Embed Size (px)
Citation preview
A concept for the visual and interactive impact analysis and simulation of data changes to enterprise metrics
Final Presentation
29.07.2014 Master Thesis Matti Maier 1

Index
• Motivation
• Research Questions
• Literature Review
• Market Overview
• Solution Approach
• Architecture
• Demo
• Byproducts
• Outlook
• References
29.07.2014 Master Thesis Matti Maier 2

Motivation
29.07.2014 Master Thesis Matti Maier 3
Decision
based on KPIs and their Visualization
Understanding the system
Solving what-if questions
Visualization of change impact
Markets Customers Suppliers
Industry-driven Problem
Research Questions
1) What is an appropriate concept to visualize the impact of data changes to enterprise metrics?
→ appropriate: theoretically profound, technically viable
2) How can interaction on this visualization help to improve the user‘s understanding of the calculation system?
29.07.2014 Master Thesis Matti Maier 4

Literature Review: KPI Visualization
• Common visualization technique: Dashboard [1]
– Each KPI, one graphical component
– Supportitive diagrams (charts, graphs, tables)
• Generic adequate visualization technique: 2-dimensional graph-based layouts [2]
• Equations well represented by node+link graphs [3]
29.07.2014 Master Thesis Matti Maier 5
a = b + c c = d + e

Literature Review: Impact Visualization
• Impact of influencing factors on processes evaluated by Hao et al. [4]
→ Hyperbolic graph layout
→ Different colors and line weights show impact of each factor
• Display delta between an original value and a new value with size of node [3]
• Enable the user to interact with the model and compare scenarios [5]
29.07.2014 Master Thesis Matti Maier 6
Market Overview
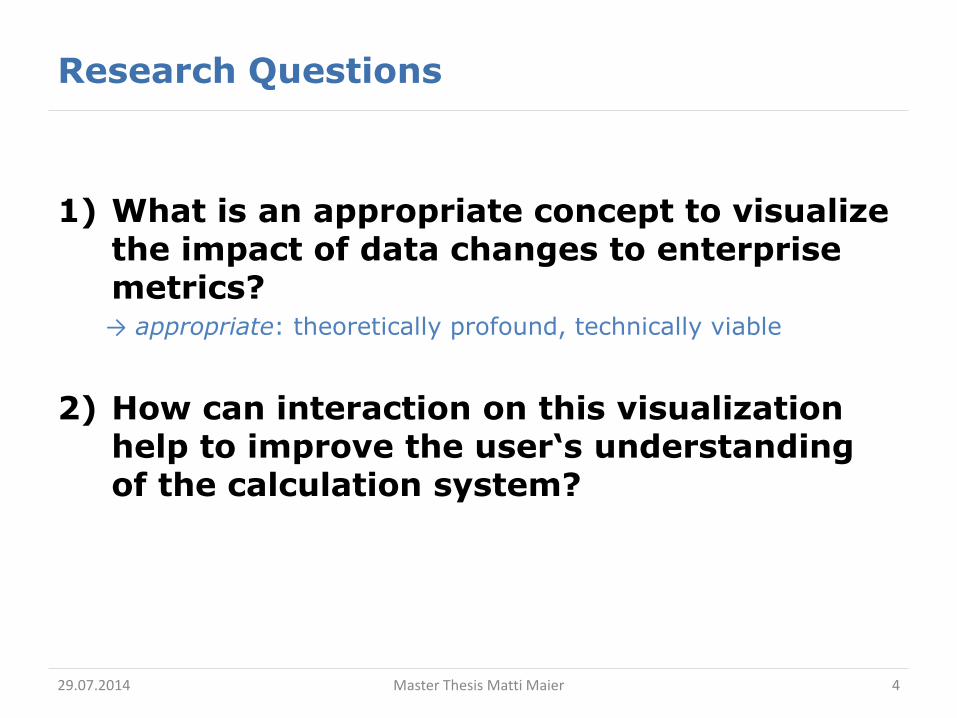
Simulation tools e.g. Simio, SimuLink/MathWorks, Simul8, OptQuest, OpenSim, OpenModelica
→ Targeted at engineers and scientists
→ Usability for user group, e.g. console view only, complex languages
→ Not suitable for the problem
Microsoft Excel → Insufficient visualization of impact
→ Understanding the system difficult if formulas are hidden
Powersim Studio 10 → No comparison between original and deviated values
→ No support for “Virtual Data“
29.07.2014 Master Thesis Matti Maier 7

Solution Approach: Basics
29.07.2014 Master Thesis Matti Maier 8
𝑑 ∗ ∆ + 𝑐 = 𝑠 with Δ = 0 for c ≠ 0
d: original value Δ: simulated delta c: value replacement / constant s: simulated value
𝐷 ∪ 𝑉 = 𝑆
D: original data V: virtual data S: simulated data
(1)
(2)
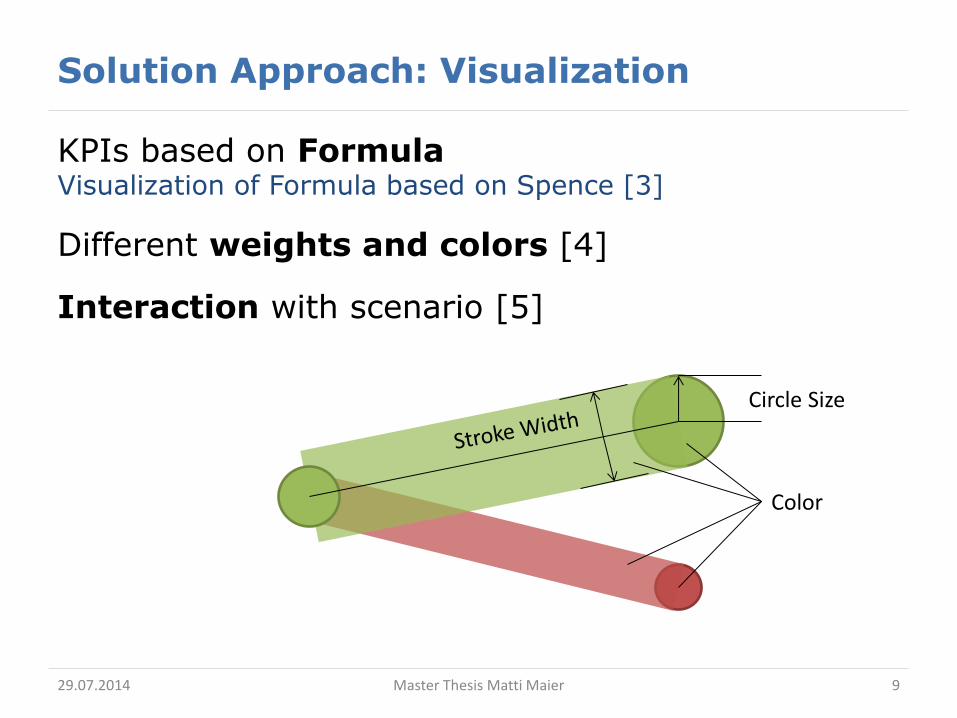
Solution Approach: Visualization
KPIs based on Formula Visualization of Formula based on Spence [3]
Different weights and colors [4]
Interaction with scenario [5]
29.07.2014 Master Thesis Matti Maier 9
Circle Size
Color
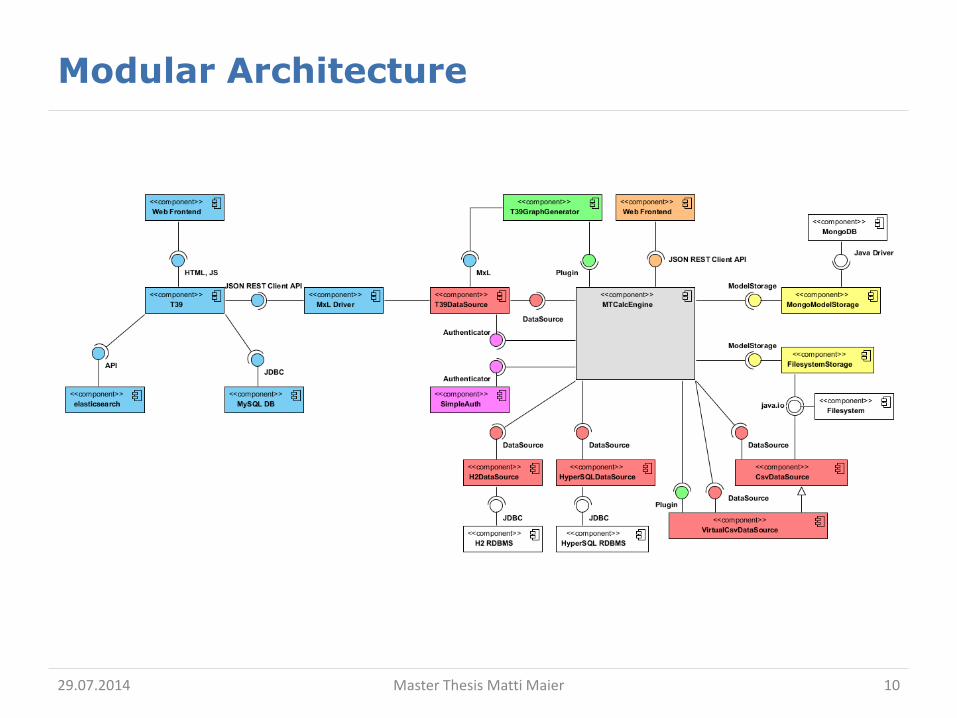
Modular Architecture
29.07.2014 Master Thesis Matti Maier 10
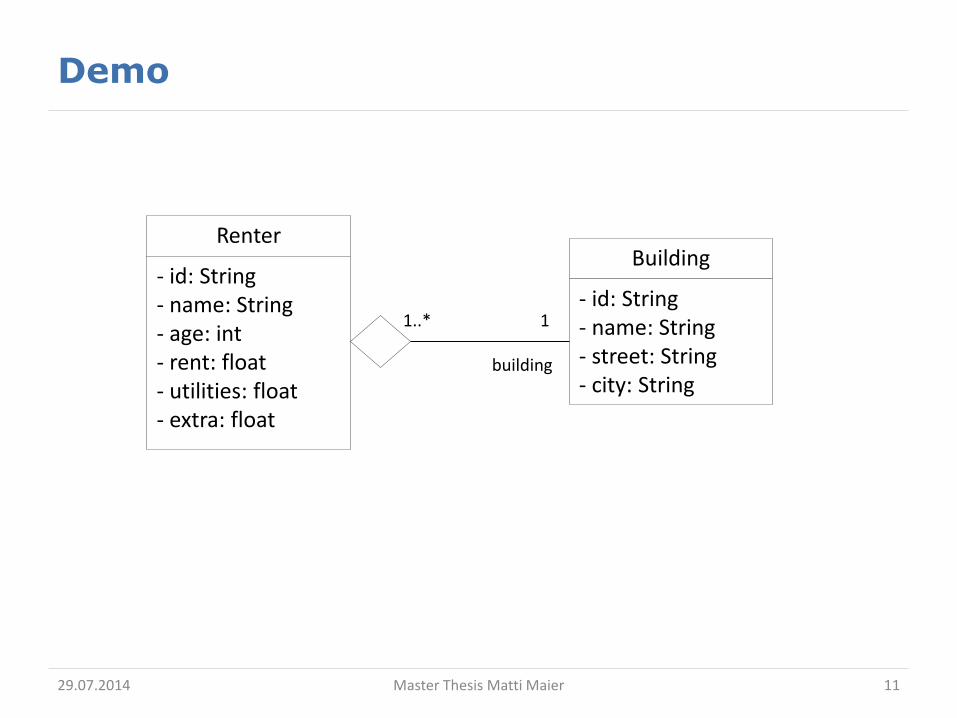
Demo
29.07.2014 Master Thesis Matti Maier 11
Renter
- id: String - name: String - age: int - rent: float - utilities: float - extra: float
Building
- id: String - name: String - street: String - city: String
1 1..*
building
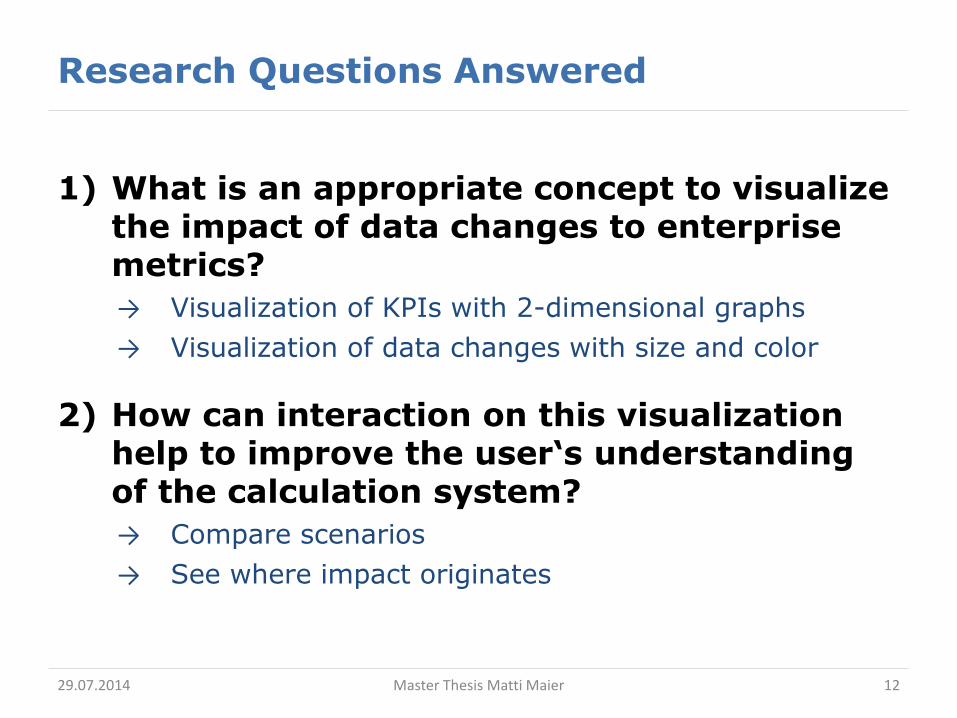
Research Questions Answered
1) What is an appropriate concept to visualize the impact of data changes to enterprise metrics?
→ Visualization of KPIs with 2-dimensional graphs
→ Visualization of data changes with size and color
2) How can interaction on this visualization help to improve the user‘s understanding of the calculation system?
→ Compare scenarios
→ See where impact originates
29.07.2014 Master Thesis Matti Maier 12

Byproducts
29.07.2014 Master Thesis Matti Maier 13
MxLDriver for Java CRUD operations, authentication, meta information, static/dynamic graph generation
Documentation in Swagger [6] Interactive and static documentation
Modelling Patterns Aggregation, Condition, Implicit Join and more
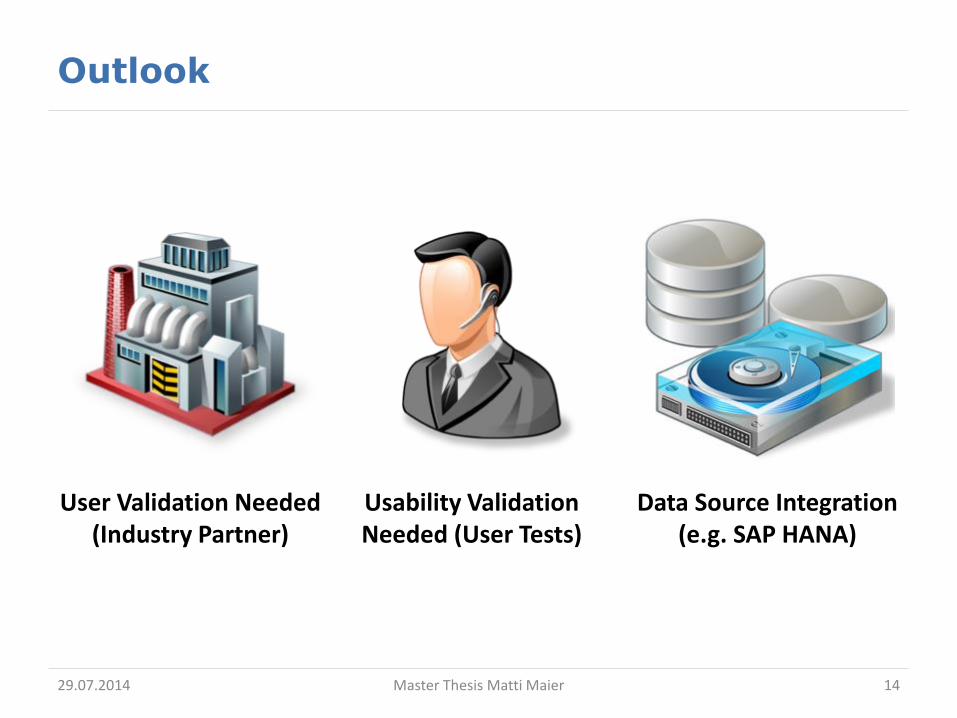
Outlook
29.07.2014 Master Thesis Matti Maier 14
User Validation Needed (Industry Partner)
Usability Validation Needed (User Tests)
Data Source Integration (e.g. SAP HANA)

References
[1] Kerzner, H. R. (2013): Project Management Metrics, KPIs, and Dashboards: A Guide to Measuring and Monitoring Project Performance: Wiley. Available online at http://books.google.de/books?id=BRNwAAAAQBAJ.
[2] Nazemi, Kawa; Breyer, Matthias; Kuijper, Arjan (2011): User-Oriented Graph Visualization Taxonomy: A Data-Oriented Examination of Visual Features. In David Hutchison, Takeo Kanade, Josef Kittler, Jon M. Kleinberg, Friedemann Mattern, John C. Mitchell et al. (Eds.): Human Centered Design. Berlin, Heidelberg: Springer Berlin Heidelberg (Lecture notes in computer science), pp. 576–585.
[3] Spence, Robert (2007): Information visualization. Design for interaction. 2nd ed. Harlow, England, New York: Addison Wesley.
[4] Hao, Ming C.; Keim, Daniel A.; Dayal, Umeshwar; Schneidewind, Jörn (2006): Business process impact visualization and anomaly detection. In Inf Vis 5 (1), pp. 15–27. DOI: 10.1057/palgrave.ivs.9500115.
[5] Russell, Karl; Carter, Shan (2009): How the Giants of Finance Shrank, Then Grew, Under the Financial Crisis. Edited by The New York Times. Available online at http://www.nytimes.com/interactive/2009/09/12/business/financial-markets-graphic.html?_r=0, updated on 9/20/2009, checked on 5/13/2014.
[6] wordnik (2014): Swagger RESTful API Documentation Specification. Reverb Technologies, Inc. Available online at https://github.com/wordnik/swagger-spec/blob/master/versions/1.2.md, updated on 6/6/2014, checked on 7/21/2014.
29.07.2014 Master Thesis Matti Maier 15
A concept for the visual and interactive impact analysis and simulation of data changes to enterprise metrics
by Matti Maier
29.07.2014 Master Thesis Matti Maier 16
BACKUP
Additional Information
29.07.2014 Master Thesis Matti Maier 17

Examples within this Thesis
1. Hotel Business – On SQL Database and T39
– Generated Data
– Goal: Easy example for presentation
2. EAM – On T39
– E.g. simulating the impact of additional applications in domains
Other areas of application include gross margin calculations, financial portfolio analysis, risk management evaluation and more.
29.07.2014 Master Thesis Matti Maier 18
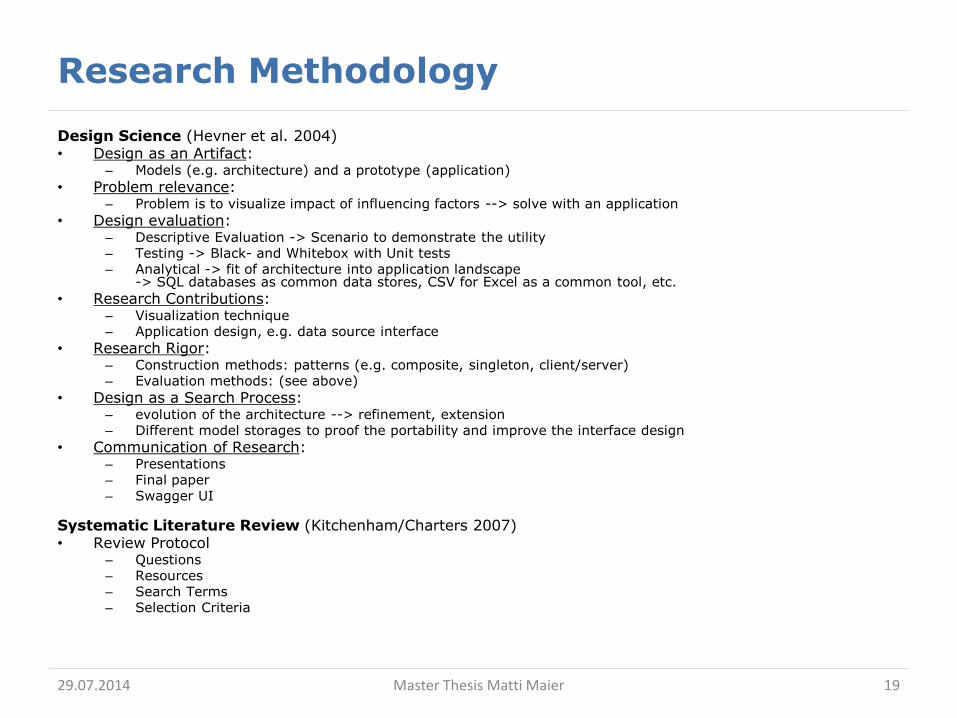
Research Methodology
Design Science (Hevner et al. 2004) • Design as an Artifact:
– Models (e.g. architecture) and a prototype (application)
• Problem relevance: – Problem is to visualize impact of influencing factors --> solve with an application
• Design evaluation: – Descriptive Evaluation -> Scenario to demonstrate the utility – Testing -> Black- and Whitebox with Unit tests – Analytical -> fit of architecture into application landscape
-> SQL databases as common data stores, CSV for Excel as a common tool, etc.
• Research Contributions: – Visualization technique – Application design, e.g. data source interface
• Research Rigor: – Construction methods: patterns (e.g. composite, singleton, client/server) – Evaluation methods: (see above)
• Design as a Search Process: – evolution of the architecture --> refinement, extension – Different model storages to proof the portability and improve the interface design
• Communication of Research: – Presentations – Final paper – Swagger UI
Systematic Literature Review (Kitchenham/Charters 2007) • Review Protocol
– Questions – Resources – Search Terms – Selection Criteria
29.07.2014 Master Thesis Matti Maier 19

Challenges in Implementation
• Connecting T39
– Result: MxL Driver
– Specialty: Data retrieval over MxL
• Generating Queries
– Different operations
– Different data sets
– Recursive dependencies
• Finding the right frameworks
– D3.js vs. Gephi vs. GraphStream vs. …
– Tempo.js for JavaScript/JSON Templates
– Validation frameworks
29.07.2014 Master Thesis Matti Maier 20

Performance
• Parallelization
– Calculation is performed in parallel as much as possible
• Code to Data
– Computation is pushed to data as far as possible
• Connection Pooling
– JDBC Data Sources are connected using connection pools
• Lightweight JSON REST Interfaces
– Reuse of JSON where possible
– Thus little conversion necessary
29.07.2014 Master Thesis Matti Maier 21

Security
• Input Validation
– from User
– from external systems, e.g. T39
– Counter measure against XSS
• Session Reinitialization
– Prevent Session Fixation
• Forced HTTPS Connections
– Forward from HTTP to HTTPS connections
• Custom Error Pages
– No presence of version and server
29.07.2014 Master Thesis Matti Maier 22

Modelling Patterns
• Column Aggregation e.g. sum of a column in a table
• Calculating the Average i.e. sum / count
• Copying Node How to copy and reuse a node?
• Condition How to model conditions?
• Implicit Join How to implicitly join tables?
29.07.2014 Master Thesis Matti Maier 23

Migration on T39
Why was this application not migrated on T39?
• Industry-driven Topic
– Various data sources, e.g. SAP HANA
• Integration of T39 earlier this year
– Could have lead to a delay of the thesis
• Incompatible libraries in T39
– e.g. D3.js requires other jQuery(s)
– When DataWidgets are completed, then integration in DW Infrastructure
29.07.2014 Master Thesis Matti Maier 24

![E[M]CONOMY moves! - ilg-sulzberger.de Die EMCO Group ist ein Verbund von Topanbietern aus der Werkzeugmaschinenbranche. ... CONCEPT MILL 55 CONCEPT MILL 105 CONCEPT MILL 250 CONCEPT](https://img.pdfslide.org/doc/110x75/5b02e7647f8b9a3c378b639e/emconomy-moves-ilg-emco-group-ist-ein-verbund-von-topanbietern-aus-der-werkzeugmaschinenbranche.jpg)