Embed Size (px)
Citation preview
Acceptance ofElectric Mobility System Components and the Role of Real-Life ExperienceFranziska Schmalfuß

ACCEPTANCE OF ELECTRIC MOBILITY SYSTEM COMPONENTS AND THE ROLE OF REAL-LIFE EXPERIENCE Dissertation zur Erlangung des akademischen Grades doctor rerum naturalium (Dr. rer. nat.) vorgelegt der Fakultät für Human- und Sozialwissenschaften der Technischen Universität Chemnitz von: Franziska Schmalfuß (geb. Bühler) geboren am 08.03.1985 in Karl-Marx-Stadt, jetzt Chemnitz eingereicht am: 22. Mai 2017 verteidigt am: 07. Dezember 2017 Gutachter: Prof. Dr. Josef F. Krems, Technische Universität Chemnitz Prof. Dr. Martin Baumann, Universität Ulm

Cover design: Janet Levrel Verfasser: Franziska Schmalfuß
Acknowledgments • i Acknowledgments During the years I have been working on my thesis, various people have encouraged and supported me. I would like to begin by thanking my supervisor, Prof. Dr. Krems, for giving me the opportunity right after my diploma to start research in the new and interesting field of e-mobility, and for supporting me in many ways. Moreover, I want to thank Prof. Dr. Baumann for his willingness to act as a second reviewer for my PhD thesis. I also want to give special thanks to my PhD colleagues Peter Cocron, Isabel Neumann, and Thomas Franke, who not only supported me with their knowledge and experience, but in the process became very good friends. Our many fruitful discussions paved the way of this thesis. I m so grateful that Isabel and Peter always lent me a sympathetic ear, and gave me some necessary emotional support. This dissertation would not have been possible without the various e-mobility projects which were funded by the Federal Ministry for the Environment, Nature Conservation, Building and Nuclear Safety (MINI E Berlin powered by Vattenfall: 16EM0003, MINI E Berlin V2.0: 16EM0070; Gesteuertes Laden V3.0). Together with partners from research (TU Berlin, TU Ilmenau and Fraunhofer Advanced System Technology AST), as well as partners from the industry (BMW Group, Vattenfall Europe, EWE AG, Clean Energy Sourcing AG), field studies and test series were conducted that provided the foundation for the present dissertation. In this context, I want to express my gratitude to Andreas Keinath, Roman Vilimek, Maximilian Schwalm, Glenn Schmidt, Michael Hajesch, Xaver Pfab, Friedrich Eckhardt, Franziska Schuth, Andreas Weber, Michael Westerburg, Michael Agsten, Steffen Schlegel, and Tobias Fritsche. Furthermore, the in-depth analyses of the project data and the online survey would not have been possible without the financial help provided by the scholarship from the SAB (Sächsische Aufbaubank) and the European Social Fund (ESF). Furthermore, very big thanks to Katja Schleinitz and Luise Franke-Bartholdt who also worked in MINI E Berlin V2.0 and realized the test series. Thanks also to Claudia Mair, Susen Döbelt, Bettina Kämpfe, Maria Kreußlein,

ii • Acknowledgments Cynthia Heller, and Ramona Wüstemann, who were part of the Gesteuertes Laden V3.0 team. They all kept the projects running when I paused working during my parental leave. In addition, I want to thank all of my other colleagues and the various people who have played a part in making this PhD successful: thanks to Marta Pereira, Tibor Petzoldt, and Nadine Rauh. Thanks also to Thomas Schäfer for his incredible patience and statistical support. My greatest gratitude goes to my family for all their love, help, and encouragement over the years. Special thanks go to my husband, Thilo Schmalfuß, and my lovely, lively children, Mio and Yara, who showed a lot of understanding and belief in me, but also reminded me that there is more to life than work. The children s laughter and their playing widened my view of life when it would become too narrowed by work. Without the love and help of my mother, Iris Bühler, I doubt that I would have by now finished my PhD. Thanks also to my sister, Felicitas Bühler, for relaxing with me when I needed it, and for all the hours of babysitting. My mother-in-law, Christa Schmalfuß, gained another thank you at this place for her enormously sacrifice for the family. Thanks also to my dads, Sven Bühler and Christian Pfeifer. I would also like to thank all of the friends who have reminded me again and again of the beautiful things in life. Our hours together have brought me back from science to reality, so that I did not forget the other important things.
Zusammenfassung • iii Zusammenfassung Neben der Verringerung von Verkehrsunfällen und Staus ist ein wichtiges Ziel der Verkehrspsychologie, die Luftverschmutzung durch den Verkehr zu reduzieren. Elektrofahrzeuge (BEVs) könnten die CO2-Emissionen deutlich reduzieren. Der weltweite BEV-Bestand nimmt zwar stetig zu, aber die Marktanteile in den meisten EU-Ländern lag 2016 dennoch nur bei rund 1% (International Energy Agency, 2016). Eine weitreichende Verbreitung von Elektrofahrzeugen birgt nicht nur Vorteile in sich, sondern kann auch zur Belastung der Stromnetze führen. Intelligente Ladesysteme , die den Ladeprozess an die Netzbelastung und Nutzeranforderungen (z.B. Ladestand bei Abfahrtszeit) anpassen, gelten als vielversprechende Lösung. Vor dem Hintergrund der bisher geringen Verbreitung von Elektrofahrzeugen und der mit einem Erfolg der Elektromobilität steigenden Relevanz intelligenter Ladesysteme entsteht die Notwendigkeit psychologische Faktoren zu identifizieren, die die Evaluation und Akzeptanz von Komponenten des Elektromobilitätssystems beeinflussen. An dieser Stelle knüpft die vorliegende Dissertation an. Der (praktische) Erfahrungshorizont vieler Menschen in Bezug auf Elektrofahrzeuge und intelligente Ladesysteme ist sehr limitiert. Unerfahrene Nutzer solch neuer Systeme begegnen bisher unbekannten Herausforderungen in der Mensch-Maschine-Interaktion. Beispielsweise geht das elektrische Fahren, im Vergleich zum Fahren herkömmlicher Fahrzeuge, mit einer wesentlich niedrigeren Reichweite, einer geringeren Geräuschkulisse, neuen Nachtankprozessen und Fahrfunktionen wie der Rekuperation (d.h. regeneratives Bremsen bei dem kinetische in elektrische Energie umgewandelt wird) einher. Dieses Thema wird ebenfalls in der vorliegenden Dissertation aufgegriffen. Das erste Forschungsziel fokussierte die allgemeine Bewertung und Akzeptanz von Elektrofahrzeugen sowie den Einfluss von praktischer Erfahrung. Im Rahmen einer Feldstudie mit zwei 6-monatigen Studienphasen (Artikel II), einer Onlinestudie (Studie I von Artikel III) sowie einer 24-Stunden Testfahrt (Studie II von Artikel III) wurde dieses Ziel untersucht. Für die verschiedenen Arten von Erfahrung (langzeitig mit gleichem Fahrzeug vs. unkontrolliert vs. kurzzeitig mit gleichem Fahrzeug) zeigten sich unterschiedliche Effekte auf die Akzeptanz von Elektrofahrzeugen, die detailliert diskutiert werden. Die Berichte der Feldstudienteilnehmer (langzeitige Erfahrung) zu Vor- und Nachteilen von Elektrofahrzeugen zeigten, dass

iv • Zusammenfassung sich die Salienz bestimmter Vor- und Nachteile über die Nutzungszeit hinweg ändert. Vor allem die Vorteile, die beim Alltagstest direkt erlebt werden können (z.B. das angenehme Fahrgefühl, die geringe Geräuschkulisse), waren in ihrer Salienz gestiegen. Es gibt erlebbare Barrieren, wie die Ladedauer, die innerhalb der Feldstudie an Prägnanz verloren, aber auch andere, wie die Reichweite, die in ihrer Bedeutsamkeit konstant blieben. Die Vorher-Nachher-Studien (Artikel II & Studie II von Artikel III) zeigten, dass die Erwartungen der Tester an solch ein Fahrzeug im Alltagstest insgesamt erfüllt werden und die Einstellung gegenüber Elektrofahrzeugen positiv bleibt. Im Rahmen der 24-Stunden-Testfahrt (kurzzeitige Erfahrung) zeigte sich zudem ein Anstieg in der Zufriedenheit mit Elektrofahrzeugen. Dem gegenüber stehen die geringen Kaufabsichten der Befragten. Der Alltagstest mit einem Elektrofahrzeug, egal ob kurz- oder langzeitig, zeigte keine Effekte auf die Kaufintention. Allerdings wiesen die Ergebnisse der Onlinebefragung darauf hin, dass Personen, die bereits ein Elektrofahrzeug gefahren sind, gegenüber dem Kauf eines Elektrofahrzeugs nicht so stark abgeneigt sind wie Unerfahrene, aber dennoch keine klare Intention zeigen. Das zweite Forschungsziel bestand in der Untersuchung wie praktische Erfahrung mit dem Nutzerverhalten und der Evaluation bezüglich der Elektrofahrzeugcharakteristika zusammenspielt. Am Beispiel der Rekuperation wurde untersucht wie sich die Menschen im Rahmen einer 6-monatigen Feldstudie an solch eine Funktion gewöhnen, ihre Nutzung erlernen und ob sich dies in der Bewertung der Funktion widerspiegelt (Artikel I). Die Ergebnisse aus den Fahrzeugdaten weisen darauf hin, dass die Adaption an diese Funktion recht zügig abgeschlossen ist und dem Power Law of Practice (Newell & Rosenbloom, 1981) folgt. Die Rekuperationsfunktion wird durch die Nutzer positiv bewertet und die Zufriedenheit mit der Rekuperation steigt mit der Nutzungszeit. In zwei weiteren Studien wurde die Bewertung von Elektrofahrzeugcharakteristika zwischen Elektrofahrzeug-Erfahrenen und Unerfahrenen verglichen. In der Onlinestudie (Studie I in Artikel III) mit dem unkontrollierten Erfahrungsfaktor zeigten sich kaum Unterschiede. Lediglich Reichweite und Laden bewerteten die Erfahrenen positiver. Kontrollierte, kurzfristige Erfahrung (Studie II in Artikel III) führte zu einer positiveren Bewertung von Beschleunigung und Fahrspaß, Geräuschlosigkeit, Sicherheit und Reliabilität, Umweltfreundlichkeit sowie des Rufs von Elektrofahrzeugen. Die Bewertung von Reichweite und Laden blieb unverändert. Das dritte, übergeordnete Ziel dieser Dissertation bestand darin, akzeptanzbeeinflussende Faktoren zu identifizieren, die als Ansatzpunkte für zukünftige Weiterentwicklungen und Strategien zur Erhöhung der Akzeptanz genutzt werden können. Dazu wurde das Potential der Bewertung verschiedener

Zusammenfassung • v Elektrofahrzeugattribute, der Faktoren der Theorie des geplanten Verhaltens (Ajzen, 1991) sowie der Erfahrung mit Elektrofahrzeugen zur Vorhersage der Akzeptanz im Rahmen der beiden Studien in Artikel III untersucht. Der soziale Faktor (subjektive Norm) und die Bewertung von Reichweite und Laden wirkten sich am stärksten auf die Vorhersage von Einstellungs- und Verhaltensakzeptanz aus. In der Onlinestudie mit between-subjekt Design, zeigte sich zudem ein starker Erfahrungseffekt auf die Kaufabsicht. Zudem erwies sich auch der Faktor Beschleunigung und Fahrspaß als relevante Größe für die Akzeptanz. Vor dem Hintergrund der aktuellen Entwicklungen, im Detail den sinkenden Batteriekosten und damit günstiger werdenden Reichweiteressourcen, eröffnen die Ergebnisse Ansatzpunkte, um die Akzeptanz zu steigern. Die Bewertung der Performanz und das angenehme Fahrgefühl beim elektrischen Fragen weisen einen nicht zu vernachlässigbaren Einfluss auf die Akzeptanz von Elektrofahrzeugen auf und konnten durch ein kurzzeitiges Erfahrungserlebnis positiv beeinflusst werden. Das letzte Forschungsziel dieser Dissertation fokussierte das intelligente Laden. Die Ergebnisse der 5-monatigen Feldstudie (Artikel IV) zeigten, dass ein intelligentes Ladesystem (mit aktiver Nutzerbeteiligung) nutzbar und akzeptabel ist. Allerdings zeigten die Ergebnisse auch, dass eine positive Kosten-Nutzen-Bilanz für die Nutzer von hoher Relevanz ist. Der zusätzliche Aufwand beim Laden erwies sich als signifikant höher und die finanziellen Anreize durch die Nutzung des Systems als niedriger als erwartet. Zudem fühlten sich die Nutzer durch das System zusätzlich in ihrer Mobilität eingeschränkt. Demnach sollten zukünftige, intelligente Ladesysteme sorgfältig gestaltet werden, so dass der Aufwand und die Reduzierung von Flexibilität und Mobilität nicht so hoch sind, dass die Barriere "Reichweite und Laden" für die Akzeptanz von Elektrofahrzeugen erhöht wird. Basierend auf den Ergebnissen wurden verschiedene Implikationen abgeleitet. Die Weiterentwicklung des Elektromobilitätssystems sollte sich darauf konzentrieren, die Barrieren bezüglich Reichweite und Laden zu reduzieren sowie die positiven Aspekte des elektrischen Fahrens zu vermitteln. Zudem sollten zukünftige Akzeptanzmodelle, vor allem für bisher eher unbekannte Objekte oder Technologien, einen Erfahrungsfaktor und die Bewertung verschiedener, objekt-/technologie-spezifischer Attribute enthalten, da dadurch wichtige Aspekte zur Verbesserung des Forschungsobjektes identifiziert werden können. Die Ergebnisse zeigten außerdem, dass der soziale Einfluss in zukünftigen Strategien zur Akzeptanzförderung von Elektrofahrzeugen adressiert werden sollte und eine Testfahrt mit einem Elektrofahrzeug, das dem aktuellen Entwicklungsstand entspricht, ein strategisches Werkzeug zur Akzeptanzsteigerung darstellt.

vi • Zusammenfassung
Table of Contents • vii Table of Contents Acknowledgments .............................................................................................. i Zusammenfassung ........................................................................................... iii Table of Contents ............................................................................................ vii Synopsis .......................................................................................................... 1 1 Overview of the Dissertation .......................................................................................................... 1 2 Introduction .................................................................................................................................. 2 3 Three Pillars of Acceptance within the Context of the Electric Mobility System ................................ 4 3.1 Definition and Assessment Structure of Acceptance.............................................................. 4 3.2 Drivers and Barriers for Acceptance ........................................................................................ 5 4 The Importance of Experiencing Electric Mobility Systems Components ........................................ 10 4.1 Really-new Products and the Problem of Uncertainty .......................................................... 10 4.2 Real-life Experience as Source of Information and Potential Driver of Acceptance ............. 12 4.3 BEV Evaluation and the Role of Real-Life Experience ........................................................... 14 4.4 Integrating Experience as an Influencing Factor into the Theoretical Framework of BEV Acceptance ............................................................................................................................ 17 4.5 Evaluation of Smart Charging Systems (with High User Involvement) and the Role of System Experience ............................................................................................................................. 19 5 Summary and Research Questions ............................................................................................... 20 5.1 Research Objective 1: General Evaluation of BEVs and the Relevance of Real-Life Experience ............................................................................................................................. 21 5.2 Research Objective 2: BEV Attributes and the Relevance of Real-Life Experience ............... 21 5.3 Research Objective 3: Predicting BEV Acceptance with Various Psychological Variables, the Evaluation of BEV Attributes and BEV Experience ................................................................ 22 5.4 Research Objective 4: Evaluation of a Smart Charging System Prototype and the Role of Real-Life Experience .............................................................................................................. 23
viii • Table of Contents 6 Overview of the Methodology ........................................................................................................24 6.1 MINI E field study ................................................................................................................... 24 6.2 Online Survey ......................................................................................................................... 26 6.3 24-hour Test Trial ................................................................................................................... 26 6.4 Smart Charging Field Study ................................................................................................... 27 7 Discussion and Critical Reflection of Results .................................................................................28 7.1 Research Objective 1: General Evaluation of BEVs and the Relevance of Real-Life Experience .............................................................................................................................. 29 7.2 Research Objective 2: BEV Attributes and the Relevance of Real-Life Experience ............... 34 7.3 Research Objective 3: Predicting BEV Acceptance with Various Psychological Variables, the Evaluation of BEV Attributes and BEV Experience ................................................................ 40 7.4 Research Objective 4: Evaluation of a Smart Charging System Prototype and the Role of Experience .............................................................................................................................. 44 8 Implications and Conclusion .........................................................................................................46 8.1 Practical Implications for Acceptance of Electric Mobility System Components ................. 46 8.2 Theoretical and Methodological Implications for Acceptance Research .............................. 49 8.3 Conclusion ............................................................................................................................. 51 References .........................................................................................................................................53 Paper I .......................................................................................................... 65 Paper II ......................................................................................................... 91 Paper III ...................................................................................................... 129 Paper IV ...................................................................................................... 179 Curriculum Vitae ........................................................................................... 213 Publications ................................................................................................. 216 Eidesstattliche Erklärung ............................................................................... 221
Synopsis • 1 Synopsis 1 Overview of the Dissertation Although the market share of battery electric vehicles (BEVs) is increasing (International Energy Agency, 2016), these vehicles remain a relatively unknown form of personal transportation with which many people have no practical experience (Skippon, Kinnear, Lloyd, & Stannard, 2016). The aim of the present dissertation was, on one hand, to investigate the acceptance of BEVs, the evaluation of related innovative functions and technologies (such as regenerative braking) as well as smart charging, and, on the other hand, to examine how these factors can be changed through practical experience. In 2010, at the beginning of this dissertation project, the knowledge of user evaluations and attitudes towards these innovative products/functions and their acceptance was very limited. The present cumulative dissertation consists of four research articles, Papers I IV, that are published in peer-reviewed journals. Additionally, another peer-reviewed journal article (Cocron et al., 2011) is referred to in the chapter, Overview of the Methodology. In the synopsis, the theoretical and empirical background of the dissertation is provided (chapter 2-4) and the underlying research objectives are presented in chapter 5. Chapter 6 describes the methodology, including two field studies, an online survey, and test drive experiment. In chapters 7 and 8, results are summarized and discussed, and implications are drawn. Paper I is focused on the special function of regenerative braking and how people evaluate and adapt to it in the course of a 6-month field study. Papers II and III concern the evaluation of BEVs and changes due to varying levels of experience. The investigation of changes in perceived advantages, barriers, attitudinal and behavioral acceptance during 6 months of integrating a BEV in daily routine is described in Paper II. Paper III includes an online study as well as a pre-post study with a 24-hour test drive, and specifically deals with the identification of factors, including BEV experience, which influence acceptance. Paper IV looks at a different part of the electric mobility system a smart charging system and compares expectations and experiences regarding the evaluation of a prototype system that was integrated in daily routine for approximately 11 weeks.
2 • Synopsis Paper I Cocron, P., Bühler, F., Franke, T., Neumann, I., Dielmann, B., & Krems, J. F. (2013). Energy recapture through deceleration regenerative braking in electric vehicles from a user perspective. Ergonomics 56(8), 12031215. dx.doi:10.1080/00140139.2013.803160 Paper II Bühler, F., Cocron, P., Neumann, I., Franke, T., & Krems, J. F. (2014). Is EV experience related to EV acceptance? Results from a German field study. Transportation Research Part F: Traffic Psychology and Behaviour, 25(A), 85 90. doi:10.1016/j.trf.2014.05.002 Paper III Schmalfuß, F., Mühl, K., & Krems, J. F. (2017). Direct experience with battery electric vehicles (BEVs) matters when evaluating vehicle attributes, attitude and purchase intention, Transportation Research Part F: Traffic Psychology and Behaviour, 46(A), 47 69, http://dx.doi.org/10.1016/j.trf.2017.01.004. Paper IV Schmalfuß, F., Mair, C., Döbelt, S., Kämpfe, B., Wüstemann, R., Krems, J. F., & Keinath, A. (2015). User responses to a smart charging system in Germany: Battery electric vehicle driver motivation, attitudes and acceptance. Energy Research & Social Science, 9, 60 71. doi:10.1016/j.erss.2015.08.019 2 Introduction Besides reducing traffic accidents and congestion, one major aim of traffic psychology is to decrease air pollution (Summala, 2001). Almost one-quarter of CO2 emissions are emitted by the transport sector in the EU (European Commission, 2016a), and 12% by passenger cars. While the European Commission expects CO2 emission levels due to road transport to remain relatively stable in the next years (European Commission, 2016b), electric mobility can significantly reduce CO2 emissions in Germany (Schill, Gerbaulet & Kasten, 2015). Battery electric vehicles (BEVs) have the greatest potential for decreasing CO2 emissions due to their low well-to-wheel (i.e., all direct and indirect energy requirements and emissions during the whole life of the BEV) energy demand and greenhouse gas emission. However, they will remain the more expensive
Synopsis • 3 technology compared to hybrid (HEVs) and plug-in hybrid electric vehicles (PHEVs) (Wolfram & Lutsey, 2016). Through 2016, the global BEV stock has increased steadily, but the market share in most EU countries is still around 1% (International Energy Agency, 2016). Availability of charging infrastructure and financial incentives positively correlate with the increase of BEV market shares, but are probably not the only factors influencing BEV adoption (e.g., Sierzchula, Bakker, Maat, & van Wee, 2014). The identification of other psychological factors influencing BEV evaluation and acceptance is an important step for developing further interventions that will increase the market share in order to reduce pollution caused by traffic. According to Wolfram and Lutsey (2016), the potential of BEVs can only be fully realized if the EU grid becomes greener . Schill et al. (2015) add that a smart charging system (e.g., for time-shifted charging) needs to be additionally implemented for recharging these vehicles so that the percentage of renewable energies in the grid can be further increased. The expected increase in the number of electrically driven vehicles will pose additional challenges for grid stability (Taylor, Maitra, Alexander, Brooks, & Duvall, 2009). Smart charging systems are promising solutions for balancing energy supply and demand, saving energy, cutting emissions, and integrating renewable energy into the grid. As a consequence, not only BEVs, but also smart charging systems should be addressed in psychological research on human interaction with electric mobility. As an important part of this whole system, BEVs form the starting point of considerations. They represent a new type of vehicle that forces drivers of conventional cars to adapt to new functions (e.g., regenerative braking) and changes the nature of driving due to, for instance, the low noise emission, limited range, and different driving performance (Urban, Weinberg, & Hauser, 1996). However, they also enable the BEV user to drive in a more environmental friendly way (Wolfram & Lutsey, 2016). Besides changes in driving behavior with a BEV, refueling behavior needs to be adapted (Urban et al., 1996). Recharging a BEV takes longer than refueling a conventional vehicle, and due to the limited range, the number of refueling events for BEVs per week is higher despite driving the same weekly mileage. However, many BEV drivers charge at home (Nationale Plattform Elektromobilität, 2015), which probably makes planning easier. Smart charging systems carry the potential to additionally influence BEV drivers behavior depending on system design and the level of user involvement (i.e., need for information entered by the user), as well as needed human-machine interaction.
4 • Synopsis From a psychological perspective, it is important to develop a better understanding of potential consumers evaluation of BEVs as a whole, as well as individual aspects and functions and smart charging systems. Increased knowledge about the user perspective on electric mobility system components will support further developments and enable decision-makers as well as stakeholders to draw implications for supporting its widespread adoption. Specifically, it is important to learn the advantages and barriers of which people are aware, to find out whether some barriers are acceptable to them, and to see if people are willing and able to manage the challenges of BEVs and smart charging systems. Thus, the aim of this thesis is to investigate users acceptance of electric mobility system components and their influencing factors. 3 Three Pillars of Acceptance within the Context of the Electric Mobility System Acceptance is the main topic of the present thesis. The question that needs to be clarified is what comprises acceptance. Adell, Várhelyi and Nilsson (2014a) argued that acceptance consists of three pillars: a definition; a resulting assessment structure (following a clarification of how acceptance can be assessed); and acceptance models that describe the factors that influence or stimulate acceptance. In a broader sense, acceptance models can act as framework for improving and further developing a product so that it better meets expectations (Amberg, Hirschmeyer, & Schobert, 2003). By identifying the actual state of acceptance and identifying barriers and motivating factors, potentially effective improvement strategies can be derived. In the next two sections, the three pillars of acceptance within the context of electric mobility systems are described. 3.1 Definition and Assessment Structure of Acceptance Despite decades of research, a clear definition of acceptance remains elusive. In traffic psychology, many varying definitions have been utilized (see Adell et al., 2014a). According to Kollmann (2004) and Schade and Schlag (2003), acceptance has an attitudinal and behavioral dimension. Regarding attitudinal acceptance, Schade and Schlag (2003) stated that attitudes are reflected simply in the degree to which a product or system is acceptable. To deepen the assessment of attitudinal acceptance, several authors (e.g., Ajzen & Fishbein, 2005; Crites, Fabrigar, & Petty, 1994) argued that attitudes should be further divided into instrumental (e.g., desirable/undesirable) and experiential (e.g., pleasant/unpleasant) components. Van der Laan, Heino, and De Waard (1997) chose a similar expansion of the attitude concept often used in
Synopsis • 5 transportation research (e.g., Vlassenfort, Brookhuis, Marchau, & Witlox, 2010). It defines attitudes as predispositions to respond, or tendencies in terms of approach/avoidance or favorable/unfavorable (p. 2) and it says that attitudinal acceptance of technological innovations is comprised of two dimensions: satisfaction and usefulness. As indicators for behavioral acceptance of BEVs, intention to purchase (e.g., Gärling & Johansson, 1999; Turrentine, Garas, Lentz, & Woodjack, 2011) or use (e.g., Carroll, 2010) were primarily used in former electric mobility studies. Kollmann (2004) argued that after purchasing a product, it is essential to observe the usage of a product in order to gain a valuable impression of people s acceptance. As cars are very expensive and have to fulfill special needs such as providing mobility, the usage intensity of BEVs is likely to depend on many factors (e.g., daily mileage, number of cars per household, etc.). So it is not surprising that no correlation between attitudinal acceptance and relative usage of BEVs compared to overall car usage can be found (Bühler, Neumann, Cocron, Franke, & Krems, 2011). The more relevant indicator for behavioral acceptance of BEVs seems to be purchase behavior. As car purchases are relatively rare events, intention to purchase is in the focus of this thesis. Besides that, a willingness to recommend has been investigated by some authors (Jabeen, Olaru, Smith, Braun, & Speidel, 2012; Moons & De Pelsmacker, 2015), and was partly included in investigation. For investigating behavioral acceptance of the smart charging system, usage rates (e.g., Pettersson, 2013), gained incentives (e.g., Pettersson, 2013), or the intention to use (e.g., Krems, 2011) are all commonly assessed in the existing literature. Implementation of the system is another relevant dimension of acceptance; given that it might be costly. Up to date, neither business models, costs for installations nor tariff models are known which makes it unattractive to investigate implementation intentions. So, the present thesis examined usage intention and actual usage. 3.2 Drivers and Barriers for Acceptance The third pillar of the acceptance concept defined by Adell et al. (2014a) concerns the question of which factors drive or hinder acceptance. A simple, straight-forward approach for identifying aspects that might influence the acceptance of a new technology is the investigation of advantages and barriers connected with the use of this new technology. Findings in acceptance research regarding other pro-environmental
6 • Synopsis technology domains (i.e., wind turbines, congestion tax) indicate, for instance, that experiencing advantages leads to a higher acceptability (Wolsink, 2007; Schuitema, Steg, & Forward, 2010). Potential benefits and costs were examined for BEVs (e.g., Sovacool & Hirsch, 2009) and for smart charging technologies (e.g., Garcia-Villalobos, Zamora, San Martín, Asensio, & Aperribay, 2014). The user perspective on costs and benefits was investigated only for BEVs (e.g., Egbue & Long, 2012), but not for smart charging systems. To accomplish the investigation of attitudinal and behavioral acceptance, perceived advantages and barriers were also studied in the present thesis. 3.2.1 Underlying Theoretical Framework for Explaining BEV Acceptance The deeper investigation of the third pillar of acceptance within the present thesis concentrates on one part of the electric mobility system BEVs. In traffic psychology, particularly in the case of advanced drivers assistance systems (for a review see Vlassenfort et al., 2010), as well as in environmental psychology (Klöckner, 2015), the most prominent theoretical framework for explaining acceptance is the Theory of Planned Behavior (TPB, Ajzen, 1991). According to the TPB, behavioral intentions are determined by the person s evaluation of a certain behavior (attitude towards behavior), the perception of beliefs of their social environment (subjective norm), and the perceived own capability (perceived behavioral control). If behavioral intention is given, people will probably show a certain behavior. For instance, Arndt (2011) embedded the TPB in a more complex model explaining acceptance of advanced driver assistance systems. The model combines the TPB factors with factors such as personal variables, product characteristics, and willingness to pay. Additionally, various authors (e.g., Bamberg & Schmidt, 2003; Goldenhar & Connell, 1992) who investigated environmentally related behavior also used the TPB. Parallel to the creation of this thesis, other authors (Moons & De Pelsmacker, 2012; Whang, Fan, Zhao, Yang, & Fu, 2016) chose it to predict behavioral intentions regarding BEVs. Another simple, economic model with relatively high explanatory power is the Technology Acceptance Model (TAM) by Davis (1989). According to this model, perceived ease of use and perceived usability of a technology determine the intention to accept the technology, which is a mediator for its actual use. The TAM does not include social influence or perceived behavioral controls that seem to be important in the case of BEV acceptance (e.g., Peters & Dütschke, 2014; Nayum, Klöckner, & Mehmetoglu, 2016).
Synopsis • 7 The Unified Theory of Acceptance and Use of Technology (UTAUT, Venkatesh, Morris, Davis, & Davis, 2003) combines several theories including TPB as well as TAM and represents another approach chosen in traffic psychology (e.g., Adell, Várhelyi, & Nilsson, 2014b). According to this theory, performance expectancy (i.e., perceived value for improving job performance), effort expectancy (i.e., anticipated extra effort to use the system), facilitating conditions (i.e., existence of infrastructure for using system) as well as social influence (comparable to the subjective norm) determine behavioral intention. In the extension of the model (UTAUT2, Venkatesh, Thong, & Xu, 2012), hedonic motivation (e.g., enjoyment), price value, and habit were identified as further important predictors for behavioral intention. Additionally, age, gender, experience and voluntariness of use were discussed as moderating variables. The latter was excluded in UTAUT2 and results showed only moderating effects when combining age and gender as moderators (Venkatesh et al., 2012). With the focus on BEVs, research has shown that BEV users have a higher perceived behavioral control regarding BEV adoption (Nayum et al., 2016). UTAUT (Venkatesh et al., 2003) and UTAUT2 (Venkatesh et al., 2012) do not include this factor. Furthermore, performance expectancy, as defined by Venkatesh et al. (2003), should be connected to a specific goal such as enhancing job performance. This hinders the economic transferability of the UTAUT to BEVs, because goals for choosing an (electric) car can be diverse: People want to satisfy mobility needs, drive environmental friendly or use the car as a symbol (e.g., Steg, 2005). Thus, the TPB was preferred as theoretical foundation for the framework developed in Paper III. In BEV acceptance research, some researchers concentrated on BEV attributes for predicting BEV acceptance and showed that notable variance in behavioral intentions can be explained by the evaluation of BEV attributes (Schuitema, Anable, Skippon, & Kinnear, 2013; Noppers, Keizer, Bolderdijk, & Steg, 2014; Noppers, Keizer, Bockarjova, & Steg, 2015). Thereby, attributes were divided into instrumental (Noppers et al., 2014; Noppers et al., 2015; Schuitema et al., 2013), symbolic (Noppers et al., 2014; Noppers et al., 2015; Schuitema et al., 2013), hedonic (Schuitema et al., 2013), and/or environmental attributes (Noppers et al., 2014; Noppers et al., 2015). Instrumental attributes include all kinds of functional BEV aspects such as charging duration, driving range, or purchase prize. Symbolic attributes describe the fact that some people drive a BEV to express, for instance, their identity and to make a statement. Hedonic attributes summarize emotional aspects of driving a BEV such as fun or driving pleasure. Moons and De Pelsmacker (2012) tested a model of BEV acceptance combining the TPB (Ajzen, 1991) with selected attributes of BEVs that evoke emotions (comparable to the concept of hedonic attributes) and
8 • Synopsis socio-demographic variables. The 27 predictors explained 47% of variance in acceptance and, besides attitudes, subjective norms, selected items covering perceived behavioral control, and socio-demographic variables, BEV attributes that are closely related to emotions turned out to be important predictors for the intention to use a BEV. However, the authors had difficulty in summarizing different functional attributes within one factor and did not investigate specific BEV attributes such as low noise emission. Nayum and Klöckner (2014) predicted car choice behavior with 20 factors, including car attributes (i.e., symbolic, instrumental & hedonic) and TPB factors (Ajzen, 1991) as predictors, and explained 92% in the intention to choose a certain car type. Regarding car attributes, only symbolic attributes proved to be a significant positive predictor for intention, which is contrary to results in BEV studies (e.g., Schuitema et al., 2013; Noppers et al., 2014; Noppers et al., 2015). They found positive significant impacts for the other attribute categories. BEV experience was only added as predictor by Barth, Jugert and Fritsche (2016) besides several norm factors as well as financial and sustainability aspects of BEVs. This model could explain 20% of BEV buying intention variance. To sum up, BEV acceptance research often relied on the TPB (Ajzen, 1991) and/or BEV attributes. This thesis aimed at a theoretical framework that includes the separate evaluation of various BEV attributes and BEV experience, but also relevant psychological variables stated within the TPB (Ajzen, 1991). Thereby, hedonic, instrumental, symbolic and environmental aspects should be reflected within the BEV attribute factors. Developing the theoretical model is part of Paper III. Adding BEV characteristics as predictors to the TPB raises the question of which position they should have within the framework. There is evidence that product characteristics directly affect attitude, but only indirectly influence behavioral intention (e.g., Arndt, 2011; Moons & De Pelsmacker, 2015). Nayum and Klöckner (2014) provided contrary results; the evaluation of car attributes directly determined the intention to purchase a fuel-efficient car. As a result, the current framework includes potential direct and indirect effects of BEV attributes on attitudes towards BEVs ( attitudinal acceptance ) as well as purchase intention ( behavioral acceptance ). Furthermore, medium to high positive relationships were reported between BEV characteristics and variables addressing social influences (e.g., Barth et al., 2016; Nayum & Klöckner, 2014), but the causality of the relationship remained unclear. In ADAS research, it is argued that if people perceive their social environment as more supportive in terms of showing a special behavior (positive subjective
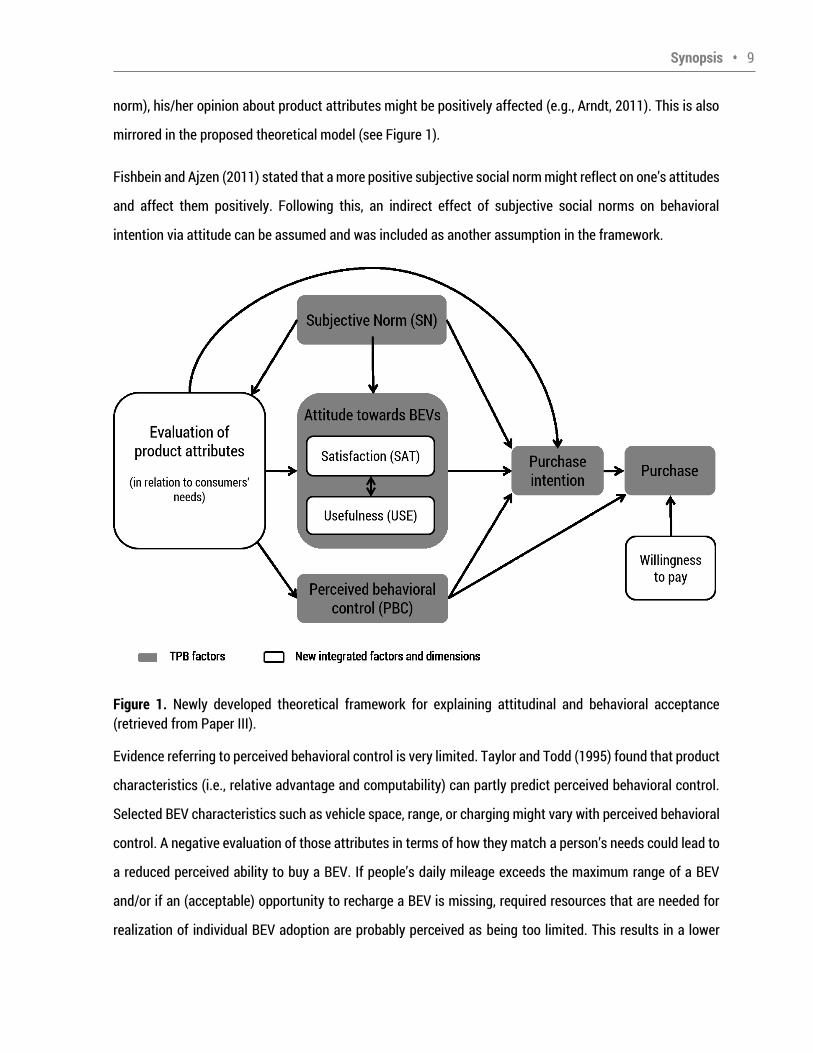
Synopsis • 9 norm), his/her opinion about product attributes might be positively affected (e.g., Arndt, 2011). This is also mirrored in the proposed theoretical model (see Figure 1). Fishbein and Ajzen (2011) stated that a more positive subjective social norm might reflect on one s attitudes and affect them positively. Following this, an indirect effect of subjective social norms on behavioral intention via attitude can be assumed and was included as another assumption in the framework. Figure 1. Newly developed theoretical framework for explaining attitudinal and behavioral acceptance (retrieved from Paper III). Evidence referring to perceived behavioral control is very limited. Taylor and Todd (1995) found that product characteristics (i.e., relative advantage and computability) can partly predict perceived behavioral control. Selected BEV characteristics such as vehicle space, range, or charging might vary with perceived behavioral control. A negative evaluation of those attributes in terms of how they match a person s needs could lead to
a reduced perceived ability to buy a BEV. If people s daily mileage exceeds the maximum range of a BEV and/or if an (acceptable) opportunity to recharge a BEV is missing, required resources that are needed for realization of individual BEV adoption are probably perceived as being too limited. This results in a lower
10 • Synopsis perceived behavioral control. The proposed relationships between the evaluation of product characteristics, subjective norm, and perceived behavioral control are depicted in Figure 1. In addition to the abovementioned aspects, the framework should include BEV s acquisition costs and
people s willingness to pay, factors that are repeatedly discussed and intensively studied in BEV research (e.g., Larson, Viáfara, Parsons, & Elias, 2014; Rezvani, Jansson, & Bodin, 2015). Thus, willingness to pay is included in the framework (see Figure 1) as a predictor for BEV purchase, in addition to purchase intention and a perceived behavioral control as suggested by Arndt (2011). So far, the newly developed theoretical framework includes TPB factors as well as the evaluation of BEV attributes. The question seeking clarity is what role does the current low distribution of BEVs (International Energy Agency, 2016) and resulting low familiarity with BEVs play for BEV acceptance. 4 The Importance of Experiencing Electric Mobility Systems Components At the time that this thesis was begun, human-centered research on electric mobility systems was rare and normally based on people who typically had no prior experience with BEVs (e.g., Dagsvik, Wennemo, Wetterwald, & Aaberge, 2002; Egbue & Long, 2012; Ewing & Sarigöllü, 1998; Hidrue, Parsons, Kempton, & Gardner, 2011; Higgins, Paevere, Gardner, & Quezada, 2012). However, potential consumers that have no experience with a product tend to inaccurately predict their interest in it (Hoeffler, 2003). Based on that, studies that investigate people who have experienced electric mobility seem to be more promising for increasing an understanding of consumers preferences and acceptance of BEVs and associated technologies such as specific vehicle aspects or smart charging. During the work on the present thesis, research involving experienced users increased regarding BEVs (e.g., Peters & Dütschke, 2014; Skippon et al., 2016; Wang et al., 2016) and smart charging systems (e.g., Pettersson, 2013). Before reviewing the existing literature on user studies including different levels of practical experience with electric mobility system components, some theoretical effects of direct experience are outlined. 4.1 Really-new Products and the Problem of Uncertainty According to Urban et al. (1996), really-new products revolutionize product categories or define new categories and represent new technologies, require consumer learning, and induce behavior changes
Synopsis • 11 (p. 47). BEVs represent an actual example of a really-new product (Skippon et al., 2016) and are also discussed as being a disruptive technology (e.g., Hardman, Steinberger-Wilckens, & van der Horst, 2013; Vilimek & Keinath, 2014). Disruptive technologies, with their new characteristics, change the way in which the technology is used (p. 15444, Hardman et al., 2013), but also require new infrastructure and/or are disruptive to market leaders. Both terms address the consequences for the user when adopting such a really-new or disruptive technology. For consistency reasons, the term really-new product is utilized within the present thesis. Drivers of conventional vehicles cannot transfer their whole knowledge about existing technologies on BEV usage. Driving a conventional vehicle differs from using a BEV on various task levels (Cocron, 2014) caused by new functions (i.e., regenerative braking) and characteristics (i.e., missing/extremely reduced auditory feedback from the engine). Recharging is known from other types of technical devices, such as smartphones, but not in the context of mobility. Consequences of a specific charging behavior might differ and/or be evaluated differently in the mobility context. Forgetting to plug-in a smartphone at home is less troublesome, as many other opportunities for recharging exist (e.g., in trains, at work). Recharging opportunities for BEV are more limited. Smart charging systems are another example of a really-new product; potential users knowledge is even more limited; the charging of a vehicle itself is a completely new topic for many people. Hoeffler (2003) argued that unknown, really-new products lead to higher levels of uncertainty among people. Higher uncertainty and higher deviation of really-new products from conventional ones, in this case BEVs from vehicles with an internal combustion engine (ICE), have been found to lead to lower willingness to purchase (Hoeffler & Herzenstein, 2011; Sierzchula et al., 2014). For smart charging systems, uncertainty within society is also expected to be high, which probably hinders the willingness to participate or use such a system. Raquel, Mita, Harish, and Manish (2009) argued that people are uncertain about performance, symbolic meaning, shift-costs, and affect related with the adoption of a really-new product. Heiman, McWilliams and Zilberman (2012) differentiated between technology, performance, matching, and response uncertainty. BEVs and smart charging systems are likely for most people to carry all these kinds of uncertainties. Although, BEVs have been on the market for several years, they remain unfamiliar (Skippon et al., 2016) and mass-market consumer drivers possess limited knowledge concerning technology, performance, and specific aspects such as regenerative braking or charging. People are uncertain regarding battery lifetime
12 • Synopsis (technology/performance; Egbue & Long, 2012; Graham-Rowe et al. 2012) and whether the available range can satisfy their mobility needs (matching/shift-costs; Egbue & Long, 2012; Graham-Rowe et al. 2012), and about the potential embarrassment (affect, e.g., Graham-Rowe et al., 2012) and social judgement associated with driving BEVs (symbolic/response; Graham-Rowe et al., 2012). The purchase of a car as a durable good (e.g., Saccani, Perona, & Bacchetti, 2017) is one of the most challenging and important consumer decisions (Bazerman, 2001), and is also described as a high-stake decision (e.g., Boudreaux & Crampton, 2003). It comes with high (personal) costs, involvement (due to high costs), and long-term commitment, all requiring an intensive decision-making process (Koklič & Vida, 2009). High-stakes decisions involve a higher investment of effort by the user, for example, in the search for information and in the time this decision takes, compared to purchase decisions about non-durable goods or low-stakes decisions (e.g., Boudreaux & Crampton, 2003; Hermann, Xia, Monroe, & Huber, 2007). As a logical consequence, reducing uncertainty is of major interest for potential consumers of a new car. For smart charging systems with high user involvement, the product category (non-durable vs. durable) is unclear, as no business models exist and it has not been decided if users have to pay, for instance, for necessary charging infrastructure. Thus, involvement and effort in decision-making might be lower, resulting in a lower importance being given to information gathered via practical experience. To sum up, electric mobility system components, namely BEVs and smart charging systems, reflect really-new products that go along with low familiarity and high uncertainty within the society. So the question arises what happens to people s evaluation of a component if they become experienced with the new technology. 4.2 Real-life Experience as Source of Information and Potential Driver of Acceptance In drivers acceptance research on new technology, the role of experience and changes in acceptance when experiencing a product or technology has not been sufficiently investigated (Stevens, Horberry, & Regan, 2014). Research in different areas suggests that experience with a product increases acceptance (e.g., Kraut, Mukhopadhyay, Szczypula, Kiesler, & Scherlis, 1999; Liaw & Huang, 2003; Nilsson, Schuitema, Bergstad, Martinsson, & Thorson, 2016; Van Driel, Hoedemaeker, & Van Arem, 2007) and reduces uncertainty regarding its evaluation (e.g., Smith & Swinyard, 1983; Heiman et al., 2012). In consumer research, the concept and influence of experience on purchase decision has been intensively investigated (e.g., Bettman & Park, 1980).
Synopsis • 13 Hamilton and Thompson (2007) distinguish between indirect experience via advertisements with no interaction and direct via product trials that include interaction with the product. The present thesis focuses on direct, hands-on, real-life experience with BEVs. When experiencing a product, people learn more about it, which in turn is expected to lead to more confidence. Gregan-Paxton and John (1997) argued that besides advertising and other external information sources, direct product experience is one primary source of consumer learning. For novel products, users aim to apply existing product schemas or categories in order to comprehend the product (Peracchio & Tybout, 1996). Kim (2009) discussed the role of memory and usage experience for the evaluation of a product based on the reasoned action approach as used within the TPB (Ajzen, 1991). He argues that new information gathered by using a product will influence the evaluation of the TPB factors if they are stored in long-term memory. The newly stored information in explicit semantic and/or episodic memory will be used to update earlier judgements. For really-new products it is even more likely that people assimilate new information when experiencing them. BEVs belong to the category of cars, but users face many new concepts (e.g., Urban et al., 1996) that are normally not embedded in the mental category of vehicles with internal combustion engines (ICEs): low noise emission, charging, and regenerative braking. Furthermore, the kilometers that can be driven without refueling are much less than for ICEs. At best, people have already heard of the differences and stored them as factual knowledge, but they lack knowledge of the consequences and how to handle these aspects in a daily routine. For smart charging systems, nothing comparable has existed until now, which probably results in an even bigger lack of knowledge. People acquire new skills when experiencing new products. This process usually follows typical patterns which can be descried by a power function. According to the power law of practice (Newell & Rosenbloom, 1981), people learn quickly at first, but this process slows rapidly. Driving a BEV requires new skills such as using regenerative braking (Cocron, 2014). If learning goes quickly, uncertainty in this area should be reduced and might positively influence the evaluation or usage/purchase intention. Skill acquisition, using the example of regenerative braking, is addressed in Paper I. In user research on BEVs, authors emphasize that direct BEV experience is of high value in convincing people that BEVs are convenient as well as fun to drive (Bakker & Trip, 2013; Burgess et al., 2013; Ozaki &
14 • Synopsis Sevastyanova, 2011; Rezvani et al., 2015). Moreover, experiencing a BEV is ascribed to overcome prejudices (e.g., Burgess et al., 2013). So, experience could be assumed to be an important factor in reducing uncertainty, and could result in higher adoption intention. Consequently, the present thesis focuses on direct, real-life experience with BEVs and a smart charging system that reflects an opportunity to use a target technology and is typically operationalized as the passage of time from the initial use of a technology by an individual (Venkatesh et al., 2012, p. 161). In all papers that are part of this cumulative dissertation, the effects of experience on user evaluations of electric mobility system components were investigated. 4.3 BEV Evaluation and the Role of Real-Life Experience In the following sections, a short review of previous publications on BEV advantages and barriers perceived by (potential) consumers and the potentially influencing factors on their acceptance, including BEV-specific aspects and functions, will be given. Thereby, the focus is on studies that either involve BEV-experienced participants or in which BEV experience is provided. 4.3.1 Changes in Perceived Advantages and Barriers of BEVs When Gaining Real-Life Experience Reported advantages and barriers for BEV acceptance are quite similar when compared to the findings of studies with BEV-experienced (e.g., Gärling & Johansson, 1999; Graham-Rowe et al., 2012) and BEV-inexperienced drivers (e.g., Egbue & Long, 2012). Both groups address, for instance, range, costs, infrastructure, charging time, and lack of noise as barriers, and environmental friendliness, high energy efficiency, and financial benefits as advantages (e.g., Egbue & Long, 2012; Jabeen et al., 2012; Gärling & Johansson, 1999; Graham-Rowe et al., 2012). However, barriers such as trip planning (Jabeen et al., 2012) and advantages including driving fun (e.g., Turrentine et al., 2011), smooth driving, high torque, and low noise (e.g., Jabeen et al., 2012) seem to be more salient after gaining BEV experience, as they were only reported in studies with BEV-experienced drivers and not in those with BEV-inexperienced drivers (e.g., Egbue & Long, 2012). Peters and Dütschke (2014) also showed that BEV users perceive higher relative advantages and lower relative disadvantages respectively than non-users. For really-new products, Hoeffler and Herzenstein (2011) argued that potential consumers are not aware of (some) benefits, and gaining experience is a potential way of increasing awareness. Better insight into the effect of experience on awareness of BEV benefits and barriers is attainable by utilizing pre-post comparisons. To my knowledge, such studies do not exist. Paper II takes up at this point
Synopsis • 15 and investigates changes in perceived advantages and disadvantages of BEVs utilizing a pre-post trial comparison. 4.3.2 Users’ Acceptance with Varying Levels of BEV Experience Apart from potential advantages and disadvantages, experience is described as crucial factor for BEV acceptance by Burgess et al. (2013); drivers reported that experience has the potential to change peoples perception of specific BEV attributes (e.g., low noise). Repeatedly, research pointed towards a positive effect of gaining BEV experience on attitude (Carroll, 2010; Wikström, Hansson, & Alvfors, 2014) and behavioral acceptance (Carroll, 2010; Turrentine et al., 2011), but in many cases neither a pre-assessment nor comparisons to BEV-inexperienced drivers were made. In some online studies, BEV-experienced and -inexperienced drivers were compared and showed ambiguous results. Barth et al. (2016) could not find an effect of BEV experience in a BEV-buying scenario. On the contrary, in other studies, BEV-experienced individuals showed a higher willingness to pay for a BEV than those who were inexperienced (Larson, et al., 2014; Peters & Dütschke, 2014). Anable, Schuitema, Skippon, and Kinnear (2011) emphasized the need for pre-post comparisons, but few studies realized these, and the results are varying. Over an 11-week trial with a BEV, purchase intentions decreased (Gärling & Johansson, 1999), which is most likely due to the early stage of BEV technology at this time. Turrentine and colleagues (2011) found an increase in willingness to buy after one year of private testing, and Carroll (2010) revealed an increase in willingness to use a BEV after a test drive and a 5-month fleet setting respectively. Pre-post comparisons of simultaneous attitudinal and behavioral acceptance do not yet exist for the newer, better performing generation of BEVs. Papers II and III (Study II) aim to bridge this research gap and examine the investigated experience effects on attitudinal as well as behavioral acceptance in a within-subject design. 4.3.3 Potentially Influencing Factors for BEV Acceptance and How They Differ between BEV-Experienced and -Inexperienced People According to various (BEV) acceptance models (e.g., TPB - Ajzen, 1991; Moons & De Pelsmacker, 2012; Nayum & Klöckner, 2014), purchase intention significantly depends on psychological factors such as social influence, norms, attitude, or perceived behavioral control. Some empirical evidence exists on the differences in psychological factors between BEV-experienced and BEV-inexperienced people. Peters and Dütschke (2014) reported that German BEV users rated the relative advantages (i.e., operation, infrastructural, driving), ease of use, compatibility with own values and needs, as well as the support in their
16 • Synopsis social environment (social norm) as higher compared to non-user groups. In Norway, comparisons between drivers of conventional cars with BEV drivers also showed that they differ in various psychological variables such as perceived behavioral control (Nayum et al., 2016); BEV drivers rated their self-efficiency to include a BEV in their life as higher as than drivers of conventional cars. Additionally, BEV drivers proved to be less interested in convenience as well as performance, evaluated environmental attributes more positively, and scored higher on behavioral intention, although not on social norm (Nayum et al., 2016). The varying results regarding the differenced in perceived social influence between Peters and Dütschke (2014) and Nayum et al. (2016) might reflect the different status of BEVs in Germany and Norway. The generous Norwegian subsidy policy contains not only financial incentives, but also driving privileges (e.g., free public parking and free usage of toll roads; Holtsmark & Skonhoft, 2014). According to the International Energy Agency (2016), the latter had a much higher market share of BEVs (23.3%) in 2015 compared to Germany (0.7%), which probably correlates with the different of levels societal support and attitudes regarding BEVs. In Norway, social influence might be more positive in general, and the perceived supportiveness of the social environment regarding BEV acceptance might not vary enough in order to reveal any significant differences between BEV owners and non-owners. For Germany, social norms regarding BEVs are expected to be more heterogeneous against the background of the low market share. As all studies reported in this thesis were conducted in Germany, subjective norm is assumed to vary between BEV-experienced and BEV-inexperienced drivers. Within Paper III, differences in perceived social pressure and perceived behavioral control between BEV-experienced and BEV-inexperienced drivers were studied. As stated before, BEVs present a relatively new type of vehicle that contains new functions and aspects that are different to conventional cars. Many BEV attributes represent advantages or disadvantages (see section 4.3.1), but various authors (e.g., Noppers et al., 2015; Rezvani et al., 2015; Schuitema et al., 2013) identified the direct effects of the evaluation of BEV characteristics on BEV acceptance. Thus, the effects of experience on the evaluation of BEV attributes should also receive attention. Carroll (2010) reported a trend that gaining (short-term) BEV experience leads to a more positive evaluation of BEV performance-attributes such as acceleration, top speed, and range, without statistically analyzing the effects. Low noise emission (Cocron & Krems, 2013) was rated more positively after gaining BEV experience. Jensen, Cherchi and Dios Ortúzar (2014) investigated the BEV experience effect on selected aspects (i.e., low noise, charging, range, fun, acceleration, safety, and vehicle size). They found that experience had a significantly positive effect on
Synopsis • 17 judgements of fun and acceleration, but had a negative effect on evaluation of range. In contrast, drivers in another long-term field study felt more comfortable with lower range levels, were more convinced that a BEV would fulfill their daily mobility needs, and were less skeptical regarding trip planning after testing the BEV several months (Franke, Cocron, Bühler, Neumann, & Krems, 2012). Charging was perceived as easy to handle, and the greater time and effort needed for recharging in comparison to traditional refueling was seen to be easily integrated into daily life, independent of levels of experience; still, for some BEV drivers charging was hard to integrate into a daily routine (Krems, 2011). Results regarding image, reputation, or symbolic meaning have been inconsistent and based on retro-perspective judgements (e.g., Burgess et al., 2013; Graham-Rowe et al., 2012). People reported a change in perceived image or symbolic meaning, but the direction of the effect varied between studies, and pre-post comparisons are lacking. Jensen et al. (2014) argued that the reason for changes in evaluation lie in less mature attitudes towards BEV characteristics before a trial, which is then formed during BEV usage. So, fun and acceleration seem to have outreached expectations, and experience led to a more positive view regarding these attributes (Jensen et al., 2014) as well as giving people more confidence in their judgments (Smith & Swinyard, 1983). Changes in the evaluation of BEVs indicate that expectations were different before testing, and stored information about BEVs was adjusted. The limited knowledge about the question of whether BEVs satisfy users expectations or even outreach them motivated further research within this thesis. Paper III therefore focuses on experience effects of BEV-attribute evaluation. 4.4 Integrating Experience as an Influencing Factor into the Theoretical Framework of BEV Acceptance Ajzen and Fishbein argued in 2005 that experience plays a role in the TPB and included this variable as one of many background factors. Further, they stated that learning from previous experiences will affect various beliefs and thereby behavioral performance. The studies reviewed in section 4.3.2 repeatedly show positive effects of providing BEV experience on attitude (e.g., Carroll, 2010), purchase intention (e.g., Turrentine et al., 2011) and willingness to pay (e.g., Larson et al., 2014). Inter-individual comparisons indicate that BEV-experienced drivers perceive their social environment as more supportive (Peters & Dütschke, 2014) and their self-efficiency of purchasing a BEV as higher (Nayum et al., 2016). Based on these findings, several direct effects of BEV experience are assumed within the present thesis and displayed in Figure 2.
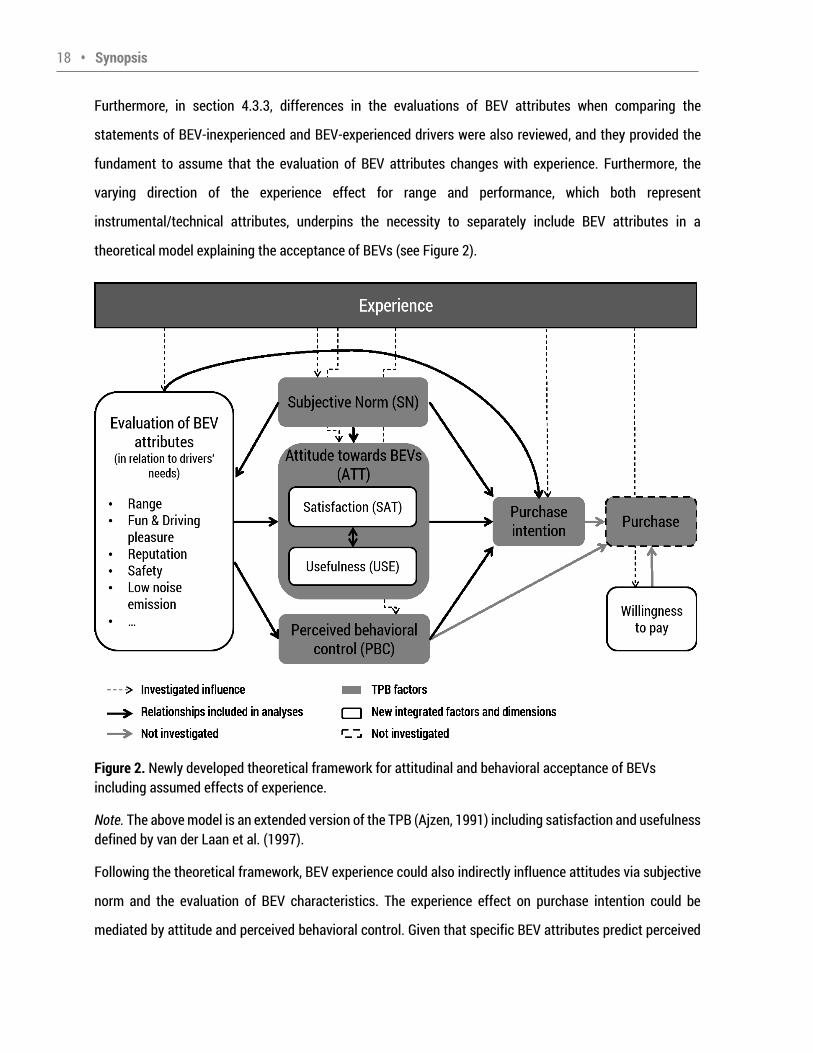
18 • Synopsis Furthermore, in section 4.3.3, differences in the evaluations of BEV attributes when comparing the statements of BEV-inexperienced and BEV-experienced drivers were also reviewed, and they provided the fundament to assume that the evaluation of BEV attributes changes with experience. Furthermore, the varying direction of the experience effect for range and performance, which both represent instrumental/technical attributes, underpins the necessity to separately include BEV attributes in a theoretical model explaining the acceptance of BEVs (see Figure 2). Figure 2. Newly developed theoretical framework for attitudinal and behavioral acceptance of BEVs including assumed effects of experience. Note. The above model is an extended version of the TPB (Ajzen, 1991) including satisfaction and usefulness defined by van der Laan et al. (1997). Following the theoretical framework, BEV experience could also indirectly influence attitudes via subjective norm and the evaluation of BEV characteristics. The experience effect on purchase intention could be mediated by attitude and perceived behavioral control. Given that specific BEV attributes predict perceived
Synopsis • 19 behavioral control, BEV experience could also have an indirect effect via the evaluation of BEV attributes. If experiencing a BEV changes the evaluation of the provided space within a BEV in a positive way so that the driver is assured that the BEV provides enough space for the whole family, the driver might deduce that if he wants, he can buy a BEV. However, to my knowledge, indirect experience-effects have not been studied in former research on BEV adoption. Thus, they were explored within Paper III. 4.5 Evaluation of Smart Charging Systems (with High User Involvement) and the Role of System Experience So far, reviewed literature regarding acceptance and the role of experience focused on BEVs. However, another component of future electric mobility systems is of interest within this thesis: smart charging. Contrary to conventional, uncontrolled charging processes that start immediately after the BEV is connected to the grid, smart charging systems for BEVs interact in real-time with smart-grids in order to plan charging processes with different charging rates. So, the charging process of the BEV can be adapted to the actual grid load and, therefore, help to overcome, for instance, grid overload problems (Amoroso & Cappuccino, 2012). There are different ways that smart charging systems can be designed and implemented. For time-shifting and efficiently managing a charging process, departure and/or parking times are needed for planning charging schedules. Additionally, information about the minimum required available range at predefined departure times would enhance the potential of smart charging for grid stabilization (Isaksson & Fagerholt, 2012). So, daily routines of electric vehicle use and people s mobility can be shaped by smart charging concepts that emphasizes the need of a user-centered approach (Norman & Draper, 1986) when developing such systems (e.g., Verbong, Beemsterboer, & Sengers, 2013). Some researchers argue that using a smart charging system will become inevitable for stabilizing the grid once market penetration of BEVs increases (e.g., Igbinovia, Fandi, Mahmoud, & Tlustý, 2016). Hence the users perspective on this system is of utter importance for the acceptance of electric mobility systems. Testing prototypes of such a system, identifying user requirements, and system acceptance all reveal an important source of information for future developmental steps. Previous research on the user perspective on smart charging system and how this evaluation is effected by real-life experience is rather sparse. In two field studies conducted by the research group of Chemnitz University of Technology, 80 and 10 BEV drivers, respectively, used a relatively simple smart/controlled
20 • Synopsis charging implementation without any reward system (Krems, 2011; Krems et al., 2011). The charging process was time-shifted so that the BEV was fully charged at a predefined time that BEV users could adjust via a web application: so-called controlled charging . Participants perceived controlled charging positively and showed a high willingness to participate (Krems et al., 2011). However, most participants did not adjust their predefined departure times to their actual departure times. The main reported reasons for not changing the settings were that the necessary effort was too high and that the costs weren t compensated with financial or ecological benefits. Fifteen private BEV drivers in another field study got the opportunity to set parking times via smartphone application when plugging in the BEV to activate smart charging (EnBW Energie Baden-Würtemberg AG, 2011). As a result, active participation (i.e., set standing times and unplug in accordance with their settings) was relatively high. However, Isaksson and Fagerholt (2012) stated that a smart charging system has greater potential when more information is provided by the user, which requires higher user involvement. A system with higher user involvement was investigated by a Swedish researcher within the ELVIIS project (Pettersson, 2013). Eleven participants rated the system as useful and were willing to use it following a 1-month test in a fleet setting. Still, there is a lack of research regarding private user evaluation of a smart charging system with high user involvement. As smart charging systems might become an essential part of daily life when using a BEV (Igbinovia et al., 2016), the present thesis picks up at this point and aims on collecting experiences with a prototype within a field test in a private setting. Nothing is known about the perceived advantages and barriers that potential users perceive and whether perception changes after testing a smart charging system. Furthermore, it has not been investigated whether attitudinal (i.e., if the system is acceptable) and behavioral acceptance (i.e., if they are willing to use the system) of the prototype changes during a field trial. These aspects are investigated in Paper IV. 5 Summary and Research Questions Fostering the acceptance of BEVs and smart charging systems for future mobility systems raises the need for investigating users evaluation of these really-new products and to identify drivers as well as barriers for acceptance. Potential consumers low familiarity and high uncertainty with these technologies lead to questions about how hands-on experience might change users evaluation once familiarity increases and
Synopsis • 21 uncertainty is reduced. To answer this main research question, the following research questions can be proposed against the background of the literature reviewed above. 5.1 Research Objective 1: General Evaluation of BEVs and the Relevance of Real-Life Experience Research so far indicates that BEV-experienced and BEV-inexperienced users perceive mostly similar advantages and disadvantages, but some are only reported by BEV-experienced drivers (Egbue & Long, 2012; Jabeen et al., 2012; Gärling & Johansson, 1999; Graham-Rowe et al., 2012; see section 4.3.1). Examples are smooth driving, high torque, low noise, or high planning effort (Jabeen et al., 2012). Additionally, Peters and Dütschke (2014) could show that BEV users see higher relative advantages and lower disadvantages. Given the reviewed literature on BEVs (e.g., Egbue & Long, 2012; Jabeen et al., 2012; Gärling & Johansson, 1999; Graham-Rowe et al., 2012), perceived environmental friendliness, lower running costs, energy efficiency, low noise, smooth driving, fun, and home-charging are assumed advantages, and limited range, charging infrastructure and duration, battery issues, reliability, uncertainty with service availability, low noise as a safety problem, and other safety concerns are expected barriers in Paper II. Furthermore, questions seeking clarity within Paper II concern changes in reported advantages and barriers when using a technology for a longer period of time, and whether such changes are more likely to be positive when advantages and barriers can be directly experienced. Regarding BEV experience, findings on attitudinal and behavioral acceptance are diverse (see section 4.3.2). Few studies found a positive effect of experiencing a BEV on attitudes toward BEVs (e.g., Carroll, 2010, Wikström et al., 2014) and more evidence was provided for an increase of behavioral intention after gaining experience (e.g., Carroll, 2010; Larson et al., 2014; Peters & Dütschke, 2014; Turrentine et al., 2011). Still, investigations of pre-post changes in attitudinal and behavioral acceptance within one study are very limited in number (e.g., Gärling & Johansson, 1999) and do not exist for the German population. Papers II and III enrich the existing literature by investigating the effects of BEV experience on both attitudinal and behavioral acceptance. 5.2 Research Objective 2: BEV Attributes and the Relevance of Real-Life Experience Uncertainty regarding really-new products such as BEVs (Sierzchula et al., 2014) is normally high in terms of technology, performance, affect, shift-costs, matching and symbolic value (Raquel et al., 2009; Heiman et
22 • Synopsis al., 2012). Reviewed literature regarding the evaluation of BEV attributes is very limited, but it provides some evidence for an experience effect that should be further strengthened (see section 4.3.3). Within our research group, the effects of BEV experience on range evaluation and preferences (e.g., Franke et al., 2012; Franke & Krems, 2013a), on judgments of low noise emissions (Cocron & Krems, 2013; Cocron, Bachl, Früh, Koch, & Krems, 2014), and on user perspectives on BEV interfaces (Neumann & Krems, 2016) were analyzed in-depth. Part of this thesis is a focus upon regenerative braking as a mostly unknown driving function. It is of special interest for traffic psychologists because it influences the driving task on different levels (i.e., operational, strategical, and maneuvering; see Cocron, 2014). Research so far has not addressed how evaluation changes when using this function for a while and whether this correlates with how easily people adapt. This is investigated in Paper I. A wide range of BEV-specific attributes (e.g., limited range, need for charging, low noise emissions, environmental friendliness) are previously reported as disadvantages and/or advantages (e.g., Egbue & Long, 2012; Graham-Rowe et al., 2012). As Paper II aims on investigating changes in the perception of advantages and disadvantages, it also indirectly contributes to this research question. On the basis of the reviewed literature, earlier studies of our research group as well as findings of Papers I and II, a wider range of BEV characteristics (i.e., low noise emission, range, safety, reliability, acceleration, and driving pleasure, reputation, regenerative braking, charging, environmental friendliness and vehicle size) were chosen for in-depth investigation of how the evaluation of BEV changes when experiencing it. As a pre-condition for studying BEV-experience effects on the evaluation of BEV attributes, scales for assessing the various attributes were developed within Paper III. The question as to how the evaluation of BEV attributes differs with inter- and intra-individual varying levels of BEV experience is addressed in Paper III. 5.3 Research Objective 3: Predicting BEV Acceptance with Various Psychological Variables, the Evaluation of BEV Attributes and BEV Experience In chapter 3.2.1 and Paper III, a theoretical model for explaining attitudinal and behavioral acceptance (see Figure 1) was proposed. Existing models of BEV adoption (e.g., Noppers et al., 2015; Schuitema et al., 2013) did not include the separate evaluation of various BEV characteristics such as range, environmental friendliness, or low noise emission. The separate investigation of BEV attributes creates the potential to identify the most influential ones for acceptance and, therefore, the main drivers that should be addressed
Synopsis • 23 in further development processes. This research aims to bridge this gap by investigating a wide range of attributes and identifying the number of sub factors of BEV attributes that can be separated within Paper III. Furthermore, experience with BEVs as an important influencing factor for BEV acceptance (e.g., Nayum et al., 2016; Peters & Dütschke, 2014) has not been part of more complex BEV acceptance models (see Nayum & Klöckner, 2014; Moons & De Pelsmacker, 2012). Only Barth et al. (2016) made an attempt to explain buying intention by using experience as one factor besides norms, financial, and sustainability aspects. Although, acceptance statements were stronger for BEV-experienced respondents, regression results did not support the importance of BEV experience for predicting acceptance. Furthermore, Barth et al. (2016 didn t consider further BEV attributes. The present thesis aimed at bridging the research gap by proposing a theoretical framework in section 4.4 (Figure 2) and Paper III, and investigating the relationships between BEV experience, the evaluation of BEV attributes, attitude, subjective norm, behavioral control, and purchase intention within two studies (Paper III). This should shed some light on the question of which factors are the strongest predictors for acceptance, and does BEV experience also influence psychological factors such as subjective norm. As potential indirect effects could be proposed based on literature (see section 4.4), the online survey (Study I) of Paper III also aims at identifying indirect effects of experience. 5.4 Research Objective 4: Evaluation of a Smart Charging System Prototype and the Role of Real-Life Experience So far, research objectives focused on BEVs, but smart charging systems represent a second component of the electric mobility system, that is of interest within the present thesis. The knowledge regarding the users perspective on smart charging systems is quite limited (see section 4.5). Systems with high user involvement that rely on information directly gathered from the user (e.g., departure times) promise a comparably high potential for grid stabilization (Isaksson & Fagerholt, 2012). In this regard, collecting experiences with a prototype within a field study is of high value. Investigating perceived advantages and barriers, attitudinal (i.e., if the system is acceptable) and behavioral acceptance (i.e., if they are willing to use the system) of such a prototype, and potential experience effects when testing a smart charging system are of high importance for the further development process, for policy planners, and future decision-makers. These aspects are investigated in Paper IV.
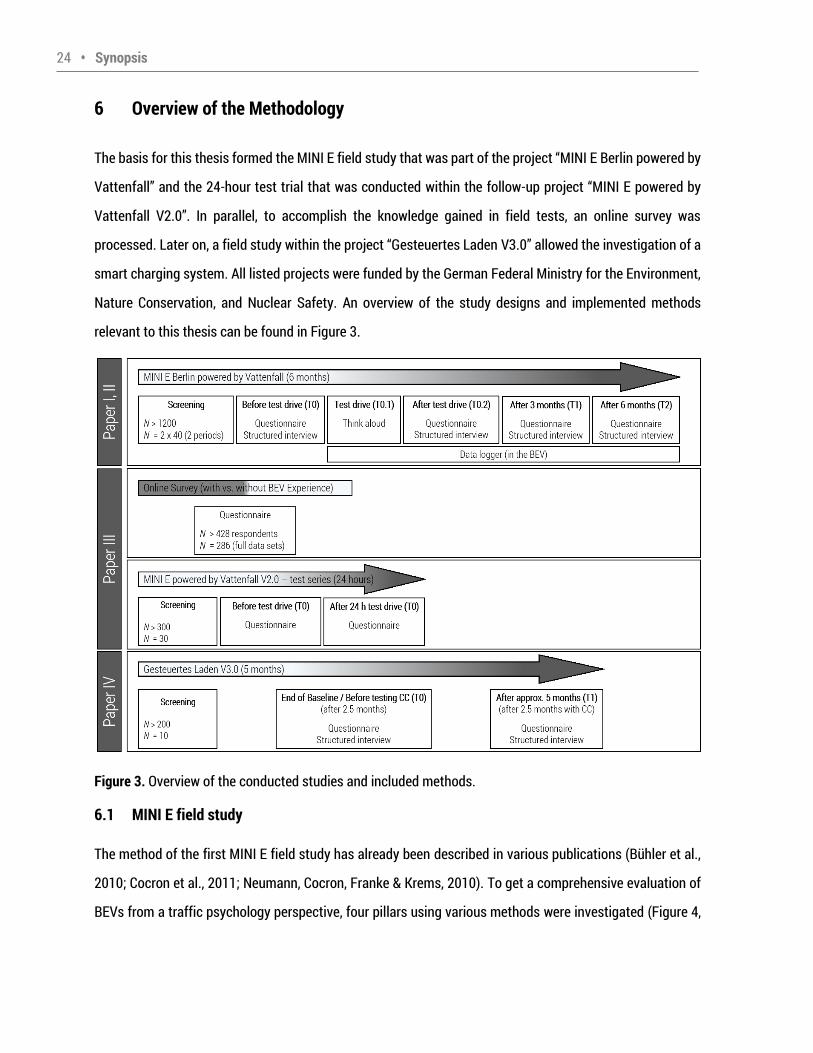
24 • Synopsis 6 Overview of the Methodology The basis for this thesis formed the MINI E field study that was part of the project MINI E Berlin powered by
Vattenfall and the 24-hour test trial that was conducted within the follow-up project MINI E powered by Vattenfall V2.0 . In parallel, to accomplish the knowledge gained in field tests, an online survey was processed. Later on, a field study within the project Gesteuertes Laden V3.0 allowed the investigation of a smart charging system. All listed projects were funded by the German Federal Ministry for the Environment, Nature Conservation, and Nuclear Safety. An overview of the study designs and implemented methods relevant to this thesis can be found in Figure 3. Figure 3. Overview of the conducted studies and included methods. 6.1 MINI E field study The method of the first MINI E field study has already been described in various publications (Bühler et al., 2010; Cocron et al., 2011; Neumann, Cocron, Franke & Krems, 2010). To get a comprehensive evaluation of BEVs from a traffic psychology perspective, four pillars using various methods were investigated (Figure 4,
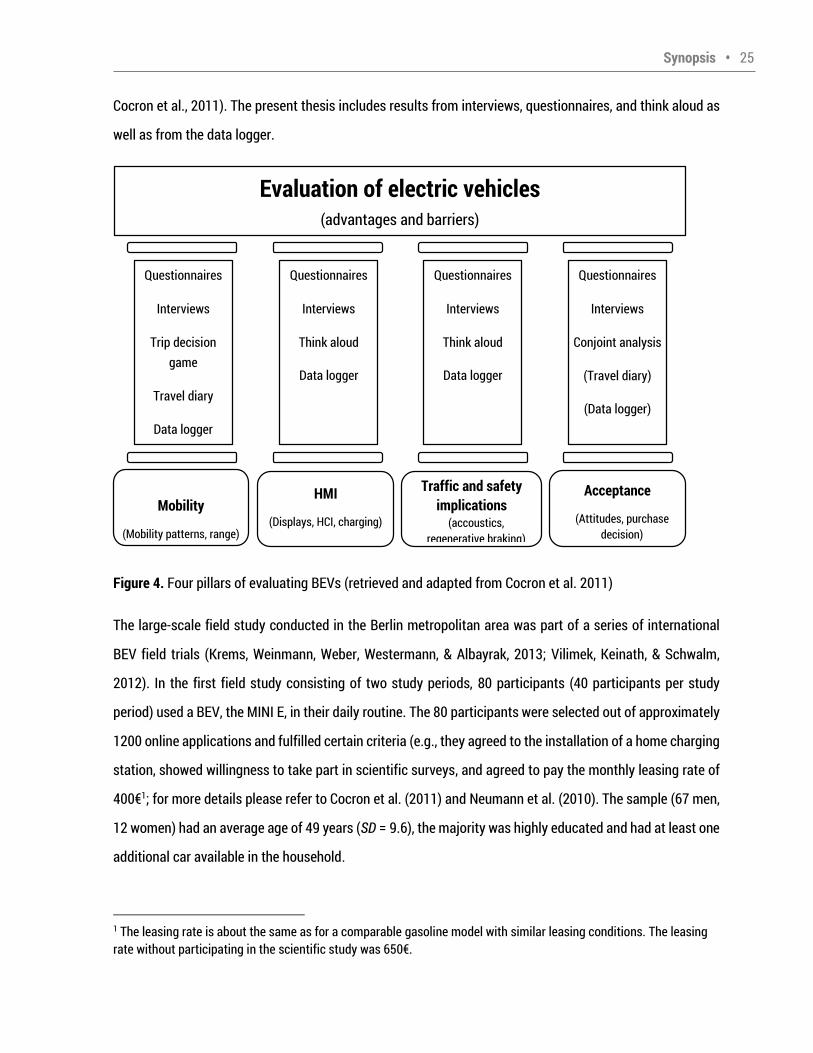
Synopsis • 25 Cocron et al., 2011). The present thesis includes results from interviews, questionnaires, and think aloud as well as from the data logger. The large-scale field study conducted in the Berlin metropolitan area was part of a series of international BEV field trials (Krems, Weinmann, Weber, Westermann, & Albayrak, 2013; Vilimek, Keinath, & Schwalm, 2012). In the first field study consisting of two study periods, 80 participants (40 participants per study period) used a BEV, the MINI E, in their daily routine. The 80 participants were selected out of approximately 1200 online applications and fulfilled certain criteria (e.g., they agreed to the installation of a home charging station, showed willingness to take part in scientific surveys, and agreed to pay the monthly leasing rate of
400€1; for more details please refer to Cocron et al. (2011) and Neumann et al. (2010). The sample (67 men, 12 women) had an average age of 49 years (SD = 9.6), the majority was highly educated and had at least one additional car available in the household. 1 The leasing rate is about the same as for a comparable gasoline model with similar leasing conditions. The leasing rate without participating in the scientific study was 650€. Questionnaires Interviews Conjoint analysis (Travel diary) (Data logger) Mobility (Mobility patterns, range) HMI (Displays, HCI, charging) Traffic and safety implications (accoustics, regenerative braking) Acceptance (Attitudes, purchase decision) Questionnaires Interviews Trip decision game Travel diary Data logger Questionnaires Interviews Think aloud Data logger Questionnaires Interviews Think aloud Data logger Evaluation of electric vehicles (advantages and barriers) Figure 4. Four pillars of evaluating BEVs (retrieved and adapted from Cocron et al. 2011)
26 • Synopsis Data was only collected from the one person per household who was expected to be the primary BEV user (main user approach). Participants were assessed three times: before receiving their car (T0), after 3 months of driving (T1) and when returning the car after 6 months (T2). Methods relevant for this thesis, are described in detail in Papers I and II. 6.2 Online Survey To further investigate the acceptance of BEVs and the role of BEV experience, an online survey was conducted using Lime Survey V1.92 (Schmitz, 2015) and is included in Paper III. It was mainly advertised via social networks and mailing lists. In order to acquire people with direct experience with BEVs, the questionnaire was distributed to 14 forums specializing in motor sports and environmentally friendly mobility and sent to two student teams who had built an electrically driven car. Out of the 428 respondents, 286 participants (44.8% male) had completed the questionnaire and had a drivers license. They formed the sample for the analyses. Participants were on average 27.6 years old (SD = 11.3). The sample was representative of the population of German car buyers given that it paralleled a large-scale study which showed little gender difference in the intention to buy a new car within a given timeframe, and that people under the age of 39 were more likely to purchase a new car (Aral Aktiengesellschaft, 2013). A question inquiring as to whether respondents had experience with BEVs was used to divide the sample into a BEV-inexperienced (N = 229) and -experienced group (N = 49). This study made the same distinction as Barth et al. (2016) in assigning respondents to the BEV-experienced group if they had driven a BEV at least once. Eight respondents were excluded because a clear distinction could not be made as they answered other . The online survey contained items covering most factors displayed in Figure 2 (except for purchase) and personal as well as socio-demographic questions. Its completion took less than 30 minutes. A detailed description can be found in Paper III. 6.3 24-hour Test Trial As part of the project MINI E powered by Vattenfall V2.0 , a 24-hour test trial was conducted in Chemnitz. Potential participants could apply for studies via an online tool which was advertised through the local press and a website. Thirty participants were selected who fulfilled certain criteria (i.e., held a driver s license for a minimum of 5 years, and had no prior experience with BEVs) and showed the largest possible variance in
Synopsis • 27 socio-demographic variables. The sample (3 female, 27 male) had a mean age of 46 years (SD = 10.5). Participants were instructed to test the BEV in their daily routine, incorporating journeys such as their commute to work. During the test drive, participants drove an average of 96.5 km (SD = 34.2; Min = 33 km, Max = 206 km). Data was collected before (T0) and after (T1) the test drive period. The implemented questionnaires contained the same items as the online questionnaire to assure compatibility. Furthermore, the BEV referred to in the online study was also used as the test vehicle to ensure standardization. Besides the online survey, this study was the second part of Paper III. 6.4 Smart Charging Field Study The field study for examining users perspective on smart charging was set up in cooperation with BMW Group, Vattenfall Europe, EWE AG, Clean Energy Sourcing AG, Fraunhofer Advanced System Technology AST, and Technische Universität Ilmenau within the research project Gesteuertes Laden V3.0 . In the metropolitan area of Berlin, 10 participants drove a BEV (BMW ActiveE) equipped with smart charging technology for 5 months. Additionally, a smart charging box with internet connection was installed in each household. The 10 participants (9 men, 1 woman) were selected from approximately 200 online applications. They fulfilled various selection criteria (e.g., have a waterproof location with internet connection on which a smart charging box can be installed, willingness to pay a monthly leasing rate of 370€), and showed a wide variety of sociodemographic variables. They were on average 47.3 years old (SD = 7.1). Many participants lived in multi-person households (n = 8), had no prior experience with hybrid electric vehicles or BEVs (n = 6), and were highly educated (7 hold a university degree, 2 are master craftsmen). One household had only the BEV. All others had one (n = 3) or more additional vehicles (n = 6). The sample was not representative for German car drivers, but BEV drivers in other studies showed similar distribution on sociodemographic variables (e.g., Hjorthol, 2013); participants were mainly middle-aged males, highly educated and had the opportunity to charge at home. Therefore, the sample was assumed to be representative of typical private BEV buyers who have the opportunity to use a smart charging system at home and function as a residential energy costumer. At first, participants gained 2 weeks of experience with the BEV and the conventional uncontrolled charging process (UC). Then, in a baseline period (ca. 8 weeks), participants drove and conventionally charged the
28 • Synopsis BEV. At the end of this period, the first data collection took place: Participants completed an online questionnaire a few days before the appointment, and had a face-to-face interview with one researcher (T0) at which they answered interview questions and completed a questionnaire. From the beginning of the 11th week of the field test onward, participants had the option to switch between two charging modes at any time: conventional uncontrolled charging (UC; i.e., charging starts immediately after plug-in) and controlled charging (CC). The implemented CC condition was programmed to charge the BEVs when energy demand in the grid was low (e.g., late-night hours) and need for regulation power was high. Calculated charging schedules were fitted to a simulated grid load (i.e., based on historic data, a grid was simulated simultaneously) and integrated with a planned departure time, the flexibility for users departure time, the
minimum state of charge (MinSOC) that must be guaranteed at departure time (50% MinSOC 100%), and a minimum state of charge that must be reached as quickly as possible (Safety Buffer, 30% Safety Buffer
45%). Users could adjust all settings via a smartphone application. At the end of the CC period, participants were questioned in the second face-to-face interview (T1) when they returned their BEVs. More details can be found in Paper IV. 7 Discussion and Critical Reflection of Results Within this dissertation, the evaluation of BEVs and smart charging systems was investigated with special emphasis on advantages, disadvantages, attitudinal and behavioral acceptance, and the role of gaining BEV experience. The actually low familiarity of most people with those new technologies caused the high interest in potential experience effects. Although the product- and system-specific attributes determined the content of research in terms of specific benefits and costs, the gained knowledge of the role of experience and the evaluation of product attributes for predicting acceptance can be transferred to other domains. When interpreting the results, the following points need to be kept in mind. First, it needs to be addressed that the presented studies on BEVs and smart charging system rely on the evaluation of one model and prototype respectively. However, other BEVs are comparable in many ways, for instance in range and charging, low noise emission, acceleration, and environmental friendliness, so that most results are transferable. Contrary, the evaluation of vehicle space may be due to the kind of vehicle selected. Still, it would enrich the scientific knowledge to investigate the applicability of this thesis s results to other types of BEVs and smart charging systems.
Synopsis • 29 Second, within the thesis, not all potential influencing factors were included in analyses. Gender and age effects were previously detected to explain part of the variance in purchase intention (Moons & De Pelsmacker, 2012). Thus, between-group comparisons within this thesis were based on matched samples that varied in neither age nor in gender. Considering the path model complexity, number of factors included in regression analyses, and sample size, age and gender were not included in the other analyses, but could increase the explained variance of attitudinal and behavioral acceptance. Furthermore, maintenance costs or refueling costs proved to be influential (Barth et al., 2016; Peters & Dütschke, 2014), but were not directly investigated within the framework as the focus was aimed at concrete BEV attributes. Acquisition costs were indirectly assessed via the willingness to pay. Third, in most studies within this thesis (except for Paper III), the samples most likely represent a population of early adopters (Rogers, 2010). This issue is more deeply discussed in the following sections. Acceptance by early adopters is crucial for widespread adoption of BEVs and, results gathered from this population can highlight barriers and driving factors that should be in the focus of further development steps. Last but not least, implemented methods have advantages, but also drawbacks that need to be considered when interpreting results. Field studies (Paper I, II, IV) and field tests (Paper III, Study II) include many external factors that a researcher cannot control, but participants get the opportunity to test the new technology in real-life conditions. Technology s suitability for daily life can be extensively tested and the ecological validity of the presented findings is higher. Online surveys (Paper III, Study I) are an economic method to collect data of larger samples, but the investigated sample might be not really representative (e.g., Theobald, 2016) for the German population due to self-selection and limited access to the internet, especially for older people (e.g., are issues) that should be kept in mind. Still, the sample seemed to be quite representative for German car drivers (see Paper III for more details). 7.1 Research Objective 1: General Evaluation of BEVs and the Relevance of Real-Life Experience In former publications on BEVs, it has been argued that providing experience is a promising strategy for promoting these vehicles, and that policies should not be solely focused on enhancing financial benefits and charging infrastructure (Sierzchula et al., 2014). Although it may be cheaper to promote experience (Sierzchula, 2014) than realizing other strategies, data on the effects of providing experience is limited. In
30 • Synopsis Papers II and III, it was studied whether experiencing BEVs changes people s evaluation of BEVs in terms of perceived advantages and disadvantages as well as acceptance. 7.1.1 Perceived Advantages and Barriers with Varying Levels of BEV Experience In Paper II, 80 participants were interviewed about advantages and barriers of BEVs before and after integrating a BEV in daily routine. The BEV experience affected potential consumers reports of advantages and barriers of BEVs. However, barriers do not become advantages or vice versa. Nine main categories of benefits (e.g., environmental friendliness, low noise) and ten main categories of barriers for BEV acceptance (e.g., range, charging duration, battery issues) could be identified within participants reports. Part of them also emerged in other research (e.g., Carroll, 2010; Egbue & Long, 2012; Graham-Rowe et al., 2012). The three most frequently reported advantages were environmental benefits, low noise emission, and the driving experience, including fun and driving pleasure. The limited range, high charging, and acquisition represented the three main barriers. Actual reports of McKinsey and Company (2017) showed that not much has changed and these are still the main barriers and benefits. Advantages and barriers could be categorized into experiential (i.e., ones that could be directly experienced) and more abstract or non-experiential (i.e., those that could not be directly experienced). Many experiential advantages (i.e., low noise, pleasant driving, fun, refueling costs, opportunity to refuel at home) and barriers (i.e., charging duration and infrastructure, battery issues, low noise level) seemed to become more relevant and are more positively evaluated respectively (i.e., advantages are strengthened, barriers are weakened) after three months of testing a BEV. Egbue and Long (2012) discussed the uncertainty regarding battery technology as result of unfamiliarity with BEVs. The reduced relevance of the barrier addressing the state of battery development after gaining experience supports Egbue s and Long s (2012) argumentation. Non-experiential advantages such as environmental benefits and usage of renewable energy sources became less salient after BEV usage, which is contrary to findings from Gould and Golob (1998) who found that environmental benefits gain in importance. Non-experiential barriers (i.e., acquisition costs, perceived societal resistance to change) were of less salience after experiencing an BEV. Notable is that acquisition costs were still an often-reported barrier. Non-financial benefits that seem to outreach expectations and gain in importance over time, as well as the disadvantages that turned out to be less critical than expected, should be taken as a starting point for marketing strategies. In this regard advertising the enhanced pleasure when driving a BEV, for example, could be an effective promotion strategy. Other barriers that remained
Synopsis • 31 stable and/or represent major disadvantages for acceptance should be in the focus of future improvement strategies, so that these barriers might be reduced. These results serve as important information for policy makers as well as stakeholders, and can build the basis for planning further actions in order to enhance BEV acceptance. In Germany, financial incentives for purchasing electric vehicles have existed since the beginning of July 2016 (Die Bundesregierung, 2016). Further benefits (e.g., no purchase tax, free parking, free ferry usage) are provided by the Norwegian government to compensate for the high purchase price of BEVs. The implementation of these incentives seems to represent an effective strategy when considering the exceptionally high market penetration of BEVs in Norway (International Energy Agency, 2016). Experiencing potential advantages and barriers reduces people s uncertainty regarding those aspects (e.g., Smith & Swinyard, 1983), but it does not mean that the evaluation has to become more positive. So, results indicate that gaining BEV experience changed the relevance structure of advantages and barriers. Some advantages gained higher relevance and some barriers were mentioned less often, which indicates that the consequences of using a BEV were not as bad as expected. Following Schuitema et al. (2010) this could lead to higher acceptance. Thus, the question remains whether the changes in various beliefs regarding BEVs that are reflected in reported advantages and barriers are mirrored in acceptance, and if they are the ones that can explain acceptance. Paper III focused on this important research question and results are presented later in chapter 7.3. 7.1.2 The Relevance of Real-Life Experience for BEV Acceptance In three studies, attitudinal and behavioral acceptance indicators were assessed and they revealed quite different results. Attitudinal acceptance. Data obtained from the Van der Laan acceptance scale (Van der Laan et al., 1997) showed that participants of the MINI E field trials (Paper II) highly valued Satisfaction and Usefulness of the BEV at all points of data collection. Scores did not significantly change throughout the study, so the BEV experience did not affect attitudinal acceptance. In the other studies (Paper III), ratings of attitudinal acceptance were also positive, but values were lower. Between the two matched groups of the online sample (Paper III), which is probably more representative of German car drivers, attitudinal acceptance did also not differ. However, people who took part in the 24-hour test trial were more satisfied with the BEV after the test than stated in the beginning. Perceived usefulness did not change. Interestingly, test drivers values of both
32 • Synopsis scales were almost as high as from the early adopter sample of Paper II. Test drivers of the field study as well as of the 24-hour test trial applied for participation as response to advertisement before they were invited to the study; online survey respondents were recruited via websites and social media. Thus, test driver samples might suffer to some extent from a stronger self-selection bias; only people with an interest in BEVs apply and might already be more positive regarding BEVs. To sum up, attitudinal acceptance was hardly changed by BEV experience which is contrary to other studies conducted in fleet settings (Carroll, 2010; Wikström et al., 2014). In these studies, positive effects on people s opinions about BEVs were found. One reason might be that users in a fleet setting were not much involved in the decision to test a BEV compared to private users who applied for tests. So, fleet users might get even more new, reliable information within such a test. According to Klöckner (2014), attitudes could change upon the provision of reliable information concerning BEV models. This could explain the stronger effects of BEV experience on attitudes within the fleet samples. Behavioral acceptance. Besides attitudinal acceptance, behavioral acceptance was investigated in all conducted studies. Regarding purchase intention, participants in Paper II showed considerable variability, and BEV experience had little impact on intention. Throughout the field study, participants rather agreed to plan a BEV purchase at the end of the project. In detail, around 40% of the participants really endorsed that they want to plan to purchase a BEV after testing such a vehicle, independently of the data collection point. On the other hand, the willingness to pay more compared to a conventional vehicle decreased after experiencing the BEV. However, people were mostly willing to recommend BEVs to friends, and even stated higher intention when having BEV experience. This is in line with findings of Jabeen et al. (2012) and points out that providing BEV experience might not only affect the people who gained experience. It could also indirectly foster the adoption of BEVs via, for instance, more positive word-of-mouth (Rogers, 2010). In Paper III, purchase intention was the focus of investigation as indicator for behavioral acceptance. Online survey participants (Study I) and test drivers (Study II) denied on average that they plan to purchase a BEV. When comparing BEV-inexperienced with -experienced respondents of the online survey, the latter group was significantly less negative and showed a high inconsistency in statements with two standard deviations. This positive effect is in line with results of other online studies (Barth et al., 2016; Peters & Dütschke, 2014) and with the retro-perspective increase in purchase intention reported by Turrentine et al. (2011). In the 24-
Synopsis • 33 hour test trial (Paper III), no change in purchase intention was detected. The missing changes in purchase intention in pre-post comparisons are contrary to findings reported by other authors (Carroll, 2010; Wikström et al., 2014). In the actual literature (Skippon et al., 2016), there is even a decrease in the willingness to consider a BEV as next main or second car during the 36-hour test trial. For both studies of Paper III, results revealed an observable increase in willingness to pay; acceptable price ranges were higher when people had experienced the quality of a BEV, and therefore underpin the experience effect found by Larson et al. (2014). Given the results, the sample of Paper II seems to be much more positive regarding BEVs from the beginning. The long-term BEV testers had decided to integrate the BEV in a daily routine for the following six months, had a home-charging station available, and paid a monthly leasing rate. So, it is not that surprising that they value the BEV higher than the other samples (Paper III). The remaining positive evaluation of BEVs of the long-term testers indicates that the BEV satisfies their expectations and the development of BEVs is trending in a good direction. Still, the sample presented in Paper II is very likely more comparable to a population of early adopters (Rogers, 2010), and therefore, might not be representative of the general population of potential consumers. In the more representative sample of the online study and the test trial (Paper III), BEV-experienced people had less positive purchase intention. Still, owners within the group of BEV-experienced online respondents most likely represent early adopters as well. 7.1.3 Summary Regarding the General Evaluation of BEVs and the Relevance of Real-Life Experience In sum, findings of this thesis so far show that the overall evaluation of a BEV of a newer generation (built 2008) is quite positive, but this does not mirror in purchase intention. Having experience with BEVs seems not to influence this. In consumer research, one repeatedly found effect is that satisfaction decreases (after purchase) if expectations are negatively disconfirmed (Oliver, 1980). Thus, the remaining high satisfaction of the BEV leasers (Paper II) and the increase among the 24-hour test drivers (Paper III) indicate that, overall, the BEV meets their expectations. Satisfied consumers are also more loyal regarding vehicles with an electric power train and state higher purchase intention (Hur, Kim, & Park, 2013). However, in all studies, participants showed rather low purchase intention compared to their satisfaction. The relatively low purchase intention of the long-term testers might also go along with the quite limited number of available BEV models on the German market until 2013 (Plötz, Gnann, Kühn, & Wietschel, 2014). Field study drivers expressed their high loyalty with their high intention to recommend a BEV. Inconsistent results in how experiencing a BEV
34 • Synopsis changes purchase intention indicate that more attention should be paid to background factors within the studies and underlying beliefs. Findings of qualitative analyses lead to the impression that gaining BEV experience changes the relevance structure of advantages and barriers, but this is not mirrored in BEV acceptance. The question referring clarity is what determines acceptance so strongly that the detected changes in the evaluation of benefits and costs do not reflect in acceptance. Perhaps purchase intention mainly depends on the perceived barriers that did not change during the trial (Paper II) and BEV experience will only foster BEV acceptance as suggested by Sierzchula (2014) if the barriers such as the limited diffusion of charging infrastructure or limited range are reduced. 7.2 Research Objective 2: BEV Attributes and the Relevance of Real-Life Experience The second research question focused on BEV attributes and how the evaluation of them differs with inter- and intra-individual varying levels of BEV experience. First, regenerative braking as one BEV-specific vehicle aspect was investigated in-depth in Paper I. Second, a wider range of attributes were studied in two instances: an online survey and a 24-hour test trial within Paper III. 7.2.1 Regenerative Braking as Example of New Functions to which Drivers Need to Adapt – Acceptance and Behavioral change In each of the two study periods presented in Paper I, the data of 40 participants was assessed regarding the adaptation to and evaluation of regenerative braking. Data-logger data from both periods showed that using this function goes along with a steep learning curve that can be matched to the power law of practice (Newell & Rosenbloom, 1981). This is accomplished by a significant increase in trust and satisfaction over usage time, indicating that people had become more confident and positive regarding this function when using it. Usefulness was consistently high and no significant changes were detected. Interestingly, the usage rate of this function, that varied inter-individually, did not significantly correlate with the evaluation of the system. However, people that stated to have a shorter duration of their learning phase, evaluated regenerative braking as more useful and satisfying after testing the BEV for three months. Results of Paper II underpin the positive evaluation of regenerative braking after experiencing a BEV; after testing the BEV for three months, significantly more participants reported this function as an advantage. Labeye, Hugot, Brusque, and Regan (2016) supported the results concerning the positive evaluation of the regenerative
Synopsis • 35 braking function and the quick adaptation to it later. In sum, the function changes the driving task and style, but people do not perceive this as a disadvantage or barrier (Paper II). As using this function is reported as an eco-driving strategy that helps to drive more energy-efficiently and environmental friendly (Neumann, Franke, Cocron, Bühler, & Krems, 2015), the existence of the regenerative braking function might even support BEV adoption. 7.2.2 Identifying Factors Representing Important BEV Attributes and their Evaluation In order to examine the evaluation of a wider range of BEV attributes including noise emission, range, charging, etc., scales needed to be developed that can be utilized for assessment In Paper III, the online questionnaire (Study I) included various statements about BEV attributes such as driving pleasure, performance, low noise (Cocron & Krems, 2013), image, range, charging, vehicle size, regenerative braking, environmental friendliness, and safety, in addition to trust and reliability. Those attributes were chosen on the basis of identified advantages and barriers in Paper II and the literature review (see section 4.3). Analyses revealed seven factors: Enhanced Acceleration and Enhanced Fun , Enjoyable Low Noise Emission , Adequate Range and Charging , Positive Reputation , Sufficient Vehicle Space , Satisfying Safety and Reliability , and Environmental Friendliness . Items referring to regenerative braking had to be excluded from further analyses. Interestingly, identified factors only partly mirror repeatedly used BEV attribute categories as used by Schuitema et al. (2013) or Noppers et al. (2014). The reputation is probably highly correlated with the symbolic meaning of BEVs (Schuitema et al., 2013). Enhanced Acceleration and Enhanced Fun combines instrumental and hedonic aspects (Schuitema et al., 2013). Several originally combined characteristics within the category of instrumental attributes, such as range and acceleration, appear to be separated within the factor structure. Moons and De Pelsmacker (2012) experienced similar difficulties in combing several instrumental attributes into one factor. Still, they did not examine further BEV attributes such as low noise emission or safety. What further enriches the value of the within this thesis newly developed scales compared to most existing assessment methods is the link to the person and her or his individual needs (as suggested by Hahnel, Gölz, & Spada, 2014) instead of rating the importance of the characteristic for future purchase (Larson et al., 2014; Klöckner & Nayum, 2014) or rating attributes in comparison to conventional cars (Peters & Dütschke, 2014). Ecological innovations, such as BEVs, need to convince people on the one hand in terms of the functional aspects that are also provided by conventional cars, and on the other hand deliver an environmental benefit (Jannson, 2011). Except for range and charging
36 • Synopsis as well as provided vehicle space, participants of both studies in Paper III (rather) positively evaluated BEV attributes on average. In detail, respondents rather agree that a BEV is safe, reliable, environmental friendly, fun to drive, has a positive reputation, and enjoyably low noise emission. They further stated that the provided space does not match their needs. On average, online survey respondents also negatively evaluated the adequacy of range and charging. Participants of the test trial were somewhat undecided if the provided range fulfills mobility needs and if charging is includable in daily routine. Thus, people are not convinced that BEVs satisfy their mobility needs and charging can be integrated in their daily routine. In sum, results indicate that not all functional aspects of BEVs are expected to satisfy peoples needs which might cause limited acceptance. Changing the user perspective, if possible, might lead to higher acceptance. Within this thesis the role of real-life experience for changing BEV attribute evaluation was investigated. 7.2.3 Experiencing BEVs Changes the Evaluation of BEV Attributes In both studies of Paper III, differences between the evaluation of diverse BEV attributes of BEV-inexperienced and BEV-experienced drivers were investigated. As a result of Study I (an online study), inter-individual comparisons of matched samples between BEV-experienced and -inexperienced respondents hardly revealed any differences in the evaluation of BEV attributes. The judged adequateness of range and charging is one out of two aspects that are significantly higher rated by BEV-experienced respondents. The only other significant effect between BEV-inexperienced and BEV-experienced drivers concerns vehicle space. People who had experienced a BEV at least once were less critical regarding the provided space. Contrary, Skippon et al. (2016) found various differences between a group that tested a BEV for 36 hours compared to a control group that drove a comparable ICE during this time; BEV testers evaluation of performance, enjoyment, low noise, safety, and comfort was more positive compared to ICE testers. The question that cannot be clarified is how respondents of the online sample (Paper III) evaluated the different BEV attributes before testing it, whether experiencing the BEV strengthened their opinion, or whether their view on BEVs became positive due to an opportunity to test a BEV. Furthermore, it is unclear if the experience within the online sample was good or bad, or which facets of the tested BEV were positive or negative. It must also be acknowledged that existing BEVs differ in their characteristics, with this potentially also influencing the individual BEV user experience. Furthermore, the length of BEV experience was not controlled. These points were addressed in Study II of Paper III in which only one type of BEV was tested for 24 hours.
Synopsis • 37 Results of the 24-hour test trial (Study II of Paper III), in which changes were investigated using a within-subject design, looked quite different compared to Study I and go along with results of Skippon et al. (2016). A 24-hour test drive could lead to significant increases in approval of fun and acceleration and low noise emission, as well as safety and reliability. Beyond the findings of Skippon et al. (2016), Paper III showed significant positive effects of the trial on BEV attributes referring to positive reputation and environmental friendliness. However, findings revealed no change for the adequateness of range and charging as well as a negative effect of experience on the evaluation of the provided space within the vehicle. To sum up, a general BEV experience factor without details that further define that experience as utilized in the online survey will reveal different results than a more controlled BEV experience factor that has a fixed time-frame and a specific BEV type as investigated in the 24-hour test trial. Thus, when investigating and interpreting the effects of BEV experience, the concrete definition of that experience is of utter importance. 7.2.4 Summary Regarding BEV Attributes and the Role of Real-Life Experience When summarizing results of Paper I, II, and III (see Table 1), the following conclusion can be made regarding the effect of experiencing a BEV on the evaluation of BEV attributes. Range is perceived as a major barrier to acceptance both prior to and after experiencing a BEV. Following long-term experience, the higher time effort for recharging along with its unsatisfying infrastructure remains one important barrier, and no significant change in reports was detected (see Paper II). Only home-charging becomes a more appreciated advantage when gaining longer BEV experience. Results from the 24-hour test drive (Study II of Paper III) indicate that short-term experience leads to a similar effect, the evaluation of range in combination with charging (that does not explicitly include statements about home-charging) stays at a stabile score level. Shorter test drives were proven to reduce range stress and increase confidence (Rauh, Franke & Krems, 2015; Rauh, Franke & Krems, 2017), but seem not to have influenced the overall evaluation. Drivers with several months of BEV testing feel more comfortable with lower range levels, are more convinced that a BEV will fulfill their daily mobility needs, and are less skeptical regarding trip planning (Franke et al., 2012). Additionally, experiencing charging also proved to reduce uncertainties (Bunce, Harris, & Burgess, 2014). Overall, results indicate that expectations are met and that reducing uncertainty regarding range and charging does not change users perspective on these aspects. However, people who have had the chance of experiencing a BEV or even owning a BEV (see Study I of Paper III) seem to be less negative regarding range in combination with charging compared to inexperienced people. This might point to a sampling effect.
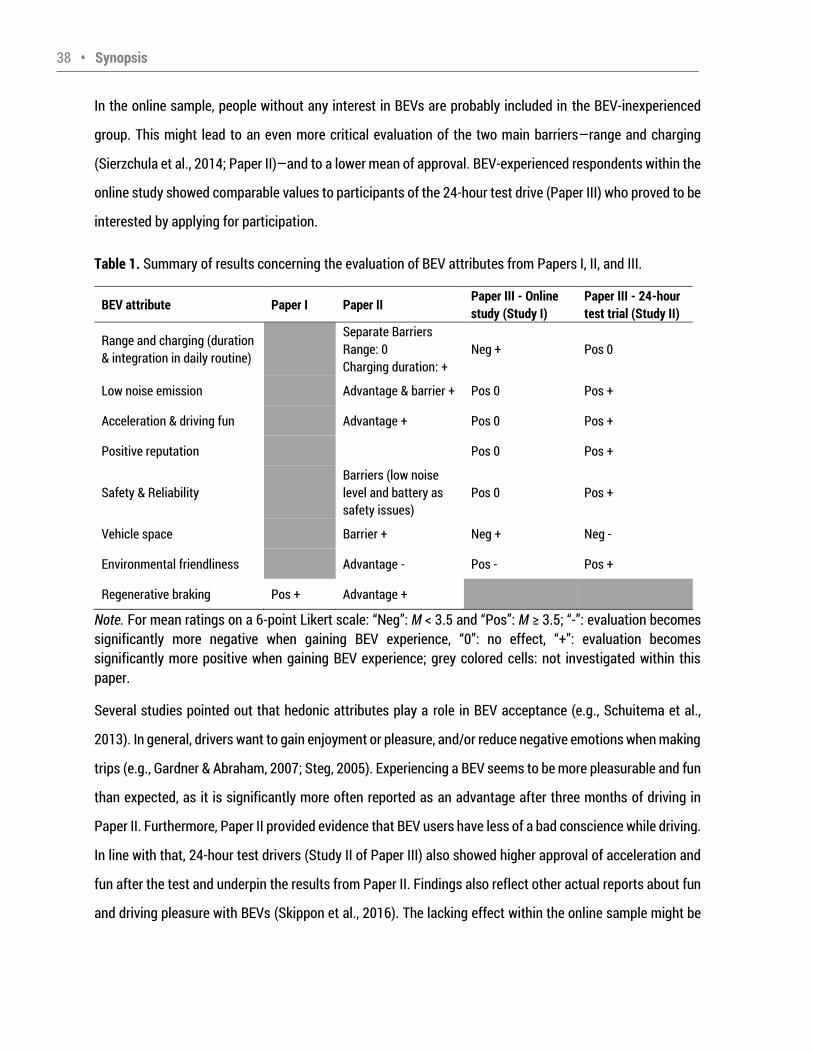
38 • Synopsis In the online sample, people without any interest in BEVs are probably included in the BEV-inexperienced group. This might lead to an even more critical evaluation of the two main barriers range and charging (Sierzchula et al., 2014; Paper II) and to a lower mean of approval. BEV-experienced respondents within the online study showed comparable values to participants of the 24-hour test drive (Paper III) who proved to be interested by applying for participation. Table 1. Summary of results concerning the evaluation of BEV attributes from Papers I, II, and III. BEV attribute Paper I Paper II Paper III - Online study (Study I) Paper III - 24-hour test trial (Study II) Range and charging (duration & integration in daily routine) Separate Barriers Range: 0 Charging duration: + Neg + Pos 0 Low noise emission Advantage & barrier + Pos 0 Pos + Acceleration & driving fun Advantage + Pos 0 Pos + Positive reputation Pos 0 Pos + Safety & Reliability Barriers (low noise level and battery as safety issues) Pos 0 Pos + Vehicle space Barrier + Neg + Neg - Environmental friendliness Advantage - Pos - Pos + Regenerative braking Pos + Advantage + Note. For mean ratings on a 6-point Likert scale: Neg : M < 3.5 and Pos : M 3.5; - : evaluation becomes significantly more negative when gaining BEV experience, 0 : no effect, + : evaluation becomes significantly more positive when gaining BEV experience; grey colored cells: not investigated within this paper. Several studies pointed out that hedonic attributes play a role in BEV acceptance (e.g., Schuitema et al., 2013). In general, drivers want to gain enjoyment or pleasure, and/or reduce negative emotions when making trips (e.g., Gardner & Abraham, 2007; Steg, 2005). Experiencing a BEV seems to be more pleasurable and fun than expected, as it is significantly more often reported as an advantage after three months of driving in Paper II. Furthermore, Paper II provided evidence that BEV users have less of a bad conscience while driving. In line with that, 24-hour test drivers (Study II of Paper III) also showed higher approval of acceleration and fun after the test and underpin the results from Paper II. Findings also reflect other actual reports about fun and driving pleasure with BEVs (Skippon et al., 2016). The lacking effect within the online sample might be
Synopsis • 39 due to differences in experience in terms of which BEV they had driven; existing BEV models are quite diverse in their characteristics. The reputation of BEVs mirrors the symbolic value of BEVs to some extent. The symbolic or identity-related meaning of product choice can shape purchase behavior (e.g., Dittmar, 2007; Heffner, Kurani, & Turrentine, 2007; Turrentine & Kurani, 2007). Thus, the trial of a BEV further convinced people of the positive reputation of BEVs (see Study II, Paper III) which is consistent to users reports studied by Burgess and colleagues (2013). Drivers were not ashamed of using a BEV like in the study of Graham-Rowe et al. (2012). The low noise emission is one of the most concise characteristics of BEVs. Findings reported in Paper II revealed that at the beginning of the trial, many participants (38%) named it as an advantage, but a high percentage of them were ambivalent about this feature and also called it a safety issue. After intensively testing the vehicle, it was reported as an advantage by many more people, with only a few participants remaining ambivalent. The low noise emission showed the highest increase in approval during the 24-hour test drive compared to all other BEV attributes (Paper III). The positive effect of experiencing a BEV on the users perspective on the low noise emission is in line with findings of Cocron and Krems (2013), as well as Skippon et al. (2016). The perceived environmental friendliness of BEVs struggles from having been so intensively discussed by researchers; BEVs are only environmental friendly if charged with green energy and the potential of BEVs for reducing CO2 emission of a vehicle depends on the whole production process (Hawkins, Singh, Majeau-Bettez, & Strømman, 2012). Detected differences in pre-post comparisons might depend on the perspective people choose referring to the local emissions or total emission, believing scientists who question the environmental benefit and on their knowledge about the debates surrounding this topic; evaluations can vary quite intensively, as the actual environmental benefits remain unclear. To sum up, many BEV attributes outreach expectations; the evaluation of driving pleasure, performance, social reputation, and regenerative braking, as well as the low noise emission, profit even from short-term experiences. Furthermore, people ascribe environmental friendliness to BEVs. Range and charging remain to be challenges that cannot be covered-up by experiencing a BEV.
40 • Synopsis 7.3 Research Objective 3: Predicting BEV Acceptance with Various Psychological Variables, the Evaluation of BEV Attributes and BEV Experience Another important goal of the thesis was to investigate the relevance of a wide range of variables when predicting acceptance, including BEV experience, traditional psychological factors such as attitude, subjective norm as well as perceived behavioral control, and the evaluation of BEV attributes. This was realized in Paper III. Analyses of the online study (Study I) concentrated on non-owners of BEVs, because BEV owners had already made the decision and further purchase intention would be hardly comparable to those of non-owners. In both studies, more than 50% of the variance in attitude towards BEVs could be explained by the evaluation of BEV attributes, experience, and, in Study I only, subjective norm. The complex model including TPB factors, the evaluation of several BEV attributes, and experience explained 41% (Study I) of the variance in purchase intention compared to the pure TPB model that explained 10% less variance. In the 24-hour test trial (Study II), a selected set of variables that had formerly proved to act as significant predictors explained 38% of purchase intention. In Figure 5, the results of the thesis regarding the theoretical framework are roughly summarized. 7.3.1 The Role of BEV Attributes for Attitudinal and Behavioral Acceptance Special emphasis was paid to including the evaluation of BEV characteristics while developing the theoretical framework. People s perspectives on BEV attributes proved to explain inter-individual variance in acceptance (Study I of Paper III). People who evaluate range and charging, acceleration and fun, low noise emission, reputation of BEVs, as well as environmental friendliness as more positive, ascribe higher levels of satisfaction and usefulness to BEVs. To my knowledge, only Moons and De Pelsmacker (2015) investigated the impact of BEV attributes on attitudes and found that ease of use (complexity), suitability to daily life (compatibility), and relative advantages for the society and the environment significantly predict attitudes, but without assuming a direct or indirect effect on the intention to use and recommend a BEV. As in other studies (Nayum & Klöckner, 2014; Schuitema et al., 2013), results in Paper III showed that the evaluation of BEV attributes notably influences a willingness to adopt. In detail, higher levels of enjoyable acceleration and enhanced fun as well as perceived adequateness of range and charging proved to have the strongest and most consistent effects on behavioral acceptance. In general, this is in line with Schuitema et al. (2013) as well as Nayum and Klöckner (2014), who described hedonic and instrumental attributes, aside
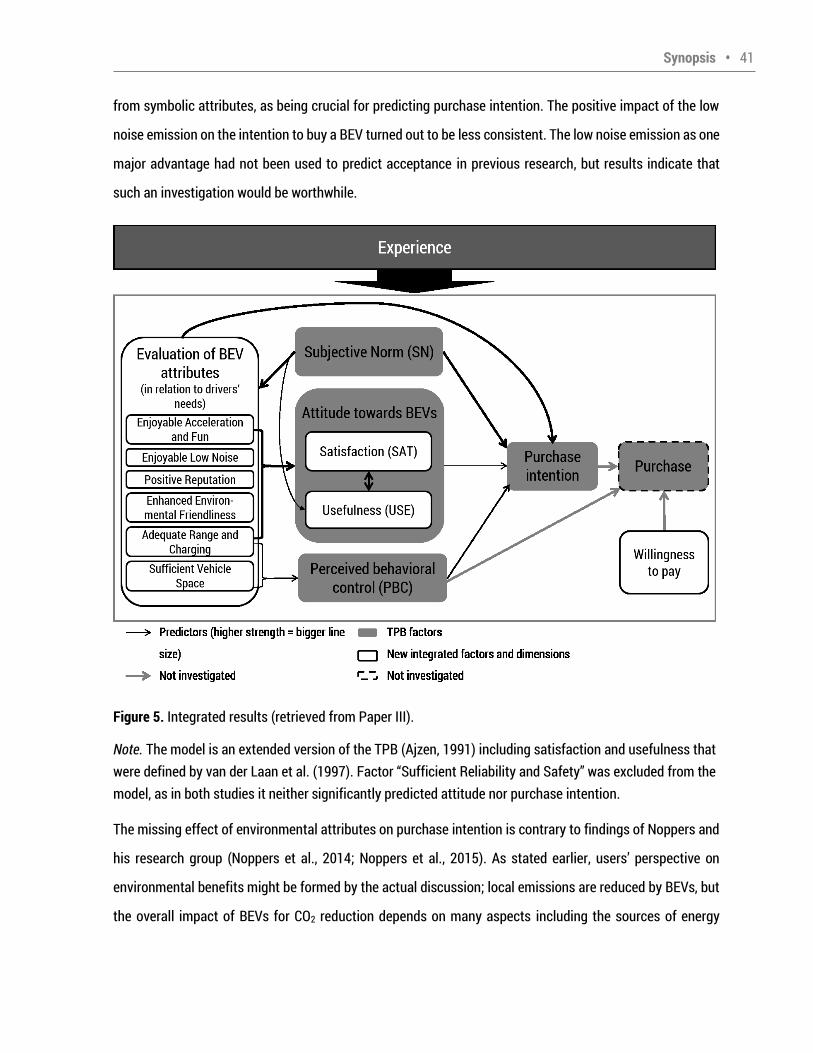
Synopsis • 41 from symbolic attributes, as being crucial for predicting purchase intention. The positive impact of the low noise emission on the intention to buy a BEV turned out to be less consistent. The low noise emission as one major advantage had not been used to predict acceptance in previous research, but results indicate that such an investigation would be worthwhile. Figure 5. Integrated results (retrieved from Paper III). Note. The model is an extended version of the TPB (Ajzen, 1991) including satisfaction and usefulness that were defined by van der Laan et al. (1997). Factor Sufficient Reliability and Safety was excluded from the model, as in both studies it neither significantly predicted attitude nor purchase intention. The missing effect of environmental attributes on purchase intention is contrary to findings of Noppers and his research group (Noppers et al., 2014; Noppers et al., 2015). As stated earlier, users perspective on environmental benefits might be formed by the actual discussion; local emissions are reduced by BEVs, but the overall impact of BEVs for CO2 reduction depends on many aspects including the sources of energy
42 • Synopsis production (Hawkins et al., 2012). Under present circumstances, people s approval of BEV s environmental friendliness is not a valid predictor for their adoption intention. A general lack of confidence in BEVs resulting in lower trust or mandatory uncertainties regarding safety and reliability as stated by other authors (Chan, Wong, Bouscayrol, & Chen, 2009; Graham-Rowe et al., 2012) were not detected within this thesis. Interestingly, the evaluation of trust, safety, and reliability could neither contribute to explain attitudinal nor behavioral acceptance. So these attributes present no drivers for BEV acceptance. As safety, trust and reliability were positively evaluated in all studies, they seem to be no barrier for BEV acceptance and no need for improvement exists for them. Overall, this thesis showed that a more detailed categorization of BEV attributes into different factors allows for the detection of particularly strong influencing instrumental attributes such as range and charging compared to weaker influencing instrumental factors such as low noise emission. Furthermore, indirect effects of BEV attributes on purchase intention (e.g., via perceived behavioral control) seem to exist, as total effects of BEV attributes on purchase intention were higher than the calculated direct effects. The findings enrich the existing knowledge on BEV acceptance, as none of the previous studies investigated the role of BEV attributes for attitudinal and behavioral acceptance simultaneously, as researchers had done in other areas of traffic psychology (e.g., Arndt, 2011). 7.3.2 The Influence of TPB Factors Within the Theoretical Framework for Explaining Attitudinal and Behavioral Acceptance Besides the evaluation of the influence of BEV attributes, the role of traditional psychological factors was investigated within this thesis (see Figure 1). In both studies included in Paper III, subjective norm turned out to be the major predictor for purchase intention. Barth et al. (2016) explicitly emphasized the importance of social influence for BEV adoption in parallel conducted research and argued that employing social norms should be an additional matter of marketing efforts. Notable is that providing short-term experience within a person s environment affected the evaluation of the subjective norm. During an extended test drive, important members of a participants social environment (e.g., husband/wife, children, friends) might get in touch with the BEV themselves, gain knowledge, and become positively impacted, resulting in a more positive subjective norm. Thus, BEV acceptance might be indirectly fostered by providing BEV experience or advancing BEV communication in neighborhoods, at work, or in communities. Neighbor effects or, more
Synopsis • 43 generally, social influences regarding BEVs will probably become higher as the market increases (Mau, Eyzaguirre, Jaccard, Collins-Dodd, & Tiedemann, 2008). Besides subjective norm, perceived behavioral control proved to be a strong predictor for people s willingness to buy a BEV in the online sample. The theoretical impact of attitude was not found in most analyses within this thesis. Klöckner (2014) argued that the TPB factors play different roles in different stages of the BEV purchase process. According to Barth et al. (2016), most Germans are currently in a very early, pre-decisional stage in which social influence is the key factor as well as emotional gain. In the following pre-actional stage, attitudes and knowledge about car types, as well as perceived behavioral control, theoretically form the behavioral intention, but the impact of perceived behavioral control was not confirmed by Klöckner (2014). Against this background, the missing effect of attitudes on purchase intention seems reasonable. However, it was surprising that the strong impact of one s perceived behavioral control on purchase intention did not fit Klöckner s (2014) and Barth et al. s (2016) argumentation. This can indicate that Germans find themselves in transition from the pre-decisional to the pre-actional stage, so that the perceived behavioral control is becoming more and more relevant for building intention. Another possible explanation for the inconsistent results are international differences. In Germany, BEVs maintain a market share below 1%; in Norway in 2015, it was above 23% (International Energy Agency, 2016). Consequently, Germans might perceive the ability of purchasing a BEV to be lower than Norwegians and perceived behavioral control might have a significant impact on behavioral intention that could not be demonstrated for Norwegians (Klöckner, 2014). 7.3.3 BEV Experience as Predictor for BEV Acceptance With the focus on BEV experience effects in Study I of Paper III, significant total effects for the perceived environmental friendliness (i.e., lower values for BEV-experienced), perceived self-efficiency regarding the BEV purchase (perceived behavioral control), and purchase intention were found, but there were no significant indirect effects. In Study II of Paper III, results of linear mixed models showed that experience did neither significantly explain attitude nor behavioral intention. The question remains which variables help to understand the difference in purchase intention between people with different experience levels. Based on the online study results, perceived behavioral control regarding a BEV purchase seems to be the key. People who are more interested in BEVs are probably better informed about the BEV market and might have made
44 • Synopsis up their mind if they could afford a BEV. Nayum et al. (2016) underpin this assumption with their finding that BEV owners have a higher perceived behavioral control regarding the purchase of fuel-efficient vehicles. In Study II, it was further investigated if pre-post changes in the evaluation of BEV attributes and subjective norm could predict changes in purchase intention. Regression analyses with difference scores indicated that 13-24% of the variance in purchase intention difference scores can be explained by changes in predictors. The attribute factor that did not change in its evaluation score during the test drive range and chargingturned out to be the strongest predictor indicating that fostering acceptance relies on improving range and charging. To sum up, main barriers (i.e., range and charging), emotional gains and performance, subjective norm, and perceived behavioral control had a notable impact on the willingness to purchase, but the effect of gaining experience with the really-new product was rather inconsistent. Still, the various effects of BEV experience on variables that determine acceptance emphasize its relevance within acceptance research. 7.4 Research Objective 4: Evaluation of a Smart Charging System Prototype and the Role of Experience As a component of the electric mobility system that will probably be needed when using a BEV in the future, smart charging systems and potential users evaluation of such a system as well as the relevance of experience were investigated within the scope of the final research question. Inspired by the domestication theory (Sørensen, 2006), interview data of 10 BEV drivers were analyzed focusing on symbolic, cognitive, and practical aspects when integrating a new technology in users daily routines. Results revealed that it is possible to integrate smart charging in daily life under the precondition that BEV drivers can predict their schedule and the needed BEV range for the next day, as this information is essential for planning the charging process and configuration settings (practical aspect). However, planning daily mobility and range needs ahead turned out to be a learning process (cognitive aspect). Users also needed to acquire knowledge and skills for using the system, but participants quotes indicate that this was no problem. Experience reports allow the assumption that while learning to use the smart charging system is relatively easy, it is mobility planning which is challenging. Still, improvements were required for the smart charging system itself (e.g., system stability, provision of access to smart charging from different devices) and the BEVs (e.g., charging
Synopsis • 45 durations, battery capacity) in order to enhance the acceptance of smart charging. BEV drivers reported no symbolic issues when talking about their experiences. Perceived benefits of using smart charging concerned the support for grid stability, financial benefits, and positive ecological effect of smart charging. Benefit ratings showed that the approval of the financial benefits became significantly lower after testing the system and gaining confidence in the real financial benefit. This indicates that the gains were probably not high enough or worth the effort. In accordance with other research (e.g., EnBW Energie Baden-Württemberg AG, 2011), these findings highlight the importance of ecological motives that should be stressed for future systems in combination with the contribution to society. Reported costs contained reduced flexibility, the need to better plan ahead, configuring settings via mobile application, and less range due to choosing a low minimum range at departure (MinSOC). These costs reflect necessary adjustments in daily practices. BEV drivers who wanted to get the best possible reward for using smart charging by setting the MinSOC as low as possible might have regretted the loss in available range. In the long-term, this might negatively influence acceptance of smart charging systems including this feature, and should receive close attention in future research and marketing attempts by highlighting the ecological impact, reducing range anxiety, and implementing well-chosen rewards. In addition, results regarding the assessment of cost-benefit-balance indicate that after testing the system, perceived costs such as reduced flexibility and more effortful charging are equalized by benefits such as grid stability and lower financial costs. However, the perceived effort to expend increased when testing smart charging, and findings indicate a readjustment of the cost-benefit analyses. Although financial benefits are not the main motivator for using smart charging, the perceived balance could be lost when financial benefits did not exist. According to Krems and colleagues (2011), financial gains are especially important when users effort is high. This seems to be the case for smart charging systems with high user involvement. Thus, future smart charging systems should either enhance financial benefits (which might be uneconomic) or reduce effort by implementing automatic system learning. Furthermore, future systems should be framed as contributing to the protection of the environment and grid stability, which additionally provide an economic benefit.
46 • Synopsis Regarding attitudinal acceptance, participants rated the system as rather acceptable and showed a high willingness to use smart charging within and after the project. In addition, the system was evaluated as effective, and rather suitable for daily life, and participants trusted it. However, trust significantly decreased, but acceptance remained at a comparable level, after gaining smart charging experience. The high willingness to use the system is consistent with findings from Pettersson (2013) in Sweden, who investigated a fleet sample. Behavioral acceptance was also given. Questionnaire results on charging behavior indicate that acceptance on the usage level was relatively high, as smart charging was extensively used by the sample (approximately 80% of charging events). The main reasons why smart charging was not chosen were an inability to access it and technical problems. In sum, usage rates might be even higher had users been given the opportunity to use smart charging more often, and if the reliability of the system would have been greater. Interview results indicate that changes in charging behavior adaptation due to offering smart charging can be quite different depending on their prior charging behavior. People who seldom charged before implementing smart charging charged more often; many BEV drivers that had plugged-in every day continued with this behavior, but others reported that they avoided charging when it was not rewarded. Now, the question remains if all types of changes are welcomed or if different solutions are needed for users with different charging styles (Franke & Krems, 2013b) in order to reach the maximum potential of smart charging for grid stabilization. Designers and engineers should have the different charging styles and potential varying effects of a reward system and its attributes in mind when further developing smart charging systems. 8 Implications and Conclusion 8.1 Practical Implications for Acceptance of Electric Mobility System Components The goal of the present thesis was to investigate, understand and explain acceptance of electric mobility system components as well as examine the role of practical experience. One motivation for this goal was the low acceptance of electric mobility in Germany. The German government (Die Bundesregierung, 2009) aims at 1 million electric cars on German streets by the year 2020. In spring 2016, the German government introduced financial incentives for electric vehicles. Around 10.000 applications (for BEV purchases) had been submitted until the end of April 2017 (Bundesamt für Wirtschaft und Ausfuhrkontrolle, 2017). The
Synopsis • 47 German Federal Motor Transport Authority (Kraftfahrt-Bundesamt, 2017) counted 34.022 registered electric vehicles in January 2017. Still, these numbers do not give the impression that the situation will soon change and that the government will reach its goal. BEV diffusion is still in an early stage (Barth et al., 2016). Awareness of electric mobility has probably increased since the beginning of this thesis, as the topic is repeatedly raised by politicians, car manufacturers, and media. McKinsey and Company (2017) report that 96% of potential car buyers were aware of BEVs in 2016, but around 50% of the German respondents were not familiar with this really-new product or related technologies. Thus, uncertainty within the society remains high. The thesis provides statistical evidence for Burgess and colleagues (2013) statement that testing a BEV can help consumers to overcome prejudices. Research colleagues have also demonstrated the effect of gaining experience with BEVs in specific domains such as interacting with range (Franke & Krems, 2013a), perception of low noise emission (Cocron & Krems, 2013), eco-driving (Neumann et al., 2015), and driver interface requirements (Neumann & Krems, 2016). The present study partly builds on this work by also showing the effect of experience on various aspects of BEVs and, simultaneously, on a more global levelBEV acceptance. Driving a BEV and gaining practical, direct experience presents an important source of information (Gregan-Paxton & John, 1997). New information is most likely stored in memory and can be recalled for the evaluation of BEV attributes (Kim, 2009). Results of the present thesis indicate that expectations regarding various BEV attributes are surpassed when experiencing a BEV, which leads to a more positive evaluation; the evaluation of BEVs profits from gaining experience regarding acceleration and fun, safety, reliability, reputation, regenerative braking, and low noise emission. Against the background that unrealistic user expectations have been discussed as a key factor for the low and unsatisfying acceptance of systems (Szajna & Scamell, 1993), the found effects of providing experience are of high value for planning future education programs or information campaigns. The evaluation of range and charging is one major, consistent BEV-specific barrier and is a factor that influences acceptance right now. On the basis of actual statistics, battery costs decrease (Nykvist & Nilsson, 2015) and are predicted to further decline, so prices of BEVs will decrease and/or range will increase. Additionally, infrastructure expansion is strongly fostered and charging duration will decrease with the implementation of fast charging stations (Nationale Plattform Elektromobilität, 2017). Thus, the barriers of range and charging will prospectively decrease. On the basis of the thesis results, this should enhance BEV
48 • Synopsis adoption intention. Still, it will likely take a while before BEVs are comparable to ICEs in terms of available range, and although fast charging takes less than 30 minutes for a recharge up to an 80% state of charge, it still takes much longer that normal refueling. Franke et al. (2012) suggested to train drivers to achieve better utilization of limited mobility resources in BEVs which might help to bridge the gap until more advanced batteries become available. To overcome the range barrier at the present time, BEV manufacturers also offer free rental cars for a few days per year for trips that exceed the BEV range. The implementation of a smart charging system as tested in this thesis would mainly influence the two BEV attributes that were just discussed range and charging. In order to receive the maximum possible financial benefit, BEV drivers need to plug in every day and adjust settings, which increases the effort of charging, as well as relinquish the possibility of an always fully charged BEV. The reduced range due to utilizing smart charging represents a barrier, although people decide themselves about the range that should be available at departure. In sum, the tested system was evaluated as rather acceptable and suitable for daily life, reported as easy to learn, and intensively used. However, dissatisfaction with financial benefits and the enhanced effort of charging appeared during the test. Overall, the implementation might negatively influence the evaluation of range and charging which is one of the strongest predictors for BEV acceptance. This indicates that future smart charging systems should be carefully designed so that they do not ultimately hinder satisfaction with BEVs. Results imply that even smarter systems with learning mechanisms that do not rely on high user involvement, or a system with a carefully adjusted reward system, should be preferred for future solutions. In addition, the social influence needs to get more attention in the context of electric mobility. In line with Barth et al. (2016), this thesis provided evidence that perceived social pressure is a fundamental aspect influencing acceptance. Thus, researchers, politicians and other stakeholder should focus on the questions how to influence the social norm in favor of BEVs, how to foster word-of-mouth marketing as a fruitful way to influence the subjective norm (Wang et al., 2016), and how to take advantage of the effect of neighborhood or community influence (Kahn, 2007) for enhancing BEV acceptance. An additional implication is that the performance and emotional gain of using a BEV is of high value for enhancing acceptance; people seem to be unaware of those benefits which can serve as the basis for
Synopsis • 49 planning marketing strategies, especially since testing a BEV positively affected people s evaluation of those aspects. Furthermore, findings imply that providing experience constitutes a promising tool in developing marketing strategies and policies that aim to change the evaluation of BEVs and their attributes, with the goal of increasing BEV adoption. However, such promotional test events need to be carefully designed to help the participants to recognize positive aspects of using a BEV and in order to reduce uncertainty show that adapting to a BEV is in many ways easy. Fundamental elements for planning such trials need to be considered, including duration and type of vehicle offered. It still needs to be investigated under which circumstances the positive experience effects on the evaluation of BEV attributes and satisfaction are reflected in purchase intention. When external barriers are reduced (e.g., missing charging infrastructure, lower costs), the potential of experiencing a BEV for supporting acceptance might be much higher and should be further investigated. People with varying infrastructure conditions were compared by Bühler et al. (2014); home-chargers and people who had to rely on public charging stations showed neither significant differences in attitudinal nor in behavioral acceptance. In order to draw conclusions as to if and how providing experience leads to more BEV purchases, actual purchase behavior needs to be investigated. Still, understanding the development of purchase intention is essential for identifying major drivers as well as barriers for acceptance and planning future marketing strategies for promoting BEV acceptance. 8.2 Theoretical and Methodological Implications for Acceptance Research In a broader sense, acceptance models can act as a framework for improving and further developing a product so that it better meets expectations by identifying the actual state of acceptance, identifying barriers and drivers, and drawing conclusions on potentially effective improvement strategies (Amberg et al., 2003). In former BEV acceptance models, concrete object attributes are summarized into categories such as instrumental, symbolic, and environmental attributes (e.g., Noppers et al., 2015) or relative advantages, compatibility, and complexity (Peters & Dütschke, 2014). Arndt (2011) aimed to explain acceptance of advanced driver assistance systems with factors of the TPB (Ajzen, 1991) and a wider range of product characteristics covering single aspects such as safety, comfort, and reliability. Such an approach did not exist for the acceptance of electric mobility system components. The inclusion of separated BEV attributes provided evidence of which aspects have the strongest impact on acceptance. Based on that, strategies for
50 • Synopsis fostering acceptance of this really-new product can be deduced. Including product attributes that address some barriers and advantages of the product within a model for predicting acceptance (Paper III) complements subjective ratings of what needs to be changed to foster acceptance as assessed by Larson et al. (2014). Within this thesis, the factors of the TPB (Ajzen, 1991) proved to be significant predictors for BEV acceptance except for attitudes (see section 7.3.2). As discussed earlier this might be caused by the early adoption phase (see Klöckner, 2014) in which most Germans probably are (Barth et al., 2016). In accordance with previous research (e.g., Arndt, 2011; Moons & De Pelsmacker, 2012; Nayum & Klöckner, 2014; Venkatesh et al., 2003), the extension of the TPB proved to be advantageous within this thesis. Findings underpin, for instance, the importance of a factor including hedonic aspects ( acceleration and fun ) and
instrumental/functional aspects ( range and charging ) within an acceptance model. The explanatory value of factors covering these aspects was also shown within models in other contexts (e.g., UTAUT2, Venkatesh et al., 2012) and also BEV acceptance research (e.g., Schuitema et al., 2013; Nayum & Klöckner, 2014). Still, the TPB (Ajzen, 1991), is a solid theoretical foundation for new (extended) models that include factors describing the research object on different dimensions. Existing BEV acceptance models (e.g., Moons & De Pelsmacker, 2012; Noppers et al., 2014; Noppers et al., 2015; Schuitema et al., 2013) will probably gain in predictive power if they include an experience factor. All of the mentioned models include BEV attributes. Within this thesis, the evaluation of attributes that included instrumental, hedonic and/or symbolic aspects (i.e., positive reputation) was linked to the level of experience. Therefore, results of this thesis indicate that it could be of benefit for these BEV acceptance models to include experience as a factor. Stevens et al. (2014) stated that current acceptance research in traffic psychology lacks knowledge regarding the effects of experience. This thesis contributes to the understanding of the role of experience for acceptance and emphasizes the importance of this factor, especially for the evaluation of really-new products characteristics. Within this thesis experience effects on acceptance and its influencing factors turned out to be quite inconsistent. This might point to a problem of defining experience. In the online study (Study I of Paper III), experience is comprised of varying levels (from driven once to regularly driving
BEVs ) and quality (different types of BEVs) and was not directly manipulated as in other studies (Barth et
Synopsis • 51 al., 2016; Larson et al., 2014). In Study II as well as in studies conducted by Carroll (2010) and Skippon et al. (2016), experience was actively manipulated in within- or between-subject design and proved to significantly affect attitude and the evaluation of various BEV attributes. A general experience factor that includes varying quantities and qualities of experience seems to have another explanatory value for understanding people s acceptance compared to a more precise experience factor. So, the definition of experience and its operationalization needs to get even more attention in future research aiming to further investigate the role of experience for acceptance. Methodologically, it needs to be discussed if online surveys with potential car buyers as utilized in the present contribution and former studies (e.g., Larson et al., 2014, Barth et al., 2016) are the best instrument for investigating (BEV) experience effects on acceptance. Although their economic efficiency and potential for investigating large samples are appealing, the variety of (BEV) experience is hard to assess and compare. Another drawback is that the direction of effects remains unclear; respondents have sought experience because they are more interested, and already have higher adoption intention or their reasons for higher purchase intention lie in testing such a vehicle. Providing real-life experience under semi-controlled conditions seems to be the more promising method as other potential influencing variables such as age, gender, vehicle type, and length of experience could be eliminated or kept constant. To sum up, this thesis contributes to understanding people s acceptance of really-new products and the relevance of real-life experience. New developments approaching the traffic sector could build on findings of this thesis and the value of acceptance models can profit from including the evaluation of product characteristics in order to gain a better understanding of what influences the adoption of the new technology. Autonomous vehicles and fuel-cell vehicles represent upcoming, really-new products in personal traffic, and acceptance research might profit from transferring some of the thesis learnings to these issues. 8.3 Conclusion The present thesis explores the role that experiencing BEVs plays in their evaluation in terms of perceived advantages and barriers, their attributes and acceptance, and found that experience should be included in discussions about BEV acceptance and purchase decision models. Statistical evidence gathered within this thesis, supported by Sierzchula (2014) statement that providing experience may prove a promising tool in developing marketing strategies and policies with the aim of increasing BEV adoption. Experiencing a BEV
52 • Synopsis can change the evaluation of this kind of vehicle and its attributes. Findings of the present dissertation suggest that acceptance of BEVs is strongly dependent on the evaluation of selected BEV attributes and the perceived opinion of people s social environment. Right now, range and charging build the strongest attribute factor in predicting acceptance, but once this barrier is reduced, other factors such as acceleration and fun will likely gain in importance. Smart charging systems should be carefully designed so that the effort and the reduction of travel flexibility and mobility is not too high, otherwise, the implementation of smart charging could even increase the barrier of range and charging . Additionally, this thesis provided evidence that people who positively evaluate range and charging, acceleration and fun, low noise emission, and the reputation of BEVs, as well as environmental friendliness as more positive, judged BEVs to be more satisfying and useful. Various suggestions were made based on the results. Further developments within the electric mobility system should focus on reducing the range and charging barrier as well as highlighting the positive aspects of driving a BEV. Findings further indicate that it will not only be technical improvements that are important for the future acceptance of BEVs, but also the social influence that needs to be kept in mind when planning future strategies for fostering BEV acceptance. A test drive in a well-performing BEV is a promising strategic tool. With the focus on traffic psychology, various new technologies (e.g., autonomous driving) are approaching. Especially regarding really-new products, future acceptance models should include an experience factor and the evaluation of object attributes. Through these, technology acceptance can be supported and important aspects for improvement of the research object will be identified by the human-factors researcher.
Synopsis • 53 References Adell, E., Várhelyi, A., & Nilsson, L. (2014a). The definition of acceptance and acceptability. In M. A. Regan, T. Horberry & A. Stevens, Driver acceptance of new technology: theory, measurement and optimisation (pp. 11 21). Farnham: Ashgate. Adell, E., Várhelyi, A., & Nilsson, L. (2014b). Modelling acceptance of driver assistant systems: Application of the unified theory of acceptance and use of technology. In M. A. Regan, T. Horberry & A. Stevens, Driver acceptance of new technology: theory, measurement and optimisation (pp. 23 348). Farnham: Ashgate Ajzen, I. (1991). The theory of planned behaviour. Organizational Behavior and Human Decision Processes, 50(2), 179 211. doi:10.1016/0749-5978(91)90020-T Ajzen, I., & Fishbein, M. (2005). The influence of attitudes on behaviour. In D. Albarracín, B. T. Johnson, & M. P. Zanna (Eds.), The influence of attitudes on behaviour. The handbook of attitudes (pp. 173 221). Mahwah, NJ: Erlbaum. Amberg, M., Hirschmeier, M., & Schobert, D. (2003). DART Ein Ansatz zur Analyse und Evaluierung der Benutzerakzeptanz [DART An approach for analysing and evaluating user acceptance]. In Wirtschaftsinformatik 2003/Band I (pp. 573 592). Physica-Verlag HD. Amoroso, F. A., & Cappucino, G. (2012). Advantages of efficiency-aware smart charging strategies for PEVs. Energy Conversion and Management, 54(1), 1 6. doi:10.1016/j.enconman.2011.09.006 Anable, J., Schuitema, G., Skippon, S., & Kinnear, N. (2011). Who will adopt electric vehicles? A segmentation approach of UK consumers (4-560-11). Proceedings from ECEEE 2011 Summer Study, Belambra Presqu Ile de Giens, France. Retrieved from: http://proceedings.eceee.org/papers/proceedings2011/4-560_Anable.pdf?returnurl=http%3A%2F%2Fproceedings.eceee.org%2Fvisabstrakt.php%3Fevent%3D1%26doc%3D4-560-11 Aral Aktiengesellschaft. (2013). Aral Studie – Trends beim Autokauf [Aral study - trends for car purchase]. Retrieved from: http://www.aral.de/content/dam/aral/pdf/Brosch%C3%BCren/aral_studie_trends_beim_autokauf_2013.pdf. Arndt, S. (2011). Evaluierung der Akzeptanz von Fahrerassistenzsystemen: Modell zum Kaufverhalten von Endkunden. Wiesbaden: VS Verlag für Sozialwissenschaften / Springer Fachmedien Wiesbaden GmbH Wiesbaden. doi:10.1007/978-3-531-93197-5 Bakker, S., & Trip, J. J. (2013). Policy options to support the adoption of electric vehicles in the urban environment. Transportation Research Part D: Transport and Environment, 25, 18 23. doi:10.1016/j.trd.2013.07.005
54 • Synopsis Bamberg, S., & Schmidt, P. (2003). Incentives, morality, or habit? Predicting students car use for university routes with the models of Ajzen, Schwartz, and Triandis. Environment and behavior, 35(2), 264 285. doi:10.1177/0013916502250134 Barth, M., Jugert, P., & Fritsche, I. (2016). Still underdetected Social norms and collective efficacy predict the acceptance of electric vehicles in Germany. Transportation Research Part F: Traffic Psychology and Behaviour, 37, 64 77. doi:10.1016/j.trf.2015.11.011 Bazerman, M. H. (2001). Consumer research for consumers. Journal of Consumer Research, 27(4), 499504. doi:10.1086/319624 Bettman, J. R., & Park, C. W. (1980). Effects of Prior Knowledge and Experience and Phase of the Choice Process on Consumer Decision Processes: A Protocol Analysis. Journal of Consumer Research, 7(3), 234 248. doi:10.1086/208812 Boudreaux, D. J., & Crampton, E. (2003). Truth and consequences: some economics of false consciousness. The Independent Review, 8(1), 27 45. Bühler, F., Franke, T., Schleinitz, K., Cocron, P., Neumann, I., Ischebeck, M., & Krems, J. F. (2014). Driving an EV with no opportunity to charge at home - Is this acceptable? In D. De Waard, K. Brookhuis, R. Wiczorek, F. Di Nocera, R. Brouwer, P. Barham,. . . A. Toffetti (Eds.), Proceedings of the Human Factors and Ergonomics Society Europe chapter 2013 annual conference (pp. 369 379). Bühler, F., Neumann, I., Cocron, P., Franke, T., & Krems, J. F. (2011). Usage patterns of electric vehicles: A reliable indicator of acceptance? Findings from a German field study. Proceedings of the 90th Annual Meeting of the Transportation Research Board. Retrieved from http://amonline.trb.org/12jj41/1 Bunce, L., Harris, M., & Burgess, M. (2014). Charge up then charge out? Drivers perceptions and experiences of electric vehicles in the UK. Transportation Research Part A: Policy and Practice, 59, 278 287. doi:10.1016/j.tra.2013.12.001 Bundesamt für Wirtschaft und Ausfuhrkontrolle, BAFA (2017). Elektromobilität (Umweltbonus) - Ziwschenbilanz zum Antragsstand vom 30. April 2017 [Electric mobility (environmantal bonus) - interim balance regarding the number of applications until 30th April 2017]. Retrieved from: http://www.bafa.de/SharedDocs/Downloads/DE/Energie/emob_zwischenbilanz.pdf?__blob=publicationFile&v=13 Burgess, M., King, N., Harris, M., & Lewis, E. (2013). Electric vehicle drivers reported interactions with the public: Driving stereotype change? Transportation Research Part F: Traffic Psychology and Behaviour, 17, 33 44. doi:10.1016/j.trf.2012.09.003 Carroll, S. (2010). The Smart Move Trial: Description and Initial Results. Retrieved from: http://www.cenex.co.uk/case-studies/smart-moves/ Chan, C. C., Wong, Y. S., Bouscayrol, A., & Chen, K. (2009). Powering sustainable mobility: roadmaps of electric, hybrid, and fuel cell vehicles [point of view]. Proceedings of the IEEE, 97(4), 603–607.
Synopsis • 55 Cocron, P. (2014). Regenerative braking and low vehicle noise of electric vehicles – implications for the driver (Doctoral Thesis, Chemnitz University of Technology). Retrieved from: http://nbn-resolving.de/urn:nbn:de:bsz:ch1-qucosa-155303 Cocron, P., Bachl, V., Früh, L., Koch, I., & Krems, J. F. (2014). Hazard detection in noise-related incidents the role of driving experience with battery electric vehicles. Accident Analysis & Prevention, 73, 380391. doi:10.1016/j.aap.2014.09.016 Cocron, P., Bühler, F., Neumann, I., Franke, T., Krems, J. F., Schwalm, M., & Keinath, A. (2011). Methods of evaluating electric vehicles from a user's perspective the MINI E field trial in Berlin. IET Intelligent Transport Systems, 5(2), 127 133. doi:10.1049/iet-its.2010.0126 Cocron, P., & Krems, J. F. (2013). Driver perceptions of the safety implications of quiet electric vehicles. Accident Analysis & Prevention, 58, 122 131. doi:10.1016/j.aap.2013.04.028 Crites, S. L., Fabrigar, L. R., & Petty, R. E. (1994). Measuring the Affective and Cognitive Properties of Attitudes: Conceptual and Methodological Issues. Personality and Social Psychology Bulletin, 20(6), 619 634. doi:10.1177/0146167294206001 Dagsvik, J. K., Wennemo, T., Wetterwald, D. G., & Aaberge, R. (2002). Potential demand for alternative fuel vehicles. Transportation Research Part B: Methodological, 36(4), 361 384. doi:10.1016/S0965-8564(01)00013-1 Davis, F. D. (1989). Perceived usefulness, perceived ease of use, and user acceptance of information technology. MIS quarterly, 13, 319 340. Die Bundesregierung (2009, August). Nationaler Entwicklungsplan Elektromobilität der Bundesregierung. [National development plan for electric mobility ]. Berlin. Retrieved from: https://www.bmbf.de/files/nationaler_entwicklungsplan_elektromobilitaet.pdf Die Bundesregierung (2016, July 1st). Förderung von E-Mobilität - Käufer können Prämie beantragen [Promotion of e-mobility - buyers can apply for premium]. Berlin. Retrieved from: https://www.bundesregierung.de/Content/DE/Artikel/2016/07/2016-07-01-elektromobilitaet-kaufpraemie-startet-ab-2-juli.html Dittmar, H. (2007). Consumer culture, identity and well-being: The search for the'good life'and the'body perfect'. Psychology Press. Egbue, O., & Long, S. (2012). Barriers to widespread adoption of electric vehicles: An analysis of consumer attitudes and perceptions. Energy Policy, 48(0), 717 729. doi:10.1016/j.enpol.2012.06.009 EnBW Energie Baden-Württemberg AG (2011). Verbundvorhaben MeRegioMobil - Abschlussbericht des Projektkonsortiums [Collaborative project MeRegioMobil - Final report of the project consortium] (Report 01ME09001A). Hannover: TIB Leibniz-Informationszentrum, Technik und Naturwissenschaften Universitätsbibliothek. doi:10.2314/GBV:723721874 Ewing, G. O., & Sarigöllü, E. (1998). Car fuel-type choice under travel demand management and economic incentives. Transportation Research Part D: Transport and Environment, 3(6), 429-444.
56 • Synopsis European Commission (2016a, July 11). Contribution of the transport sector to total emissions of the main air pollutants. Retrieved from: http://www.eea.europa.eu/data-and-maps/daviz/contribution-of-the-transport-sector-3#tab-chart_1_filters=%7B%22rowFilters%22%3A%7B%7D%3B%22columnFilters%22%3A%7B%7D%3B%22sortFilter%22%3A%5B%22pollutant_name%22%5D%7D European Commission (2016b). EU Reference Scenario 2016: Energy, transport and GHG emissions - Trends to 2050. Retrieved from: https://ec.europa.eu/energy/sites/ener/files/documents/ref2016_report_final-web.pdf Fishbein, M. & Ajzen, I. (2011). Predicting and changing behaviour: The reasoned action approach. Taylor & Francis. Franke, T., Cocron, P., Bühler, F., Neumann, I., & Krems, J.F. (2012). Adapting to the range of an electric vehicle the relation of experience to subjectively available mobility resources. In Valero Mora, P., Pace, J.F., Mendoza, L. (Eds.). Proceedings of the European Conference on Human Centred Design for Intelligent Transport Systems, Valencia, Spain, June 14-15 2012 (pp. 95 103). Lyon: Humanist Publications. Franke, T., & Krems, J. F. (2013a). What drives range preferences in electric vehicle users? Transport Policy, 30, 56 62. doi:10.1016/j.tranpol.2013.07.005 Franke, T., & Krems, J. F. (2013b). Understanding charging behaviour of electric vehicle users. Transportation Research Part F: Traffic Psychology and Behaviour, 21, 75 89. doi:10.1016/j.trf.2013.09.002 García-Villalobos, J., Zamora, I., San Martín, J. I., Asensio, F. J., & Aperribay, V. (2014). Plug-in electric vehicles in electric distribution networks: A review of smart charging approaches. Renewable and Sustainable Energy Reviews, 38, 717 731. doi:10.1016/j.rser.2014.07.040 Gardner, B., & Abraham, C. (2007). What drives car use? A grounded theory analysis of commuters reasons for driving. Transportation Research Part F: Traffic Psychology and Behaviour, 10(3), 187 200. doi: 10.1016/j.trf.2006.09.004 Gärling, A., & Johansson, A. (1999, June). An EV in the family. In 2nd KFB-Research Conference, Lund. Goldenhar, L. M., & Connell, C. M. (1992). Effects of educational and feedback interventions on recycling knowledge, attitudes, beliefs, and behaviors. Journal of Environmental Systems, 21, 321 333. doi:10.2190/0HC1-UGML-97N6-UPFE Gould, J., & Golob, T. F. (1998). Clean air forever? A longitudinal analysis of opinions about air pollution and electric vehicles. Transportation Research Part D: Transport and Environment, 3(3), 157 169. doi:10.1016/S1361-9209(97)00018-7 Graham-Rowe, E., Gardner, B., Abraham, C., Skippon, S., Dittmar, H., Hutchins, R., & Stannard, J. (2012). Mainstream consumers driving plug-in battery-electric and plug-in hybrid electric cars: A qualitative
Synopsis • 57 analysis of responses and evaluations. Transportation Research Part A: Policy and Practice, 46(1), 140 153. doi:10.1016/j.tra.2011.09.008 Gregan-Paxton, J., & John, D. R. (1997). Consumer learning by analogy: A model of internal knowledge transfer. Journal of Consumer Research, 24(3), 266 284. doi:10.1086/209509 Hahnel, U. J., Gölz, S., & Spada, H. (2014). How does green suit me?: Consumers mentally match perceived product attributes with their domain-specific motives when making green purchase decisions. Journal of Consumer Behaviour, 13(5), 317 327. doi:10.1002/cb.1471 Hamilton, R. W., & Thompson, D. V. (2007). Is There a Substitute for Direct Experience?: Comparing Consumers' Preferences after Direct and Indirect Product Experiences. Journal of Consumer Research, 34(4), 546 555. doi:10.1086/520073 Hardman, S., Steinberger-Wilckens, R., & van der Horst, D. (2013). Disruptive innovations: the case for hydrogen fuel cells and battery electric vehicles. International journal of hydrogen energy, 38(35), 15438 15451. doi:10.1016/j.ijhydene.2013.09.088 Hawkins, T. R., Singh, B., Majeau-Bettez, G., & Strømman, A. H. (2012). Comparative environmental life cycle assessment of conventional and electric vehicles. Journal of Industrial Ecology. 17(1), 53 64. doi:10.1111/j.1530-9290.2012.00532.x Heffner, R. R., Kurani, K. S., & Turrentine, T. S. (2007). Symbolism in California s early market for hybrid electric vehicles. Transportation Research Part D: Transport and Environment, 12(6), 396 413. Heiman, A., McWilliams, B., & Zilberman, D. (2012). The Effect of Social Norms and Economic Considerations on Purchases of Chicken. In Health and Animal Agriculture in Developing Countries (pp. 143 157). Springer New York. Hermann, A., Xia, L., Monroe, K.B., & Huber, F. (2007). The influence of price fairness on customer satisfaction: an empirical test in the context of automobile purchases, Journal of Product & Brand Management, 16(1), 49 58. doi:10.1108/10610420710731151 Hidrue, M. K., Parsons, G. R., Kempton, W., & Gardner, M. P. (2011). Willingness to pay for electric vehicles and their attributes. Resource and Energy Economics, 33(3), 686 705. doi:10.1016/j.reseneeco.2011.02.002 Higgins, A., Paevere, P., Gardner, J., & Quezada, G. (2012). Combining choice modelling and multi-criteria analysis for technology diffusion: An application to the uptake of electric vehicles. Technological Forecasting and Social Change, 79(8), 1399-1412. doi:10.1016/j.techfore.2012.04.008 Hjorthol, R. (2013). Attitudes, ownership and use of Electric Vehicles a review of literature. Hoeffler, S. (2003). Measuring preferences for really new products. Journal of marketing research, 40(4), 406 420. doi:10.1509/jmkr.40.4.406.19394 Hoeffler, S., & Herzenstein, M. (2011). Optimal marketing for really new products: Using a consumer perspective to improve communications. In S. Posavac (Ed.), Cracking the Code: Leveraging Consumer Psychology to Drive Profitability (pp. 21 44). New York: Routledge.
58 • Synopsis Holtsmark, B., & Skonhoft, A. (2014). The Norwegian support and subsidy policy of electric cars. Should it be adopted by other countries? Environmental Science and Policy, 42, 160 168. doi:10.1016/j.envsci.2014.06.006 Hur, W. M., Kim, Y., & Park, K. (2013). Assessing the Effects of Perceived Value and Satisfaction on Customer Loyalty: A Green Perspective. Corporate Social Responsibility and Environmental Management, 20(3), 146 156. https://doi.org/10.1002/csr.1280 Igbinovia, F. O., Fandi, G., Mahmoud, R., & Tlustý, J. (2016). A Review of Electric Vehicles Emissions and its Smart Charging Techniques Influence on Power Distribution Grid. Journal of Engineering Science and Technology Review, 9(3), 80 85. International Energy Agency, IEA (2016). Global EV outlook 2016 Beyond one million electric cars. Retrieved from: https://www.iea.org/publications/freepublications/publication/Global_EV_Outlook_2016.pdf Isaksson, O., & Fagerholt, A. (2012). Smart charging for electric vehicles. Ericsson Business Review, 3, 3236. Retrieved from http://www.ericsson.com/res/thecompany/docs/publications/business-view/2012/issue3/smart charging-for-electric-vehicles.pdf. Jabeen, F., Olaru, D., Smith, B., Braunl, T., & Speidel, S. (2012). Acceptability of electric vehicles: findings from a driver survey, Proceeding of the ATRF (Australasian Transport Research Forum), Sep. 2012, Perth, Australia. Retrieved from http://www.atrf.info/papers/2012/2012_Jabeen_Olaru_Smith_Braunl_Speidel.pdf. Jansson, J. (2011). Consumer Eco-Innovation Adoption: Assessing Attitudinal Factors and Perceived Product Characteristics. Business Strategy and the Environment, 20(3), 192 210. https://doi.org/10.1002/bse.690 Jensen, A. F., Cherchi, E., & Dios Ortúzar, J. de. (2014). A long panel survey to elicit variation in preferences and attitudes in the choice of electric vehicles. Transportation, 41(5), 973 993. doi:10.1007/s11116-014-9517-6 Kahn, M. E. (2007). Do greens drive Hummers or hybrids? Environmental ideology as a determinant of consumer choice. Journal of Environmental Economics and Management, 54(2), 129-145. Kim, S. S. (2009). The Integrative Framework of Technology Use: An Extension ans Test. MIS Quarterly, 33(3), 513 537. Klöckner, C. A. (2014). The dynamics of purchasing an electric vehicle A prospective longitudinal study of the decision-making process. Transportation Research Part F: Traffic Psychology and Behaviour, 24, 103 116. doi:10.1016/j.trf.2014.04.015 Klöckner, C. A. (2015). The psychology of pro-environmental communication: beyond standard information strategies. Springer.
Koklič, M. K., & Vida, I. (2009). A strategic household purchase: consumer house buying behavior. Managing Global Transitions, 7(1), 75 96.
Synopsis • 59 Kollmann, T. (2004). Attitude, adoption or acceptance? Measuring the market success of telecommunication and multimedia technology. International Journal of Business Performance Management, 6(2), 133 152. Kraftfahrtsbundesamt, KBA) (2017, March 1st). Pressemitteilung Nr. 06/2017 - Der Fahrzeugbestand am 1. Januar 2017 - korrigierte Fassung [Press Release No. 06/2017 - The vehicle stock on 1st January 2017 - revised version] Retrieved from: http://www.kba.de/DE/Presse/Pressemitteilungen/2017/Fahrzeugbestand/pm6_fz_bestand_pm_komplett_korr.html?nn=1558882 Kraut, R., Mukhopadhyay, T., Szczypula, J., Kiesler, S., & Scherlis, B. (1999). Information and communication: Alternative uses of the Internet in households. Information Systems Research, 10(4), 287 303. Krems, J. F. (2011). MINIEVatt Berlin – Freude am umweltgerechten Fahren, Verbundprojekt: Klimaentlastung durch den Einsatz erneuerbarer Energien im Zusammenwirken mit emissionsfreien Elektrofahrzeugen – MINI E 1.0 Berlin Chemnitz: Technische Universität Chemnitz (Abschlussbericht, Förderkennzeichen 16EM0003) [MINIEVatt Berlin – Freude am umweltgerechten Fahren, Verbundprojekt: Klimaentlastung durch den Einsatz erneuerbarer Energien im Zusammenwirken mit emissionsfreien Elektrofahrzeugen – MINI E 1.0 Berlin Chemnitz: Technische Universität Chemnitz (Final report, funding code 16EM0003)]. Chemnitz. Krems, J. F., Bartholdt, L., Cocron, P., Dielmann, B., Franke, T., Henning, M. J.,. . . Žilyte-Lennertz, M. (2011). MINI E powered by Vattenfall V2.0. Schlussbericht zum Forschungsvorhaben Verbundprojekt: MINI E powered by Vattenfall V2.0 Chemnitz: Technische Universität Chemnitz. (Abschlussbericht, Förderkennzeichen 16EM0070) [MINI E powered by Vattenfall V2.0. Final report from the collaborative research project: MINI E powered by Vattenfall V2.0 Chemnitz: Technische Universität Chemnitz. (Final report, funding code 16EM0070)]. Chemnitz. Krems, J. F., Weinmann, O., Weber, J., Westermann, D., & Albayrak, S. (Hrsg.) (2013). Elektromobilität in Metropolregionen: Die Feldstudie MINI E Berlin powered by Vattenfall. Fortschritt-Berichte VDI Reihe 12 Nr. 766 [Electric mobility in metropolitan areas: The field study MINI E Berlin powered by Vattenfall. Progress Reports VDI Volume 12]. Düsseldorf: VDI Verlag. Labeye, E., Hugot, M., Brusque, C., & Regan, M. A. (2016). The electric vehicle: A new driving experience involving specific skills and rules. Transportation Research Part F: Traffic Psychology and Behaviour, 37, 27 40. https://doi.org/10.1016/j.trf.2015.11.008 Larson, P. D., Viáfara, J., Parsons, R. V., & Elias, A. (2014). Consumer attitudes about electric cars: Pricing analysis and policy implications. Transportation Research Part A: Policy and Practice, 69, 299 314. doi:10.1016/j.tra.2014.09.002 Liaw, S. S., & Huang, H. M. (2003). An investigation of user attitudes toward search engines as an information retrieval tool. Computers in human behavior, 19(6), 751 765.
60 • Synopsis Mau, P., Eyzaguirre, J., Jaccard, M., Collins-Dodd, C., & Tiedemann, K. (2008). The neighbor effect : Simulating dynamics in consumer preferences for new vehicle technologies. Ecological Economics, 68(1 2), 504 516. doi:10.1016/j.ecolecon.2008.05.007 McKinsey & Company (2017). Electrifying insights: How automakers can drive electrified vehicle sales and profitability (Advanced Industries January 2017) Retrieved from: https://www.mckinsey.de/files/161223_mckinsey_e-vehicles.pdf Moons, I., & De Pelsmacker, P. (2012). Emotions as determinants of electric car usage intention. Journal of Marketing Management, 28(3-4), 195 237. Moons, I., & De Pelsmacker, P. (2015). An Extended Decomposed Theory of Planned Behaviour to Predict the Usage Intention of the Electric Car: A Multi-Group Comparison. Sustainability, 7(5), 6212 6245. doi:10.3390/su7056212 Nationale Plattform Elektromobilität, NPE (2015). Charging Infrastructure for Electric Vehicles in Germany - Progress Report and Recommendations 2015. Retrieved from http://nationale-plattform-elektromobilitaet.de/fileadmin/user_upload/Redaktion/AG3_Statusbericht_LIS_2015_engl_klein_bf.pdf Nationale Plattform Elektromobilität, NPE (2017, February 7th). Bundesverkehrsministerium veröffentlicht Förderaufruf zum Ausbau der Ladeinfrastruktur in Deutschland. [The Federal Ministry of Traffic publishes a call for proposals to expand the charging infrastructure in Germany] Retrieved from: http://nationale-plattform-elektromobilitaet.de/aktuelles/news/detail/bundesverkehrsministerium-veroeffentlicht-foerderaufruf-zum-ausbau-der-ladeinfrastruktur-in-deutschl/ Nayum, A., & Klöckner, C. A. (2014). A comprehensive socio-psychological approach to car type choice, Journal of Environmental Psychology, 40, 401 414. doi:10.1016/j.jenvp.2014.10.001 Nayum, A., Klöckner, C. A., & Mehmetoglu, M. (2016). Comparison of socio-psychological characteristics of conventional and battery electric car buyers. Travel Behaviour and Society, 3, 8 20. doi:10.1016/j.tbs.2015.03.005 Neumann, I., Cocron, P., Franke, T., & Krems, J.F. (2010). Electric vehicles as a solution for green driving in the future? A field study examining the user acceptance of electric vehicles. In J.F. Krems, T. Petzoldt & M. Henning (Eds.). Proceedings of the European Conference on Human Centred Design for Intelligent Transport Systems, Berlin, Germany, April 29-30 2010 (pp. 445 453). Lyon: Humanist Publications. Neumann, I., Franke, T., Cocron, P., Bühler, F., & Krems, J. F. (2015). Eco-driving strategies in battery electric vehicle use - how do drivers adapt over time? IET Intelligent Transport Systems, 9(7), 746 753. doi:10.1049/iet-its.2014.0221 Neumann, I., & Krems, J. F. (2016). Battery Electric Vehicles Implications for the Driver Interface. Ergonomics, 59(3), 331 343 doi:10.1080/00140139.2015.1078914 Newell, A., & Rosenbloom, P. S. (1981). Mechanisms of skill acquisition and the law of practice. Cognitive skills and their acquisition, 1, 1 55.
Synopsis • 61 Nilsson, A., Schuitema, G., Bergstad, C. J., Martinsson, J., & Thorson, M. (2016). The road to acceptance: Attitude change before and after the implementation of a congestion tax. Journal of Environmental Psychology, 46, 1 9. http://doi.org/10.1016/j.jenvp.2016.01.011 Noppers, E. H., Keizer, K., Bockarjova, M., & Steg, L. (2015). The adoption of sustainable innovations: The role of instrumental, environmental, and symbolic attributes for earlier and later adopters. Journal of Environmental Psychology, 44, 74 84. doi:10.1016/j.jenvp.2015.09.002 Noppers, E. H., Keizer, K., Bolderdijk, J. W., & Steg, L. (2014). The adoption of sustainable innovations: Driven by symbolic and environmental motives. Global Environmental Change, 25, 52 62. doi:10.1016/j.gloenvcha.2014.01.012 Norman, D. A., & Draper, S. W. (1986). User-centered system design: New perspectives in human-computer interaction. Hillsdale, NJ: Lawrence Erlbaum Associates. Nykvist, B., & Nilsson, M. (2015). Rapidly falling costs of battery packs for electric vehicles. Nature Climate Change, 5(4), 329-332. doi:10.1038/nclimate2564 Oliver, R. L. (1980). A cognitive model of the antecedents and consequences of satisfaction decisions. Journal of marketing research, 17(4), 460 469. doi:10.2307/3150499 Ozaki, R., & Sevastyanova, K. (2011). Going hybrid: An analysis of consumer purchase motivations. Energy Policy, 39(5), 2217 2227. doi:10.1016/j.enpol.2010.04.024 Peters, A. & Dütschke, E. (2014). How do Consumers Perceive Electric Vehicles? A Comparison of German Consumer Groups. Journal of Environmental Policy & Planning, 16 (3), 359 377. DOI: 10.1080/1523908X.2013.879037. Peracchio, L. A., & Tybout, A. M. (1996). The moderating role of prior knowledge in schema-based product evaluation. Journal of Consumer Research, 23(3), 177 192. Pettersson, S. (2013). ELVIIS – Final Report to Göteborg Energi Forskningsstiftelse, ICT Sweden Viktoria https://www.viktoria.se/sites/default/files/pub/www.viktoria.se/upload/publications/elviis_final.pdf Plötz, P., Gnann, T., Kühn, A., & Wietschel, M. (2014). Markthochlaufszenarien für Elektrofahrzeuge [Market increase scenarios for electric vehicles]. Retrieved from: http://www.isi.fraunhofer.de/isi-wAssets/docs/e/de/publikationen/Fraunhofer-ISI-Markthochlaufszenarien-Elektrofahrzeuge-Langfassung.pdf Raquel, C., Mita, S., Harish, S., & Manish, K. (2009). Preparing for the Adoption of the New Arrival. GfK Marketing Intelligence Review, 1(2), 16 23. Rauh, N., Franke, T., & Krems, J. F. (2015). Understanding the Impact of Electric Vehicle Driving Experience on Range Anxiety. Human Factors: The Journal of the Human Factors and Ergonomics Society, 57(1), 177 187. doi:10.1177/0018720814546372 Rauh, N., Franke, T., & Krems, J. F. (2017). First-time experience of critical range situations in BEV use and the positive effect of coping information. Transportation research part F: traffic psychology and behaviour, 44, 30 41. doi:10.1016/j.trf.2016.10.001
62 • Synopsis Rezvani, Z., Jansson, J., & Bodin, J. (2015). Advances in consumer electric vehicle adoption research: A review and research agenda. Transportation Research Part D: Transport and Environment, 34, 122136. doi:10.1016/j.trd.2014.10.010 Rogers, E. M. (2010). Diffusion of innovations (5th ed.). New York: Free Press. Saccani, N., Perona, M., & Bacchetti, A. (2017). The total cost of ownership of durable consumer goods: A conceptual model and an empirical application. International Journal of Production Economics, 183, 1 13. doi:10.1016/j.ijpe.2016.09.021 Schade, J., & Schlag, B. (2003). Acceptability of urban transport pricing strategies. Transportation Research Part F: Traffic Psychology and Behaviour, 6(1), 45 61. doi:10.1016/S1369-8478(02)00046-3 Schill, W.-P., Gerbaulet, C., & Kasten, P. (2015). Elektromobilität in Deutschland: CO2-Billanz hängt vom Ladestrom ab [Electric mobility in Germany: CO2 balance depends on the charging current]. DIW-Wochenbericht, 82(10), 207 215. Schmitz, C. (2015). LimeSurvey: An Open Source survey tool, LimeSurvey Project Hamburg, Germany. Retrieved from: http://limesurvey.org Schuitema, G., Anable, J., Skippon, S., & Kinnear, N. (2013). The role of instrumental, hedonic and symbolic attributes in the intention to adopt electric vehicles. Transportation Research Part A: Policy and Practice, 48, 39 49. doi:10.1016/j.tra.2012.10.004 Schuitema, G., Steg, L., & Forward, S. (2010). Explaining differences in acceptability before and acceptance after the implementation of a congestion charge in Stockholm. Transportation Research Part A: Policy and Practice, 44(2), 99 109. doi:10.1016/j.tra.2009.11.005 Sierzchula, W. (2014). Factors influencing fleet manager adoption of electric vehicles. Transportation Research Part D: Transport and Environment, 31, 126 134. doi:10.1016/j.trd.2014.05.022 Sierzchula, W., Bakker, S., Maat, K., & van Wee, B. (2014). The influence of financial incentives and other socio-economic factors on electric vehicle adoption. Energy Policy, 68, 183 194. doi:10.1016/j.enpol.2014.01.043 Skippon, S. M., Kinnear, N., Lloyd, L., & Stannard, J. (2016). How experience of use influences mass-market drivers willingness to consider a battery electric vehicle: A randomised controlled trial. Transportation Research Part A: Policy and Practice, 92, 26 42. doi: 10.1016/j.tra.2016.06.034 Smith, R. E., & Swinyard, W. R. (1983). Attitude-behavior consistency: The impact of product trial versus advertising. Journal of Marketing Research, 20(3), 257 267. doi:10.2307/3151829 Sørensen, K. (2006). Domestication: The Enactment of Technology, in T. Berker, M. Hartmann, Y. Punie and K. Ward (Eds.), Domestication of Media and Technologies (pp. 40 61) Maidenhead: Open University press. Sovacool, B. K., & Hirsh, R. F. (2009). Beyond batteries: An examination of the benefits and barriers to plug-in hybrid electric vehicles (PHEVs) and a vehicle-to-grid (V2G) transition. Energy Policy, 37(3), 10951103. doi:10.1016/j.enpol.2008.10.005
Synopsis • 63 Steg, L. (2005). Car use: lust and must. Instrumental, symbolic and affective motives for car use. Transportation Research Part A: Policy and Practice, 39(2), 147 162. doi:10.1016/j.tra.2004.07.001 Stevens, A., Horberry, T., & Regan, M. A. (2014). Driver acceptance of New Technology: Synthesis and Perspectives. In M. A. Regan, T. Horberry & A. Stevens, Driver acceptance of new technology: theory, measurement and optimisation (pp. 335 348). Farnham: Ashgate. Summala, H. (2001). Traffic Psychology for the 2000's: Profession and science. In P. E. Barjonet. Traffic psychology today (pp. 353 364). Springer Science & Business Media. Szajna, B., & Scamell, R. W. (1993). The effects of information system user expectations on their performance and perceptions. Mis Quarterly, 493-516. doi: 10.2307/249589 Taylor J., Maitra A., Alexander M., Brooks D., & Duvall M. (2009). Evaluation of the impact of plug-in electric vehicle loading on distribution system operations. In: IEEE power & energy society general meeting, 1 6. doi:10.1109/PES.2009.5275317 Taylor, S., & Todd, P. (1995). Decomposition and crossover effects in the theory of planned behavior: A study of consumer adoption intentions. International Journal of Research in Marketing, 12, 137 155. doi:10.1016/0167-8116(94)00019-K Theobald, A. (2016). Praxis Online-Marktforschung: Grundlagen–Anwendungsbereiche–Durchführung. Springer-Verlag. Turrentine, T. S., Garas, D., Lentz, A., & Woodjack, J. (2011). The UC Davis MINI E consumer study. (Research Report No. UCD-ITS-RR-11-05). Davis, CA: Institute of Transportation Studies, University of California. Turrentine, T. S., & Kurani, K. S. (2007). Car buyers and fuel economy?. Energy Policy, 35(2), 1213 1223. doi:10.1016/j.enpol.2006.03.005 Urban, G. L., Weinberg, B. D. & Hauser, J. R. (1996). Premarket forcasting for really new products. Journal of Marketing, 60, 47 60. doi:10.2307/1251887 Van der Laan, J. D., Heino, A., & De Waard, D. (1997). A simple procedure for the assessment of acceptance of advanced transport telematics. Transportation Research Part C: Emerging Technologies, 5(1), 110. doi:10.1016/S0968-090X(96)00025-3 Van Driel, C. J., Hoedemaeker, M., & Van Arem, B. (2007). Impacts of a congestion assistant on driving behaviour and acceptance using a driving simulator. Transportation Research Part F: Traffic Psychology and Behaviour, 10(2), 139-152. doi: 10.1016/j.trf.2006.08.003 Venkatesh, V., Morris, M., Davis, G., & Davis, F. (2003). User Acceptance of Information Technology: Toward a Unified View. MIS Quarterly, 27(3), 425-478. Retrieved from http://www.jstor.org/stable/30036540 Venkatesh, V., Thong, J., & Xu, X. (2012). Consumer Acceptance and Use of Information Technology: Extending the Unified Theory of Acceptance and Use of Technology. MIS Quarterly, 36(1), 157 178.
64 • Synopsis Verbong, G. P., Beemsterboer, S., & Sengers, F. (2013). Smart grids or smart users? Involving users in developing a low carbon electricity economy. Energy Policy, 117 125. doi:10.1016/j.enpol.2012.05.003 Vilimek, R., & Keinath, A. (2014). User-centred design and evaluation as a prerequisite for the success of disruptive innovations: an electric vehicle case study. M. A. Regan, T. Horberry & A. Stevens, Driver acceptance of new technology: theory, measurement and optimisation (pp. 169 186). Farnham: Ashgate. Vilimek, R., Keinath, A., & Schwalm, M. (2012). The MINI E Field Study - Similarities and Differences in International Everyday EV Driving. In N. A. Stanton (Ed.), Advances in Human Aspects of Road and Rail Transportation (pp. 363 372). Boca Raton, Florida: Crc Press Inc. Vlassenfort, S., Brookhuis, K., Marchau, V., & Witlox, F. (2010). Towards defining a unified concept of acceptability of Intelligent Transport Systems (IST): A conceptual analysis based on the case of Intelligent Speed Adaptation (ISA). Transportation Research Part F: Traffic Psychology and Behaviour, 13, 164–178. doi:10.1016/j.trf.2010.02.001 Wang, S., Fan, J., Zhao, D., Yang, S., & Fu, Y. (2016). Predicting consumers intention to adopt hybrid electric vehicles: Using an extended version of the theory of planned behaviour model. Transportation, 43(1), 123 143. doi:10.1007/s11116-014-9567-9 Wikström, M., Hansson, L., & Alvfors, P. (2014). Socio-technical experiences from electric vehicle utilisation in commercial fleets. Applied Energy, 123, 82 93. doi:10.1016/j.apenergy.2014.02.051 Wolfram, P., & Lutsey, N. (2016). Elektrik vehicles: Literature review of technology costs and carbon emissions (ICCT working paper 2016-14). Retrieved from ICCT International Concil for Clean Transportation website: http://www.theicct.org/sites/default/files/publications/ICCT_LitRvw_EV-tech-costs_201607.pdf (13.03.2017) Wolsink, M. (2007). Wind power implementation: The nature of public attitudes: Equity and fairness instead
of backyard motives. Renewable and Sustainable Energy Reviews, 11, 1188 1207. doi: 10.1016/j.rser.2005.10.005
Paper I • 65 Paper I Energy recapture through deceleration regenerative braking in electric vehicles from a user perspective Citation: Cocron, P., Bühler, F., Franke, T., Neumann, I., Dielmann, B., & Krems, J. F. (2013). Energy recapture through deceleration regenerative braking in electric vehicles from a user perspective. Ergonomics 56(8), 12031215. dx.doi:10.1080/00140139.2013.803160
66 • Paper I ENERGY RECAPTURE THROUGH DECELERATION REGENERATIVE BRAKING IN ELECTRIC VEHICLES FROM A USER PERSPECTIVE Peter Cocron, Franziska Bühler, Thomas Franke, Isabel Neumann, Benno Dielmann, and Josef F. Krems Department of Psychology, Chemnitz University of Technology, Chemnitz, Germany Abstract We report results from a 1-year field study (N = 80) on user interactions with regenerative braking in electric vehicles (EVs). Designed to recapture energy in vehicles with electric powertrains, regenerative braking has an important influence on both, the task of driving and energy consumption. Results from user assessments and data from onboard data loggers indicate that most drivers quickly learned to interact with the system, which was triggered via accelerator. Further, conventional braking manoeuvres decreased significantly as the majority of deceleration episodes could only be executed through regenerative braking. Still, some drivers reported difficulties when adapting to the system. These difficulties could be addressed by offering different levels of regeneration so the intensity of the deceleration could be individually modified. In general, the system is trusted and regarded as a valuable tool for prolonging range. Keywords: electric vehicles, regenerative braking, skill acquisition, trust, acceptance Statement of relevance Regenerative braking in electric vehicles has direct implications for the driving task. We found that drivers quickly learn to use and accept a system, which is triggered via accelerator. For those reporting difficulties in the interaction, it appears reasonable to integrate options to customize or switch off the system.
Paper I • 67 1 Introduction In the debate about decreasing CO2 emissions, hybrid electric vehicles (HEVs), plug-in hybrid electric vehicles (PHEVs) and fully electric vehicles (EVs) are regarded as promising solutions for a more sustainable transportation system. Such technological innovations also have an impact on the driving task and require effective interfaces (Haslam & Waterson, 2013). Commercially available full HEVs can achieve an improvement in fuel efficiency of 60% or more compared to similar conventional internal combustion engine (ICE) vehicles. Most of the energy saved by HEVs originates from the use of a regenerative braking system (Romm & Frank, 2006). Originally developed for energy recapture in rail traffic, regenerative braking is now integrated in most vehicles with electric propulsion systems. A regenerative braking system converts kinetic energy into electric energy during deceleration manoeuvres. The energy that is usually wasted during braking manoeuvres can be recaptured and stored for later use (Cikanek & Bailey, 2002). The major research objective of our paper is to examine the impact of regenerative braking on the driver. We assume that the regenerative braking system serves as energy saving system, to which the drivers have to adapt, irrespective of which particular regeneration strategy is implemented in the vehicle. In our research we apply the Power Law of Practice (Newell & Rosenbloom, 1981) to investigate (1) how long it takes EV drivers to learn to utilize accelerator triggered regenerative braking during deceleration. Furthermore, we assess the driver perspective of such a function at first on a (2) general level and relate these findings to (3) trust and (4) acceptance in order to give (5) recommendations on the future layout of such systems. As part of several international field trials on EVs (Vilimek, Keinath, & Schwalm, 2012) these issues were addressed in a German 1-year field study (Cocron et al., 2011; Franke, Bühler, Cocron, Neumann, & Krems, 2012) with a total of 80 drivers who each drove an EV for six months. 2 Background 2.1 Regenerative braking Particularly in heavy stop-and-go traffic, regenerative braking is regarded as a valuable means to improve a vehicle s energy efficiency. Aside from differences in technical layout, drivers seem to have considerable influence on the vehicle s energy efficiency. Romm and Frank (2006) argue that aggressive driving or
68 • Paper I inefficient use of regenerative braking in HEVs can lead to a more than 30% decrease in fuel efficiency. Different driving strategies appear to have a much bigger impact on efficiency in electric powertrain vehicles than in ICE vehicles. The technical implementation of regenerative braking in EVs varies considerably. Energy regeneration from deceleration is either triggered via accelerator pedal, brake pedal or both pedals. The amount of deceleration caused by energy regeneration differs substantially between vehicle types. Thus, deceleration may resemble ICE engine braking or even braking manoeuvres. Eberl, Sharma, Stroph, Schumann, and Pruckner (2012) studied the intensities of regenerative braking and found that test drivers evaluated an EV with a stronger deceleration in the regeneration phase as more directly controllable than EV concepts with less deceleration. Comparing an accelerator triggered system with regeneration via brake pedal in a simulator, Schmitz, Jagiellowicz, Maag, and Hanig (2012) reported that drivers used the hydraulic brake less when regeneration braking was triggered via accelerator. Drivers generally preferred the accelerator triggered system and rated it as more suitable for efficient driving. In recent studies on user experiences with EVs, regenerative braking was addressed as part of the driving experience (Everett, Walsh, Smith, Burgess, & Harris, 2010). Results of a field study from the US (Turrentine, Garas, Lentz, & Woodjack, 2011) indicated that participants had learned to appreciate a system, which was integrated in the accelerator pedal. The participants who drove a converted MINI Cooper (MINI E) appreciated the fact that they could accelerate and decelerate mostly using the accelerator pedal. Moreover, some drivers reported they tested how far they could drive without applying the brake pedal. Walsh, Carroll, Eastlake, and Blythe (2010) reported on track tests with six drivers representing the most- and least-efficient drivers of a greater sample. During deceleration on a high speed track, the most aggressive driver achieved only 15% of regenerative energy capture efficiency compared to 93% regained by the most efficient driver, who used no friction braking during deceleration. As the most efficient driver was an expert in eco-driving, the potential for driver training was thus evident. Walsh et al. (2010) argued that in order to increase the range of EVs, driving styles might have to be modified. Existing user studies on EVs highlight two important aspects. First, drivers seem to appreciate such a function and second, there is considerable variance in how drivers use the system to regain energy.
Paper I • 69 Moreover, different regenerative braking strategies have already been discussed by the drivers (Solberg, 2007; Berman, 2011). Against this background we investigated how long it took drivers to familiarise themselves with such a function and how they evaluated regenerative braking. 2.2 Skill acquisition Newell and Rosenbloom (1981) developed a theory that stated why certain learning phenomena can be best described by a power law. The authors called it the Power Law of Practice and showed that in various areas there exists a quantifiable relation between the time to fulfil a certain task and the number of practice trials. As the number of trials increases, the time necessary to complete the task decreases, though at a declining rate. The Power Law has been applied to data from many areas of research, such as perceptual motor skills, perception, problem solving and motor behaviour (for an overview see Lacroix & Cousineau, 2006). In the driving context, focusing on the operation of in-vehicle information systems, Jahn, Krems, and Gelau (2009) fitted the Power Law to training data to compare ease of learning in different systems. Although the power function provided robust results irrespective of the methods used (Newell & Rosenbloom, 1981, as quoted in Ritter & Schooler, 2001), its applicability to learning data has been questioned mainly with regards to averaging performance scores across participants (Brown & Heathcote, 2003). In the current study, we still apply the Power Law as we want to illustrate learning experiences reported subjectively by the drivers. For the assessment of the learning process in regenerative braking, we adapt the general equation of the Power Law according to Lacroix and Coisineau (2006), BP = a + bN-c where BP is performance in a specific braking parameter at a certain individual level of experience N (km), a is the asymptotic value of the braking parameter, b is the amplitude at the beginning of learning and c is the learning rate. The asymptote a is deliberately included in the equation as the performance in regenerative braking is studied over a longer period of time, so it can be assumed that participants reach a plateau in performance. In the section on skill acquisition we examine subjective and objective learning data and apply the Power Law of Practice to describe the exact learning duration from data logger data.
70 • Paper I 2.3 Acceptance and trust In addition to the assessment of the learning process, we examine how actual drivers evaluate regenerative braking. Strengths and drawbacks of such a new system need to be identified at an early stage to allow for potential adjustments of the system layout. Van der Laan, Heino, and De Waard (1997) proposed a simple method to assess the acceptance of advanced transport telematics. They postulate two dimensions, usefulness and satisfaction, which are measured by nine rating-scale items. As the method is easy to use and quite economical, the scale has been used in numerous studies on human machine interaction in traffic (e.g., Comte, 2000). In several studies on the human interaction with new in-vehicle systems, researchers (e.g., Rudin-Brown & Parker, 2004; Kazi, Stanton, Walker, & Young, 2007) emphasized also trust as a factor, which is crucial for examining new systems. As regenerative braking automates elements of the deceleration process, findings on human trust in automation should serve as an additional basis for the evaluation of the system. To assess operator s trust in cruise control (CC) Cahour and Forzy (2009) proposed a scale integrating trust and related notions based on past research on trust by Muir (1994). Cahour and Forzy (2009) argue that whenever new technology is integrated in the human-machine interaction (HMI), human activity somehow undergoes change. Particularly, if human task elements are transferred to machines, the corresponding loss of control can be compensated for by trust. Muir and Moray (1996) stated that trust in automation heavily depends on the operator s belief that the system can fulfil a task as accurately as the operator. The more the operators trusted a system, the more they tended to use it. If operators distrusted the system, they were more likely to reject it and execute the task by hand. According to the adapted definition of trust by Rajaonah, Anceaux, and Vienne (2006), in decision-making situations, users choose whether or not they will delegate functions to automated systems. In the current study we interrogate if this is also the case for delegating the deceleration to regenerative braking. 3 Study objectives Based on existing literature on driver interaction with new in-vehicle technology, we identified (1) skill acquisition, (2) general user evaluation, (3) trust and (4) acceptance as appropriate means to derive (5) recommendations for future regeneration layouts from the user perspective. Regarding (1) skill acquisition we investigated how fast drivers learn to utilize such a function applying the Power Law of Practice (Newell
Paper I • 71 & Rosenbloom, 1981). Analogical to research on in-vehicle information systems (Jahn et al., 2009), we examined in particular how long it took EV novices to substitute conventional braking manoeuvres with regenerative braking. With respect to (2) general user evaluation, we investigated strengths and weaknesses of an accelerator triggered regenerative braking using a qualitative approach. The qualitative findings were the basis to further investigate (3) trust and (4) acceptance of regenerative braking in more detail. Related to (3) trust, we expected according to Kazi et al. (2007) that trust rises at first and then remains constant. Additionally, based on Muir and Moray (1996), we assumed a positive relation between trust and the actual usage of regenerative braking. Based on Comte (2000), we hypothesised that (4) driver s acceptance undergoes a change after interacting with the system. Additionally, we expected a positive relation to trust and based on Jamson (2006) a positive relation to actual behaviour. The findings obtained in the four areas are then used to (5) make suggestions for improving the system s layout based on the driver s perspective. Addressing these objectives appeared to be necessary to decide how regenerative braking should be implemented in EVs from a human factors perspective. The need to investigate long term effects of regenerative braking usage was also emphasized by Schmitz et al. (2012). 4 Framework of the 1-year field study 4.1 Structure In our article we report results from two 6-month periods of a 1-year field study on EV usage. Both study periods were nested within a larger German field study on acceptance and suitability for daily use of EVs. In each study period, drivers were interviewed three times: when receiving the vehicle (T0), after 3 months (T1) and when returning the cars after 6 months (T2). A wide range of methods was applied to assess various aspects of the user experience in the context of electro-mobility study (Cocron et al., 2011; Franke et al., 2012). A qualitative approach was chosen predominantly in Study Period 1 to understand how drivers learn to interact with regenerative braking and how they evaluate the system. In Study Period 2 quantitative methods assessing, for instance, trust were used to quantify the results of Study Period 1. Unless specified otherwise, approval was assessed using a 6-point Likert scale ranging from 1 (completely disagree) to 6 (completely agree).
72 • Paper I 4.2 Test vehicle The test vehicle in both study periods was a standard MINI Cooper, converted to a battery-powered vehicle with a lithium ion battery pack. The MINI E was a two-seater, which was powered by a 150-KW electric engine and reached a top speed of 152 km/h. The regenerative braking system was implemented in the accelerator pedal. As soon as the driver released the pedal, the vehicle decelerated rapidly. 4.3 Data loggers In Study Period 1 and 2, driving data such as acceleration and speed were continuously recorded via onboard data loggers in all vehicles. Marked keys were distributed among the participants so logger data could be unambiguously assigned to each participant. Regarding the learning curve of the usage of regenerative braking, two braking parameters were taken into account. The sampling rate of the data was 1 km. A braking manoeuvre is defined as using the brake pedal to decelerate. The first braking parameter Bman represents the number of braking manoeuvres per 100 km. The second braking parameter Bprop stands for the proportion of braking manoeuvres in total deceleration time. 5 Study period 1 5.1 Methods 5.1.1 Sample During the first 6-month study period in Berlin, a sample of 40 users consisting of 33 male and 7 female participants drove an EV. Participants were an average 48 years old (SD = 8.9). Twenty-five percent of users had already driven a fully or partially EV, for example, during a test drive. Nevertheless, none of the participants had previous experience driving the test vehicle, when they received the keys. On average drivers had possessed a driving license for 29 years (SD = 9.8). Two participants dropped out during Study Period 1. 5.1.2 Vehicle handover – think-aloud task during test drive (T0) When driving the EV for the first time, users were asked to think aloud . The concurrent think-aloud-technique in particular is widely used in qualitative usability testing (e.g., Van den Haak, De Jong, & Schellens, 2004). As first part of the general evaluation (2) the aim of the qualitative approach was the identification of characteristics of EVs, which novice drivers have to adapt to. For the present study only statements on regenerative braking were analysed in more detail.
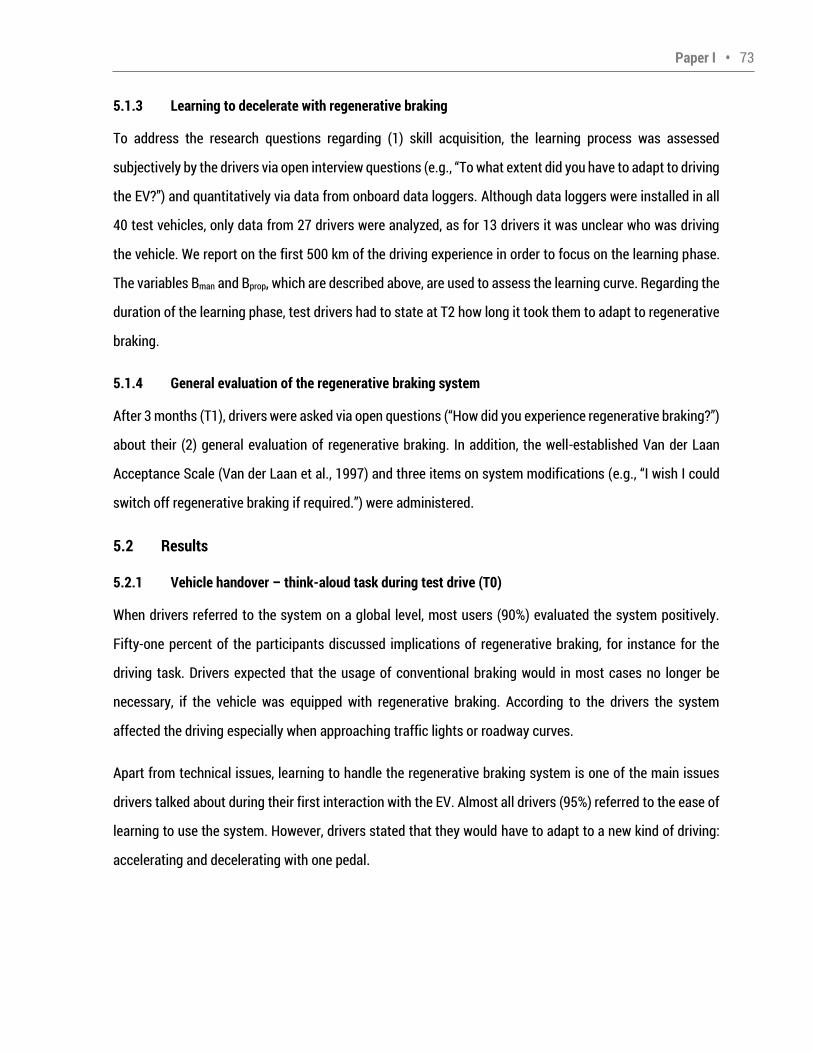
Paper I • 73 5.1.3 Learning to decelerate with regenerative braking To address the research questions regarding (1) skill acquisition, the learning process was assessed subjectively by the drivers via open interview questions (e.g., To what extent did you have to adapt to driving
the EV? ) and quantitatively via data from onboard data loggers. Although data loggers were installed in all 40 test vehicles, only data from 27 drivers were analyzed, as for 13 drivers it was unclear who was driving the vehicle. We report on the first 500 km of the driving experience in order to focus on the learning phase. The variables Bman and Bprop, which are described above, are used to assess the learning curve. Regarding the duration of the learning phase, test drivers had to state at T2 how long it took them to adapt to regenerative braking. 5.1.4 General evaluation of the regenerative braking system After 3 months (T1), drivers were asked via open questions ( How did you experience regenerative braking? ) about their (2) general evaluation of regenerative braking. In addition, the well-established Van der Laan Acceptance Scale (Van der Laan et al., 1997) and three items on system modifications (e.g., I wish I could
switch off regenerative braking if required. ) were administered. 5.2 Results 5.2.1 Vehicle handover – think-aloud task during test drive (T0) When drivers referred to the system on a global level, most users (90%) evaluated the system positively. Fifty-one percent of the participants discussed implications of regenerative braking, for instance for the driving task. Drivers expected that the usage of conventional braking would in most cases no longer be necessary, if the vehicle was equipped with regenerative braking. According to the drivers the system affected the driving especially when approaching traffic lights or roadway curves. Apart from technical issues, learning to handle the regenerative braking system is one of the main issues drivers talked about during their first interaction with the EV. Almost all drivers (95%) referred to the ease of learning to use the system. However, drivers stated that they would have to adapt to a new kind of driving: accelerating and decelerating with one pedal.
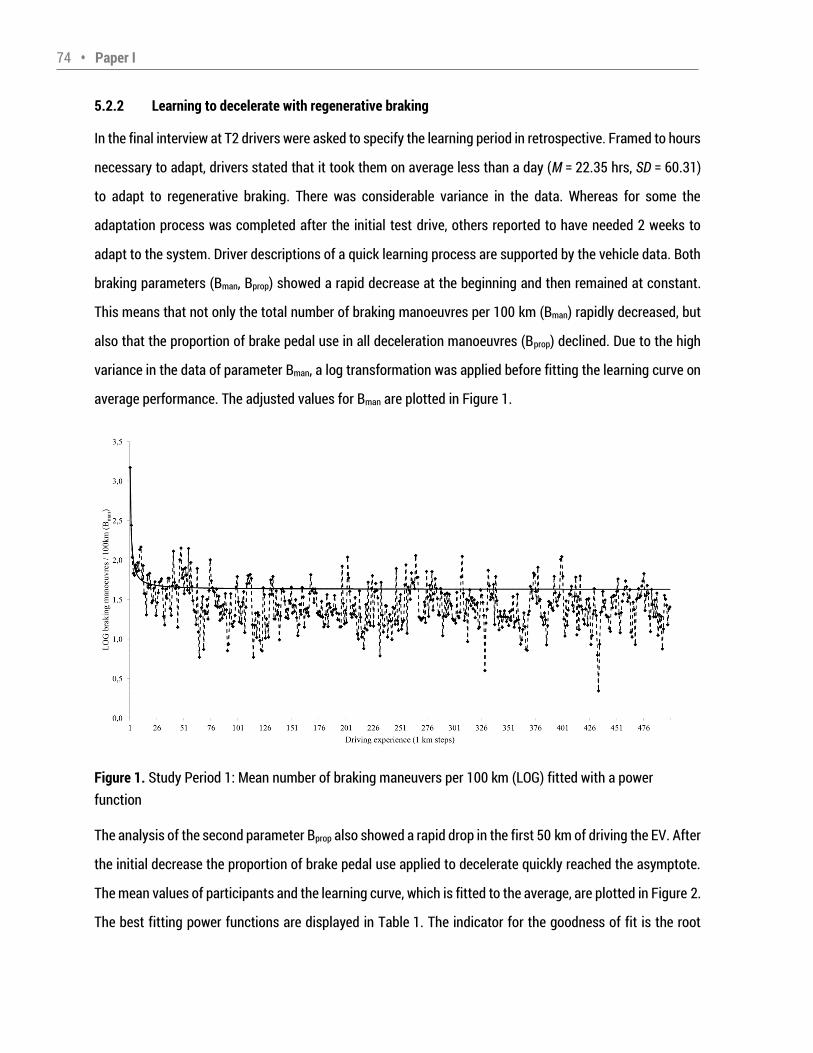
74 • Paper I 5.2.2 Learning to decelerate with regenerative braking In the final interview at T2 drivers were asked to specify the learning period in retrospective. Framed to hours necessary to adapt, drivers stated that it took them on average less than a day (M = 22.35 hrs, SD = 60.31) to adapt to regenerative braking. There was considerable variance in the data. Whereas for some the adaptation process was completed after the initial test drive, others reported to have needed 2 weeks to adapt to the system. Driver descriptions of a quick learning process are supported by the vehicle data. Both braking parameters (Bman, Bprop) showed a rapid decrease at the beginning and then remained at constant. This means that not only the total number of braking manoeuvres per 100 km (Bman) rapidly decreased, but also that the proportion of brake pedal use in all deceleration manoeuvres (Bprop) declined. Due to the high variance in the data of parameter Bman, a log transformation was applied before fitting the learning curve on average performance. The adjusted values for Bman are plotted in Figure 1. Figure 1. Study Period 1: Mean number of braking maneuvers per 100 km (LOG) fitted with a power function The analysis of the second parameter Bprop also showed a rapid drop in the first 50 km of driving the EV. After the initial decrease the proportion of brake pedal use applied to decelerate quickly reached the asymptote. The mean values of participants and the learning curve, which is fitted to the average, are plotted in Figure 2. The best fitting power functions are displayed in Table 1. The indicator for the goodness of fit is the root
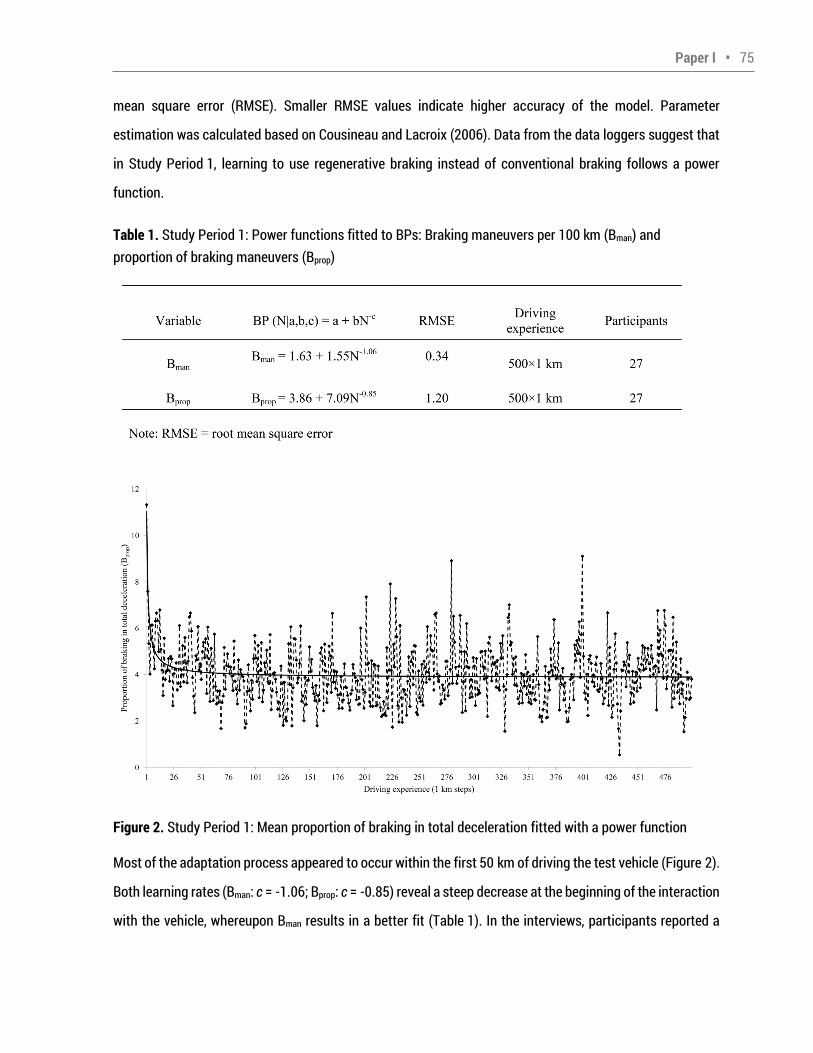
Paper I • 75 mean square error (RMSE). Smaller RMSE values indicate higher accuracy of the model. Parameter estimation was calculated based on Cousineau and Lacroix (2006). Data from the data loggers suggest that in Study Period 1, learning to use regenerative braking instead of conventional braking follows a power function. Table 1. Study Period 1: Power functions fitted to BPs: Braking maneuvers per 100 km (Bman) and proportion of braking maneuvers (Bprop) Figure 2. Study Period 1: Mean proportion of braking in total deceleration fitted with a power function Most of the adaptation process appeared to occur within the first 50 km of driving the test vehicle (Figure 2). Both learning rates (Bman: c = -1.06; Bprop: c = -0.85) reveal a steep decrease at the beginning of the interaction with the vehicle, whereupon Bman results in a better fit (Table 1). In the interviews, participants reported a
76 • Paper I considerable need to adapt, but also mentioned a short learning phase. The user assessment of a quick adaptation phase is supported by the objective data from the data loggers in Study Period 1. 5.2.3 General evaluation of the regenerative braking system Overall, after extended driving experience the majority of the drivers (82%) evaluated the system very positively, in reducing the energy consumption, making conventional braking unnecessary and affording pleasure of use. The remaining 18% of our test drivers also mentioned negative aspects in the interviews, such as the layout of the system. The need to adapt to regenerative braking was often mentioned in the driver evaluation after three months (T1). When asked about regenerative braking in particular, fifty-six percent of drivers emphasized the need to adapt, during the interview at T1. According to test drivers, the driving task was affected by regenerative braking, although they reported to have learned quickly how to handle the system. Nevertheless, some drivers reported difficulties when adapting to the system. During the first days of EV usage the automatic deceleration caused by the system was too strong for 15% of the drivers. Other drivers (13%) mentioned that at the beginning they often stopped too early, for instance, at a traffic light as they underestimated the deceleration of the system. However, they reported that after the initial adaptation phase they managed to decelerate quite accurately as they used the pedal more sensitively. One driver additionally explained that during stop-and-go the deceleration was sometimes too abrupt; another driver mentioned that in some situations he just wanted to coast. In the accompanying questionnaire after three months, 23% wished to modify the system themselves and 10% even wished to be able to switch-off the system. According to the participants, driving with mainly one pedal becomes a routine and was increasingly automated. For some drivers the new form of deceleration became so automated that they reported the need to re-adapt to conventional ICE vehicles after extended EV usage. Twenty-five percent of the drivers referred to surprise effects when driving a conventional vehicle again. When lifting the foot from the accelerator, these drivers were expecting the strong deceleration of their EV while at first not noticing that they were driving another car. Closely related to those take-over situations in conventional vehicles was the notion that conventional friction brakes were only used for emergency braking. Thirteen percent of the drivers referred to the friction brake as a system only for emergency braking as they used regenerative braking for most deceleration manoeuvres.
Paper I • 77 Regarding the impact of the system on the surrounding traffic, 15% of the drivers were unsure if and when the brake lights of the EV would light up when using regenerative braking. After three months few drivers (10%) were still unsure about the deceleration of the system as they could not exactly predict the deceleration in differing driving situations. One driver reported that during deceleration manoeuvres, he kept his foot above the brake pedal to make sure that he could quickly apply the friction brake if needed. The data from the questionnaires violated the assumptions of parametric tests, therefore non-parametric procedures were used. Effect sizes are calculated according to Rosenthal (1991, as quoted in Field 2009). Even if certain drawbacks and uncertainties existed concerning the regenerative braking system, the overall evaluation of the system is very positive. The Van der Laan Acceptance Scale (Van der Laan et al., 1997) ranging from -2 to +2, revealed quite high values on Satisfaction (Mdn = 1.75, IQR = 0.75) and very high values on Usefulness (Mdn = 2.00, IQR = 0.40), whereupon the system is significantly regarded as more useful than satisfying, z = -2.79, p = .005, r = -.32. Additional analyses revealed negative correlations between the subjective duration of the learning phase and Usefulness (rs = -.46, p = .005) of and Satisfaction (rs = -.52, p = .001) with the system at T1. 5.3 Discussion The main objectives of Study Period 1 were to examine how drivers (1) learned to interact with regenerative braking and how they (2) generally evaluated the system with regard to strengths and weaknesses. The subjective appraisal of a quick learning process is supported by the analysis of braking parameters. These parameters indicate that the amount of conventional braking, that is, decelerating via brake pedal, is substantially reduced over the first 50 km of driving. The skill acquisition in using regenerative braking instead of conventional friction braking appears to follow the Power Law of Practice. As reported by the participants, the greatest adjustments in braking behaviour occurred relatively quickly. In both braking parameters the asymptote was reached within 50 km. The results further showed that drivers appreciate the regenerative braking function as it was implemented in the test vehicle. Acceptance of the system was high in our sample, although the system was regarded as more useful than satisfying. The opportunity to regain energy via deceleration appealed to the participants. Besides the positive evaluation, it became clear that the system had a substantial impact on the driving task, forcing the drivers to adapt to a new mode of deceleration. However, for the majority of the test drivers the
78 • Paper I subjective adaptation phase was completed within 1 day of driving the EV. As there existed a negative correlation between Acceptance and the reported learning duration, this could be accounted for in system design (see 7. Conclusions from the 1-Year Field Study). User feedback from Study Period 1 also indicates that some drivers had difficulties when adapting to the system. In the beginning, the automatic deceleration caused by the system was too strong for some participants; others reported that during the first days they frequently stopped too early at traffic lights as they could not predict the exact deceleration by the system. After the adaptation phase was completed, some drivers reported surprise effects when driving a conventional vehicle again. Used to regenerative braking, they were somehow expecting a strong deceleration in their conventional car, although regenerative braking was missing there. This result is in line with Reason s assumption (2008) that slips, such as strong habit intrusions, are more likely to occur if features of the present and the familiar environment resemble each other much. This might also apply to switching between electric and conventional vehicle types. Still, these drivers reported no severe consequences of this temporary confusion and could manage such take-over situations. Related to the reported surprise effects in ICE vehicles is the notion of the friction brake as an emergency brake. After using regenerative braking for an extended period of time, the need to conventionally brake could be challenging for the drivers. Such take-over situations should be investigated in future studies. Uncertainties about the system s status or actions and the absence of different deceleration intensities might hinder drivers from utilizing the system correctly. In order to drive safe and energy efficient, drivers need to be able to accurately predict the system s actions, which in turn requires trust. We assumed that especially the need to modify the system and the uncertainty about certain of its features are related to drivers trust. Muir (1994) argues that in order for trust to be built, the user has to be able to test the system in varying situations. Therefore, in addition to validate the findings of Study Period 1, research questions for Study Period 2 focussed more on (1) the initial phase of the learning process, (3) the evolution of trust and (4) acceptance to derive (5) suggestions for future regeneration systems.
Paper I • 79 6 Study Period 2 6.1 Methods 6.1.1 Sample A second sample of 40 users (35 men, 5 women) drove an EV for six months in Study Period 2. The sample was on average 50 years old (SD = 10.2). Twenty percent of users reported some driving experience with the test vehicle; for instance, they had tested the MINI E of a friend. Besides that, 13% of the participants had previous experience with regenerative braking in a HEV. On average drivers possessed their driving license for 31 years (SD = 9.9). In this study period one participant dropped out. 6.1.2 Learning to decelerate with regenerative braking – the initial phase When the vehicles were handed over to the participants in Study Period 2, participants accomplished a test drive (T0.2) in their assigned vehicles. As participants drove the same route (approx. 2.5 km) during the test drive, learning conditions for the initial interaction with regenerative braking could therefore be controlled more. In Study Period 1 the greatest adjustments in braking behaviour could be seen during the first 50 km of driving the EV, so this range is focused in Study Period 2. Due to more monitoring and the explanation of the importance of the logger data especially at vehicle handover (T0), data from 37 drivers could be included in the analysis. 6.1.3 Evaluation of regenerative braking regarding trust and acceptance Based on the findings of Study Period 1, the participants were also asked about their expectations concerning the regenerative braking system before they drove the car for the first time. Special attention was paid to the longitudinal development of system (3) trust and (4) acceptance. General information about the functionality of the system was provided for the participants to ensure basic knowledge. Scale items on trust in cruise control (Cahour & Forzy, 2009) were adapted to regenerative braking. The adapted short scale Trust consisted of four items on general confidence in the system, predictability, reliability and perceived efficiency. Muir (1994) emphasized the importance of longer testing periods for the development of system trust; therefore Trust was repeatedly assessed in the present study. Before the initial test drive (T0.1), after the first drive (T0.3), after 3 months (T1) and upon returning the EV after 6 months (T2), participants rated their trust in the regenerative braking system. Additional items on system modification (e.g., I wish I could switch off regenerative braking if required. ) as a counterpart to the Trust scale were included in the midterm
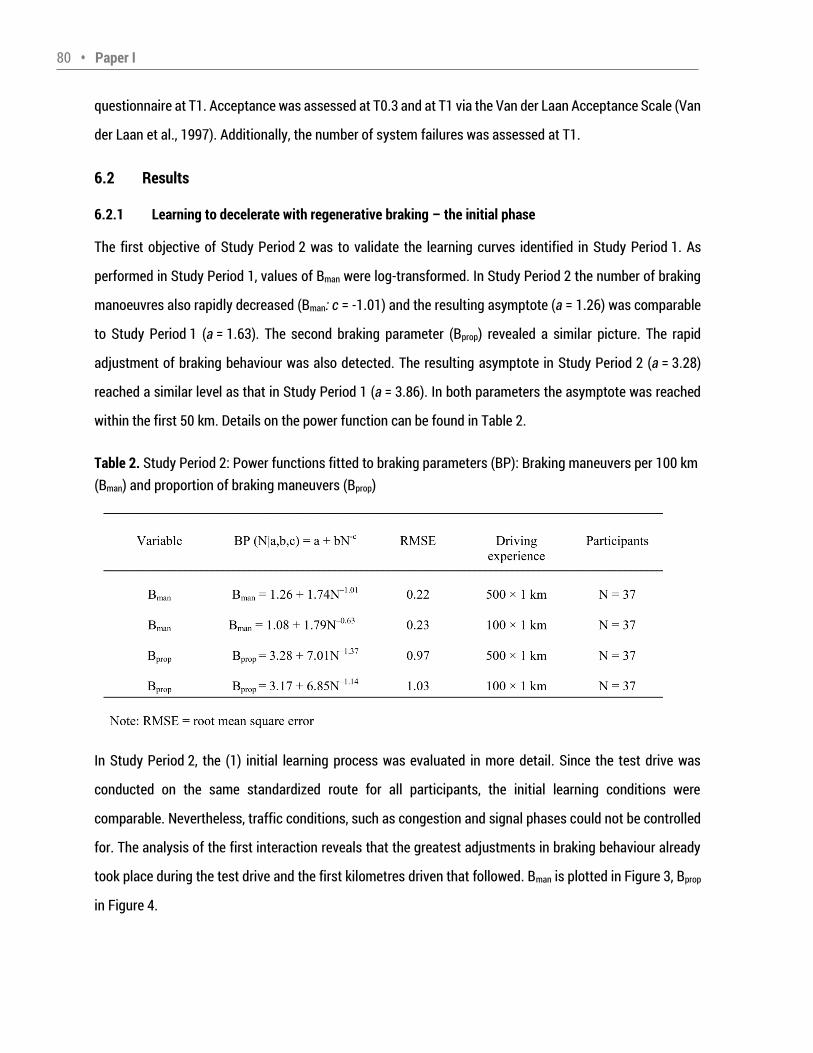
80 • Paper I questionnaire at T1. Acceptance was assessed at T0.3 and at T1 via the Van der Laan Acceptance Scale (Van der Laan et al., 1997). Additionally, the number of system failures was assessed at T1. 6.2 Results 6.2.1 Learning to decelerate with regenerative braking – the initial phase The first objective of Study Period 2 was to validate the learning curves identified in Study Period 1. As performed in Study Period 1, values of Bman were log-transformed. In Study Period 2 the number of braking manoeuvres also rapidly decreased (Bman: c = -1.01) and the resulting asymptote (a = 1.26) was comparable to Study Period 1 (a = 1.63). The second braking parameter (Bprop) revealed a similar picture. The rapid adjustment of braking behaviour was also detected. The resulting asymptote in Study Period 2 (a = 3.28) reached a similar level as that in Study Period 1 (a = 3.86). In both parameters the asymptote was reached within the first 50 km. Details on the power function can be found in Table 2. Table 2. Study Period 2: Power functions fitted to braking parameters (BP): Braking maneuvers per 100 km (Bman) and proportion of braking maneuvers (Bprop) In Study Period 2, the (1) initial learning process was evaluated in more detail. Since the test drive was conducted on the same standardized route for all participants, the initial learning conditions were comparable. Nevertheless, traffic conditions, such as congestion and signal phases could not be controlled for. The analysis of the first interaction reveals that the greatest adjustments in braking behaviour already took place during the test drive and the first kilometres driven that followed. Bman is plotted in Figure 3, Bprop in Figure 4.
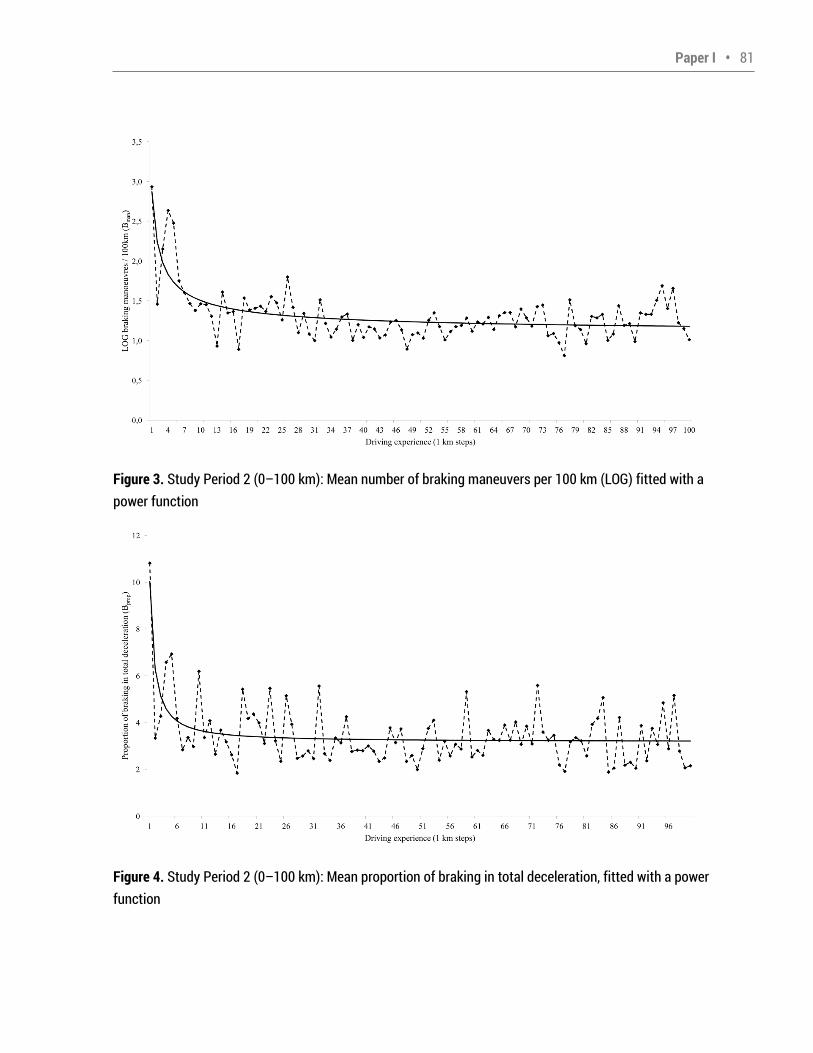
Paper I • 81 Figure 3. Study Period 2 (0 100 km): Mean number of braking maneuvers per 100 km (LOG) fitted with a power function Figure 4. Study Period 2 (0 100 km): Mean proportion of braking in total deceleration, fitted with a power function
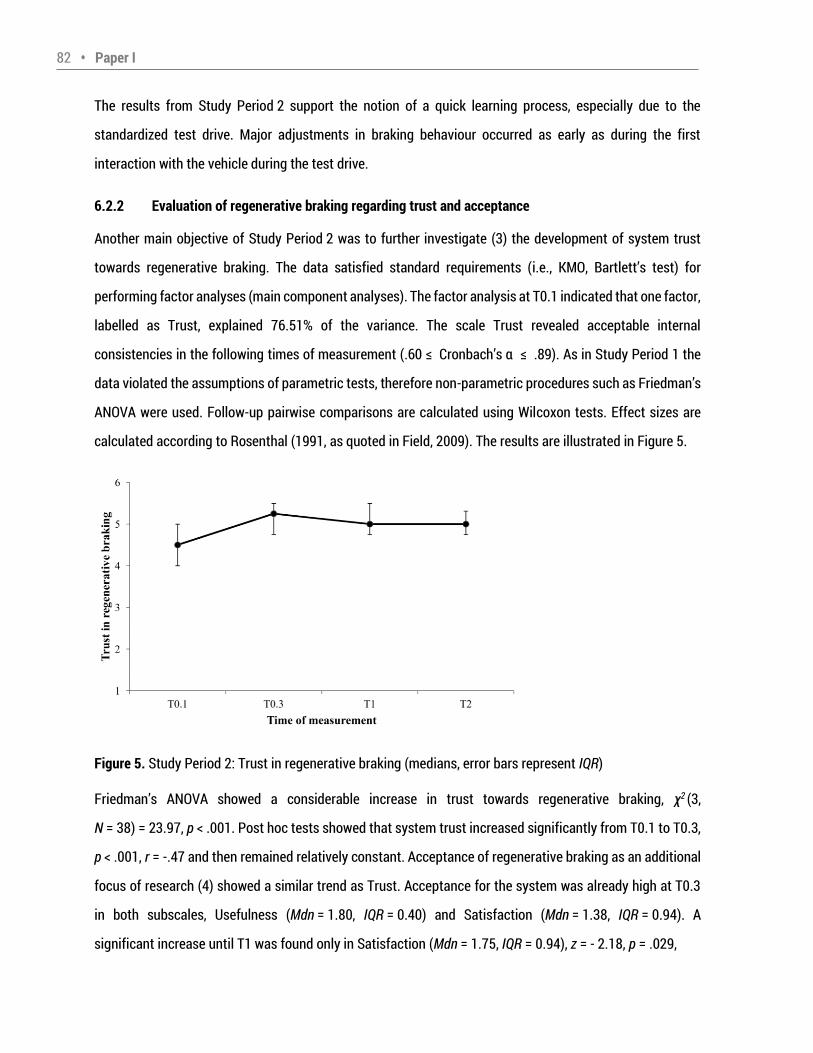
82 • Paper I The results from Study Period 2 support the notion of a quick learning process, especially due to the standardized test drive. Major adjustments in braking behaviour occurred as early as during the first interaction with the vehicle during the test drive. 6.2.2 Evaluation of regenerative braking regarding trust and acceptance Another main objective of Study Period 2 was to further investigate (3) the development of system trust towards regenerative braking. The data satisfied standard requirements (i.e., KMO, Bartlett s test) for performing factor analyses (main component analyses). The factor analysis at T0.1 indicated that one factor, labelled as Trust, explained 76.51% of the variance. The scale Trust revealed acceptable internal consistencies in the following times of measurement (.60 Cronbach s α .89). As in Study Period 1 the data violated the assumptions of parametric tests, therefore non-parametric procedures such as Friedman s ANOVA were used. Follow-up pairwise comparisons are calculated using Wilcoxon tests. Effect sizes are calculated according to Rosenthal (1991, as quoted in Field, 2009). The results are illustrated in Figure 5. Figure 5. Study Period 2: Trust in regenerative braking (medians, error bars represent IQR) Friedman s ANOVA showed a considerable increase in trust towards regenerative braking, χ2 (3, N = 38) = 23.97, p < .001. Post hoc tests showed that system trust increased significantly from T0.1 to T0.3, p < .001, r = -.47 and then remained relatively constant. Acceptance of regenerative braking as an additional focus of research (4) showed a similar trend as Trust. Acceptance for the system was already high at T0.3 in both subscales, Usefulness (Mdn = 1.80, IQR = 0.40) and Satisfaction (Mdn = 1.38, IQR = 0.94). A significant increase until T1 was found only in Satisfaction (Mdn = 1.75, IQR = 0.94), z = - 2.18, p = .029,
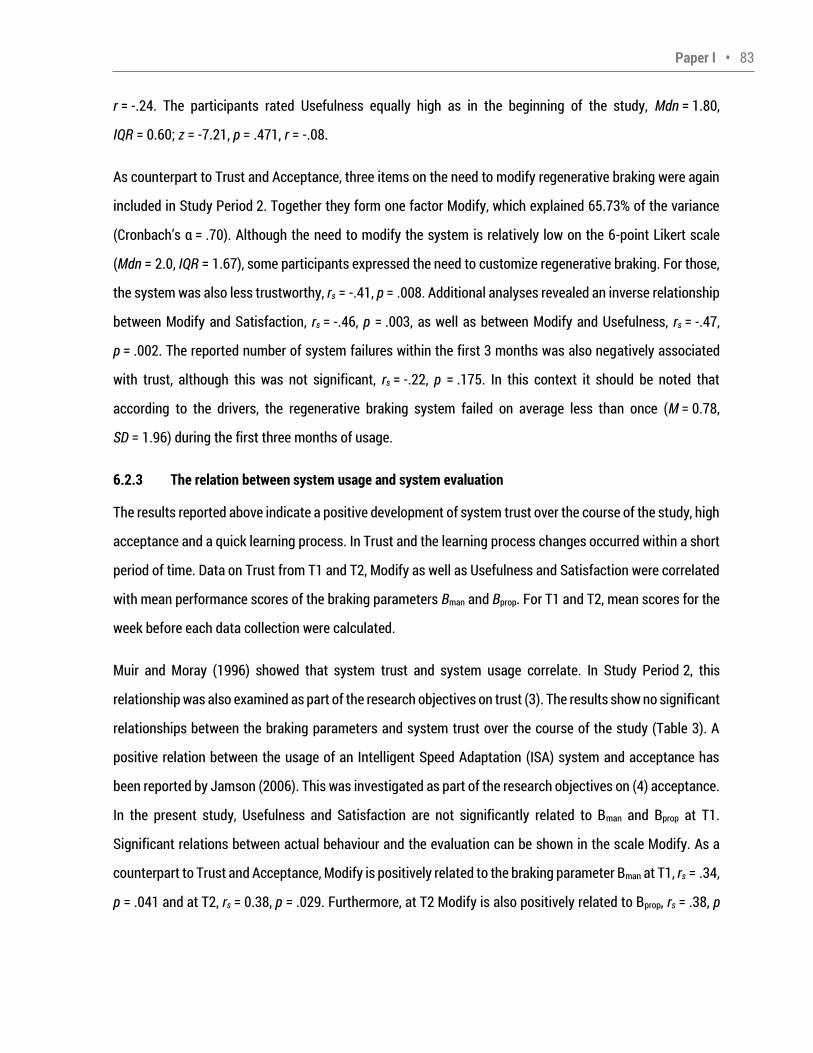
Paper I • 83 r = -.24. The participants rated Usefulness equally high as in the beginning of the study, Mdn = 1.80, IQR = 0.60; z = -7.21, p = .471, r = -.08. As counterpart to Trust and Acceptance, three items on the need to modify regenerative braking were again included in Study Period 2. Together they form one factor Modify, which explained 65.73% of the variance (Cronbach s α = .70). Although the need to modify the system is relatively low on the 6-point Likert scale (Mdn = 2.0, IQR = 1.67), some participants expressed the need to customize regenerative braking. For those, the system was also less trustworthy, rs = -.41, p = .008. Additional analyses revealed an inverse relationship between Modify and Satisfaction, rs = -.46, p = .003, as well as between Modify and Usefulness, rs = -.47, p = .002. The reported number of system failures within the first 3 months was also negatively associated with trust, although this was not significant, rs = -.22, p = .175. In this context it should be noted that according to the drivers, the regenerative braking system failed on average less than once (M = 0.78, SD = 1.96) during the first three months of usage. 6.2.3 The relation between system usage and system evaluation The results reported above indicate a positive development of system trust over the course of the study, high acceptance and a quick learning process. In Trust and the learning process changes occurred within a short period of time. Data on Trust from T1 and T2, Modify as well as Usefulness and Satisfaction were correlated with mean performance scores of the braking parameters Bman and Bprop. For T1 and T2, mean scores for the week before each data collection were calculated. Muir and Moray (1996) showed that system trust and system usage correlate. In Study Period 2, this relationship was also examined as part of the research objectives on trust (3). The results show no significant relationships between the braking parameters and system trust over the course of the study (Table 3). A positive relation between the usage of an Intelligent Speed Adaptation (ISA) system and acceptance has been reported by Jamson (2006). This was investigated as part of the research objectives on (4) acceptance. In the present study, Usefulness and Satisfaction are not significantly related to Bman and Bprop at T1. Significant relations between actual behaviour and the evaluation can be shown in the scale Modify. As a counterpart to Trust and Acceptance, Modify is positively related to the braking parameter Bman at T1, rs = .34, p = .041 and at T2, rs = 0.38, p = .029. Furthermore, at T2 Modify is also positively related to Bprop, rs = .38, p
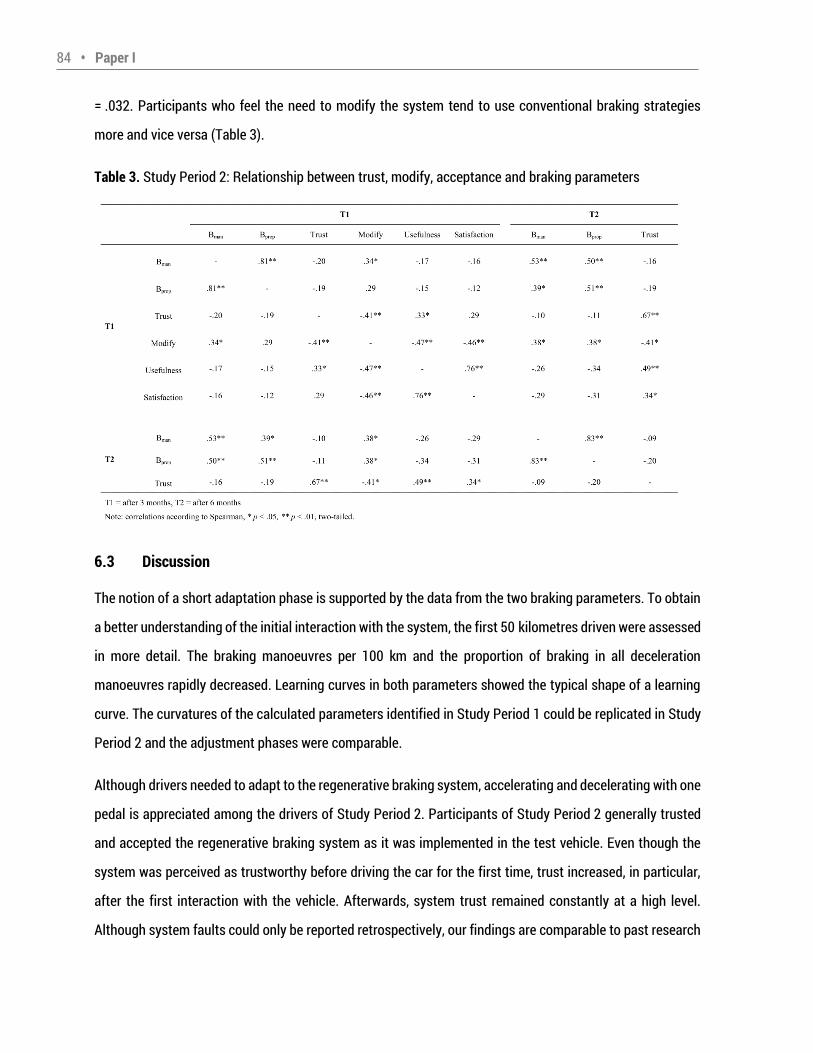
84 • Paper I = .032. Participants who feel the need to modify the system tend to use conventional braking strategies more and vice versa (Table 3). Table 3. Study Period 2: Relationship between trust, modify, acceptance and braking parameters 6.3 Discussion The notion of a short adaptation phase is supported by the data from the two braking parameters. To obtain a better understanding of the initial interaction with the system, the first 50 kilometres driven were assessed in more detail. The braking manoeuvres per 100 km and the proportion of braking in all deceleration manoeuvres rapidly decreased. Learning curves in both parameters showed the typical shape of a learning curve. The curvatures of the calculated parameters identified in Study Period 1 could be replicated in Study Period 2 and the adjustment phases were comparable. Although drivers needed to adapt to the regenerative braking system, accelerating and decelerating with one pedal is appreciated among the drivers of Study Period 2. Participants of Study Period 2 generally trusted and accepted the regenerative braking system as it was implemented in the test vehicle. Even though the system was perceived as trustworthy before driving the car for the first time, trust increased, in particular, after the first interaction with the vehicle. Afterwards, system trust remained constantly at a high level. Although system faults could only be reported retrospectively, our findings are comparable to past research
Paper I • 85 on user trust (Kazi et al., 2007; Lee & Moray, 1992). As in Trust, results of the Satisfaction scale implied that drivers appreciated the system even more after some experience; the perceived usefulness remains constantly high. Our findings on acceptance therefore point in a similar direction as results of Turrentine et al. (2011) and Schmitz et al. (2012) for one pedal driving. Nevertheless, the wish to modify the system individually seems to play an essential role in the evaluation of regenerative braking. The Modify scale negatively corresponded with Trust, Satisfaction and Usefulness thus implying that modifications of the system appeared to be necessary for some drivers. Self-reported system failures usually have a negative effect on trust, although this could not be detected in the present study. In general, the system was evaluated as functioning very reliably. Research on operator trust suggests that the more an operator trusts a system, the more he uses it (Muir & Moray, 1996). Similar findings for system acceptance and system usage are reported by Jamson (2006). Based on those findings we assumed that the less frequently participants use conventional friction braking, the more they trust and accept regenerative braking. However, no significant relationship between system usage and trust or acceptance could be detected in our study. A possible explanation could be the high variance in the braking data. Decelerating only with the accelerator pedal depends heavily on the traffic conditions, faced by each participant. Therefore, each participant had varying opportunities to apply regenerative braking. In our study the need to modify the system as part of the driver evaluation correlated positively with the behavioral braking parameters. Drivers who expressed the wish to modify or switch off the system also used more conventional braking strategies instead of decelerating via regenerative braking. This emphasizes the findings of Study Period 1, which showed that some people reported some difficulties with the system and took longer to adapt in general. For those participants it appears reasonable to provide more information about the functionalities and potential of the system as well as give the opportunity to technically customize the amount of deceleration caused by regenerative braking. The possibility of changing regeneration intensities or even switching off the system appears promising in this context.
86 • Paper I 7 Conclusions from the 1-year field study If electrically propelled vehicles are marketed on a larger scale, the driving task, particularly the deceleration, will change. In our study participants appreciated regenerative braking which was triggered via accelerator. System trust quickly developed, the learning curve revealed a short adjustment phase. Drivers feeling of control was enhanced by the possibility of regaining some of the usually lost kinetic energy. Moreover, the system decelerated quite rapidly, which contributed to the sporty feel of the vehicle. This and the notion of interacting with a sustainable technology seemed to appeal to the drivers. Our findings have (5) implications for different stakeholders of the traffic system. The study suggests that drivers quickly adapt to a regeneration system which decelerates considerably. Furthermore, drivers generally appreciate driving with one pedal. The potential of haptic feedback via pedal was also recently discussed in the context of eco-driving with conventional vehicles (Birrell, Young, & Weldon, 2013). Manufacturers could include the findings in decisions on the system s intensity and if regeneration should be triggered mainly by the accelerator or the brake pedal. As some drivers wished to modify the system individually and there exists a negative relation between acceptance and the reported learning duration, it may be reasonable to integrate different levels of regeneration in future EVs. As a consequence, drivers could modify the system individually and could gradually increase the deceleration during the early days of usage. Drivers might therefore have fewer problems while learning to use the system. Afterwards different levels of regeneration would enable the drivers to flexibly react towards different driving situations, such as driving in stop-and-go traffic or going downhill. Driver s preferences could be accounted for, especially for those who reported difficulties in the beginning. To avoid temporary confusion when switching between vehicle types, drivers should be informed about the existence and layout of regenerative braking when starting the vehicle. As soon as EVs become more widespread, the existence of regenerative braking in vehicles might also have implications for driver training as curricula might have to be adjusted. As considerable barriers exist already among potential buyers (Egbue & Long, 2012), it appears necessary to emphasize that even if the driving task might be different in an EV with accelerator triggered regeneration, drivers usually quickly adapt to the new system.
Paper I • 87 Findings of the large field study on user interactions with EVs suggest that accelerator triggered regenerative braking can be integrated in the driving task rapidly. A future system could benefit from the option to modify the deceleration intensity or even to deactivate it. Acknowledgements The present study was funded by the German Federal Ministry for the Environment, Nature Conservation and Nuclear Safety. We are grateful for the support of our consortium partners, Vattenfall Europe AG (Dr. C. F. Eckhardt and F. Schuth) and the BMW Group (G. Schmidt, Dr. M. Hajesch, Dr. A. Keinath and Dr. M. Schwalm) which made our research possible. We thank Dr. M. Hajesch for his valuable comments on the manuscript. We also gratefully thank Katja Gabler, Florian Fritzsche and their colleagues at the BMW Group for performing data pre-processing of the logger data.
88 • Paper I References Berman, B. (2011). Honda reinvents regenerative braking for fit EV. Retrieved from http://www.plugincars.com/honda-reinvents-regenerative-braking-fit-ev-110596.html Birrell, S. A., Young, M. S., & Weldon, A. M. (2013). Vibrotactile pedals: Provision of haptic feedback to support economical driving. Ergonomics, 56(2), 282 292. Brown, S., & Heathcote, A. (2003). Averaging learning curves across and within participants. Behavior Research Methods, Instruments, & Computers, 35(1), 11 21. doi:10.1080/00140139.2012.760750 Cahour, B., & Forzy, J. F. (2009). Does projection into use improve trust and exploration? The case of a cruise control system. Safety Science, 47(9), 1260 1270. doi:10.1016/j.ssci.2009.03.015 Cikanek, S. R., & Bailey, K. E. (2002). Regenerative braking system for a Hybrid Electric Vehicle. Proceedings of the American Control Conference, Anchorage, AK, USA, May 8-10 2002 (pp. 31293134). Cocron, P., Bühler, F., Neumann, I., Franke, T., Krems, J. F., Schwalm, M., & Keinath, A. (2011). Methods of evaluating electric vehicles from a user's perspective - the MINI E field trial in Berlin. IET Intelligent Transport Systems, 5(2), 127 133. Comte, S. L. (2000). New systems: New behaviour? Transportation Research Part F: Traffic Psychology and Behaviour, 3(2), 95-111. Cousineau, D., & Lacroix, G. L. (2006). Getting parameters from learning data. Tutorials in Quantitative Methods for Psychology, 2(2), 77 83. Eberl, T., Sharma, R., Stroph, R., Schumann, J., & Pruckner, A. (2012). Evaluation of interaction concepts for the longitudinal dynamics of electric vehicles. In N. Stanton (Ed.), Advances in Human Aspects of Road and Rail Transportation (pp. 263-272). San Francisco, CA: CRC Press. Egbue, O., & Long, S. (2012). Barriers of widespread adoption of electric vehicles: An analysis of consumer attitudes and perceptions. Energy Policy, 48, 717 729. Everett, A., Walsh, C., Smith, K., Burgess, M., & Harris, M. (2010). Ultra low carbon vehicle demonstrator programme. Proceedings of the 25th World Battery, Hybrid and Fuel Cell Electric Vehicle Symposium & Exhibition, Shenzhen, China, November 5-9 2010. Field, A. (2009). Discovering statistics using SPSS (3rd edition). London, UK: Sage. Franke, T., Bühler, F., Cocron, P., Neumann, I., & Krems, J. F. (2012). Enhancing sustainability of electric vehicles: A field study approach to understanding user acceptance and behavior. In M. Sullman & L. Dorn (Eds.), Advances in Traffic Psychology (pp. 295 306). Farnham, UK: Ashgate. Haslam, R., & Waterson, P. (2013). Ergonomics and sustainability. Ergonomics, 56(3), 343 347. Jahn, G., Krems, J. F., & Gelau, C. (2009). Skill acquisition while operating in-vehicle information systems: Interface design determines the level of safety-relevant distractions. Human Factors, 51(2), 136151.
Paper I • 89 Jamson, S. (2006). Would those who need ISA, use it? Investigating the relationship between drivers speed choice and their use of a voluntary ISA system. Transportation Research Part F: Traffic Psychology and Behaviour, 9(3), 195 206. Kazi, T. A., Stanton, N. A., Walker, G. H., & Young, M. S. (2007). Designer driving: Drivers conceptual models and level of trust in adaptive cruise control. International Journal of Vehicle Design, 45(3), 339 360. Lacroix, G. L., & Cousineau, D. (2006). The introduction to the special issue on RT(N) = a + bN-c : The power law of learning 25 years later. Tutorials in Quantitative Methods for Psychology, 2(2), 38 42. Lee, J., & Moray, N. (1992). Trust, control strategies and allocation of function in human-machine systems. Ergonomics, 35(10), 1243 1270. Muir, B. M. (1994). Trust in automation: Part 1. Theoretical issues in the study of trust and human intervention in automated systems. Ergonomics, 37, 1905 1922. Muir, B. M., & Moray, N. (1996). Trust in automation: Part II. Experimental studies of trust and human intervention in a process control simulation. Ergonomics, 39(3), 429 460. Newell, A., & Rosenbloom, P. S. (1981). Mechanisms of skill acquisition and the law of practice. In J. R. Anderson (Ed.), Cognitive skills and their acquisition (pp. 1 55). Hillsdale, NJ: Erlbaum. Rajaonah, B., Anceaux, F. & Vienne, F. (2006). Trust and the use of adaptive cruise control: A study of a cut-in situation. Cognition, Technology and Work, 8(2), 146 155. Reason, J. (2008). The human contribution: Unsafe acts, accidents, and heroic recoveries. Farnham, UK: Ashgate. Ritter, F. E., & Schooler, L. J. (2001). The learning curve. In N. Smelser & P. Baltes (Eds.), International Encyclopedia of the Social and Behavioral Science (pp. 8602 8605). Amsterdam, The Netherlands: Pergamon. Romm, J., & Frank, A. (2006). Hybrid vehicles gain traction. Scientific American, 294(4), 72 79. Rosenthal, R. (1991). Meta-analytic procedures for social research. Newbury Park, CA: Sage. Rudin-Brown, C. M., & Parker, H. A. (2004). Behavioural adaptation to adaptive cruise control (ACC): Implications for preventive strategies. Transportation Research Part F: Traffic Psychology and Behaviour, 7, 59 76. Schmitz, M., Jagiellowicz, M., Maag, C., & Hanig, M. (2012). The impact of different pedal solutions for supporting efficient driving with electric vehicles. In P. V. Mora, J.-F. Pace & L. Mendoza (Eds.), Proceedings of European on Human Centered Design for Intelligent Transport Systems (HUMANIST) (pp. 21 27). Lyon, France: Humanist Publications. Solberg, G. (2007). The magic of Tesla roadster regenerative braking. Retrieved from http://www.teslamotors.com/blog/magic-tesla-roadster-regenerative-braking Turrentine, T., Garas, D., Lentz, A., & Woodjack, J. (2011). The UC Davis MINI E consumer study. Retrieved from http://publications.its.ucdavis.edu/publication_detail.php?id=1470 Van den Haak, M., de Jong, M., & Schellens, P. (2004). Employing think-aloud protocols and constructive interaction to test the usability of online library catalogues: A methodological comparison. Interacting with Computers, 16(6), 1153 1170.
90 • Paper I Van der Laan, J. D., Heino, A., & De Waard, D. (1997). A simple procedure for the assessment of acceptance of advanced transport telematics. Transportation Research Part C: Emerging Technologies, 5(1), 110. Vilimek, R., Keinath, A., & Schwalm, M. (2012). The MINI E field study - similarities and differences in international everyday EV driving. In N. Stanton (Ed.), Advances in Human Aspects of Road and Rail Transportation (pp. 363 372). San Francisco, CA: CRC Press. Walsh, C., Carroll, S., Eastlake, A., & Blythe, P. (2010). Electric vehicle driving style and duty variation performance study. Retrieved from http://www.nichevehiclenetwork.co.uk/LinkClick.aspx?fileticket=WTmGSFXB8qA%3d&tabid=
Paper II • 91 Paper II Is EV experience related to EV acceptance? Results from a German field study Citation: Bühler, F., Cocron, P., Neumann, I., Franke, T., & Krems, J. F. (2014). Is EV experience related to EV acceptance? Results from a German field study. Transportation Research Part F: Traffic Psychology and Behaviour, 25(A), 85 90. doi:10.1016/j.trf.2014.05.002
92 • Paper II IS EV EXPERIENCE RELATED TO EV ACCEPTANCE? RESULTS FROM A GERMAN FIELD STUDY Franziska Bühler, Peter Cocron, Isabel Neumann, Thomas Franke, Josef. F. Krems Technische Universität Chemnitz Abstract Electric vehicles (EVs) provide a promising solution to rising CO2 emissions and, in the long term, the dependence on oil. In the present study, we examined how the current state of EV technology is perceived and accepted by a sample of early adopters and how experience influences the evaluation and acceptance of EVs. In a 6-month field trial, data from 79 participants who drove an EV in the Berlin metropolitan area were assessed at three data collection points (before receiving the EV, after 3 and 6 months of usage). Participants reported a wide range of advantages, but also barriers to acceptance. They perceive EVs positively and show positive attitudes towards EVs and possess moderate purchase intention. Experience can significantly change the perception of EVs. Many advantages became even more salient (e.g., driving pleasure, low refueling costs) and several barriers (e.g., low noise) were less frequently mentioned. Experience had a significant positive effect on the general perception of EVs and the intention to recommend EVs to others, but not on attitudes and purchase intention. Our findings reveal that EVs are already evaluated positively, but in order to achieve widespread market success in Germany, solutions are needed for important barriers like acquisition costs. Providing real-life experience could be a promising marketing strategy. Key Words: Electric vehicle, acceptance, experience, advantages and barriers, purchase intentions, field study
Paper II • 93 1 Introduction 1.1 Background In an era when climate change and limited fossil fuel resources are highly relevant concerns, the widespread adoption of renewable energy-based transportation has become critically important. In the EU, one fifth of CO2 emissions are produced by automobiles (European Commission, 2012). In order to comply with the Kyoto protocol, the EU must reduce emissions by approximately 20% by 2020 (German Federal Ministry for the Environment, Nature Conservation and Nuclear Safety, 2013), and therefore, automobile emissions must be significantly reduced. These facts underline the need for the development of alternative propulsion systems. Electric vehicles1 (EVs), vehicles with an electric power train that only work on a battery, represent one promising technological development that has the potential to significantly reduce CO2-emissions emitted by automobiles (King, 2010). Still, there is a debate about the real environmental benefit of EVs. According to Hawkins, Singh, Maieau-Bettez and Strømman (2012), the real amount of potential CO2-emissions savings depends on many factors (e.g., production, electricity mix used for charging). In addition to questions concerning the real environmental benefit of EVs, the question concerning the future market success of EVs is of interest. Driving an EV involves many aspects to which a driver of conventional cars has to adapt, including limited range, the charging procedure, regenerative braking, and extremely low noise (Urban, Weinberg, & Hauser, 1996). Potential EV consumers must be willing to manage these additional challenges and currently pay a relatively high purchase price; though, the lower energy prices for recharging would (partly) offset the higher acquisition costs over time (Wietschel et al., 2012). In order to support the widespread adoption of EVs, it is important to develop a better understanding of potential consumers perceptions of EVs. Specifically, it is important to learn which advantages they are aware of, whether some barriers are insurmountable for them, and if they are willing to manage the challenges of an EV. This study aims to investigate the perception of EVs, including advantages and barriers, as well as acceptance of EVs. Furthermore, the present research aims to help determine whether consumers perception and acceptance changes after intensive EV usage. These issues were addressed in a field study with drivers who lived in the Berlin metropolitan area and drove an EV for 6 months. 1 With the term electric vehicle (EV) we refer to a pure battery electric vehicle (BEV) in the present paper. However, several results and conclusions may also generalize to plug-in hybrid electric vehicles (PHEVs) and BEVs with range extender (EREVs).
94 • Paper II 1.2 Perception and acceptance of EVs To assess the willingness of potential consumers to adopt EVs, researchers in several countries have investigated the potential market share of EVs, including Australia (Higgins, Paevere, Gardner, & Quezada, 2012), Japan (Kuwano, Tsukai, & Matsubara, 2012), Canada (Ewing & Sarigöllü, 1998), the USA (Hidrue, Parsons, Kempton, & Gardner, 2011), and Germany (Lieven, Mühlmeier, Henkel, & Waller, 2011). The typical conclusion from this research is that EVs are not fully competitive (Dagsvik, Wennemo, Wetterwald, & Aaberge, 2002) and the demand is weak (e.g., Achtnicht, Bühler, & Hermeling, 2012). Reasons for this might be several concerns of potential consumers including identified limited range, high costs, limited charging infrastructure (e.g., Ziegler, 2012; Egbue & Long, 2012) and charging time (e.g., Hidrue et al., 2011). These findings provide a clearer picture of the potential for EV adoption; however, the aforementioned research is based on people who typically had no prior experience with EVs. Potential consumers tend to inaccurately predict their interest in products with which they have no experience (Hoeffler, 2003). Given this tendency, it seems promising to focus more on studies that examine acceptance of EVs within the context of real-life experience. 1.2.1 Perception and acceptance of EVs after testing EVs Some previous studies have assessed perception and acceptance of EVs after providing participants with direct EV experience. In the UK, Skippon and Garwood (2011) as well as Graham-Rowe et al. (2012) gave drivers the opportunity to test an EV on a 10 mile route for 7 days. Skippon and Garwood (2011) reported that participants endorsed the environmental benefits of EVs, assumed that refueling costs are lower compared to a conventional car and were partly willing to consider an EV with 150 km range as a second car. In contrast, Graham-Rowe et al. (2012) reported that participants were rather skeptical about EVs suitability for daily driving needs and many improvements were needed before participants would be willing to purchase an EV. Additionally, Graham-Rowe et al. (2012) reported that on the one hand many participants were skeptical about the overall CO2 production of EVs, but on the other hand some individuals reported a feel-good factor due to the environmental benefits of the EV. Carroll (2010) studied fleet users and managers who reported that they were more positive about EVs after they had tested them between 1 to 4 weeks. Turrentine, Garas, Lentz, and Woodjack (2011) found similar results: Drivers reported that they have more favorable opinions of EVs and higher purchase intentions after a one year lease of an EV. Taken together, in studies with drivers that have directly experienced EVs, perceptions of EVs vary and purchase intentions
Paper II • 95 were relatively high (e.g., Skippon & Garwood, 2011; Jabeen, Olaru, Smith, Braunl, & Speidel, 2012) compared to those of EV-inexperienced drivers. When comparing findings of studies with EV-experienced (e.g.,Gärling & Johansson, 1999; Graham-Rowe et al., 2012) and EV-inexperienced drivers (e.g., Egbue & Long, 2012), concerns about EVs were found to be mostly similar, including range, costs, infrastructure, charging time, battery issues, lack of noise, reliability, uncertainty with service availability and safety concerns. Furthermore, people with or without EV experience perceive environmental friendliness, high energy efficiency, being the future of automobile travel and financial benefits such as lower running costs as advantages (e.g., Egbue & Long, 2012; Jabeen et al., 2012). Still, there seem to be important differences between EV-inexperienced and experienced drivers: Barriers such as trip planning (Jabeen et al., 2012) and advantages including fun driving (e.g., Turrentine et al., 2011), smooth driving, high torque and low noise (e.g., Jabeen et al., 2012) seem to be more salient after gaining EV experience, as they were only reported in studies with EV-experienced drivers. Better insight into the effect of experience on EV acceptance is attainable by utilizing pre-post comparisons. 1.2.2 Perception and acceptance of EVs in pre-post studies Only a few studies with pre-post comparisons exist in which the change in attitudes towards EVs and willingness to pay for, purchase or use was investigated within the context of ongoing EV experience. In an 11-week trial, EV users attitudes did not change with increasing experience, but willingness to purchase and perceived safety decreased over time (Gärling & Johansson, 1999). Gould and Golob (1998) found an increase in perceived environmental friendliness after a 2-week field trial. In a more recent study, Carroll (2010) showed that experience produced an observable influence: More drivers were willing to use an EV after a test drive than before. With a stated preference approach, Jensen, Cherchi and Mabit (2013) found that participants willingness to pay for range, battery life and top speed after EV usage increased within a 3-month field trial. To our knowledge, there are no studies that explicitly investigated changes in consumers reports of EV advantages and barriers during the process of gaining EV experience. Jensen et al. (2013) investigated selected EV attributes that are potential disadvantages when using EVs (e.g., purchase price, range). Many potential advantages and barriers were not included in these analyses. When reviewing the literature, it became apparent that there are advantages and barriers that were only reported in studies with EV-
96 • Paper II experienced drivers. Furthermore, most of those advantages and barriers are features that can be directly experienced when testing an EV (e.g., low noise, smoothness). It might be the case that these EV-specific attributes become more salient when experiencing an EV. As the available literature on EVs indicates that the market potential of EVs is relatively low (e.g., Ziegler, 2012) and that several concerns exist (e.g., Egbue & Long, 2012), it is important to identify the advantages and barriers that are perceived and can be reinforced or positively changed through experience with EVs. This leads to our first research questions: Which advantages and barriers do users/potential consumers perceive? Given the reviewed literature, we can further specify this question: Do users/potential consumers perceive environmental friendliness, lower running costs, energy efficiency, low noise, smooth driving, fun, and home-charging as advantages and limited range, charging infrastructure and duration, battery issues, reliability, uncertainty with service availability, low noise as a safety problem, and other safety concerns as barriers? (Q1a). Furthermore, we aim to answer the following questions: Do reported advantages and barriers change when using an EV for a longer period of time? Are changes in reports more likely to be positive when advantages and barriers can be directly experienced? (Q1b) Apart from potential advantages and disadvantages, the reviewed literature (e.g., Carroll, 2010; Gärling & Johansson ,1999) indicates that experience has a positive influence on acceptance. Burgess, King, Harris and Lewis (2013) also reported that experience is a crucial factor, because drivers reported that it has the potential to change peoples perception of specific EV attributes (e.g., low noise).Yet, recent studies that directly perform pre-post comparisons regarding changes in EV acceptance over the process of gaining long-term experience are lacking. Older published research on long-term experience (Gärling & Johansson,1999; Gould & Golob, 1998) utilized an earlier generation of EVs with substantially lower performance capabilities. This study aims to bridge this gap and investigates the following questions: How is the current state of EV technology perceived and is it acceptable to users/potential consumers? (Q2a) Does perception of EVs and acceptance change while testing an EV for a longer period of time? (Q2b) 1.3 Defining perception and acceptance In order to investigate the previously mentioned research questions, acceptance must be defined. In the scientific literature, different variables were assessed to make conclusions about acceptance or adoption of EVs. In several stated preference studies (e.g., Ziegler, 2012), individuals preferences for different vehicle attributes (e.g., energy source, range, and price) were investigated. Based upon such data, conclusions can
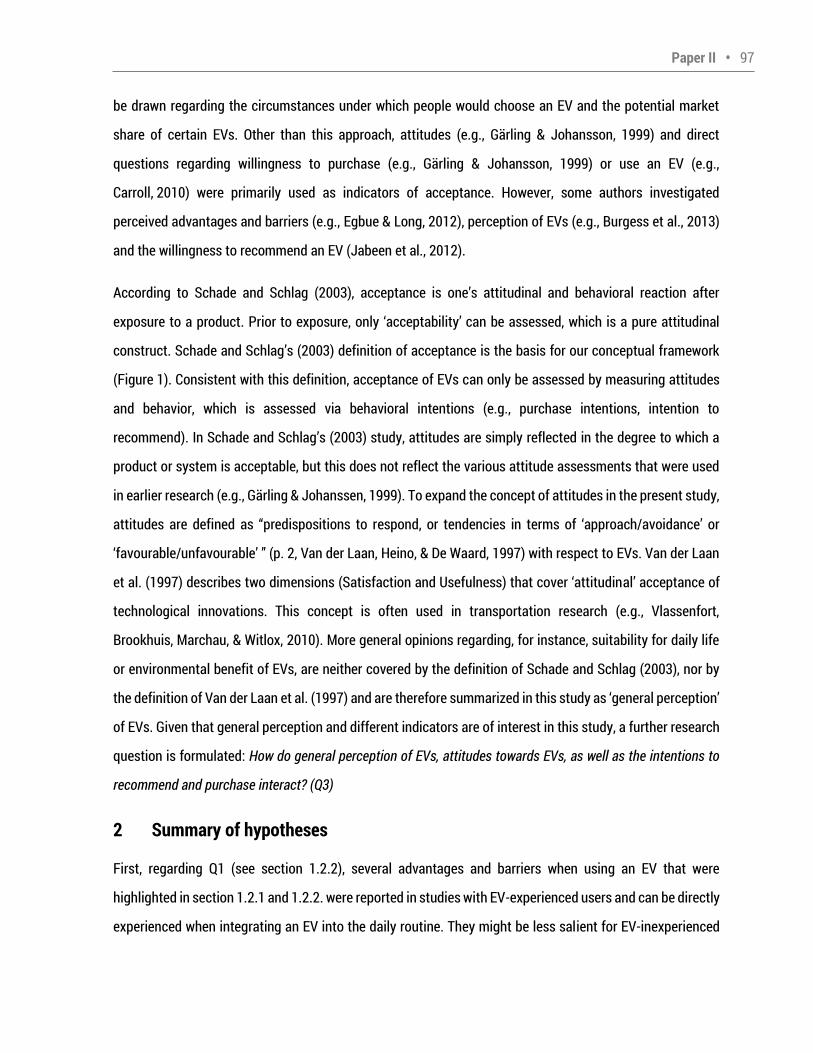
Paper II • 97 be drawn regarding the circumstances under which people would choose an EV and the potential market share of certain EVs. Other than this approach, attitudes (e.g., Gärling & Johansson, 1999) and direct questions regarding willingness to purchase (e.g., Gärling & Johansson, 1999) or use an EV (e.g., Carroll, 2010) were primarily used as indicators of acceptance. However, some authors investigated perceived advantages and barriers (e.g., Egbue & Long, 2012), perception of EVs (e.g., Burgess et al., 2013) and the willingness to recommend an EV (Jabeen et al., 2012). According to Schade and Schlag (2003), acceptance is one s attitudinal and behavioral reaction after exposure to a product. Prior to exposure, only acceptability can be assessed, which is a pure attitudinal
construct. Schade and Schlag s (2003) definition of acceptance is the basis for our conceptual framework (Figure 1). Consistent with this definition, acceptance of EVs can only be assessed by measuring attitudes and behavior, which is assessed via behavioral intentions (e.g., purchase intentions, intention to recommend). In Schade and Schlag s (2003) study, attitudes are simply reflected in the degree to which a product or system is acceptable, but this does not reflect the various attitude assessments that were used in earlier research (e.g., Gärling & Johanssen, 1999). To expand the concept of attitudes in the present study, attitudes are defined as predispositions to respond, or tendencies in terms of approach/avoidance or
favourable/unfavourable (p. 2, Van der Laan, Heino, & De Waard, 1997) with respect to EVs. Van der Laan
et al. (1997) describes two dimensions (Satisfaction and Usefulness) that cover attitudinal acceptance of technological innovations. This concept is often used in transportation research (e.g., Vlassenfort, Brookhuis, Marchau, & Witlox, 2010). More general opinions regarding, for instance, suitability for daily life or environmental benefit of EVs, are neither covered by the definition of Schade and Schlag (2003), nor by the definition of Van der Laan et al. (1997) and are therefore summarized in this study as general perception of EVs. Given that general perception and different indicators are of interest in this study, a further research question is formulated: How do general perception of EVs, attitudes towards EVs, as well as the intentions to recommend and purchase interact? (Q3) 2 Summary of hypotheses First, regarding Q1 (see section 1.2.2), several advantages and barriers when using an EV that were highlighted in section 1.2.1 and 1.2.2. were reported in studies with EV-experienced users and can be directly experienced when integrating an EV into the daily routine. They might be less salient for EV-inexperienced
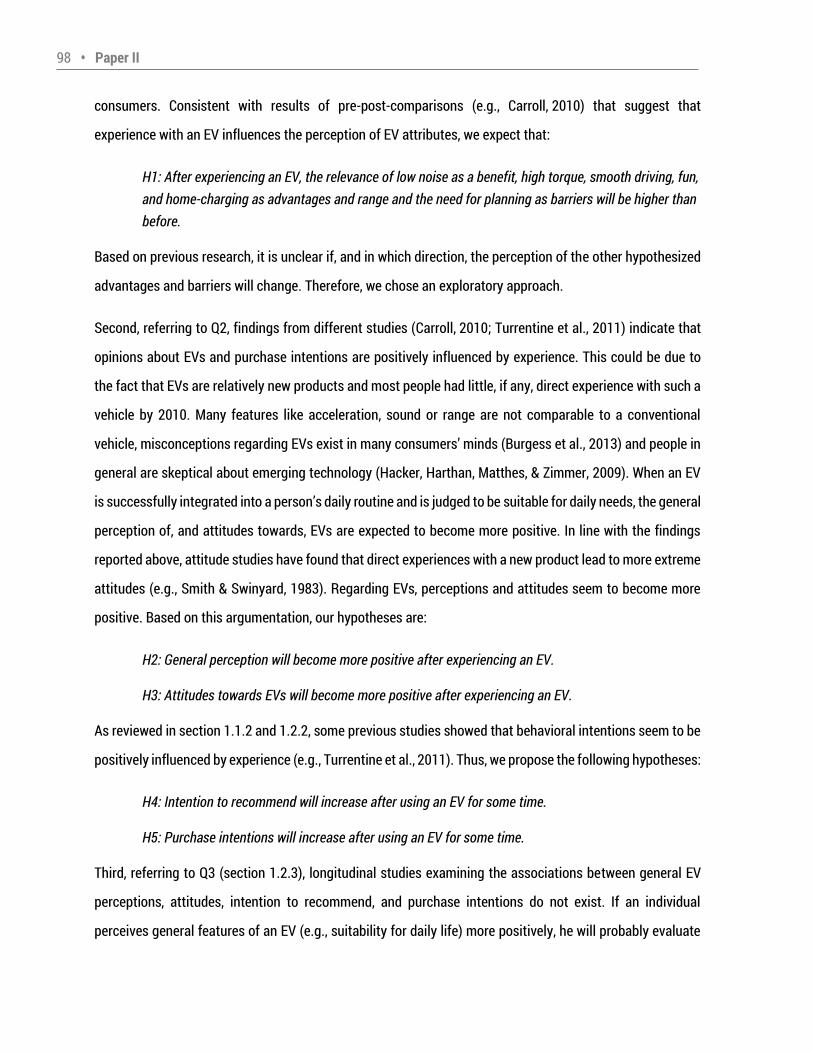
98 • Paper II consumers. Consistent with results of pre-post-comparisons (e.g., Carroll, 2010) that suggest that experience with an EV influences the perception of EV attributes, we expect that: H1: After experiencing an EV, the relevance of low noise as a benefit, high torque, smooth driving, fun, and home-charging as advantages and range and the need for planning as barriers will be higher than before. Based on previous research, it is unclear if, and in which direction, the perception of the other hypothesized advantages and barriers will change. Therefore, we chose an exploratory approach. Second, referring to Q2, findings from different studies (Carroll, 2010; Turrentine et al., 2011) indicate that opinions about EVs and purchase intentions are positively influenced by experience. This could be due to the fact that EVs are relatively new products and most people had little, if any, direct experience with such a vehicle by 2010. Many features like acceleration, sound or range are not comparable to a conventional vehicle, misconceptions regarding EVs exist in many consumers minds (Burgess et al., 2013) and people in general are skeptical about emerging technology (Hacker, Harthan, Matthes, & Zimmer, 2009). When an EV is successfully integrated into a person s daily routine and is judged to be suitable for daily needs, the general perception of, and attitudes towards, EVs are expected to become more positive. In line with the findings reported above, attitude studies have found that direct experiences with a new product lead to more extreme attitudes (e.g., Smith & Swinyard, 1983). Regarding EVs, perceptions and attitudes seem to become more positive. Based on this argumentation, our hypotheses are: H2: General perception will become more positive after experiencing an EV. H3: Attitudes towards EVs will become more positive after experiencing an EV. As reviewed in section 1.1.2 and 1.2.2, some previous studies showed that behavioral intentions seem to be positively influenced by experience (e.g., Turrentine et al., 2011). Thus, we propose the following hypotheses: H4: Intention to recommend will increase after using an EV for some time. H5: Purchase intentions will increase after using an EV for some time. Third, referring to Q3 (section 1.2.3), longitudinal studies examining the associations between general EV perceptions, attitudes, intention to recommend, and purchase intentions do not exist. If an individual perceives general features of an EV (e.g., suitability for daily life) more positively, he will probably evaluate
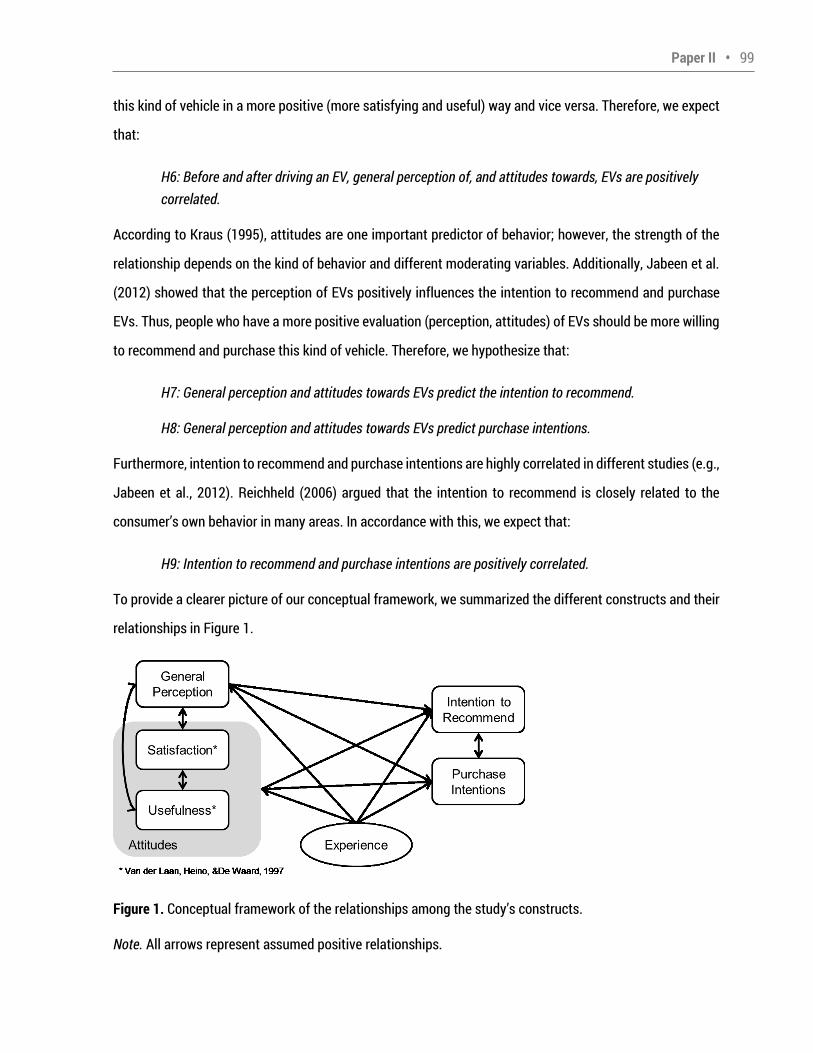
Paper II • 99 this kind of vehicle in a more positive (more satisfying and useful) way and vice versa. Therefore, we expect that: H6: Before and after driving an EV, general perception of, and attitudes towards, EVs are positively correlated. According to Kraus (1995), attitudes are one important predictor of behavior; however, the strength of the relationship depends on the kind of behavior and different moderating variables. Additionally, Jabeen et al. (2012) showed that the perception of EVs positively influences the intention to recommend and purchase EVs. Thus, people who have a more positive evaluation (perception, attitudes) of EVs should be more willing to recommend and purchase this kind of vehicle. Therefore, we hypothesize that: H7: General perception and attitudes towards EVs predict the intention to recommend. H8: General perception and attitudes towards EVs predict purchase intentions. Furthermore, intention to recommend and purchase intentions are highly correlated in different studies (e.g., Jabeen et al., 2012). Reichheld (2006) argued that the intention to recommend is closely related to the consumer s own behavior in many areas. In accordance with this, we expect that: H9: Intention to recommend and purchase intentions are positively correlated. To provide a clearer picture of our conceptual framework, we summarized the different constructs and their relationships in Figure 1. Figure 1. Conceptual framework of the relationships among the study s constructs. Note. All arrows represent assumed positive relationships.
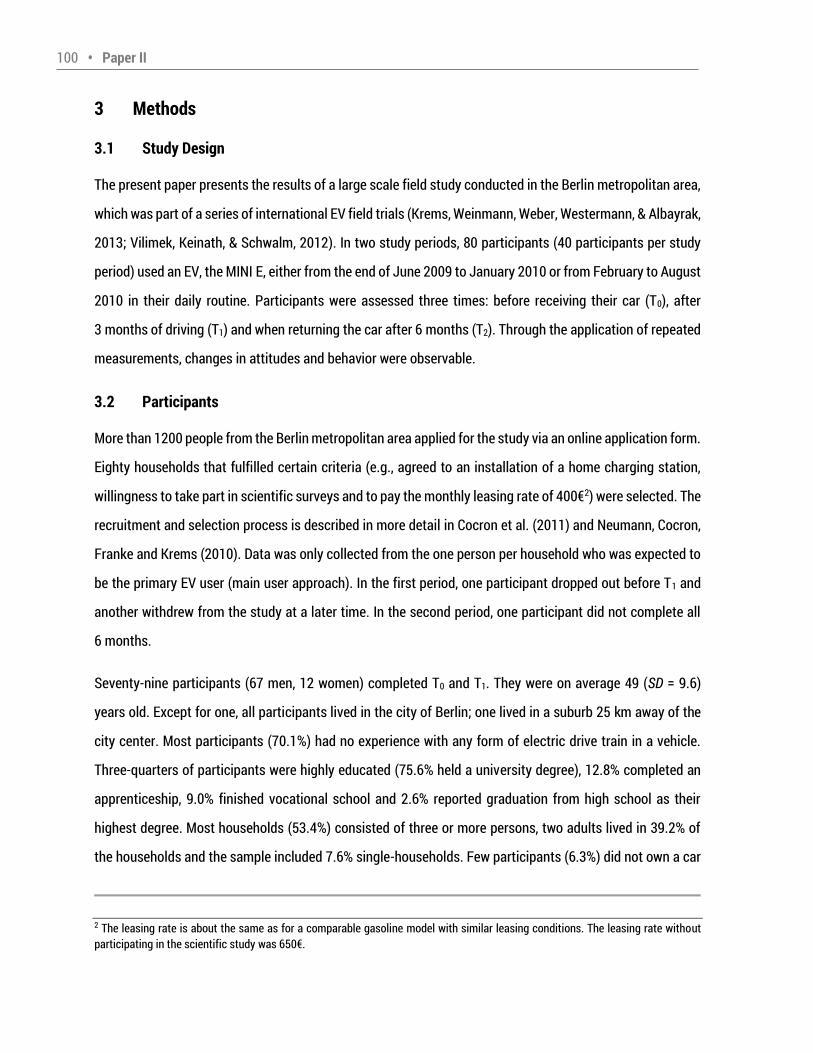
100 • Paper II 3 Methods 3.1 Study Design The present paper presents the results of a large scale field study conducted in the Berlin metropolitan area, which was part of a series of international EV field trials (Krems, Weinmann, Weber, Westermann, & Albayrak, 2013; Vilimek, Keinath, & Schwalm, 2012). In two study periods, 80 participants (40 participants per study period) used an EV, the MINI E, either from the end of June 2009 to January 2010 or from February to August 2010 in their daily routine. Participants were assessed three times: before receiving their car (T0), after 3 months of driving (T1) and when returning the car after 6 months (T2). Through the application of repeated measurements, changes in attitudes and behavior were observable. 3.2 Participants More than 1200 people from the Berlin metropolitan area applied for the study via an online application form. Eighty households that fulfilled certain criteria (e.g., agreed to an installation of a home charging station, willingness to take part in scientific surveys and to pay the monthly leasing rate of 400€2) were selected. The recruitment and selection process is described in more detail in Cocron et al. (2011) and Neumann, Cocron, Franke and Krems (2010). Data was only collected from the one person per household who was expected to be the primary EV user (main user approach). In the first period, one participant dropped out before T1 and another withdrew from the study at a later time. In the second period, one participant did not complete all 6 months. Seventy-nine participants (67 men, 12 women) completed T0 and T1. They were on average 49 (SD = 9.6) years old. Except for one, all participants lived in the city of Berlin; one lived in a suburb 25 km away of the city center. Most participants (70.1%) had no experience with any form of electric drive train in a vehicle. Three-quarters of participants were highly educated (75.6% held a university degree), 12.8% completed an apprenticeship, 9.0% finished vocational school and 2.6% reported graduation from high school as their highest degree. Most households (53.4%) consisted of three or more persons, two adults lived in 39.2% of the households and the sample included 7.6% single-households. Few participants (6.3%) did not own a car 2 The leasing rate is about the same as for a comparable gasoline model with similar leasing conditions. The leasing rate without participating in the scientific study was 650€.
Paper II • 101 before the study and 26.6% reported that the EV would substitute for one of their vehicles. The majority of participants had a second car available during the study (one additional car: 48.1%; two: 31.6%; three or more: 10.1%). The household size and available vehicle fleet correlated significantly (r = .31, p = .006). The majority of participants (91.1%) endorsed using the EV for work trips that varied considerably in length (M = 17.5 km, SD = 10.7). German early adopters in other studies (e.g., Wietschel et al., 2012) showed similar distribution on sociodemographic variables. Compared to the population of early adopters, German car drivers in the representative large-scale survey Mobility in Germany 2008 (Mobilität in Deutschland, MiD; infas, & DLR, 2010) were younger (M = 42), included fewer men (51%), were not as highly educated (40% had at least a university of applied science entrance qualification) and had smaller household sizes (36% of households had three or more persons) (see Franke & Krems, 2013b). 3.3 Data collection To investigate study hypotheses, portions of the conducted interviews and questionnaires were used. 3.3.1 Perceived advantages and barriers of EVs In the first two interviews (T0 & T1), participants were asked the following open-ended questions: (1) In your opinion, what are the greatest advantages of electric vehicles like the MINI E? and (2) In your opinion, what
are the greatest barriers to acceptance of electric vehicles? At T1, users were asked to answer based on their experiences beforehand. Recordings of the interviews were transcribed verbatim and coded using the qualitative data analysis software package MAXQDA 10. The qualitative content analysis by Mayring (2000), particularly the inductive category development, served as a guideline for coding. After coding all of the obtained interview data, reliability was checked, categories were interpreted and frequencies of assigned categories were analyzed. Because qualitative analysis might be biased or highly subjective due to the dependence on researchers coding and interpretation of transcribed data, two different strategies to verify analyses were pursued, as suggested by Elliott, Fischer and Rennie (1999). First, two researchers on the research team coded both the first 25% of the transcripts and continually discussed category development and text interpretation. For the overlapping 25% of the data, the interrater reliability using Cohen s κ proved to be very good (κ = 0.81, p = .000; Landis & Koch, 1977). This procedure was used to ensure that categories were shared between coders and that the interpretation was valid. Notably, only minimal interpretation was needed, because participants
102 • Paper II made mostly clear statements, at least in terms of the advantages and barriers they reported. While coding the rest of the material, researchers discussed more complex text passages. Second, some illustrative quotes were included in this paper to give the reader the opportunity to follow our interpretation. At the conclusion of content analysis, researchers subdivided the categorized advantages and barriers into non-experiential /not directly experienced or experiential / directly experienced and frequencies were analyzed. 3.3.2 Perception, attitudes towards EVs and behavioral intentions Regarding General Perception of EVs, five items (see Table 1) were consistently used at all points of data collection. These items were summarized to create the scale General Perception of EVs (.67 Cronbach s α .70). A 6-point Likert Scale from 1 (completely disagree) to 6 (completely agree) was applied for all items, as well as for all intention items. Furthermore, the Van der Laan Acceptance Scale (Van der Laan et al., 1997), an instrument for measuring acceptance that contains two dimensions (Satisfaction and Usefulness) was implemented. Only users who participated in the second study period were asked at all points of data collection to respond to the nine semantic differentials (ranging from -2 to 2) while evaluating the EV. Users participating in the first period were asked at T1 and T2, but not at T0. Four of nine semantic differentials belong to the Satisfaction scale (e.g., pleasant unpleasant, nice annoying). The other five items represent the Usefulness scale (e.g., useful useless, bad good). The internal consistency of Usefulness (.64 Cronbach s α .82) and Satisfaction (.70 Cronbach s α .86) was satisfactory at all data collection points. One item was administered to assess the Willingness to Recommend an EV (Table 1). It included the wording, would recommend to my best friend , which has been shown to reliably predict customers behavior in most contexts (Reichheld, 2003). Three items assessed purchase intentions (see Table 1). In particular, two items assessed the Willingness to Pay. These items were anchored on realistic leasing rates and purchase prices for EVs which would be comparable to the test vehicle in performance. The third item assessed the Willingness to Purchase an EV after the project, but it was only administered in the second study period at all three points of data collection (first period: T1 & T2).
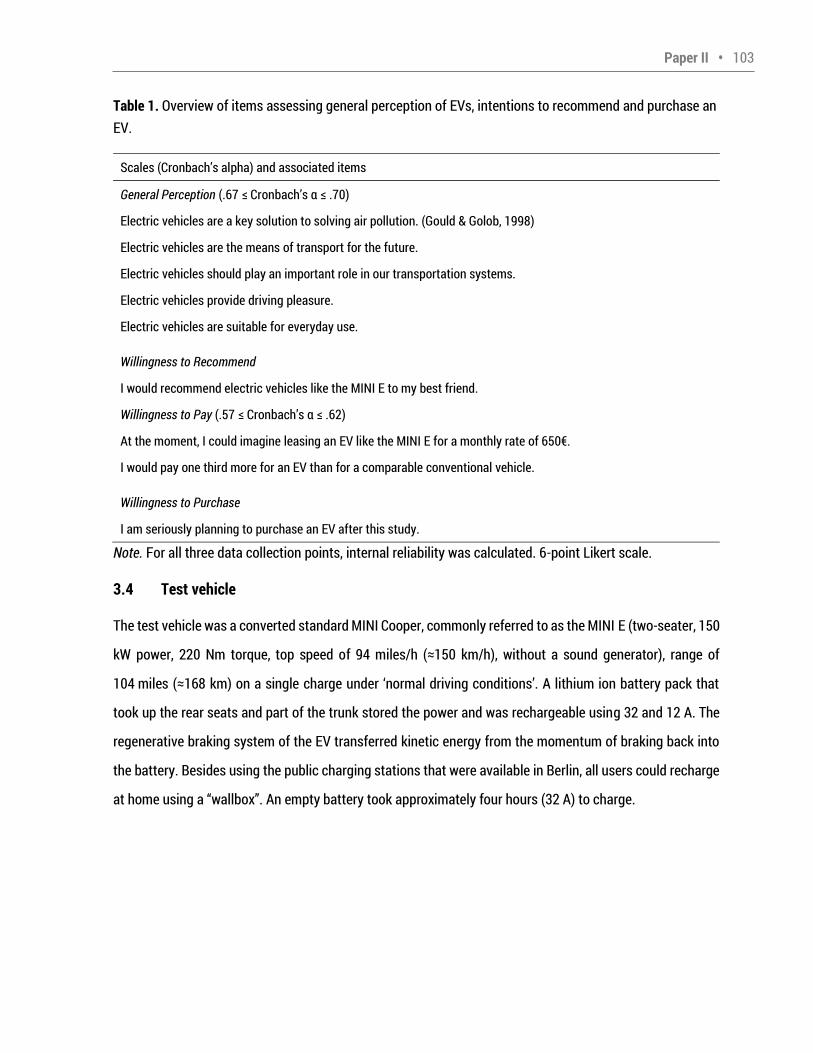
Paper II • 103 Table 1. Overview of items assessing general perception of EVs, intentions to recommend and purchase an EV. Scales (Cronbach s alpha) and associated items General Perception (.67 Cronbach s α .70) Electric vehicles are a key solution to solving air pollution. (Gould & Golob, 1998) Electric vehicles are the means of transport for the future. Electric vehicles should play an important role in our transportation systems. Electric vehicles provide driving pleasure. Electric vehicles are suitable for everyday use. Willingness to Recommend I would recommend electric vehicles like the MINI E to my best friend. Willingness to Pay (.57 Cronbach s α .62) At the moment, I could imagine leasing an EV like the MINI E for a monthly rate of 650€. I would pay one third more for an EV than for a comparable conventional vehicle. Willingness to Purchase I am seriously planning to purchase an EV after this study. Note. For all three data collection points, internal reliability was calculated. 6-point Likert scale. 3.4 Test vehicle The test vehicle was a converted standard MINI Cooper, commonly referred to as the MINI E (two-seater, 150 kW power, 220 Nm torque, top speed of 94 miles/h (≈150 km/h), without a sound generator), range of 104 miles (≈168 km) on a single charge under normal driving conditions . A lithium ion battery pack that took up the rear seats and part of the trunk stored the power and was rechargeable using 32 and 12 A. The regenerative braking system of the EV transferred kinetic energy from the momentum of braking back into the battery. Besides using the public charging stations that were available in Berlin, all users could recharge
at home using a wallbox . An empty battery took approximately four hours (32 A) to charge.
104 • Paper II 4 Results 4.1 Perceived advantages of EVs and barriers to acceptance – Qualitative data (H1 & exploratory approach) To investigate perceived advantages and barriers, frequencies of reported categories and the changes in participants reports were analyzed. The McNemar test, with Yates correction for continuity, was performed to test if participants significantly changed their reports of perceived advantages and barriers. If preconditions of the McNemar test were violated, we used the binomial test. Because the experience effect was of interest, the effect size was calculated according to Green and Salkind (2003) (i.e., the proportions of participants that endorsed the particular advantage or barrier at T0 was subtracted from the proportion of participants that endorsed the advantage or barrier at T1). Although participants were asked to report general advantages and barriers, it became clear in the interviews that they often spoke in personal terms. It was not possible to distinguish between advantages/barriers that were perceived to be general or personal in most cases; therefore, this differentiation was not included in the analyses. However, some of the reported advantages and barriers could have been directly experienced while integrating the EV in daily life and others could not. This is addressed in the presentation of the results. 4.1.1 How perception of advantages changes with EV experience Statistical results regarding perceived advantages are shown in Table 2. The most frequently reported experiential advantage was the low noise emission of the vehicle. After 3 months, participants were even more enthusiastic about the low noise emission and changes in reported frequencies were significant.
It might sound trivial, but I almost think that the greatest advantage is that [the EV] is silent. That s
the best part about the whole thing. (T1, Participant 27)
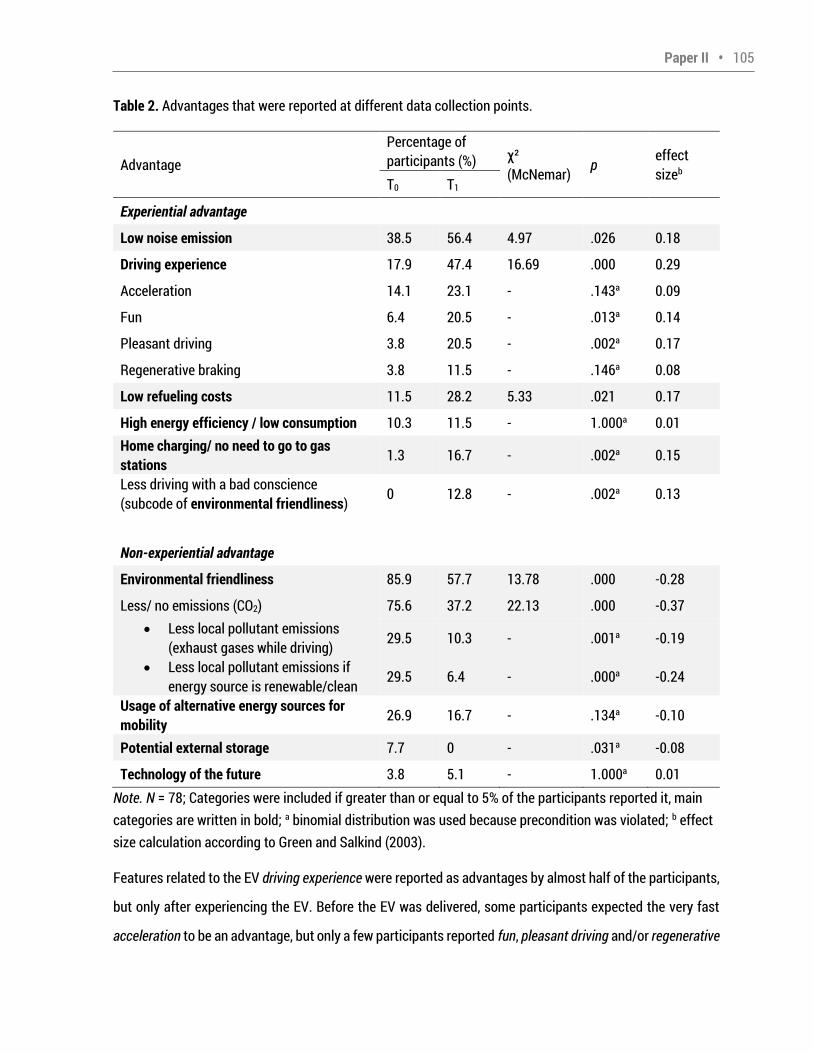
Paper II • 105 Table 2. Advantages that were reported at different data collection points. Advantage Percentage of participants (%) χ² (McNemar) p effect sizeb T0 T1 Experiential advantage Low noise emission 38.5 56.4 4.97 .026 0.18 Driving experience 17.9 47.4 16.69 .000 0.29 Acceleration 14.1 23.1 - .143a 0.09 Fun 6.4 20.5 - .013a 0.14 Pleasant driving 3.8 20.5 - .002a 0.17 Regenerative braking 3.8 11.5 - .146a 0.08 Low refueling costs 11.5 28.2 5.33 .021 0.17 High energy efficiency / low consumption 10.3 11.5 - 1.000a 0.01 Home charging/ no need to go to gas stations 1.3 16.7 - .002a 0.15 Less driving with a bad conscience (subcode of environmental friendliness) 0 12.8 - .002a 0.13 Non-experiential advantage Environmental friendliness 85.9 57.7 13.78 .000 -0.28 Less/ no emissions (CO2) 75.6 37.2 22.13 .000 -0.37 Less local pollutant emissions (exhaust gases while driving) 29.5 10.3 - .001a -0.19 Less local pollutant emissions if energy source is renewable/clean 29.5 6.4 - .000a -0.24 Usage of alternative energy sources for mobility 26.9 16.7 - .134a -0.10 Potential external storage 7.7 0 - .031a -0.08 Technology of the future 3.8 5.1 - 1.000a 0.01 Note. N = 78; Categories were included if greater than or equal to 5% of the participants reported it, main categories are written in bold; a binomial distribution was used because precondition was violated; b effect size calculation according to Green and Salkind (2003). Features related to the EV driving experience were reported as advantages by almost half of the participants, but only after experiencing the EV. Before the EV was delivered, some participants expected the very fast acceleration to be an advantage, but only a few participants reported fun, pleasant driving and/or regenerative
106 • Paper II braking as expected advantages. After 3 months, fun and pleasant driving was seen as an advantage by more participants and individual reported attitudes had changed significantly over time. After 3 months, compared to prior to EV delivery, the number of participants who reported the low refueling costs of an EV as an advantage more than doubled. After experiencing the EV, the perception of this feature changed significantly. At both data collection points, around 10% of the participants perceived the high energy efficiency, and therefore low consumption, as one important advantage. There was no experience effect found for this feature. Another category of advantages included that EVs could be charged at home if possible and participants do not need to make extra trips to gas stations. At T0, just 1.3% reported this feature as an advantage, but after experience with the EV, 16.7% noted it as benefit. Participants reports changed significantly. The environmental friendliness per se is an advantage that could not have been directly experienced. However, driving with less of a bad conscience is a direct experience that the participants had. After 3 months, some drivers endorsed this quality because of perceived environmental friendliness. This change was significant. Overall, environmental friendliness of the EV is the most frequently reported advantage. This category includes less CO2-emission through EV usage, particularly lower inner-city air pollution. Some participants mentioned that this advantage would only appear if the energy used for charging was generated using low CO2 technology (e.g., solar or wind power).
CO2-neutral, on the condition that renewable energy is used, because if we use nuclear power or energy from coal-fired power plants, it wouldn't make much sense really (T0, Participant 22) After using the EV for 3 months, environmental friendliness was mentioned less frequently when participants were asked to report advantages of EVs. There was a significant change in individuals reports over time. At T0, another major non-experiential advantage was the usage of alternative energy sources for mobility. Although this category implies that electric vehicles are independent of fossil fuels, they depend on energy
Paper II • 107 which could come from various sources. At T1, it was mentioned less often, but the change in participants reports between T0 and T1 was not significant. I think the greatest advantage for the future is that energy can be generated or produced in many ways, using solar, wind, nuclear, coal or water energy. This energy can be used to operate vehicles. One is not tied to one specific kind of energy, oil, but has the opportunity to generate electricity from
different sources. (T1, Participant 23) An EV as potential external storage was only reported as a relevant advantage at T0; at T1 none of the participants mentioned it. Participants endorsement of this feature changed significantly after EV usage. Few participants reported EVs are a technology of the future as an advantage at either data collection point. No significant change was observed after experience with the EV. In sum, as expected in Q1a, environmental friendliness, lower running costs, efficiency, low noise, fun, and home-charging were reported as advantages by participants. Furthermore, different driving characteristic such as acceleration and regenerative braking, usage of alternative energy sources for mobility and EVs as potential external storage were additionally reported. The hypothesized smooth driving is most likely comparable to the reported pleasant driving . Furthermore, different experiential features of the EV (e.g., low noise, pleasant driving) were more frequently reported after experience. However, perception of some features such as acceleration , which is likely comparable to high torque , were unaffected by experience. Other than that, we can conclude that perception of low noise, smooth driving, fun, and home-charging as advantages increased for the participants after gaining experience, and therefore, our data support hypothesis H1. With two exceptions, the endorsement of most non-experiential advantages (e.g., environmental benefits) was negatively influenced by experience (i.e., these advantages were not mentioned as frequently anymore). In sum, the valence of the experience effect varied. 4.1.2 Barriers to acceptance and how perceptions change with EV experience Reported barriers for acceptance and their statistical values are presented in Table 3. At T0, the most frequently reported experiential barrier to widespread adoption of EVs was limited range. Although the
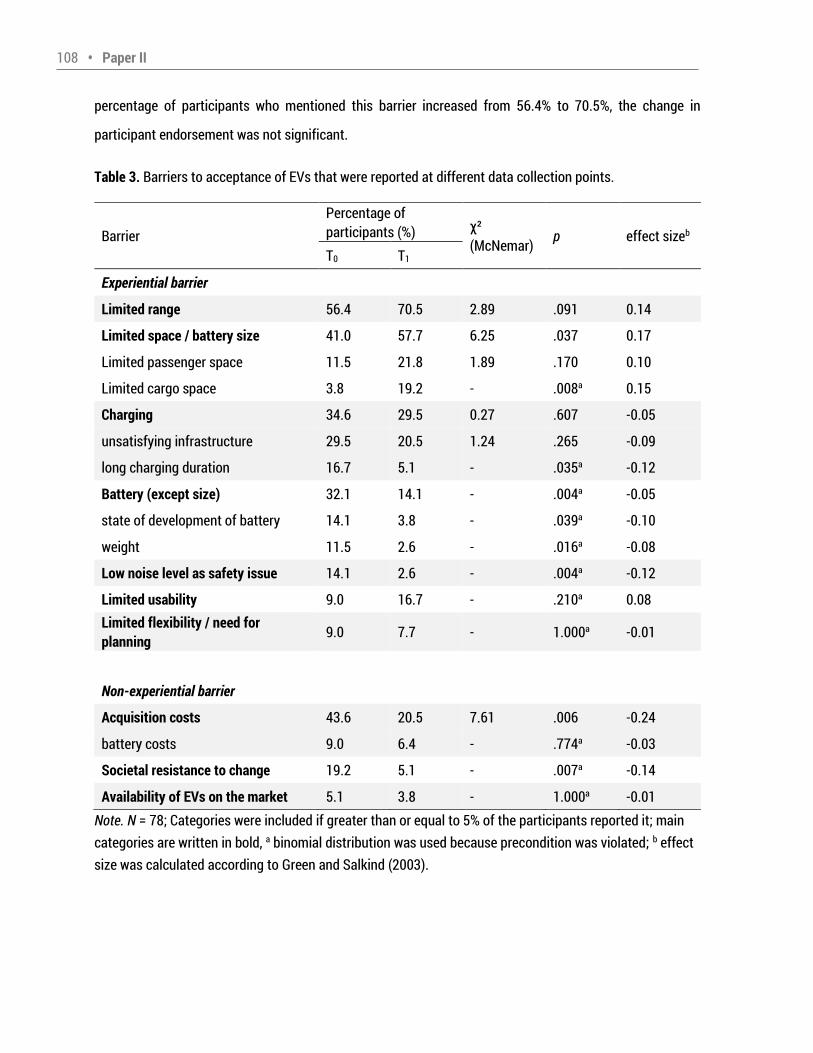
108 • Paper II percentage of participants who mentioned this barrier increased from 56.4% to 70.5%, the change in participant endorsement was not significant. Table 3. Barriers to acceptance of EVs that were reported at different data collection points. Barrier Percentage of participants (%) χ² (McNemar) p effect sizeb T0 T1 Experiential barrier Limited range 56.4 70.5 2.89 .091 0.14 Limited space / battery size 41.0 57.7 6.25 .037 0.17 Limited passenger space 11.5 21.8 1.89 .170 0.10 Limited cargo space 3.8 19.2 - .008a 0.15 Charging 34.6 29.5 0.27 .607 -0.05 unsatisfying infrastructure 29.5 20.5 1.24 .265 -0.09 long charging duration 16.7 5.1 - .035a -0.12 Battery (except size) 32.1 14.1 - .004a -0.05 state of development of battery 14.1 3.8 - .039a -0.10 weight 11.5 2.6 - .016a -0.08 Low noise level as safety issue 14.1 2.6 - .004a -0.12 Limited usability 9.0 16.7 - .210a 0.08 Limited flexibility / need for planning 9.0 7.7 - 1.000a -0.01 Non-experiential barrier Acquisition costs 43.6 20.5 7.61 .006 -0.24 battery costs 9.0 6.4 - .774a -0.03 Societal resistance to change 19.2 5.1 - .007a -0.14 Availability of EVs on the market 5.1 3.8 - 1.000a -0.01 Note. N = 78; Categories were included if greater than or equal to 5% of the participants reported it; main categories are written in bold, a binomial distribution was used because precondition was violated; b effect size was calculated according to Green and Salkind (2003).
Paper II • 109 Compared to T0, 20% more participants mentioned limited space due to the battery as a disadvantage at T1. Experience had a significant effect. Participants partly distinguished between limited passenger and cargo space. Regarding charging, different features were mentioned as barriers: unsatisfying infrastructure, long charging duration, or simply, the handling of the cable. In sum, every feature was reported less frequently as a barrier after 3 months of EV usage; however, only charging duration changed significantly. The battery (apart from size) as barrier was also mentioned more frequently at T1. Participants evaluated the battery as heavy, and its battery life as unsatisfactory. Experience had a significant impact. Especially in the beginning, participants mentioned low noise as a barrier. Many participants reports changed significantly over time. Less than 3% mentioned the acoustics as a barrier after experience with the EV. Some participants were conflicted about this feature and simultaneously reported it as an advantage and a disadvantage. They were concerned about the safety consequences of low noise and missing important noise-related feedback, but were pleased with the silent driving. As a consequence, we analyzed the data differently, coding 3 groups: drivers who only endorse it as an advantage, only as barrier or as both. At T0, 28.2% of the participants perceived the low sound level as an advantage, 10.3% felt ambivalent about it and 3.8% perceived the low noise exclusively as a barrier. One significant change was observed over time. At T1, many more participants (53.8%) reported the low noise exclusively as an advantage (p = .002). After 3 months, 2.6% of the participants were conflicted (p = .070) and none of the participants reported this feature exclusively as a barrier (p = .250), but these latter changes were not significant. Limited usability of an EV, which is closely related to other barriers (e.g., range, acquisition costs and unsatisfying infrastructure), was also reported as a barrier to acceptance. The percentage of participants who identified this feature as a barrier was higher at T1; however, changes in reports between T0 and T1 were not significant. … and that [the EV] is not as functionally versatile, because you can t go on vacations with it or drive
longer trips. (T1, Participant 74)
110 • Paper II At both data collection points, some participants reported that driving an EV requires more planning and organization than driving a conventional automobile, because EVs are less flexible (limited flexibility / need for planning). Experience did not significantly change perception of this barrier. Although participants leased the EV, acquisition costs was a non-experiential barrier, because they paid a reduced leasing rate. At T0, acquisition costs, including high battery costs, was the second most frequently endorsed barrier, but at T1, only 19.2% reported this feature as a barrier. The McNemar test showed that the impact of experience was significant. Another barrier that participants mentioned is best described as societal resistance to change. Some participants mentioned that the majority of the German population has a very specific conception of what a car should be and which characteristics and functions it must have. In addition, they reported that the population is skeptical about new products. Thus, this would be a barrier to widespread EV adoption. Participants perceptions regarding this category changed significantly after experience with the EV. Societal resistance to change was perceived as much less of a barrier.
Well, I think that most people are somehow afraid of first losing mobility through the limited range and then they're scared of the unknown (T0, Participant 16) One barrier that was identified that is probably not as valid today is that the availability of EVs on the market is unknown or very limited. As expected in Q1a, limited range, charging infrastructure and duration, battery issues, and low noise as a safety problem are perceived as barriers. Contrary to our expectation, reliability, uncertainty with service availability and other safety concerns were not reported by at least 5% of the participants. Additionally, barriers such as limited usability and societal resistance to change were identified. Participant endorsement of some barriers changed with experience. Some barriers became more relevant (e.g., limited space) and others were mentioned less frequently (e.g., low noise); thus, experience did not always positively influence
perceptions. Our hypothesis (H1) that the salience of need for planning and limited range as barriers will increase after using an EV was not supported by our data.
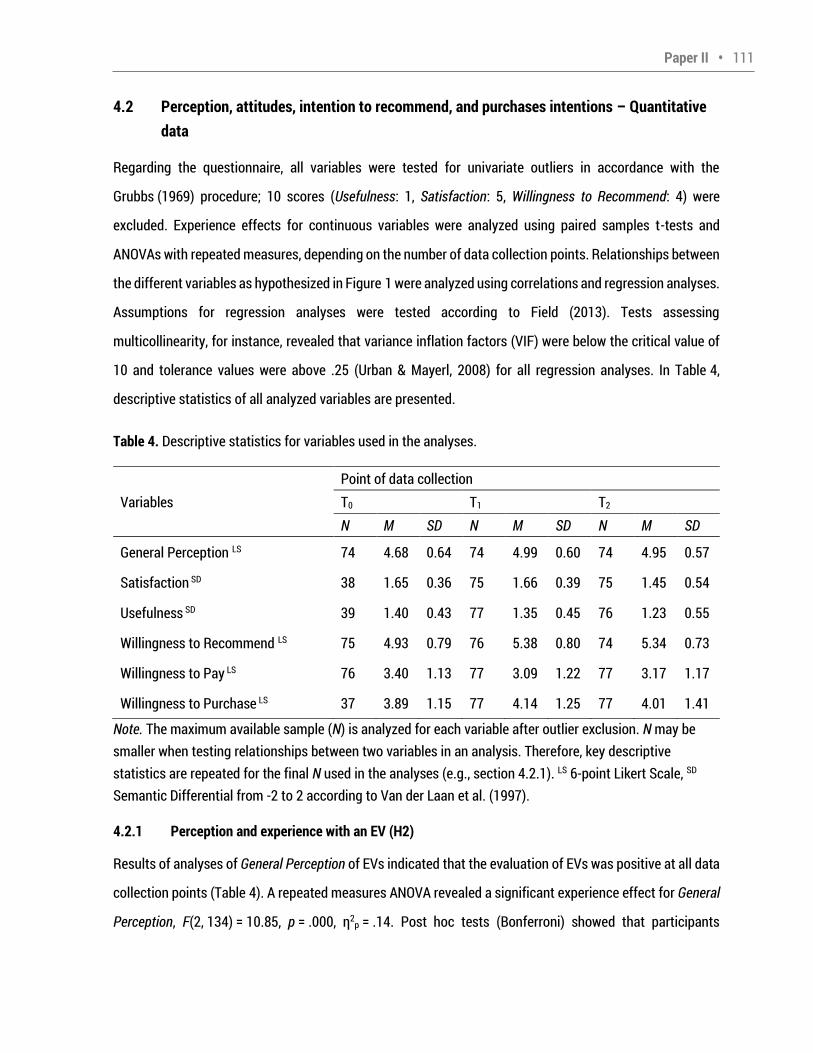
Paper II • 111 4.2 Perception, attitudes, intention to recommend, and purchases intentions – Quantitative data Regarding the questionnaire, all variables were tested for univariate outliers in accordance with the Grubbs (1969) procedure; 10 scores (Usefulness: 1, Satisfaction: 5, Willingness to Recommend: 4) were excluded. Experience effects for continuous variables were analyzed using paired samples t-tests and ANOVAs with repeated measures, depending on the number of data collection points. Relationships between the different variables as hypothesized in Figure 1 were analyzed using correlations and regression analyses. Assumptions for regression analyses were tested according to Field (2013). Tests assessing multicollinearity, for instance, revealed that variance inflation factors (VIF) were below the critical value of 10 and tolerance values were above .25 (Urban & Mayerl, 2008) for all regression analyses. In Table 4, descriptive statistics of all analyzed variables are presented. Table 4. Descriptive statistics for variables used in the analyses. Variables Point of data collection T0 T1 T2 N M SD N M SD N M SD General Perception LS 74 4.68 0.64 74 4.99 0.60 74 4.95 0.57 Satisfaction SD 38 1.65 0.36 75 1.66 0.39 75 1.45 0.54 Usefulness SD 39 1.40 0.43 77 1.35 0.45 76 1.23 0.55 Willingness to Recommend LS 75 4.93 0.79 76 5.38 0.80 74 5.34 0.73 Willingness to Pay LS 76 3.40 1.13 77 3.09 1.22 77 3.17 1.17 Willingness to Purchase LS 37 3.89 1.15 77 4.14 1.25 77 4.01 1.41 Note. The maximum available sample (N) is analyzed for each variable after outlier exclusion. N may be smaller when testing relationships between two variables in an analysis. Therefore, key descriptive statistics are repeated for the final N used in the analyses (e.g., section 4.2.1). LS 6-point Likert Scale, SD Semantic Differential from -2 to 2 according to Van der Laan et al. (1997). 4.2.1 Perception and experience with an EV (H2) Results of analyses of General Perception of EVs indicated that the evaluation of EVs was positive at all data collection points (Table 4). A repeated measures ANOVA revealed a significant experience effect for General Perception, F(2, 134) = 10.85, p = .000, η2p = .14. Post hoc tests (Bonferroni) showed that participants
112 • Paper II perceived EVs less positively before receiving the car than after 3 months of experience, M = -.324, p < .001, or 6 months, M = -.279, p = .002. The difference between General Perception of EVs at T1 and T2 was not significant. The results support hypothesis H2 which proposes that EV-experienced drivers perceived EVs in a more positive way. 4.2.2 Attitudes and experience with an EV (H3) Data obtained from the Van der Laan Acceptance Scale (Van der Laan et al., 1997) showed that users judge the EV as satisfying and useful at all data collection points (Table 4). For the repeated measures ANOVA, only data from the second study period were analyzed, because the first study period data were not collected at all measurement points. Participants in the second study evaluated the test vehicle as satisfying, T0: M = 1.65, SD = 0.36; T1: M = 1.62, SD = 0.37; T2: M = 1.55, SD = 0.42, and useful, T0: M = 1.40, SD = 0.43; T1: M = 1.30, SD = 0.44; T2: M = 1.30, SD = 0.50, at all points of data collection, but Usefulness and Satisfaction slightly decreased. Results of a repeated measures ANOVA did not reveal a significant experience effect for Satisfaction, F(2, 74) = 1.31, p = .277, η2p = .03, or Usefulness, F(2, 76) = 1.22, p = .300, η2p = .03, and did not support hypothesis H3. When analyzing the whole sample, Satisfaction and Usefulness correlated strongly with each other, T0: r = .55, p < .001; T1: r = .62, p < .001; T2: r = .82, p < .001. 4.2.3 Intention to recommend and experience with an EV (H4) Participants willingness to recommend EVs like the MINI E to friends (WTrecommend) increased over time (Figure 2). A repeated measures ANOVA revealed a significant experience effect, F(2, 142) = 15.38, p < .001, η2p = .18. A post hoc test (Bonferroni) showed that the difference between T0 and T1 was significant, M = -.486, p < .001. Additionally, the increase in Willingness to Recommend an EV between T0 and T2 was significant, M = -.403, p < .001. No significant difference was observed between T1 and T2. These results support hypothesis H4. 4.2.4 Purchase intentions and experience with an EV (H5) In addition to intention to recommend, purchase intentions were assessed. Willingness to Pay (WTpay) was relatively low and decreased somewhat over time (Figure 2). Participants more frequently endorsed the statement that they were willing to purchase (WTpurchase) an EV after the study (Figure 2). Forty percent
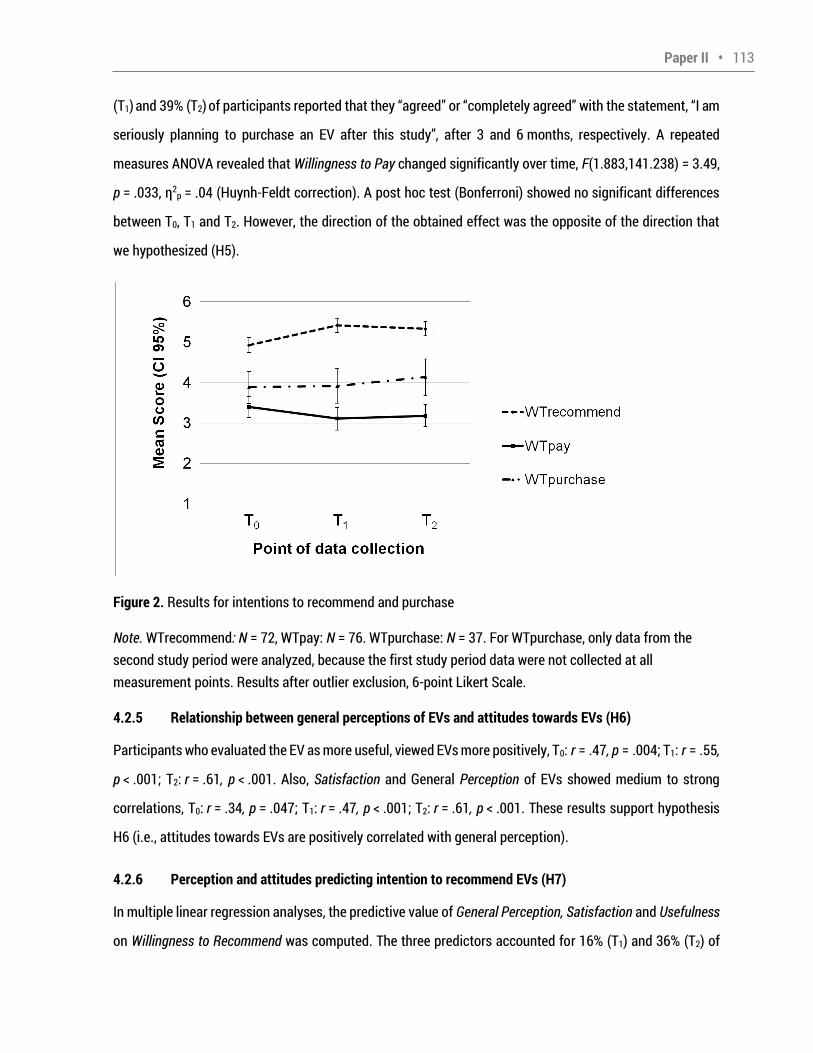
Paper II • 113 (T1) and 39% (T2) of participants reported that they agreed or completely agreed with the statement, I am
seriously planning to purchase an EV after this study , after 3 and 6 months, respectively. A repeated measures ANOVA revealed that Willingness to Pay changed significantly over time, F(1.883,141.238) = 3.49, p = .033, η2p = .04 (Huynh-Feldt correction). A post hoc test (Bonferroni) showed no significant differences between T0, T1 and T2. However, the direction of the obtained effect was the opposite of the direction that we hypothesized (H5). Figure 2. Results for intentions to recommend and purchase Note. WTrecommend: N = 72, WTpay: N = 76. WTpurchase: N = 37. For WTpurchase, only data from the second study period were analyzed, because the first study period data were not collected at all measurement points. Results after outlier exclusion, 6-point Likert Scale. 4.2.5 Relationship between general perceptions of EVs and attitudes towards EVs (H6) Participants who evaluated the EV as more useful, viewed EVs more positively, T0: r = .47, p = .004; T1: r = .55, p < .001; T2: r = .61, p < .001. Also, Satisfaction and General Perception of EVs showed medium to strong correlations, T0: r = .34, p = .047; T1: r = .47, p < .001; T2: r = .61, p < .001. These results support hypothesis H6 (i.e., attitudes towards EVs are positively correlated with general perception). 4.2.6 Perception and attitudes predicting intention to recommend EVs (H7) In multiple linear regression analyses, the predictive value of General Perception, Satisfaction and Usefulness on Willingness to Recommend was computed. The three predictors accounted for 16% (T1) and 36% (T2) of
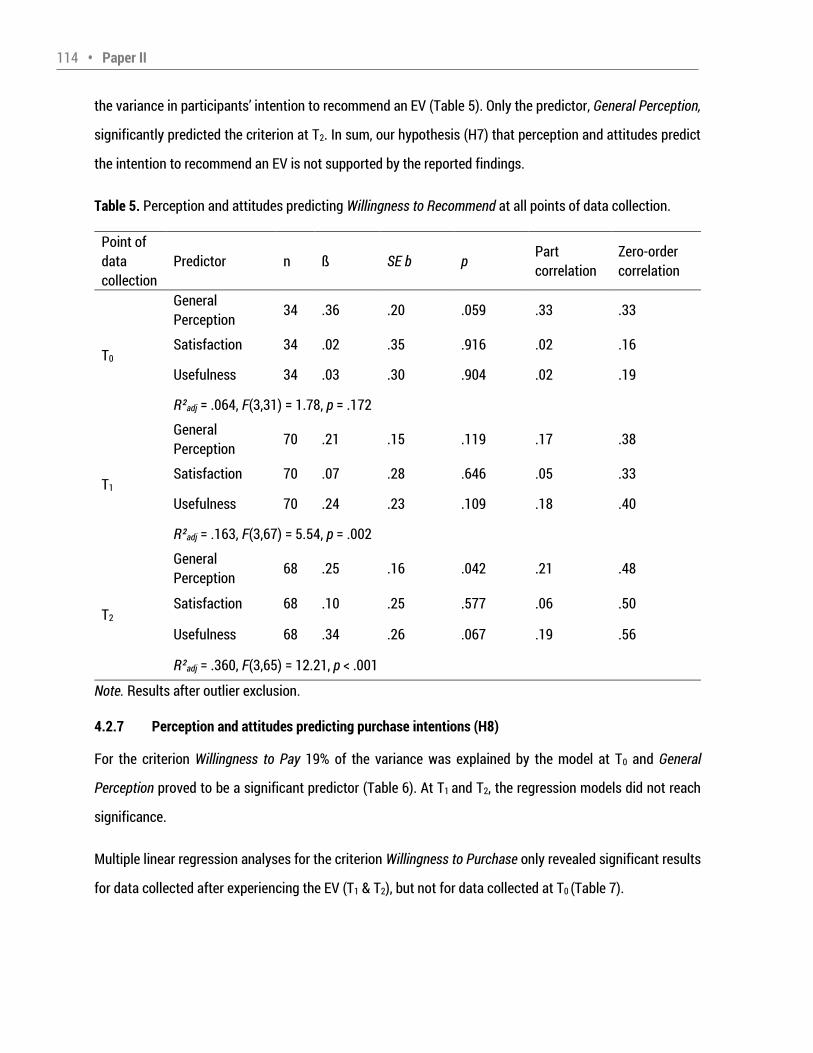
114 • Paper II the variance in participants intention to recommend an EV (Table 5). Only the predictor, General Perception, significantly predicted the criterion at T2. In sum, our hypothesis (H7) that perception and attitudes predict the intention to recommend an EV is not supported by the reported findings. Table 5. Perception and attitudes predicting Willingness to Recommend at all points of data collection. Point of data collection Predictor n ß SE b p Part correlation Zero-order correlation T0 General Perception 34 .36 .20 .059 .33 .33 Satisfaction 34 .02 .35 .916 .02 .16 Usefulness 34 .03 .30 .904 .02 .19 R²adj = .064, F(3,31) = 1.78, p = .172 T1 General Perception 70 .21 .15 .119 .17 .38 Satisfaction 70 .07 .28 .646 .05 .33 Usefulness 70 .24 .23 .109 .18 .40 R²adj = .163, F(3,67) = 5.54, p = .002 T2 General Perception 68 .25 .16 .042 .21 .48 Satisfaction 68 .10 .25 .577 .06 .50 Usefulness 68 .34 .26 .067 .19 .56 R²adj = .360, F(3,65) = 12.21, p < .001 Note. Results after outlier exclusion. 4.2.7 Perception and attitudes predicting purchase intentions (H8) For the criterion Willingness to Pay 19% of the variance was explained by the model at T0 and General Perception proved to be a significant predictor (Table 6). At T1 and T2, the regression models did not reach significance. Multiple linear regression analyses for the criterion Willingness to Purchase only revealed significant results for data collected after experiencing the EV (T1 & T2), but not for data collected at T0 (Table 7).
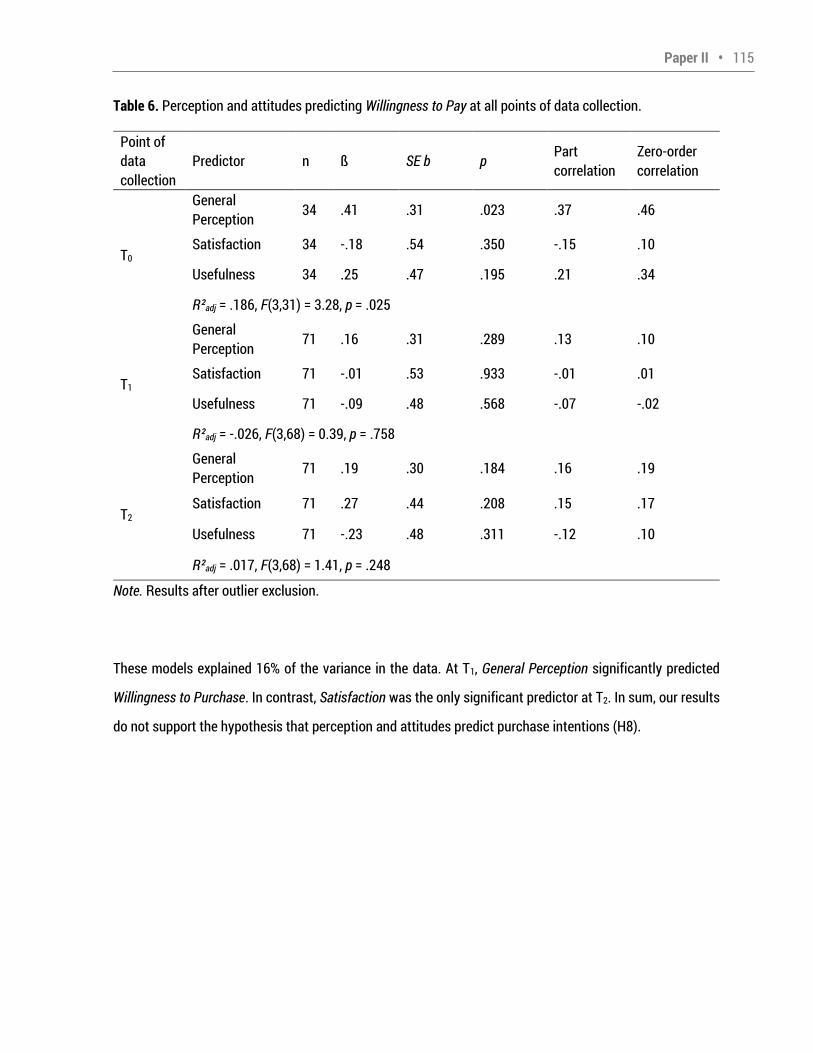
Paper II • 115 Table 6. Perception and attitudes predicting Willingness to Pay at all points of data collection. Point of data collection Predictor n ß SE b p Part correlation Zero-order correlation T0 General Perception 34 .41 .31 .023 .37 .46 Satisfaction 34 -.18 .54 .350 -.15 .10 Usefulness 34 .25 .47 .195 .21 .34 R²adj = .186, F(3,31) = 3.28, p = .025 T1 General Perception 71 .16 .31 .289 .13 .10 Satisfaction 71 -.01 .53 .933 -.01 .01 Usefulness 71 -.09 .48 .568 -.07 -.02 R²adj = -.026, F(3,68) = 0.39, p = .758 T2 General Perception 71 .19 .30 .184 .16 .19 Satisfaction 71 .27 .44 .208 .15 .17 Usefulness 71 -.23 .48 .311 -.12 .10 R²adj = .017, F(3,68) = 1.41, p = .248 Note. Results after outlier exclusion. These models explained 16% of the variance in the data. At T1, General Perception significantly predicted Willingness to Purchase. In contrast, Satisfaction was the only significant predictor at T2. In sum, our results do not support the hypothesis that perception and attitudes predict purchase intentions (H8).
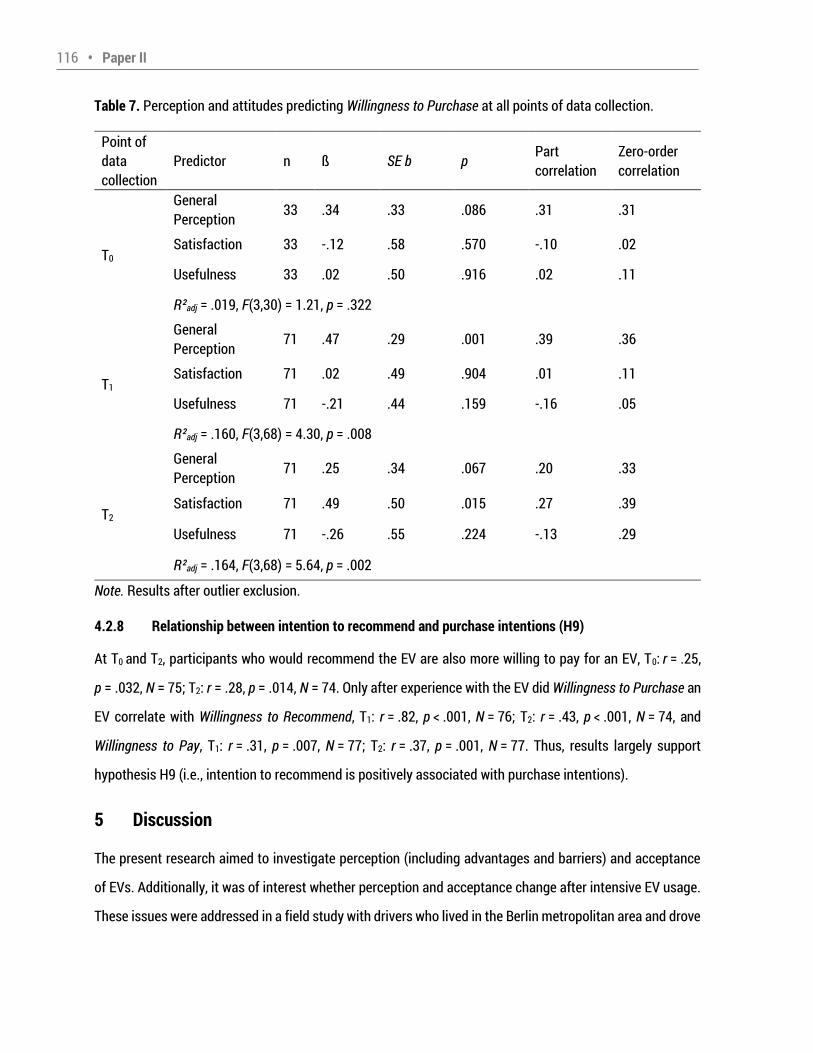
116 • Paper II Table 7. Perception and attitudes predicting Willingness to Purchase at all points of data collection. Point of data collection Predictor n ß SE b p Part correlation Zero-order correlation T0 General Perception 33 .34 .33 .086 .31 .31 Satisfaction 33 -.12 .58 .570 -.10 .02 Usefulness 33 .02 .50 .916 .02 .11 R²adj = .019, F(3,30) = 1.21, p = .322 T1 General Perception 71 .47 .29 .001 .39 .36 Satisfaction 71 .02 .49 .904 .01 .11 Usefulness 71 -.21 .44 .159 -.16 .05 R²adj = .160, F(3,68) = 4.30, p = .008 T2 General Perception 71 .25 .34 .067 .20 .33 Satisfaction 71 .49 .50 .015 .27 .39 Usefulness 71 -.26 .55 .224 -.13 .29 R²adj = .164, F(3,68) = 5.64, p = .002 Note. Results after outlier exclusion. 4.2.8 Relationship between intention to recommend and purchase intentions (H9) At T0 and T2, participants who would recommend the EV are also more willing to pay for an EV, T0: r = .25, p = .032, N = 75; T2: r = .28, p = .014, N = 74. Only after experience with the EV did Willingness to Purchase an EV correlate with Willingness to Recommend, T1: r = .82, p < .001, N = 76; T2: r = .43, p < .001, N = 74, and Willingness to Pay, T1: r = .31, p = .007, N = 77; T2: r = .37, p = .001, N = 77. Thus, results largely support hypothesis H9 (i.e., intention to recommend is positively associated with purchase intentions). 5 Discussion The present research aimed to investigate perception (including advantages and barriers) and acceptance of EVs. Additionally, it was of interest whether perception and acceptance change after intensive EV usage. These issues were addressed in a field study with drivers who lived in the Berlin metropolitan area and drove
Paper II • 117 an EV for 6 months. Seventy-nine users who had the opportunity to experience an EV in their daily life for 6 months were studied. 5.1 Perceived Advantages of and Barriers to EV acceptance A major aim of the present study was to examine which advantages and barriers EV users perceive (Q1a). Furthermore, it was of interest whether these perceptions change over time and if changes in reports of experiential advantages and barriers are more likely to be positive (Q1b). EV drivers perceive a variety of advantages. In sum, nine main categories (e.g., environmental friendliness, low noise) emerged through our analyses that partially reflect the expected advantages, as well as the perceived positive features (i.e., advantages) reported by Graham-Rowe et al. (2012). They could be categorized into experiential advantages (i.e., advantages that could be directly experienced) (e.g., low noise emission) and more abstract or non-experiential advantages (e.g., environmental friendliness). Most experiential advantages, including low noise emission, pleasant driving, fun, refueling costs, as well as the opportunity to refuel at home were mentioned much more frequently after users gained experience using their EV. Results revealed that after experiencing an EV, some non-experiential advantages became even less relevant. Thus, environmental benefits of EVs became less important over time, which is contrary to findings from Gould and Golob (1998). The decrease in the number of EV users reporting the usage of renewable energy sources as an advantage also became apparent. Still, compared to other countries, MINI E drivers in Germany were more likely to report that charging with renewable energy played an important role in their evaluation of the vehicle (Vilimek et al., 2012). Regarding barriers, the ten identified main categories included most of the concerns reported in previous studies (e.g., Carroll, 2010; Graham-Rowe et al., 2012). Many EV users changed their opinion on experiential barriers after using the EV; charging duration and infrastructure, battery issues and low noise level were less frequently reported as barriers after experiencing the EV. Another experiential barrier that was quite specific to the test vehicle was limited space. It was perceived as a barrier by many more participants after experiencing the EV. However, in newer vehicles, batteries are integrated in ways that require less space; thus, this disadvantage is likely to become much less salient in the near future. However, several experiential barriers were not significantly influenced by experience. Limited range, for instance, remained a highly relevant barrier over the course of the study. Therefore, our data does not support the findings of Jensen et
118 • Paper II al. (2013), which showed that the importance of range increases after testing an EV, as our data suggest that it remains stable. Research indicates that daily range practice has a positive impact on the efficiency of users interaction with range (Franke & Krems, 2013a), but this does not seem to influence the perception of range, as it remains a major barrier for acceptance even after gaining substantial experience with an EV. It still remains unclear, however, whether experienced users endorsed as a barrier because of direct personal experience with limited range or because of a general intellectual understanding of range limitations in EVs. The results regarding space and range match with EV manufacturers goals of reducing battery size, while simultaneously enlarging space and increasing range. Today, many EVs on the market have higher space capacity, and therefore, should already be more suitable for daily use. Alike Pearre, Kempton, Guensler, and Elango (2011) we expect that battery range is likely to improve in the future; thus, this barrier will become less significant than has been observed here. Additionally, one could argue, according to Franke, Neumann, Cocron, Bühler and Krems (2012), that training drivers to achieve better utilization of limited mobility resources in EVs might help to bridge the gap until more advanced batteries become available. To overcome the range barrier at the present time, EV manufacturers also offer free rental cars for a few days per year for long trips that exceed the EV range. Charging is closely related to range. One finding from our study is that under the present study s conditions (i.e., home charging station with 32 A fuse, 4-h charging duration), charging duration became less of a barrier with increasing experience and home charging was even described as an advantage after the EV was integrated into daily life. These results are consistent with the findings of Turrentine et al. (2011). A sample of US drivers enjoyed charging at home and evaluated the charging time as adequate. In sum, we have observed that EV charging is suitable for daily life if drivers have access to personal (i.e., home-based) charging infrastructure. Still, under other circumstances, experience might have the opposite effect. For instance, experience might negatively influence EV users who do not have access to personal charging infrastructure, because of the inconvenience of relying on public recharging stations. Perceptions of several reported barriers that could not have been directly experienced while driving an EV (referred to in this paper as non-experiential barriers) were also investigated. For example, availability of
EVs on the market remained unchanged over the course of the study. In contrast, acquisition costs and perceived societal resistance to change were less frequently reported as barriers after experiencing an EV. Still, acquisition costs were an often reported barrier. In Norway, other benefits (e.g., no purchase tax, free
Paper II • 119 parking, free ferry usage), in addition to cheaper running costs, are provided by the government to compensate for the high purchase price of EVs. At the same time, EVs are also more successful on the Norwegian market than in many other European markets. Notably, low noise level is seen more as an advantage than as a barrier. Specifically, after driving an EV for a longer time, this particular EV characteristic was perceived very favorably. Additionally, none of the EV-experienced drivers described it exclusively as barrier; however, some participants were ambivalent and endorsed this special feature of EVs as both an advantage and a safety problem. This might be considered in the debate regarding sound generators for EVs. A detailed account of the advantages and disadvantages of driving a silent EV in urban traffic as well as the influence of experience on drivers evaluation of low noise can be found in Cocron and Krems (2013). Although safety issues still need to be addressed, it should be taken into account that this feature could impact the market success of EVs. Overall, in our study experience affects potential consumers perception of the advantages and barriers of EVs; however, advantages do not become barriers or vice versa. Moreover, it seems to be the case that experiential advantages (e.g., low noise, fun) and barriers (e.g., charging duration) were of higher relevance and more positively evaluated respectively (i.e., advantages are strengthened, barriers are weakened) after gaining direct experience with an EV. These findings have several different implications. Providing EV experience could serve as a promising strategy for marketing EVs. This is consistent with Burgess et al. (2013), who argued that first-hand experience could change consumers perception of EV performance. Notably, the test EV that we provided was quite agile relative to other available EV models. Thus, this result might not generalize to different EV models. However, even if positive perceptions of the EV driving experience do not generalize to other currently available EVs, this finding could have potential implications for the design and marketing of future EVs. 5.2 Perceptions, attitudes, intention to recommend, and purchase intentions We evaluated how the current state of EV technology is perceived and accepted (Q2a) and whether perceptions and acceptance change after experiencing an EV (Q2b). At all data collection times, the general perception of EVs including, for instance, suitability for daily life, was quite positive. Consistent with Carroll (2010), experience had a favorable impact on user opinions; participants general perception of EVs was even more positive after gaining experience.
120 • Paper II Data obtained from the Van der Laan acceptance scale (Van der Laan et al., 1997) revealed that participants highly valued Usefulness and Satisfaction of the EV at all data collection points. Scores remained high throughout the study and no experience effects were detected. Given these results, it appears that current EV technology already meets the expectations of users, is judged to be satisfactory in everyday life, and experience does not influence these attitudes. Notably, it is very likely that our sample is more comparable to a population of early adopters, and therefore, might not be representative of the general population of potential consumers. Nevertheless, early adopters may be crucial for widespread acceptance of new technology, a topic that will be discussed in more detail later, and the positive evaluation observed here indicates that the development of EVs is trending in the right direction. This research also examined several behavioral indicators of EV acceptance. As a whole, the sample was willing to recommend EVs and this intention even increased after experiencing the EV. Regarding purchase intentions, participants in this sample exhibited considerable variability, and EV experience had little impact on intentions. However, at all data collection points, between 13% and 27% of the sample were willing to spend more money for an EV than a conventional car. Even more participants (around 40%) endorsed that they were ready to purchase an EV. These results are comparable to those found in previous studies conducted with samples of EV-experienced drivers (e.g., Jabeen et al., 2012). Although the intention to recommend and purchase might be overestimated here because our sample most likely consisted of early adopters, these results are notable as they indicate that current EV technology is already acceptable for some potential consumers. Another behavioral indicator of acceptance of EVs is the usage intensity after receiving an EV. In this study, considerable effort was made to collect usage data. However, for the present research, data quality was insufficient due to technical problems and multiple potential confounding factors that could not be controlled. Because we had to exclude many participants from analyses, it was not possible to make valid conclusions about usage intensity and changes over time. Thus, usage data are not reported here. Regarding Q3, our results reveal that there is no association between general perception and the various indicators of acceptance investigated here, a finding that does not support our conceptual model (Figure 1). More positive perceptions of, and attitudes towards, EVs does not predict higher intention to recommend or purchase an EV. Several researchers (e.g., Ajzen, 1991) have shown that attitudes and behavioral intentions
Paper II • 121 tend to be rather unreliable predictors of enacted behavior and that other factors (e.g., subjective norms and perceived behavioral control) might also influence the relationship. Furthermore, the possibility of a significant relationship is higher if attitudes and behavioral assessments correspond in their levels of
specificity (Kraus, 1995). Given that the major objective of the present research was to show how EVs are perceived and accepted, we required scales that assess more general EV evaluations and behavioral indicators. Investigation of the factors that influence EV purchase behavior was beyond the scope of the present research, but is of high interest for future investigations. In sum, participants were given 6 months to experience many of the positive and negative aspects of living with and driving an EV. We were able to demonstrate that experience with EVs influences users evaluation of EVs. Previous research has demonstrated the effect of experience on a variety of specific domains, including interaction with range (Franke & Krems, 2013), usage of regenerative braking (Cocron et al., 2013), perception of acoustics (Cocron & Krems, 2013) and driver interface (Neumann, Franke, Cocron, Bühler, & Krems, 2013). The present study builds on this work by showing the effect of experience on a more global level EV acceptance. Although our sample is not representative of the population of German car owners and likely consists of a higher percentage of early adopters (Rogers, 2010), our findings have important implications for the potential widespread adoption of EVs. Satisfaction of early adopters seems to be an important pre-requisite for general acceptance of EVs. For instance, early adopters could influence others via word-of-mouth or incidentally promote emulation while using their EV (Rogers, 2010). If early adopters perceive barriers after experiencing the EV and are skeptical of the product, it is important to improve the characteristics of the product. According to Rogers (2010), a product will have a high probability of success when innovators and early adopters, approximately 16% of the potential market, accept the product. 5.3 Comparing qualitative and quantitative results The combination of qualitative and quantitative results provides interesting information. When taking all perception results (i.e., advantages, barriers, general perception of EVs) into account, we can conclude that shortly after gaining experience with an EV, the perception of many EV features is positively influenced. Findings from Burgess et al. (2013) emphasize the importance of real-life experience. This supports our assertion in section 5.1 that giving potential EV consumers the opportunity to test an EV might be a
122 • Paper II promising means for supporting EV acceptance, and thereby, the expansion of the EV market. Direct experience can help to overcome consumers misconceptions which may be based on older EV models (e.g.,
slow, strange design, embarrassing). Burgess et al. (2013) referred to these perceptions as the traditional
view . When combining quantitative and qualitative data, another interesting point comes to light. The EV was perceived positively (e.g., suitable for daily life) and evaluated as useful and satisfying, even though several barriers like limited range were still reported. The negative evaluation of range and other barriers could be one potential explanation for the discrepancy between attitudes and intention to recommend or purchase. 5.4 Implications for future research As stated earlier, our sample consists of urban residents with the opportunity to charge at home and who are early adopters of EVs. It would be interesting to determine if our results would generalize to a sample that is more representative of the population of German car owners. Early adopters experiences, perceived barriers and suggestions for improvements serve as an important first step. The next step is to determine how users living under other circumstances (e.g., users who do not have access to private charging infrastructure) perceive and accept EVs, whether experience also affects them in similar ways, and what level of experience is necessary to change their EV-related perceptions. Additionally, countries that have moved beyond the early adopter stage should be investigated. In Germany, encountering an EV on the road is still a noteworthy event. In comparison, in countries like Norway where the EV market is more mature, EVs are already highly integrated into the driving culture. According to Burgess et al. (2013), mere exposure to EVs can positively influence consumers perceptions and attitudes. Thus, it is of interest whether direct EV experience for an extended period of time still has a positive effect on non-EV drivers perceptions of EVs in such countries. Furthermore, the 6-month test period offered in this study is relatively long and is likely not an economically viable business strategy. Realistically, potential consumers might be allowed to test an EV for approximately one day. It has not yet been investigated whether this relatively short test duration leads to changes in consumers evaluation of EVs.
Paper II • 123 6 Conclusion The present research explores EV drivers acceptance of current EV technology and the impact that real-life experience has on perception and acceptance of EVs. Experience can significantly change perception of the EV s advantages and barriers in both positive and negative directions depending on the specific type of advantage or barrier. Our findings reveal that currently available EVs are already acceptable and suitable for daily life in urban areas, provided that a home charging station and a second car are available. However, for widespread market success, solutions are still needed to overcome important barriers such as limited range and acquisition costs. On the other hand, widespread adoption of EVs might be supported if features such as the fun factor and low noise are retained in future EV designs. In addition to technological solutions, some new marketing strategies are required to demonstrate that EVs have favorable characteristics beyond the environmental benefits. These strategies could also target misconceptions related to EVs and societal resistance to change. Given these goals, first-hand experience seems to be a promising strategy. Acknowledgements The present study is funded by the German Federal Ministry for the Environment, Nature Conservation and Nuclear Safety. Statements in this paper reflect the authors views and do not necessarily reflect those of the German Federal Ministry for the Environment, Nature Conservation and Nuclear Safety or of other partners involved in the project. We thank our consortium partners BMW Group (Dr. J. Weber, Dr. A. Keinath and Dr. R. Vilimek) and Vattenfall Europe AG (A. Weber, F. Schuth, Dr. C.-F. Eckhardt) who gave us the opportunity to conduct our research.
124 • Paper II References Achtnicht, M., Bühler, G., & Hermeling, C. (2012). The impact of fuel availability on demand for alternative-fuel vehicles. Transportation Research: Part D: Transport and Environment, 17(3), 262-269. Ajzen, I. (1991). The theory of planned behavior. Organizational Behavior and Human Decision Processes, 50(2), 179-211. Burgess, M., King, N., Harris, M., & Lewis, E. (2013). Electric vehicle drivers' reported interactions with the public: Driving stereotype change?. Transportation Research Part F: Traffic Psychology and Behaviour, 17(0), 33-44. Carroll, S. (2010). The Smart Move trial: description and initial results. Loughborough, UK: Centre of excellence for low carbon and fuel cell technologies, Smartmove-10-010. Cocron, P., Bühler, F., Franke, T., Neumann, I., Dielmann, B., & Krems, J. F. (2013). Energy recapture through deceleration regenerative braking in electric vehicles from a user perspective. Ergonomics 56(8), 1203-1215. Cocron, P., Bühler, F., Neumann, I., Franke, T., Krems, J. F., Schwalm, M., et al. (2011). Methods of evaluating electric vehicles from a user's perspective - The MINI e field trial in Berlin. IET Intelligent Transport Systems, 5(2), 127-133. Cocron, P., & Krems, J. F. (2013). Silent driving in urban traffic - results of two field studies on electric vehicles. Accident Analysis and Prevention, 58, 122-131. Dagsvik, J. K., Wennemo, T., Wetterwald, D. G., & Aaberge, R. (2002). Potential demand for alternative fuel vehicles. Transportation Research Part B: Methodological, 36(4), 361-384. Egbue, O., & Long, S. (2012). Barriers to widespread adoption of electric vehicles: An analysis of consumer attitudes and perceptions. Energy Policy, 48(0), 717-729. Elliott, R., Fischer, C. T., & Rennie, D. L. (1999). Evolving guidelines for publication of qualitative research studies in psychology and related fields. British Journal of Clinical Psychology, 38(3), 215-229. European Commission (2012). Road transport: Reducing CO2 emissions from vehicles Retrieved 08th Febr, 2013, from http://ec.europa.eu/clima/policies/transport/vehicles/index_en.htm Ewing, G. O., & Sarigöllü, E. (1998). Car fuel-type choice under travel demand management and economic incentives. Transportation Research Part D: Transport and Environment, 3(6), 429-444. Federal Ministry for the Environment, Nature Conversation and Nuclear Safety. Kyoto Protocol Retrieved 08th Febr, 2013, from http://www.bmu.de/en/topics/climate-energy/climate/international-climate-policy/kyoto-protocol/ Field, A. (2013). Discovering Statistics using IBM SPSS Statistics (4th ed.). Sage Publications. Franke, T., & Krems, J. F. (2013a). Interacting with limited mobility resources: Psychological range levels in electric vehicle use. Transportation Research Part A: Policy and Practice, 48(0), 109-122. Franke, T., & Krems, J. F. (2013b). What drives range preferences in electric vehicle users?. Transport Policy, 30, 56-62.
Paper II • 125 Franke, T., Neumann, I., Bühler, F., Cocron, P., & Krems, J. F. (2012). Experiencing Range in an Electric Vehicle: Understanding Psychological Barriers. Applied Psychology, 61(3), 368-391. Gärling, A., & Johansson, A. (1999). An EV in the family. Göteborg: Department of Road and Traffic Planning. Chalmers University of Technology: Göteborg. Gould, J., & Golob, T. F. (1998). Clean air forever? A longitudinal analysis of opinions about air pollution and electric vehicles. Transportation Research Part D: Transport and Environment, 3(3), 157-169. Graham-Rowe, E., Gardner, B., Abraham, C., Skippon, S., Dittmar, H., Hutchins, R., et al. (2012). Mainstream consumers driving plug-in battery-electric and plug-in hybrid electric cars: A qualitative analysis of responses and evaluations. Transportation Research Part A: Policy and Practice, 46(1), 140-153. Green, S. B., & Salkind, N. J. (2003). Using Spss for Windows and Macintosh: Analyzing and Understanding Data (3 ed.). Upper Saddle River: Prentice Hall. Grubbs, F. E. (1969). Procedures for detecting outlying observations in samples. Technometrics, 11(1), 1-21. Hacker, F., Harthan, R., Matthes, F., & Zimmer, W. (2009). Environmental Impacts and Impact on the Electricity Market of a Large Scale Introduction of Electric Cars in Europe - Critical Review of Literature (ETC/ACC Technical Paper). Copenhagen: European Topic Centre on Air and Climate Change. Retrieved from EIONET - European Topic Centre on Air Pollution and Climate Change Mitigation website: http://acm.eionet.europa.eu/docs/ETCACC_TP_2009_4_electromobility.pdf Hawkins, T. R., Singh, B., Majeau-Bettez, G., & Strømman, A. H. (2012). Comparative environmental life cycle assessment of conventional and electric vehicles. Journal of Industrial Ecology. 17(1), 53-64. Hidrue, M. K., Parsons, G. R., Kempton, W., & Gardner, M. P. (2011). Willingness to pay for electric vehicles and their attributes. Resource and Energy Economics, 33(3), 686-705. Higgins, A., Paevere, P., Gardner, J., & Quezada, G. (2012). Combining choice modelling and multi-criteria analysis for technology diffusion: An application to the uptake of electric vehicles. Technological Forecasting and Social Change, 79(8), 1399-1412. Hoeffler, S. (2003). Measuring Preferences for Really New Products. Journal of Marketing Research, 40(4), 406-420. infas, & DLR (2010). Mobilität in Deutschland: Ergebnisbericht [Mobility in Germany: results report] (Report). Retrieved from: http://mobilitaet-in-deutschland.de/02_MiD2008/publikationen.htm Jabeen, F., Olaru, D., Smith, B., Braunl, T., & Speidel, S. (2012). Acceptability of electric vehicles: findings from a driver survey, Proceeding of the ATRF (Australasian Transport Research Forum), Sep. 2012, Perth, Australia. Retrieved 8th Febr, 2013, from http://www.atrf.info/papers/2012/2012_Jabeen_Olaru_Smith_Braunl_Speidel.pdf. Jensen, A. F., Cherchi, E., & Mabit, S. L. (2013). On the stability of preferences and attitudes before and after experiencing an electric vehicle. Transportation Research Part D: Transport and Environment, 25, 24-32. King, D. (Ed.). (2010). Future of Mobility Roadmap - Ways to reduce emissions while keeping mobile.
126 • Paper II Kraus, S. J. (1995). Attitudes and the Prediction of Behavior: A Meta-Analysis of the Empirical Literature. Personality and Social Psychology Bulletin, 21(1), 58-75. Krems, J. F., Weinmann, O., Weber, J., Westermann, D., & Albayrak, S. (Eds.). (2013). Elektromobilität in Metropolregionen: Die Feldstudie MINI E Berlin powered by Vattenfall [Emobility in metropolitan areas: the field study MINI E Berlin powered by Vattenfall] (Vol. 12). Düsseldorf: VDI Verlag. Kuwano, M., Tsukai, M., & Matsubara, T. (2012). Analysis on promoting factors of electric vehicles with social conformity. Paper presented at the 13th International Conference on Travel Behaviour Research, Toronto, Canada. Landis, J. R., Koch, G. G. (1977). The measurement of observer agreement for categorical data. Biometrics, 33, 159-174. Lieven, T., Mühlmeier, S., Henkel, S., & Waller, J. F. (2011). Who will buy electric cars? An empirical study in Germany. Transportation Research Part D: Transport and Environment, 16(3), 236-243. Mayring, P. (2000). Qualitative content analysis. Forum: Qualitative Social Research, 1(2), Art. 20. Retrieved 08th Febr, 2013, from http://nbn-resolving.de/urn:nbn:de:0114-fqs0002204. Neumann, I., Cocron, P., Franke, T., & Krems, J.F. (2010). Electric vehicles as a solution for green driving in the future? A field study examining the user acceptance of electric vehicles. In J.F. Krems, T. Petzoldt & M. Henning (Eds.). Proceedings of the European Conference on Human Centred Design for Intelligent Transport Systems, Berlin, Germany, April 29-30 2010 (p. 445-453). Lyon: Humanist Publications. Neumann, I., Franke, T., Cocron, P., Bühler, F., & Krems, J. F. (2013). Electrification of transportation – implications for the driver interface of electric vehicles. Manuscript submitted for publication. Pearre, N. S., Kempton, W., Guensler, R. L., & Elango, V. V. (2011). Electric vehicles: How much range is required for a day's driving?. Transportation Research Part C: Emerging Technologies, 19(6), 1171-1184. Reichheld, F. F. (2003). The one number you need to grow. Harvard business review, 81(12), 46-55. Reichheld, F. F. (2006). The ultimate question: For unlocking the door to good profits and true growth. Cambridge, MA: Harvard Business School Press. Rogers, E. M. (2010). Diffusion of innovations (5th ed.). New York: Free Press. Schade, J., & Schlag, B. (2003). Acceptability of urban transport pricing strategies. Transportation Research Part F: Traffic Psychology and Behaviour, 6(1), 45-61. Skippon, S., & Garwood, M. (2011). Responses to battery electric vehicles: UK consumer attitudes and attributions of symbolic meaning following direct experience to reduce psychological distance. Transportation Research Part D: Transport and Environment, 16(7), 525-531. Smith, R. E., & Swinyard, W. R. (1983). Attitude-Behavior Consistency: The Impact of Product Trial Versus Advertising. Journal of Marketing Research, 20(3), 257-267. Turrentine, T., Garas, D., Lentz, A., & Woodjack, J. (2011). The UC Davis MINI E Consumer Study.
Paper II • 127 Urban, D., & Mayerl., J. (2008). Regressionsanalyse: Theorie, Technik und Anwendung [Regression analysis: theorry, technique and use] (3rd ed.). Wiesbaden: VS Verlag für Sozialwissenschaften | GWV Fachverlage GmbH. Urban, G. L., Weinberg, B. D., & Hauser, J. R. (1996). Premarket forecasting of really new products. Journal of Marketing, 60(1), 47-60. Van der Laan, J. D., Heino, A., & De Waard, D. (1997). A simple procedure for the assessment of acceptance of advanced transport telematics. Transportation Research Part C: Emerging Technologies, 5(1), 1-10. Vilimek, R., Keinath, A., & Schwalm, M. (2012). The MINI E Field Study - Similarities and Differences in International Everyday EV Driving. In N. A. Stanton (Ed.), Advances in Human Aspects of Road and Rail Transportation (pp. 363-372 ). Boca Raton, Florida: Crc Press Inc. Vlassenfort, S., Brookhuis, K., Marchau, V., & Witlox, F. (2010). Towards defining a unified concept of acceptability of Intelligent Transport Systems (IST): A conceptual analysis based on the case of Intelligent Speed Adaptation (ISA). Transportation Research Part F: Traffic Psychology and Behaviour, 13, 164-178. Wietschel, M., Dütschke, E., Schneider, U., Plötz, P., Peters, A., Roser, A., et al. (2012). Kaufpotenzial für Elektrofahrzeuge bei so genannten » Early Adoptern « [purchasing potential of electric vehicles for so called »early adopters«], Karlsruhe: Fraunhofer ISI. Retrieved 08th Febr, 2013, from http://publica.fraunhofer.de/eprints/urn:nbn:de:0011-n-2070344.pdf. Ziegler, A. (2012). Individual characteristics and stated preferences for alternative energy sources and propulsion technologies in vehicles: A discrete choice analysis for Germany. Transportation Research Part A: Policy and Practice, 46(8), 1372-1385.

128 • Paper II
Paper III • 129 Paper III Direct experience with battery electric vehicles (BEVs) matters when evaluating vehicle attributes, attitude and purchase intention Citation: Schmalfuß, F., Mühl, K., & Krems, J. F. (2017). Direct experience with battery electric vehicles (BEVs) matters when evaluating vehicle attributes, attitude and purchase intention, Transportation Research Part F: Traffic Psychology and Behaviour, 46(A), 47 69, http://dx.doi.org/10.1016/j.trf.2017.01.004.
130 • Paper III DIRECT EXPERIENCE WITH BATTERY ELECTRIC VEHICLES (BEVS) MATTERS WHEN EVALUATING VEHICLE ATTRIBUTES, ATTITUDE AND PURCHASE INTENTION Franziska Schmalfuß*, Kristin Mühl+, Josef F. Krems* * Technische Universität Chemnitz, 09107 Chemnitz, Germany + Ulm University, 89081 Ulm, Germany Abstract Battery electric vehicles (BEVs) can contribute to the realization of more sustainable mobility systems. The actual adoption rate however of BEVs in Germany remains low, and strategies for enhancing BEV acceptance are required. Providing direct experience can, for instance, help to overcome prejudices relating to relatively new products, with this being a potential marketing strategy. The present research contributes to the question of what role direct experience plays in acceptance of BEVs. Two studies were conducted to address the relationship between these variables: (1) an online survey (N = 286) and (2) a 24-hour field test (N = 30). Both studies showed several experience-based differences in evaluations of BEV attributes, attitude and purchase intention, with most BEV attributes being evaluated more positively when people had BEV experience. Path analyses revealed a direct experience effect on purchase intention in the online study. Findings from the 24-hours field test, showed effects of BEV experience on BEV attributes and attitudes, but no BEV experience effect for purchase intention was found. Based on the results of both studies, we can conclude that practical (and also short-term) experience with BEVs has the potential to change the evaluation of BEVs and psychological factors relevant for determining behavioral intention. As many effects were positive, providing short-term BEV experience to enhance acceptance has the potential to change BEV evaluation as well as the satisfaction with such a vehicle and might be a promising strategy for promoting BEVs. Key Words: battery electric vehicle; experience; theory of planned behavior; acceptance, test trial, online survey
Paper III • 131 1 Introduction Battery electric vehicles (BEVs), vehicles with an electric powertrain that work on battery, represent a promising technological development with the potential to significantly reduce CO2-emissions emitted by automobiles (King, 2010). According to Schill, Gerbaulet and Kasten (2015), the potential of BEVs can only be fully realized if, among other things, a high percentage of the energy is generated from renewable energy resources. Although the BEV market has grown (with at least 8 BEV models available in 15 of the 30 investigated countries), the market share of BEVs is relatively low in many countries such as Germany, Denmark and the United Kingdom (Sierzchula, Bakker, Maat, & van Wee, 2014). To achieve higher BEV adoption rates, policies should not only build on financial incentives and aim to increase the quantity and quality of charging infrastructure (Sierzchula et al., 2014), but experience with BEVs should also be considered, given that this has been argued as relevant to policy interventions (Larson, Viáfara, Parsons, & Elias, 2014), and moreover implementing experience programs may prove cheaper than subsidies (Sierzchula, 2014). As Germany is currently in an early adopter stage (Barth, Jugert, & Fritsche, 2016) and many German car drivers have never driven a BEV, knowledge and experience of BEVs is limited. One interesting approach therefore is to investigate what role experience plays in BEV acceptance. The objective of this study was to investigate if and how the evaluation and acceptance of BEVs changes with increasing BEV experience, and if BEV experience might have indirect effects on attitude and purchase intention. To address these research questions, data from (Study I) an online survey (N = 286) and (Study II) a 24-hours field test (N = 30) were analyzed. In the following section (1.1), we will derive our theoretical framework of BEV acceptance (i.e., BEV purchase) from the literature on BEV adoption. The subsequent section (1.2) summarizes findings regarding BEV experience, and finally in the last introductory section (1.3) reviewed results on BEVs are integrated into our theoretical framework and our research questions are generated. 1.1 Theoretical framework for BEV attitudinal and behavioral acceptance A theoretical framework for BEV acceptance is necessary for identifying relevant variables that might vary at different levels of experience. Within the present research, the definition of Schade and Schlag (2003) is applied, who argue that acceptance is reflected by attitudes (attitudinal acceptance) and behavior (behavioral acceptance). BEV purchase, ownership and usage are often used indicators for behavioral
132 • Paper III acceptance (see Hjorthol, 2013; Rezvani, Jansson, & Bodin, 2015). In accordance with other researchers investigating BEV acceptance (e.g., Carroll, 2010; Noppers, Keizer, Bolderdijk, & Steg, 2014), purchase intention was studied in the present contribution. Purchase intention has proved to be the strongest predictor for purchase behavior in different contexts (e.g., De Cannière, De Pelsmacker, & Geuens, 2010; Arndt, 2011). Reviewing literature on BEV adoption (i.e., a behavioral response including purchase and usage), Rezvani et al. (2015) argued that various factors influence the adoption process. Technical (e.g., instrumental, functional BEV attributes), contextual (e.g., policy, charging infrastructure), cost (e.g., purchase prize, fuel costs), individual and social factors (e.g., knowledge, perceived behavioral control, emotions, symbolic meaning of BEV, subjective social norm) are all associated with BEV adoption. Klöckner (2014) argues that a BEV purchase decision can be described with different stages (i.e., pre-decisional, pre-actional, actional and post-actional) in which different influencing psychological variables play a role. People transit from one stage to the next by developing specific intentions. For instance, when an individual forms a goal intention, he/she transits from the pre-decisional stage to the pre-actional stage. Klöckner (2014) analyzed the impact of selected psychological variables at the different stages and could show that in the pre-decisional stage, a person s goal intention to buy a BEV is determined by positive emotions as well as personal and social norms. In the following pre-actional stage, attitudes and knowledge about car types form the behavioral intention, but the impact of perceived behavioral control could not be confirmed. In the next stage, the actional stage, planning ability and car availability predict the actual purchase. With regard to BEVs, many Germans are still at the pre-decisional stage (Barth et al., 2016). Thus, purchase intention investigated within this contribution represent most likely goal intention. In several studies (e.g., Moons & De Pelsmacker, 2015; Wang, Fan, Zhao, Yang, & Fu, 2016), the Theory of Planned Behavior (TPB, Ajzen, 1991) has been applied in order to explain BEV adoption. According to Ajzen (1991), the behavioral intention (purchasing a BEV) is determined by the attitude towards the behavior (the purchase), the perceived social pressure resulting from the perceived expectations or behaviors of important people of one s social environment (subjective norm), and one s perceived ability to perform the purchase (perceived behavioral control) depending on internal (i.e., self-efficiency) and external resources. Various researchers have extended the TPB (Moons & De Pelsmacker, 2015; Wang et al., 2016). Moons and De Pelsmacker (2015) added emotions, focused on the attitude towards BEVs and included some attitudes
Paper III • 133 towards specific BEV attributes. Ajzen and Fishbein (2005) stated that the attitude towards an object is normally a poor predictor for specific behavior, but if the selected behavioral criterion is representative for the selection of behavioral options regarding one object, strong relations can be found. Several authors (e.g., Ajzen & Fishbein, 2005; Crites, Fabrigar, & Petty, 1994) proposed that attitudes towards a behavior include two different sub-components: instrumental (e.g., desirable undesirable) and experiential (e.g., pleasant unpleasant). Regarding the attitude towards an object, a similar distinction is assumed by Van der Laan, Heino, and De Waard (1997). They defined attitudes as predispositions to
respond, or tendencies in terms of approach/avoidance or favourable/unfavourable (Van der Laan et al., 1997, p. 2), and suggested two dimensions (satisfaction and usefulness) that cover attitudinal acceptance of technological innovations. This has been successfully implemented in other studies concerning BEVs (e.g., Bühler, Cocron, Neumann, Franke, & Krems, 2014). In sum, the TPB seems to be a promising and economical theoretical framework, but it covers few individual and social aspects described by Rezvani et al. (2015). It also does not account for the importance of BEV attributes, although it is indisputable that the evaluation of BEV attributes plays an essential role in predicting BEV adoption (Rezvani et al., 2015; Schuitema, Annable, Skippon, & Kinnear, 2013). In addition to instrumental or functional attributes (i.e., BEV characteristics such as performance, driving range or charging duration) and symbolic attributes (characteristics that reflect driver s identity, show that s/he is
conscious, and/or green ) (Schuitema et al., 2013; Noppers et al., 2014; Noppers, Keizer, Bockarjova, & Steg, 2015), the role of emotions (e.g., Moons & De Pelsmacker, 2015) in terms of hedonic attributes (e.g., Schuitema et al., 2013) of BEVs, that describe the emotional experience of the drivers such as their joy or pleasure (e.g., Dittmar, 1992), were found to be relevant to BEV purchase and/or usage intention. It therefore seems advantageous to combine the TPB with the evaluation of product attributes as undertaken by other authors (Moons & De Pelsmacker, 2015; Arndt, 2011). Arndt (2011) as well as Moons and de Pelsmacker (2015) reported a direct effect of the evaluation of product characteristics on attitudes and argue that it only indirectly affects behavioral intention. Contrary, Nayum and Klöckner (2014) showed that the evaluation of different car attributes directly determines the intention to buy a fuel-efficient car. Following these results, we study propose that the evaluation of different BEV
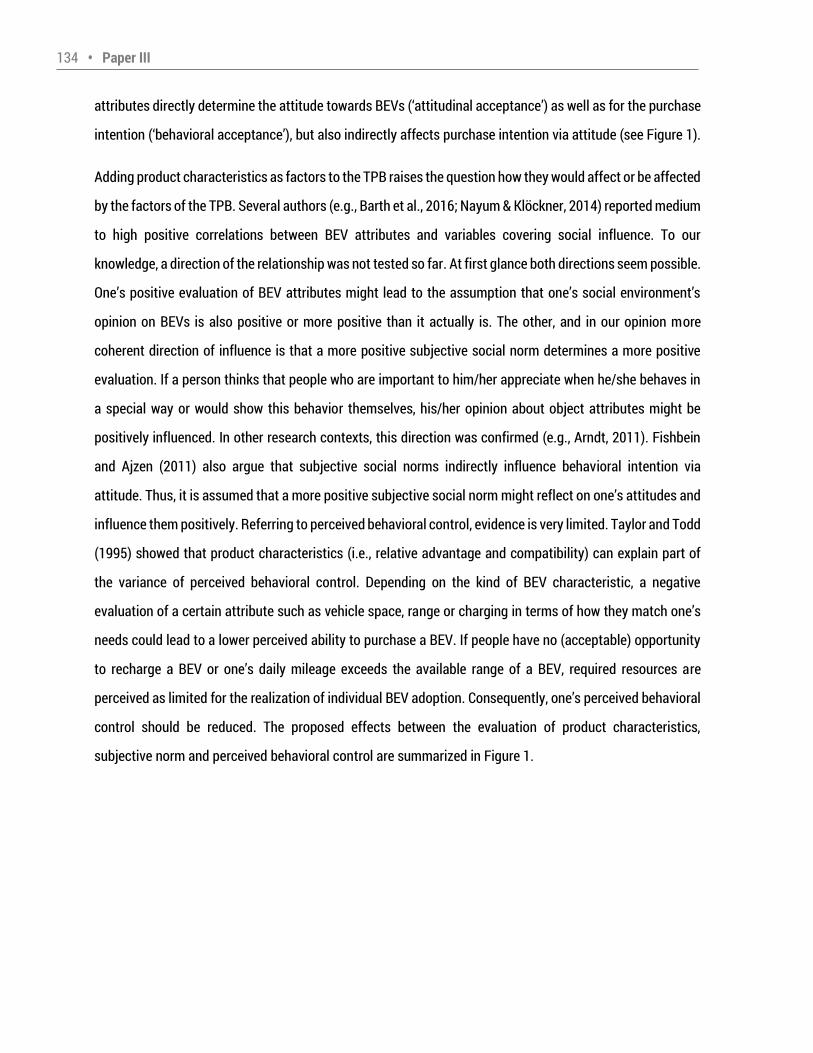
134 • Paper III attributes directly determine the attitude towards BEVs ( attitudinal acceptance ) as well as for the purchase intention ( behavioral acceptance ), but also indirectly affects purchase intention via attitude (see Figure 1). Adding product characteristics as factors to the TPB raises the question how they would affect or be affected by the factors of the TPB. Several authors (e.g., Barth et al., 2016; Nayum & Klöckner, 2014) reported medium to high positive correlations between BEV attributes and variables covering social influence. To our knowledge, a direction of the relationship was not tested so far. At first glance both directions seem possible. One s positive evaluation of BEV attributes might lead to the assumption that one s social environment s opinion on BEVs is also positive or more positive than it actually is. The other, and in our opinion more coherent direction of influence is that a more positive subjective social norm determines a more positive evaluation. If a person thinks that people who are important to him/her appreciate when he/she behaves in a special way or would show this behavior themselves, his/her opinion about object attributes might be positively influenced. In other research contexts, this direction was confirmed (e.g., Arndt, 2011). Fishbein and Ajzen (2011) also argue that subjective social norms indirectly influence behavioral intention via attitude. Thus, it is assumed that a more positive subjective social norm might reflect on one s attitudes and influence them positively. Referring to perceived behavioral control, evidence is very limited. Taylor and Todd (1995) showed that product characteristics (i.e., relative advantage and compatibility) can explain part of the variance of perceived behavioral control. Depending on the kind of BEV characteristic, a negative evaluation of a certain attribute such as vehicle space, range or charging in terms of how they match one s needs could lead to a lower perceived ability to purchase a BEV. If people have no (acceptable) opportunity to recharge a BEV or one s daily mileage exceeds the available range of a BEV, required resources are perceived as limited for the realization of individual BEV adoption. Consequently, one s perceived behavioral control should be reduced. The proposed effects between the evaluation of product characteristics, subjective norm and perceived behavioral control are summarized in Figure 1.
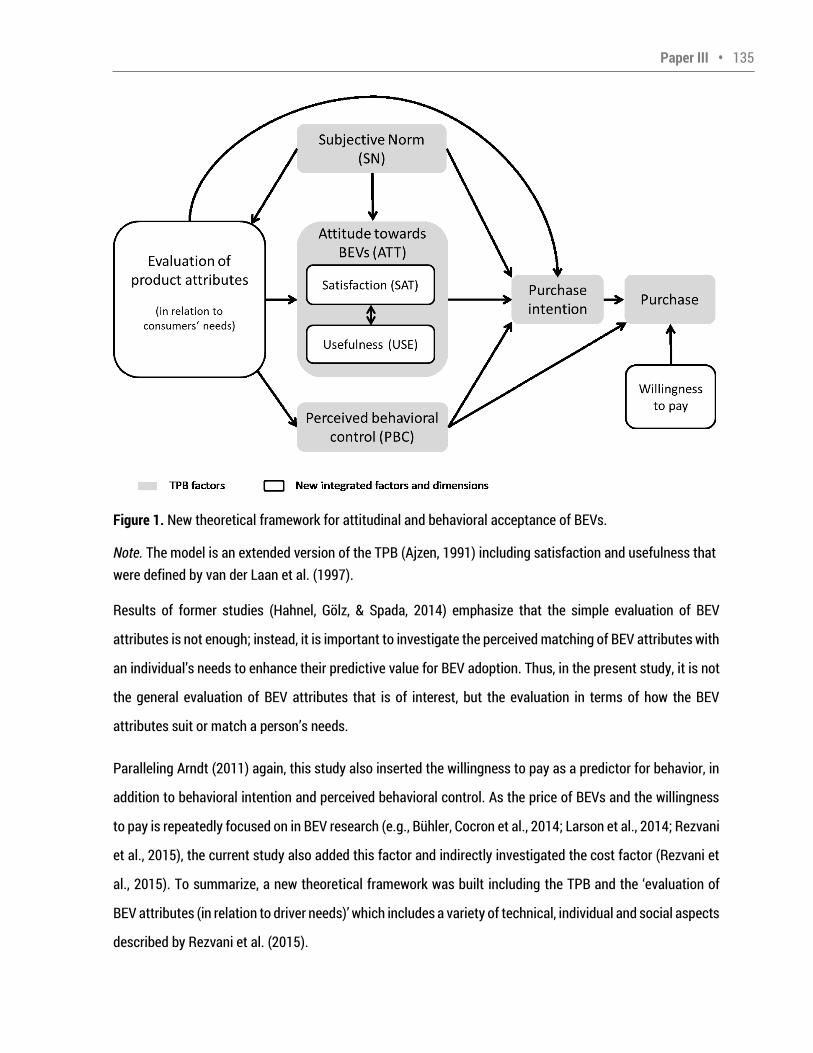
Paper III • 135 Figure 1. New theoretical framework for attitudinal and behavioral acceptance of BEVs. Note. The model is an extended version of the TPB (Ajzen, 1991) including satisfaction and usefulness that were defined by van der Laan et al. (1997). Results of former studies (Hahnel, Gölz, & Spada, 2014) emphasize that the simple evaluation of BEV attributes is not enough; instead, it is important to investigate the perceived matching of BEV attributes with an individual s needs to enhance their predictive value for BEV adoption. Thus, in the present study, it is not the general evaluation of BEV attributes that is of interest, but the evaluation in terms of how the BEV attributes suit or match a person s needs. Paralleling Arndt (2011) again, this study also inserted the willingness to pay as a predictor for behavior, in addition to behavioral intention and perceived behavioral control. As the price of BEVs and the willingness to pay is repeatedly focused on in BEV research (e.g., Bühler, Cocron et al., 2014; Larson et al., 2014; Rezvani et al., 2015), the current study also added this factor and indirectly investigated the cost factor (Rezvani et al., 2015). To summarize, a new theoretical framework was built including the TPB and the evaluation of
BEV attributes (in relation to driver needs) which includes a variety of technical, individual and social aspects described by Rezvani et al. (2015).
136 • Paper III 1.2 Experiencing BEVs Repeatedly, authors of user studies with BEVs emphasize that direct experience with a BEV is important in overcoming prejudices and convincing people that BEVs are fun and convenient vehicles (Bakker & Trip, 2013; Burgess, King, Harris, & Lewis, 2013; Ozaki & Sevastyanova, 2011; Rezvani et al., 2015). The majority of people is still unfamiliar with BEVs and possesses limited knowledge concerning performance, technology and specific aspects such as charging. Burgess et al. (2013) described experience as a crucial factor as drivers reported that experiencing the BEV had the potential to change peoples evaluation of specific BEV attributes (such as low noise). BEV experience, as it has been operationalized in former studies (Bühler, Cocron et al., 2014; Cocron et al., 2011), reflects an opportunity to use a target technology and is typically operationalized as the passage of time from the initial use of a technology by an individual (Venkatesh, Thong, & Xu, 2012, p. 161). In consumer research, the concept and influence of experience on purchase decision has been widely investigated, and evidence of the effect of prior knowledge and experience has been repeatedly provided (e.g., Bettman & Park, 1980). Experience can be indirect via advertisements with no interaction and direct via product trials that include interaction with the product (Hamilton & Thompson, 2007). The present study focuses on direct, hands-on experience with BEVs. A number of studies have investigated the role of providing direct BEV experience (Vilimek, Keinath, & Schwalm, 2012; Krems, 2011; Krems et al., 2011; Peters & Dütschke, 2014; Nayum, Klöckner, & Mehmetoglu, 2016). In pre-post studies with early adopters, a range of changes were documented after drivers had tested a BEV for three months or longer; namely the evaluation of car attributes such as low noise (Cocron & Krems, 2013), perceived advantages and disadvantages (Bühler, Cocron et al., 2014), attitude towards BEVs (e.g., Carroll, 2010; Wikström, Hansson, & Alvfors, 2014), and purchase intention (Turrentine, Garas, Lentz, & Woodjack, 2011). In online studies that utilize samples that are more representative of potential car buyers, knowledge and/or BEV experience explain some of the variation of behavioral intention relating to BEVs. Barth et al. (2016) showed an effect of knowledge but not of experience in a BEV buying scenario. Furthermore, BEV-experienced individuals accepted higher price ranges and demonstrated a greater willingness to pay for a BEV than people who were inexperienced (Larson at al., 2014; Peters & Dütschke, 2014). Peters and Dütschke
Paper III • 137 (2014) found that BEV users rated various relative advantages higher, and the social norm (i.e., the perceived image and approval of BEVs in the society) as more positive, compared to non-user groups that were either interested or uninterested in BEVs. Nayum et al. (2016) compared BEV drivers with drivers of conventional cars and found that there were differences in most psychological variables. BEV drivers were less interested in performance and convenience, showed more positive attitudes towards environmental attributes, and scored higher on perceived behavioral control and intention. In summary therefore, BEV-inexperienced and experienced individuals do not only vary in variables reflecting acceptance (e.g., purchase intention), they also differ in terms of potentially influencing psychological variables (e.g., social norm) for the prediction of BEV adoption. 1.3 Present research Ajzen and Fishbein (2005) argued that experience plays a role in TPB and included this variable as one background factor. They further stated that learning from previous experiences will affect various beliefs and thereby behavioral performance. Existing models of BEV adoption did not include experience with BEVs as factor and previous research has not investigated potential indirect experience effects on attitudes or behavioral intentions relating to BEVs. This research aims to bridge this gap and investigates the role of experience for explaining the evaluation of different BEV attributes, attitude and purchase intention. Simultaneously, it should be investigated if experience indirectly influences attitude and purchase intention. In Figure 2, the experience factor and its assumed direct influences within the theoretical framework of this study are displayed. In the following, the various effects of experience displayed in Figure 2 as well as potential indirect effects are explained and findings of earlier research are summarized that led to the assumptions. Subjective norm and experience. In a German study, BEV users (i.e., owners and non-owners, but regular users) showed higher values for social norms (i.e., using a BEV is expected by relevant others) than non-users (Peters & Dütschke, 2014). Contrary, Nayum et al. (2016) could not show a difference in subjective social norms between Norwegian BEV owners and conventional car owners. The varying results might reflect the different status of BEVs in the two countries. In Norway, the market share of BEVs in 2015 was 23.3% compared to Germany with 0.7% (International Energy Agency, 2016). This probably goes along with a different support and attitude regarding BEVs within the society. In Norway, social norms which determine
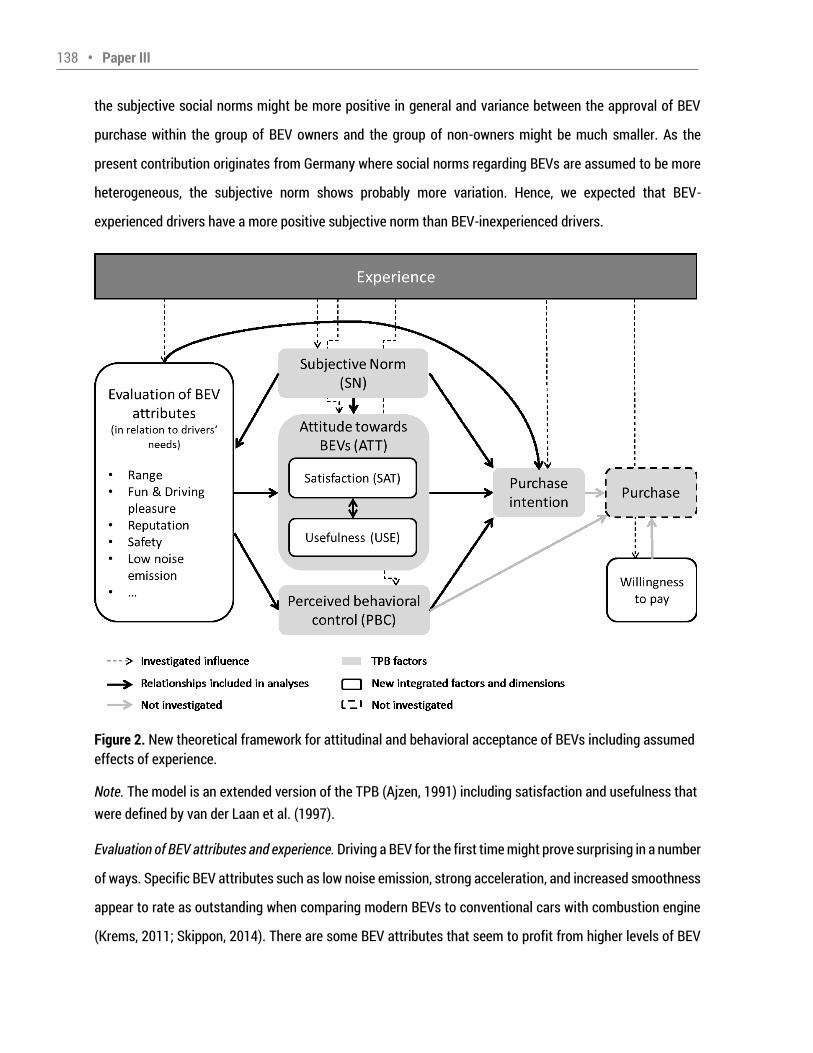
138 • Paper III the subjective social norms might be more positive in general and variance between the approval of BEV purchase within the group of BEV owners and the group of non-owners might be much smaller. As the present contribution originates from Germany where social norms regarding BEVs are assumed to be more heterogeneous, the subjective norm shows probably more variation. Hence, we expected that BEV-experienced drivers have a more positive subjective norm than BEV-inexperienced drivers. Figure 2. New theoretical framework for attitudinal and behavioral acceptance of BEVs including assumed effects of experience. Note. The model is an extended version of the TPB (Ajzen, 1991) including satisfaction and usefulness that were defined by van der Laan et al. (1997). Evaluation of BEV attributes and experience. Driving a BEV for the first time might prove surprising in a number of ways. Specific BEV attributes such as low noise emission, strong acceleration, and increased smoothness appear to rate as outstanding when comparing modern BEVs to conventional cars with combustion engine (Krems, 2011; Skippon, 2014). There are some BEV attributes that seem to profit from higher levels of BEV
Paper III • 139 experience and are more positively evaluated by BEV-experienced drivers: low noise emission (Cocron & Krems, 2013), performance (Carroll, 2010; Jensen, Cherchi, & Dios Ortúzar, 2014), regenerative braking (Bühler, Cocron et al., 2014; Cocron et al., 2013), fun or hedonic aspects when driving a BEV (e.g., Bühler, Cocron et al., 2014; Burgess et al., 2013), environmental attributes (Gould & Golob, 1998) and reliability (Jensen et al., 2014). Image, reputation or symbolic meaning seemed to be evaluated differently when people gained experience (e.g., Burgess et al., 2013; Graham-Rowe et al., 2012), but results are inconsistent regarding the direction of the effect. Evaluation of other attributes seems to be less affected by the level of experience. Range is perceived as a major barrier to acceptance both prior to and after experiencing a BEV (Bühler, Cocron et al., 2014), but BEV-experienced drivers had a lower minimum acceptable range (Franke & Krems, 2013). Charging was perceived as easy to handle and the higher time effort for recharging compared to refueling was evaluated as assimilable into daily life, independent of the level of experience; although for some BEV drivers charging was hard to integrate into the daily routine (Krems, 2011). Furthermore, the advantage of refueling at home was more salient after experiencing a BEV (Bühler, Cocron et al., 2014). To summarize, various studies provide evidence that the evaluation of BEV attributes changes with a higher level of BEV experience, thus the influence of experience on the evaluation of BEV attributes was investigated in this study (see Figure 2). Attitude towards BEVs, purchase intention, willingness to pay and experience. Although some previous studies suggested that general attitude towards BEVs did not change with increasing experience in an early adopter sample in a private setting (Bühler, Cocron et al., 2014; Bühler, Franke et al., 2014), they did alter in a fleet setting (Carroll, 2010; Wikström et al., 2014). Other studies also reported that attitudes towards BEVs can change with a higher level of experience (Hjorthol, 2013; Rezvani et al., 2015), and providing knowledge and hands-on experience is expected to raise buying intention (Hjorthol, 2013). Several authors (Turrentine et al., 2011; Larson et al., 2014; Peters & Dütschke, 2014) showed an increase in the purchase intention and willingness to pay of BEV-experienced drivers, but others have failed to replicate this (Bühler, Cocron et al., 2014). Within these studies, the level of BEV experience varied notably. Respondents were categorized as BEV-experienced when they had either driven or […] other direct experience with EVs (Larson et al., 2014, p. 303) or had gained several months of BEV experience (e.g., Bühler, Cocron et al., 2014; Turrentine et al., 2011). Referring to former studies, attitude towards BEVs, purchase intention and willingness to pay were assumed to be different between BEV-inexperienced and experienced people. Thereby, experience could
140 • Paper III have a direct and/or indirect effect. Following our theoretical framework, experience could indirectly affect attitude via subjective norm and the evaluation of BEV attributes. If the evaluation of one or more attributes is affected by experience, then this might indirectly influence attitude or the purchase intention. The effect of experience on purchase intention could be additionally mediated by attitude and perceived behavioral control. To our knowledge indirect experience effects have not been studied in former research on BEV adoption. To address this, indirect and total effects of experience were also investigated in the present contribution. Perceived behavioral control and experience. Perceived behavioral control to buy a fuel-efficient vehicle was higher for BEV owners (Nayum et al., 2016). BEV owners know from their experience that they can purchase a BEV. For people who have driven a BEV, but do not own such a vehicle, perceived behavioral control is not necessarily higher than for people with no experience. They might be better informed in terms of if and how they could purchase a BEV and may have considered if they could afford a BEV, so their perceived behavioral control might be thought through and even lower than for BEV-inexperienced people. Given that specific BEV attributes predict perceived behavioral control; BEV experience could also have an indirect effect via the evaluation of BEV attributes. If experiencing a BEV changes the evaluation of space in a positive way, so that the driver is sure that the BEV provides enough space for the whole family, the driver might deduce that he can buy a BEV if he wants to. Based on these considerations, this study investigated how perceived behavioral control differed between BEV-experienced and -inexperienced drivers and if experience has indirect effects on perceived behavioral control. 2 Study I: Online Survey 2.1 Method The online survey (programmed in Lime Survey V1.92; Schmitz, 2015) was advertised via social networks and mailing lists. In order to acquire people with direct experience with BEVs, the questionnaire was distributed to 14 forums specializing in motor sports and environmentally friendly mobility and sent to two student teams who had built an electrically driven car.
Paper III • 141 2.1.1 Participants The final sample consisted of 286 participants (44.8% male) who completed the questionnaire and had a drivers license. Participants were on average 27.6 (SD = 11.3) years old. Further details are featured in Appendix A, Table A1. The sample was representative of the population of German car buyers given that it paralleled a large-scale study which showed little gender difference in the intention to buy a new car within a given timeframe, and that people under the age of 39 were more likely to purchase a new car (Aral Aktiengesellschaft, 2013). A question enquiring as to whether respondents had experience with BEVs was used to divide the sample into a BEV-inexperienced (INEXP, N = 229) and experienced group (EXP, N = 49). This study made the same distinction as Barth et al. (2016) in assigning respondents to the EXP group if they had driven a BEV at least once. Eight respondents were excluded as a clear distinction could not be made as they answered other . People in the EXP group were mostly male (91.8%), older (M = 37.1, SD = 12.9), highly educated (61.2% held a university degree) and had a higher income (50% earned more than €3000 net income for the household per month) in relation to the INEXP group. The subsample is therefore typical of the population of BEV buyers (Wietschel et al., 2012). More than half (55.1%) had only driven once a BEV whilst 34.7% owned a BEV. More detailed information about the sample and subgroups is provided in Appendix A, Table A1. 2.1.2 Questionnaires The implemented questionnaire contained 144 items and its completion took less than 30 minutes. For the present research, items referring to factors of the theoretical framework (Figure 2), personal and socio-demographic variables were analyzed. To ensure that BEV-inexperienced respondents were also able to judge a BEV-type specific set of attributes, this study framed the questionnaire to a specific BEV - the MINI E (further information provided in section 2.2). A detailed description of this BEV including pictures was featured at the beginning of the questionnaire. Participants were then asked to answer the items described below. Several items regarding the subjective evaluation of BEV attributes and their match to one s personal needs were either adapted from the questionnaire used in the project MINI E Berlin powered by Vattenfall (e.g., Krems, 2011) or newly created. A 6-point Likert Scale from 1 (completely disagree) to 6 (completely agree) was applied to all items, unless the question necessitated alternative phrasing. The questionnaire included
142 • Paper III 42 items for the evaluation of BEV attributes, and assessed vehicle performance (3 items), driving pleasure (4 items), low noise (6 items, Cocron & Krems, 2013), image (4 items), charging (3 items), range (4 items), vehicle size (4 items), regenerative braking (3 items), safety (4 items), environmental friendliness (3 items) in addition to trust and reliability (4 items). To address the findings of Hahnel et al. (2014), phrases such as for me , I would and I can were included in several items so that participants were triggered to evaluate the different BEV attributes in accordance with their wishes and needs. Based on the results of a calculated principal factor analysis (PCA) with varimax rotation, the 8 factors that had an eigenvalue above 1 were extracted and explained 67% of the variance. After reliability analyses, 7 scales remained and 5 items were excluded (regenerative braking: 3, trust & reliability: 1, charging: 1) from further analysis. The final scales and items with factor loadings, explained variance and internal reliability values are displayed in Table 1. As in earlier publications (e.g., Bühler, Cocron et al., 2014), the van der Laan Acceptance Scale (Van der Laan et al., 1997) with the subdimensions Satisfaction (SAT, 4 items, Cronbach s α = .85) and Usefulness (USE,
5 items, Cronbach s α = .93) was applied in order to operationalize attitude towards BEVs. The nine semantic differentials ranged from -2 to 2. Subjective Norm (SN, 6 items) and Perceived Behavioral Control (PBC, 5 items) were assessed using items from the MINI E 1.0 Berlin field trial (Cocron et al., 2011). As suggested by Ajzen and Fishbein (2005), the scale assessing subjective norm (see Appendix B, Table B1) included items covering on descriptive (SN2, SN5, SN6) and injunctive norm (SN1, SN3, SN4). Scales were analyzed using factor and reliability analyses. As results, descriptive and injunctive norm items proved to load on one factor and two items of PBC had to be excluded. Final scales are displayed in Appendix B Table B1. The Willingness To Purchase (WTPurchase, 1 item) and Willingness To Pay (WTPay, 2 items) were assessed in reference to Bühler, Cocron et al. (2014). To assess the subjective acceptable price range and the optimal price of a BEV, the NSS-Price Sensitivity Meter (Van Westendorp, 1976) was implemented. In addition to socio-demographic variables (age, gender, number of adults and children per household, year of driver s license, net income per household and education level), this study also assessed environmental concerns (2 items, Oreg & Katz-Gerro, 2006) and subjective knowledge regarding BEVs (such as whether participants described themselves as experts in electric mobility).
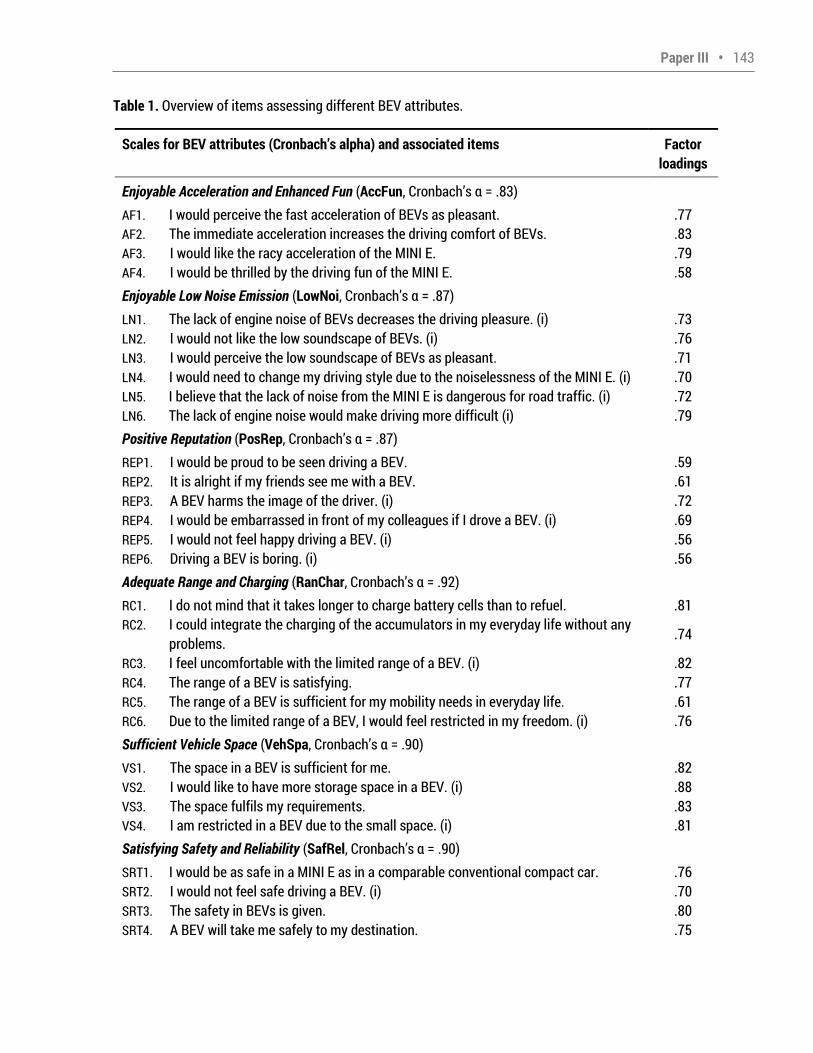
Paper III • 143 Table 1. Overview of items assessing different BEV attributes. Scales for BEV attributes (Cronbach’s alpha) and associated items Factor loadings Enjoyable Acceleration and Enhanced Fun (AccFun, Cronbach s α = .83) AF1. I would perceive the fast acceleration of BEVs as pleasant. .77 AF2. The immediate acceleration increases the driving comfort of BEVs. .83 AF3. I would like the racy acceleration of the MINI E. .79 AF4. I would be thrilled by the driving fun of the MINI E. .58 Enjoyable Low Noise Emission (LowNoi, Cronbach s α = .87) LN1. The lack of engine noise of BEVs decreases the driving pleasure. (i) .73 LN2. I would not like the low soundscape of BEVs. (i) .76 LN3. I would perceive the low soundscape of BEVs as pleasant. .71 LN4. I would need to change my driving style due to the noiselessness of the MINI E. (i) .70 LN5. I believe that the lack of noise from the MINI E is dangerous for road traffic. (i) .72 LN6. The lack of engine noise would make driving more difficult (i) .79 Positive Reputation (PosRep, Cronbach s α = .87) REP1. I would be proud to be seen driving a BEV. .59 REP2. It is alright if my friends see me with a BEV. .61 REP3. A BEV harms the image of the driver. (i) .72 REP4. I would be embarrassed in front of my colleagues if I drove a BEV. (i) .69 REP5. I would not feel happy driving a BEV. (i) .56 REP6. Driving a BEV is boring. (i) .56 Adequate Range and Charging (RanChar, Cronbach s α = .92) RC1. I do not mind that it takes longer to charge battery cells than to refuel. .81 RC2. I could integrate the charging of the accumulators in my everyday life without any problems. .74 RC3. I feel uncomfortable with the limited range of a BEV. (i) .82 RC4. The range of a BEV is satisfying. .77 RC5. The range of a BEV is sufficient for my mobility needs in everyday life. .61 RC6. Due to the limited range of a BEV, I would feel restricted in my freedom. (i) .76 Sufficient Vehicle Space (VehSpa, Cronbach s α = .90) VS1. The space in a BEV is sufficient for me. .82 VS2. I would like to have more storage space in a BEV. (i) .88 VS3. The space fulfils my requirements. .83 VS4. I am restricted in a BEV due to the small space. (i) .81 Satisfying Safety and Reliability (SafRel, Cronbach s α = .90) SRT1. I would be as safe in a MINI E as in a comparable conventional compact car. .76 SRT2. I would not feel safe driving a BEV. (i) .70 SRT3. The safety in BEVs is given. .80 SRT4. A BEV will take me safely to my destination. .75
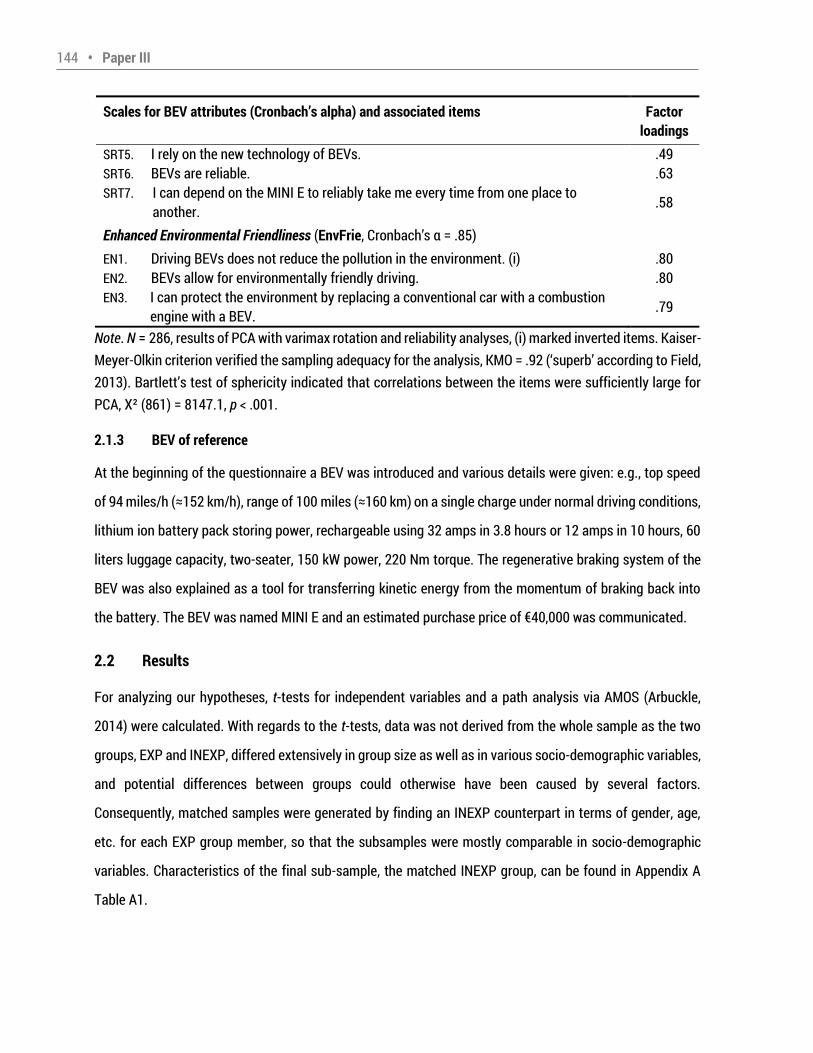
144 • Paper III Scales for BEV attributes (Cronbach’s alpha) and associated items Factor loadings SRT5. I rely on the new technology of BEVs. .49 SRT6. BEVs are reliable. .63 SRT7. I can depend on the MINI E to reliably take me every time from one place to another. .58 Enhanced Environmental Friendliness (EnvFrie, Cronbach s α = .85) EN1. Driving BEVs does not reduce the pollution in the environment. (i) .80 EN2. BEVs allow for environmentally friendly driving. .80 EN3. I can protect the environment by replacing a conventional car with a combustion engine with a BEV. .79 Note. N = 286, results of PCA with varimax rotation and reliability analyses, (i) marked inverted items. Kaiser-Meyer-Olkin criterion verified the sampling adequacy for the analysis, KMO = .92 ( superb according to Field, 2013). Bartlett s test of sphericity indicated that correlations between the items were sufficiently large for PCA, Χ² (861) = 8147.1, p < .001. 2.1.3 BEV of reference At the beginning of the questionnaire a BEV was introduced and various details were given: e.g., top speed of 94 miles/h (≈152 km/h), range of 100 miles (≈160 km) on a single charge under normal driving conditions, lithium ion battery pack storing power, rechargeable using 32 amps in 3.8 hours or 12 amps in 10 hours, 60 liters luggage capacity, two-seater, 150 kW power, 220 Nm torque. The regenerative braking system of the BEV was also explained as a tool for transferring kinetic energy from the momentum of braking back into the battery. The BEV was named MINI E and an estimated purchase price of €40,000 was communicated. 2.2 Results For analyzing our hypotheses, t-tests for independent variables and a path analysis via AMOS (Arbuckle, 2014) were calculated. With regards to the t-tests, data was not derived from the whole sample as the two groups, EXP and INEXP, differed extensively in group size as well as in various socio-demographic variables, and potential differences between groups could otherwise have been caused by several factors. Consequently, matched samples were generated by finding an INEXP counterpart in terms of gender, age, etc. for each EXP group member, so that the subsamples were mostly comparable in socio-demographic variables. Characteristics of the final sub-sample, the matched INEXP group, can be found in Appendix A Table A1.
Paper III • 145 Path analysis1 was used to calculate direct, indirect and total effects of BEV experience (see Preacher & Hayes, 2008) as well as the predictive power of the other postulated factors. BEV owners were excluded from this analysis as their willingness to purchase is most likely biased by the fact that they already own a BEV. The theoretical framework was extended by the seven BEV attribute scales that were identified via factor and reliability analysis. The predictors for perceived behavioral control were adapted referring to the content of the attributes. From a theoretical viewpoint range and charging as well as vehicle space would be appropriate predictors for perceived behavioral control. This was underpinned by results of correlation analyses; only Adequate Range and Charging (r = .16, p = .009) and Sufficient Vehicle Space (r = .33, p < .001) significantly correlated with perceived behavioral control. As a result, paths reflecting these correlations were added in the analyzed model. Following Preacher s and Hayes (2008) recommendations, bias-corrected bootstrapping with 5000 resamples was used to estimate indirect and total effects in the multi-mediator model and residuals of the mediators were allowed to covary (results are displayed in Appendix C, Table C2). Effects were labelled as significant if zero was not part of the 95% CI. All variables were tested for univariate outliers in accordance with the Grubbs (1969) procedure; 16 values were excluded. 2.2.1 Descriptive statistics and differences between the groups Evaluation of BEV attributes and experience. Results regarding BEV attributes revealed significant differences for two BEV attributes between the Matched INEXP and EXP group (Table 2). We found medium effects between the groups for Adequate Range and Charging (RanChar) and Sufficient Vehicle Space (VehSpa), but small, non-significant effects for Satisfying Safety and Reliability (SafRel), Enjoyable Low Noise
Emission (LowNoi) and Positive Reputation (PosRep). All results are shown in Table 2. Attitude towards BEVs, purchase intention, willingness to pay and experience. Experienced respondents showed lower scores on Satisfaction and Usefulness than inexperienced, but results were not significant
and the effect for Usefulness was small (Table 2). There was a medium effect of group on WTPurchase; the EXP group scored higher on WTPurchase than the INEXP group. Contrary, the group difference between WTPay values was close to zero (Table 2). The optimal price (≈€19,000) as well as the acceptable price range of BEVs (Van Westendorp, 1976) for experienced respondents (Min: ≈€16,300; Max: ≈€25,000) was higher 1 For complex models (more than seven factors), samples should be larger than the investigated sample of 286 (Hair, Black, Babin, & Anderson, 2010). Furthermore, the factors covering BEV attributes were extracted using exploratory factor analyses what could cause problems for the model fit when confirmatory factor analyses would be additionally used (Kline, 2011). As a consequence, path models were analysed and reported.
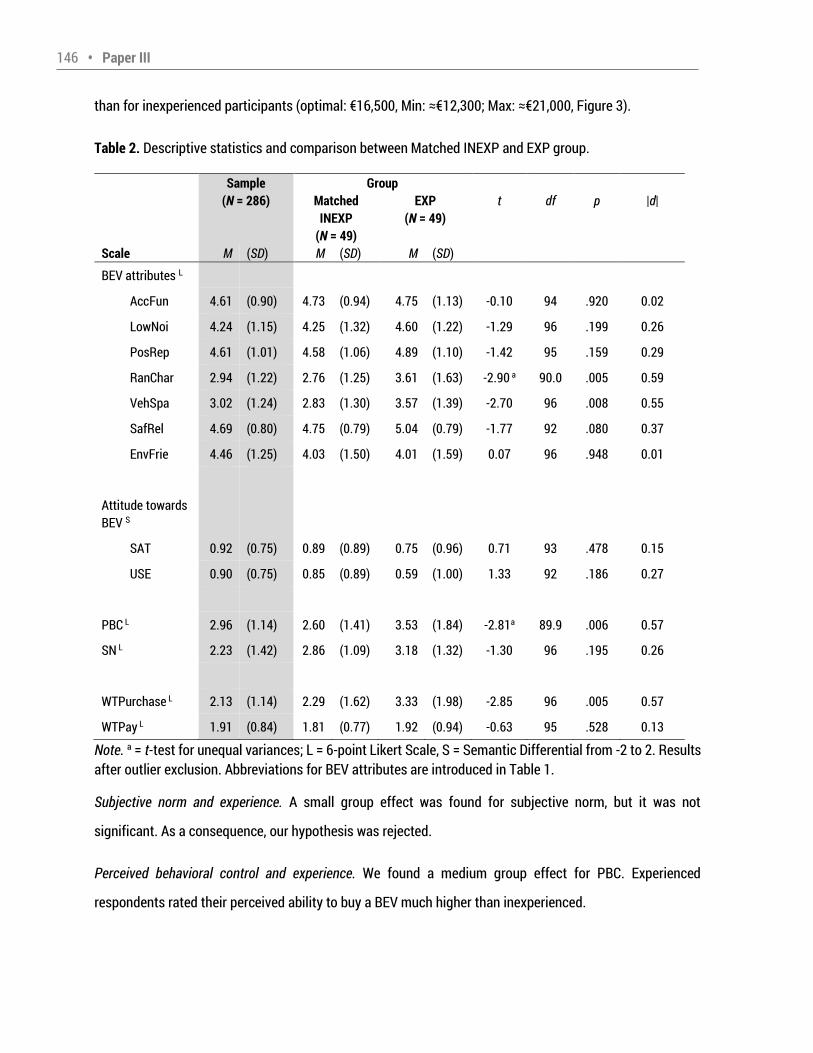
146 • Paper III than for inexperienced participants (optimal: €16,500, Min: ≈€12,300; Max: ≈€21,000, Figure 3). Table 2. Descriptive statistics and comparison between Matched INEXP and EXP group. Sample (N = 286) Group Matched INEXP (N = 49) EXP (N = 49) t df p |d| Scale M (SD) M (SD) M (SD) BEV attributes L AccFun 4.61 (0.90) 4.73 (0.94) 4.75 (1.13) -0.10 94 .920 0.02 LowNoi 4.24 (1.15) 4.25 (1.32) 4.60 (1.22) -1.29 96 .199 0.26 PosRep 4.61 (1.01) 4.58 (1.06) 4.89 (1.10) -1.42 95 .159 0.29 RanChar 2.94 (1.22) 2.76 (1.25) 3.61 (1.63) -2.90 a 90.0 .005 0.59 VehSpa 3.02 (1.24) 2.83 (1.30) 3.57 (1.39) -2.70 96 .008 0.55 SafRel 4.69 (0.80) 4.75 (0.79) 5.04 (0.79) -1.77 92 .080 0.37 EnvFrie 4.46 (1.25) 4.03 (1.50) 4.01 (1.59) 0.07 96 .948 0.01 Attitude towards BEV S SAT 0.92 (0.75) 0.89 (0.89) 0.75 (0.96) 0.71 93 .478 0.15 USE 0.90 (0.75) 0.85 (0.89) 0.59 (1.00) 1.33 92 .186 0.27 PBC L 2.96 (1.14) 2.60 (1.41) 3.53 (1.84) -2.81a 89.9 .006 0.57 SN L 2.23 (1.42) 2.86 (1.09) 3.18 (1.32) -1.30 96 .195 0.26 WTPurchase L 2.13 (1.14) 2.29 (1.62) 3.33 (1.98) -2.85 96 .005 0.57 WTPay L 1.91 (0.84) 1.81 (0.77) 1.92 (0.94) -0.63 95 .528 0.13 Note. a = t-test for unequal variances; L = 6-point Likert Scale, S = Semantic Differential from -2 to 2. Results after outlier exclusion. Abbreviations for BEV attributes are introduced in Table 1. Subjective norm and experience. A small group effect was found for subjective norm, but it was not significant. As a consequence, our hypothesis was rejected. Perceived behavioral control and experience. We found a medium group effect for PBC. Experienced respondents rated their perceived ability to buy a BEV much higher than inexperienced.
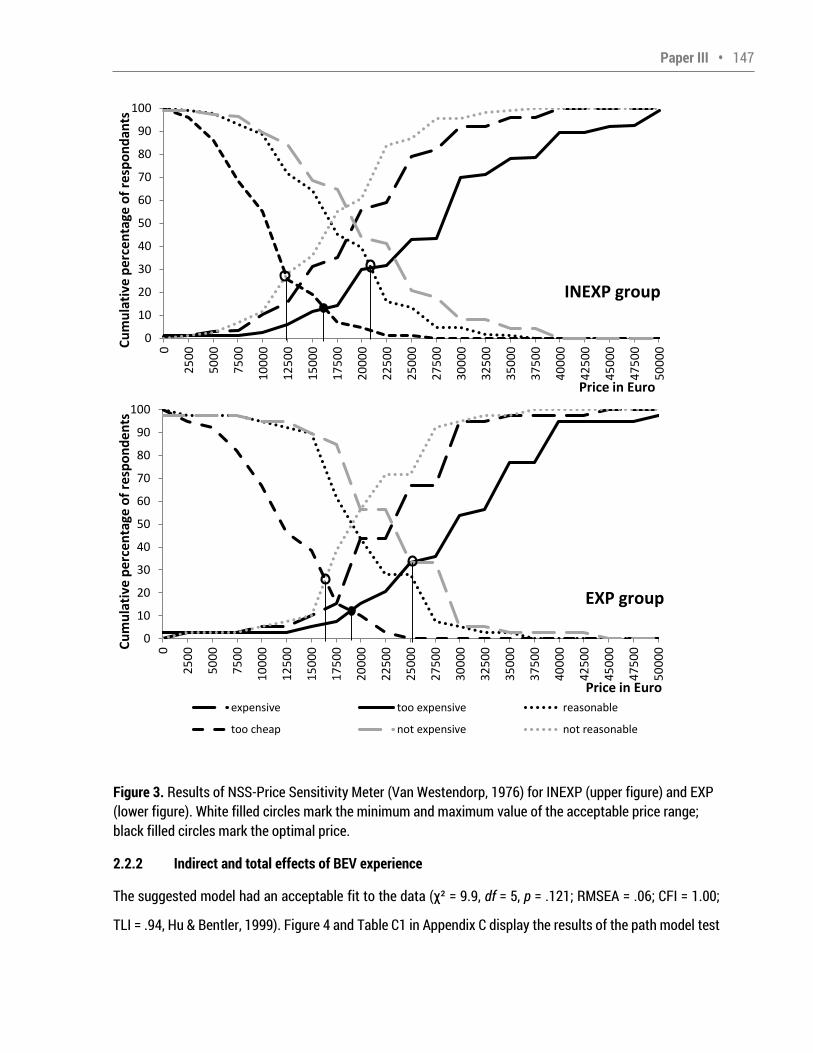
Paper III • 147 Figure 3. Results of NSS-Price Sensitivity Meter (Van Westendorp, 1976) for INEXP (upper figure) and EXP (lower figure). White filled circles mark the minimum and maximum value of the acceptable price range; black filled circles mark the optimal price. 2.2.2 Indirect and total effects of BEV experience The suggested model had an acceptable fit to the data (χ² = 9.9, df = 5, p = .121; RMSEA = .06; CFI = 1.00; TLI = .94, Hu & Bentler, 1999). Figure 4 and Table C1 in Appendix C display the results of the path model test 01020304050607080901000 2500 5000 7500 10000 12500 15000 17500 20000 22500 25000 27500 30000 32500 35000 37500 40000 42500 45000 47500 50000Cumulative pe
rcentage of respondants
Price in Euro
0102030405060708090100
0 2500 5000 7500 10000 12500 15000 17500 20000 22500 25000 27500 30000 32500 35000 37500 40000 42500 45000 47500 50000Cumulative percentage of re
spondents
Price in Euroexpensive too expensive reasonabletoo cheap not expensive not reasonable
INEXP group
EXP group
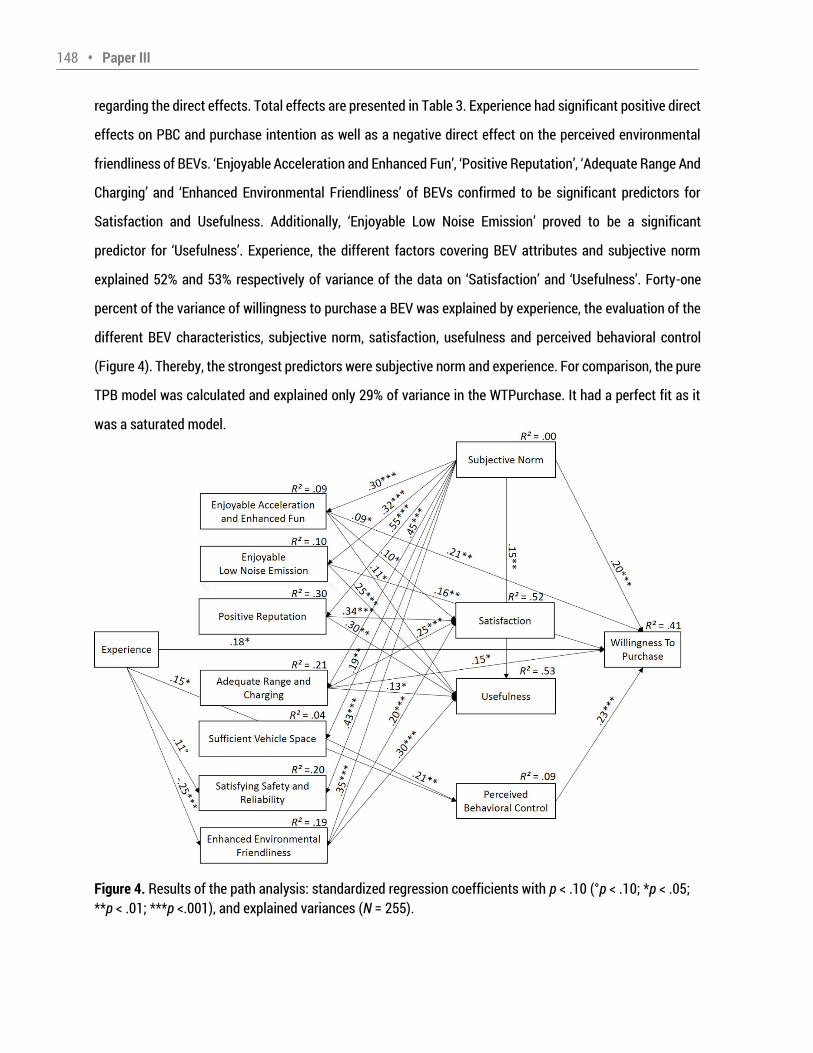
148 • Paper III regarding the direct effects. Total effects are presented in Table 3. Experience had significant positive direct effects on PBC and purchase intention as well as a negative direct effect on the perceived environmental friendliness of BEVs. Enjoyable Acceleration and Enhanced Fun , Positive Reputation , Adequate Range And
Charging and Enhanced Environmental Friendliness of BEVs confirmed to be significant predictors for
Satisfaction and Usefulness. Additionally, Enjoyable Low Noise Emission proved to be a significant predictor for Usefulness . Experience, the different factors covering BEV attributes and subjective norm
explained 52% and 53% respectively of variance of the data on Satisfaction and Usefulness . Forty-one percent of the variance of willingness to purchase a BEV was explained by experience, the evaluation of the different BEV characteristics, subjective norm, satisfaction, usefulness and perceived behavioral control (Figure 4). Thereby, the strongest predictors were subjective norm and experience. For comparison, the pure TPB model was calculated and explained only 29% of variance in the WTPurchase. It had a perfect fit as it was a saturated model. Figure 4. Results of the path analysis: standardized regression coefficients with p < .10 (°p < .10; *p < .05; **p < .01; ***p <.001), and explained variances (N = 255).
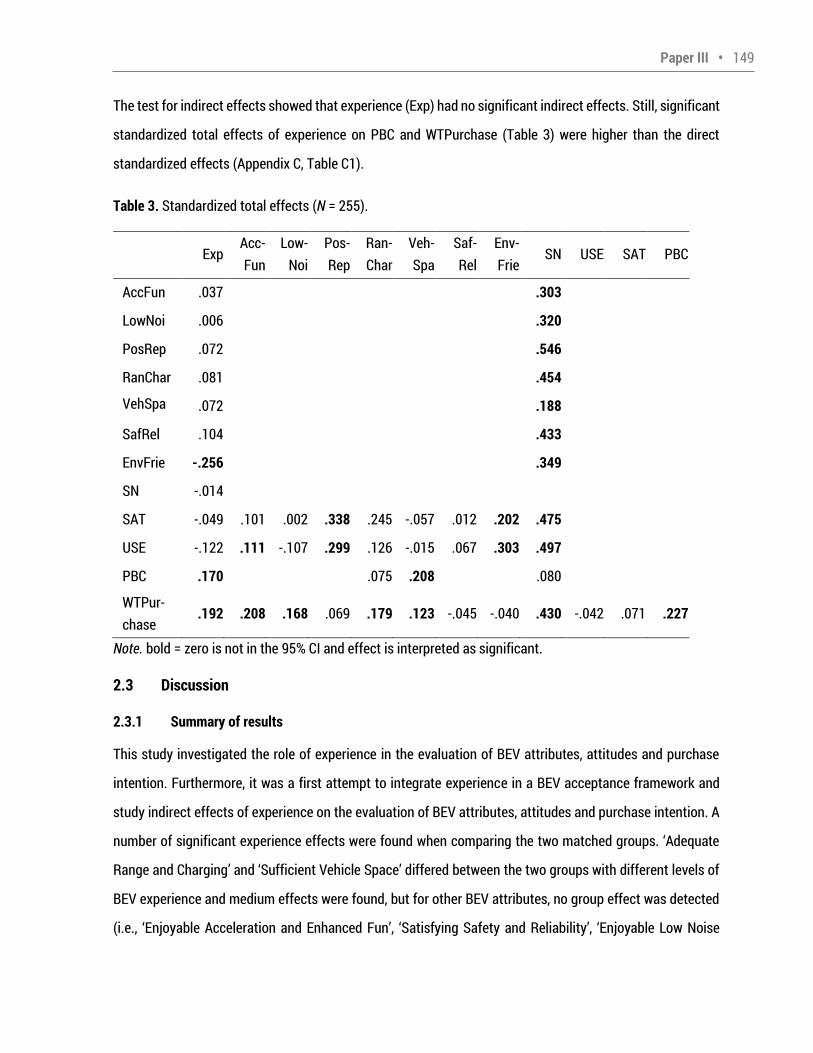
Paper III • 149 The test for indirect effects showed that experience (Exp) had no significant indirect effects. Still, significant standardized total effects of experience on PBC and WTPurchase (Table 3) were higher than the direct standardized effects (Appendix C, Table C1). Table 3. Standardized total effects (N = 255). Exp Acc-Fun Low-Noi Pos-Rep Ran-Char Veh-Spa Saf-Rel Env-Frie SN USE SAT PBC AccFun .037 .303 LowNoi .006 .320 PosRep .072 .546 RanChar .081 .454 VehSpa .072 .188 SafRel .104 .433 EnvFrie -.256 .349 SN -.014 SAT -.049 .101 .002 .338 .245 -.057 .012 .202 .475 USE -.122 .111 -.107 .299 .126 -.015 .067 .303 .497 PBC .170 .075 .208 .080 WTPur-chase .192 .208 .168 .069 .179 .123 -.045 -.040 .430 -.042 .071 .227 Note. bold = zero is not in the 95% CI and effect is interpreted as significant. 2.3 Discussion 2.3.1 Summary of results This study investigated the role of experience in the evaluation of BEV attributes, attitudes and purchase intention. Furthermore, it was a first attempt to integrate experience in a BEV acceptance framework and study indirect effects of experience on the evaluation of BEV attributes, attitudes and purchase intention. A number of significant experience effects were found when comparing the two matched groups. Adequate Range and Charging and Sufficient Vehicle Space differed between the two groups with different levels of BEV experience and medium effects were found, but for other BEV attributes, no group effect was detected (i.e., Enjoyable Acceleration and Enhanced Fun , Satisfying Safety and Reliability , Enjoyable Low Noise
150 • Paper III Emission , Enhanced Environmental Friendliness and Positive Reputation ). Regarding attitudes towards BEVs, no or only small effects of experience were found. Furthermore, the BEV-experienced group showed higher values regarding Perceived Behavioral Control , but no difference in Subjective Norm . Additionally,
the Willingness To Purchase and the acceptable price ranges (Van Westendorp, 1976) were higher for the EXP group than for the INEXP group. Contrary to this, the Willingness to Pay more for BEVs showed no difference. The analyses of factors predicting purchase intention concentrated on respondents who did not own a BEV. Experience proved to have significant total effects for Enhanced Environmental Friendliness , Perceived Behavioral Control and Willingness to Purchase , but no significant indirect effects were found. Many factors representing BEV attributes had significant impact on satisfaction, usefulness and purchase intention; more than 50% of the variance in attitude towards BEV could be explained by the evaluation of BEV attributes, experience and subjective norm. The complex model, including TPB factors and BEV attributes, explained about 10% more variance in purchase intention than the simple TPB model. Results of t-tests and path analysis showed different patterns of experience effects on the evaluation of BEV attributes what can be explained by either the nature of the used analyses (i.e., 98 data sets were used for t-tests with matched groups vs. 255 in path analyses) or the potential influence of socio-demographic variables. In path analyses subjective norm was included as second predictor besides experience and showed high impact on the evaluation of BEV attributes. So, subjective norm explains part of the covariance of experience and purchase intention what might have led to insignificant experience effects. The other explanation concerns the impact of socio-demographic variables. Former research had proved that age, gender, education (Plötz, Schneider, Globisch, & Dütschke, 2014) or environmental concerns (e.g., Moons & De Pelsmacker, 2015) affect BEV purchase intention. The test between the matched samples showed effects when those variables were equally distributed in both samples. In path analyses, we only analyzed the selected psychological variables as more factors than recommended had been already included in path analyses for a sample of the given size (Hair et al., 2010). 2.3.2 Implications Results regarding perceived BEV attributes indicate that BEV-experienced people (including BEV owners) seem to have fewer concerns regarding potential barriers such as range and charging than inexperienced
Paper III • 151 people. This is interesting, particularly because longitudinal studies with early adopters showed no change over usage time (Bühler, Cocron et al., 2014) or alternatively reported users as having more concerns regarding the satisfaction of mobility needs (Jensen et al., 2014). Early adopters might already have a more positive view on range and charging prior to testing a BEV, with this positive opinion remaining unchanged upon experiencing a BEV. Alternatively, expectations might not be met, with drivers then being less satisfied with the given range and charging options. One interesting question is whether non-adopters would change their opinions on these topics if they had the opportunity to test a BEV. The negative effect of experience on Enhanced Environmental Friendliness was somehow surprising, but might originate from the fact that BEV-experienced respondents are probably better informed about BEVs in general and about the discussion on the real environmental impact of BEVs depending on factors such as the energy mix used for recharging (Schill et al., 2015). So, they might be more critical regarding the real environmental benefit of BEVs which is reflected in their evaluation. This would also explain the negative effect of Enhanced Environmental Friendliness on purchase intention. Contrary to results of earlier studies (e.g., Bühler, Cocron et al., 2014), attributes referring functional aspects such as noise emission, acceleration and hedonic aspects did not differ between BEV-experienced or inexperienced drivers. Furthermore, neither attitude nor subjective norm differed between groups which is contrary to earlier findings (e.g., Carroll, 2010; Peters & Dütschke, 2014). One explanation is that BEVs and their special features are better known within the society than in times when earlier studies were conducted, so the evaluation of BEV attributes does not differentiate to such a great extend between groups with different levels of BEV experience. The perceived social pressure seems to be evaluated as lower than in former studies (Peters & Dütschke, 2014). However, these differences in results might be due to divergent definitions. In sum, BEV experience proved to have few effects, but still the total effects on purchase intention cannot be ignored. The question remains what leads to the difference in purchase intention between people with different experience levels. On the basis of this study, the perceived behavioral control regarding a BEV purchase seems of utter importance. Although BEV owners were excluded from the path analyses, existing BEV experience determined a higher perceived ability to perform a BEV purchase. This supports the assumption that more interested people might be better informed in terms of if and how they could purchase a BEV and
152 • Paper III may have considered if they could afford a BEV. Originally, Klöckner (2014) argued that subjective social norm influences goal intention in the pre-decisional stage and perceived behavioral control predicts behavioral intention in the pre-actional stage, but the latter could not be confirmed. As it is assumed that many Germans are still in the pre-decisional stage (Barth et al., 2016), the strong impact of Perceived Behavioral Control on purchase intention was surprising. This indicates that Germans might be in the transition phase from pre-decisional to a next stage, so that the perceived ability is becoming more and more relevant for developing intentions. That Klöckner (2014) did not find an effect of perceived behavioral control might be caused by the high market penetration (23.3% in 2015; International Energy Agency, 2016) in Norway. It indicates that purchasing a BEV is realizable. In Germany, the market share of BEVs is below 1% (International Energy Agency, 2016). Consequently, Germans perceived ability of purchasing a BEV might be lower and of higher relevance for developing their behavioral intentions compared to Norwegians perceived ability. In the present study, we focused on psychological factors that proved to be good indicators for predicting behavioral intention. Explained variance for purchase intention indicates that there are other influencing variables that might also be sensitive to changes in BEV experience and help to understand the processes that lead to the difference in behavioral acceptance between the two groups. To sum up, the missing group effects on potential influencing factors for acceptance, that are likely being affected by trying a BEV (e.g., evaluation of BEV attributes), raises the question if providing BEV experience to people is really a promising action when planning future strategies to enhance BEV acceptance. 2.3.3 Limitations and next steps The level of experience within the EXP group differed notably. Several respondents owned a BEV or repeatedly used a BEV, but many had only driven a BEV on one occasion. Having already purchased a BEV, BEV owners were therefore at a different stage in the purchase decision process (Klöckner, 2014) than people who might be in the initial stages of being interested in a BEV purchase, or who had only driven a BEV once. For BEV non-owners, that were included in the path model test, the question arises as to whether they had sought the hands-on experience (i.e., asked to test drive) or if their one-off driving opportunity had merely been coincidence. The next question requiring clarity is, if respondents already held a rather positive opinion regarding the different BEV attributes, whether experiencing the BEV strengthened this evaluation,
Paper III • 153 or whether their outlook became positive because they had had the opportunity to test a BEV and experienced it positively. Furthermore, when people had experiences with BEVs, it is unclear if the experience was good or bad, or which facets of the tested BEV were positive or negative. It must also be acknowledged that, existing BEVs differ in their characteristics, with this potentially also influencing the individual BEV user experience. 3 Study II: 24-hours test trial In Study I, the effect of BEV experience including different quantity and quality of experience was investigated; respondents who had driven a BEV once or repeatedly were all labelled as experienced and the variance, for instance, in experienced BEV types was left disregarded. Few effects of BEV experience were found and differences in purchase intention could hardly be explained. Based on findings of Study I, the value of an experience factor for explaining differences in acceptance is rather limited. The question arises if a better controlled, more restricted BEV experience factor reveals better insight on how BEV experience can affect BEV evaluation and acceptance. A short-term BEV experience in form of a test drive might be a powerful marketing strategy in order to increase the market success of BEVs (e.g., Burgess et al., 2013), but on basis of Study I this cannot be confirmed. Carroll (2010) reported that the intention to use or adopt a BEV is more positive and the expectations on BEV performance parameters was higher after a short test drive, but without providing statistical evidence. To investigate the effect of a more controlled, short-term BEV experience, we conducted a study in which the level of experience is manipulated by providing hands-on experience on a specific BEV. It allows the comparison of pre and post assessments to better understand the role of experience and the causality of relationships in a controlled setting. The same research questions as in Study I, except for indirect effects, were investigated in a pre-post design. The investigation of the many potential indirect effects within our theoretical framework needs a sample size that was not realizable for the test trial. 3.1 Methods 3.1.1 Study design In the 24-hours test trial, data was collected before (T0) and after (T1) the test drive. Before the first data assessment, participants got an introduction to the study including information about the test vehicle and their task (i.e., test the BEV in their daily routine, incorporating journeys such as their commute to work).
154 • Paper III 3.1.2 Participants Potential participants could apply for studies with a BEV via an online tool which was advertised through the local press and a website. Thirty participants who fulfilled certain criteria (i.e., held a driver s licence for a minimum of 5 years, and had no prior experience with BEVs) and showed the largest possible variance in socio-demographic variables were selected. The sample (3 females, 27 males) had a mean age of 46 (SD = 10.5) years. Participants scored on average 4.15 (SD = 1.12) for Environmental Concerns (Oreg & Katz-Gerro, 2006) and 2.97 (SD = 1.15) for Subjective Knowledge (see section 2.1.2). Appendix A, Table A2 presents more detailed sample characteristics. During the test drive, participants drove on average 96.5 km (SD = 34.2; Min = 33 km, Max = 206 km). 3.1.3 Questionnaires To allow for the comparison of results, the applied scales paralleled those used in the online survey (see section 2.2; Appendix B, Table B1). Scales regarding the BEV attributes, attitudes towards BEVs, subjective norm, willingness to purchase and pay were completed prior to and after the test drive. If necessary, wording of the items was slightly adapted in the post test drive questionnaire (e.g., T0: I would like the racy acceleration of the MINI E. vs. T1: I like the racy acceleration of the MINI E. ). Reliability of the scales was acceptable (.62 < α < .91, Hair et al., 2010). All other scales (e.g., PBC) were implemented before the test drive. 3.1.4 Test vehicle In Study II, the BEV that was referred to in the online study to ensure standardization was used as the test vehicle (see section 2.2). 3.2 Results Data was analyzed using t-tests for paired samples, linear mixed models (LMM) and multiple linear regression analyses. To account for the within-subject design, LMMs with a random effect for participant (intercept) and fixed effects for all other predictors were calculated using the package lme4 (Bates, Maechler, Bolker, & Walker, 2015) in R 3.2.2 (R Core Team, 2015). For analyzing if changes in predicting variables such as the evaluation of BEV attributes can explain differences in attitudinal and behavioral acceptance, regression analyses with difference scores (variable T1 variable T0) of all repeatedly assessed variables were calculated. As the sample was relatively small, complexity of the models was reduced by
Paper III • 155 including only BEV attributes that had proved to affect the attitude in Study I; Sufficient Vehicle Space and
Satisfying Safety and Reliability were excluded. For predicting purchase intention and its change respectively, attitude, subjective norm and the evaluation of selected BEV attributes (AccFun, LowNoi, RanChar) served as predictors, because they had proved significance in Study I. As power might be low, effect sizes are in the focus for interpretation instead of significance values. In accordance with Grubbs (1969), all variables were tested for univariate outliers; eight values were excluded. 3.2.1 Descriptive statistics and differences between pre and post assessments Evaluation of BEV attributes and experience. Most BEV attributes were rated significantly differently after the test drive (Table 4). T-tests revealed large effects for Enjoyable Low Noise Emission (LowNoi) and Enhanced
Environmental Friendliness (EnvFrie) as well as medium effects for Enjoyable Acceleration and Enhanced Fun (AccFun), Positive Reputation (PosRep) and Satisfying Safety and Reliability (SafRel, Table 4). Vehicle space was rated as less sufficient after gaining experience. The perceived adequateness of range and charging did not differ between the points of data collection. Attitude towards BEVs, purchase intention, willingness to pay and experience. Only the difference in Satisfaction was significant with a rather small effect size (Table 4). Participants perceived the BEV as satisfying and useful. No significant differences were found for willingness to purchase or to pay, and pre/post effects were small. Participants were neither more willing to purchase nor willing to pay more for BEVs. Acceptable price ranges however were larger, with the minimum as well as the maximum amounts being higher at T1 (Figure 5). Subjective norm and experience. In addition to the significances outlined above, the scores on subjective norm also significantly increased from T0 to T1 and time of measurement had a medium effect. This finding supports our hypothesis.
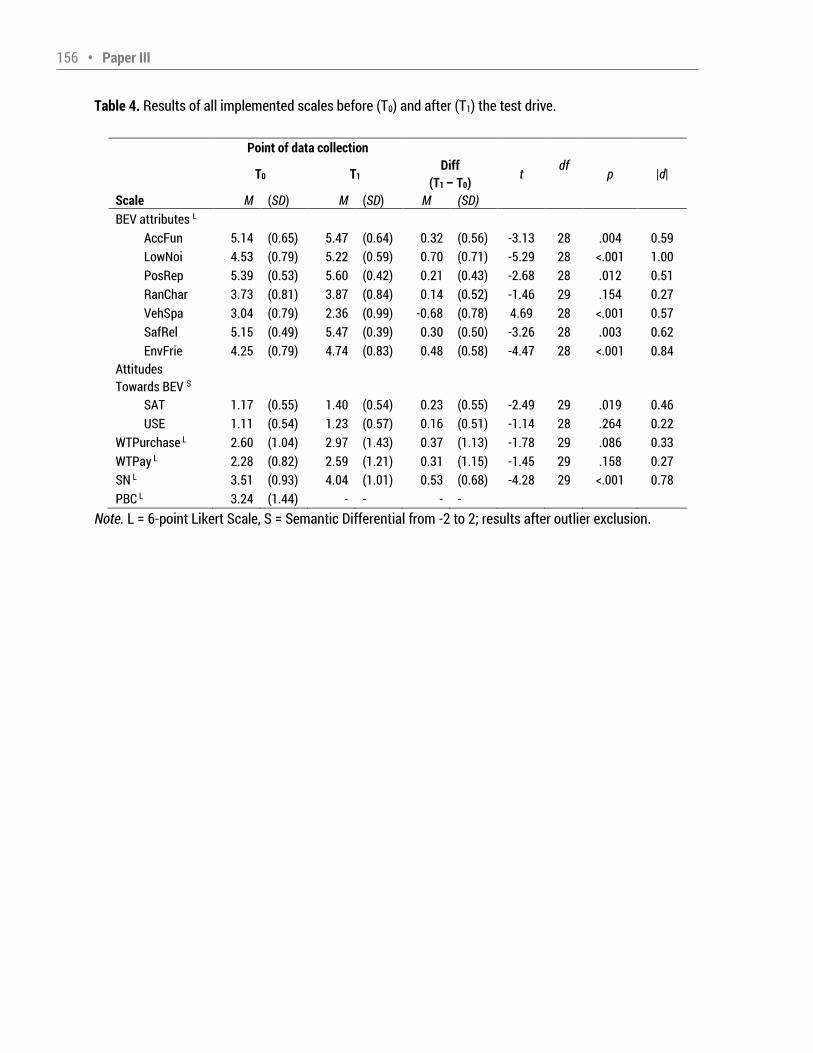
156 • Paper III Table 4. Results of all implemented scales before (T0) and after (T1) the test drive. Point of data collection t p |d| T0 T1 Diff (T1 – T0) df Scale M (SD) M (SD) M (SD) BEV attributes L AccFun 5.14 (0.65) 5.47 (0.64) 0.32 (0.56) -3.13 28 .004 0.59 LowNoi 4.53 (0.79) 5.22 (0.59) 0.70 (0.71) -5.29 28 <.001 1.00 PosRep 5.39 (0.53) 5.60 (0.42) 0.21 (0.43) -2.68 28 .012 0.51 RanChar 3.73 (0.81) 3.87 (0.84) 0.14 (0.52) -1.46 29 .154 0.27 VehSpa 3.04 (0.79) 2.36 (0.99) -0.68 (0.78) 4.69 28 <.001 0.57 SafRel 5.15 (0.49) 5.47 (0.39) 0.30 (0.50) -3.26 28 .003 0.62 EnvFrie 4.25 (0.79) 4.74 (0.83) 0.48 (0.58) -4.47 28 <.001 0.84 Attitudes Towards BEV S SAT 1.17 (0.55) 1.40 (0.54) 0.23 (0.55) -2.49 29 .019 0.46 USE 1.11 (0.54) 1.23 (0.57) 0.16 (0.51) -1.14 28 .264 0.22 WTPurchase L 2.60 (1.04) 2.97 (1.43) 0.37 (1.13) -1.78 29 .086 0.33 WTPay L 2.28 (0.82) 2.59 (1.21) 0.31 (1.15) -1.45 29 .158 0.27 SN L 3.51 (0.93) 4.04 (1.01) 0.53 (0.68) -4.28 29 <.001 0.78 PBC L 3.24 (1.44) - - - - Note. L = 6-point Likert Scale, S = Semantic Differential from -2 to 2; results after outlier exclusion.
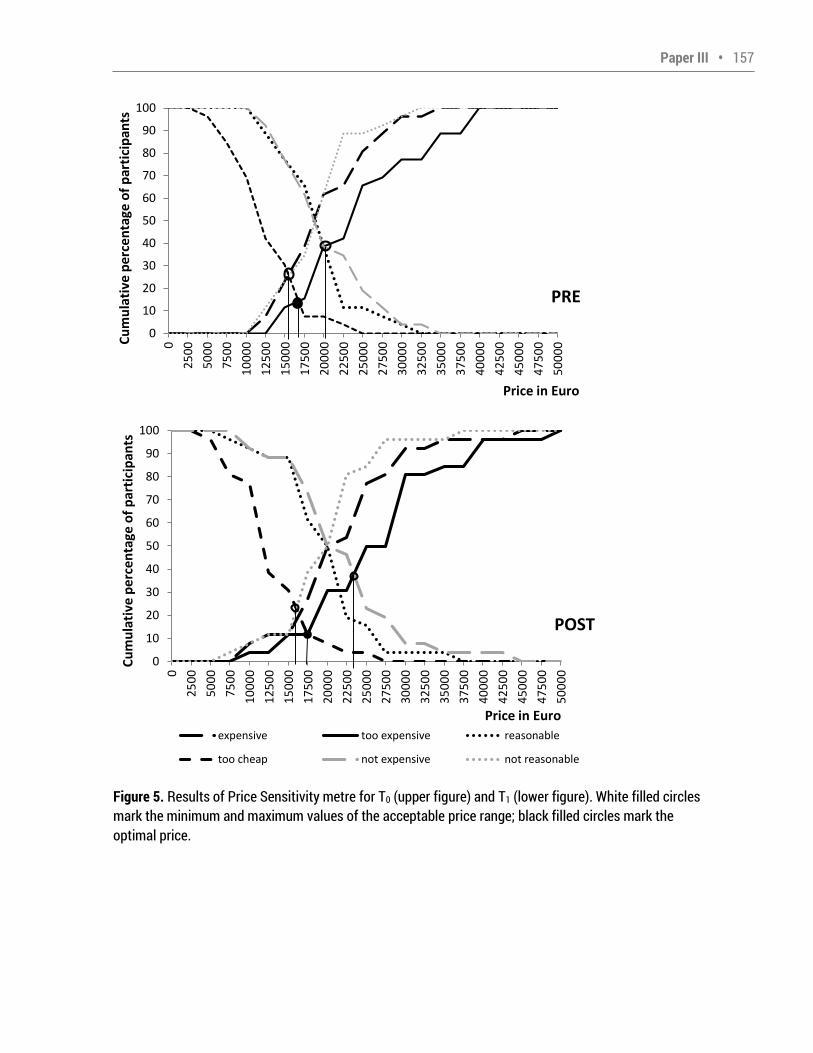
Paper III • 157 Figure 5. Results of Price Sensitivity metre for T0 (upper figure) and T1 (lower figure). White filled circles mark the minimum and maximum values of the acceptable price range; black filled circles mark the optimal price.
01020304050607080901000 2500 5000 7500 10000 12500 15000 17500 20000 22500 25000 27500 30000 32500 35000 37500 40000 42500 45000 47500 50000Cumulative pe
rcentage of participants
Price in Euro
0102030405060708090100
0 2500 5000 7500 10000 12500 15000 17500 20000 22500 25000 27500 30000 32500 35000 37500 40000 42500 45000 47500 50000Cumulative percentage of pa
rticipants
Price in Euroexpensive too expensive reasonabletoo cheap not expensive not reasonable
PRE
POST
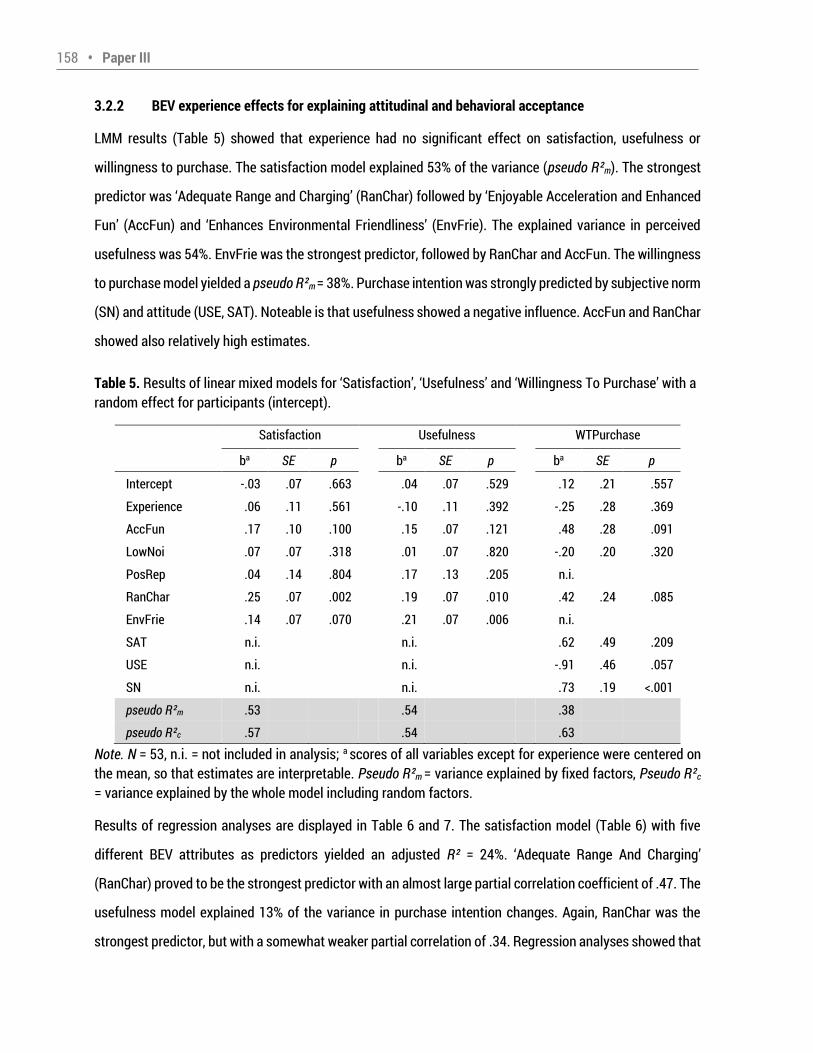
158 • Paper III 3.2.2 BEV experience effects for explaining attitudinal and behavioral acceptance LMM results (Table 5) showed that experience had no significant effect on satisfaction, usefulness or willingness to purchase. The satisfaction model explained 53% of the variance (pseudo R²m). The strongest predictor was Adequate Range and Charging (RanChar) followed by Enjoyable Acceleration and Enhanced Fun (AccFun) and Enhances Environmental Friendliness (EnvFrie). The explained variance in perceived usefulness was 54%. EnvFrie was the strongest predictor, followed by RanChar and AccFun. The willingness to purchase model yielded a pseudo R²m = 38%. Purchase intention was strongly predicted by subjective norm (SN) and attitude (USE, SAT). Noteable is that usefulness showed a negative influence. AccFun and RanChar showed also relatively high estimates. Table 5. Results of linear mixed models for Satisfaction , Usefulness and Willingness To Purchase with a random effect for participants (intercept). Satisfaction Usefulness WTPurchase ba SE p ba SE p ba SE p Intercept -.03 .07 .663 .04 .07 .529 .12 .21 .557 Experience .06 .11 .561 -.10 .11 .392 -.25 .28 .369 AccFun .17 .10 .100 .15 .07 .121 .48 .28 .091 LowNoi .07 .07 .318 .01 .07 .820 -.20 .20 .320 PosRep .04 .14 .804 .17 .13 .205 n.i. RanChar .25 .07 .002 .19 .07 .010 .42 .24 .085 EnvFrie .14 .07 .070 .21 .07 .006 n.i. SAT n.i. n.i. .62 .49 .209 USE n.i. n.i. -.91 .46 .057 SN n.i. n.i. .73 .19 <.001 pseudo R²m .53 .54 .38 pseudo R²c .57 .54 .63 Note. N = 53, n.i. = not included in analysis; a scores of all variables except for experience were centered on the mean, so that estimates are interpretable. Pseudo R²m = variance explained by fixed factors, Pseudo R²c = variance explained by the whole model including random factors. Results of regression analyses are displayed in Table 6 and 7. The satisfaction model (Table 6) with five different BEV attributes as predictors yielded an adjusted R² = 24%. Adequate Range And Charging (RanChar) proved to be the strongest predictor with an almost large partial correlation coefficient of .47. The usefulness model explained 13% of the variance in purchase intention changes. Again, RanChar was the strongest predictor, but with a somewhat weaker partial correlation of .34. Regression analyses showed that
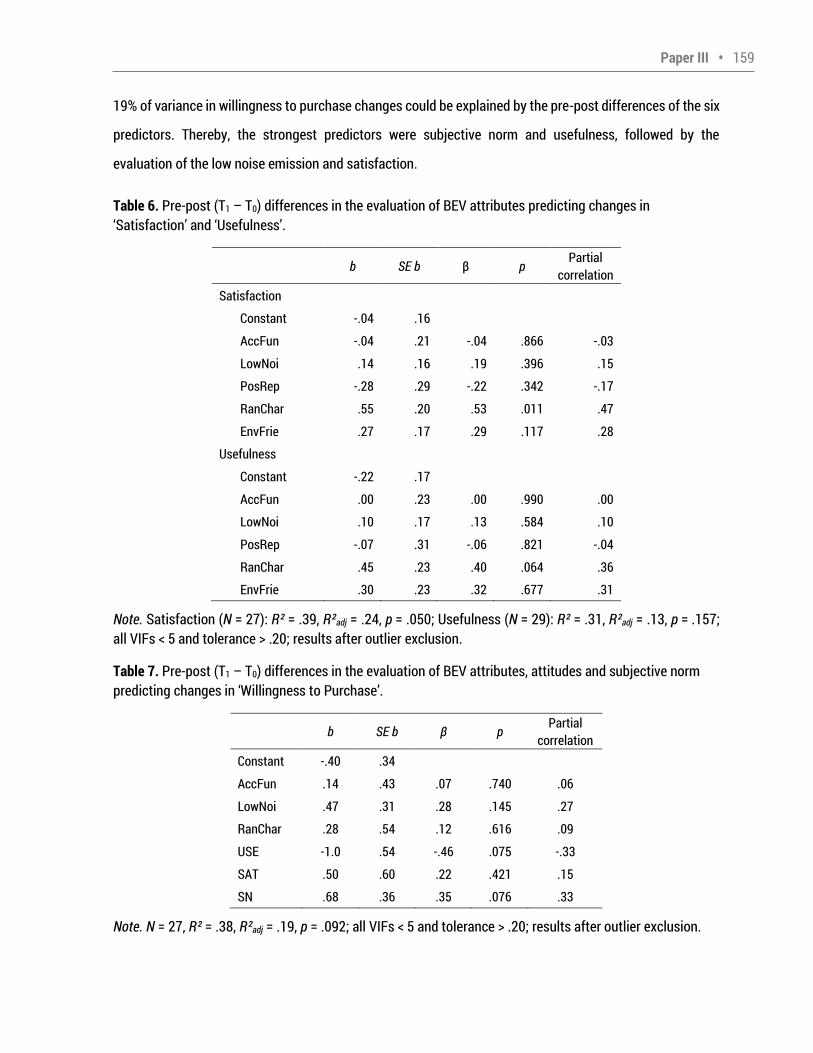
Paper III • 159 19% of variance in willingness to purchase changes could be explained by the pre-post differences of the six predictors. Thereby, the strongest predictors were subjective norm and usefulness, followed by the evaluation of the low noise emission and satisfaction. Table 6. Pre-post (T1 T0) differences in the evaluation of BEV attributes predicting changes in Satisfaction and Usefulness . b SE b β p Partial correlation Satisfaction Constant -.04 .16 AccFun -.04 .21 -.04 .866 -.03 LowNoi .14 .16 .19 .396 .15 PosRep -.28 .29 -.22 .342 -.17 RanChar .55 .20 .53 .011 .47 EnvFrie .27 .17 .29 .117 .28 Usefulness Constant -.22 .17 AccFun .00 .23 .00 .990 .00 LowNoi .10 .17 .13 .584 .10 PosRep -.07 .31 -.06 .821 -.04 RanChar .45 .23 .40 .064 .36 EnvFrie .30 .23 .32 .677 .31 Note. Satisfaction (N = 27): R² = .39, R²adj = .24, p = .050; Usefulness (N = 29): R² = .31, R²adj = .13, p = .157; all VIFs < 5 and tolerance > .20; results after outlier exclusion. Table 7. Pre-post (T1 T0) differences in the evaluation of BEV attributes, attitudes and subjective norm predicting changes in Willingness to Purchase . b SE b β p Partial correlation Constant -.40 .34 AccFun .14 .43 .07 .740 .06 LowNoi .47 .31 .28 .145 .27 RanChar .28 .54 .12 .616 .09 USE -1.0 .54 -.46 .075 -.33 SAT .50 .60 .22 .421 .15 SN .68 .36 .35 .076 .33 Note. N = 27, R² = .38, R²adj = .19, p = .092; all VIFs < 5 and tolerance > .20; results after outlier exclusion.
160 • Paper III 3.3 Discussion 3.3.1 Summary of results In this study the role of experience for the evaluation of BEV attributes, attitude and purchase intention was investigated via a pre-post comparison during a 24-hours test drive. A number of direct experience effects were found via t-test analyses. Except for Adequate Range and Charging , the evaluation of all BEV attributes
(e.g., Enjoyable Acceleration and Enhanced Fun , Enjoyable Low Noise Emission ) differed between pre and post assessments. Regarding attitude towards BEVs, only the level of Satisfaction was dependent on the
level of experience. Results on Usefulness showed no difference between the two points of data collection. For willingness to purchase a marginal significant, small positive experience effect was found. Acceptable price ranges (Van Westendorp, 1976) were higher after the test. Contrary, the willingness to pay showed no difference. In support of hypothesis, subjective norm was more positive after the test drive than before. Results of LMM showed that experience is neither a relevant predictor for attitudinal nor behavioral acceptance. Part of the reported effects of Study I could be replicated. Analyses showed, for example, a high predictive value of the evaluation of range and charging as well as environmental friendliness for attitude and the strong impact of subjective norm on purchase intention. The negative impact of perceived usefulness on purchase intention is contrary to expectations as well as results of Study I and needs further investigation. In sum, high percentages of variance in attitudes (53-54%) and purchase intention (38%) was explained by the predictors. Regression analyses with difference scores indicate that changes in predictors can explain 13-24% of the variance in changes in acceptance scores. 3.3.2 Implications Results of t-tests relating to perceived BEV attributes indicate that after experiencing a BEV, people have fewer concerns regarding the often discussed topic of low noise emission, and advantages such as acceleration and fun are more salient. This is in line with former results (e.g., Bühler, Cocron et al., 2014; Cocron, Bachl, Früh, Koch, & Krems, 2014). The negative impact of a more positive evaluation of low noise on purchase intention is contrary to expectations as well as results of Study I and needs further investigation. Another contrary effect compared to Study I is that the evaluation of environmental friendliness profits from the test drive. A short-term experience with a BEV shows that no local emissions are produced, but does not give further information on the debate of the environmental friendliness of BEVs. Thus, the difference
Paper III • 161 between results is explicable and indicates that experience effects assessed between and within individuals are not necessarily comparable. The evaluation of range and charging did not change and adequacy of these aspects was rated as low. This indicates that although range anxiety seems to decrease in a test drive (Rauh, Franke, & Krems, 2015), range and charging remain a barrier. This might be one reason why the medium to large, positive experience effects on almost all other BEV attributes, satisfaction and subjective norm did hardly reflect in purchase intention. The evaluation of range and charging is of high importance as it is one of the strongest predictors for attitude and proved to have a moderate effect on purchase intention. Upcoming BEVs provide already higher levels of available range. Reducing this barrier might change the effect of providing BEV experience and it is worth investigating if the positive effect of a test drive can change purchase intention when the range barrier is reduced or even eliminated. The study showed that the evaluation of selected BEV attributes is of importance for building attitude and purchase intention. The new information acquired through driving the BEV or at least part of this information is most likely stored in memory and immediately influences the evaluation of BEV attributes. External influences via the social environment remain the strongest predictor for purchase intention. Subjective norm was affected by experience and differences between pre and post assessments predicted changes in purchase intention. This points out a potential indirect effect of experience. It is possible that during the 24-hours test drive important parts of participants social environment such as family and friends got involved, gained knowledge and were positively influenced which resulted in a more positive subjective norm. 3.3.3 Limitations This study observed various changes engendered by a BEV test drive in people that have never previously driven a BEV. This is an interesting case to investigate given that the number of BEV owners is still limited in many countries, with the concept of BEVs still being considered new to many people. It remains unclear however under which conditions a short test drive would not have the reported effects. It must also be acknowledged that participants applied to take part in the study, so they might present a population that is overly interested in BEVs in comparison with the general public. Future studies should therefore investigate if a short test drive could also influence the evaluation of BEV attributes and satisfaction with BEVs in
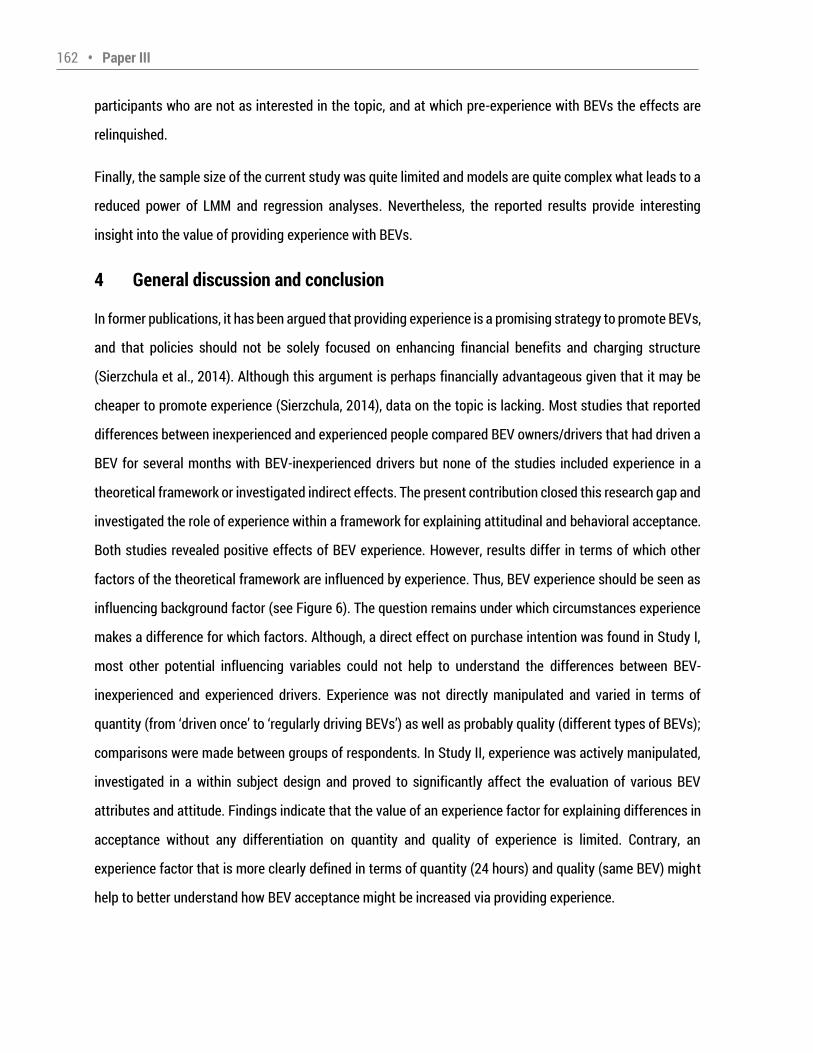
162 • Paper III participants who are not as interested in the topic, and at which pre-experience with BEVs the effects are relinquished. Finally, the sample size of the current study was quite limited and models are quite complex what leads to a reduced power of LMM and regression analyses. Nevertheless, the reported results provide interesting insight into the value of providing experience with BEVs. 4 General discussion and conclusion In former publications, it has been argued that providing experience is a promising strategy to promote BEVs, and that policies should not be solely focused on enhancing financial benefits and charging structure (Sierzchula et al., 2014). Although this argument is perhaps financially advantageous given that it may be cheaper to promote experience (Sierzchula, 2014), data on the topic is lacking. Most studies that reported differences between inexperienced and experienced people compared BEV owners/drivers that had driven a BEV for several months with BEV-inexperienced drivers but none of the studies included experience in a theoretical framework or investigated indirect effects. The present contribution closed this research gap and investigated the role of experience within a framework for explaining attitudinal and behavioral acceptance. Both studies revealed positive effects of BEV experience. However, results differ in terms of which other factors of the theoretical framework are influenced by experience. Thus, BEV experience should be seen as influencing background factor (see Figure 6). The question remains under which circumstances experience makes a difference for which factors. Although, a direct effect on purchase intention was found in Study I, most other potential influencing variables could not help to understand the differences between BEV-inexperienced and experienced drivers. Experience was not directly manipulated and varied in terms of quantity (from driven once to regularly driving BEVs ) as well as probably quality (different types of BEVs); comparisons were made between groups of respondents. In Study II, experience was actively manipulated, investigated in a within subject design and proved to significantly affect the evaluation of various BEV attributes and attitude. Findings indicate that the value of an experience factor for explaining differences in acceptance without any differentiation on quantity and quality of experience is limited. Contrary, an experience factor that is more clearly defined in terms of quantity (24 hours) and quality (same BEV) might help to better understand how BEV acceptance might be increased via providing experience.
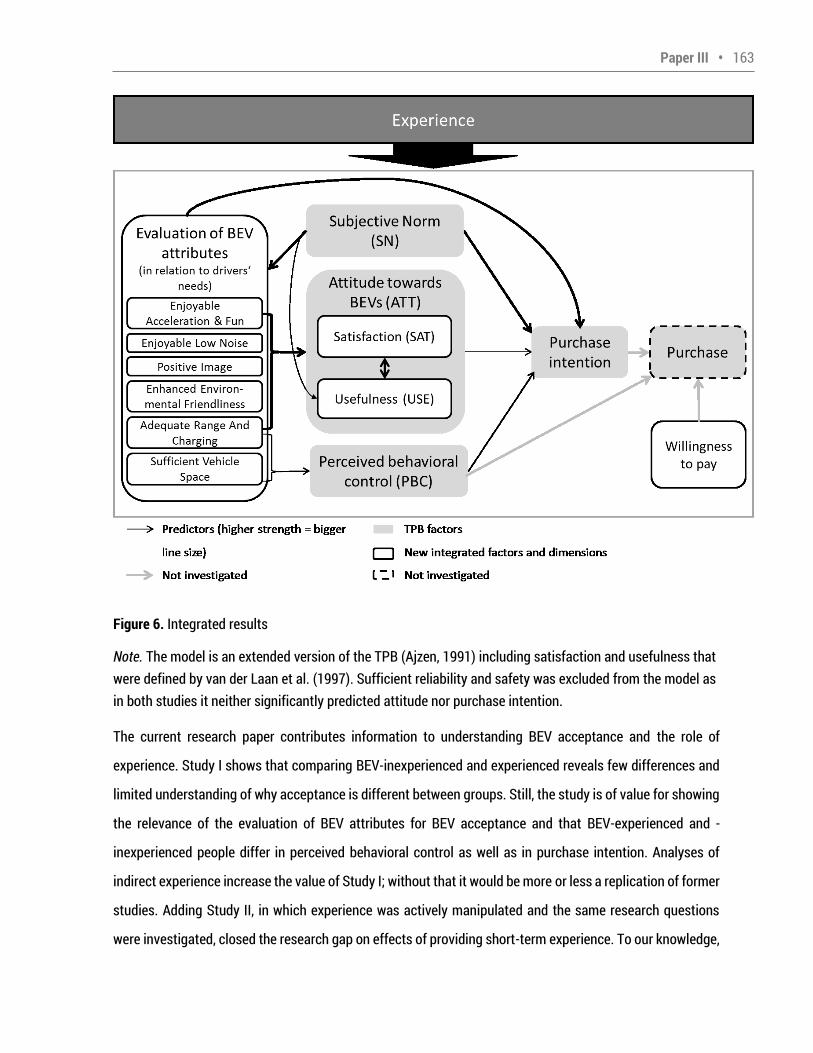
Paper III • 163 Figure 6. Integrated results Note. The model is an extended version of the TPB (Ajzen, 1991) including satisfaction and usefulness that were defined by van der Laan et al. (1997). Sufficient reliability and safety was excluded from the model as in both studies it neither significantly predicted attitude nor purchase intention. The current research paper contributes information to understanding BEV acceptance and the role of experience. Study I shows that comparing BEV-inexperienced and experienced reveals few differences and limited understanding of why acceptance is different between groups. Still, the study is of value for showing the relevance of the evaluation of BEV attributes for BEV acceptance and that BEV-experienced and -inexperienced people differ in perceived behavioral control as well as in purchase intention. Analyses of indirect experience increase the value of Study I; without that it would be more or less a replication of former studies. Adding Study II, in which experience was actively manipulated and the same research questions were investigated, closed the research gap on effects of providing short-term experience. To our knowledge,
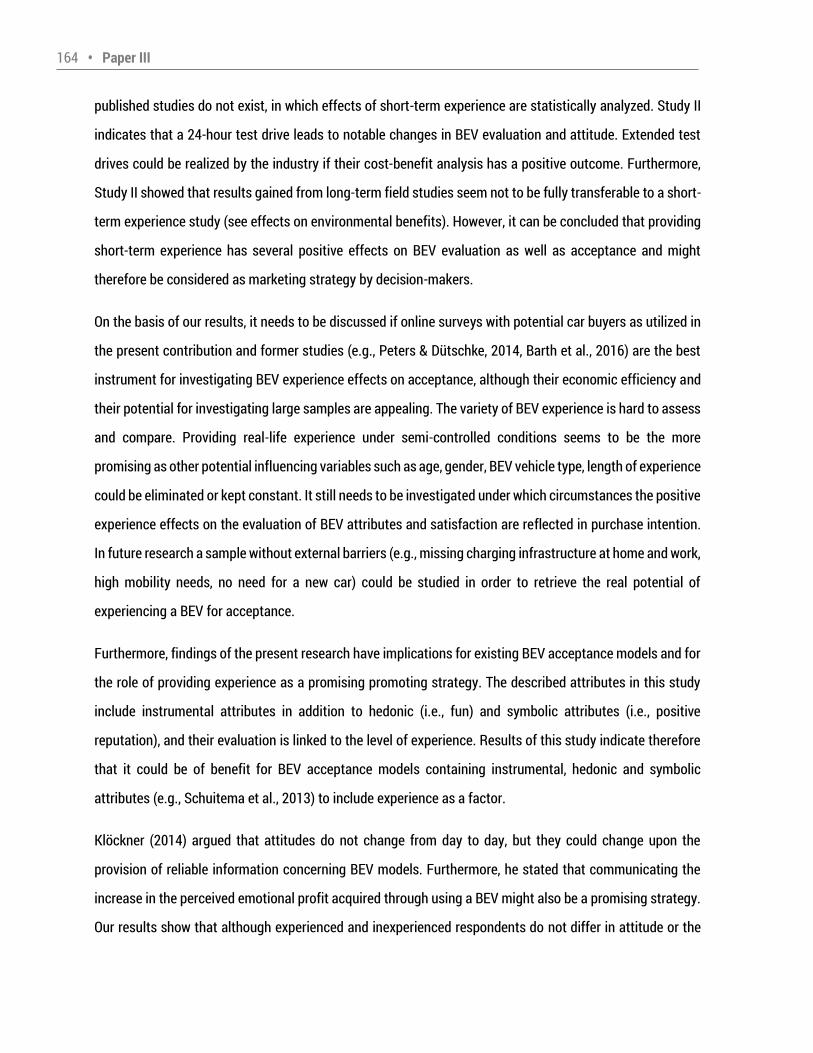
164 • Paper III published studies do not exist, in which effects of short-term experience are statistically analyzed. Study II indicates that a 24-hour test drive leads to notable changes in BEV evaluation and attitude. Extended test drives could be realized by the industry if their cost-benefit analysis has a positive outcome. Furthermore, Study II showed that results gained from long-term field studies seem not to be fully transferable to a short-term experience study (see effects on environmental benefits). However, it can be concluded that providing short-term experience has several positive effects on BEV evaluation as well as acceptance and might therefore be considered as marketing strategy by decision-makers. On the basis of our results, it needs to be discussed if online surveys with potential car buyers as utilized in the present contribution and former studies (e.g., Peters & Dütschke, 2014, Barth et al., 2016) are the best instrument for investigating BEV experience effects on acceptance, although their economic efficiency and their potential for investigating large samples are appealing. The variety of BEV experience is hard to assess and compare. Providing real-life experience under semi-controlled conditions seems to be the more promising as other potential influencing variables such as age, gender, BEV vehicle type, length of experience could be eliminated or kept constant. It still needs to be investigated under which circumstances the positive experience effects on the evaluation of BEV attributes and satisfaction are reflected in purchase intention. In future research a sample without external barriers (e.g., missing charging infrastructure at home and work, high mobility needs, no need for a new car) could be studied in order to retrieve the real potential of experiencing a BEV for acceptance. Furthermore, findings of the present research have implications for existing BEV acceptance models and for the role of providing experience as a promising promoting strategy. The described attributes in this study include instrumental attributes in addition to hedonic (i.e., fun) and symbolic attributes (i.e., positive reputation), and their evaluation is linked to the level of experience. Results of this study indicate therefore that it could be of benefit for BEV acceptance models containing instrumental, hedonic and symbolic attributes (e.g., Schuitema et al., 2013) to include experience as a factor. Klöckner (2014) argued that attitudes do not change from day to day, but they could change upon the provision of reliable information concerning BEV models. Furthermore, he stated that communicating the increase in the perceived emotional profit acquired through using a BEV might also be a promising strategy. Our results show that although experienced and inexperienced respondents do not differ in attitude or the
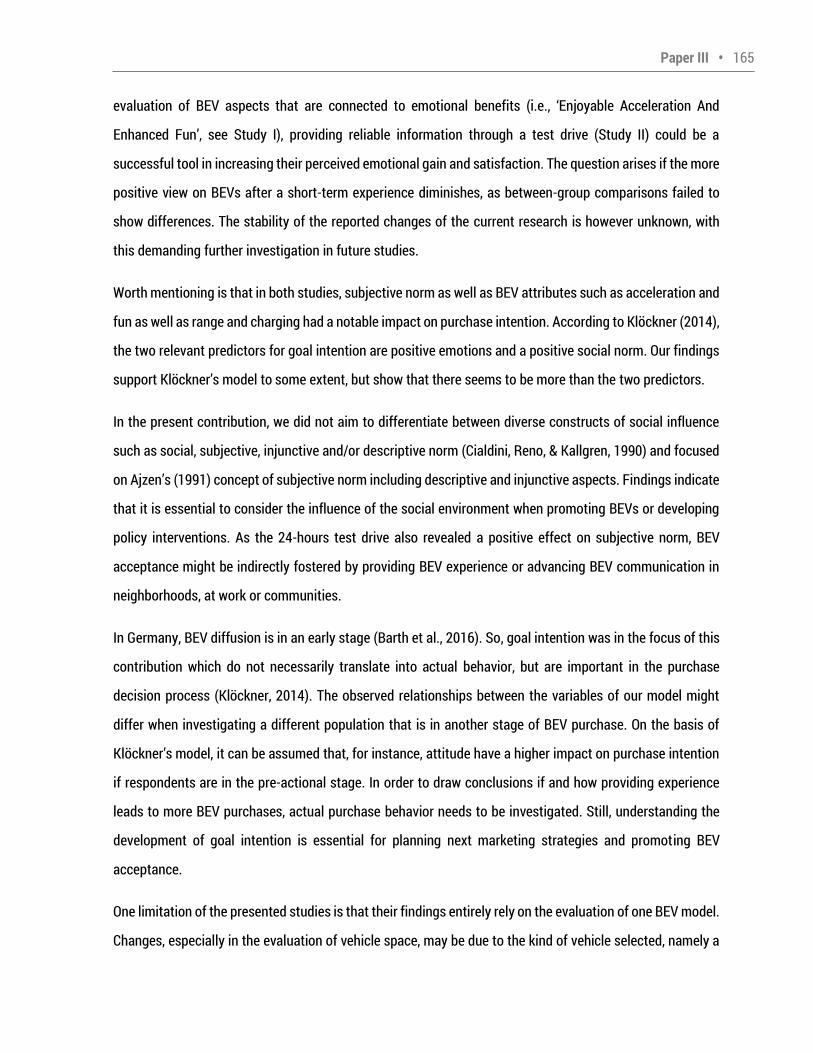
Paper III • 165 evaluation of BEV aspects that are connected to emotional benefits (i.e., Enjoyable Acceleration And
Enhanced Fun , see Study I), providing reliable information through a test drive (Study II) could be a successful tool in increasing their perceived emotional gain and satisfaction. The question arises if the more positive view on BEVs after a short-term experience diminishes, as between-group comparisons failed to show differences. The stability of the reported changes of the current research is however unknown, with this demanding further investigation in future studies. Worth mentioning is that in both studies, subjective norm as well as BEV attributes such as acceleration and fun as well as range and charging had a notable impact on purchase intention. According to Klöckner (2014), the two relevant predictors for goal intention are positive emotions and a positive social norm. Our findings support Klöckner s model to some extent, but show that there seems to be more than the two predictors. In the present contribution, we did not aim to differentiate between diverse constructs of social influence such as social, subjective, injunctive and/or descriptive norm (Cialdini, Reno, & Kallgren, 1990) and focused on Ajzen s (1991) concept of subjective norm including descriptive and injunctive aspects. Findings indicate that it is essential to consider the influence of the social environment when promoting BEVs or developing policy interventions. As the 24-hours test drive also revealed a positive effect on subjective norm, BEV acceptance might be indirectly fostered by providing BEV experience or advancing BEV communication in neighborhoods, at work or communities. In Germany, BEV diffusion is in an early stage (Barth et al., 2016). So, goal intention was in the focus of this contribution which do not necessarily translate into actual behavior, but are important in the purchase decision process (Klöckner, 2014). The observed relationships between the variables of our model might differ when investigating a different population that is in another stage of BEV purchase. On the basis of Klöckner s model, it can be assumed that, for instance, attitude have a higher impact on purchase intention if respondents are in the pre-actional stage. In order to draw conclusions if and how providing experience leads to more BEV purchases, actual purchase behavior needs to be investigated. Still, understanding the development of goal intention is essential for planning next marketing strategies and promoting BEV acceptance. One limitation of the presented studies is that their findings entirely rely on the evaluation of one BEV model. Changes, especially in the evaluation of vehicle space, may be due to the kind of vehicle selected, namely a
166 • Paper III converted ICE. Other BEVs are however comparable in many ways, for instance in range and charging, low noise emission, acceleration and environmental friendliness. It would be beneficial for future studies to investigate the applicability of this study s results to other types of BEVs. The present research explored the role of experiencing BEVs in the evaluation of BEV attributes and their acceptance, and found that experience should be included in discussions about BEV acceptance and purchase decision models. Providing experience may prove a promising tool in developing marketing strategies and policies that aim to change the evaluation of BEVs and their attributes, with the aim of increasing BEV adoption. Acknowledgements The presented field test was part of the project MINI E powered by Vattenfall V2.0 which was funded by the German Federal Ministry for the Environment, Nature Conservation and Nuclear Safety. Statements in this paper reflect the authors views and do not necessarily reflect those of the German Federal Ministry for the Environment, Nature Conservation and Nuclear Safety or of other partners involved in the project. We thank our consortium partners BMW Group (J. Weber, A. Keinath, R. Vilimek) and Vattenfall Europe AG (A. Weber, F. Schuth, C. F. Eckhardt) who gave us the opportunity to conduct our research. We especially thank Thomas Franke, Peter Cocron, Katja Schleinitz and Luise Franke-Bartholdt for their hard work in the project MINI E 2.0. Furthermore, these in-depth analyses would not be possible without the financial help provided by the scholarship from the SAB (Sächsische Aufbaubank) and the European Social Fund (ESF). We also thank Laura Buchinger for her support in working on her Bachelor thesis.
Paper III • 167 References Ajzen, I. (1991). The theory of planned behaviour. Organizational Behavior and Human Decision Processes, 50(2), 179 211. doi:10.1016/0749-5978(91)90020-T Ajzen, I., & Fishbein, M. (2005). The influence of attitudes on behaviour. In D. Albarracín, B. T. Johnson, & M. P. Zanna (Ed.), The influence of attitudes on behaviour. The handbook of attitudes (pp. 173 221). Mahwah, NJ: Erlbaum. Aral Aktiengesellschaft. (2013). Aral Studie – Trends beim Autokauf. Retrieved from: http://www.aral.de/content/dam/aral/pdf/Brosch%C3%BCren/aral_studie_trends_beim_autokauf_2013.pdf. Arbuckle, J. L. (2014). Amos (Version 23.0) [Computer Program]. Chicago: IBM SPSS. Arndt, S. (2011). Evaluierung der Akzeptanz von Fahrerassistenzsystemen: Modell zum Kaufverhalten von Endkunden. Wiesbaden: VS Verlag für Sozialwissenschaften / Springer Fachmedien Wiesbaden GmbH Wiesbaden. Retrieved from http://dx.doi.org/10.1007/978-3-531-93197-5 Bakker, S., & Trip, J. J. (2013). Policy options to support the adoption of electric vehicles in the urban environment. Transportation Research Part D: Transport and Environment, 25, 18 23. doi:10.1016/j.trd.2013.07.005 Barth, M., Jugert, P., & Fritsche, I. (2016). Still underdetected Social norms and collective efficacy predict the acceptance of electric vehicles in Germany. Transportation Research Part F: Traffic Psychology and Behaviour, 37, 64 77. doi:10.1016/j.trf.2015.11.011 Bates, D., Maechler, M., Bolker, B., & Walker, S. (2015). Fitting Linear Mixed-Effects Models Using lme4. Journal of Statistical Software, 67(1), 1-48. doi:10.18637/jss.v067.i01. Bettman, J. R., & Park, C. W. (1980). Effects of Prior Knowledge and Experience and Phase of the Choice Process on Consumer Decision Processes: A Protocol Analysis. Journal of Consumer Research, 7(3), 234. doi:10.1086/208812 Bühler, F., Cocron, P., Neumann, I., Franke, T., & Krems, J. F. (2014). Is EV experience related to EV acceptance?: Results from a German field study. Transportation Research Part F: Traffic Psychology and Behaviour, 25, 34 49. doi:10.1016/j.trf.2014.05.002 Bühler, F., Franke, T., Schleinitz, K., Cocron, P., Neumann, I., Ischebeck, M., & Krems, J. F. (2014). Driving an EV with no opportunity to charge at home - Is this acceptable? In D. De Waard, K. Brookhuis, R. Wiczorek, F. Di Nocera, R. Brouwer, P. Barham,. . . A. Toffetti (Eds.), Proceedings of the Human Factors and Ergonomics Society Europe chapter 2013 annual conference (pp. 369 379). Burgess, M., King, N., Harris, M., & Lewis, E. (2013). Electric vehicle drivers reported interactions with the public: Driving stereotype change? Transportation Research Part F: Traffic Psychology and Behaviour, 17, 33 44. doi:10.1016/j.trf.2012.09.003
168 • Paper III Carroll, S. (2010). The Smart Move Trial: Description and Initial Results. Retrieved from: http://www.cenex.co.uk/case-studies/smart-moves/ Cialdini, R. B., Reno, R. R., & Kallgren, C. A. (1990). A focus theory of normative conduct: Recycling the concept of norms to reduce littering in public places, Journal of Personality and Social Psychology, 58, 1015 1026. Cocron, P., Bachl, V., Früh, L., Koch, I., & Krems, J. F. (2014). Hazard detection in noise-related incidents the role of driving experience with battery electric vehicles. Accident Analysis & Prevention, 73, 380391. doi:10.1016/j.aap.2014.09.016 Cocron, P., Bühler, F., Franke, T., Neumann, I., Dielmann, B., & Krems, J. F. (2013). Energy recapture through deceleration regenerative braking in electric vehicles from a user perspective. Ergonomics, 56(8), 1203 1215. doi:10.1080/00140139.2013.803160 Cocron, P., Bühler, F., Neumann, I., Franke, T., Krems, J. F., Schwalm, M., & Keinath, A. (2011). Methods of evaluating electric vehicles from a user's perspective the MINI E field trial in Berlin. IET Intelligent Transport Systems, 5(2), 127. doi:10.1049/iet-its.2010.0126 Cocron, P., & Krems, J. F. (2013). Driver perceptions of the safety implications of quiet electric vehicles. Accident Analysis & Prevention, 58, 122 131. doi:10.1016/j.aap.2013.04.028 Crites, S. L., Fabrigar, L. R., & Petty, R. E. (1994). Measuring the Affective and Cognitive Properties of Attitudes: Conceptual and Methodological Issues. Personality and Social Psychology Bulletin, 20(6), 619 634. doi:10.1177/0146167294206001 De Cannière, M.H., De Pelsmacker, P. & Geuens, M. (2010). Relationship Quality and Purchase Intention and Behavior: The Moderating Impact of Relationship Strength, Journal of Business and Psychology, 25(1), 87-98. doi:10.1007/s10869-009-9127-z Dittmar, H. (1992). The social psychology of material possessions: To have is to be. Hemel Hempstead: Harvester Wheatsheaf. Field, A. (2013). Discovering Statistics using IBM SPSS Statistics (Fourth Edition). London: SAGE Publications Ltd. Fishbein, M. & Ajzen, I. (2011). Predicting and changing behaviour: The reasoned action approach. Taylor & Francis. Franke, T., & Krems, J. F. (2013). What drives range preferences in electric vehicle users? Transport Policy, 30, 56 62. doi:10.1016/j.tranpol.2013.07.005 Gould, J., & Golob, T. F. (1998). Clean air forever? A longitudinal analysis of opinions about air pollution and electric vehicles. Transportation Research Part D: Transport and Environment, 3(3), 157-169. Graham-Rowe, E., Gardner, B., Abraham, C., Skippon, S., Dittmar, H., Hutchins, R., & Stannard, J. (2012). Mainstream consumers driving plug-in battery-electric and plug-in hybrid electric cars: A qualitative analysis of responses and evaluations. Transportation Research Part A: Policy and Practice, 46(1), 140153. doi:10.1016/j.tra.2011.09.008
Paper III • 169 Grubbs, F. E. (1969). Procedures for Detecting Outlying Observations in Samples. Technometrics, 11(1), 121. doi:10.1080/00401706.1969.10490657 Hahnel, U. J., Gölz, S., & Spada, H. (2014). How does green suit me?: Consumers mentally match perceived product attributes with their domain-specific motives when making green purchase decisions. Journal of Consumer Behaviour, 13(5), 317 327. doi:10.1002/cb.1471 Hair, J.F., Black, W.C., Babin, B.J., & Anderson, R.E. (2010). Multivariate Data Analysis. Seventh Edition. Prentice Hall, Upper Saddle River, New Jersey Hamilton, R. W., & Thompson, D. V. (2007). Is There a Substitute for Direct Experience?: Comparing Consumers' Preferences after Direct and Indirect Product Experiences. Journal of Consumer Research, 34(4), 546 555. doi:10.1086/520073 Hjorthol, R. (2013). Attitudes, ownership and use of Electric Vehicles a review of literature. Hu, L. T., & Bentler, P. M. (1999). Cutoff criteria for fit indexes in covariance structure analysis: Conventional criteria versus new alternatives. Structural equation modeling: a multidisciplinary journal, 6(1), 1-55. International Energy Agency (2016). Global EV outlook 2016 Beyond one million electric cars. Retrieved from: https://www.iea.org/publications/freepublications/publication/Global_EV_Outlook_2016.pdf Jensen, A. F., Cherchi, E., & Dios Ortúzar, J. de. (2014). A long panel survey to elicit variation in preferences and attitudes in the choice of electric vehicles. Transportation, 41(5), 973 993. doi:10.1007/s11116-014-9517-6 King, D. (Ed.). (2010). Future of Mobility Roadmap - Ways to reduce emissions while keeping mobile. Kline R. B. (2011). Principles and Practice of Structural Equation Modeling (3rd ed.). New York: Guilford Press. Klöckner, C. A. (2014). The dynamics of purchasing an electric vehicle A prospective longitudinal study of the decision-making process. Transportation Research Part F: Traffic Psychology and Behaviour, 24, 103 116. doi:10.1016/j.trf.2014.04.015 Krems, J. F. (2011). MINIEVatt Berlin – Freude am umweltgerechten Fahren, Verbundprojekt: Klimaentlastung durch den Einsatz erneuerbarer Energien im Zusammenwirken mit emissionsfreien Elektrofahrzeugen – MINI E 1.0 Berlin Chemnitz: Technische Universität Chemnitz. Abschlussbericht, Förderkennzeichen 16EM0003. Chemnitz. Krems, J. F., Bartholdt, L., Cocron, P., Dielmann, B., Franke, T., Henning, M. J.,. . . Žilyte-Lennertz, M. (2011). MINI E powered by Vattenfall V2.0. Schlussbericht zum Forschungsvorhaben Verbundprojekt: MINI E powered by Vattenfall V2.0 (Abschlussbericht, Förderkennzeichen 16EM0070). Chemnitz: Technische Universität Chemnitz. Chemnitz. Larson, P. D., Viáfara, J., Parsons, R. V., & Elias, A. (2014). Consumer attitudes about electric cars: Pricing analysis and policy implications. Transportation Research Part A: Policy and Practice, 69, 299 314. doi:10.1016/j.tra.2014.09.002
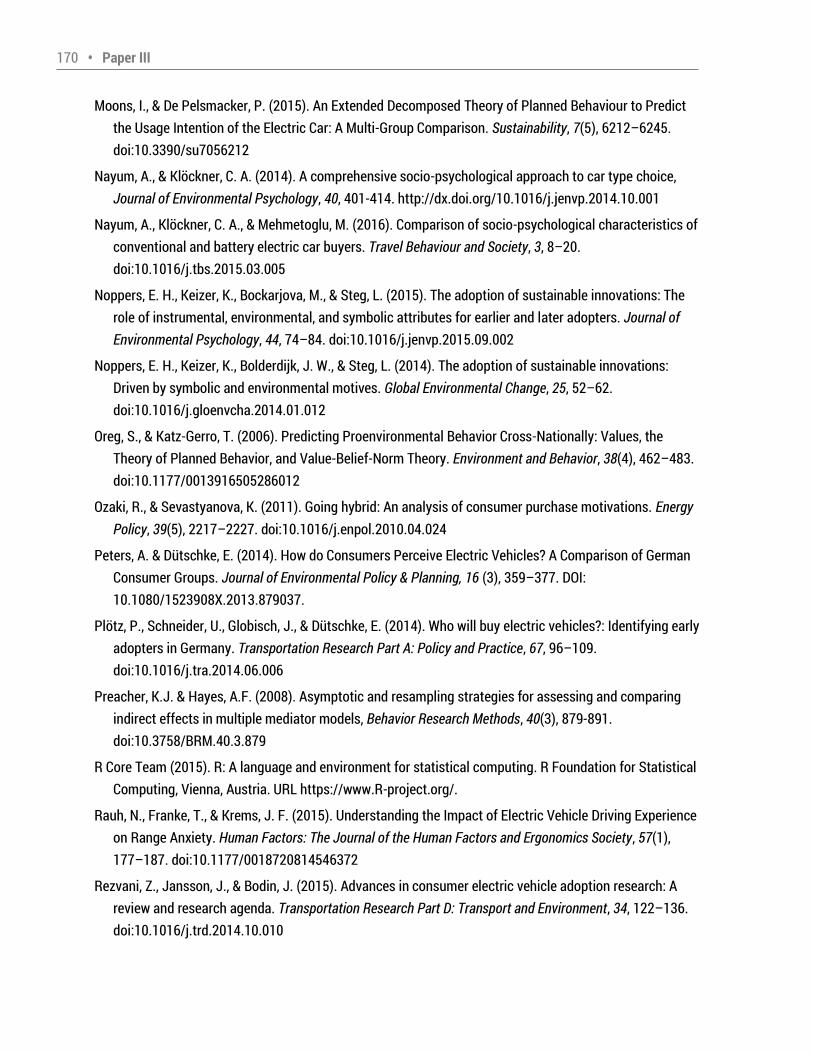
170 • Paper III Moons, I., & De Pelsmacker, P. (2015). An Extended Decomposed Theory of Planned Behaviour to Predict the Usage Intention of the Electric Car: A Multi-Group Comparison. Sustainability, 7(5), 6212 6245. doi:10.3390/su7056212 Nayum, A., & Klöckner, C. A. (2014). A comprehensive socio-psychological approach to car type choice, Journal of Environmental Psychology, 40, 401-414. http://dx.doi.org/10.1016/j.jenvp.2014.10.001 Nayum, A., Klöckner, C. A., & Mehmetoglu, M. (2016). Comparison of socio-psychological characteristics of conventional and battery electric car buyers. Travel Behaviour and Society, 3, 8 20. doi:10.1016/j.tbs.2015.03.005 Noppers, E. H., Keizer, K., Bockarjova, M., & Steg, L. (2015). The adoption of sustainable innovations: The role of instrumental, environmental, and symbolic attributes for earlier and later adopters. Journal of Environmental Psychology, 44, 74 84. doi:10.1016/j.jenvp.2015.09.002 Noppers, E. H., Keizer, K., Bolderdijk, J. W., & Steg, L. (2014). The adoption of sustainable innovations: Driven by symbolic and environmental motives. Global Environmental Change, 25, 52 62. doi:10.1016/j.gloenvcha.2014.01.012 Oreg, S., & Katz-Gerro, T. (2006). Predicting Proenvironmental Behavior Cross-Nationally: Values, the Theory of Planned Behavior, and Value-Belief-Norm Theory. Environment and Behavior, 38(4), 462 483. doi:10.1177/0013916505286012 Ozaki, R., & Sevastyanova, K. (2011). Going hybrid: An analysis of consumer purchase motivations. Energy Policy, 39(5), 2217 2227. doi:10.1016/j.enpol.2010.04.024 Peters, A. & Dütschke, E. (2014). How do Consumers Perceive Electric Vehicles? A Comparison of German Consumer Groups. Journal of Environmental Policy & Planning, 16 (3), 359 377. DOI: 10.1080/1523908X.2013.879037. Plötz, P., Schneider, U., Globisch, J., & Dütschke, E. (2014). Who will buy electric vehicles?: Identifying early adopters in Germany. Transportation Research Part A: Policy and Practice, 67, 96 109. doi:10.1016/j.tra.2014.06.006 Preacher, K.J. & Hayes, A.F. (2008). Asymptotic and resampling strategies for assessing and comparing indirect effects in multiple mediator models, Behavior Research Methods, 40(3), 879-891. doi:10.3758/BRM.40.3.879 R Core Team (2015). R: A language and environment for statistical computing. R Foundation for Statistical Computing, Vienna, Austria. URL https://www.R-project.org/. Rauh, N., Franke, T., & Krems, J. F. (2015). Understanding the Impact of Electric Vehicle Driving Experience on Range Anxiety. Human Factors: The Journal of the Human Factors and Ergonomics Society, 57(1), 177 187. doi:10.1177/0018720814546372 Rezvani, Z., Jansson, J., & Bodin, J. (2015). Advances in consumer electric vehicle adoption research: A review and research agenda. Transportation Research Part D: Transport and Environment, 34, 122 136. doi:10.1016/j.trd.2014.10.010
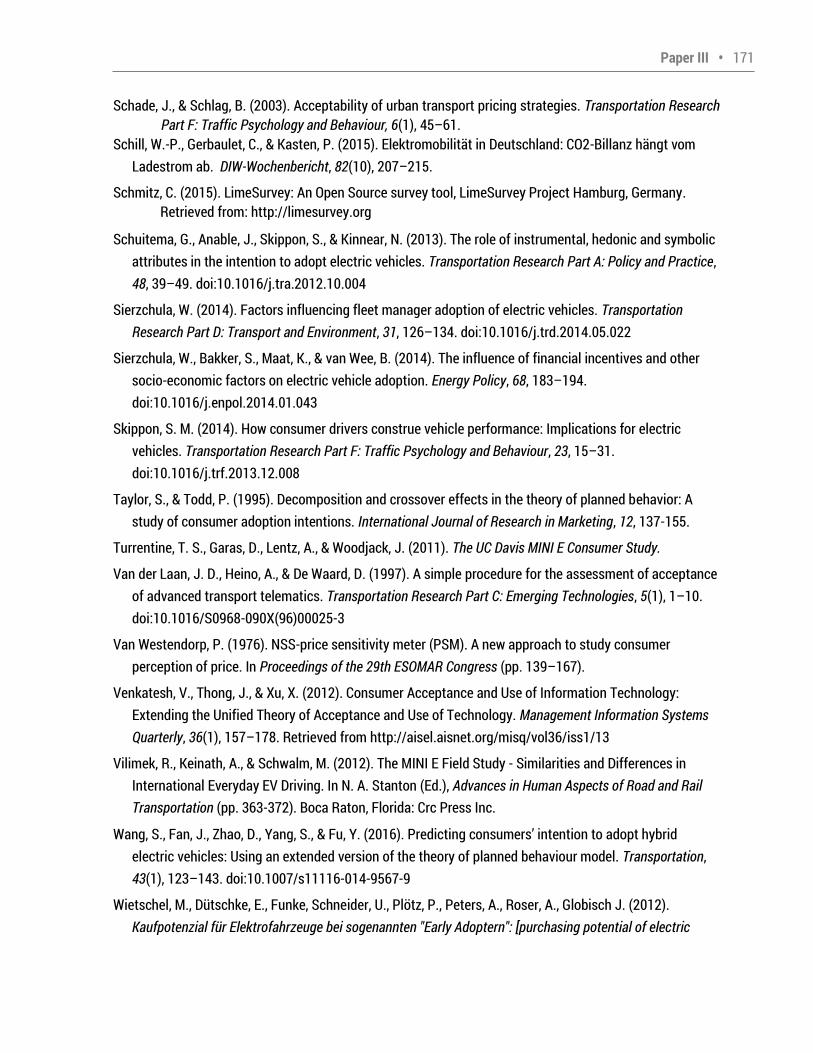
Paper III • 171 Schade, J., & Schlag, B. (2003). Acceptability of urban transport pricing strategies. Transportation Research Part F: Traffic Psychology and Behaviour, 6(1), 45 61. Schill, W.-P., Gerbaulet, C., & Kasten, P. (2015). Elektromobilität in Deutschland: CO2-Billanz hängt vom Ladestrom ab. DIW-Wochenbericht, 82(10), 207 215. Schmitz, C. (2015). LimeSurvey: An Open Source survey tool, LimeSurvey Project Hamburg, Germany. Retrieved from: http://limesurvey.org Schuitema, G., Anable, J., Skippon, S., & Kinnear, N. (2013). The role of instrumental, hedonic and symbolic attributes in the intention to adopt electric vehicles. Transportation Research Part A: Policy and Practice, 48, 39 49. doi:10.1016/j.tra.2012.10.004 Sierzchula, W. (2014). Factors influencing fleet manager adoption of electric vehicles. Transportation Research Part D: Transport and Environment, 31, 126 134. doi:10.1016/j.trd.2014.05.022 Sierzchula, W., Bakker, S., Maat, K., & van Wee, B. (2014). The influence of financial incentives and other socio-economic factors on electric vehicle adoption. Energy Policy, 68, 183 194. doi:10.1016/j.enpol.2014.01.043 Skippon, S. M. (2014). How consumer drivers construe vehicle performance: Implications for electric vehicles. Transportation Research Part F: Traffic Psychology and Behaviour, 23, 15 31. doi:10.1016/j.trf.2013.12.008 Taylor, S., & Todd, P. (1995). Decomposition and crossover effects in the theory of planned behavior: A study of consumer adoption intentions. International Journal of Research in Marketing, 12, 137-155. Turrentine, T. S., Garas, D., Lentz, A., & Woodjack, J. (2011). The UC Davis MINI E Consumer Study. Van der Laan, J. D., Heino, A., & De Waard, D. (1997). A simple procedure for the assessment of acceptance of advanced transport telematics. Transportation Research Part C: Emerging Technologies, 5(1), 1 10. doi:10.1016/S0968-090X(96)00025-3 Van Westendorp, P. (1976). NSS-price sensitivity meter (PSM). A new approach to study consumer perception of price. In Proceedings of the 29th ESOMAR Congress (pp. 139 167). Venkatesh, V., Thong, J., & Xu, X. (2012). Consumer Acceptance and Use of Information Technology: Extending the Unified Theory of Acceptance and Use of Technology. Management Information Systems Quarterly, 36(1), 157 178. Retrieved from http://aisel.aisnet.org/misq/vol36/iss1/13 Vilimek, R., Keinath, A., & Schwalm, M. (2012). The MINI E Field Study - Similarities and Differences in International Everyday EV Driving. In N. A. Stanton (Ed.), Advances in Human Aspects of Road and Rail Transportation (pp. 363-372). Boca Raton, Florida: Crc Press Inc. Wang, S., Fan, J., Zhao, D., Yang, S., & Fu, Y. (2016). Predicting consumers intention to adopt hybrid electric vehicles: Using an extended version of the theory of planned behaviour model. Transportation, 43(1), 123 143. doi:10.1007/s11116-014-9567-9 Wietschel, M., Dütschke, E., Funke, Schneider, U., Plötz, P., Peters, A., Roser, A., Globisch J. (2012). Kaufpotenzial für Elektrofahrzeuge bei sogenannten "Early Adoptern": [purchasing potential of electric

172 • Paper III vehicles for so called »early adopters«] Fraunhofer ISI. Karlsruhe. Retrieved from Fraunhofer ISI website: http://publica.fraunhofer.de/eprints/urn:nbn:de:0011-n-2070344.pdf Wikström, M., Hansson, L., & Alvfors, P. (2014). Socio-technical experiences from electric vehicle utilisation in commercial fleets. Applied Energy, 123, 82 93. doi:10.1016/j.apenergy.2014.02.051
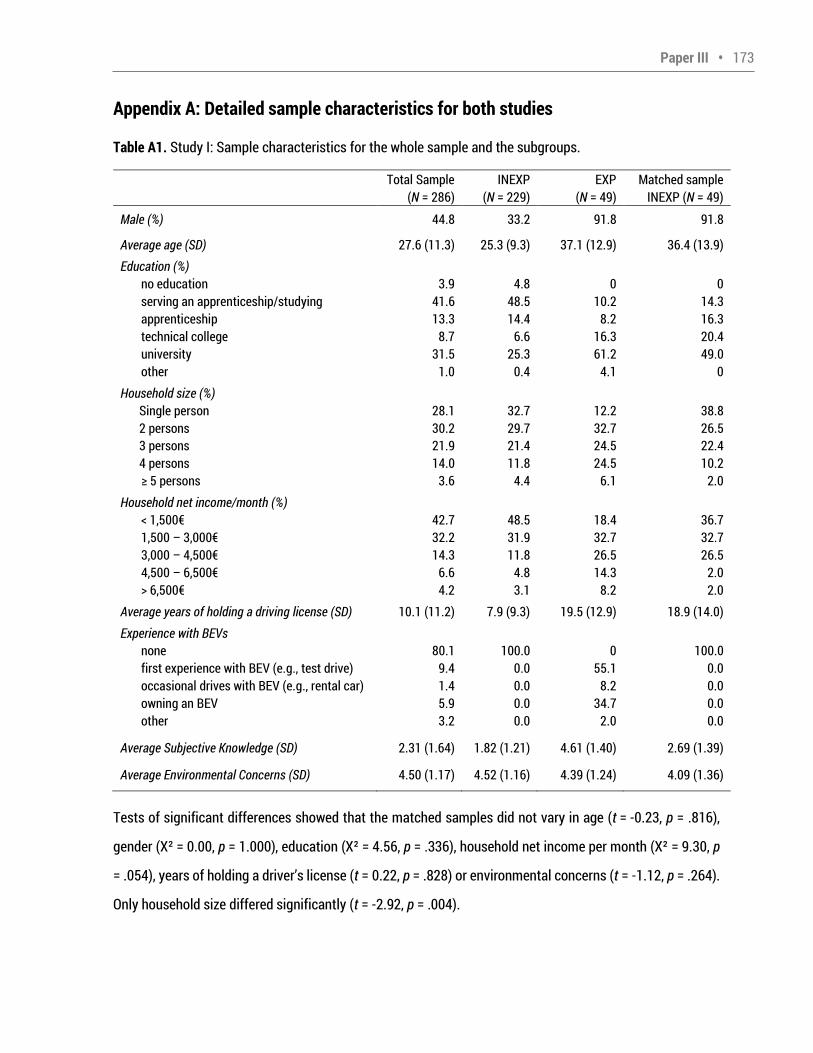
Paper III • 173 Appendix A: Detailed sample characteristics for both studies Table A1. Study I: Sample characteristics for the whole sample and the subgroups. Total Sample (N = 286) INEXP (N = 229) EXP (N = 49) Matched sample INEXP (N = 49) Male (%) 44.8 33.2 91.8 91.8 Average age (SD) 27.6 (11.3) 25.3 (9.3) 37.1 (12.9) 36.4 (13.9) Education (%) no education 3.9 4.8 0 0 serving an apprenticeship/studying 41.6 48.5 10.2 14.3 apprenticeship 13.3 14.4 8.2 16.3 technical college 8.7 6.6 16.3 20.4 university 31.5 25.3 61.2 49.0 other 1.0 0.4 4.1 0 Household size (%) Single person 28.1 32.7 12.2 38.8 2 persons 30.2 29.7 32.7 26.5 3 persons 21.9 21.4 24.5 22.4 4 persons 14.0 11.8 24.5 10.2 5 persons 3.6 4.4 6.1 2.0 Household net income/month (%)
< 1,500€ 42.7 48.5 18.4 36.7 1,500 3,000€ 32.2 31.9 32.7 32.7 3,000 4,500€ 14.3 11.8 26.5 26.5 4,500 6,500€ 6.6 4.8 14.3 2.0 > 6,500€ 4.2 3.1 8.2 2.0 Average years of holding a driving license (SD) 10.1 (11.2) 7.9 (9.3) 19.5 (12.9) 18.9 (14.0) Experience with BEVs none 80.1 100.0 0 100.0 first experience with BEV (e.g., test drive) 9.4 0.0 55.1 0.0 occasional drives with BEV (e.g., rental car) 1.4 0.0 8.2 0.0 owning an BEV 5.9 0.0 34.7 0.0 other 3.2 0.0 2.0 0.0 Average Subjective Knowledge (SD) 2.31 (1.64) 1.82 (1.21) 4.61 (1.40) 2.69 (1.39) Average Environmental Concerns (SD) 4.50 (1.17) 4.52 (1.16) 4.39 (1.24) 4.09 (1.36) Tests of significant differences showed that the matched samples did not vary in age (t = -0.23, p = .816),
gender (Χ² = 0.00, p = 1.000), education (Χ² = 4.56, p = .336), household net income per month (Χ² = 9.30, p = .054), years of holding a driver s license (t = 0.22, p = .828) or environmental concerns (t = -1.12, p = .264). Only household size differed significantly (t = -2.92, p = .004).
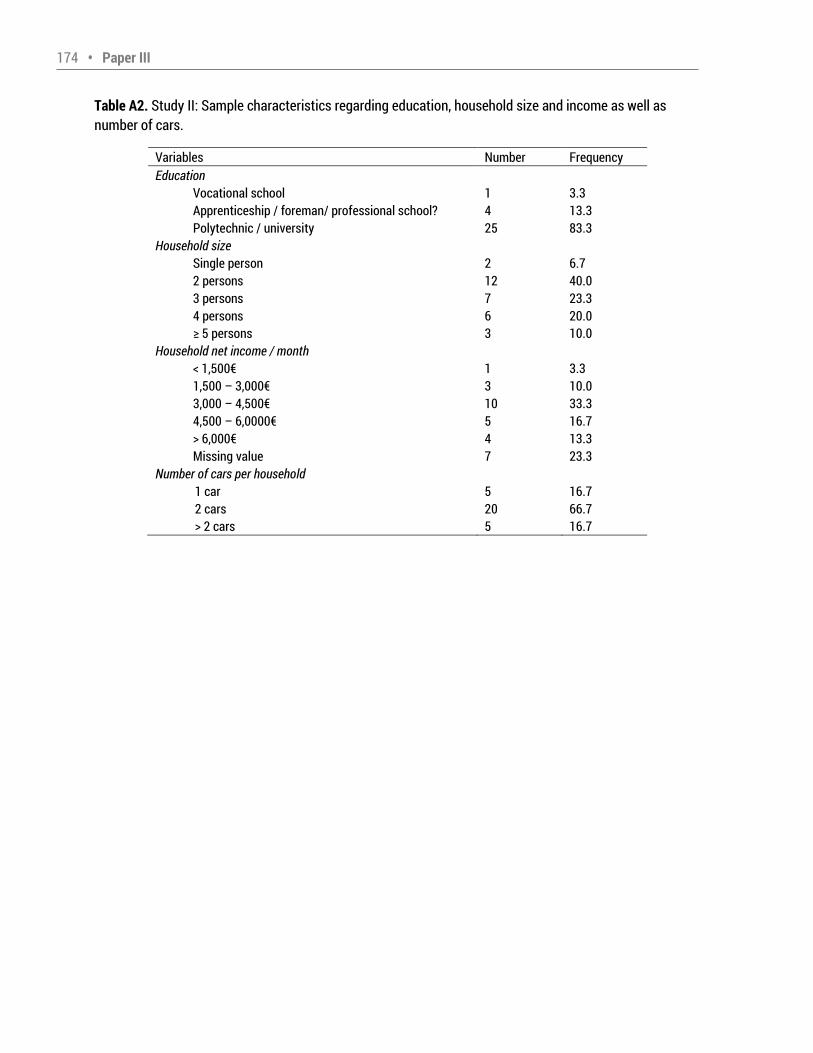
174 • Paper III Table A2. Study II: Sample characteristics regarding education, household size and income as well as number of cars. Variables Number Frequency Education Vocational school 1 3.3 Apprenticeship / foreman/ professional school? 4 13.3 Polytechnic / university 25 83.3 Household size Single person 2 6.7 2 persons 12 40.0 3 persons 7 23.3 4 persons 6 20.0 5 persons 3 10.0 Household net income / month
< 1,500€ 1 3.3 1,500 3,000€ 3 10.0 3,000 4,500€ 10 33.3 4,500 6,0000€ 5 16.7 > 6,000€ 4 13.3 Missing value 7 23.3 Number of cars per household 1 car 5 16.7 2 cars 20 66.7 > 2 cars 5 16.7
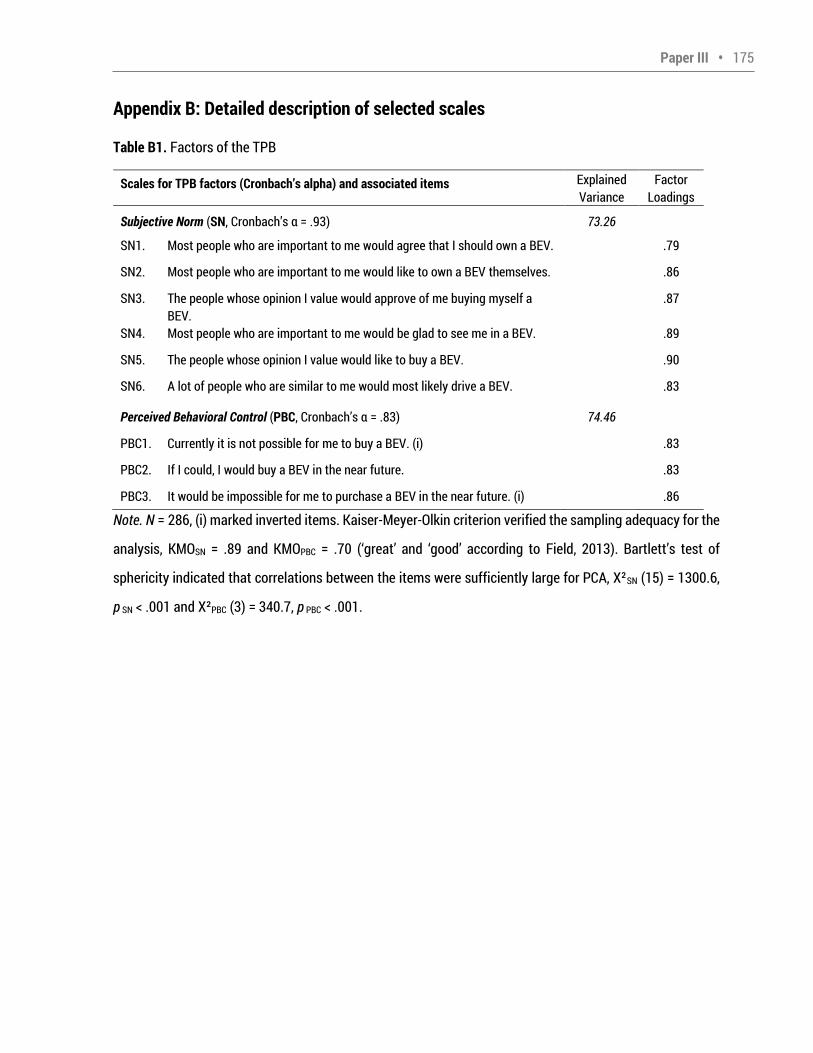
Paper III • 175 Appendix B: Detailed description of selected scales Table B1. Factors of the TPB Scales for TPB factors (Cronbach’s alpha) and associated items Explained Variance Factor Loadings Subjective Norm (SN, Cronbach s α = .93) 73.26 SN1. Most people who are important to me would agree that I should own a BEV. .79 SN2. Most people who are important to me would like to own a BEV themselves. .86 SN3. The people whose opinion I value would approve of me buying myself a BEV. .87 SN4. Most people who are important to me would be glad to see me in a BEV. .89 SN5. The people whose opinion I value would like to buy a BEV. .90 SN6. A lot of people who are similar to me would most likely drive a BEV. .83 Perceived Behavioral Control (PBC, Cronbach s α = .83) 74.46 PBC1. Currently it is not possible for me to buy a BEV. (i) .83 PBC2. If I could, I would buy a BEV in the near future. .83 PBC3. It would be impossible for me to purchase a BEV in the near future. (i) .86 Note. N = 286, (i) marked inverted items. Kaiser-Meyer-Olkin criterion verified the sampling adequacy for the analysis, KMOSN = .89 and KMOPBC = .70 ( great and good according to Field, 2013). Bartlett s test of
sphericity indicated that correlations between the items were sufficiently large for PCA, Χ²SN (15) = 1300.6, p SN < .001 and Χ²PBC (3) = 340.7, p PBC < .001.
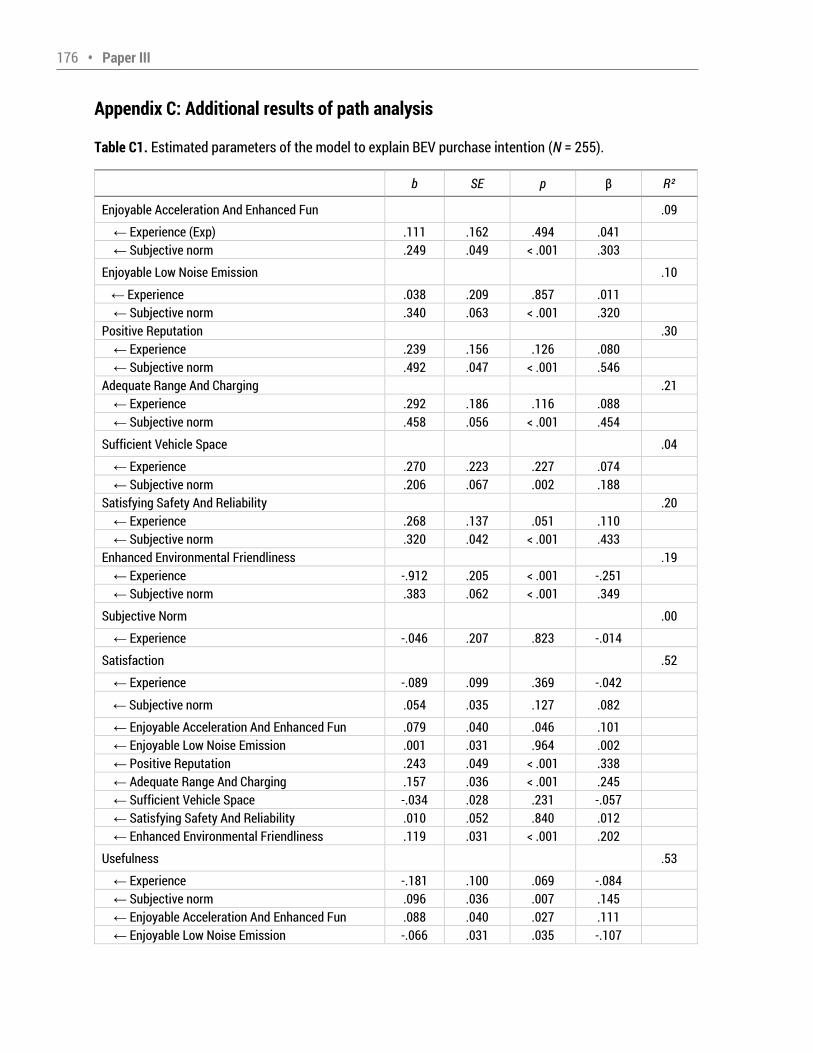
176 • Paper III Appendix C: Additional results of path analysis Table C1. Estimated parameters of the model to explain BEV purchase intention (N = 255). b SE p β R² Enjoyable Acceleration And Enhanced Fun .09 ← Experience (Exp) .111 .162 .494 .041 ← Subjective norm .249 .049 < .001 .303 Enjoyable Low Noise Emission .10 ← Experience .038 .209 .857 .011 ← Subjective norm .340 .063 < .001 .320 Positive Reputation .30 ← Experience .239 .156 .126 .080 ← Subjective norm .492 .047 < .001 .546 Adequate Range And Charging .21 ← Experience .292 .186 .116 .088 ← Subjective norm .458 .056 < .001 .454 Sufficient Vehicle Space .04 ← Experience .270 .223 .227 .074 ← Subjective norm .206 .067 .002 .188 Satisfying Safety And Reliability .20 ← Experience .268 .137 .051 .110 ← Subjective norm .320 .042 < .001 .433 Enhanced Environmental Friendliness .19 ← Experience -.912 .205 < .001 -.251 ← Subjective norm .383 .062 < .001 .349 Subjective Norm .00 ← Experience -.046 .207 .823 -.014 Satisfaction .52 ← Experience -.089 .099 .369 -.042 ← Subjective norm .054 .035 .127 .082 ← Enjoyable Acceleration And Enhanced Fun .079 .040 .046 .101 ← Enjoyable Low Noise Emission .001 .031 .964 .002 ← Positive Reputation .243 .049 < .001 .338 ← Adequate Range And Charging .157 .036 < .001 .245 ← Sufficient Vehicle Space -.034 .028 .231 -.057 ← Satisfying Safety And Reliability .010 .052 .840 .012 ← Enhanced Environmental Friendliness .119 .031 < .001 .202 Usefulness .53 ← Experience -.181 .100 .069 -.084 ← Subjective norm .096 .036 .007 .145 ← Enjoyable Acceleration And Enhanced Fun .088 .040 .027 .111 ← Enjoyable Low Noise Emission -.066 .031 .035 -.107
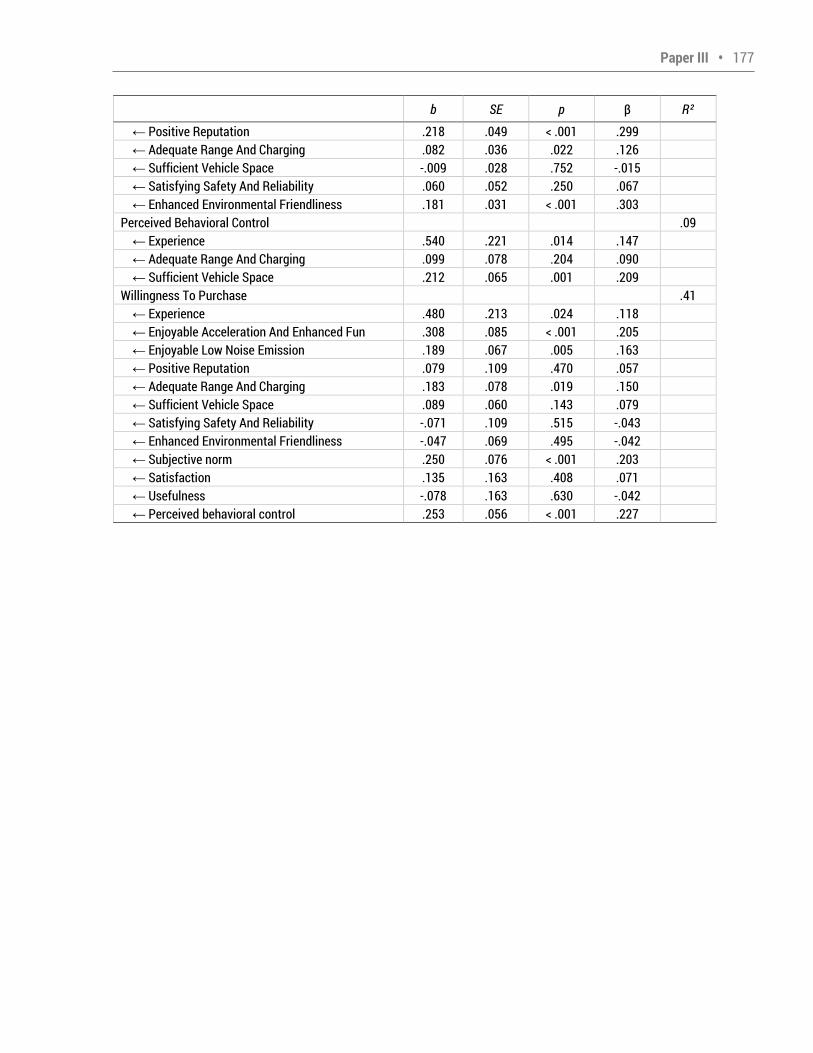
Paper III • 177 b SE p β R² ← Positive Reputation .218 .049 < .001 .299 ← Adequate Range And Charging .082 .036 .022 .126 ← Sufficient Vehicle Space -.009 .028 .752 -.015 ← Satisfying Safety And Reliability .060 .052 .250 .067 ← Enhanced Environmental Friendliness .181 .031 < .001 .303 Perceived Behavioral Control .09 ← Experience .540 .221 .014 .147 ← Adequate Range And Charging .099 .078 .204 .090 ← Sufficient Vehicle Space .212 .065 .001 .209 Willingness To Purchase .41 ← Experience .480 .213 .024 .118 ← Enjoyable Acceleration And Enhanced Fun .308 .085 < .001 .205 ← Enjoyable Low Noise Emission .189 .067 .005 .163 ← Positive Reputation .079 .109 .470 .057 ← Adequate Range And Charging .183 .078 .019 .150 ← Sufficient Vehicle Space .089 .060 .143 .079 ← Satisfying Safety And Reliability -.071 .109 .515 -.043 ← Enhanced Environmental Friendliness -.047 .069 .495 -.042 ← Subjective norm .250 .076 < .001 .203 ← Satisfaction .135 .163 .408 .071 ← Usefulness -.078 .163 .630 -.042 ← Perceived behavioral control .253 .056 < .001 .227
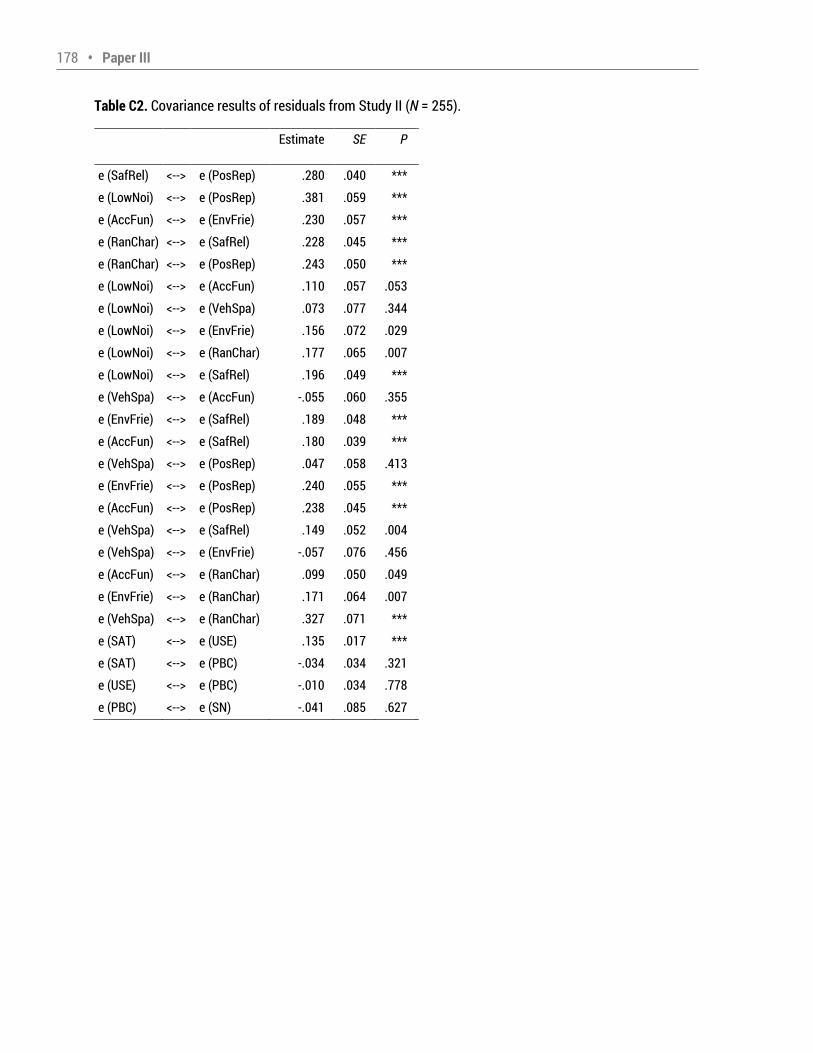
178 • Paper III Table C2. Covariance results of residuals from Study II (N = 255). Estimate SE P e (SafRel) <--> e (PosRep) .280 .040 *** e (LowNoi) <--> e (PosRep) .381 .059 *** e (AccFun) <--> e (EnvFrie) .230 .057 *** e (RanChar) <--> e (SafRel) .228 .045 *** e (RanChar) <--> e (PosRep) .243 .050 *** e (LowNoi) <--> e (AccFun) .110 .057 .053 e (LowNoi) <--> e (VehSpa) .073 .077 .344 e (LowNoi) <--> e (EnvFrie) .156 .072 .029 e (LowNoi) <--> e (RanChar) .177 .065 .007 e (LowNoi) <--> e (SafRel) .196 .049 *** e (VehSpa) <--> e (AccFun) -.055 .060 .355 e (EnvFrie) <--> e (SafRel) .189 .048 *** e (AccFun) <--> e (SafRel) .180 .039 *** e (VehSpa) <--> e (PosRep) .047 .058 .413 e (EnvFrie) <--> e (PosRep) .240 .055 *** e (AccFun) <--> e (PosRep) .238 .045 *** e (VehSpa) <--> e (SafRel) .149 .052 .004 e (VehSpa) <--> e (EnvFrie) -.057 .076 .456 e (AccFun) <--> e (RanChar) .099 .050 .049 e (EnvFrie) <--> e (RanChar) .171 .064 .007 e (VehSpa) <--> e (RanChar) .327 .071 *** e (SAT) <--> e (USE) .135 .017 *** e (SAT) <--> e (PBC) -.034 .034 .321 e (USE) <--> e (PBC) -.010 .034 .778 e (PBC) <--> e (SN) -.041 .085 .627
Paper IV • 179 Paper IV User responses to a smart charging system in Germany: Battery electric vehicle driver motivation, attitudes and acceptance Citation: Schmalfuß, F., Mair, C., Döbelt, S., Kämpfe, B., Wüstemann, R., Krems, J. F., & Keinath, A. (2015). User responses to a smart charging system in Germany: Battery electric vehicle driver motivation, attitudes and acceptance. Energy Research & Social Science, 9, 60 71. doi:10.1016/j.erss.2015.08.019
180 • Paper IV USER RESPONSES TO A SMART CHARGING SYSTEM IN GERMANY: BATTERY ELECTRIC VEHICLE DRIVER MOTIVATION, ATTITUDES AND ACCEPTANCE Franziska Schmalfuß1*, Claudia Mair*, Susen Döbelt*, Bettina Kämpfe*, Ramona Wüstemann* & Josef F. Krems*, Andreas Keinath+ * Technische Universität, Chemnitz, 09107 Chemnitz, Germany +BMW Group, Knorrstr. 147, 80788 München, Germany Abstract Smart charging systems for battery electric vehicles (BEVs) are one promising smart grid technology that has the potential to help balance energy supply and demand. In the present study, we aimed to investigate users real-life experiences with a smart charging system and their evaluation of it. In a 5-month field trial, 10 BEV drivers compared conventional BEV charging with smart charging. Via smartphone application, users could modify settings which determined the charging process (e.g., departure times). Before and after experiencing the prototype system, users motivation, attitudes, willingness to use smart charging and charging behavior were assessed via interviews and questionnaires. Furthermore, participants reported how they experienced and integrated the smart charging system. Results showed that users were motivated and positive about the system at both points of data collection. On average, users agreed that the system is suitable for daily life, reliable and trustworthy. They were willing to use smart charging before and after testing it, but some participants stated that reliability of the system should be improved. In sum, results indicate that a smart charging system like the one implemented in this study is assimilable in everyday life and provide valuable indications for further development of smart charging systems. Keywords: smart charging system for electric vehicles, acceptance, usage behavior, field study 1 corresponding author
Paper IV • 181 1 Introduction Smart grid technologies are promising solutions for balancing energy supply and demand, saving energy, cutting emissions and integrating renewable energy into the grid. In the transportation sector, there are also several attempts to reduce the consumption of fossil energy and develop more energy-efficient vehicles like battery electric vehicles (BEVs). It is expected that the number of BEVs will grow in the near future, but a promulgation of BEVs will pose additional challenges for grid stability (Taylor, Maitra, Alexander, Brooks, & Duvall, 2009). Conventional uncontrolled charging processes start immediately after the BEV is connected to the grid. They have a fixed charging rate and no dynamic adaptive mechanism that responds to actual grid load. Smart charging systems for BEVs that interact in real-time with smart grids in order to plan charging processes with different charging rates in a way that they could help to overcome, for instance, grid overload problems are very promising (Amoroso & Cappuccino, 2012). Besides unidirectional charging of BEVs, so called grid to vehicle (G2V), vehicle to grid (V2G) scenarios have been demonstrated that include bidirectional energy flow (Habib, Kamran, & Rashid, 2015). In the present research, we focus on the unidirectional approach. There are many different ways that G2V systems can be designed and implemented. However, a charging process can only be time-shifted and efficiently managed if departure and/or parking times are available for planning charging schedules. The potential of smart charging systems to avoid demand peaks could further increase if, for instance, BEVs are connected to the grid for a longer period of time and if charging processes are planned ahead more precisely or are more flexible. This is only achievable by integrating additional information obtained from BEV users, such as: realistic/actual departure times and minimum required available range at departure times (Isaksson & Fakerholt, 2012). Hence, the success of smart charging systems relies on the active participation of BEV drivers when charging their vehicles. Verbong, Beemsterboer and Sengers (2013) additionally state that users willingness to accept changes in their homes and daily routines will determine what smart grids will look like and will have a considerable impact on future acceptance of smart grid implementation. As smart charging concepts like G2V have an impact on a very essential aspect of the daily routine mobility a user-centered approach (Norman & Draper, 1986) when developing smart grid applications (e.g., smart charging systems) is recommended (e.g., Verbong et al., 2013). Within the research project, the usage context was analyzed, users requirements defined, the conception completed, mock-ups designed and evaluated and a prototype developed. The evaluation of the
182 • Paper IV prototype was the next important step in the engineering process (ISO/PAS 18152, 2003). As a G2V system with the need for user engagement probably influences people s daily routine (see Domestication Theory;
Silverstone & Hirsch, 1992), it is important to assess users experiences when integrating the new technology at home. Hence, this research aims to investigate (Q1) users experiences, (Q2) motivation, (Q3) perspective, and (Q4) charging behavior when integrating a smart charging system in daily life. Further, the (QExp) experience itself of utilizing a smart charging system can have an impact on users motivation and evaluation, so pre-post comparisons were obtained. 1.1 State of research Over the past several years, many studies investigated users evaluation, acceptance, or usage of different smart grid technologies, as well as their motivation to use this technology (e.g., Balta-Ozkan, Boteler, & Amerighi, 2014; Toft, Schuitema, & Thøgersen, 2014). Some of them examined electric vehicles (EV) and smart charging management systems (e.g., Krems et al., 2011). Gangale, Mengolini and Onyeji (2013) analyzed 38 European projects on smart grids with consumer involvement to identify trends for consumer engagement strategies and areas for potential future research. Three motivational factors dominated in the projects: reduction of bills/more control over consumption, environmental concerns and higher comfort. Furthermore, the authors (Gangale et al., 2013) emphasized the importance of trust for a successful distribution of smart grid technologies. Until now, very little research has been conducted to investigate users evaluation of, and willingness to use, different G2V approaches. The focus of our review were studies in which BEV drivers experienced a smart charging system, because potential consumers tend to inaccurately predict their interest in products with which they have no experience (Hoeffler, 2003). Furthermore, previous studies on electric vehicles have shown that experience matters when evaluating different features of an electric vehicle (e.g., Bühler, Cocron, Neumann, Franke, & Krems, 2014; Cocron & Krems, 2013). In two field studies, 80 and 10 BEV drivers, respectively, used a relatively simple G2V implementation without any reward system (Franke & Krems, 2013; Krems, 2011; Krems et al., 2011). The charging process was time-shifted, so that the PEV was fully charged at a predefined time which BEVs users could adjust via a web application. Participants perceived controlled charging positively and showed a high willingness to participate (Krems, 2011; Krems et al., 2011). However, most participants did not adjust their predefined
Paper IV • 183 departure times to their real departure times. The main reported reasons for not changing the settings were that the effort was too high and the costs were not compensated through financial or ecological benefits. In another field study, 15 private EV drivers could set parking times when plugging-in the EVs to achieve smart charging (EnBW Energie Baden-Württemberg AG, 2011). During the approximately 4 months of data collection, active participation was relatively high. Eighty percent of EV drivers set standing times and 73% acted in accordance with their settings and received the bonus. As implemented systems varied considerably, results are not completely comparable. However, we can conclude that relatively simple implementations of smart charging systems with little consumer involvement are acceptable to consumers. As described earlier, more promising systems need more information, and therefore, require higher user involvement. A smart charging system with higher user involvement was implemented in the Swedish project ELVIIS (Pettersson, 2013). Users could set the time at which the BEV should be fully charged, the range that must be charged immediately and the current used via in-vehicle, web or smartphone interface. Eleven BEV drivers, employees of Göteborg Energi who paid a taxable benefit fee, used the BEV for a period of 1 month and evaluated the system as useful. They indicate that they would use it in the future and also recommend ELVIIS to a friend (Pettersson, 2013). However, private users who own or lease BEVs (so called residential customers ) are an important user group. When the market penetration of EVs increases, residential customers who drive an EV might cause significant peaks in energy consumption in the early evening when they come home and plug-in (Weiller, 2011). Thus, it is of high interest how private users evaluate smart charging technology as adoption of these technologies could help to avoid or reduce such peaks. To our knowledge, published results of a field study with private users who integrated a smart charging system with high user involvement in daily life do not exist. 1.2 Relevant concepts and research questions In research on controlled charging systems, different variables such as users motives (EnBW Energie Baden-Württemberg AG, 2011), general evaluation (e.g., Krems et al., 2011), willingness to use (e.g., Krems et al., 2011, Pettersson, 2013), reasons for not using controlled charging (e.g., Krems et al., 2011) and/or actual
184 • Paper IV usage (e.g., EnBW Energie Baden-Württemberg AG, 2011) were assessed in order to make conclusions about the costumers assessment and acceptance of the implemented systems. Motivational factors are an important topic when investigating smart charging systems, given the need for customer utilization (see Gangale et al., 2013; Krems et al., 2011). Many motivational factors go hand-in-hand with perceived benefits. In previous research, shifting charging processes was more strongly motivated by ecological reasons than by economic motives (EnBW Energie Baden-Württemberg AG, 2011). Financial benefits seemed to be insufficient long-term motivators and other motivational factors like ecological motives are needed (Gangale et al., 2013). Still, financial benefits are important, especially when perceived user effort is high (e.g., Krems et al., 2011). However, perceived benefits do not cover all possible motives for a specific behavior. According to Self-Determination Theory (Deci & Ryan, 2012), it is especially important to examine the level of perceived autonomy when behavior such as participating in a smart charging system is externally motivated by others. The sub-theory, Organismic Integration Theory (Deci & Ryan, 2012), specifies the following types of motivation: intrinsic motivation, external motivation and amotivation. Intrinsic Motivation refers to the natural drive from inside a person to act in a specific way. External motivation comes from the environment and there are four types of behavioral regulation. External regulated behavior is behavior in response to external rewards or demands. Introjected Regulation refers to regulation in which people have adapted to external rewards or demands, but have not fully accepted the behavior; they do it, because it is, for instance, common courtesy. Identified Regulation refers to external influences that are fully accepted and the person thinks it is important to act this way. Integrated Regulation is the state of regulation in which the person has integrated all norms, goals and behavioral strategies and is closest to intrinsic motivation. For intrinsic motivation, as well as for identified and integrated regulation, perceived autonomy is high. Amotivation implies that there is neither intrinsic nor extrinsic motivation. Regarding smart charging technologies, it is of interest to investigate which type of motivation dominates BEV drivers. As mentioned earlier, effort points to another variable that needs to be investigated when evaluating smart charging systems perceived costs. Using a smart charging system with high user involvement, as described in the introduction, is associated with (high) costs for the BEV driver: He/she has to plan ahead, set/adjust, for instance, departure times and act according to his/her settings. Depending on the driver s living
Paper IV • 185 conditions and habits, system usage could be more or less cumbersome. Furthermore, it is important to evaluate the perceived ratio of benefits to costs, which is labelled fairness by Hujits, Molin and Steg (2012). In current research on smart grid technologies, trust proved to be a relevant factor (Gangale et al., 2013) that also increases acceptance of sustainable energy technologies (Hujits et al., 2012). In cases where customers are expected to intensively engage with the system, their goodwill and trust is a particularly important precondition. Some authors argue that users trust in the owners or developers of the technology should be assessed instead of trust in the system itself, because smart grid technologies are relatively new technologies and not well-known (e.g., Gangale et al., 2013). However, smart charging systems can involve various actors (e.g., energy supplier, car manufacturer) that can assume different roles (e.g., BEV pool operator, retailer) in the system (Illing, Wargweg, & Hartung, 2014) and there is not currently a pre-defined actor who will be in contract with the BEV driver. Based on this, trust in the system is the better variable to investigate than trust in owners or developers. Hujits et al. (2012) proposed a comprehensive framework for explaining acceptance of sustainable energy technologies, including the aforementioned variables such as trust, fairness, perceived costs and benefits, attitude, behavioral intention and behavior. This highlights the important role of these variables when evaluating a smart charging system. Some researchers (e.g., Hargreaves, 2015) argue that an attitude behavior approach, such as the one proposed by Hujits et al. (2012), does not adequately explain acceptance and distribution of a new technology, because it does not fully account for a user s daily life and environment. New technologies often
influence or require change in a user s daily routine, practices, and/or social interactions in his/her environment (e.g., Sørensen, 2006). The Domestication Theory (e.g., Silverstone & Hirsch, 1992) attempts to address this critique. According to this theory, new technology, such as the smart charging system, is an unfamiliar, exciting, but also threatening (p. 227, Silverstone, 1993) artifact. Once integrated in the daily routine of people in their environment, this new technology should then be transformed into a familiar artifact. The domestication perspective teaches researchers to consider cognitive (competence or skills), symbolic (meaning or image), and practical (usage pattern or employment) aspects when integrating a new
technology in users daily routines (e.g., Sørensen, 2006).
186 • Paper IV Inspired by domestication theory and aiming to better understand use of controlled charging (CC), we not only investigated changes in attitudes, motivation and use of a technology, but also made first steps towards analyzing the influence of CC on the daily skills, practices and meanings associated with CC usage. Therefore, we focus on the question (Q1) how users experience a charging system with a rather high need for user involvement and how they integrate it in daily routine. Furthermore, this research aims to investigate (Q2) users motivation to use the system and (Q3) evaluation of the system, including (Q3a) perceived benefits and costs, (Q3b) fairness, (Q3c) trust in the system, (Q3d) general evaluation, as well as (Q3e) acceptability and (Q3f) users willingness to use such a system. (Q4) Actual controlled charging usage behavior is also investigated as intentions and actual behavior can differ considerably (e.g., Deci & Ryan, 2012). Research on BEVs indicates that experience impacts evaluation of different BEV features (e.g., Bühler et al., 2014; Cocron, & Krems, 2013). Hujits et al. (2012) also proposed that experience can have a direct effect on the different variables in the framework for explaining acceptance of sustainable energy technologies. Thus, we additionally wanted to examine (QExp) if experience with the smart charging system leads to any changes in the aforementioned variables. 2 Method 2.1 Field Study and the implemented smart charging system The field study was set up in cooperation with BMW Group, Vattenfall Europe, EWE AG, Clean Energy Sourcing AG, Fraunhofer Advanced System Technology AST and Technische Universität Ilmenau within the research project Gesteuertes Laden V3.0 which was funded by the German Federal Ministry for the Environment, Nature Conservation, Building and Nuclear Safety. In the metropolitan area of Berlin, 10 participants drove a BEV (BMW ActiveE, BMW Group, 2012) equipped with smart charging technology for 5 months. A smart charging box with internet connection was installed in each of the 10 households2. 2 In the project, the smart charging technology was implemented in an ActiveE and home charging station by BMW Group and Vattenfall Europe. This technology could be transferred to other types of BEVs and charging stations as long as there is an internet connection available at the charging location. Used smart charging stations also needed a water-proof installation location, but this precondition could be eliminated by investing in the production of the charging boxes.
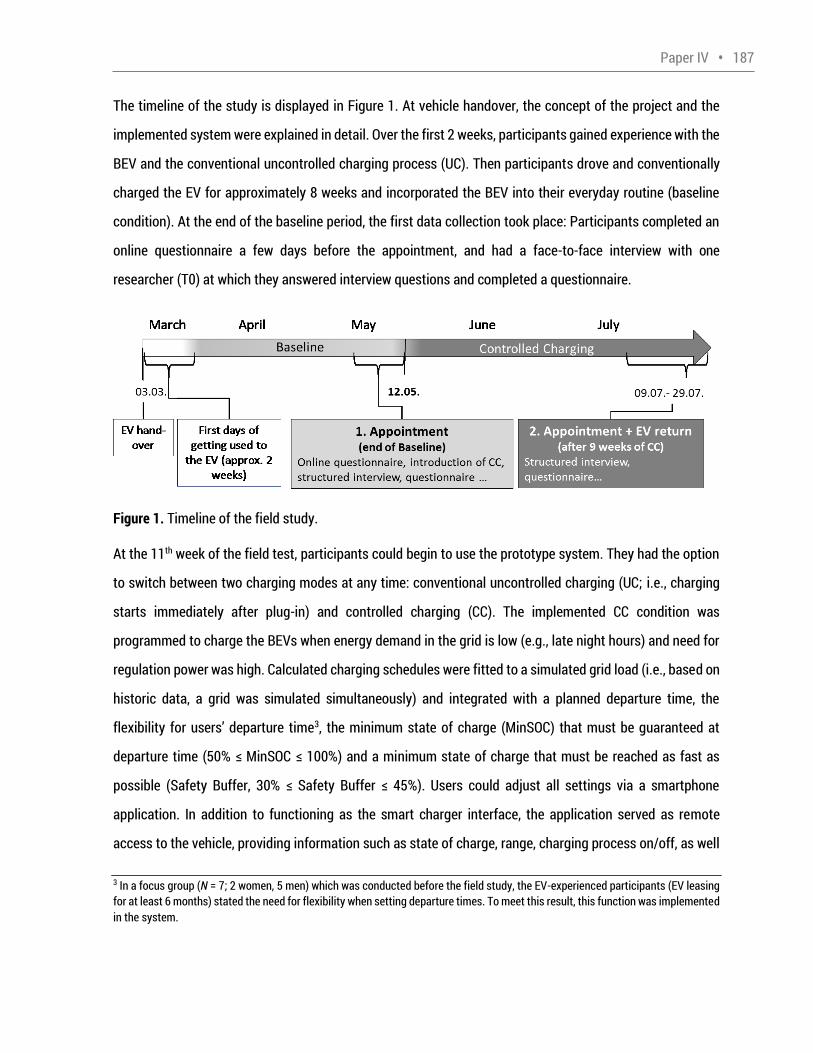
Paper IV • 187 The timeline of the study is displayed in Figure 1. At vehicle handover, the concept of the project and the implemented system were explained in detail. Over the first 2 weeks, participants gained experience with the BEV and the conventional uncontrolled charging process (UC). Then participants drove and conventionally charged the EV for approximately 8 weeks and incorporated the BEV into their everyday routine (baseline condition). At the end of the baseline period, the first data collection took place: Participants completed an online questionnaire a few days before the appointment, and had a face-to-face interview with one researcher (T0) at which they answered interview questions and completed a questionnaire. Figure 1. Timeline of the field study. At the 11th week of the field test, participants could begin to use the prototype system. They had the option to switch between two charging modes at any time: conventional uncontrolled charging (UC; i.e., charging starts immediately after plug-in) and controlled charging (CC). The implemented CC condition was programmed to charge the BEVs when energy demand in the grid is low (e.g., late night hours) and need for regulation power was high. Calculated charging schedules were fitted to a simulated grid load (i.e., based on historic data, a grid was simulated simultaneously) and integrated with a planned departure time, the flexibility for users departure time3, the minimum state of charge (MinSOC) that must be guaranteed at departure time (50% MinSOC 100%) and a minimum state of charge that must be reached as fast as possible (Safety Buffer, 30% Safety Buffer 45%). Users could adjust all settings via a smartphone application. In addition to functioning as the smart charger interface, the application served as remote access to the vehicle, providing information such as state of charge, range, charging process on/off, as well 3 In a focus group (N = 7; 2 women, 5 men) which was conducted before the field study, the EV-experienced participants (EV leasing for at least 6 months) stated the need for flexibility when setting departure times. To meet this result, this function was implemented in the system.
188 • Paper IV as energy consumed and costs for all previous charging events. A mobile application was used as such a user interface was favored in pre-studies within the project and other projects (e.g., Pettersson, 2013). To motivate participants to plug-in their BEV as long as possible and to choose small Safety Buffers and low levels of MinSOC, participants were rewarded with points (max. 40 points per charging event) that were displayed in the smartphone application. Points were converted into Euros every 2 weeks (1 point = 2 Euro cents). After approximately 10 weeks in which participants had the opportunity to use CC, participants returned their BEVs and participated in the second face-to-face interview (T1). When testing CC, several technical problems occurred, such as a 3-day server crash, delayed feedback on earned points per charging event due to internet connection failures and problems with charging infrastructure. 2.2 Materials Demographic variables such as age, gender, highest level of education, household net income, experience with vehicles with electric drive and monthly driving distance were assessed via the online application. To investigate participants pre-existing expectations, as well as their experience and utilization of CC, a multimethod approach was chosen including structured interviews that were digitally recorded and questionnaires that were processed before and after using the smart charging system. In the structured interviews, after the theoretical introduction of CC at the first appointment (T0) and at the beginning of the T1 appointment, participants were asked the following questions: In your opinion, what are the benefits of CC? and In your opinion, what are the costs of CC? . Afterwards, participants rated fairness via questionnaire on a scale from 1 (disadvantages predominate) to 5 (advantages predominate). In addition, participants provided approval ratings of possible benefits and costs (see Table 5). At the T0 interview, participants concerns were also assessed by asking Do you have any concerns
regarding CC? . After experiencing CC, participants were asked Please summarize your experiences with CC , followed by Summarize your experiences in one word . Afterwards participants were additionally asked
How did you integrate CC in your daily routine? and Did your charging behavior change? . In order to assess motivation for using CC within the questionnaire, participants were instructed to distribute a total of 100 points to 3 given categories ( contribution to grid stability , contribution to integration of
renewable energies and reward for participation ) and one open-ended category. To further investigate
Paper IV • 189 motivation, the Exercise Self-Determination Scale from Ryan and Deci (2012) was adapted to CC. Participants rated statements like can do something good, when I am involved in controlled charging on a 6-point Likert scale ranging from 1 (completely disagree) to 6 (completely agree). For the 5 subscales (Intrinsic Motivation, External Regulation, Introjected Regulation, Identified Regulation, Amotivation) means were calculated. To assess trust in the smart charging system, the 12-item unidimensional scale for trust in automated systems with a seven point Likert scale ranging from 1 (fully disagree) to 7 (fully agree) by Jian, Bisantz and Drury (2000) was utilized. An overall trust score was obtained by calculating the mean of all 12 items. Suitability for daily routine was assessed with 3 items, including aspects like easy to integrate in daily
routine . Furthermore, participants rated perceived effectiveness. The statement the implementation of CC
is acceptable assessed acceptability of CC. Additionally, willingness to use CC in the project and afterwards was assessed in the questionnaire. All scales mentioned above were included in the questionnaires at T0 and T1. At both points of data collection, the questionnaire also included an open-ended question on the average number of charging events the participant initiated each week. Only at T1, the number of controlled as well as uncontrolled charging events was assessed and participants rated different reasons for not using CC (e.g., technical problems). 2.3 Participants The field study was advertised via different media channels (internet, local newspaper, local radio). Out of approximately 200 online applications, 10 participants (9 men, 1 woman) were selected that satisfied various criteria (e.g., have a water-proof location with internet connection on which a smart charging box can be installed, willingness to pay a monthly leasing rate of €370) and showed a wide variety in sociodemographic variables. They were on average 47.3 years old (SD = 7.1) and the majority of participants lived in multi-person households (n = 8). Many participants had no prior experience with hybrid electric vehicles or BEVs (n = 6). The majority of the participants were highly educated (7 hold a university degree, 2 are master craftsmen). One household had only the BEV. All others had one (n = 3) or more additional vehicles (n = 6). The sample was not representative for German car drivers, but BEV drivers in other studies showed similar distribution on sociodemographic variables (e.g., Hjorthol, 2013); participants are mainly middle-aged males,
190 • Paper IV highly educated and had the opportunity to charge at home. Therefore, the sample was assumed to be representative of typical private BEV buyers who have the opportunity to use a smart charging system at home and function as a residential energy costumer. Participants indicated that they were mainly motivated to join the project because of the opportunity to test the ActiveE (M = 32.50, SD = 23.60) and support research and development (M = 25.50, SD = 22.04). Testing a smart charging system (M = 15.00, SD = 9.13) and getting a lower leasing rate (M = 6.00, SD = 9.37) were reported as the third and fourth most cited motivators, respectively. 3 Results Recorded responses to interview questions were transcribed verbatim and coded according to thematic analyses by Braun and Clarke (2006), using the software tool MAXQDA 114 (VERBI Software, 2014). After reading all transcribed responses to one question, all answers were categorized using a set of initial, thematic codes. Based on this, main categories with their respective sub-categories were defined. Regarding the question about the integration of CC in daily life, we included the codes practical , cognitive and
symbolic at this point. The final system of categories was applied to all participant responses to each question. The number of participants who made a statement that fit in one sub-category (n) was analyzed for each sub-category. Descriptive analyses were performed on quantitative data. Paired t-tests for dependent samples were calculated by analyzing the differences between statements at T0 and T1. They were used if the following assumptions were met: differences between scores were normally distributed (Field, 2013) and series of measured values did not correlate negatively (Bortz, 2005). Otherwise, the Wilcoxon signed-rank test was used. This test was also chosen for items with ordinal scales (Field, 2013). Effect sizes were interpreted according to Cohen (1988). The sample size is relatively small and only optimal for investigating very large effects (Field, 2013). Therefore, we focused on interpreting effect sizes. 4 The software was used to highlight segments of the transcribed text and assign them to codes for further analysis
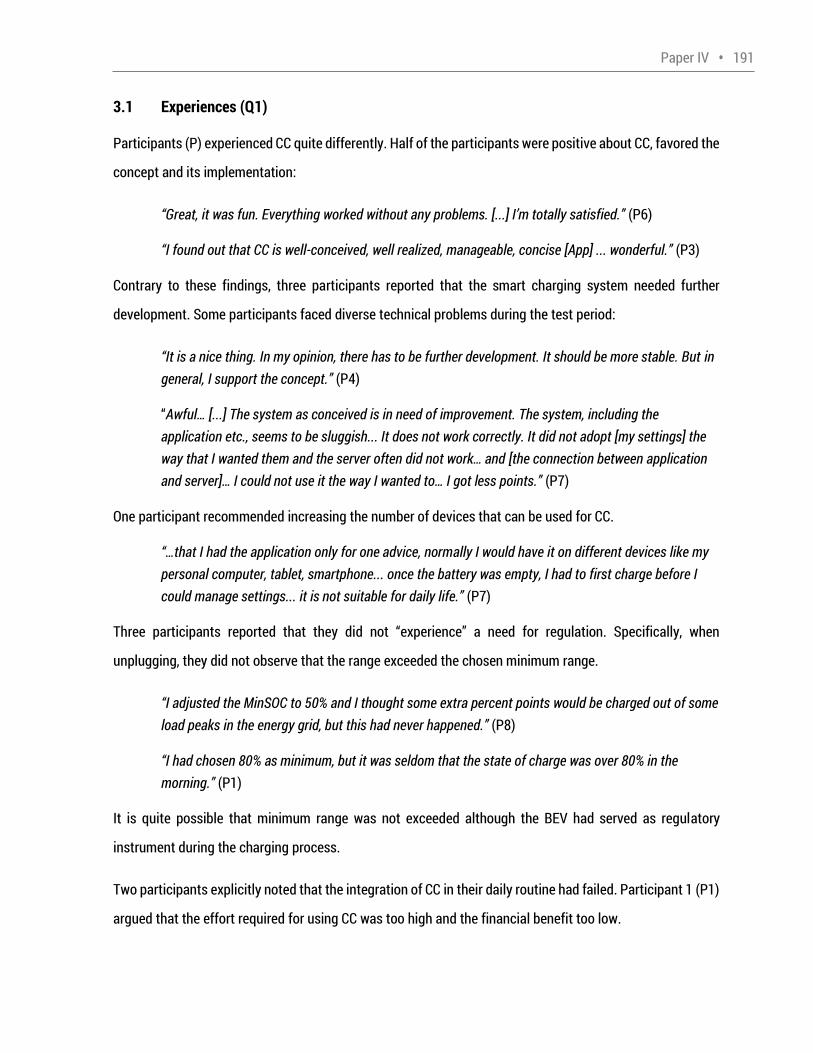
Paper IV • 191 3.1 Experiences (Q1) Participants (P) experienced CC quite differently. Half of the participants were positive about CC, favored the concept and its implementation: Great, it was fun. Everything worked without any problems. [...] I m totally satisfied. (P6) I found out that CC is well-conceived, well realized, manageable, concise [App] ... wonderful. (P3) Contrary to these findings, three participants reported that the smart charging system needed further development. Some participants faced diverse technical problems during the test period: It is a nice thing. In my opinion, there has to be further development. It should be more stable. But in
general, I support the concept. (P4) Awful… [...] The system as conceived is in need of improvement. The system, including the application etc., seems to be sluggish... It does not work correctly. It did not adopt [my settings] the
way that I wanted them and the server often did not work… and [the connection between application and server]… I could not use it the way I wanted to… I got less points. (P7) One participant recommended increasing the number of devices that can be used for CC. …that I had the application only for one advice, normally I would have it on different devices like my personal computer, tablet, smartphone... once the battery was empty, I had to first charge before I
could manage settings... it is not suitable for daily life. (P7) Three participants reported that they did not experience a need for regulation. Specifically, when unplugging, they did not observe that the range exceeded the chosen minimum range. I adjusted the MinSOC to 50% and I thought some extra percent points would be charged out of some load peaks in the energy grid, but this had never happened. (P8) I had chosen 80% as minimum, but it was seldom that the state of charge was over 80% in the
morning. (P1) It is quite possible that minimum range was not exceeded although the BEV had served as regulatory instrument during the charging process. Two participants explicitly noted that the integration of CC in their daily routine had failed. Participant 1 (P1) argued that the effort required for using CC was too high and the financial benefit too low.
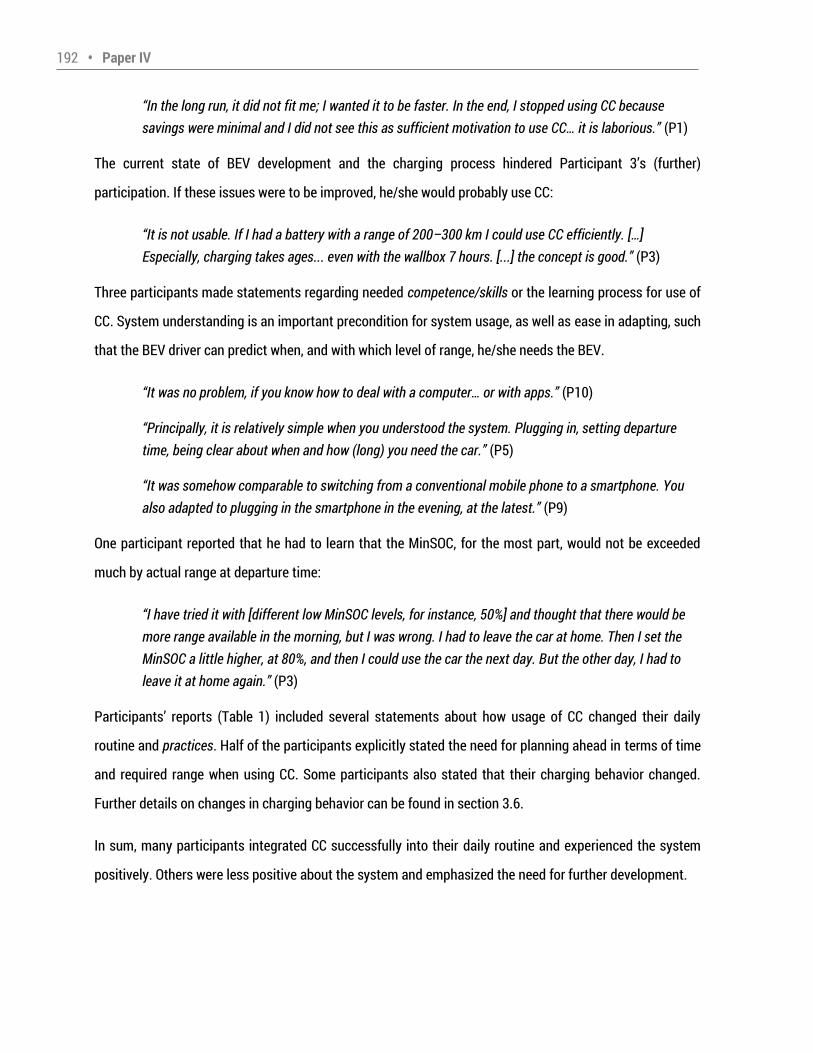
192 • Paper IV In the long run, it did not fit me; I wanted it to be faster. In the end, I stopped using CC because savings were minimal and I did not see this as sufficient motivation to use CC… it is laborious. (P1) The current state of BEV development and the charging process hindered Participant 3 s (further) participation. If these issues were to be improved, he/she would probably use CC: It is not usable. If I had a battery with a range of 200–300 km I could use CC efficiently. […] Especially, charging takes ages... even with the wallbox 7 hours. [...] the concept is good. (P3) Three participants made statements regarding needed competence/skills or the learning process for use of CC. System understanding is an important precondition for system usage, as well as ease in adapting, such that the BEV driver can predict when, and with which level of range, he/she needs the BEV. It was no problem, if you know how to deal with a computer… or with apps. (P10) Principally, it is relatively simple when you understood the system. Plugging in, setting departure
time, being clear about when and how (long) you need the car. (P5) It was somehow comparable to switching from a conventional mobile phone to a smartphone. You
also adapted to plugging in the smartphone in the evening, at the latest. (P9) One participant reported that he had to learn that the MinSOC, for the most part, would not be exceeded much by actual range at departure time: I have tried it with [different low MinSOC levels, for instance, 50%] and thought that there would be more range available in the morning, but I was wrong. I had to leave the car at home. Then I set the MinSOC a little higher, at 80%, and then I could use the car the next day. But the other day, I had to
leave it at home again. (P3) Participants reports (Table 1) included several statements about how usage of CC changed their daily routine and practices. Half of the participants explicitly stated the need for planning ahead in terms of time and required range when using CC. Some participants also stated that their charging behavior changed. Further details on changes in charging behavior can be found in section 3.6. In sum, many participants integrated CC successfully into their daily routine and experienced the system positively. Others were less positive about the system and emphasized the need for further development.
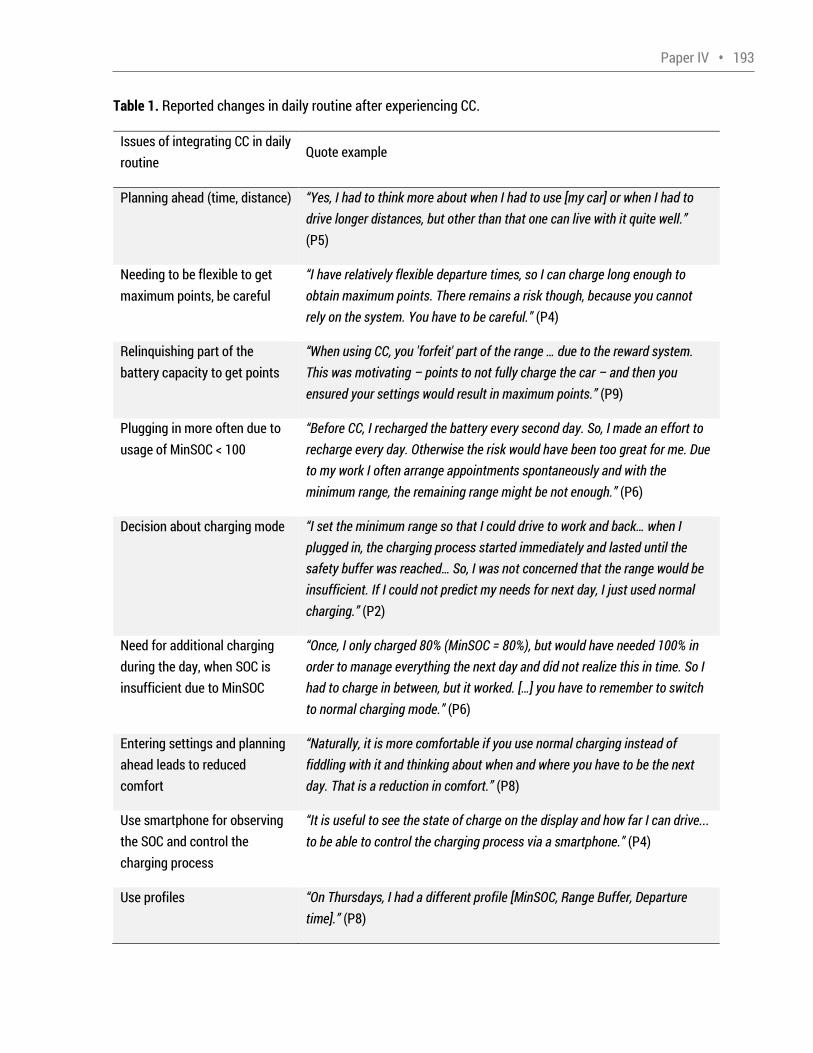
Paper IV • 193 Table 1. Reported changes in daily routine after experiencing CC. Issues of integrating CC in daily routine Quote example Planning ahead (time, distance) Yes, I had to think more about when I had to use [my car] or when I had to drive longer distances, but other than that one can live with it quite well. (P5) Needing to be flexible to get maximum points, be careful I have relatively flexible departure times, so I can charge long enough to obtain maximum points. There remains a risk though, because you cannot rely on the system. You have to be careful. (P4) Relinquishing part of the battery capacity to get points When using CC, you 'forfeit' part of the range … due to the reward system. This was motivating – points to not fully charge the car – and then you ensured your settings would result in maximum points. (P9) Plugging in more often due to usage of MinSOC < 100 Before CC, I recharged the battery every second day. So, I made an effort to recharge every day. Otherwise the risk would have been too great for me. Due to my work I often arrange appointments spontaneously and with the minimum range, the remaining range might be not enough. (P6) Decision about charging mode I set the minimum range so that I could drive to work and back… when I plugged in, the charging process started immediately and lasted until the safety buffer was reached… So, I was not concerned that the range would be insufficient. If I could not predict my needs for next day, I just used normal charging. (P2) Need for additional charging during the day, when SOC is insufficient due to MinSOC Once, I only charged 80% (MinSOC = 80%), but would have needed 100% in order to manage everything the next day and did not realize this in time. So I had to charge in between, but it worked. […] you have to remember to switch to normal charging mode. (P6) Entering settings and planning ahead leads to reduced comfort Naturally, it is more comfortable if you use normal charging instead of fiddling with it and thinking about when and where you have to be the next day. That is a reduction in comfort. (P8) Use smartphone for observing the SOC and control the charging process It is useful to see the state of charge on the display and how far I can drive... to be able to control the charging process via a smartphone. (P4) Use profiles On Thursdays, I had a different profile [MinSOC, Range Buffer, Departure time]. (P8)
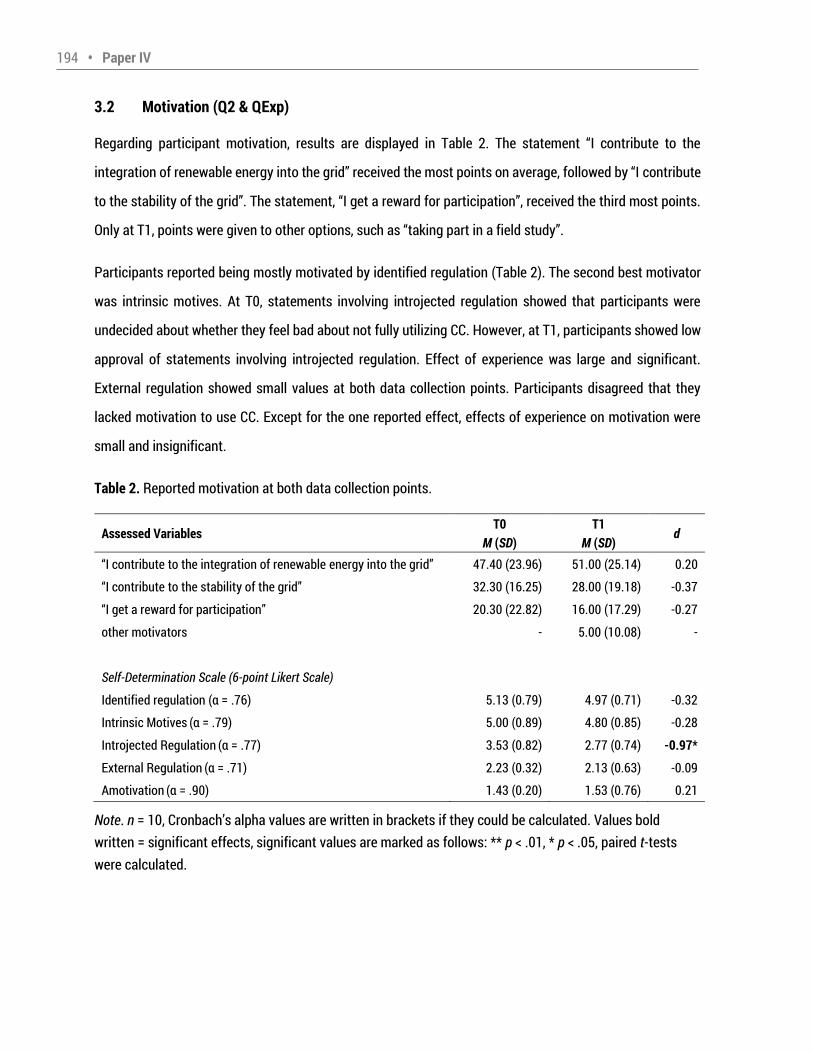
194 • Paper IV 3.2 Motivation (Q2 & QExp) Regarding participant motivation, results are displayed in Table 2. The statement I contribute to the
integration of renewable energy into the grid received the most points on average, followed by I contribute to the stability of the grid . The statement, I get a reward for participation , received the third most points.
Only at T1, points were given to other options, such as taking part in a field study . Participants reported being mostly motivated by identified regulation (Table 2). The second best motivator was intrinsic motives. At T0, statements involving introjected regulation showed that participants were undecided about whether they feel bad about not fully utilizing CC. However, at T1, participants showed low approval of statements involving introjected regulation. Effect of experience was large and significant. External regulation showed small values at both data collection points. Participants disagreed that they lacked motivation to use CC. Except for the one reported effect, effects of experience on motivation were small and insignificant. Table 2. Reported motivation at both data collection points. Assessed Variables T0 T1 d M (SD) M (SD) I contribute to the integration of renewable energy into the grid 47.40 (23.96) 51.00 (25.14) 0.20 I contribute to the stability of the grid 32.30 (16.25) 28.00 (19.18) -0.37 I get a reward for participation 20.30 (22.82) 16.00 (17.29) -0.27 other motivators - 5.00 (10.08) - Self-Determination Scale (6-point Likert Scale)
Identified regulation (α = .76) 5.13 (0.79) 4.97 (0.71) -0.32 Intrinsic Motives (α = .79) 5.00 (0.89) 4.80 (0.85) -0.28 Introjected Regulation (α = .77) 3.53 (0.82) 2.77 (0.74) -0.97* External Regulation (α = .71) 2.23 (0.32) 2.13 (0.63) -0.09 Amotivation (α = .90) 1.43 (0.20) 1.53 (0.76) 0.21 Note. n = 10, Cronbach s alpha values are written in brackets if they could be calculated. Values bold written = significant effects, significant values are marked as follows: ** p < .01, * p < .05, paired t-tests were calculated.
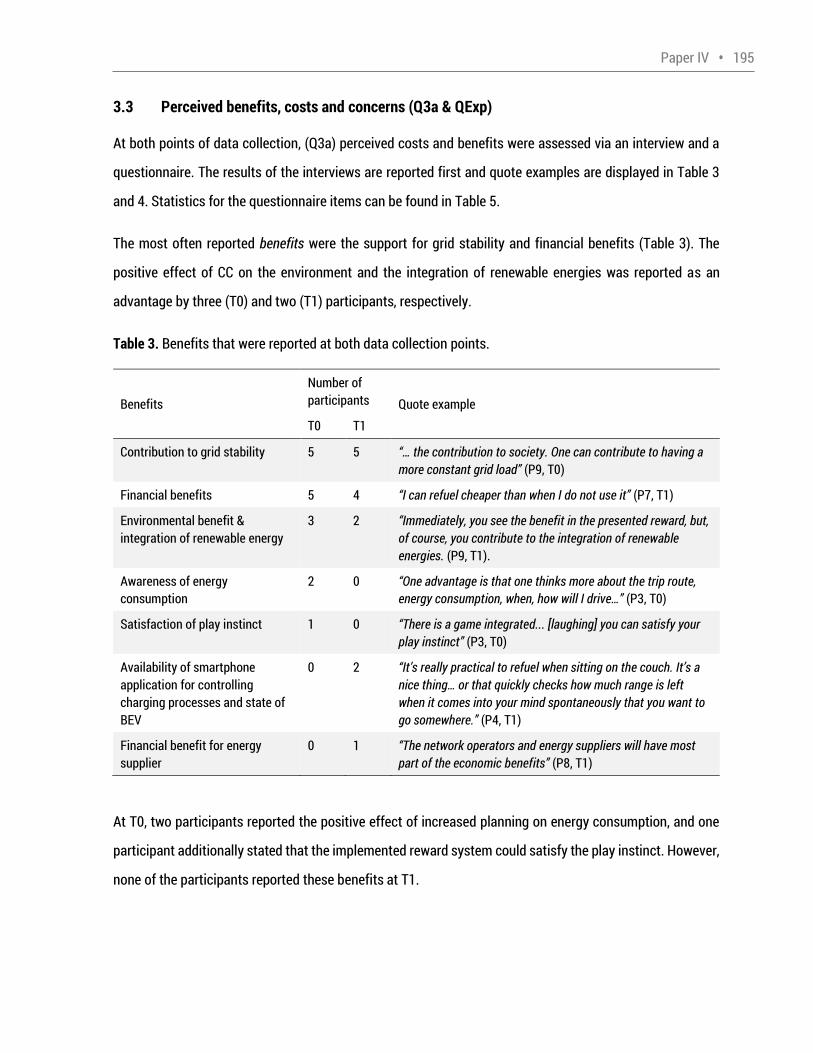
Paper IV • 195 3.3 Perceived benefits, costs and concerns (Q3a & QExp) At both points of data collection, (Q3a) perceived costs and benefits were assessed via an interview and a questionnaire. The results of the interviews are reported first and quote examples are displayed in Table 3 and 4. Statistics for the questionnaire items can be found in Table 5. The most often reported benefits were the support for grid stability and financial benefits (Table 3). The positive effect of CC on the environment and the integration of renewable energies was reported as an advantage by three (T0) and two (T1) participants, respectively. Table 3. Benefits that were reported at both data collection points. Benefits Number of participants Quote example T0 T1 Contribution to grid stability 5 5 … the contribution to society. One can contribute to having a more constant grid load (P9, T0) Financial benefits 5 4 I can refuel cheaper than when I do not use it (P7, T1) Environmental benefit & integration of renewable energy 3 2 Immediately, you see the benefit in the presented reward, but, of course, you contribute to the integration of renewable energies. (P9, T1). Awareness of energy consumption 2 0 One advantage is that one thinks more about the trip route, energy consumption, when, how will I drive… (P3, T0) Satisfaction of play instinct 1 0 There is a game integrated... [laughing] you can satisfy your play instinct (P3, T0) Availability of smartphone application for controlling charging processes and state of BEV 0 2 It s really practical to refuel when sitting on the couch. It s a nice thing… or that quickly checks how much range is left when it comes into your mind spontaneously that you want to go somewhere. (P4, T1) Financial benefit for energy supplier 0 1 The network operators and energy suppliers will have most part of the economic benefits (P8, T1) At T0, two participants reported the positive effect of increased planning on energy consumption, and one participant additionally stated that the implemented reward system could satisfy the play instinct. However, none of the participants reported these benefits at T1.
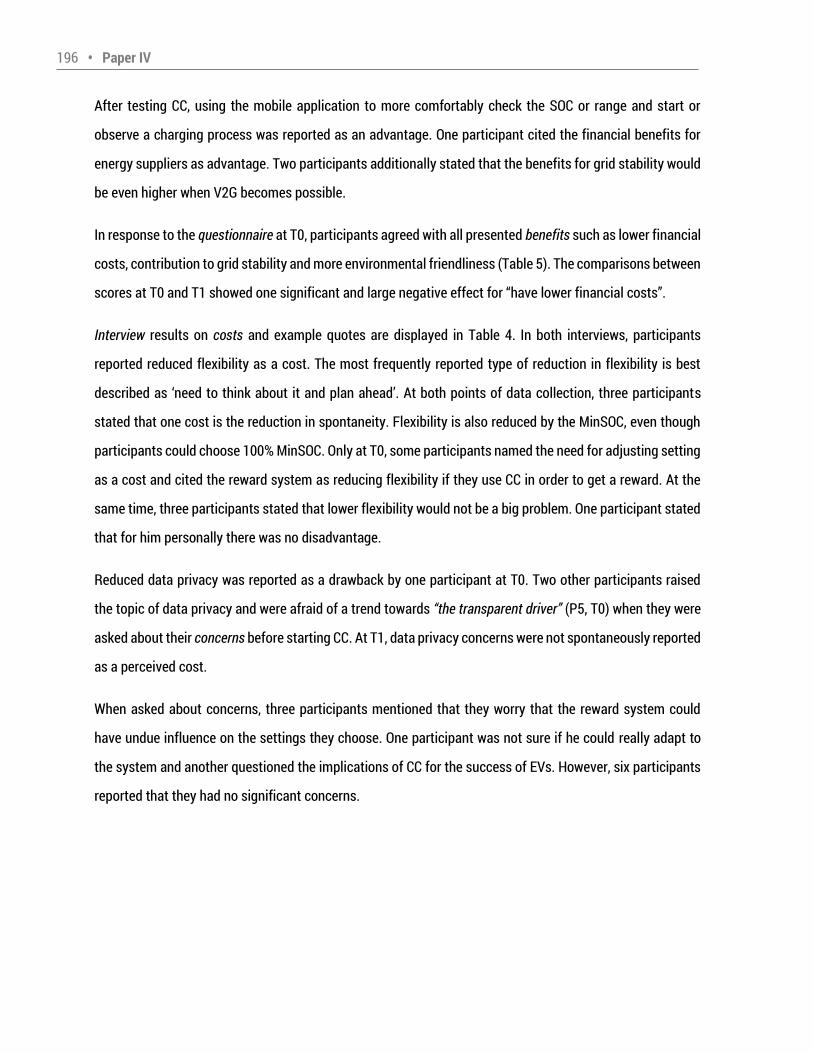
196 • Paper IV After testing CC, using the mobile application to more comfortably check the SOC or range and start or observe a charging process was reported as an advantage. One participant cited the financial benefits for energy suppliers as advantage. Two participants additionally stated that the benefits for grid stability would be even higher when V2G becomes possible. In response to the questionnaire at T0, participants agreed with all presented benefits such as lower financial costs, contribution to grid stability and more environmental friendliness (Table 5). The comparisons between scores at T0 and T1 showed one significant and large negative effect for have lower financial costs . Interview results on costs and example quotes are displayed in Table 4. In both interviews, participants reported reduced flexibility as a cost. The most frequently reported type of reduction in flexibility is best described as need to think about it and plan ahead . At both points of data collection, three participants stated that one cost is the reduction in spontaneity. Flexibility is also reduced by the MinSOC, even though participants could choose 100% MinSOC. Only at T0, some participants named the need for adjusting setting as a cost and cited the reward system as reducing flexibility if they use CC in order to get a reward. At the same time, three participants stated that lower flexibility would not be a big problem. One participant stated that for him personally there was no disadvantage. Reduced data privacy was reported as a drawback by one participant at T0. Two other participants raised the topic of data privacy and were afraid of a trend towards the transparent driver (P5, T0) when they were asked about their concerns before starting CC. At T1, data privacy concerns were not spontaneously reported as a perceived cost. When asked about concerns, three participants mentioned that they worry that the reward system could have undue influence on the settings they choose. One participant was not sure if he could really adapt to the system and another questioned the implications of CC for the success of EVs. However, six participants reported that they had no significant concerns.
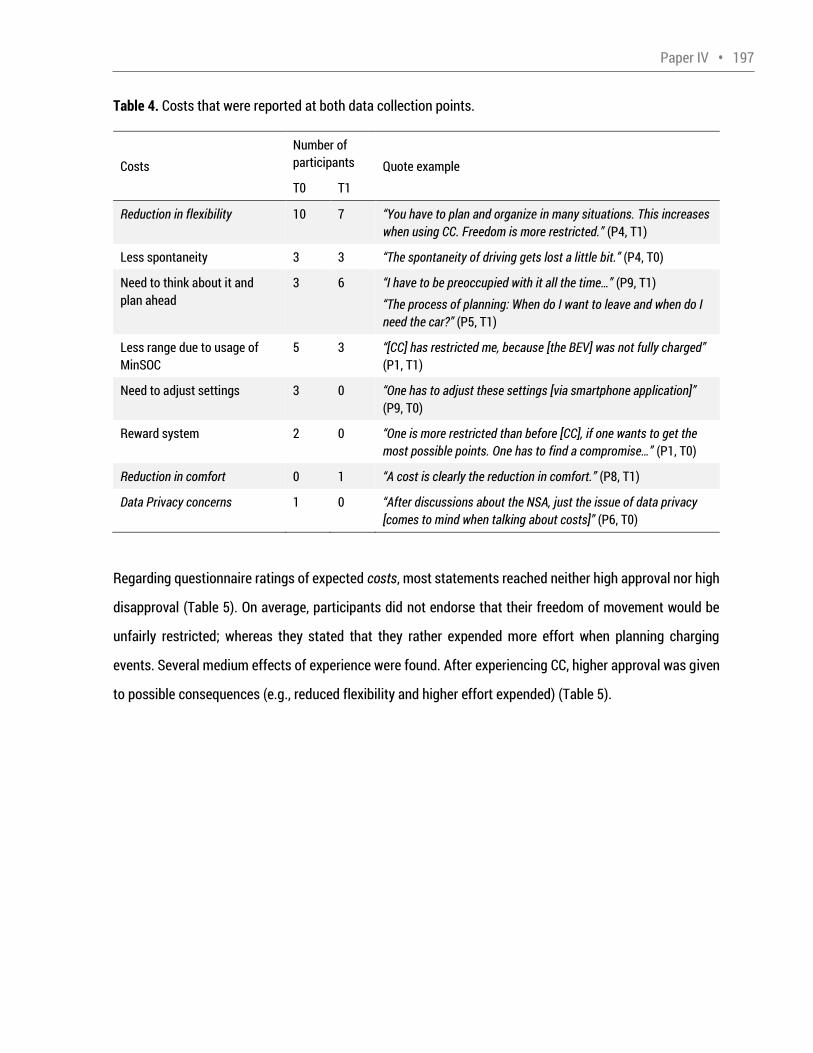
Paper IV • 197 Table 4. Costs that were reported at both data collection points. Costs Number of participants Quote example T0 T1 Reduction in flexibility 10 7 You have to plan and organize in many situations. This increases when using CC. Freedom is more restricted. (P4, T1) Less spontaneity 3 3 The spontaneity of driving gets lost a little bit. (P4, T0) Need to think about it and plan ahead 3 6 I have to be preoccupied with it all the time… (P9, T1) The process of planning: When do I want to leave and when do I
need the car? (P5, T1) Less range due to usage of MinSOC 5 3 [CC] has restricted me, because [the BEV] was not fully charged (P1, T1) Need to adjust settings 3 0 One has to adjust these settings [via smartphone application] (P9, T0) Reward system 2 0 One is more restricted than before [CC], if one wants to get the most possible points. One has to find a compromise… (P1, T0) Reduction in comfort 0 1 A cost is clearly the reduction in comfort. (P8, T1) Data Privacy concerns 1 0 After discussions about the NSA, just the issue of data privacy [comes to mind when talking about costs] (P6, T0) Regarding questionnaire ratings of expected costs, most statements reached neither high approval nor high disapproval (Table 5). On average, participants did not endorse that their freedom of movement would be unfairly restricted; whereas they stated that they rather expended more effort when planning charging events. Several medium effects of experience were found. After experiencing CC, higher approval was given to possible consequences (e.g., reduced flexibility and higher effort expended) (Table 5).
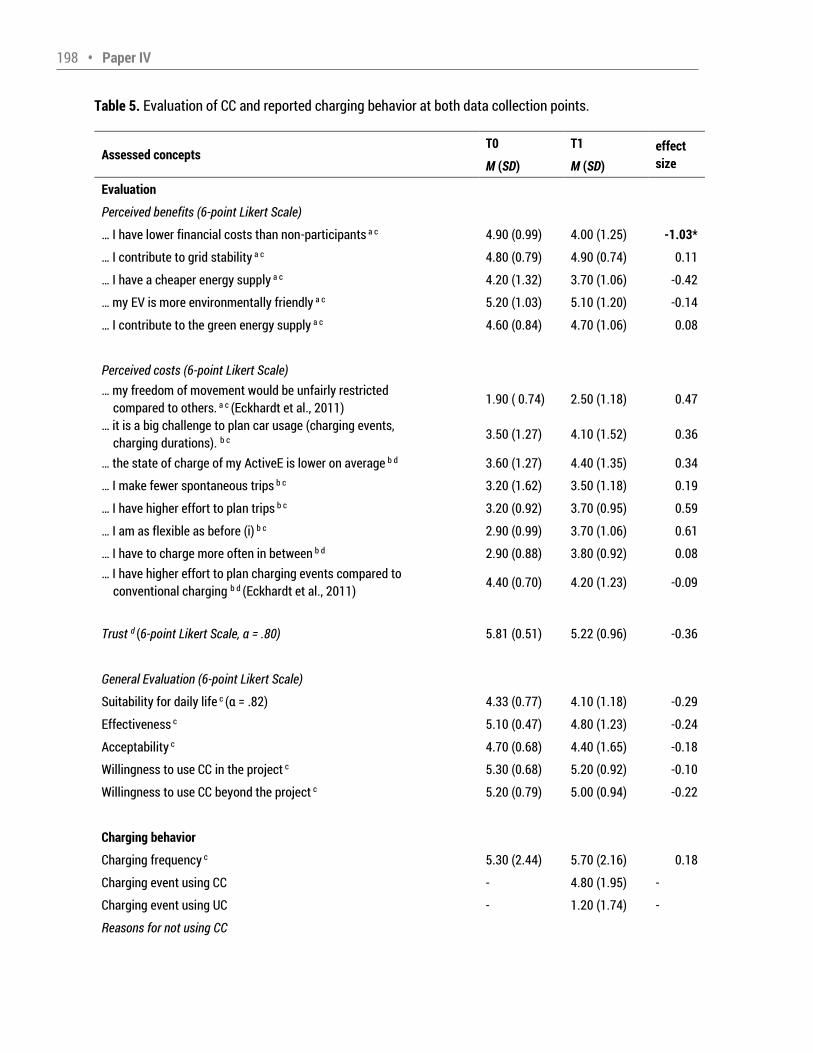
198 • Paper IV Table 5. Evaluation of CC and reported charging behavior at both data collection points. Assessed concepts T0 T1 effect size M (SD) M (SD) Evaluation Perceived benefits (6-point Likert Scale) … I have lower financial costs than non-participants a c 4.90 (0.99) 4.00 (1.25) -1.03* … I contribute to grid stability a c 4.80 (0.79) 4.90 (0.74) 0.11 … I have a cheaper energy supply a c 4.20 (1.32) 3.70 (1.06) -0.42 … my EV is more environmentally friendly a c 5.20 (1.03) 5.10 (1.20) -0.14 … I contribute to the green energy supply a c 4.60 (0.84) 4.70 (1.06) 0.08 Perceived costs (6-point Likert Scale) … my freedom of movement would be unfairly restricted compared to others. a c (Eckhardt et al., 2011) 1.90 ( 0.74) 2.50 (1.18) 0.47 … it is a big challenge to plan car usage (charging events, charging durations). b c 3.50 (1.27) 4.10 (1.52) 0.36 … the state of charge of my ActiveE is lower on average b d 3.60 (1.27) 4.40 (1.35) 0.34 … I make fewer spontaneous trips b c 3.20 (1.62) 3.50 (1.18) 0.19 … I have higher effort to plan trips b c 3.20 (0.92) 3.70 (0.95) 0.59 … I am as flexible as before (i) b c 2.90 (0.99) 3.70 (1.06) 0.61 … I have to charge more often in between b d 2.90 (0.88) 3.80 (0.92) 0.08 … I have higher effort to plan charging events compared to conventional charging b d (Eckhardt et al., 2011) 4.40 (0.70) 4.20 (1.23) -0.09 Trust d (6-point Likert Scale, α = .80) 5.81 (0.51) 5.22 (0.96) -0.36 General Evaluation (6-point Likert Scale) Suitability for daily life c (α = .82) 4.33 (0.77) 4.10 (1.18) -0.29 Effectiveness c 5.10 (0.47) 4.80 (1.23) -0.24 Acceptability c 4.70 (0.68) 4.40 (1.65) -0.18 Willingness to use CC in the project c 5.30 (0.68) 5.20 (0.92) -0.10 Willingness to use CC beyond the project c 5.20 (0.79) 5.00 (0.94) -0.22 Charging behavior Charging frequency c 5.30 (2.44) 5.70 (2.16) 0.18 Charging event using CC - 4.80 (1.95) - Charging event using UC - 1.20 (1.74) - Reasons for not using CC
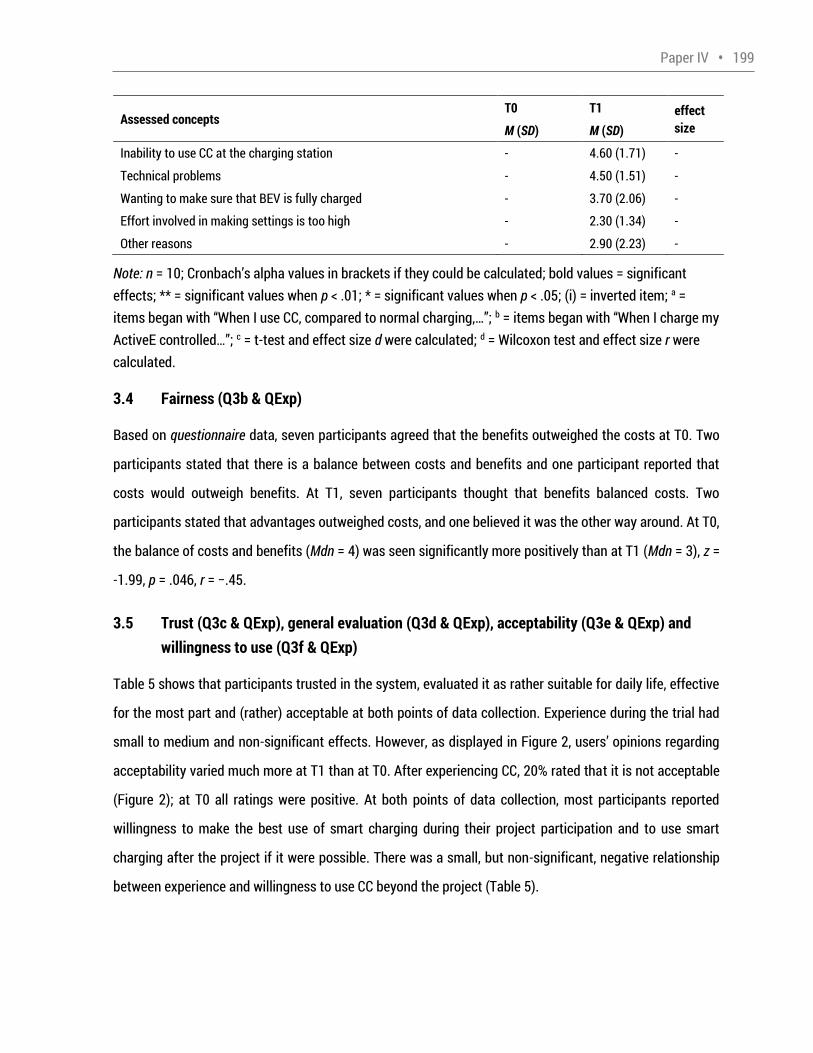
Paper IV • 199 Assessed concepts T0 T1 effect size M (SD) M (SD) Inability to use CC at the charging station - 4.60 (1.71) - Technical problems - 4.50 (1.51) - Wanting to make sure that BEV is fully charged - 3.70 (2.06) - Effort involved in making settings is too high - 2.30 (1.34) - Other reasons - 2.90 (2.23) - Note: n = 10; Cronbach s alpha values in brackets if they could be calculated; bold values = significant effects; ** = significant values when p < .01; * = significant values when p < .05; (i) = inverted item; a = items began with When I use CC, compared to normal charging,… ; b = items began with When I charge my ActiveE controlled… ; c = t-test and effect size d were calculated; d = Wilcoxon test and effect size r were calculated. 3.4 Fairness (Q3b & QExp) Based on questionnaire data, seven participants agreed that the benefits outweighed the costs at T0. Two participants stated that there is a balance between costs and benefits and one participant reported that costs would outweigh benefits. At T1, seven participants thought that benefits balanced costs. Two participants stated that advantages outweighed costs, and one believed it was the other way around. At T0, the balance of costs and benefits (Mdn = 4) was seen significantly more positively than at T1 (Mdn = 3), z = -1.99, p = .046, r = −.45. 3.5 Trust (Q3c & QExp), general evaluation (Q3d & QExp), acceptability (Q3e & QExp) and willingness to use (Q3f & QExp) Table 5 shows that participants trusted in the system, evaluated it as rather suitable for daily life, effective for the most part and (rather) acceptable at both points of data collection. Experience during the trial had small to medium and non-significant effects. However, as displayed in Figure 2, users opinions regarding acceptability varied much more at T1 than at T0. After experiencing CC, 20% rated that it is not acceptable (Figure 2); at T0 all ratings were positive. At both points of data collection, most participants reported willingness to make the best use of smart charging during their project participation and to use smart charging after the project if it were possible. There was a small, but non-significant, negative relationship between experience and willingness to use CC beyond the project (Table 5).
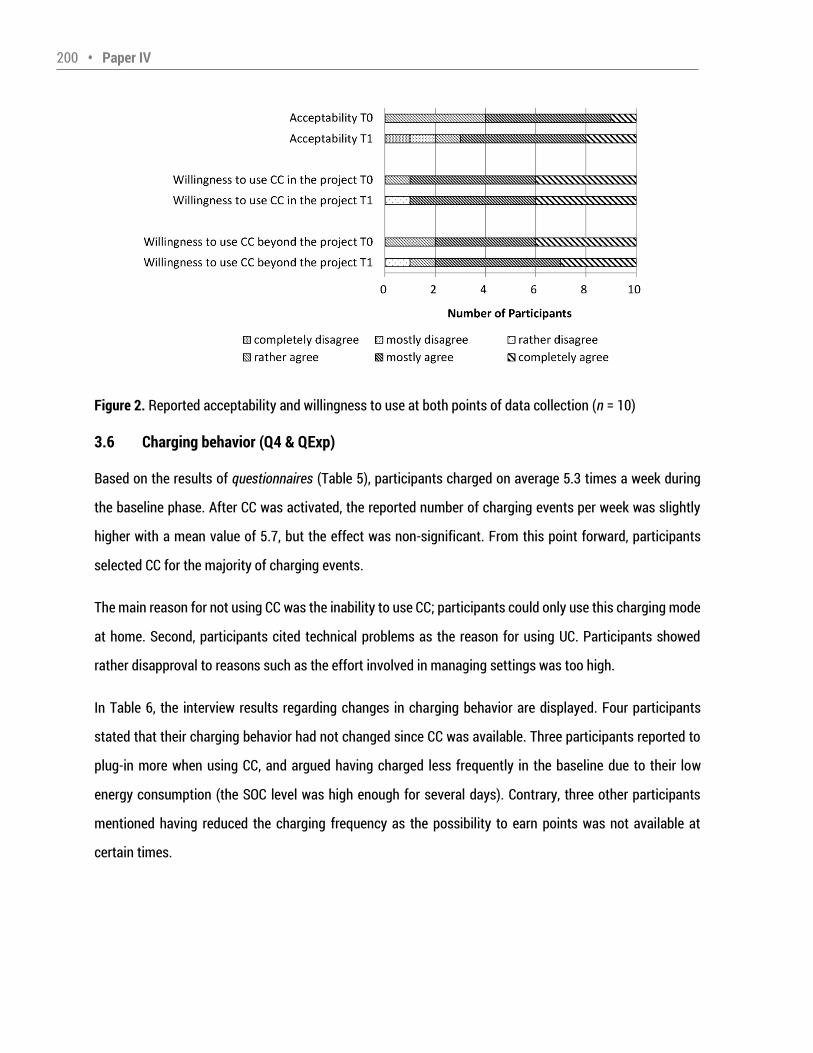
200 • Paper IV Figure 2. Reported acceptability and willingness to use at both points of data collection (n = 10) 3.6 Charging behavior (Q4 & QExp) Based on the results of questionnaires (Table 5), participants charged on average 5.3 times a week during the baseline phase. After CC was activated, the reported number of charging events per week was slightly higher with a mean value of 5.7, but the effect was non-significant. From this point forward, participants selected CC for the majority of charging events. The main reason for not using CC was the inability to use CC; participants could only use this charging mode at home. Second, participants cited technical problems as the reason for using UC. Participants showed rather disapproval to reasons such as the effort involved in managing settings was too high. In Table 6, the interview results regarding changes in charging behavior are displayed. Four participants stated that their charging behavior had not changed since CC was available. Three participants reported to plug-in more when using CC, and argued having charged less frequently in the baseline due to their low energy consumption (the SOC level was high enough for several days). Contrary, three other participants mentioned having reduced the charging frequency as the possibility to earn points was not available at certain times.
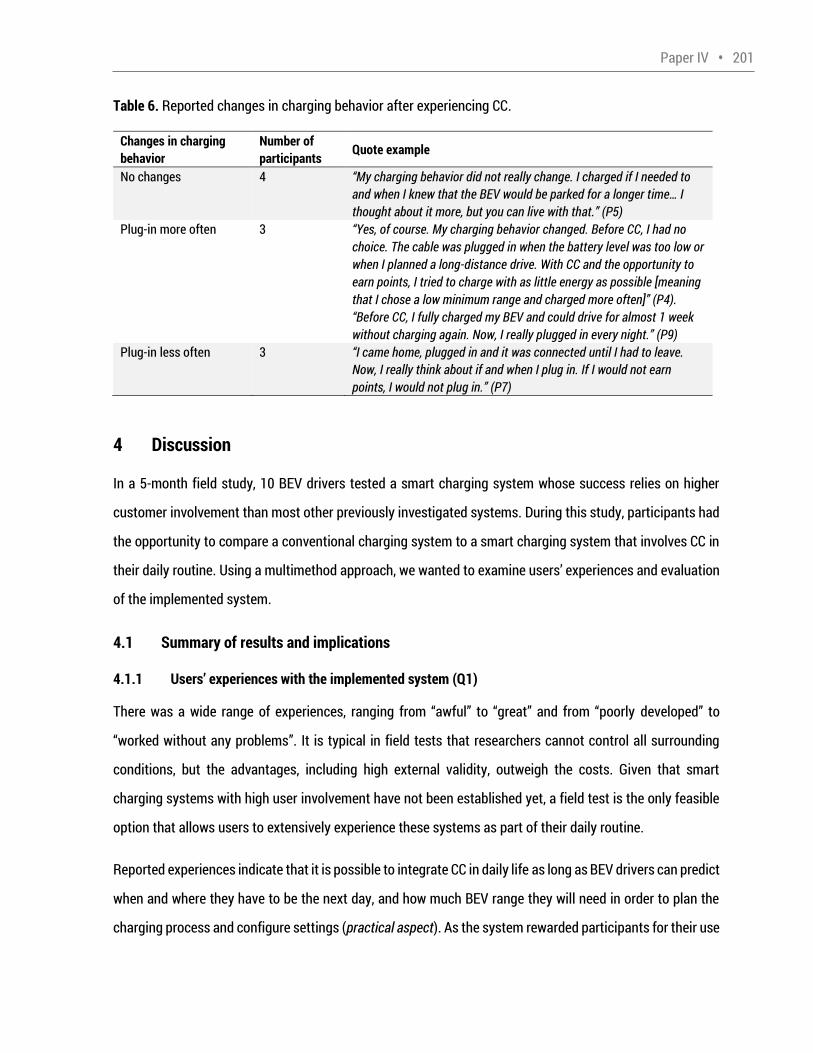
Paper IV • 201 Table 6. Reported changes in charging behavior after experiencing CC. Changes in charging behavior Number of participants Quote example No changes 4 My charging behavior did not really change. I charged if I needed to and when I knew that the BEV would be parked for a longer time… I thought about it more, but you can live with that. (P5) Plug-in more often 3 Yes, of course. My charging behavior changed. Before CC, I had no choice. The cable was plugged in when the battery level was too low or when I planned a long-distance drive. With CC and the opportunity to earn points, I tried to charge with as little energy as possible [meaning that I chose a low minimum range and charged more often] (P4). Before CC, I fully charged my BEV and could drive for almost 1 week
without charging again. Now, I really plugged in every night. (P9) Plug-in less often 3 I came home, plugged in and it was connected until I had to leave. Now, I really think about if and when I plug in. If I would not earn points, I would not plug in. (P7) 4 Discussion In a 5-month field study, 10 BEV drivers tested a smart charging system whose success relies on higher customer involvement than most other previously investigated systems. During this study, participants had the opportunity to compare a conventional charging system to a smart charging system that involves CC in their daily routine. Using a multimethod approach, we wanted to examine users experiences and evaluation of the implemented system. 4.1 Summary of results and implications 4.1.1 Users’ experiences with the implemented system (Q1)
There was a wide range of experiences, ranging from awful to great and from poorly developed to
worked without any problems . It is typical in field tests that researchers cannot control all surrounding conditions, but the advantages, including high external validity, outweigh the costs. Given that smart charging systems with high user involvement have not been established yet, a field test is the only feasible option that allows users to extensively experience these systems as part of their daily routine. Reported experiences indicate that it is possible to integrate CC in daily life as long as BEV drivers can predict when and where they have to be the next day, and how much BEV range they will need in order to plan the charging process and configure settings (practical aspect). As the system rewarded participants for their use
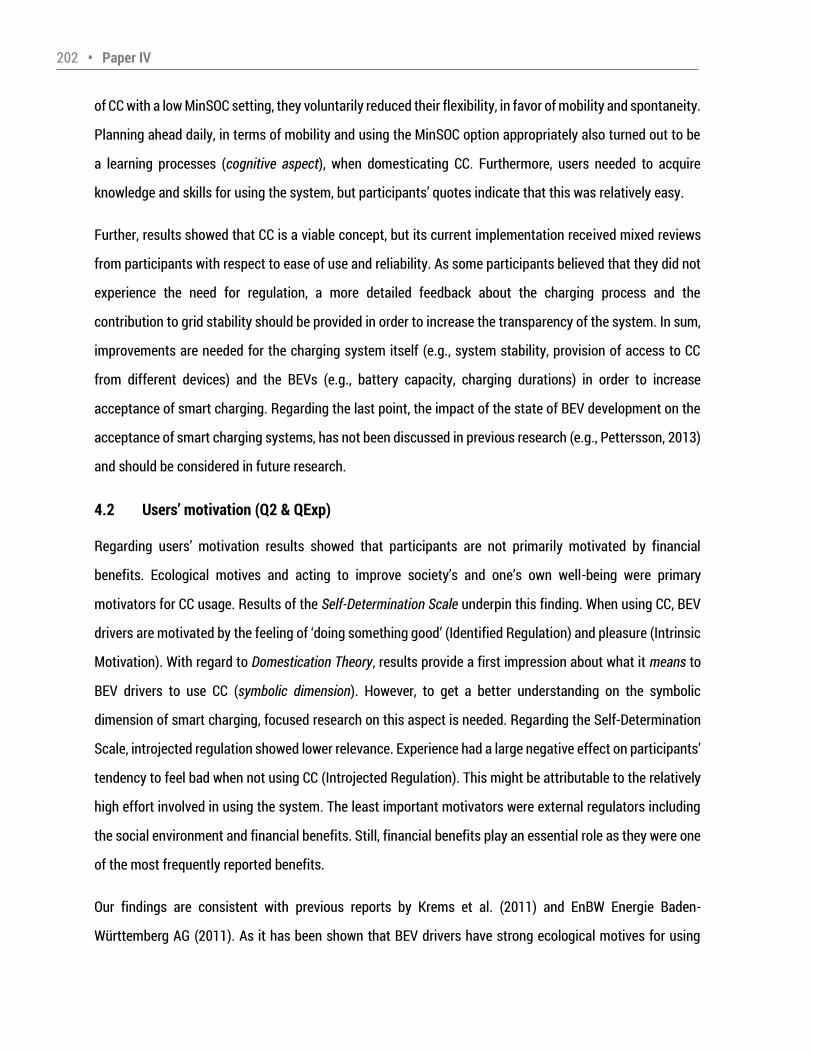
202 • Paper IV of CC with a low MinSOC setting, they voluntarily reduced their flexibility, in favor of mobility and spontaneity. Planning ahead daily, in terms of mobility and using the MinSOC option appropriately also turned out to be a learning processes (cognitive aspect), when domesticating CC. Furthermore, users needed to acquire knowledge and skills for using the system, but participants quotes indicate that this was relatively easy. Further, results showed that CC is a viable concept, but its current implementation received mixed reviews from participants with respect to ease of use and reliability. As some participants believed that they did not experience the need for regulation, a more detailed feedback about the charging process and the contribution to grid stability should be provided in order to increase the transparency of the system. In sum, improvements are needed for the charging system itself (e.g., system stability, provision of access to CC from different devices) and the BEVs (e.g., battery capacity, charging durations) in order to increase acceptance of smart charging. Regarding the last point, the impact of the state of BEV development on the acceptance of smart charging systems, has not been discussed in previous research (e.g., Pettersson, 2013) and should be considered in future research. 4.2 Users’ motivation (Q2 & QExp) Regarding users motivation results showed that participants are not primarily motivated by financial
benefits. Ecological motives and acting to improve society s and one s own well-being were primary motivators for CC usage. Results of the Self-Determination Scale underpin this finding. When using CC, BEV drivers are motivated by the feeling of doing something good (Identified Regulation) and pleasure (Intrinsic Motivation). With regard to Domestication Theory, results provide a first impression about what it means to BEV drivers to use CC (symbolic dimension). However, to get a better understanding on the symbolic dimension of smart charging, focused research on this aspect is needed. Regarding the Self-Determination Scale, introjected regulation showed lower relevance. Experience had a large negative effect on participants tendency to feel bad when not using CC (Introjected Regulation). This might be attributable to the relatively high effort involved in using the system. The least important motivators were external regulators including the social environment and financial benefits. Still, financial benefits play an essential role as they were one of the most frequently reported benefits. Our findings are consistent with previous reports by Krems et al. (2011) and EnBW Energie Baden-Württemberg AG (2011). As it has been shown that BEV drivers have strong ecological motives for using
Paper IV • 203 BEVs (e.g., Krems, 2011; Hjorthol, 2013), these motives might also generalize to CC usage, thereby, supporting the distribution of smart charging technology. For advertising future smart charging systems, it is therefore important to highlight the positive ecological benefit and the contribution to society. Moreover, feedback about using CC should not only provide information on financial benefits, but also on the positive effects for the environment and/or society as it has been done for eco-driving (Dogan, Bolderdijk, & Steg, 2014) or smart home displays (Petkoy, Goswani, Kobler, & Kremar, 2014). Dogan et al. (2014) argued that ecological feedback increased the extent to which drivers evaluate eco-driving behavior as worth the effort. This could also account for using CC. However, it is also possible that a significant portion of the BEV driver population thinks they have already done their part to protect the environmental by driving an EV (Vilimek, Keinath, & Schwalm, 2012), which might negatively affect acceptance of CC. For this group financial benefits could be even more important. To confirm this hypothesis further research is needed. When interpreting the role of financial benefits of CC, we have to emphasize that the costs of the implemented smart charging technology were defrayed by the project partners and the German Federal Ministry for the Environment, Nature Conservation, Building and Nuclear Safety. For future systems, it has not been decided who will pay, for instance, for the smart charging box. The role of financial benefits when using CC might change significantly, if BEV users have to make some extra investments. Then amortization time might become an important factor. 4.3 Evaluation and acceptance of smart charging (Q3 & QExp) Our results indicate that spontaneously reported benefits of using CC are similar to the later rated main motives of participating in CC and ratings of potential benefits listed in the questionnaire: support for grid stability, financial benefits and positive ecological effect of CC. The potential benefit that participants rated most highly was environmental friendliness, followed in order of approval by contribution to grid stability, contribution to green energy supply, and lower financial costs. These findings highlight the importance of ecological motives and are consistent with previous research (e.g., EnBW Energie Baden-Württemberg AG, 2011). For future systems, it is therefore important to highlight the positive ecological benefit and the contribution to society as discussed earlier.
204 • Paper IV Prior to experiencing the BEV, participants spontaneously mentioned further benefits, such as the positive effect on energy consumption associated with the need for planning and the satisfaction of the play instinct. After experiencing the prototype system, use of the mobile application to remotely access the vehicle was reported as a benefit. Currently available BEVs, like the BMW i3 and the Nissan Leaf already provide similar remote access. Integrating a CC function in such an application might be beneficial for the usage of CC as the driver will be reminded of this charging mode when checking, for instance, the actual state-of-charge and he/she has just one app for all information and actions regarding the EV. For drivers of other BEVs that are not equipped with such a tool, a mobile application for CC that provides additional vehicle information and control elements could be a further motivator for using CC. Reported costs were reduced flexibility including less spontaneity, the need to better plan ahead, adjusting settings via mobile application, and less range due to utilization of MinSOC. These reported costs reflected the needed changes in daily practices (see discussion on Q1). Participants who reported this drawback might have wanted to make the most efficient use of CC by setting the MinSOC as low as possible. In the long-term this might negatively influence the use of CC. Therefore, we recommend paying close attention to the potential disadvantage of MinSOC and addressing it by highlighting the ecological impact, reducing range anxiety and implementing reward. Another expected cost or concern prior to using CC was the lack of data privacy, but it was no longer cited as a drawback after experiencing CC. Still, it is an important issue and has been investigated, for instance, by Döbelt, Kämpfe and Krems (2014). In the context of smart charging, participants in an online survey were somewhat willing to provide information that base on raw (e.g., departure time) and processed data (e.g., parking time). However, they reject providing information that includes threat potential of this data (e.g., household is unattended). For the successful establishment of smart charging systems, it might be important to address privacy concerns and provide information about data security to end-users. Participants were ambivalent about costs, neither disagreeing nor agreeing strongly with cost statements in the questionnaire. Notably, they partly reflect the spontaneously reported costs in the interview (e.g., not as flexible as before, make fewer spontaneous trips), but agreement ratings for the perceived costs were relatively low. So we assume that the reduction of flexibility is acceptable and therefore should not hinder the acceptance of CC. Furthermore, results regarding the assessment of cost-benefit-balance indicate that
Paper IV • 205 perceived costs such as reduced flexibility and more effortful charging are equalized by benefits such as grid stability and lower financial costs after testing CC. Although financial benefits are not the main motivator for using CC, the perceived balance could be lost when financial benefits would not exist. According to Krems et al. (2011) financial benefits are especially important when effort is high. This is the case for CC when interpreting the reported experiences and costs. Therefore, future smart charging systems should probably be framed as systems that contribute to the protection of environment and grid stability, which additionally provide an economic benefit. Regarding the effect of testing CC (QExp), effort expended was evaluated higher and financial benefits evaluated as lower after experiencing CC. These findings indicate that experiencing CC results in readjustment of the cost-benefit-analysis. Therefore, a reduction in acceptance is preventable, provided that benefits justify costs. This should be taken into account when developing future reward systems or improving smart charging systems by, for instance, developing new features (e.g., weekly profiles of EV usage) in order to reduce the effort involved in managing settings. However, the effort expended to utilize the implemented charging system was probably higher than intended. Due to the reduced reliability of the prototype system, participants might have had to deal with uncertainty, additional observation of the system, and troubleshooting with technicians. The smart charging system was evaluated as effective, rather suitable for daily life and rather acceptable. Participants trusted in the system, although experienced (QExp) medium negative effects on trust. Consistent with Pettersson (2013) in Sweden, we found a high willingness to use CC: 90% and 80% of the participants reported that they are completely or mostly willing, respectively, to use such a system within the project and even after the project, if possible. When interpreting these results in combination with reported experiences, it can be concluded that the level of user involvement is acceptable and that the implemented prototype of a smart charging system is promising; however, adjustments are needed to fully meet user satisfaction and a successful domestication of CC. Future research is needed to determine whether a more advanced smart charging system with a comparable level of user involvement and a higher level of system reliability would be evaluated even more positively and used for a longer period of time.
206 • Paper IV 4.4 Charging with the opportunity to use CC (Q4 & QExp) Regarding the charging behavior (Q4), questionnaire results showed that CC was extensively used by the sample (approximately 80% of charging events). The main reasons why CC was not used were inability to access CC and technical problems. In sum, participants accepted CC and usage rates might be even higher when users have the opportunity to use CC more often and if reliability of CC systems improves. Interview results indicate that changes in charging behavior can be quite different depending on their prior charging behavior. People who seldom charged before CC charged more often, BEV drivers that had plugged-in every day continued with this behavior after the introduction of CC and some people reported to avoid charging when it was not rewarded. The differences in how people adapt their charging behavior show how differently daily practices (practical dimension) have to be changed in order to domesticate CC. Now, the question remains if all types of changes are welcomed or if different solutions are needed for users with different charging styles (Franke & Krems, 2013) in order to reach the maximum potential of CC for grid stabilization. Designers and engineers should have this in mind when further developing smart charging systems. 4.5 Limitations Participants in this study actively applied for the project. They were aware of the field study goal and willing to support grid stability from the beginning. This might have originated a self-selection bias in the sample, by the introduction of participants especially motivated to change their energy consumption (Strengers, 2013). However, results showed that the main motivator for joining the project was to drive the ActiveE; whereas testing CC was only the third most cited motivator. CC usage frequency might also have been slightly different if other charging locations would be available. Though, a significant behavioral change should not be expected, as previous studies demonstrate that, for instance, public charging stations are rarely used (Pettersson, 2013; Vilimek et al., 2012). Future research is needed to investigate whether evaluations and usage behavior of CC observed in this study generalizes to the population of actual and future BEV owners and whether CC usage behavior changes over a longer period of time. Although, the number of participants is relatively low, results contribute to research on users perspectives of smart charging systems. Until the present, only very few people had the chance to experience a smart charging system in real life. As implementation of a smart charging system prototype like the one in the
Paper IV • 207 present project is expensive and the possibility of running such tests is limited, results of our study contribute to gathering more knowledge about the acceptability of CC. 4.6 Generalizability of results to other countries A comparison of the technical aspects of smart charging systems between different countries is challenging, as every state has its own laws and regulations that determine the implementation of smart charging systems. However, the users perspective of CC might still be quite similar: Users have a BEV, a smart charging station and a HMI (e.g., mobile application) through which they manage their settings when utilizing CC. Our study was conducted in a German city, but we argue that results are generalizable to other European countries with large metropolitan areas similar to Berlin. Residents in large cities have similar mobility needs and living conditions. Acceptable range requirements reported by BEV drivers from different countries showed that they were close to the provided range of the BEV (+/- 15 miles; Vilimek et al. 2012). Therefore, setting a low MinSOC (e.g., 50% ≈ 50 miles) is expected to be perceived as a high potential cost of CC in different countries. Furthermore, Pettersson (2013) reported a similar intention to use a smart charging system with a comparable level of user involvement in the future with a Swedish sample. Regarding smart grids, Swiss participants had lower acceptance rates than Danish or Norwegian respondents, but when neutrally asked, smart grid was accepted in all countries by at least 70% of respondents (Toft et al., 2014). This implies that CC will be acceptable in other European countries; however, rates might vary to some extent. 5 Conclusion On the one hand, results of this field study show that a smart charging system with high user involvement like the one implemented in this study is useable and acceptable in daily routine and provided some insight into practical, symbolic and cognitive aspects of using a smart charging system. BEV drivers were able to effectively set, for instance, departure times and a MinSOC level at the expected departure time. On the other hand, results indicate that adjustments to the charging system like increasing technical reliability and providing access to smart charging from other devices, as well as improvements to the vehicle itself (e.g., battery capacity), are needed in order to increase consumer acceptance of smart charging systems.
208 • Paper IV Acknowledgements This study is part of the research project Gesteuertes Laden V3.0 which is funded by the German Federal Ministry for the Environment, Nature Conservation, Building and Nuclear Safety. We thank our consortium partners BMW Group, EWE AG, Clean Energy Sourcing AG, Fraunhofer Advanced System Technology AST, Technische Universität Ilmenau and the associated partner Vattenfall Europe that realized the smart charging system and supported the study.
Paper IV • 209 References Amoroso, F. A., & Cappuccino, G. (2012). Advantages of efficiency-aware smart charging strategies for PEVs. Energy Conversion and Management, 54(1), 1-6. doi:10.1016/j.enconman.2011.09.006 Balta-Ozkan, N., Boteler, B., & Amerighi, O. (2014). European smart home market development: Public views on technical and economic aspects across the United Kingdom, Germany and Italy, Energy Research & Social Science, 3, 65-77. doi:10.1016/j.erss.2014.07.007 BMW Group (2012). BMW ActiveE. Entwickelt um zu elektrisieren. Retrieved from: http://www.bmw.de/de/neufahrzeuge/1er/activeE/2011/fakten.html (24.02.2015) Bortz, J. (2005). Statistik: Für Human- und Sozialwissenschaftler. (6th edition) Heidelberg: Springer. Braun, V., & Clarke, V. (2006). Using thematic analysis in psychology. Qualitative Research in Psychology 3(2), 77-101, doi:10.1191/1478088706qp063oa Bühler, F., Cocron, P., Neumann, I., Franke, T., & Krems, J. F. (2014). Is EV experience related to EV acceptance? Results from a German field study. Transportation Research Part F: Traffic Psychology, 25(A), 85-90. doi:10.1016/j.trf.2014.05.002 Cocron, P., & Krems, J. F. (2013). Driver perceptions of the safety implications of quiet electric vehicles. Accident Analysis and Prevention, 58, 122-131. doi:10.1016/j.aap.2013.04.028 Cohen, J. (1988). Statistical power analysis for the behavioral sciences (2nd edition). Hillsdale, NJ: Erlbaum. Deci, E. L., & Ryan, R. M. (2012). Self-determination theory. In P. A. M. Van Lange, A. W. Kruglanski, & E. T. Higgins (Eds.), Handbook of theories of social psychology: Vol. 1 (pp. 416-437). Thousand Oaks, CA: Sage, doi:10.4135/9781446201022 Döbelt, S., Kämpfe, B., & Krems, J. F. (2014). Smart Grid, Smart Charging, Smart Privacy? An Empirical Investigation of Consumers Willingness to Provide Smart Charging Information, Proceedings ComForEn 2014, 29-37. Dogan, E., Bolderdijk, J. W., & Steg, L. (2014). Making Small Numbers Count: Environmental and Financial Feedback in Promoting Eco-driving Behaviours. Journal of Consumer Policy, 37(3), 413-422. doi:http://dx.doi.org/10.1007/s10603-014-9259-z Eckhardt, D. C. F., Lindwedel, D. E., Gödderz, D. K., Maempel, V., Schwarz, D. M., Hufnagl, C., . . . Schlegel, S. (2011). Verbundprojekt: Steigerung der Effektivität und Effizienz der Applikationen Wind-to-Vehicle (W2V) sowie Vehicle-to-Grid (V2G) inklusive Ladeinfrastruktur (Gesteuertes Laden V2.0). Hamburg, Berlin, Chemnitz, Ilmenau: Vattenfall Europe Innovation GmbH, BMW AG, Technische Universität Berlin, TU Chemnitz, TU Ilmenau.
210 • Paper IV EnBW Energie Baden-Württemberg AG (2011). Verbundvorhaben MeRegioMobil - Abschlussbericht des Projektkonsortiums. Karlsruhe. Field, A. (2013). Discovering statistics using IBM SPSS statistics (4th ed.). London: Sage. Franke, T., & Krems, J. F. (2013). Understanding charging behaviour of electric vehicle users. Transportation Research Part F: Traffic Psychology and Behaviour, 21, 75-89. doi:10.1016/j.trf.2013.09.002 Gangale, F., Mengolini, A., & Onyeji, I. (2013). Consumer engagement: An insight from smart grid projects in Europe. Energy Policy, 60, 621-628. doi:10.1016/j.enpol.2013.05.031 Habib, S., Kamran, M., & Rashid, U. (2015). Impact analysis of vehicle-to-grid technology and charging strategies of electric vehicles on distribution networks A review, Journal of Power Sources, 277, 205 214. doi:10.1016/j.jpowsour.2014.12.020 Hargreaves, T. (2015). Practice-ing behaviour change: Applying social practice theory to pro-environmental behaviour change, Journal of Consumer Culture, 11(1), 79-99, doi:10.1177/1469540510390500. Hjorthol, R. (2013). Attitudes, Ownership and Use of Electric Vehicles – A Review of Literature. TØI, Institute of Transport Economics, Norwegian Center for Transport Research. Report 1261/201. Hoeffler, S. (2003). Measuring Preferences for Really New Products. Journal of Marketing Research, 40(4), 406-420. Hujits, N. M. A., Molin, E. J. E., & Steg, L. (2012). Psychological factors influencing sustainable energy technology acceptance: A review-based comprehensive framework, Renewable and Sustainable Energy Reviews, 16(1), 525-531, doi:10.1016/j.rser.2011.08.018 Illing, B., Warweg, O., & Hartung, P. (2014). Cost-utility analysis to evaluate business cases for electric vehicle market penetration. Paper for 11th International Conference on the European Energy Market (EEM), doi:10.1109/EEM.2014.6861270 Isaksson, O., & Fagerholt, A. (2012). Smart charging for electric vehicles. Ericsson Business Review, 3, 32-36. Retrieved from http://www.ericsson.com/res/thecompany/docs/publications/business-view/2012/issue3/smart-charging-for-electric-vehicles.pdf. ISO/PAS 18152: Ergonomics of human–system interaction – Specification for the process assessment of human–system issues. Genf 2003 Jian, J. J., Bisantz, A. M., & Drury, C. G. (2000). Foundations for an empirical determined scale of trust in automated systems. International Journal of Cognitive Ergonomics, 4(1), 53-71, doi:10.1207/S15327566IJCE0401_04
Paper IV • 211 Krems, J. F. (2011). MINIEVatt Berlin – Freude am umweltgerechten Fahren, Verbundprojekt: Klimaentlastung durch den Einsatz erneuerbarer Energien im Zusammenwirken mit emissionsfreien Elektrofahrzeugen MINI E 1.0 Berlin (Abschlussbericht, Förderkennzeichen 16EM0003). Chemnitz: Technische Universität Chemnitz. Krems, J. F., Bartholdt, L., Cocron, P., Dielmann, B., Franke, T., Henning, M. J., Ischebeck, M., Schleinitz, K., & Žilyte-Lennertz, M. (2011). MINI E powered by Vattenfall V2.0. Schlussbericht zum Forschungsvorhaben Verbundprojekt: MINI E powered by Vattenfall V2.0 (Abschlussbericht, Förderkennzeichen 16EM0070). Chemnitz: Technische Universität Chemnitz. Norman, D. A., & Draper, S. W. (1986). User-centered system design: New perspectives in human-computer interaction. Hillsdale, NJ: Lawrence Erlbaum Associates. Petkov, P., Goswani, S., Kobler, F., & Kremar, H. (2012). Personalized Eco-Feedback as a design technique for motivating energy saving behavior at home. Paper presented at the proceedings of the 7th Nordic conference on human–computer interaction: Making sense through design, Copenhagen Denmark. Pettersson, S. (2013). ELVIIS – Final Report to Göteborg Energi Forskningsstiftelse, ICT Sweden Viktoria https://www.viktoria.se/sites/default/files/pub/www.viktoria.se/upload/publications/elviis_final.pdf Ryan, R. M., & Deci, E. L. (2007). Active human nature: Self-determination theory and the promotion and maintenance of sport, exercise, and health. In M. S. Hagger & N. L. D. Chatzisarantis (Eds.), Intrinsic motivation and self-determination in exercise and sport (pp. 1-19). Champaign, IL: Human Kinetics. Silverstone, R. (1993). Domesticating the revolution: information and communication technologies and everyday life, Aslib Proceedings, 45(9), 227 233, doi:10.1108/eb051328. Silverstone, R., & Hirsch, E. (1992). Consuming Technologies: Media and information in domestic spaces. London/New York: Routledge. Sørensen, K. (2006). Domestication: The Enactment of Technology, in T. Berker, M. Hartmann, Punie and K. Ward (eds) Domestication of Media and Technologies (pp. 40-61), Maidenhead: Open University press. Strengers, Y. (2013). Smart Energy Technologies in Everyday Life: Smart Utopia?. Palgrave Macmillan, London. Taylor J., Maitra A., Alexander M., Brooks D., & Duvall M. (2009). Evaluation of the impact of plug-in electric vehicle loading on distribution system operations. In: IEEE power & energy society general meeting, 1 6. doi:10.1109/PES.2009.5275317 Toft, M. B., Schuitema, G., & Thøgersen, J. (2014). The importance of framing for consumer acceptance of the Smart Grid: A comparative study of Denmark, Norway and Switzerland, Energy Research & Social Science, 3, 113-123. doi:10.1016/j.erss.2014.07.010
212 • Paper IV VERBI Software (2014). MAXQDA: Reference Manual for the Text Analysis Software, Marburg, 2014. Verbong, G. P., Beemsterboer, S., & Sengers, F. (2013). Smart grids or smart users? Involving users in developing a low carbon electricity economy. Energy Policy, 52, 117-125. Vilimek, R., Keinath, A., & Schwalm, M. (2012). The MINI E field study - Similarities and differences in international everyday driving. In: 4th International Conference Applied on Human Factors and Ergonomics, July 21 - 25, 2012, San Francisco, CA. Weiller, C. (2011). Plug-in hybrid electric vehicle impacts on hourly electricity demand in the United States, Energy Policy, 39(6), 3766-3778, ISSN 0301-4215, doi:10.1016/j.enpol.2011.04.005

Curriculum Vitae • 213 Curriculum Vitae Personal information Name: Franziska Schmalfuß (neé Bühler) Date of birth: 08.03.1985 Place of birth: Karl-Marx-Stadt, now Chemnitz, Germany Marital status: married, two children Citizenship: German Office address Technische Universität Chemnitz Department of Psychology Cognitive and Engineering Psychology Wilhelm-Raabe-Str. 43 09120 Chemnitz Phone: +49-371-531-38235 Fax: +49-371-531-838235 Email: [email protected] Education 2009 2017 Chemnitz University of Technology, Doctoral research 2004 2009 Chemnitz University of Technology, Germany (Major: Psychology), Diploma in Psychology (Dipl. Psych.); Thesis: Übung macht den (Fahr-) Meister - Der Einfluss der Fahrerfahrung auf das Fahr- und Blickverhalten in unterschiedlich komplexen Verkehrssituationen ( Practice make perfect (in driving) The effect

214 • Curriculum Vitae of driving experience on driving and gaze behavior in traffic situations of varying complexity ) 2003 2004 Work abroad CT, USA + several classes at Manhattanville College, NY, USA (Major: Language, Business Management) 1994 2003 Gottfried-Leibniz-Gymnasium Chemnitz, Germany University entrance qualification (Abitur) Professional experience 2009 Researcher and lecturer at the Professorship of Cognitive and Engineering Psychology, Department of Psychology, Chemnitz University of Technology; Parental time from June 2011 to August 2012 and from July 2014 to October 2015 2007 April June Internship at Volkswagen AG, Wolfsburg, Germany (Vehicle security) 2006 2009 Student assistant at the Professorship of Cognitive and Engineering Psychology, Department of Psychology, Chemnitz University of Technology Projects 2009 2010 MINI E Berlin powered by Vattenfall 2010 2011 Gesteuertes Laden V2.0 2012 2014 Gesteuertes Laden V3.0 2015 Gesteuertes Laden V3.0 2016 Freiluftlabor Neue Mobilität am Sachsenring 2016 Factory2Fit 2017 SYNCAR Teaching 2015 2016 Winter semester: Empirical and experimental practical course 2016 Summer semester: Empirical and experimental practical course
Curriculum Vitae • 215 2016 2017 Winter semester: Empirical and experimental practical course + Engineering psychology ( Stress ) 2017 Summer semester: Empirical and experimental practical course Fellowship 2012 September 2014 January Scholarship for the PhD project for achieving a work-life balance, funded by the European Social Fund (ESF) and the Sächsische AufbauBank (Saxon Development Bank) in the context of Europa fördert Sachsen (Europe funds Saxony) Award 2013 IET Intelligent Transport Systems Premium Award for the paper on research methods of the MINI E work group: Cocron, P., Bühler, F., Neumann, I., Franke, T., Krems, J.F., Schwalm, M., & Keinath, A. (2011). Methods of evaluating electric vehicles from a user's perspective - the MINI E field trial in Berlin. IET Intelligent Transport Systems, 5(2), 127-133. doi: 10.1049/iet-its.2010.0126 Franziska Schmalfuß Chemnitz, 22.05.2017
216 • Publications Publications Articles in journals (peer-reviewed) Bühler, F., Cocron, P., Neumann, I., Franke, T., & Krems, J. F. (2014). Is EV experience related to EV acceptance? Results from a German field study. Transportation Research Part F: Traffic Psychology and Behaviour, 25(A), 85 90. doi:10.1016/j.trf.2014.05.002 Cocron, P., Bühler, F., Franke, T., Neumann, I., Dielmann, B., & Krems, J. F. (2013). Energy recapture through deceleration regenerative braking in electric vehicles from a user perspective. Ergonomics, 56(8), 1203 1215. doi:10.1080/00140139.2013.803160 Cocron, P., Bühler, F., Neumann, I., Franke, T., Krems, J.F., Schwalm, M., & Keinath, A. (2011). Methods of evaluating electric vehicles from a user's perspective - the MINI E field trial in Berlin. IET Intelligent Transport Systems, 5(2), 127 133. doi: 10.1049/iet-its.2010.0126 Franke, T., Neumann, I., Bühler, F., Cocron, P., & Krems, J. F. (2012). Experiencing range in an electric vehicle: Understanding psychological barriers. Applied Psychology: An international review, 61(3), 368 391. doi:10.1111/j.1464-0597.2011.00474.x Neumann, I., Franke, T., Cocron, P., Bühler, F., & Krems, J. F. (2015). Eco-driving strategies in battery electric vehicle use - how do drivers adapt over time? IET Intelligent Transport Systems. 9(7), 746 753. doi:10.1049/iet-its.2014.0221 Schmalfuß, F., Mair, C., Döbelt, S., Kämpfe, B., Wüstemann, R., Krems, J. F., & Keinath, A. (2015). User responses to a smart charging system in Germany: Battery electric vehicle driver motivation, attitudes and acceptance. Energy Research & Social Science, 9, 60 71. doi:10.1016/j.erss.2015.08.019 Schmalfuß, F., Mühl, K., & Krems, J. F. (2017). Direct experience with battery electric vehicles (BEVs) matters when evaluating vehicle attributes, attitude and purchase intention, Transportation Research Part F: Traffic Psychology and Behaviour, 46(A), 47 69, doi:10.1016/j.trf.2017.01.004. Book chapters and conference proceedings Bühler, F., Franke, T., Schleinitz, K., Cocron, P., Neumann, I., Ischebeck, M., & Krems, J. F. (2013). Driving an EV with no opportunity to charge at home - is this acceptable? In D. De Waard et al. (Eds.), Proceedings of the Human Factors and Ergonomics Society Europe Chapter 2013 Annual Conference. Retrieved from http://www.hfes-europe.org/books/proceedings2013/Buehler.pdf
Publications • 217 Bühler, F., Neumann, I., Cocron, P., Franke, T., & Krems, J. F. (2011). Usage patterns of electric vehicles: A reliable indicator of acceptance? Findings from a German field study. Proceedings of the 90th Annual Meeting of the Transportation Research Board. Retrieved from http://amonline.trb.org/12jj41/1 Bühler, F., Neumann, I., Cocron, P., Franke, T., Krems, J. F., Schwalm, M., & Keinath, A. (2010). Die Nutzerstudie im Rahmen des Flottenversuchs MINI E Berlin Methodisches Vorgehen und erste Erfahrungen im Rahmen der wissenschaftlichen Begleitforschung. In T. J. Mager (Ed.), Mobilitätsmanagement – Beiträge zur Verkehrspraxis (pp. 81 96). Köln, Deutschland: ksv-verlag. Cocron, P., Bühler, F., Franke, T., Neumann, I., & Krems, J. F. (2011). The silence of electric vehicles blessing or curse? Proceedings of the 90th Annual Meeting of the Transportation Research Board. Retrieved from http://amonline.trb.org/12jq42/1 Franke, T., Bühler, F., Cocron, P., Neumann, I., & Krems, J. F. (2012). Enhancing sustainability of electric vehicles: A field study approach to understanding user acceptance and behavior. In M. Sullman & L. Dorn. (Eds.), Advances in traffic psychology (pp. 295 306). Farnham, UK: Ashgate. Franke, T., Cocron, P., Bühler, F., & Neumann, I. (2013). Die Nutzerperspektive auf Elektromobilität: Ergebnisse der Feldstudie. In J. F. Krems, O. Weinmann, J. Weber, D. Westermann, & S. Albayrak (Eds.), Elektromobilität in Metropolregionen: Die Feldstudie MINI E Berlin powered by Vattenfall. Fortschritt-Berichte VDI Reihe 12 Nr. 766 (pp. 48 79). Düsseldorf, Germany: VDI Verlag. Franke, T., Cocron, P., Bühler, F., Neumann, I., & Krems, J. F. (2012). Adapting to the range of an electric vehicle: The relation of experience to subjectively available mobility resources. In P. Valero Mora, J. F. Pace, & L. Mendoza (Eds.), Proceedings of the European Conference on Human Centred Design for Intelligent Transport Systems, Valencia, Spain, June 14-15 2012 (pp. 95103). Lyon, France: Humanist Publications. Neumann, I., Franke, T., Bühler, F., Cocron, P., & Krems, J.F. (2014). Eco-driving strategies in electric vehicle use what do drivers get to know over time? In R. Risser, A. Pauzié, & L. Mendoza (Eds.), Proceedings of the European Conference on Human Centred Design for Intelligent Transport Systems 2014, Vienna, Austria. Lyon: Humanist Publications (pp. 746 753). Schmalfuß, F., Kreußlein, M., Döbelt, S., Kämpfe, B., Wüstemann, R., Mair, C., Heller, C., & Krems, J. F. (2016). Smart charging systems as one solution to overcome grid stability problems in the future? A field study for examining the BEV user acceptance of a smart charging system. In A. Morris & L. Mendoza (Eds.). Proceedings of European Conference on Human Centred Design Intelligent Transport Systems (pp. 114 124).
218 • Publications Schmalfuß, F., Kreußlein, M., Mair, C., Döbelt, S., Heller, C., Wüstemann, R., Kämpfe, B., & Krems, J. F. (2017). Smart charging in daily routine - Expectations, experiences and preferences of potential users. In: J. Liebl (Ed.), Grid Integration of Electric Mobility - 1st International ATZ Conference 2016. Wiesbaden, Germany: Springer Vieweg. Wege, C., Bühler, F., Rösler, D., & Krems, J.F. (2010). Does driving experience matter in driving situations of varying complexity? A comparison of gaze and driving behaviour of experienced and inexperienced drivers. In J.F. Krems, T. Petzoldt & M. Henning (Eds.). Proceedings of the European Conference on Human Centred Design for Intelligent Transport Systems, Berlin, Germany, April 29-30 2010 (pp. 189 196). Lyon: Humanist Publications. Presentations and posters Bühler, F., Rösler, D., Wege, C. & Krems, J.F. (2009). Driving experience matters! Comparison of experienced and inexperienced drivers in driving situations of varying complexity. In A. Lichtenstein, C. Stößel & C. Clemens (Eds.), Der Mensch im Mittelpunkt technischer Systeme. 8. Berliner Werkstatt Mensch-Maschine-Systeme (pp. 104 109). Düsseldorf: VDI Verlag. Bühler, F., Rösler, D., Wege, C., & Krems, J.F. (2010). Fahrerverhalten in unterschiedlich komplexen Verkehrssituationen: Ein Vergleich von Wenigfahrern und Experten. In F. Petermann & U. Koglin (Hrsg.). 47. Kongress der Deutschen Gesellschaft für Psychologie, 26.-30. September 2010 (p. 434). Lengerich: Pabst Science Publishers. Bühler, F., Schleinitz, K., Cocron, P., Franke, T., Bartholdt, L., & Krems, J. F. (2013). Can short-term experience with an EV change people s mind? Experience effects on attitudes and purchase intentions towards EVs. Poster session presented at 10th Biennial Conference on Environmental Psychology, 23rd- 25th September 2013, Magdeburg, Germany. Cocron, P., Bachl, V., Neumann, I., Franke, T., Bühler, F., & Krems, J. F. (2011). Die geringe Geräuschkulisse von Elektrofahrzeugen: Viel Lärm um nichts? In K. Bittrich, S. Blankenberger, & J. Lukas (Eds.), Beiträge zur 53. Tagung experimentell arbeitender Psychologen (p. 33). Lengerich, Germany: Pabst Science Publishers. Cocron, P., Franke, T., Neumann, I., Bühler, F., & Krems, J. F. (2010). Expectancies and experiences of drivers using an EV: Findings from a German field study. In V. Mrowinski, M. Kyrios , & N. Voudouris (Eds.), Abstracts of the 27th International Congress of Applied Psychology (pp. 250251). Melbourne, Australia: The Australian Psychological Society Ltd. Cocron, P., Franke, T., Neumann, I., Wege, C., Bühler, F., & Krems, J. F. (2010). Ist das Fahren mit einem Elektrofahrzeug so besonders? Anpassung des Verhaltens beim Fahren mit Elektrofahrzeugen. In C. Frings, A. Mecklinger, D. Wentura, & H. Zimmer (Eds.), Beiträge zur 52.
Publications • 219 Tagung experimentell arbeitender Psychologen (p. 28). Lengerich, Germany: Pabst Science Publishers. Cocron, P., Neumann, I., Franke, T., Bühler, F., & Krems, J. F. (2012, July). To beep or not to beep: Implications of the low sound emission of electric vehicles. Paper presented at the 4th AHFE Conference. San Francisco, USA. Franke, T., Bühler, F., Neumann, I., Cocron, P., Schwalm, M., & Krems, J. F. (2010). Elektromobilität im Alltagstest - die Feldstudie Mini E Berlin. In F. Petermann, & U. Koglin (Eds.). 47. Kongress der Deutschen Gesellschaft für Psychologie, 26.-30. September 2010 (p. 290). Lengerich, Germany: Pabst Science Publishers. Franke, T., Cocron, P., Bühler, F., Neumann, I., & Krems, J. F. (2012, July). User interaction with electric vehicles: Implications for human factors research. Paper presented at the 4th AHFE Conference. San Francisco, USA. Franke, T., Neumann, J., Cocron, P., Bühler, F., & Krems, J. F. (2011). Interacting with scarce mobility resources: Psychological range levels in electric vehicles. Paper presented at the 9th Biennial Conference on Environmental Psychology, Eindhoven, The Netherlands. Franke, T., Neumann, I., Cocron, P., Bühler, F., Wege, C., & Krems, J. F. (2010). Wie gehen Nutzer mit Batterien in Elektrofahrzeugen um? Human-Battery- Interaction in einer Pilotstudie. In C. Frings, A. Mecklinger, D. Wentura, & H. Zimmer (Eds.), Beiträge zur 52. Tagung experimentell arbeitender Psychologen (p. 36). Lengerich, Germany: Pabst Science Publishers. Neumann, I., Cocron, P., Franke, T., Bühler, F., Wege, C., & Krems, J. F. (2010). Begrenzte Reichweite von Elektrofahrzeugen: Wie können Fahrer durch Anzeigenkonzepte unterstützt werden? In C. Frings, A. Mecklinger, D. Wentura, & H. Zimmer (Eds.), Beiträge zur 52. Tagung experimentell arbeitender Psychologen (p. 81). Lengerich, Germany: Pabst Science Publishers. Rösler, D., Bühler, F., Wege, C. & Krems, J.F. (2009a). Fahrerverhalten in unterschiedlich komplexen Verkehrssituationen - ein Vergleich von unerfahrenen und erfahrenen Autofahrern. In A. Eder, K. Rothermund, S. Schweinberger, M. Steffens & H. Wiese (Hrsg.), 51. Tagung experimentell arbeitender Psycholog/innen in Jena. Lengerich, Germany: Pabst Science Publishers. Rösler, D., Bühler, F., Wege, C. & Krems, J.F. (2009b). Wie komplex dürfen Verkehrssituationen sein? Ein Vergleich von unerfahrenen und erfahrenen Autofahrern. In C. Korunka, E. Kirchler & H. Ulferts (Eds.), Entscheidungen und Veränderungen in Arbeit, Organisation und Wirtschaft (pp. 8384). Wien: Falcultas Verlangs- und Buchhandels AG. Schmalfuß, F., Döbelt, S., Kreußlein, M., Mair, C., Heller, C., Wüstemann, R., Kämpfe, B., & Krems, J. (October, 2016). Project Gesteuertes Laden V3.0 . Presentation presented at the Expert
220 • Publications Workshop: V2X User perception, business models and regulatory framework Task 28 Home Grids and V2X Technologies, International Energy Agency, 26th 28th Octobre, 2016 in Paris, France. Schneidereit, T., Bühler, F., & Krems, J. F. (2015). Umweltfreundlichkeit, Reichweite oder soziales Umfeld? Eine Onlinestudie zur Untersuchung der akzeptanzbeeinflussenden Faktoren von Elektrofahrzeugen. In M. Vollrath (Hrsg.), 1. Kongress Fachgruppe Verkehrspsychologie, 25.-27. Februar 2015 (p. 15).

Eidesstattliche Erklärung • 221 Eidesstattliche Erklärung Hiermit erkläre ich, dass ich die vorliegende Arbeit selbstständig verfasst und keine anderen als die angegebenen Hilfsmittel verwendet habe. Franziska Schmalfuß Chemnitz, 22.05.2017


![Mobility Management in UMTS...problem in such networks. 2.2 Mobility Scenarios There exist several different scenarios of mobility [1,2]: Service mobility: A personalized service can](https://img.pdfslide.org/doc/110x75/60da4a3db73df032b6565862/mobility-management-in-problem-in-such-networks-22-mobility-scenarios-there.jpg)