Embed Size (px)
Citation preview
1
Background information only. Do not publish without the permission of Techconsult (www.techconsult.nu) and Reel Energi Oplysning (www.reo.dk ). Translation of “Analyse af Vindkraft i Dansk Elforsyning 2005 og 2006” prepared by Techconsult on behalf of Reel Energi Oplysning (REO). 10-08-2007.
“Analysis of Wind Power in the Danish Electricity Supply in 2005 and 2006” By Techconsult
Summary
It is often said that wind power covers ca. 20% of Danish electricity consumption. It is more correct to say that the production of power by Danish wind turbines corresponds to about 20% of electricity demand. But a considerable part of the wind energy produced is exported to neighbouring countries and thus does not cover any part of Danish electricity consumption. Now the question is how can one know that it is wind energy and not coal-electricity which is exported? In this present report Danish electricity production in the years 2005 and 2006 is analysed in a way not used earlier. It is shown that in many cases there is a strong relationship over time between wind power production and net exports. It is therefore concluded that it is mainly wind power which is exported. The wind energy used in Denmark is thus calculated as wind power production minus net exports, when this is positive. See Section 3 of the report for other situations.
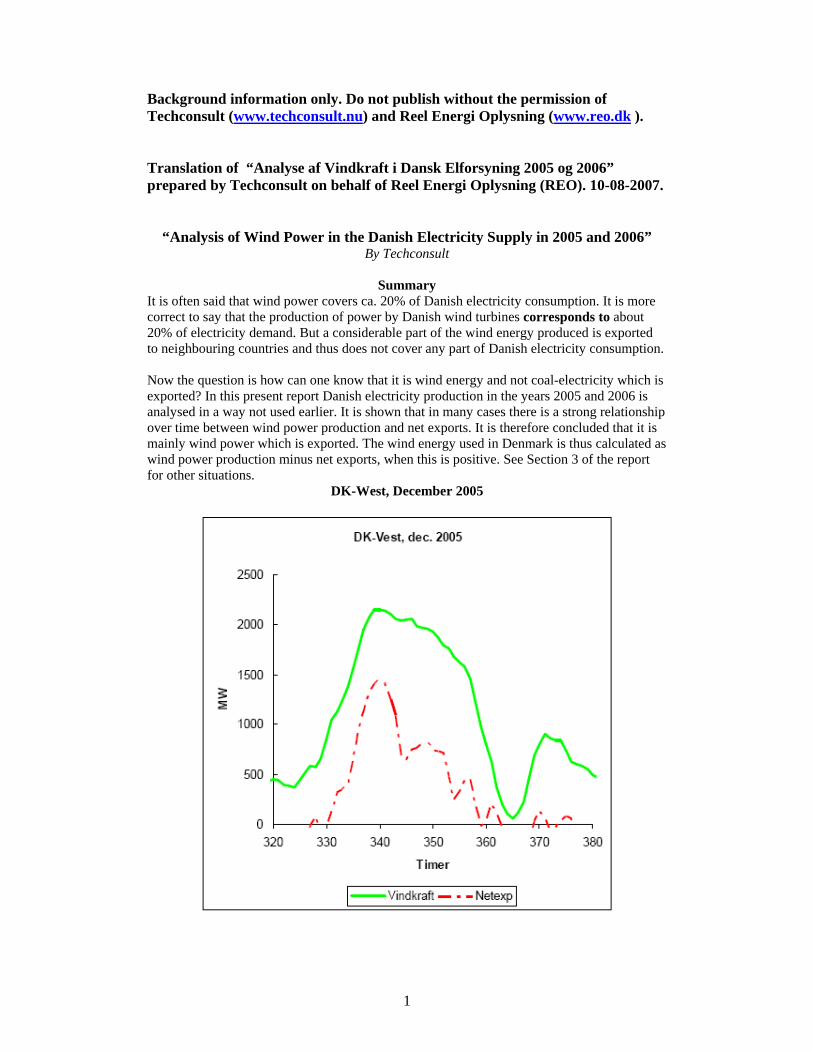
DK-West, December 2005
2
The accompanying figure shows an example. The complete (green) curve gives wind power production in West Denmark over a 60-hour period in the middle of December 2005. The stippled (red) curve gives net exports. The claim that 20% of Danish electricity consumption is covered by wind power means that one takes all the area under the green curve and says that this is the wind energy used in Denmark. But for the method used in this present report the area under the stippled line is subtracted since it is exported. In this way the wind power used in Denmark becomes less, and the degree of cover falls. One could naturally believe that the correspondence of the two curves in the figure [over time] is random. However, this is not the case. In the report the extent to which the production of wind power and net exports “swing in step” month by month is calculated. In West Denmark (Jutland-Funen) this is predominantly the case. In East Denmark, where the power stations also produce for export, the tendency is less pronounced. To get a general assessment of the amount of wind power used in Denmark it is therefore necessary to use a more sensitive estimate of the relationship, as explained in Section 3. The following results were obtained with this approach. Results for the two independent supply regions of West and East Denmark, and for Denmark as a whole, are shown in the following tables. For the whole country the degree of cover in 2005 was 13.6% (not 18.7% as stated by the Wind Turbine Industry), and in 2006 it was 10.3%, not 17%.
Table 9. Main data for regions and the whole country in 2005 Year: 2005 Demand, GWh Wind power
prodn., GWh Wind power used in DK regions. GWh %
Wind power prodn. in % of demand.
DK-West 21,009.0 5,022.6 3,438.8 16.4 23.9 DK-East 14,447.0 1,592.4 1,367.6 9.5 11.0
DK 35,456.0 6,615.0 4,806.5 13.6 18.7
Table 10. Main data for regions and the whole country in 2006 Year: 2006 Demand, GWh Wind power
prodn., GWh Wind power used in DK regions. GWh %
Wind power prodn. in % of demand.
DK-West 21,400.6 4,618.0 2,613.1 12.2 21.6 DK-East 14,573.9 1,489.0 1,087.7 7.5 10.2
DK 35,974.6 6,107.0 3,700.8 10.3 17.0
Thus, the perception that Denmark gets ca. 20% of its electricity consumption covered by wind turbines is incorrect.
-----
3
Introduction Over the last 20 years Denmark has introduced a change to the country’s electricity supply which in the long term will break totally with the system that has been developed over more than 100 years. This builds on the existence of a nationwide network provided with electrical energy from central power stations near the larger demand centres. Some of the central power stations can deliver district heating to the towns. A larger number of slightly smaller power plants are permanently coupled to produce both electricity and heat (decentralised heat and power plants). Earlier, only these two types of power plant (central and decentralized) delivered energy to the net, but with the storming arrival of wind turbines came a third source. Imports constitute a fourth. These four sources deliver electrical energy to the grid. The purchasers are Danish consumers as well as neighbouring countries. A systematic analysis of wind power in the Danish supply of electricity does not exist. REO wants to remedy this in the current report, which, using different methods, investigates the contribution of the different power sources to supply. In Section 1, the four sources are assumed to be of equal value. From data provided by Energinet.dk, hourly weight factors for the sources are calculated. The electricity received by a consumer mirrors the composition determined by these weight factors. The same applies to exported electricity. In this way the amount of electricity from each source used internally or exported can be calculated. For wind power this method suggests that 70 – 80% of the produced energy is used in Denmark, most in Eastern Denmark where the concentration of wind turbines is smaller than in the west. In Section 2, it is shown that the four sources are not of equal value. This is revealed by calculating how individual sources relate to demand and net exports. The relationship is expressed by the correlation coefficient, the principle of which is illustrated in the appendix. It is shown that the production of wind power is not correlated with demand. In this regard it differs markedly from the other sources. In Section 3, the net export of electricity is considered. It appears that for DK-West in December 2005, this was strongly correlated with the production of wind power. In this case the wind power used in Denmark was calculated as wind power production minus net exports. For the period in question it appears that wind power covered 13.7% [14.9%??] of demand. Calculation according to the method used by the wind turbine industry and the authorities would give 29.3%. In this latter case, exported wind power is calculated as though it is used within Denmark. Another characteristic situation is DK-East in January 2006. Here, there are regular exports to Sweden at night, although exports are greater when the wind blows strongly. A method has been developed to estimate the wind energy used in Denmark even in this situation.
4
1. Sources of equal value
Energinet.dk has provided the following data for Danish electricity supply in recent years: • physical exchanges via international inter-connectors • production at central plants • production at decentralised plants (NB. Here production at business plants is missing,
for which reason the data differ from those of Dansk Elforsyning) • electricity consumption.
All data are given for each hour in MWh/h units, (average MW). In this section it is assumed that all sources are of equal value. The sources comprise central power stations (Cen), decentralised power plants (Decen), wind power (Wind) and imports (Imp). The proportion (weight) of each individual source is calculated for each hour. For a particular period a consumer is assumed to receive an amount of wind power obtained by multiplying the Demand by the Weight Factor for wind power. The same is true for exports.
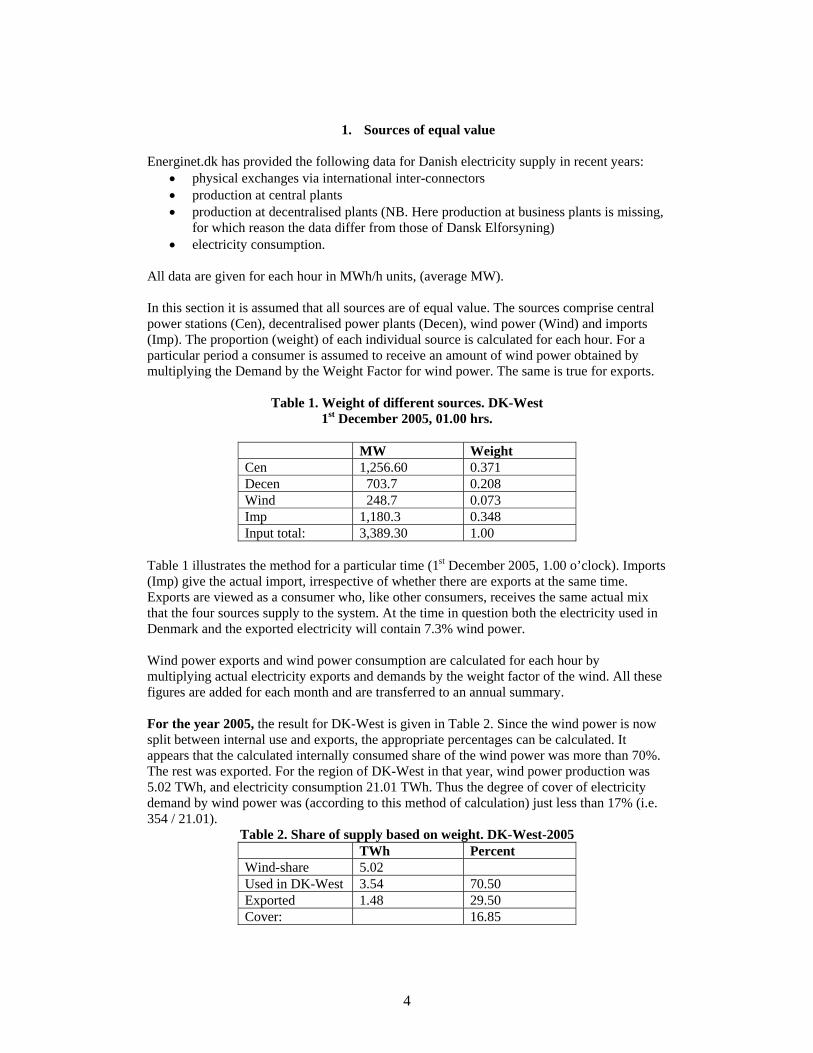
Table 1. Weight of different sources. DK-West 1st December 2005, 01.00 hrs.
MW Weight Cen 1,256.60 0.371 Decen 703.7 0.208 Wind 248.7 0.073 Imp 1,180.3 0.348 Input total: 3,389.30 1.00
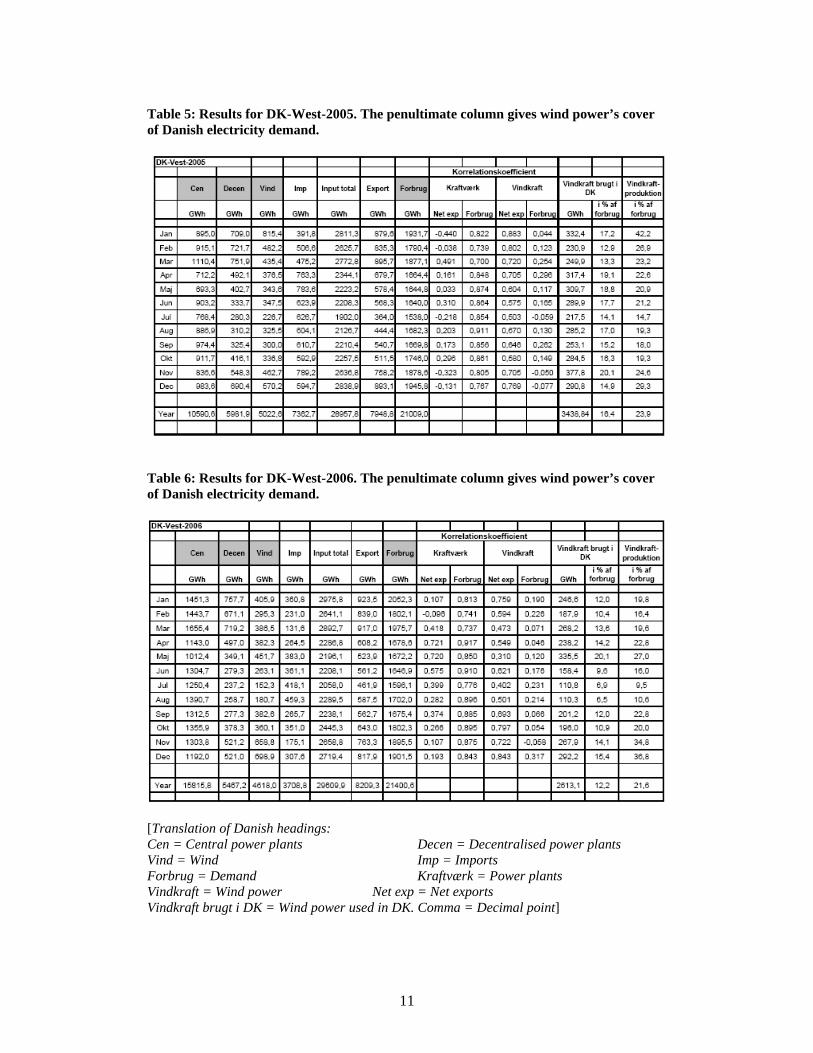
Table 1 illustrates the method for a particular time (1st December 2005, 1.00 o’clock). Imports (Imp) give the actual import, irrespective of whether there are exports at the same time. Exports are viewed as a consumer who, like other consumers, receives the same actual mix that the four sources supply to the system. At the time in question both the electricity used in Denmark and the exported electricity will contain 7.3% wind power. Wind power exports and wind power consumption are calculated for each hour by multiplying actual electricity exports and demands by the weight factor of the wind. All these figures are added for each month and are transferred to an annual summary. For the year 2005, the result for DK-West is given in Table 2. Since the wind power is now split between internal use and exports, the appropriate percentages can be calculated. It appears that the calculated internally consumed share of the wind power was more than 70%. The rest was exported. For the region of DK-West in that year, wind power production was 5.02 TWh, and electricity consumption 21.01 TWh. Thus the degree of cover of electricity demand by wind power was (according to this method of calculation) just less than 17% (i.e. 354 / 21.01).
Table 2. Share of supply based on weight. DK-West-2005 TWh Percent Wind-share 5.02 Used in DK-West 3.54 70.50 Exported 1.48 29.50 Cover: 16.85
5
The wind turbine industry calculates cover in a different way, expressing the total wind power production in relation to the internal demand. It ignores the fact that part of the wind power is exported. In this way a figure of just less than 24% is obtained (i.e. 502 / 21.01)
2. Are the electricity network’s sources of equal value?
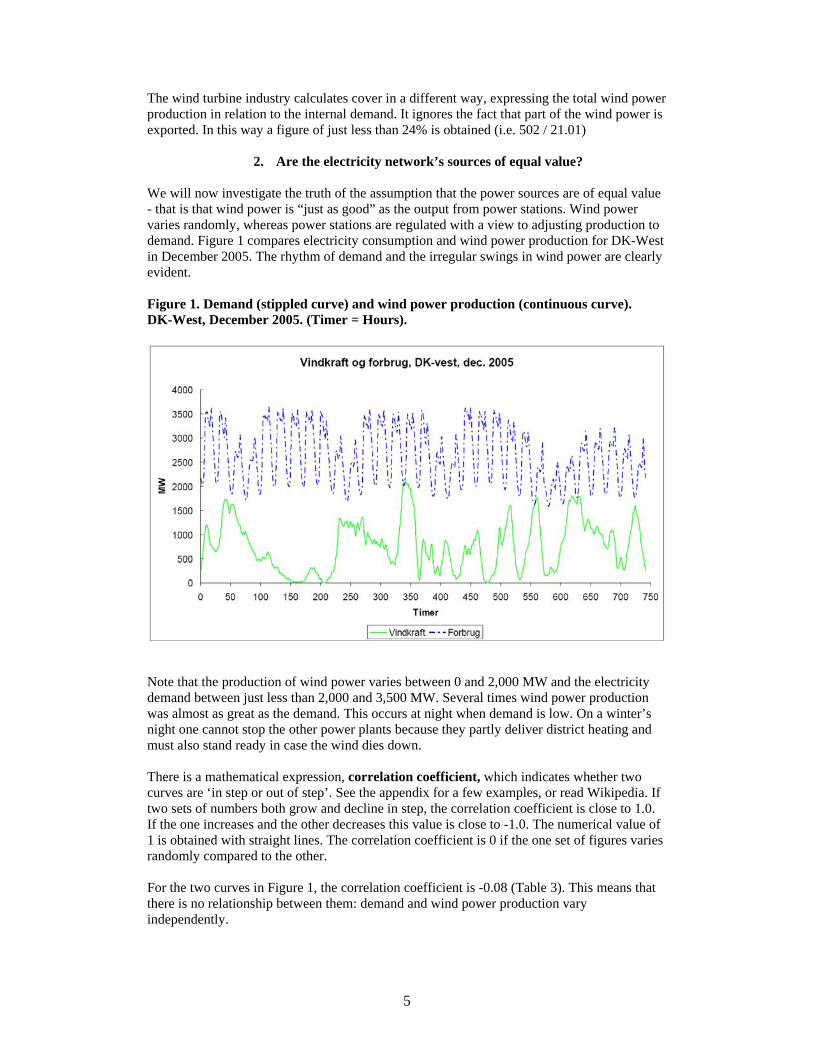
We will now investigate the truth of the assumption that the power sources are of equal value - that is that wind power is “just as good” as the output from power stations. Wind power varies randomly, whereas power stations are regulated with a view to adjusting production to demand. Figure 1 compares electricity consumption and wind power production for DK-West in December 2005. The rhythm of demand and the irregular swings in wind power are clearly evident. Figure 1. Demand (stippled curve) and wind power production (continuous curve). DK-West, December 2005. (Timer = Hours).
Note that the production of wind power varies between 0 and 2,000 MW and the electricity demand between just less than 2,000 and 3,500 MW. Several times wind power production was almost as great as the demand. This occurs at night when demand is low. On a winter’s night one cannot stop the other power plants because they partly deliver district heating and must also stand ready in case the wind dies down. There is a mathematical expression, correlation coefficient, which indicates whether two curves are ‘in step or out of step’. See the appendix for a few examples, or read Wikipedia. If two sets of numbers both grow and decline in step, the correlation coefficient is close to 1.0. If the one increases and the other decreases this value is close to -1.0. The numerical value of 1 is obtained with straight lines. The correlation coefficient is 0 if the one set of figures varies randomly compared to the other. For the two curves in Figure 1, the correlation coefficient is -0.08 (Table 3). This means that there is no relationship between them: demand and wind power production vary independently.
6
A calculation of correlations between the various parameters given in Table 3 produces the following results: Table 3. Examples of correlations between various power sources, demand and exports
for DK-West in December 2005 Cen Decen Wind Demand Exports
Norway Exports Sweden
Exports Germany
Cen 1.00 0.61 -0.33 0.56 -0.27 0.00 0.35 Decen 1.00 -0.08 0.86 -0.29 0.10 0.37 Wind 1.00 -0.08 0.30 0.49 -0.01 Demand 1.00 -0.48 -0.09 0.56 Exports N 1.00 0.32 -0.78 Exports S 1.00 -0.26 Exports G 1.00
This shows that:
1. Central power production is negatively correlated (-0.33) with wind power. This means that it is turned down when the wind starts blowing. This is no great news, but it serves to illustrate the method and its uses.
2. Wind power is weakly and negatively correlated with demand (-0.08) whereas production at the central and decentralised power plants is strongly correlated with demand (0.56 and 0.86).
3. Wind power is positively correlated with exports to Norway (0.30) and Sweden (0.49). This means that exports to these countries increase as the wind power rises.
4. Wind power has no correlation (-0.01) with exports to Germany during this period. The reason may be that the wind was blowing in North Germany and DK-West at the same time, or that there were special conditions for control of the connection.
The analysis shows that the four sources, Cen, Decen, Wind and Imports were not of equal value. Wind power has no correlation with demand and thus takes on a special position. The method given in Section 1 is therefore incorrect, as is the method used by the wind industry. A more correct method must be found!
3. Analysis for sources which are not of equal value.
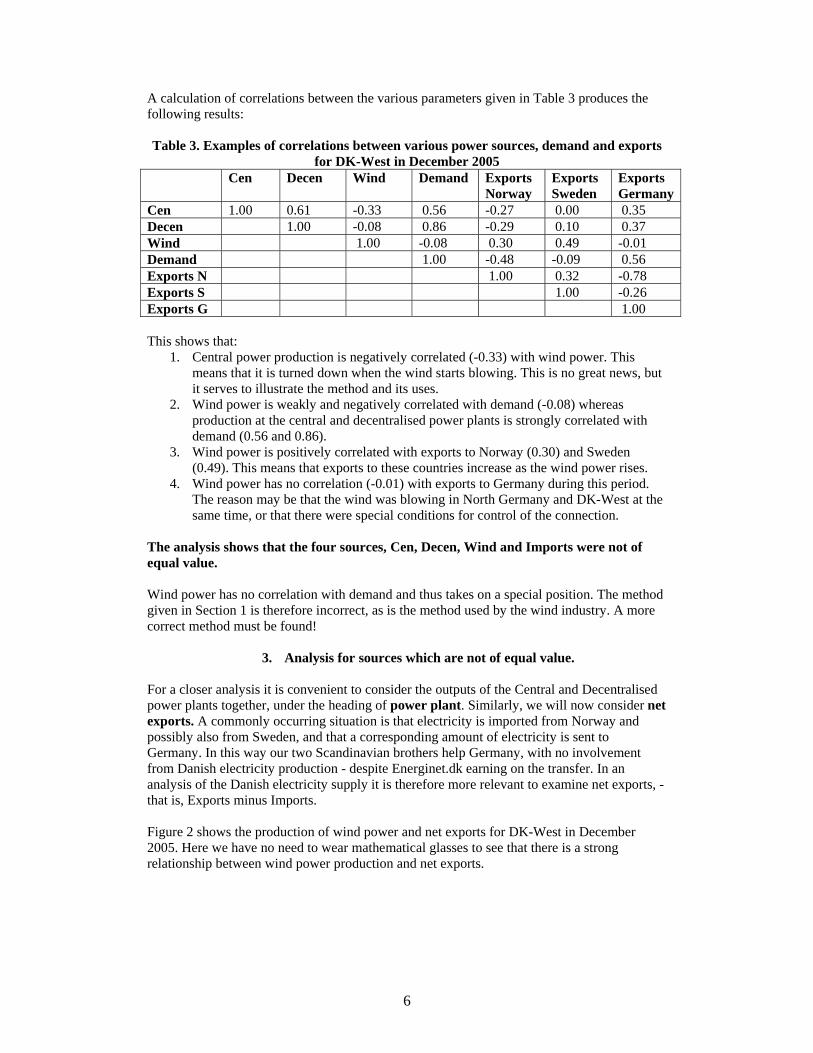
For a closer analysis it is convenient to consider the outputs of the Central and Decentralised power plants together, under the heading of power plant. Similarly, we will now consider net exports. A commonly occurring situation is that electricity is imported from Norway and possibly also from Sweden, and that a corresponding amount of electricity is sent to Germany. In this way our two Scandinavian brothers help Germany, with no involvement from Danish electricity production - despite Energinet.dk earning on the transfer. In an analysis of the Danish electricity supply it is therefore more relevant to examine net exports, - that is, Exports minus Imports. Figure 2 shows the production of wind power and net exports for DK-West in December 2005. Here we have no need to wear mathematical glasses to see that there is a strong relationship between wind power production and net exports.
7
Figure 2. Wind power production and net exports for DK-West during December 2005. Wind power production is depicted by the continuous curve and net exports by the stippled curve. (Timer = Hours)
Correlation coefficients for associated parameters are given in Table 4.Two of these stand out:
• The output of the power plants is strongly correlated with demand (0.767), • Wind power production is strongly correlated with net exports (0.769).
The latter is exactly what can be seen from Figure 2
Table 4. Examples of correlation coefficients for various parameters. DK-West, December 2005.
Power plants Wind Net exports Demand Power plants 1.000 -0.247 -0.131 0.767 Wind 1.000 0.769 -0.077 Net exports 1.000 -0.413 Demand 1.000
The conclusion is that in this case large amounts of wind power go for export.
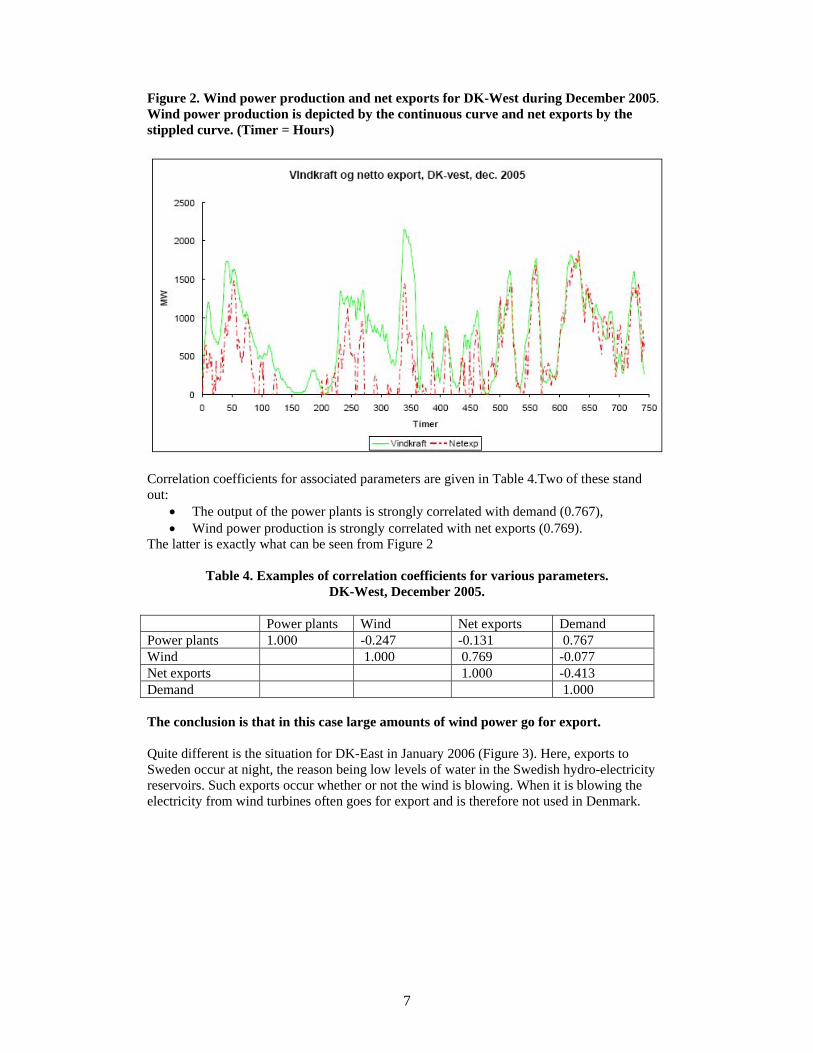
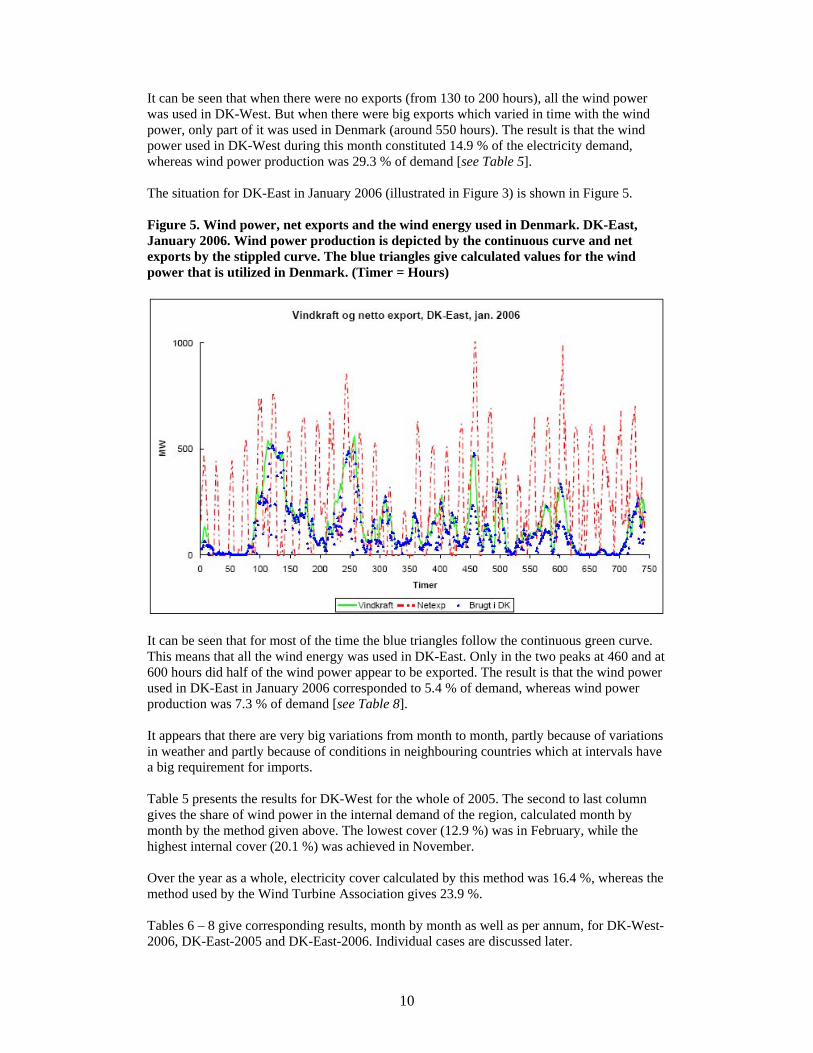
Quite different is the situation for DK-East in January 2006 (Figure 3). Here, exports to Sweden occur at night, the reason being low levels of water in the Swedish hydro-electricity reservoirs. Such exports occur whether or not the wind is blowing. When it is blowing the electricity from wind turbines often goes for export and is therefore not used in Denmark.
8
Figure 3. Production from wind turbines and net exports. DK-East, January 2006. Wind power production is depicted by the continuous curve and net exports by the stippled curve. (Timer = Hours)
Characteristic of Figures 2 and 3 are the following: Figure 2: DK-West generally exports energy only when it is blowing. It is concluded that its electricity is exported at the best price available, irrespective of how high or how low this is. Figure 3: DK-East has already reached an agreement to export at night at an appropriate price. This electricity is supplied by the power stations which therefore, in general, don’t go as far down the “night hole” as is usual. From Figure 3 it can be seen that net exports are regular, and are therefore, in principle, based on electricity from power stations fired by fuel. Exports can be increased when the wind blows, as seen around 250, 450 and 600 hours. Alternatively one can turn down the power stations and save fuel. One may discuss whether in this case the wind power replaces domestic or exported electricity. A compromise, which also takes regard to more ‘woolly’ situations (the rest of Figure 3) would be that half of the wind power is used in Denmark. To mathematically identify the peaks of the export curve which, due to windy conditions are higher than the average, the correlation coefficient is calculated on a 24-hour basis. For each hour it is calculated from data 6 hours before and 6 hours after the time in question. If this correlation coefficient is greater than 0.6, the relationship is strong. The wind power used in Denmark (Wind-DK) can be calculated according to directions given in the following scheme, irrespective of whether it is used as electricity or as saved coal.
9
Net Export
Wind minus Net Export
Corr. (Wind, Net Export)
Wind-DK = Criterion Example
>0 Wind minus Net Exports
1 DK-West-Dec-2005 (Fig. 2)
>0.6
½ x Wind
DK-East-Jan-2006, around 450 and 600 hours (Fig. 3)
>0
<0 <0.6
Wind
2
DK-East-Jan-2006, around 150 hours (Fig 3)
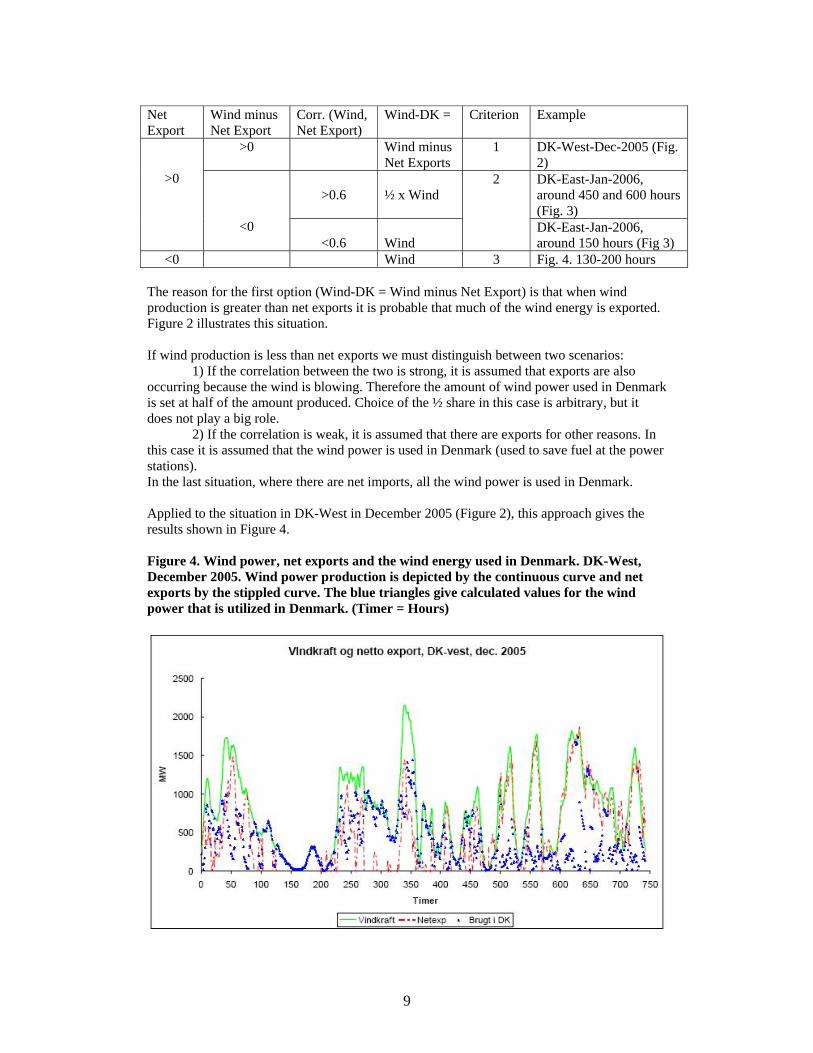
<0 Wind 3 Fig. 4. 130-200 hours The reason for the first option (Wind-DK = Wind minus Net Export) is that when wind production is greater than net exports it is probable that much of the wind energy is exported. Figure 2 illustrates this situation. If wind production is less than net exports we must distinguish between two scenarios:
1) If the correlation between the two is strong, it is assumed that exports are also occurring because the wind is blowing. Therefore the amount of wind power used in Denmark is set at half of the amount produced. Choice of the ½ share in this case is arbitrary, but it does not play a big role.
2) If the correlation is weak, it is assumed that there are exports for other reasons. In this case it is assumed that the wind power is used in Denmark (used to save fuel at the power stations). In the last situation, where there are net imports, all the wind power is used in Denmark. Applied to the situation in DK-West in December 2005 (Figure 2), this approach gives the results shown in Figure 4. Figure 4. Wind power, net exports and the wind energy used in Denmark. DK-West, December 2005. Wind power production is depicted by the continuous curve and net exports by the stippled curve. The blue triangles give calculated values for the wind power that is utilized in Denmark. (Timer = Hours)
10
It can be seen that when there were no exports (from 130 to 200 hours), all the wind power was used in DK-West. But when there were big exports which varied in time with the wind power, only part of it was used in Denmark (around 550 hours). The result is that the wind power used in DK-West during this month constituted 14.9 % of the electricity demand, whereas wind power production was 29.3 % of demand [see Table 5]. The situation for DK-East in January 2006 (illustrated in Figure 3) is shown in Figure 5. Figure 5. Wind power, net exports and the wind energy used in Denmark. DK-East, January 2006. Wind power production is depicted by the continuous curve and net exports by the stippled curve. The blue triangles give calculated values for the wind power that is utilized in Denmark. (Timer = Hours)
It can be seen that for most of the time the blue triangles follow the continuous green curve. This means that all the wind energy was used in DK-East. Only in the two peaks at 460 and at 600 hours did half of the wind power appear to be exported. The result is that the wind power used in DK-East in January 2006 corresponded to 5.4 % of demand, whereas wind power production was 7.3 % of demand [see Table 8]. It appears that there are very big variations from month to month, partly because of variations in weather and partly because of conditions in neighbouring countries which at intervals have a big requirement for imports. Table 5 presents the results for DK-West for the whole of 2005. The second to last column gives the share of wind power in the internal demand of the region, calculated month by month by the method given above. The lowest cover (12.9 %) was in February, while the highest internal cover (20.1 %) was achieved in November. Over the year as a whole, electricity cover calculated by this method was 16.4 %, whereas the method used by the Wind Turbine Association gives 23.9 %. Tables 6 – 8 give corresponding results, month by month as well as per annum, for DK-West-2006, DK-East-2005 and DK-East-2006. Individual cases are discussed later.
11
Table 5: Results for DK-West-2005. The penultimate column gives wind power’s cover of Danish electricity demand.
Table 6: Results for DK-West-2006. The penultimate column gives wind power’s cover of Danish electricity demand.
[Translation of Danish headings: Cen = Central power plants Decen = Decentralised power plants Vind = Wind Imp = Imports Forbrug = Demand Kraftværk = Power plants Vindkraft = Wind power Net exp = Net exports Vindkraft brugt i DK = Wind power used in DK. Comma = Decimal point]
12
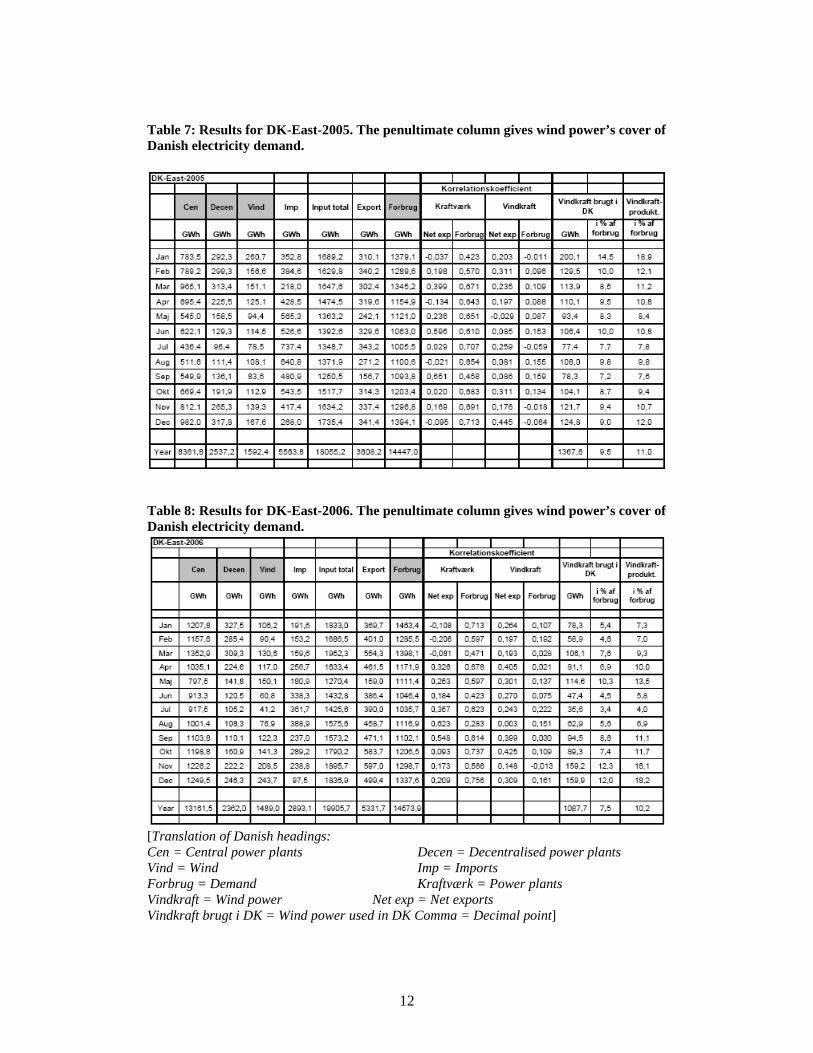
Table 7: Results for DK-East-2005. The penultimate column gives wind power’s cover of Danish electricity demand.
Table 8: Results for DK-East-2006. The penultimate column gives wind power’s cover of Danish electricity demand.
[Translation of Danish headings: Cen = Central power plants Decen = Decentralised power plants Vind = Wind Imp = Imports Forbrug = Demand Kraftværk = Power plants Vindkraft = Wind power Net exp = Net exports Vindkraft brugt i DK = Wind power used in DK Comma = Decimal point]
13
4. Nationwide results for 2005 and 2006
DK-West and DK-East will remain two independent supply systems as long as there is no inter-connector across the Great Belt. Tables 9 and 10 present the main results for these two systems and the country as a whole (all data coming from the above tables). It is evident that the widely held contention that wind power covers about 20 % of Danish electricity demand is wrong. In 2005 the cover of internal Danish demand was 13.6 %, and in 2006 it was 10.3 %.
Table 9. Main data for regions and the whole country in 2005 Year: 2005 Demand, GWh Wind power
prodn., GWh Wind power used in DK regions GWh % of demand
Wind power prodn. in % of demand.
DK West 21,009.0 5,022.6 3,438.8 16.4 23.9 DK East 14,447.0 1,592.4 1,367.6 9.5 11.0
DK 35,456.0 6,615.0 4,806.5 13.6 18.7
Table 10. Main data for regions and the whole country in 2006 Year: 2006 Demand, GWh Wind power
prodn., GWh Wind power used in DK regions GWh % of demand
Wind power prodn. in % of demand.
DK West 21,400.6 4,618.0 2,613.1 12.2 21.6 DK East 14,573.9 1,489.0 1,087.7 7.5 10.2
DK 35,974.6 6,107.0 3,700.8 10.3 17.0
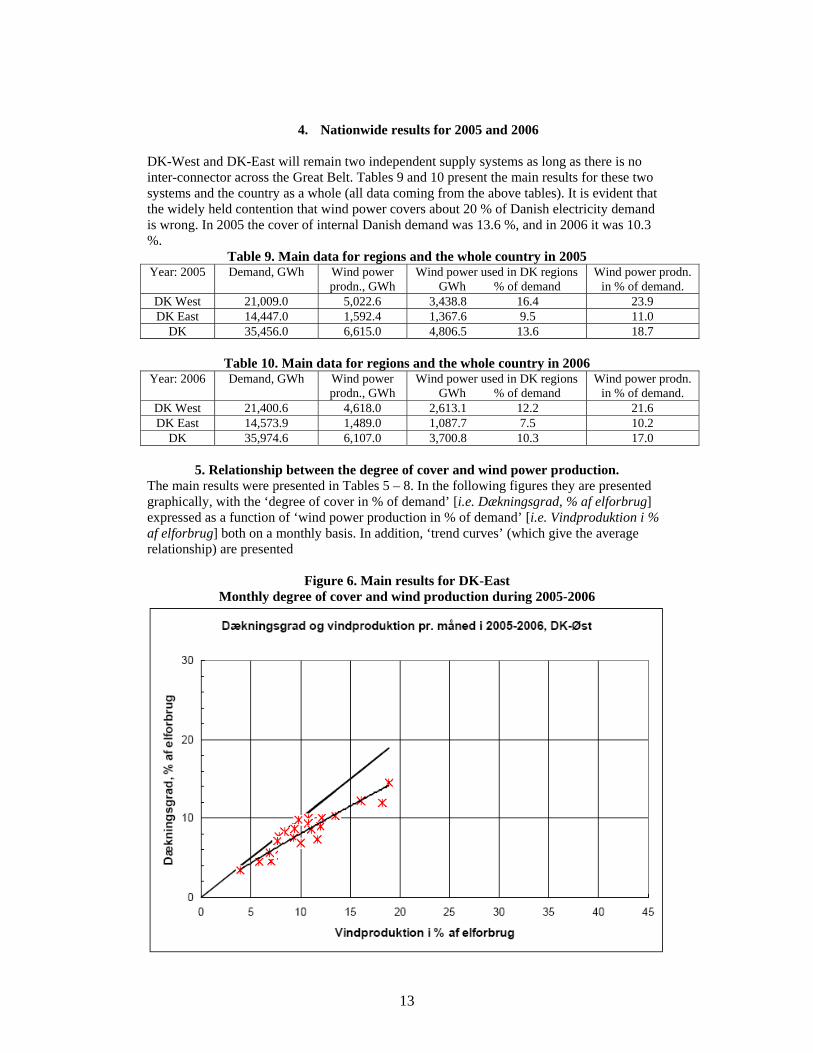
5. Relationship between the degree of cover and wind power production. The main results were presented in Tables 5 – 8. In the following figures they are presented graphically, with the ‘degree of cover in % of demand’ [i.e. Dækningsgrad, % af elforbrug] expressed as a function of ‘wind power production in % of demand’ [i.e. Vindproduktion i % af elforbrug] both on a monthly basis. In addition, ‘trend curves’ (which give the average relationship) are presented
Figure 6. Main results for DK-East
Monthly degree of cover and wind production during 2005-2006
14
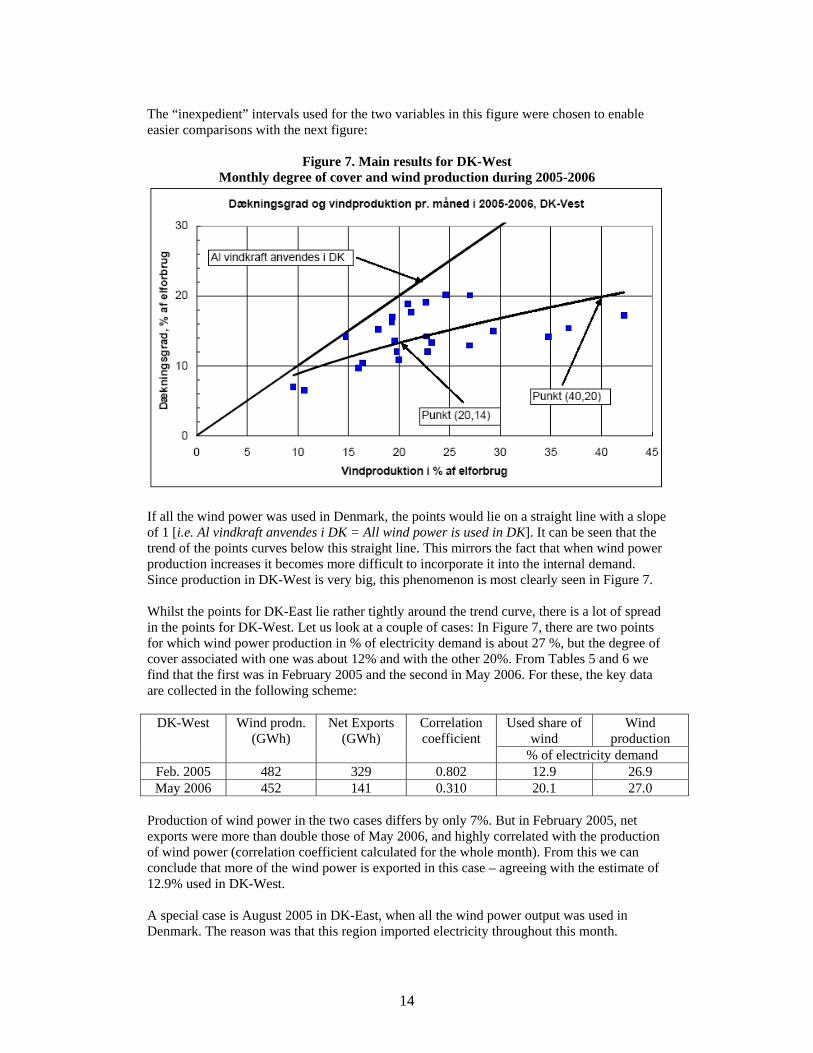
The “inexpedient” intervals used for the two variables in this figure were chosen to enable easier comparisons with the next figure:
Figure 7. Main results for DK-West Monthly degree of cover and wind production during 2005-2006
If all the wind power was used in Denmark, the points would lie on a straight line with a slope of 1 [i.e. Al vindkraft anvendes i DK = All wind power is used in DK]. It can be seen that the trend of the points curves below this straight line. This mirrors the fact that when wind power production increases it becomes more difficult to incorporate it into the internal demand. Since production in DK-West is very big, this phenomenon is most clearly seen in Figure 7. Whilst the points for DK-East lie rather tightly around the trend curve, there is a lot of spread in the points for DK-West. Let us look at a couple of cases: In Figure 7, there are two points for which wind power production in % of electricity demand is about 27 %, but the degree of cover associated with one was about 12% and with the other 20%. From Tables 5 and 6 we find that the first was in February 2005 and the second in May 2006. For these, the key data are collected in the following scheme:
Used share of wind
Wind production
DK-West Wind prodn. (GWh)
Net Exports (GWh)
Correlation coefficient
% of electricity demand Feb. 2005 482 329 0.802 12.9 26.9 May 2006 452 141 0.310 20.1 27.0
Production of wind power in the two cases differs by only 7%. But in February 2005, net exports were more than double those of May 2006, and highly correlated with the production of wind power (correlation coefficient calculated for the whole month). From this we can conclude that more of the wind power is exported in this case – agreeing with the estimate of 12.9% used in DK-West. A special case is August 2005 in DK-East, when all the wind power output was used in Denmark. The reason was that this region imported electricity throughout this month.
15
6. Different assessments of wind power cover in Denmark Different methods can be employed to assess how much of the electricity produced by wind turbines can be used in Denmark: Method 0: Wind Turbine Industry’s perception.
• All of the wind power production is used in Denmark. The electricity which is exported is produced at the remaining power plants. This is the view of the Wind Turbine Industry.
Method 1: Proportionality method.
• All sources which deliver electricity to the grid are considered as being of equal value, and a weight factor is calculated for each. The receivers of electricity (consumers in Denmark, and neighbouring countries which purchase electricity from Denmark) receive electricity from the different power sources in relation to their relevant weight factors.
Method 2: Wind power primarily for export.
• When wind power production exceeds net exports, the difference is used in Denmark. • When wind power production is less than net exports, all electricity from the wind
turbines is exported. • When Denmark is a net importer of electricity, all of the produced wind power is
used here in this country. Method 3: The wind power is shared appropriately. The first and third points of Method 2 are preserved. The second point is different:
• When net exports are greater than wind power production, the exports are assumed to be based on the requirements of neighbouring countries. Therefore, as a principle, it is assumed that the wind power displaces fuel at a power plant, and is considered as internal Danish usage – notwithstanding that the electricity is exported. Excluded from this rule are situations in which net exports and wind power production move together. This seems to show that the (extra) exports can be caused by wind power availability. In this case it is assumed that half of the wind power is used in Denmark.
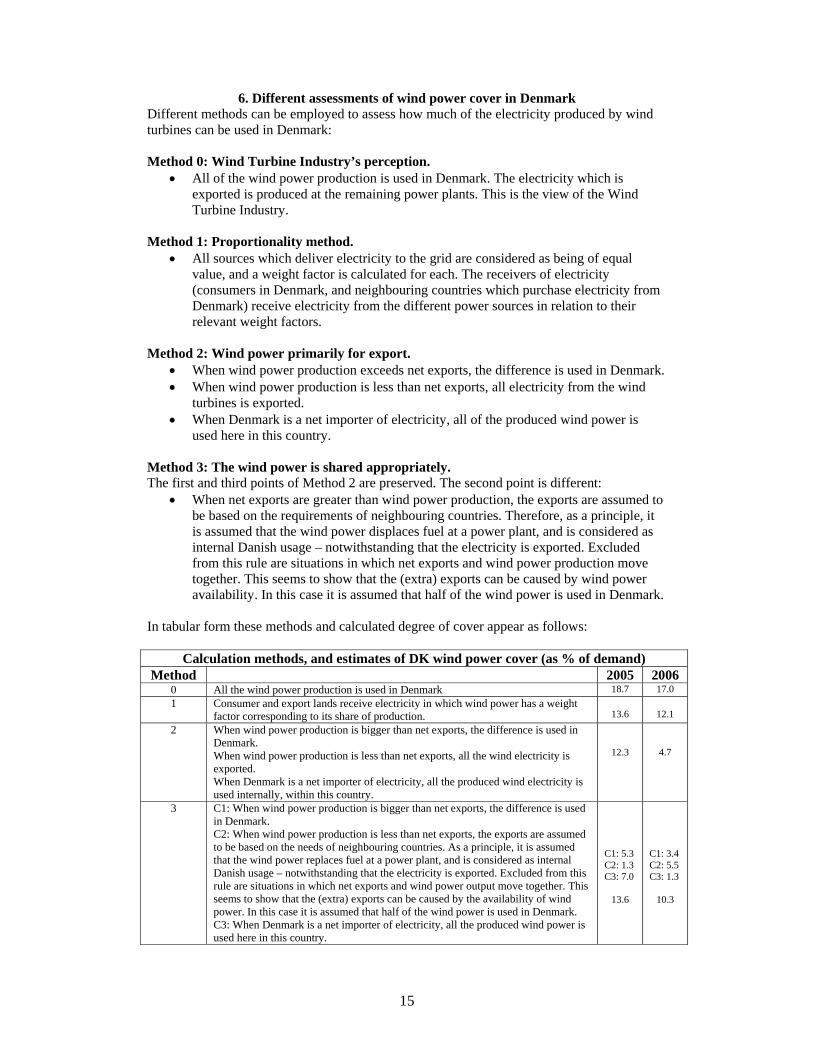
In tabular form these methods and calculated degree of cover appear as follows:
Calculation methods, and estimates of DK wind power cover (as % of demand) Method 2005 2006
0 All the wind power production is used in Denmark 18.7 17.0 1 Consumer and export lands receive electricity in which wind power has a weight
factor corresponding to its share of production.
13.6
12.1 2 When wind power production is bigger than net exports, the difference is used in
Denmark. When wind power production is less than net exports, all the wind electricity is exported. When Denmark is a net importer of electricity, all the produced wind electricity is used internally, within this country.
12.3
4.7
3 C1: When wind power production is bigger than net exports, the difference is used in Denmark. C2: When wind power production is less than net exports, the exports are assumed to be based on the needs of neighbouring countries. As a principle, it is assumed that the wind power replaces fuel at a power plant, and is considered as internal Danish usage – notwithstanding that the electricity is exported. Excluded from this rule are situations in which net exports and wind power output move together. This seems to show that the (extra) exports can be caused by the availability of wind power. In this case it is assumed that half of the wind power is used in Denmark. C3: When Denmark is a net importer of electricity, all the produced wind power is used here in this country.
C1: 5.3 C2: 1.3 C3: 7.0
13.6
C1: 3.4 C2: 5.5 C3: 1.3
10.3
16
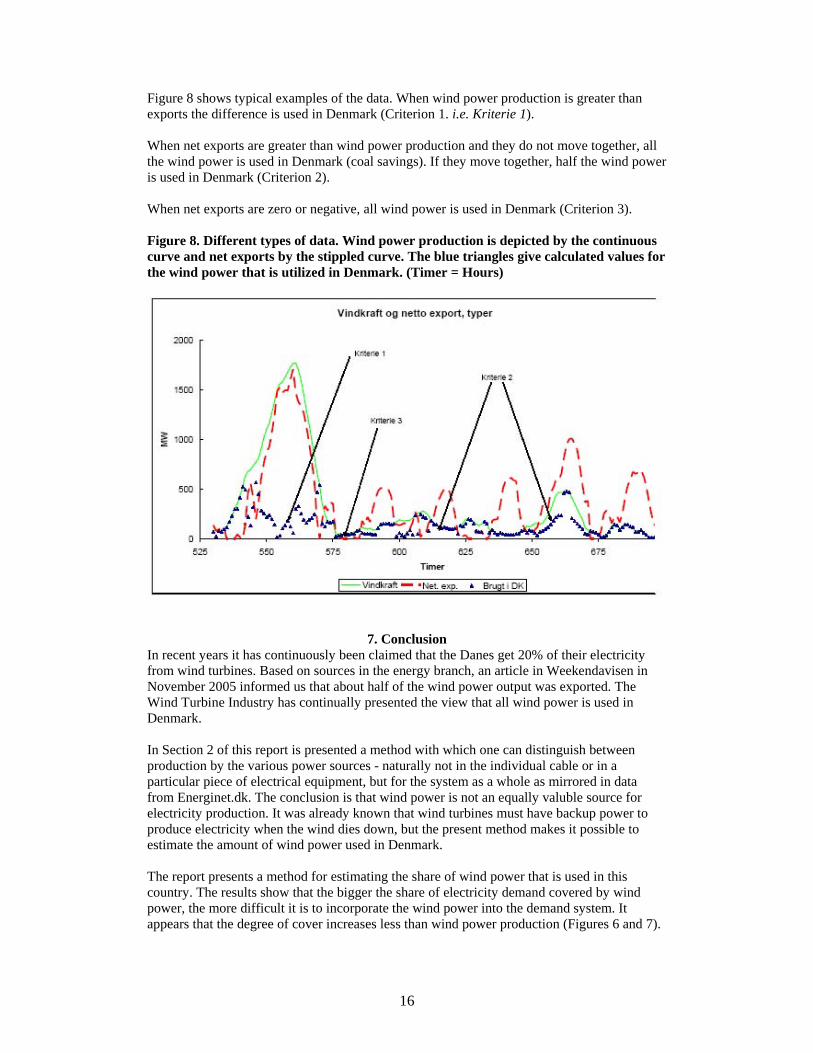
Figure 8 shows typical examples of the data. When wind power production is greater than exports the difference is used in Denmark (Criterion 1. i.e. Kriterie 1). When net exports are greater than wind power production and they do not move together, all the wind power is used in Denmark (coal savings). If they move together, half the wind power is used in Denmark (Criterion 2). When net exports are zero or negative, all wind power is used in Denmark (Criterion 3). Figure 8. Different types of data. Wind power production is depicted by the continuous curve and net exports by the stippled curve. The blue triangles give calculated values for the wind power that is utilized in Denmark. (Timer = Hours)
7. Conclusion In recent years it has continuously been claimed that the Danes get 20% of their electricity from wind turbines. Based on sources in the energy branch, an article in Weekendavisen in November 2005 informed us that about half of the wind power output was exported. The Wind Turbine Industry has continually presented the view that all wind power is used in Denmark. In Section 2 of this report is presented a method with which one can distinguish between production by the various power sources - naturally not in the individual cable or in a particular piece of electrical equipment, but for the system as a whole as mirrored in data from Energinet.dk. The conclusion is that wind power is not an equally valuble source for electricity production. It was already known that wind turbines must have backup power to produce electricity when the wind dies down, but the present method makes it possible to estimate the amount of wind power used in Denmark. The report presents a method for estimating the share of wind power that is used in this country. The results show that the bigger the share of electricity demand covered by wind power, the more difficult it is to incorporate the wind power into the demand system. It appears that the degree of cover increases less than wind power production (Figures 6 and 7).
17
Trend curves suggest that when production is doubled from 20% to 40% of demand over several years, the degree of cover will rise from 14% to, at most, 20% on average. One must keep an eye on this result when setting targets for the share of wind power in future electricity demand. For it to reach the values desired by politicians, an extensive modification of all the Danish energy supply system is necessary. Over the last 50 years, Denmark has built up an exemplary system, in which the co-production of electricity and heat (heat and power) is one of its most important corner-stones. A greater reliance on wind power will result in this system being largely phased out.
----
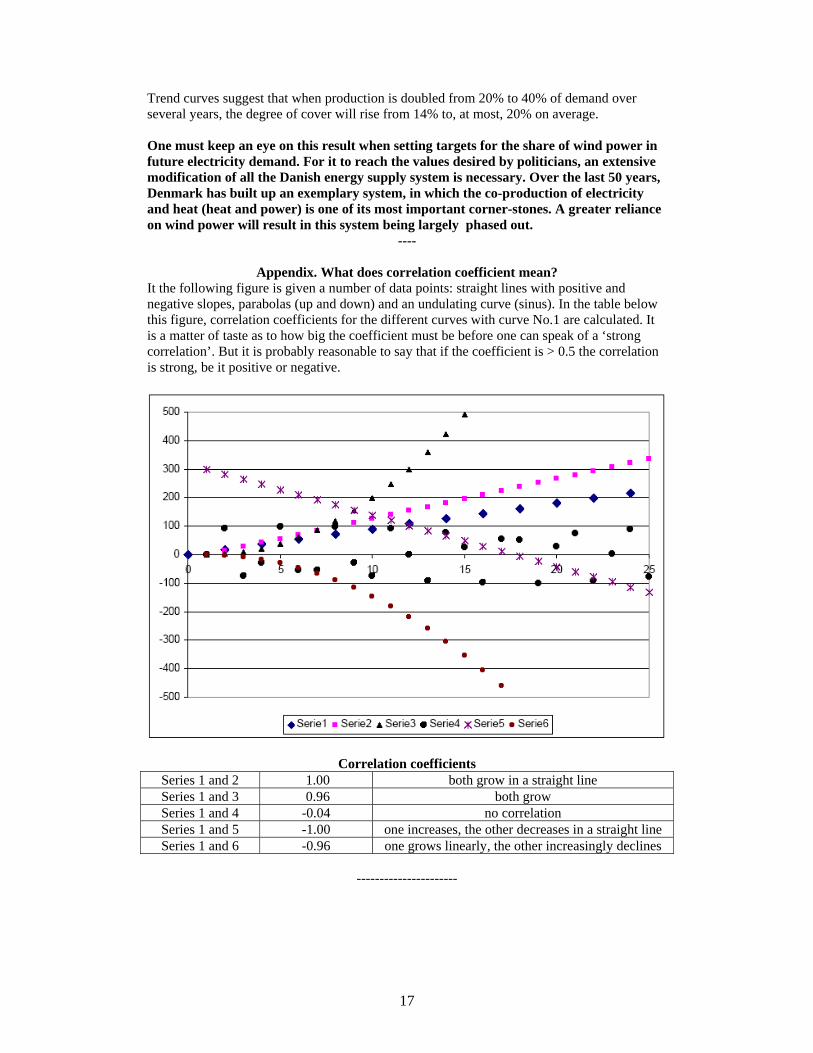
Appendix. What does correlation coefficient mean? It the following figure is given a number of data points: straight lines with positive and negative slopes, parabolas (up and down) and an undulating curve (sinus). In the table below this figure, correlation coefficients for the different curves with curve No.1 are calculated. It is a matter of taste as to how big the coefficient must be before one can speak of a ‘strong correlation’. But it is probably reasonable to say that if the coefficient is > 0.5 the correlation is strong, be it positive or negative.
Correlation coefficients Series 1 and 2 1.00 both grow in a straight line Series 1 and 3 0.96 both grow Series 1 and 4 -0.04 no correlation Series 1 and 5 -1.00 one increases, the other decreases in a straight line Series 1 and 6 -0.96 one grows linearly, the other increasingly declines
----------------------