Embed Size (px)
Citation preview

Initial Operation of the Array for Microwave Background Anisotropy (AMiBA)
Chao-Te Li*a, Chih-Chiang Hana, Ming-Tang Chena, Yau-De Huanga, Homin Jianga, Yuh-Jing Hwanga, Su-Wei Changa, Shu-Hao Changa, Pierre Martin-Cochera,
Chia-Hao Changa, Chung-Cheng Chena, Warwick Wilsonb, Keiichi Umetsua, Kai-Yang Linc, Patrick Kocha, Guo-Chin Liua, Hiroaki Nishiokaa, Paul T.P. Hoa
aInstitute of Astronomy and Astrophysics, Academia Sinica, Taipei, Taiwan 106
bAustralia Telescope National Facility, Epping, NSW Australia 1710 cInstitute of Physics, National Taiwan University, Taipei, Taiwan 106
ABSTRACT
AMiBA1, as a dual-polarization 86-102 GHz interferometer array, is designed to measure the power spectrum of fluctuations in the cosmic microwave background (CMB) radiation, and to detect the high-redshift clusters of galaxies via the Sunyaev-Zel'dovich Effect (SZE). The operation of AMiBA is about to begin after installation of the first two receivers and correlators onto the 6-meter diameter platform by the end of 2005. The initial setup of the array will consist of 7 antennas with 60 cm diameter reflectors in a hexagonal configuration, aiming at multipoles l ~ 3000. Signals from receivers are cross-correlated in analog lag correlators. The initial operation will focus on characterizing the systematics by observing various known objects on the sky. The expansion to 13 elements with larger dishes will commence once the 7-element array testing is completed.
Keywords: AMiBA, interferometry, CMB, SZE
1. SCIENCE GOALS AND ARRAY CONFIGURATION In the initial phase, AMiBA is composed of seven of 60 cm antennas, and aims to measure the CMB temperature anisotropies at smaller angular scales, l=2000-6000, where the secondary anisotropy such as the diffuse thermal SZE2 starts to dominate. Despite extensive efforts by various groups, small scale CMB anisotropies at l > 2000 are yet poorly constrained by observations (e.g., CBI, ACBAR). AMiBA will increase the sensitivity and survey efficiency by replacing the 60cm dishes with the larger 120cm dishes, while keeping the same receiver configuration. The second goal of AMiBA is to survey for high-redshift galaxy clusters through the SZ effect and study the evolution of cluster number density as a function of redshift. The result would give a tight constraint on the large scale structure normalization or cluster abundance parameter σ8
3. Probing to redshift as high as z~1 can give a useful constraint on the cosmological parameter Ωm. Combined with independent information obtained from the X-ray cluster number count observation, the constraint on σ8 and Ωm can be even stronger. A blind survey of high redshift galaxy clusters using 7-element AMiBA is not very efficient. As a result, a cluster survey will be the primary goal of 13-element AMiBA to be operational in 2007. On the other hand, bright and well known clusters are easier to detect than the CMB. In the initial operation, a few bright clusters such as A2142 or RXJ1347-1145 are being considered as first targets to diagnose the systematics. *[email protected]
Millimeter and Submillimeter Detectors and Instrumentation for Astronomy III, edited by Jonas Zmuidzinas, Wayne S. Holland, Stafford Withington, William D. Duncan,
Proc. of SPIE Vol. 6275, 62751I, (2006) · 0277-786X/06/$15 · doi: 10.1117/12.672622
Proc. of SPIE Vol. 6275 62751I-1
AMiBA dish configuration: NthSh=
3OO-
2OO 7 •m100
00 x oxooo
'\\\xx 1
i \NNx1/—300 —200 —100 0 100 200 300
x/cm
AMIBA instantaneous uv—coverage
5000
—5000 02nu
5000
• I II I•
—5000
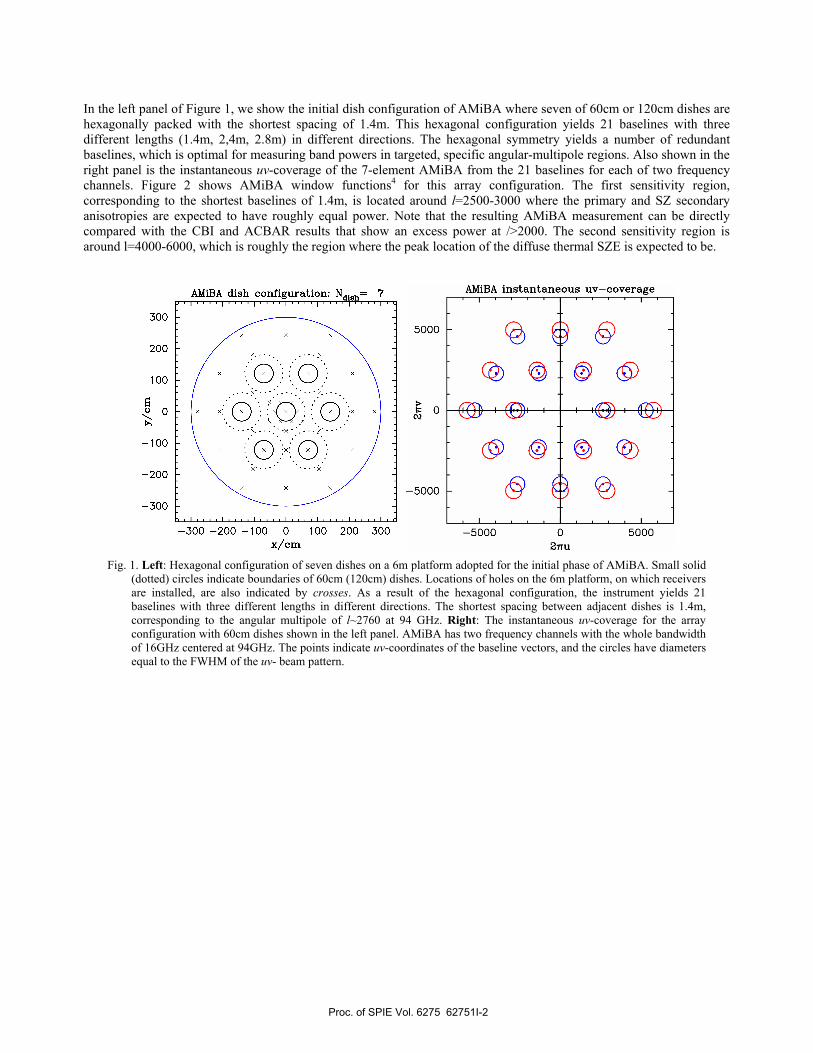
In the left panel of Figure 1, we show the initial dish configuration of AMiBA where seven of 60cm or 120cm dishes are hexagonally packed with the shortest spacing of 1.4m. This hexagonal configuration yields 21 baselines with three different lengths (1.4m, 2,4m, 2.8m) in different directions. The hexagonal symmetry yields a number of redundant baselines, which is optimal for measuring band powers in targeted, specific angular-multipole regions. Also shown in the right panel is the instantaneous uv-coverage of the 7-element AMiBA from the 21 baselines for each of two frequency channels. Figure 2 shows AMiBA window functions4 for this array configuration. The first sensitivity region, corresponding to the shortest baselines of 1.4m, is located around l=2500-3000 where the primary and SZ secondary anisotropies are expected to have roughly equal power. Note that the resulting AMiBA measurement can be directly compared with the CBI and ACBAR results that show an excess power at />2000. The second sensitivity region is around l=4000-6000, which is roughly the region where the peak location of the diffuse thermal SZE is expected to be.
Fig. 1. Left: Hexagonal configuration of seven dishes on a 6m platform adopted for the initial phase of AMiBA. Small solid
(dotted) circles indicate boundaries of 60cm (120cm) dishes. Locations of holes on the 6m platform, on which receivers are installed, are also indicated by crosses. As a result of the hexagonal configuration, the instrument yields 21 baselines with three different lengths in different directions. The shortest spacing between adjacent dishes is 1.4m, corresponding to the angular multipole of l~2760 at 94 GHz. Right: The instantaneous uv-coverage for the array configuration with 60cm dishes shown in the left panel. AMiBA has two frequency channels with the whole bandwidth of 16GHz centered at 94GHz. The points indicate uv-coordinates of the baseline vectors, and the circles have diameters equal to the FWHM of the uv- beam pattern.
Proc. of SPIE Vol. 6275 62751I-2
•1
0.6
0.4 //\\ //X\
p
uW(u
)
Il!!1000 2000 3000 4000 5000
1=2icu
6000 7000 8000
0.2
00
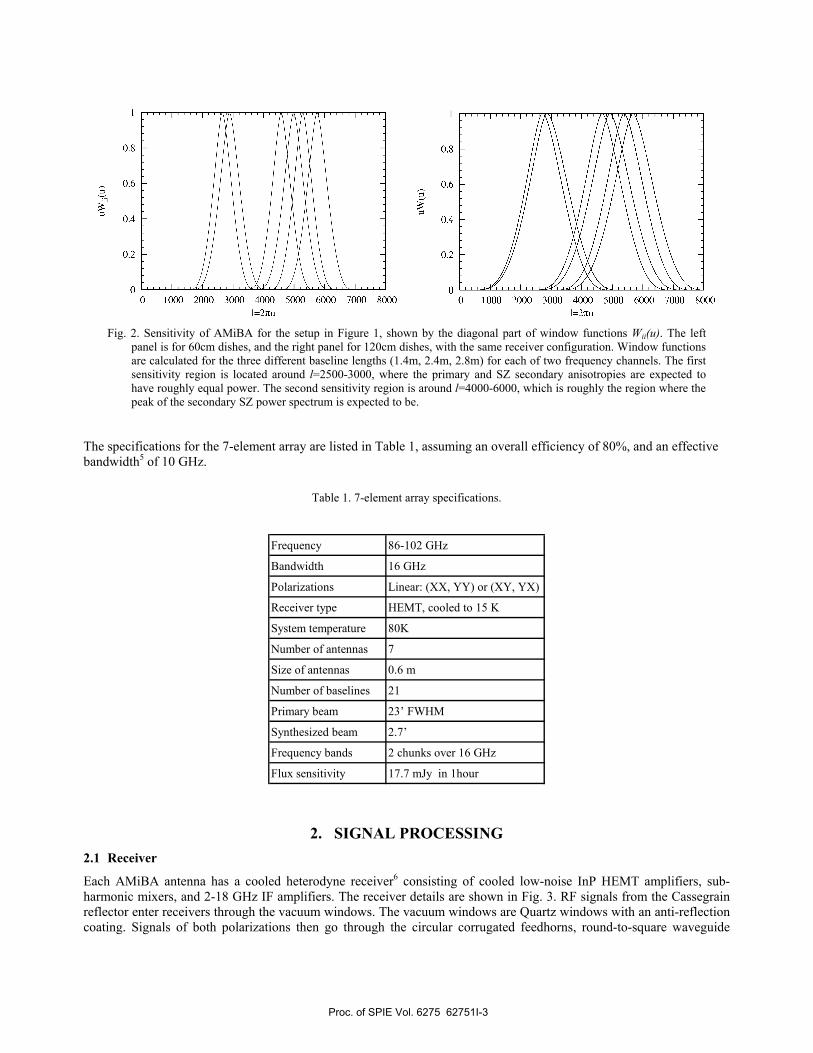
Fig. 2. Sensitivity of AMiBA for the setup in Figure 1, shown by the diagonal part of window functions Wii(u). The left
panel is for 60cm dishes, and the right panel for 120cm dishes, with the same receiver configuration. Window functions are calculated for the three different baseline lengths (1.4m, 2.4m, 2.8m) for each of two frequency channels. The first sensitivity region is located around l=2500-3000, where the primary and SZ secondary anisotropies are expected to have roughly equal power. The second sensitivity region is around l=4000-6000, which is roughly the region where the peak of the secondary SZ power spectrum is expected to be.
The specifications for the 7-element array are listed in Table 1, assuming an overall efficiency of 80%, and an effective bandwidth5 of 10 GHz.
Table 1. 7-element array specifications.
Frequency 86-102 GHz
Bandwidth 16 GHz
Polarizations Linear: (XX, YY) or (XY, YX)
Receiver type HEMT, cooled to 15 K
System temperature 80K
Number of antennas 7
Size of antennas 0.6 m
Number of baselines 21
Primary beam 23’ FWHM
Synthesized beam 2.7’
Frequency bands 2 chunks over 16 GHz
Flux sensitivity 17.7 mJy in 1hour
2. SIGNAL PROCESSING 2.1 Receiver
Each AMiBA antenna has a cooled heterodyne receiver6 consisting of cooled low-noise InP HEMT amplifiers, sub-harmonic mixers, and 2-18 GHz IF amplifiers. The receiver details are shown in Fig. 3. RF signals from the Cassegrain reflector enter receivers through the vacuum windows. The vacuum windows are Quartz windows with an anti-reflection coating. Signals of both polarizations then go through the circular corrugated feedhorns, round-to-square waveguide
Proc. of SPIE Vol. 6275 62751I-3
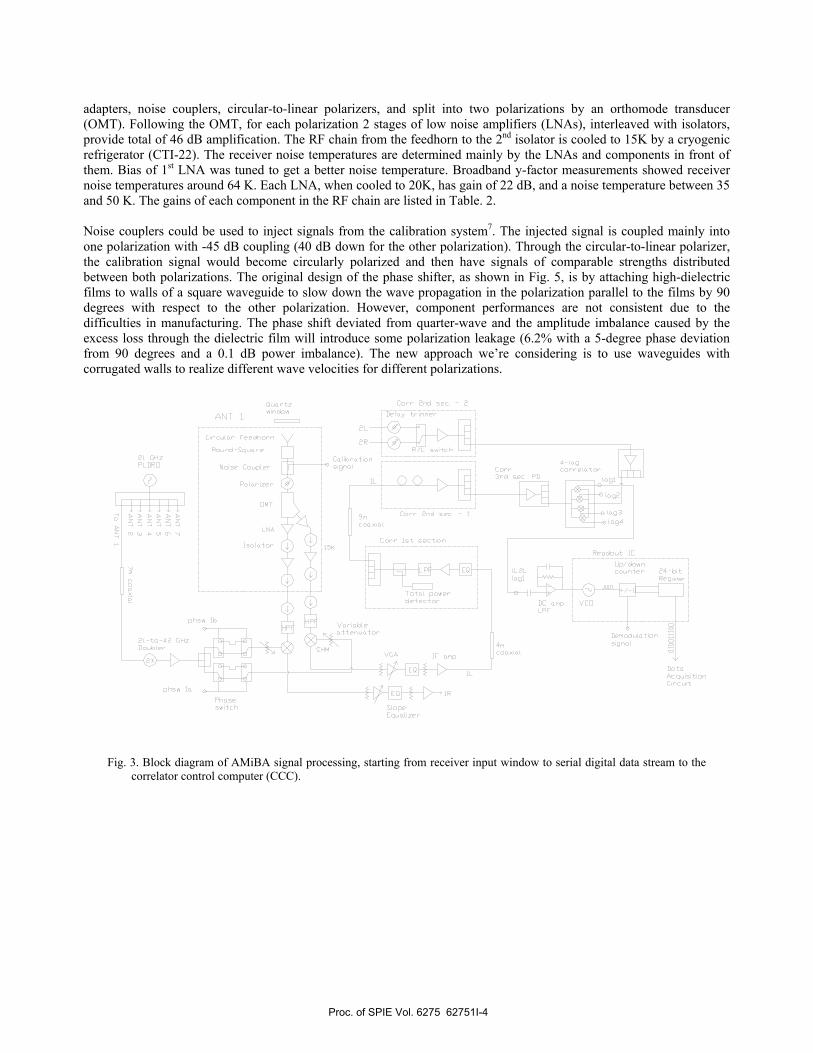
adapters, noise couplers, circular-to-linear polarizers, and split into two polarizations by an orthomode transducer (OMT). Following the OMT, for each polarization 2 stages of low noise amplifiers (LNAs), interleaved with isolators, provide total of 46 dB amplification. The RF chain from the feedhorn to the 2nd isolator is cooled to 15K by a cryogenic refrigerator (CTI-22). The receiver noise temperatures are determined mainly by the LNAs and components in front of them. Bias of 1st LNA was tuned to get a better noise temperature. Broadband y-factor measurements showed receiver noise temperatures around 64 K. Each LNA, when cooled to 20K, has gain of 22 dB, and a noise temperature between 35 and 50 K. The gains of each component in the RF chain are listed in Table. 2. Noise couplers could be used to inject signals from the calibration system7. The injected signal is coupled mainly into one polarization with -45 dB coupling (40 dB down for the other polarization). Through the circular-to-linear polarizer, the calibration signal would become circularly polarized and then have signals of comparable strengths distributed between both polarizations. The original design of the phase shifter, as shown in Fig. 5, is by attaching high-dielectric films to walls of a square waveguide to slow down the wave propagation in the polarization parallel to the films by 90 degrees with respect to the other polarization. However, component performances are not consistent due to the difficulties in manufacturing. The phase shift deviated from quarter-wave and the amplitude imbalance caused by the excess loss through the dielectric film will introduce some polarization leakage (6.2% with a 5-degree phase deviation from 90 degrees and a 0.1 dB power imbalance). The new approach we’re considering is to use waveguides with corrugated walls to realize different wave velocities for different polarizations.
Fig. 3. Block diagram of AMiBA signal processing, starting from receiver input window to serial digital data stream to the
correlator control computer (CCC).
Proc. of SPIE Vol. 6275 62751I-4
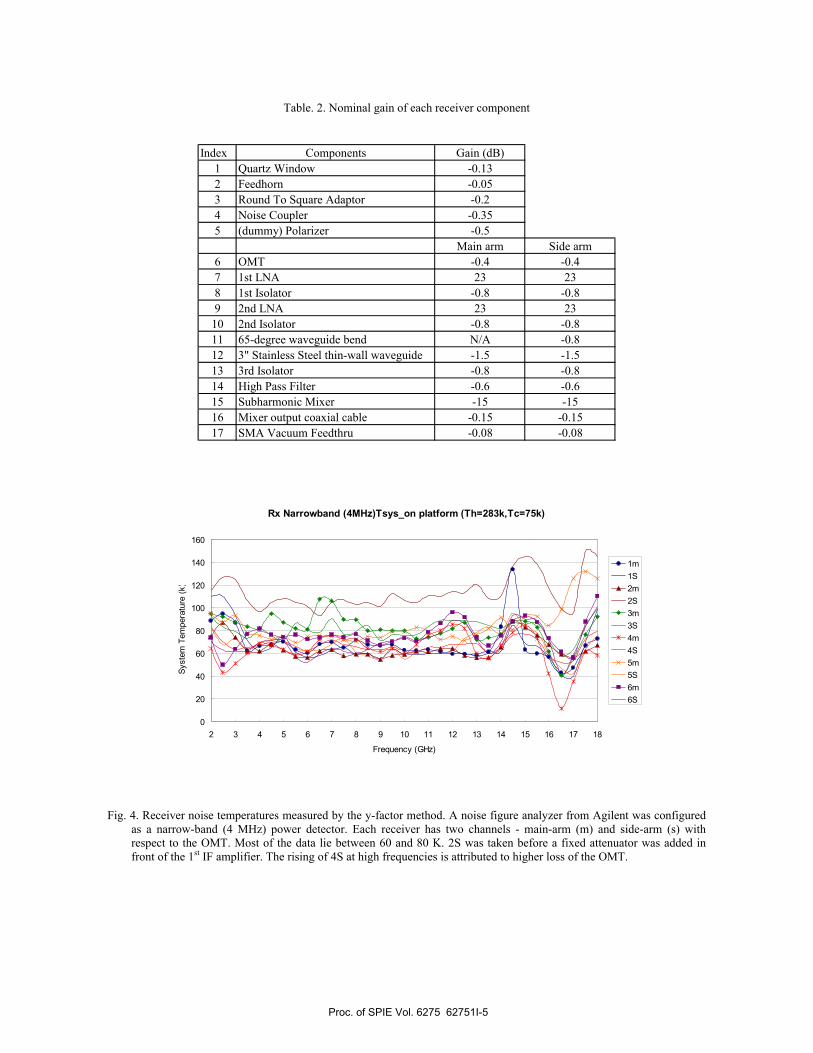
Table. 2. Nominal gain of each receiver component
Index Components Gain (dB)1 Quartz Window -0.132 Feedhorn -0.053 Round To Square Adaptor -0.24 Noise Coupler -0.355 (dummy) Polarizer -0.5
Main arm Side arm6 OMT -0.4 -0.47 1st LNA 23 238 1st Isolator -0.8 -0.89 2nd LNA 23 23
10 2nd Isolator -0.8 -0.811 65-degree waveguide bend N/A -0.812 3" Stainless Steel thin-wall waveguide -1.5 -1.513 3rd Isolator -0.8 -0.814 High Pass Filter -0.6 -0.615 Subharmonic Mixer -15 -1516 Mixer output coaxial cable -0.15 -0.1517 SMA Vacuum Feedthru -0.08 -0.08
Rx Narrowband (4MHz)Tsys_on platform (Th=283k,Tc=75k)
0
20
40
60
80
100
120
140
160
2 3 4 5 6 7 8 9 10 11 12 13 14 15 16 17 18
Frequency (GHz)
Syst
em T
empe
ratu
re (k
)
1m1S2m2S3m3S4m4S5m5S6m6S
Fig. 4. Receiver noise temperatures measured by the y-factor method. A noise figure analyzer from Agilent was configured
as a narrow-band (4 MHz) power detector. Each receiver has two channels - main-arm (m) and side-arm (s) with respect to the OMT. Most of the data lie between 60 and 80 K. 2S was taken before a fixed attenuator was added in front of the 1st IF amplifier. The rising of 4S at high frequencies is attributed to higher loss of the OMT.
Proc. of SPIE Vol. 6275 62751I-5
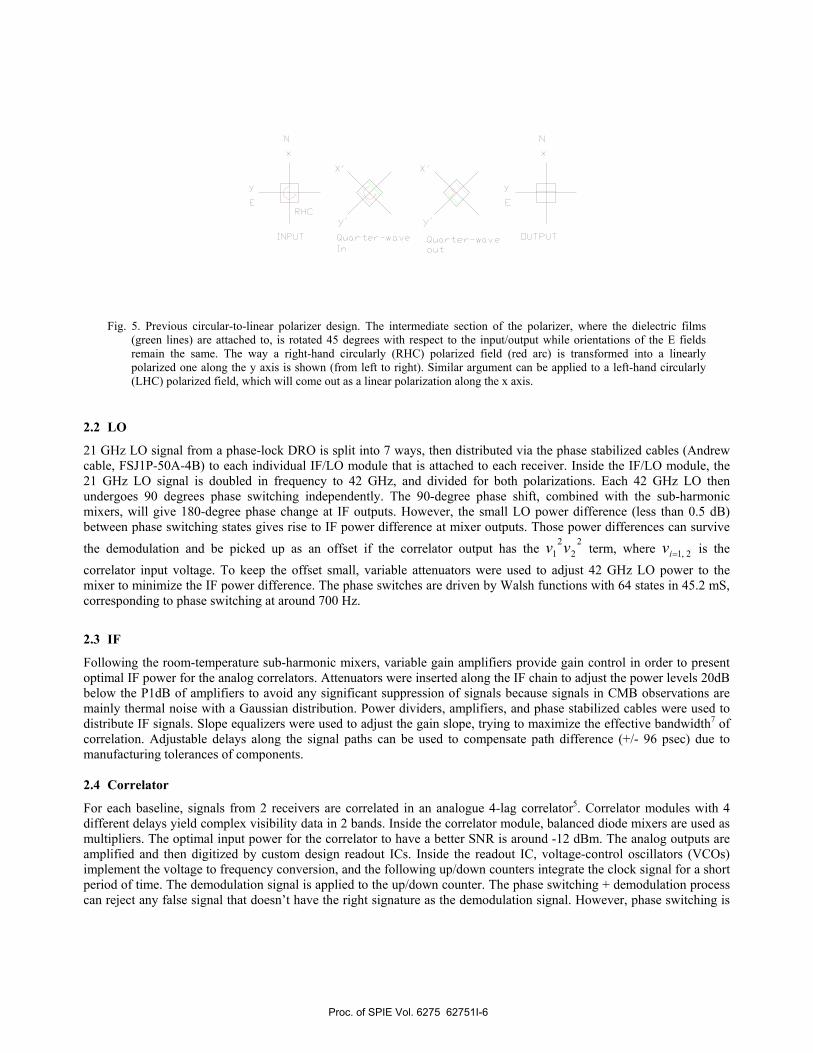
Fig. 5. Previous circular-to-linear polarizer design. The intermediate section of the polarizer, where the dielectric films
(green lines) are attached to, is rotated 45 degrees with respect to the input/output while orientations of the E fields remain the same. The way a right-hand circularly (RHC) polarized field (red arc) is transformed into a linearly polarized one along the y axis is shown (from left to right). Similar argument can be applied to a left-hand circularly (LHC) polarized field, which will come out as a linear polarization along the x axis.
2.2 LO
21 GHz LO signal from a phase-lock DRO is split into 7 ways, then distributed via the phase stabilized cables (Andrew cable, FSJ1P-50A-4B) to each individual IF/LO module that is attached to each receiver. Inside the IF/LO module, the 21 GHz LO signal is doubled in frequency to 42 GHz, and divided for both polarizations. Each 42 GHz LO then undergoes 90 degrees phase switching independently. The 90-degree phase shift, combined with the sub-harmonic mixers, will give 180-degree phase change at IF outputs. However, the small LO power difference (less than 0.5 dB) between phase switching states gives rise to IF power difference at mixer outputs. Those power differences can survive the demodulation and be picked up as an offset if the correlator output has the 2
22
1 vv term, where 2,1=iv is the correlator input voltage. To keep the offset small, variable attenuators were used to adjust 42 GHz LO power to the mixer to minimize the IF power difference. The phase switches are driven by Walsh functions with 64 states in 45.2 mS, corresponding to phase switching at around 700 Hz.
2.3 IF
Following the room-temperature sub-harmonic mixers, variable gain amplifiers provide gain control in order to present optimal IF power for the analog correlators. Attenuators were inserted along the IF chain to adjust the power levels 20dB below the P1dB of amplifiers to avoid any significant suppression of signals because signals in CMB observations are mainly thermal noise with a Gaussian distribution. Power dividers, amplifiers, and phase stabilized cables were used to distribute IF signals. Slope equalizers were used to adjust the gain slope, trying to maximize the effective bandwidth7 of correlation. Adjustable delays along the signal paths can be used to compensate path difference (+/- 96 psec) due to manufacturing tolerances of components. 2.4 Correlator
For each baseline, signals from 2 receivers are correlated in an analogue 4-lag correlator5. Correlator modules with 4 different delays yield complex visibility data in 2 bands. Inside the correlator module, balanced diode mixers are used as multipliers. The optimal input power for the correlator to have a better SNR is around -12 dBm. The analog outputs are amplified and then digitized by custom design readout ICs. Inside the readout IC, voltage-control oscillators (VCOs) implement the voltage to frequency conversion, and the following up/down counters integrate the clock signal for a short period of time. The demodulation signal is applied to the up/down counter. The phase switching + demodulation process can reject any false signal that doesn’t have the right signature as the demodulation signal. However, phase switching is
Proc. of SPIE Vol. 6275 62751I-6
not able to remove the gain fluctuation occurred along the signal path if they’re superposed onto the phase switching functions.
Because of the wide bandwidth (IF 2-18 GHz) and non monotonic responses of microwave components, it is necessary to calibrate the passband properties for each baseline. This information is also essential for lag-to-visibility transformation. The current approach is to set up a W-band noise source to radiate correlated signals into 2 receivers while the dishes are removed and some metallic plates are used as reflectors. The relative delay is changing as the noise source is translating on the platform along each baseline. In the later operation, the passband properties can be retrieved using the calibration system.
3. LAG TO VISIBILITY TRANSFORMATION The lag correlators measure cross correlation of the electric fields received by a pair of antennas as a function of delay τ. At each time step the correlator outputs are combined to form the complex visibility that is the Fourier transform of the sky brightness distribution multiplied by the antenna primary beam pattern.
For the AMiBA 4-lag correlator, the lag-to-visibility transformation is not a trivial issue because of a small number of lags, Nlag=4, and a wide bandwidth of 16 GHz. Specifically, the problems are the following: non-flat amplitude response over the wide passband, non-even lag spacing between each channel, and non-linear phase response at higher frequencies. A theoretical formulation of the lag-to-visibility transformation has been developed in the framework of a linear inversion problem as Equation (1), where iR and iI are the real and imaginary parts of the complex visibility of band i ,
respectively, jv is the voltage output of lag j , and ),,( φτgK is the transformation matrix which takes into account the gain, delay and phase errors of each channel. The transformation matrix can be obtained through analyzing the fringes generated with a translating noise source or from the calibration system.
⎥⎥⎥⎥
⎦
⎤
⎢⎢⎢⎢
⎣
⎡
=
⎥⎥⎥⎥
⎦
⎤
⎢⎢⎢⎢
⎣
⎡
−
4
3
2
1
1
2
2
1
1
),,(
vvvv
gK
IRIR
φτ (1)
We have tested the analysis pipelines by reconstructing the complex visibilities and the 1-D image as a point source is moving across the phase center. The results shown in Figures 6 and 7 indicate that with a proper weighting scheme and passband information, the phase and the flux of a point source can be correctly recovered even with a small number of lags. This is important in the sense that the point spread function of the system is well constructed. We have also tested our pipelines using simulation data with a function with non-flat amplitude response and non-linear phase. Comparing with a ‘perfect correlator’ (one with many lags and flat frequency response), we verified that our pipelines are working correctly, as shown in Fig. 8. Several issues need to be studied based on the simulation:
Nonlinear phase response function Instrument noise (e.g., white noise, 1/f noise) 2-D extended sources Realistic cosmic signals (primary CMB, SZ sources, point sources) Realistic observing strategies (scan strategies, etc.)
Proc. of SPIE Vol. 6275 62751I-7
t=-l8sec t=-9sec
-2 -2-10 -5 0 5 10 -10 -5 0 5 10
t=Osec t=9sec4 4
2 2
0 0
-2 -2-10 -5 0 5 10 -10 -5 0 5 10
t=l8sec t=27sec
10 -5 0 5 10 -Offset wrt pointing (arcmin) Offset wrt pointing (arcmin)
t=-l8sec t=-9sec
-2 -2-10 -5 0 5 10 -10 -5 0 5 10
t=Osec t=9sec4 4
2 2
0 0
-2 -2-10 -5 0 5 10 -10 -5 0 5 10
t=l8sec t=27sec
10 -5 0 5 10 -Offset wrt pointing (arcmin) Offset wrt pointing (arcmin)
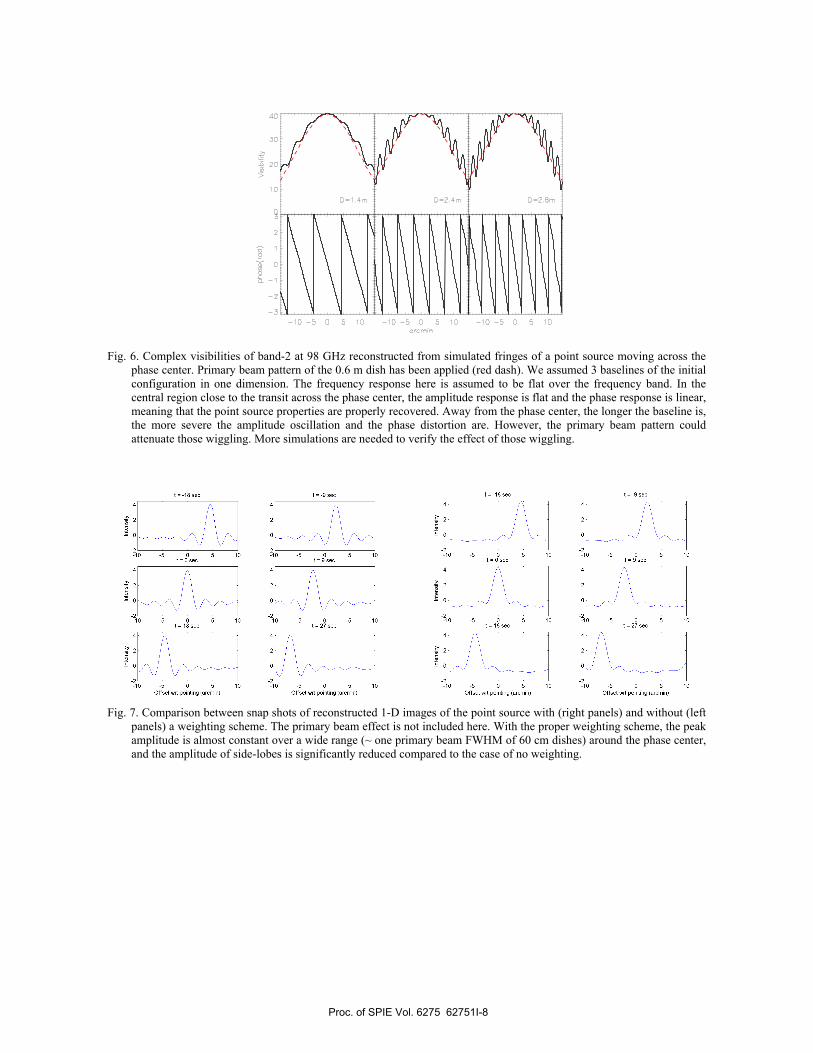
Fig. 6. Complex visibilities of band-2 at 98 GHz reconstructed from simulated fringes of a point source moving across the
phase center. Primary beam pattern of the 0.6 m dish has been applied (red dash). We assumed 3 baselines of the initial configuration in one dimension. The frequency response here is assumed to be flat over the frequency band. In the central region close to the transit across the phase center, the amplitude response is flat and the phase response is linear, meaning that the point source properties are properly recovered. Away from the phase center, the longer the baseline is, the more severe the amplitude oscillation and the phase distortion are. However, the primary beam pattern could attenuate those wiggling. More simulations are needed to verify the effect of those wiggling.
Fig. 7. Comparison between snap shots of reconstructed 1-D images of the point source with (right panels) and without (left
panels) a weighting scheme. The primary beam effect is not included here. With the proper weighting scheme, the peak amplitude is almost constant over a wide range (~ one primary beam FWHM of 60 cm dishes) around the phase center, and the amplitude of side-lobes is significantly reduced compared to the case of no weighting.
Proc. of SPIE Vol. 6275 62751I-8
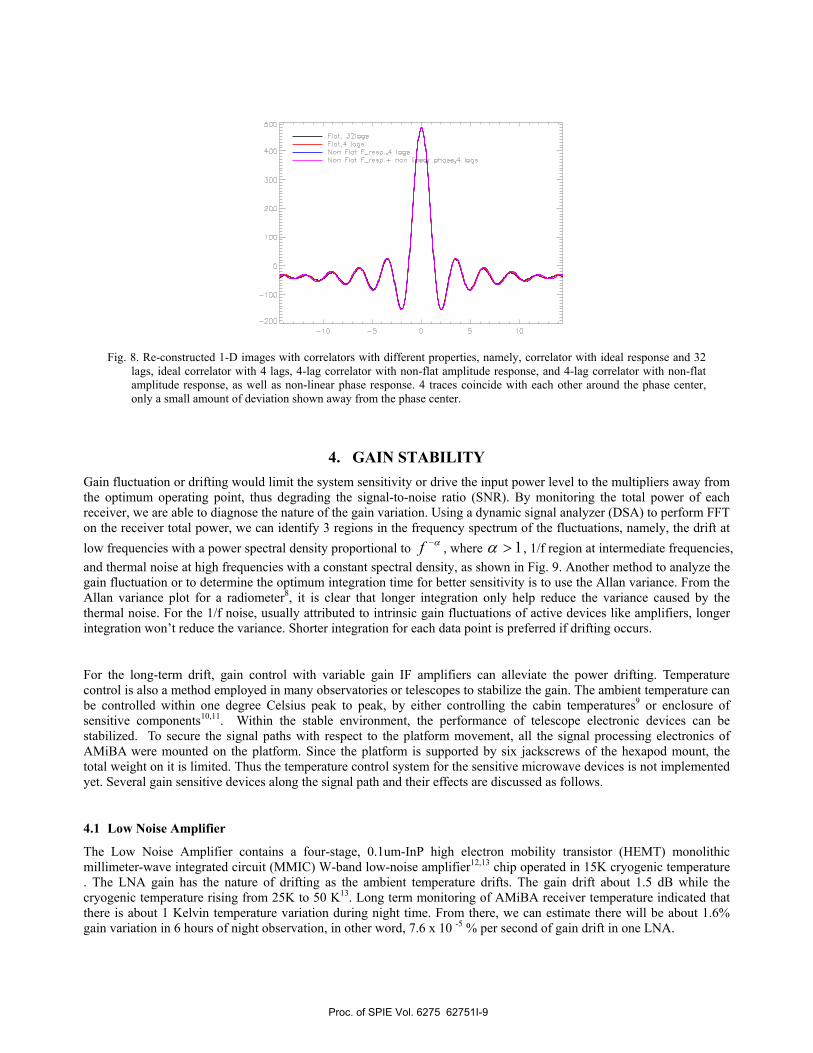
Fig. 8. Re-constructed 1-D images with correlators with different properties, namely, correlator with ideal response and 32
lags, ideal correlator with 4 lags, 4-lag correlator with non-flat amplitude response, and 4-lag correlator with non-flat amplitude response, as well as non-linear phase response. 4 traces coincide with each other around the phase center, only a small amount of deviation shown away from the phase center.
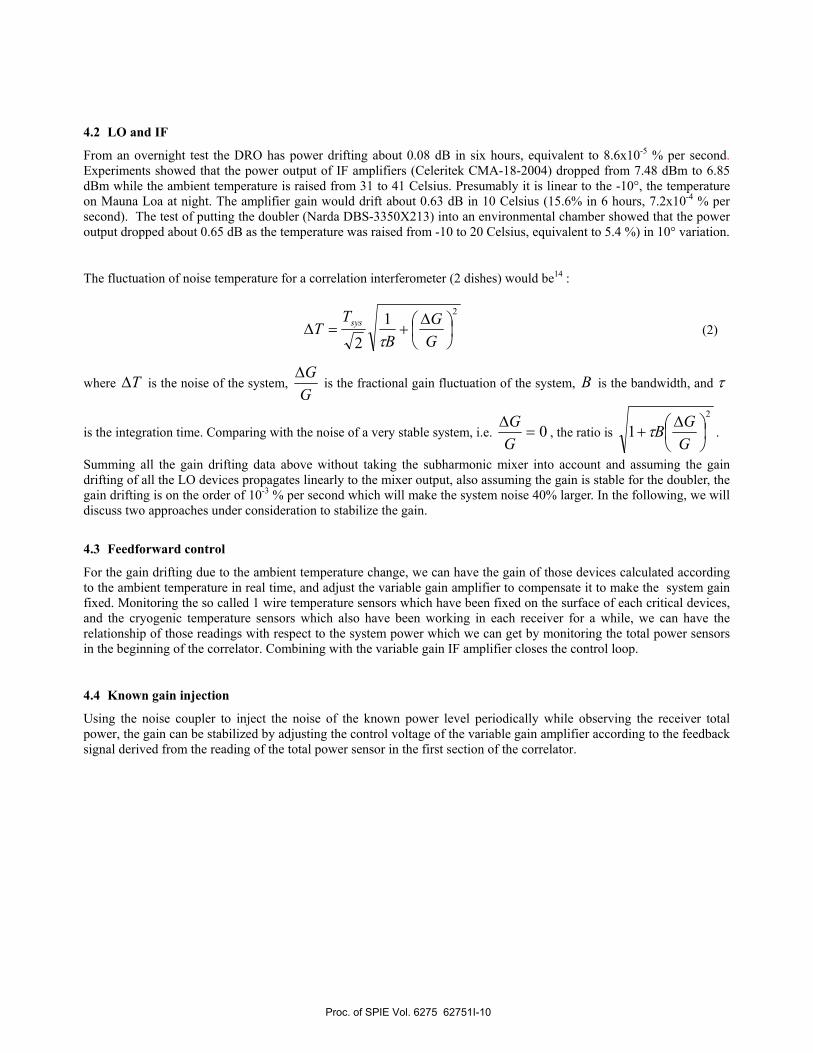
4. GAIN STABILITY Gain fluctuation or drifting would limit the system sensitivity or drive the input power level to the multipliers away from the optimum operating point, thus degrading the signal-to-noise ratio (SNR). By monitoring the total power of each receiver, we are able to diagnose the nature of the gain variation. Using a dynamic signal analyzer (DSA) to perform FFT on the receiver total power, we can identify 3 regions in the frequency spectrum of the fluctuations, namely, the drift at low frequencies with a power spectral density proportional to α−f , where 1>α , 1/f region at intermediate frequencies, and thermal noise at high frequencies with a constant spectral density, as shown in Fig. 9. Another method to analyze the gain fluctuation or to determine the optimum integration time for better sensitivity is to use the Allan variance. From the Allan variance plot for a radiometer8, it is clear that longer integration only help reduce the variance caused by the thermal noise. For the 1/f noise, usually attributed to intrinsic gain fluctuations of active devices like amplifiers, longer integration won’t reduce the variance. Shorter integration for each data point is preferred if drifting occurs.
For the long-term drift, gain control with variable gain IF amplifiers can alleviate the power drifting. Temperature control is also a method employed in many observatories or telescopes to stabilize the gain. The ambient temperature can be controlled within one degree Celsius peak to peak, by either controlling the cabin temperatures9 or enclosure of sensitive components10,11. Within the stable environment, the performance of telescope electronic devices can be stabilized. To secure the signal paths with respect to the platform movement, all the signal processing electronics of AMiBA were mounted on the platform. Since the platform is supported by six jackscrews of the hexapod mount, the total weight on it is limited. Thus the temperature control system for the sensitive microwave devices is not implemented yet. Several gain sensitive devices along the signal path and their effects are discussed as follows.
4.1 Low Noise Amplifier
The Low Noise Amplifier contains a four-stage, 0.1um-InP high electron mobility transistor (HEMT) monolithic millimeter-wave integrated circuit (MMIC) W-band low-noise amplifier12,13 chip operated in 15K cryogenic temperature . The LNA gain has the nature of drifting as the ambient temperature drifts. The gain drift about 1.5 dB while the cryogenic temperature rising from 25K to 50 K13. Long term monitoring of AMiBA receiver temperature indicated that there is about 1 Kelvin temperature variation during night time. From there, we can estimate there will be about 1.6% gain variation in 6 hours of night observation, in other word, 7.6 x 10 -5 % per second of gain drift in one LNA.
Proc. of SPIE Vol. 6275 62751I-9
4.2 LO and IF
From an overnight test the DRO has power drifting about 0.08 dB in six hours, equivalent to 8.6x10⁻⁵ % per second. Experiments showed that the power output of IF amplifiers (Celeritek CMA-18-2004) dropped from 7.48 dBm to 6.85 dBm while the ambient temperature is raised from 31 to 41 Celsius. Presumably it is linear to the -10°, the temperature on Mauna Loa at night. The amplifier gain would drift about 0.63 dB in 10 Celsius (15.6% in 6 hours, 7.2x10⁻⁴ % per second). The test of putting the doubler (Narda DBS-3350X213) into an environmental chamber showed that the power output dropped about 0.65 dB as the temperature was raised from -10 to 20 Celsius, equivalent to 5.4 %) in 10° variation.
The fluctuation of noise temperature for a correlation interferometer (2 dishes) would be14 :
21
2⎟⎠⎞
⎜⎝⎛ ∆+=∆
GG
BT
T sys
τ (2)
where T∆ is the noise of the system, GG∆
is the fractional gain fluctuation of the system, B is the bandwidth, and τ
is the integration time. Comparing with the noise of a very stable system, i.e. 0=∆GG
, the ratio is 2
1 ⎟⎠⎞
⎜⎝⎛ ∆+
GGBτ .
Summing all the gain drifting data above without taking the subharmonic mixer into account and assuming the gain drifting of all the LO devices propagates linearly to the mixer output, also assuming the gain is stable for the doubler, the gain drifting is on the order of 10-3 % per second which will make the system noise 40% larger. In the following, we will discuss two approaches under consideration to stabilize the gain.
4.3 Feedforward control
For the gain drifting due to the ambient temperature change, we can have the gain of those devices calculated according to the ambient temperature in real time, and adjust the variable gain amplifier to compensate it to make the system gain fixed. Monitoring the so called 1 wire temperature sensors which have been fixed on the surface of each critical devices, and the cryogenic temperature sensors which also have been working in each receiver for a while, we can have the relationship of those readings with respect to the system power which we can get by monitoring the total power sensors in the beginning of the correlator. Combining with the variable gain IF amplifier closes the control loop.
4.4 Known gain injection
Using the noise coupler to inject the noise of the known power level periodically while observing the receiver total power, the gain can be stabilized by adjusting the control voltage of the variable gain amplifier according to the feedback signal derived from the reading of the total power sensor in the first section of the correlator.
Proc. of SPIE Vol. 6275 62751I-10
S Sa a
10-7
10-6
10-5
0.0001
0.001
0.01
0.1
100 1000 104
DSA (span 6.4 KHz)
50ohmRx1/f
Vrm
s
Hz Fig. 9. (blue) FFT of receiver total power with a DSA; (red) DSA input terminated with a 50 ohm resistor.
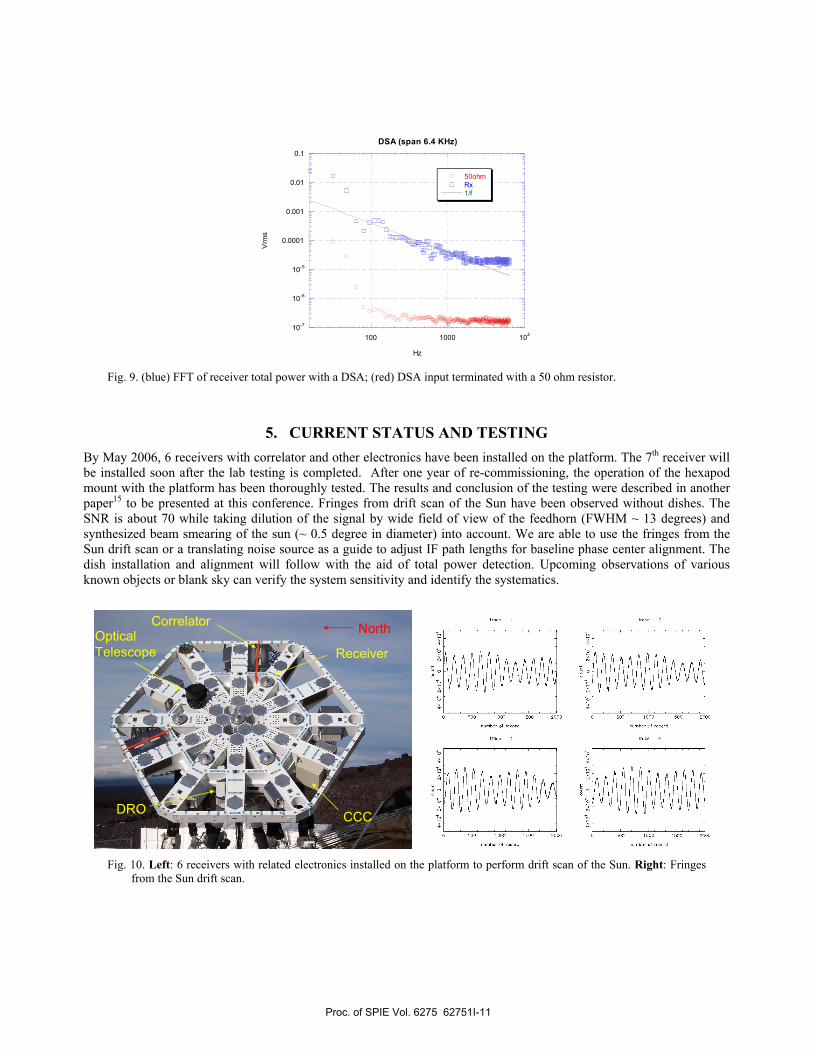
5. CURRENT STATUS AND TESTING By May 2006, 6 receivers with correlator and other electronics have been installed on the platform. The 7th receiver will be installed soon after the lab testing is completed. After one year of re-commissioning, the operation of the hexapod mount with the platform has been thoroughly tested. The results and conclusion of the testing were described in another paper15 to be presented at this conference. Fringes from drift scan of the Sun have been observed without dishes. The SNR is about 70 while taking dilution of the signal by wide field of view of the feedhorn (FWHM ~ 13 degrees) and synthesized beam smearing of the sun (~ 0.5 degree in diameter) into account. We are able to use the fringes from the Sun drift scan or a translating noise source as a guide to adjust IF path lengths for baseline phase center alignment. The dish installation and alignment will follow with the aid of total power detection. Upcoming observations of various known objects or blank sky can verify the system sensitivity and identify the systematics.
Receiver
CorrelatorOpticalTelescope
North
DRO CCC
Fig. 10. Left: 6 receivers with related electronics installed on the platform to perform drift scan of the Sun. Right: Fringes
from the Sun drift scan.
Proc. of SPIE Vol. 6275 62751I-11
REFERENCES
1. P. T.P. Ho, M.-T. Chen, T.-D. Chiueh, T.-H. Chiueh, T.-H. Chu, H. Jiang, P. Koch, D. Kubo, C.-T. Li, M. Kesteven, K.-Y. Lin, G.-C. Liu, K.-Y. Lo, C.-J. Ma, R. N. Martin, K.-W. Ng, H. Nishioka, F. Patt, J. B. Peterson, P. Raffin, H. Wang, Y.-J. Hwang, K. Umetsu, J.-H. P. Wu, The AMiBA Project, Modern Physics Letters A, Vol. 19, Nos. 13-16, pp. 993-1000 (2004) 2. E. Komatsu, U. Seljak, The Sunyaev-Zel'dovich angular power spectrum as a probe of cosmological parameters, MNRAS, Vol. 336, pp. 1256-1270 (2002) 3. Z. Fan, T. Chiueh, Determining the Geometry and the Cosmological Parameters of the Universe through Sunyaev-Zeldovich Effect Cluster Counts, ApJ, Vol. 550, pp. 547-553 (2001) 4. M. White, J. E. Carlstrom, M. Dragovan, W. L. Holzapfel, Interferometric Observation of Cosmic Microwave Background Anisotropies, ApJ, Vol. 514, pp. 12-24 (1999) 5. C.-T. Li, D. Kubo, C.-C. Han, C.-C. Chen, M.-T. Chen, C.-H. Lien, H. Wang, R.-M. Wei, C.-H. Yang, T.-D. Chiueh, J. Peterson, M. Kesteven, W. Wilson, A wideband analog correlator system for AMiBA, Proc. SPIE Vol. 5498, pp. 455-463, Millimeter and Submillimeter Detectors for Astronomy II; J. Zmuidzinas, W. S. Holland, S. Withington; Eds (2004) 6. Y.-J. Hwang, M.-T. Chen, H. Jiang, T.-H. Chu, S.-N. Hsieh, C.-C. Han, F. Patt, W. Wilson, W-band Dual-polarization Receiver for AMiBA , Proc. SPIE Vol. 5498, p. 517-524, Millimeter and Submillimeter Detectors for Astronomy II; J. Zmuidzinas, W. S. Holland, S. Withington; Eds. (2004) 7. K.-Y. Lin, D. Kubo, M.-T. Chen, T.-H. Chiueh, Calibration system of AMiBA project, IEEE Conference Proceeding of IRMMW-THz, pp. 411-412 (2005) 8. L. D'Addario, Gain Stability: Requirements and Design Considerations, ALMA Memo 466 9. P.T.P. Ho, J.M. Moran, K.Y. Lo, The Submillimeter Array, ApJ, vol. 616, pp. L1-L6 (2004) 10. E.J. Wollack, M.J. Devin, N.J. Jarosik, C.B. Nettterfield, L. Page, D. Wilkinson, An instrument for investigation of the cosmic microwave background radiation at intermediate angular scales, ApJ, v. 476, pp. 440-457 (1997) 11. S. Padin et al., The Cosmic Background Imager, The Publications of the Astronomical Society of the Pacific, Vol. 114, pp. 83-97 (2002) 12. M. W. Pospieszalski, E. J. Wollack, N. Bailey, D. Thacker, J. Webber, L. D. Nguyen, M. Le, and M. Lui, Design and performance of wideband, low-noise, millimeter-wave amplifiers for microwave anisotropy probe radiometers, 2000 IEEE MTT-S Int. Microwave Symp. Dig., June 2000. 13. M. W. Pospieszalski, W. J. Lakatosh, E. J. Wollack, L. D. Nguyen, M. Le, and M. Lui, and T. Liu, Millimeter-wave waveguide-bandwidth cryogenically-coolable InP HEMT amplifiers, 1997 IEEE MTT-S Int. Microwave Symp. Dig., June 1997. 14. K. Rohlfs, T.L. Wilson, Tools of Radio Astronomy, 2nd Edition, Springer 15. P. Raffin, P. Koch, Y.-D. Huang, C.-H. Chang, J. Chang, M.-T. Chen, K.-Y. Chen, P. T.P. Ho, C.-W. Huang, F. I. Roman, H. Jiang, M. Kesteven, K.-Y. Lin, G.-C. Liu, H. Nishioka, K. Umetsu, SPIE Optomechanical Technologies for Astronomy Conference, Orlando, FL, 2006 (to be held)
Proc. of SPIE Vol. 6275 62751I-12


![Spin waves in coupled YIG/Co heterostructuresexcitation of exchange spin waves by microwave magnetic fields requires nanolithographically defined microwave an-tennas [11] that have](https://img.pdfslide.org/doc/110x75/6068fa3a8fa72b2c5a423f16/spin-waves-in-coupled-yigco-heterostructures-excitation-of-exchange-spin-waves.jpg)