Embed Size (px)
Citation preview
Benthic organic carbon fluxes
in the Southern Ocean:
Regional differences and links to
surface primary production and carbon export
Dissertation
zur Erlangung des
Doktorgrades der Naturwissenschaften
- Dr. rer. nat. -
im Fachbereich Geowissenschaften
der Universitat Bremen
vorgelegt von
Oliver Sachs
Bremen
August 2007
Everything should be made as
simple as possible.
But not simpler.
Gutachter:
Prof. Dr. Michael Schloter
Prof. Dr. Horst D. Schulz
Albert Einstein (1879 - 1955)
Eine elektronische Farbversion dieses Dokumentes kann bezogen werden unter:
http://hdLhandle.netli 00 13!epic.30856
oder
http://nbn-reso]ving,de!urn:nbn: dt':gbv:46-dissOOOll 0604
Table of Contents
Zusammenfassung ........................................................................................... IV
Summary ........................................................................................................... V
Acknowledgements .......................................................................................... VI
List of figures .................................................................................................... VII
List of tables ..................................................................................................... IX
Section A: Concepts and outline
1 General introduction ....................................................................................... 3
2 Outline of the manuscripts .............................................................................. 17
Section B: Submitted papers
3 Enhanced carbon export to deep-sea sediments underlying productivity hotspots
in the Southern Ocean .................................................................................... 21
3.1 Abstract 21
3.2 Introduction 22
3.3 Results and discussion 22
3.4 Conclusions 28
3.5 Methods ....................................................................................................................... 28
3.5.1 Study site ..................................................................................................... 28
3.5.2 Benthic carbon fluxes ................................................................................. 29
3.5.3 Sediment sampling ..................................................................................... 30
3.5.4 Sediment investigations ............................................................................. 30
3.5.5 APEX floats 31
3.6 References 31
I
4 Benthic organic carbon flux and oxygen penetration reflect different plankton
provinces in the Southern Ocean ..................................................................... 35
4.1 Abstract _______________________________________________________________________________________________________________________ 35
4.2 Introduction .. _______________________________________________________________________________________________________________ 36
4.3 Materials and methods _____________________________________________________________________________________________ 38
4.3.1 Measurements of in situ and ex situ oxygen microprofiles .. _______________ .. 39
4.4 Results and discussion .. ___________________________________________________________________________________________ 42
4.4.1 Relationship between ex situ and in situ flux measurements ____________ .. 42
4.4.2 Organic carbon fluxes reaching the seafloor of the SO ______________________ .. 58
4.5 Conclusions ________________________________________________________________________________________________________________ 72
4.6 Refe re nces __________________________________________________________________________________________________________________ 74
5 Spatial variability of the transfer efficiency of primary produced carbon to the
seafloor of the Atlantic Ocean .............................................................................. 81
5. 1 Ab s tra ct _ _ _ __ __ ___ _ __ __ _ ___ _ ___ _ __ _ _ _ _ _____ _ _ _ _ _ __ _ _ __ ___ _ _ ___ _ _ __ _ _ _ _ __ _ _ ____ ___ ___ __ _ __ ___ _ _ __ _ _ __ _ _ __ _ _ _ __ ___ __ __ __ _ _ ___ _ __ _ 81
5.2 I ntrod u cti on .________________________________________________________________________________________________________________ 82
5.3 Me th od s _ __ __ __ _ ___ __ ____ ___ _ __ _ _____ _ _ _ _ _ __ __ __ __ __ __ _ _ ___ _ _ _ _ __ __ __ __ _ _ ___ _ _ __ _ __ __ _ __ ___ _ _ __ _ _ _ __ _ __ _ __ _ _ __ __ ____ __ _ __ _____ 90
5.3.1 Database and data compilation ______________________________________________________________ .. 90
5.3.2 Consideration of lateral advection 93
5.3.3 Connecting surface chl-a with benthic Corg fluxes & OPD values _____ .. 94
5.4 Results and discussion .. ___________________________________________________________________________________________ 97
5.4.1 Lateral advection 97
5.4.2 Use of long-term median chl-a connection & pp estimates .. _____________ .. 98
5.4.3 A priori station groups ______________________________________________________________________________ .. 102
5.4.4 Benthic carbon export ratio (BER) _________________________________________________________ ..1 07
5.4.5 A posteriori g rou ps .. __________________________________________________________________________________ .. 109
5.4.6 Relationships between OPD, Corg flux, depth and latitude _________________ ..112
II
5.4.7 Calculation of Corg flux for the SO and Atlantic Oceans ..................... ..122
5.4.8 Open questions ........................................................................................... 126
5.5 Conclusions , ................................................................................................................ 129
5.6 References .................................................................................................................. ,130
6 Synthesis and Outlook ....................................................................................... 139
7 Appendix ............................................................................................................. 141
III
Zusammenfassung
Der weltweite Klimawandel steht in direktem Zusammenhang mit der anthropogenen
Freisetzung von Treibhausgasen wie Kohlendioxid (C02) und Methan (UN IPCC-Report 2007).
Darum wurde die Erforschung des globalen Kohlenstoffkreislaufs in den letzten lahren stark
vorangetrieben. Dabei ist insbesondere zu kHiren, welche Rolle der Hydro-, Bio- und
Atmosphare innerhalb der beobachteten Veranderungen zukommt und welche Auswirkungen die
Zunahme der atmospharischen CO2 Konzentration auf die verschiedenen Kompartimente des
Erdsystems haben. Aufgrund seines riesigen Kohlenstoffinventars stellt der marine
Kohlenstoffkreislauf hierbei die wichtigste Komponente dar. Zahlreiche Befunde weisen dem
Stidozean eine Schltisselstellung beztiglich der Aufnahme von C02 zu. Allerdings ist eine genaue
Quantifizierung dieser Stofffltisse, insbesondere aufgrund der Unzuganglichkeit der Region,
kaum groI3flachig maglich. Speziell zum benthischen Kohlenstoffeintrag lagen bisher kaum
genaue Daten vor. Diese k6nnen aus Oberflachensedimentdaten wie beispielsweise aus
hochauflasenden Sauerstoffprofilen abgeleitet werden. Allerdings zeigt sich, dass an
Sedimentkernen, also ex situ bestimmte benthische Kohlenstofffltisse durch Temperatur- und
Druckveranderungen haufig fehlerbehaftet sind. Die Altemative besteht in der Messung der
Sauerstoff-Mikroprofile am Meeresboden (in situ). Bisher waren jedoch fUr den Stidozean keine
derartigen Literaturdaten verfUgbar. Im Rahmen dieser Doktorarbeit wurden wahrend der
Antarktis-Expedition ANT XXI-4 in situ und ex situ Sauerstoffprofile gemessen und hieraus
benthische Kohlenstofffltisse abgeleitet. Hierdurch wurde es m6glich, eine tiefenabhangige
Kon·ekturfunktion zu bestimmen, mit der bisher publizierte und unpublizierte Kohlenstofffltisse
revidiert wurden. Damit wurde eine einheitliche Datenbasis fUr benthische Kohlenstoffeintrage
fUr viele wichtige Regionen imlerhalb des Stidozeans wie beispielsweise die Amundsen und
Bellingshausen See (stidlicher Pazifischer Ozean), das Scotia und Weddell Meer (stidlicher
Atlantischer Ozean) sowie das Crozet Becken im stidlichen Indischen Ozean geschaffen.
EinschlieI3lich der Stationen am Antarktischen Schelf decken 134 neue bzw. revidierte
Messlokationen einen Bereich von annahemd 1800 des Stidozeans ab, fUr welche benthische
Kohlenstofffltisse bzw. die Machtigkeit der oxischen Zone des Oberflachensediments vorliegen.
Dartiber hinaus wurden benthische Kohlenstoffeintrage empirisch in Beziehung gesetzt zu
dominanten Diatomeenvelieilungen in Oberflachensedimenten sowie zu satellitengesttitzten
Chlorophyll-a Langzeitmessungen. Im Kontext mit benthischen Kohlenstofffltissen des
gesamten Atlantischen Ozeans zeigt sich eine deutlich hahere Export-Effizienz im Stidozean,
und hier speziell im Bereich des Opalgtirtels, als bisher angenommen.
IV
Summary
Without doubt, global climate change is directly linked to the anthropogenic release of
greenhouse gases such as carbon dioxide (C02) and methane (UN IPCC-Report 2007).
Therefore, research efforts to comprehend the global carbon cycle have increased during the last
years. In the context of the observed changes, it is of particular interest to decipher the role of the
hydro-, bio- and atmospheres and how the different compartments of the earth system are
affected by the increase of atmospheric CO2. Due to its huge carbon inventory, the marine
carbon cycle represents the most important component in this respect. Numerous findings
suggest that the Southern Ocean plays a key role in terms of oceanic CO2 uptake. However, an
exact quantification of such fluxes of material is hard to achieve for large areas, not least on
account of the inaccessibility of this remote region. In particular, there exist so far only few
accurate data for benthic carbon fluxes. The latter can be derived from high resolution pore water
oxygen profiles, as one possible method. However the ex sitl! flux determinations calTied out on
sediment cores, tend to suffer from temperature and pressure artefacts. Alternatively, oxygen
microprofiles can be measured in sitl!, i.e. at the seafloor. Until now, no such data have been
published for the Southern Ocean. During the Antarctic Expedition ANT XXII4, within the
framework of this thesis, in situ and ex sitl! oxygen profiles were measured and used to derive
benthic organic carbon fluxes. Having both types of measurements from the same locations, it
was possible to establish a depth-related correction function which was applied subsequently to
revise published and additional unpublished carbon fluxes to the seafloor. This resulted in a
consistent data base of benthic carbon inputs covering many important sub-regions of the
Southern Ocean including the Amundsen and Bellingshausen Seas (southern Pacific), Scotia and
Weddell Seas (southern South Atlantic) as well as the Crozet Basin (southern Indian Ocean).
Including additional locations on the Antarctic Shelf, there are now 134 new and revised
measurement locations, covering almost 1800 of the Southern Ocean, for which benthic organic
carbon fluxes and sedimentary oxygen penetration depth values are available.
Further, benthic carbon fluxes were empirically related to dominant diatom distributions in
surface sediments as well as to long-tern1 remotely sensed chlorophyll-a estimates. The
comparison of these results with benthic carbon fluxes of the entire Atlantic Ocean reveals
significantly higher export efficiencies for the Southern Ocean than have previously been
assumed, especially for the area of the opal belt.
v
Acknowledgements
'A journey is easier when you travel together. Interdependence is certainly more valuable than
independence.' With these words I want thank to all of the people who accompanied and
supported this thesis. It is pleasant now to have the opportunity to express my gratitude to all of
them.
First, I would like to thank my doctoral advisors Prof. Dr. Michael Schltiter and Dr. Eberhard
Sauter for giving me the chance to perfonll this work and for enabling me to write this thesis at
the University of Bremen. They also gave me the opportunity to do this research at the Alfred
Wegener Institute. Their input and constructive comments and remarks were of great value for
this thesis. I would like to thank Prof. Dr. Horst Schulz for kindly performing the second review
of this thesis.
Much support also came from Or. Jill Nicola Schwarz, Prof. Dr. Victor Smetacek and Prof. Dr.
Ulrich Bathmann. Jan Wegener, Uli Hoge, Ludmila Baumann, Dr. Kerstin Jerosch, Ingrid Voge
and Michael Gensheimer are acknowledged for their unremitting technical support at sea and at
the institute.
I thank sincerely to all co-authors of the submitted manuscripts for their constructive
collaboration during the expeditions, access to unpublished data and for many helpful
discussions during the preparation process of the manuscripts.
I appreciated the friendly atmosphere within my host, the A WI Geochemistry Group. I enjoyed
the collaboration and multidisciplinary discussions with many colleagues: Prof. Dr. Karen Helen
Wiltshire and Dr. Nicole Aberle-Malzahn (Shelf Sea Ecology - Biologische Anstalt Helgoland),
Dr. Richard Crawford, Friedel Hinz, Dr. Philipp Assmy and Dr. Joachim Henjes (Biological
Oceanography) and Rita Frohlking, Fred Niederjasper, Prof. Dr. Reiner Schlitzer, Dr. Gerhard
Kuhn, Dr. Rainer Gersonde and Dr. Andrea Abelmann-Gersonde (Marine Geology and
Paleontology).
Many thanks go to Anja Kahler (IFM-GEOMAR, Kiel) and Dr. Ilka Peeken (IFM-GEOMAR,
Kiel) for discussions and laboratory work.
In particular, I would like to thank my wife Marcella, my son Marco Pascal and my parents
Werner and Annemarie Sachs for their patience and support.
VI
List of figures
Figure 1-1: Simplified global carbon cycle _____________________________________________________________________________ 4
Figure 1-2: Diagram of the marine carbon cycle ___________________________________________________________________ 5
Figure 1-3: Worldwide in situ Corg flux (DOU) determinations _______________________________________________ 7
Figure 1-4: Worldwide in situ Corg flux (DOU) determinations with SO dataset ____________________ 9
Figure 1-5: Schematic overview of the pathways of organic matter _____________________________________ 11
Figure 3-1: Surface chlorophyll-a concentrations across the ACC _______________________________________ 23
Figure 3-2: Evidence of freshly deposited material at Site 600 . ____________________________________________ 24
Figure 3-3: Oxygen microprofiles measured in situ _______________________________________________________________ 25
Figure 3-4: Close-up of the EIFEX eddy . _______________________________________________________________________________ 26
Figure 4-1: Compiled oxygen profile measurements of surface sediments . _________________________ 38
Figure 4-2: In situ Ormeasurements in surface sediments of the SO . _________________________________ 40
Figure 4-3: Flux ratio of ex situ / in situ determined DOU versus depth (worldwide) . ___________ 42
Figure 4-4: Flux ratio of ex situ / in situ determined DOU versus depth (high latitude) ________ 43
Figure 4-5: Flux of organic carbon reaching the seafloor . _____________________________________________________ 58
Figure 4-6: Oxygen penetration depths of surface sediments in the SO ______________________________ 63
Figure 4-7: Selected oxygen profiles measured in Region A ________________________________________________ 65
Figure 4-8: Selected oxygen profiles measured in Region B ________________________________________________ 67
Figure 4-9: Selected oxygen profiles measured in Region C . _______________________________________________ 69
Figure 4-10: Corg fluxes of Chaetoceros spp. and F. kerguelensis Provinces (longitude) ____ 70
Figure 4-11: Corg fluxes of Chaetoceros spp. and F. kerguelensis Provinces (depth) __________ 70
Figure 4-12: OPO values of Chaetoceros spp. and F. kerguelensis Provinces (longitude) _ 71
Figure 4-13: OPD values of Chaetoceros spp. and F. kerguelensis Provinces (depth) _______ 72
Figure 5-1: Schematic overview of the pathways of organic matter _____________________________________ 84
Figure 5-2: Median chl-a distribution and rms variability _______________________________________________________ 85
Figure 5-3: Correlation between Corg
flux and OPD . ______________________________________________________________ 100
VII
Figure 5-4: Comparison of Eppley and VGPM primary production ...................................... J.R:t
Figure 5-5: Maps of a priori groups ........................................................................................ 103
Figure 5-6: Regressions of a priori groupings ........................................................................ 108
Figure 5-7: Regressions of a posteriori groupings ................................................................. 110
Figure 5-8: Locations of a posteriori groups .......................................................................... 111
Figure 5-9: Variability of OPO and benthic Corg flux ............................................................... 112
Figure 5-10: Variability of export ratio with depth and latitude .............................................. 114
Figure 5-11: Multiple regression of Corg flux against median VGPM & water depth .............. 116
Figure 5-12: Spatial distribution of benthic Corg flux calculated using Eq. 3/AP 4 ................. 122
Figure 5-13: Spatial distribution of Corg flux calculated using Eq. 3/AP 3 for the opal belt. ... 123
Figure 5-14: Corg flux for the North Atlantic Arctic, North Atlantic, South Atlantic, Southern Ocean
(all longitudes) and 'rest of the world's .............................................................. 125
VIII
List of tables
Table 3-1: Station list ______________________________________________________________________________________________________________ 29
Table 4-1: Station list ______________________________________________________________________________________________________________ 45
Table 5-1: Estimated diatom sinking rates and the corresponding mean lateral advection
distances . _______________________________________________________________________________________________________________ 98
Table 5-2: Characteristics of the four chl-a distribution groups _____________________________________________ 104
Table 5-3: Characteristics of the five sediment group systems _____________________________________________ 106
Table 5-4: Significant correlations __________________________________________________________________________________________ 109
Table 5-5: Regression coefficients _________________________________________________________________________________________ 116
Table 5-6: Areally integrated Corg flux values in this study and from the literature . _______________ 124
IX

Section A: Concepts and outline
1

2
1 General introduction
The World Meteorological Organisation (WMO) and the United Nations Environment
Programme (UNEP) founded the Intergovernmental Panel on Climate Change (IPCC)
1988 when global change became more and more obvious. The idea was that the IPCC
should monitor and report in regular intervals the situation of the global climate, its
effects for the society, and advice policy makers. The IPCC report 2007 clearly appoints
the reasons for global climate change as follows: since 1750 the concentration of
carbon dioxide (C02) raised from 280 ppm up to 379 ppm in 2005 (Solomon et al.,
2007). This is an increase of 35 % compared to the first reliable measurements in 1750.
The increment during the last decade is the largest since 50 years. The modern
atmospheric CO2 concentration is the highest value since 650.000 years. 78 % of this
increase is attributed to the use of fossil fuels and 22 % is caused by the change of land
use (e. g. uprooting).
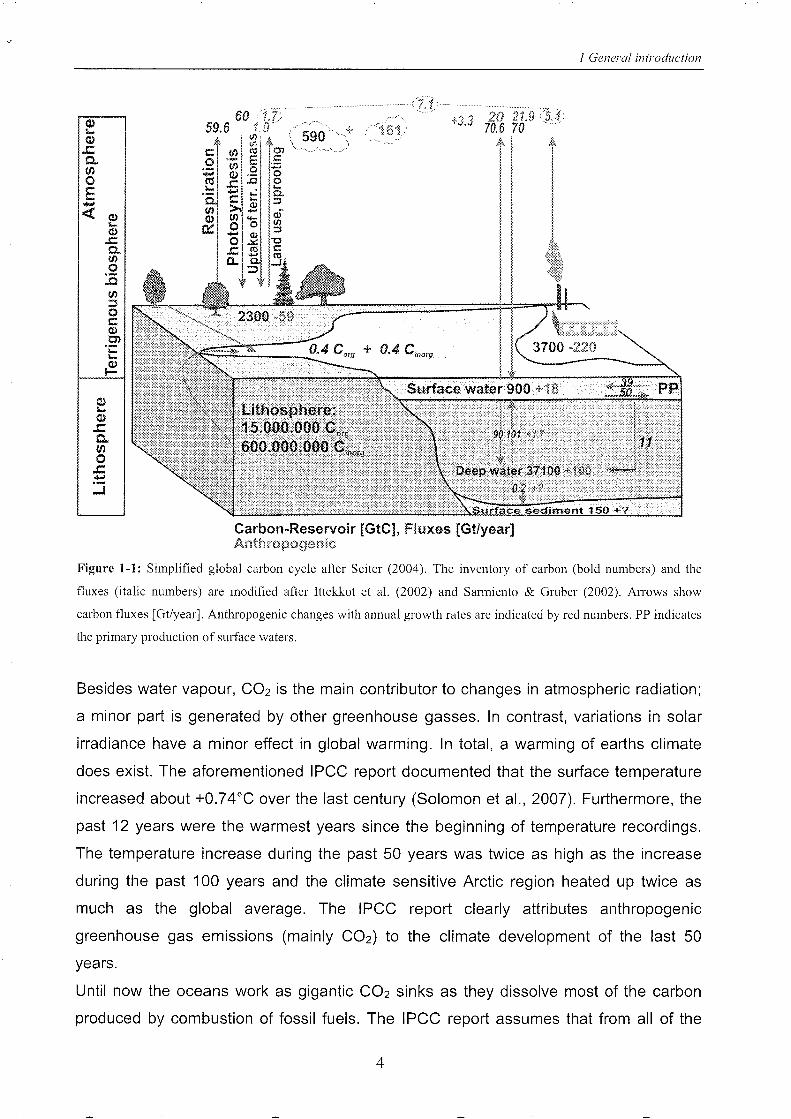
These facts may illustrate the importance of carbon in the earth system. Where are the
large carbon reservoirs on planet earth? Where are the sources and sinks of CO2?
What happens with the 'missing carbon', the part of anthropogenic generated and
released carbon which is still missing in the global budget? Fig 1-1 gives an overview of
the global carbon cycle and exhibits interactions between reservoirs and flux rates
between different compartments.
3
60 59.6
lO 21,9 70.6 70
Carbon-Reservoir [GtC], Fluxes [Gt/year] Anthropogenic
I Genera! introdllction
Figure 1-1: Simplified global carbon cycle after Seiter (2004). The inventory of carbon (bold numbers) and the
fluxes (italic numbers) are modified after lttekkot et al. (2002) and Sanniento & Gruber (2002). AlTOWS show
carbon fluxes [Gtlyear]. Anthropogenic changes with annual growth rates are indicated by red numbers. pp indicates
the primary production of surface waters.
Besides water vapour, C02 is the main contributor to changes in atmospheric radiation;
a minor part is generated by other greenhouse gasses. In contrast, variations in solar
irradiance have a minor effect in global warming. In total, a warming of earths climate
does exist. The aforementioned IPCC report documented that the surface temperature
increased about +0.74°C over the last century (Solomon et al., 2007). Furthermore, the
past 12 years were the warmest years since the beginning of temperature recordings.
The temperature increase during the past 50 years was twice as high as the increase
during the past 100 years and the climate sensitive Arctic region heated up twice as
much as the global average. The IPCC report clearly attributes anthropogenic
greenhouse gas emissions (mainly CO2) to the climate development of the last 50
years.
Until now the oceans work as gigantic CO2 sinks as they dissolve most of the carbon
produced by combustion of fossil fuels. The IPCC report assumes that from all of the
4
I General intl'Odllction
anthropogenic CO2 emissions since 1750 around 45 % stayed in the atmosphere and
about 30 % was adsorbed by the world ocean (Solomon et ai., 2007). This process on
the one hand leads to saturation and on the other hand causes ocean acidification.
Figure 1-1 shows the ocean sub-divided into a smaller reservoir of surface water and a
larger pool of deep water. Both work as different compartments with a differing inventory
and storage capacity in respect to carbon. A miner portion of the carbon reacting the
ocean's interior, settles on the surface sediments of the deep-sea. A sub fraction here
from is subsequently remineralized whereas another part is buried in the sediments.
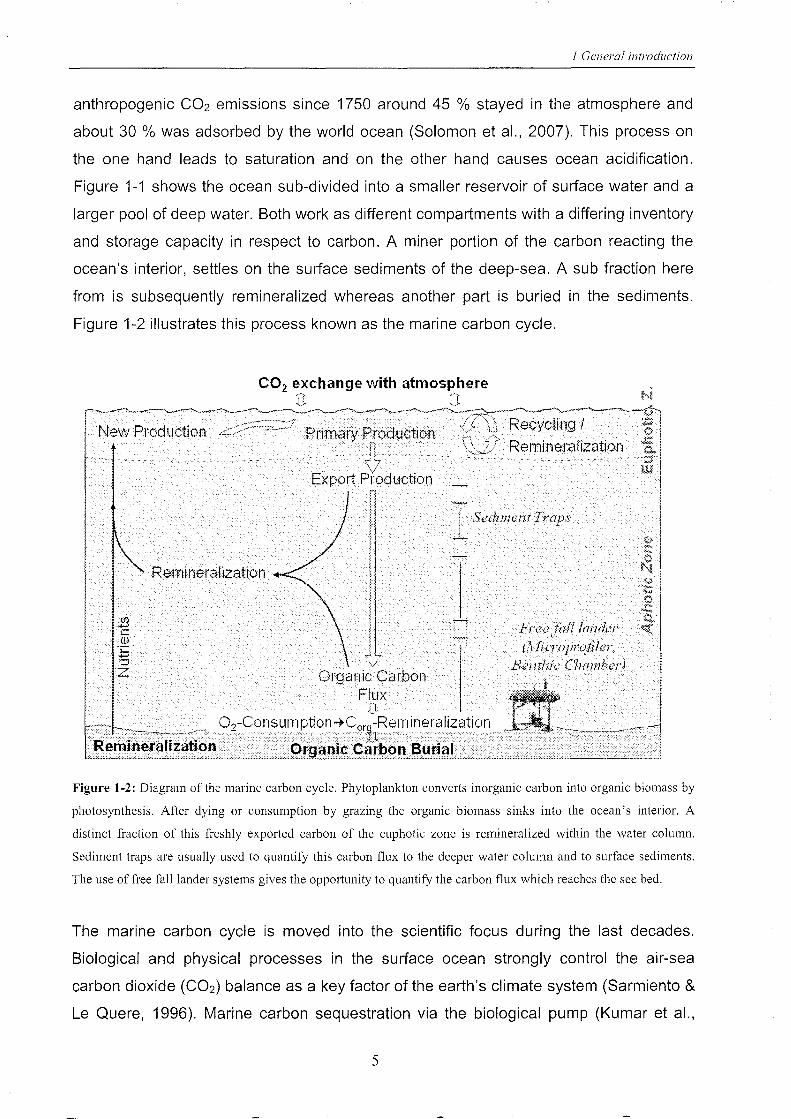
Figure 1-2 illustrates this process known as the marine carbon cycle.
New Production
CO2 exchange with atmosphere n
Primary Production ........ - ... )~-
\l
Export Production n
v ~ Recycling I " Remineralization "&
~ - " .. v. - v - ~., , - - . - .' . ~ -' -::to W
11 ! I
1 Sediment Traps
,$ C Ql ·c ...... ::; z
Remineralization
Organic Carbon Flux n
__ ~~._ ... __ ~. __ . 02-Consumption -tCClrhRE;tll i nera lization
Remmerabzatlon Organic Carbon Burial
Free j;J/! ltmdcr tJlicropr(~fil er,
BemMe C7wmber)
Figure 1-2: Diagram of the marine carbon cycle. Phytoplankton converts inorganic carbon into organic biomass by
photosynthesis. After dying or consumption by grazing the organic biomass sinks into the ocean's interior. A
distinct fraction of this freshly exported carbon of the euphotic zone is remineralized within the water column.
Sediment traps are usually used to quantify this carbon flux to the deeper water column and to surface sediments.
The use of free falllander systems gives the opportunity to quantify the carbon flux which reaches the see bed.
The marine carbon cycle is moved into the scientific focus during the last decades.
Biological and physical processes in the surface ocean strongly control the air-sea
carbon dioxide (C02) balance as a key factor of the earth's climate system (Sarmiento &
Le Quere, 1996). Marine carbon sequestration via the biological pump (Kumar et al.,
5
J Genera! introduction
1995; Sarmiento & Le Quere, 1996; Sarmiento et al., 2004) as well as via the solubility
pump (Raven and Falkowski, 1999; Le Quere et al., 2007) is considered one of the
major pathways of carbon exchange between atmosphere and the marine reservoir
(Fig. 1-2).
The combination of these two processes in the Southern Ocean is attributed with the
uptake of -2 Pg of anthropogenic carbon dioxide per year (Siegenthaler & Sarmiento,
1993; Caldeira & Duffy, 2000) which is -32 % of the annual global anthropogenic
carbon dioxide emissions during the 1990s (Houghton, 2003). The long-term efficacy of
the biological pump depends on the depth of carbon export: Delivery of particulate
organic carbon to the seafloor represents much longer isolation from the atmosphere
(e.g. Boyd & Trull, 2007) than carbon recycling within the upper ocean. C02 fixation by
phytoplankton via photosynthesis combined with the subsequent cycle of grazing,
export to the deep, sedimentation, and remineralization represents one of the major
CO2 sinks in this respect. The Southern Ocean (SO) is recognized as one of the world's
most important regions (DiTullio et al., 2000; Ribbe, 2004). However, amounts and
mechanisms of organic matter export to the deep-sea are still poorly constrained (Asper
et al., 1992; Jahnke, 1996; Schlitzer, 2002).
Vast areas of the world ocean are characterized by deep-sea environments. Contrasting
their areal importance, our knowledge of biogeochemical processes as well as of the
deep-sea fauna is still limited, in particular for the climate-sensitive Polar Regions. Apart
from ecological considerations, deep-sea sediments exhibit a globally important carbon
sink. Several large programmes and projects such as JGOFS (Joint Global Ocean Flux
Study), OMEX (Ocean Margin Exchange), BIGSET (Biogeochemical Fluxes of Matter
and Energy in the Deep Sea), BIO-C-FLUX (Biological Carbon Flux in the Benthic
Boundary Layer of the Deep Sea), 6C (Carbon Cycle, Carbonate Chemistry, Climate
Change), or Carbo-Ocean addressed the marine carbon cycle during the last decades
and at present. Nonetheless, due to their limited accessibility, polar deep-sea
environments are still underrepresented in respect to benthic organic carbon fluxes and
the linkage of benthic species distribution and small scale geochemical settings. At
oligotrophic and deep-sea sites, the organic carbon rain rate to the sea floor (Corg flux),
can be deduced in good approximation from measurements of the sedimentary oxygen
demand.
The total oxygen uptake (TOU) normally exceeds and is to be distinguished from the
diffusive oxygen uptake (DOU). Whereas TOU includes the contribution of epi and
6
1 Gel7era! introduction
macro fauna to the net respiration rate of a given sediment section (e.g. Graf et al.,
1995; Rowe et ai., 1997), DOU exhibits its basic turnover primarily caused by microbial
activities. Both TOU and DOU can be determined ex situ, i.e., by shipboard sediment
core incubation and laboratory measurements of pore water oxygen microprofiles,
respectively. Alternatively these parameters can be determined in situ, i.e. at the sea
floor using deep-sea benthic chamber and microprofiler landers, respectively (Tengberg
et al., 1995). In order to circumvent sampling artefacts as well as depressurization and
temperature effects during core recovery, measurements should preferentially be
performed in situ.
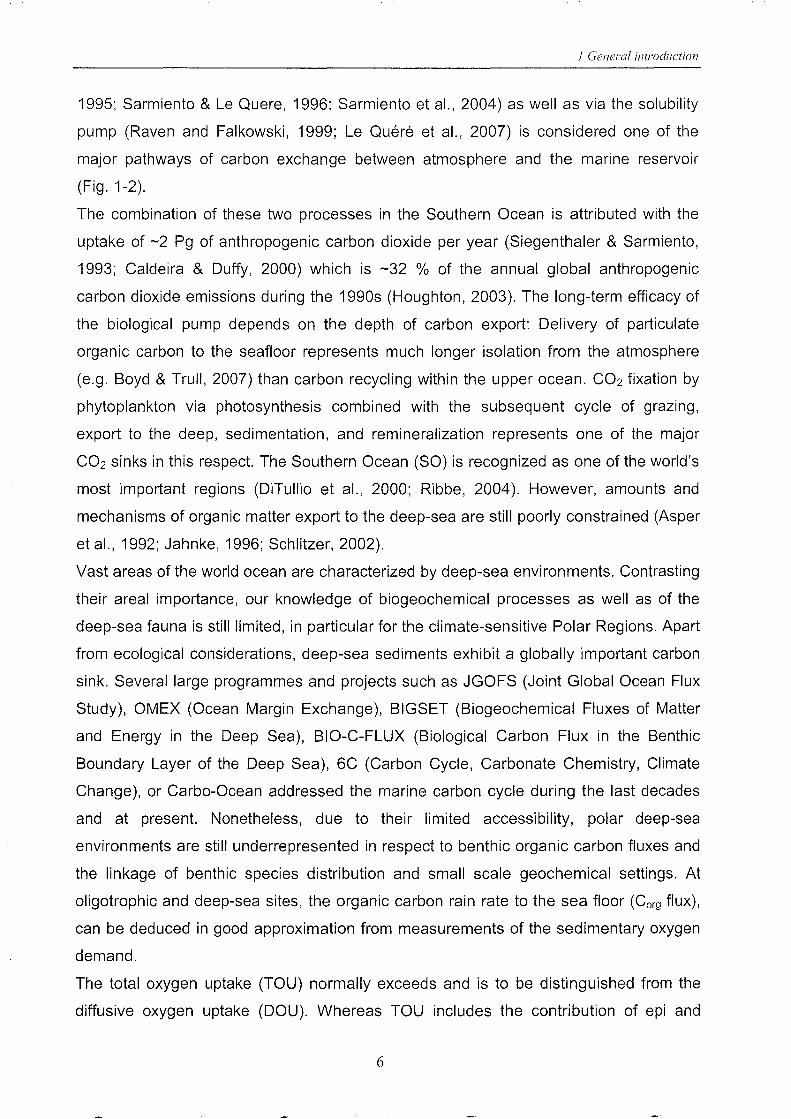
The use of micro sensors for flux determination was introduced already some 25 years
ago (Revsbech et al., 1980; Revsbech & J0rgensen, 1986; Reimers et al., 1986).
Although, since their in situ deployment is not trivial, data coverage is still modest for
temperate regions (Fig. 1-3).
Corg flux [mgC m-2 a-1]
1 - 4 5 - 8 i19 9 - 25 * > 25
Figure 1-3: Worldwide in situ Corg flux (DOU) detenninations for water depths of more than 100 m water depth till
2003 (Reimers et aI., 1984; Reimers, 1987; Archer et aI., 1989; Bender et aI., 1989; lahnke et aI., 1989; Bere1son et
aI., 1990; Archer & Devo1, 1992; Reimers et aI., 1992; Devo1 & Christensen, 1993; G1ud et aI., 1994; Ha1es et aI.,
1994; lahnke et al., 1994; Cai et aI., 1995; Ha1es & Emerson, 1996, 1997; G1ud et aI., 1998; Lohse et aI., 1998; G1ud
et aI., 1999; Luff et aI., 2000; Sauter et aI., 2001; WenzhOfer et aI., 2001a+b; Epping et aI., 2002; Giordani et aI.,
2002; WenzhOfer & G1ud, 2002 and additional database queries of PANG AEA (http://www.pangaea.de/).
7
1 General introduction
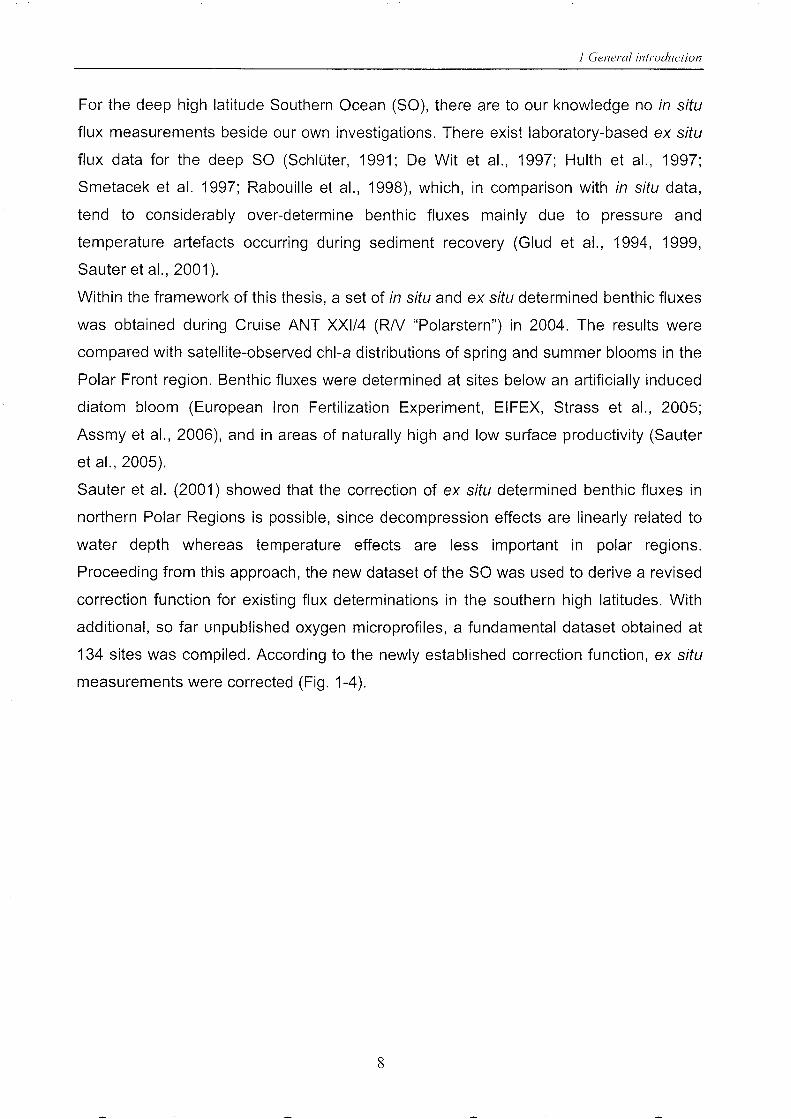
For the deep high latitude Southern Ocean (SO), there are to our knowledge no in situ
flux measurements beside our own investigations. There exist laboratory-based ex situ
flux data for the deep SO (Schluter, 1991; De Wit et al., 1997; Hulth et al., 1997;
Smetacek et al. 1997; Rabouille et al., 1998), which, in comparison with in situ data,
tend to considerably over-determine benthic fluxes mainly due to pressure and
temperature artefacts occurring during sediment recovery (Glud et al., 1994, 1999,
Sauter et al., 2001).
Within the framework of this thesis, a set of in situ and ex situ determined benthic fluxes
was obtained during Cruise ANT XXI/4 (RN "Polarstern") in 2004. The results were
compared with satellite-observed chl-a distributions of spring and summer blooms in the
Polar Front region. Benthic fluxes were determined at sites below an artificially induced
diatom bloom (European Iron Fertilization Experiment, EIFEX, Strass et al., 2005;
Assmy et ai., 2006), and in areas of naturally high and low surface productivity (Sauter
et al., 2005).
Sauter et al. (2001) showed that the correction of ex situ determined benthic fluxes in
northern Polar Regions is possible, since decompression effects are linearly related to
water depth whereas temperature effects are less important in polar regions.
Proceeding from this approach, the new dataset of the SO was used to derive a revised
correction function for existing flux determinations in the southern high latitudes. With
additional, so far unpublished oxygen microprofiles, a fundamental dataset obtained at
134 sites was compiled. According to the newly established correction function, ex situ
measurements were corrected (Fig. 1-4).
8
I General intl'Odllction
Corg flux [mgC m-2 a-1]
1 - 4 5 - 8 @ 9 - 25 it > 25
Figure 1-4: Worldwide in sit1l DOU determinations for water depths of more than 100 m water depth with the new
detennined and processed dataset in the Southern Ocean.
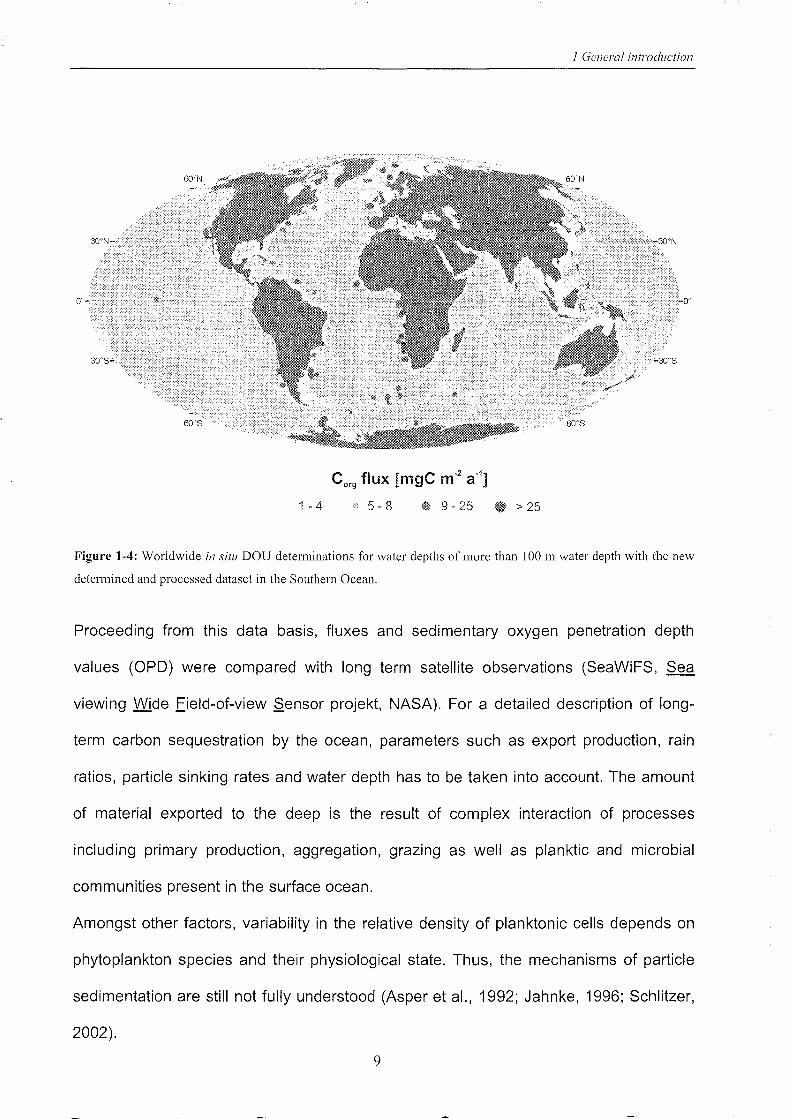
Proceeding from this data basis, fluxes and sedimentary oxygen penetration depth
values (OPO) were compared with long term satellite observations (SeaWiFS, Sea
viewing Wide field-of-view Sensor projekt, NASA). For a detailed description of long-
term carbon sequestration by the ocean, parameters such as export production, rain
ratios, particle sinking rates and water depth has to be taken into account. The amount
of material exported to the deep is the result of complex interaction of processes
including primary production, aggregation, grazing as well as planktic and microbial
communities present in the surface ocean.
Amongst other factors, variability in the relative density of planktonic cells depends on
phytoplankton species and their physiological state. Thus, the mechanisms of particle
sedimentation are still not fully understood (Asper et al., 1992; Jahnke, 1996; Schlitzer,
2002).
9
I General introduction
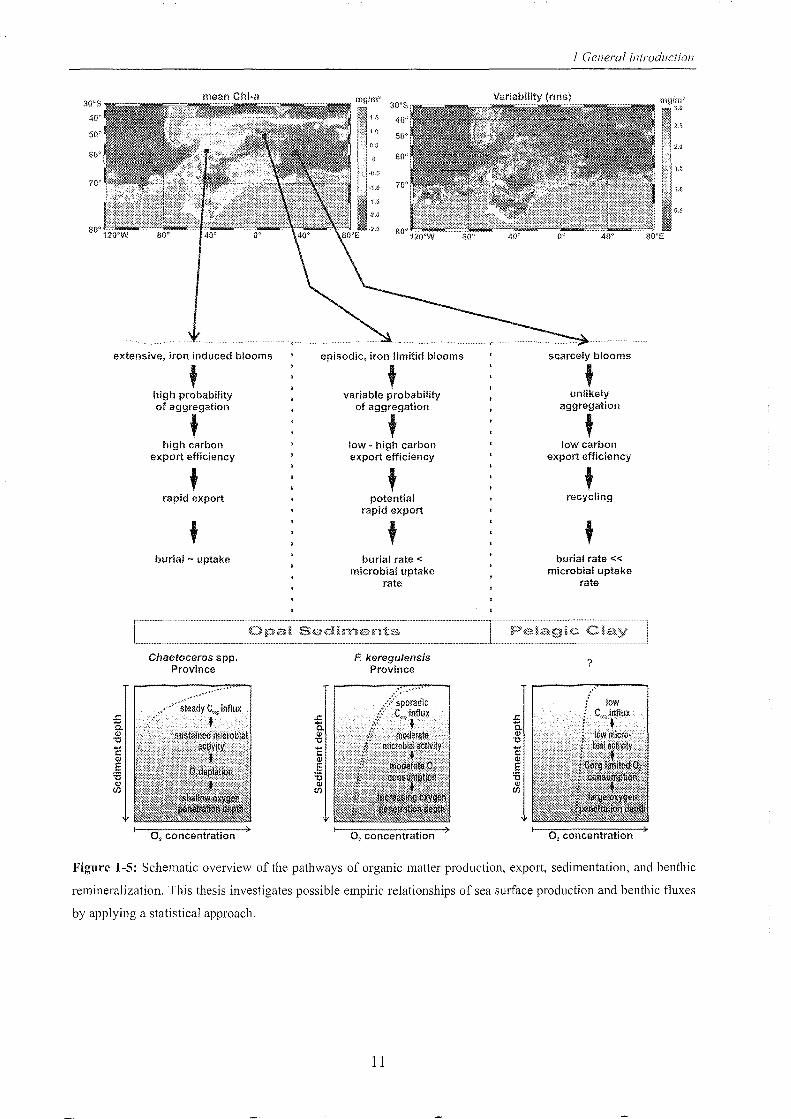
Figure 1-5 illustrates some of these mechanisms in the context of the Southern Ocean.
The mean chlorophyll-a concentration (chi-a) observed over 10 years, shown in the left
hand satellite-derived image, is highest in shelf regions and frontal systems. On the top
right of figure 1-5 the variability in chl-a (root square mean variability, rms) is particularly
high over the shelf, with relatively low variability at the Antarctic front systems (e.g.
Subantarctic Front, Antarctic Polar Front) suggesting steady production. Primary
production and chl-a distribution counter draws to the sediment compartment. Different
regions with individual diatom distributions are reflected in characteristic provinces of
sedimentary diatom debris which were be mapped e.g. by Crosta et al. (1997), Zielinski
& Gersonde (1997), Armand et al. (2005), and Crosta et al. (2005). One aim of this
thesis is the comparison of surface sediments in this respect, which leads to regionally
different oxygen gradients and oxygen penetration depths (bottom of fig. 1-5).
As a final step, benthic fluxes were compared statistically with the 10 year SeaWiFS
observation and according to the sea surface production regime of the respect Southern
Ocean region. The statistical examination revealed that data interpretation is difficult if
the dataset is restricted to the high latitude Southern Ocean. This is attributed to high
local, seasonal and annual variabilities in the surface chl-a distribution.
Most of the sites investigated here are located in the Atlantic Sector of the Southern
Ocean. Only the comparison of these results with published in situ Corg fluxes obtained
from other sites of the Atlantic Ocean, lights-up the picture: Within this context, the
importance of the Southern Ocean's contribution to CO2 drawdown can be assessed.
Thus, these results can be considered a contribution to a refined comprehension of the
global carbon cycle.
10
30"S·
400
50"
700
mean Chl·a
extensive, iron induced blooms
E <l)
E :0 <ll
(J)
t high probability of aggregation
t high carbon
export efficiency
t rapid export
t burial - uptake
Chaetoceros spp. Province
steady C". influx t
30"3
40'·
50'
episodic, iron limitid blooms
.... r:: <l)
E :0 <ll
(J)
t variable probability
of aggregation
t low - high carbon export efficiency
t potential
rapid export
t burial rate <
microbial uptake rate
F. keregu/ensis Province
1 Genera/ introduction
Variability (rms)
scarcely blooms
t unlikely
aggregation
t low carbon
export efficiency
t recycling
t burial rate «
microbial uptake rate
?
2.5
Z.U
1,5
1.0
0,5
Figure 1-5: Schematic overview of the pathways of organic matter production, export, sedimentation, and benthic
remineralization. This thesis investigates possible empiric relationships of sea surface production and benthic fluxes
by applying a statistical approach.
11
1 General introduction
References
Archer, D., Devol, A., 1992. Benthic oxygen fluxes on the Washington shelf and slope: A comparison of in
situ microelectrode and chamber flux measurements. Limnology and Oceanography 37,614-629.
Archer, D., Emerson, S., Reimers, C., 1989. Dissolution of calcite in deep-sea sediments: pH and O2
microelectrode results. Geochimica Cosmochimica Acta 53, 2831-2845.
Armand, L. K., Crosta, X., Romero, 0., Pichon, J.-J., 2005. The biogeography of major diatom taxa in
Southern Ocean sediments: 1. Sea ice related species. Palaeogeography, Palaeoclimatology,
Palaeoecology 223, 93-126.
Asper, V. L., Honjo, S., Orsi, T. H., 1992. Distribution and transport of marine snow aggregates in the
Panama Basin. Deep-Sea Research 39, 939-952.
Assmy, P., Cisewski, B., Henjes, J., Klaas, C., Sachs, 0., Smetacek, V., Strass, V., 2006. Plankton rain in
the Southern Ocean: The European Iron Fertilization Experiment EIFEX. Research Highlights 2006,
Alfred-Wegener-Institut, Bremerhaven, 40-43.
Bender, M. L., Jahnke, R., Weiss, R., Martin, W., Heggie, D. T., Orchado, J., Sowers T., 1989. Organic
carbon oxidation and benthic nitrogen and silica dynamics in San Clemente basin, a continental
borderland site. Geochimica Cosmochimica Acta 53, 685-697.
Berelson, W. M., Hammond, D. E., O'Neill, D., Xu, X.-M., Chin, C., Zukin, J., 1990. Benthic fluxes and
pore water studies from sediments of the central equatorial north Pacific: Nutrient diagenesis.
Geochimica Cosmochimica Acta 54, 3001-3012.
Cai, W.-J., Reimers, C. E., Shaw, T., 1995. Microelectrode studies of organic carbon degradation and
calcite dissolution at a California Continental rise site. Geochimica et Cosmochimica Acta 59, 497-
511.
Caldeira, K., Duffy, P. B., 2000. The role of the Southern Ocean in uptake and storage of anthropogenic
carbon dioxide. Science 287, 620-622.
Crosta, X., Pichon, J.-J., Labracherie, M., 1997. Distribution of Chaetoceras resting spores in modern
peri-Antarctic sediments. Marine Micropaleontology 29, 283-299.
Crosta, X., Romero, 0., Armand, K. L., Pichon, J.-J., 2005. The biogeography of major diatom taxa in
Southern Ocean sediments: 2. Open ocean related species. Palaeogeography, Palaeoclimatology,
Palaeoecology 223, 66-92.
De Wit, R., Relexans, J.-C., Bouvier, T., Moriarty, D. J. W., 1997. Microbial respiration and diffusive
oxygen uptake of deep-sea sediments in the Southern Ocean (ANTARES-I cruise). Deep-Sea
Research 11 44, 1053-1068.
Devol, A. H., Christensen, J. P., 1993. Benthic fluxes and nitrogen cycling in sediments of the continental
margin of the eastern North Pacific. Journal of Marine Research 51, 345-372.
DiTullio, G. R., Grebmeier, J. M., Arrigo, K. R., Lizotte, M. P., Robinson, D. H., Leventer, A., Barry, J. P.,
VanWoert, M. L. & Dunbar, R. B., 2000. Rapid and early export of Phaeocystis antarctica in the Ross
Sea. Nature 404, 595-598.
Epping, E. H. G., Zee, C. v. d., Soetart, K., Helder, W., 2002. On the oxidation and burial of organic
carbon in sediments of the Iberian Margin and Nazare Canyon (NE Atlantic). Progress in
Oceanography 52, 399-431.
12
1 Genera! introduction
Giordani, P., Helder, W., Koning, E., Miserocchi, S., Danovaro, R., Malaguti, A, 2002. Gradients of
benthic-pelagic coupling and carbon budgets in the Adriatic and Northern Ionian Sea. Journal of
Marine Systems 33-34, 365-387.
Glud, R. N., Gundersen, J. K., Holby, 0.,1999. Benthic in situ respiration in the upwelling area off central
Chile. Marine Ecology Progress series 186,9-18.
Glud, R. N., Gundersen, J. K., J0rgensen, B. B., Revsbech, N. P., Schulz, H.-D., 1994. Diffusive and total
oxygen uptake of deep-sea sediments in the eastern South Atlantic Ocean, in situ and laboratory
measurements. Deep-Sea Research 141,1767-1788.
Glud, R. N., Holby, 0., Hoffmann, F., Canfield, D. E., 1998. Benthic mineralization and exchange in Arctic
sediments (Svalbard, Norway). Marine Ecology Process Series 173, 237-251.
Graf, G., Gerlach, S. A, Linke, L., Queisser, W., Ritzrau, w., Scheltz, A., Thomsen, L., Witte, U., 1995.
Benthic-pelagic coupling in the Greenland-Norwegian Sea and its effect on the geological record.
Geologische Rundschau 84, 49-58.
Hales, B., Emerson, S., 1996. Calcite dissolution in sediments of the Ontong-Java Plateau: In situ
measurements of pore water O2 and pH. Global Biogeochemical Cycles 10,527-541.
Hales, B., Emerson, S., Archer, D. E., 1994. Respiration and dissolution in the sediments of the western
North Atlantic: estimates from models of in situ microelectrode measurements of porewater oxygen
and pH. Deep-Sea Research 41, 695-719.
Hales, B., Emmerson, S., 1997. Calcite dissolution in sediments of the Ceara rise: in situ measurements
of porewater O2 , pH, and CO2(aq). Geochimica Cosmochimica Acta 61, 501-514.
Houghton, R A, 2003. The contemporary carbon cycle. In: Schlesinger, W. H. (Ed.), Treatise of
geochemistry 8,473-513.
Hulth, S., Tengberg, A., Landen, A., Hall, P. O. J., 1997. Mineralization and burial of organic carbon in
sediments of the southern Weddell Sea (Antarctica). Deep-Sea Research 1,44,955-981.
Ittekkot, V., Rixen, T., Suthhof, A., Unger, D., 2002. Der globale Kohlenstoffkreislauf. In: Wefer, G. (Ed.),
Expedition Erde. Beitrage zum Jahr der Geowissenschaften 2002, Bremen, Deutschland.
Jahnke, R. A. 1996. The global ocean flux of particulate organic carbon: Areal distribution and magnitude.
Global Biogeochemical Cycles 10, 71-88.
Jahnke, R. A., Craven, D. B., Gaillard, J.-F., 1994. The influence of organic matter diagenesis on CaC03
dissolution at the deep-sea floor. Geochimica Cosmochimica Acta 58, 2799-2809.
Jahnke, R. A., Emerson, S. R, Reimers, C. E., Schuffert, J., Ruttenberg, K., Archer, D., 1989. Benthic
Recycling of biogenic Debris in the Eastern Tropical Atlantic Ocean. Geochimica Cosmochimica Acta
53,2947-2960.
Solomon, S., Qin, D., Manning, M., Chen, Z., Marquis, M., Averyt, K. B., Tignor, M., Miller, H. L., 2007.
Climate Change 2007: The Physical Science Basis. Contribution of Working Group I to the Fourth
Assessment Report of the Intergovernmental Panel on Climate Change, Cambridge University
Press.
Kumar, N., Anderson, R F., Mortlock, R. A, Froelich, P. N., Kubik, P., Dittrich-Hannen, B., Suter, M.,
1995. Increased biological productivity and export production in the glacial Southern Ocean. Nature
378, 675-680.
13
1 General introduction
Le Quere, C., Rbdenbeck, C., Buitenhuis, E. T., Conway, T. J., Langenfelds, R., Gomez, A.,
Labuschagne, C., Ramonet, M., Nakazawa, T., Metzl, N., Gillett N., Heimann, M., 2007. Saturation
of the Southern Ocean CO2 sink due to recent climate change. SCience 316, 1735-1738.
Lohse, L., Helder, w., Epping, E. H. G., Balzer, W., 1998. Recycling of organic matter along a shelf-slope
transect across the N.W. European Continental Margin (Goban Spur). Progress in Oceanography
42,77-110.
Luff, R., Wallmann, K., Grandel, S., Schluter, M., 2000. Numerical modeling of benthic processes in the
deep Arabian Sea. Deep Sea Research 1147, 3039-3072.
Rabouille, C., Gaillard, J.-F., Relexans, J.-C., Treguer P., Vincendeau, M.-A., 1998. Recycling of organic
matter in Antarctic sediments: A transect through the polar front in the Southern Ocean (Indian
Sector). Limnology and Oceanography 43, 420-432.
Raven, J. A., Falkowski, P. G., 1999. Oceanic sinks for atmospheric CO2 . Plant Cell and Environment 22,
741-755.
Reimers, C. E., 1987. An in situ microprofiling instrument for measuring interfacial pore water gradients:
methods and oxygen profiles from the North Pacific Ocean. Deep-Sea Research 34, 2019-2035.
Reimers, C. E., Fischer, K. M., Merewether, R., Smith jr. K. L., Jahnke, R. A., 1986. Oxygen microprofiles
measured in situ in deep ocean sediments. Nature 320,741-744.
Reimers, C. E., Jahnke, R. H., McCorkle, D. C., 1992. Carbon fluxes and burial rates over the continental
slope and rise off central California with implications for the global carbon cycle. Global
Biogeochemical Cycles 6, 199-224.
Reimers, C. E., Kalhorn, S., Emerson, S. R., Nealson, K. H., 1984. Oxygen consumption rates in pelagic
sediments from the Central Pacific: First estimates from microelectrode profiles. Geochimica
Cosmochimica Acta 48, 903-910.
Revsbech, N. P., J0rgensen, B. B., 1986. Microelectrodes: Their Use in Microbial Ecology. Advances in
Microbial Ecology 9,293-352.
Revsbech, N. P., J0rgensen, B. B., Blackburn, T. H., 1980. Oxygen in the sea bottom measured with a
microelectrode. Science 207, 1355-1356.
Ribbe, J., 2004. Oceanography: The southern supplier. Nature 427,23-24.
Rowe, G. T., Boland, G. S., Escobar Briones, E. G., Cruz-Kaegi, M. E., Newton, A., Pipenburg, D., Walsh,
I., Deming, J., 1997. Sediment community biomass and respiration in the Northeast Water Polynya,
Greenland: a numerical simulation of benthic lander and spade core data. Journal of Marine
Systems, 10,497-515.
Sarmiento, J. L., Gruber, N., 2002. Anthropogenic Carbon Sinks. Physics Today 55, 30-36.
Sarmiento, J. L., Gruber, N., Brzezinski, M. A., Dunne, J. P., 2004. High-latitude controls of thermocline
nutrients and low latitude biological productivity. Nature 427,56-60.
Sarmiento, J. L., Le Quere, C., 1996. Oceanic carbon dioxide uptake in a model of century-scale global
warming. Science 274,1346-1350.
Sauter, E. J., Sachs, 0., Wegner, J., Baumann, L., Gensheimer, M., 2005. Benthic fluxes around the
Antarctic Front during the austral fall season, in: Smetacek, V., Bathmann, U., Helmke, E. (eds), The
Expeditions ANTARKTIS XXI/3-4-5 of the Research Vessel Polarstern in 2004. Reports on Polar and
Marine Research 500, 218-226.
14
1 Genera/ introduction
Sauter, E. J., SchlOter, M., Suess, E., 2001. Organic carbon flux and remineralization in surface
sediments from the northern North Atlantic derived from pore-water oxygen microprofiles. Deep-Sea
Research I 48, 529-553.
Schlitzer, R, 2002. Carbon export fluxes in the Southern Ocean: results from inverse modeling and
comparison with satellite-based estimates. Deep-Sea Research 1149, 1623-1644.
SchlOter, M., 1991. Organic carbon flux and oxygen penetration into sediments of the Weddell Sea:
indicators for regional differences in export production. Marine Chemistry 35,569-579.
Se iter, K., 2004. Regionalisierung und Quantifizierung benthischer Mineralisationsprozesse. Berichte aus
dem Fachbereich Geowissenschaften der Universitat Bremen 226, 135 p.
Siegenthaler, U., Sarmiento, J. L., 1993. Atmospheric carbon dioxide and the ocean. Nature 365, 119-
125.
Smetacek, V., de Baar, H. J. W., Bathmann, U., Lochte, K., Rutgers van der Loeff, M. M., 1997. Ecology
and biogeochemistry of the antarctic Circumpolar Current during austral spring: a summary of
Southern Ocean JGOFS cruise ANT X/6 of RV. Polarstern. Deep-Sea Research II 44, CD-ROM
data appendix of issue 1-2.
Strass, V., Cisewski, B., Gonzalez, S., Leach, H., Loquay, K.-D., Prandke, H., Rohr, H., Thomas, M.,
2005. The physical setting of the European Iron Fertilization Experiment 'EIFEX' in the Southern
Ocean, in: Smetacek, V., Bathmann, U., Helmke, E. (eds), The Expeditions ANTARKTIS XXI/3-4-5
of the Research Vessel Polarstern in 2004. Reports on Polar and Marine Research 500, 15-50.
Tengberg, A, De Bouvee, F., Hall, P., Berelson, W., Chad wick, B., Cicceri, G., Crassous, P., Devol, A,
Emerson, S., Gage, J., Glud, R, Graziottin, F., Gundersen, J., Hammond, D., Helder, W., Hinga, K.,
Holby, 0., Jahnke, R, Khripounoff, A, Lieberman, H., Nuppenau, V., Pfannkuche, 0., Reimers, C.,
Rowe, G., Sahami, A, Sayles, F., Schurter, M., Smallman, D., Wehrli, B., De Wilde, P., 1995.
Benthic chamber and profile landers in oceanography - A review of design, technical solutions and
functioning. Progress in Oceanography 35, 265-294.
Wenzh6fer, F., Adler, M., Kohls, 0., Hensen, C., Strotmann, B., Boehme, S., Schulz, H. D., 2001a.
Calcite dissolution driven by benthic mineralization in the deep sea: In situ measurements of Ca2+,
pH, pC02 , O2 . Geochimica Cocmochimica Acta 65, 2677-2690.
Wenzh6fer, F., Glud, R, 2002. Benthic carbon mineralization in the Atlantic: a synthesis based on in situ
data from the last decade. Deep Sea Research 149, 1255-1279.
Wenzh6fer, F., Holby, 0., Kohls, 0., 2001 b. Deep penetrating benthic oxygen profiles measured in situ by
oxygen optodes. Deep-Sea Research 148, 1741-1755.
Zielinski, U., Gersonde, R, 1997. Diatom distribution in southern ocean surface sediments (Atlantic
sector): implications for paleoenvironmental reconstructions. Palaeogeography, Palaeociimatology,
Palaeoecology 129, 213-250.
15
J Genera! introduction
16
2 Outline of the manuscripts
This thesis comprises original texts, figures, and tables of three submitted manuscripts.
All of which have been submitted to international peer-reviewed journals (Nature, Deep
Sea Research I, Global Biogeochemical Cycles). Following the review-process, their
final published form might slightly differ from the chapters presented in this work.
The work was carried out at the Alfred Wegener Institute for Polar and Marine Research
in Bremerhaven and at the University of Bremen and was co-funded by the Deutsche
Forschungsgemeinschaft within the Priority Program SPP 1158 (SA 1030/1-1 - 1-4).
Three manuscripts represent the main part of the results compiled during the PhD and
presented in three chapters of this thesis. All manuscripts are linked to each other. A
brief outline of each manuscript is given below. They are all based on own
investigations and were authored by myself as first author.
Chapter 3
Enhanced carbon export to deep-sea sediments underlying productivity hotspots
in the Southern Ocean
O. Sachs, E. J. Sauter, M. SchlUter, I. Peeken, P. Assmy, U. Bathmann, V. H. Strass
and V. Smetacek
Satellite images of the Antarctic Circumpolar Current reveal enhanced chlorophyll
concentrations along the Polar Front. Oxygen uptake rates, a proxy for carbon flux,
measured in situ in deep-sea sediments underlying the chlorophyll band weeks after its
disappearance were threefold higher than in surrounding water. Similarly high values
were recorded in sediments underlying the site of an iron fertilization experiment. We
estimate that at least 10 % of phytoplankton biomass artificially induced by iron addition
reached the deep sea floor. Since carbon input to deep-sea sediments appears to triple
with a doubling of surface biomass, artificial iron fertilization of the Southern Ocean from
this point of view could sequester a significant fraction of current atmospheric CO2
accumulation.
17
2 Olltline olthe manuscripts
Chapter 4
Benthic organic carbon flux and oxygen penetration reflect different plankton
provinces in the Southern Ocean
O. Sachs, E. J. Sauter, M. Schluter, M. M. Rutgers van der Loeff, K. Jerosch, and
O. Holby
The manuscript addresses organic carbon fluxes to the sediment surface of different
regions of the Southern Ocean derived from in situ and ex situ oxygen microprofiles. An
empiric approach to correct ex situ measurements for their potential artefacts is
presented. Furthermore, oxygen penetration depth values were investigated as a
measure for benthic long term carbon input which was found to correlate with diatom
species dominating specific regions of the Southern Ocean. Thus, benthic fluxes
confirm the particularities of regionally dominant diatom species in respect to the
efficiency of carbon export to the deep-sea.
Chapter 5
Spatial variability of the transfer efficiency of primary produced carbon to the
seafloor of the Atlantic Ocean
O. Sachs, J. N. Schwarz, E. J. Sauter, M. SchlOter, and M. Schodlok
This chapter focuses on datasets of benthic oxygen fluxes, satellite-derived primary
production estimates and bathymetry which have been used to derive transfer functions
for the export of carbon from the surface mixed layer to the sea floor. Biogeochemical
provinces defined a priori using surface chlorophyll or sediment characteristics could not
be distinguished by their transfer efficiencies. However, a posteriori definition of
provinces based on the transfer efficiency showed a band of high export efficiency
along the Southern Ocean opal belt and in the northern North Atlantic. Possible
explanations for this are discussed.
18
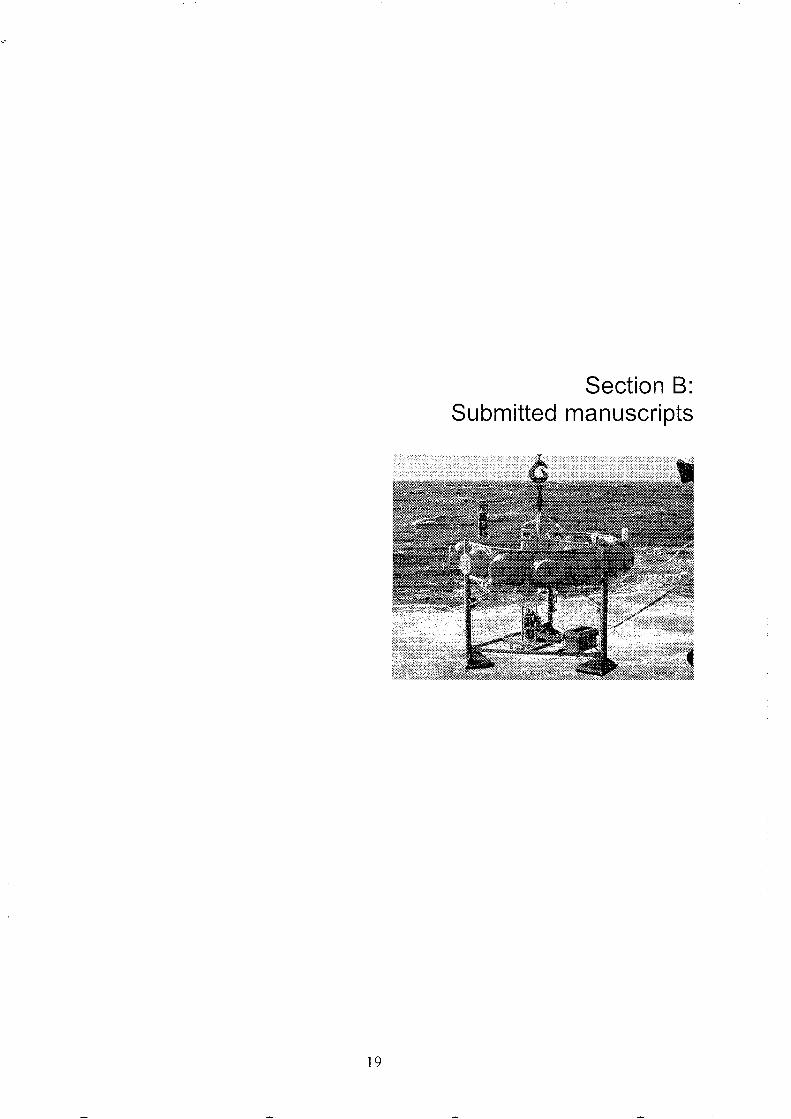
Section B: Submitted manuscripts
19
2 Outline a/the manZ/scripts
20
3 Enhanced carbon export to deep-sea sediments underlying productivity hotspots in the Southern Ocean
Oliver Sachs 1, Eberhard J. Sauter\ Michael Schluter1, Ilka Peeken2, Philipp Assmy\
Ulrich Bathmann \ Volker H. Strass 1 & Victor Smetacek 1
1 Alfred Wegener Institute for Polar and Marine Research, Am Handelshafen 12,
0-27570 Bremerhaven, Germany.
2 IFM - GEOMAR Leibniz Institute of Marine Sciences, Ouestembrooker Weg 20,
0-24105 Kie/, Germany.
3.1 Abstract
The modern Southern Ocean plays a modest role in global air-sea exchange of carbon
dioxide because its low, iron-limited phytoplankton production utilises only a fraction of
nutrients provided by circumpolar upwelling of deep water1-2 . According to the Iron
Hypothesis3, phytoplankton growth rates and the accompanying draw-down of
atmospheric CO2 during glacial cycles were significantly enhanced due to iron
fertilization by 10-fold higher dust input levels in the Southern Ocean than todal.
Whereas local phytoplankton blooms occur naturalll and have been induced by
artificial iron addition in in situ experiments6, the fate of their biomass, which determines
magnitude and duration of carbon sequestration in the deep ocean, is still under
dispute6-7
. We studied the deep-sea floor underlying regions of low and high
productivity, including the site of an iron fertilization experiment conducted a few weeks
earlier, and found compelling evidence of fresh deposition of significant amounts of
organic carbon emanating from surface blooms. Our in situ measurements of
sedimentary carbon fluxes under recurrent high productivity hotspots along the Antarctic
Polar Front are amongst the highest recorded from the ocean. In striking contrast,
carbon deposition under adjoining low-productive waters was much lower. Our findings
support the Iron Hypothesis and identify the Southern Ocean as a potential global-scale,
long-term sink of atmospheric CO2 .
Sachs, 0., Sauter E. 1., Schltiter, M., Peeken, 1., Assmy, P., Bathmann, U., Strass, V. H., Smetacek, V. submitted. Enhanced carbon export to deep-sea sediments underlying productivity hotspots in the Southern Ocean. Nature.
21
3 Enhanced carbon export to deep-sea sediments IInderl)'ing productivitv hotspots in the Southern Ocean
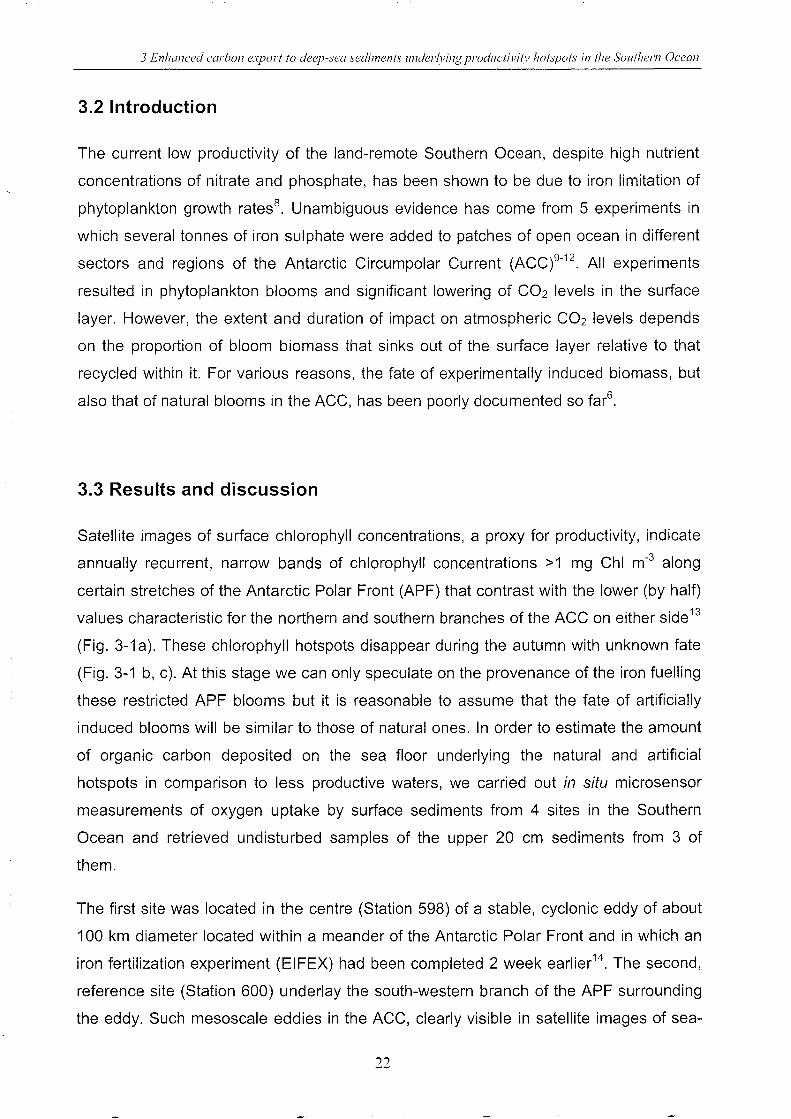
3.2 Introduction
The current low productivity of the land-remote Southern Ocean, despite high nutrient
concentrations of nitrate and phosphate, has been shown to be due to iron limitation of
phytoplankton growth rates8. Unambiguous evidence has come from 5 experiments in
which several tonnes of iron sulphate were added to patches of open ocean in different
sectors and regions of the Antarctic Circumpolar Current (ACC)9-12. All experiments
resulted in phytoplankton blooms and significant lowering of CO2 levels in the surface
layer. However, the extent and duration of impact on atmospheric CO2 levels depends
on the proportion of bloom biomass that sinks out of the surface layer relative to that
recycled within it. For various reasons, the fate of experimentally induced biomass, but
also that of natural blooms in the ACC, has been poorly documented so far6.
3.3 Results and discussion
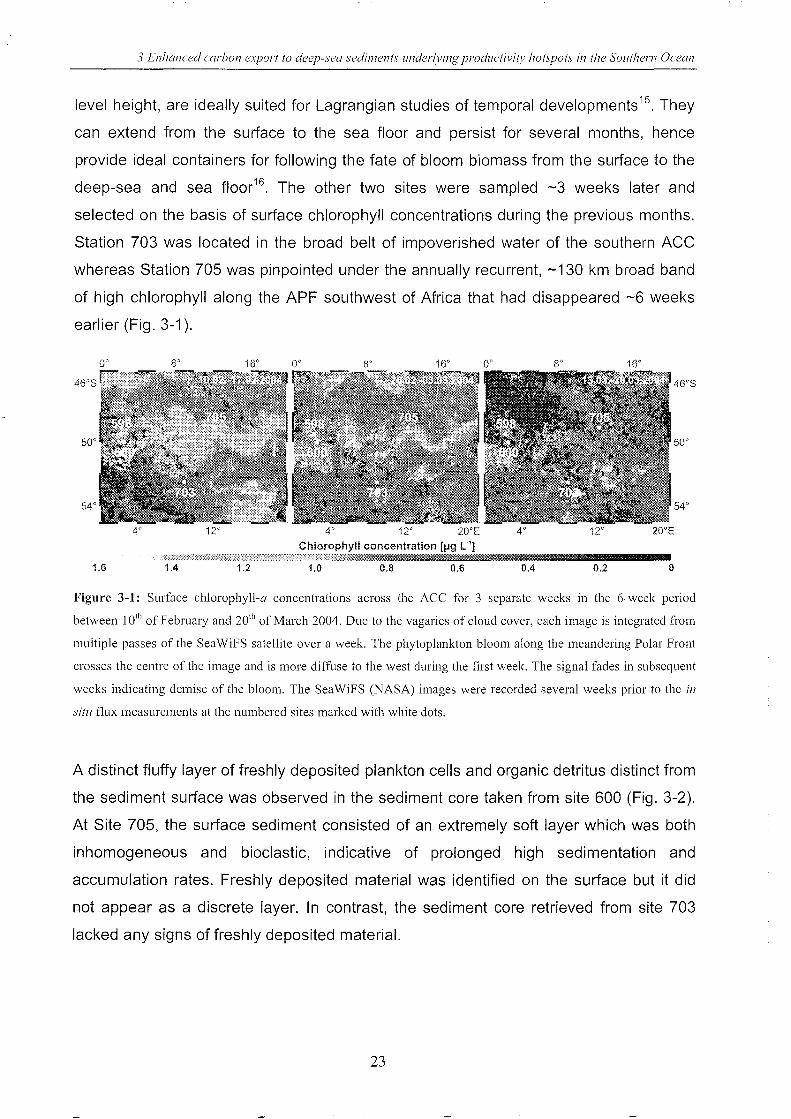
Satellite images of surface chlorophyll concentrations, a proxy for productivity, indicate
annually recurrent, narrow bands of chlorophyll concentrations >1 mg Chi m-3 along
certain stretches of the Antarctic Polar Front (APF) that contrast with the lower (by half)
values characteristic for the northern and southern branches of the ACC on either side 13
(Fig. 3-1 a). These chlorophyll hotspots disappear during the autumn with unknown fate
(Fig. 3-1 b, c). At this stage we can only speculate on the provenance of the iron fuelling
these restricted APF blooms but it is reasonable to assume that the fate of artificially
induced blooms will be similar to those of natural ones. In order to estimate the amount
of organic carbon deposited on the sea floor underlying the natural and artificial
hotspots in comparison to less productive waters, we carried out in situ microsensor
measurements of oxygen uptake by surface sediments from 4 sites in the Southern
Ocean and retrieved undisturbed samples of the upper 20 cm sediments from 3 of
them.
The first site was located in the centre (Station 598) of a stable, cyclonic eddy of about
100 km diameter located within a meander of the Antarctic Polar Front and in which an
iron fertilization experiment (EIFEX) had been completed 2 week earlier14. The second,
reference site (Station 600) underlay the south-western branch of the APF surrounding
the eddy. Such mesoscale eddies in the ACC, clearly visible in satellite images of sea-
22
3 Enhanced carbon export to deep-sea sediments lInderlving prodllctivitv hotspots in the Southern Ocean
level height, are ideally suited for Lagrangian studies of temporal developments 15. They
can extend from the surface to the sea floor and persist for several months, hence
provide ideal containers for following the fate of bloom biomass from the surface to the
deep-sea and sea floor16. The other two sites were sampled -3 weeks later and
selected on the basis of surface chlorophyll concentrations during the previous months.
Station 703 was located in the broad belt of impoverished water of the southern ACC
whereas Station 705 was pinpointed under the annually recurrent, -130 km broad band
of high chlorophyll along the APF southwest of Africa that had disappeared -6 weeks
earlier (Fig. 3-1).
46"S
50"
54"
4" 12" 4" 12' 20"E 4' 12" 200E
Chlorophyll concentration [1-19 L"l :X·if'?,:':,"i:ntc-;--:X;:t;)';'}'}}ii':{;'-::{'·/(';:-:)::':'·' .... ·~·-:·\~~~'-:.~!lffi~~~~ ___ ~~!iIl1IIIl!!iIl1IIIl!1I!!!!I111!!!!1111!!!!1111!!!!11111i1111l11111i1111l1111111111111
1.6 1.4 1.2 1.0 0.8 0.6 0.4 0.2 0
Figure 3-1: Surface chlorophyll-a concentrations across the ACC for 3 separate weeks in the 6-week period
between 10th of February and 20th of March 2004. Due to the vagaries of cloud cover, each image is integrated from
multiple passes of the Sea W iFS satellite over a week. The phytoplankton bloom along the meandering Polar Front
crosses the centre of the image and is more diffuse to the west during the first week. The signal fades in subsequent
weeks indicating demise of the bloom. The SeaWiFS (NASA) images were recorded several weeks prior to the in
situ flux measurements at the numbered sites marked with white dots.
A distinct fluffy layer of freshly deposited plankton cells and organic detritus distinct from
the sediment surface was observed in the sediment core taken from site 600 (Fig. 3-2).
At Site 705, the surface sediment consisted of an extremely soft layer which was both
inhomogeneous and bioclastic, indicative of prolonged high sedimentation and
accumulation rates. Freshly deposited material was identified on the surface but it did
not appear as a discrete layer. In contrast, the sediment core retrieved from site 703
lacked any signs of freshly deposited material.
23
3 Enhanced carbon export to deep-sea sedil1lents 1ll1derll'ing prodllctil'i(l' hot~pots in the SOllthern Ocean
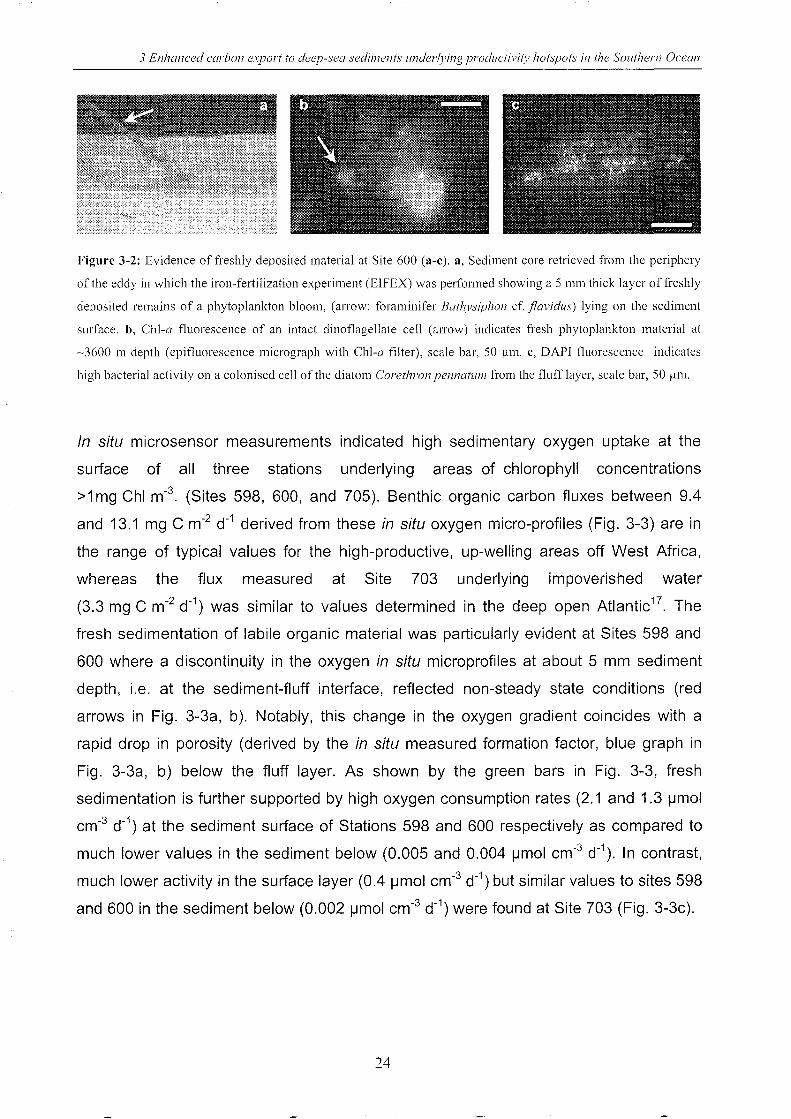
Figure 3-2: Evidence of freshly deposited material at Site 600 (a-c). a, Sediment core retrieved from the periphery
of the eddy in which the iron-fertilization experiment (EIFEX) was performed showing a 5 mm thick layer of freshly
deposited remains of a phytoplankton bloom, (arrow: foraminifer Bathysiphon cf. flavidus) lying on the sediment
surface. b, ChI-a fluorescence of an intact dinoflagellate cell (arrow) indicates fresh phytoplankton material at
~3600 m depth (epifluorescence micrograph with ChI-a filter), scale bar, 50 flm. e, DAPI fluorescence indicates
high bacterial activity on a colonised cell of the diatom Corethron pellnatUI11 from the fluff layer, scale bar, 50 11111.
In situ microsensor measurements indicated high sedimentary oxygen uptake at the
surface of all three stations underlying areas of chlorophyll concentrations
>1 mg Chi m-3. (Sites 598, 600, and 705). Benthic organic carbon fluxes between 9.4
and 13.1 mg C m-2 d-1 derived from these in situ oxygen micro-profiles (Fig. 3-3) are in
the range of typical values for the high-productive, up-welling areas off West Africa,
whereas the flux measured at Site 703 underlying impoverished water
(3.3 mg C m-2 d-1) was similar to values determined in the deep open Atlantic17
. The
fresh sedimentation of labile organic material was particularly evident at Sites 598 and
600 where a discontinuity in the oxygen in situ microprofiles at about 5 mm sediment
depth, i.e. at the sediment-fluff interface, reflected non-steady state conditions (red
arrows in Fig. 3-3a, b). Notably, this change in the oxygen gradient coincides with a
rapid drop in porosity (derived by the in situ measured formation factor, blue graph in
Fig. 3-3a, b) below the fluff layer. As shown by the green bars in Fig. 3-3, fresh
sedimentation is further supported by high oxygen consumption rates (2.1 and 1.3 ~mol
cm-3 d-1) at the sediment surface of Stations 598 and 600 respectively as compared to
much lower values in the sediment below (0.005 and 0.004 IJmol cm-3 d-1). In contrast,
much lower activity in the surface layer (0.4 IJmol cm-3 d-1) but similar values to sites 598
and 600 in the sediment below (0.002 IJmol cm-3 d-1) were found at Site 703 (Fig. 3-3c).
24
·1
0
~2 E 2.3 .c .... g-4 "0
1: 5 Q)
E :.0 6 Q)
(f) 7
8
9
0
3 Enhanced carbon export to deep-sea sediments under/ping productivitl' hot.lpots in the SOllfhern Ocean
Oxygen [~MJ
100 200 300 0
Site 598, 9.11 mg C n1" cl" 3942 m
Oxygen [f.lM] Oxygen [I-lMJ Oxygen [f.lMJ
100 200 300 0 100 200 300 0 100 200 300
Site 600, BArng C rn: d' 3589 m
+-__ -L __ ~ ____ + +----L---~---+.1
Site 703, 33 mg ern:' d' 3330 m
Site 705,
2 (f1 (!> 0..
3 3' (!>
4 ;:!. 0..
S.g s:
60' 3 7 ......
8
13.1 mgC m' el" 9 4293 m
10+--~~-.---,---+ +---,--,---.--+10 0.4 0.0 0.2 0.4 0.6 0.8 0.0 0.1 0.2 0.3 0.4 0.0 0.1 0.2 0.3 0.4 0.0 0.2
0, consumption 0,. consumptkm [!Jn1o! cm' d'} [pmol cm"
I I i I I i I I I i j I
0.7 0.8 0.9 1.0 0.7 0.8 0.9 1.0 0.7 0.8 0.9 1.0
0.3 0;, consumption
[pmoi cm' d'1 I ill
0.7 0.8 0.9 1.0
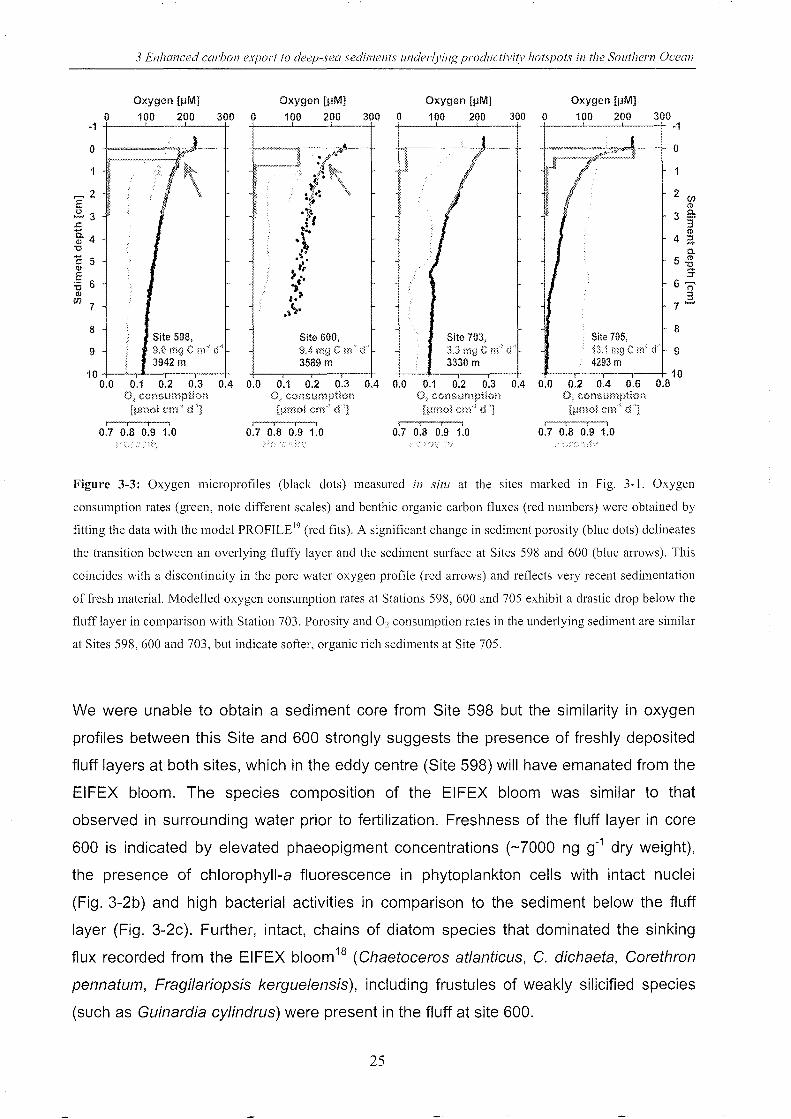
Figure 3-3: Oxygen microprofiles (black dots) measured in sitl! at the sites marked in Fig. 3-1. Oxygen
consumption rates (green, note different scales) and benthic organic carbon fluxes (red numbers) were obtained by
fitting the data with the model PROFILE I9 (red fits). A significant change in sediment porosity (blue dots) delineates
the transition between an overlying fluffy layer and the sediment surface at Sites 598 and 600 (blue aHows). This
coincides with a discontinuity in the pore water oxygen profile (red arrows) and reflects very recent sedimentation
of fresh material. Modelled oxygen consumption rates at Stations 598, 600 and 705 exhibit a drastic drop below the
fluff layer in comparison with Station 703. Porosity and O2 consumption rates in the underlying sediment are similar
at Sites 598,600 and 703, but indicate softer, organic rich sediments at Site 705.
We were unable to obtain a sediment core from Site 598 but the similarity in oxygen
profiles between this Site and 600 strongly suggests the presence of freshly deposited
fluff layers at both sites, which in the eddy centre (Site 598) will have emanated from the
EIFEX bloom. The species composition of the EIFEX bloom was similar to that
observed in surrounding water prior to fertilization. Freshness of the fluff layer in core
600 is indicated by elevated phaeopigment concentrations (-7000 ng g-1 dry weight),
the presence of chlorophyll-a fluorescence in phytoplankton cells with intact nuclei
(Fig. 3-2b) and high bacterial activities in comparison to the sediment below the fluff
layer (Fig. 3-2c). Further, intact, chains of diatom species that dominated the sinking
flux recorded from the EIFEX bloom 18 (Chaetoceros at/anticus, C. dichaeta, Corethron
pennatum, Fragi/ariopsis kergue/ensis), including frustules of weakly silicified species
(such as Guinardia cy/indrus) were present in the fluff at site 600.
25
3 Enhanced carbon export to deep-sea sediments 1ll7derlving prodllctivitv hotspots ill the SOl/them Ocean
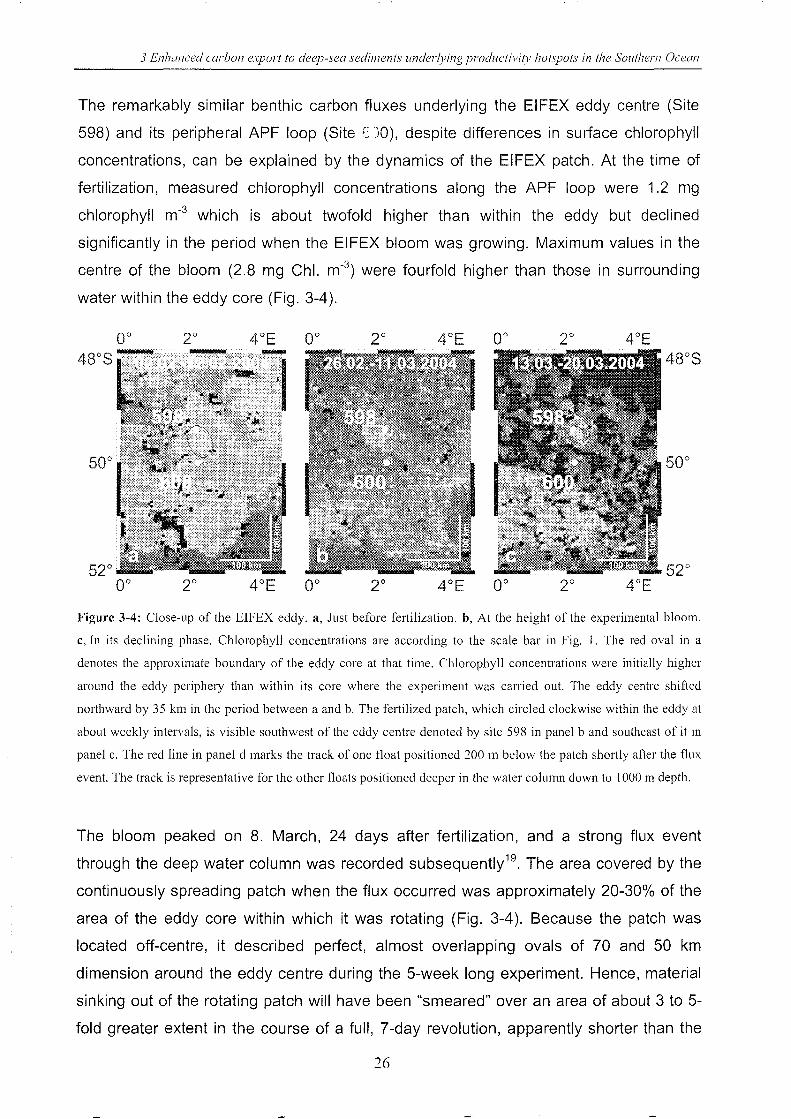
The remarkably similar benthic carbon fluxes underlying the EIFEX eddy centre (Site
598) and its peripheral APF loop (Site C 10), despite differences in surface chlorophyll
concentrations, can be explained by the dynamics of the EIFEX patch. At the time of
fertilization, measured chlorophyll concentrations along the APF loop were 1.2 mg
chlorophyll m-3 which is about twofold higher than within the eddy but declined
significantly in the period when the EIFEX bloom was growing. Maximum values in the
centre of the bloom (2.8 mg ChI. m-3) were fourfold higher than those in surrounding
water within the eddy core (Fig. 3-4).
Figure 3-4: Close-up of the EIFEX eddy. a, Just before fertilization. b, At the height of the experimental bloom.
C, In its declining phase. Chlorophyll concentrations are according to the scale bar in Fig. 1. The red oval in a
denotes the approximate boundary of the eddy core at that time. Chlorophyll concentrations were initially higher
around the eddy periphelY than within its core where the experiment was carried out. The eddy centre shifted
northward by 35 km in the period between a and b. The fertilized patch, which circled clockwise within the eddy at
about weekly intervals, is visible southwest of the eddy centre denoted by site 598 in panel b and southeast of it in
panel c. The red line in panel d marks the track of one float positioned 200 111 below the patch shortly after the flux
event. The track is representative for the other floats positioned deeper in the water column down to 1000 m depth.
The bloom peaked on 8. March, 24 days after fertilization, and a strong flux event
through the deep water column was recorded subsequently 19. The area covered by the
continuously spreading patch when the flux occurred was approximately 20-30% of the
area of the eddy core within which it was rotating (Fig. 3-4). Because the patch was
located off-centre, it described perfect, almost overlapping ovals of 70 and 50 km
dimension around the eddy centre during the 5-week long experiment. Hence, material
sinking out of the rotating patch will have been "smeared" over an area of about 3 to 5-
fold greater extent in the course of a full, 7-day revolution, apparently shorter than the
26
3 Enhanced carbon export to deep-sea sediments 1l11derl)!ing prodllctivitv hotspots in the SOllthem Ocean
flux event. In contrast, material sinking out of the peripheral APF frontal jet (Site 600)
will have been deposited as a band beneath it and not "smeared" over a more extensive
sediment area. Thus, although surface chlorophyll concentrations along the APF were
lower than in the centre of the EIFEX patch, the amount of fluff deposited on the
underlying sediments was about the same as within the eddy. In other words, without an
EIFEX bloom a fluff layer would not have been deposited in the impoverished eddy
core.
At Site 705, where the highest fluxes were measured (13.1 mg C m-2 d-1), the
smoothness of the oxygen depth profile (Fig. 3-3d) indicates a steady state system
characterised by enhanced, long term influx of organic carbon. In contrast, the fluff
layers at sites 598 and 600 appear not to be a recurrent feature. The shallow oxygen
penetration depth (OPD) of -10 cm at Site 705 contrasts with Sites 598, 600 and 703
where oxygen concentrations extrapolated from the microprofiles penetrate at least
>40 cm into the sediment. These are, to our knowledge, the first published in situ flux
data for the SO. Previous ex situ observations of low OPD values in sediment samples
from the APF are in good agreement with our in situ fluxes at Site 70520-21
.
A conservative estimate of the amount of carbon deposited from the surface blooms can
be derived from measured benthic carbon fluxes and consideration of the spatial
kinetics of the patch. From the satellite images and measurements carried out around
the EIFEX eddy prior to fertilization, we know that the fresh material at Sites 600 and
705 were deposited at about the same time and derived from blooms of roughly similar
magnitude (1-2 mg chlorophyll m-3 in an 80-100 m deep mixed surface layer). This
corresponds to a phytoplankton biomass of approximately 4 g carbon m-2, at a C:Chl
ratio of 30 determined from the EIFEX bloom. Carbon fluxes at the sediment / water
interface at all sites were approximately 10 mg m-2 d-1. Since measurements at site 600
were carried out two weeks and at site 705 five weeks after deposition of the fresh
material we assume that the measured benthic carbon fluxes prevailed for at least
35 days which results in a flux estimate of 350 mg C for this time period. This is a
minimum estimate as we do not know for how long these fluxes lasted. These
calculations indicate that at least 10% of organic carbon built up by the surface bloom
was deposited as fluff on the deep sea floor.
27
3 Enhanced carbon export to deep-sea sediments 1I11derlvillg prodllctivit)' hotspots in the SOllthern Ocean
3.4 Conclusions
Our data indicate that a significant portion of the biomass of natural and artificially
induced blooms reaches the underlying deep-sea floor within weeks after
disappearance from the surface. Rapid sinking of surface blooms and deposition as fluff
on the sea floor has been described for the North Atlantic22 and is probably due to
diatom cells and chains aggregating into fast-sinking flocks that trigger the mass
sinking23. The proportion of organic carbon produced in the surface layer that is
deposited on the underlying deep-sea floor appears to triple with doubling of chlorophyll
concentrations above about 0.5 mg Chi m-3. The amount buried, reflected in depth of
oxygen penetration, depends on degree of recurrence of surface blooms. Higher levels
of dust input during glacials4 will have resulted in much higher productivity and hence
more intense burial of organic carbon over much larger areas than today. This is
corroborated by the high abundances of Chaetoceros resting spores - an indicator of
higher productivity - in glacial ACC sediments of the Atlantic sector as compared to
todal4. It follows that an iron-fertilized ACC, whether naturally by dust or artificially by
ferrous sulphate, is capable of sequestering a significant portion of atmospheric carbon
dioxide in surface sediments for time scales exceeding those of deep-sea ventilation,
i.e. well in excess of 1000 years.
3.5 Methods
3.5.1 Study site
During expedition ANT XXI/4 of R/V "Polarstern" (27.03.-06.05.200425) in situ
measurements and sampling was performed at four locations close to the Antarctic
Polar Front (Tab. 3-1).
28
3 Enhanced carbon export to deep-sea sedil7lents 1Inder/ping pl'od1lctivitF hotspots in the SOllthern Ocean
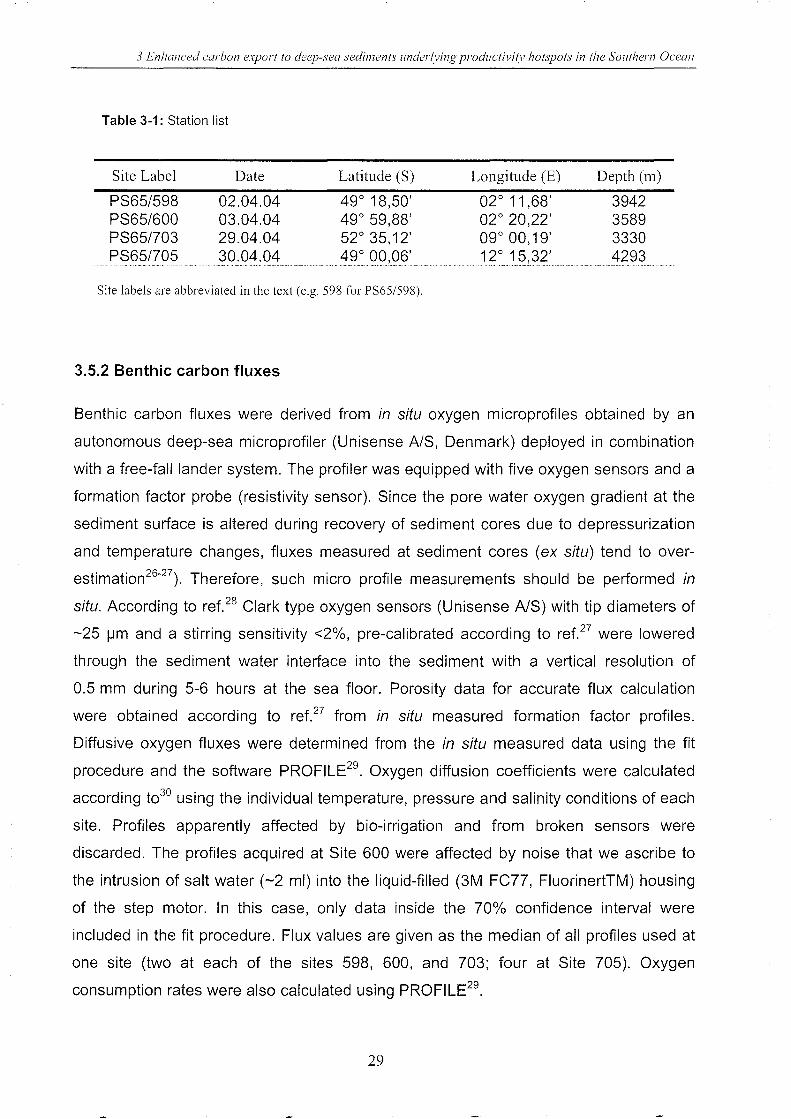
Table 3-1: Station list
Site Label
PS65/598 PS65/600 PS65/703 PS65/705
Date
02.04.04 03.04.04 29.04.04 30.04.04
Latitude (S)
49° 18,50' 49° 59,88' 52° 35,12' 49° 00,06'
Site labels are abbreviated in the text (e.g. 598 for PS65/598).
3.5.2 Benthic carbon fluxes
Longitude (E)
02° 11,68' 02° 20,22' 09° 00,19' 12° 15,32'
Depth (m)
3942 3589 3330 4293
Benthic carbon fluxes were derived from in situ oxygen microprofiles obtained by an
autonomous deep-sea microprofiler (Unisense A/S, Denmark) deployed in combination
with a free-falllander system. The profiler was equipped with five oxygen sensors and a
formation factor probe (resistivity sensor). Since the pore water oxygen gradient at the
sediment surface is altered during recovery of sediment cores due to depressurization
and temperature changes, fluxes measured at sediment cores (ex situ) tend to over
estimation26-27 ). Therefore, such micro profile measurements should be performed in
situ. According to ref.28 Clark type oxygen sensors (Unisense NS) with tip diameters of
-25 I-lm and a stirring sensitivity <2%, pre-calibrated according to ref.27 were lowered
through the sediment water interface into the sediment with a vertical resolution of
0.5 mm during 5-6 hours at the sea floor. Porosity data for accurate flux calculation
were obtained according to ref.27 from in situ measured formation factor profiles.
Diffusive oxygen fluxes were determined from the in situ measured data using the fit
procedure and the software PROFILE29. Oxygen diffusion coefficients were calculated
according t030 using the individual temperature, pressure and salinity conditions of each
site. Profiles apparently affected by bio-irrigation and from broken sensors were
discarded. The profiles acquired at Site 600 were affected by noise that we ascribe to
the intrusion of salt water (-2 ml) into the liquid-filled (3M FC77, FluorinertTM) housing
of the step motor. In this case, only data inside the 70% confidence interval were
included in the fit procedure. Flux values are given as the median of all profiles used at
one site (two at each of the sites 598, 600, and 703; four at Site 705). Oxygen
consumption rates were also calculated using PROFILE29.
29
3 Enhanced carbon export to deep-sea sediments underzving productivity hotspots in the Southem Ocean
3.5.3 Sediment sampling
For sediment sampling a multiple corer with a core diameter of 10 cm was deployed31 .
Apparently undisturbed sediment cores were obtained at sites 600, 703, and 705. At
Site 59S no sediment was retrieved despite repeated efforts. Upon recovery, sediment
samples were immediately segmented into 1 cm slices in the shipboard cool laboratory.
The top centimetre was cut into two slices of 5 mm. Sediment samples were shock
frozen in liquid nitrogen and stored at -SO ac. If present, fluff was sampled separately by
pipette, shock frozen and stored at -soac. A portion of the fluff was preserved in
hexamine-buffered formaline solution (2%) and stored at 4 ac.
3.5.4 Sediment investigations
Samples were examined by light and epifluorescence microscopy revealing chl-a in
cells of phototrophic dinoflagellates, single cells and chains of diatoms with intact nuclei
(made visible by 4',6-0iamidino-2-phenylindoldihydrochloride (OAPI) staining). High
bacterial activities were observed by OAPI staining in formaline fixed fluff samples.
Fluff and sediment samples for light microscopy investigations were transferred into
Utermohl chambers and onto microscope slides. Samples were filtered over Black
Nuclepore® membranes (Whatman, pore size O.S IJm.) for epifluorescence microscopy
Pigment analyses were performed by high performance liquid chromatography (HPLC).
For analytical preparation, 1 cm 3 of sediment was mixed with 50 IJI of internal standard
(canthaxanthin) and 1 ml of glass beads (1 mm diameter). This mixture was extracted
3 times with 2 ml acetone in a cell mill for 3 minutes. After centrifugation (10 minutes at
4000 U min-1 and 0 ac) the extracts were unified and concentrated on an Alltech C1S™
solid phase extract clean column. Pigments were eluted with 1 00% acetone and further
concentrated under nitrogen atmosphere in the dark to a final volume of 0.3 ml. Finally,
pigments were measured with a Waters ™ HPLC system according to ref.12.
30
3 Enhanced carbo/1 export to deep-sea sedil1lents underlying prodllctivitl' hotspots in the Southern Ocean
3.5.5 APEX floats
Four autonomous profiling APEX (Autonomous Profiling EXplorer) floats were deployed
below the fertilized patch at depths of 200m, 300 m, 500 m and 1000 m. before
departure from the EIFEX experimental site 14. The floats ascend to the surface once
every 2 days and transmit their data to satellite for about 10 hours before sinking back
to their parking depth.
3.6 References
1. Falkowski, P. G., Barber, R. T. & Smetacek, V. Biogeochemical controls and feedbacks on ocean
primary production. Science 281, 200-206 (1998).
2. Sarmiento, J. L., Gruber, N., Brzezinski, M. A. & Dunne, J. P. High-latitude controls of thermocline
nutrients and low latitude biological productivity. Nature 427, 56-60 (2004).
3. Martin, J. H. Glacial-interglacial CO2 changes: the iron hypothesis. Pale oceanography 5, 1-13 (1990).
4. Wolff, E. W. et al. Southern Ocean sea-ice extent, productivity and iron flux over the past eight glacial
cycles. Nature 440, 491-496 (2006).
5. Smetacek, V., de Baar, H. J. W., Bathmann, U.V., Lochte, K. & Rutgers van der Loeff, M. M. Ecology
and biogeochemistry of the Antarctic Circumpolar Current during austral spring: a summary of
Southern Ocean JGOFS cruise ANT X/6 of R.V. Polarstern. Deep-Sea Res. 11 44, 1-21 (1997).
6. Boyd et al. A synthesis of mesoscale iron-enrichment experiments 1993-2005: key findings and
implications for ocean biogeochemistry. Science (in press).
7. Zeebe, R. E. & Archer, D. Feasibility of ocean fertilization and its impact on future atmospheric CO2
levels. Geophys. Res. Left. 32, L09703 (2005).
8. Smetacek, V., Assmy, P. & Henjes, J. The role of grazing in structuring Southern Ocean pelagic
ecosystems and biogeochemical cycles. Antarct. Sci. 16,541-558 (2004).
9. Boyd, P. W. et al. A mesoscale phytoplankton bloom in the polar Southern Ocean stimulated by iron
fertilization. Nature 407, 695-702 (2000).
10. Gervais, F., Riebesell, U. & Gorbunov, M. Y. Changes in primary productivity and chlorophyll a in
response to iron fertilization in the Southern Polar Frontal Zone. Limnol. Oceanogr. 47, 1324-1335
(2002).
11. Coale, K. H. et al. Southern Ocean Iron Enrichment Experiment: Carbon Cycling in High- and Low-Si
Waters. Science 304, 408-414 (2004).
12. Hoffmann, L., Peeken, I., Lochte, K., Assmy, P. & Veldhuis, M. Different reactions of Southern Ocean
phytoplankton size classes to iron fertilization. Limnol. Oceanogr. 51, 1217-1229 (2006).
13. Moore, J. K. & Abbott, M. R. Surface chlorophyll concentrations in relation to the Antarctic Polar
Front: seasonal and spatial patterns from satellite observations. J. Mar. Syst. 37,69-86 (2002).
14. Strass, V. et al. in The Expeditions ANTARKTlS XXI/3-4-5 of the Research Vessel "Polarstern" in
2004 (eds Smetacek, V., Bathmann, U., Helmke, E.) Rep. Polar Mar. Res. 500, 15-46 (2005).
31
3 Enhanced carbon export to deep-sea sediments under/l'ing prodllctivitl' hotspots in the SOllthem Ocean
15. Cisewski, B., Strass, V. H. & Prandke, H. Upper ocean vertical mixing in the Antarctic Polar Front
Zone. Deep-Sea Res. 11 52, 1087-1108 (2005).
16. Bryden, H. L. in: Eddies in marine science (ed Robinson, A. R) 265-277 (Springer, Heidelberg and
New York, 1983).
17. Wenzhbfer, F. & Glud, R N. Benthic carbon mineralization in the Atlantic: a synthesis based on in situ
data from the last decade. Deep-Sea Res. 149, 1255-1279 (2002).
18. Assmy et al. Mass species-specific sinking of diatom populations from an iron-fertilized open ocean
phytoplankton bloom. Nature (in prep).
19. Strass et al. Rapid vertical flux of particles to the deep sea from an artificially induced Southern
Ocean phytoplankton bloom. Nature (in prep).
20. Rutgers van der Loeff, M. M. & Berger, G. W. Scavenging and particle flux: seasonal and regional
variations in the southern ocean (Atlantic sector). Mar. Chem. 35, 553-568 (1991).
21. Schluter, M., Sauter, E. J., Schulz-Bull, D., Balzer, W. & Suess, E. in: The northern North Atlantic: a
changing environment (eds Schafer, P., Ritzrau, W., Schluter, M. & Thiede, J.) 225-240 (Springer,
Berlin, 2001).
22. Billett, D. S. M., Lampitt, R S., Rice, A. L., & Mantoura, R F. C. Seasonal sedimentation of
phytoplankton to the deep-sea benthos. Nature 302, 520-522 (1983).
23. McCave, I. N. Vertical flux of particles in the ocean. Deep-Sea Res. 22, 491-502 (1975).
24. Abelmann, A., Gersonde, R, Cortese, G., Kuhn, G. & Smetacek, V. Extensive phytoplankton blooms
in the Atlantic sector of the glacial Southern Ocean. Pale oceanography 21, PA 1013 (2006).
25. Sauter, E. J., Sachs, 0., Wegner, J., Baumann, L. & Gensheimer, M. in The Expeditions ANTARKTlS
XXI/3-4-5 of the Research Vessel "Polarstern" in 2004 (eds Smetacek, V., Bathmann, U., Helmke, E.)
Rep. Polar Mar. Res. 500, 218-226 (2005).
26. Glud, RN., Gundersen, J. K., J0rgensen, B. B., Revsbech, N. P. & Schulz, H. D. Diffusive and total
oxygen uptake of deep-sea sediments in the eastern South Atlantic Ocean: in situ and laboratory
measurements, Deep-Sea Res. 141, 1767-1788 (1994).
27. Sauter, E. J., Schluter, M. & Suess, E. Organic carbon flux and remineralization in surface sediments
from the northern North Atlantic derived from pore-water oxygen microprofiles. Deep-Sea Res. 148,
529-553 (2001).
28. De Beer, D. et al. In situ fluxes and zonation of microbial activity in surface sediments of the Hakon
Mosby Mud Volcano. Limnol. Oceanogr. 51, 1315-1331 (2006).
29. Berg, P., Risgaard-Petersen, N. & Rysgaard, S. Interpretation of measured concentration profiles in
sediment pore water. Limnol. Ocenogr. 43, 1500-1510 (1998).
30. Boudreau, B. P. Diagenetic models and their implementation (Springer, Berlin, 1997).
31. Barnett, P. R. 0., Watson, J. & Conelly, D. A multiple corer for taking virtually undisturbed samples
from shelf, bathyal, and abyssal sediments. Oceanol. Acta 7,399-408 (1984).
Acknowledgements We thank captain and crew of RN "Polarstern" for their assistance during
Expedition ANT XX1/4. We are grateful to L. Baumann, M. Gensheimer, and A. Kahler for laboratory work,
J. Wegner for technical assistance and K. Stumm for help with fluorescence microscopy. P. Berg and H.
R0Y are acknowledged for their support with profile modelling. We appreciate the assistance of J.N.
32
3 Enhanced carbon export to deep-sea sediments ill/deriVing productivitl' 11Otspots il/ the SOllthem Ocean
Schwarz with Fig. 3-3 and comments on the manuscript. We thank the SeaWiFS Project and the
Distributed Active Archive Center at the Goddard Space Flight Center for the production and distribution
of these data, respectively. These activities are sponsored by NASA's Mission to Planet Earth Program.
This work has been supported by grants from the Deutsche Forschungsgemeinschaft (to O.S. and
E.J.S.).
Author contributions O.S. and E.J.S. carried out the field work, data evaluation, and manuscript
preparation. M.S. contributed to the flux determination and manuscript preparation. O.S. performed
pigment analyses together with I.P. and P.A. provided data from EIFEX. U.B. was chief scientist of the
cruise and provided the chl-a satellite images. V.H.S. was responsible for physical measurements during
EIFEX. V.S. led EIFEX and contributed substantially to preparation of the manuscript.
Competing interests statement The authors declare that they have no competing financial interests.
Correspondence and requests for materials should be addressed E.J.S. ([email protected]) or
V.S. ([email protected]).
33
3 Enhanced carbon export to deep-sea sediments 1I11derZving prodl/ctivitv hotspots in the SOl/them Ocean
34
4 8enthic organic carbon flux and oxygen penetration reflect different plankton provinces in the Southern Ocean
Oliver Sachsa*, Eberhard J. Sautera, Michael SchlOtera, Michiel M. Rutgers van der
Loeff, Kerstin Jeroscha, Ola Holbl
aAlfred Wegener Institute for Polar and Marine Research, Am Handelshafen 12,
D-27568 Bremerhaven, Germany
bDepartment of Environmental and Energy Systems, Karlstad University, SE-651
88 Karlstad, Sweden
*Corresponding author: Oliver Sachs
Key words: benthic organic carbon fluxes, deep-sea sediments, Southern Ocean,
microsensors, oxygen penetration depth
4.1 Abstract
Based on the comparison between benthic oxygen fluxes derived from oxygen
microprofiles measured at sediment cores (ex situ) and by means of free falling lander
systems (in situ), a correction function was set up that was applied on existing ex situ
flux data in order to revise the database for the Southern Ocean. Organic carbon fluxes
range from 0.5 to >35 mgC m-2 d-1. Oxygen microprofiles were measured at 134 sites in
different sub-regions mainly of the Atlantic Sector of the Southern Ocean. Oxygen
penetration depths and benthic organic carbon fluxes were derived from the profiles and
investigated in respect to regional characteristics. In the Scotia Sea (-3000 m water
depth) oxygen penetration depths of less than 15 cm were observed in deep-sea
sediments. In contrast, the oxic zone extends to several decimetres in abyssal
sediments of the Weddell Sea and south-eastern South Atlantic. The depth of
oxygenation reflecting sedimentary long term organic matter influx was found to be
correlated with diatom key species characterizing different regions of the surface ocean.
From the partly very high fluxes derived from micro sensor data it can be concluded that
episodic and seasonal sedimentation pulses are important for carbon supply to the sea
floor even at great depths.
Sachs, 0., Sauter E. 1., Schluter, M., Rutgers van der Loeff, M., Jerosch, K., Holby, 0., submitted. Benthic organic carbon flux and oxygen penetration reflect different plankton provinces in the Southern Ocean. Deep-Sea Research 1.
35
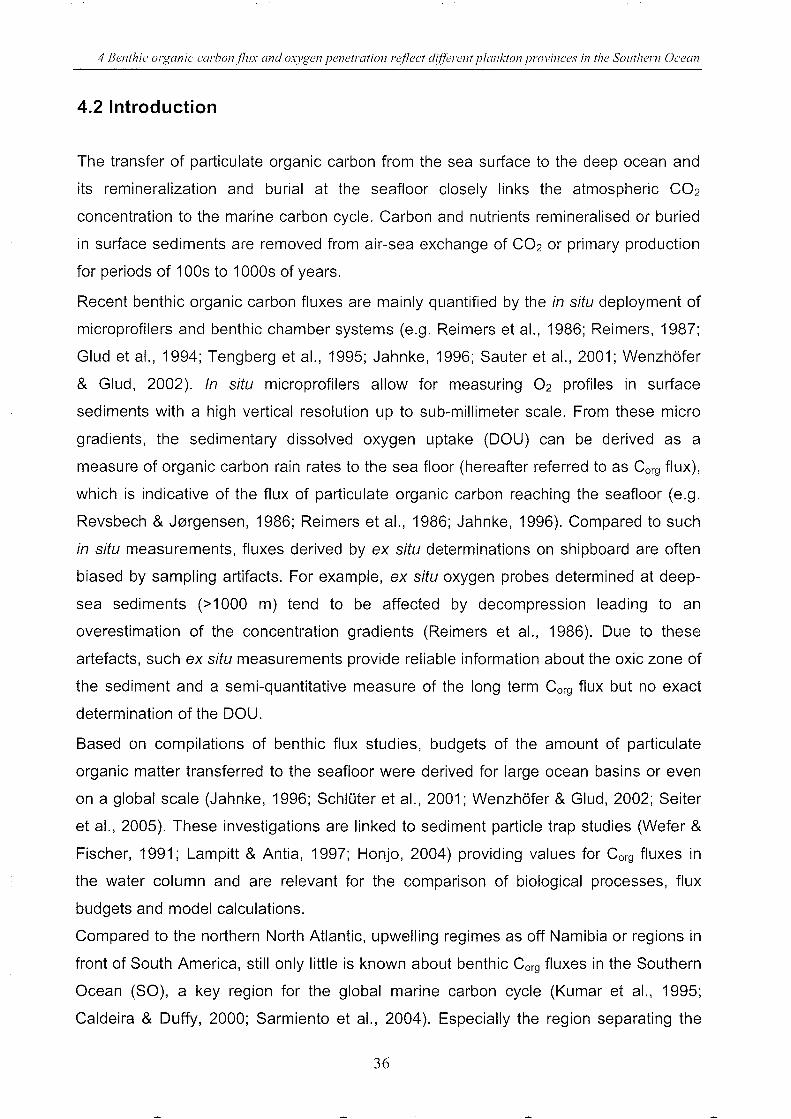
4 Benthie organic carbon/7ux and oxygen penetration reflect different plankton provinces in the Southern Ocean
4.2 Introduction
The transfer of particulate organic carbon from the sea surface to the deep ocean and
its remineralization and burial at the seafloor closely links the atmospheric CO2
concentration to the marine carbon cycle. Carbon and nutrients remineralised or buried
in surface sediments are removed from air-sea exchange of CO2 or primary production
for periods of 1 OOs to 1000s of years.
Recent benthic organic carbon fluxes are mainly quantified by the in situ deployment of
microprofilers and benthic chamber systems (e.g. Reimers et aI., 1986; Reimers, 1987;
Glud et aI., 1994; Tengberg et aI., 1995; Jahnke, 1996; Sauter et aI., 2001; Wenzhofer
& Glud, 2002). In situ microprofilers allow for measuring O2 profiles in surface
sediments with a high vertical resolution up to sub-millimeter scale. From these micro
gradients, the sedimentary dissolved oxygen uptake (DOU) can be derived as a
measure of organic carbon rain rates to the sea floor (hereafter referred to as Corg flux),
which is indicative of the flux of particulate organic carbon reaching the seafloor (e.g.
Revsbech & J0rgensen, 1986; Reimers et aI., 1986; Jahnke, 1996). Compared to such
in situ measurements, fluxes derived by ex situ determinations on shipboard are often
biased by sampling artifacts. For example, ex situ oxygen probes determined at deep
sea sediments (>1000 m) tend to be affected by decompression leading to an
overestimation of the concentration gradients (Reimers et aI., 1986). Due to these
artefacts, such ex situ measurements provide reliable information about the oxic zone of
the sediment and a semi-quantitative measure of the long term Corg flux but no exact
determination of the DOU.
Based on compilations of benthic flux studies, budgets of the amount of particulate
organic matter transferred to the seafloor were derived for large ocean basins or even
on a global scale (Jahnke, 1996; Schloter et aI., 2001; Wenzhofer & Glud, 2002; Seiter
et aI., 2005). These investigations are linked to sediment particle trap studies (Wefer &
Fischer, 1991; Lampitt & Antia, 1997; Honjo, 2004) providing values for Corg fluxes in
the water column and are relevant for the comparison of biological processes, flux
budgets and model calculations.
Compared to the northern North Atlantic, upwelling regimes as off Namibia or regions in
front of South America, still only little is known about benthic Corg fluxes in the Southern
Ocean (SO), a key region for the global marine carbon cycle (Kumar et aI., 1995;
Caldeira & Duffy, 2000; Sarmiento et aI., 2004). Especially the region separating the
36
4 Benthic organic carbon/lzlx and oxvgen penetration reflect different plankton provinces in the SOllthem Ocean
Antarctic and Subantarctic zone (ASZ), referred to as the biogeochemical divide
(Martinov et al., 2006), and seems to have a crucial impact in respect to the present and
past global CO2 cycle. Considering the Atlantic sector of the Southern Ocean, only a
limited number of studies investigated Corg fluxes in the ASZ region via sediment
particle traps (e.g. Wefer & Fischer, 1991; de Baar et ai., 1995; Smetacek et al., 1997;
Bathmann et al., 1997; Fischer et al., 2000, 2002) or radio nuclide tracers (Rutgers van
der Loeff et al., 1997). Data on Corg fluxes reaching the seafloor of the ASZ are based
on a very limited number of O2 microprofiles and sediment incubations (Schluter, 1991;
Hulth et al., 1997; Smetacek et al., 1997; De Witt et al., 1997; Rabouille et al., 1998;
SchlOter et ai., 2001). Accurate flux data derived from in situ oxygen microprofile
measurements were not available for this area until now. Instead, only ex situ
measurements were reported so far. Due to the lack of data, the Southern Ocean south
of 60° was excluded from the global carbon budgets derived by Jahnke (1996) and
Seiter et al. (2005).
In this paper we present new results including the first in situ oxygen measurements
reported for the SO, derived from measurements of oxygen profiles in surface
sediments and a compilation of more than 134 oxygen profiles (Rutgers van der Loeff,
1990a; Schluter, 1990; Rutgers van der Loeff & Berger, 1991; SchlOter, 1991; Smetacek
et al., 1997; de Wit et al., 1997; Rabouille et al., 1998; Sachs et al., subm.). This study
of in situ and ex situ flux data is complemented by additional unpublished data sets
obtained during previous field expeditions (1986-1990, 1992-1994, 2004) to the Mid
Atlantic Ridge region (Holby, 1994), Amundsen and Bellingshausen Seas (Holby, 1996),
the Antarctic Peninsula region, the Scotia and Weddell Seas and the east Antarctic
shelf (Fig. 4-1 ).
Based on a comparison of in situ with ex situ oxygen profiles a correction function for ex
situ data previously measured in Southern Ocean sediments was established. This
allows us to estimate organic carbon fluxes reaching the seafloor for sites were ex situ
measurements are available and obtain a retrospective data analysis correcting existing
benthic oxygen and Corg fluxes as well as oxygen penetration depth values (OPD, the
oxygenated zone in sediment). In a second step regional differences of particulate
organic matter fluxes were considered for the region south of 40° S. The combined
dataset allows for considering the specific pattern, e.g. with respect to the biogenic silica
cycle, of particulate organic matter fluxes reaching the seafloor. The compilation of
these data significantly improves the data basis and our understanding of regional
37
4 Benthic orgal1ic carbol1flux and oxygen penetration reflect different planktol1 provinces il1 the Southern Ocean
differences of benthic fluxes in the Southern Ocean.
160W 120W 80cW 40'W 0 40"E 80"E 120'E 160E
Figure 4-1: For the region from the Amundsen and Bellingshausen Seas (west of the Antarctic Peninsula) to the
Crozet Basin (600 E) oxygen profile measurements of surface sediments were compiled. In total 134 sites were
considered, x indicating in sitz! sites. This includes new measurements as well as previously published data (Tab. 4-
1). The Antarctic Polar Front (white line) is given according to Orsi et al. (1995).
4.3 Materials and methods
In this study, data derived from measurement of oxygen profiles in surface sediments
from different sources were compiled and considered: a) In situ and ex situ
measurements were performed during the Polarstern Expedition ANT XXI/4 (Sachs et
al., subm.) on a latitudinal transect across the Antarctic Polar Front system. b) Ex situ
and two in situ datasets obtained during the Polarstern Expeditions (ANT V/4, ANT VI/2-
3, ANT VIII/3 & 6, ANT X/5-6, ANT XI/3) to the Amundsen and Bellingshausen Seas
(Pacific Sector) as well as the Atlantic sector of the Antarctic Circumpolar Current, the
Scotia and Weddell Seas, the east Antarctic shelf and continental slope. These data
previously considered with respect to the depth of the oxic habitat within the sediment
(Rutgers van der Loeff, 1990a; SchlUter, 1990; Schluter et al., 2001), were now used for
flux determination and the revised investigation of the regional patterns of OPD values.
In total 134 microprofiles were considered for OPD studies in different regions of the
Southern Ocean whereas 96 were suited to derive Corg flux values from (Tab. 4-1).
38
4 Benthic organic carbonflux and oxvgel7 penetration reflect difFerent plankton pl'Ovinces in the Southern Ocean
4.3.1 Measurements of in situ and ex situ oxygen microprofiles
In situ oxygen microprofiles were measured during Expeditions ANT X/6 (Holby, 1994,
Fig. 4-2) and ANT XXI/4 (Sachs et al., subm.) by means of a deep-sea microprofiler.
Mainly due to ice coverage and frequent rough weather conditions, these are the first in
situ oxygen microprofile measurements published for the Southern Ocean.
Microprofilers were equipped with up to five pressure compensated Clark type oxygen
sensors with a tip diameter of -25 I-lm and a stirring sensitivity <2%. Sensors were pre
calibrated according to Sauter et al. (2001). During -5-6 hours at the sea floor, sensors
were lowered through the water-sediment interface into the sediment with a vertical
resolution of 0.5 mm. A Niskin bottle mounted onto the lander frame and closing in
concert with the lander's releaser provided bottom water for sensor re-calibration. For
porosity determination, the microprofilers were also equipped with a resistivity sensor
(formation factor probe).
Oxygen diffusion coefficients were calculated according to Boudreau (1997) using the
individual in situ temperature recorded by a current meter (Aanderaa, Norway) mounted
onto the lander frame. Diffusive in situ oxygen fluxes were determined from the
uppermost 3-4 mm of the pore water oxygen profiles using the software PROFILE (Berg
et al., 1998). The fit curve (Fig. 4-2) of measured oxygen profiles were computed by the
model PROFILE.
39
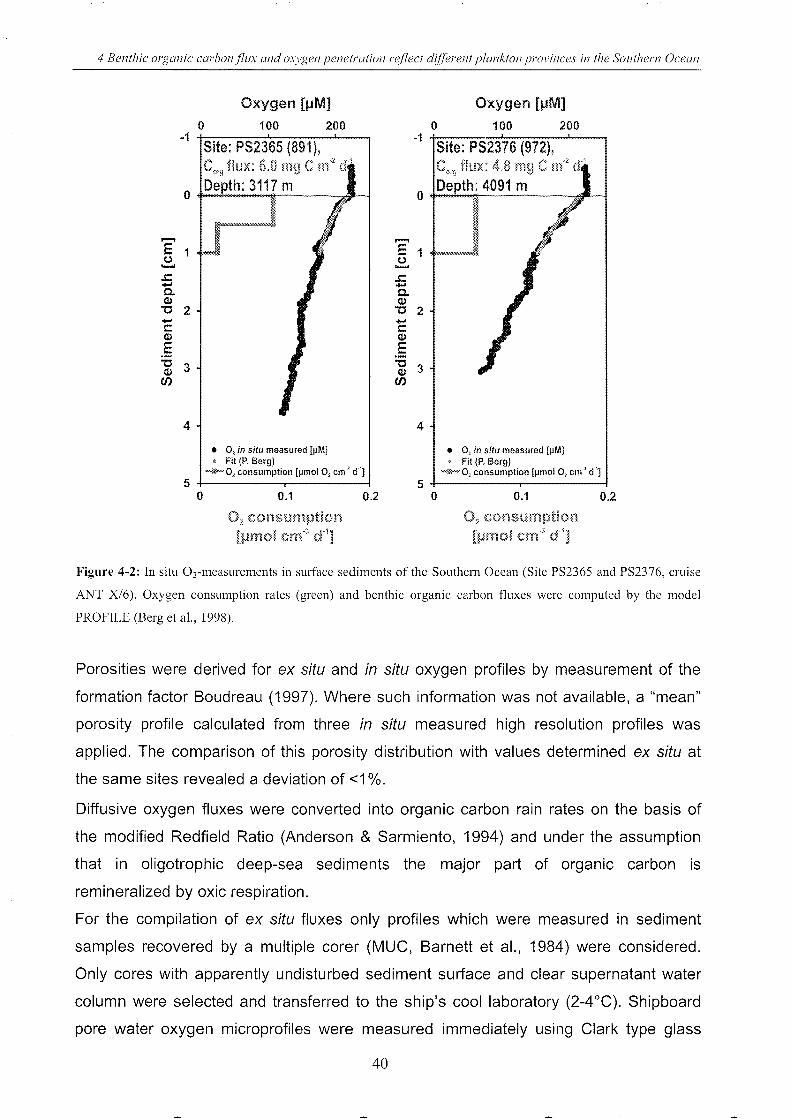
4 Benthic organic carbon flux and oxygen penetration reflect different plankton provinces in the Southern Ocean
Oxygen [~M] Oxygen [!-IM] 0 100 200 0 100 200
·1 Site: PS2365 (891),
-1 Site: PS2376 (972),
flux: 6.0 mg C 111" C,.", flux: 4J3
0 th: 3117 m
0 De th: 4091 m
,..... ....... E 1 E 1 0 0 ...... ......
..c: ..c: ..... ..... 0... 0. Q) Q) "0 2 "0 2 ..... ... t: t: Q) Q)
E E "0 3 "0 3 Q) Q)
en en
4 4
• 0, in situ measured [tJMJ • 0, in situ measured [J.lM] • Fit (p. Berg) • Fit (P, Berg)
--0, consumption [J.lmol 0, cm" d"l --0, consumption [J.lmol 0, cm" d"l 5 5
0 0.1 0.2 0 0.1 0.2
O2 consumption O2 consumption [!Jmo! cm<; d·1
] [pmo! cm" cl']
Figure 4-2: In situ OTmeasurements in surface sediments of the Southern Ocean (Site PS2365 and PS2376, cruise
ANT X/6). Oxygen consumption rates (green) and benthic organic carbon fluxes were computed by the model
PROFILE (Berg et al., 1998).
Porosities were derived for ex situ and in situ oxygen profiles by measurement of the
formation factor Boudreau (1997). Where such information was not available, a "mean"
porosity profile calculated from three in situ measured high resolution profiles was
applied. The comparison of this porosity distribution with values determined ex situ at
the same sites revealed a deviation of <1 %.
Diffusive oxygen fluxes were converted into organic carbon rain rates on the basis of
the modified Redfield Ratio (Anderson & Sarmiento, 1994) and under the assumption
that in oligotrophic deep-sea sediments the major part of organic carbon is
remineralized by oxic respiration.
For the compilation of ex situ fluxes only profiles which were measured in sediment
samples recovered by a multiple corer (MUC, Barnett et al., 1984) were considered.
Only cores with apparently undisturbed sediment surface and clear supernatant water
column were selected and transferred to the ship's cool laboratory (2-4 CC). Shipboard
pore water oxygen microprofiles were measured immediately using Clark type glass
40
4 Benthic organic carbon/lux and oxygen penetration reflect difFerent plankton provinces in the SOllthern Ocean
microelectrodes similar to those applied for in situ measurements. In a few cases,
especially when the oxygen penetration depth exceeded several decimetres, Clark type
steel-needle probes were applied. Microelectrodes were calibrated prior to each
measurement against the bottom water oxygen concentration determined by Winkler
titration (Grasshoff et al., 1983) and oxygen-free seawater. The microelectrodes were
mounted into a micromanipulator and profiles were measured with a vertical resolution
of 0.1 to 2 mm. Oxygen measurements were conducted down to as much as 32 cm. At
cores where the anoxic zone was not reached by the measurement, OPO was
estimated by fitting a double exponential function to the oxygen profile.
Except the study of Sachs et al. (subm.), all of the published deep-sea studies of the SO
represent ex situ measurements, which tend to considerably over-estimate benthic
fluxes (e. g. Reimers et al., 1986; Glud et al., 1994 and 1999; Sauter et al., 2001). This
is mainly due to pressure release and, if the sample comes from warm or temperate
regions, temperature artifacts which may occur during sediment recovery. Whereas the
oxygen gradient at the water-sediment interface is very sensitive against such artifacts,
the thickness of the oxic zone within surface sediments (i.e. the oxygen penetration
depth) is much more robust in this respect and offers an additional indication for benthic
carbon fluxes (Rutgers van der Loeff, 1990a; Cai & Sayles, 1996; Schloter et al., 2001).
In addition OPO values measured from box corer sub-samples were gathered in the
years 1986, 1987 and 1988 from the Weddell Sea and Antarctic shelf region. No flux
values were taken from such samples due to the potentially poor preservation of the
sediment surface.
Specific observations were made at two particular sediment samples: (1) Sediments at
site PS65/600-2 were covered by a consistent 5 mm thick fluff layer (Sachs et al.,
subm.). (2) At site PS1782 Rutgers van der Loeff (1990b) and Rutgers van der Loeff &
Berger (1991) describe "extremely fluid sediment" from a high accumulation area in
5016 m depth. It should be mentioned here that in case of fluff present on top of the
sediment, the flux correction is misleading since the bacterial activity and the diffusion is
changing dramatically with sediment depth. Similarly, a correction cannot be given for
"liquid" or "extremely fluid" sediments as suggested by in situ and ex situ investigations
of Arctic deep-sea sediments (Molloy Hole, Fram Strait, 5400 m depth, Sauter and
Sachs, unpublished). Oue to the given specific sediment consistency, Corg fluxes were
not corrected for these particular SO sites. However, the OPO value was used in both
cases.
41
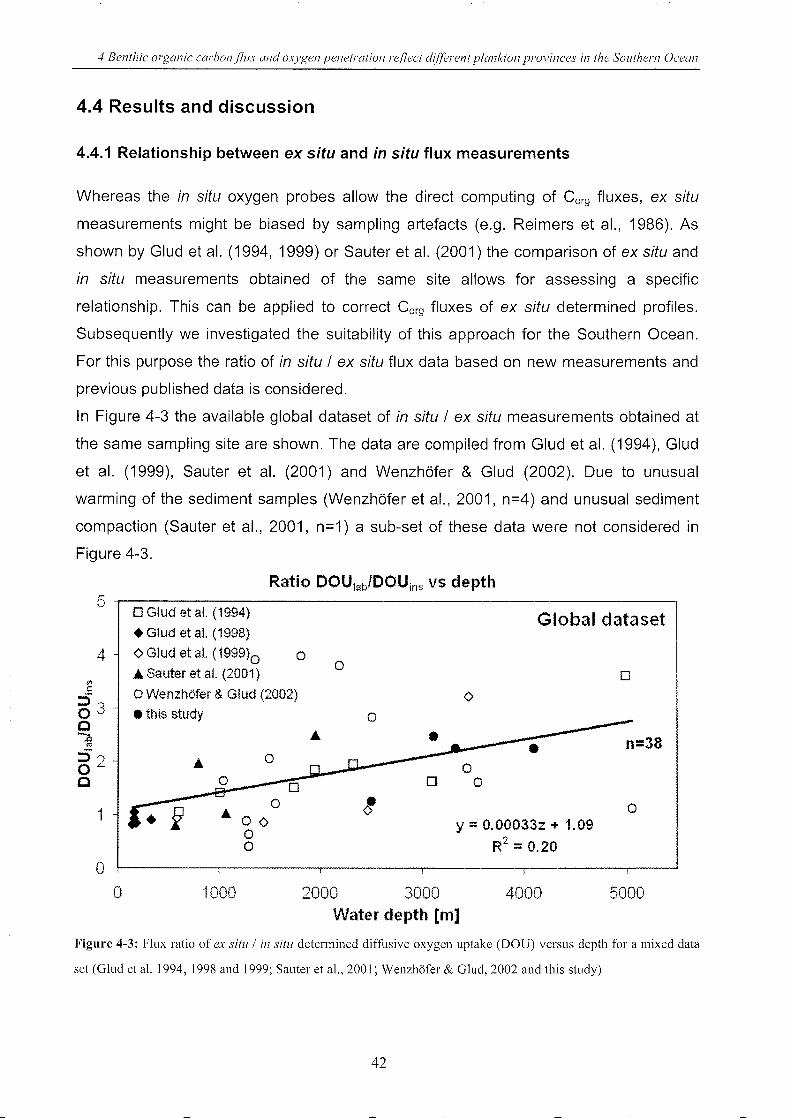
4 Benthic organic carbon/lux and oxvgel1 penetration reflect different plal1kton provinces in the Southern Ocean
4.4 Results and discussion
4.4.1 Relationship between ex situ and in situ flux measurements
Whereas the in situ oxygen probes allow the direct computing of Corg fluxes, ex situ
measurements might be biased by sampling artefacts (e.g. Reimers et al., 1986). As
shown by Glud et al. (1994, 1999) or Sauter et al. (2001) the comparison of ex situ and
in situ measurements obtained of the same site allows for assessing a specific
relationship. This can be applied to correct Corg fluxes of ex situ determined profiles.
Subsequently we investigated the suitability of this approach for the Southern Ocean.
For this purpose the ratio of in situ / ex situ flux data based on new measurements and
previous published data is considered.
In Figure 4-3 the available global dataset of in situ / ex situ measurements obtained at
the same sampling site are shown. The data are compiled from Glud et al. (1994), Glud
et al. (1999), Sauter et al. (2001) and Wenzh6fer & Glud (2002). Due to unusual
warming of the sediment samples (Wenzh6fer et al., 2001, n=4) and unusual sediment
compaction (Sauter et al., 2001, n=1) a sub-set of these data were not considered in
Figure 4-3.
Ratio DOUlab/DOUins vs depth 5 .-------------------------------------------------------, o Glud et al. (1994)
4 -
1
• Glud et al. (1998)
<> Glud et at. (1999)0 0 ... Sauter et al. (2001)
o Wenzhofer & Glud (2002)
• this study
o
... 0 <> o o
o o
o
o
o
Global dataset
<>
y = 0.00033z + 1.09 R2 = 0.20
o
n=38
o
o +---------.---------~---------,---------.----------.---~ o 1000 2000 3000 4000 5000
Water depth [m]
Figure 4-3: Flux ratio of ex sitl! / in sitl! determined diffusive oxygen uptake (DOU) versus depth for a mixed data
set (Glud et al. 1994, 1998 and 1999; Sauter et al., 2001; WenzhOfer & Glud, 2002 and this study)
42
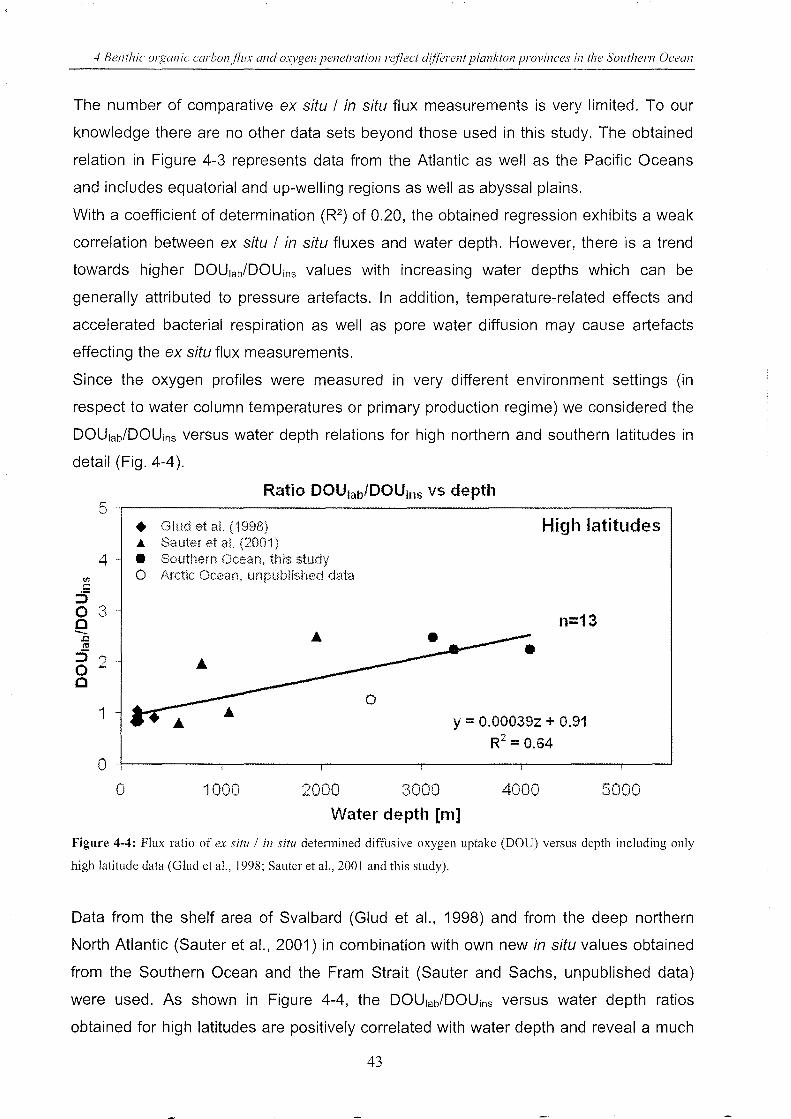
4 Benthic organic carbon/7ux and oxvgen penetration re/7ect difFerent plankton provinces in the SOl/them Ocean
The number of comparative ex situ I in situ flux measurements is very limited. To our
knowledge there are no other data sets beyond those used in this study. The obtained
relation in Figure 4-3 represents data from the Atlantic as well as the Pacific Oceans
and includes equatorial and up-welling regions as well as abyssal plains.
With a coefficient of determination (R2) of 0.20, the obtained regression exhibits a weak
correlation between ex situ I in situ fluxes and water depth. However, there is a trend
towards higher DOUlab/DOUins values with increasing water depths which can be
generally attributed to pressure artefacts. In addition, temperature-related effects and
accelerated bacterial respiration as well as pore water diffusion may cause artefacts
effecting the ex situ flux measurements.
Since the oxygen profiles were measured in very different environment settings (in
respect to water column temperatures or primary production regime) we considered the
DOU1ab/DOUins versus water depth relations for high northern and southern latitudes in
detail (Fig. 4-4).
(t)
:: :5
5
4
O ') '-.cl
o -. "§
:5" o L
o
1
o o
Ratio DOUlab/DOUins vs depth
• Glud et aL (1998) ... Sauter et aL (2001)
High latitudes
• Southern Ocean, this study o Arctic Ocean, unpublished data
o
1000 2000 3000
n=13
y = 0.00039z + 0.91
R2 = 0.64
4000 Water depth [m]
5000
Figure 4-4: Flux ratio of ex situ / in situ determined diffusive oxygen uptake CDOU) versus depth including only
high latitude data (Glud et al., 1998; Sauter et al., 2001 and this study).
Data from the shelf area of Svalbard (Glud et al., 1998) and from the deep northern
North Atlantic (Sauter et al., 2001) in combination with own new in situ values obtained
from the Southern Ocean and the Fram Strait (Sauter and Sachs, unpublished data)
were used. As shown in Figure 4-4, the DOUlab/DOUins versus water depth ratios
obtained for high latitudes are positively correlated with water depth and reveal a much
43
4 Benthic organic carbonflux al1d oxvgen pel1ctratiol1 reflect difFerent plankton provinces in the SOllthern Ocean
stronger correlation with a coefficient of determination of 0.64. The depth-dependent
correction function derived for the high latitude regression is
DOUlailDOUcorr = 0.00039 . z + 0.91 (1)
z being the water depth [m] and DOUcorr being the calculated Corg flux [mgC m-2 d-1] as
expected to be measured in situ. From equation (1), literature ex situ flux data can be
corrected as follows:
OOUcorr = DOU1ab . (0.00039 . z + 0.91 r1 (2)
One focus of this paper was to correct literature and own ex situ measurements
according to the above explained correction function. The corrected fluxes are listed in
the Table 4-1 together with sampling techniques and biological provinces of the site of
sampling (classification see below).
44
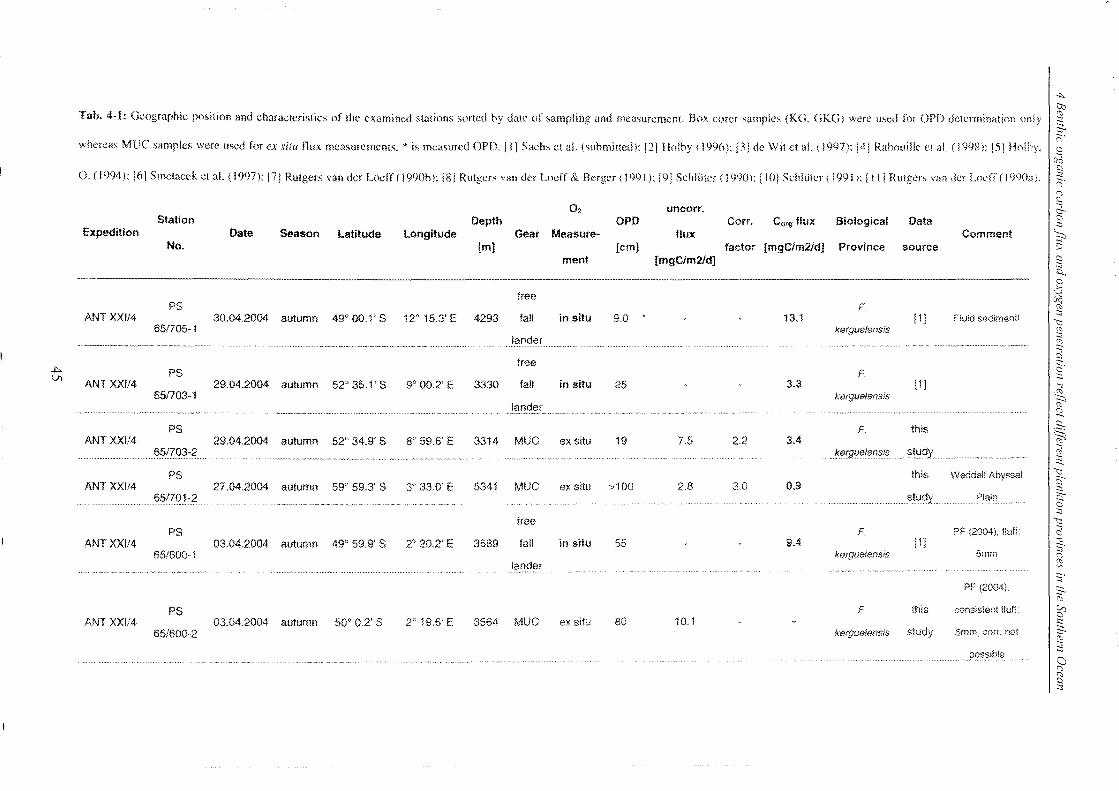
Tab. 4·1: Geographic posi1inn and characteristics of the examined stalinns sorted by dale PI' sampling and measurement.. Box corer samples (KG, GKG) wen: used for OrD determination
whereas MUC samples were used for ex situ nux measurements, * is measured OPD, III Sachs el aL {suhmitted}: [21 Bolh)' ( 1996); [.'I; de Wit et aL !. ! 9(7): 141 Rabouilk et al. (199R I; 151 Hnlhy,
0, (1994): 16] Smelacl~k et aL (1997): PI Rutgers van def LoelT ( J990b): I RI Rutgers van der Lneff &. Bergcr ( 1991): [91 Schlii[cr (l990i; f 10] SchliHer( 199!): I! l] Rutgers van de[ Locff (I 990a).
02 uncorr. Station Depth OPD Con. COrlJ flux Biological Data
Expedition Date Season latitude Longitude Gear Measure- flux Comment No. [m] [cm] factor [mgCfm2!dJ Province source
men! [mgCfm2ld]
--~.--............ ,--- ---.-.......... __ ........ ............... -.... -............. -.~~.--." ..• " .................... -
free PS F.
ANT XXI/4 30,04.2004 autumn 49" 00.1' S 12" 15.3' E 4293 fall in situ 9.0 13,1 [11 FlUid sediment! 651705-1 kergl.1elensis
!ander
free -f::.. PS F. Vl
ANT XXI!4 29,04.2004 autumn 52" 35. i' S 90 00.2' E 3330 faU in situ 25 3,3 [1] 651703-1 kerguelensis
lander ··'w.,···,·v .. ¥ •• ,· •• ~ •••• ,
PS F. this ANT XXU4 29.04.2004 autumn 52" 34.9' S 8" 59.6' E 3314 MUG ex situ 19 7.5 2.2 3,4
651703-2 k,erg!Jf!lerj!sis.
PS this Weddell Abyssal ANT XX!l4 27.04.2004 autumn 59" 59.3' S 3" 33.0' E 5341 MUC ex situ >100 2,8 3.0 0,9
?:?!79..1..~? study Plain
free PS F. pr (2004). fluff:
ANT XX!!4 03.04.2004 autumn 49" 59,9' S 2" 20.2' E 3589 fall in situ 55 9A 11] 65/600-1 kerguelensis 5mrn
lander
pr (2004).
PS F. this consislent fluff:
ANT XX!!4 03.04.2004 autumn 50" 0.2' S 2" 19,6' E 3564 MUC ex situ 80 10.1 65/600-2 kerguelensis study 5mm. COff. not
.... J)ossible
"" to ~ ::; ;::;" co ~ § (:)"
" Sl :::l-~ ~ ~
§ s:::"., co
~ ~ ~ ~
'" ~ g' .~ Q
~ ~ ;;; ~
't;:j
§ ~ Cl ~
~
~. ~
" re '" s· ~
::0-re
g ~ ()
" re l::l ~
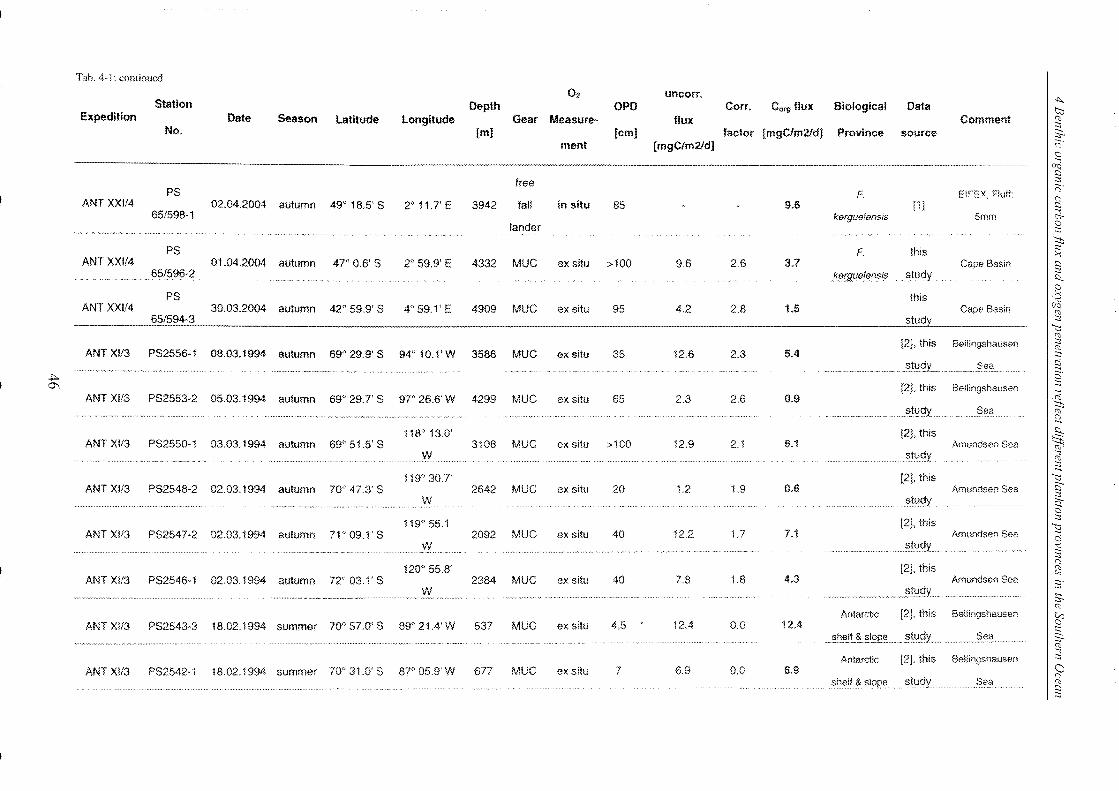
Tah. 4-1: continued
02 uncorr. ~ Station Depth OPD Corr. C,,'9 flux Biological Data b:1 Expedition Date Season Latitude Longitude Gear Measure- flux Comment re :::;
No. [m] [cm] factor [mgC/m2ld) Province source ~ ment [mgC/m2ld] " a
(}~ l:l
free :::;
PS F. EiFEX. Fluff: ;:;.
ANT XXI/4 02.04.2004 autumn 49" 18.5' S 2" 11.7' E 3942 fal! in situ 85 9.6 111 " 2 65/598-1 kerguelensis Smm c:;;..
lander ~
PS ~ F this ~
ANT XXf/4 01.04.2004 autumn 47" OB S 2" 59.9' E 4332 MUG ex situ >100 9.6 2.6 3.7 Cape Basin 2 ... .65/;'i96-2 kerguelensi$ study ~
a PS this .~
ANT XXI/4 30.03.2004 autumn 42" 59.9' S 4°59.1'E 4909 MUG ex situ 95 4.2 2.8 1.5 Cape Basin 0 (1)
65/594-3 :::; 'I::s
(1)
[2J, this Bellingshauson :::;
ANT :>{1/3 (1)
PS2556-1 08.03.1994 autumn 69" 29.9' S 94" 1O.1'W 3586 MUC ex situ 35 12.6 2.3 5.4 :::-Sea g.
~ § 0\ (2]. this Bellingshausen
ANTXI!3 PS2553-2 05.03.1994 autumn 69° 29.7' S 97" 26.6'W 4299 MUG ex situ 65 2,3 2.6 0.9 ~ SillY)! .. (1)
Q 118° 13.0' [2], this ~ ANT XI/3 PS2550-1 03.03.1994 autumn 69" 51.5' S 3108 MUC ex situ >100 12.9 2.1 6.1 Amundsen Sea ~
.. :o;tlJt.ly .. '" ~ 119" 30.7' [2], this "(:::
ANT Xl/3 PS2548-2 02.03.1994 autumn 70" 47.3' S 2642 MUG ex situ 20 1.2 1.9 0.6 Amundsen Sea i? "tllclY
::; >;-
1190 55.1 [2J, this §
"(::: ANT Xl/3 PS2547·2 02.03.1994 autumn 71"09.1'S 2092 MUC ex situ 40 12.2 1.7 7.1 Amundsen Sea d
:::. :::;
1200 55.8' (2], this I~ v, ANT Xl/3 PS2546·1 02.03.1994 autumn 72" 03.1' S 2384 MUG ex situ 40 7.8 1.8 4.3 Amundsen Sea
~
-. ~ (1)
Antarctic [2J, this 8ellingshausen ~ ANT Xl/3 PS2543-3 18.02.1994 summer 70'" 57.0' S 890 21.4' W 537 MUC ex situ 45 12.4 0.0 12.4 .. 5.ll.eJt?:.~I.2fl~ .. _.~!l1.9L .. -.
~
CS Antarctic (2J, this Bellingshausen ::::
ANT XII3 PS2542·1 18.02.1994 summer 70" 31,0' S 87"'059'W 677 MUC e)( situ 7 6,9 0.0 6,9 a " si)elf&slope. stlJdy (1)
§
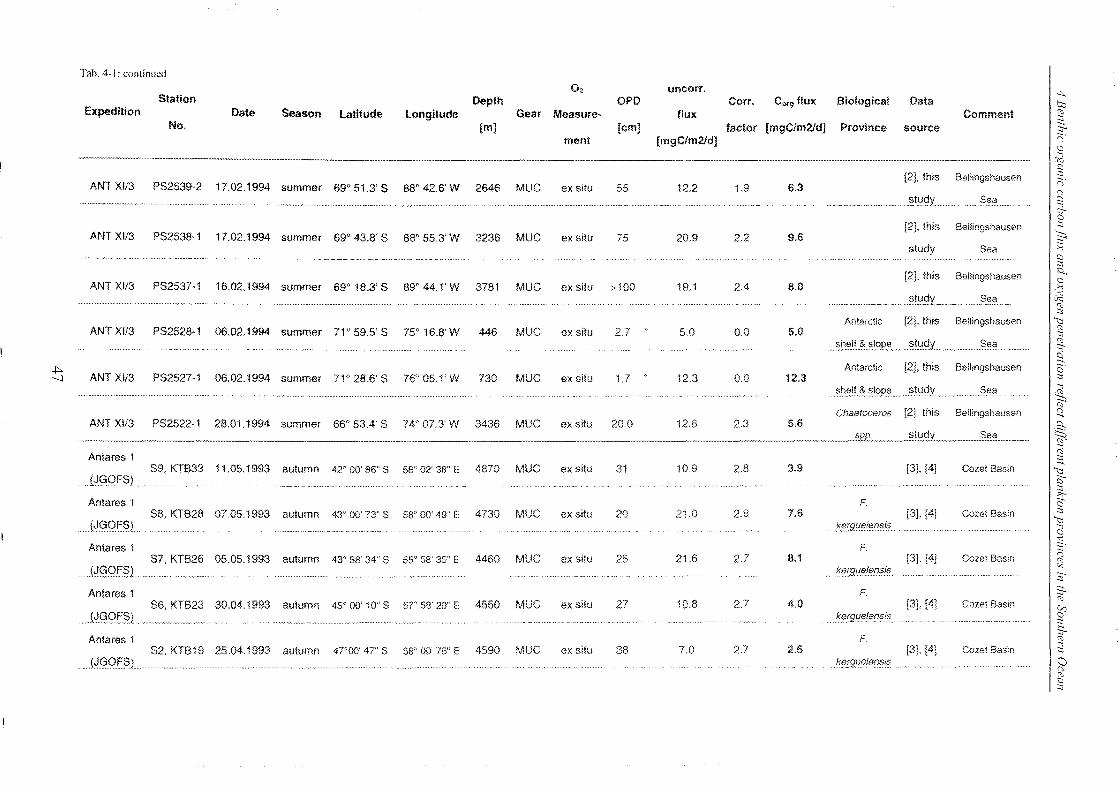
Tab. 4-1: continued
O2 uncorr. -k. Station Depth OPD Corr. COtS flux Biological Data Dv
Expedition Date Season Latitude Longitude Gear Measure- flux Comment ~ No. [m] [cm] factor [mgCfm2ldJ Province source -..
~ men! [mgC/m2ldJ r,
C)
~ !::)
ANT XI!3 PS2539-2 17.02.1994 [2J, this Ballingshausen
I ~. summer 690 51.3' S Sfl'" 42.6'W 2646 MUG ex situ 55 12.2 1.9 6.3 .' .~!lJdy. .. . Sea
Q-C)
ANT XI/3 PS2538-1 [2], this Ballingshausen
I'~ 17.02.1994 summer 69° 43.8' S 88" 55.3'W 3236 MUG ex situ 75 20.9 2.2 9.6 study Sea ;,.,
S [2], this Ballingshausen ~
C) ANT XI!3 PS2537·1 16.02.1994 summer 69° 18_3' S 89<' 44.1'W 3781 MUG ex situ >100 19.1 2.4 6.0 ;,.,
~ 3
Antarctic [2J, this Bellingshausen '1::: ANT XI!3 PS2S28-1 06,02.1994 summer 71" 59.5' S 75° l6.S'W 446 MUC ex situ 2.7 5,0 0.0 5.0 §
.... 1'.I1~!3~_~.19Q~...~t.llcl)' ..... Sea ~ ~
..j::.. Antarctic (2], this Bellingshausen ~. ---l ANT XI!3 PS2527·j 06,02,1994 summer 71" 28.6' S 76" 05,1' W 730 MUG ex situ 1.7 . 12.3 0.0 12.3 :::;
.1'.~~L~§!QPE)_ . .:>!1,l9Y .... Sea 1 '" Chaetoceros [2). this Bellingshausen Cl.
ANT XI/3 PS2S22-1 28,01.1994 summer 66" 53,4' S 74"07.3'W 3436 MUC ex situ 20.0 12.6 2.3 5.6 .~ '---'< ~.
Antares 1 '" :::. 59, KTB33 11,05,1993 autumn 42" 00' 86" S 58" 02' 38" F 4870 MUG ex situ 31 10.9 2.8 3.9 (3), [4J Cozet Basin '1:::
(J.Q9f$L .. ""Y ___ "_MM'<'" ~ ;:,
Antares 1 F. ~ S8,KTB28 07.05.1993 autumn 43" 00' 73" S SS" 00' 49' E 4730 MUC ex situ 20 ao 2.8 7.6 [3J, (4) Cozet Basin '1::: ... {~09f§L ... v •••• •••• ".,,~. "W ".¥ •. ~.
.k.e.rgl!f:!lf!r~si5 CS .,;
Antares 1 F. ;:,. (')
S7,KTB26 05.05,1993 autumn 43" SS' 34" S 55" 58' 3..'5" E 4460 MUC ex situ 25 21.6 2.7 8.1 [3]. [4J Cozet Basin <C
PQ9E$t ...... .~?rfJi!e.!'!rJ[5.is. ... , ," '" ............. ,,, ..•. _ .. ,, -. :::;
Antares 1 F. ~
::,-
S6,KTB23 30,04.1993 aulumn 4550 MUC ex situ 27 10.8 2.7 4.0 [3], [4] COlet Basin '" 45" OD' 10" S 5'1" SS' 29' E V:> .... {~Q9E§L .................... ...............•.. ~~~.~,.-.. ~ .. ,. ····., .. v •••••• «.>'········ ~~rf)l!e.£f!{1s.!$ . ~ ••• 'H'" ""_,,vw • ~
::,-Antares 1 F. ~
52,KTB19 25,04.1993 autumn 4TOO' 47" S 58" 00' 7ft E 4590 MUC ex situ 38 7.0 2.7 Vi [3J, [4] Cczet Basin ::i
.PQ9E$L ... kgrJl'!.l!lerlfii€ .,. () r,
'" §
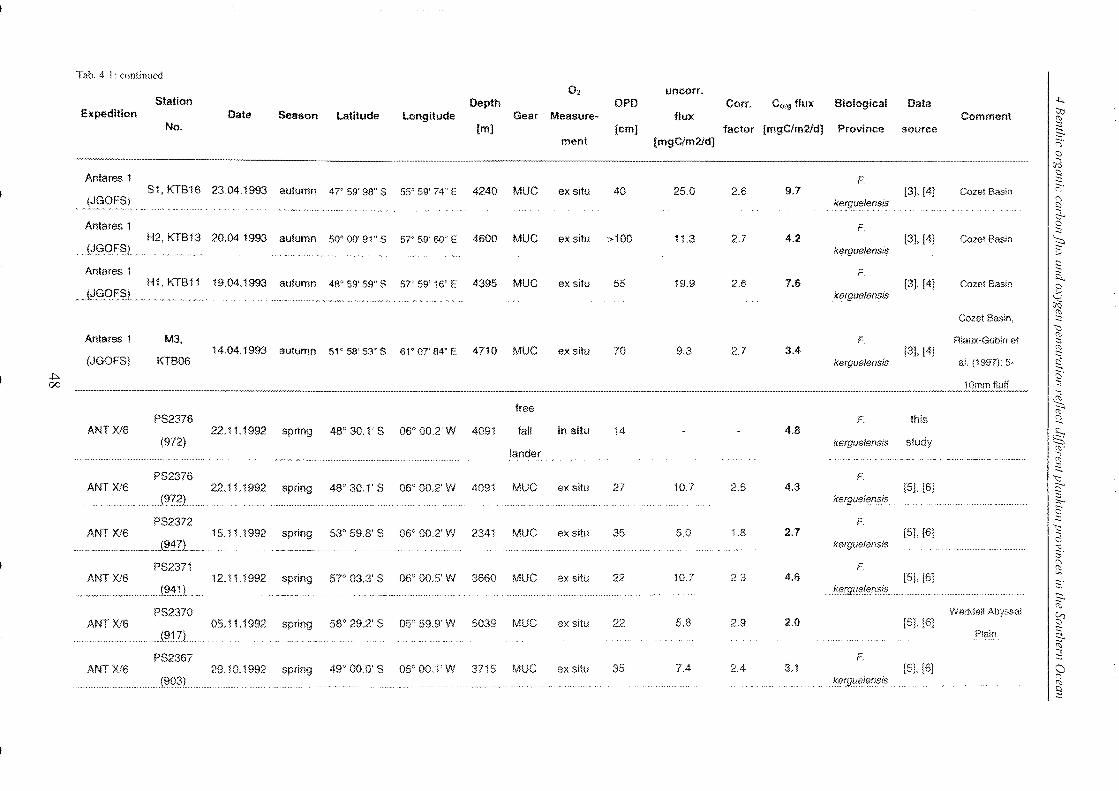
Tal:>. 4··1 : conlinucd
O2 uncorr. Station Depth OPD Corr. Corg flux Biological Data ~
Expedition Date Season Latitude Longitude Gear MeaslIre- flux Comment ~
~ No. [m] [cm) factor [mgCfm2fd} Province source 3-ment [mgC/m2fd) ;:;.
Cl
er7$
Antares 1 !::l F.
S1, KTB16 23.04.1993 autumn 47" 59'98" S 55' 59' 74" E 4240 MUG ex situ 40 25.0 2.6 9.7 [3J, [4] Cozet Basin ~.
(J(30F::;) kerguelensis r; 2 ;:j..
Antares 1 F. Cl :os
H2, KTB13 20.04.1993 autumn 50" 00' 91" S 57" 59' 60" E 4600 MUG ex situ >100 11.3 2.7 4.2 [3], [4] Cozet Basin ~ (JGo,FS1. kf!rguelensl$ ,.. --: !::l
Antares 1 F. ~ Hi, KTB11 19.04.1993 autumn 48° 59' 59" S 57" 59' 16" E 4395 MUG ex situ 55 19.9 2.6 ],5 [3J, [4] Cozet Basin Cl .. ,.,(J.~()t?). kerguelensis ,~
rlQ
Cozet Basin. § '1::l
Anlaras 1 MS. F. ",iaux-Gobin et cv :os
14.04.1993 autumn 51" 58' 53" S {'WOT 84" E 4710 MUG ex situ 70 9.3 2.7 3.4 [31, [4J cv
(JGOFS) KTB06 kerguelensis al. (1997): 5- ~ +:. go 00
free .~ cv
PS2376 F this Q ANTXJ6 22.11.1992 spring 48" 30.1' S 06" 00.2' W 4091 faH in situ 14 4.8 t& (972) kerguelensis study '--"
lander ~' "" ,~'"'' _V'~'
~ PS2376 F. '1::l
ANT Xl6 22.1 1.1992 spring 48" 30.1' S 06" 00.2'W 4091 MUG ex situ 27 10.'1 2.5 4.3 [5], [6] § ktJrgll£1l£1n;sis . ::r
PS2372 F. g
ANT XIS 15.11.1992 spring 53" 59.8' S 06" 00.2' W 2341 MUG ex situ 35 5.0 1.8 2.7 [5]. [6J '1::l c;
. "~~"-""~'-'-"-." , k£1rgUf}If)f1sls :: .
:os PS237i F.
r; cv
ANT XIS 12.11.1992 spring 57" 03.3' S 06" 00.5' W 3660 MUG ex situ 22 10.7 2.3 4.6 [51, [5] '" .~tJrg,lleierJsli; . ~
~
:::;-
PS2370 Weddell Abyssal cv
ANT XIS 05.11.1992 spring 58° 29,2' S 05" 59.9'W 5039 MUC ex situ 22 5.8 2.9 2.0 [5], [6J g (9iD Plain ::;
~ PS2357 F ::i
ANT Xi6 29.10.1992 spring 49" 00.0' S 06" 00.1'W 3715 MUC ex situ 35 7.4 2.4 3.1 [5]. [6] Cl ".(90~L .. ~£1rgu(llflnsis
r; cv §
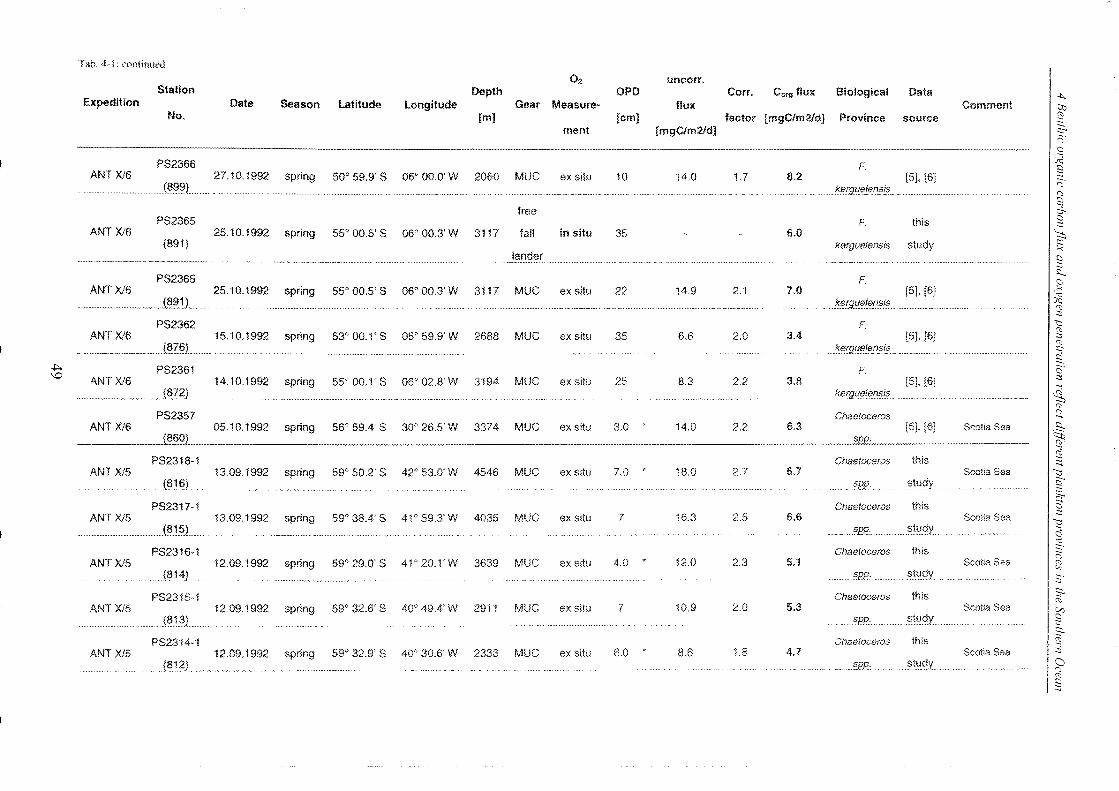
Tab, 4-! ' ('ol1fimll'~l
O2 uncorr. Station Depth OPD Corr. C"'9 flux Biological Data ~
Expedition Date Season Latitude longitude Gear Measure- flux Comment tv No. [m] [cm] factor [mgC/m2!d) Province source ~
ment [mgC/m21d} ~ ;::;-Cl
PS2366 F, ~ ANT X/6 27.1O,Hi92 spring 50" 59.9' S 06" 00.0' W 2060 MUC ex situ 10 14.0 1.7 8.2 [5], [6J
§ (~~~L., .. ..~,!rgl!ft!ftl}§i~
r;' ..... """~"~ '''''''~-'''' ........ -..... -.. ~ "'"'-'--~"""~" _ ...... -.. , ......... __ . <"'J
free ~ ()-
PS2365 F: this g ANT X/6 25,10.1992 spring 55" 00.5' S 06" OO,3'W 3117 fall in situ 35 6.0 ~ (891) kerguelensis study '" .••. v •. ~.w •• ¥ •• ¥ •• Y~ ,"w.¥ .. ¥_~v,,~~,.~. ".
lander ~
PS2365 F. ~ Cl
ANT Xi6 25.10.1992 spring 55" OOS S 06° 00.3' W 3117 MUC ex situ 22 149 2.1 1.0 [5J, [6J ,~
__ ._ ... __ .. __ .. ______ ._J?JJJ) ....... ..~efgY.eJ'!f}!}!~._ ... _._..... (jQ
•• • •••••••••••••••••• •••••••• ••• •••••• • •• •••• ....... " ..................... ,.v •• v •••••• __ •• _ ••• ~¥~w ........................... "' ..•. '"."'.-,-.--¥~ ...................... '" ::s PS2362 F. "\:::
'" ANT Xi6 15.10.1992 spring 53" 00,1' S 05" 59.S'W 2688 MUC ex situ 35 6,6 2.0 3.4 [5], [6] ::s '" ~el3JueJ€!."-?'i.s . ::::-~
..j:::.. PS2361 /" o· '-D
ANT Xi6 14.10,1992 spring 55'" 00.1' S 06"02.B'W 3194 MUC ex situ 25 8.3 2,2 3.B [5], [6] ::s
. __ .. __ ..... ~._ ...... JI???t ... . .. ~ftlJJ.l!€!'-'!!1:.".!'!. ... .~ .......................................................... _ ••••• ¥ •••• ·.N~·M· •. ··'""' .. · ..... • • ••••• _ •••• ¥ '" •• " ••••• ~. ~'A • '" ........................ ~ ~ ... ~ .. ':::::;
'" PS2357 Chaetoceros Q ANT Xi6 05,10.1992 spring 56" 59.4' S 30" 26.5' W 3374 MUC ex situ 3.0
, 14,0 2.2 6.3 [5]. [5] Scolia Sea ~ ~ Er
'" PS2318-1 Chaetoceros this -.. ANT XIS 13.09,1992 spring 59" SO.2' S 42° 53.O'W 4546 MUC ex situ 7.0 . 18.0 2.7 6,7 ScotiaSea "\:::
. ,(?.1?L. .. ·.··".-.¥O.-.·.·.v". __ .$.PP: . study .......................... § >;-
PS2317-1 Cllee/acelos this ~ ANT Xi5 13,09.1992 spring 59" 38.4' S 4FS9.3'W 4035 MUC ex situ 7 16,3 2.5 6.6 Scotia Sea "\:::
".';;'£2 ... ... ::;tl,l9Y. . , ._.¥. ·.vo_.·~,-v'" • ~. PS2316-1 Chaetoceros this r;
ANT Xi5 12.09.1992 spring 59'" 29.0' S 41" 20,1'W 3639 MUC ex silu 4,0 . 12.0 2.3 5.1 Scolia Sea '" t..,
. (~,1,4J. .§f?P: sway . -. •••• " .... " .... ··,,· ••• ¥ •• v.v • .-,,' ::s
PS231S-1 CI18etoceros this ~ ANT Xi5 12.09,1992 spring 59° 32,6' S 40'" 49.4' W 2911 MUG ex situ 7 109 2,0 5.3 Scotia Sea V:l
.. ....... ~pe. ... . ..... stY9y ... . ~ PS2314-i Chaetoceros this ~
ANT Xi5 12,09.1992 spring 59" 32.9' S 40" 30,6'W 2333 MUC ex situ 6.0 8.6 1.8 4.7 Scolia Sea :::i
J1:j.1?t ....... ...... J:>':1:'£, sway .. Cl <"'J
'" §
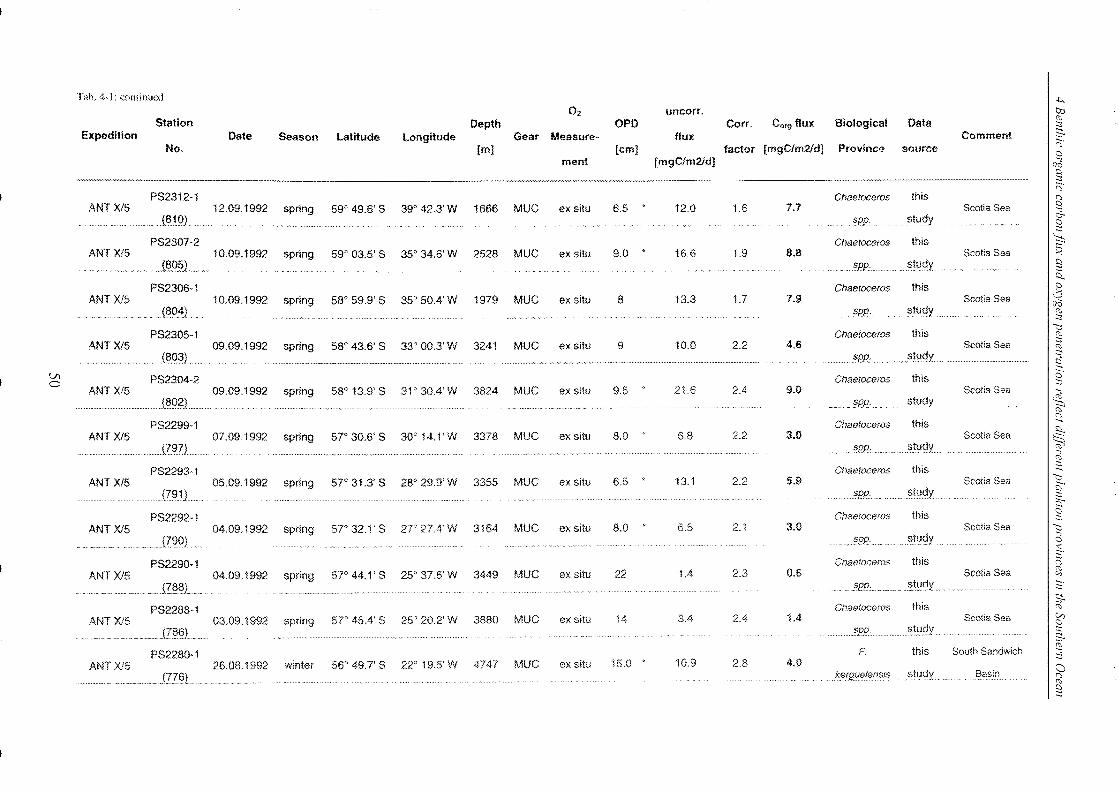
Tah, 4 .. 1: conlinued -k.
O2 uncorr. to Station Depth OPD COff. Corg flux Biological Data ~
Expedition Date Season Latitude Longitude Gear Measure- flux Comment ~ No. [mJ [cm] factor [mgC/m2!d] Province source a ment [mgC/m2!d] er';j
!::)
--.--.•....... ~-----.. -•..... - .......... -.. __ .............................. ~. PS2312-1 Chaetoceros this
~ ANT XIS 12.09,1992 spring 59" 49,6' S 39" 42.3'W 1666 MUG ex situ 6.5 12,0 1.6 7.7 Scotia Sea
f8. 1()) . spp. study <::;-
§ PS2307-2 Cllaetoceros this ~
ANT X/5 10.09.1992 spring 59" 03.5' S 35" 34.6'W 2528 MUG ex situ 9,0 * 16,6 1.9 8.8 Scotia Sea '"' .,.t?9!?L .. spp, §tLJdy § ~
PS2306-1 Chaetocero$ this a ANT Xl5 10.09.1992 spring 58° 59.9' S 35" 50.4'W 1979 MUG ex situ 8 13.3 1.7 7.9 SeeM Sea ~
....... j?~~L, spp study, '" :::
PS2305-i Chaetoceros this "\:l G
ANT XIS 09.09.1992 spring 58" 43,6' S 33" OO.3'W 3241 MUG ex situ 9 10.0 2.2 4.6 SeNia Sea ~ (8.9;3.) .. .. __ .. §PP"... ..."t!l<ly
::c-o •• " ••••••• 'A""'~"o .~~A~A_~._._~,,~._~ __ ~_~_._ ~_.~ .. ~_~ .~_~ .. ~ .. , , .. , ..... ..... ""v.v .. w.v"~"Y."AV."·~y,,·_,,·,_· .. ,,_ ~
Vl PS2304-2 Chaetoceros this 0' 0 :::
ANT X/5 09.09.1992 spring 580 13,9' S 31" 30.4' W 3824 MUG ex situ 9,5 ,
21.6 2.4 9.0 Seotia Sea
(~9?L ... §pe. .stU(!Y ~ '" " PS2299-1 Chaetoceros this ""
ANT Xl5 07.091992 spring 57" 30.6' S 30" 14,j'W 3378 MUG ex situ 8.0 6.8 2.2 3.0 Seotia Sea ~ ~
. Efl?L ..... s.PP:................st!ldy ",' ......... .... ' •• A ..... A.A.A ",,,, .... 'A.~ .. ~ ..... ~ .. '." .. A ... 'A M" • ~
PS2293-1 Chaetoceros this ~ ANT X/5 05.09.1992 spring 57" 31,3' S 28° 29.9'W 3355 MUG ex situ 6,5
, 13.1 2.2 5.9 Seotia Sea "\:l
.. \7?.1.L ..... . .... ,!$PP,. ..... iStlldy § ;>;-
PS2292-1 Chaetoceros this g ANT Xl5 04.09,1992 spring 57" 32.1' S 21' 2.7.4'W 3164 MUC ex situ B.O 6.5 2,1 3.0 Scotia Sea "\:l
VflOL. . .......... ?pP' ..... .iStucly CS ~.
PS2290·1 Chaetaceros this <'S
ANT Xl5 04.09.1992 spring 57" 44.1' S 25° 37.6' W 3449 MUG ex situ 22 1.4 2.3 0.6 Seotia Sea '" v,
"i?§~L ..... . ... ....$PR... .... .is!lIc1Y_ .... ~. .." .. "._" ..... A .. ~¥". '" "' ..... '¥A'''¥~ __ •••••
"" this
<::;-
PS2288-1 ChaetiA-:eros '" ANT XIS 03.09.1992 spring 57" 45.4' S 25' 20,2'W 3880 MUC ex situ 14 3.4 2.4 1.4 Scotia Sea g
::;.
PS2280·1 F. this South Sandwich
I~ ANT Xl5 26,08,1992 winter 56" 49,1' S 22" is.5'W 4747 MUC ex situ 15.0 , 10.9 2.3 4.0
kerguelensis study .. Basin !::) :::
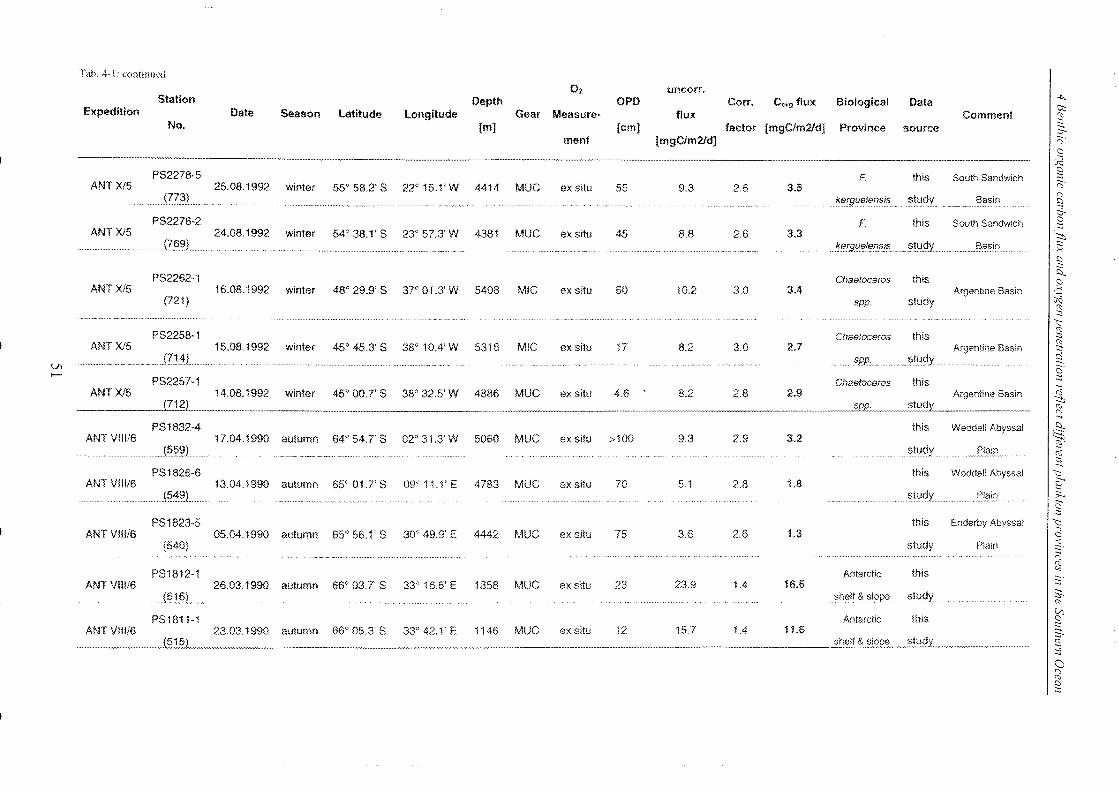
Tar. 4-l : cnminucu
O2 uncorr. Station Depth OPD Corr. C""g flux Biological Data ~
to Expedition Date Season Latitude longitude Gear Measure· flux Comment ~ No. [m] [cm] factor [mgC/m2!d} Province source :::;.. ment [mgCfm2!dJ ;::;.
C)
CI""Cl
PS227B-5 F. this South Sandwictl § ANT Xl5 25.0B.1992 winter 55" 58.2' S 22" 15.1' W 4414 MUG ex situ 55 9.3 2.6 3.5 ;:::"
J??~t. . .~€IC!J!JeienSiS ._~!lld,L Basin " ............... __ •• M 'A_AV_""VA"'¥~~'_" • ~
<::)«
PS2276-2 F. this South Sandwich C) :::,
ANT Xl5 24.08.1992 winter 54° 38.1' S 23" 57.3'W 4381 MUG ex situ 45 8.8 2.6 3.3 ~ .~€1rg(}~I(Ol'l.sl!'._._~t'J2Y.. ... .. . ..t:,asio .... :::
PS2262-1 this I~ Chaetoceros ~ ANT X/5 16.08.1992 winter 48" 29.9' S 37" 01.3'W 5408 MIG ex situ 60 10,2 3.0 3A Argentine Basin ~ (721} spp. study §
";: re
PS2258-1 Chaetoceros this :::, re ANT Xl5 15,08,1992 winter 45° 45.3' S 38" 10A'W 5318 MIC ex situ 17 8.2 3.0 2.7 Argentine Basin ~ ........... sp.P: ....... .. ~!':l(jy
Vl C). ........
PS2257-1 Chaetoceros this :::,
ANT X/5 14.08,1992 winter 45" 00.7' S 38" 32.5' W 4886 MUC ex situ 4.6 8.2 2.8 2.9 Argentine 8asin ~ no Q
PS1832-4 this Weddell Abyssal t& ANT VI!1!6 17.04.1990 autumn 64'" 54.7' S 020 31.3' W 5060 MUC ex situ >100 9.3 2.9 3.2 --..:; re'
... J5.?~L ... ~tlJ<lY ... Plain ;;; .. " .. -.. -,.-,.-,.~ ."~.,,.,- ,.,
:::. PS1826-6 this Weddell Abyssal ";:
ANT Villi€> 13.04.1990 autumn 650 01.7' S 09' 11.1' E 4783 MUC ex situ 70 5,1 2.8 1.8 ~ ::;
.(~'+~L . stllclr Plain "<-
11 PS1823-5 this EndBrby Abyssal
ANT V/W6 05.04,1990 autumn 65' 56.1' S 30" 49.9' E 4442 MUG ex situ 75 3.6 2.6 1.3 (540) study Plain
" re PS1812-1 Antarctic this '"
ANTVW!6 26,03.1990 autumn 66" 03.7' S 33" 16.5' E 1358 MUC ex situ 23 23.9 1.4 16.6 ~'
,.(§l?L, .... .. shEllf§:sl()pe ...... "t1l9r .... ::::. re
PS1811-1 Antarctic this ~ ANT V!!I!6 23.03.1990 autumn 66" 05.3 S 33" 42.1' E 1146 MUG ex situ 12 15.7 1.4 11.1:, :::;.. (S15) ~
::i ()
" re §
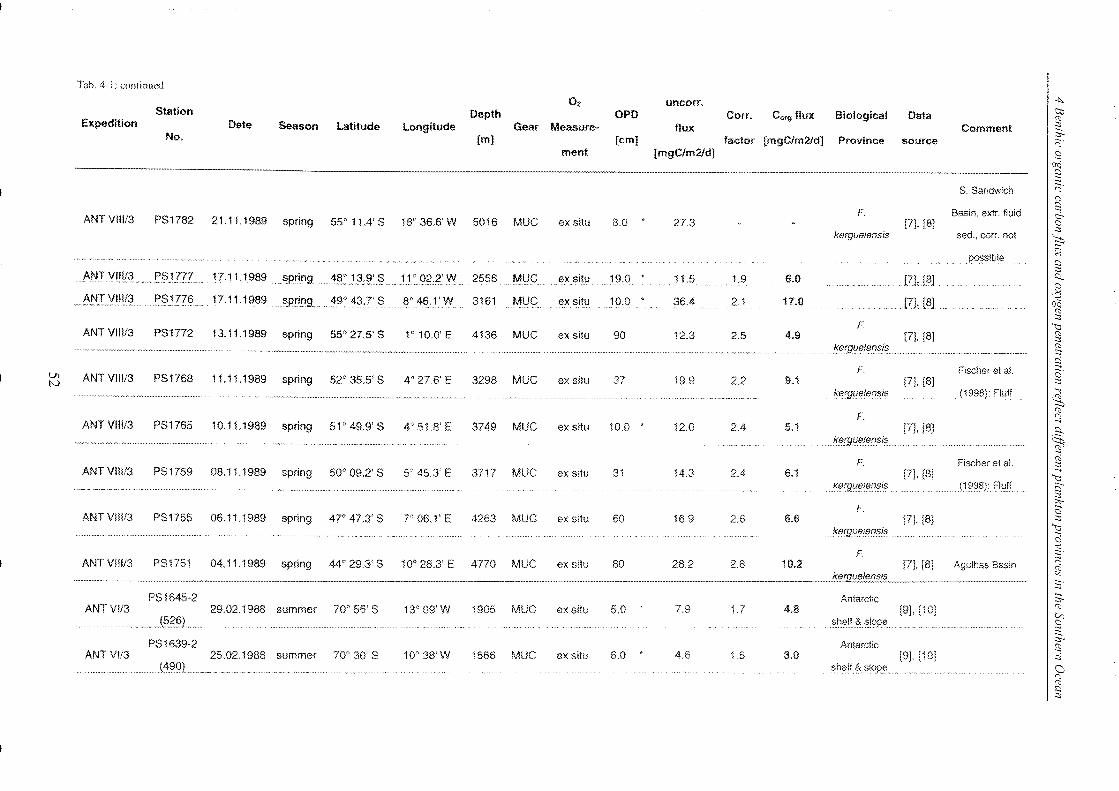
TJh, 4, l: cnnlirwcd
O2 uncorr. -k. Station Depth OPD Con. Corg flux Biological Data tlv re
Expedition Date Season Latitude Longitude Gear Measure- flux Comment ~ ::;-No. [m} [cm] factor [mgC/m2ld] Province source C;'
ment [mgC/m2ldJ co (j~ §
S, Sandwich ~.
r,
F', Basin, eAr. fluid Si <::0-ANT V!!I!3 PS1782 21.11.1989 spring 55° 11A' S 18" 36,5' W 5016 MUC ex silu 8,0 * 27,3 [7], [8J §
kerguelensis sed" corr, not ~ possible ~
l::)
,ANT VII 1/3 P$)777 17,11.1989 s.pring .. 4!?:1},(;j'§ ,1F02,,2' W , 2555 flAUC ,. e,x situ 19,0 * 11.5 1,9 6.0 m.,rS] 2.. co
""A,t.-JTy'!lI/;J ....... P§E!6 '.'. , 17,11.1989 ex situ 17.0 "",.,.17]'18J ,~
~prjf)g , .. ,49" 43.7' S 8'" 46, 1'W 3161 MUC 10,0 36A 2,1 CJQ ""'" , , ",' ,. A.
£l F ~
ANT VII!/3 PS1772 13.11.1989 spring 55" 27.5' S F 10,0' E 4136 MUC ex situ 90 12,3 2.5 4.9 (7], [81 £l ,~e.rg(j.'?lf!n.si!!. ,.... ... ... .. ..... .. . .......... . ... .""" ..... ~
~ F. Fischer et aL (3' Vl ANTVIII!3 PS 1758 11.11.1989 spring 52" 35.5' S 4" 27,6' E 3298 MUC ex situ 37 19.9 2.2 9.1 [7], [8] :::: N
~E!rg[ifil?'f1;;is , " " ... , .. , .... , ... ,(1998): FlUff .115 '::::::, re
F Q ANT VII!!3 PS 1765 10,11,1989 spring 51" 49.9' S 4" 51.8' E 3749 MUC ex silu 10.0
, 12,0 2,4 5.1 [7J, fS] ,2-,
.. kfilPIil!lerisis . .. . ...•.. ,", .. A·'~·'_·_··. ~_ ..• ~ ~'
F: Fiscner et ai, (\i ::::
ANT VI!!!3 PS1759 08.11.1989 spring 50C 09.2' S 5' 45,3' E 3717 MUC ex situ 31 14.3 2.4 6.1 {7], [8j ~
~ .~li!rgu'JIf!r;S,i.5 (1998)FllJff. §
>;-r. ~ co ANT Vlll!3 PS1755 06,11.1989 spring 470 47,3' S T 06,i' E 4263 MUC ex situ 60 16.9 2,6 6.6 in IS]
k?,rgue!fifl§i§ 's2 ~. F. ~ ANT VIlI/3 PS1751 04,11.1989 spring 44" 29,3' S 10° 28.3' E 4770 MUC ex situ 80 2S,2 2,8 10.2 [7]. fS] Agulhas Basin '" ",,,,,,,,,JS,fi.f9uelensis '" -_ ...... _-_ •.. _-- ... --................. ~
PS164S-2 Antarctic -~ ANT VI/3 29.02.1988 summer 70" 56' S 13" 09' W 1905 MUC ex situ 5.0 7,9 U 4.8 (9J, [lOJ
~ j~?§L silel! ? s,1?pe
Antardic ::;-
PS1639-2 ~ ANT V!i3 25,02,1988 summer 70° 30' S 10'" 38'W 1566 MUC ex situ 6,0 , 4,6 1.5 3.0 [9]. riG] ~
;;~?lf's<slop:e .. Cl r, re l::) ::::
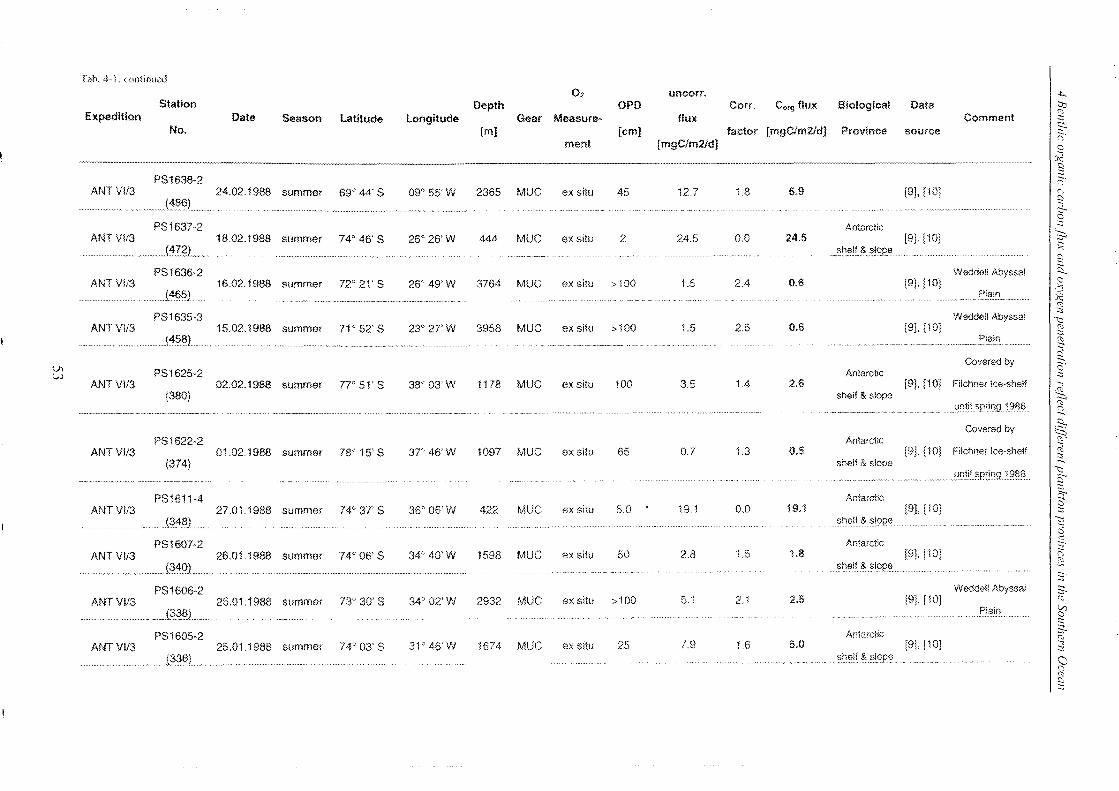
Tah, 4·· ! : wnlinu",d
02 uncorr. "'-Station Depth OPD Con, C",s flux Biologica! Data to
Expedition Date Season Latitude Longitude Gear Measure- flux Comment ~ No. [m] [cm] factor [mgC/m2JdJ Province source ::;-
~.
ment [mgC/m2fdJ S Crq
PS1638-2 ~. " ANT V!!3 24,02.1988 summer 69" 44' S 09" 55'W 2365 MUG ex situ 45 12,7 1.8 6.9 (9], [lOJ " l~!3.?t ... ~
,."" ,.'" .. ,.-.. ~". . c::o-C)
PS163?·2 Antarctic :::
ANT V!l3 18,02.1988 summer 74° 46' S 26' 26'W 444 MUG ex situ 2 24.5 0,0 24.5 [9]. [lOJ .~
..... J1.!?L ...... .. ~tl§!L&:sI()£El .. ~
!::l
PS 1636·2 Waddell Abyssal ~ ANTW3 16.02,1988 summer 72° 21' S 26" 49'W 3764 MUG ex situ >100 1,5 2.4 0.6 (9], [10] C)
:-e (~1?!5) ... Plain ~ ··."·M~~·'~V'v ...... .v'"' ~v.v_v_v_v __ w_".",. __ ·MV •• _ •• ~ ••• , '''e .~ " • .•...••...• v.v'V'" ••. ~._. __ v_.·.· •• ·~vv· .. ·•
~ PS1635·3 Wadde!! Abyssal '1:::
ANT V!l3 15,02,1988 summer 71< 52' S 23° 27' W 3958 MUG ex situ >100 1.5 2.5 0.6 [9], [10J ~
(4:?~L ~ ·········"· ••• ,, ..... " •••• A •••• ~ •• A ••• V.~ •• ~ •• ~ .~" u ....... •• ,,~ ~¥~,,~ .. ~ .. ~ .......
~ Vl
Covered by g' w PS1625·2 Antarctic ANTVI!3 02,02.1988 summer 77" 51' S 38" 03'W 1178 MUG ex situ 100 3.5 1.4 2.6 [9J, [10] Filchner ICB-shelf
1 (380) shelf & slope ..llfl1ilsprirl9J??f) (1)
.~u ¥. __ '.~U' __ ~M"~ Q
Covered by ~ '-i:? PS1622·2 Antarctic S·
ANTVI!3 01.02, i 988 summer 78" 15' S 3T 46'W 1097 MUG ex situ 65 DJ 1.3 0.5 [9J, [10] Filchner Ice·shelf et (374) shelf & slope ~
'1::: · __ ~_~",,'~"~'"'v''' •
. ..... _.. ..... ... ....... .. ... tlfliil "pringi?8i3 § PS16i1·4 Antarctic ;>;-
ANT VI!3 27,01.1988 summer 74" 37' S 36" 06'W 422 MUG ex situ 5.0 ,
19.1 0.0 19.1 [9J, [10l g r3~~) ."helj~"lope '1:::
• .. .. ¥ ...... ~. ~¥ ...... v~. ~_, M~U~' •
9 PS1607·2 Antarctic ~.
ANTVli3 26.01.1988 summer 74' 06' S 34" 40' W 1598 MUG ex situ 50 2.8 1.5 U! (9), [10] G (1)
she!f&sl(jpe .. '" -. ::: PS1606·2 Wedde!! Abyssal ~
::;-
ANT Vl/3 25.01.1988 summer 73" 30' S 34' 02'W 2932 MUG ex situ >100 5.1 2,1 2.5 [9J, [101 (1)
Plain V:l
~ PS1605·2 Antarctic ::;-
(1)
ANTVI!3 25.01.1988 summer 74" 03' S 31" 46' W 1674 MUG ex situ 25 7,9 L6 5.0 [9]. [10] :i J3~f3L . < ". " .... ¥".~ .. ~... •
........... ~hEilf§C.?i()pe. C)
" (1)
!::l :::
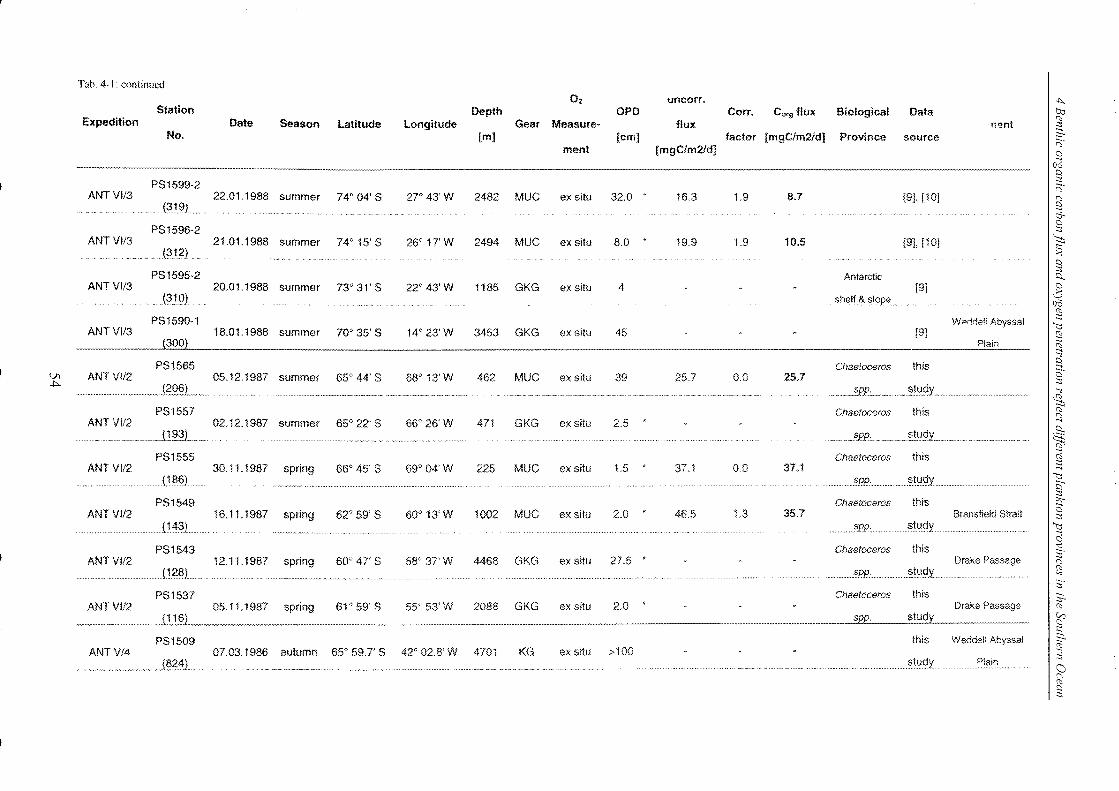
Tab. 4- I : continued
02 uncorr. -k.. Station Depth OPD Con. Corg flux Biological Data to
'" Expedition Date Season Latitude Longitude Gear Measure- flux l1'!!'nt :::. No. [m] [cm} factor [mgC/m2fd] Province source ;::,-;::;.
ment [mgC/m2fd} Cl
C!~ s;:,
PS1599-2 :::: ;::;.
ANTVI/3 22.01.1988 summer 74" 04' S 27" 43'W 2482 MUG ex situ 32.0 • 16.3 1.9 8.7 [9J, [10] r;,
(:3~~} ... ~ c-PS 1596-2 g
ANTVI/3 21.01.1988 summer 74° 15' S 26" 17' W 2494 MUG ex situ 8.0 ,
19.9 1.9 10.5 [9],110] ~ (~t2) .' ~
8 PS1595-2 Antarctic ~
ANTV!!3 20.01.1988 summer 73" 31' S 22" 43'W 1185 GKG ex situ 4 (9J Cl
(~10) shelf & slope '::s erQ
'" PS1590·1 WMlr'Je!i Abyssal :::: ~ ANTVII3 18.01.1988 summer 70° 35' S 14" 23'W 3453 GKG ex situ 45 [9] '" (300) Plain :::: ~
PS1565 Cllaetoceros this ~ VI ANT V112 05.12.1987 summer 65°44'8 68" 13' W 462 MUG ex situ 39 25.7 0.0 25.7 §" .j:::.
._.,{~Q?l ........... , .......................... ,. ~~~_A_A_A_A •• ______ A_A_A •••• ___ "M" •• ___ .,., '" _____ '_'"A'"A'-'" "'_0.'''' ""·AV_V'''·''·A··A·A._V_··.· •. __ _''"'''' ___ ·,.'_,'"A'"A'·AW'
~ P81557 Chaetoceros this '" r;,
ANT VI!2 02.12.1987 summer 650 22' S 66° 26' W 471 GKG ex situ 2.5 ~
", ___ "",,,"j.l~1L .. ",. ................................. ,. " .•...• ~ ..... ~ ...... ~ "-Q CS'
PS1555 Chaetoceros this ~
ANT Vlf2 30.11.1987 spring 66° 45' S 69" 04' W 225 MUC ex situ 1,5 37.1 0.0 37.1 ~
?!3L .. spp . ................. ~tl,1ciy .... ~ s;:, ::::
P81549 Chaetoceros this """ ANT VII2 16.1 1.1987 spring 62" 59' S 60° 13' W 1002 MUC ex situ 2.0 46.5 1.3 35.7 Bransfield Strait g
$;PP ......... §~1l9Y ...... "t::: CS
P81543 Chaetoceros this -,: ~.
ANT VI!2 12.11.1987 spring 60" 47' S 58" 37' W 4468 GKG ex situ 27.5 ,
Drake Passage r;,
..................J1??L. §pp ... ....... ~tlJc:ly .... ~ •• • •• ~_. __ • __ ~y ___ WN'.¥ •• V ••
S· PS1537 ChaetocelOs this ~
;::,-ANTVI!2 05.11.1987 61" 59' S 55" 53'W 2088 GKG ex situ 2.0 " Drake Passage '" ~
PSi509 this Weddell Abyssal 3-ANT Vi4 07.03.1986 autumn 65° 59,7' S 42" 02.8' W 4701 KG ex situ >100 ~ :::
Plain () r;,
'" s;:, ::::
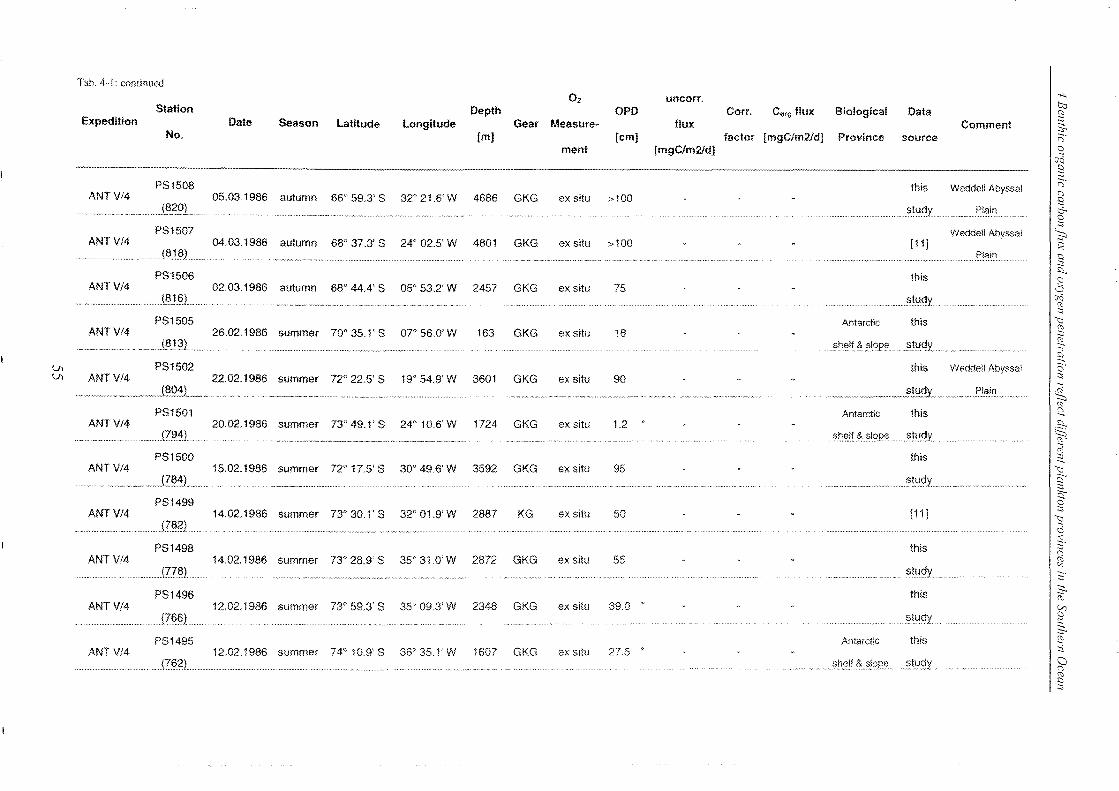
Tah, 4-1: com.inlled O2 uncorr. -k
b;, Station Depth OPD Corr. C."g flux Biological Data ~ Expedition Date Season latitude Longitude Gear Measure- flux Comment 2-No. [m] [cm} factor [mgC/m2ld] Province source (:;.
ment [mgC/m2ld] a I/~ ___ ,n, ••
S PS1508 this Weddell Abyssal
;::;.
'"' ANTV/4 05,031986 autumn 66" 59,3' S 32° 21,6'W 4686 GKG ex situ >100 2 " "."._,.,j~?QL " ............ stljclY Plain <:S-..... ..... .." .. ~ .. ~ .. ~ .. a
:::; PS1507 Weddell Abyssal ~ ANTV!4 04.03,1986 autumn 68° 37,3' S 24" 025' W 4801 GKG ex situ >100 [11] :-,
Plain l::) :::;
PS1506 this l::l.. a
ANTV/4 02,03,1986 autumn 68" 44.4' S 05" 53.2' W 2457 GKG ex situ 75 ,~
.".,"", ............... J8.1§t .. . ............. i;tli<:lY c;g
. "'''···· .. ,·~·~.····_····w .. ~ .. · .. '" :::;
PS1505 Antarctic this 'l:::l
'" ANTV!4 26.02.1986 summer 70" 35,1' S or 56,0'W 163 GKG ex situ 18 :::;
.. ,_.,', .... ,.,,, ......... ,(~.1;?L, , SIl,~lf~sl()pe.~tljtly ~ ... ", .. ". ...... .··.A·M •.... ~ •. w •• ~~ •• y ••••• ··~_A·.~·.~·. '", .... ~
Vl PS1502 this Weddell Abyssal 3' Vl ANTV/4 22,02.1986 summer 72° 22.5' S 19" 54,9'W 3601 GKG ex situ 90 :::;
.................... _",._ ......... 1?Q1), ... _, .... .. ~ .,,~~~~~ .... --.-............................... ".~ .. ~..... . .. •• ~ .. _.~ •• ~ .. ~ __ •• ~,,~ •• ~ •• v ..... v •• v .. v"'v"'v.~ ....... ~ • .~· •• v.·~W.v~vnv'·.' , ,." .. " ... ",-""_.,-,,,.§!~.qX. __ .. , .... f'Ii,li.fl".. . .... ~ '" PS1501 Antarctic this ~
ANTV!4 20,02,1986 summer 73" 49.1' S 24" 10.6'W 1124 GKG ex situ 1.2 . ~ .. (?'~:'l:t .. sh.~lf~i>I(lPI?,i;tlJgy .. ~
• • • ~. __ ." .~ .. _ ... A_A ... ~".v~~y •• __ ._ .. _ .. __ vnv •• vnv_v .. v., ...... ~ •• _n_~~ __ ~ •• ~_ .. _~ ... v •• v. '.A ~. • • ·.··A·· ... ~ .. A·· ... " • G'
PS1500 this ~ ANT V!4 15,02.1986 summer 72" 17$ S 30" 49.6' W 3592 GKG ex situ 95 'l:::l --.... jZ~1L ... _,. l::)
... -.. ~ .. ~ .... --.. -........... •••••• ,...... ..... • .............................. , ... ~ .. v ...... :::; >;-
PS1499 ~ ANTV!4 14,02,1986 summer 73"30.1'3 32° 01.9'W 2887 KG ex situ 50 [1 i 1 'l:::l .(!~?) ............... " .. -.. ~ .. ~ .. '".'"~-. '" ............ _ .. _ .. _ ...... d
PS1498 this ~' ANTV!4 14,02,1986 summer 73" 28,9' S 35" 3LO'W 2872 GKG ex situ 55 '" '" .(!.?~L ... ....... "'A"A"~"~'"''' __ '_'' ..... _ ... "A_"VA_AYA~~~~~~y~"~ .. ········~· .. _ .. VA·~· •• ~.,
stllclY 2' ~
PS1496 this :::s-rc
ANT V/4 12,02,1986 summer 73° 59,3' S 35" 09,3'W 2348 GKG ex situ 39.0 • [ s.tlJdy :::s-
PS1495 AntarctiC this ~ ANT V!4 12,02,1986 summer 74" 10.9' S 3EF 35,1' W 1607 GKG ex situ 27,5 , :::i
... . . ... , §f1§lf 8;,(;Ii)pe !;';tugy .. ()
'"' '" l::) :::;
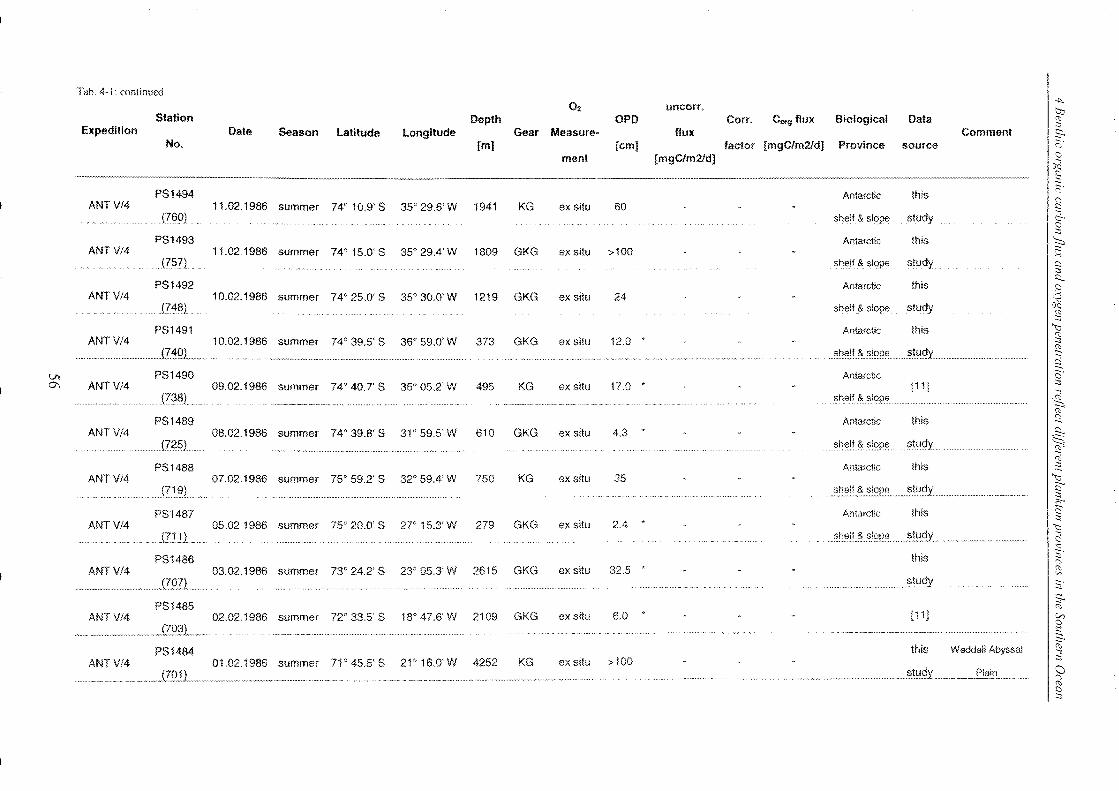
Tah. 4-1 : continued
02 ~
uncorr. b:J Station Depth OPD Corr. CO'll flux Biological Data ~ Expedition Date Season Latitude Longitude Gear Measure- flux Comment ;:,;-.
No. [m] {cm1 factor [mgC/m2fd] Prollince source (=)'
ment [mgC/m2fd] C)
~ l:l .....•...................... -. ..... --" ......... ~-- ... _-_ ........ ............................ _-_ ....
PS 1494 Antarctic this ~ . (J
ANT V/4 11.02.1986 summer 74" 10.9' S 35" 29.6'W 1941 KG ex silu 60 ~ (76()) shelf &5100' study (:;-
§ PS1493 Antarctic this ~
ANT V/4 11.02.1986 summer 74'" 15.0' S 35° 29A'W 1809 GKG ex situ >100 :--
'""' (757) shelf & slope study 2
PS1492 this ~
Antarctic C)
ANT V!4 10.02.1986 summer 74" 25.0' S 35" 30.0'W 1219 GKG ex situ 24 ,~
(718) shelf & slope study oQ re :::J
PS1491 Antarctic this '(:j re
ANTV!4 10.02.1986 summer 74° 39.5' S 36" 59.0'W 373 GKG ex situ 12.0 , :::J re
....... J!~QL .......... .h_n~_."' .. ""'._ .. " . .-.... . ....... " .•... ".".,. ~l1e.lf?(;I()pe . ..::;tllely ~ Vl PS1490 Antarctic g' 0\ ANT V/4 09.02.1986 summer 74" 40.7' S 35"05.2'W 495 KG ex situ 17.0 * fi1j
(7;3fiL .. •• V~'~"A __ ··~~~"_v_'·_' _. ·· .. ""·0"·"" .. ··
shelf (!,~Iope .. ~ re PS1489 Antarctic this Q
ANT V!4 08.02.1986 summer 74" 39.8' S 31" 59.5' W 610 GKG ex situ 4.3 .~ ei'??) §he.lf~(;I?pe .... StuelL i::::h
..... '" .,.'_v_w .•. "" ..•. v .... ~ PSi488 Antarctic this ~
ANT V!4 07.02.1986 summer 75" 59.2' S 32° 59.4'W 750 KG ex situ 35 ~
.... ~~.~1!~.~.~~2~ ._~.t~9y ' ... "' __ .... _'."._.'.' § """ PSi487 Antarctic this Cl :::J
ANT Vi4 05.02.1986 summer 75" 20.0' S 2]0 i5.3'W 279 GKG ex situ 2.4 ~
:;h.(3I!.&..SJ0P_<:._S..t!::!9Y .. Cl ::.
PS1486 this ~ ANT V/4 03.02.1986 summer 73° 24.2' S 23' 05.3' W 2615 GKG ex situ 32.5 * "" '" .. s.tu(jy
~
~
PS1485 ;:,;-. re
ANT Vi4 02.02.1986 summer 72" 33.5' S 18° 47.6'W 2109 GKG ex situ 6.0 (11) VJ
, , •• ,~ .. ~.~ ••• ~ •• ~ •••••••••• __ .~ •• ~ ••••• ~ •• ~" •• .v ~ .. ~<'~ •• ~ ...... _.~ ......... .-..... ~_ .. 2 ~~ .... -........ ~.-.-., .. ,
~ PS1484 this Weddell Abyssal ANTV/4 01.02.1986 71° 458 S 21" HWW 4252 KG ex situ > lOO :::i
slimmer Cl (J re §
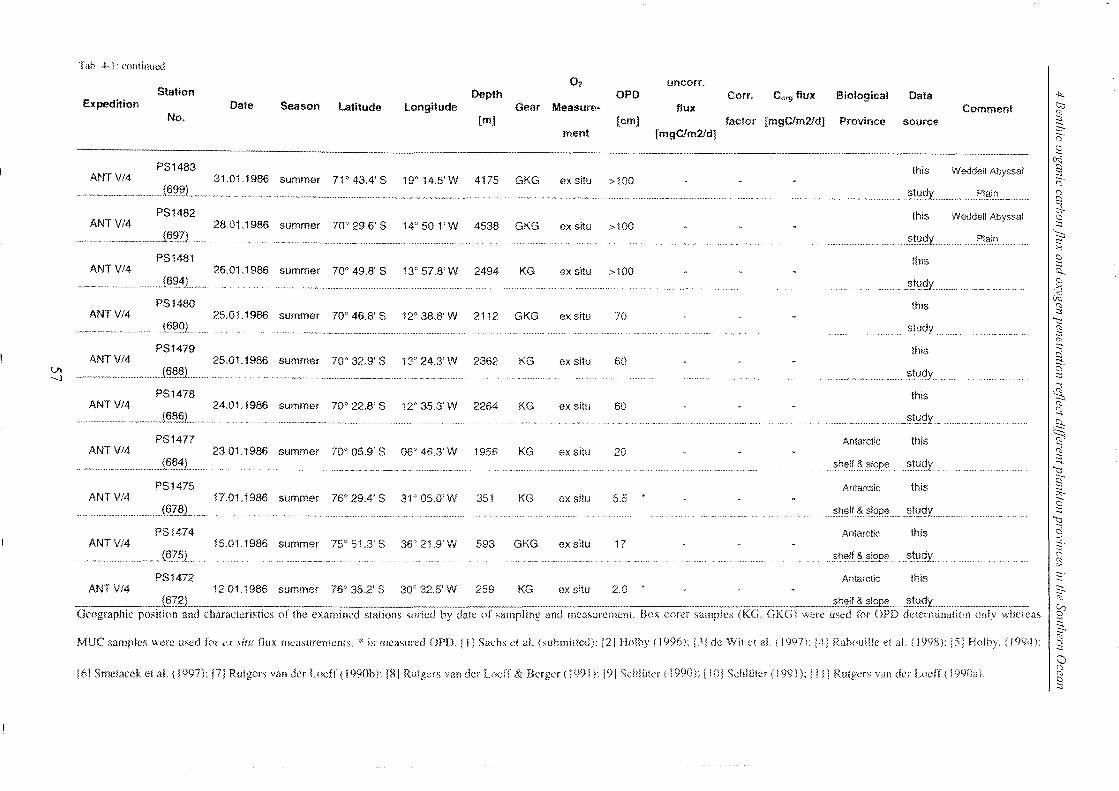
Tao. 4-1: continued
02 uncorr. Station Depth OPO Corr. Corg flux Biological Data
Expedition Date Season latitude Longitude Gear Measure- flux Comment No. [m] [cm] factor [mgCfm2ld] Province source
ment [mgC/m2ld]
... -..... _-- -.... -........ -.--~--.. -.. -.-----PS1483 this Weddell Abyssal
ANTV!4 31.01.1986 summer 71° 43.4' S 19" 14.5' W 4175 GKG ex situ >100 • "".-~.-~.".~-~~ •• ¥. .......... {§~gL .. _ ........... __ ~ ___ vm •• v"v •• v •• v ... _. ····· .. ·············'·A··A __ .. ·Vnv"v"v_v_,,_" .. "·_A·.·
PS1482 this Weddell Abyssal ANT V/4 28.01.1986 slimmer 70" 29.6' S 14° 50.1' W 4538 GKG ex situ >100 ..... ,," .......... Jfi!;jZL.
··,·"~.·"v ..• v.¥·¥·v.".v •. v .. , .. _ ..... . ....... ~~llcly
PS1481 this ANT Vl4 26.01.1986 summer 70° 49.8' S 13° 57.8' W 2494 KG ex situ >100
....... m~.4) ..... _ ... •••• .......... "V'_·.VAV.V •• V ..... . .. ..... ...... ~t.U..clY ..
PS1480 this ANT V/4 25.01.1986 summer 70° 46.8' S 12° 38.8' W 2112 GKG ex situ 70
•• v •• v ... _ ............. _ ... j§9.QL .. PS1479 this
ANTV!4 25.01.1986 summer 70" 32.9' S 13" 24.3'W 2362 KG ex situ 60 VI .t§§§j ......... __ ._ ................... '>.t(1dy. -...l
•• ___ ~N~n ___ •• _.w. ··········" .. ··A·.A·M_A_A._" __ ·A._A~." .. " .. __ ."_v .. ,,.'"' .• · .. _ .. V." .. ·.A ..• ·_.~v .. · •.
PS1478 this ANT V/4 24,01.1986 slimmer 70" 22.8' S 12'" 35.3' W 2264 KG ex situ 60
_ .. J~~§l,, __ .
PS1477 Antarctic this ANTV!4 23.01.1986 summer 70Q 05.9' S 06" 46.3'IN 1956 KG ex situ 20
.. ~.hfJlt.~?I()P!l.. .."Ill?)! PS1475 Antarctic this
ANT V!4 17.01.1986 summer 76° 29.4' S 31" OS.O'W 351 KG ex situ 5.5 (§??L_ ......
PS1474 Antarctic this ANTV/4 15.01.1986 summer 75" 51.3' S 36'" 21.9'W 593 GKG ex situ 17
s~~!fJ~.:;;I?pe~tlJcJY
PS1472 Antarctic this ANTV!4 12.01.1986 summer 76° 35.2' S 30' 32.5'W 259 KG ex situ 2.0
-::-__ --,-_........,-.... ("-.67.21..___..... shelf & SIOP8 .. __ ~!(1,!Y .. Geographic position and characteristics of the examined stations sorted hy date of sampling and measurement. Box corer samples (KG. GKG) were used for OPf) dctermination only whcf(.'<ts
MUC samples were u"ed for ex SItu flux measurcments. * is mcasmed OPD. I!] Sachs et aL (,uhmined): 12] (1996); 131 de Wit el aL (1997); [41 Ra!wumc et aL (1998): { 1994):
[6) Smetacck et a!. (1997); Rutgers van dcr Loclf (j 990b): 181 Rutgcrs van dcr LodT & Berger (1991): SchlUtcr ( 19(0); [ 101 Schliilcr ( 1(91); I ! 11 Rutgers van der Lncff ( I 990a l.
ok
to
~ ::;--(=;' Cl
~ § ~ .
" ~ g ~ :-: 2l ~ Cl .~ liq
(1l ::;
";::: ~ g ~. g
.{\) ':::::, (1l
Q !:l... ~ ~.
~ '1:::: § >;-
2 ::;
~
~. r:; ~
::::. ~
g ::;:. (1l
~ ()
" (1l
§
4 Bellthic organic carbonf1ux and oxygen penetration reflect difFerent plankton provinces in the SOl/them Ocean
4.4.2 Organic carbon fluxes reaching the seafloor of the Southern Ocean
The organic carbon fluxes derived for the SO by in situ measurements and by correction
of ex situ measurements are shown in Figure 4-5. Benthic fluxes range from very low
values of 0.6 mgC m-2 d-1 (Weddell Sea) to approximately 25 mgC m-2 d-1 below coastal
polynias in front of the east Antarctic shelf. Highest fluxes up to 37.1 mgC m-2 d-1 were
determined for the Antarctic shelf region (Fig. 4-5). The spatial distribution of oxygen
penetration depths (shallow and deep OPO values are a semi-quantitative indicator for
continuous high and low organic carbon flux into the sediment, respectively) are shown
in Figure 4-6. Furthermore, benthic Corg fluxes and OPO values show no obvious
relation to water depth, oceanic fronts and regions except those at the Polar Front.
However, if the oxygen penetration depths are mapped against the context of additional
sedimentary parameters, a more systematic pattern is obvious: All open ocean fluxes
exceeding 5 mgC m-2 d-1 are in or close to the biogenic silica belt, an area of enhanced
sedimentary silicate from diatom export in the SO. For regionalization purposes, several
surface sediment mappings by Zielinski & Gersonde (1997), Burckle & Cirilli (1987),
Jouse et al. (1962), DeFelice & Wise (1981), Armand et al. (2005), Crosta et al. (2005)
and Mohan et al. (2006) were unified into a composite map of high sedimentary
inventories of diatom valves (Fig. 4-5).
Figure 4-5: Flux of organic carbon reaching the seafloor. The fluxes were derived from in situ measurement of
oxygen profiles in surface sediments and correction of ex situ determined fluxes according to equation (2). Colors
and circle sizes represent different Corg fluxes. Hatched areas indicate diatom-rich surface sediments according to
Zielinski & Gersonde (1997), louse et al. (1962), DeFelice & Wise (1981), Burckle & Cirilli (1987), Armand et al.
(2005), Crosta et al. (2005) and Mohan et al. (2006).
58
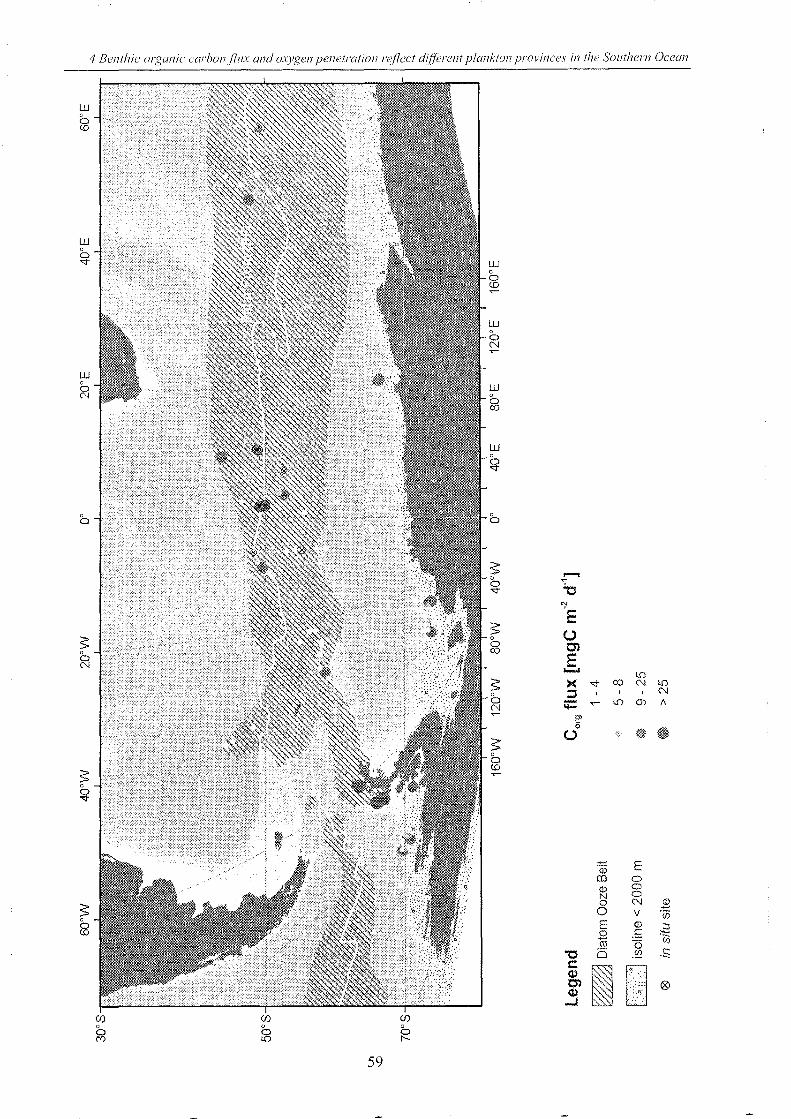
4 Benthic organic carbon/lux and oxygen penetration reflect different plankton provinces in the SOllthem Ocean
w o o CD
w c 0 '<t
w 0
0 N
0
S " ~
S 0 '<t
S 0
0 CD
if)
0 M
if) if) 0 0 0 L.O I'-
59
W 0
0 CD
W
0 r"
w 0
0 co
w 0
0 '<t
0 0
S 0 0 '<t
S 0
0 co
S 0
0 N
S 0
0 CD
....... ~
~ ~
E (.) Cl E ...... >< ;:,
;;:: e' 0
(.)
"'0 c:: (!) Cl (!)
...I
L.O <::t co N L.O
N ..- L.O 0) A
$1& •
...., E ill
ill 0 <J) 0 N 0 0 N Q)
0 v ....-'(j)
E Q) :::J 0 C ~ ....-
0 If) (1)
0 (/J .S
~ ~ ,', ~: '.
::\". '::;:,i,{· ® ~::, .... ' .... ~
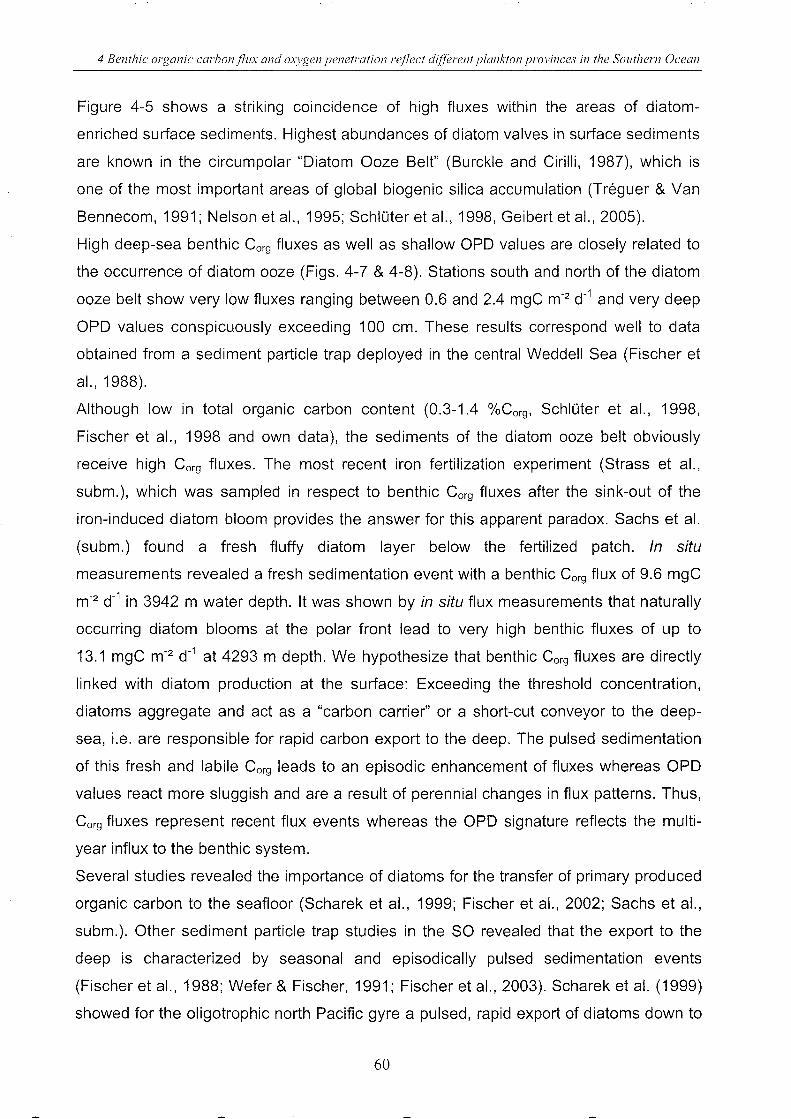
4 Benthic olganic carbonf1l1x and oxygen penetration reflect difFerent plankton provinces in the SOllthern Ocean
Figure 4-5 shows a striking coincidence of high fluxes within the areas of diatom
enriched surface sediments. Highest abundances of diatom valves in surface sediments
are known in the circumpolar "Diatom Ooze Belt" (Burckle and Cirilli, 1987), which is
one of the most important areas of global biogenic silica accumulation (Treguer & Van
Bennecom, 1991; Nelson et al., 1995; Schluter et a!., 1998, Geibert et a!., 2005).
High deep-sea benthic Corg fluxes as well as shallow OPD values are closely related to
the occurrence of diatom ooze (Figs. 4-7 & 4-8). Stations south and north of the diatom
ooze belt show very low fluxes ranging between 0.6 and 2.4 mgC m-2 d-1 and very deep
OPD values conspicuously exceeding 100 cm. These results correspond well to data
obtained from a sediment particle trap deployed in the central Weddell Sea (Fischer et
a!., 1988).
Although low in total organic carbon content (0.3-1.4 O/OCorg , SchlOter et al., 1998,
Fischer et al., 1998 and own data), the sediments of the diatom ooze belt obviously
receive high Corg fluxes. The most recent iron fertilization experiment (Strass et a!.,
subm.), which was sampled in respect to benthic Corg fluxes after the sink-out of the
iron-induced diatom bloom provides the answer for this apparent paradox. Sachs et a!.
(subm.) found a fresh fluffy diatom layer below the fertilized patch. In situ
measurements revealed a fresh sedimentation event with a benthic Corg flux of 9.6 mgC
m-2 d-1 in 3942 m water depth. It was shown by in situ flux measurements that naturally
occurring diatom blooms at the polar front lead to very high benthic fluxes of up to
13.1 mgC m-2 d-1 at 4293 m depth. We hypothesize that benthic Corg fluxes are directly
linked with diatom production at the surface: Exceeding the threshold concentration,
diatoms aggregate and act as a "carbon carrier" or a short-cut conveyor to the deep
sea, i.e. are responsible for rapid carbon export to the deep. The pulsed sedimentation
of this fresh and labile Corg leads to an episodic enhancement of fluxes whereas OPD
values react more sluggish and are a result of perennial changes in flux patterns. Thus,
Corg fluxes represent recent flux events whereas the OPD signature reflects the multi
year influx to the benthic system.
Several studies revealed the importance of diatoms for the transfer of primary produced
organic carbon to the seafloor (Scharek et al., 1999; Fischer et al., 2002; Sachs et al.,
subm.). Other sediment particle trap studies in the SO revealed that the export to the
deep is characterized by seasonal and episodically pulsed sedimentation events
(Fischer et al., 1988; Wefer & Fischer, 1991; Fischer et al., 2003). Scharek et a!. (1999)
showed for the oligotrophic north Pacific gyre a pulsed, rapid export of diatoms down to
60
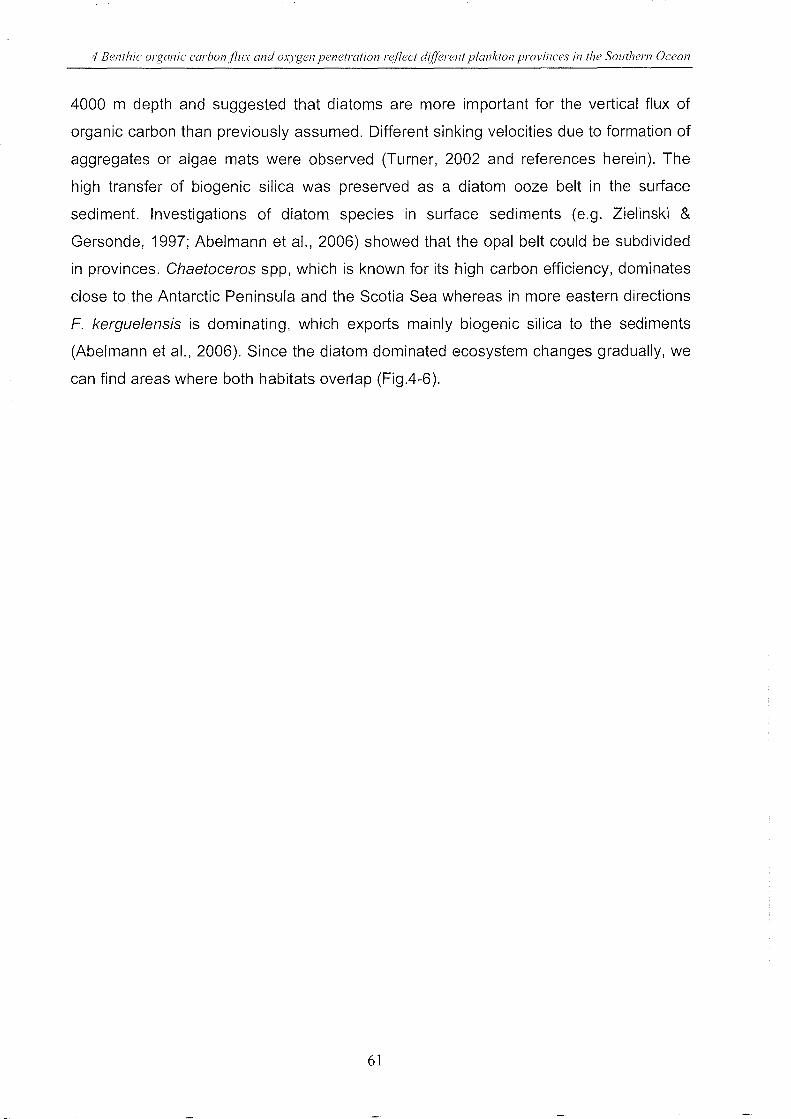
4 Bellthic organic carbonf/lIx and oxygen penetration reflect different plankton provinces in the Southern Ocean
4000 m depth and suggested that diatoms are more important for the vertical flux of
organic carbon than previously assumed. Different sinking velocities due to formation of
aggregates or algae mats were observed (Turner, 2002 and references herein). The
high transfer of biogenic silica was preserved as a diatom ooze belt in the surface
sediment. Investigations of diatom species in surface sediments (e.g. Zielinski &
Gersonde, 1997; Abelmann et al., 2006) showed that the opal belt could be subdivided
in provinces. Chaetoceros spp, which is known for its high carbon efficiency, dominates
close to the Antarctic Peninsula and the Scotia Sea whereas in more eastern directions
F. kerguelensis is dominating, which exports mainly biogenic silica to the sediments
(Abelmann et al., 2006). Since the diatom dominated ecosystem changes gradually, we
can find areas where both habitats overlap (Fig.4-6).
61
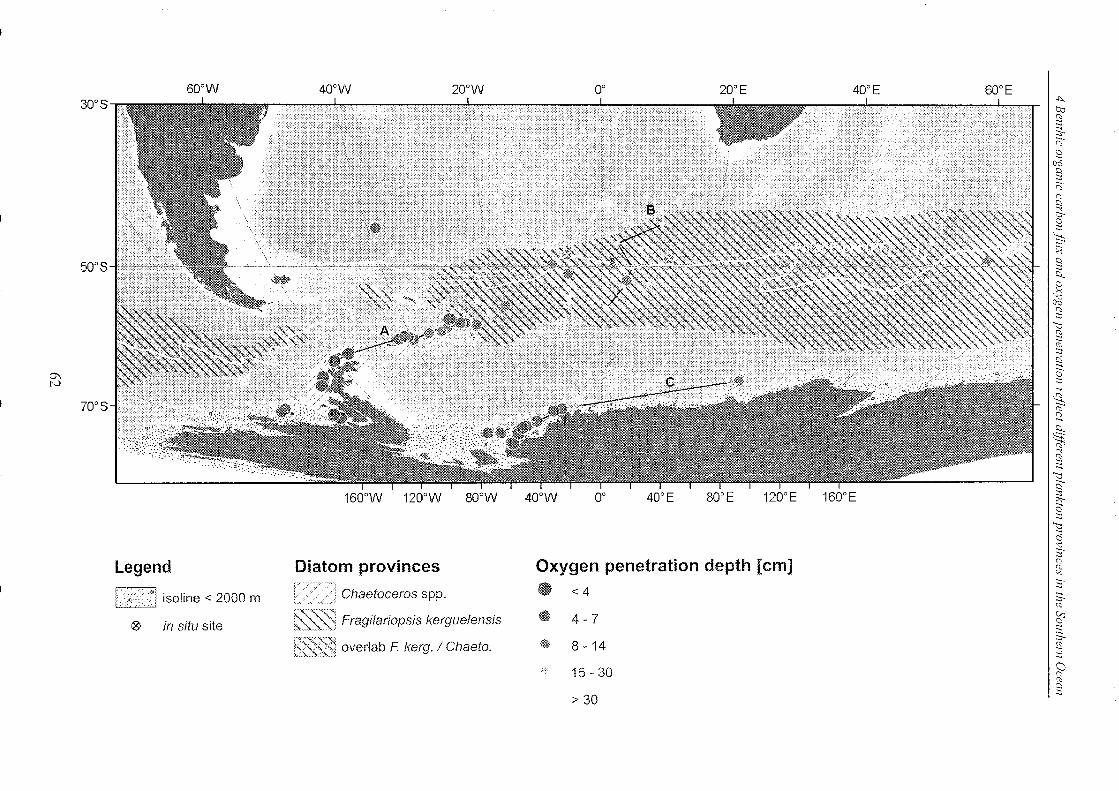
0\ IV
600 W 300 S
50° S -+:c:+~"~:,,'~,,';
700 S
Legend
1:.';,,:,'::/1 isoline < 2000 m
o in situ site
400W 200W
1600W 1200W 800W
Diatom provinces
Chaetoceros spp.
Fragilariopsis kerguefensis
'","",,",,,",,,.3 overlab F kerg. I Chaeto.
0° 200E
400W 0° 400E 800 E 1200E
Oxygen penetration depth [cm] • <4
• 4-7
@ 8 -14
15 - 30
> 30
400E
1600E
4 Benthic organic carbon/lux alld oxygen penetration reflect difFerent plankton provil1ces in the SOl/them Ocean
Figure 4-6: Oxygen penetration depths (OPD) of surface sediments in the Southern Ocean. Blue colors and circle
sizes indicate different OPD values. The orange hatched area shows enhanced Chaetoceros spp. spores (>20%) in
surface sediments and corresponds with Region A (The Chaetoceros spp. province, see text) whereas the red
hatched area shows elevated Fragilariopsis kerguelensis frustles (>40%) and corresponds with Region B. The
hatched areas were established according to Zielinski & Gersonde Cl 997), Jouse et a1. Cl 962), DeFelice & Wise
(1981), Burckle & Cirilli (1987), Kellogg & Kellogg (1987), Crosta et a1. (1997), Armand et a1. (2005), Crosta et a1.
(2005) and Mohan et a1. (2006). The blue marked area corresponds to Region C (The east Antarctic Shelf and
continental slope). Black lines represent transects of selected oxygen microprofiles (A = Fig. 4-10, B = Fig. 4-11, C
= Fig. 4-12).
To refine the image, we investigated how our results match the distribution of key
species of modern diatomeous surface sediments. For this purpose we compared the
mapped diatom ooze belt with its diatom provinces as suggested by Zielinski &
Gersonde (1997) considering the OPD values as a long term signal of benthic Corg flux.
Additional information was taken from surface sediment maps by Jouse et al. (1962),
DeFelice & Wise (1981), Burckle & Cirilli (1987), Kellogg & Kellogg (1987), Crosta et al.
(1997), Armand et al. (2005), Crosta et al. (2005) and Mohan et al. (2006). Figure 4-5
indicates that high fluxes are directly linked with siliceous, diatom-rich sediments. High
fluxes indicate rapid and pulsed deep export which can be observed occasionally as
fresh phytodetritus or fluff layer in various regions of the SO. The occurrence of deep
organic carbon export (annually, seasonally and/or regionally) is associated with
different diatom key species dominating primary production in the surface ocean and
generates a typical OPD pattern. Consequently, we distinguish three characteristic SO
regions in respect to their Corg input as a main result of this study (Fig. 4-6).
Region A: The Chaetoceros spp. province
The first region is characterized as a region of shallow sediment oxygen penetration and
high abundances of resting spores (20 % around South Georgia and the South
Sandwich Islands, up to 100 % at the Antarctic Peninsula). According to Zielinski &
Gersonde (1997), Armand et al. (2005) and Abelmann et al. (2006), the surface
sediments around the Antarctic Peninsula, the Scotia Sea and the region around South
Georgia and the South Sandwich Islands belong to the Chaetoceros spp. province. The
resting spores originate from small-celled diatoms belonging to the subgenus
Hya/ochaetae of the genus Chaetoceros (C. curvisetus, C. debilis, C. socia/is, C.
63
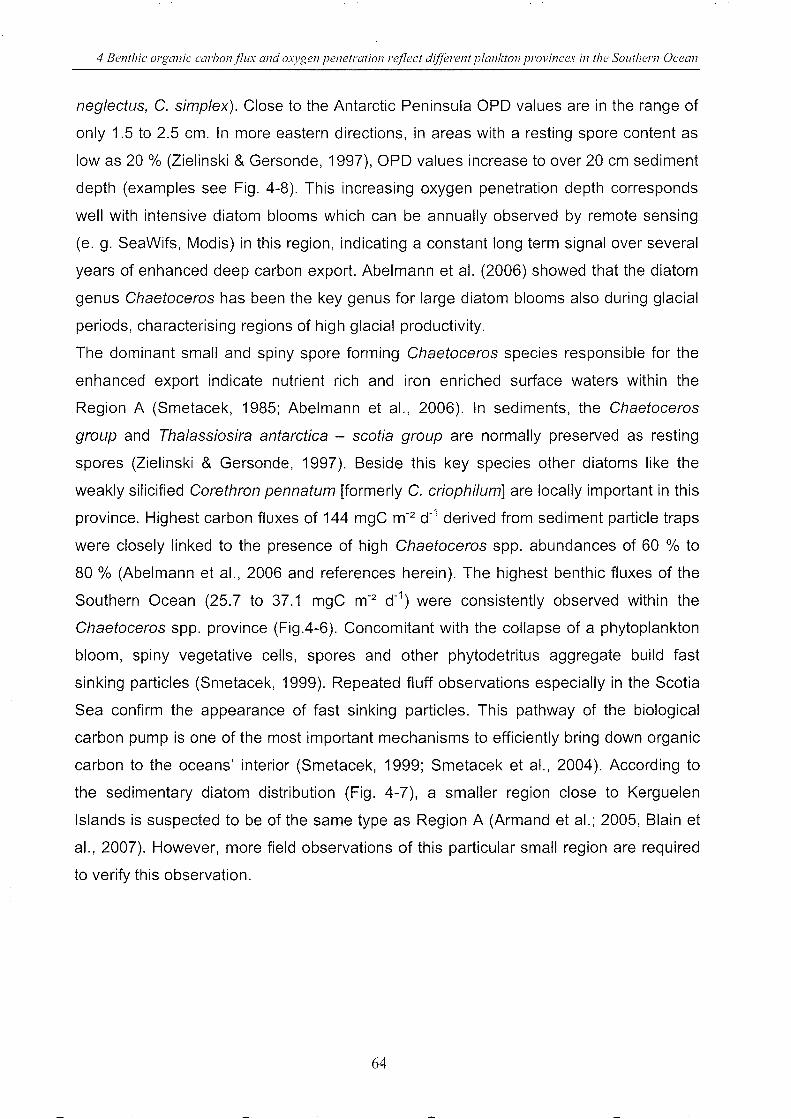
4 Benthic organic carhon/lux and oxygen penetration reflect difFerent plankton provinces in the Southern Ocean
neglectus, C. simplex). Close to the Antarctic Peninsula OPD values are in the range of
only 1.5 to 2.5 cm. In more eastern directions, in areas with a resting spore content as
low as 20 % (Zielinski & Gersonde, 1997), OPD values increase to over 20 cm sediment
depth (examples see Fig. 4-8). This increasing oxygen penetration depth corresponds
well with intensive diatom blooms which can be annually observed by remote sensing
(e. g. SeaWifs, Modis) in this region, indicating a constant long term signal over several
years of enhanced deep carbon export. Abelmann et al. (2006) showed that the diatom
genus Chaetoceros has been the key genus for large diatom blooms also during glacial
periods, characterising regions of high glacial productivity.
The dominant small and spiny spore forming Chaetoceros species responsible for the
enhanced export indicate nutrient rich and iron enriched surface waters within the
Region A (Smetacek, 1985; Abelmann et al., 2006). In sediments, the Chaetoceros
group and Thalassiosira antarctica - scotia group are normally preserved as resting
spores (Zielinski & Gersonde, 1997). Beside this key species other diatoms like the
weakly silicified Corethron pennatum [formerly C. criophilum] are locally important in this
province. Highest carbon fluxes of 144 mgC m-2 d-1 derived from sediment particle traps
were closely linked to the presence of high Chaetoceros spp. abundances of 60 % to
80 % (Abelmann et al., 2006 and references herein). The highest benthic fluxes of the
Southern Ocean (25.7 to 37.1 mgC m-2 d-1) were consistently observed within the
Chaetoceros spp. province (Fig.4-6). Concomitant with the collapse of a phytoplankton
bloom, spiny vegetative cells, spores and other phytodetritus aggregate build fast
sinking particles (Smetacek, 1999). Repeated fluff observations especially in the Scotia
Sea confirm the appearance of fast sinking particles. This pathway of the biological
carbon pump is one of the most important mechanisms to efficiently bring down organic
carbon to the oceans' interior (Smetacek, 1999; Smetacek et al., 2004). According to
the sedimentary diatom distribution (Fig. 4-7), a smaller region close to Kerguelen
Islands is suspected to be of the same type as Region A (Armand et al.; 2005, Blain et
al., 2007). However, more field observations of this particular small region are required
to verify this observation.
64
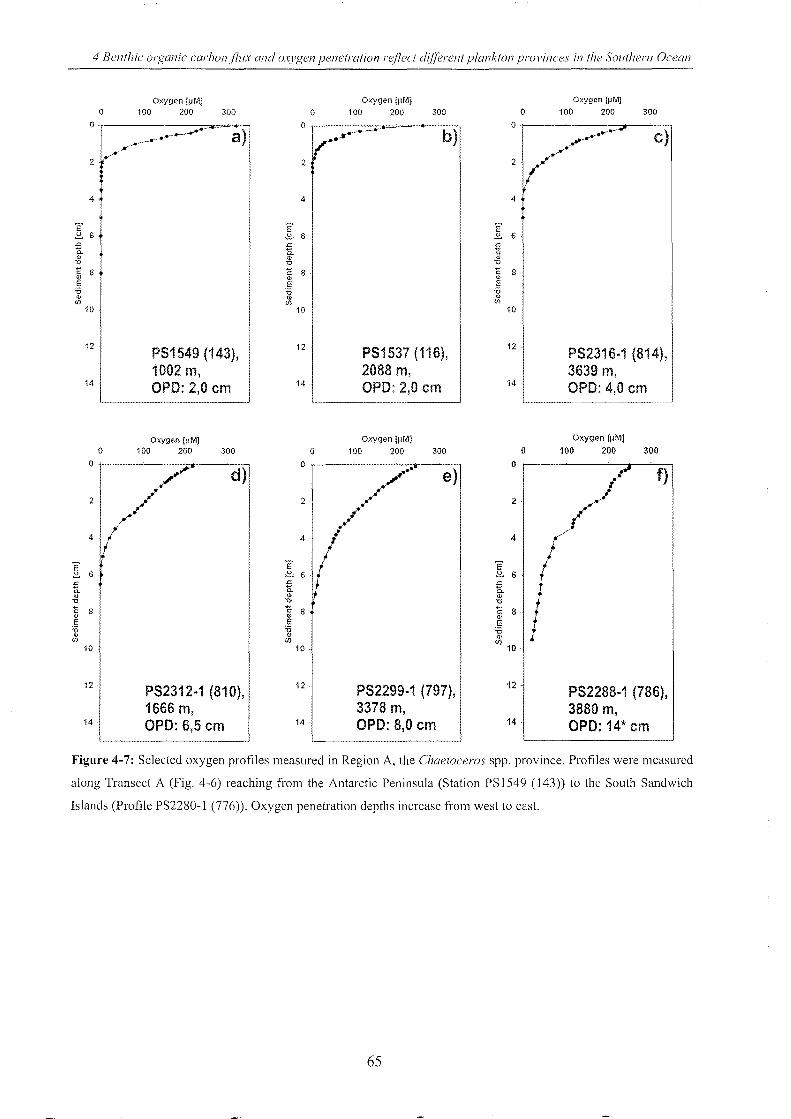
4 Benthie organic carbonfl1lx and ox)'gen penetration reflect different plankton provinces in the S01lthern Ocean
o
4
12
14
o
10
12
14
Oxygen (jJM] 100 200 300
PS1549 (143), 1002 m, OPO: 2,0 cm
Oxygen [~Ml 100 200 300
PS2312"i (8i0), 1666 m, OPO: 6,5 cm
2
4
12
14
E ~ 6 .c 1:l. '" '0
o
o
g 8 . E :g '" w
12
14
Oxygen [pM] 100 200 300
PS1537 (116), 2088 m, OPO: 2,0 cm
Oxygen [pM] 100 200 300
PS2299-1 (797), 3378 m, OPO: 8,0 cm
E ~
n. '" u C '" E ii <l>
'"
o
4
10
12
14
0
0··
2
4
6
8
10
12
14
Oxygen [pM]
100 200 300
PS2316·1 (814), 3639 m, OPO: 4,0 cm
Oxygen (jJMJ
100 200 300
f)
PS2288·1 (786), 3880 m, OPO: 14* cm
Figure 4-7: Selected oxygen profiles measured in Region A, the Chaetoceros spp. province. Profiles were measured
along Transect A (Fig. 4-6) reaching from the Antarctic Peninsula (Station PS 1549 (143)) to the South Sandwich
Islands (Profile PS2280-1 (776)). Oxygen penetration depths increase from west to east.
65
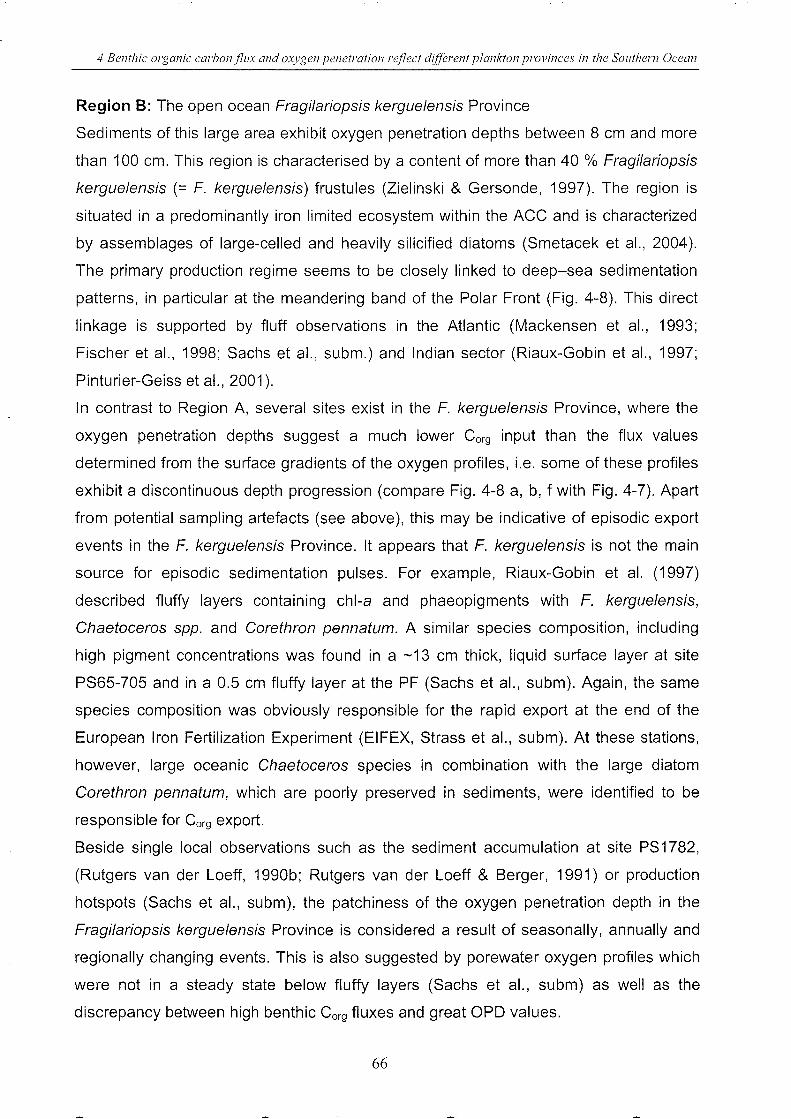
4 Benthic organic carbon/lux and oxvgen penetration reflect different plankton provinces in the Southern Ocean
Region B: The open ocean Fragi/ariopsis kergue/ensis Province
Sediments of this large area exhibit oxygen penetration depths between 8 cm and more
than 100 cm. This region is characterised by a content of more than 40 % Fragi/ariopsis
kergue/ensis (= F. kergue/ensis) frustules (Zielinski & Gersonde, 1997). The region is
situated in a predominantly iron limited ecosystem within the ACC and is characterized
by assemblages of large-celled and heavily silicified diatoms (Smetacek et al., 2004).
The primary production regime seems to be closely linked to deep-sea sedimentation
patterns, in particular at the meandering band of the Polar Front (Fig. 4-8). This direct
linkage is supported by fluff observations in the Atlantic (Mackensen et al., 1993;
Fischer et al., 1998; Sachs et al., subm.) and Indian sector (Riaux-Gobin et al., 1997;
Pinturier-Geiss et al., 2001).
In contrast to Region A, several sites exist in the F. kergue/ensis Province, where the
oxygen penetration depths suggest a much lower Corg input than the flux values
determined from the surface gradients of the oxygen profiles, i.e. some of these profiles
exhibit a discontinuous depth progression (compare Fig. 4-8 a, b, f with Fig. 4-7). Apart
from potential sampling artefacts (see above), this may be indicative of episodic export
events in the F. kergue/ensis Province. It appears that F. kergue/ensis is not the main
source for episodic sedimentation pulses. For example, Riaux-Gobin et al. (1997)
described fluffy layers containing chl-a and phaeopigments with F. kergue/ensis,
Chaetoceros spp. and Corethron pennatum. A similar species composition, including
high pigment concentrations was found in a -13 cm thick, liquid surface layer at site
PS65-705 and in a 0.5 cm fluffy layer at the PF (Sachs et al., subm). Again, the same
species composition was obviously responsible for the rapid export at the end of the
European Iron Fertilization Experiment (EIFEX, Strass et al., subm). At these stations,
however, large oceanic Chaetoceros species in combination with the large diatom
Corethron pennatum, which are poorly preserved in sediments, were identified to be
responsible for Corg export.
Beside single local observations such as the sediment accumulation at site PS1782,
(Rutgers van der Loeff, 1990b; Rutgers van der Loeff & Berger, 1991) or production
hotspots (Sachs et al., subm), the patchiness of the oxygen penetration depth in the
Fragi/ariopsis kergue/ensis Province is considered a result of seasonally, annually and
regionally changing events. This is also suggested by porewater oxygen profiles which
were not in a steady state below fluffy layers (Sachs et al., subm) as well as the
discrepancy between high benthic Corg fluxes and great OPD values.
66
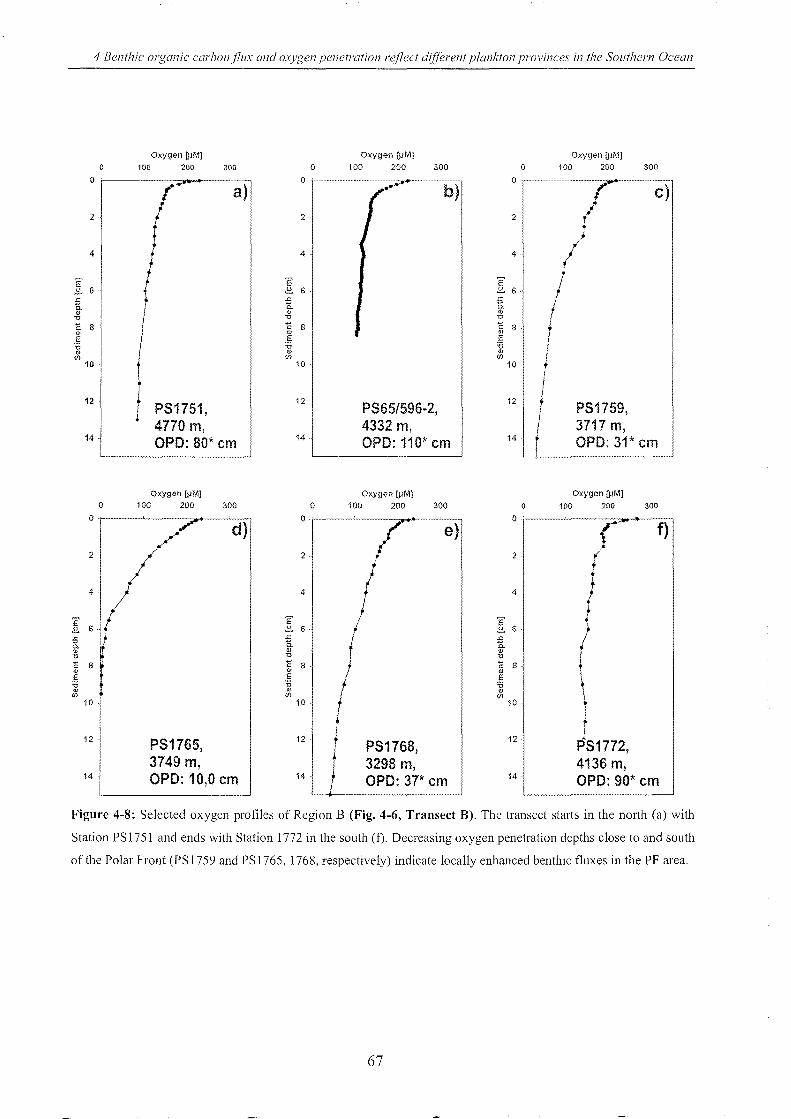
4 Benthic organic carbon/711x and oxvgen penetration re/7ect difFerent plankton provinces in the Southern Ocean
Oxygen [~MJ 300 0
o . a)
2 2
4 4
I 6 E ::!.. G
.c; • .s:: ti.
I ti.
<lJ '" "0 "0
c 8 - 8· " '"
I ID
E E '0 '0
'" '" if) if)
10 10 .
12 PS1751,
·12
4770 m, 14 OPO: 80* cm M·
Oxygen fiJMj 0 100 200 300 0
0 0
I .f' d)
...
:1 1 2
4
E SI! E s. S. 6 J::
'r z. ti.
'" '" "0 "0
C C 8 '" <l> E E '5 B '" '" if) if)
101 10
I 12 PS1765, 12
3749 m, 14 OPO: 10,0 cm 14
Oxyg"n [flMJ 100 200 300
.................. ~,.....
b)
PS65!596~2,
4332 m, OPO: 110* cm
Oxygen fiJMJ 100 200
( I
300
e)
PS1768, 3298 m, OPO: 37* cm
Oxygen [~MJ 0 100 200 300
0 -r ....... --... ~ ..... -....
c) 2 I 4 / •
E I ::!.. S·· .c ti. '" '0
J C 8 '" f E '0 '" I if)
f 10
I i
12 t PS1759,
I 3717 m, 14 OPO: 31* cm
Ox,'gen [flMJ o 100 200 300
o r---~------~~~-=t r 1) 2
4
E ::!.. 6 :S a.
'" ."
1:' s <ll E '0 <ll </J
10
12
14
PS1772, 4136 m, OPO: 90* cm
Figure 4-8: Selected oxygen profiles of Region B (Fig. 4-6, Transect B). The transect starts in the nOJ1h (a) with
Station PS 1751 and ends with Station 1772 in the south (f). Decreasing oxygen penetration depths close to and south
of the Polar Front (PS 1759 and PS 1765, 1768, respectively) indicate locally enhanced benthic fluxes in the PF area.
67
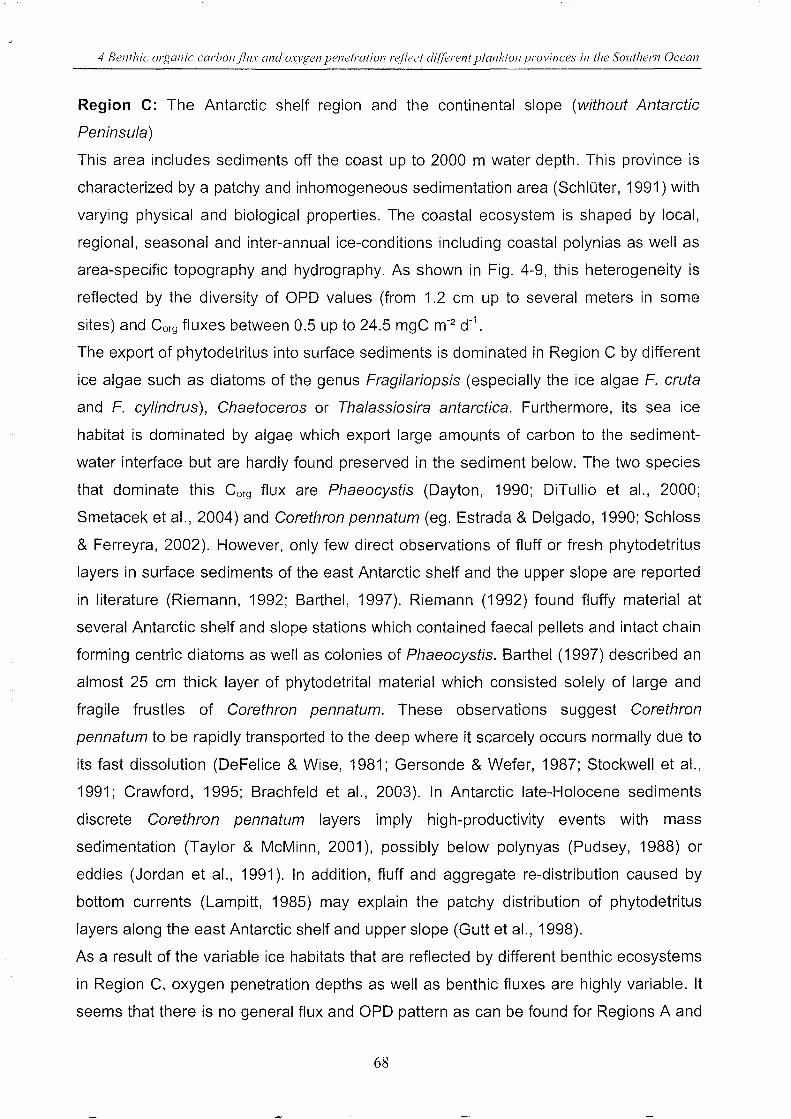
4 Benthic organic carbon/lllx and oXl'gen penetration re/lee'! different plankton provinces in the SOllthe1'l1 Ocean
Region C: The Antarctic shelf region and the continental slope (without Antarctic
Peninsula)
This area includes sediments off the coast up to 2000 m water depth. This province is
characterized by a patchy and inhomogeneous sedimentation area (SchIOter, 1991) with
varying physical and biological properties. The coastal ecosystem is shaped by local,
regional, seasonal and inter-annual ice-conditions including coastal polynias as well as
area-specific topography and hydrography. As shown in Fig. 4-9, this heterogeneity is
reflected by the diversity of OPO values (from 1.2 cm up to several meters in some
sites) and Corg fluxes between 0.5 up to 24.5 mgC m-2 d-1.
The export of phytodetritus into surface sediments is dominated in Region C by different
ice algae such as diatoms of the genus Fragilariopsis (especially the ice algae F. cruta
and F. cylindrus) , Chaetoceros or Tha/assiosira antarctica. Furthermore, its sea ice
habitat is dominated by algae which export large amounts of carbon to the sediment
water interface but are hardly found preserved in the sediment below. The two species
that dominate this Corg flux are Phaeocystis (Oayton, 1990; OiTullio et al., 2000;
Smetacek et aI., 2004) and Corethron pennatum (eg. Estrada & Oelgado, 1990; Schloss
& Ferreyra, 2002). However, only few direct observations of fluff or fresh phytodetritus
layers in surface sediments of the east Antarctic shelf and the upper slope are reported
in literature (Riemann, 1992; Barthel, 1997). Riemann (1992) found fluffy material at
several Antarctic shelf and slope stations which contained faecal pellets and intact chain
forming centric diatoms as well as colonies of Phaeocystis. Barthel (1997) described an
almost 25 cm thick layer of phytodetrital material which consisted solely of large and
fragile frustles of Corethron pennatum. These observations suggest Corethron
pennatum to be rapidly transported to the deep where it scarcely occurs normally due to
its fast dissolution (OeFelice & Wise, 1981; Gersonde & Wefer, 1987; Stockwell et al.,
1991; Crawford, 1995; Brachfeld et al., 2003). In Antarctic late-Holocene sediments
discrete Corethron pennatum layers imply high-productivity events with mass
sedimentation (Taylor & McMinn, 2001), possibly below polynyas (Pudsey, 1988) or
eddies (Jordan et al., 1991). In addition, fluff and aggregate re-distribution caused by
bottom currents (Lampitt, 1985) may explain the patchy distribution of phytodetritus
layers along the east Antarctic shelf and upper slope (Gutt et al., 1998).
As a result of the variable ice habitats that are reflected by different benthic ecosystems
in Region C, oxygen penetration depths as well as benthic fluxes are highly variable. It
seems that there is no general flux and OPO pattern as can be found for Regions A and
68
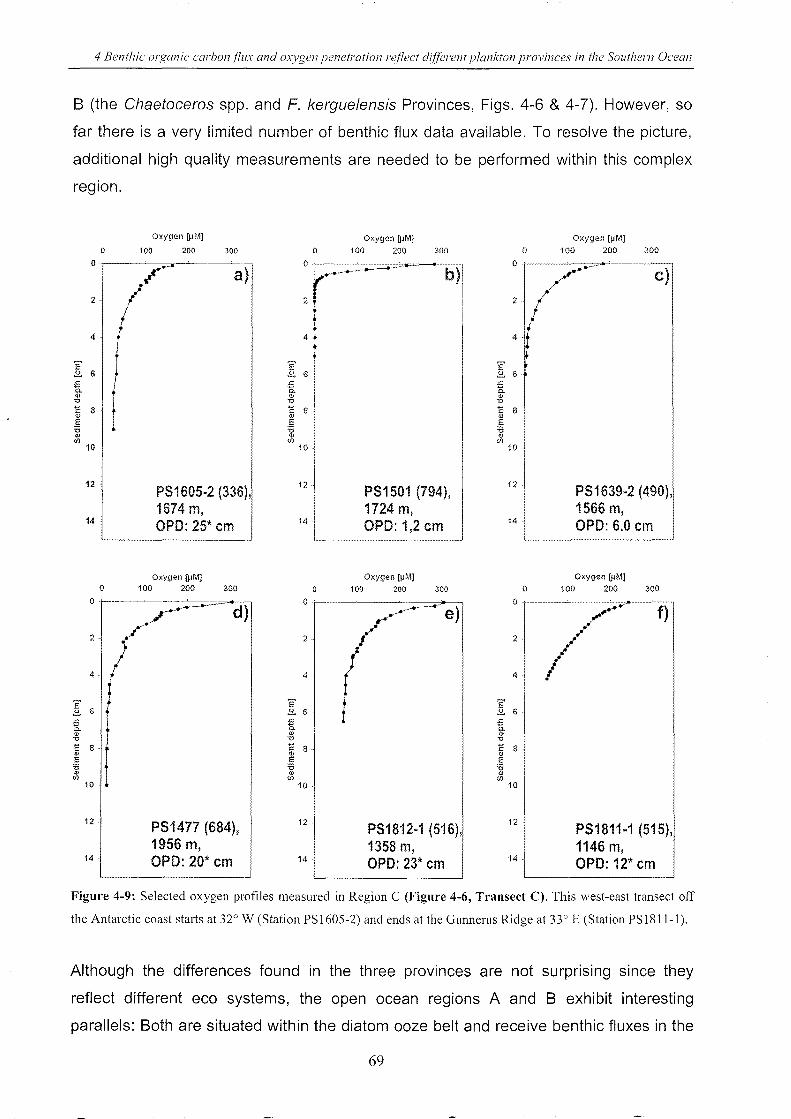
4 Benthic organic carbon/lllx and oxygen penetration reflect difFerent plankton provinces in the Southern Ocean
B (the Chaetoceros spp. and F. kerguelensis Provinces, Figs. 4-6 & 4-7). However, so
far there is a very limited number of benthic flux data available. To resolve the picture,
additional high quality measurements are needed to be performed within this complex
region.
Oxygen [IJMJ Oxygen [jJM] Oxygen [IJM]
0 100 200 300 0 100 200 300 0 '100 200 300
0 ~'--~ 0 ·-··:--'::~-=~-=-~b )1 0
( /.~ a) c)
2 2 2
4 4 4 +
E E E 2, 6 2, G 2, 6
t .c .c 15. 15.
<l> <l> <l> n "0 " - 8 c: 8 - 8 c: C <l> '" '" E E E :;:; :;:; :;:; '" (j) (j) I/) I/) (/)
10 10 10
12 PS1605·2 (336),
12 " PS1501 (794),
12 PS1639·2 (490),
1674 m, 1724 m, 1566 m, 14 OPO: 25* cm 14 OPO: 1,2 cm 14 OPO: 6.0 cm
Oxygen [jJMJ Oxygen [pM] Oxygen [jJM] 0 100 200 300 0 100 200 300 0 100 200 300
0, " .. -.-.. ---.~- o ' ~ 0- 0
7~~ij r"'" d) ...----- e) ,..- ,f 2, 2, 2
4" 4, 4·
E E E ::!.. 6 ::!.. 6 ::!.. 6 .c t .c a. a. <l> <lI <lI
" " '" ijj 8 " 8 1:: 8
'" <lJ E E E 'i'i :;:; :;:; '" <lJ <l> C/) (/) (/)
10 10, 10
12 PS1477 (684), 12 PS1812·1 (516),
12 PS1811·1 (515),
1956 rn, 1358 m, 1146 m, '14, OPO: 20* cm 14, OPD: 23* cm 14 OPO: 12* cm
Figure 4-9: Selected oxygen profiles measured in Region C (Figure 4-6, Transect C). This west-east transect off
the Antarctic coast starts at 32° W (Station PS 1605-2) and ends at the Gunnerus Ridge at 33° E (Station PS 1811-1).
Although the differences found in the three provinces are not surprising since they
reflect different eco systems, the open ocean regions A and B exhibit interesting
parallels: Both are situated within the diatom ooze belt and receive benthic fluxes in the
69
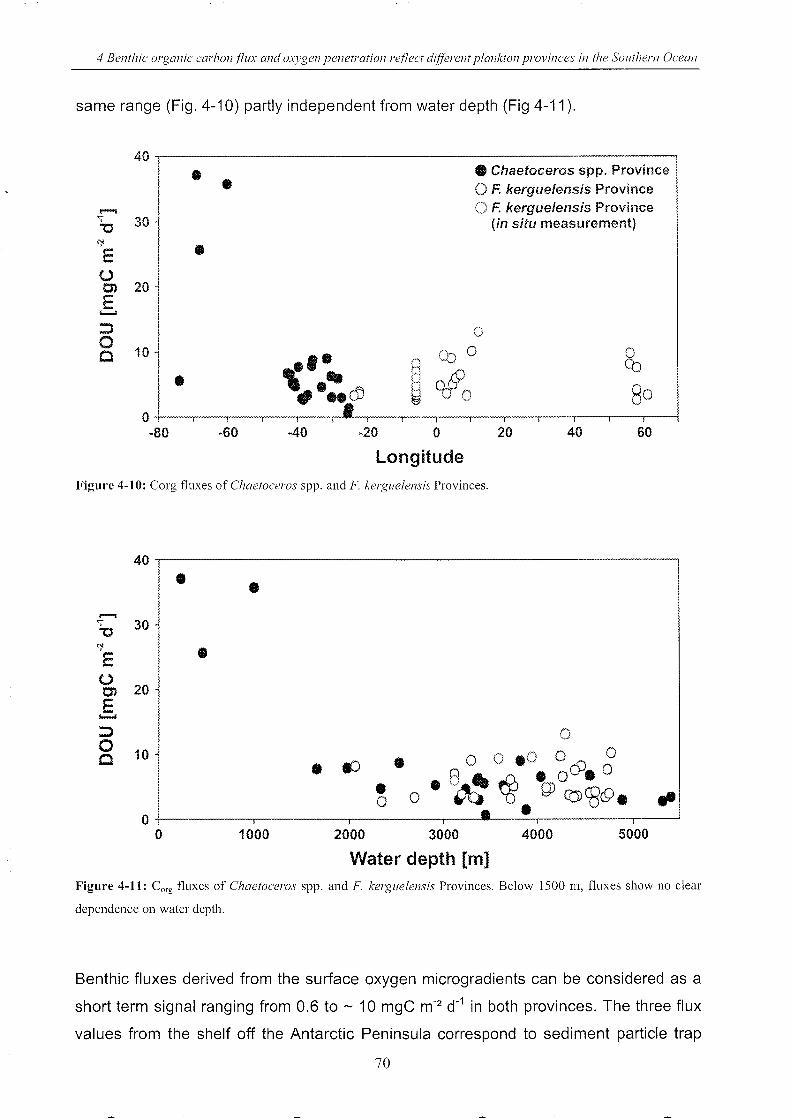
4 Benthic organic carbon/fIl); and oxygen penetration re/lect difFerent plankton provinces in the SOllthern Ocean
same range (Fig. 4-10) partly independent from water depth (Fig 4-11).
40 .. • Chaetoceros spp. Province .. o F. kerguelensis Province
...... F. kerguelensis Province ~
30 (in situ measurement) "0 ~ .. E u 0) 20 E ....... ::l 0 0
10 C 0 80 Cl ('':. ~ 0
(jJ .. ~ 80 .-of Cd 1'"'1
~,'
0 -80 -60 -40 -20 0 20 40 60
longitude Figure 4-10: Corg fluxes of Chaetocel'Os spp. and F. kerguelensis Provinces.
::l o Cl
40~------------------------------------------------------'
• • 30
.. 20
• e:::;' -10 o 0.0 0 0 _ 8 .. M • 0 cP. 0
~ 0 ~ Y5 Q) ctDctlc9. .. O+---------.--------.---------.---·-----·.---------.---~
o 1000 2000 3000 4000 5000
Water depth [m] Figure 4-11: Corg fluxes of Chaetocel'Os spp. and F. kerglle1ensis Provinces. Below 1500 Ill, fluxes show no clear
dependence on water depth.
Benthic fluxes derived from the surface oxygen microgradients can be considered as a
short term signal ranging from 0.6 to - 10 mgC m-2 d-1 in both provinces. The three flux
values from the shelf off the Antarctic Peninsula correspond to sediment particle trap
70
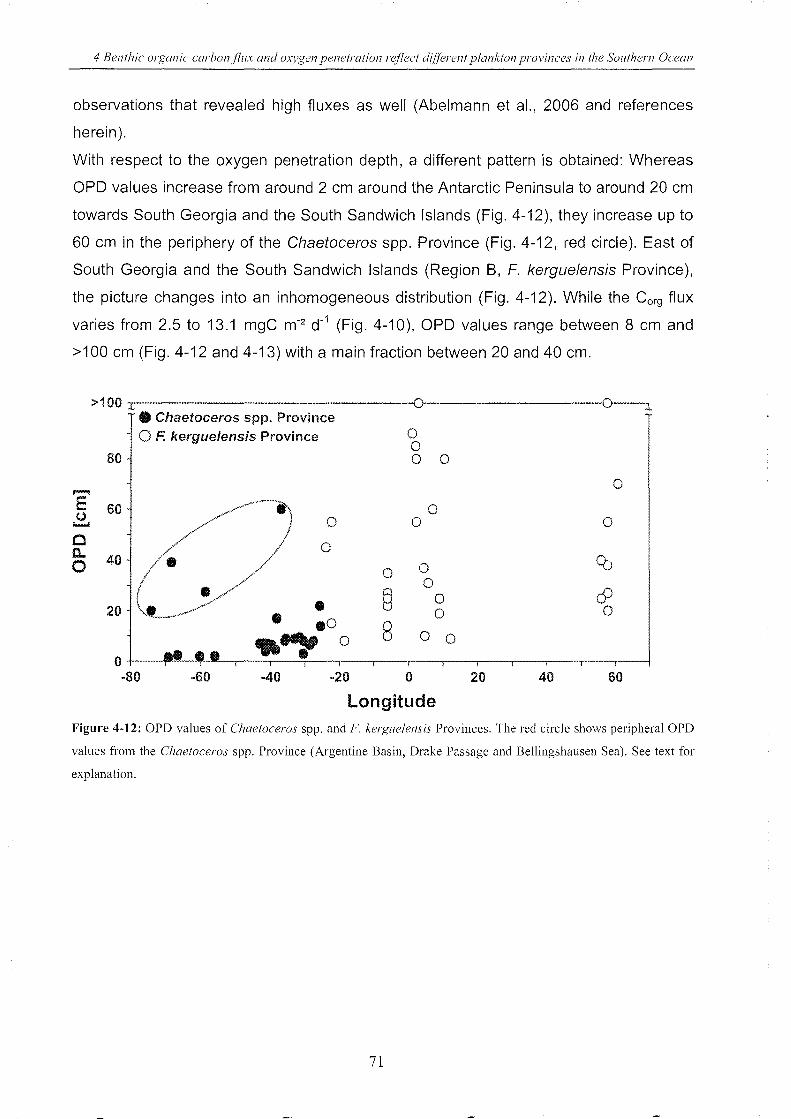
4 Benthic organic carbonflux and oxvgen penetration reflect difFerent plankton provinces in the SOllthem Ocean
observations that revealed high fluxes as well (Abelmann et al., 2006 and references
herein).
With respect to the oxygen penetration depth, a different pattern is obtained: Whereas
OPD values increase from around 2 cm around the Antarctic Peninsula to around 20 cm
towards South Georgia and the South Sandwich Islands (Fig. 4-12), they increase up to
60 cm in the periphery of the Chaetoceros spp. Province (Fig. 4-12, red circle). East of
South Georgia and the South Sandwich Islands (Region B, F. kerguelensis Province),
the picture changes into an inhomogeneous distribution (Fig. 4-12). While the Corg flux
varies from 2.5 to 13.1 mgC m-2 d-1 (Fig. 4-10), OPD values range between 8 cm and
>100 cm (Fig. 4-12 and 4-13) with a main fraction between 20 and 40 cm.
>100 x • Chaetoceros spp. Province
0 ~
o F. kerguelensis Province 0 0
80 0 0
0 ...... E 60 /} 0 (.)
0 0 0 ....... C 0..
U. 0
0 40 0 CO
0
§ 0
& • 0 20 0 0
eO 8 .. ." 0 0 0
0 -80 -60 -40 -20 0 20 40 60
Longitude Figure 4-12: OPD values of Chaetoceros spp. and F. kergllelensis Provinces. The red circle shows peripheral OPD
values from the Chaetoceros spp. Province (Argentine Basin, Drake Passage and BeIIingshausen Sea). See text for
explanation.
71
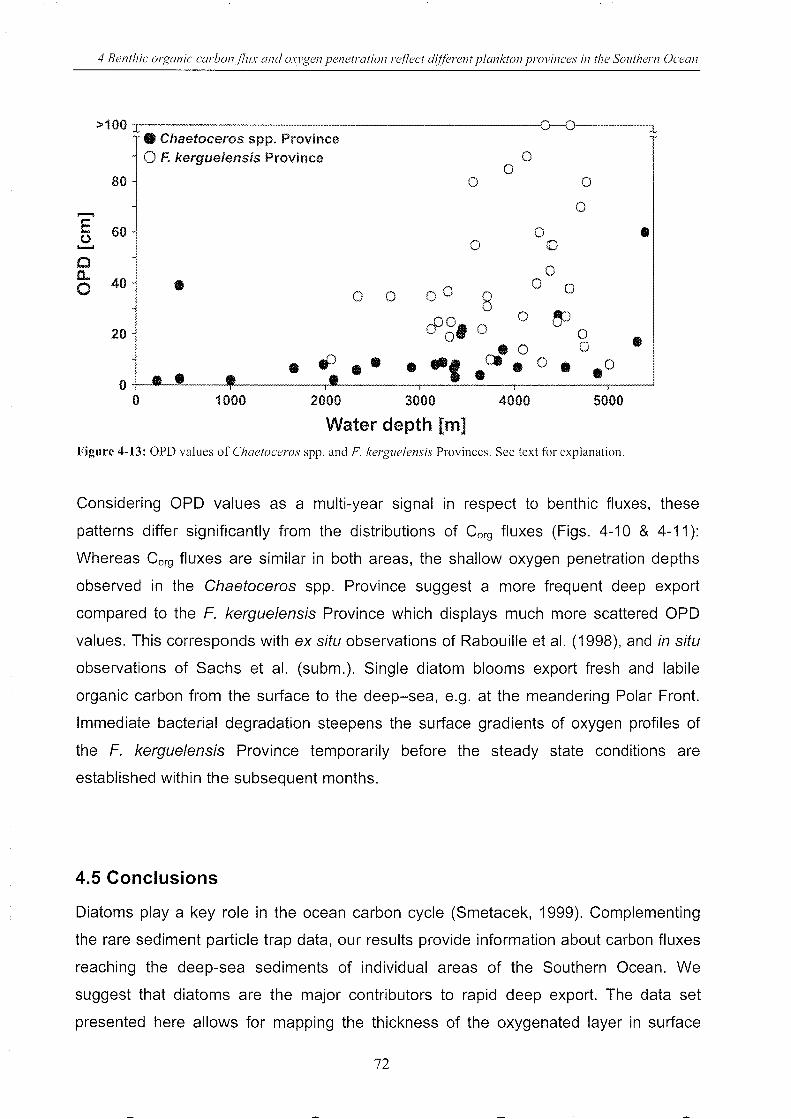
4 Benthic organic carbon/lux and oxygen penetration reflect different plankton provinces in the Southern Ocean
>100 1 0-0 ::L • Chaetoceros spp. Province o F. kergueiensis Province 0
0 80 0 0
0 ....... E 60 0 • 0 0 (() ....... C 0 0... 0 40 • 0 0 0 0 0 0 8
c9g, 0 ~ 20 0 0
ca- 0 0 • - tP -- • -t 0 • .0 . -0 0 1000 2000 3000 4000 5000
Water depth [m] Figure 4-13: OPD values of Chaetoceros spp. and F. kerguelensis Provinces. See text for explanation.
Considering OPD values as a multi-year signal in respect to benthic fluxes, these
patterns differ significantly from the distributions of Corg fluxes (Figs. 4-10 & 4-11):
Whereas Corg fluxes are similar in both areas, the shallow oxygen penetration depths
observed in the Chaetoceros spp. Province suggest a more frequent deep export
compared to the F. kerguelensis Province which displays much more scattered OPD
values. This corresponds with ex situ observations of Rabouille et al. (1998), and in situ
observations of Sachs et al. (subm.). Single diatom blooms export fresh and labile
organic carbon from the surface to the deep-sea, e.g. at the meandering Polar Front.
Immediate bacterial degradation steepens the surface gradients of oxygen profiles of
the F. kerguelensis Province temporarily before the steady state conditions are
established within the subsequent months.
4.5 Conclusions
Diatoms play a key role in the ocean carbon cycle (Smetacek, 1999). Complementing
the rare sediment particle trap data, our results provide information about carbon fluxes
reaching the deep-sea sediments of individual areas of the Southern Ocean. We
suggest that diatoms are the major contributors to rapid deep export. The data set
presented here allows for mapping the thickness of the oxygenated layer in surface
72
4 Benthic Olganic carbon/7ux and oxygen penetration reflect differellt plankto/1 provinces in the SOllthem Ocean
sediments as multi-year flux information for different diatom provinces. This proves the
concept of Abelmann et al. (2006), which suggests that productive zones are reflected
in the sediments. Transferred to glacial/interglacial times, it permits to regionalize sinks
of CO2 of past climate cycles. Furthermore, the determination of paleo Corg fluxes from
this relationship would provide important input for the comprehension of export and
burial processes as well as CO2 modelling. According to Smetacek (1999), there are still
fundamental gaps in our knowledge which will have to be bridged in order to completely
understand global elementary cycles, their time scales as well as their implications in
respect to global change. Connecting modern oceanic phytoplankton provinces with
deep-sea carbon fluxes, the present paper aims to contribute to the understanding of
controls and feed backs of biogeochemical cycles in the Southern Ocean.
We conclude from these investigations that diatoms are more important for the vertical
flux of organic carbon than previously assumed. It is obvious that diatom-dominated
ecosystems such as the Southern Ocean play a major potential role in respect to CO2
drawdown. This is clearly supported by our flux correction.
Furthermore, we propose to continue enlarging the database of high quality in situ flux
measurements (e. g. from the Scotia Sea, Antarctic shelf and slope). In particular, by
measuring below specific patches of diatom blooms, one could more exactly determine
export capacities, burial efficiencies and remineralization rates of individual diatom
species. Doing so, the regional distribution of benthic carbon fluxes can be used as the
basis for a more detailed modelling of CO2 draw down in the Southern Ocean.
Acknowledgements
We gratefully acknowledge the skilled support of captain and crew of the RV Polarstern.
We thank Jan Wegner, Ludmila Baumann, and Michael Gensheimer for their
unremitting technical and laboratory support during Expedition ANT-XXI/4. The
manuscript benefited from useful comments of Philipp Assmy and Victor Smetacek.
This study has been co-funded by the Deutsche Forschungsgemeinschaft within the
Priority Program SPP 1158 (SA 1030/1-1 - 1-4).
73
4 Benthic organic carbon flux and oxygen penetration reflect different plankton provinces in the Southern Ocean
4.6 References
Abelmann, A., Gersonde, R., Cortese, G., Kuhn, G., Smetacek, V., 2006. Extensive phytoplankton
blooms in the Atlantic sector of the glacial Southern Ocean. Paleoceanography 21, PA 1013.
Anderson, L. A., Sarmiento, J. L., 1994. Redfield ratios of remineralization determined by nutrient data
analysis. Global Biogeochemical Cycles 8, 65-80.
Armand, L. K., Crosta, X., Romero, 0., Pichon, J.-J., 2005. The biogeography of major diatom taxa in
Southern Ocean sediments: 1. Sea ice related species. Palaeogeography, Palaeoclimatology,
Palaeoecology 223, 93-126.
BarneU, P. R. 0., Watson, J., Conelly, D., 1984. A multiple corer for taking virtually undisturbed samples
from shelf, bathyal, and abyssal sediments. Oceanologica Acta 7, 399-408.
Barthel, D., 1997. Presence of fluff in an Antarctic shelf trough, at 600 m depth. In: Arntz, W., GuU, J.
(eds.), The Expedition ANTARKTIS XIII/3 (EASIZ I) of Polarstern to the eastern Weddell Sea in
1996, Reports on Polar Research 249, 16-17.
Bathmann, U., Scharek, R., Klaas, C., Dubischar, C. D., Smetacek, V., 1997. Spring development of
phytoplankton biomass and composition in major water masses of the Atlantic sector of the Southern
Ocean. Deep-Sea Research 1144 (1-2), 51-68.
Berg, P., Risgaard-Petersen, N., Rysgaard, S., 1998. Interpretation of measured concentration profiles in
sediment pore water. Limnology and Oceanography 43,1500-1510.
Blain, S., Queguiner, B., Armand, L., Belviso, S., Bombled, B., Bopp, L., Bowie, A., Brunet, C., Brussaard,
C., Carlotti, F., Christaki, U., Cobiere, A., Durand, I., Ebersbach, F., Fuda, J.-L., Garcia, N., Gerringa,
L., Griffiths, B., Guigue, C., Guillerm, C., Jacquet, S., Jeandel, C., Laan, P., Lefevre, D., Monaco, C.
L., Malits, A., Mosseri, J., Obernosterer, I., Park, Y.-H., Picheral, M., Pondaven, P., Remenyi, T.,
Sandroni, V., Sarthou, G., Savoye, N., Scouarnec, L., Souhaut, M., Thuiller, D., Timmermans, K.,
Trull, T., Uitz, J., van Beek, P., Veldhuis, M., Vincent, D., Viollier, E., Vong, L., Wagener, T., 2007.
Effect of natural iron fertilization on carbon sequestration in the Southern Ocean. Nature 446, 1070-
1074.
Boudreau, B. P., 1997. Diagenetic Models and their Implementation. Springer, Berlin, 414 pp.
Brachfeld, S., Domack, E., Kissel, C., Laj, C., Leventer, A., Ishman, S., Gilbert, R., Camerlenghi, A.,
Eglington, L. B., 2003. Holocene history of the Larsen-A ice shelf constrained by geomagnetic
paleointensity dating. Geology 31, 749-752.
Burckle, L. H., Cirilli, J., 1987. Origin of the diatom ooze belt in the Southern Ocean: implications for the
late Quaternary paleoceanography. Micropaleontology 33, 82-86.
Cai, W.-J., Sayles F. L., 1996. Oxygen penetration depths and fluxes in marine sediments. Marine
Chemistry 52, 123-131.
Caldeira, K., Duffy, P. B., 2000. The role of the Southern Ocean in uptake and storage of anthropogenic
carbon dioxide. Science 287,620-622.
Charles, C. D., Froelich, P. N., Zibello, M. A., Mortlock, R. A., Morley, J. J., 1991. Biogenic opal in
southern ocean sediments over the last 450.000 years, Implications for surface water chemistry and
circulation. Paleoceanography 6,697-728.
74
4 Benthic organic carbon/l1lx and ox)'gen penetration reflect ditlerent plankton pl'Ovil1ces in the Southern Ocean
Crawford, R. M., 1995. The role of sex in the sedimentation of a marine diatom bloom. Limnology and
Oceanography 40, 200-204.
Crosta, X., Pichon, J.-J., Labracherie, M., 1997. Distribution of Chaetoceras resting spores in modern
peri-Antarctic sediments. Marine Micropaleontology 29, 283-299.
Crosta, X., Romero, 0., Armand, K. L., Pichon, J.-J., 2005. The biogeography of major diatom taxa in
Southern Ocean sediments: 2. Open ocean related species. Palaeogeography, Palaeociimatology,
Palaeoecology 223, 66-92.
Day ton, P. K., 1990. Polar benthos. In: Smith, W. O. Jr (ed.), Polar oceanography. Part B: Chemistry,
biology, and geology, San Diego, Academic Press, 631-685.
De Baar, H. J. W., de Jong, J. T. M., Bakker, D. C. E., Lbscher, B. M., Veth, C., Bathmann, U., Smetacek,
V., 1995. Importance of iron for plankton blooms and carbon dioxide drawdown in the Southern
Ocean. Nature 373,412-415.
De Witt, R, Relexans, J.-C., Bouvier, T., Moriarty, D. J. W., 1997. Microbial respiration and diffusive
oxygen uptake of deep-sea sediments in the Southern Ocean (ANTARES-I cruise). Deep-Sea
Research 1144 (5), 1053-1068.
DeFelice, D. R, Wise, S. W. J., 1981. Surface lithofacies, biofacies and diatom diverity patterns as
models for delineation of climatic change in the southeast Atlantic Ocean. Marine Micropaleontolgy
6,29-70.
DiTullio, R, Grebmeier, J. M., Arrigo, K. R, Lizotte, M. P., Robinson, D. H., Leventer, A., Barry, J. P.,
VanWoert, M. L., Dunbar, R B., 2000. Rapid and early export of Phaeocystis antarctica blooms in
the Ross Sea, Antarctica. Nature 404, 595-598.
Estrada, M., Oelgado, M., 1990. Summer phytoplankton distributions in the Weddell Sea. Polar Biology
10, 441-449.
Fischer, G., Futterer, D., Gersonde, R, Honjo, S., Ostermann, D., Wefer, G., 1988. Seasonal variability of
particle flux in the Weddell Sea and its relation to ice cover. Nature 335, 426-428.
Fischer, G., Gersonde, R, Wefer, G., 2002. Organic carbon, biogenic silica and diatom fluxes in the
marginal winter sea-ice zone and in the Polar Front Region: interannual variations and differences in
composition. Deep-Sea Research 1149 (9-10),1721-1745.
Fischer, G., Muller, P. J., Wefer, G., 1998. Latitudinal 513Corg variations in sinking matter and sediments
from the South Atlantic: effects of anthropogenic CO2 and implications for paleo-PC02
reconstructions. Journal of Marine Systems 17, 417-495.
Fischer, G., Ratmeyer, V., Wefer, G., 2000. Organic carbon fluxes in the Atlantic and the Southern
Ocean: relationship to primary production compiled from satellite radiometer data. Deep-Sea
Research 1147 (9-11),1961-1997.
Fischer, G., Wefer, G., Romero, 0., Dittert, N., Ratmeyer, V., Donner, B., 2003. Transfer of particles into
the deep Atlantic and the global ocean: control of nutrient supply and ballast production. In: Wefer,
G., Mulitza, S., Ratmeyer, V. (eds.). The South Atlantic in the late Quaternary: reconstruction of
material budgets and current systems, Springer, 21-46.
Geibert, W., Rutgers van der Loeff, M., Usbeck, R., Gersonde, R, Kuhn, G., Seeberg-Elverfeldt, J., 2005.
Quantifying the opal belt in the Atlantic and southeast Pacific sector of the Southern Ocean by
means of 230Th normalization. Global Biogeochemical Cycles 19, GB4001.
75
4 Benthic organic carbon/lllx and oxygen penetration reflect different plankton provinces in the SOllthern Ocean
Gersonde, R., Wefer, G., 1987. Sedimentation of biogenic siliceous particles in Antarctic waters from the
Atlantic sector. Marine Micropaleontology 11,311-332.
Glud, R. N., Gundersen, J. K., Holby, 0., 1999. Benthic in situ respiration in the upwelling area of central
Chile. Marine Ecology Process Series 186, 9-18.
Glud, R. N., Gundersen, J. K., J0rgensen, B. B., Revsbech, N. P., Schulz, H.-D. 1994. Diffusive and total
oxygen uptake of deep-sea sediments in the eastern South Atlantic Ocean, in situ and laboratory
measurements. Deep-Sea Research 141 (11-12),1767-1788.
Glud, R. N., Holby, 0., Hoffmann, F., Canfield, D. E., 1998. Benthic mineralization and exchange in Arctic
sediments (Svalbard, Norway). Marine Ecology Process Series 173, 237-251.
Grasshoff, K., Erhard, M., Kremling, K., 1983. Methods of Seawater Analysis. Verlag Chemie, Weinheim,
417pp.
Gutt, J., Starmans, A., Dieckmann, G., 1998. Phytodetritus deposited on the Antarctic shelf and upper
slope: its relevance for the benthic system. Journal of Marine Systems 17, 435-444.
Holby, 0., 1994. Oxygen, nutrients, pH and CaC03 . in: Bathmann, U., Smetacek, V., de Baar, H.,
Fahrbach, E., Krause, G. (eds.), The Expeditions ANTARKTIS X/6-8 of the Research Vessel
Polarstern in 1992/93, Reports on Polar Research 135, 117-121.
Holby, 0.,1996. Geochemestrie. In: Miller, H. , Grobe, H. (eds.), The Expedition ANTARKTIS-XI/3 of RV
Polarstern in 1994, Reports on Polar Research 188, 20-22.
Honjo, S., 2004. Particle export and the biological pump in the Southern Ocean. Antarctic Science 16,
501-516.
Hulth, S., Tengberg, A., LandEln, A., Hall, P. O. G., 1997. Mineralization and burial of organic carbon in
sediments of the southern Weddell Sea (Antarctica). Deep-Sea Research 144 (6), 955-981.
Jahnke, R. A., 1996. The global ocean flux of particulate organic carbon: areal distribution and
magnitude. Global Biogeochemical Cycles 10, 71-88.
Jordan, R. W., Priddle, J., Pudsey, C. J., Barker, P. F., Whitehouse, M. J., 1991. Unusual diatom layers in
Upper Pleistocene sediments from the northern Weddell Sea. Deep-Sea Research Part A 38 (7),
829-843.
Jouse, A. P., Koroleva, G. S., Nagaeva, G. A., 1962. Diatoms in the surface layer of sediment in the
Indian sector of the Antarctic (in Russian with English summary). Trudy Instituta Okeanologii
(=Transactions of the Institute of Oceanology) Akademija Nauk SSSR 61, 19-92.
Kellogg, D. E., Kellogg, T. B., 1987. Microfossil distributions in modern Amundsen Sea sediments. Marine
Micropaleontology 12, 203-222.
Kumar, N., Anderson, R. F., Mortlock, R. A., Froelich, P. N., Kubik, P., Dittrich-Hannen, B., Suter, M.,
1995. Increased biological productivity and export production in the glacial Southern Ocean. Nature
378, 675-680.
Lampitt, R. S., 1985. Evidence for the seasonal deposition of detritus to the deep-sea floor and its
subsequent resuspension. Deep-Sea Research 32, 885-897.
Lampitt, R. S., Antia, A. N., 1997. Particle flux in deep seas: regional characteristics and temporal
variability. Deep-Sea Research 44 (8), 1377-1403.
Mackensen, A., Hubberten, H.-W., Bickert, T., Fischer, G. & FOtterer, D. K. 1993. The 513C in benthic
foraminiferal tests of Fontbotia wuellerstorfi (Schwager) relative to the 513C of dissolved inorganic
76
4 Benthic organic carbol1fl1lx and oxygen penetration reflect difFerent plal1kton provinces in the S01lthern Ocean
carbon in Southern Ocean deep water: implications for glacial ocean circulation models.
Paleoceanography 8, 587-610.
Martinov, I., Gnanadesikan, A, Toggweiler, J. R., Sarmiento, J. L., 2006. The Southern Ocean
biogeochemical divide. Nature 441, 964-967.
Mohan, R., Shanvas, S., Thamban, M., Sudhakar, M., 2006. Spatial distribution of diatoms in surface
sediments from the Indian sector of Southern Ocean. Current Science 91, 1495-1502.
Nelson, D. M., Tn3guer, P., Brzezinski, M. A, Leynaert, A, Queguiner, B., 1995. Production and
dissolution of biogenic silica in the ocean: revised global estimates, comparison with regional data
and relationship to biogenic sedimentation. Global Biogeochemical Cycles 9, 359-372.
Orsi, A H., Whitworth Ill, T., Nowlin Jr., W. D., 1995. On the meridional extent and fronts of the Antarctic
Circumpolar Current. Deep-Sea Research I 42 (5), 641-673.
Pinturier-Geiss, L., Laureillard, J., Riaux-Gobin, C., Fillaux, J., Saliot, A, 2001. Lipids and pigments in
deep-sea surface sediments and interfacial particles from the Western Crozet Basin. Marine
Chemistry 75, 249-266.
Pudsey, C. J., Barker, P. F., Hamilton, N., 1988. Weddell Sea sediments: a record of Antarctic bottom
water flow. Marine Geology 81,289-314.
Rabouille, C., Gaillard, J.-F., Relexans, J.-C., Treguer P., Vincendeau, M.-A, 1998. Recycling of organic
matter in Antarctic sediments: A transect through the polar front in the Southern Ocean (Indian
Sector), Limnology and Oceanography 43, 420-432.
Reimers, C. E., 1987. An in situ microprofiling instrument for measuring interfacial pore-water gradients:
methods and oxygen profiles from North Pacific Ocean. Deep-Sea Research 34, 2019-2035.
Reimers, C. E., Fischer, K. M., Merewether, R., Smith Jr., K. L., Jahnke, R. A, 1986. Oxygen
microprofiles measured in situ in deep ocean sediments. Nature 320, 741-744.
Revsbech, N. P., J0rgensen, B. B., 1986. Microelectrodes and their use in microbial ecology. In: Marshall,
K. C. (ed.), Advantagesin microbial ecology 9. Plenum, New York, 293-352.
Riaux-Gobin, C., Hargraves, P. E., Neveux, J., Oriol, L., Vetion, G., 1997. Microphyte pigments and
resting spores at the water-sediment interface in the Subantarctic deep sea (Indian sector of the
Southern Ocean). Deep-Sea Research 11 44 (5), 1033-1051.
Riemann, F., 1992. Studies of small rhizopodan protests and nematodes at the sediment surface and in
sea ice. In: Bathmann, U., Schulz-Baldes, M., Fahrbach, E., Smetacek, V., Hubberten, H.-W. (eds.),
The Expeditions ANTARKTIS IXl1-4 of the Research Vessel Polarstern in 1990/91, Reports on Polar
Research 100, 206-208.
Rutgers van der Loeff, M. M., 1990a. Oxygen in pore waters of deep- sea sediments. Philosophical
Transactions of the Royal Society of London A 331,69-84.
Rutgers van der Loeff, M. M., 1990b. Diagenesis of organic matter and opal in surface sediments. In:
Gersonde, R. and Hempel, G. (eds.), The Expeditions ANTARKTIS VIII/3 and VII1I4 of RV
"Polarstern" in 1989, Reports on Polar Research 74, 95-96.
Rutgers van der Loeff, M. M., Berger, G. W., 1991. Scavenging and particle flux: seasonal and regional
variations in the Southern Ocean (Atlantic sector). Marine Chemistry 35, 553-568.
77
4 Benthic organic carbon/lux and oxygen penetration reflect different plankton provinces il/ the Southern Ocean
Rutgers van der Loeff, M. M., Friedrich, J., Bathmann, U., 1997. Carbon export during the Spring Bloom
at the Antarctic Polar Front, determined with the natural tracer 234Th . Deep-Sea Research 11 44 (1-2),
457-478.
Sachs, 0., Sauter, E. J., Schloter, M., Peeken, I., Assmy, P., Bathmann, U., Strass, V. H., Smetacek, V.,
submitted. Enhanced carbon export to deep-sea sediments underlying productivity hots pots in the
Southern Ocean. Nature.
Sarmiento, J. L., Gruber, N., Brzezinski, M. A., Dunne, J. P., 2004. High-latitude controls of thermocline
nutrients and low latitude biological productivity. Nature 427,56-60.
Sauter, E. J., SchlOter, M., Suess, E., 2001. Organic carbon flux and remineralization in surface
sediments from the northern North Atlantic derived from pore-water oxygen microprofiles. Deep-Sea
Research I 48 (2), 529-553.
Scharek, R., Tupas, L. M., Karl, D. M., 1999. Diatom fluxes to the deep sea in the oligotrophic North
Pacific gyre at Station ALOHA. Marine Ecology Process Series 182, 55-67.
Schloss, I. R., Ferreyra, G. A., 2002. Primary production, light and vertical mixing in Potter Cove, a
shallow bay in the maritime Antarctic. Polar Biology 25, 41-48.
SchlOter, M., 1990. Early diagenesis of organic carbon and opal in sediments of the southern and eastern
Weddell Sea. Reports on Polar and Marine Research 73, 156 pp.
SchlOter, M., 1991. Organic carbon flux and oxygen penetration into sediments of the Weddell Sea:
indicators for regional differences in export production. Marine Chemistry 35, 569-579.
Schloter, M., Rutgers van der Loeff, M. M., Holby, 0., Kuhn, G., 1998. Silica cycle in surface sediments of
the South Atlantic. Deep-Sea Research 145 (7), 1085-1109.
SchlOter, M., Sauter, E. J., Schulz-Bull, D., Balzer, W., Suess, E., 2001. Fluxes of organic carbon and
biogenic silica reaching the seafloor: A comparison of high northern and southern latitudes of the
Atlantic Ocean. In: Schafer, P., Ritzrau, W., Schloter, M., Thiede, J. (eds.). The northern North
Atlantic: A changing environment, Springer, 225-240.
Seiter, K., Hensen, C., Zabel, M., 2005. Benthic carbon mineralization on a global scale. Global
Biogeochemical Cycles 19, GB1010.
Smetacek, V., 1999. Diatoms and the ocean carbon cycle, Protist 250,25-32.
Smetacek, V., 1985. Role of sinking in diatom life-history cycles: Ecological, evolutionary and geological
significance. Marine Biology 84, 239-251.
Smetacek, V., Assmy, P., Henjes, J., 2004. The role of grazing in structuring Southern Ocean pelagic
ecosystems and biogeochemical cycles. Antarctic Science 16, 541-558.
Smetacek, V., de Baar, H. J. W., Bathmann, U., Lochte, K., Rutgers van der Loeff, M. M., 1997. Ecology
and biogeochemistry of the antarctic Circumpolar Current during austral spring: a summary of
Southern Ocean JGOFS cruise ANT X/6 of R.V. Polarstern [with CD-ROM]. Deep-Sea Research 11
44 (1-2).
Stockwell, D. A., Kang, S.-H., Fryxell, G. A., 1991. Comparisons of diatom biocoenoses with Holocene
sediment assemblages in Prydz Bay, Antarctica. Proceedings of the Ocean Drilling Program,
Scientific Results Vol. 119., 667-673.
Strass, V., Assmy, P., Bathmann, U., Bellerby, R., Berg, G. M., Cisewski, B., Croot, P., Gonzales, S.,
Henjes, J., Herndl, G., Leach, H., Losch, M., Montresor, M., Neill, C., Passow, U., Peeken, I.,
78
4 Benthic organic carbon/7ux and oxygen penetration re/7ect diflerent plankton provinces in the Southern Ocean
Rbttgers, R., Savoye, N., Webb, A., Wolf-Gladrow, D., Smetacek, V., submitted. Massive carbon flux
to the deep-sea from an iron fertilised phytoplankton bloom in the Southern Ocean. Nature.
Taylor, F., McMinn, A., 2001. Evidence from diatoms for Holocene climate fluctuation along the East
Antarctic margin. The Holocene 11, 455-466.
Tengberg, A., De Bouvee, F., Hall, P., Berelson, W., Chad wick, B., Cicceri, G., Crassous, P., Devol, A.,
Emerson, S., Gage, J., Glud, R., Graziottin, F., Gundersen, J., Hammond, D., Helder, W., Hinga, K.,
Holby, 0., Jahnke, R., Khripounoff, A., Lieberman, H., Nuppenau, V., Pfannkuche, 0., Reimers, C.,
Rowe, G., Sahami, A., Sayles, F., Schurter, M., Smallman, D., Wehrli, B., De Wilde, P., 1995.
Benthic chamber and profile landers in oceanography - A review of design, technical solutions and
functioning. Progress in Oceanography 35, 265-294.
Treguer, P., Van Bennecom, A. J., 1991. The annual production of biogenic silica in the Antarctic Ocean.
Marine Chemistry 35, 447-487.
Turner, J. T., 2002. Zooplankton faecal pellets, marine snow and sinking phytoplankton blooms. Aquatic
Microbial Ecology 27,57-102.
Wefer, G., Fischer, G., 1991. Annual primary production and export flux in the Southern Ocean from
sediment trap data. Marine Chemistry 35,597-613.
Wenzhbfer, F., Glud, R. N., 2002. Benthic carbon mineralization in the Atlantic: A synthesis based on in
situ data from the last decade. Deep-Sea Research 149,1255-1279.
Wenzhbfer, F., Holby, 0., Kohls, 0., 2001. Deep penetrating benthic oxygen profiles measured in situ by
oxygen optodes. Deep-Sea Research I 48, 1741-1755.
Zielinski, U., Gersonde, R., 1997. Diatom distribution in southern ocean surface sediments (Atlantic
sector): implications for paleoenvironmental reconstructions. Palaeogeography, Palaeoclimatology,
Palaeoecology 129, 213-250.
79
4 Benthic organic carbon/lux and oxygen penetration reflect difFerent plankton provinces in the S01lthern Ocean
80
5 Spatial variability of the transfer efficiency of primary produced carbon to the seafloor of the Atlantic Ocean
Oliver Sachs, Jill N. Schwarz, Eberhard J. Sauter, Michael SchlUter and Michael
Schodloku
Alfred Wegener Institute for Polar & Marine Research, Bremerhaven, Germany
u now at the Jet Propulsion Laboratory, Los Angeles, U.S.A.
Key words: export ratio, benthic organic carbon fluxes, deep-sea sediments, Southern
Ocean, microsensors
5.1 Abstract
Datasets of benthic oxygen fluxes, satellite-derived primary production estimates and
bathymetry have been used to derive transfer functions for the export of carbon from the
surface mixed layer to the sea floor, in the Southern and Atlantic Oceans.
Biogeochemical provinces defined a priOri using surface chlorophyll or sediment
characteristics could not be distinguished by their transfer efficiencies. However, a
posteriori definition of provinces based on the transfer efficiency showed a band of high
export efficiency along the Southern Ocean opal belt and in the northern North Atlantic.
Possible explanations for this are discussed. Basin-wide carbon export values were
calculated for the Southern, Atlantic and global oceans using the transfer functions
derived for the a posteriori-defined provinces. Areally integrated carbon fluxes were
within the range published from sediment trap studies, and lower than published values
calculated using inverse modelling of the f-ratio. For the Southern Ocean, areally
integrated carbon export to the sea floor in water deeper than 800 m was 0.055 PgCy(1
(0.6 % of net primary production). Incorporating higher export ratios within the opal belt
gave a value of 0.064 PgCyr-1.
Sachs, 0., Schwarz, 1. N., Sauter E. 1., SchlUter, M., Schodlok, M. submitted. Spatial variability of the transfer efficiency of primary produced carbon to the seafloor of the Atlantic Ocean. Global Biogeochemical Cycles.
81
5 Spatial variabilitv olthe transler efficiency ofjJri111QJY produced carbon to the seafloor oj'the Atlantic Ocean
5.2 Introduction
Carbon dioxide (C02 ) fixation by phytoplankton via photosynthesis decreases the partial
pressure of CO2 at the ocean surface. This process, combined with the subsequent
cycle of grazing and export to the deep, is often referred to as the "biological pump"
(Volk and Hoffert, 1985; Sarmiento and Le Quere, 1996), and represents one of the
major CO2 sinks (Cameron et al., 2005). The Southern Ocean (SO) is recognized as
one of the world's most important regions of carbon sequestration via the biological
pump (Kumar et al., 1995; Sarmiento et al., 2004) as well as for the solubility pump, i.e.
the physico-chemical pump of CO2 (Raven and Falkowski, 1999; Le QUEm~ et al., 2007).
The combination of these two processes in the Southern Ocean is attributed with the
uptake of -2 Pg of anthropogenic CO2 per year (Siegenthaler & Sarmiento, 1993;
Caldeira & Duffy, 2000) which is -32 % of the annual global anthropogenic emissions
during the 1990s (Houghton, 2003). The long-term efficacy of the biological pump
depends on the depth of carbon export: Delivery of particulate organic carbon to the
seafloor represents the longest isolation from the atmosphere (e.g. Boyd & Trull, 2007).
Organic carbon deposited at the sea floor is remineralized over days to years
depending on composition, microbial and macrobenthic activity and other environmental
factors. Refractory components are buried in the sediments for geological time scales
(Cai & Reimers, 1995). The effect of photosynthetic carbon fixation on CO2 partial
pressure in the water is negative except when carbon is used to form particulate organic
carbon platelets or shells (e.g. Raven & Falkowski, 1999). This means that in order to
quantify the efficiency of the biological pump, parameters such as primary production,
particulate inorganic and organic matter export and benthic carbon fluxes have to be
determined.
82
5 Spatial variabi1i(v of the tram/er etflciency oj'pril7larv produced carbon to the seafloor oj'tlze Atlantic Ocean
The upper limit for export to the deep is determined by surface primary production rates,
whereas the actual export into the deep sea is a complex, as yet incompletely
understood, function of phytoplankton cell shape, composition, aggregation, grazing and
ballasting (Asper et al., 1992; Dunne et al., 2005; Boyd & Trull, 2007; Passow & De La
Rocha, 2006; Kemp et al., 2006; Jin et al., 2006; Green & Sambrotto, 2006). Figure 5-1
illustrates some of the mechanisms particularly relevant for the SO. Primary production
is largely determined by physical factors (e.g. Longhurst, 1995; Holm-Hansen et al.,
2005) which may be typical for a region but vary over time scales of days to millennia.
83
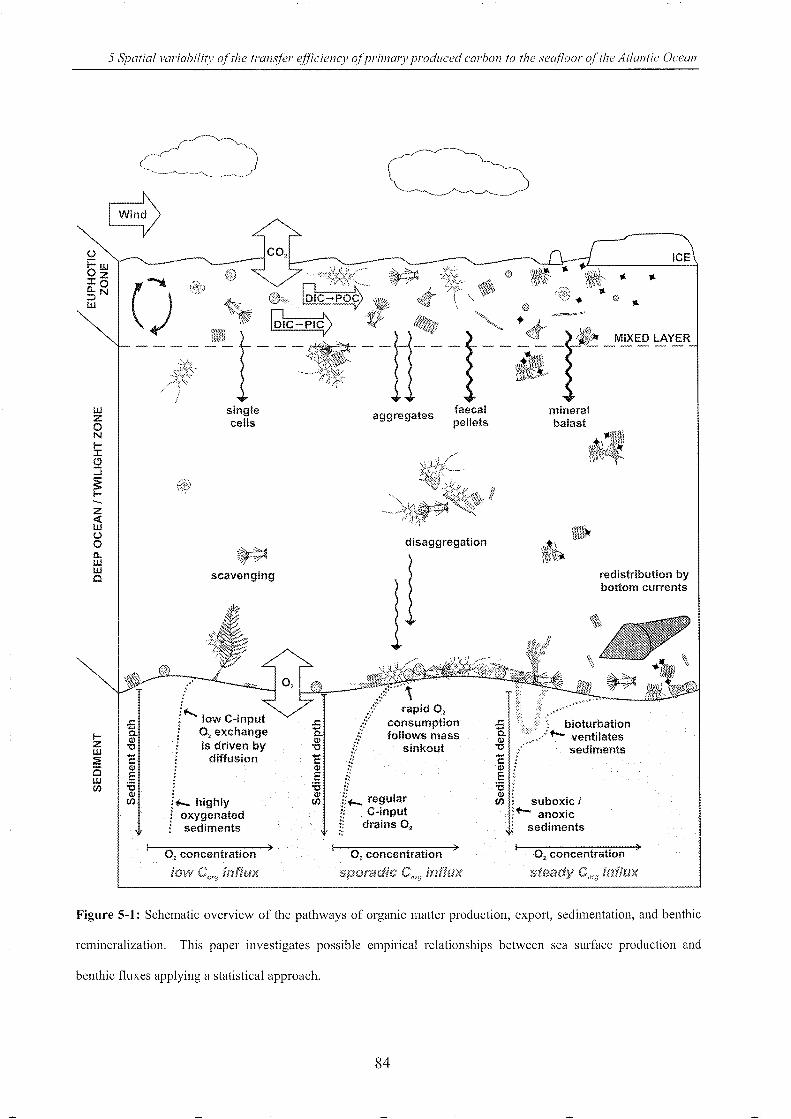
5 Spatial variabilit)! olthe transler efliciencv a/primary produced carbol1 to the seaj1oOl' olthe Atlantic Ocean
z « ill U o 0.. ill ill o
IZ ill ~ is ill r.n
single cells
.~ scavenging
~:~~.
i ...... Iow C-lnput : O2 exchange
is driven by diffusion
i+- highly : oxygenated J sediments
O2 concentration
Iow influx
)
.s::: .... 0. Q) "0 -C Q)
E :s Q)
r.n
aggregates faecal pellets
fI ,/j
disaggregation
""', //'con':~i~~;O" l fOIl~:o~:"
!!+- regular # C-input it drains O.
0, concentration )
sporadic inffux
mineral balast
redistribution by bottom currents
, bioturbation ,.,,./+- ventilates
'E /' sediments Q)
E :s ~: suboxic I
1'to- anoxic sediments
O2 concentration )
steady inffux
Figure 5-1: Schematic overview of the pathways of organic matter production, export, sedimentation, and benthic
remineralization, This paper investigates possible empirical relationships between sea surface production and
benthic fluxes applying a statistical approach,
84
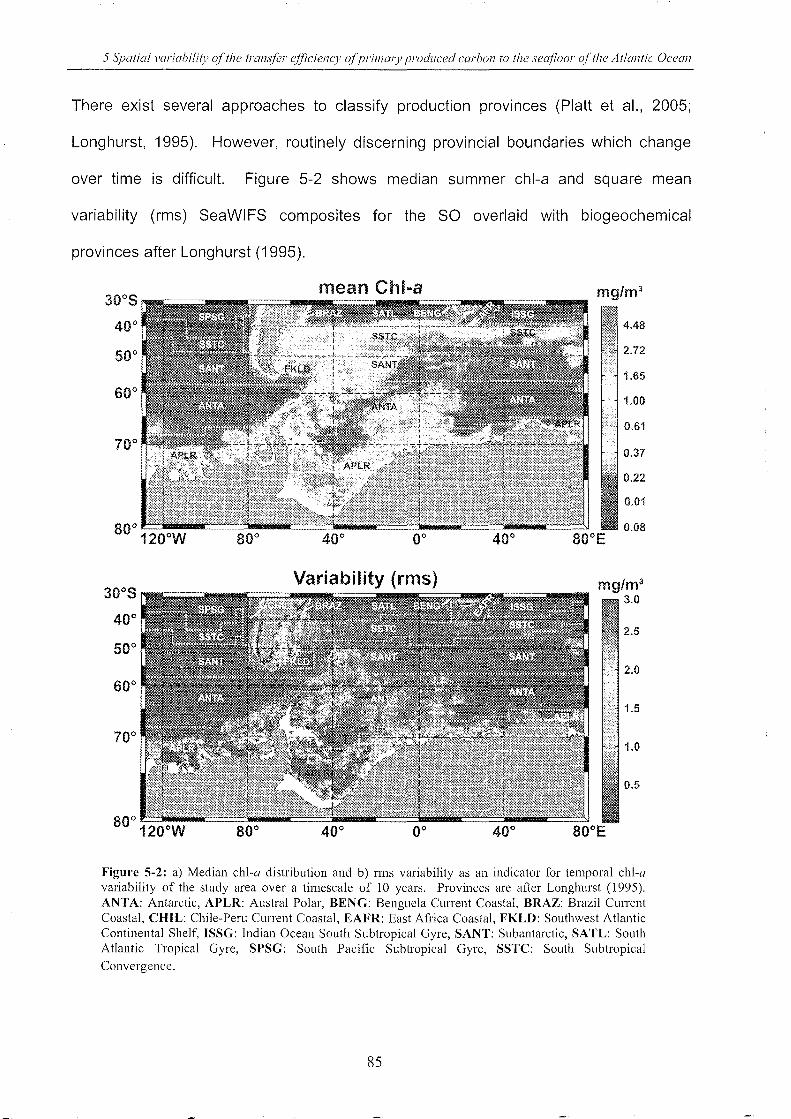
5 Spatial l'ariahilit)' olthe transler ejjiciencv olpril77aTY produced carhon to the sea/loor olthe Atlantic Ocean
There exist several approaches to classify production provinces (Platt et aI., 2005;
Longhurst, 1995). However, routinely discerning provincial boundaries which change
over time is difficult. Figure 5-2 shows median summer chl-a and square mean
variability (rms) SeaWIFS composites for the SO overlaid with biogeochemical
provinces after Longhurst (1995).
mean Chl-a 30°8
40° 4.48
50° 2.72
1.65
60° 1.00
0.61
70° 0.37
0.22
0.01
0.08
Variability (rms) ---
2.5
2.0
1.5
1.0
0.5
Figure 5-2: a) Median chI-a distribution and b) rms variability as an indicator for temporal chI-a variability of the study area over a timescale of 10 years. Provinces are after Longhurst (1995). ANTA: Antarctic, APLR: Austral Polar, BENG: Benguela Current Coastal, BRAZ: Brazil Current Coastal, CHIL: Chile-Peru Current Coastal, EAFR: East Africa Coastal, FKLD: Southwest Atlantic Continental Shelf, ISSG: Indian Ocean South Subtropical Gyre, SANT: Subantarctic, SATL: South Atlantic Tropical Gyre, SPSG: South Pacific Subtropical Gyre, SSTC: South Subtropical Convergence.
85
5 Spatial variabi1i(l' olthe transfer etllciencv o/jJri17larl' produced carbol1 to the sea/loor olthe Atlantic Oceal1
While both concentration and variability are well-contained by the Longhurst province
along the Antarctic coast, off-shore, the variability patterns do not lie neatly within the
boundaries. The more sophisticated approach of Sokolov & Rintoul (2007) utilises
satellite altimetry to track front locations and may solve the problem of determining
provincial boundaries in the Southern Ocean. Spatial patterns in flora and fauna have
also been observed at the more mysterious sea floor (Beamann & Harris, 2005; Brandt
et al., 2007a+b). Among others, Suess (1980) and Martin et a!. (1987) proposed
transfer functions for the coupling between the two compartments. Some studies
suggest the biogeochemical provinces at the surface to have influence on the export
regime (Lampitt & Antia, 1997). On the other hand, evidence for a decoupling between
ocean surface and sediment was reported e.g. by Buesseler, 1998, Se iter et a!. (2004,
2005) and Christensen (2000). Owing to the relative paucity of information about
community distributions in the twilight zone between these two domains, a complete
surface to benthos mapping of communities or particle export processes is not yet
possible, so that all determinations of benthic carbon flux distributions involve implicit
assumptions about midwater processes. There is evidence that the ecosystems
occupying waters below the euphotic zone are highly adaptable (Richardson et a!.,
2006; Zaric et al., 2005), which poses the question of the degree to which any regional
variability in export production is smoothed out as exported material proceeds to the
sea-floor. The problem of regional variability in export efficiency can be considered in
four stages: A) how much labile carbon sinks out of the euphotic zone? B) how well
is it protected? C) how long is it exposed to remineralising forces? D) how efficient is
the remineralising community?
In the case of point A, the most direct method of quantifying organic carbon export
production is to use particle traps, which provide estimates of carbon flux at
predetermined temporal resolution at a fixed location or drift-depth. These
86
5 Spatial variabilit)' of the transfer ejj7ciency ofprimaJ:l' produced carbo/1 to the seC/floor of the Atlantic Ocean
investigations, mostly carried out within the top 1000 m of the water column, show
pulsed and highly variable particle export. Longer term variability of fluxes is difficult to
determine due to logistical constraints on the duration of most studies. Well
documented technical limitations with respect to efficiency of different trap types (Gust
et al. 1994, Scholten et al., 2001) can, in part, be alleviated using 234Th correction (e.g.
Waples et al., 2006). This method remains invaluable for examining particle
sedimentation rates over time-scales of weeks to months. However, the number of
particle traps in the ocean is relatively low, particularly in the polar regions (Honjo, 2004
and references therein). Therefore it is difficult to derive basin-wide mean export
production rates from particle trap data.
Another method of determining carbon fluxes to the deep ocean involves use of the f
ratio - the ratio of new to regenerated production - and global-scale modelling
(Schlitzer, 2002; Schlitzer et al., 2003). However, the validity of the f-ratio for
determining export flux has been called into question, since nitrification is now known to
take place in the euphotic zone, rather than exclusively below the mixed layer (Dore &
Karl, 1996; Raimbault et al., 1999).
A third method is the calculation of benthic carbon fluxes using oxygen measurements
at the sediment / water interface. In contrast to sediment traps, this provides values of
carbon export through the twilight zone into the benthos. Oxygen uptake rates, i.e.
benthic oxygen consumption and pore water gradients, are closely linked to the
degradation of labile organic carbon at the sediment surface. Benthic oxygen uptake
rates can be derived from oxygen microprofiles and sediment incubations (e. g.
Revsbech & J0rgensen, 1986; Reimers et al., 1986; Glud et al., 1994; Berg et al.,
1998). Both methods can be applied in situ (at the seafloor) and ex situ (by retrieving
samples and measuring aboard ship). Except in the study of Hulth et al. (1997) there
exist no sediment incubation measurements for the Southern Ocean. In contrast, many
87
5 Spatial variabilitv of the transfer efficiency ojfJrimmy prod1tced carbon to the seajloor olthe Atlantic Ocean
flux determinations derived from oxygen microprofiles have been reported in the
literature for other regions (e. g. Archer et al., 1989; Sauter et al., 2001; Wenzhbfer &
Glud, 2002; Sachs et al. submitted 2007 and references therein). Diffusive oxygen
fluxes are converted into organic carbon rain rates on the basis of the Redfield Ratio
modified by Anderson & Sarmiento, (1994). Oxygen profiles also allow determination of
the depth of sedimentary oxygen penetration depth (oxygen penetration depth, OPD),
which is ecologically relevant as O2 supply can limit benthic faunal growth. Whereas
the organic carbon flux determined from oxygen microgradients reflects the recent
history of sedimentation and Corg remineralization by microbial activity, the oxygen
penetration depth reflects a long-term signal of benthic fluxes and can therefore be used
as a measure of long term carbon export to the seafloor. Measurements of total and
diffusive oxygen uptake at a range of sites across the globe have shown that benthic
Corg flux estimates based on diffusive oxygen uptake rates represent a lower limit on
carbon export (Wenzhbfer & Glud, 2002; Seiter et al., 2005; Christensen, 2000).
Sachs et al. (submitted 2006) observed an apparent correlation between in situ
determined benthic organic carbon flux measurements and the remotely-sensed surface
chl-a concentration at a few stations along the Antarctic Polar Front (APF). The link
between primary production (PP) and particle flux reported for mid-water particle traps
(e. g. Lampitt & Antia, 1997; Fischer et al., 2000; Francois et al., 2002; Lutz et al., 2002)
appeared to be applicable to benthic flux measurements performed in the deep-sea.
In this paper, the relationship between surface primary production and sea-floor carbon
remineralisation in the Southern Ocean is examined for the first time with a substantial
dataset. Coupling between chl-a concentrations in surface waters and OPD, and
between measured organic carbon remineralisation at the sea floor (hereafter assumed
to represent the minimum exported carbon, referred to as benthic Corg flux), was
examined for provinces defined using surface biomass and sediment characteristics.
88
5 Spatial variabilitv of the transfer efficiencv of primarv produced carbon to the sea/loor of the Atlantic Ocean
The effects of water depth and latitude were also examined. The objectives of this
study were:
1) to investigate whether statistically significant relationships could be
identified between sea surface productivity and benthic Corg fluxes for the
SO,
2) to test the hypothesis of whether different biogeochemical provinces,
characterized by different key phytoplankton species, can be distinguished
from one another by their sea surface: benthos regression characteristics;
and
3) to use the sea surface:benthos regression relationships to produce maps
of benthic Corgflux and OPO.
This analysis differs from previous studies in 3 fundamental respects: a) this study
focuses on the SO, which has previously been omitted from large-scale Corg flux
estimates (e.g. Jahnke, 1996; Antia et al., 2001) due to the very limited data coverage;
b) benthic oxygen flux measurements and sediment oxygen penetration depths are
used instead of mid-water sediment traps. This avoids the uncertainties of sediment
traps and chamber measurements and allows a lower limit for deep Corg export to be
calculated; c) long-term, median surface chlorophyll and primary production are used.
This eliminates the possibility of analysing inter-annual trends but allows the degree to
which surface-benthic biogeochemical systems are stable over decadal time scales to
be addressed. Time-scales involved are comparable to those used by Schlitzer et al.
(2003), but the methodology is quite different.
89
5 Spatial variabilitl' o/the transfer efficiency a/prill1ary produced carbon to the seaflaor a/the Atlantic Ocean
5.3 Methods
5.3.1 Database and data compilation
5.3.1.1 Point Data at individual sites in the Southern Ocean: Corg fluxes and OPD
Data derived from the measurement of oxygen profiles in surface sediments were
compiled from different sources and assessed for suitability for further analysis (Sachs
et al., submitted 2007). In situ and ex situ oxygen microprofiles were measured during
Polarstern Expeditions ANT V/4, ANT VI/2-3, ANT V1I1/3, 6, ANT X/5-6, ANT X1/3, ANT
XX1/4. This covers the following SO regions: Amundsen and Bellingshausen Seas
(Pacific Sector), Scotia and Weddell Seas, east Antarctic shelf and continental slope
and the Atlantic sector of the Antarctic Circumpolar Current. In total 134 microprofiles
were taken from the literature, of which 96 were suitable for derivation of Corg fluxes
(Sachs et al. submitted 2007). Additional published in situ flux determinations from
oxygen microprofiles were used to compare the results obtained for the SO with other
domains of the Atlantic Ocean (Archer et al., 1989; Jahnke et al., 1989; Glud et al.,
1994; Hales et al., 1994; Hales & Emerson, 1997; Lohse et al., 1998; Schloter et al.,
2000; Sauter et al., 2001; Wenzhbfer et al., 2001; Epping et al., 2002; Wenzhbfer et al.,
2002).
Determination of organic carbon fluxes
Benthic oxygen fluxes were partly determined in situ on the basis of oxygen
microprofiles obtained by an autonomous deep-sea microprofiler deployed in
combination with a free fall lander system. Ex situ profiles were measured in
undisturbed sediment samples recovered by a multiple corer (MUC, Barnett et al., 1984)
in the ship's cool laboratory at in situ temperature (Sachs et al., submitted 2007). In situ
and ex situ oxygen profiles were measured using Clark type glass microelectrodes.
90
5 Spatial variabilitl' of the transfer efficiency 0/1)/'ill1a/'\' produced carbol1 to the seafloor of the Atlal1tic Oceal1
Deep-sea and laboratory electrodes were calibrated prior to each measurement and
against the bottom water oxygen concentration determined by Winckler titration
(Grassoff et al., 1983). When microprofiles reached the depth of oxygen depletion, this
zero reading was used for calibration. Diffusive oxygen fluxes were determined from
the uppermost 3-5 mm of in situ and ex situ pore water oxygen profiles using the
software PROFILE (Berg et al., 1998) and were converted into organic carbon rain rates
on the basis of the modified Redfield Ratio (Anderson & Sarmiento, 1994), under the
assumption that in oligotrophic deep-sea sediments the major part of organic carbon is
remineralized by oxic respiration. Ex situ determined deep-sea fluxes of the SO were
depth corrected using the function Corg fluxcorr = Corg fluxex situ • (0.00039 • z + 0.91)
(Sachs et al., submitted 2007).
Determination of oxygen penetration depth
The in situ oxygen microprofiles were measured with a vertical resolution of 0.1-0.5 mm.
For ex situ measurements, laboratory microsensors were mounted into a
micromanipulator and profiles were measured with a vertical resolution of 0.1-2 mm.
The maximum profile depth was 32 cm. At cores where the anoxic zone was not
reached during the measurement, OPD was estimated by fitting a double exponential
function (Sachs et al., submitted 2007; Andersson et al., 2004) to the oxygen profile,
using the Matlab 'dtool' program.
5.3.1.2 Chlorophyll and primary production data (SeaWifs/MODIS)
Sea surface chl-a concentration data were obtained from the NASA internet portal
(http://oceancolor.gsfc.nasa.org).Chl-a concentrations at the sediment stations were
extracted from weekly, level 2 SeaWiFS data, with a spatial resolution of 9 km, for the
91
5 Spatialmriabilit), olthe transfer efliciencv ofpri177my produced carhon to the sea/7oor olthe Atlantic Ocean
period November 1997 to December 2006. SeaDAS v.S was used for data extraction,
while Matlab v.7.3 was used for subsequent analyses.
Two suites of net primary production data, based on the Vertically Generalized
Production Model (VGPM) and on the VGPM model with a correction for photo
acclimation (Eppley) were also obtained from NASA (http://oceancolor.gsfc.nasa.gov).
These primary production estimates are derived from SeaWiFS / MODIS chl-a and
photosynthetically available irradiance data along with MODIS / AVHRR sea surface
temperature data. The native spatial resolution for primary production was 9 km, and
the suitability of this was examined using a general circulation model (section 2.1.3)
The native temporal resolution is one month and the temporal range September 1997 to
October 2006. These data were preferred to the Coastal Zone Colour Scanner (CZCS)
derived dataset of Antoine et al. (1996) which has been used by many other studies
because the emphasis here is on the long-term median values of both chlorophyll and
primary production. As the CZCS was more a proof-of-concept mission for coastal
remote sensing, it was not designed or positioned for daily/two-daily repeat coverage
which both SeaWiFS and MODIS acquire. For median values, therefore, the more
modern sensors are more suitable. VGPM PP data were selected for further analysis,
while the Eppley PP data were retained, being similar in approach to the Antoine et al.,
(1996) data set, for comparison with the VGPM approach. Different sensor
characteristics of MODIS and SeaWiFS necessitate the use of different corrections and
chlorophyll algorithms: the resulting chlorophyll values are significantly different only in
highly turbid waters (oceancolor.gsfc.nasa.govNALlDATION). Comparison of the
weekly and monthly SeaWiFS and MODIS chlorophyll products at all stations used in
this study showed no systematic bias in the range of values at any location (data not
shown). Muller-Karger et al. (200S) found that CZCS- and SeaWiFS-derived global net
primary production estimates agreed to within ± 20%.
92
5 Spatial variahilitF of the trallsfer efficiellcy o/jJri171arl' produced carboll to the sea/loor oj'the Atlantic Ocean
Median, mean and maximum chl-a and primary production values were calculated over
the full range of remote-sensing data for each location where benthic measurements
were performed, for comparison with sediment variables. However, results are
significantly biased towards summer values for high latitudes: Since the focus of this
paper is the relationship between long-term carbon sequestration and primary
production in varying ecological regimes and at varying latitudes, it was decided not to
fix potentially arbitrary boundaries for 'summer'. This approach has the additional
advantage of maximizing coverage in cloudy / icy regions. A similar temporal bias is
also present in other datasets used to estimate Corg flux, with the exception of long-term
sediment trap deployments.
5.3.2 Consideration of lateral advection
Our comparison of surface production and benthic carbon input parameters (OPO, Corg
flux) is based on the assumption of a predominately vertical export. This approach is
most accurate if the grid size of the satellite chl-a observation is chosen to encompass
the likely distance of lateral advection. Mean monthly modelled velocities together with
a range of realistic sinking velocities (10, 200, 1000 m d-1) taken from literature (e. g.
Suzuki et al., 2001; Turner, 2002) were used to reconstruct, from the station location at
the sea-floor upwards, the lateral distance which could have been travelled by particles
deposited at the site during each month of the year.
Horizontal advection distances were calculated for each station using velocities from the
BRIOS-1 ice-ocean model (Beckmann et al., 1999; Schodlok et al., 2002) with 24 model
depths and a horizontal resolution of 1/6 x 1/3 deg within -50 0 to -80 0 S, and using
World Hydrographic Atlas data to the north. Despite the relatively high vertical
resolution of the model at the sea-floor compared to the inner ocean, the BRIOS-1
93
5 Spatial variability olthe tram/er e/lIciencv o(primarv produced carbon to the seaj700r olthe Atlal1tic Ocea11
model was not designed to simulate near-bottom turbidity currents, so that the
possibility of large near-bottom transport distances was not considered. To the best of
our knowledge, no large-scale ice-ocean models currently running have the capability to
predict bottom currents, and efforts to overcome this limitation are hindered by a lack of
data for validating such predictions and by poor bathymetric charts - necessary for
accurately predicting near-bottom flow - over large areas of the Southern Ocean.
5.3.3 Connecting surface chl-a with benthic Corg fluxes and OPD values
To test whether the relationships between surface and benthos vary regionally, two
approaches were taken to a priori classification of ecological provinces: The first method
uses only surface chlorophyll data from the last ten years' remote sensing record. The
second method uses only benthic sediment information from the literature. Results of
these grouping procedures were also compared with the provinces determined by
Longhurst (1995) and by Seiter et al. (2004).
5.3.3.1 A priori groups based on surface chlorophyll data (CD groups)
The chl-a distribution groups were determined using root mean square variability (rms)
on the summer chl-a concentration and the log-transformed chl-a concentration at all
stations. Gaussian curves were fit to histograms of these two variables. Best fits were
obtained by assuming two Gaussian distributions for rms and three for chi-a. 'Low',
'medium' and 'high' value thresholds were chosen as the intersection points between
Gaussian distributions. The 134 stations were then assigned to one of the six groups
according to their chl-a and rms-chl-a values. The group defined as 'Iow chi-a, high
rms' was found to be empty. The group defined as 'high chi-a, low rms' contained only
two stations which, since this is insufficient for statistical testing, were re-assigned to the
94
5 Spatiall'ariahilitv of the transfer efficiencl' ojjJril1larv prod1lced carbon to the seafloor of the Atlantic Ocean
group 'med chi-a, low rms'. The remaining four chlorophyll data groups are henceforth
referred to as 'CD groups':
CD1: low chl-a / low rms,
CD 2: median chl-a / low rms,
CD X: high chl-a / low rms, (2 stations reassigned to C02)
CD Y: low chl-a / high rms, (empty)
CD 3: medium chl-a / high rms,
CD 4: high chl-a / high rms.
5.3.3.2 A priori groups based on surface sediment data (SED groups)
Groupings based on sediment data from the literature were assigned to each station
using sediment surface distributions of Fragilariopsis kerguelensis, Chaetoceros spp.
and depth (Jouse et al., 1962; DeFelice & Wise, 1981; Burckle & Cirilli, 1987; Zielinski &
Gersonde, 1997; Armand et al., 2005; Crosta et al., 1997; Mohan et al., 2006). Owing
to a lack of information in the Amundsen and Bellingshausen Seas, the stations in this
area were placed in a separate group. Similarly, stations in the Atlantic, north of 30 0 S,
were also placed into a separate group. The resulting six sediment record groups are
henceforth referred to as 'SED groups'.
One-way analysis of variance (AN OVA) was used to determine whether each of the
grouping systems produced distinctive subsets of stations based on oxygen penetration
depth (OPD), organic carbon flux, chi-a, pp and rms-chl-a.
5.3.3.3 Coupling between the sea surface and benthos
Direct coupling of sea surface to benthic data was tested using linear regression
analyses between pp and Corg flux and between chl-a and OPD, i.e.:
95
5 Spatial variabilitl' olthe transler eflicienc~l' olpl'imarv produced carbon to the sea/70or olthe Atlantic Ocean
Corg flux = a1 • pp
In OPD = a2 • In median chi a + a3
Eq.1
Eq.2
Subsequently, several equations relating Corg flux, pp and depth from the literature
were considered:
Antia et al. (2001): In Corg flux = a1' In pp + a2' In z + a3
Schloter et al. (2000): In (Corg flux) = a1' In (PP) + a2 • In (z)
Suess (1980): Corg flux
Eq.3
Eq.4
Eq.S
Multiple-ANOVA tests were performed to establish whether the CD or SED groups were
distinctive in the 2-dimensional (chl-a and OPD / PP and Corg flux) and 3-dimensional
(including depth) parameter space.
The most statistically significant of the resulting fits was applied to the ten-year
Southern Ocean (40 0 S to 80 0 S, circumpolar) and Atlantic (70 0 W to 20 0 E, 80 0 S to 80 0 N)
median PP data to produce a map of benthic Corg flux. Corg flux was then integrated
over basin and depth intervals. Area per pixel of the primary production product was
calculated by taking each value as a pixel-midpoint, locating a square midway to the
neighbouring pixels and calculating area as:
A = (11/180) • R2 • I sin Ai - sin 1.,2 I • I <1>1 - <1>2 I Equation 9
Where the Earth's radius R was assumed to be 6371 km, Ai and 1.,2 are the northern and
southern latitude boundaries and <1>1 and <1>2 the west and east longitude boundaries.
96
5 Spatial variabilitv of the transfer efficiencv of primal' v produced carbon to the seafloor of the Atlantic Ocean
5.4 Results and discussion
5.4.1 Lateral advection
As reported in Table 5-1, mean net lateral advection calculated using monthly current
fields produced by the BRIOS circulation model was found to be less than 5 km for even
the slowest sinking particles. One station at 74° 15' S, 26° 17' W (PS1596-2) was an
extreme outlier with extreme advection distances up to -32 km. Based on these results
and the resolution of available NASA level 3 data, the native satellite data resoltion of
9 km was retained. The linkage between surface chl-a values and benthic Corg fluxes
should not be severely affected by lateral advection except where bottom currents,
which could not be modelled, are strong. In a similar study, Muller-Karger et al., 2005
also retained 9 km resolution with the reasoning that only a small proportion of POC
undergoes lateral transport. However, it should be noted that anecdotal evidence (U.
Bathmann, AWl, pers. comm.) as well as point studies (Geibert et al., 2005) indicate
that the influence of bottom currents may be significant in many areas, including the
Southern Ocean opal belt. In this case, correlations between surface production and
benthic oxygen uptake rates will be determined not only by the transfer function with
depth but also by the spatial coherence of the surface biomass. In order for advection
along the sea floor to produce a systematic bias in statistical analyses, the deposition
area for advective currents would have to be large (traversing gradients of at least an
order of magnitude in surface chlorophyll values) and spatially coherent, producing an
over-estimate of the export efficiency for the region in question. Such an effect can only
be ruled out by intensive in situ sampling or by focussed modelling efforts.
97
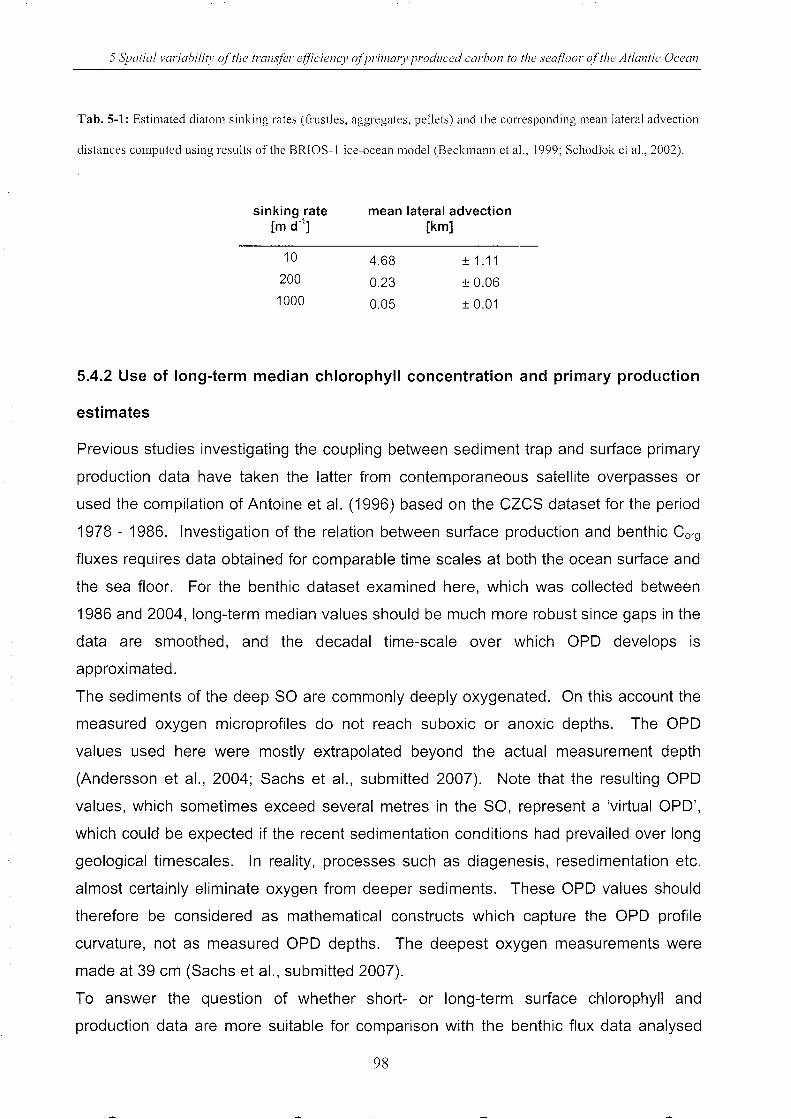
5 Spatial variabilitv oj'the transfer etJIciency oj'primary prod1lced carbon to the seafloor of the Atlantic Ocean
Tab. 5-1: Estimated diatom sinking rates (frustles, aggregates, pellets) and the conesponding mean lateral advection
distances computed using results of the BR10S-1 ice-ocean model (Beckmann et aI., 1999; Schodlok et al., 2002).
sinking rate [m d,1]
10
200
1000
mean lateral advection [km]
4.68
0.23
0.05
± 1.11
± 0.06
± 0.01
5.4.2 Use of long-term median chlorophyll concentration and primary production
estimates
Previous studies investigating the coupling between sediment trap and surface primary
production data have taken the latter from contemporaneous satellite overpasses or
used the compilation of Antoine et a!. (1996) based on the CZCS dataset for the period
1978 - 1986. Investigation of the relation between surface production and benthic Corg
fluxes requires data obtained for comparable time scales at both the ocean surface and
the sea floor. For the benthic dataset examined here, which was collected between
1986 and 2004, long-term median values should be much more robust since gaps in the
data are smoothed, and the decadal time-scale over which OPO develops is
approximated.
The sediments of the deep SO are commonly deeply oxygenated. On this account the
measured oxygen microprofiles do not reach suboxic or anoxic depths. The OPO
values used here were mostly extrapolated beyond the actual measurement depth
(Andersson et al., 2004; Sachs et al., submitted 2007). Note that the resulting OPO
values, which sometimes exceed several metres in the SO, represent a 'virtual OPO',
which could be expected if the recent sedimentation conditions had prevailed over long
geological timescales. In reality, processes such as diagenesis, resedimentation etc.
almost certainly eliminate oxygen from deeper sediments. These OPO values should
therefore be considered as mathematical constructs which capture the OPO profile
curvature, not as measured OPO depths. The deepest oxygen measurements were
made at 39 cm (Sachs et al., submitted 2007).
To answer the question of whether short- or long-term surface chlorophyll and
production data are more suitable for comparison with the benthic flux data analysed
98
5 Spatial variabilitv of the transfer efficiency ofpril11arv produced carbon to the sea/700r of the Atlantic Ocea/1
here, the mechanisms of POC transport to the seafloor have to be taken into account: If
benthic measurements were carried out in the presence of freshly deposited organic
matter which is increasingly believed to contribute significantly to total benthic POC
fluxes, particularly at high latitudes (Nodder et al., 2005; Kemp et al. 2006), the resulting
Corg flux may not be representative for the site as the labile organic carbon of this
phytodetritus may be remineralised over time scales of days to weeks (e.g. Carney
1989; Turley & Lochte 1990; Conte et al. 1995). A measurement made a month after a
sedimentation event would therefore yield a different profile for the upper centimetres of
sediment, and hence a much lower value of benthic Corgflux (see Figure 5-1).
In contrast, the oxygen penetration depth represents the long-term benthic influx of
organic carbon and can therefore be used to gauge the representativeness of an
instantaneous Corg flux estimate. Assuming that remineralization and burial covary with
changing carbon rain rates, and that the export systems responsible for the
development of the sediment oxygen profile remain stable over many years, pairs of
measurements of OPO and Corgflux should fall along a line which describes the
depletion of O2 in the deeper sediments with increasing, regular rain rate and
associated 02 demand. Any measurement points affected by recent carbon deposition
should fall above this line, since more carbon is present that would be expected for the
long-term steady state. Figure 5-3 shows the strong coupling found between Corg flux
and OPO for the dataset employed here. Regression curves are described by:
For all data:
For the 80:
Corg flux = 63.8 . OPO-O.6476, r = -0.4557, n = 194
Corg flux = 8.23 . OPO-0.4694, r = -0.667, n = 126
For the Atlantic N of 30°8:
Corg flux = 14.9 . OPO-O.7723, r = -0.8312, n = 32
99
Equation 6a.
Equation 6b.
Equation 6c.
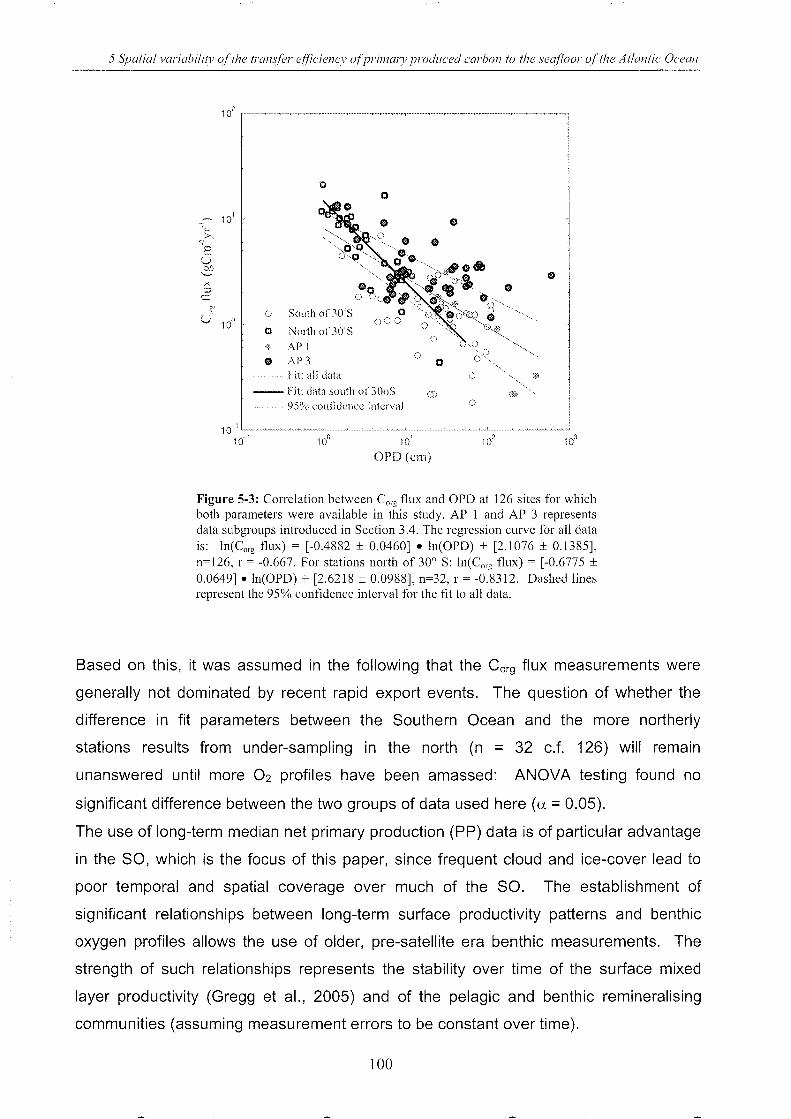
5 Spatial variabilitF otthe transfer efficiency otprimary produced carbon to the seafloor ot the Atlantic Ocean
10" r·············,·······,·················'''··.,.········· ... , ............... , .... , ... , .. ,." • .,.. ............................ "." .. " ........ .,. ........................... , ... , ... ,." .. , .... ,
.:- 10'
,.5;:.. 'p
C bD
o
o South of ~(YS
o North oi'3(Y'S
+ APl o APJ
................. Fit: all dala
o
-- Fit: data soul'h of JOoS
o
Co.)
95% l'onfld<:l1l'l' intl'rval 0
10" '---~~ .. ~~-"'--~~~~-~-~--'--~ .. ~~~""" 10' 10
1
OPD (cm)
Figure 5-3: Correlation between Corg flux and GPD at 126 sites for which both parameters were available in this study, AP 1 and AP 3 represents data subgroups introduced in Section 3.4. The regression curve for all data is: In(Corg flux) = [-0.4882 ± 0.0460] • In(OPD) + [2.1076 ± 0.1385], n=126, r = -0.667. For stations north of 30° S: In(Corg flux) = [-0.6775 ± 0.0649] • In(GPD) + [2.6218 ± 0.0988], n=32, r = -0.8312. Dashed lines represent the 95% confidence interval for the fit to all data.
Based on this, it was assumed in the following that the Corg flux measurements were
generally not dominated by recent rapid export events. The question of whether the
difference in fit parameters between the Southern Ocean and the more northerly
stations results from under-sampling in the north (n = 32 c.f. 126) will remain
unanswered until more 02 profiles have been amassed: ANOVA testing found no
significant difference between the two groups of data used here (a = 0.05).
The use of long-term median net primary production (PP) data is of particular advantage
in the SO, which is the focus of this paper, since frequent cloud and ice-cover lead to
poor temporal and spatial coverage over much of the SO. The establishment of
significant relationships between long-term surface productivity patterns and benthic
oxygen profiles allows the use of older, pre-satellite era benthic measurements. The
strength of such relationships represents the stability over time of the surface mixed
layer productivity (Gregg et al., 2005) and of the pelagic and benthic remineralising
communities (assuming measurement errors to be constant over time).
100
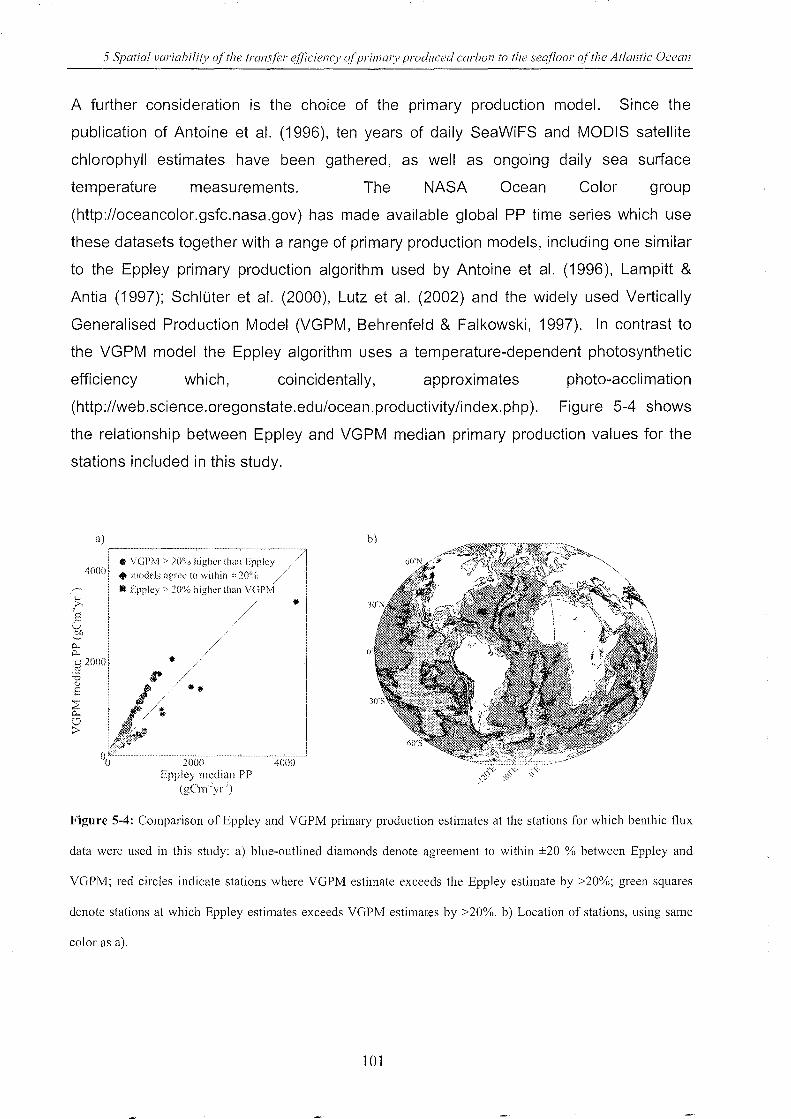
5 Spatial variabilitv of the transfer efficiency ofprimarv produced carhon to the seafloor of the Atlantic Ocean
A further consideration is the choice of the primary production model. Since the
publication of Antoine et al. (1996), ten years of daily SeaWiFS and MODIS satellite
chlorophyll estimates have been gathered, as well as ongoing daily sea surface
temperature measurements. The NASA Ocean Color group
(http://oceancolor.gsfc.nasa.gov) has made available global pp time series which use
these datasets together with a range of primary production models, including one similar
to the Eppley primary production algorithm used by Antoine et al. (1996), Lampitt &
Antia (1997); Schluter et al. (2000), Lutz et al. (2002) and the widely used Vertically
Generalised Production Model (VGPM, Behrenfeld & Falkowski, 1997). In contrast to
the VGPM model the Eppley algorithm uses a temperature-dependent photosynthetic
efficiency which, coincidentally, approximates photo-acclimation
(http://web.science.oregonstate.edu/ocean. productivity/index. php). Figure 5-4 shows
the relationship between Eppley and VGPM median primary production values for the
stations included in this study.
0... 0...
a)
C 2000 ~
u u 8
• VGPlvl > 20"'0 higher than Fppley
.. models agrc<: to within ± 20'% /' III Fppley> 20% higiler tilan VGPJvl
//
•
Epplcy median pp (gCm'yr')
Figure 5-4: Comparison of Eppley and VGPM primary production estimates at the stations for which benthic flux
data were used in this study: a) blue-outlined diamonds denote agreement to within ±20 % between Eppley and
VGPM; red circles indicate stations where VGPM estimate exceeds the Eppley estimate by >20%; green squares
denote stations at which Eppley estimates exceeds VGPM estimates by >20%. b) Location of stations, using same
color as a).
101
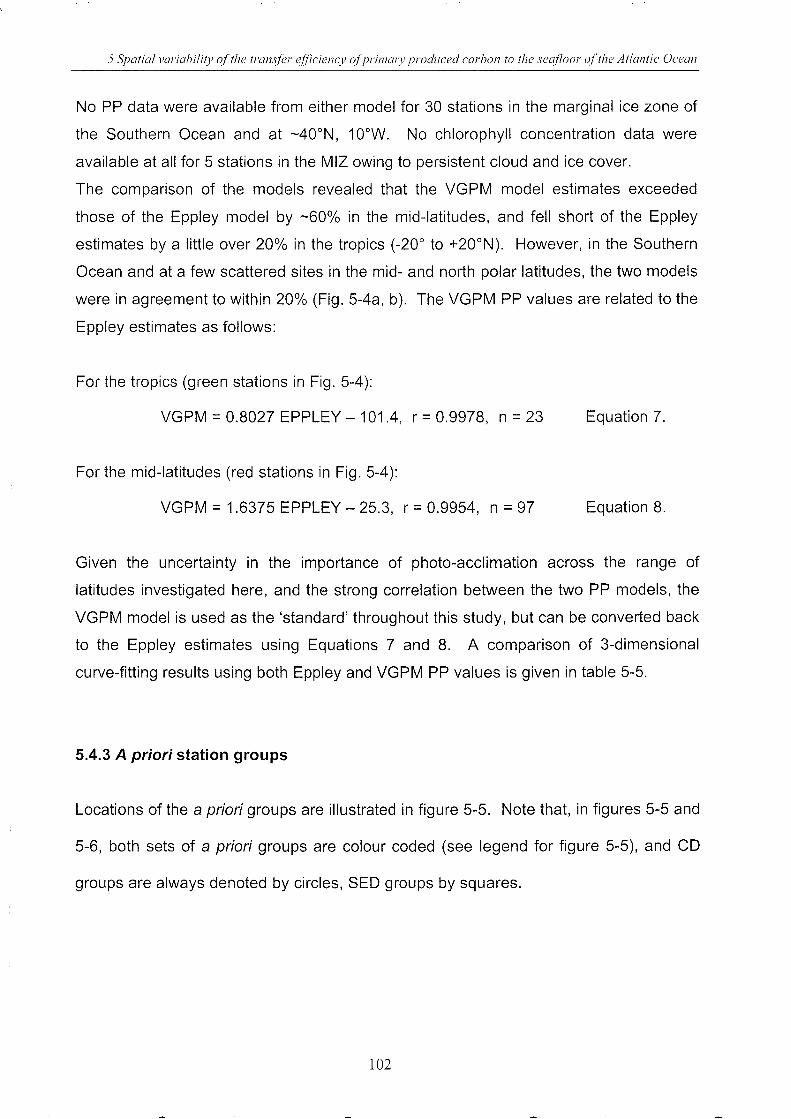
5 Spatial variability olthe transfer efficiency olpril71arv produced carbon to the seafloor olthe Atlantic Ocean
No pp data were available from either model for 30 stations in the marginal ice zone of
the Southern Ocean and at -400N, 100W. No chlorophyll concentration data were
available at all for 5 stations in the MIZ owing to persistent cloud and ice cover.
The comparison of the models revealed that the VGPM model estimates exceeded
those of the Eppley model by -60% in the mid-latitudes, and fell short of the Eppley
estimates by a little over 20% in the tropics (-20° to +200N). However, in the Southern
Ocean and at a few scattered sites in the mid- and north polar latitudes, the two models
were in agreement to within 20% (Fig. 5-4a, b). The VGPM pp values are related to the
Eppley estimates as follows:
For the tropics (green stations in Fig. 5-4):
VGPM = 0.8027 EPPLEY - 101.4, r = 0.9978, n = 23 Equation 7.
For the mid-latitudes (red stations in Fig. 5-4):
VGPM = 1.6375 EPPLEY - 25.3, r = 0.9954, n = 97 Equation 8.
Given the uncertainty in the importance of photo-acclimation across the range of
latitudes investigated here, and the strong correlation between the two pp models, the
VGPM model is used as the 'standard' throughout this study, but can be converted back
to the Eppley estimates using Equations 7 and 8. A comparison of 3-dimensional
curve-fitting results using both Eppley and VGPM pp values is given in table 5-5.
5.4.3 A priori station groups
Locations of the a priori groups are illustrated in figure 5-5. Note that, in figures 5-5 and
5-6, both sets of a priori groups are colour coded (see legend for figure 5-5), and CD
groups are always denoted by circles, SED groups by squares.
102
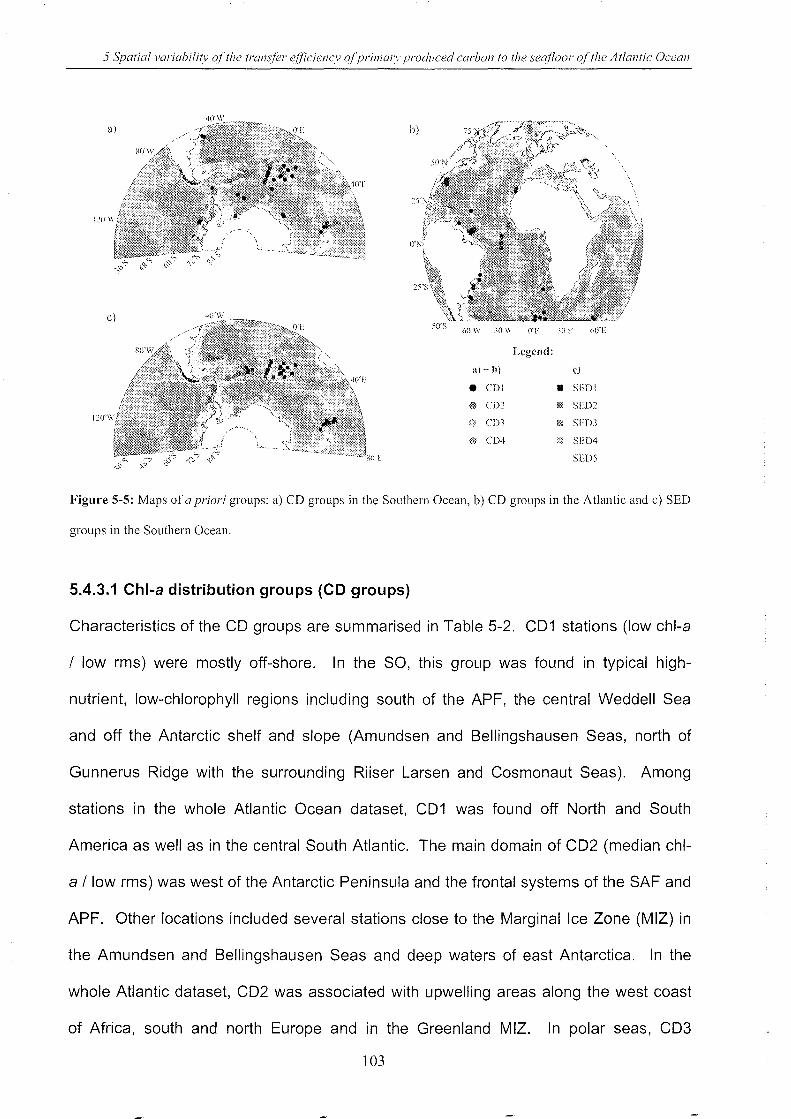
5 Spatial variabilitv of the transfer ejficiencl' of prim an' produced carbo/1 to the seafloor of the Atlantic Ocean
ill + h)
• CD!
@ C02
CD.)
® CD4
Legend:
£1
• SED!
00 SED::'
00 SEDJ
SED4
SED5
Figure 5-5: Maps of a priori groups: a) CD groups in the Southern Ocean, b) CD groups in the Atlantic and c) SED
groups in the Southern Ocean.
5.4.3.1 Chi-a distribution groups (CD groups)
Characteristics of the CD groups are summarised in Table 5-2. CD1 stations (Iow chl-a
/ low rms) were mostly off-shore. In the SO, this group was found in typical high-
nutrient, low-chlorophyll regions including south of the APF, the central Weddell Sea
and off the Antarctic shelf and slope (Amundsen and Bellingshausen Seas, north of
Gunnerus Ridge with the surrounding Riiser Larsen and Cosmonaut Seas). Among
stations in the whole Atlantic Ocean dataset, CD1 was found off North and South
America as well as in the central South Atlantic. The main domain of CD2 (median chl-
a / low rms) was west of the Antarctic Peninsula and the frontal systems of the SAF and
APF. Other locations included several stations close to the Marginal Ice Zone (MIZ) in
the Amundsen and Bellingshausen Seas and deep waters of east Antarctica. In the
whole Atlantic dataset, CD2 was associated with upwelling areas along the west coast
of Africa, south and north Europe and in the Greenland MIZ. In polar seas, CD3
103
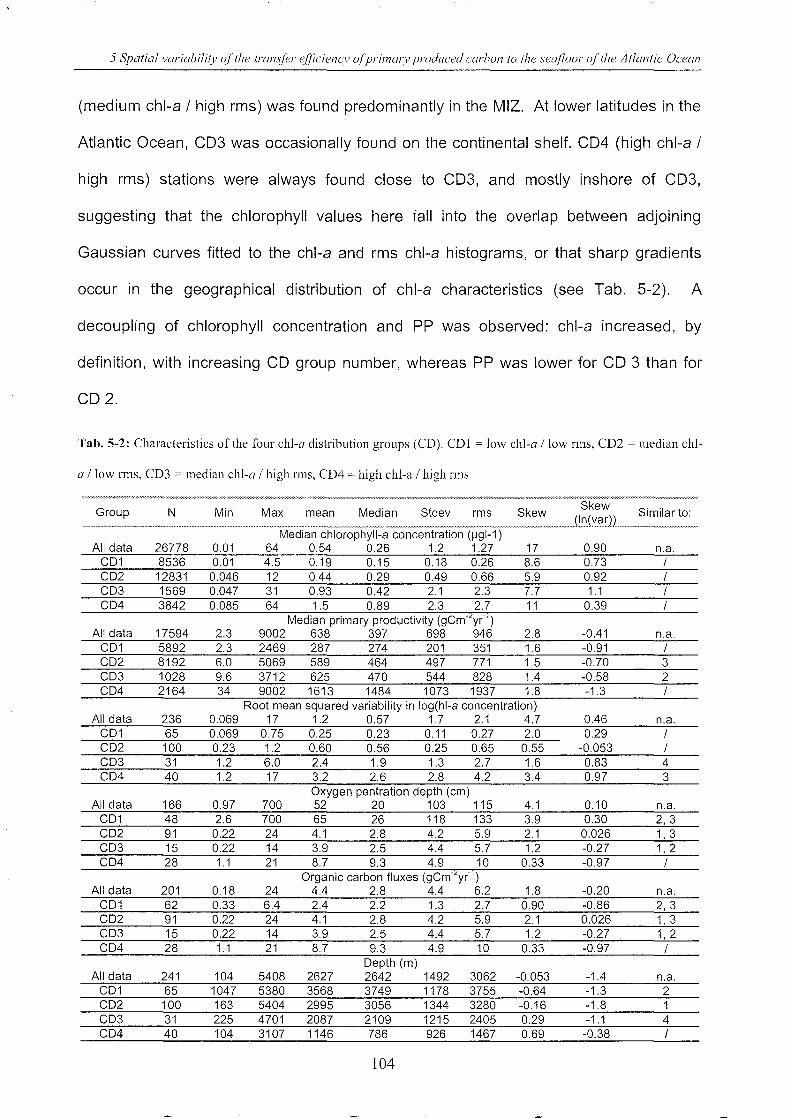
5 Spatial variabilitv olthe transler efliciencv olpri171GlY produced carbon to the sea/loor olthe Atlantic Ocean
(medium chl-a / high rms) was found predominantly in the MIZ. At lower latitudes in the
Atlantic Ocean, CD3 was occasionally found on the continental shelf. CD4 (high chl-a /
high rms) stations were always found close to CD3, and mostly inshore of CD3,
suggesting that the chlorophyll values here fall into the overlap between adjoining
Gaussian curves fitted to the chl-a and rms chl-a histograms, or that sharp gradients
occur in the geographical distribution of chl-a characteristics (see Tab. 5-2). A
decoupling of chlorophyll concentration and pp was observed: chl-a increased, by
definition, with increasing CD group number, whereas pp was lower for CD 3 than for
CD2.
Tab. 5-2: Characteristics of the four chi-a distribution groups (CD). CD I = low chi-a / low rms, CD2 = median chl-
a / low nns, CD3 = median chi-a / high rms, CD4 = high chl-a / high nns
Group N Min Max mean Median Stdev rms Skew (In(var)2 Similar to: "'''~-'---'-'-----~'-------'----~'--'''-''- ,,-,-~~---~-, -,,~--,,~--~---- __ ,_'_""._"''''''·A'''''''''''''''''''Y.'''~'''''~'''' """"'''--~,,--, """''''''''''''''''''''~~-,,~~--, -"",,,,,~~-....-.,,,,,,,,,,,,,,,,,,,,,,,,,,,
Median chlorophyll-a concentration (lJgl-1) All data 26778 0.01 64 0.54 0.26 1.2 1.27 17 0.90 n.a.
CD1 8536 0.01 4.5 0.19 0.15 0.18 0.26 8.6 0.73 I CO2 12831 0.046 12 0.44 0.29 0.49 0.66 5.9 0.92 I CD3 1569 0.047 31 0.93 0.42 2.1 2.3 7.7 1.1 I CD4 3842 0.085 64 1.5 0.89 2.3 2.7 11 0.39 I
Median primary productivity (gCm .2y( I) All data 17594 2.3 9002 638 397 698 946 2.8 -0.41 n.a.
CD1 5892 2.3 2469 287 274 201 351 1.6 -0.91 I CO2 8192 6.0 5069 589 464 497 771 1.5 -0.70 3 CD3 1028 9.6 3712 625 470 544 828 1.4 -0.58 2 CD4 2164 34 9002 1613 1484 1073 1937 1.8 -1.3 I
Root mean squared variability in log(hl-a concentration) All data 236 0.069 17 1.2 0.57 1.7 2.1 4.7 0.46 n.a.
CD1 65 0.069 0.75 0.25 0.23 0.11 0.27 2.0 0.29 I CO2 100 0.23 1.2 0.60 0.56 0.25 0.65 0.55 -0.053 I CD3 31 1.2 6.0 2.4 1.9 1.3 2.7 1.6 0.83 4 CD4 40 1.2 17 3.2 2.6 2.8 4.2 3.4 0.97 3
Oxygen pentration depth (cm) All data 166 0.97 700 52 20 103 115 4.1 0.10 n.a.
CD1 48 2.6 700 65 26 118 133 3.9 0.30 2,3 CO2 91 0.22 24 4.1 2.8 4.2 5.9 2.1 0.026 1,3 CD3 15 0.22 14 3.9 2.5 4.4 5.7 1.2 -0.27 1,2 CD4 28 1.1 21 8.7 9.3 4.9 10 0.33 -0.97 I
Organic carbon fluxes (gCm·2y(l) All data 201 0.18 24 4.4 2.8 4.4 6.2 1.8 -0.20 n.a.
CD1 62 0.33 6.4 2.4 2.2 1.3 2.7 0.90 -0.86 2, 3 CO2 91 0.22 24 4.1 2.8 4.2 5.9 2.1 0.026 1,3 CD3 15 0.22 14 3.9 2.5 4.4 5.7 1.2 -0.27 1,2 CD4 28 1.1 21 8.7 9.3 4.9 10 0.33 -0.97 I
Depth (m) All data 241 104 5408 2627 2642 1492 3062 -0.053 -1.4 n.a.
CD1 65 1047 5380 3568 3749 1178 3755 -0.64 -1.3 2 CO2 100 163 5404 2995 3056 1344 3280 -0.16 -1.8 1 CD3 31 225 4701 2087 2109 1215 2405 0.29 -1.1 4 CD4 40 104 3107 1146 786 926 1467 0.69 -0.38 I
104
5 Spatial variabili(v of the transfer efficiencv of pri/11arv produced carbon to the sea/100r of the Atlantic Ocean
5.4.3.2 Sediment provinces (SED groups)
Characteristics of the sediment groups are given in Tab. 5-3. SED1, SED2, SED3 and
SED4 contain stations which were located in regions of reported enhanced diatom
sedimentation. According to Crosta et al. (1997), Zielinski & Gersonde (1997), Armand
et al. (2005) and Abelmann et al. (2006), the surface sediments around the Antarctic
Peninsula, the Scotia Sea and the region around South Georgia and the South
Sandwich Islands are abundant in Chaetoceros spp. resting spores (accounting for
20 % of identified diatom frustules around South Georgia and the South Sandwich
Islands, up to 100 % at the Antarctic Peninsula). The SED1 group mirrors the
distribution of this Chaetoceros province. Diatoms of the genus Chaetoceros are
normally weakly silicified and their frustules poorly preserved in sediments (e.g. Zielinski
& Gersonde, 1997). The domain of SED2 is characterised by a content of >40 %
Fragilariopsis kerguelensis (F. kerg.) frustules. The distribution of this more heavily
silicified species corresponds with the distribution of the silica belt in the open ocean of
the region of the SO considered here (Jouse et al., 1962; DeFelice & Wise, 1981;
Zielinski & Gersonde, 1997; Crosta et al., 1997; Mohan et al., 2006). SED3 lies within
the east Antarctic shelf region and the continental slope with water depths of up to 2000
m. This province is characterized by patchy and inhomogeneous sedimentation
(Schloter, 1991) with varying physical and biological properties. The coastal ecosystem
is shaped by local, regional, seasonal and inter-annual ice-conditions including coastal
polynyas as well as area-specific topography and hydrography. All stations in the SO
Atlantic Sector which could not be assigned to one of the other three groups were
assigned to SED4. These locations are generally characterized by lower sedimentation
of siliceous material.
105
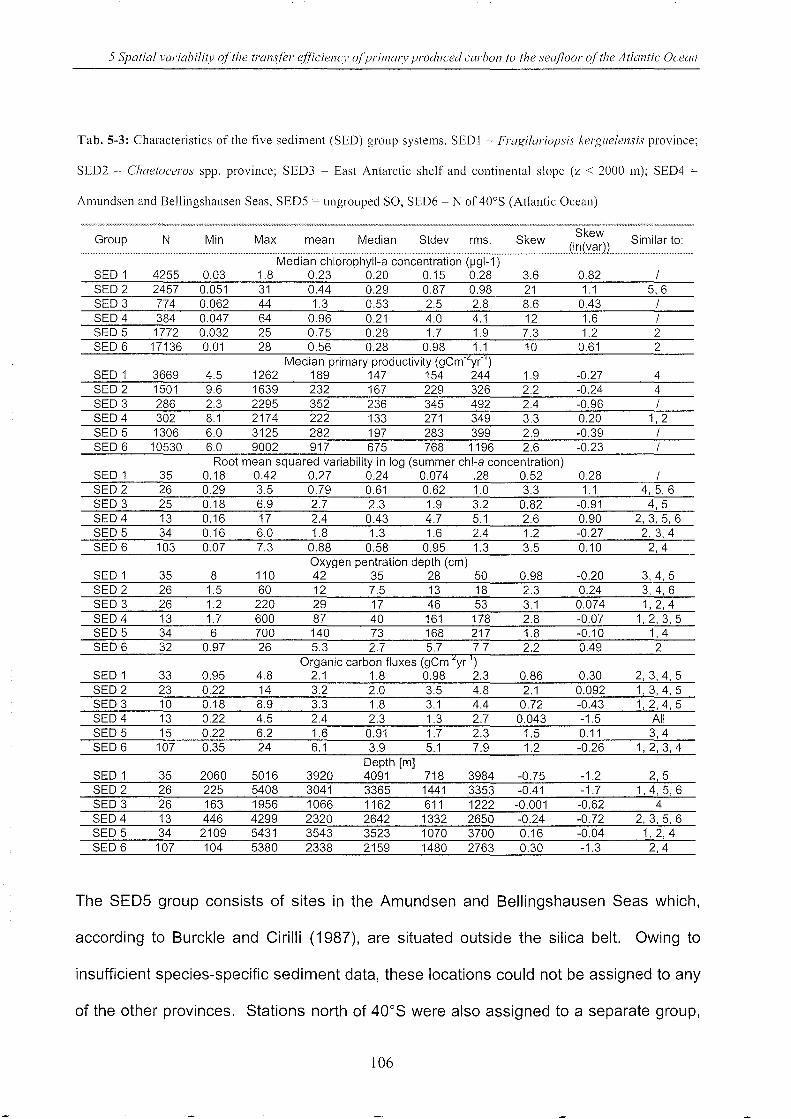
5 Spatial variabilitv o/the transfer efficiency oj'pril71arv produced carbo/1 to the sea/loor oj'the Atlantic Ocean
Tab. 5-3: Characteristics of the five sediment (SED) group systems. SED 1 = Fragilariopsis kerguelensis province;
SED2 = Chaetoceros spp. province; SED3 = East Antarctic shelf and continental slope (z < 2000 m); SED4 =
Amundsen and Bellingshausen Seas, SED5 = ungrouped SO, SED6 = N of 40 0 S (Atlantic Ocean)
Group N Min Max mean Median Stdev rms. Skew Similar to:
Median chlorophyll-a concentration (jJgl-1) SED 1 4255 0.03 1.8 0.23 0.20 0.15 0.28 3.6 0.82 / SED 2 2457 0.051 31 0.44 0.29 0.87 0.98 21 1.1 5,6 SED 3 774 0.062 44 1.3 0.53 2.5 2.8 8.6 0.43 / SED4 384 0.047 64 0.96 0.21 4.0 4.1 12 1.6 / SED 5 1772 0.032 25 0.75 0.28 1.7 1.9 7.3 1.2 2 SED 6 17136 0.01 28 0.56 0.28 0.98 1.1 10 0.61 2
Median primary productivity (gCm,2y(l)
SED 1 3669 4.5 1262 189 147 154 244 1.9 -0.27 4 SED 2 1501 9.6 1639 232 167 229 326 2.2 -0.24 4 SED 3 286 2.3 2295 352 236 345 492 2.4 -0.96 / SED4 302 8.1 2174 222 133 271 349 3.3 0.20 1,2 SED 5 1306 6.0 3125 282 197 283 399 2.9 -0.39 / SED 6 10530 6.0 9002 917 675 768 1196 2.6 -0.23 /
Root mean squared variability in log (summer chl-a concentration) SED 1 35 0.18 0.42 0.27 0.24 0.074 .28 0.52 0.28 / SED 2 26 0.29 3.5 0.79 0.61 0.62 1.0 3.3 1.1 4,5,6 SED 3 25 0.18 6.9 2.7 2.3 1.9 3.2 0.82 cO.91 4,5 SED4 13 0.16 17 2.4 0.43 4.7 5.1 2.6 0.90 2,3,5,6 SED 5 34 0.16 6.0 1.8 1.3 1.6 2.4 1.2 -0.27 2,3,4 SED 6 103 0.07 7.3 0.88 0.58 0.95 1.3 3.5 0.10 2,4
Oxygen pentration depth (cm) SED 1 35 8 110 42 35 28 50 0.98 -0.20 3,4,5 SED 2 26 1.5 60 12 7.5 13 18 2.3 0.24 3,4,6 SED 3 26 1.2 220 29 17 46 53 3.1 0.074 1,2,4 SED4 13 1.7 600 87 40 161 178 2.8 -0.07 1,2,3,5 SED 5 34 6 700 140 73 168 217 1.8 -0.10 1,4 SED 6 32 0.97 26 5.3 2.7 5.7 7.7 2.2 0.49 2
Organic carbon fluxes (gCm,2y(l)
SED 1 33 0.95 4.8 2.1 1.8 0.98 2.3 0.86 0.30 2,3,4,5 SED 2 23 0.22 14 3.2 2.0 3.5 4.8 2.1 0.092 1,3,4,5 SED 3 10 0.18 8.9 3.3 1.8 3.1 4.4 0.72 -0.43 1,2,4,5 SED4 13 0.22 4.5 2.4 2.3 1.3 2.7 0.043 -1.5 All SED 5 15 0.22 6.2 1.6 0.91 1.7 2.3 1.5 0.11 3,4 SED 6 107 0.35 24 6.1 3.9 5.1 7.9 1.2 -0.26 1,2,3,4
Depth [m] SED 1 35 2060 5016 3920 4091 718 3984 -0.75 -1.2 2,5 SED 2 26 225 5408 3041 3365 1441 3353 -0.41 -1.7 1,4,5,6 SED 3 26 163 1956 1066 1162 611 1222 -0.001 -0.62 4 SED 4 13 446 4299 2320 2642 1332 2650 -0.24 -0.72 2,3,5,6 SED 5 34 2109 5431 3543 3523 1070 3700 0.16 -0.04 1,2,4 SED 6 107 104 5380 2338 2159 1480 2763 0.30 -1.3 2,4
The SED5 group consists of sites in the Amundsen and Bellingshausen Seas which,
according to Burckle and Cirilli (1987), are situated outside the silica belt. Owing to
insufficient species-specific sediment data, these locations could not be assigned to any
of the other provinces. Stations north of 40 0 S were also assigned to a separate group,
106
5 Spatial variabilitv of the transfer efficienc.l' ofpri11larv produced carbo/1 to the sea/loor of the Atlantic Ocean
SED6, owing to paucity of information across the Atlantic. Figure 5-5 illustrates the CD
and SED group locations.
In respect of the surface parameters, the SED groups are largely similar, with the
exception of SED1 which has distinctive chi-a, pp and rms chl-a values. Distributions of
the benthic parameters OPD and benthic Corg flux, and of water depth, were likewise
similar among all groups, with the exception of SED2, for which OPD was always
shallower than 60 cm.
5.4.4 8enthic carbon export ratio (8ER)
Regressions of net primary production against carbon remineralization rate were
calculated, yielding the export ratio at the sea floor. Since the term 'export ratio'
describes the proportion of surface primary production exported out of the surface
mixed layer, we apply the term 'benthic export ratio': the difference between ER and
BER at a given site represents the fraction of carbon which is remineralised in the
meso-pelagic zone, so that BER represents a lower limit on carbon export ratio. BER
was calculated for the entire data set and separately for the CD and SED groups.
Systematically overestimated pp would result in a lower BER: For example, if Eppley
primary production is closer to the truth than VGPM PP, then the export ratios
calculated here are too high in the mid-latitudes (Fig. 5-4, red points). Since Eppley and
VGPM agree well in Southern Ocean, BER values presented here for the SO can be
taken as a best estimate for this method and dataset. Further research into the
accuracy of the various PP models is still urgently required.
As an indication of long-term benthic Corg flux (Hartnett et al., 1998), median chlorophyll
a was regressed against oxygen penetration depth. Figure 5-6 illustrates these
regressions. A priori groupings were not generally significantly different in either Corg
fluX/PP or OPD/chl-a space (MANOVA, a = 0.05). Table 5-4 lists significant
correlations.
107
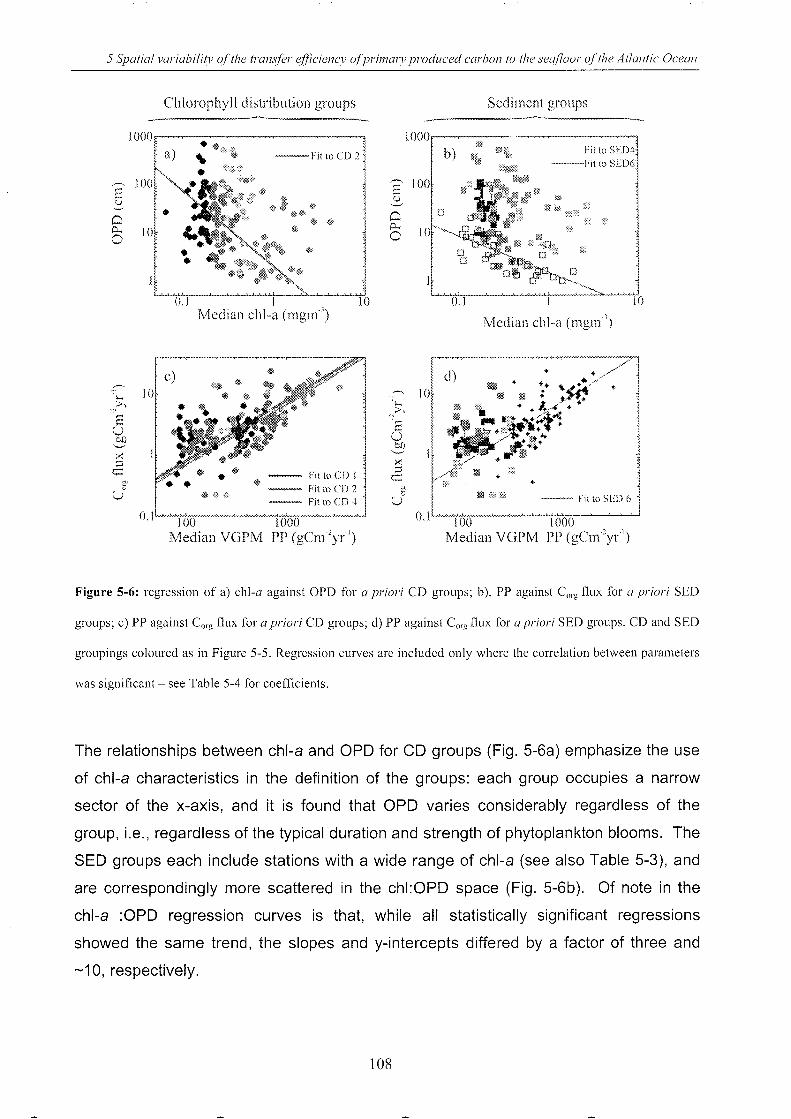
5 Spatial variabi1i(v olthe transler efficiency olpril71G1Y prod1lced carbon to the seafloor olthe Atlantic Ocean
r-. r'
6 Cl 0..,
0
1000
10
10
Chlorophyll distribution groups
<1) • @,,- -;;. \. ~-Fit(oCD~
• •
• • 0.1 1
c)
Median ehl-a (mgm-')
-- FittoCD I @ -- FittoCD2 -~ FitloCD4
10
O.lL.......-'-:]~O:-:cO-~~~'-'-1I"7:'O(""')(:::-) ~~~..w
Median VGPM pp (gCm"yr')
Sediment groups
lOOO~~--@
Fil to SED4 --Fit to SED6
Cl 0.., o 10
10 h »
~,
c. U bf)
x ;::s
c:: g!'
U-
O.l
b) 11$
0.1 10
Median chI-a (mgn1')
-- Fit to SED (,
lOO 1000 Median VGPM pp (gCm2y(1)
Figure 5-6: regression of a) chl-a against OPD for a priori CD groups; b), pp against Corg flux for a priori SED
groups; c) pp against Corg flux for a priori CD groups; d) pp against Corg flux for a priori SED groups. CD and SED
groupings coloured as in Figure 5-5. Regression curves are included only where the correlation between parameters
was significant - see Table 5-4 for coefficients.
The relationships between chl-a and OPD for CD groups (Fig. 5-6a) emphasize the use
of chl-a characteristics in the definition of the groups: each group occupies a narrow
sector of the x-axis, and it is found that OPD varies considerably regardless of the
group, i.e., regardless of the typical duration and strength of phytoplankton blooms. The
SED groups each include stations with a wide range of chl-a (see also Table 5-3), and
are correspondingly more scattered in the chl:OPD space (Fig. 5-6b). Of note in the
chl-a :OPD regression curves is that, while all statistically significant regressions
showed the same trend, the slopes and y-intercepts differed by a factor of three and
-10, respectively.
108
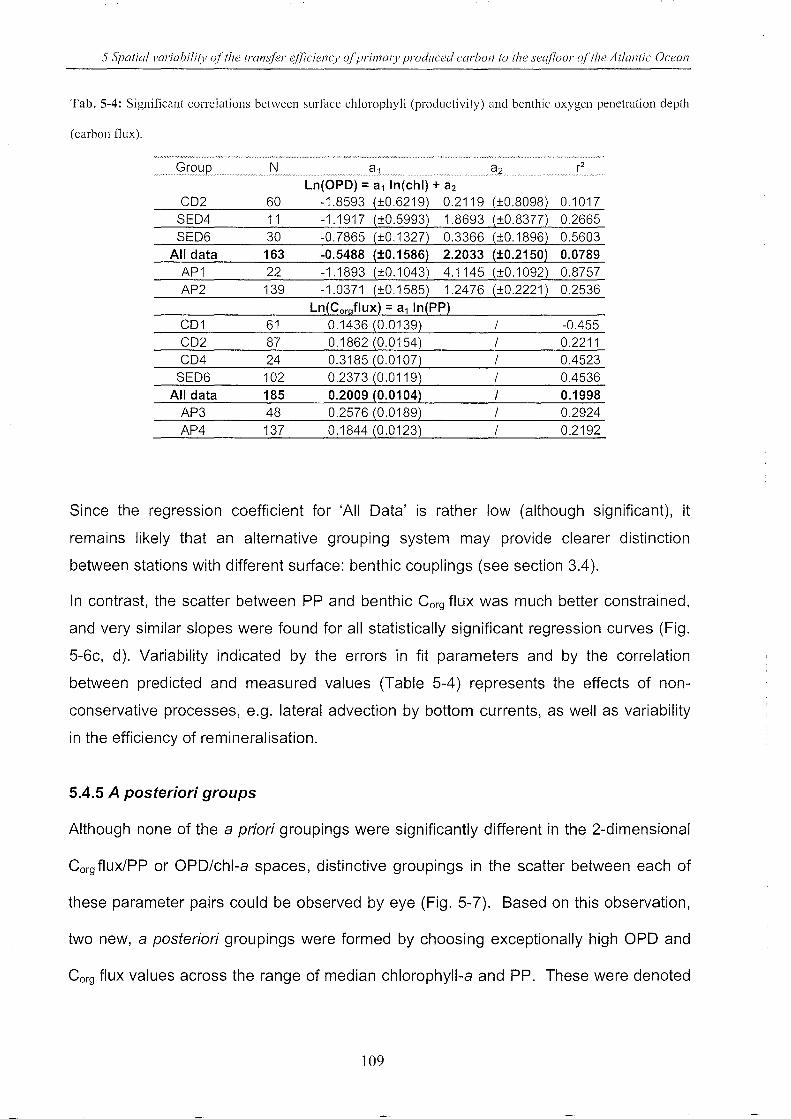
5 Spatial variabi!itl' of the transfer efficiency ofpril71aJY produced carbon to the seafloor of the Atlantic Ocean
Tab. 5-4: Significant correlations between surface chlorophyll (productivity) and benthic oxygen penetration depth
(carbon flux).
N r2
Ln(OPD) = a1 In(chl) + a2 CO2 60 -1.8593 {±0.6219) 0.2119 {±0.8098) 0.1017
SE04 11 -1.1917 {±0.5993) 1.8693 {±0.8377) 0.2665 SE06 30 -0.7865 {±0.1327) 0.3366 {±0.1896) 0.5603
All data 163 -0.5488 {±0.1586) 2.2033 {±0.2150) 0.0789 AP1 22 -1.1893 {±0.1043) 4.1145 (±0.1092) 0.8757 AP2 139 -1.0371 {±0.1585) 1.2476 {±0.2221) 0.2536
Ln{Corgflux} = a1 In{pP} C01 61 0.1436 {0.0139) -0.455 CO2 87 0.1862 {0.0154) 0.2211 C04 24 0.3185 W0107) 0.4523
SE06 102 0.2373 {0.0119) 0.4536 All data 185 0.2009 {0.0104} 0.1998
AP3 48 0.2576 {0.0189) 0.2924 AP4 137 0.1844 {0.0123) 0.2192
Since the regression coefficient for 'All Data' is rather low (although significant), it
remains likely that an alternative grouping system may provide clearer distinction
between stations with different surface: benthic couplings (see section 3.4).
In contrast, the scatter between pp and benthic Corg flux was much better constrained,
and very similar slopes were found for all statistically significant regression curves (Fig.
5-6c, d). Variability indicated by the errors in fit parameters and by the correlation
between predicted and measured values (Table 5-4) represents the effects of non
conservative processes, e.g. lateral advection by bottom currents, as well as variability
in the efficiency of remineralisation.
5.4.5 A posteriori groups
Although none of the a priori groupings were significantly different in the 2-dimensional
Corg flux/PP or OPD/chl-a spaces, distinctive groupings in the scatter between each of
these parameter pairs could be observed by eye (Fig. 5-7). Based on this observation,
two new, a posteriori groupings were formed by choosing exceptionally high OPD and
Corg flux values across the range of median chlorophyll-a and PP. These were denoted
109
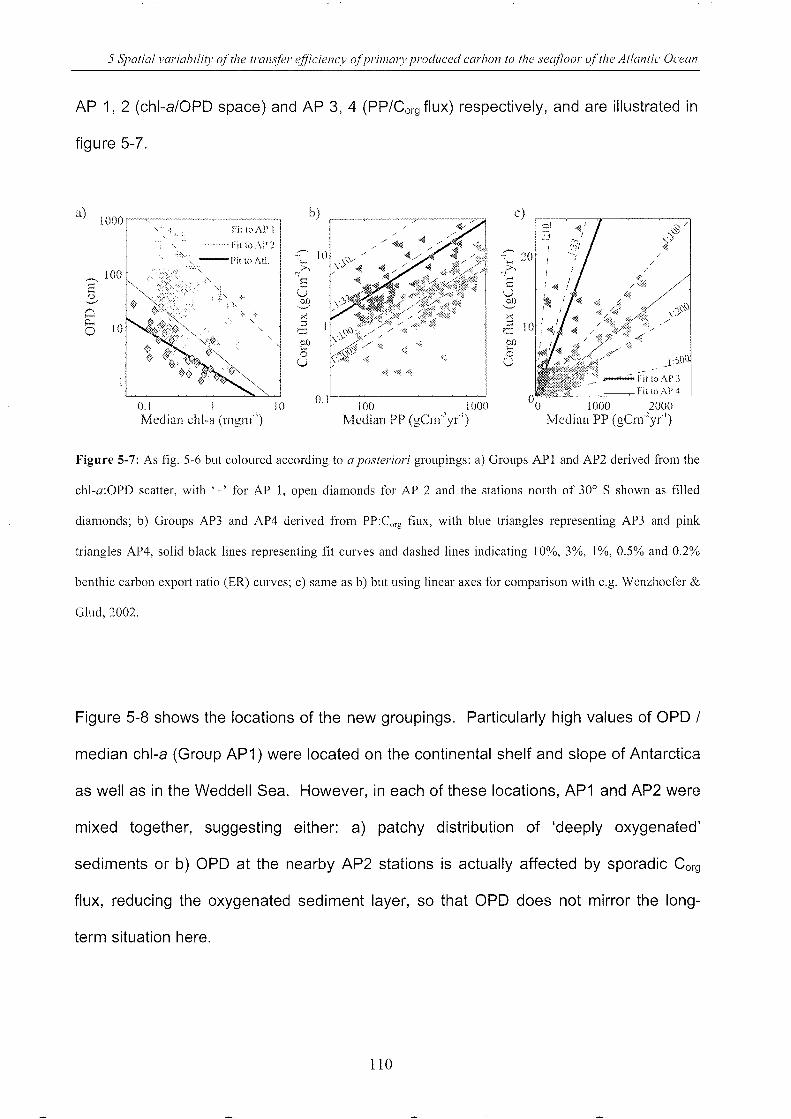
5 Spatial variabilitl' o.lthe tram/er efliciency olprimary produced carbon to the sea/loOl' olthe Atlantic Ocean
AP 1, 2 (chl-a/OPD space) and AP 3, 4 (PP/Corg flux) respectively, and are illustrated in
figure 5-7.
a) 1000,.-----....,,----------,
100 -;::::' G ,~'
Cl c... o
0.1
", " '" Fit t('AP 1
.:.\,. .. ht toAI"2
--FittoAtL
Median chl-a (mgm') 10
c)
bll i5 u
o 1000 2000 Median pp (gCm'y(')
Figure 5-7: As fig. 5-6 but coloured according to a posteriori groupings: a) Groups AP 1 and AP2 derived from the
chl-a:OPD scatter, with '+' for AP I, open diamonds for AP 2 and the stations north of 30° S shown as filled
diamonds; b) Groups AP3 and AP4 derived from PP:Corg flux, with blue triangles representing AP3 and pink
triangles AP4, solid black lines representing fit curves and dashed lines indicating 10%, 3%, 1%, 0.5% and 0.2%
benthic carbon export ratio (ER) curves; c) same as b) but using linear axes for comparison with e.g. Wenzhoefer &
Glud,2002.
Figure 5-8 shows the locations of the new groupings. Particularly high values of OPD /
median chl-a (Group AP1) were located on the continental shelf and slope of Antarctica
as well as in the Weddell Sea. However, in each of these locations, AP1 and AP2 were
mixed together, suggesting either: a) patchy distribution of 'deeply oxygenated'
sediments or b) OPD at the nearby AP2 stations is actually affected by sporadic Corg
flux, reducing the oxygenated sediment layer, so that OPD does not mirror the long-
term situation here.
110
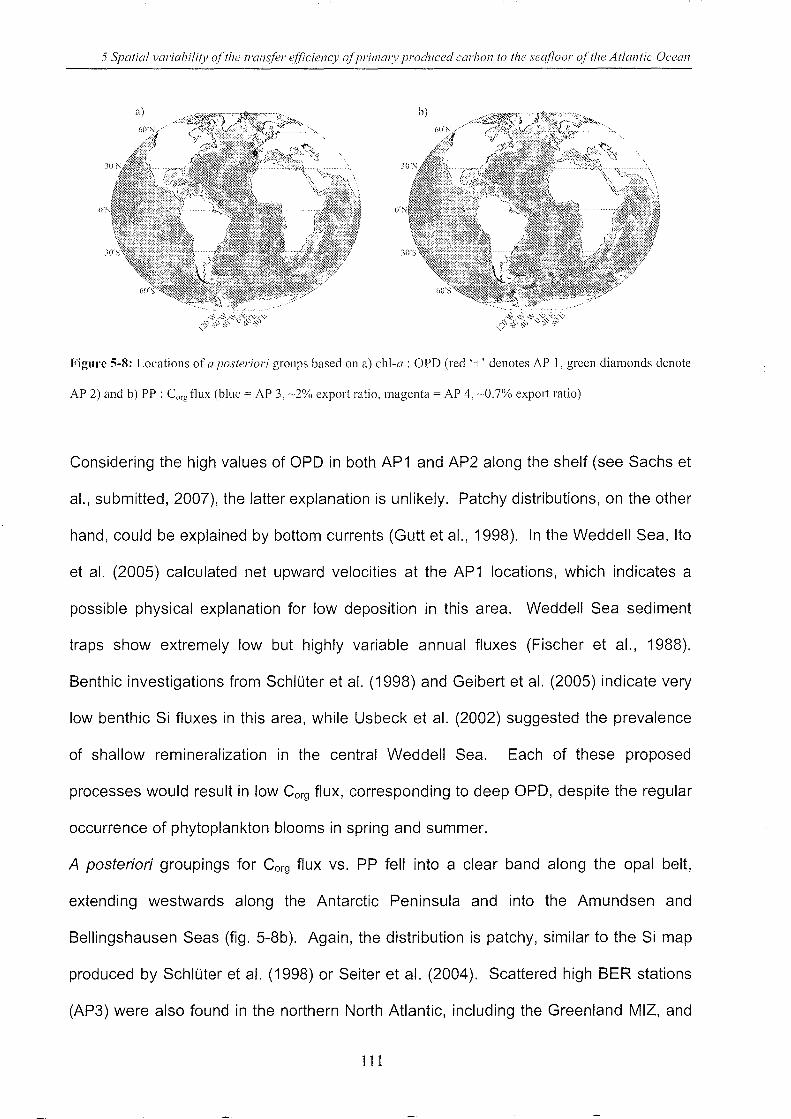
5 Spatiall'ariabilitl' of the transfer e[jiciencv o/j)rimmy produced carbon to the sea/loor of the Atlantic Ocean
Figure 5-8: Locations of a posteriori groups based on a) chi-a: OPD (red '+' denotes AP I, green diamonds denote
AP 2) and b) pp : Corg flux (blue = AP 3, ~2% export ratio, magenta = AP 4, ~O.7% export ratio)
Considering the high values of OPD in both AP1 and AP2 along the shelf (see Sachs et
al., submitted, 2007), the latter explanation is unlikely. Patchy distributions, on the other
hand, could be explained by bottom currents (Gutt et al., 1998). In the Weddell Sea, Ito
et al. (2005) calculated net upward velocities at the AP1 locations, which indicates a
possible physical explanation for low deposition in this area. Weddell Sea sediment
traps show extremely low but highly variable annual fluxes (Fischer et al., 1988).
Benthic investigations from SchlUter et al. (1998) and Geibert et al. (2005) indicate very
low benthic Si fluxes in this area, while Usbeck et al. (2002) suggested the prevalence
of shallow remineralization in the central Weddell Sea. Each of these proposed
processes would result in low Corg flux, corresponding to deep OPD, despite the regular
occurrence of phytoplankton blooms in spring and summer.
A posteriori groupings for Corg flux vs. PP fell into a clear band along the opal belt,
extending westwards along the Antarctic Peninsula and into the Amundsen and
Bellingshausen Seas (fig. 5-8b). Again, the distribution is patchy, similar to the Si map
produced by SchlOter et al. (1998) or Seiter et al. (2004). Scattered high BER stations
(AP3) were also found in the northern North Atlantic, including the Greenland MIZ, and
III
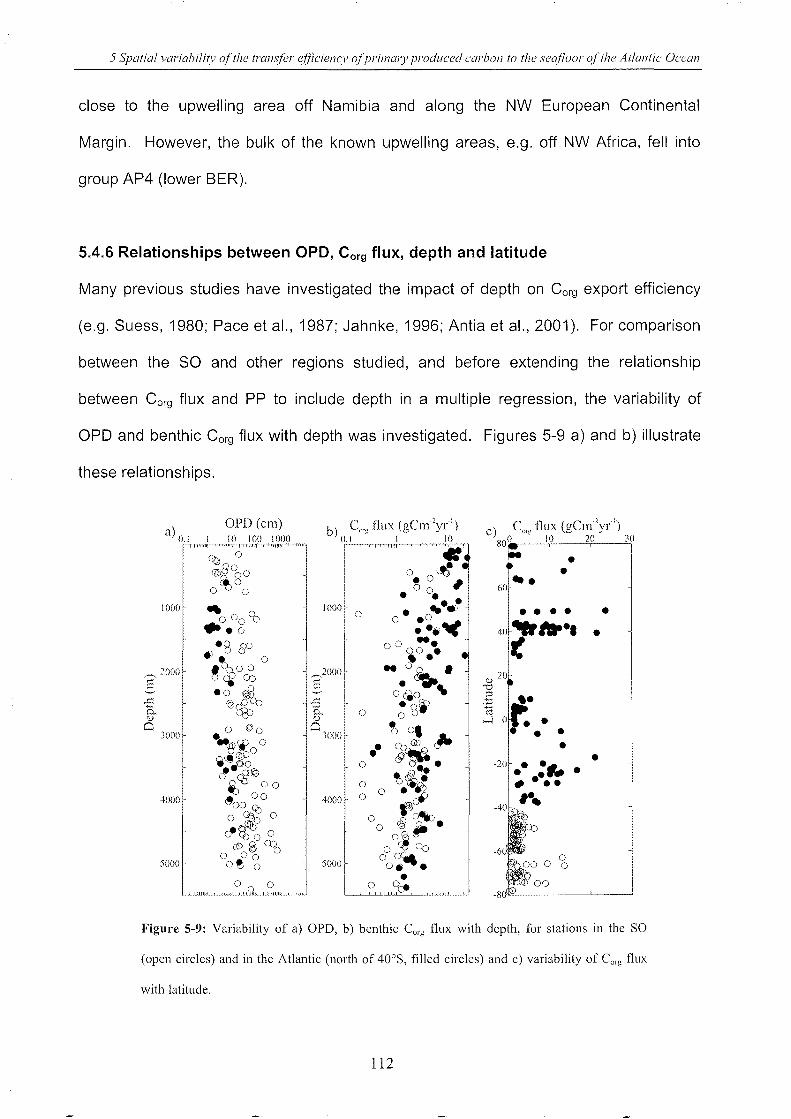
5 Spatial variabilitv of'the tram/er etliciencv o(pril71arv produced carbon to the sea/loor of'the Atlantic Ocean
close to the upwelling area off Namibia and along the NW European Continental
Margin. However, the bulk of the known upwelling areas, e.g. off NW Africa, fell into
group AP4 (lower BER).
5.4.6 Relationships between OPD, Corg flux, depth and latitude
Many previous studies have investigated the impact of depth on Corg export efficiency
(e.g. Suess, 1980; Pace et al., 1987; Jahnke, 1996; Antia et al., 2001). For comparison
between the SO and other regions studied, and before extending the relationship
between Corg flux and PP to include depth in a multiple regression, the variability of
OPO and benthic Corg flux with depth was investigated. Figures 5-9 a) and b) illustrate
these relationships.
OPD (cm) a) 0 I 10 10(1 1000
i-TrrIT";--'~""'inirT-ffinii~"",
1000
.","" 2000 ~
,.c ~ ~;)
C JOOO
·1000
sooo
,,,w,
60
• •
r .. · • • • •
40~"" I(
• •
·20 .... _ ...... -... , .• -6
00
o o
• •
•
Figure 5-9: Variability of a) OPD, b) benthic Corg flux with depth, for stations in the SO
(open circles) and in the Atlantic (north of 40oS, filled circles) and c) variability of Corg flux
with latitude.
112
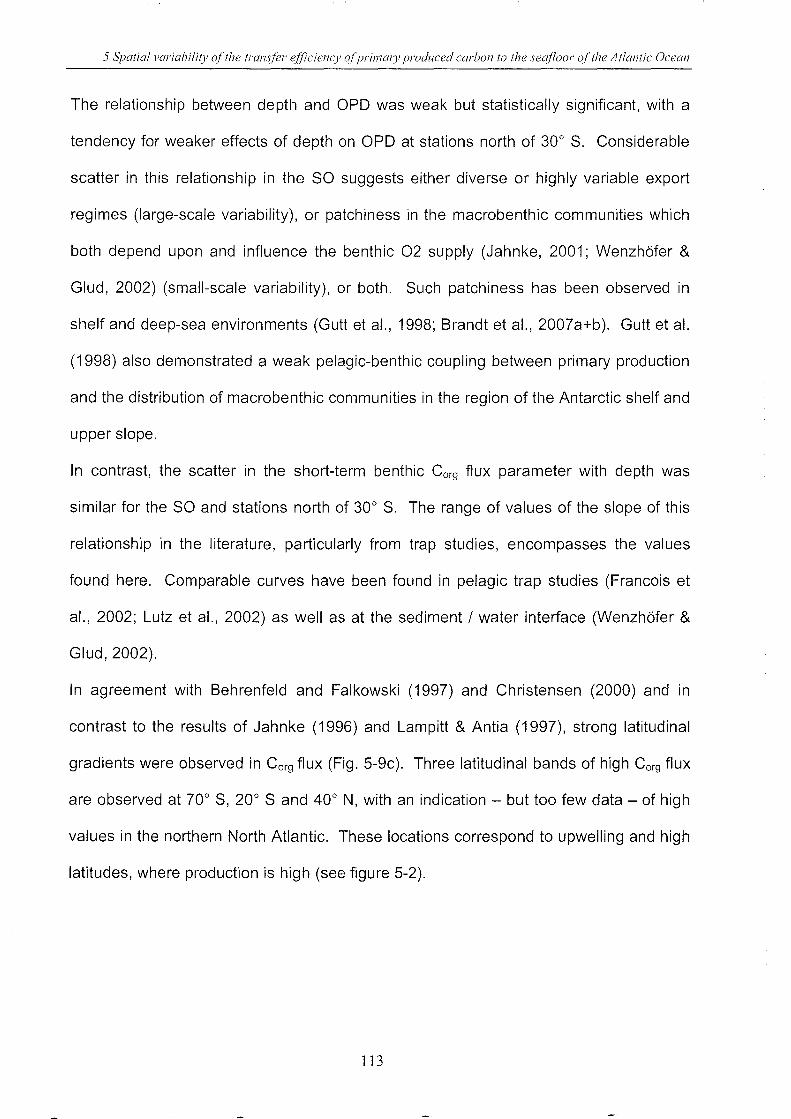
5 Spatial variabilitF of the transfer efficiency ofprimarv produced carbon to the seaj700r of the Atlantic Ocean
The relationship between depth and OPD was weak but statistically significant, with a
tendency for weaker effects of depth on OPD at stations north of 30° S. Considerable
scatter in this relationship in the SO suggests either diverse or highly variable export
regimes (large-scale variability), or patchiness in the macrobenthic communities which
both depend upon and influence the benthic 02 supply (Jahnke, 2001; Wenzh6fer &
Glud, 2002) (small-scale variability), or both. Such patchiness has been observed in
shelf and deep-sea environments (Gutt et aI., 1998; Brandt et al., 2007a+b). Gutt et al.
(1998) also demonstrated a weak pelagic-benthic coupling between primary production
and the distribution of macrobenthic communities in the region of the Antarctic shelf and
upper slope.
In contrast, the scatter in the short-term benthic Corg flux parameter with depth was
similar for the SO and stations north of 30° S. The range of values of the slope of this
relationship in the literature, particularly from trap studies, encompasses the values
found here. Comparable curves have been found in pelagic trap studies (Francois et
al., 2002; Lutz et al., 2002) as well as at the sediment / water interface (Wenzh6fer &
Glud,2002).
In agreement with Behrenfeld and Falkowski (1997) and Christensen (2000) and in
contrast to the results of Jahnke (1996) and Lampitt & Antia (1997), strong latitudinal
gradients were observed in Corg flux (Fig. 5-9c). Three latitudinal bands of high Corg flux
are observed at 70° S, 20° Sand 40° N, with an indication - but too few data - of high
values in the northern North Atlantic. These locations correspond to upwelling and high
latitudes, where production is high (see figure 5-2).
113
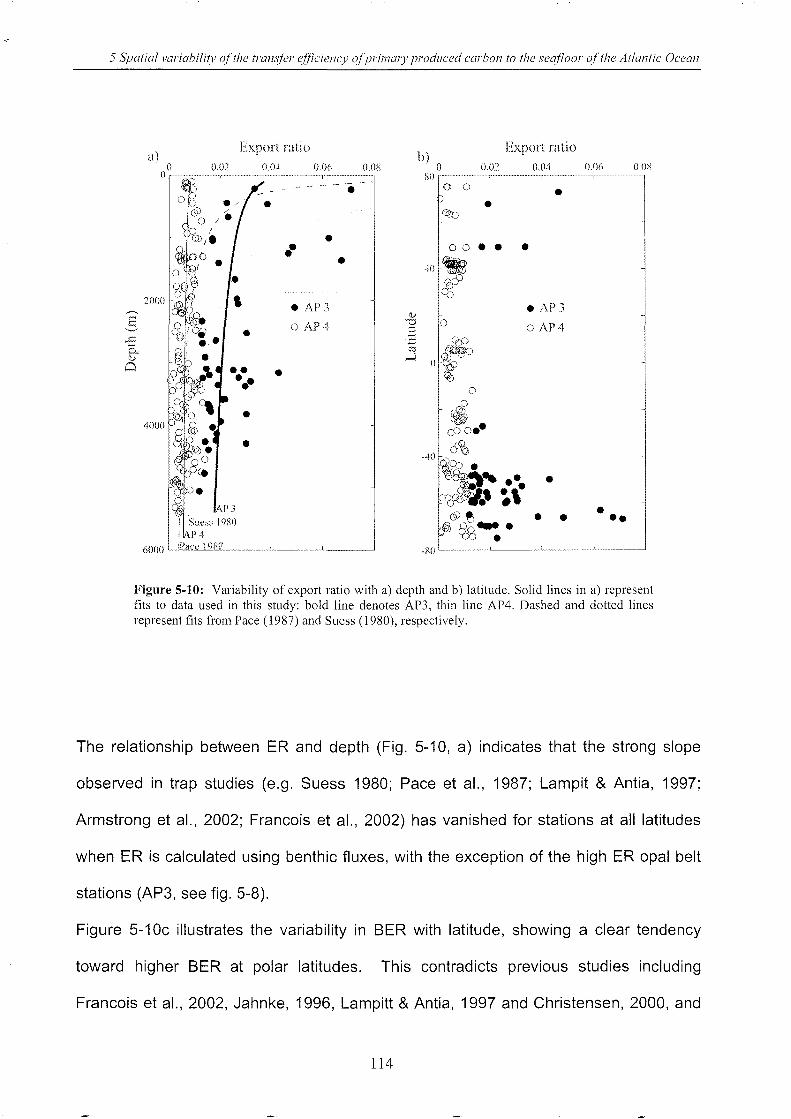
5 Spatial variability of the transfer efficiency ojjJrimarv produced carbon to the seafloor of the Atlantic Oceal7
Export ratio 0.06 n.os
,·· ...... ····T···· ..
• •• •
• AP:;
o AP4
• •
6000 LJ.L.illS_-'-21O"--__ -L-__ -'--__ -'
Export ratio 0.02 0,(14
b) o O.n6 0.08 gO , ................................ , ..................... -.. -.... , ............................... " ...................... -....... ,
o 0
•
o
•
• AP 3
o AP4
• •• -80 '--__ -'--__ -L-__ -'--__ -'
Figure 5-10: Variability of export ratio with a) depth and b) latitude. Solid lines in a) represent fits to data used in this study: bold line denotes AP3, thin line AP4. Dashed and dotted lines represent fits from Pace (1987) and Suess (1980), respectively.
The relationship between ER and depth (Fig. 5-10, a) indicates that the strong slope
observed in trap studies (e.g. Suess 1980; Pace et al., 1987; Lampit & Antia, 1997;
Armstrong et al., 2002; Francois et al., 2002) has vanished for stations at all latitudes
when ER is calculated using benthic fluxes, with the exception of the high ER opal belt
stations (AP3, see fig. 5-8).
Figure 5-10c illustrates the variability in BER with latitude, showing a clear tendency
toward higher BER at polar latitudes. This contradicts previous studies including
Francois et al., 2002, Jahnke, 1996, Lampitt & Antia, 1997 and Christensen, 2000, and
114
5 Spatial variability of the transfer efficiency ofpril71a!)' produced carbon to the sea/loo,. of the Atlantic Ocean
is in agreement with Buesseller, 1998. These conflicting results most likely reflect the
sparsity of data available at high latitudes: The dataset compiled by Sachs et al.,
submitted 2007 is the first study with substantial coverage of the SO. However, it is
also possible that the efficiency of the meso-pelagic community varies with latitude,
perhaps affected by temperature, so that upper water column sediment trap studies to
date have correctly observed lower ER at high latitudes, which subsequently evolves
into higher BER on account of more efficient scavenging of the available carbon at
lower compared to higher latitudes.
Having found significant, variable, effects of depth on benthic Corg flux, a 3-D regression
was used to relate these parameters to surface PP. Following Antia et al. (2001), Corg
flux was regressed against median primary production and water depth for all 185
stations using Eq. 3. Additional regressions were calculated for the a posteriori
subgroups AP 3 and AP 4, and also using alternative equations from the literature (Eq.
4 and 5). Table 5-5 presents the regression coefficients and statistics for each of these
regressions. Figure 5-11 shows the 3-dimensional fit corresponding to Eq. 3 applied to
groups AP 3 and 4. Proceeding on the assumption that benthic remineralization
represents the lower limit on carbon flux to the sea floor, the AP 4 algorithm was
selected to calculate conservative estimates of carbon rain rate in the Atlantic,
described in the next section.
115
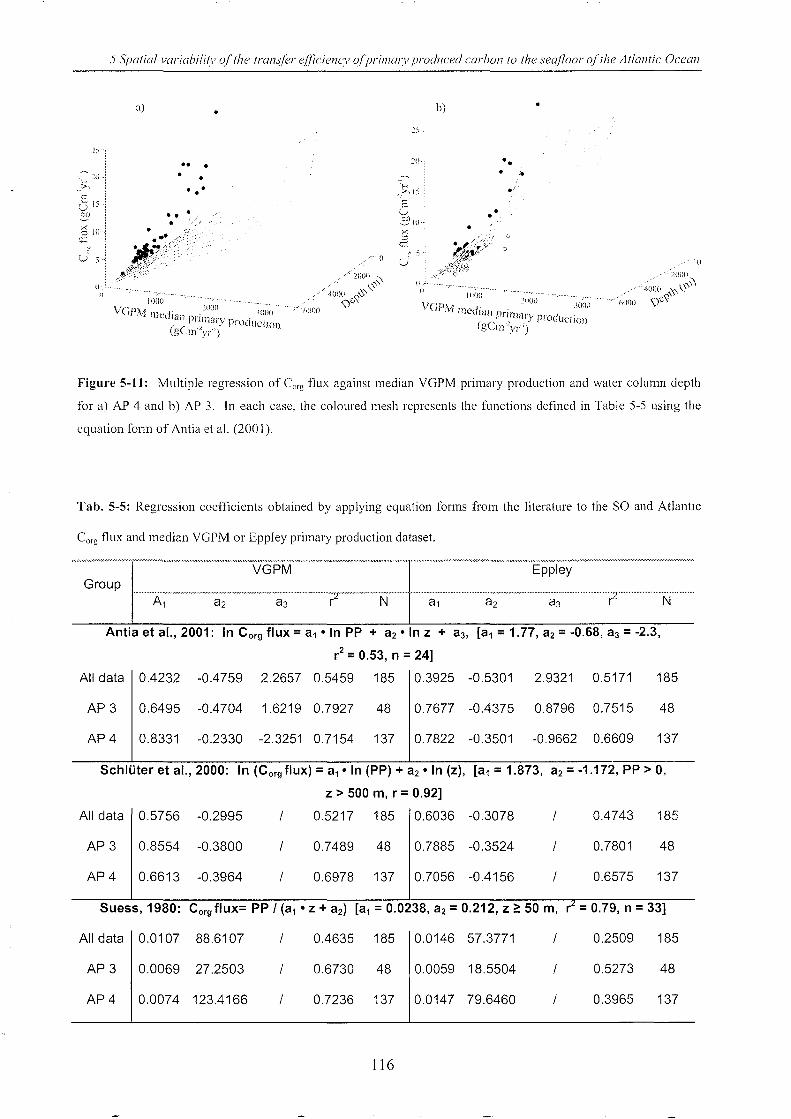
5 Spatial variabilitl' olthe tram/er efficiency o/jJrilJlarv prodllced carbol1 to the sea/loor olthe Atlantic Ocean
a)
•• •
p
0 1'
01)
•
•• . •
• • o
S 10 • •• ,~ .. ~:-":
~, ,,,jj::rf '"
•
IS
'-' 2!IO'"
b)
• • •
o. . " . 0'
•
......•... ,... ... "
VGPfv ,'., . 2000 3000 , J IllCdldliyn,malY ProdUction
(gCmYr)
,/'0
/-.~ 2000
'40;)(. ~ 0~1 :0' \)e\'
Figure 5-11: Multiple regression of Corg flux against median VGPM primary production and water column depth
for a) AP 4 and b) AP 3. In each case, the coloured mesh represents the functions defined in Table 5-5 using the
equation form of Antia et aL (2001),
Tab. 5-5: Regression coefficients obtained by applying equation forms from the literature to the SO and Atlantic
Corg flux and median VGPM or Eppley primary production dataset.
VGPM Eppley Group
r" N N
Antia et al., 2001: In Corg flux = a1 ·In pp + a2 oln z + a3, [a1 = 1.77, a2 = -0.68, a3 = -2.3,
r2 = 0.53, n = 24]
All data 0.4232 -0.4759 2.2657 0.5459 185 0.3925 -0.5301 2.9321 0.5171 185
AP3 0.6495 -0.4704 1.6219 0.7927 48 0.7677 -0.4375 0.8796 0.7515 48
AP4 0,8331 -0.2330 -2.3251 0.7154 137 0.7822 -0.3501 -0.9662 0.6609 137
SchlUter et al., 2000: In (Corg flux) = a1 0 In (PP) + a2 • In (z), [a1 = 1.873, a2 = -1.172, PP> 0,
z > 500 rn, r = 0.92]
All data 0.5756 -0.2995 0.5217 185 0.6036 -0.3078 0.4743 185
AP3 0.8554 -0.3800 0.7489 48 0.7885 -0.3524 0.7801 48
AP4 0.6613 -0.3964 0,6978 137 0.7056 -0.4156 0.6575 137
Suess,1980: Corg flux= PP I (a1 • z + a2) [a1 = 0.0238, a2 = 0.212, z::: 50 rn, r = 0.79, n = 33]
All data 0.0107 88.6107 0.4635 185 0.0146 57.3771 0.2509 185
AP 3 0.0069 27.2503 0.6730 48 0.0059 18.5504 0.5273 48
AP4 0.0074 123.4166 0.7236 137 0.0147 79.6460 0.3965 137
116
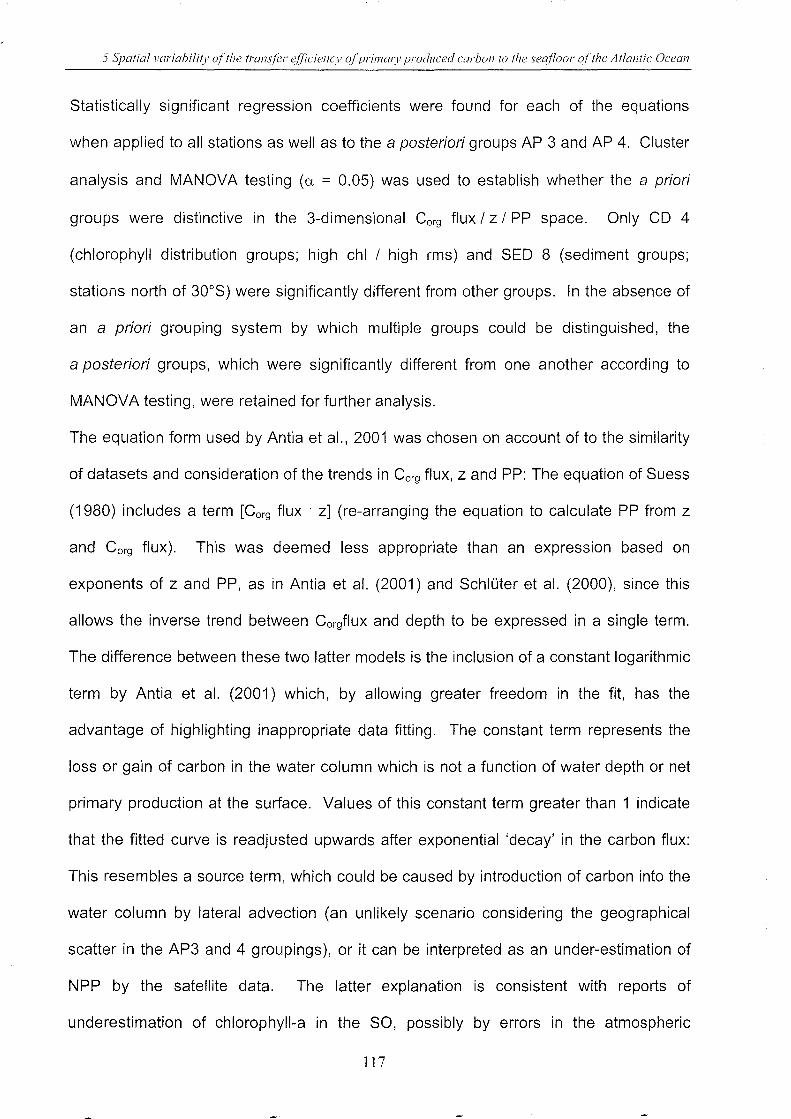
5 Spatial variahilitl' olthe transfer efficiency olprimarv produced carbon to the seafloor olthe Atlantic Ocean
Statistically significant regression coefficients were found for each of the equations
when applied to all stations as well as to the a posteriori groups AP 3 and AP 4. Cluster
analysis and MANOVA testing (a = 0.05) was used to establish whether the a priori
groups were distinctive in the 3-dimensional Corg flux / z / pp space. Only CD 4
(chlorophyll distribution groups; high chi / high rms) and SED 8 (sediment groups;
stations north of 30 0 S) were significantly different from other groups. In the absence of
an a priori grouping system by which multiple groups could be distinguished, the
a posteriori groups, which were significantly different from one another according to
MANOVA testing, were retained for further analysis.
The equation form used by Antia et al., 2001 was chosen on account of to the similarity
of datasets and consideration of the trends in Corg flux, z and PP: The equation of Suess
(1980) includes a term [Corg flux' z] (re-arranging the equation to calculate PP from z
and Corg flux). This was deemed less appropriate than an expression based on
exponents of z and PP, as in Antia et al. (2001) and Schloter et al. (2000), since this
allows the inverse trend between Corgflux and depth to be expressed in a single term.
The difference between these two latter models is the inclusion of a constant logarithmic
term by Antia et al. (2001) which, by allowing greater freedom in the fit, has the
advantage of highlighting inappropriate data fitting. The constant term represents the
loss or gain of carbon in the water column which is not a function of water depth or net
primary production at the surface. Values of this constant term greater than 1 indicate
that the fitted curve is readjusted upwards after exponential 'decay' in the carbon flux:
This resembles a source term, which could be caused by introduction of carbon into the
water column by lateral advection (an unlikely scenario considering the geographical
scatter in the AP3 and 4 groupings), or it can be interpreted as an under-estimation of
NPP by the satellite data. The latter explanation is consistent with reports of
underestimation of chlorophyll-a in the SO, possibly by errors in the atmospheric
117
5 Spatial variabilitv of the transfer efficiency ofprimarv produced carbon to the seafloor of the Atlantic Ocean
correction at high latitudes (n.b. while it is often mooted that underestimation of
chlorophyll-a in the SO is caused by the prevalence of deep chlorophyll maxima, this
reasoning is rejected on the grounds that a) other oligotrophic regions at lower latitudes
typified by DC Ms were included in development of the satellite algorithms and b) this
does not account for systematic underestimation of chlorophyll in the Arctic, where
DCMs are less usual). The de facto exclusion of springtime data in the MIZ which
arises from using the monthly pp product, for which more robust masking for variable
cloud and ice cover is employed than the daily or weekly chlorophyll products, may also
be important: Consultation of the weekly chlorophyll data showed that the median
values measured during the summertime represent consistently lower concentrations
than were attained during the spring bloom at AP3 stations (data not shown). This
implies that the satellite median pp data are not so much erroneous as not
representative. Peak values are of course also smoothed out by monthly compositing,
but this affects the data at all locations, and will produce a regional bias only where the
duration of blooms in one region is always significantly shorter than at other locations.
Values of the constant term in Equation 3 less than 1 resemble a linear sink term. This
could be interpreted as the proportion of organic carbon which is remineralised most
rapidly, i.e. regardless of the length of time over which the material is exposed to
oxygen. In the AP 4 data fit, the constant term was close to that obtained by Antia et al.
(2001) with exp{-2.3} = 0.1, i.e. a sink term. In contrast, the constant term for AP 3 was
exp{1.6} = 5 - a source term, while for the fit to all data a value of 9.6 was obtained. It
is likely that this massive source term for all data resulted from unsuitable fitting of a
single expression to a dataset which clearly falls into more than one group. However,
the precise meaning of the apparent source term for AP 3 remains unclear, especially
given the similarity of a1 and a2 for AP 3 and AP 4. This could indicate a true source
term, such as sea-floor winnowing, or simply reflect lack of data.
118
5 Spatial variabilitv oithe transfer elf7ciency o/primarv produced carbon to the sea/loo,. a/the Atlantic Ocean
Another factor which must be considered here because of the use of 'snapshot' Corg flux
measurements is the possibility that the AP3 group represents those stations at which
Corg flux measurements were affected by recent sedimentation events. Re-examining
Figure 5-3, where the AP3 stations are shown as filled blue circles, indicates that there
is a slight tendency toward higher Corg flux: OPD ratios within the AP3 group. However,
the range of ratios remains broad for both AP3 and AP4, and ANOVA analysis indicated
that the two groups were not distinctive within the Corg flux: OPD space (alpha = 0.05).
The implications of the data fits for AP3 and AP4 are intriguing and can only be resolved
by long-term in situ measurement programs. Mathematical conundrums aside, the fact
that the AP3 grouping, selected purely by means of the export ratio fell mostly in SO
waters, supports the notion that mass export of fresh, giant (Kemp et al., 2006,
Smetacek et al., 2002) or heavily silicified (Smetacek, 2004) diatoms, result in unusually
high export efficiency. Returning to the arguments A to 0 presented in the introduction;
AP 3 represents stations at which either a) more labile carbon is exported and/or b) the
labile carbon is better protected than at other locations and/or c) the exported carbon is
exposed to reminerisation for less time and/or d) remineralisation is less efficient here.
These possibilities are discussed below:
a) Disproportionately high concentrations of carbon are exported:
Higher export production can be discarded immediately by consulting Figure 5-2:
AP 3 does include regions of relatively high surface biomass close to the Antarctic
Peninsula, but also areas of very low biomass further to the west - these
concentrations are not the highest in the SO and are an order of magnitude lower
than is found on shelf regions in the northern hemisphere: high BER in AP 3 is not
caused simply by higher input of particulate organic carbon at the water surface.
119
5 Spatial variabilitF of the transfer efJiciency afprimar]' produced carbon to the seaflaar of the Atlantic Ocean
b) Exported carbon is well protected against remineralisation:
Dissolution of the protective silicate diatom frustule has been found to be slower
when phytoplankton cells sink out before dying (Moriceau et aI., 2007), and
inorganic coatings may also slow cell degradation (Burdige, 2007). It is unlikely that
inorganic matrices are produced exclusively in AP 3 and not, for example, at more
southerly stations with similar environmental characteristics. Sedimentation of fresh
phytoplankton has, on the other hand, been reported in the locality of the opal belt
(Sachs et aI., submitted 2006; Riaux-Gobin et aI., 1997). Such mass precipitation
events may be caused by matting of spined species such as Chaetoceros and
Corethron or by loss of buoyancy, for example under nutrient stress. The former
requires sufficiently high chlorophyll concentrations that cells are highly likely to lock
together; this is not consistent with the satellite chlorophyll record for the eastern
end of the opal belt, and even if satellite estimates are too low, Holm-Hansen et a!.
(2005) reported that chlorophyll in DCMs of the SO has not yet been found to
exceed 0.7 mgm-3. Slow but steady sinking out could be explained by deep mixed
layer depths which, together with low iron availability, could maintain growth at very
slow rates (see also Figure 5-2b), resulting in phytoplankton communities dominated
by heavier, more strongly silicified cells (e.g. F. kergeulensis, used in this study to
denote province SED 2, see section 3.3.2) and in a steady grazing pressure, leading
to the dominance of larger cells (Smith & Lancelot, 2004; Smetacek et aI., 2002,
2004). Loss of buoyancy control could affect a higher than usual proportion of cells
as they are subjected to low light levels in the deep mixed layer. Since the AP 3
group comprises regions of low, steady chlorophyll concentrations as well as high,
variable concentrations (Figure 5-2a and b) it can not be ruled out that both slow and
rapid sinking of large or heavy diatoms before cell death causes the higher BER
values.
120
5 Spatial variabilitv of the tram/er efficiency of prim my produced carbon to the sea/loor of the Atlantic Ocean
c) Exported carbon is exposed to remineralisation over disproportionately short time
scales:
This explanation can be discarded since the range of depths over which cells sink
out in AP 3 is not distinct from that in AP 4, and there is neither evidence nor reason
to suspect that sinking velocities are exceptionally high in the opal belt.
d) Remineralisation is inefficient
Low temperatures slow down bacterial activity (e.g. Matsumoto et al., 2007).
However, the range of water temperatures found in the AP 3 region is similar to that
found across the SO, so that this effect can be ruled out as being exclusive to the
AP 3 region. High turbulence, caused by strong wind mixing at the surface or by
strong currents in the mesopelagic, may make grazing by chemotaxis inefficient
(Kiorboe & Jackson, 2001; Visser & Jackson, 2004). However, neither the wind nor
the current regime along AP 3 is unique - strong easterly winds dominate most of
the SO and the currents they produce are found in several concentric rings (e.g.
Orsi, 1995; Sokolov & Rintoul, 2007), not just along AP 3.
It is possible that high BER in AP 3 results from combinations of processes categorised
as b) and d) above. However, suggestions in the literature that winnowing of benthic
deposits by bottom currents (Geibert et al., 2005, Seiter et al., 2005) may also explain
the grouping found here.
121
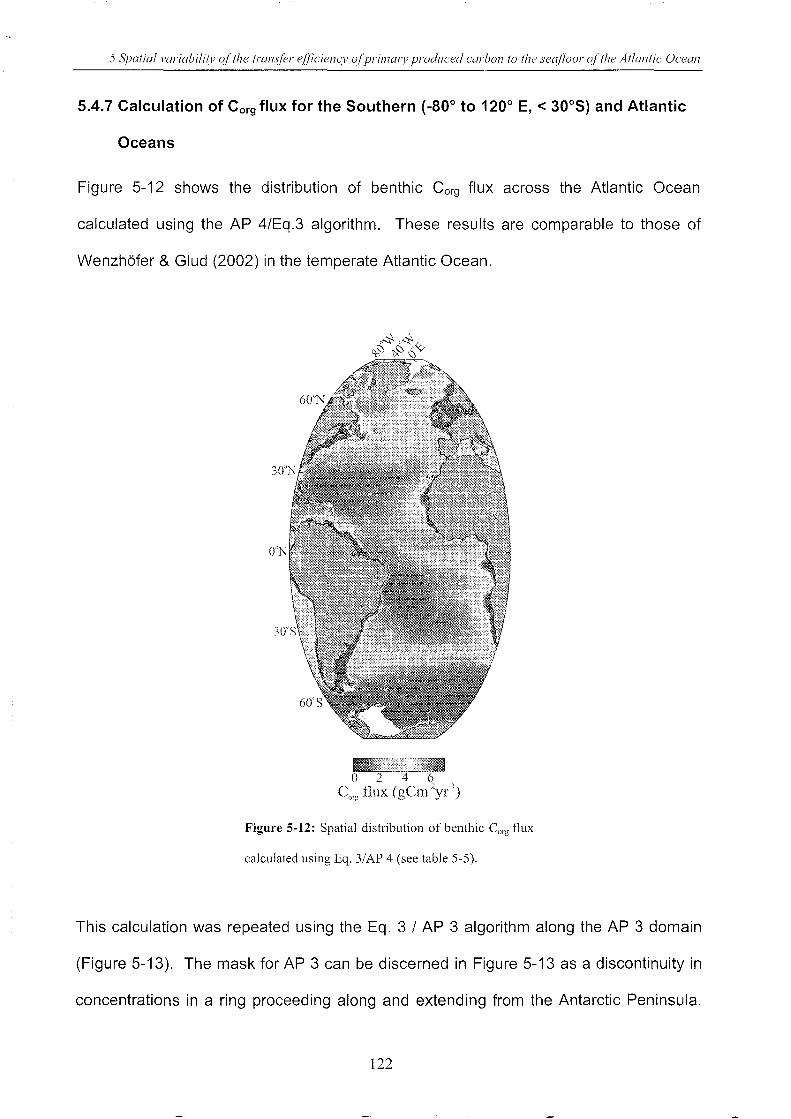
5 Spatial variabilit)i of the tram/er efficiency of primary produced carbon to the seafloor of the Atlantic Ocean
5.4.7 Calculation of Corg flux for the Southern (-80° to 120° E, < 30°5) and Atlantic
Oceans
Figure 5-12 shows the distribution of benthic Corg flux across the Atlantic Ocean
calculated using the AP 4/Eq.3 algorithm. These results are comparable to those of
Wenzhbfer & Glud (2002) in the temperate Atlantic Ocean.
Figure 5-12: Spatial distribution of benthic Corg flux
calculated using Eq. 3/AP 4 (see table 5-5).
This calculation was repeated using the Eq. 3 I AP 3 algorithm along the AP 3 domain
(Figure 5-13). The mask for AP 3 can be discerned in Figure 5-13 as a discontinuity in
concentrations in a ring proceeding along and extending from the Antarctic Peninsula.
122
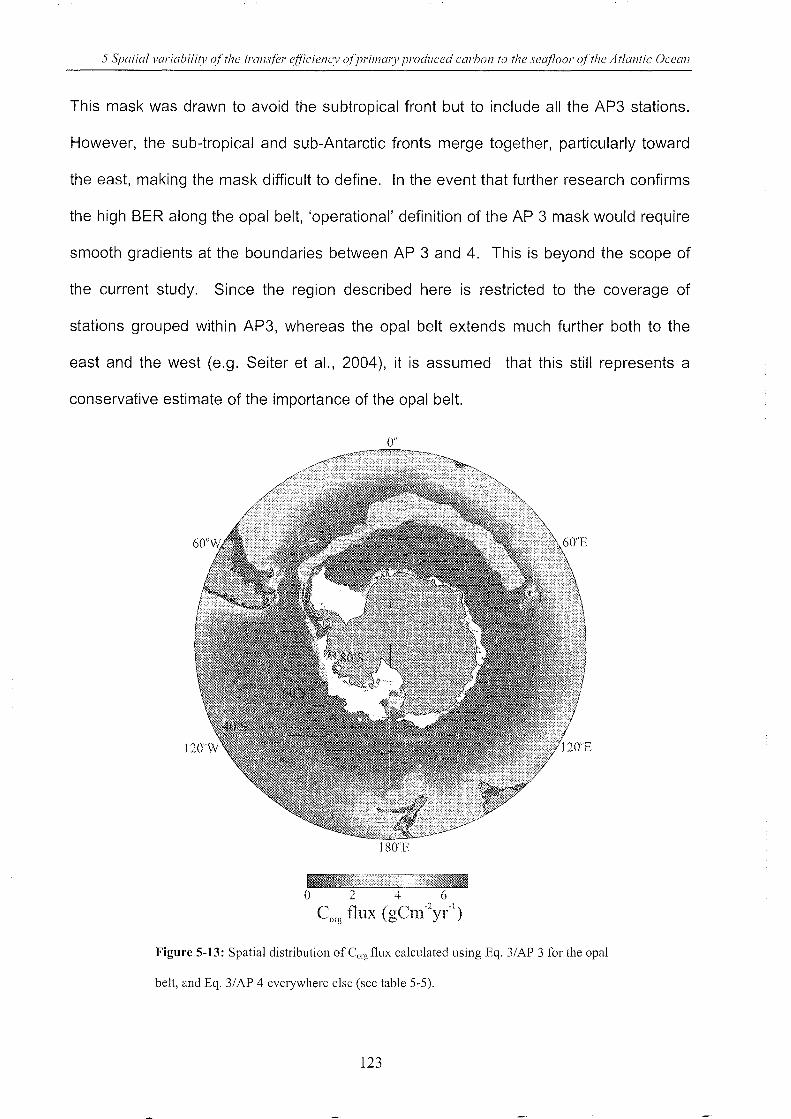
5 Spatial variabilit)' oj'the transj'er efficiency oj'primarv prodllced carbon to the sea/loo I' oj'the Atlantic Ocean
This mask was drawn to avoid the subtropical front but to include all the AP3 stations.
However, the sub-tropical and sub-Antarctic fronts merge together, particularly toward
the east, making the mask difficult to define. In the event that further research confirms
the high BER along the opal belt, 'operational' definition of the AP 3 mask would require
smooth gradients at the boundaries between AP 3 and 4. This is beyond the scope of
the current study. Since the region described here is restricted to the coverage of
stations grouped within AP3, whereas the opal belt extends much further both to the
east and the west (e.g. Seiter et ai., 2004), it is assumed that this still represents a
conservative estimate of the importance of the opal belt.
180"E
o 4 6 C
org tlux (gCnl-2y(1)
Figure 5-13: Spatial distribution of Corg flux calculated using Eq. 3/ AP 3 for the opal
belt, and Eq. 3/ AP 4 everywhere else (see table 5-5).
123
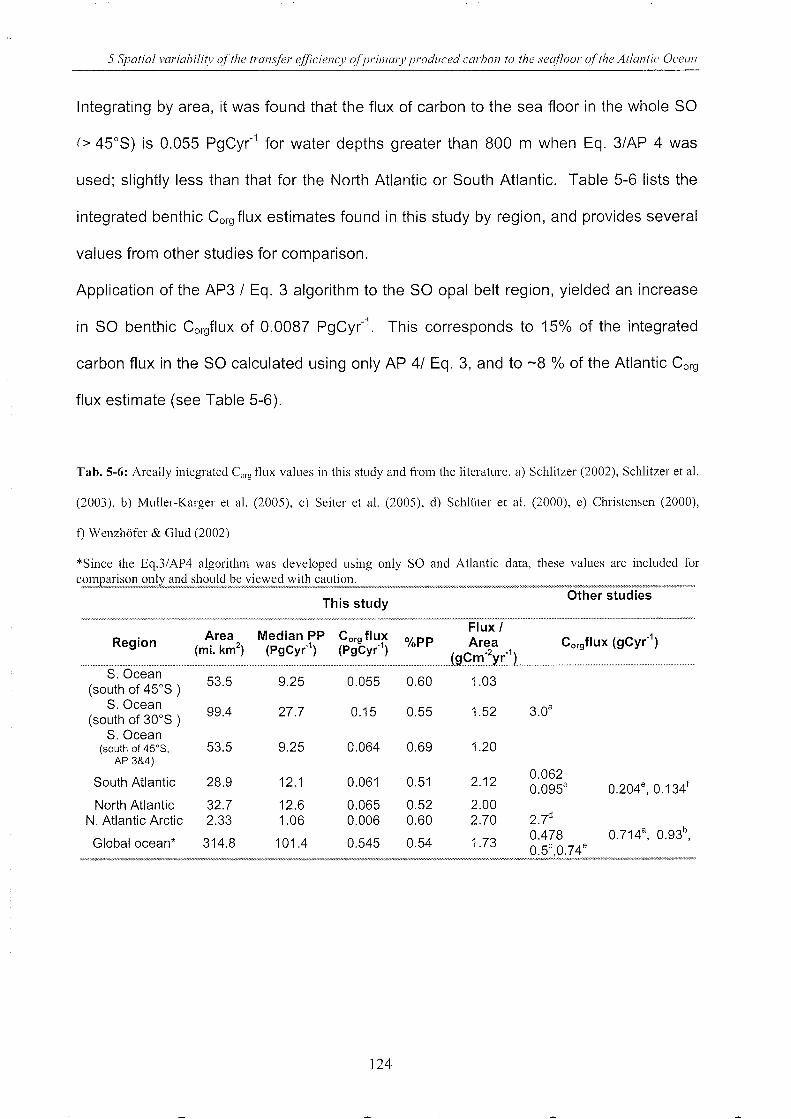
5 Spatial variabilitl' of the transfer efficiency o(primm:v produced carbon to the sea/loor of the Atlantic Ocean
Integrating by area, it was found that the flux of carbon to the sea floor in the whole SO
(> 45°S) is 0.055 PgCy(1 for water depths greater than 800 m when Eq. 3/AP 4 was
used; slightly less than that for the North Atlantic or South Atlantic. Table 5-6 lists the
integrated benthic Corg flux estimates found in this study by region, and provides several
values from other studies for comparison.
Application of the AP3 1 Eq. 3 algorithm to the SO opal belt region, yielded an increase
in SO benthic Corgflux of 0.0087 PgCy(1. This corresponds to 15% of the integrated
carbon flux in the SO calculated using only AP 41 Eq. 3, and to -8 % of the Atlantic Corg
flux estimate (see Table 5-6).
Tab. 5-6: Areally integrated Corg flux values in this study and from the literature. a) Schlitzer (2002), Schlitzer et al.
(2003), b) Muller-Karger et al. (2005), c) Seiter et al. (2005), d) Schli.iter et al. (2000), e) Christensen (2000),
f) WenzhOfer & Glud (2002)
*Since the Eq.3/ AP4 algorithm was developed using only SO and Atlantic data, these values are included for and should be viewed with caution.
This study
Area Median pp Corgflux Region (mi. km2
) (PgCyr'l) (PgCyr'l)
S. Ocean 53.5 9.25 0.055
(south of 45°S ) S. Ocean
99.4 27.7 0.15 (south of 30 0 S )
S. Ocean (south of 45°8, 53.5 9.25 0.064
AP 3&4)
South Atlantic 28.9 12.1 0.061
North Atlantic 32.7 12.6 0.065 N. Atlantic Arctic 2.33 1.06 0.006
Global ocean* 314.8 101.4 0.545
124
Flux I %PP Area
(C ·2 .1) ................. g.)!I.Y~ .....
0.60 1.03
0.55 1.52
0.69 1.20
0.51 2.12
0.52 2.00 0.60 2.70
0.54 1.73
Other studies
0.062 0.0958
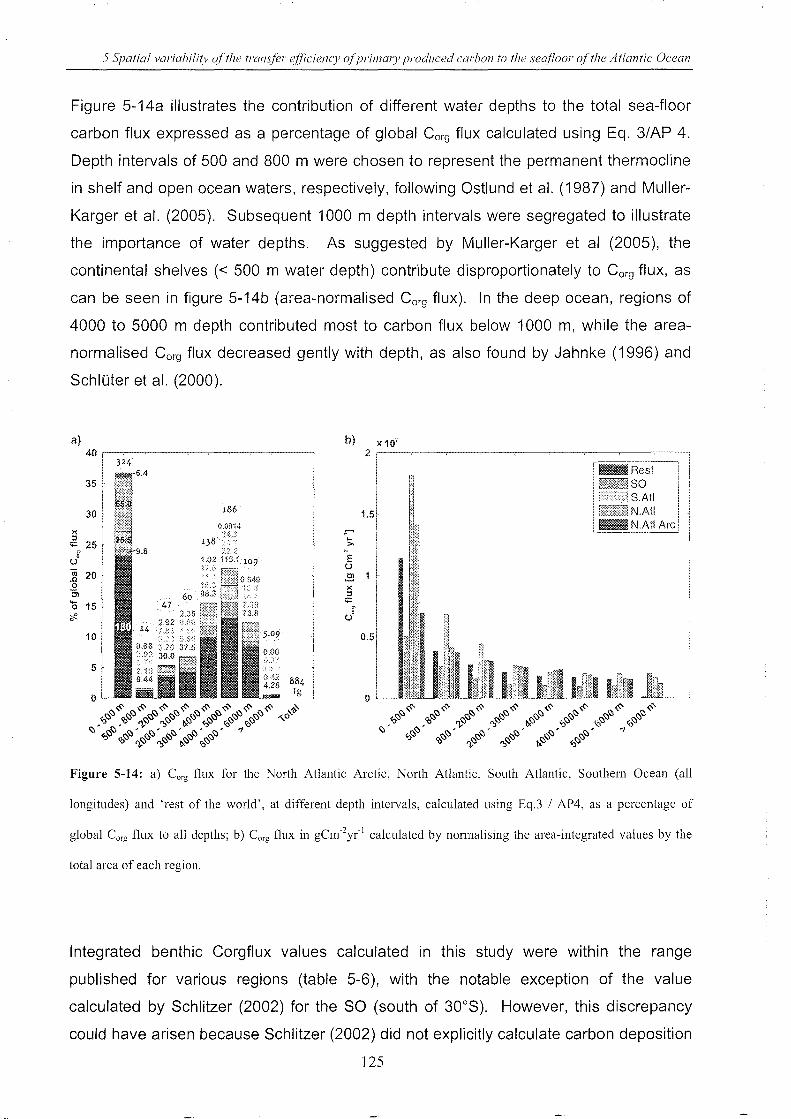
5 Spatial variahilitv olthe transfer etliciencv olprimarv produced carbon to the sea/700r olthe Atlantic Ocean
Figure 5-14a illustrates the contribution of different water depths to the total sea-floor
carbon flux expressed as a percentage of global Corg flux calculated using Eq. 3/AP 4.
Depth intervals of 500 and 800 m were chosen to represent the permanent thermocline
in shelf and open ocean waters, respectively, following Ostlund et al. (1987) and Muller
Karger et al. (2005). Subsequent 1000 m depth intervals were segregated to illustrate
the importance of water depths. As suggested by Muller-Karger et al (2005), the
continental shelves « 500 m water depth) contribute disproportionately to Corg flux, as
can be seen in figure 5-14b (area-normalised Corg flux). In the deep ocean, regions of
4000 to 5000 m depth contributed most to carbon flux below 1000 m, while the area
normalised Corg flux decreased gently with depth, as also found by Jahnke (1996) and
SchlOter et al. (2000).
a) 40,-~~~~--~--~~----,
x ::l
35
30
t;:: 25 ,J ~ 20 o Cl Ci 15 ;f!.
10
5 .
o
186
884 Tg o
I!IIi1l!!II Rest SO SAtl N.Atl
RmN.AtlArc
Figure 5-14: a) Corg flux for the North Atlantic Arctic, North Atlantic, South Atlantic, Southern Ocean (all
longitudes) and 'rest of the world', at different depth intervals, calculated using Eq.3 / AP4, as a percentage of
global Corg flux to all depths; b) Corg flux in gCm-2y(i calculated by normalising the area-integrated values by the
total area of each region.
Integrated benthic Corgflux values calculated in this study were within the range
published for various regions (table 5-6), with the notable exception of the value
calculated by Schlitzer (2002) for the SO (south of 30 0 S). However, this discrepancy
could have arisen because Schlitzer (2002) did not explicitly calculate carbon deposition
125
5 Spatial val'iabilitv of the transfer efficiency o/jJI'ilJ1G1Y produced carbon to the sea/700l' of the Atlantic Ocean
at the sea-floor, but rather remineralisation within the lower water masses, or because
of the significant nitrification within the euphotic zone, rendering the f-ratio invalid.
While global application of the Eq.3/AP 4 algorithm enabled comparison with other
studies using a range of methodologies, it is difficult to assess how well it performs in
basins other than the SO and Atlantic: Seiter et al. 2005 concluded that Pacific sub and
anoxic remineralization processes are more important outside of the Southern and
Atlantic Oceans on account of the time since these waters were last ventilated. This
would imply that our estimates considerably underestimated the benthic Corg flux. In
contrast, Cai & Reimers (1995) found similar remineralisation rates in the Pacific and
Atlantic. In general, the global dataset, particularly of oxygen microprofiles, is still
sparse.
5.4.8 Open questions
Relationships between benthic Corgflux and OPD One of the greatest weaknesses of this study is the scatter in the relationship between
benthic Corgflux and OPD (figure 5-3). In the absence of more temporal monitoring of
Corgflux variability at any given location, the use of the relationship between these two
parameters remains the best option for determining whether Corgflux measurements are
contaminated by recent sedimentation events. Clearly, a tighter relationship, or better
understanding of interactions between the upper millimetres and deeper layers of
sediment, is desirable.
Could more sophisticated definition of ecological provinces better capture the variability
in BER?
The study of Sokolov & Rintoul (2007) promises a routine method for establishing
ecological province boundaries in the Southern Ocean. If this, or a similar, approach
can be expanded to other regions, then determining the strength of coupling between
126
5 Spatial variability oj'the transfer efficiency oj'primarv produced carbon to the sea/loor oj'the Atlantic Ocean
surface carbon fixation and benthic rain rates will be limited only by the size of the
benthic dataset.
Does the mesopelagic community eliminate the swiace ecological province footprint at
depth?
As pointed out by Cai & Reimers (1995), remineralisation of carbon at the sediment
interface depends not only on the degradability of particulate organic matter but also on
the benthic environment, i.e. parameter such as on oxygen concentration,
sedimentation rate and bioturbation rates. Since these conditions influence one another
over both short and geological time scales, the system is clearly highly evolved and
complex: this may mean it is susceptible to disturbance by sudden changes in input or
that it is highly adaptive, so that regional variability is mostly damped out within days of
Corg reaching the sea floor.
Several elements of the mesopelagic community have been shown to adapt to Corg
export variability (e.g. Zari6 et aI., 2005; Richardson et aI., 2006; Countway et aI., 2007),
suggesting that the ecosystem across the breadth of the water column is able to
compensate for the mode and speed of particle export and make maximal use of
available Corg. Export models, while becoming increasingly sophisticated, still lack a
detailed parametrisation of mesopelagic variability (e.g. Gehlen et aI., 2006; Stemmann
et ai, 2004).
This dataset used here suffers very poor coverage in the mid-latitude gyres, reported to
have the lowest export ratio. Despite this, the values found here are lower than those
reported from sediment traps in the vicinity of the gyres. This implies that sufficient
remineralisation occurs between the lowest trap positions and the sea floor that, even in
the more productive zones of the current dataset, benthic remineralisation rates are
lower than in the mesopelagic of the oligotrophic gyres.
127
5 Spatial variahilit)' of the transfer etJ7ciency ofpril7lar), produced carbon to the seaf700r olthe Atlantic Ocean
What is the inter-annual variability in benthic Corgflux?
The results presented here represent the long-term (decadal) situation. While Gregg et
al., 2005 found no significant trend in chl-a concentrations in the SO over the last ten
years, Antia et al. (2001) reported a shift in biological pump efficiency caused by
reduced opal content. On a global scale, the interannual variability in Corg flux reported
by Muller-Karger et al. (2005) far exceeded the inter-decadal trend derived by Gregg et
al. (2005). Such trends can not be analysed using the current oxygen microelectrode
dataset since fewer than 10 measurements concurrent with the SeaWIFS or CZCS flight
periods have been recorded so far.
How efficient is the biological pump in the SO? Similar to Schlitzer (2002) this study was not intended to be a stand-alone approach to
quantifying the rate of biological pump efficiency since no indication of rain ratio can be
gleaned from satellite data at present. The rain ratio has been found to be low in the
SO (Seiter et al., 2004): their data show an inverse correlation between opal and calcite
over much of the global ocean. In the SO and Arctic, CaC03 concentrations are
conspicuously low, whereas opal appears high in the SO, low in the Arctic. This implies
that the AP 3 stations in the SO are likely to have a reinforcing effect on the biological
pump, while the same may not be true for the Arctic. The results presented here
represent a lower limit on the carbon flux to the sea floor; the algorithms derived may be
used in models which distinguish the soft- and hard-tissue pumps to quantify the effects
of primary production on alkalinity as well as determining carbon export.
128
5 Spatial variabilit)' a/the trans/er ellicienc), oj'primmT produced carbon to the sea/loor a/the At/antic Ocean
5.5 Conclusions
A large dataset of benthic oxygen microprofiles and satellite primary production data
have been used to explore regional variability in the export of organic carbon to the sea
floor in the Southern and Atlantic oceans.
A priori determination of ecological provinces using satellite-derived chlorophyll
concentrations or sediment characteristics did not capture regional differences in the
benthic export ratio, whereas a posteriori groupings, defined using the BER, highlighted
a band of high export along the Southern Ocean opal belt (BER - 2 % compared to 0.7
% in the rest of the Atlantic).
Benthic organic carbon flux was found to be elevated within three latitudinal bands - at
70 0 S, 20 0 S and 40 0 N, whereas high BER was clearly a feature of high latitudes.
Spatially-integrated carbon export was calculated for the North and South Atlantic,
northern North Atlantic, Southern Ocean and 'rest of the world', yielding comparable
values to most values published based on quite different techniques, with the exception
of the calculations of Schlitzer (2002) for the Southern Ocean south of 30 0 S which
exceeded our estimates by a factor of -5.
The implications of our findings affect estimates of present and past contributions to
CO2 draw-down in the Southern Ocean and possibly in other areas of the world ocean.
There is evidence that during glacial periods export in the SO was significantly
enhanced (Kumar et al., 1995; Anderson et al., 2002; Fennel et al., 2003; Abelmann et
al., 2006). Our results for the modern SO could be used to reconstruct detailed
palaeoproductivity scenarios such as that proposed by Abelmann et al., 2006.
129
5 Spatial variabilitv olthe transfer efficiency ojjJril71G1Y produced carbon to the seafloor olthe Atlantic Ocean
Acknowledgements
We gratefully acknowleage the skilled support of captain and crew of the RV Polarstern.
We thank Jan Wegner, Ludmila Baumann, and Michael Gensheimer for their
unremitting technical and laboratory support during Expedition ANT-XXI/4. The
manuscript benefited from useful comments of Michiel Rutgers van der Loeff and Ulrich
Bathmann. This study has been co-funded by the Deutsche Forschungsgemeinschaft
within the Priority Program SPP 1158 (SA1030/1-1 - 1-4).
5.6 References
Abelmann, A., R. Gersonde, G. Cortese, G. Kuhn, and V. Smetacek (2006), Extensive phytoplankton
blooms in the Atlantic sector of the glacial Southern Ocean, Paleoceanography, 21, PA 1013.
Anderson, L. A., and J. L. Sarmiento (1994), Redfield ratios of remineralization determined by nutrient
data analysis, Global Biogeochem. Cycles, 8, 65-80.
Anderson, R. F., Z. Chase, M. Q. Fleischer, and J. Sachs (2002), The Southern Ocean's biological pump
during the last Glacial Maximum, Deep Sea Res., Part 11, 49, 1909-1938.
Andersson, J. H., J. W. M. Wijsman, P. M. J. Herman, and J. J. Middelburg (2004), Respiration patterns
in the deep ocean, Geophys. Res. Left., 31, L03304.
Antia, A. N., W. Koeve, G. Fischer, T. Blanz, D. Schulz-Bull, J. Scholten, S. Neuer, K. Kremling, J. Kuss,
R. Peinert, D. Hebbeln, U. Bathmann, M. Conte, U. Fehner, and B. Zeitschel (2001), Basin-wide
particulate carbon flux in the Atlantic Ocean: regional export patterns and potential for atmospheric
CO2 sequestration, Global Biogeochem. Cycles, 15,845-862.
Antonine, D., J.-M. Andre, and A. Morel (1996), Oceanic primary production 2. Estimation of global scale
from satellite (Coastal Zone Color Scanner) chlorophyll, Global Biogeochem. Cycles, 10,57-69.
Archer, D., S. Emerson, and C. Reimers (1989), Dissolution of calcite in deep-sea sediments: pH and O2
microelectrode results, Geochim. Cosmochim. Acta, 53,2831-2845.
Armand, L. K., X. Crosta, O. Romero, and J.-J. Pichon (2005), The biogeography of major diatom taxa in
Southern Ocean sediments: 1. Sea ice related species, Palaeogeogr. Palaeoclim. Palaeoecol., 223,
93-126.
Armstrong, R. A., C. Lee, J. I. Hedges, S. Honjo, and S. G. Wakeham (2002), A new, mechanistic model
for organic carbon fluxes in the ocean based on the quantitative association of POC with ballast
minerals, Deep Sea Res., Part 11, 49, 219-236.
Asper, V. L., S. Honjo, T. H. Orsi (1992), Distribution and transport of marine snow aggregates in the
Panama Basin, Deep Sea Res., Part A, 39, 939-952.
130
5 Spatial variabilitl' olthe transler efficiency ol pril11my produced carbon to the sea/loor olthe Atlantic Ocean
Barnett, P. R. 0., J. Watson, D. Conelly (1984), A multiple corer for taking virtually undisturbed samples
from shelf, bathyal, and abyssal sediments, Oceanol. Acta, 7, 399-408.
Beaman, R. J., P. T. Harris (2005), Bioregionalization of the Gerorge V Shelf, East Antarctica, Cont. Shelf
Res., 25, 1657-1691.
Beckmann, A., H. H. Hellmer, and R. Timmermann (1999), A numerical model of the Weddell Sea: large
scale circulation and water mass distribution, J. Geophys. Res., 104,23375-23391.
Behrenfeld, M. J., and P. G. Falkowski (1997), Photosynthetic rates derived from satellite-based
chlorophyll concentration, Limnol. Oceanogr., 42, 1-20.
Berg, P., N. Risgaard-Petersen, and S. Rysgaard (1998), Interpretation of measured concentration
profiles in sediment pore water, Limnol. Oceanogr., 43,1500-1510.
Boyd, P. W., and T. W. Trull (2007), Understanding the export of biogenic particles in oceanic waters: Is
there consensus? Prog. Oceanogr., 72,276-312.
Brandt, A., A. J. Gooday, S. N. Brandno, S. Brix, W. Brbkeland, T. Cedhagen, M. Choudhury, N.
Cornelius, B. Danis, I. De Mesel, R. J. Diaz, D. C. Gillan, B. Ebbe, J. A. Howe, D. Janussen, S.
Kaiser, K. Linse, M. Malyutina, J. Pawlowski, M. Raupach, and A. Vanreusel (2007a), First insights
into the biodiversity and biogeography of the Southern Ocean deep sea, Nature, 447, 307-311.
Brandt, A., C. De Broyer, I. De Mesel, K. E. Ellingsen, A. J. Gooday, B. Hilbig, K. Linse. M. R. A.
Thomson, and P. A. Tyler (2007b), The biodiversity of the deep Southern Ocean benthos, Phil.
Trans. R. Soc. B., 362, 39-66.
Burckle, L. H., and J. Cirilli (1987), Origin of the diatom ooze belt in the Southern Ocean: implications for
the late Quaternary paleoceanography, Micropaleont., 33,82-86.
Burdige, D. J. (2007), Preservation of organic matter in marine sediments: controls, mechanisms, and an
imbalance in sediment organic carbon budgets?, Chem. Rev. 107, 467-485.e
Buesseler, K. O. (1998), The decoupling of production and particulate export in the surface ocean, Global
Biogeochem. Cycles, 12,297-310.
Cai, W.-J., and C. E. Reimers (1995), Benthic oxygen flux, bottom water oxygen concentration and core
top organic carbon content in the deep northeast Pacific Ocean, Deep Sea Res., Part I, 42, 1681-
1699.
Caldeira, K., and P. B. Duffy (2000), The role of the Southern Ocean in uptake and storage of
anthropogenic carbon dioxide, Science, 287, 620-622.
Cameron, D. R., T. M. Lenton, A. J. Ridgwell, J. G. Shepherd, R. Marsh, and A. Yool (2005), A factorial
analysis of the marine carbon cycle and ocean circulation controls on atmospheric CO 2, Global
Biogeochem. Cycles, 19, GB4027.
Carney, R. S. (1989), Examining relationships between organic carbon flux and deep-sea deposit
feeding, in Ecology of marine deposit feeders, edited by G. Lopez, G. Taghon and J. Levinton, pp.
24-58, Springer.
Christensen, J. P. (2000), A relationship between deep-sea benthic oxygen demand and oceanic primary
productivity, Oceanol. Acta, 23, 65-82.
Conte, M. H., G. Eglinton, and L. A. S. Madureira (1995), Origin and fate of organic biomarker
compounds in the water column and sediments of the eastern North Atlantic, Phi/os. Trans. R. Soc.
London, Ser. B, 348, 169-177.
131
5 Spatial variabilitl' o/the transfer efficiency o/jJril17arv produced carbon to the sea/loor o/the Atlantic Ocean
Countway, P, D" R. J, Gast, M, R. Dennett, P, Savai, J, M, Rose, and D, A. Caron (2007), Distinct
protistan assemblages characterize the euphotic zone and deep sea (2500 m) of the western North
Atlantic (Sargasso Sea and Gulf Stream), Environ Microbiol" 9, 1219-1232,
Crosta, X" J,-J, Pichon, and M, Labracherie (1997), Distribution of Chaetoceros resting spores in modern
peri-Antarctic sediments, Mar, Micropaleo" 29, 283-299,
DeFelice, D, R., and S, W. J, Wise (1981), Surface lithofacies, biofacies and diatom diversity patterns as
models for delineation of climatic change in the southeast Atlantic Ocean, Mar, Micropaleo" 6, 29-
70,
Dore, J, E" and D, M, Karl (1996), Nitrification in the euphotic zone as a source for nitrite, nitrate, and
nitrous oxide at station ALOHA, Limnol. Oceanogr" 41, 1619-1628,
Dunne, J, P" R. A. Armstrong, A. Gnanadesikan, and J, L. Sarmiento (2005), Empirical and mechanistic
models for the particle export ratio, Global Biogeochem. Cycles, 19, GB4026.
Epping, E. H. G., C. van der Zee, K. Soetaert, and W. Helder (2002), On the oxidation and burial of
organic carbon in sediments of the Iberian Margin and Nazare Canyon (NE Atlantic), Prog.
Oceanogr., 52, 399-431.
Fennel, K., M. R. Abbott, Y. H. Spitz, J. G. Richman, and D. M. Nelson (2003), Impacts of iron control on
phytoplankton production in the modern and glacial Southern Ocean, Deep Sea Res., Part /I, 50,
833-851.
Fischer, G., D. FOtterer, R. Gersonde, S. Honjo, D. Ostermann, and G. Wefer (1988), Seasonal variability
of particle flux in the Weddell Sea and its relation to ice cover, Nature, 335, 426-428.
Fischer, G., V. Ratmeyer, and G. Wefer (2000), Organic carbon fluxes in the Atlantic and the Southern
Ocean: relationship to primary production compiled from satellite radiometer data, Deep Sea Res.,
Part 1/,47,1961-1997.
Francois, R., S. Honjo, R. Krishfield, and S. Manganini (2002), Factors controlling the flux of organic
carbon to the bathypelagic zone of the ocean, Global Biogeochem. Cycles, 16, GB001722.
Gehlen, M., L. Boop, N. Emprin, O. Aumont, C. Heinze, and O. Ragueneau (2006), Reconciling surface
ocean productivity, export fluxes and sediment composition in a global biogeochemical ocean model,
Biogeosciences, 3, 521-573.
Geibert, W., M. Rutgers van der Loeff, R. Usbeck, R. Gersonde, G. Kuhn, and J. Seeberg-Elverfeldt
(2005), Quantifying the opal belt in the Atlantic and southeast Pacific sector of the Southern Ocean
by means of 230Th normalization, Global Biogeochem. Cycles, 19, GB4001.
Glud, R. N., J. K. Gundersen, B. B. J0rgensen, N. P. Revsbech, and H.-D. Schulz (1994), Diffusive and
total oxygen ! !otake of deep-sea sediments in the eastern South Atlantic Ocean, in situ and
laboratory me Tements, Deep Sea Res., Part 1,41,1767-1788.
Grasshoff, K., M. c.Yhard, and K. Kremling (1983), Methods of Seawater Analysis, Verlag Chemie,
Weinheim, 417 pp.
Green, S. E., and R. N. Sambrotto (2006), Plankton community structure and export of C, N, P and Si in
the Antarctic Circumpolar Current, Deep Sea Res., Part /I, 53, 620-643.
Gregg, W. W., N. W. Casey, and C. R. McClain (2005), Recent trends in global ocean chlorophyll,
Geophys. Res. Lett., 32, L03606.
132
5 Spatial variabi!it)' olthe tram/er efjiciency a/primal'\' produced carbon to the seafloor olthe Atlantic Ocean
Gust, G., A. F. Michaels, R. Johnson, W. G. Deuser, and W. Bowles (1994), Mooring line motions and
sediment trap hydromechanics: In situ intercomparison of three common deployment designs, Deep
Sea Res., Part I, 41, 831-857.
Gutt, J., A. Starmans, and G. Dieckmann (1998), Phytodetritus deposited on the Antarctic shelf and upper
slope: its relevance for the benthic system, J. Mar. Syst., 17, 435-444.
Hales, B., and S. Emerson (1997), Calcite dissolution in sediments of the Ceara rise: in situ
measurements of porewater O2 , pH, and CO2(aq), Geochim. Cosmochim. Acta, 61,501-514.
Hales, B., S. Emerson, and D. Archer (1994), Respiration and dissolution in the sediments of the western
North Atlantic: Estimates from models of in situ microelectrode measurements of porewater oxygen
and pH, Deep Sea Res., Part A, 41,695-719.
Hartnett, H. E., R. G. Keil, J. I. Hedges, and A. H. Devol (1998), Influence of oxygen exposure time on
organic carbon preservation in continental margin sediments, Nature, 391,572-574.
Holm-Hansen, 0., M. Kahru, and C. D. Hewes (2005), Deep chlorophyll-a maxima (DCMs) in pelagic
Antarctic waters 11. Relation to bathymetric features and dissolved iron concentration, Mar. Ecol.
Prog. Ser., 297, 71-81.
Honjo, S. (2004), Particle export and the biological pump in the Southern Ocean, Antarct. Sci., 16, 501-
516.
Houghton, R. A. (2003), The contemporary carbon cycle, in Treatise of geochemistry 8, edited by W. H.
Schlesinger, pp. 473-513, Elsevier, Amsterdam.
Hulth, S., A. Tengberg, A. Landen, and P. O. J. Hall (1997), Mineralization and burial of organic carbon in
sediments of the southern Weddell Sea (Antarctica), Deep Sea Res., Part 1,44, 955-981.
Ito, T., P. Parekh, S. Dutkiewicz, and M. J. Follows (2005), The Antarctic Circumpolar Productivity Belt,
Geophys. Res. Lett., 32, L 13604.
Jahnke, R. A., S. R. Emerson, C. E. Reimers, J. Schuffert, K. Ruttenberg, and D. Archer, Benthic
recycling of biogenic debris in the eastern tropical Atlantic Ocean, Geochim. Cosmochim. Acta, 53,
2947-2960, 1989.
Jahnke, R. A. (1996), The global ocean flux of particulate organic carbon: Areal distribution and
magnitude, Global Biogeochem. Cycles, 10,71-88.
Jahnke, R. A. (2001), Constraining organic matter cycling with benthic fluxes, in The Benthic Boundary
Layer-Transport Processes and Biogeochemistry, edited by B. P. Boudreau, and B. B. J0rgensen,
pp. 302-319, Oxford University Press, Oxford.
Jin, X., N. Gruber, J. P. Dunne, J. L. Sarmiento, and R. A. Armstrong (2006), Diagnosing the contribution
of phytoplankton functional groups to the production and export of particulate organic carbon,
CaC03, and opal from global nutrient and alkalinity distributions, Global Biogeochem. Cycles, 20,
GB2015.
Jouse, A. P., G. S. Koroleva, and G. A. Nagaeva (1962), Diatoms in the surface layer of sediment in the
Indian sector of the Antarctic (in Russian with English summary), Trudy Instituta Okeanologii
(= Transactions of the Institute of Oceanology), Akademija Nauk, SSSR 61, 19-92.
Kemp, A. E. S., R. B. Pearce, I. Grigorov, J. Rance, C. B. Lange, P. Quilty, and I. Salter (2006),
Production of giant marine diatoms and their export at oceanic frontal zones: Implications for Si and
C flux from stratified oceans, Global Biogeochem. Cycles, 20, GB4S04.
133
5 Spatial variabilitv ol/he translel' etlicienc)' o/JJril71arv produced carbon to the sea/loo I' olthe Atlantic Ocean
Ki0rboe, T., and G. A. Jackson (2001), Marine snow, organic solute plumes, and optimal chemosensory
behavior of bacteria, Limnol. Oceanogr., 46, 1309-1318.
Kumar, N., R. F. Anderson, R. A. Mortlock, P. N. Froelich, P. Kubik, B. Dittrich-Hannen, and M. Suter
(1995), Increased biological productivity and export production in the glacial Southern Ocean,
Nature, 378, 675-680.
Lampitt, R. S., and A. N. Antia (1997), Particle flux in deep seas: regional characteristics and temporal
variability, Deep Sea Res., Part I, 44, 1377-1403.
Le QUElrE3, C., C. R6denbeck, E. T. Buitenhuis, T. J. Conway, R. Langenfelds, A. Gomez, C.
Labuschagne, M. Ramonet, T. Nakazawa, N. Metzl, N. Gillett, and M. Heimann (2007), Saturation of
the Southern Ocean CO2 sink due to recent climate change, Science, 316, 1735-1738.
Lohse, L., W. Helder, E. H. G.Epping, and W. Balzer (1998), Recycling of organic matter along a shelf
slope transect across the N.W. European Continental Margin (Goban Spur), Prog. Oceanogr., 42,
77-110.
Longhurst, A. R., S. Sathyendranath, T. Platt, and C. M. Caverhill (1995), An estimate of global primary
production in the ocean from satellite radiometer data, J. Plankton Res., 17, 1245-1271.
Lutz, M., K. Dunbar, and K. Caldeira (2002), Regional variability in the vertical flux of particulate organic
carbon in the ocean interior, Global Biogeochem. Cycles, 16, GB001383.
Martin, J. H., G. A. Knauer, D. M. Karl, and W. Broenkow (1987), VERTEX: Carbon cycling in the
northeast Pacific, Deep Sea Res., 34,267-285.
Matsumoto, K., T. Hashioka, and Y. Yamanaka (2007), Effect of temperature-dependent organic carbon
decay on atmospheric pC02 , J. Geophys. Res., 112, G02007.
Mohan, R., S. Shanvas, M. Thamban, and M. Sudhakar (2006), Spatial distribution of diatoms in surface
sediments from the Indian sector of Southern Ocean, Curr. Sci., 91, 1495-1502.
Moriceau, B., M. Garvey, O. Ragueneau, and U. Passow (2007), Evidence for reduced biogenic silica
dissolution rates in diatom aggregates, Mar. Ecol. Prog. Ser., 333, 129-142.
Muller-Karger, F. E., R. Varela, R. Thunell, R. Luerssen, C. Hu, and J. J. Walsh (2005), The importance
of continental margins in the global carbon cycle, Geophys. Res. Left., 32, L01602.
Nodder, S. D., P. W. Boyd, S. M. Chiswell, M. H. Pinkerton, J. M. Bradford-Grieve, and Malcom J. N.
Greig (2005), Temporal coupling between surface and deep ocean biogeochemical processes in
contrasting subtropical and subantarctic water masses, southwest Pacific Ocean, J. Geophys. Res.,
110, C12017.
Orsi, A. H., T. Whitworth, W. D. Nowlin (1995), On the meridional extent and fronts of the Antarctic
circumpolar current, Deep Sea Res., Part A, 42, 641-673.
Ostlund, H. G., H. Craig, W. S. Broecker, and D. Spencer (1987), GEOSECS Atlantic, Pacific, and Indian
Ocean Expedition, vol. 7, Shorebased Data and Graphics, National Science Foundation, U.S. Gov.
Print. Off., Washington, D. C., 200 pp.
Pace, M., G. Knauer, D. Karl, and J. Martin (1987), Primary production, new production and vertical flux in
the eastern Pacific Ocean, Nature, 325, 803-804.
Passow, U., and C. L. De La Rocha (2006), Accumulation of mineral ballast on organic aggregates,
Global Biogeochem. Cycles, 20, GB1013.
134
5 Spatial variabilitv olthe transler efficiency olpriIl1C11:1' produced carbon to the seafloor olthe Atlantic Ocean
Platt, T., S. Sathyendranath, A. Longhurst, T. R. S. Wilson, J. Woods, and T. Takahashi (1995), Remote
sensing of primary production in the ocean: promise and fulfilment, Philos. Trans. R. Soc. London
Ser. A., 348,191-202.
Raimbault, P., G. Slawyk, B. Boudjellal, C. Coatanoan, P. Conan, B. Coste, N. Garcia, T. Moutin, and M.
Pujo-Pay (1999), Carbon and nitrogen uptake and export in the equatorial Pacific at 150oW:
Evidence of an efficient regenerated production cycle, J. Geophys. Res., 104,3341-3356.
Raven, J. A., and P. G. Falkowski (1999), Oceanic sinks for atmospheric CO2 , Plant Cell and Environ.,
22,741-755.
Reimers, C. E., K. M. Fischer, R. Merewether, K. L. Smith Jr., and R. A. Jahnke (1986), Oxygen
microprofiles measured in situ in deep ocean sediments, Nature, 320,741-744.
Revsbech, N. P., and B. B. J0rgensen (1986), Microelectrodes and their use in microbial ecology, in
Advantagesin microbial ecology 9, edited by K. C. Marshall, pp. 293-352, Plenum, New York.
Riaux-Gobin, C., P. E. Hargraves, J. Neveux, L. Oriol, and G. Vetion (1997), Microphyte pigments and
resting spores at the water-sediment interface in the Subantarctic deep-sea (Indian sector of the
Southern Ocean), Deep Sea Res. Part /I, 44, 1033-1051.
Richardson, T. L., G. A. Jackson, H. W. Ducklow, M. R. Roman (2006), Spatial and seasonal patterns of
carbon cycling through planktonic food webs of the Arabian Sea determined by inverse analysis,
Deep Sea Res., Part /I, 53,555-575.
Sachs, 0., E. J. Sauter, M. SchlOter, I. Peeken, P. Assmy, U. Bathmann, V. H. Strass, and V. Smetacek
(Submitted 2006), Enhanced carbon export to deep-sea sediments underlying productivity hots pots
in the Southern Ocean, Nature.
Sachs, 0., E. J. Sauter, M. SchlOter, M. M. Rutgers van der Loeff, K. Jerosch, and O. Holby (Submitted
2007), Benthic organic carbon flux and oxygen penetration reflect different plankton provinces in the
Southern Ocean, Deep Sea Res., Part I.
Sarmiento, J. L., and C. Le Quere (1996), Oceanic carbon dioxide uptake in a model of century-scale
global warming, Science, 274, 1346-1350.
Sarmiento, J. L., N. Gruber, M. A. Brzezinski, and J. P. Dunne (2004), High-latitude controls of
thermocline nutrients and low latitude biological productivity, Nature, 427, 56-60.
Sauter, E. J., M. SchlOter, and E. Suess, Organic carbon flux and remineralization in surface sediments
from the northern North Atlantic derived from pore-water oxygen microprofiles, Deep Sea Res., Part
I, 48, 529-553, 2001.
Schlitzer, R. (2002), Carbon export fluxes in the Southern Ocean: results from inverse modeling and
comparison with satellite-based estimates, Deep Sea Res., Part /I, 49, 1623-1644.
Schlitzer, R., R. Us beck, and G. Fischer (2003), Inverse Modeling of Particulate Organic Carbon Fluxes in
the South Atlantic, in The South Atlantic in the late Quaternary: Reconstruction of material budgets
and current systems, edited by G. Wefer, S. Mulitza, and V. Ratmeyer, pp. 1-19, Springer Verlag,
Berlin Heidelberg New York Tokyo.
SchlOter, M. (1991), Organic carbon flux and oxygen penetration into sediments of the Weddell Sea:
indicators for regional differences in export production, Mar. Chem., 35, 569-579.
SchlOter, M., M. M. Rutgers van der Loeff, O. Holby, and G. Kuhn (1998), Silica cycle in surface
sediments of the South Atlantic, Deep Sea Res., Part 1,45, 1085-1109.
135
5 Spatial variabilitv afthe transfer efficiency afprimarv produced carbon ta the sea/loor of the Atlantic Ocean
SchlOter, M., E. J. Sauter, A. Schafer, and W. Ritzrau (2000), Spatial budget of organic carbon flux to the
seafloor of the north"'rn North Atlantic (60 0 N - 80 0 N), Global Biogeochem. Cycles, 14, 329-340.
Schodlok, M. P., H. H. Hellmer, and A. Beckmann (2002), On the transport, variabilitj' and origin of dense
water masses crossing the South Scotia Ridge, Deep Sea Res., Part If, 49, 4807-4825.
Scholten, J. C., F. Fietzke, S. Vogler, M. Rutgers van der Loeff, A. Mangini, W. Koeve, J. Waniek, P.
Stoffers, A. Antia, and J. Kuss (2001), Trapping efficiency of sediment traps from the deep eastern
North Atlantic: 230Th calibration, Deep Sea Res., Part If, 48, 243-268.
Seiter, K., C. Hensen, J. Schroter, and M. Zabel (2004), Organic carbon content in surface sediments -
defining regional provinces, Deep Sea Res., Part I, 51,2001-2026.
Seiter, K., C. Hensen, and M. Zabel (2005), Benthic carbon mineralization on a global scale, Global
Biogeochem. Cycles, 19, GB1010.
Siegenthaler, U., and J. L. Sarmiento (1993), Atmospheric carbon dioxide and the ocean, Nature, 365,
119-125.
Smetacek, V., C. Klaas, S. Menden-Deuer, and T. A. Rynearson (2002), Mesoscale distribution of
dominant diatom species relative to the hydrographical field along the Antarctic Polar Front, Deep
Sea Res., Part If, 49, 3835-3848.
Smetacek, V., P. Assmy, and J. Henjes (2004), The role of grazing in structuring Southern Ocean pelagic
ecosystems and biogeochemical cycles, Antarct. Sci., 16,541-558.
Smith, W. 0., and C. Lancelot (2004), Bottom-up versus top-down control in phytoplankton of the
Southern Ocean, Antarct. Sci. 16,531-539.
Sokolov, S., and S. R Rintoul (2007), On the relationship between fronts of the Antarctic Circumpolar
Current and surface chlorophyll concentrations in the Southern Ocean, J. Geophys. Res., 112,
C07030.
Stemmann, L., G. A. Jackson, and D. lanson (2004), A vertical model of particle size distributions and
fluxes in the midwater column that includes biological and physical processes - Part I: model
formulation, Deep Sea Res., Part 1,51,865-884.
Suess, E., Particulate organic carbon flux in the ocean-surface productivity and oxygen utilization, Nature,
288,260-263, 1980.
Suzuki, H., H. Sasaki, and M. Fukuchi (2001), Short-term variability in the flux of rapidly sinking particles
in the Antarctic marginal ice zone, Polar BioI., 24, 697-705.
Turley, C. M., and K. Lochte (1990), Microbial response to the input of fresh detritus to the sea bed,
Palaeogeogr. Palaeoclim. Palaeoecol., 89, 3-23.
Turner, J. T. (2002), Zooplankton faecal pellets, marine snow and sinking phytoplankton blooms (review),
Aquat. Microb. Ecol., 27,57-102.
Usbeck, R,M. Rutgers van der Loeff, M. Hoppema, and R Schlitzer (2002), Shallow remineralisation in
the Weddell Gyre, Geochem. Geophys. Geosyst., 3,1008.
Visser, A., W., and G. A. Jackson (2004), Characteristics of the chemical plume behind a sinking particle
in a turbulent water column, Mar. Ecol. Prog. Ser., 283,55-71.
Volk, T., and M. I. Hoffert (1985), Ocean carbon pumps: analysis of relative strengths and efficiencies in
ocea-driven atmospheric CO2 exchanges, in The Carbon Cycle and Atmospheric CO2: Natural
136
5 Spatial variabilitv a/the transfer efficiencv a/primarv produced carbol1 to the seafloor a/the Atlantic Ocean
Variations Archean to Present, edited by E. T. Sunquist and W. S. Broeke, pp. 99-110, American
Geophysical Union, Washington, D. C.
Waples, J. T., C. Benitez-Nelson, N. Savoye, M. Rutgers van der Loeff, M. Baskaran, O. Gustafsson
(2006), An introduction to the application and future use of 234Th in aquatic systems, Marine
Chemistry, 100,166-189.
Wenzhbfer, F., O. Holby, and O. Kohls (2001), Deep penetrating benthic oxygen profiles measured in situ
by oxygen optodes, Deep Sea Res., Part I, 48, 1741-1755.
Wenzhbfer, F., and R. N. Glud (2002), Benthic carbon mineralization in the Atlantic: A synthesis based on
in situ data from the last decade, Deep-Sea Res., Part I, 49, 1255-1279.
Zaric, S., B. Donner, G. Fischer, S. Mulitza, G. Wefer (2005), Sensitivity of planktic foraminifera to sea
surface temperature and export production as derived from sediment trap data, Mar. Micropaleo., 55,
75-105.
Zielinski, U., and R. Gersonde (1997), Diatom distribution in southern ocean surface sediments (Atlantic
sector): implications for paleoenvironmental reconstructions, Palaeogeogr. Palaeoclim. Palaeoecol.,
129,213-250.
137
5 Spatiall'ariabilit)! olthe trallsfer efliciel1cl' o/jJril17arv prodllced carbo/1 to the sea/loor olthe Atlantic Oceal?
138
6 Synthesis and Outlook
This chapter summarises the main results of the previous chapters and describes
additional co-operations with other scientific groups. Developed research programs are
also introduced and an outline for further planned projects given.
In the framework of this cumulative thesis, evidence for an enhanced carbon export to
the deep Southern Ocean was found. The collapse of an artificially induced plankton
bloom as well as the breakdown of a large natural bloom at the Antarctic Polar Front
was observed by satellite observations and the response of the subsequent carbon
export to the deep-sea floor could be measured in situ at the water/sediment interface
for the first time. It also could be shown for the first time that organic carbon reached the
deep-sea floor after an iron fertilization experiment. During the same field campaign,
reference measurements were carried out in an oligotrophic area characterised by
much lower phytoplankton production at the surface.
Proceeding from these results, existing benthic data from the Southern Ocean were
evaluated and benthic fluxes were revised for numerous locations using a correction
function established from the relation of in situ and ex situ flux determinations. This
allowed comparison regional benthic fluxes with the diatom composition of surface
sediments. Organic matter fluxes to the seafloor could be linked with diatom provinces
and, in a further step with long-term satellite observations of surface ocean chlorophyll
concentrations. This allowed the determination of biogeochemical provinces at the
seafloor in terms of benthic fluxes. One of the most prominent results was the high
export efficiency of organic carbon which in the Southern Ocean silica belt, which is
considerably enhanced in comparison to the mid and low latitude Atlantic. These
benthic results could be used as ground truth data for further modelling studies.
Up to now, little is known about the seasonality of deep-sea benthic fluxes. Only a few
in situ measurements exist in the region of the Antarctic Circumpolar Current. It is
important to gather more in situ data and long term measurements in the near future.
Apart from the key results shown above, vital co-operations with other research groups
developed which led or will lead to several additional research papers and conference
contributions (see appendix). One of the highlights to be mentioned was the targeted
measurement of oxygen microprofiles at porpoise carcases in water depths of 2500 and
139
6 SYl1thesis and Outlook
5400 m at the Arctic deep-sea long-term observation site "AWl Hausgarten": These
measurements, perfor, ned during the German-French cruise "Arctic Ocean 2005" with
R/V "L'Atalante" by means of a small deep-sea microprofiler unit operated by a ROV
(remotely operated vehicle), revealed that benthic communities are able to change the
benthic milieu within days or a few weeks subsequent to the input of large food falls
(see appendix). Due to time constraints, these findings will only be evaluated in the
aftermath of this PhD thesis, under consideration of additional data obtained by
collaborators in 2007.
140
7 Appendix
Other publications and conference contributions further associated with this thesis:
Peer-reviewed publications
Gallucci, F., Sauter, E., Sachs, 0., Klages, M., Soltwedel, T. (2007). Caging experiment in the deep sea: efficiency and artefacts from a case study at the Arctic long-term observatory HAUSGARTEN, Journal of experimental marine biology and ecology.
Hoffmann, F., Sauter, E., Sachs, 0., R0Y, H., Klages, M. (2006). Oxygen distribution in Tentorium semisuberites and in its habitat in the Arctic deep sea, Proceedings of the 7th International Sponge Symposium.
Not peer-reviewed Publications
Sauter, E. J., Sachs, 0., Wiesner, U., Hoffmann, F., Bartsch, S., Morchner C. (in press). Geochemistry at the AWI-Hausgarten. Reports on Polar and Marine Research.
Assmy, P., Cisewski, B., Henjes, J., Klaas, Ch., Sachs, 0., Smetacek, V., Strass, V. (2006). Plankton rain in the Southern Ocean: The European Iron Fertilization Experiment EIFEX, Das AWl in den Jahren 2004 und 2005 - Report, 2004/2005, 38-41.
Rogenhagen, J., Sauter, E. J., Sachs, O. (2005). Acoustic seafloor investigations with PARASOUND, In: Smetacek, V., Bathmann, U., Helmke, E. (eds), The Expeditions ANTARKTIS XXI/3-4-5 of the Research Vessel Polarstern in 2004, Reports on Polar and Marine Research, 500, 227-229.
Sauter, E. J., Sachs, 0., Wegner, J., Baumann, L., Gensheimer, M. (2005). Benthic fluxes around the Antarctic Front during the austral fall season, In: Smetacek, V., Bathmann, U., Helmke, E. (eds), The Expeditions ANTARKTIS XXI/3-4-5 of the Research Vessel Polarstern in 2004, Reports on Polar and Marine Research, 500, 218-226.
Invited talks
Sauter, E., Sachs, 0., SchlOter, M., Bathmann, U., Strass, V., Smetacek, V. (2007). Rapid export and high benthic fluxes at the Antarctic Polar Front, Assessment and reporting colloquium of the DFG Priority Program "Antarctic research with comparative investigations in Arctic ice region", Bremerhaven, 12-14 February 2007.
Sachs, 0., Sauter, E. J. (2005). Zukunftsperspektiven geowissenschaftlicher Berufe, Die Zukunft in den Geowissenschaften (Workshop der DFG-Kommission fOr Geowissenschaftliche Gemeinschaftsforschung), 22-23 Februar 2005, Internationales Wissenschaftsforum Heidelberg, Deutschland.
141
7 Appendix
Talks
Peeken, I., Hoffmann, L., Assmy, P., Bathmann, U., Croot, P., Harbou von, L., Henjes, J., Jansen, S., Kragefsky, S., Lochte, K., Sachs, 0., Sauter, E. (2006). Effect of in situ iron fertilisation during contrasting seasons - comparison between EisenEx and EIFEX, Ocean Sciences Meeting, 20-24 February 2006, Honolulu, Hawaii.
Sauter, E., Sachs, 0., SchlUter, M. (2006). Benthic Fluxes at the SO Polar Front, Interner Seminarvortrag auf POL2-Seminar, 23. February 2006.
Sauter, E., Sachs, 0., SchlUter, M. (2006). Benthic fluxes at the Southern Ocean Polar Front, Prasentation anlassl. SYSTCO-IPY-Arbeitstreffen, 27. February 2006, Hamburg.
Sauter, E., Sachs, O. (2006). Spatial and temporal sedimentation and degradation patterns of particulate organic matter in the polar deep-sea (POMPOS), Coordination workshop DFG Priority Programme "Antarctic Research with comparative investigations in arctic ice regions", Bremerhaven, 9.-10. October 2006.
Peeken, I., Hoffmann, L., Assmy, P., Bathmann, U., Cisewski, B., Leach, H., Lochte, K., Sachs, 0., Sauter, E., Strass, V. (2005). Export of fresh algal material during the Southern Ocean iron fertilisation experiment, EIFEX, ASLO Summer Meeting, 19-24 Juni 2005, Santiago de Compostela, Spain.
Sachs, 0., Sauter, E. J., SchlUter, M., Peeken, I. (2005). Benthic Fluxes and pigments in deep-sea surface sediments of the EIFEX area, EIFEX workshop, 27-30 April 2005, Bremerhaven, Germany.
Sachs, 0., Sauter, E., SchlUter, M. (2004). Benthic fluxes of the Antarctic Polar Front area during the austral fall season, EIFEX Post cruise workshop, 11-12 November 2004, Bremerhaven, Germany.
Posters
Assmy, P., Henjes, J., Klaas, C., Sachs, 0., Sauter, E. J., Smetacek, V. (2006). Mass sinking of individual species populations during an iron fertilization experiment in the Southern Ocean (EIFEX)., Gordon Research Conference "Marine Microbes: Activities & Interactions", 23-28 July 2006, Biddeford, Maine, USA.
Sachs, 0., Sauter, E. J., SchlUter, M., Peeken, I., Assmy, P., Schwarz, J., Bathmann, U. (2006). Extremely high benthic organic carbon fluxes at the Polar Front (Southern Ocean, Atlantic Sector) below areas of enhanced surface productivity, 2nd SCAR Open Science Conference "Antarctica in the Earth System", 12-14 July 2006, Hobart, Tasmania, Australia.
Sauter, E., Sachs, 0., SchlUter, M., Peeken, I., Assmy, P., Strass, V., Bathmann, U. (2006). Deep-Sea Benthic Fluxes and Fluff Layer Analyses in Sediments below a Southern Ocean Iron Vertilization Experiment, 2nd SCAR Open Science Conference "Antarctica in the Earth System", 12-14 July 2006, Hobart, Tasmania, Australia.
142
7 Appendix
Sauter, E. J., Sachs, 0., Schewe, I., Soltwedel, T. (2006). Impact of large food-falls on spatial and temporal patterns of dissolved oxygen in the upper sediment layers, 11th International Deep-Sea Biology Symposium, 9-14 July 2006, Southampton, UK.
Sachs, 0., Sauter, E. J., SchlUter, M., Wiltshire, K. H., Aberle, N., Peeken, I., Assmy, P., Stumm, K., Bathmann, U., Strass, V. H. (2005). Benthic fluxes in the region of the Polar Front in the east Atlantic sector of the Southern Ocean during austral fall 2004, ASLO Summer Meeting, 19-24 June 2005, Santiago de Compostela, Spain.
143

Publications of this series:
No.l
No.2
No.3
No.4
No.5
No.6
No.7
No.8
No.9
No. 10
No.ll
No. 12
No. 13
No. 14
No. 15
No. 16
No. 17
No. 18
'''efer, G., E. Suess and cruise participants Bericht liber die POLARSTERN-Fahrt ANT IV/2, Rio de Janeiro - Punta Arenas, 6.11. - 1.12.1985. 60 pages, Bremen, 1986. Hoffmann, G. Holozanstratigraphie und Klistenlinicnverlagcrung an del' andalusischen Mittclmccrkliste. 173 pagcs, Brcmen, 1988. (out of print) '''efer, G. and cruise participants Bcricht libcr die METEOR-Fahrt M 6/6, Libreville - Las Palmas, 18.2. - 23.3.1988. 97 pages, Bremcn, 1988. Wefer, G., G.F. Lutze, T.J. Muller, O. Pfannkuche, W. Schenke, G. Siedler, W. Zenk Kurzbericht Libcr die METEOR-Expcdition No. 6, Hamburg - Hamburg, 28.10.1987 - 19.5.1988. 29 pagcs, Brcmen, 1988. (out of print) Fischer, G. Stabile Kohlenstoff-lsotope in partikularer organischcr Substanz aus dcm SLidpolarmeer (Atlantischer Scktor). 161 pages, Bremen, 1989. Berger, W.H. and G. Wefer Partikelfluf3 und Kohlenstofflueislauf im Ozean. Bericht und Kurzfassungen Libel' den Workshop vom 3.-4. Juli 1989 in Bremen. 57 pagcs, Bremcn, 1989. Wefer, G. and cruise participants Bcricht libel' die METEOR - Fahrt M 9/4, Dakar - Santa Cruz, 19.2. - 16.3.1989. 103 pages, Bremcn, 1989. Kolling, M. Modellierung geochemischcr Prozesse im Sickerwasser und Grundwasser. 135 pages, Bremen, 1990. Heinze, P.-M. Das Auftriebsgeschehen vor Peru im Spatquartar. 204 pages, Bremen, 1990. (out of print) Willems, H., G. Wefer, M. Rinski, B. Donner, H.-J. Bellmann, L. Eifimann, A. Muller, B.W. Flemming, H.-C. Hofle, J. Merkt, H. Streif, G. Hertweck, H. Kuntze, J. Schwaar, W. Schafer, M.-G. Schulz, F. Grube, B. Menke Beitrage zur Geologie und Pa1aontologie Norddeutschlands: ExkursionsfUhrer. 202 pages, Bremen, 1990. Wefer, G. and cruise participants Bericht libel' die METEOR-Fahrt M 1211, Kapstadt - FunchaI, 13.3.1990 - 14.4.1990. 66 pages, Bremen, 1990. Dahmke, A., H.D. Schulz, A. Kolling, F. Kracht, A. Lucke Schwermetallspuren und geochcmische Gleichgewichtc zwischen PorenlOsung und Sedimcnt im WesermLindungsgcbiet. BMFT-Projekt MFU 0562, Abschluf3bcricht. 121 pages, Brcmen, 1991. Rostek, F. PhysikaIische Strukturcn von Tiefseesedimenten des Slidatlantiks und ihrc Erfassung in Echolotrcgistrierungen. 209 pages, Bremen, 1991. Baumann, M. Die Ablagerung von TschernobyI-Radiocasiu!l1 in del' Norwegischen See und in del' Nordsee. 133 pages, Bremen, 1991. (out of print) Kolling, A. Frlihdiagenctische Prozesse und Stoff-Fli.isse in marinen und astuarinen Sedimenten. 140 pages, Bremen, 1991. SFB 261 (ed.) 1. Kolloquium des Sondcrforschungsbereichs 261 del' Universitat Bremen (14.Juni 1991): Del' SUdatlantik im Spatquartar: Rekonstruktion von StoffllaushaIt und Stromsystemen. Kurzfassungen del' Vortrage und Poster. 66 pages, Bremen, 1991. Patzold, J. and cruise participants Bericht und erste Ergebnisse libel' die METEOR-Fahrt M 15/2, Rio de Janeiro - Vitoria, 18.1. - 7.2.1991. 46 pages, Bremen, 1993. Wefer, G. and cruise participants Bericht und erste Ergebnisse libel' die METEOR-Fahrt M 1611, Pointe Noire - Recife, 27.3. - 25.4.1991. 120 pages, Brcmcn, 1991.
No. 19
No. 20
No. 21
No. 22
No. 23
No. 24
No. 25
No. 26
No. 27
No. 28
No. 29
No. 30
No. 31
No. 32
No. 33
No. 34
No. 35
No. 36
No. 37
No. 38
Schuiz, H.D. and cruise participants Bericht und erste Ergebnisse liber die METEOR-Fahrt M 16/2, Recife - Belc111, 28.4. - 20.5.1991. 149 pages, Bre111en, 1991. Bernel., H. Mechanis111en der Sedimentbildung in der Fra111-Stral.le, im Arktischen Ozean und in der Norwegischen See. 167 pages, Brc111en, 1991. Schneider, R. Spiitquartiire Produktivitiitsiinderungen i111 ostlichen Angola-Becken: Reaktion aufVariationen im Passat-Monsun-Windsystem und in der Advektion des Bengucla-Klistenstroms. 198 pages, Bremen, 1991. (out of print) Hebbeln, D. Spiitquartiire Stratigraphie und Paliiozeanographie in der Fram-Stral.le. 174 pages, Bre111en, 1991. Liicke, A. Ul11setzungsprozesse organischer Substanz wiihrend der Frlihdiagenese in astuarinen Sedimenten. 137 pages, Brcmen, 1991. Wefer, G. and cruise participants Bcricht und erste Ergebnisse der METEOR-Fahrt M 20/1, Brc111en - Abidjan, 18.11.- 22.12.1991. 74 pages, Bremen, 1992. Schulz, H.D. and cruise participants Bericht und erste Ergebnisse der METEOR-Fahrt M 20/2, Abidjan - Dakar, 27.12.1991 - 3.2.1992. 173 pages, Bremen, 1992. Gingele, F. Zur klimaabhiingigcn Bildung biogener und terrigener Sedi111ente und ihrer Veriinderung durch die Frlihdiagenese im zentralen und ostlichen Slidatlantik. 202 pages, Brel11en, 1992. Bickert, T. Rekonstruktion der spiitquartiiren Bodenwasserzirkulation im ostlichen Slidatlantik lib er stabile Isotope benthischer Foraminiferen. 205 pages, Bremen, 1992. (out of print) Schmidt, H. Der Benguela-Strom il11 Bereich des Walfisch-RUckens im Spatquartar. 172 pages, Bremen, 1992. Meinecke, G. Spatquartare Oberfliichenwassertemperaturen im ostlichen iiquatorialen Atlantik. 181 pages, Bremen, 1992. Bathmann, U., U. Bleil, A. Dahmke, P. Miiller, A. Nehrkorn, E.-M. Nothig, M. Olesch, J. Plitzold, H.D. Schulz, V. Smctacek, V. Spie6, G. Wefer, H. Willems Bericht des Graduierten Kollegs. Stoff-Flilsse in marinen Geosystemen. Berichtszeitraum Oktober 1990 - Dezember 1992. 396 pages, Brel11en, 1992. Damm, E. Frlihdiagenetische Verteilung von Schwermetallen in Schlicksedimenten der westlichen Ostsee. 115 pages, Brel11cn, 1992. Antia, E.E. Sedil11entology, Morphodynamics and Facies Association of a mesotidal Barrier Island Shoreface (Spiekeroog, Southern North Sea). 370 pages, Bremen, 1993. Duinker, J. and G. Wefer (ed.) Bericht liber den 1. JGOFS-Workshop. 1.12. Dezember 1992 in Brel11en. 83 pagcs, Bremen, 1993. Kasten, S. Die Verteilung von Schwermetallen in den Sedil11enten eines stadtbrel11ischen Hafenbeckens. 103 pages, Bremen, 1993. Spie6, V. Digitale Scdimentographie. Neue Wege zu einer hochauflosenden Akustostratigraphie. 199 pages, Brel11en, 1993. Schinzel, U. Laborversuche zu frUhdiagenetischen Reaktionen von Eisen (Ill) - Oxidhydraten in marinen Sedil11enten.189 pages, Brel11en, 1993. SiegeI', R. CoT AM - ein Modell zur Modellierung des Schwermetalltransports in Grundwasserleitern. 56 pages, Brel11en, 1993. (out of print) Willems, H. (cd.) Geoscientific Investigations in the Tethyan Himalayas. 183 pages, Brel11en, 1993.
No. 39
No. 40
No.41
No. 42
No. 43
No. 44
No. 45
No. 46
No. 47
No. 48
No. 49
No. 50
No.51
No. 52
No. 53
No. 54
No. 55
No.56
No. 57
Hamer, K. Entwicklung von Laborversuchen als Grundlage fUr die Modellierung des Transportverhaltens von Arsenat, Blei, Cadmium und Kupfer in wassergesattigten Saulen. 147 pages, Bremen, 1993. Sieger, R. Modellierung des Stofftransports in pOl'osen Medien unter Ankopplung kinetisch gesteuerter Sorptions- und Redoxprozesse sowie thermischer Gleichgewichte. 158 pages, Bremen, 1993. Thie/3en, W. Magnetische Eigenschaften von Sedimenten des ostlichen SUdatlantiks und ihre paJaozeanographische Relevanz. 170 pages, Bremen, 1993. Spie/3, V. and cruise participants Report and preliminary results of METEOR-Cruise M 2311, Kapstadt - Rio de Janeiro, 4.-25.2.1993. 139 pages, Bremen, 1994. BJeiJ, U. and cruise participants Report and preliminary results of METEOR-Cruise M 23/2, Rio de Janeiro - Recife, 27.2.-19.3.1993 133 pages, Bremen, 1994. Wefer, G. and cruise participants Report and preliminary results of METEOR-Cruise M 23/3, Recife - Las Palmas, 21.3. - 12.4.1993 71 pages, Bremen, 1994. Giese, M. and G. Wefer (cd.) Bericht Uber den 2. JGOFS-Workshop. 18 . .119. November 1993 in Bremen. 93 pages, Bremen, 1994. BaizeI', \V. and cruise participants Report and preliminary results of METEOR-Cruise M 22/1, Hamburg - Recife, 22.9. - 21.1 0.1992. 24 pages, Brel11en, 1994. Stax, R. Zyklische Scdimentation von organischem Kohlenstoff in der Japan See: Anzeiger fUr Anderungen von Palaoozeanographie und Palaoklima im Spatldinozoikum. 150 pages, Bremen, 1994. Skowronek, F. FrUhdiagenetische Stoff-FlUsse gelOster Schwenl1etalle an der Oberflache von Sedimenten des Weser Astuares. 107 pages, Brel11en, 1994. Dersch-Hansmann, M. Zur Klimaentwicklung in Ostasien wahrend der letzten 5 Millionen Jahre: Terrigener Sedil11enteintrag in die Japan See (ODP Ausfahrt 128). 149 pages, Bremen, 1994. Zabel, M. FrUhdiagenetische Stoff-FlUsse in Oberflachen-Sedimenten des aquatorialen und ostlichen Siidatlantik. 129 pages, Bremen, 1994. BleiJ, U. and cruise participants Report and preliminary results of SONNE-Cruise SO 86, Buenos Aires - Capetown, 22.4. - 31.5.93 116 pages, Bremen, 1994. Symposium: The South Atlantic: Present and Past Circulation. Bremen, Germany, 15 - 19 August 1994. Abstracts. 167 pages, Bremen, 1994. Kretzmann, U.E. 57Fe-Mossbauer-Spektroskopie an Sedimenten - Moglichkeiten und Grenzen. 183 pages, Bremen, 1994. Bachmann, M. Die Karbonatrampe von Organya im oberen Oberapt und unteren Unteralb (NE-Spanien, Prav. Lerida): Fazies, Zyklo- und Sequenzstratigraphie. 147 pages, Bremen, 1994. (out of print) Kemle-von Mticke, S. Oberflachenwasserstruktur und -zirkulation des Siidostatlantiks im Spatquartar. 151 pages, Bremen, 1994. Petermann, H. Magnetotaktische Bakterien und ihre Magnetosome in Oberflachensedimenten des SUdatlantiks. 134 pages, Bremen, 1994. Mulitza, S. Spatquartare Variationen der oberflachennahen Hydrographie im westlichen aquatorialen Atlantik. 97 pages, Bremen, 1994.
No. 58
No. 59
No. 60
No. 61
No. 62
No. 63
No. 64
No. 65
No. 66
No. 67
No. 68
No. 69
No. 70
No. 71
No. 72
No. 73
No. 74
No. 75
Segl, M. and cruise participants Report and preliminary results of METEOR-Cruise M 29/1, Buenos-Aires - Montevideo, 17.6. -13.7.1994 94 pages, Bremen, 1994. Bleil, U. and cruise participants Report and preliminary results of METEOR-Cruise M 29/2, Montevideo - Rio de Janiero 15.7. - 8.8.1994.153 pages, Bremen, 1994. Henrich, R. and cruise participants Report and preliminary results of METEOR-Cruise M 29/3, Rio de Janeiro - Las Palmas 11.8. - 5.9.1994. Bremen, 1994. (out of print) Sagemann, J. Saisonale Variationen von Porenwasserprofilen, Nahrstoff-FWssen und Reaktionen in intertidalen Sedimenten des Weser-Astuars. 110 pages, Bremen, 1994. (out of print) Giese, M. and G. Wefer Bericht Liber den 3. JGOFS-Workshop. 5./6. Dezember 1994 in Bremen. 84 pages, Bremen, 1995. Mann, U. Genese kretazischer Schwarzschiefer in Kolumbien: Globale vs. regionale/lokale Prozesse. 153 pages, Bremen, 1995. (out of print) WilIems, H., Wan X., Vin J., Dongdui L., Liu G., S. Dtin, K.-U. Grafe The Mesozoic development of the N-Indian passive margin and of the Xi gaze FOl'earc Basin in southem Tibet, China. - Excursion Guide to IGCP 362 Working-Group Meeting "Integrated Stratigraphy". 113 pages, Bremen, 1995. (out of print) Htinken, U. Liefergebiets - Charakterisierung proterozoischer Goldseifen in Ghana anhand von Fluideinschlu13 - Untersuchungen. 270 pages, Bremen, 1995. Nyandwi, N. The Nature of the Sediment Distribution Patterns in ther Spiekeroog Backbarrier Area, the East Frisian Islands. 162 pages, Bremen, 1995. Isenbeck-Schroter, M. Transportverhalten von Schwermetallkationen und Oxoanionen in wassergesattigten Sanden. - Laborversuche in Saulen und ihre Modellierung -. 182 pages, Bremen, 1995. Hebbeln, D. and cruise participants Report and preliminary results of SONNE-Cruise SO 102, Valparaiso - Valparaiso, 95. 134 pages, Bremen, 1995. Willems, H. (Sprecher), U.Bathmann, U. B1eil, T. v. Dobeneck, K. Herterich, B.B. Jorgensen, E.-M. Nothig, M. Olesch, J. Patzold, H.D. Schulz, V. Smetacek, V. SpeW. G. Wefer Bericht des Graduierten-Kollegs Stoff-Fli.isse in marine Geosystemen. Berichtszeitraum Januar 1993 - Dezember 1995.45 & 468 pages, Bremen, 1995. Giese, M. and G. Wefer Bericht Liber den 4. JGOFS-Workshop. 20,/21. November 1995 in Bremen. 60 pages, Bremen, 1996. (out of print) Meggers, H. Pliozan-quartiire Karbonatsedimentation und Palaozeanographie des Nordatlantiks und des Europaischen Nordmeeres - Hinweise aus planktischen Foraminiferengemeinschaften. 143 pages, Bremen, 1996. (out of print) Teske, A. Phylogenetische und okologische Untersuchungen an Bakterien des oxidativen und reduktiven marinen Schwefelkreislaufs mittels ribosomaler RNA. 220 pages, Bremen, 1996. (out of print) Andersen, N. Biogeochemische Charakterisierung von Sinkstoffen und Sedimenten aus ostatlantischen Produktions-Systemen mit Hilfe von Biomarkern. 215 pages, Bremen, 1996. Treppke, U. Saisonalitat im Diatomeen- und Silikof1agellatenfluf3 im ostlichen tropischen und subtropischen Atlantik. 200 pages, Brel11en, 1996. Schtiring, J. Die Verwendung von Steinkohlebergel11aterialien il11 Deponiebau im Hinblick auf die Pyritverwitterung und die Eignung aIs geochemische Baniere. 110 pages, Brel11en, 1996.
No. 76
No. 77
No. 78
No. 79
No. 80
No.81
No. 82
No. 83
No. 84
No. 85
No. 86
No. 87
No. 88
No. 89
No. 90
No. 91
No. 92
No. 93
No. 94
PatzoId, J. and cruisc participants Report and preliminary results of VICTOR HENSEN cruise lOPS n, Leg 6, Fortaleza - Rccife, 10.3. - 26.3.1995 and Leg 8, Vitoria - Vitoria, 10.4. - 23.4.1995. 87 pages, Bremen, 1996. BIeH, U. and cruise participants Report and preliminary results of METEOR-Cruise M 34/1, Cape Town - Walvis Bay, 3.-26.1.1996. 129 pages, Bremen, 1996. SchuIz, lLD. and cruise participants Report and preliminary results of METEOR-Cruise M 3412, Walvis Bay - Walvis Bay, 29.1.-18.2.96 133 pages, Bremen, 1996. Wefer, G. and cruise participants Report and preliminary results of METEOR-Cruise M 34/3, Walvis Bay - Recife, 21.2.-17.3.1996. 168 pages, Bremen, 1996. Fischer, G. and cruise participants Report and preliminary results of METEOR-Cruise M 34/4, Rccife - Bridgetown, 19.3.-15.4.1996. 105 pages, Bremen, 1996. KuIbrok, F. Biostratigraphie, Fazies und Sequenzstratigraphie einer Karbonatrampe in den Schichten der Oberkreide und des Altterti~irs Nordost-Agyptens (Eastern Desert, N'Golf von Suez, Sinai). 153 pages, Bremen, 1996. Kasten, S. Early Diagenetic Metal Enrichments in Marine Sediments as Documents of Nonsteady-State Depositional Conditions. Bremcn, 1996. HoImes, M.E. Reconstruction of Surface Ocean Nitrate Utilization in the Southeast Atlantic Ocean Based on Stable Nitrogen Isotopes. 113 pages, Bremcn, 1996. RiihIemann, C. Akkumulation von Cm'bonat und organischem Kohlenstoffim tropischen Atlantik: Spatquartare Produktivitats-Variationen und ihre Steuerungsmechanismen. 139 pages, Bremen, 1996. Ratmeyer, V. Untersuchungen zum Eintrag und Transport lithogener und organischer partikularer Substanz im ostlichen subtropischen Nordatlantik. 154 pages, Bremen, 1996. Cepek, M. Zeitliche und raumliche Variationen von Coccolithophoriden-Gemeinschaften im subtropischen Ost-Atlantik: Untersuchungen an Plankton, Sinkstoffen und Sedimenten. 156 pages, Bremen, 1996. Otto, S. Die Bedeutung von gelOstem organischen Kohlenstoff (DOC) fUr den Kohlenstoffflui3 im Ozean. 150 pages, Bremen, 1996. Hensen, C. Frlihdiagenetische Prozesse und Quantifizierung benthischer Stoff-Fliisse in Oberflachensedimenten des Slidatlantiks. 132 pages, Bremen, 1996. Giese, M. and G. Wefer Bericht liber den 5. lGOFS-Workshop. 27.128. November 1996 in Bremen. 73 pages, Bremen, 1997. Wefer, G. and cruise participants Report and preliminary results of METEOR-Cruise M 37/1, Lisbon - Las Palmas, 4.-23.12.1996. 79 pages, Bremen, 1997. Isenbeck-Schroter, M., E. Bedbur, M. Kofod, B. Konig, T. Schramm & G. Matthe/3 Occurrence of Pesticide Residues in Water - Assessment of the CUlTent Situation in Selected EU Countries. 65 pages, Bremen 1997. Kiihn, M. Geochemische Folgereaktionen bei der hydrogeothermalen Energiegewinnung. 129 pages, Bremen 1997. Determann, S. & K. Herterich JGOFS-A6 "Daten und Modelle": Samm1ung JGOFS-relevanter ModelIe in Deutschland. 26 pages, Bremen, 1997. Fischer, G. and cruise participants Report and preliminary results of METEOR-Cruise M 38/1, Las Palmas - Recife, 25.1.-1.3. 1997, with Appendix: Core Descriptions from METEOR Cruise M 37/1. Bremen, 1997.
No. 95
No. 96
No. 97
No. 98
No. 99
No. 100
No. 101
No. 102
No. 103
No. 104
No. 105
No. 106
No. 107
No. 108
No. 109
No. 110
No. 111
No. 112
No. 113
No. 114
Bleil, U. and cl"Uise participants Report and preliminary results of METEOR-Cruise M 38/2, Recite - Las Palmas, 4.3.-14.4.1997. 126 pages, Bremen, 1997. Neuer, S. and cruise participants Report and preliminary results of VICTOR HENSEN-Cruise 96/1. Bremen, 1997. Villinger, H. and cruise participants Fahrtbericht SO 111,20.8. - 16.9.1996. 115 pages, Bremen, 1997. Luning, S. Late Cretaceous - Early Tertiary sequence stratigraphy, palcoeco1ogy and geodynamics of Eastern Sinai, Egypt. 218 pages, Bremen, 1997. Haese, R.R. Beschreibung und Quantifizierung frUhdiagenetischer Reaktionen des Eisens in Sedimenten des SUdatlantiks. 118 pages, Bremen, 1997. Luhrte, R. von Verwertung von Bremer Baggergut als Material zur Oberfliichenabdichtung von Deponien -Geochemisches Langzeitverhalten und Schwermetall-Mobilitat (Cd, Cu, Ni, Pb, Zn). Bremen, 1997. Ebert, M. Der Einflu13 des Redoxmilieus auf die Mobilitat von Chrom im durchstromten Aquifer. 135 pages, Bremen, 1997. Krogel, F. Einflu13 von Viskositat und Dichte des Seewassers auf Transport und Ablagerung von Wattsedimenten (Langeooger RUckseitenwatt, sUdliche Nordsee). 168 pages, Bremen, 1997. Kerntopf, B. Dinoflagellate Distribution Patterns and Preservation in the Equatorial Atlantic and Offshore North-West Africa. 137 pages, Bremen, 1997. Breitzke, M. Elastische Wellenausbreitung in marinen Sedimenten - Neue Entwicklungen der Ultraschall Sedimentphysik und Sedimentechographie. 298 pages, Bremen, 1997. Marchant, M. Rezente und spatquartare Sedimentation planktischer Foraminiferen im Peru-Chile Strom. 115 pages, Bremen, 1997. Habicht, K.S. Sulfur isotope fractionation in marine sediments and bacterial cultures. 125 pages, Bremen, 1997. Hamer, K., R.v. Luhrte, G. Becker, T. Felis, S. Keffel, B. Strotmann, C. Waschkowitz, M. Kolling, M. Isenbeck-Schroter, H.D. Schulz Endbericht zum Forschungsvorhaben 060 des Landes Bremen: Baggergut der Hafengruppe Bremen-Stadt: Modelluntersuchungen zur Schwermetallmobilitat und Moglichkeiten der Verwertung von Hafenschlick aus Bremischen Hafen. 98 pages, Bremen, 1997. Greeff, O.W. Entwicklung und Erprobung eines benthischen Landersystemes zur in situ-Bestimmung von Sulfatreduktionsraten mariner Sedimente. 121 pages, Bremen, 1997. Patzold, M. und G. Wefer Bericht Uber den 6. JGOFS-Workshop am 4./5.12.1997 in Bremen. Im Anhang: Publikationen ZUl11 deutschen Beitrag zur Joint Global Ocean Flux Study (JGOFS), Stand 111998. 122 pages, Bremen, 1998. Landenberger, H. CoTReM, ein Multi-Komponenten Transport- und Reaktions-Modell. 142 pages, Bremen, 1998. Villinger, H. und Fahrtteilnehmer Fahrtbericht SO 124,4.10. - 16.1 0.199. 90 pages, Bremen, 1997. Gietl, R. Biostratigraphie und Sedimentationsmuster einer nordostagyptischen Karbonatrampe unter BerUcksichtigung der Alveolinen-Faunen. 142 pages, Bremen, 1998. Ziebis, 'v. The Impact of the Thalassinidean Shrimp Callianassa truncata on the Geochemistry of permeable, coastal Sediments. 158 pages, Bremen 1998. Schulz, H.D. and cruise participants Report and preliminary results of METEOR-Cruise M 4111, MaJaga - Libreville, 13.2.-15.3.1998. Bremen, 1998.
No. 115
No. 116
No. 117
No. 118
No. 119
No. 120
No. 121
No. 122
No. 123
No. 124
No. 125
No. 126
No. 127
No. 128
No. 129
No. 130
No. 131
No. 132
No. 133
Volker, D.J. Untersuchungen an stromungsbeeinflul3ten Sedimentationsmustern im SUdozean. Interpretation sedimentechographischer Daten und numerische Modellierung. 152 pages, Bremen, 1998. Schliinz, B. Riverine Organic Carbon Input into the Ocean in Relation to Late Quaternary Climate Change. 136 pages, Brcmen, 1998. Kuhnert, H. Aufzeichnug des Klimas vor Westaustra1ien in stabilcn Isotopen in Korallenskeletten. 109 pages, Bremen, 1998. Kirst, G. Rekonstruktion von Oberflachenwassertemperaturen im ostlichen SUdatlantik anhand von A1kenonen. 130 pages, Bremen, 1998. Diirkoop, A. Der Brasi1-Strom im Spatquartar: Rekonstruktion der oberf1achennahen Hydrographie wahrend der 1etzten 400000 lahre. 121 pages, Bremen, 1998. Lamy, F. Spatquartare Variationen des terrigenen Sedimenteintrags ent1ang des chilenischen Kontinentalhangs als Abbild von Klimavariabilitat im Mi1ankovic- und Sub-Milankovic-Zeitbereich. 141 pages, Bremen, 1998. Neuer, S. and cruise participants Report and preliminary results ofPOSEIDON-Cruise Pos 237/2, Vi go - Las Palmas, 18.3.-31.3 .1998. 39 pages, Bremen, 1998 Romero, O.E. Marine planktonic diatoms from the tropical and equatorial Atlantic: temporal flux pattems and the sediment record. 205 pages, Bremen, 1998. Spiess, V. und Fahrtteilnehmer Report and preliminary results of RV SONNE Cruise 125, Co chin - Chittagong, 17.1 0.-17.1l.l997. 128 pages, Bremen, 1998. Arz, H.W. Dokumentation von kurzfristigen Klimaschwankungen des Spatquartars in Sedimenten des westlichen aquatoria1en At1antiks. 96 pages, Bremen, 1998. Wolff, T. Mixed layer characteristics in the equatorial Atlantic during the late QuaternalY as deduced from planktonic foraminifera. 132 pages, Bremen, 1998. Dittert, N. Late Quaternary Planktic Foraminifera Assemblages in the South Atlantic Ocean: Quantitative Determination and Preservational Aspects. 165 pages, Bremen, 1998. Holl, C. Kalkige und organisch-wandige Dinoflagellaten-Zysten in Spatquartaren Sedimenten des tropischen Atlantiks und ihre palOkologische Auswertbarkeit. 121 pages, Bremen, 1998. Hencke, J. Redoxreaktionen im Grundwasser: Etablierung und Verlagerung von Reaktionsfronten und ihre Bedeutung fUr die Spurenelement-Mobilitat. 122 pages, Bremen 1998. Piitzold, J. and cruise participants Report and preliminary results of METEOR-Cruise M 4113, Vitoria, Brasil- Salvador de Bahia, Brasil, 18.4. - 15.5.1998. Bremen, 1999. Fischer, G. and cruise participants Report and preliminary results of METEOR-Cruise M 4114, Salvador de Bahia, Brasi1-Las Pa1mas, Spain, 18.5. - 13.6.1998. Bremen, 1999. Schliinz, B. und G. Wefer Bcricht Uber den 7. lGOFS-Workshop am 3. und 4.12.1998 in Bremen. Im Anhang: Publikationen zum deutschen Beitrag zur loint Global Ocean Flux Study (JGOFS), Stand 11 1999. 100 pages, Bremen, 1999. We fer, G. and cruise participants Report and preliminary results of METEOR-Cruise M 42/4, Las Palmas - Las Palmas - Viena do Caste1o; 26.09.1998 - 26.10.1998.104 pages, Bremen, 1999. FeIis, T. Climate and ocean variability reconstructed from stable isotope records of modem subtropical corals (NOlihern Red Sea). 111 pages, Bremen, 1999.
No. 134
No. 135
No. 136
No. 137
No. 138
No. 139
No. 140
No. 141
No. 142
No. 143
No. 144
No. 145
No. 146
No. 147
No. 148
No. 149
No. 150
No. 151
No. 152
No. 153
Dt'aschba , S. North Atlantic climate variability recorded in reef corals from Bermuda. 108 pages, Bremen, 1999. Schmieder, F. Magnctic Cyclostratigraphy of South Atlantic Sediments. 82 pages, Bremen, 1999. Ridl, W. In situ measurements of respiration and mineralisation processes - Interaction between fauna and geochemical Duxes at active interfaces. 68 pages, Bremen, 1999. Devey, C.W. and cruise participants Report and shipboard results from METEOR-cruise M 41/2, Libreville - Vitoria, 18.3. - 15.4.98. 59 pages, Bremen, 1999. WenzhOfer, F. Biogeochemical processes at the sediment water interface and quantification of l11etabolically driven calcitc dissolution in deep sea sediments. 103 pages, Bremen, 1999. Klump, J. Biogenic barite as a proxy of paleoproductivity variations in the Southern Peru-Chile Current. 107 pages, Bremen, 1999. Huber, R. Carbonate sedimentation in the northern Northatlantic since the late pliocene. 103 pages, Bremen, 1999. Schulz, H. Nitrate-storing sulfur bacteria in sediments of coastal upwelling. 94 pages, Bremen, 1999. Mai,S. Die Sedimentverteilung im Wattenmeer: ein Simulationsmodell. 114 pages, Brel11en, 1999. Neuer, S. and cruise participants Report and preliminary results of Poseidon Cruise 248, Las Palmas - Las Pall11as, 15.2.-26.2.1999. 45 pages, Bremen, 1999. Weber, A. Schwefelkreislaufin marinen Sedimenten und Messung von in situ Sulfatreduktionsraten. 122 pages, Bremen, 1999. Hadeler, A. Sorptionsreaktionen im Grundwasser: Unterschiediiche Aspekte bei der Modellierung des Transportverhaltens von Zink. 122 pages, 1999. Dier6en, H. Zum Kreis1auf ausgewahlter Spurenmetalle im SUdatlantik: Vertikaltransport und Wechselwirkung zwischen Partikeln und Losung. 167 pages, Bremen, 1999. Ziihlsdorff, L. High resolution multi-frequency seismic surveys at the Eastern Juan de Fuca Ridge Flank and the Cascadia Margin - Evidence for thel111ally and tectonically driven fluid upl10w in marine sediments. 118 pages, Bremen 1999. Kinkel, H. Living and late Quaternary Coccolithophores in the equatorial Atlantic Ocean: response of distribution and productivity patterns to changing surface water circulation 183 pages, Bremen, 2000. Plitzold, J. and cruise participants Report and preliminary results of METEOR Cruise M 44/3, Aqaba (Jordan) - Safaga (Egypt) - Duba (Saudi Arabia) - Suez (Egypt) - Haifa (Israel), 12.3.-26.3.-2.4.-4.4.1999. 135 pagcs, Bremen, 2000. Schliinz, B. and G. Wefer Bericht Uber den 8. JGOFS-Workshop am2. und 3.12.1999 in Bremen. Im Anhang: Publikationen zum deutschen Beitrag zur Joint Global Ocean Flux Study (JGOFS), Stand 11 2000. 95 pages, Bremen, 2000. Schnack, K. Biostratigraphie und fazielle Entwicklung in der Oberkreide und im Alttertiar im Bereich der Kharga Schwelle, Westliche WUste, SW-Agypten. 142 pages, Bremen, 2000. Karwath, B. Ecological studies on living and fossil calcareous dinol1agellates of the equatorial and tropical Atlantic Ocean. 175 pages, Bremen, 2000. Moustafa, Y. Paleoclimatic reconstructions of the Northern Red Sea during the Holocene inferred from stable isotope records of modem and fossil corals and molluscs. 102 pages, Bremen, 2000.
No. 154
No. 155
No. 156
No. 157
No. 158
No. 159
No. 160
No. 161
No. 162
No. 163
No. 164
No. 165
No. 166
No. 167
No. 168
No. 169
No. 170
No. 171
No. In
No. 173
Villinger, H. and cruise participants Report and preliminary results of SONNE-cruise 145-1 Balboa - Talcahuana, 21.12.1999 -28.01.2000.147 pages, Bremen, 2000. Rusch, A. Dynamik der Feinfraktion im Oberf1achenhorizont permeabler Schelfsedimente. 102 pages, Bremen, 2000. Moos, C. Reconstruction of upwelling intensity and paleo-nutrient gradients in the northwest Arabian Sea derived from stable carbon and oxygen isotopes of planktic foraminifcra. 103 pages, Brcmen, 2000. Xu,W. Mass physical sediment properties and trends in a Wadden Sea tidal basin. 127 pages, Bremen, 2000. Meinecke, G. and cruise participants Report and preliminary results of METEOR Cruise M 45/1, Malaga (Spain) - Lissabon (Portugal), 19.05. - 08.06.1999. 39 pages, Bremen, 2000. Vink,A. Reconstruction of recent and late Quaternary surface water masses of the western subtropical Atlantic Ocean based on calcareous and organic-walled dinoflagellate cysts. 160 pages, Bremen, 2000. Willems, H. (Sprecher), U. Bleil, R. Henrich, K. Herterich, B.B. Jorgensen, H.-J. Kufi, M. Olesch, H.D. Schulz,V. Spiefi, G. Wefer Abschlu13bericht dcs Graduierten-Kollegs Stoff-Fllisse in marine Geosystemcn. Zusammenfassung und Berichtszeitraum Janusr 1996 - Dezember 2000. 340 pages, Bre111en, 2000. Sprengel, C. Untersuchungen zur Sedimentation und Okologie von Coccolithophoriden im Bcreich der Kanarischen 1nseln: Saisonale Flussmuster und Karbonatexport. 165 pages, Bremen, 2000. Donner, B. and G. Wefer Bericht Uber den JGOFS-Workshop am 18.-21.9.2000 in Bremen: Biogeochemical Cycles: German Contributions to the International Joint Global Ocean Flux Study. 87 pages, Bremen, 2000. Neuer, S. and cruise participants Report and preliminary results of Meteor Cruise M 45/5, Bremen - Las Palmas, October 1 -November 3,1999.93 pages, Bremen, 2000. Devey, C. and cruise participants Report and preliminary results of Sonne Cruise SO 145/2, Talcahuano (Chile) - Arica (Chile), February 4 - February 29, 2000. 63 pages, 13remen, 2000. Freudenthal, T. Reconstruction of productivity gradients in the Canary Islands region off Morocco by means of sinking particles and sediments. 147 pages, Bremen, 2000. Adler, M. Modeling of one-dimensional transport in porous media with respect to simultaneous geochemical reactions in CoTReM. 147 pages, Bremen, 2000. Santamarina Cuneo, P. FI uxes of suspended particulate matter through a tidal inlet of the East Frisian Wadden Sea (southern North Sea). 91 pages, Bremen, 2000. Benthien, A. Effects of CO} and nutrient concentration on the stable carbon isotope composition ofC37:2 alkenones in sediments of the South Atlantic Ocean. 104 pages, Bremen, 2001. Lavik, G. Nitrogen isotopes of sinking matter and sediments in the South Atlantic. 140 pages, Bremen, 2001. Budziak, D. Late Quaternary monsoonal climate and related variations in paleoproductivity and alkenone-derived sea-surface temperatures in the western Arabian Sea. 114 pages, Bremen, 2001. Gerhardt, S. Late Quaternary water mass variability derived from the pteropod preservation state in sediments of the western South Atlantic Ocean and the Caribbean Sea. 109 pages, Bremen, 2001. Bleil, U. and cruise participants Report and preliminary results of Meteor Cruise M 46/3, Montevideo (Uruguay) - Mar del Plata (Argentina), January 4 - February 7, 2000. Bremen, 200 I. Wefer, G. and cruise participants Report and preliminary results of Meteor Cruise M 46/4, Mar del Plata (Argentina) - Salvador da Bahia (Brazil), February 10 - March 13,2000. With p31iial results of METEOR cruise M 46/2. 136 pages, Bremen, 2001.
No. 174
No. 175
No. 176
No. 177
No. 178
No. 179
No. 180
No. 181
No. 182
No. 183
No. 184
No. 185
No. 186
No. 187
No. 188
No. 189
No. 190
No. 191
No. 192
No. 193
Schulz, H.D. and cruise participants Report and preliminary results of Mcteor Cruisc M 46/2, Recife (Brazil) - Montevideo (Uruguay), December 2 - December 29, 1999. 107 pages, Bremcn, 2001. Schmidt, A. Magnetic mineral Duxes in the Quaternary South Atlantic: Implications for the paleoenvironment. 97 pages, Bremen, 2001. Bruhns, P. Crystal chemical characterization of heavy metal incorporation in brick burning processes. 93 pages, Bremen, 2001. Karius, V. Baggergut del' Hafengruppe Bremen-Stadt in del' Ziegelherstellung. 131 pagcs, Bremen, 200 I. Adcgbie, A. T. Reconstruction of paleoenvironmental conditions in Equatorial Atlantic and the Gulf of Guinea Basins for the last 245,000 years. 113 pages, Bremen, 2001. Spiel3, V. and cruise participants Report and preliminary results ofRlV Sonne Cruise SO 149, Victoria - Victor; . ".8. - 16.9.2000. 100 pages, Bremen, 2001. Kim, J.-H. Reconstruction of past sea-surface temperatures in the eastern South Atlantic aJ. ,c eastern South Pacific across Termination I based on the Alkenone Method. 114 pages, Bremcn, 2001. von Lom-Keil, H. Sedimentary waves on the Namibian continental margin and in the Argentinc Basin - Bottom flow reconstructions based on high resolution echo sounder data. 126 pages, Bremen, 2001. Hebbeln, D. and cruise participants PUCK: Report and preliminary results of RlV Sonne Cruise SO 156, Valparaiso (Chile) - Talcahuano (Chile), March 29 - May 14, 2001. 195 pages, Bremen, 2001. Wendler, J. Reconstruction of astronomically-forced cyclic and abrupt paleoecological changes in the Upper Crctaceous Boreal Realm based on calcareous dinoflagellate cysts. 149 pages, Bremen, 2001. Volbers, A. Planktic foraminifera as paleoceanographic indicators: production, preservation, and reconstruction of upwelling intensity. Implications from late Quaternary South Atlantic sediments. 122 pages, Bremen, 2001. Bleil, U. and cruise participants Report and preliminary results of RlV METEOR Cruise M 49/3, Montevideo (Uruguay) - Salvador (Brasil), March 9 - April 1, 2001. 99 pages, Bremen, 2001. Scheibner, C. A "hitecture of a carbonate platform-to-basin transition on a structural high (Campanian-early Eocene, E. ,lern Desert, Egypt) - classical and modelling approaches combined. 173 pages, Bremen, 2001. Schneider, S. Quartare Schwankungen in Stromungsintensitat und Produktivitat als Abbild del' WassermassenVariabilitat im aquatorialen Atlantik (ODP Sites 959 und 663): Ergebnisse aus Siltkorn-Analysen. 134 pages, Bremen, 2001. Uliana, E. Late Quaternary biogenic opal scdimcntation in diatom assemblages in Kongo Fan sediments. 96 pages, Bremen, 2002. Esper, O. Reconstruction of Recent and Late Quaternary oceanographic conditions in the eastern South Atlantic Ocean based on calcareous- and organic-walled dinoflagellate cysts. 130 pages, Bremen, 2001. Wendler. I. Production and preservation of calcareous dinoflagellate cysts in the modern Arabian Sea. 117 pages, B"cmen, 2002. Bauer, J. Late Cenomanian - Santonian carbonate platform evolution of Sinai (Egypt): stratigraphy, facies, and sequence architecture. 178 pages, Bremen, 2002. Hildebrand-Habcl, T. Die Entwicklung kalkiger Dinoflagellaten im Slidatlantik seit der hOheren Oberkreide. 152 pages, Bremen, 2002. Hecht, H. Sauerstoff-Optopoden zur Quantifizierung von Pyritverwitterungsprozessen im Labor- und Langzeit-insitu-Einsatz. Entwicklung - Anwendung - Modellierung. 130 pages, Bremen, 2002.
No. 194
No. 195
No. 196
No. 197
No. 198
No. 199
No. 200
No. 201
No. 202
No. 203
No. 204
No. 205
No. 206
No. 207
No. 208
No. 209
No. 210
No.211
No. 212
No. 213
Fischcr, G. and cruise participants Report and Preliminary Results of RV METEOR-Cruise M49/4, Salvador da Bahia - Halifax, 4.4.-5.5.2001. 84 pages, Bremen, 2002. Grogcr, M. Deep-water circulation in the western equatorial Atlantic: inferences from carbonate preservation studies and silt grain-size analysis. 95 pages, Bremen, 2002. Meincckc,G. and cruise participants Report of RV POSEIDON Cruise POS 271, Las Palmas - Las Palmas, 19.3.-29.3.2001. 19 pages, Bremen, 2002. Mcggers, H. and cruise participants Report of RV POSEIDON Cruise POS 272, Las Palmas - Las Palmas, 1.4.-14.4.200 I. 19 pages, Bremen, 2002. Grafe, K-U. Stratigraphische Korrelation und Steuerungsfaktoren Sedimentarer Zyklen in ausgewahlten Borealen und Tethyalen Becken des Cenoman/Turon (Oberkreide) Europas und Nordwestafrikas. 197 pages, Bremen, 2002. Jahn, B. Mid to Late Pleistocene Variations of Marine Productivity in and Terrigenous Input to the Southeast Atlantic. 97 pages, Bremen, 2002. AI-Rousan, S. Ocean and climate history recorded in stable isotopes of coral and foraminifers from the northern Gulf of Aqaba. 116 pages, Bremen, 2002. Azouzi, B. Regionalisierung hydraulischer und hydrogeochemischer Daten mit geostatistischen Methoden. 108 pages, Bremen. 2002. Spicfi, V. and cruise participants Report and preliminary results of METEOR Cruise M 47/3, Libreville (Gab un) - Walvis Bay (Namibia), 01.06 - 03.07.2000.70 pages, Bremen 2002. Spiefi, V. and cruise participants Report and preliminary results of METEOR Cruise M 49/2, Montevideo (Uruguay) - Montevideo, 13.02 - 07.03.2001. 84 pages, Bremen 2002. Mollenhauer, G. Organic carbon accumulation in the South Atlantic Ocean: Sedimentary processes and glaciallinterglacial Budgets. 139 pages, Bremen 2002. Spiefi, V. and cruise participants Report and preliminary results of METEOR Cruise M49/1, Cape Town (South Africa) - Montevideo (Uruguay), 04.0l.2001 - 10.02.2001. 57 pages, Bremen, 2003. Meier, KJ.S. Calcareous dinoflagellates from the Mediterranean Sea: taxonomy, ecology and palaeoenvironmental application. 126 pages, Bremen, 2003. Rakic, S. Untersuchungen zur Polymorphie und Kristallchemie von Silikaten der Zusammensetzung Me2Si20s (Me:Na, K). 139 pages, Bremen, 2003.
Pfeifer, K Auswirkungen frlihdiagenetischer Prozesse auf Calcit- und Barytgehalte in marinen Oberflachensedil11enten. 110 pages, Bremen, 2003. Heuer, V. Spurenelemente in Sedil11enten des Sildatlantik. Primarer Eintrag und frlihdiagenetische Uberpragung. 136 pages, Bremen, 2003. Streng, M. Phylogenetic Aspects and Taxonomy of Calcareous Dinoflagellates. 157 pages, Bremen 2003. Boeckel, B. Present and past coccolith assemblages in the South Atlantic: implications for species ecology, carbonate contribution and palaeoceanographic applicability. 157 pages, Bremen, 2003. Precht, E. Advective interfacial exchange in permeable sedil11ents driven by surface gravity waves and its ecological consequences. 131 pages, Brel11en, 2003. Frenz, M. Grain-size composition of Quatemary South Atlantic sediments and its paleoceanographic significance. 123 pages, Brel11en, 2003.
No.214
No.215
No. 216
No.217
No.218
No. 219
No. 220
No. 221
No. 222
No. 223
No. 224
No. 225
No. 226
No. 227
No. 228
No. 229
No. 230
No. 231
No. 232
No. 233
Meggers, H. and cruise participants Report and preliminary results of METEOR Cruise M 53/1, Limassol - Las Palmas - Mindelo, 30.03.2002 - 03.05.2002.81 pages, Bremen, 2003. Schulz, H.D. and cruise participants Report and preliminary results of METEOR Cruise M 5811, Dakar - Las Palmas, 15.04 .. 2003 -12.05.2003. Bremen, 2003. Schneider, R. and cruise participants Report and preliminary results of METEOR Cruise M 5711, Cape Town - Walvis Bay, 20.01.-08.02.2003. 123 pages, Bremen, 2003. Kallmeyer, J. Sulfate reduction in the deep Biosphere. 157 pages, Bremen, 2003. Roy, H. Dynamic Structure and Function of the Diffusive Boundary Layer at the Seanoor. 149 pages, Brcmen, 2003. Plitzold, .J., C. Hiibscher and cruise participants Report and preliminary results of METEOR Cruise M 52/2&3, Istanbul- Limassol - Limassol, 04.02. - 27.03.2002. Bremen, 2003. Zabel, M. and cruise participants Report and preliminary results of METEOR Cruise M 57/2, Walvis Bay - Walvis Bay, 11.02.-12.03.2003. 136 pages, Bremen 2003. Salem, M. Geophysical investigations of submarine prolongations of alluvial fans on the western side of the Gulf of Aqaba-Red Sea. 100 pages, Bremen, 2003. THch, E. Oszillation von Wattflachen und deren fossiles Erhaltungspotential (Spiekerooger Rtickseitenwatt, stidliche Nordsee). 137 pages, Bremen, 2003. Frisch, U. and F. Kockel Der Bremen-Knoten im Strukturnetz Nordwest-Deutschlands. Stratigraphie, Palaogeographie, Strukturgeologie. 379 pages, Bremen, 2004. Kolonic, S. Mechanisms and biogeochemical implications of CenomanianiTuronian black shale formation in North Africa: An integrated geochemical, millennial-scale study from [he Tarfaya-LaAyoune Basin in SW Morocco. 174 pages, Bremen, 2004. Report online available only. Panteleit, B. Geochemische Prozesse in der Salz- StiJ3wasser Dbergangszone. 106 pages, Bremen, 2004. Seiter, K. Regionalisierung und Quantifizierung benthischer Mineralisationsprozesse. 135 pages, Bremen, 2004. BleH, U. and cruise participants Report and preliminary results of METEOR Cruise M 58/2, Las Palmas - Las Palmas (Canary Islands, Spain), 15.05. - 08.06.2003. 123 pages, Bremen, 2004. Kopf, A. and cruise participants Report and preliminary results of SONNE Cruise S0l75, Mim'll - Bremerhaven, 12.11 - 30.12.2003. 218 pages, Bremen, 2004. Fabian, M. Near Surface Tilt and Pore Pressure Changes Induced by Pumping in Multi-Layered Poroelastic HalfSpaces. 121 pages, Bremen, 2004. Segl, M. , and cruise participants Report and preliminary results ofPOSEIDON cruise 304 Galway - Lisbon,S. - 22. Oct. 2004. 27 pages, Bremen 2004 Meinecke, G. and cruise participants Report and preliminary results of POSEIDON Cruise 296, Las Palmas - Las Palmas, 04.04-14.04.2003.42 pages, Bremen 2005. Meinecke, G. and cruise participants Report and preliminary results of POSEIDON Cruise 310, Las Palmas - Las Palmas, 12.04-26.04.2004.49 pages, Bremen 2005. Meinecke, G. and cruise participants Report and preliminary results of METEOR Cruise 58/3, Las Palmas - Ponta Delgada, 11.06 - 24.06.2003. 50 pages, Bremen 2005.
No. 234
No. 235
No. 236
No. 237
No. 238
No. 239
No. 240
No. 241
No. 242
No. 243
No. 244
No. 245
No. 246
No. 247
No. 248
No. 249
No. 250
No. 251
No. 252
Feseker, T. Numerical Studies on Groundwater Flow in Coastal Aquifers. 219 pages. Bremen 2004. Sahling, H. and cruise participants Report and preliminary results of R/V POSEIDON Cruise P317/4, Istanbul-Istanbul, 16 October - 4 November 2004. 92 pages, Bremen 2004. Meineckc, G. und FahrtteiInehmer Report and preliminary results of POSEIDON Cruise 305, Las Palmas (Spain) - Lisbon (Portugal), October 28th - November 6th, 2004. 43 pages, Bremen 2005. Ruhland, G. and cruise participants Report and preliminary results of POSEIDON Cruise 319, Las Palmas (Spain) - Las Palmas (Spain), December 6th - December 17th, 2004. 50 pages, Bremen 2005. Chang, T.S. Dynamics of fine-grained sediments and stratigraphic evolution of a back-barrier tidal basin of the German Wadden Sea (southern North Sea). 102 pages, Bremen 2005. Lager, T. Predicting the source strength of recycling materials within the scope of a seepage water prognosis by means of standardized laboratory methods. 141 pages, Bremen 2005. Mcinecke, G. DOLAN - Operationelle Datenubertragung im Ozean und Laterales Akustisches Netzwerk in der Tiefsee. AbschluBbericht. 42 pages, Bremen 2005. Guasti, E. Early Paleogene environmental turnover in the southern Tethys as recorded by foraminiferal and organic-walled dinoflagellate cysts assemblages. 203 pages, Bremen 2005. Riedinger, N. Preservation and diagenetic overprint of geochemical and geophysical signals in ocean margin sediments related to depositional dynamics. 91 pages, Bremen 2005. Ruhland, G. and cruise participants Report and preliminary results of POSEIDON cruise 320, Las Palmas (Spain) - Las Palmas (Spain), March 08th - March 18th, 2005.57 pages, Bremen 2005. Inthorn, M. Lateral particle transport in nepheloid layers - a key factor for organic matter distribution and quality in the Benguela high-productivity area. 127 pages, Bremen, 2006. Aspetsberger, F. Benthic carbon turnover in continental slope and deep sea sediments: importance of organic matter quality at different time scales. 136 pages, Bremen, 2006. Hebbeln, D. and cruise participants Report and preliminary results of RV SONNE Cruise SO-184, PABESIA, Durban (South Africa)Cilacap (Indonesia) - Darwin (Australia), July 08th - September 13th, 2005. 142 pages, Bremen2006. Ratmeyer, V. and cruise participants Report and preliminary results of RV METEOR Cruise M61/3. Development of Carbonate Mounds on the Celtic Continental Margin, Northeast Atlantic. Cork (Ireland) - Ponta Delgada (Portugal), 04.06. - 21.06.2004. 64 pages, Bremen 2006. Wien, K. Element Stratigraphy and Age Models for Pelagites and Gravity Mass Flow Deposits based on Shipboard XRF Analysis. 100 pages, Bremen 2006. Krastel, S. and cruise participants Report and preliminary results of RV METEOR Cruise M65/2, Dakar - Las Palmas, 04.07. -26.07.2005. 185 pages, Bremen 2006. HeiI, G.M.N. Abrupt Climate Shifts in the Western Tropical to Subtropical Atlantic Region during the Last Glacial. 121 pages, Bremen 2006. Ruhland, G. and cruise participants Report and preliminary results of POSEIDON Cruise 330, Las Palmas - Las Palmas, November 21 th - December 03rd, 2005. 48 pages, Bremen 2006. Mulitza , S. and cruise participants Report and preliminary results of METEOR Cruise M6511, Dakar - Dakar, 11.06.- 1.07.2005. 149 pages, Bremen 2006.
No. 253
No. 254
No. 255
No. 256
No. 257
No. 258
No. 259
No. 260
No. 261
No.2()'::
No. 263
No. 264
No. 265
No. 266
No. 267
Kopf, A. and cruise participants Report and preliminary results of POSEIDON Cruise P336, Heraklion - Heraklion, 28.04. -17.05.2006. 127 pages, Bremen, 2006. Wefer, G. and cruise participants Report and preliminary results of RN METEOR Cruise M6S13, Las Pa1mas - Las Pa1mas (Spain), July 31st - August lOth, 2005. 24 pages, Bremen 2006. Hanebuth, T.J.J. and cruise participants Report and first results of the POSEIDON Cruise P342 GALIOMAR, Vigo - Lisboa (Portugal), August 19thSeptember 06th, 2006. Distribution Pattern, Residence Times and Export of Sediments on the Pleistocene/Holocene Galician Shelf (NW Iberian Peninsula). 203 pages, Bremen, 2007. Ahke,A. Composition of molecular organic matter pools, pigments and proteins, in Benguela upwelling and Arctic Sediments. 192 pages, Bremen 2007. Becker, V. Seep er - Ein Mouell fUr die Praxis der Sickerwasserprognose. 170 pages, Bremen 2007. Ruhland, G. and cruise participants Report and preliminary results of Pose id on cruise 333, Las Palmas (Spain) - Las Palmas (Spain), March 1 sI - March 101h, 2006.32 pages, Bremen 2007. Fischer, G., G. Ruhland and cruise participants Report and preliminary results of Poseidon cruise 344, leg 1 and leg 2, Las Palmas (Spain) - Las Palmas (Spain), Oct. 20lh -Nov 2nd & Nov. 41h - Nov 13lh, 2006. 46 pages, Bremen 2007. Westphal, H. and cruise participants Report and preliminary results of Pose id on cruise 346, MACUMA. Las Palmas (Spain) - Las Palmas (Spain), 28.12.2006 - 15.1.2007.49 pages, Bremen 2007. Bohrmann, G., T. Pape, and cruise participants Report and preliminary results ofRIV METEOR Cruise M72/3, Istanbul- Trabzon- Istanbul, March 17thApril 23rd, 2007. Marine gas hydrates of the Eastern Black Sea. 130 pages, Bremen 2007. Bohrmann, G., and cruise participants Report and preliminary results of RlV METEOR Cruise M70/3, Iraklion - Iraklion, 21 November -8 December 2006. Cold Seeps of the Anaximander Mountains I Eastern Mediterranean. 75 pages, Bremen 2008. Bohrmann, G., Spiess, V., and cruise participants Report and preliminary results of RlV Meteor Cruise M67/2a and 2b, Balboa -- Tampico -- Bridgetown, 15 March -- 24 April, 20u6. Fluid seepage in the Gulf of Mexico. Bremen 2008. Kopf, A., and cruise participants Report and preliminary results of Meteor Cruise M7311: LIMA-LAMO (Ligurian Margin Landslide Measurements & Observatory). Cadiz, 22.07.2007 - Genoa, 11.08.2007. 170 pages, Bremen 2008. Hebbeln, D., and cruise participants Report and preliminary results of RV Pelagia Cruise 64PE284. Cold-water Corals in the Gulf ofCadiz and on Coral Patch Seamount (NE Atlantic). Portimao - Portimao, 18.02. - 09.03.2008. 90 pages, Bremen 2008. Bohrmann, G. and cruise participants Report and preliminary results ofRlV Meteor Cruise M74/3, Fujairah - Male, 30 October - 28 November, 2007. Cold Seeps of the Makran subduction zone (Continental margin of Pakistan). 161 pages, Bremen 2008. Sachs, O. Benthic organic carbon fluxes in the Southern Ocean: Regional differences and links to surface primary production and carbon export. 143 pages, Bremen, 2008.