Embed Size (px)
Citation preview
Gruppe Forensische Chemie SGRM
Auswertung: M.T. Pinorini-Godly, Fondazione Alpina per le Scienze della Vita, Istituto alpino di chimica e di tossicologia,
CH-6718 Olivone; e-mail: [email protected]
Arbeitsgruppe
Forensische Chemie SGRM
Arbeitsgruppe
Forensische Chemie SGRM
Betäubungsmittelstatistik 2018
Amphetamin, Methamphetamin und
MDMA Gehaltswerte
Gruppe Forensische Chemie SGRM
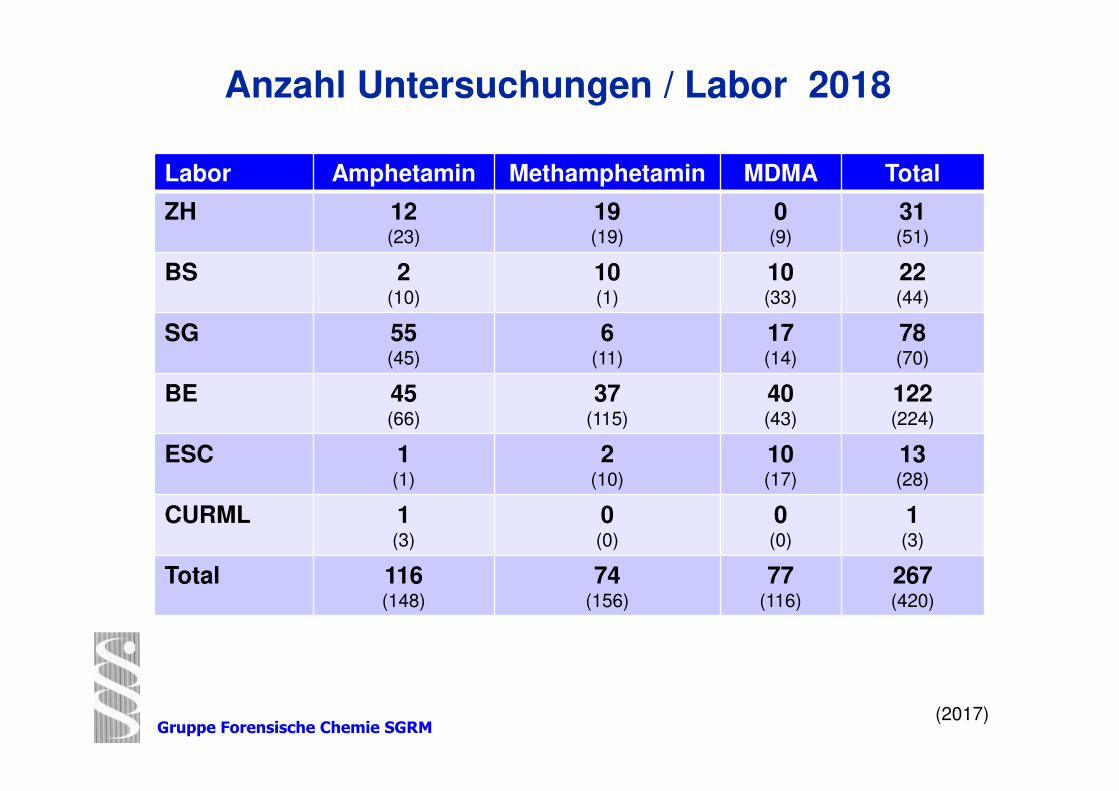
Anzahl Untersuchungen / Labor 2018
Labor Amphetamin Methamphetamin MDMA Total
ZH 12 (23)
19(19)
0(9)
31(51)
BS 2 (10)
10(1)
10(33)
22(44)
SG 55(45)
6(11)
17(14)
78(70)
BE 45 (66)
37(115)
40(43)
122(224)
ESC 1(1)
2(10)
10(17)
13(28)
CURML 1 (3)
0(0)
0(0)
1(3)
Total 116(148)
74(156)
77(116)
267(420)
(2017)
Gruppe Forensische Chemie SGRM
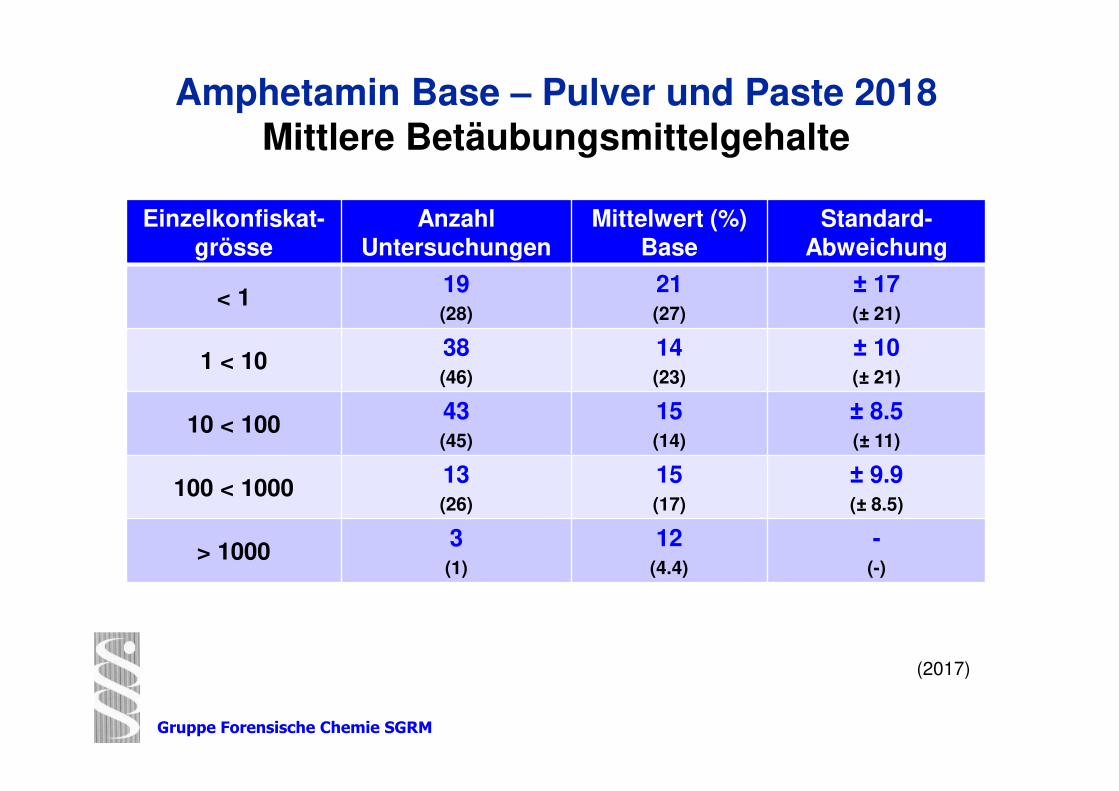
Amphetamin Base – Pulver und Paste 2018
Mittlere Betäubungsmittelgehalte
Einzelkonfiskat-grösse
Anzahl Untersuchungen
Mittelwert (%) Base
Standard-Abweichung
< 119(28)
21(27)
± 17 (± 21)
1 < 1038(46)
14(23)
± 10 (± 21)
10 < 10043(45)
15(14)
± 8.5 (± 11)
100 < 100013(26)
15(17)
± 9.9 (± 8.5)
> 10003(1)
12(4.4)
-(-)
(2017)
Gruppe Forensische Chemie SGRM
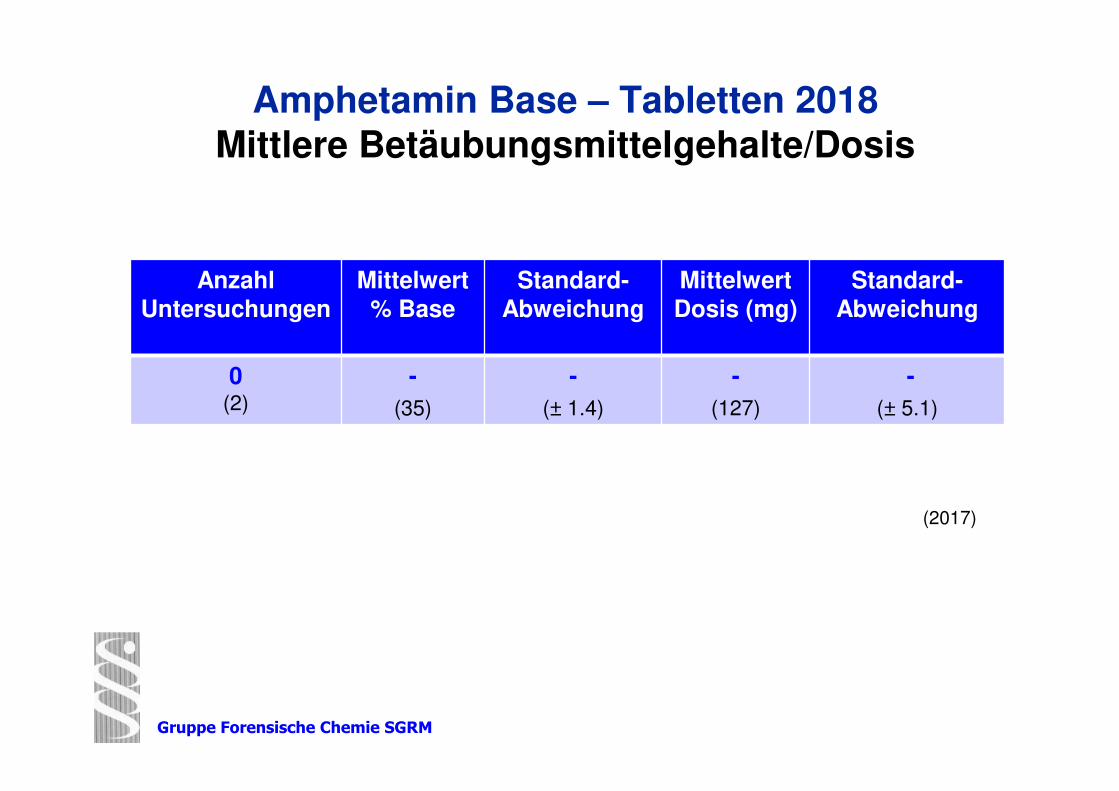
Amphetamin Base – Tabletten 2018
Mittlere Betäubungsmittelgehalte/Dosis
AnzahlUntersuchungen
Mittelwert% Base
Standard-Abweichung
MittelwertDosis (mg)
Standard-Abweichung
0(2)
-
(35)
-
(± 1.4)
-
(127)
-
(± 5.1)
(2017)
Gruppe Forensische Chemie SGRM
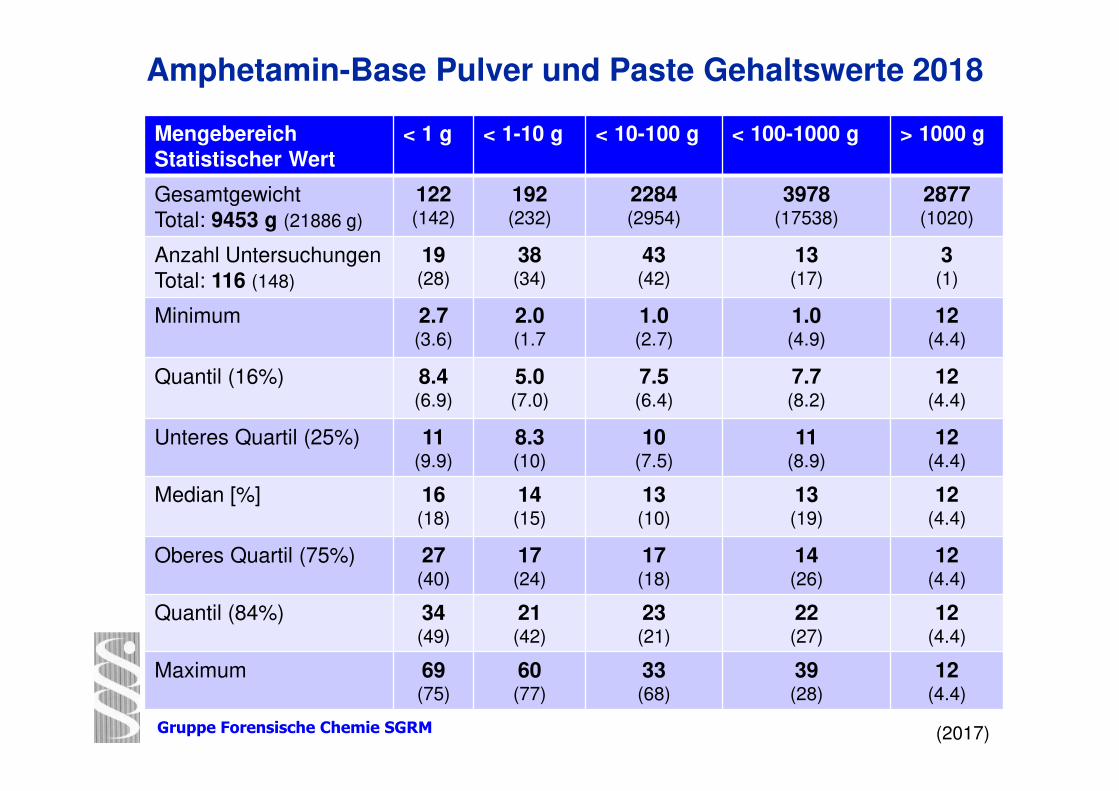
Amphetamin-Base Pulver und Paste Gehaltswerte 2018
Mengebereich
Statistischer Wert
< 1 g < 1-10 g < 10-100 g < 100-1000 g > 1000 g
Gesamtgewicht
Total: 9453 g (21886 g)
122(142)
192(232)
2284(2954)
3978(17538)
2877(1020)
Anzahl Untersuchungen
Total: 116 (148)
19(28)
38(34)
43(42)
13(17)
3(1)
Minimum 2.7(3.6)
2.0(1.7
1.0(2.7)
1.0(4.9)
12(4.4)
Quantil (16%) 8.4(6.9)
5.0(7.0)
7.5(6.4)
7.7(8.2)
12(4.4)
Unteres Quartil (25%) 11(9.9)
8.3(10)
10(7.5)
11(8.9)
12(4.4)
Median [%] 16(18)
14(15)
13(10)
13(19)
12(4.4)
Oberes Quartil (75%) 27(40)
17(24)
17(18)
14(26)
12(4.4)
Quantil (84%) 34(49)
21(42)
23(21)
22(27)
12(4.4)
Maximum 69(75)
60(77)
33(68)
39(28)
12(4.4)
(2017)
Gruppe Forensische Chemie SGRM
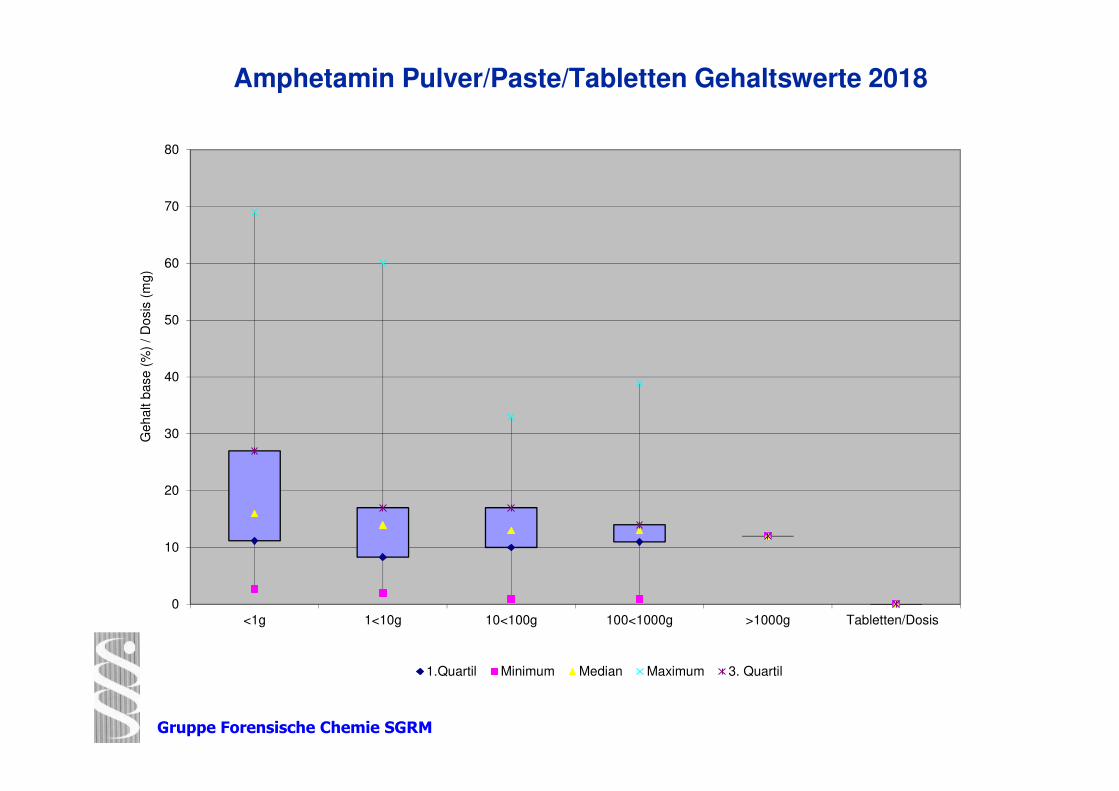
Amphetamin Pulver/Paste/Tabletten Gehaltswerte 2018
0
10
20
30
40
50
60
70
80
<1g 1<10g 10<100g 100<1000g >1000g Tabletten/Dosis
Gehalt b
ase (
%)
/ D
osis
(m
g)
1.Quartil Minimum Median Maximum 3. Quartil
Gruppe Forensische Chemie SGRM
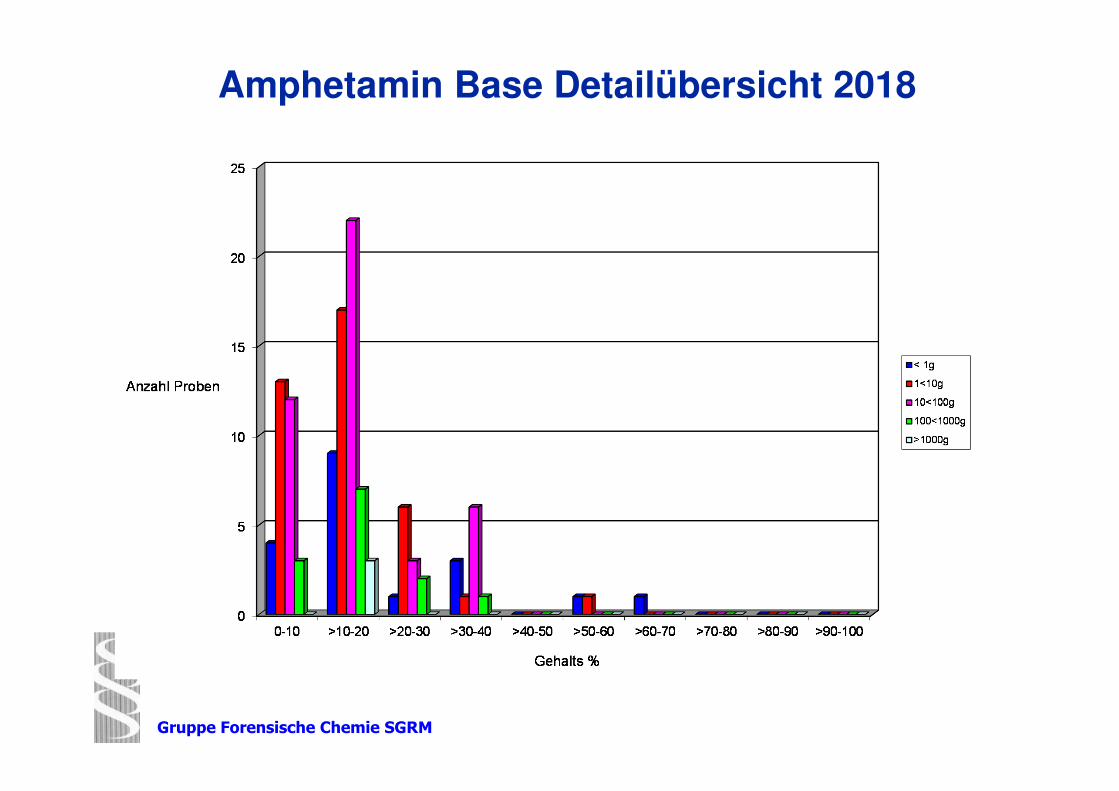
Amphetamin Base Detailübersicht 2018
Gruppe Forensische Chemie SGRM
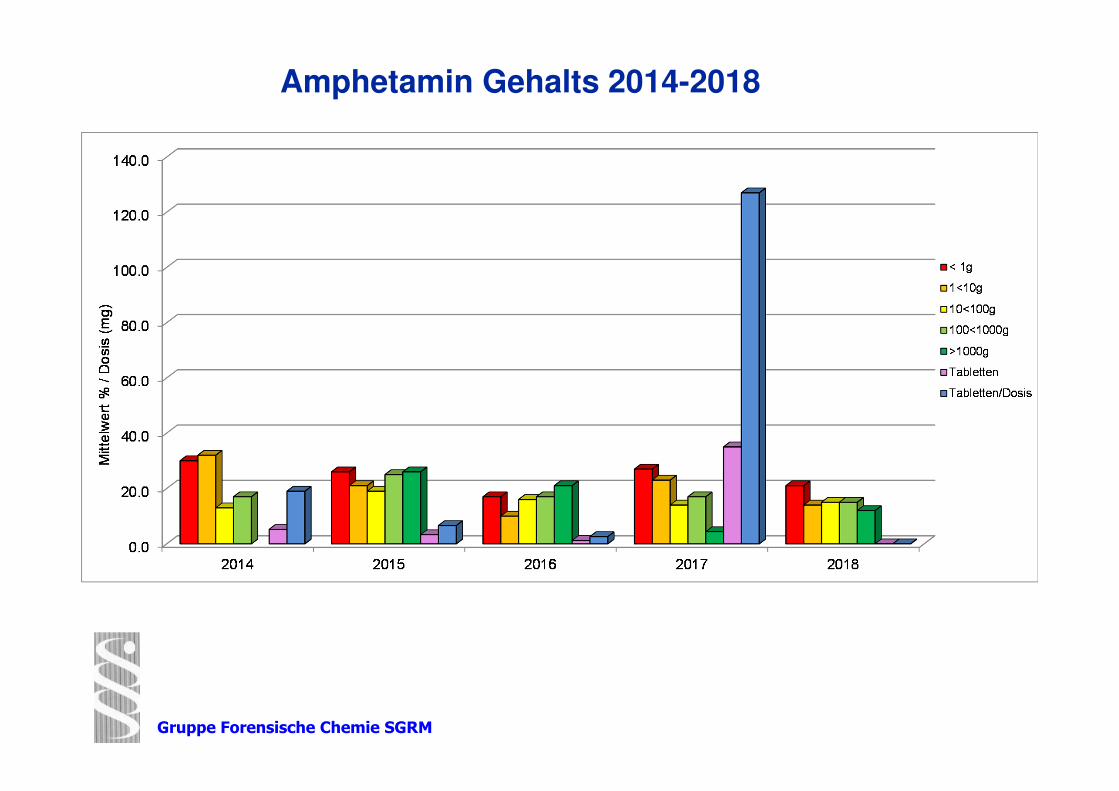
Amphetamin Gehalts 2014-2018
Gruppe Forensische Chemie SGRM
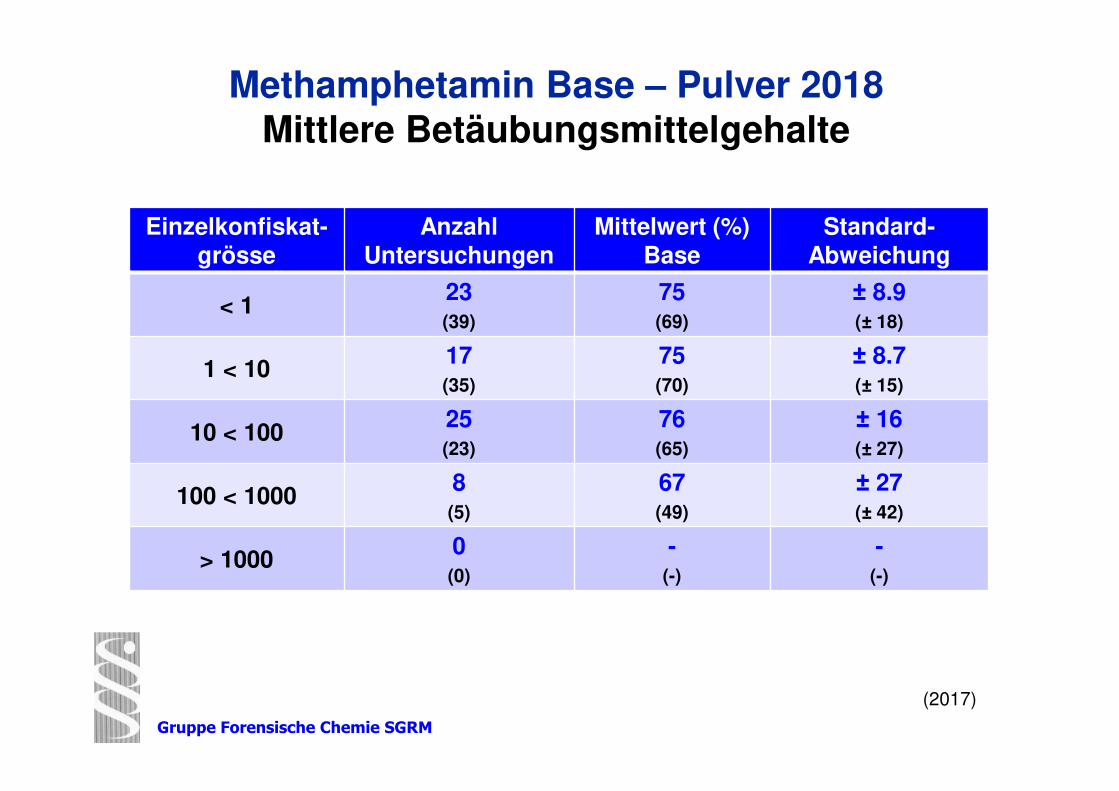
Methamphetamin Base – Pulver 2018
Mittlere Betäubungsmittelgehalte
Einzelkonfiskat-grösse
Anzahl Untersuchungen
Mittelwert (%) Base
Standard-Abweichung
< 123(39)
75(69)
± 8.9(± 18)
1 < 1017(35)
75(70)
± 8.7(± 15)
10 < 10025(23)
76(65)
± 16(± 27)
100 < 10008(5)
67(49)
± 27(± 42)
> 10000(0)
-(-)
-(-)
(2017)
Gruppe Forensische Chemie SGRM
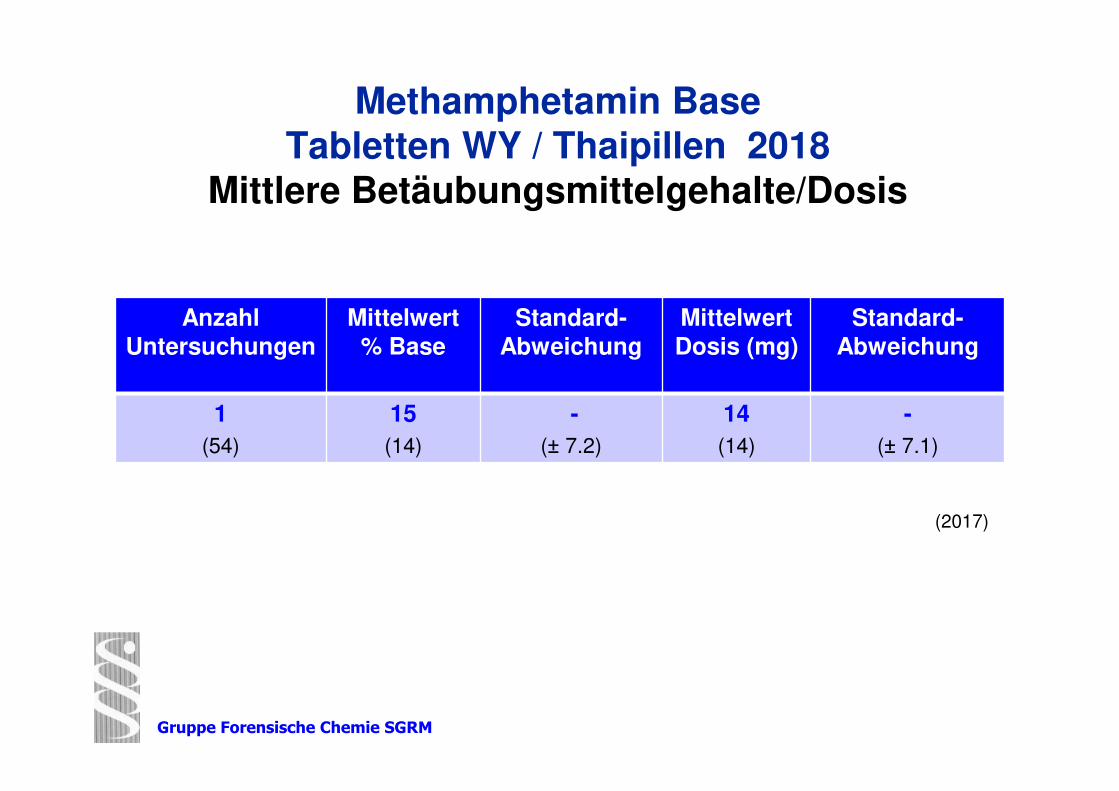
Methamphetamin Base
Tabletten WY / Thaipillen 2018
Mittlere Betäubungsmittelgehalte/Dosis
AnzahlUntersuchungen
Mittelwert% Base
Standard-Abweichung
MittelwertDosis (mg)
Standard-Abweichung
1
(54)
15
(14)
-
(± 7.2)
14
(14)
-
(± 7.1)
(2017)
Gruppe Forensische Chemie SGRM
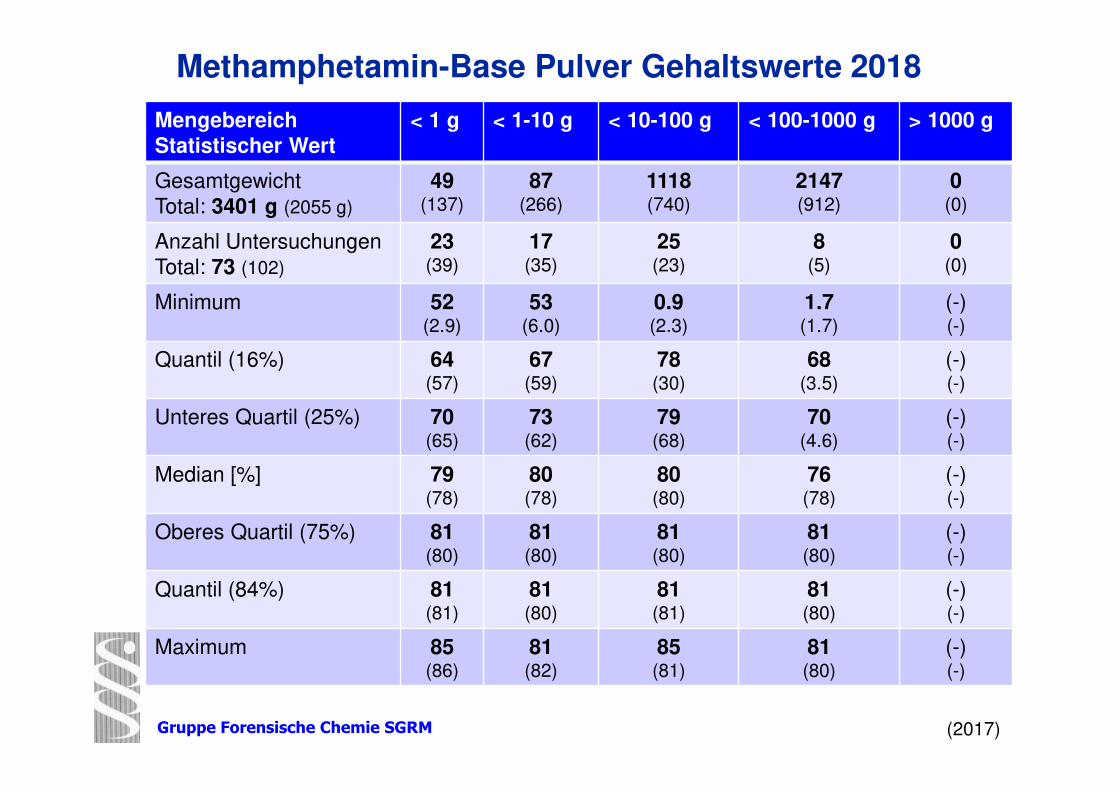
Methamphetamin-Base Pulver Gehaltswerte 2018
Mengebereich
Statistischer Wert
< 1 g < 1-10 g < 10-100 g < 100-1000 g > 1000 g
Gesamtgewicht
Total: 3401 g (2055 g)
49(137)
87(266)
1118(740)
2147(912)
0(0)
Anzahl Untersuchungen
Total: 73 (102)
23(39)
17(35)
25(23)
8(5)
0(0)
Minimum 52(2.9)
53(6.0)
0.9(2.3)
1.7(1.7)
(-)(-)
Quantil (16%) 64(57)
67(59)
78(30)
68(3.5)
(-)(-)
Unteres Quartil (25%) 70(65)
73(62)
79(68)
70(4.6)
(-)(-)
Median [%] 79(78)
80(78)
80(80)
76(78)
(-)(-)
Oberes Quartil (75%) 81(80)
81(80)
81(80)
81(80)
(-)(-)
Quantil (84%) 81(81)
81(80)
81(81)
81(80)
(-)(-)
Maximum 85(86)
81(82)
85(81)
81(80)
(-)(-)
(2017)
Gruppe Forensische Chemie SGRM
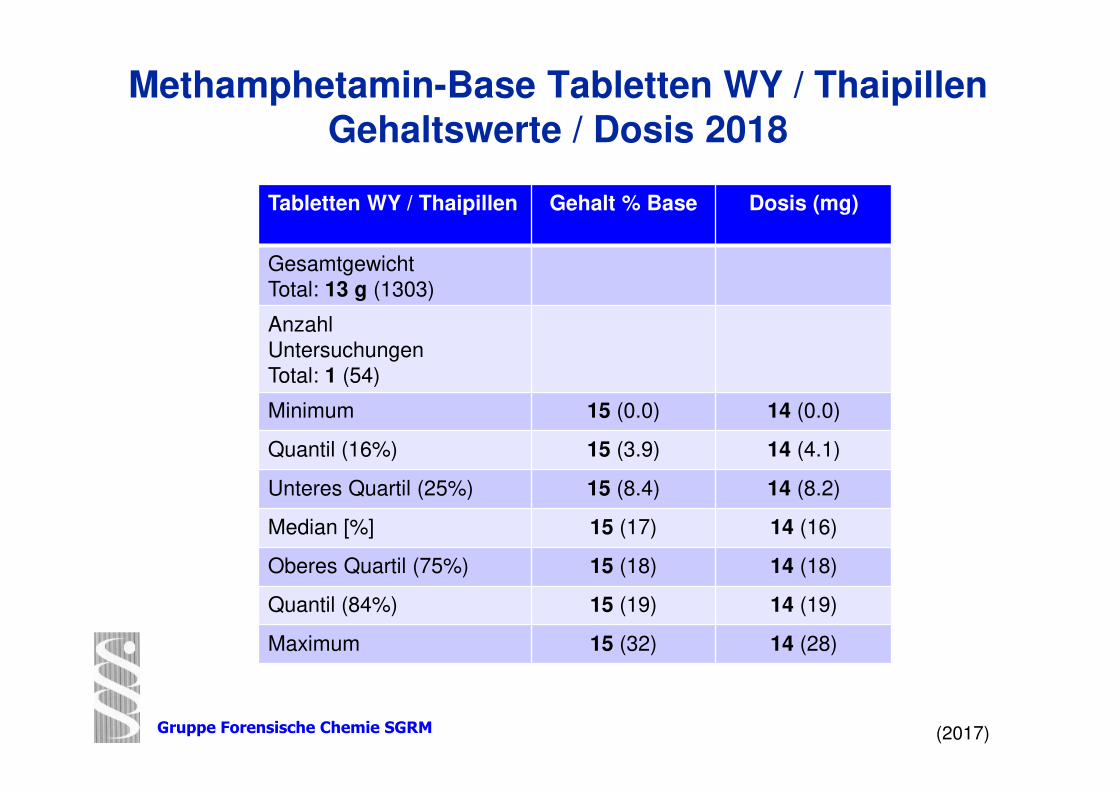
Methamphetamin-Base Tabletten WY / Thaipillen
Gehaltswerte / Dosis 2018
Tabletten WY / Thaipillen Gehalt % Base Dosis (mg)
Gesamtgewicht
Total: 13 g (1303)
Anzahl
Untersuchungen
Total: 1 (54)
Minimum 15 (0.0) 14 (0.0)
Quantil (16%) 15 (3.9) 14 (4.1)
Unteres Quartil (25%) 15 (8.4) 14 (8.2)
Median [%] 15 (17) 14 (16)
Oberes Quartil (75%) 15 (18) 14 (18)
Quantil (84%) 15 (19) 14 (19)
Maximum 15 (32) 14 (28)
(2017)
Gruppe Forensische Chemie SGRM
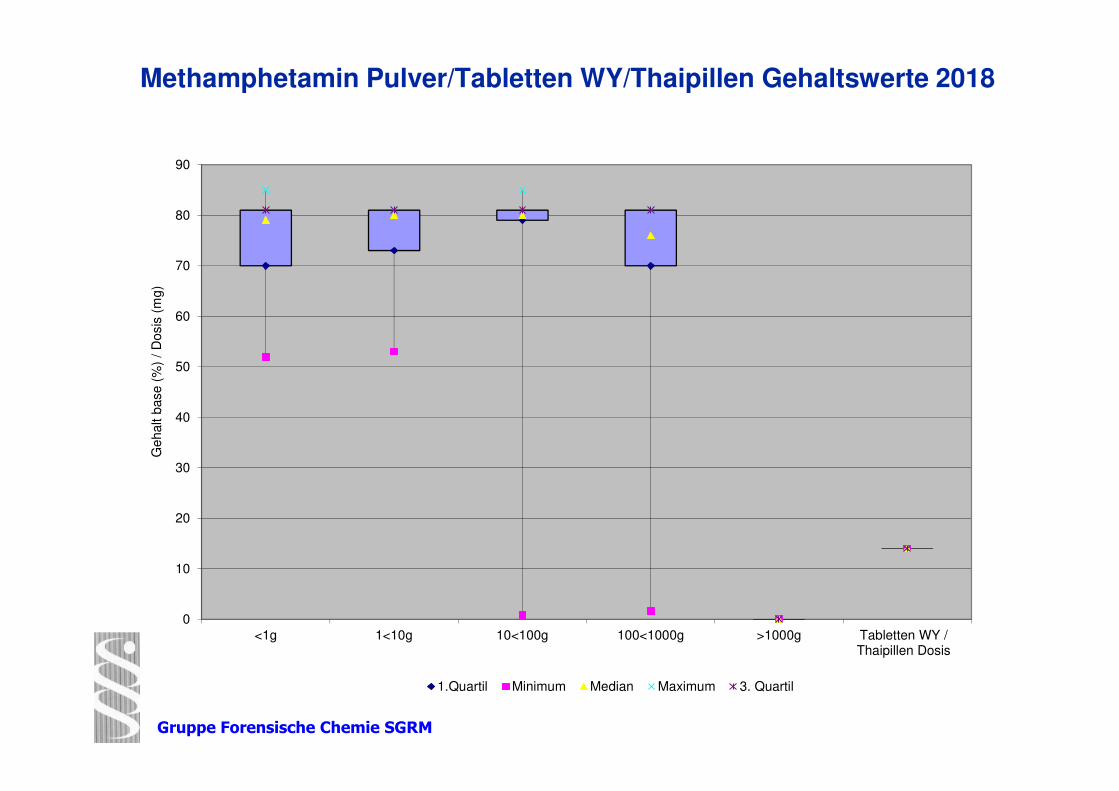
Methamphetamin Pulver/Tabletten WY/Thaipillen Gehaltswerte 2018
0
10
20
30
40
50
60
70
80
90
<1g 1<10g 10<100g 100<1000g >1000g Tabletten WY /Thaipillen Dosis
Gehalt b
ase (
%)
/ D
osis
(m
g)
1.Quartil Minimum Median Maximum 3. Quartil
Gruppe Forensische Chemie SGRM
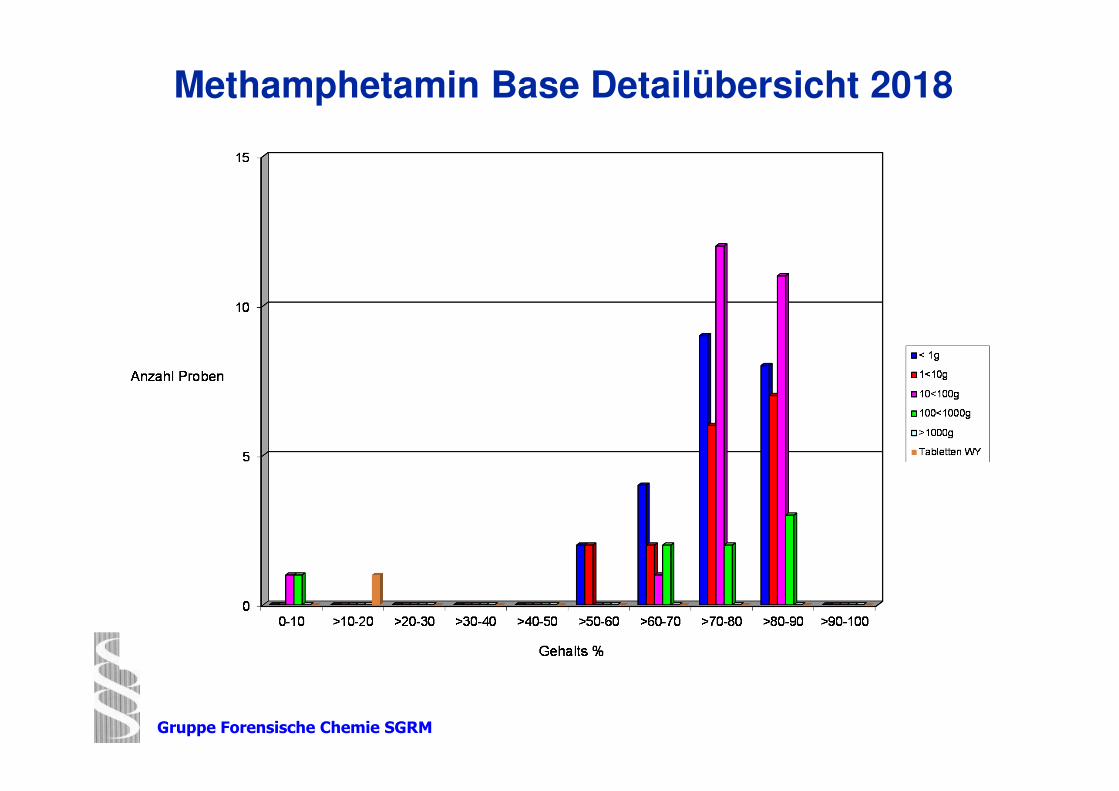
Methamphetamin Base Detailübersicht 2018
Gruppe Forensische Chemie SGRM
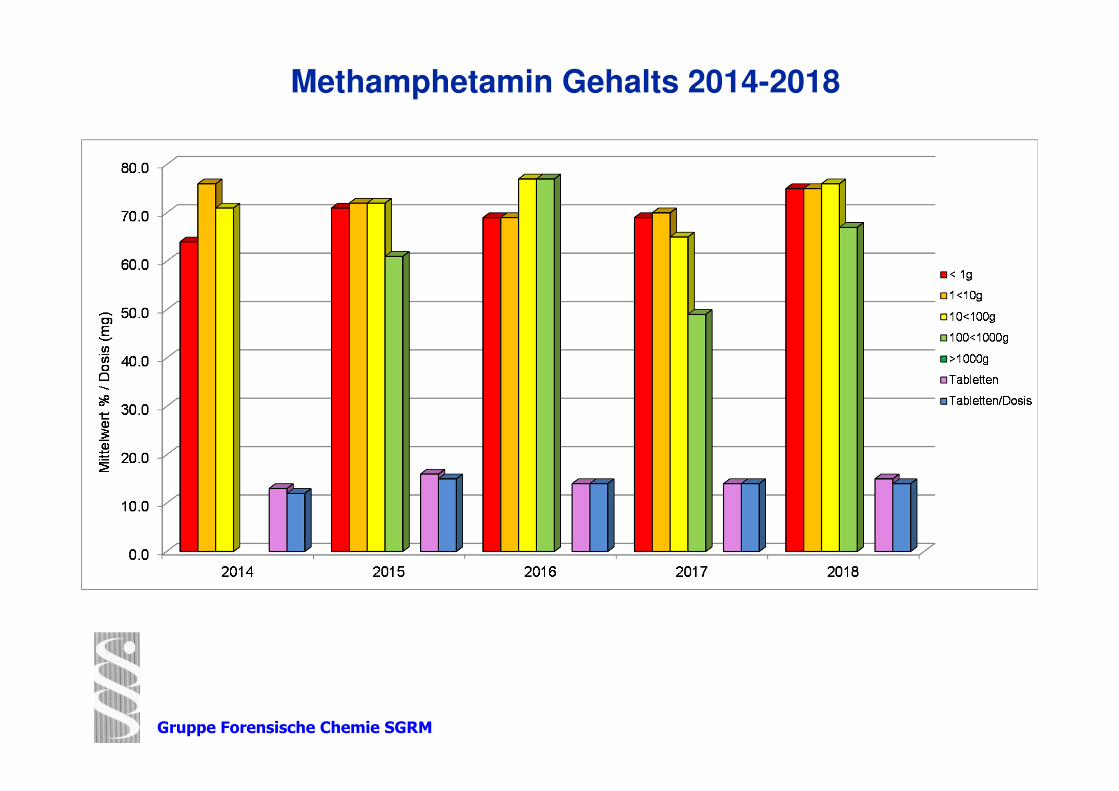
Methamphetamin Gehalts 2014-2018
Gruppe Forensische Chemie SGRM
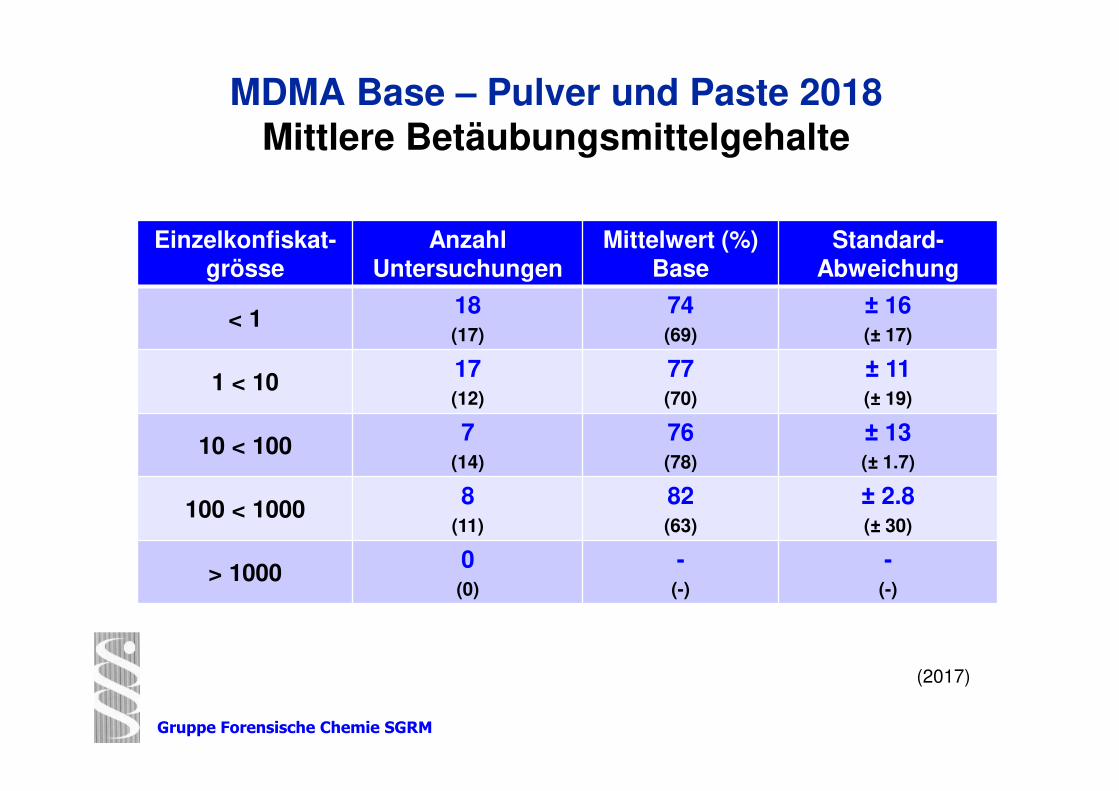
MDMA Base – Pulver und Paste 2018
Mittlere Betäubungsmittelgehalte
Einzelkonfiskat-grösse
Anzahl Untersuchungen
Mittelwert (%) Base
Standard-Abweichung
< 118(17)
74(69)
± 16 (± 17)
1 < 1017(12)
77(70)
± 11(± 19)
10 < 1007
(14)
76(78)
± 13(± 1.7)
100 < 10008
(11)
82(63)
± 2.8(± 30)
> 10000(0)
-(-)
-(-)
(2017)
Gruppe Forensische Chemie SGRM
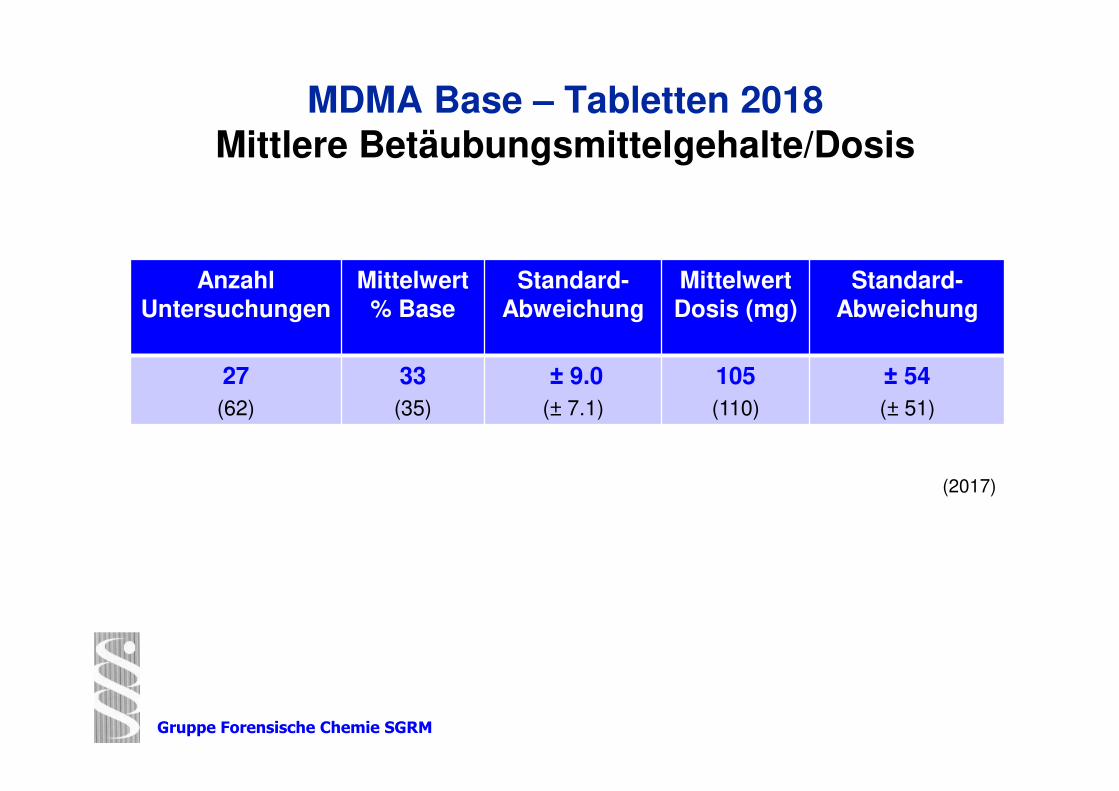
MDMA Base – Tabletten 2018
Mittlere Betäubungsmittelgehalte/Dosis
AnzahlUntersuchungen
Mittelwert% Base
Standard-Abweichung
MittelwertDosis (mg)
Standard-Abweichung
27
(62)
33
(35)
± 9.0
(± 7.1)
105
(110)
± 54
(± 51)
(2017)
Gruppe Forensische Chemie SGRM
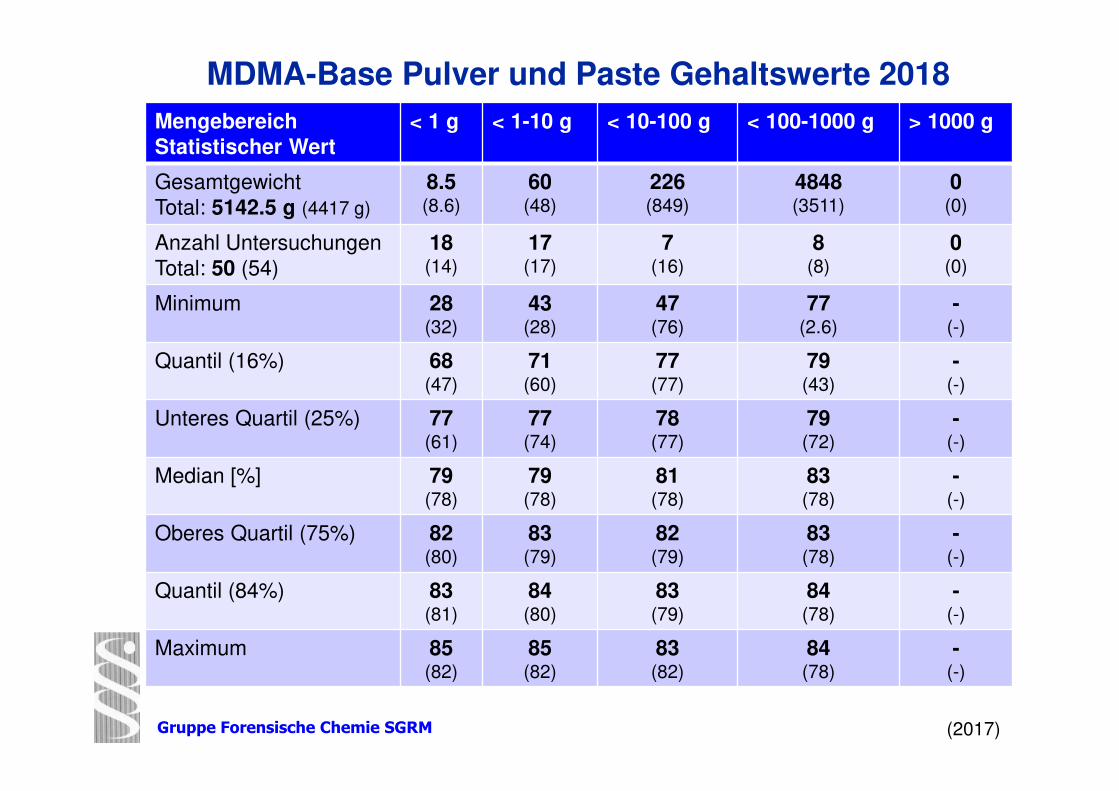
MDMA-Base Pulver und Paste Gehaltswerte 2018
Mengebereich
Statistischer Wert
< 1 g < 1-10 g < 10-100 g < 100-1000 g > 1000 g
Gesamtgewicht
Total: 5142.5 g (4417 g)
8.5(8.6)
60(48)
226(849)
4848(3511)
0(0)
Anzahl Untersuchungen
Total: 50 (54)
18(14)
17(17)
7(16)
8(8)
0(0)
Minimum 28(32)
43(28)
47(76)
77(2.6)
-(-)
Quantil (16%) 68(47)
71(60)
77(77)
79(43)
-(-)
Unteres Quartil (25%) 77(61)
77(74)
78(77)
79(72)
-(-)
Median [%] 79(78)
79(78)
81(78)
83(78)
-(-)
Oberes Quartil (75%) 82(80)
83(79)
82(79)
83(78)
-(-)
Quantil (84%) 83(81)
84(80)
83(79)
84(78)
-(-)
Maximum 85(82)
85(82)
83(82)
84(78)
-(-)
(2017)
Gruppe Forensische Chemie SGRM
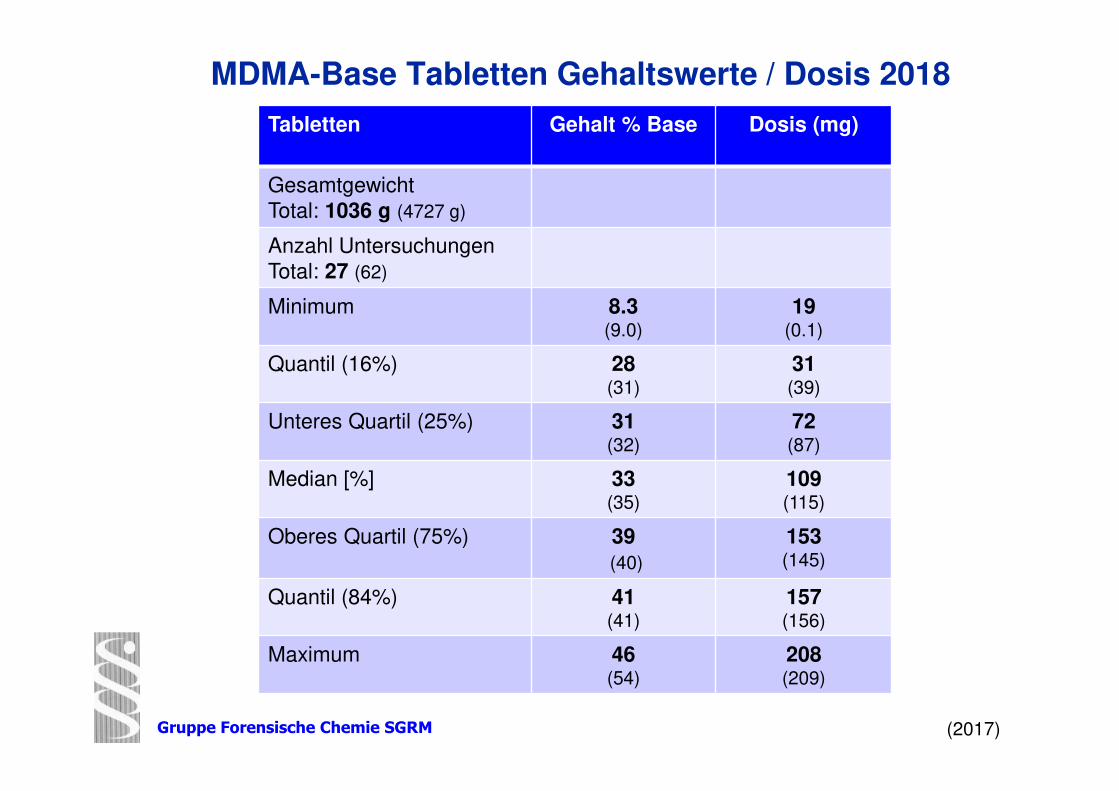
MDMA-Base Tabletten Gehaltswerte / Dosis 2018
Tabletten Gehalt % Base Dosis (mg)
Gesamtgewicht
Total: 1036 g (4727 g)
Anzahl Untersuchungen
Total: 27 (62)
Minimum 8.3(9.0)
19(0.1)
Quantil (16%) 28(31)
31(39)
Unteres Quartil (25%) 31(32)
72(87)
Median [%] 33(35)
109(115)
Oberes Quartil (75%) 39
(40)
153(145)
Quantil (84%) 41(41)
157(156)
Maximum 46(54)
208(209)
(2017)
Gruppe Forensische Chemie SGRM
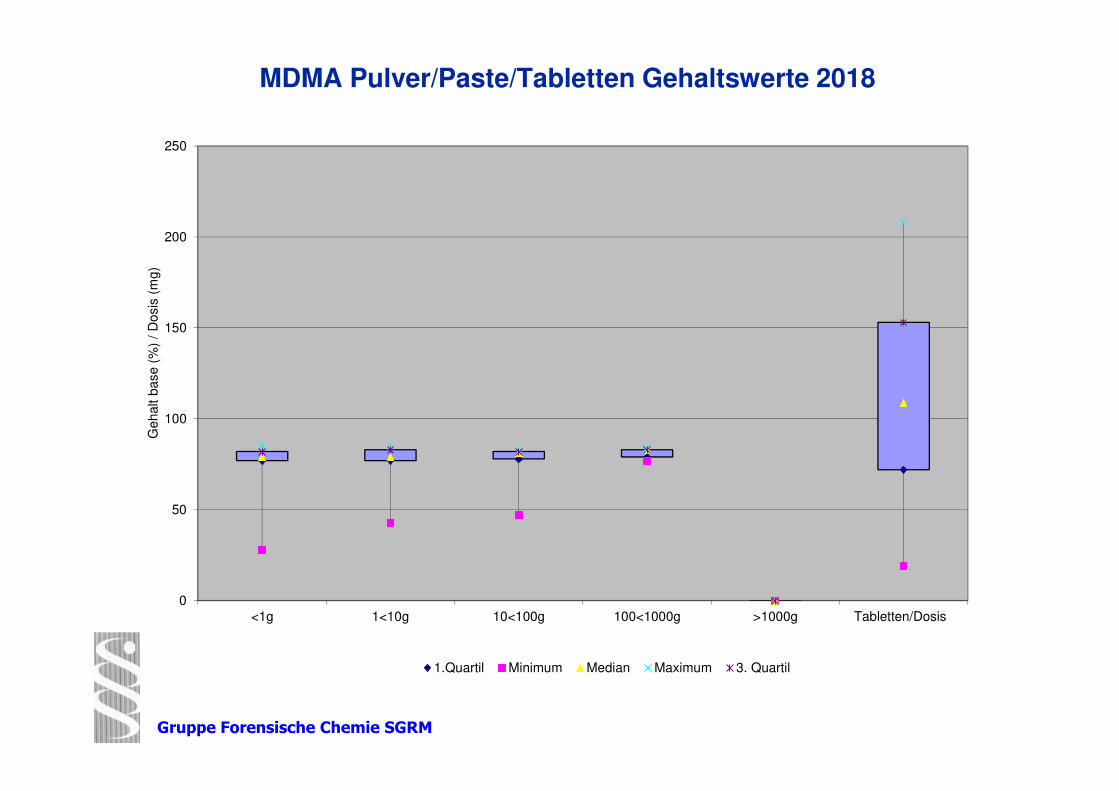
MDMA Pulver/Paste/Tabletten Gehaltswerte 2018
0
50
100
150
200
250
<1g 1<10g 10<100g 100<1000g >1000g Tabletten/Dosis
Gehalt b
ase (
%)
/ D
osis
(m
g)
1.Quartil Minimum Median Maximum 3. Quartil
Gruppe Forensische Chemie SGRM
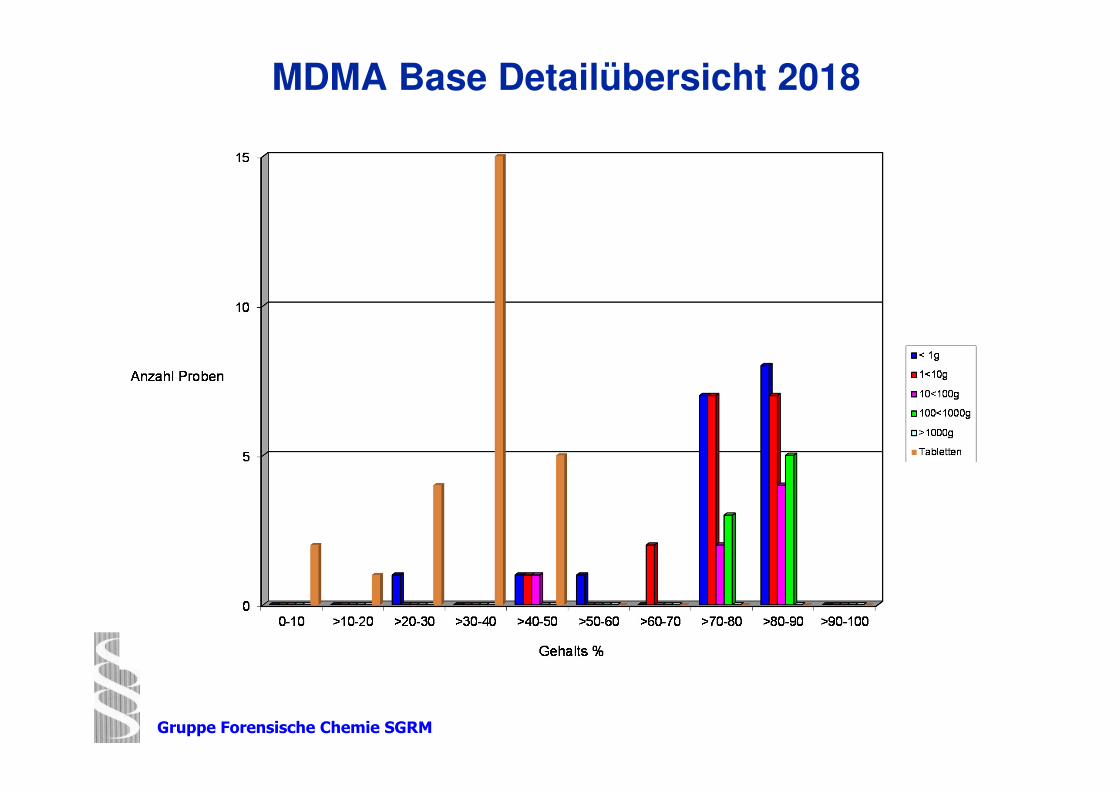
MDMA Base Detailübersicht 2018
Gruppe Forensische Chemie SGRM
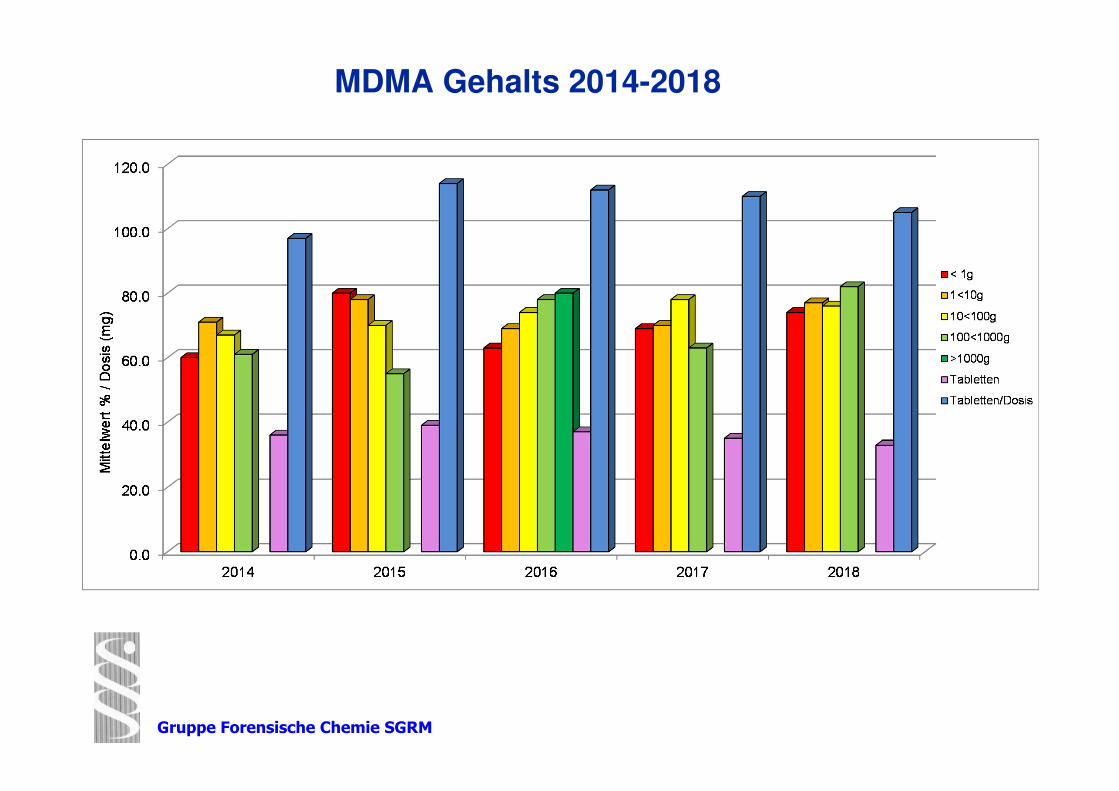
MDMA Gehalts 2014-2018