Embed Size (px)
Citation preview
i
Cathodic Protection Attenuation Near Tidal Zone Area
By
Amirah Husna Binti Abdul Halim
16709
Dissertation submitted in partial fulfillment of
the requirements for the
Bachelor of Engineering (Hons)
(Civil)
MAY 2015
Universiti Teknologi PETRONAS
Bandar Seri Iskandar
31750 Tronoh
Perak Darul Ridzuan
ii
CERTIFICATION OF APPROVAL
Cathodic Protection Attenuation Near Tidal Zone Area
By
Amirah Husna Binti Abdul Halim
16709
A project dissertation submitted to the
Civil Engineering Programme
Universiti Teknologi PETRONAS
In partial fulfilment of the requirement for the
BACHELOR OF ENGINEERING (Hons)
(CIVIL)
Approved by,
____________________
(Dr. Zahiraniza Bt. Mustaffa)
Project Supervisor
UNIVERSITI TEKNOLOGI PETRONAS
TRONOH PERAK
May 2015
iii
CERTIFICATION OF ORIGINALITY
This is to certify that I am responsible for the work submitted in this project, that the
original work is my own except as specified in the references and
acknowledgements, and that the original work contained herein have not been
undertaken or done by unspecified sources or persons.
_____________________________________
AMIRAH HUSNA BINTI ABDUL HALIM
iv
ACKNOWLEDGEMENTS
In the name of Allah, the Most Gracious, the Most Merciful. Praise to
Him the Almighty that His blessing and guidance in giving me strength, courage,
patience, and perseverance to endure this Final Year Project.
First and foremost, I like to express my gratitude to my supervisor, Dr
Zahiraniza Bt. Mustaffa, for her guidance, supports and suggestion throughout this
project. Dr Zahiraniza has spent much time and energy to guide me throughout the
project duration despite other commitments and packed schedule as lecturer in UTP.
Under her supervision, I managed to start and finish my project within the stipulated
timeframe. She has been assisting me in this project by giving her guidance and always
been a great help in making this final year project a success
Earnest appreciation goes to my beloved family for their enormous help
and support. There were times when desperation and despair revolves around me.
Without their countless support, things will be very difficult to deal with.
I also would like to thank all my friends, colleague and individuals whose
name were not mentioned but had willingly shared their knowledge towards the
accomplishment of this project.
A big thanks to my very own Universiti Teknologi PETRONAS, for the
facilities provided that help me a lot in this project such as Information Resource Centre
(IRC) and UTPedia.
Last but not least, my greatest appreciation goes to those who have
assisted me directly or indirectly starting from the beginning of the research. Your
cooperation is highly appreciated and may Allah repay your kindness.
Thanks.
Sincerely,
v
ABSTRACT
Pipeline is widely used in the offshore industry to transport all the oil and
gas product from the offshore platforms to the onshore facilities. Large investment has
been made by most oil and gas company in order to make sure offshore pipelines could
last for their design life. So far, cathodic protection system and coating protection are the
best solution in order to control the corrosion process along the pipeline. Over the years,
cathodic protection has doing great in controlling the corrosion process for all offshore
pipeline which either been buried or being laid in the deep water. However, the
corrosion problems for pipelines near tidal zone area seems to have been overlook by the
people in this industry. All these years, pipeline coating has been widely used in order to
protect the pipeline in the tidal zone area.
Generally, this research will study and analyze the response of cathodic
protection system near tidal zone area. It will focused more on finding out the cathodic
protection potential at tidal zone area close to shoreline. A few equations is being used
and adapted with cathodic protection design from PETRONAS PMO in order to find out
the dissipation of cathodic protection potential at tidal zone area. It seems that sacrificial
anode does not function effectively in tidal zone area due to the absence of stable
seawater electrolyte. Sacrificial anode needs a stable electrolyte around the metalwork to
enable the anode to function effectively.
vi
TABLE OF CONTENTS
CERTIFICATION OF APPROVAL ------------------------------------------------------ i
CERTIFICATION OF ORIGINALITY -------------------------------------------------iii
ACKNOWLEDGEMENTS ----------------------------------------------------------------- iv
ABSTRACT -------------------------------------------------------------------------------------v
TABLE OF CONTENTS -------------------------------------------------------------------- vi
LIST OF FIGURES ------------------------------------------------------------------------- viii
LIST OF TABLES ---------------------------------------------------------------------------- ix
INTRODUCTION ------------------------------------------------------------------------------1
1.1 Research Background ------------------------------------------------------------------1
1.2 Problem Statement ---------------------------------------------------------------------2
1.3 Objectives and Scopes of Study ------------------------------------------------------3
LITERATURE REVIEW --------------------------------------------------------------------4
2.1 Corrosion at Tidal Zone Area --------------------------------------------------------6
2.2 Cathodic Protection --------------------------------------------------------------------9
2.2.1 Impressed Current Systems --------------------------------------------------- 10
2.2.2 Sacrificial Anode ----------------------------------------------------------------- 11
2.2.2.1 How sacrificial anode works. ----------------------------------------------- 12
2.3 Cathodic Protection Design for Pipeline ----------------------------------------- 14
2.3.1 Design Current Densities ------------------------------------------------------- 14
2.3.2 Coating Breakdown Factor ---------------------------------------------------- 16
2.4 Wave Transformation and Attenuation ------------------------------------------ 18
2.5 Cathodic Protection Attenuation Design ----------------------------------------- 19
2.5.1 Cathodic Protection Potential based from Smith (1992) ---------------- 19
vii
2.5.2 Cathodic Protection Potential based from Fontaine and Gibson
(2004) -------------------------------------------------------------------------------------- 21
2.5.3 Cathodic Protection Potential based from Hartt and Lysogorski
(2003) -------------------------------------------------------------------------------------- 22
2.5.4 Cathodic Protection Potential based from Hartt and Lysogorski
(2003) -------------------------------------------------------------------------------------- 23
METHODOLOGY and PROJECT WORK ------------------------------------------- 24
3.1 Overall Methodology ----------------------------------------------------------------- 24
3.2 Detailed Methodology ---------------------------------------------------------------- 26
3.3 Project Progress / Timeline --------------------------------------------------------- 27
RESULTS and DISCUSSIONS ----------------------------------------------------------- 29
4.1 Calculation of Cathodic Protection Potential based from Smith (1992) -- 30
4.2 Calculation of Cathodic Protection Potential based from Fontaine and
Gibson (2004) ------------------------------------------------------------------------------- 32
4.3 Calculation of Cathodic Protection Potential based from Hartt and
Lysogorski (2003) -------------------------------------------------------------------------- 34
4.4 Calculation of Cathodic Protection Potential based from Hartt and
Lysogorski (2003) -------------------------------------------------------------------------- 36
CONCLUSIONS ------------------------------------------------------------------------------ 38
REFERENCES ------------------------------------------------------------------------------- 39
APPENDIX ------------------------------------------------------------------------------------ 42
viii
LIST OF FIGURES
Figure 1: The illustration of the pipeline near tidal zone area.
Figure 2: Corrosion of bridge in tidal zone area
Figure 3: Corrosion of piles in tidal zone area
Figure 4: Corrosion of offshore platform
Figure 5: Illustration of impressed current cathodic protection systems
Figure 6: Illustration of Sacrificial anode cathodic protection system
Figure 7: Methodology of project
Figure 8: Project planning and timeline for FYP 1
Figure 9: Project planning and timeline for FYP 2
Figure 10: Graph of CP potential based from Smith Equation
Figure 11: Graph of CP potential based from Fontaine and Gibson Equation
Figure 12: Graph of CP potential based from Hartt and Lysogorski Equation
Figure 13: Graph of CP potential based from Hartt and Lysogorski
ix
LIST OF TABLES
Table 1: Simplified galvanic series
Table 2: Design of current densities of non-buried offshore pipeline in different sea
water condition (from PTS code of practice)
Table 3: Design current densities (A/m2) for seawater exposed bare metal surface based
on surface water temperature (from DNV code of practice)
Table 4: Constant of k1 and k2 for different pipeline coatings.
Table 5: Constant a and b for different coating categories.
Table 6: CP Design parameters used by PETRONAS PMO
1
CHAPTER 1
INTRODUCTION
1.1 Research Background
Over the years, there are more than 27, 000 miles of offshore pipelines have
been laid on the seabed of the ocean since 1859. All these pipelines had either been
abandoned in the sea or had been removed. These pipeline were used to transport all
the petroleum product from the topside facilities to the processing facilities.
Normally, offshore steel pipelines are designed for a life span ranging from 10 years
to 40 years. In order to make the pipelines to last for such life span, these pipelines
need to be protected from corrosion both externally and internally.
Corrosion has become one of the biggest concern for all oil and gas
companies. The effect of corrosion could lead to pipeline leakage and ruptures,
which is the most crucial problem that all oil and gas companies need to avoid. They
have to put in much effort and money to overcome this problem. Although corrosion
could not be eliminated but it can be reduced to some extent. One of the solution in
reducing the rate of corrosion on the pipeline is by applying the coatings or
protection systems that could slow down or inhibit the rate of corrosion on the
pipeline.
From the early years of offshore industries until mid-1970’s, all the offshore
pipeline coatings had been using either asphaltic or aggregate ‘Somastic’ type
coating or the hot-applied coal tar enamels. After that, the trends had change into
using the Fusion Bonded Epoxy (FBE) powder coatings. Later then, cathodic
protection was introduced and widely used in the oil and gas industries.
1
Cathodic protection (CP) is a method of controlling the metal surface by
preventing the corrosion of parent metal. A sacrificial anode is provided in order to
prevent the damaged areas from corroding. In the early days, CP relied on the
impressed current-system that consist of DC power source, an AC powered
transformer rectifier and an array of anodes that were buried in the ground. In early
1970s, the zinc bracelet anode that were attached to the pipeline were introduced and
since then, it had been widely used by many operators. After many researches were
done by the earlier researcher, it was found that aluminum alloy perform much better
as compared to zinc bracelet anode. Since then, aluminum alloys had become the
preferred material for the offshore pipeline galvanic anode. However, there are still
some operators that used impressed current-systems and zinc bracelet anode in their
pipeline external protection.
2
1.2 Problem Statement
Pipeline plays an important role in the oil and gas industries. Until now,
pipeline has become the most efficient and economical transportation for the crude
oil, natural gas and their product. Despite of its efficiency, the corrosion in the
internal and external surface of the pipeline has become the main concern for the
people in this industry.
Many research and studies have been done in order to find out the solution
for this problem. Until now, the best solution they can find is by applying the
cathodic protection and coatings to the offshore pipeline. Yet, the application of
cathodic protection and coatings is just a matter of slowing down the corrosion of
the pipeline. Usually, the most severe pipeline corrosion occurs in the splash and
tidal zone area where the corrosion rates are generally more than twice compared to
the pipeline that immersed in the ocean. Thus, some analysis should be done in
order to find out the dissipation of CP near the tidal zone area. In this research, a
qualitatively analysis will be conducted in order to find out the CP responses near
tidal zone area.
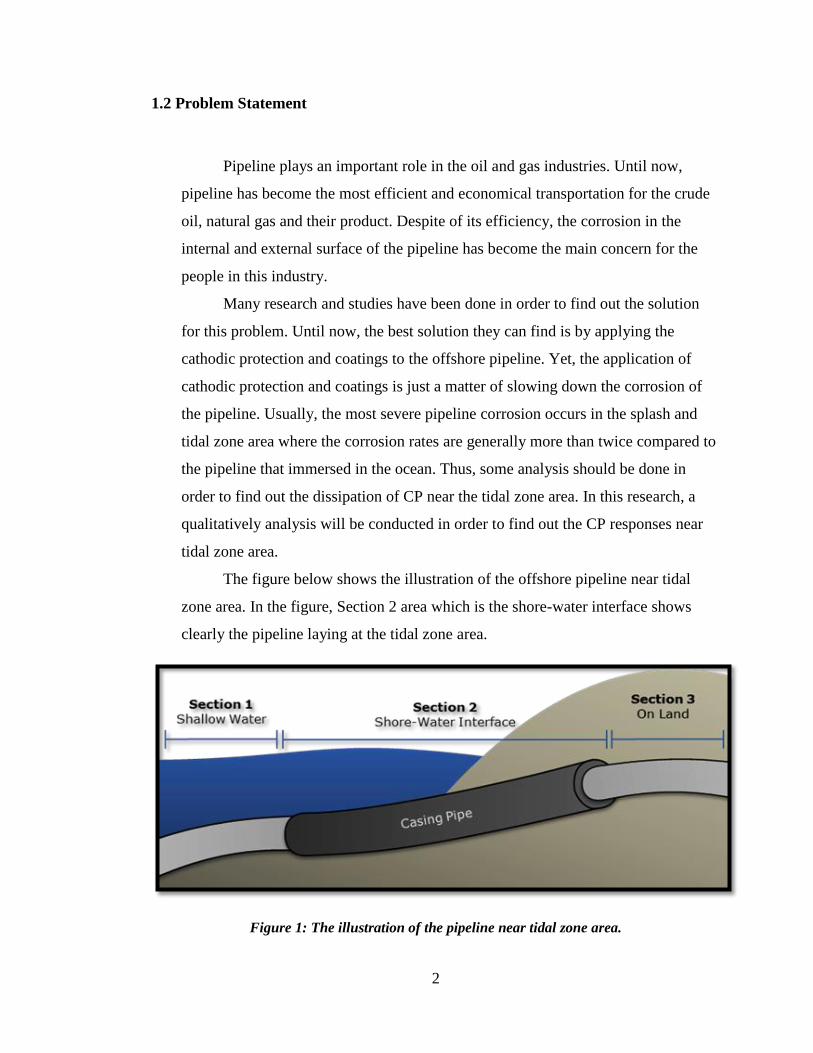
The figure below shows the illustration of the offshore pipeline near tidal
zone area. In the figure, Section 2 area which is the shore-water interface shows
clearly the pipeline laying at the tidal zone area.
Figure 1: The illustration of the pipeline near tidal zone area.
3
1.3 Objectives and Scopes of Study
The objectives of this research are:
1) To calculate and compare the cathodic protection distribution along the
pipeline near tidal zone area.
2) To qualitatively analyze the dissipation of cathodic protection near tidal zone
area.
In general, the scope of study for this research is to analyze the cathodic protection
potential prediction near tidal zone area close to shoreline. In this research, the corrosion
in the pipeline will not be used for validation as the data provided is very limited. The
calculation of cathodic protection potential was calculated based from the formula used
by past researchers. Therefore, the scope of works for this research will include the
analysis and observation of the cathodic protection potential dissipation and behavior
near tidal zone area.
4
CHAPTER 2
LITERATURE REVIEW
Pipeline systems are very important assets in oil and gas industries. They are
mainly used to transport all the petroleum product like crude oil and natural gases from
the topside facilities to the processing facilities. All oil and gas companies are trying
very hard to come out with the best pipeline design that could last longer. In order to
have the best offshore pipeline design, they need to overcome the issue of pipeline
corrosion both externally and internally. Ever since years ago, corrosion has become the
biggest enemy in the oil and gas industries. Corrosion problems could lead to pipeline
leakages and ruptures in which would cause disaster if it is happening.
Generally, corrosion is defined as the common phenomenon where materials
deteriorates due to the reaction with the environment. According to the Theory of
Corrosion and Cathodic Protection by J.B. Bushman (n.d.), different terms have been
used in order to describe the form or basic mechanism of corrosion. He preferred to
defined corrosion as the degradation of materials when they reacts with the environment.
On the other hand, based on ISO 8044, Corrosion of Metal & Alloys, corrosion is
defined as the physiochemical interaction between metal and its surrounding
environment which will result in the changes in properties of the metal itself.
Normally, all metal are naturally found in corroded state in which they are in
their most stable state of metals. Corrosion process occurred when the metal change to
oxide state or as well as their stable state. In order for the corrosion process to occur,
there are several component that need to be taking into consideration. They are the
anode, cathode and electron path or ionic path. During corrosion process, anodic and
cathodic reaction will be occur in which they are representing the oxidation and
reduction process. As for the electrons or ionic path, this terms shows the condition of
the environment where the electron or ions is moving or transferred during the corrosion
process.
5
Theoretically, corrosion process will occur when the metal react with the
environment where there are the presence of water and oxygen. Corrosion reaction will
significantly increase in the aqueous solution due the presence of dissolved salt, acids, or
bases which create and electrically conducting with the alliance of electrolytes. Marine
water environment is an exact example of electrolytic solution which significantly
related to various kind of corrosion failure experienced by numerous marine structures
like offshore platforms, bridges, ship and pipelines. According to Fontana (1986), he had
stated that corrosion rate will significantly increase in a corrosive solution such as the
sea water. The corrosion rate is increase as the concentration of the corrosive solution is
increased. Sea water is one of example for the corrosive solution as it contains various
kinds of salts, mainly sodium chloride, NaCl
6
2.1 Corrosion at Tidal Zone Area
Marine environment can be divided into different zones. Usually, these zones
were divided based on the water level and conditions. Some of the zones in marine
environment are splash zone, high zones and mid zones. Yin et al. (2008) has stated that
the marine environments can be divided into atmospheric, splash, tidal, seawater and sea
mud zones, This has also been supported by Zen (2005), as he had mentioned that the
corrosion environment for all port structure are usually divided into atmospheric, splash,
tidal, seawater and mud and backfill zones.
Over the years, the rate of corrosion along the splash and tidal zone area has
been very severe. It is reported that the rate of corrosion in splash and tidal zone area is
twice greater compared to any zones in the marine environment. Jeffrey and Melchers
(2009) had stated that based from the past research done by Humble, LaQue and
Larrabee on the corrosion loss mass profile, the result for the steel exposed in marine
tidal conditions for short terms (151 days) and longer terms (5 years) has shown the very
similar profile pattern in which the most severe corrosion occurred in the tidal zone area
that is, the region above the mean-tide level. This has proved the statement from Bardal
(2004) as he also stated that the corrosion damage is likely to be most severe in the
splash and tidal zone area. Besides that, Zen (2005) also has said that ‘the corrosion rate
in the atmospheric zone is less than 01.mm/year while the corrosion rate in the tidal zone
is about 0.3 mm/year’.
Past research done by various researchers were only to observe and study the
corrosion rate in the tidal zone at the bridges, piles and offshore platform. This can be
seen as Kaplan et al. (1995) has presented and came up with the analytical solution to
the wave slamming impact on the offshore platforms. Besides that, Zen (2005) has
examined the corrosion tendency of a steel pile at the portion between ‘mean low water
level’ and ‘low water level’.
Based from my observation, there is none research has been done to investigate
the cathodic protection behavior along the pipeline at tidal zone area. Nevertheless, Lye
(2001) has stated that according to the old Det Norske Veritas rules, the risers at the
7
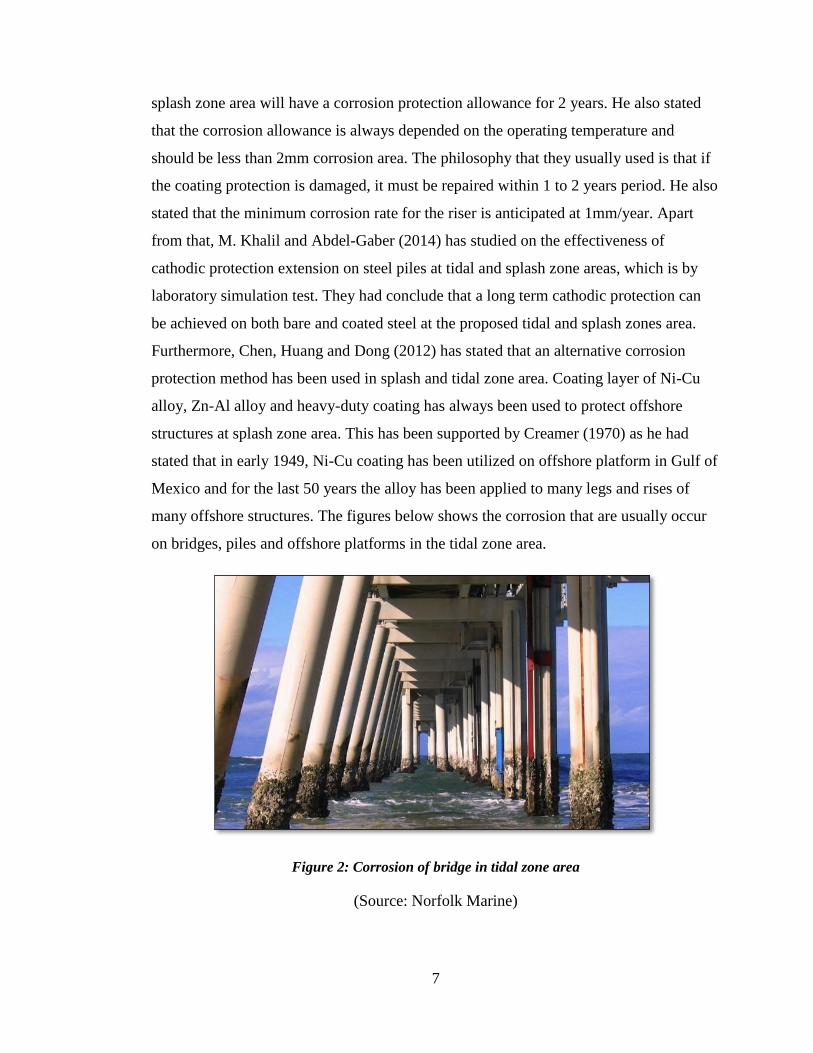
splash zone area will have a corrosion protection allowance for 2 years. He also stated
that the corrosion allowance is always depended on the operating temperature and
should be less than 2mm corrosion area. The philosophy that they usually used is that if
the coating protection is damaged, it must be repaired within 1 to 2 years period. He also
stated that the minimum corrosion rate for the riser is anticipated at 1mm/year. Apart
from that, M. Khalil and Abdel-Gaber (2014) has studied on the effectiveness of
cathodic protection extension on steel piles at tidal and splash zone areas, which is by
laboratory simulation test. They had conclude that a long term cathodic protection can
be achieved on both bare and coated steel at the proposed tidal and splash zones area.
Furthermore, Chen, Huang and Dong (2012) has stated that an alternative corrosion
protection method has been used in splash and tidal zone area. Coating layer of Ni-Cu
alloy, Zn-Al alloy and heavy-duty coating has always been used to protect offshore
structures at splash zone area. This has been supported by Creamer (1970) as he had
stated that in early 1949, Ni-Cu coating has been utilized on offshore platform in Gulf of
Mexico and for the last 50 years the alloy has been applied to many legs and rises of
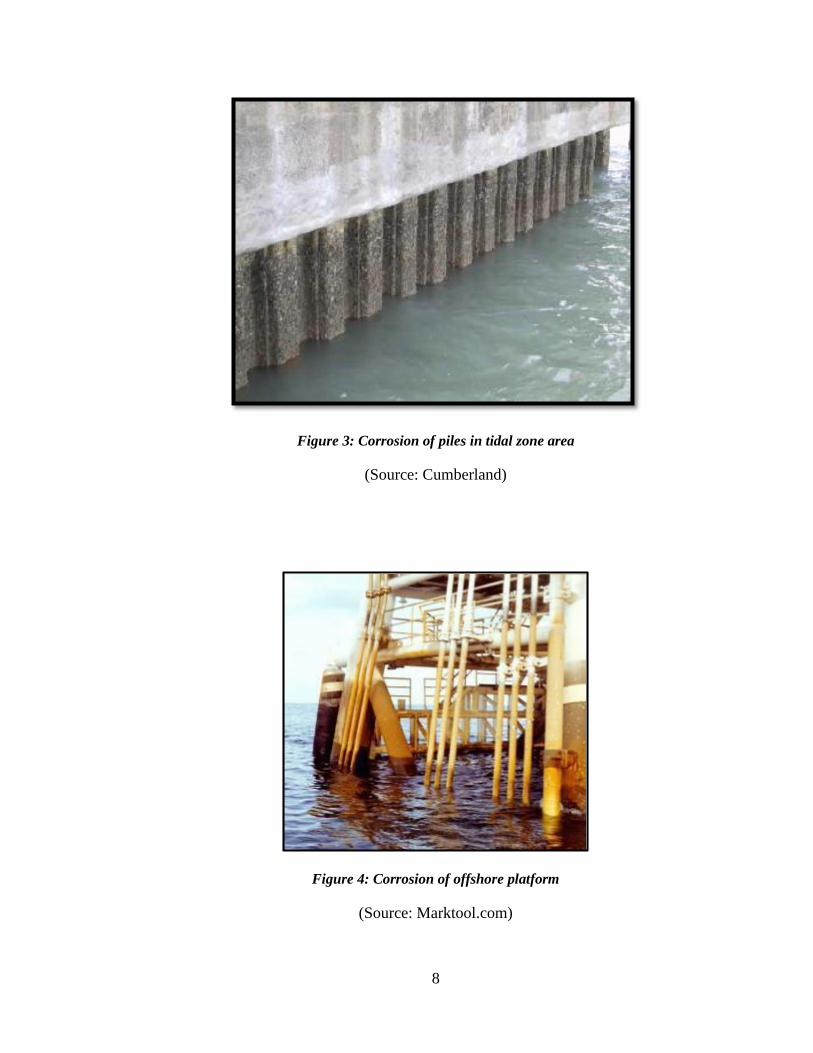
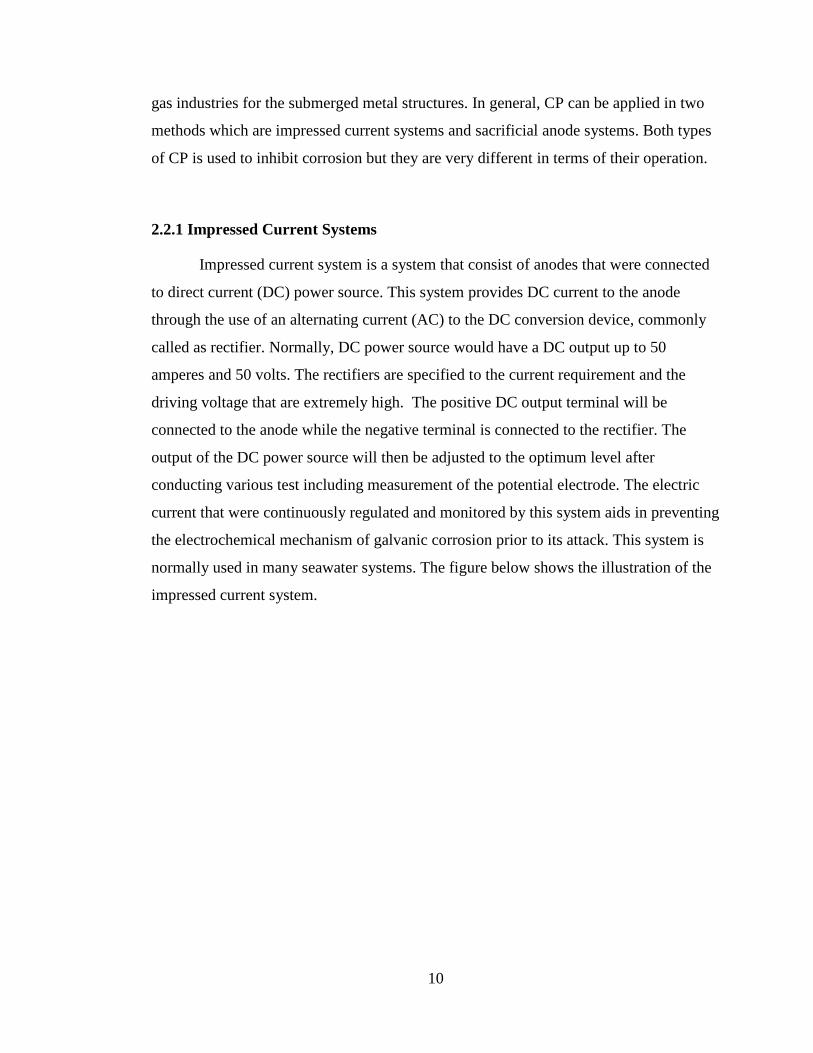
many offshore structures. The figures below shows the corrosion that are usually occur
on bridges, piles and offshore platforms in the tidal zone area.
Figure 2: Corrosion of bridge in tidal zone area
(Source: Norfolk Marine)
8
Figure 3: Corrosion of piles in tidal zone area
(Source: Cumberland)
Figure 4: Corrosion of offshore platform
(Source: Marktool.com)
9
2.2 Cathodic Protection
Cathodic protection (CP) was first introduced by Sir Humprey Davy in 1824 to
protect the copper sheeting on the hulls of the wooden naval ships. According to ISO
8044, CP can be defined as “electrochemical protection by decreasing the corrosion
potential to a level at which the corrosion rate of the metal is significantly reduced”
while NACE RP0176 has defined CP as “a technique to reduce corrosion of a metal
surface by making that surface the cathode of an electrochemical cell”. CP is applicable
for all types of metals and alloys that were commonly used in marine environment. It
prevents localized forms of corrosion as well as uniform corrosion attacks and
eliminates the possibility of having galvanic corrosion when the metallic materials with
different electrochemical characteristic are combined.
The principles of CP can be explained by referring to the corrosion of a typical
metal, M, in an acidic environment. By means of electrochemical reactions, the process
of metal dissolution and hydrogen gas evolution occurred, for example:
M → M n+ + ne (1)
2H+ + 2e → H2 (2)
CP is achieved as the metal structure to be protected is supplied with electrons, or in
other hand, CP system is accomplished by providing external current to the protected
structure. Based from the Equation (1) and (2), it shows that addition of electron to the
metal will help to a smoother metal dissolution as well as increasing the rate of hydrogen
evolution. In other words, the protected structure will be protected from corrosion if the
electric current from the electrolyte corrode other metal that has higher negativity
compared to the protected structure.
According to Refait et al. (2014), in most cases, all the seaport structures, sheets
and pilings were initially not protected against corrosion. In order to increase the
lifetime and protect the existing structures, a decision to apply CP is always been
considered. Moreover, Saberi et al. (2014) also suggests that CP is one of the primary
method in controlling the corrosion which can applied extensively in offshore oil and
10
gas industries for the submerged metal structures. In general, CP can be applied in two
methods which are impressed current systems and sacrificial anode systems. Both types
of CP is used to inhibit corrosion but they are very different in terms of their operation.
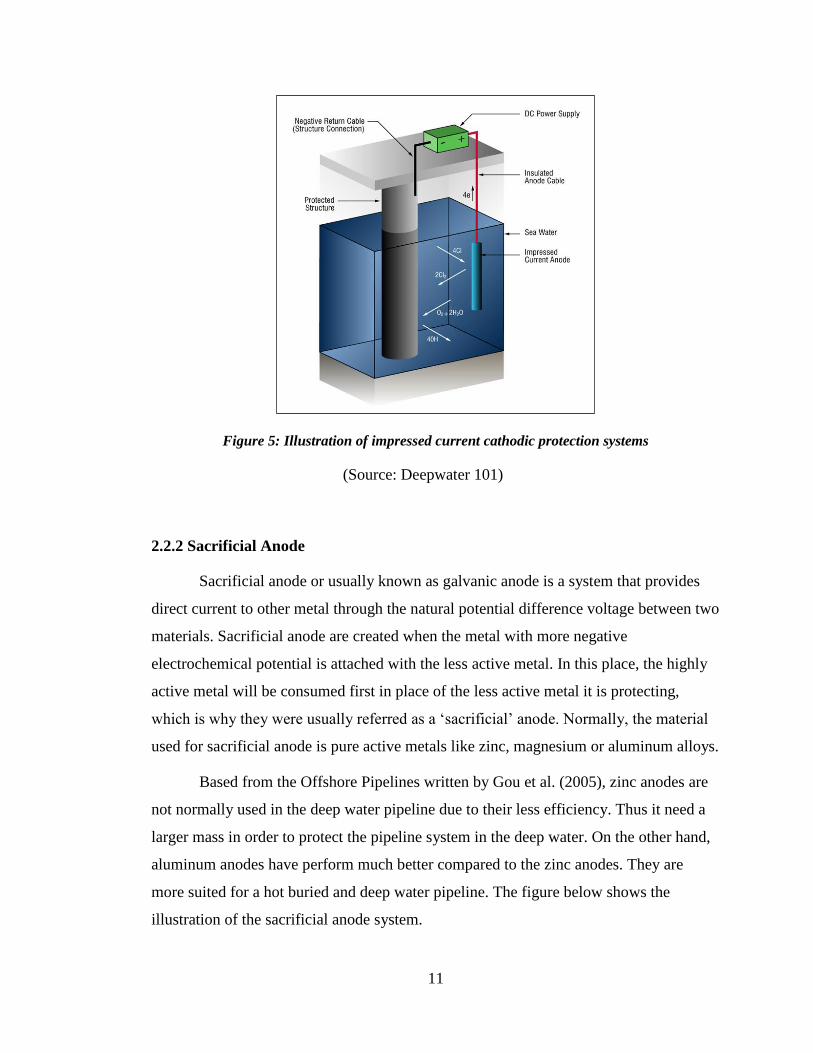
2.2.1 Impressed Current Systems
Impressed current system is a system that consist of anodes that were connected
to direct current (DC) power source. This system provides DC current to the anode
through the use of an alternating current (AC) to the DC conversion device, commonly
called as rectifier. Normally, DC power source would have a DC output up to 50
amperes and 50 volts. The rectifiers are specified to the current requirement and the
driving voltage that are extremely high. The positive DC output terminal will be
connected to the anode while the negative terminal is connected to the rectifier. The
output of the DC power source will then be adjusted to the optimum level after
conducting various test including measurement of the potential electrode. The electric
current that were continuously regulated and monitored by this system aids in preventing
the electrochemical mechanism of galvanic corrosion prior to its attack. This system is
normally used in many seawater systems. The figure below shows the illustration of the
impressed current system.
11
Figure 5: Illustration of impressed current cathodic protection systems
(Source: Deepwater 101)
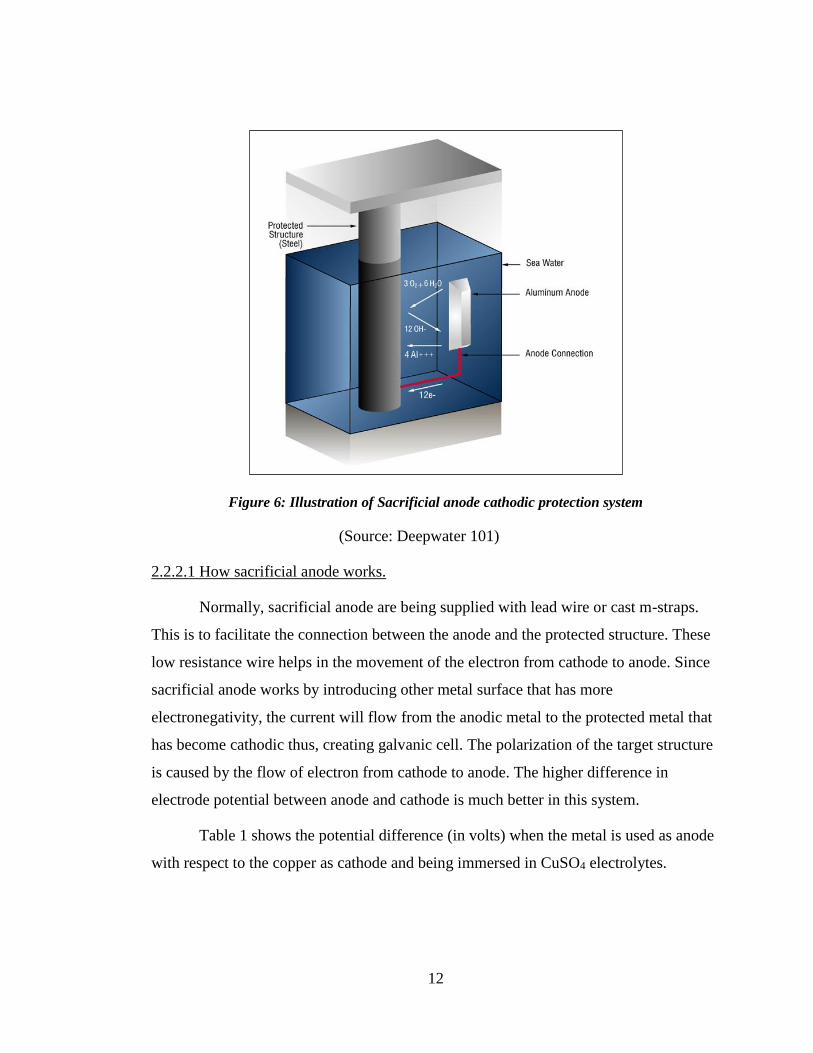
2.2.2 Sacrificial Anode
Sacrificial anode or usually known as galvanic anode is a system that provides
direct current to other metal through the natural potential difference voltage between two
materials. Sacrificial anode are created when the metal with more negative
electrochemical potential is attached with the less active metal. In this place, the highly
active metal will be consumed first in place of the less active metal it is protecting,
which is why they were usually referred as a ‘sacrificial’ anode. Normally, the material
used for sacrificial anode is pure active metals like zinc, magnesium or aluminum alloys.
Based from the Offshore Pipelines written by Gou et al. (2005), zinc anodes are
not normally used in the deep water pipeline due to their less efficiency. Thus it need a
larger mass in order to protect the pipeline system in the deep water. On the other hand,
aluminum anodes have perform much better compared to the zinc anodes. They are
more suited for a hot buried and deep water pipeline. The figure below shows the
illustration of the sacrificial anode system.
12
Figure 6: Illustration of Sacrificial anode cathodic protection system
(Source: Deepwater 101)
2.2.2.1 How sacrificial anode works.
Normally, sacrificial anode are being supplied with lead wire or cast m-straps.
This is to facilitate the connection between the anode and the protected structure. These
low resistance wire helps in the movement of the electron from cathode to anode. Since
sacrificial anode works by introducing other metal surface that has more
electronegativity, the current will flow from the anodic metal to the protected metal that
has become cathodic thus, creating galvanic cell. The polarization of the target structure
is caused by the flow of electron from cathode to anode. The higher difference in
electrode potential between anode and cathode is much better in this system.
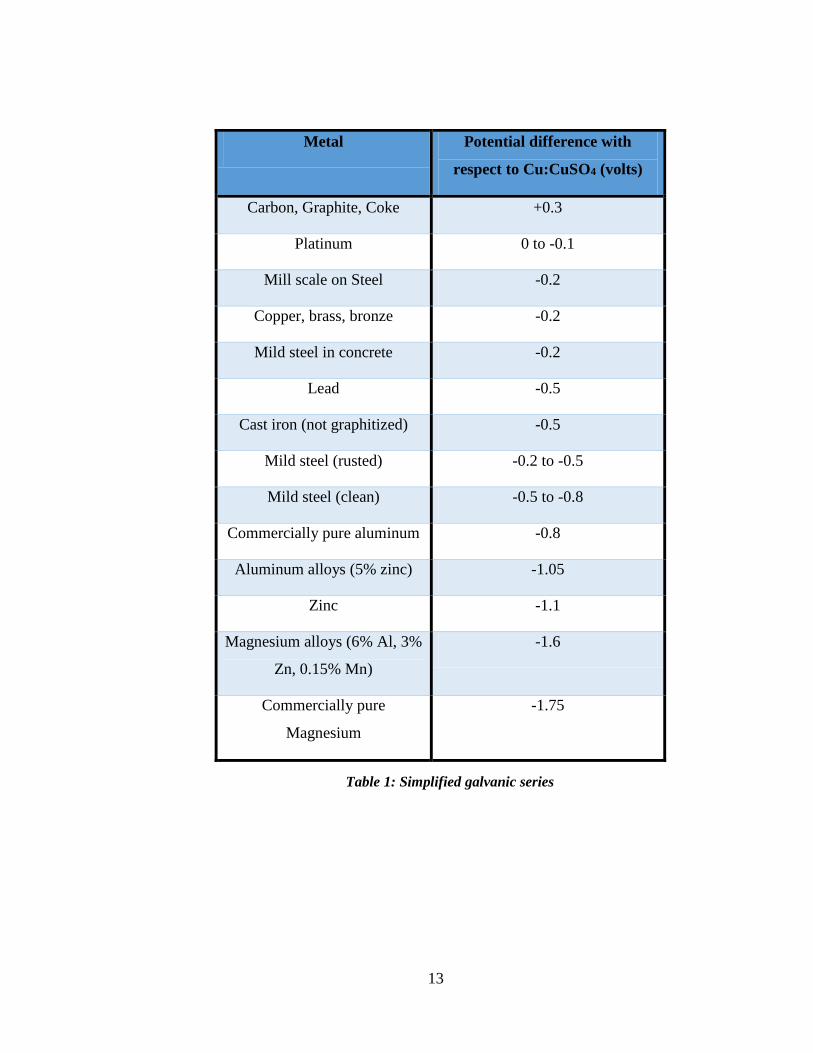
Table 1 shows the potential difference (in volts) when the metal is used as anode
with respect to the copper as cathode and being immersed in CuSO4 electrolytes.
13
Metal Potential difference with
respect to Cu:CuSO4 (volts)
Carbon, Graphite, Coke +0.3
Platinum 0 to -0.1
Mill scale on Steel -0.2
Copper, brass, bronze -0.2
Mild steel in concrete -0.2
Lead -0.5
Cast iron (not graphitized) -0.5
Mild steel (rusted) -0.2 to -0.5
Mild steel (clean) -0.5 to -0.8
Commercially pure aluminum -0.8
Aluminum alloys (5% zinc) -1.05
Zinc -1.1
Magnesium alloys (6% Al, 3%
Zn, 0.15% Mn)
-1.6
Commercially pure
Magnesium
-1.75
Table 1: Simplified galvanic series
14
2.3 Cathodic Protection Design for Pipeline
According to Det Norske Veritas, cathodic protection (CP) can be defined as
electrochemical protection by decreasing the corrosion potential of the protected
structure to a level in which the corrosion rate is significantly reduced. Based from the
design philosophy of Petronas Technical Standard; Design of Cathodic Protection
System for Offshore Pipeline, it stated that all offshore pipeline should be protected
from corrosion using a mixed use of external coating and cathodic protection. Petronas
also recommended CP system to be used in the new offshore pipelines that features a
bracelet-type sacrificial anode. This also supported by Zhang et al. (2012) as they also
said that CP is a best practice in impeding the metal structure form corrosion.
In designing a cathodic protection, there are several design parameters that
should be taken into consideration. Based from the Recommended Practice DNV-RP-
BR401; Cathodic Protection Design, the design parameters to be used in the conceptual
and detailed design of CP systems are design life, design current densities, coating
breakdown factor, material design parameter, anode resistance, seawater and sediment
resistivity and current design parameter. Petronas Technical Standard also followed the
same design parameter as the DNV Code of practice but with some modification in the
design current densities and the coating breakdown factor.
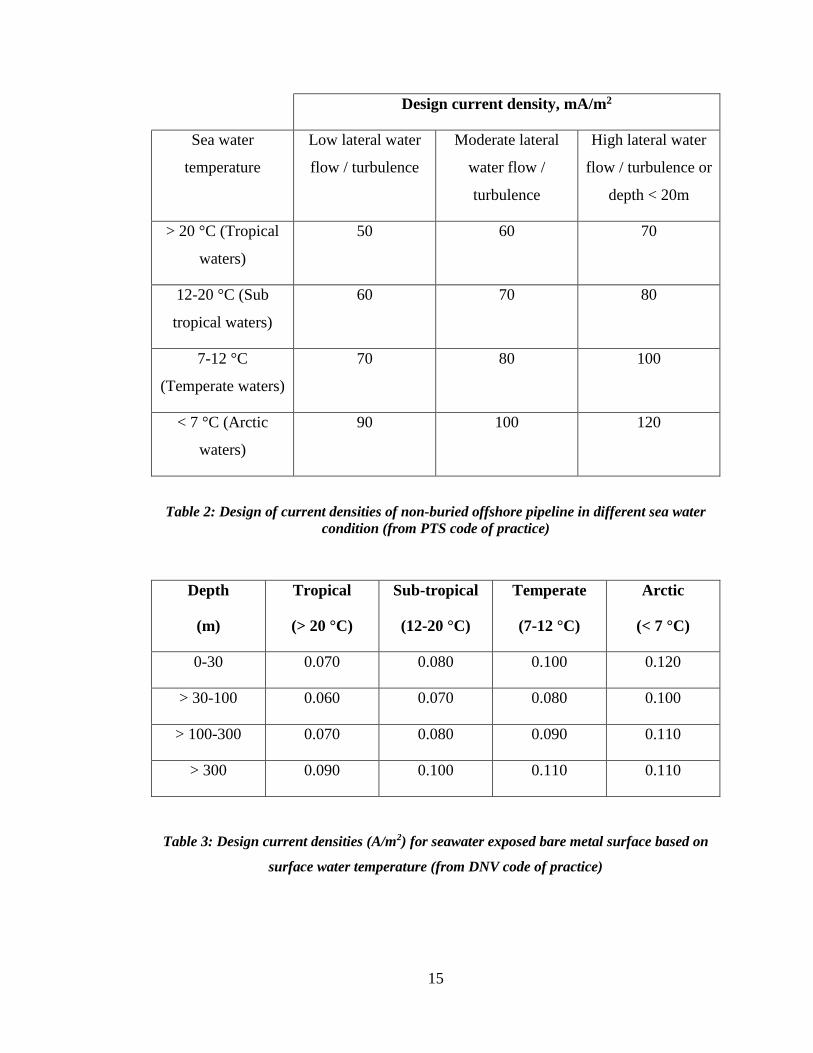
2.3.1 Design Current Densities
Design current density, ic refers to the cathodic protection current per unit
surface area (A/m2). The current density need to achieve its full protection of a bare
metal depends on the sea water temperature water velocities. Once the current demand is
calculated, it will then be used to determine the number and size of anode. On this
matter, both PTS and DNV code have different sets of data. The data used in PTS are
usually applicable to the North Sea and the Norwegian Sea up to a latitude of 70 degrees
North while the data used in DNV are used with the consideration of polarization effect
of bare metal surface and the establishment of calcareous scale and marine growth. The
tables below will show the current density for PTS and DNV code of practice.
15
Design current density, mA/m2
Sea water
temperature
Low lateral water
flow / turbulence
Moderate lateral
water flow /
turbulence
High lateral water
flow / turbulence or
depth < 20m
> 20 °C (Tropical
waters)
50 60 70
12-20 °C (Sub
tropical waters)
60 70 80
7-12 °C
(Temperate waters)
70 80 100
< 7 °C (Arctic
waters)
90 100 120
Table 2: Design of current densities of non-buried offshore pipeline in different sea water
condition (from PTS code of practice)
Depth
(m)
Tropical
(> 20 °C)
Sub-tropical
(12-20 °C)
Temperate
(7-12 °C)
Arctic
(< 7 °C)
0-30 0.070 0.080 0.100 0.120
> 30-100 0.060 0.070 0.080 0.100
> 100-300 0.070 0.080 0.090 0.110
> 300 0.090 0.100 0.110 0.110
Table 3: Design current densities (A/m2) for seawater exposed bare metal surface based on
surface water temperature (from DNV code of practice)
16
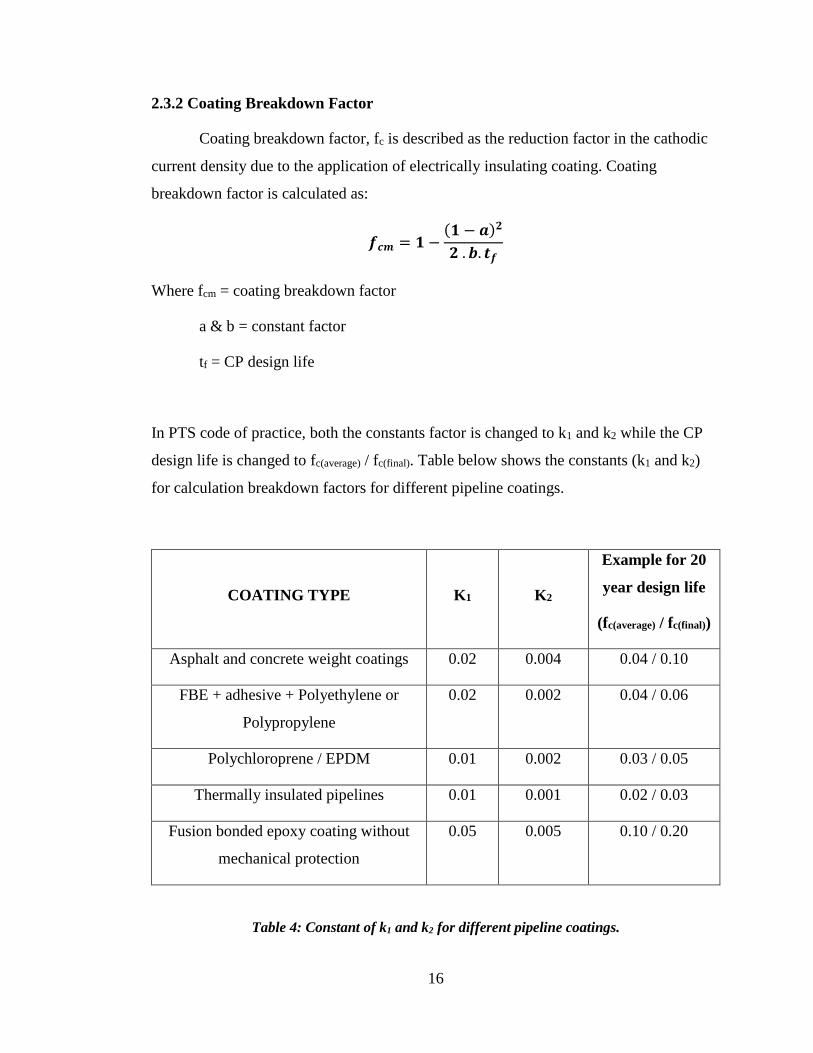
2.3.2 Coating Breakdown Factor
Coating breakdown factor, fc is described as the reduction factor in the cathodic
current density due to the application of electrically insulating coating. Coating
breakdown factor is calculated as:
𝒇𝒄𝒎 = 𝟏 −(𝟏 − 𝒂)𝟐
𝟐 . 𝒃. 𝒕𝒇
Where fcm = coating breakdown factor
a & b = constant factor
tf = CP design life
In PTS code of practice, both the constants factor is changed to k1 and k2 while the CP
design life is changed to fc(average) / fc(final). Table below shows the constants (k1 and k2)
for calculation breakdown factors for different pipeline coatings.
COATING TYPE
K1
K2
Example for 20
year design life
(fc(average) / fc(final))
Asphalt and concrete weight coatings 0.02 0.004 0.04 / 0.10
FBE + adhesive + Polyethylene or
Polypropylene
0.02 0.002 0.04 / 0.06
Polychloroprene / EPDM 0.01 0.002 0.03 / 0.05
Thermally insulated pipelines 0.01 0.001 0.02 / 0.03
Fusion bonded epoxy coating without
mechanical protection
0.05 0.005 0.10 / 0.20
Table 4: Constant of k1 and k2 for different pipeline coatings.
17
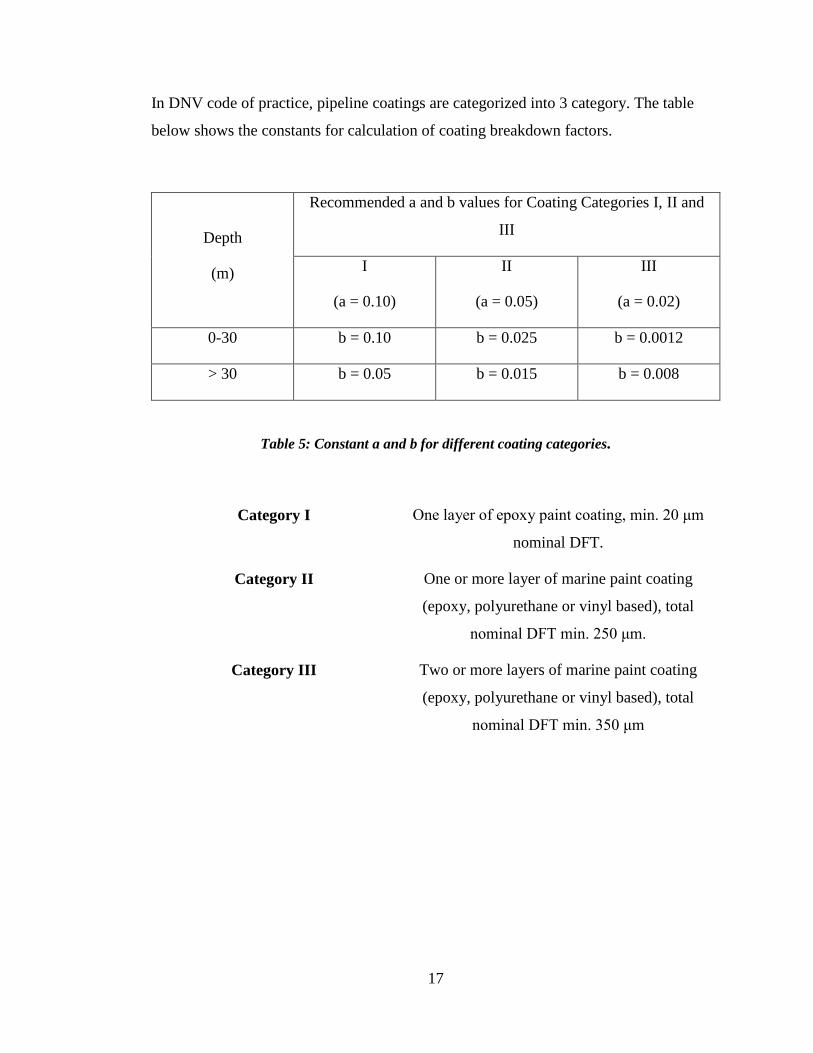
In DNV code of practice, pipeline coatings are categorized into 3 category. The table
below shows the constants for calculation of coating breakdown factors.
Depth
(m)
Recommended a and b values for Coating Categories I, II and
III
I
(a = 0.10)
II
(a = 0.05)
III
(a = 0.02)
0-30 b = 0.10 b = 0.025 b = 0.0012
> 30 b = 0.05 b = 0.015 b = 0.008
Table 5: Constant a and b for different coating categories.
Category I One layer of epoxy paint coating, min. 20 μm
nominal DFT.
Category II One or more layer of marine paint coating
(epoxy, polyurethane or vinyl based), total
nominal DFT min. 250 μm.
Category III Two or more layers of marine paint coating
(epoxy, polyurethane or vinyl based), total
nominal DFT min. 350 μm
18
2.4 Wave Transformation and Attenuation
Normally, ocean waves are generated naturally by the action of wind on water.
They were formed initially through a complex process of shearing action and resonance.
In the process, these waves will have difference wave height, length and period that
were travelling in various directions. Once the waves is formed, they will travel for a far
distances, spreading in various direction and reducing in wave height, but it will
maintaining same wavelength and period. As the waves approaching shoreline area, their
height and wavelength will be altered due to some process that were happened.
The accurate computation of nearshore wave transformation is a major aspect of
the design of coastal structures and the prediction of nearshore currents and shoreline
changes. As the waves approaching the shoreline, the waves will enter a transitional
depth region in which these waves motion will be affected by the ocean seabed. They
will undergo several processes such as refraction, shoaling, bottom friction, and wave
breaking (Reeve, Chadwick and Fleming, 2012). If the waves encounter with major
structures or abrupt changes in the shoreline, they will be transformed by diffraction
process. According to Chen and Tsai (2012) in order to design the coastal structures and
predict the shoreline changes, an accurate information and calculation of wave
transformation is needed. They also added that in the calculation of complex nearshore
wave transformation, the combined effect of wave shoaling, refraction, diffraction,
reflection and wave breaking should be included.
19
2.5 Cathodic Protection Attenuation Design
As for the calculation of CP potential attenuation, several formula used by various
researchers has been adapted in this research. Various researchers has come up with
their own formula based from the basic formula of CP potential from Morgan and Uhlig.
They have been come up with the new equation as to improve and modified the equation
to suit better with current conditions.
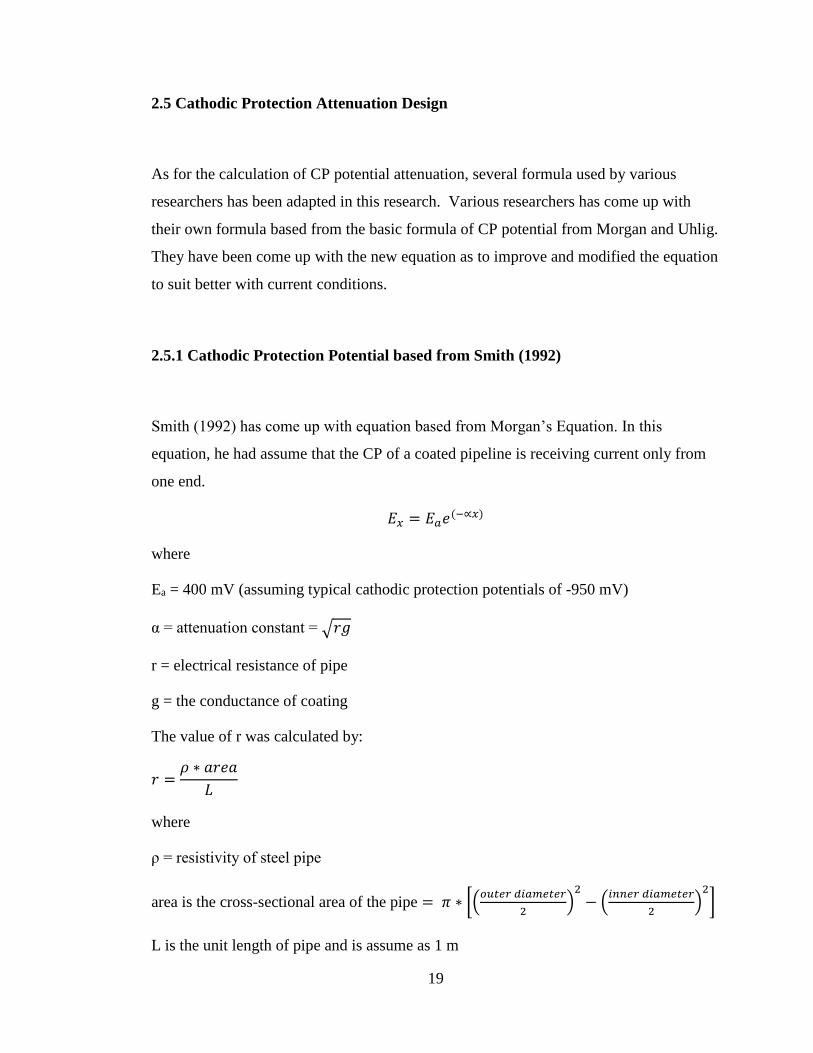
2.5.1 Cathodic Protection Potential based from Smith (1992)
Smith (1992) has come up with equation based from Morgan’s Equation. In this
equation, he had assume that the CP of a coated pipeline is receiving current only from
one end.
𝐸𝑥 = 𝐸𝑎𝑒(−∝𝑥)
where
Ea = 400 mV (assuming typical cathodic protection potentials of -950 mV)
α = attenuation constant = √𝑟𝑔
r = electrical resistance of pipe
g = the conductance of coating
The value of r was calculated by:
𝑟 =𝜌 ∗ 𝑎𝑟𝑒𝑎
𝐿
where
ρ = resistivity of steel pipe
area is the cross-sectional area of the pipe = 𝜋 ∗ [(𝑜𝑢𝑡𝑒𝑟 𝑑𝑖𝑎𝑚𝑒𝑡𝑒𝑟
2)
2
− (𝑖𝑛𝑛𝑒𝑟 𝑑𝑖𝑎𝑚𝑒𝑡𝑒𝑟
2)
2
]
L is the unit length of pipe and is assume as 1 m
20
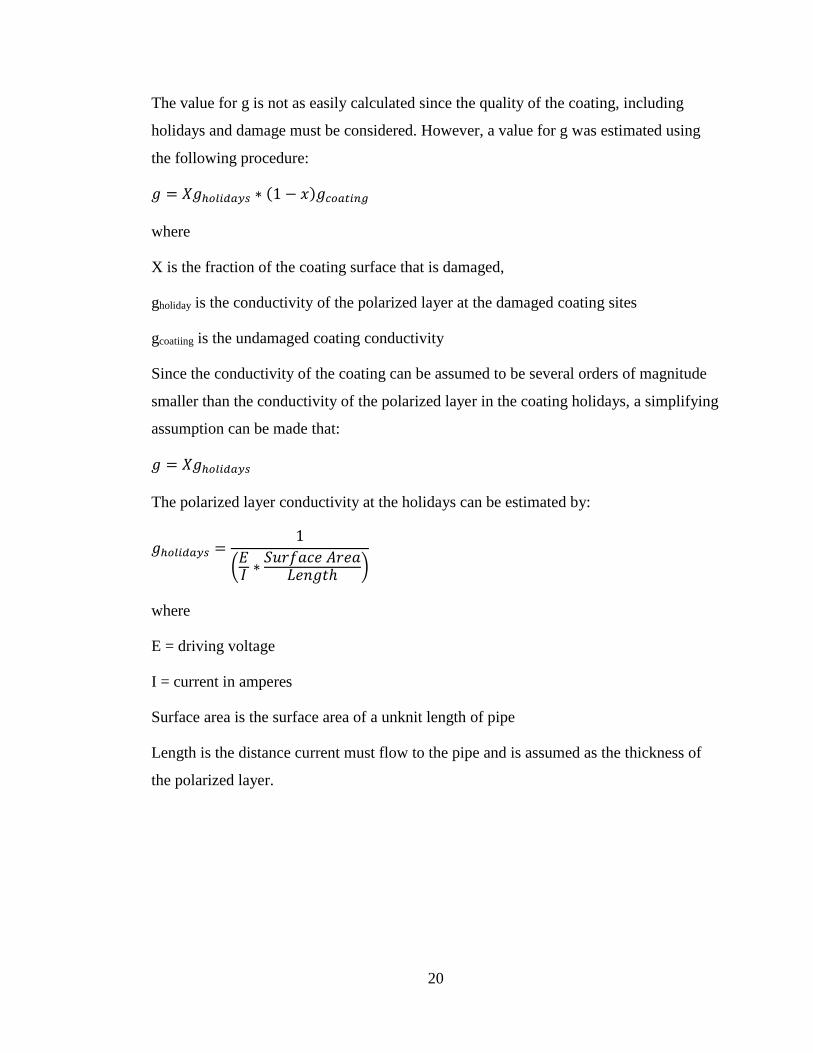
The value for g is not as easily calculated since the quality of the coating, including
holidays and damage must be considered. However, a value for g was estimated using
the following procedure:
𝑔 = 𝑋𝑔ℎ𝑜𝑙𝑖𝑑𝑎𝑦𝑠 ∗ (1 − 𝑥)𝑔𝑐𝑜𝑎𝑡𝑖𝑛𝑔
where
X is the fraction of the coating surface that is damaged,
gholiday is the conductivity of the polarized layer at the damaged coating sites
gcoatiing is the undamaged coating conductivity
Since the conductivity of the coating can be assumed to be several orders of magnitude
smaller than the conductivity of the polarized layer in the coating holidays, a simplifying
assumption can be made that:
𝑔 = 𝑋𝑔ℎ𝑜𝑙𝑖𝑑𝑎𝑦𝑠
The polarized layer conductivity at the holidays can be estimated by:
𝑔ℎ𝑜𝑙𝑖𝑑𝑎𝑦𝑠 =1
(𝐸𝐼 ∗
𝑆𝑢𝑟𝑓𝑎𝑐𝑒 𝐴𝑟𝑒𝑎𝐿𝑒𝑛𝑔𝑡ℎ
)
where
E = driving voltage
I = current in amperes
Surface area is the surface area of a unknit length of pipe
Length is the distance current must flow to the pipe and is assumed as the thickness of
the polarized layer.
21
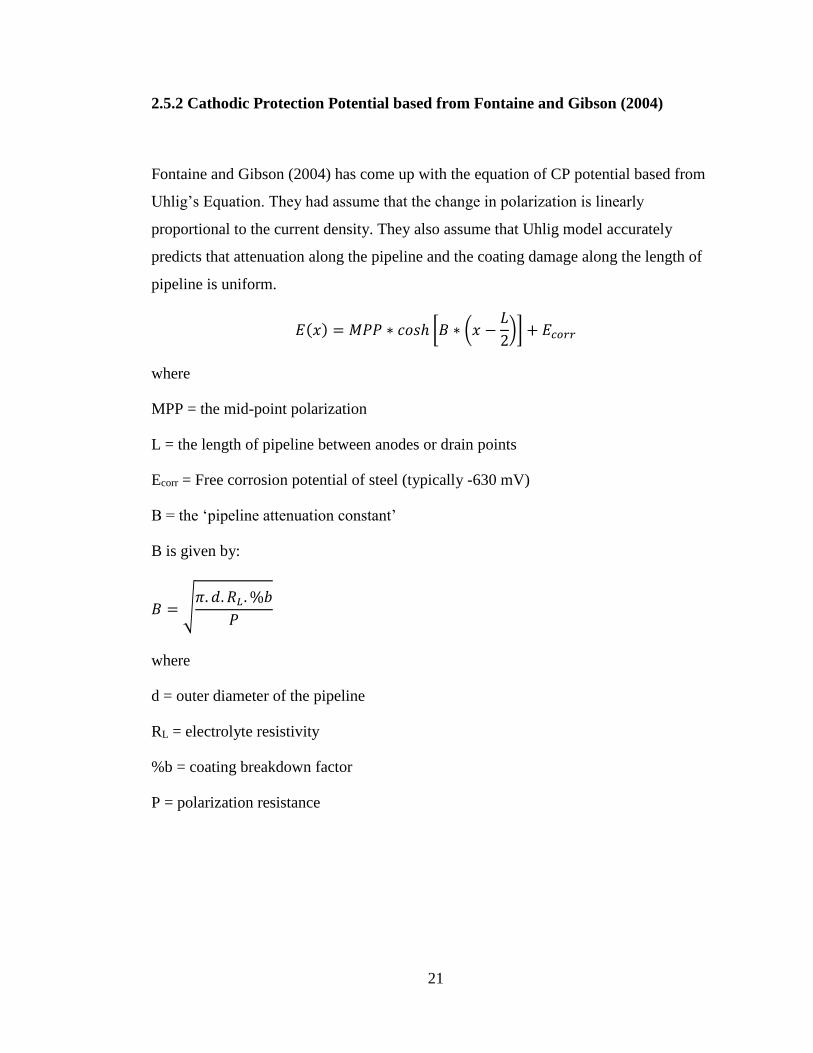
2.5.2 Cathodic Protection Potential based from Fontaine and Gibson (2004)
Fontaine and Gibson (2004) has come up with the equation of CP potential based from
Uhlig’s Equation. They had assume that the change in polarization is linearly
proportional to the current density. They also assume that Uhlig model accurately
predicts that attenuation along the pipeline and the coating damage along the length of
pipeline is uniform.
𝐸(𝑥) = 𝑀𝑃𝑃 ∗ 𝑐𝑜𝑠ℎ [𝐵 ∗ (𝑥 −𝐿
2)] + 𝐸𝑐𝑜𝑟𝑟
where
MPP = the mid-point polarization
L = the length of pipeline between anodes or drain points
Ecorr = Free corrosion potential of steel (typically -630 mV)
B = the ‘pipeline attenuation constant’
B is given by:
𝐵 = √𝜋. 𝑑. 𝑅𝐿 . %𝑏
𝑃
where
d = outer diameter of the pipeline
RL = electrolyte resistivity
%b = coating breakdown factor
P = polarization resistance
22
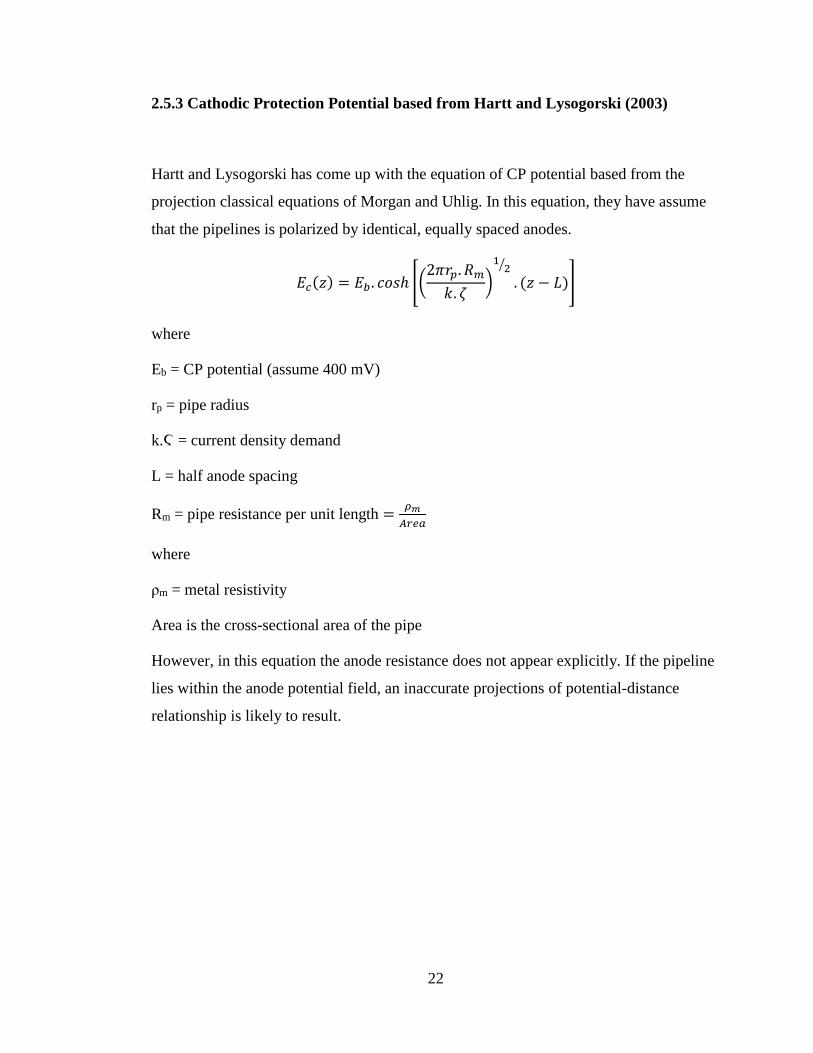
2.5.3 Cathodic Protection Potential based from Hartt and Lysogorski (2003)
Hartt and Lysogorski has come up with the equation of CP potential based from the
projection classical equations of Morgan and Uhlig. In this equation, they have assume
that the pipelines is polarized by identical, equally spaced anodes.
𝐸𝑐(𝑧) = 𝐸𝑏 . 𝑐𝑜𝑠ℎ [(2𝜋𝑟𝑝. 𝑅𝑚
𝑘. 𝜁)
12⁄
. (𝑧 − 𝐿)]
where
Eb = CP potential (assume 400 mV)
rp = pipe radius
k.Ϛ = current density demand
L = half anode spacing
Rm = pipe resistance per unit length =𝜌𝑚
𝐴𝑟𝑒𝑎
where
ρm = metal resistivity
Area is the cross-sectional area of the pipe
However, in this equation the anode resistance does not appear explicitly. If the pipeline
lies within the anode potential field, an inaccurate projections of potential-distance
relationship is likely to result.
23
2.5.4 Cathodic Protection Potential based from Hartt and Lysogorski (2003)
Hartt and Lysogorski also has come up with another equations in their research. In this
equation, they have considered a linear relation between the polarized pipe potential and
cathode current density. They also have assume that the pipeline is protected by
multiple, equally spaced, identical superimposed bracelet anode. The bracelet anode is
assume to have incorporated all four resistance which are anode electrolyte, coating,
polarization and metallic path.
𝐸𝑐(𝑧) = 𝛼. 𝛾. 𝑖𝑐(𝑧)
where
α = polarization resistance
ϒ = coating breakdown factor
ic = cathode current density
24
CHAPTER 3
METHODOLOGY and PROJECT WORK
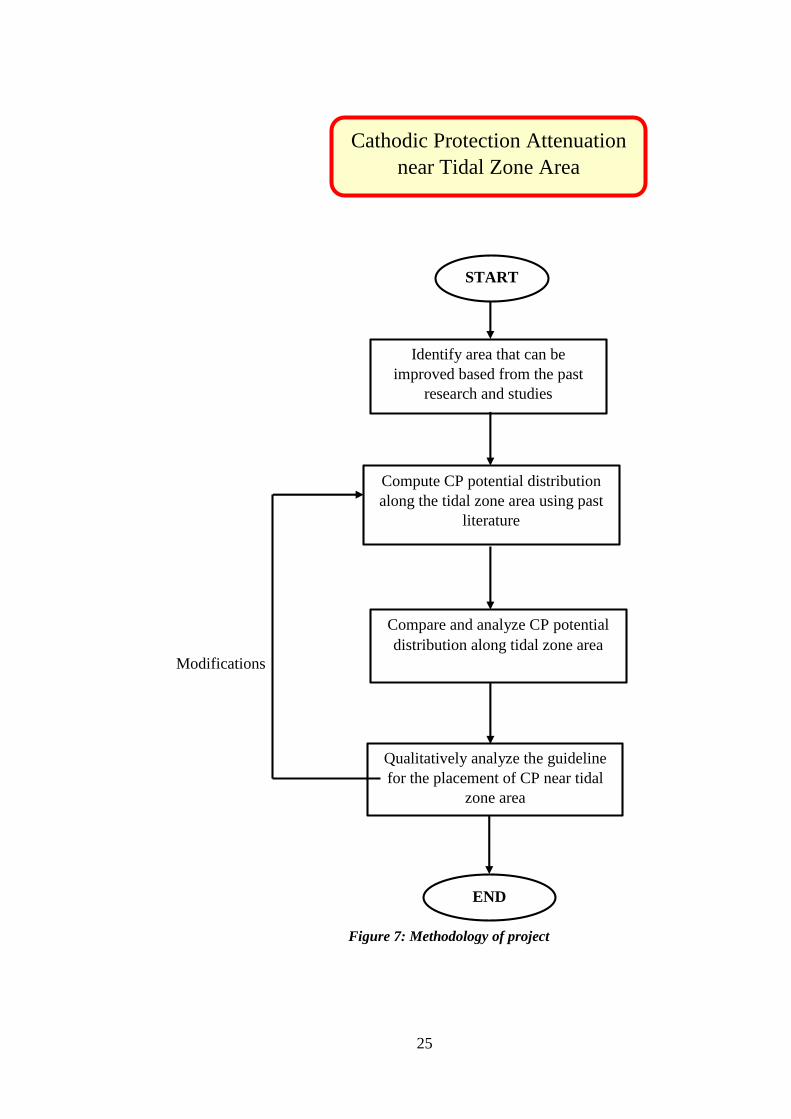
3.1 Overall Methodology
This research involves in several stages with the first stages is to study and identify
the current design and the performance of CP application. Some of the areas that can
be improved will be then identified and being put into consideration as the base
hypothesis for this research. Then, the CP potential near tidal zone area will be
computing. In this stage, several equations and formulas from various researchers
will be used. The design parameters used by PETRONAS PMO will be adapted into
all the equations. After that, the results from all the calculation will be compared and
analyze qualitatively in order to find out the guideline for the placement of CP near
tidal zone area. Figure below shows the simplified of project’s methodology.
25
Cathodic Protection Attenuation
near Tidal Zone Area
Compare and analyze CP potential
distribution along tidal zone area
Identify area that can be
improved based from the past
research and studies
START
Compute CP potential distribution
along the tidal zone area using past
literature
END
Qualitatively analyze the guideline
for the placement of CP near tidal
zone area
Modifications
Figure 7: Methodology of project
26
3.2 Detailed Methodology
This research involves a qualitative analysis for the CP distribution near tidal zone
area. Further studies has to be conducted beforehand to provide a better
understanding. Therefore, the research method and activities planned are conducted
as follow.
1. Research and Literature Review.
The aim of this activity is to study about the previous research done by other
people. This is to instill some awareness and understanding of the current
situation related to this research. Method used in this activity is by collecting
and reading all journal articles, online materials, books and other source of
reading materials that are related closely to this research.
2. Computing of CP Potential Distribution.
The objective of this activity is to compute the CP potential distribution at
tidal zone area. For this activity, the CP distribution will be calculated by
using several equations used by various researchers. The design parameters
used by PETRONAS PMO will be used and adapted into all the equations
involved.
3. Result Analysis and Comparison.
The objective of this activity is to compare and analyze the result obtained
from CP potential distribution. A qualitative analysis will be done in order to
find out the best guideline for the placement of CP near tidal zone area at
shoreline.
27
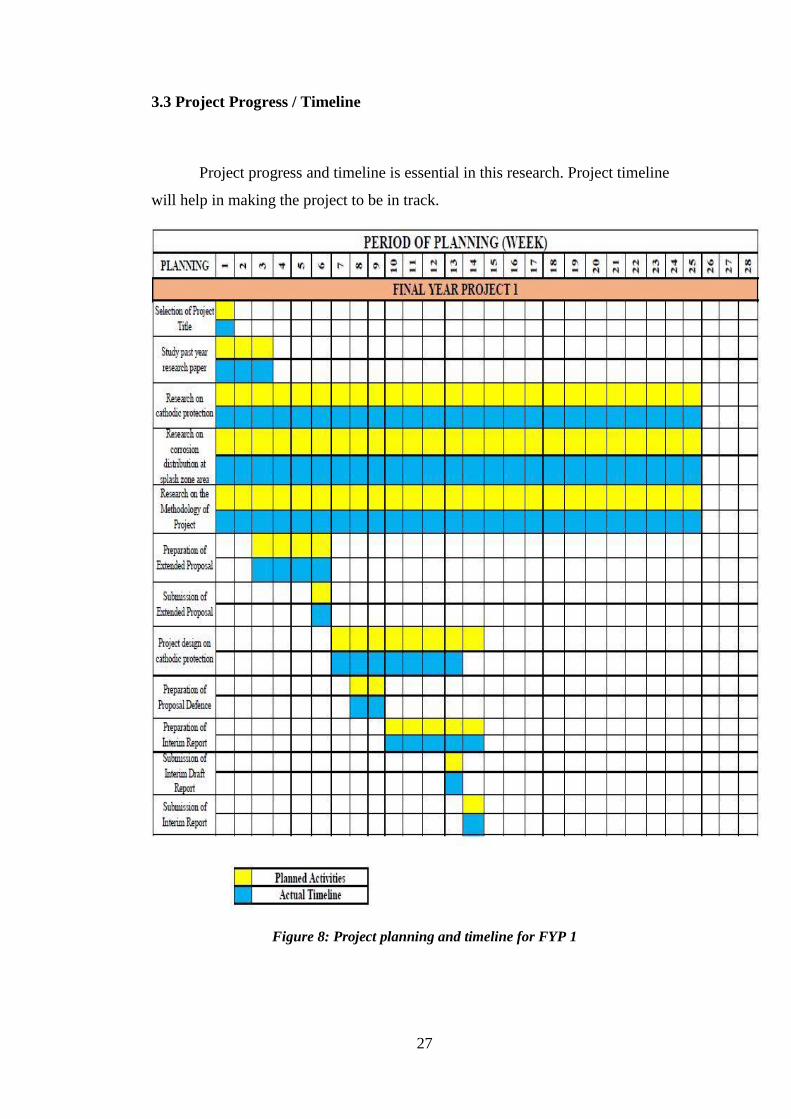
3.3 Project Progress / Timeline
Project progress and timeline is essential in this research. Project timeline
will help in making the project to be in track.
Figure 8: Project planning and timeline for FYP 1
28
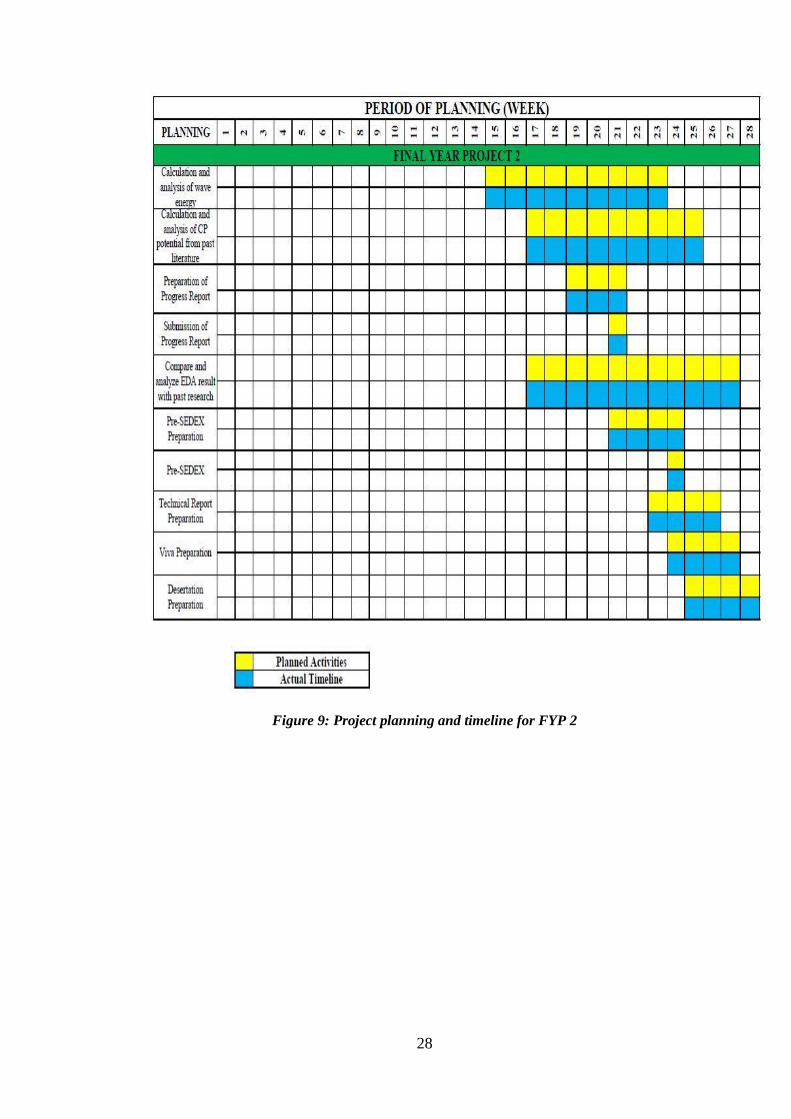
Figure 9: Project planning and timeline for FYP 2
29
CHAPTER 4
RESULTS and DISCUSSIONS
This research study is comprises of two objectives that are intended to be achieved at the
end of the study. In this section, all the results and findings will then be discussed
accordingly based from the objectives stated.
In order to find out the CP behavior at tidal zone area, the calculation of CP potential
distribution will be done. The aim of this activity is to find out the CP attenuation along
the pipeline in the tidal zone area. The calculation of CP attenuation is based from past
literatures and formula used by past researchers. Four types of equation used by various
researchers will be adapted in this calculation of CP.
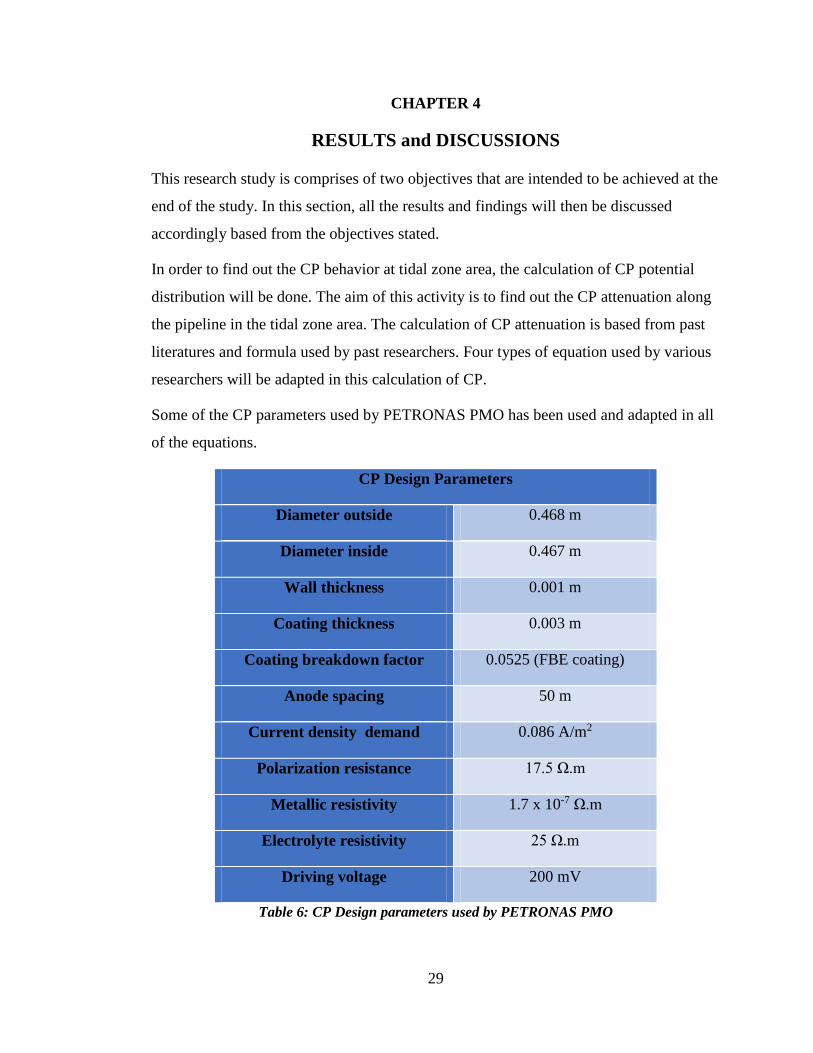
Some of the CP parameters used by PETRONAS PMO has been used and adapted in all
of the equations.
CP Design Parameters
Diameter outside 0.468 m
Diameter inside 0.467 m
Wall thickness 0.001 m
Coating thickness 0.003 m
Coating breakdown factor 0.0525 (FBE coating)
Anode spacing 50 m
Current density demand 0.086 A/m2
Polarization resistance 17.5 Ω.m
Metallic resistivity 1.7 x 10⁻⁷ Ω.m
Electrolyte resistivity 25 Ω.m
Driving voltage 200 mV
Table 6: CP Design parameters used by PETRONAS PMO
30
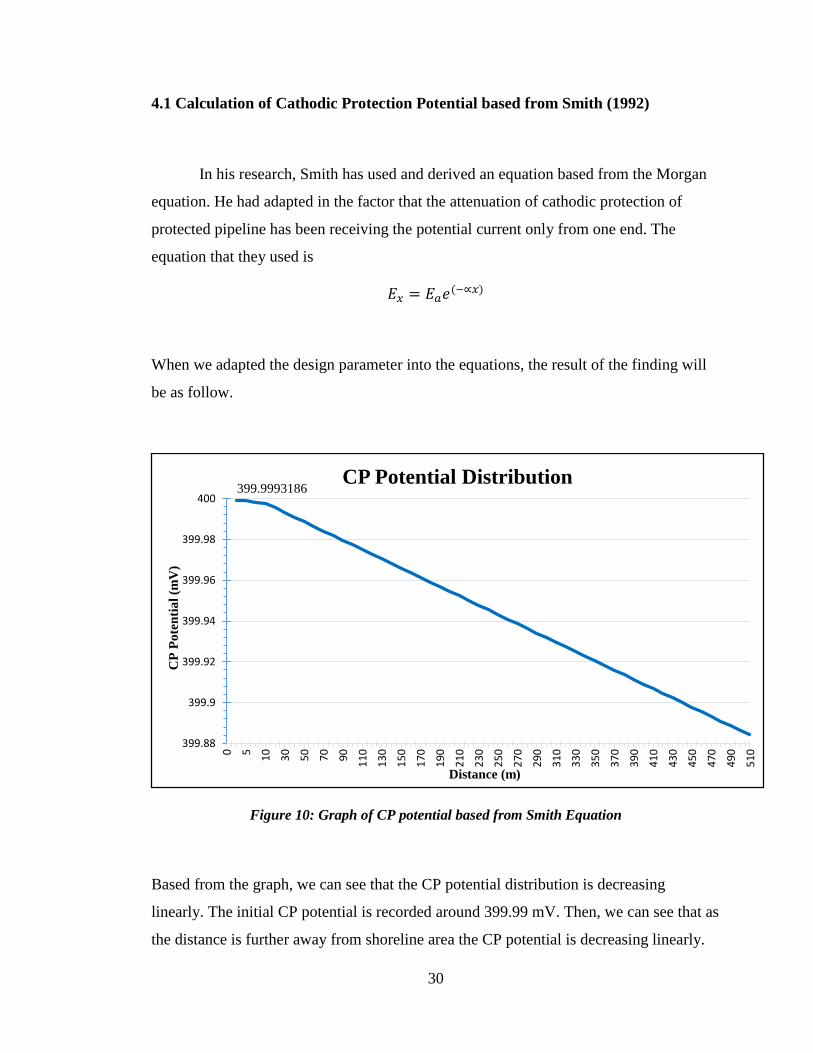
4.1 Calculation of Cathodic Protection Potential based from Smith (1992)
In his research, Smith has used and derived an equation based from the Morgan
equation. He had adapted in the factor that the attenuation of cathodic protection of
protected pipeline has been receiving the potential current only from one end. The
equation that they used is
𝐸𝑥 = 𝐸𝑎𝑒(−∝𝑥)
When we adapted the design parameter into the equations, the result of the finding will
be as follow.
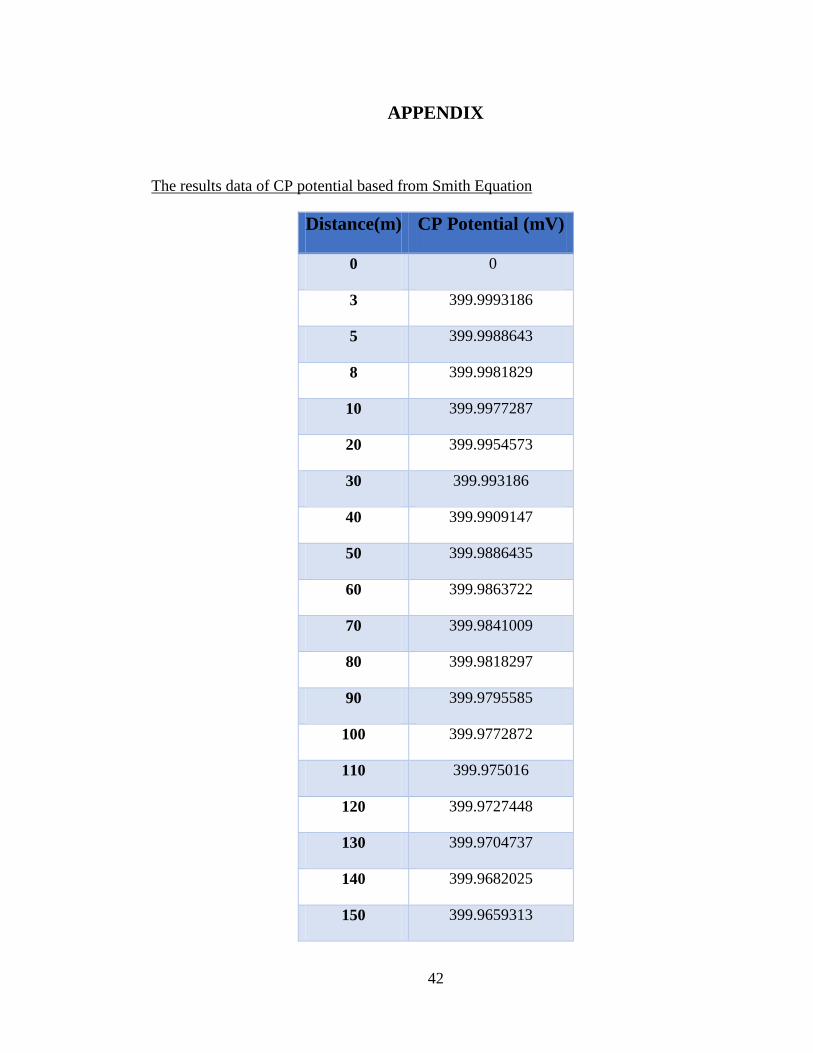
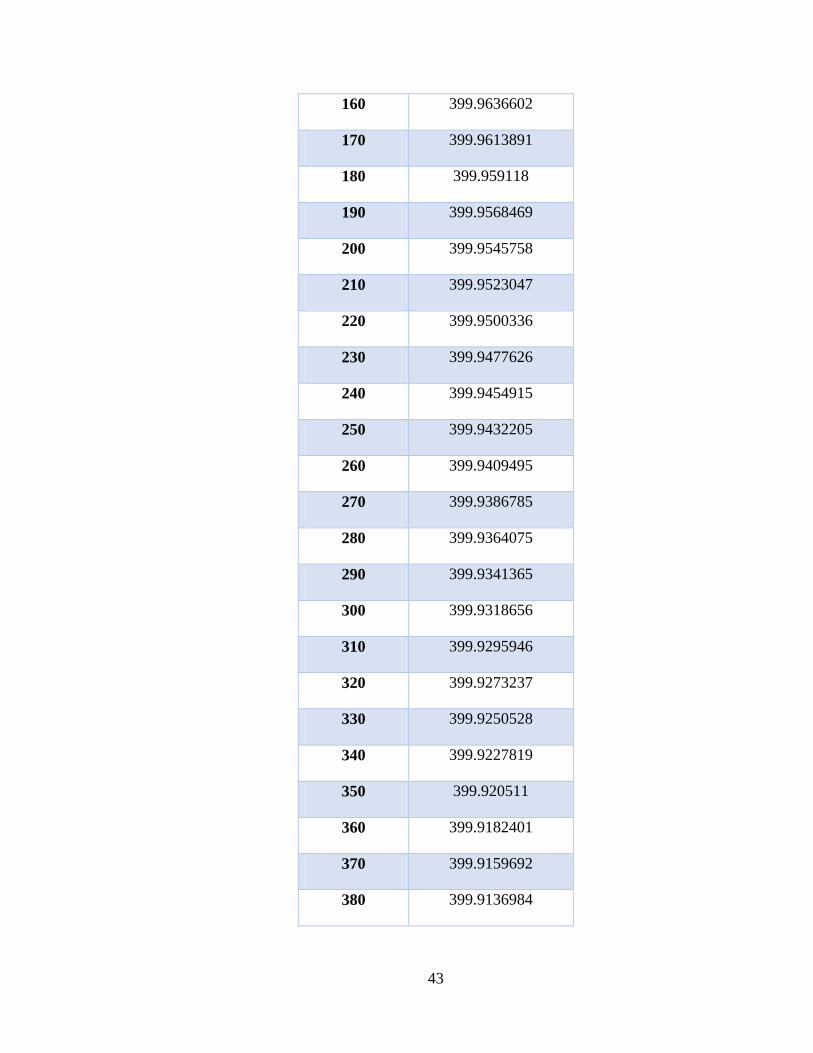
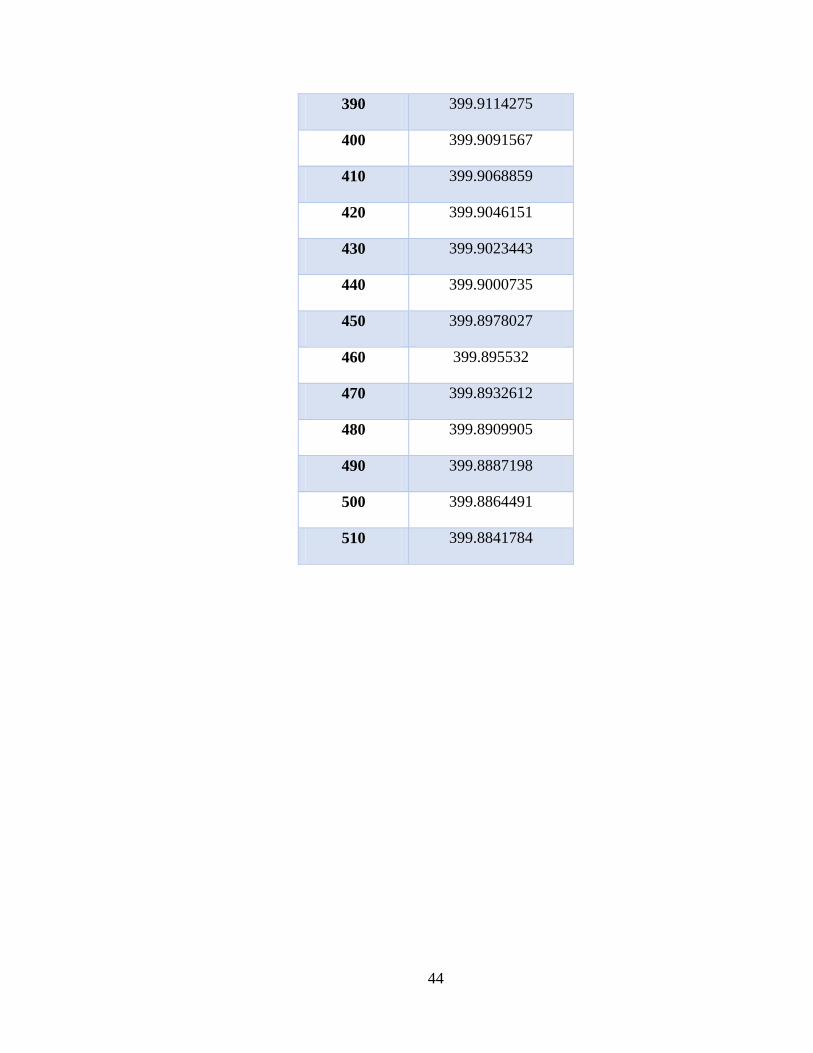
Figure 10: Graph of CP potential based from Smith Equation
Based from the graph, we can see that the CP potential distribution is decreasing
linearly. The initial CP potential is recorded around 399.99 mV. Then, we can see that as
the distance is further away from shoreline area the CP potential is decreasing linearly.
399.9993186
399.88
399.9
399.92
399.94
399.96
399.98
400
0 5
10
30
50
70
90
11
0
13
0
15
0
17
0
19
0
21
0
23
0
25
0
27
0
29
0
31
0
33
0
35
0
37
0
39
0
41
0
43
0
45
0
47
0
49
0
51
0
CP
Po
ten
tia
l (m
V)
Distance (m)
CP Potential Distribution

31
The lowest CP potential is recorded around 399.88 mV which located at 500 m away
from shoreline area. In this results, we can see that the CP potential which received the
current at its end will likely have a higher potential. As the distance is further away, the
CP potential will be decreasing in order to protect the other end of pipeline. In this
equation also, the CP near shoreline area has been receiving the potential current. This
shows that the CP near shoreline area need some ‘kick-start’ of current potential in
order for the anode to protect the pipeline in shoreline area.
32
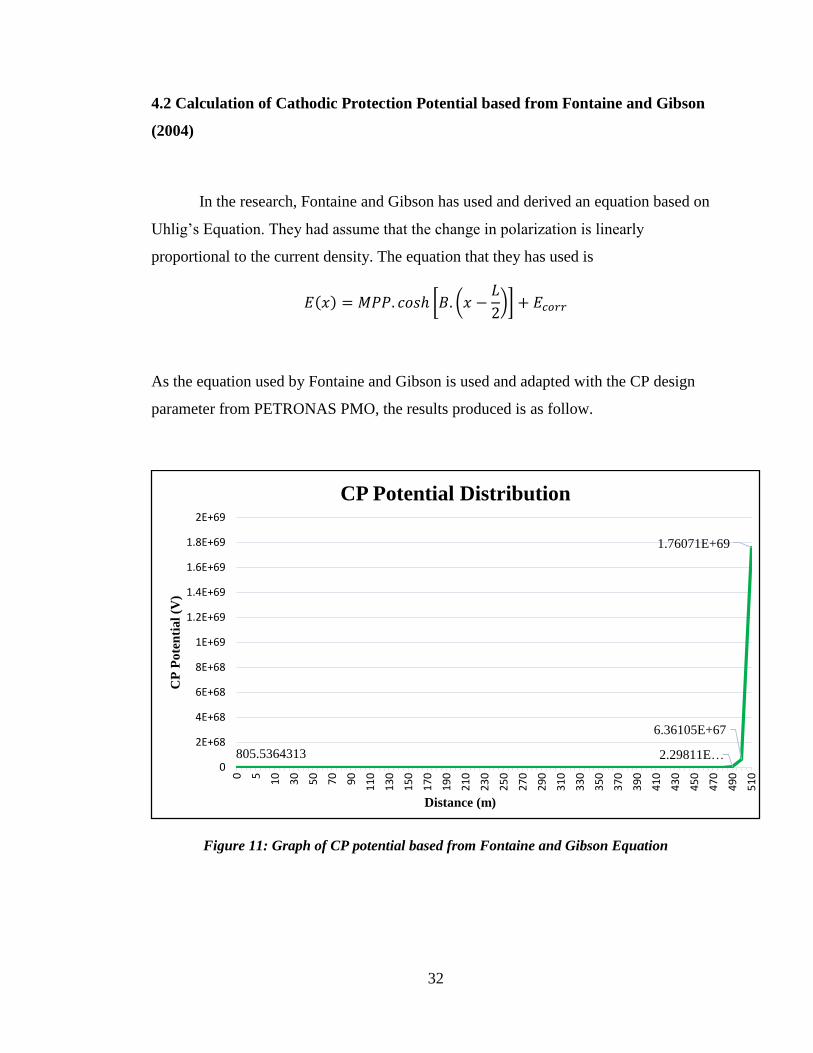
4.2 Calculation of Cathodic Protection Potential based from Fontaine and Gibson
(2004)
In the research, Fontaine and Gibson has used and derived an equation based on
Uhlig’s Equation. They had assume that the change in polarization is linearly
proportional to the current density. The equation that they has used is
𝐸(𝑥) = 𝑀𝑃𝑃. 𝑐𝑜𝑠ℎ [𝐵. (𝑥 −𝐿
2)] + 𝐸𝑐𝑜𝑟𝑟
As the equation used by Fontaine and Gibson is used and adapted with the CP design
parameter from PETRONAS PMO, the results produced is as follow.
Figure 11: Graph of CP potential based from Fontaine and Gibson Equation
805.5364313 2.29811E…
6.36105E+67
1.76071E+69
0
2E+68
4E+68
6E+68
8E+68
1E+69
1.2E+69
1.4E+69
1.6E+69
1.8E+69
2E+69
0 5
10
30
50
70
90
11
0
13
0
15
0
17
0
19
0
21
0
23
0
25
0
27
0
29
0
31
0
33
0
35
0
37
0
39
0
41
0
43
0
45
0
47
0
49
0
51
0
CP
Po
ten
tia
l (V
)
Distance (m)
CP Potential Distribution
33
Based from the graph above, we can see that the CP potential is increasing as the
distance from shoreline is further away. The initial CP potential recorded is around
805.53 V. As the distance from shoreline area is further away, the CP potential keeps on
increasing. The highest CP potential is recorded around 1.761 x 1069 which is at 510 m
away from the shoreline area.
We can see that the results based from Fontaine and Gibson equation is totally differ
from the result based from the equation used by Smith. In this equation, the CP
potential is produced naturally as compared to the Smith equation. This makes the CP
potential near shoreline area to be small when compared to CP potential based from
Smith’s Equation.
34
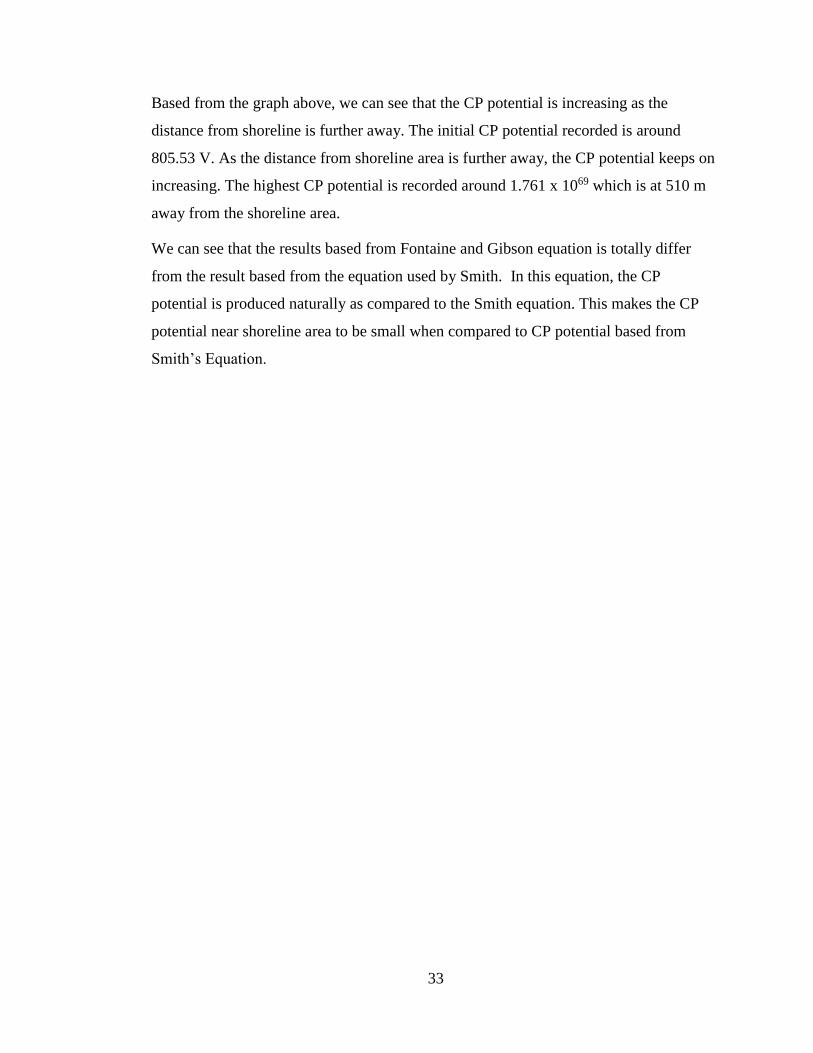
4.3 Calculation of Cathodic Protection Potential based from Hartt and Lysogorski
(2003)
In the research, Hartt and Lysogorski has calculate the potential attenuation by
using a commonly projected of the classical equations of Morgan and Uhlig. They had
assumes that the pipelines are polarized by identical, equally spaced anodes. However,
in this equation the anode resistance does not appear explicitly. If the pipeline lies within
the anode potential field, an inaccurate projections of potential-distance relationship is
likely to result. The equation that they used is
𝐸𝑐(𝑧) = 𝐸𝑏 . 𝑐𝑜𝑠ℎ [(2𝜋𝑟𝑝. 𝑅𝑚
𝑘. 𝜁)
12⁄
. (𝑧 − 𝐿)]
When we adapted the design parameter into this equation, the results is as follow.
Figure 12: Graph of CP potential based from Hartt and Lysogorski Equation
0.848302783 43602154071
2.87844E+11
3.56469E+12
0.75
4E+11
8E+11
1.2E+12
1.6E+12
2E+12
2.4E+12
2.8E+12
3.2E+12
3.6E+12
4E+12
0 5
10
30
50
70
90
11
0
13
0
15
0
17
0
19
0
21
0
23
0
25
0
27
0
29
0
31
0
33
0
35
0
37
0
39
0
41
0
43
0
45
0
47
0
49
0
51
0
CP
Po
ten
tia
l (V
)
Distance (m)
CP Potential Distribution
35
Based from the graph above, we can see that the CP potential is increasing as the
distance from the shoreline area is further away. The initial CP potential is recorded
around 0.848 V. As the distance is further away from the shoreline area, the CP potential
keep on increasing. The highest CP potential is recorded around 3.56 x 10¹² V which is
at 510 m away from shoreline area.
We can see that the CP attenuation based on this equation is much likely same with the
result from the equation by Fontaine and Gibson. The trends in CP potential from this
equation is much differ with the results obtained from the equation used by Smith. The
CP potential for this equation also is produced naturally. This has made the CP potential
near shoreline area to be small as compared to the CP potential that is further away from
shoreline area.
36
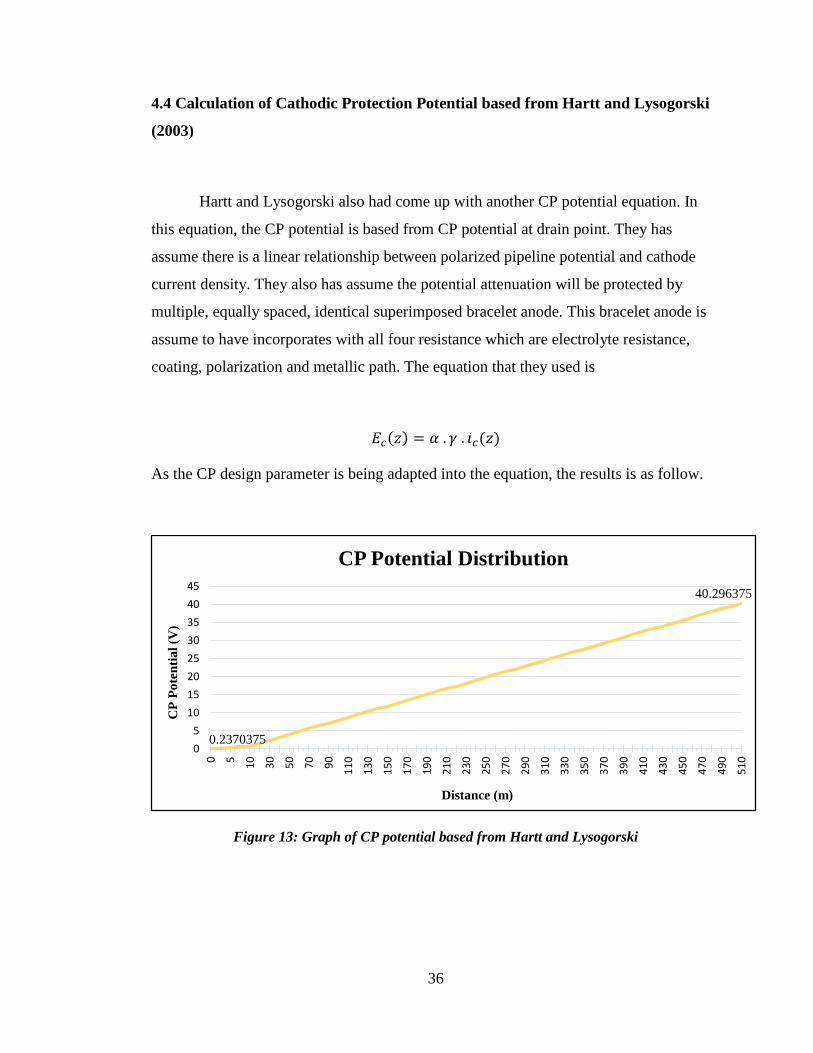
4.4 Calculation of Cathodic Protection Potential based from Hartt and Lysogorski
(2003)
Hartt and Lysogorski also had come up with another CP potential equation. In
this equation, the CP potential is based from CP potential at drain point. They has
assume there is a linear relationship between polarized pipeline potential and cathode
current density. They also has assume the potential attenuation will be protected by
multiple, equally spaced, identical superimposed bracelet anode. This bracelet anode is
assume to have incorporates with all four resistance which are electrolyte resistance,
coating, polarization and metallic path. The equation that they used is
𝐸𝑐(𝑧) = 𝛼 . 𝛾 . 𝑖𝑐(𝑧)
As the CP design parameter is being adapted into the equation, the results is as follow.
Figure 13: Graph of CP potential based from Hartt and Lysogorski
0.2370375
40.296375
0
5
10
15
20
25
30
35
40
45
0 5
10
30
50
70
90
11
0
13
0
15
0
17
0
19
0
21
0
23
0
25
0
27
0
29
0
31
0
33
0
35
0
37
0
39
0
41
0
43
0
45
0
47
0
49
0
51
0
CP
Po
ten
tia
l (V
)
Distance (m)
CP Potential Distribution
37
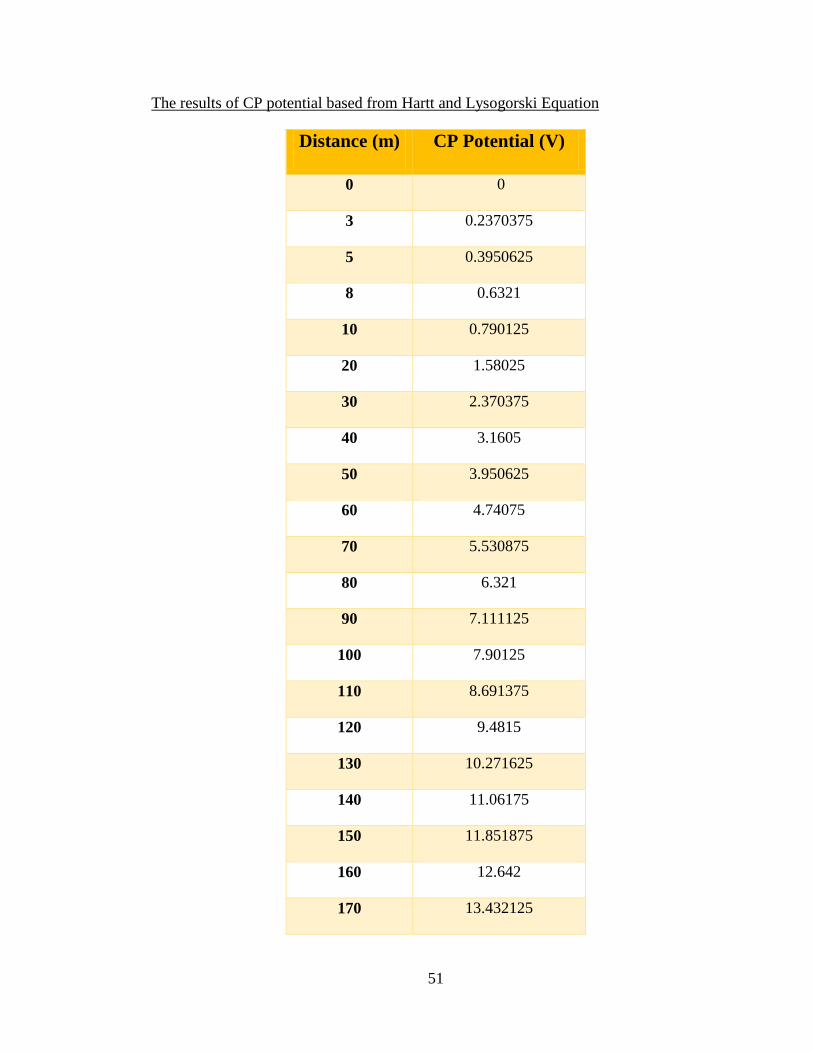
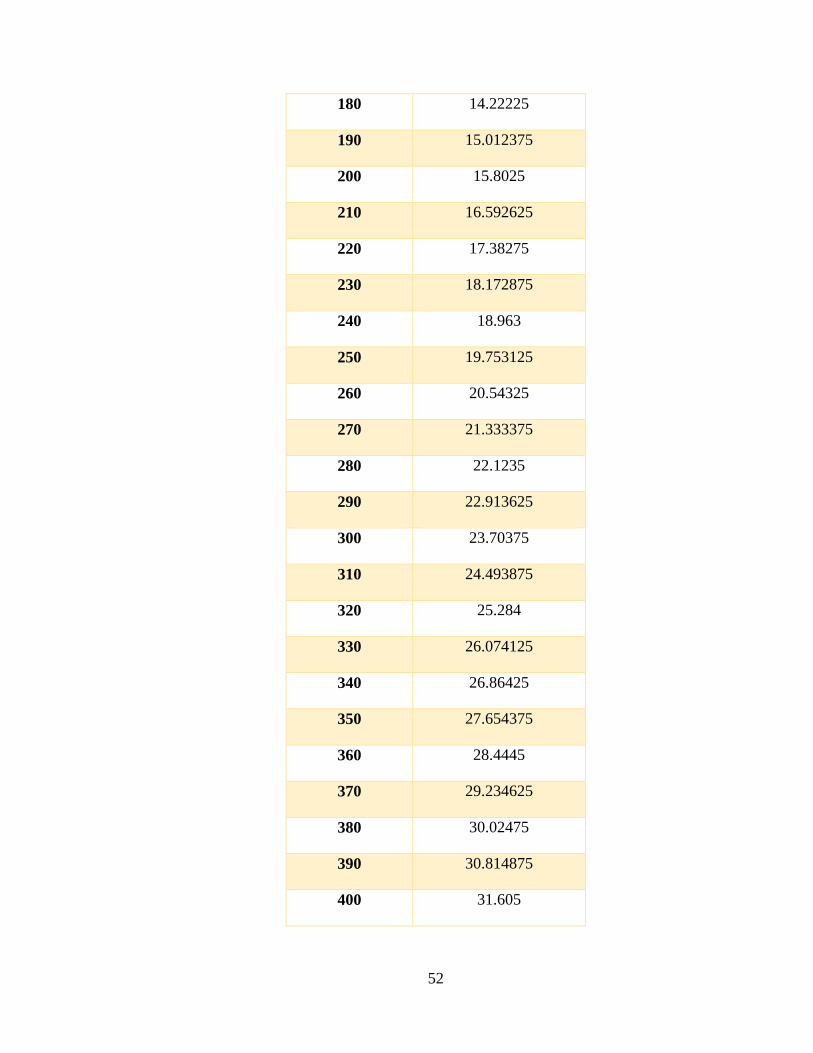
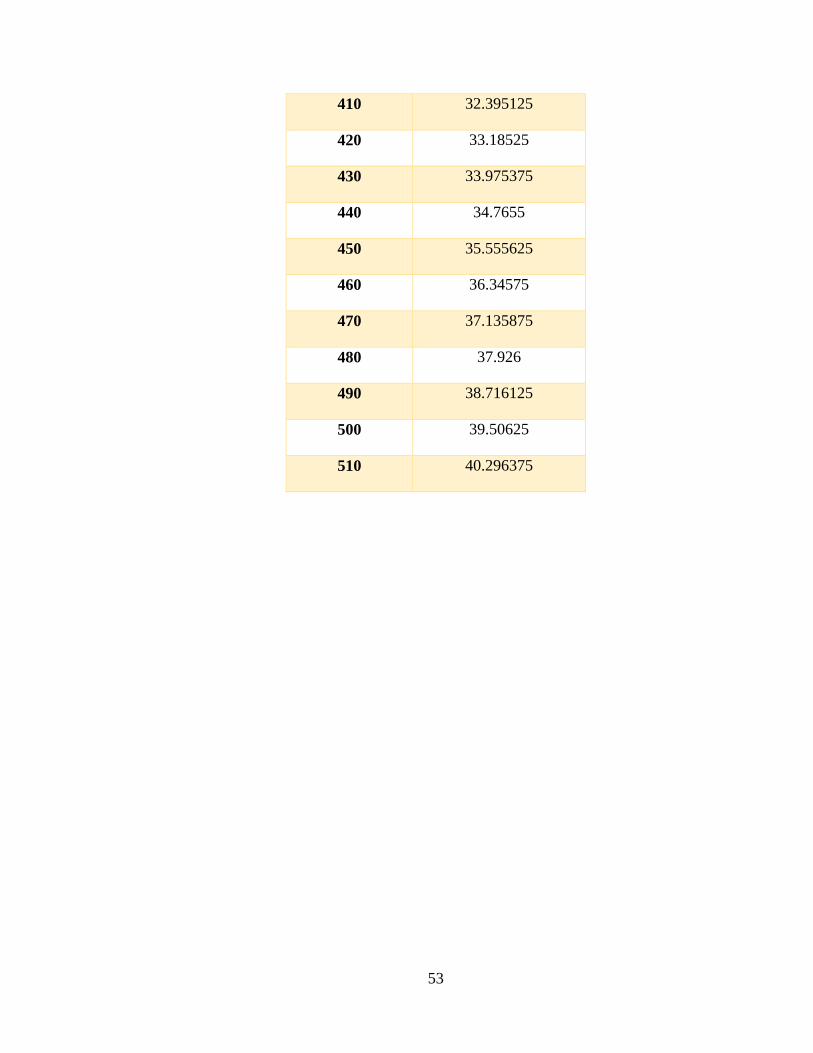
Based from the graph above, we can see that the CP potential is increasing as the
distance from shoreline is further away. The initial CP potential is recorded around
0.237 V. As the distance is further away from shoreline area, the CP potential is
increasing linearly. The highest CP potential is recorded around 40.296 V which located
around 500 m away from the shoreline area.
We can see that the CP potential recorded when using this equation has the same trends
with the other two results. The trends of result shows by this equation is differ when
compare with the results from Smith equation.
Based from these four equations, we can see that the trends of CP potential for every
equation is much likely same. They will have a lower CP potential when approaching
the shoreline area. As the distance is further away from shoreline area, they will have the
highest CP potential. Apart from the results based from the Smith Equation, the CP
potential for all other equations shows the same trends.
From the results, the CP potential near shoreline area is at the lowest potential when
compared to the potential which is further away from shoreline area. This is likely
because in shoreline area the movement of wave is always irregular and unpredictable.
Pipeline which lays near shoreline area will always experiencing wet and dry condition
due to the movement off the waves from the sea.
Sacrificial anode is usually effective when there is a stable electrolyte around the
metalwork and have a direct contact with the electrolyte. This is because the presence of
seawater as electrolyte will help greatly in the movement of electrons to occur. When
there is no stable movement of electron, the sacrificial anode will not work properly and
effectively. If a stable seawater film can be formed on the surface of protected structure,
then the sacrificial anode will be able to be used in order to protect the parent metal near
tidal zone area.
38
CHAPTER 5
CONCLUSIONS
In conclusion, this research is mainly about the study and analysis of cathodic
protection (CP) attenuation along the pipeline near tidal zone area. The calculation for
CP potential distribution is done by using various equations by various researchers.
While it is yet to be conclusively proven, based from the results of CP potential
calculation, most of them shows that the CP potential near shoreline area will have small
potential. From the qualitative analysis of CP potential distribution, it shows that CP
potential near shoreline area that having small CP is likely due to the wave activity at
shoreline area. As we know, wave activity at tidal zones are very irregular and
unpredictable. Sacrificial anode need a stable electrolyte to function effectively. The
movement of wave activity will make tidal area to have less presence of stable seawater.
This makes sacrificial anode not suited to be installed at tidal zone due to the absence of
stable electrolyte.
Recommendation for future works:
1. Apply thicker coating protection at tidal zone area – Based from this
research, so far it is advisable for the industry to coat their pipeline with a
thicker coating protection since sacrificial anode seems not to function
effectively in the tidal zone area.
2. On-site investigation for future works – For future studies about this
research, it is advisable that the research to be done more towards on-site
investigation. This will help in producing more precise and reliable
results as we can observe the behavior and dissipation of cathodic
protection at tidal zone area more closely rather than analyzed it
qualitatively.
39
REFERENCES
Bardal, E. (2004). Corrosion and Protection. Springer, 204.
Bushman, J. (n.d.). Theory of Corrosion and Cathodic Protection. Bushman &
Associates.
Chen, H.-B., & Tsai, C.-P. (2012). Computations of nearshore wave transformationn
using finite-volume method. Taiwan: Elsevier Ltd.
Chen, J., Huang, Y., & Dong, X. (2012). Study on the Splash Zone Corrosion Protection
of Carbon Steel by Sacrificial Anode. China: International Journal of
Electrochemical Science.
Creamer, E. (1970). Splash Zone Protection of Marine Structures. (p. Paper No. 1274).
Houston, Texas: Offshore Technology Conference.
Fontana, M. G. (1986). Corrosion Engineering (Third ed.). Mc Graw Hill.
Guo, D. B., Song, D. S., Chacko, J., & Ghalambor, D. A. (2005). Offshore Pipeline.
Oxford, United Kingdom: Elsevier.
Hartt, W. H., & Lysogorski, D. K. (2003). A Potential Attenuation Equation for Design
and Analysis of Cathodic Protection Systems with Displaced Anodes. Corrosion
Conference. Paper No. 3197. Texas: NACE International.
Jeffrey, R., & Melchers, R. E. (2009, June 17). Corrosion of vertical mild steel strips in
seawater. Corrosion Science, 2291-2297.
Kaesche, H. (2003). Corrosion of Metals, Physiochemical Principles and Current
Problem. Springer.
La Fontaine, J. P., & Gibson, G. (2004). Cathodic Protection Design of Pipelines using
an Improved Attenuation Model. Corrosion Cenference. Paper No. 4091. Texas:
NACE International.
40
Lei Zhang, Y. D. (2012). Study on Cathodic Protection of Submarine Pipeline in Deep-
water Environment. NACE International Corrosion Conference & Expo. Texas:
NACE International.
Lye, R. E. (2001). Splash Zone Protection; A Norwegian Operator's View. NACE
International Corrosion Conference. Texas: NACE International.
Mohamed Ahmed M. Khalil, A. M.-G. (2014). Extension of Cathodic Protection effect
to Steel Piles at Tidal and Splash Zone. NACE International Corrosion
Conference. San Antonio, Texas: NACE International.
P. Kaplan, J. M. (1995). Theoretical analysis of wave impact forces on platform deck
structures. 1-A, pp. 189-198.
Reeve, D., Chadwick, A., & Fleming, C. (2012). Coastal Enginnering : Processes,
Theory and Design Practice (Second Edition ed.). Milton Park, Abingdon, Oxon:
Spon Press.
Refait, P., Jeannin, M., Sabot, R., Antony, H., & Pineau, S. (2014, October 30).
Corrosion and cathodic protection of carbon steel in tidal zone: Product,
mechanisms and kinetics. Corrosion Sciece, 375-382.
Saberi, G., Allahyarzadeh, M., Zendehdel, N., Dehghan, P., Ahdeno, F., & Kavid, J.
(2014, December 2). A new approach on troubleshooting of cathodic protection :
A case study. (Elsevier, Ed.) Journal of Loss Prevention in the Process
Industries, 124-128.
Smith, S. N. (1992). Analysis of Cathodic Protection on An Underprotected Offshore
Pipeline. NACE Annual Conference and Corrosion Show (p. Paper No. 429).
Houston, Texas: NACE.
Yin, Y. S., Huang, X., & Dong, L. H. (2008). Materias for Ocean Engineering. Beijing:
Science Press.
Zen, K. (2005, June 13). Corrosion and life cycle management of port structures.
Corrosion Science, 2353-2360.

41
Zhao, W.-m., Wang, Y., Liu, C., Dong, L.-x., & Ai, Y. H. (2010, September 15).
Erosion-corrosion of thermally sprayed coatings in simulated splash zone.
Surface & Coatings Technology, 2267-2272.
42
APPENDIX
The results data of CP potential based from Smith Equation
Distance(m) CP Potential (mV)
0 0
3 399.9993186
5 399.9988643
8 399.9981829
10 399.9977287
20 399.9954573
30 399.993186
40 399.9909147
50 399.9886435
60 399.9863722
70 399.9841009
80 399.9818297
90 399.9795585
100 399.9772872
110 399.975016
120 399.9727448
130 399.9704737
140 399.9682025
150 399.9659313
43
160 399.9636602
170 399.9613891
180 399.959118
190 399.9568469
200 399.9545758
210 399.9523047
220 399.9500336
230 399.9477626
240 399.9454915
250 399.9432205
260 399.9409495
270 399.9386785
280 399.9364075
290 399.9341365
300 399.9318656
310 399.9295946
320 399.9273237
330 399.9250528
340 399.9227819
350 399.920511
360 399.9182401
370 399.9159692
380 399.9136984
44
390 399.9114275
400 399.9091567
410 399.9068859
420 399.9046151
430 399.9023443
440 399.9000735
450 399.8978027
460 399.895532
470 399.8932612
480 399.8909905
490 399.8887198
500 399.8864491
510 399.8841784
45
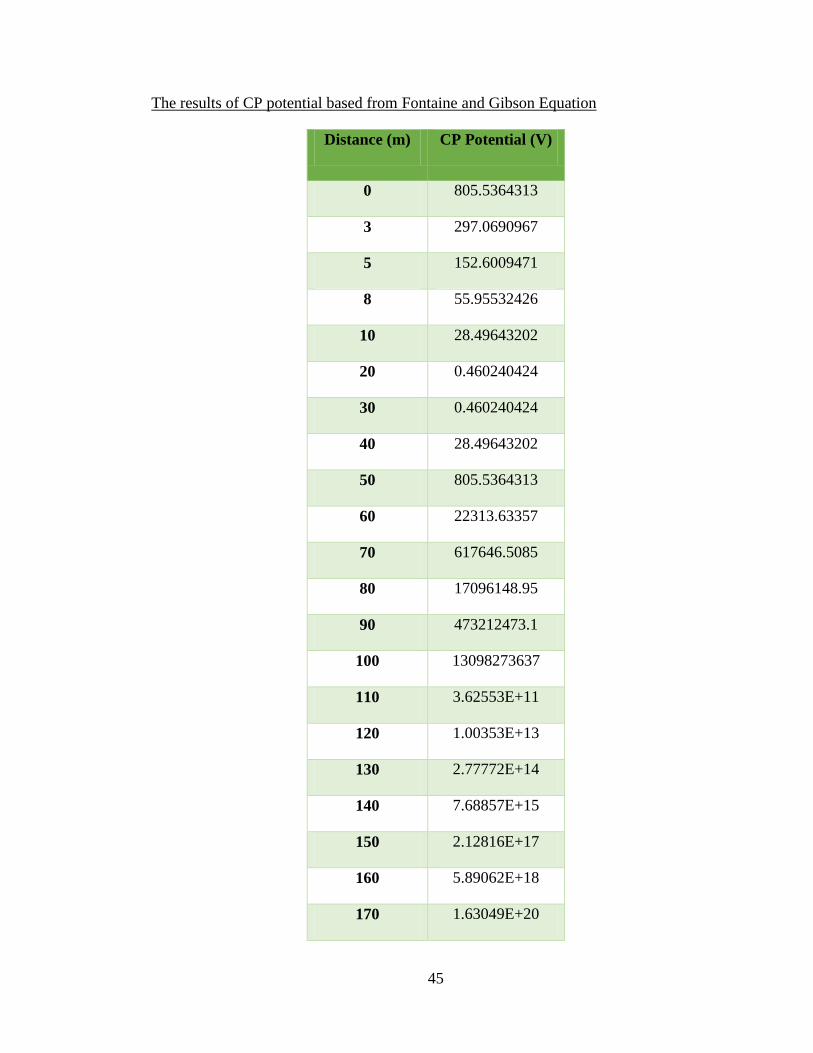
The results of CP potential based from Fontaine and Gibson Equation
Distance (m) CP Potential (V)
0 805.5364313
3 297.0690967
5 152.6009471
8 55.95532426
10 28.49643202
20 0.460240424
30 0.460240424
40 28.49643202
50 805.5364313
60 22313.63357
70 617646.5085
80 17096148.95
90 473212473.1
100 13098273637
110 3.62553E+11
120 1.00353E+13
130 2.77772E+14
140 7.68857E+15
150 2.12816E+17
160 5.89062E+18
170 1.63049E+20
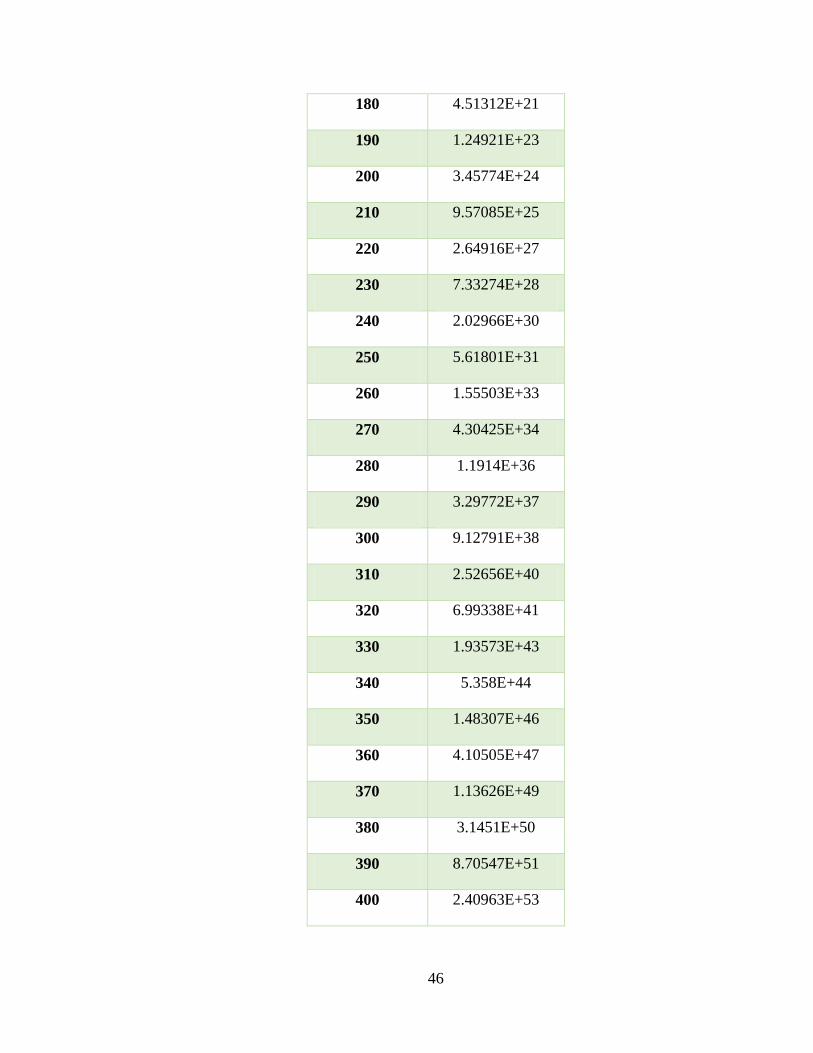
46
180 4.51312E+21
190 1.24921E+23
200 3.45774E+24
210 9.57085E+25
220 2.64916E+27
230 7.33274E+28
240 2.02966E+30
250 5.61801E+31
260 1.55503E+33
270 4.30425E+34
280 1.1914E+36
290 3.29772E+37
300 9.12791E+38
310 2.52656E+40
320 6.99338E+41
330 1.93573E+43
340 5.358E+44
350 1.48307E+46
360 4.10505E+47
370 1.13626E+49
380 3.1451E+50
390 8.70547E+51
400 2.40963E+53
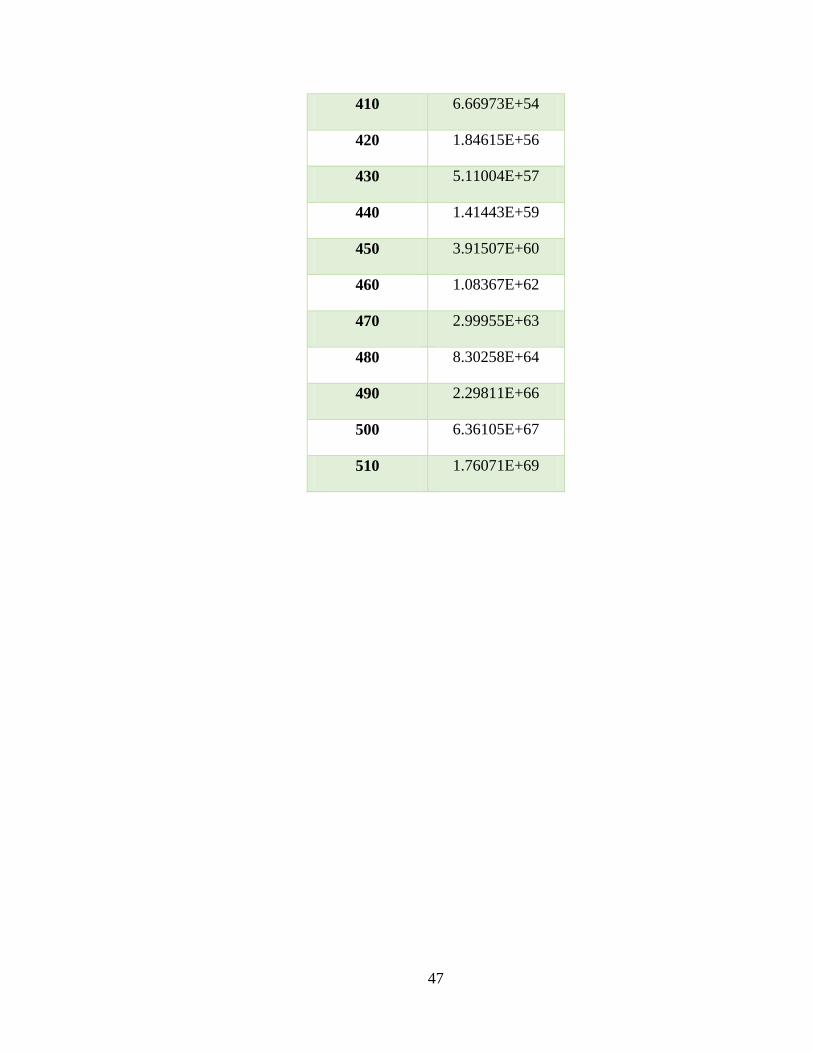
47
410 6.66973E+54
420 1.84615E+56
430 5.11004E+57
440 1.41443E+59
450 3.91507E+60
460 1.08367E+62
470 2.99955E+63
480 8.30258E+64
490 2.29811E+66
500 6.36105E+67
510 1.76071E+69
48
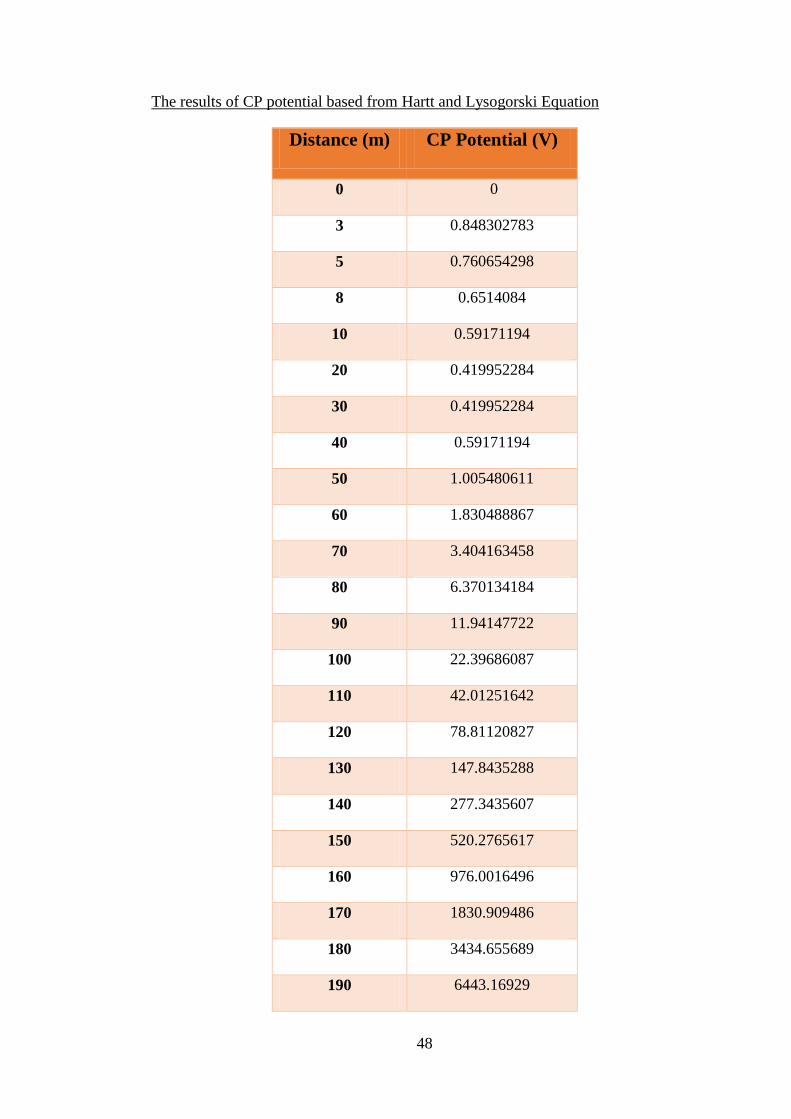
The results of CP potential based from Hartt and Lysogorski Equation
Distance (m) CP Potential (V)
0 0
3 0.848302783
5 0.760654298
8 0.6514084
10 0.59171194
20 0.419952284
30 0.419952284
40 0.59171194
50 1.005480611
60 1.830488867
70 3.404163458
80 6.370134184
90 11.94147722
100 22.39686087
110 42.01251642
120 78.81120827
130 147.8435288
140 277.3435607
150 520.2765617
160 976.0016496
170 1830.909486
180 3434.655689
190 6443.16929
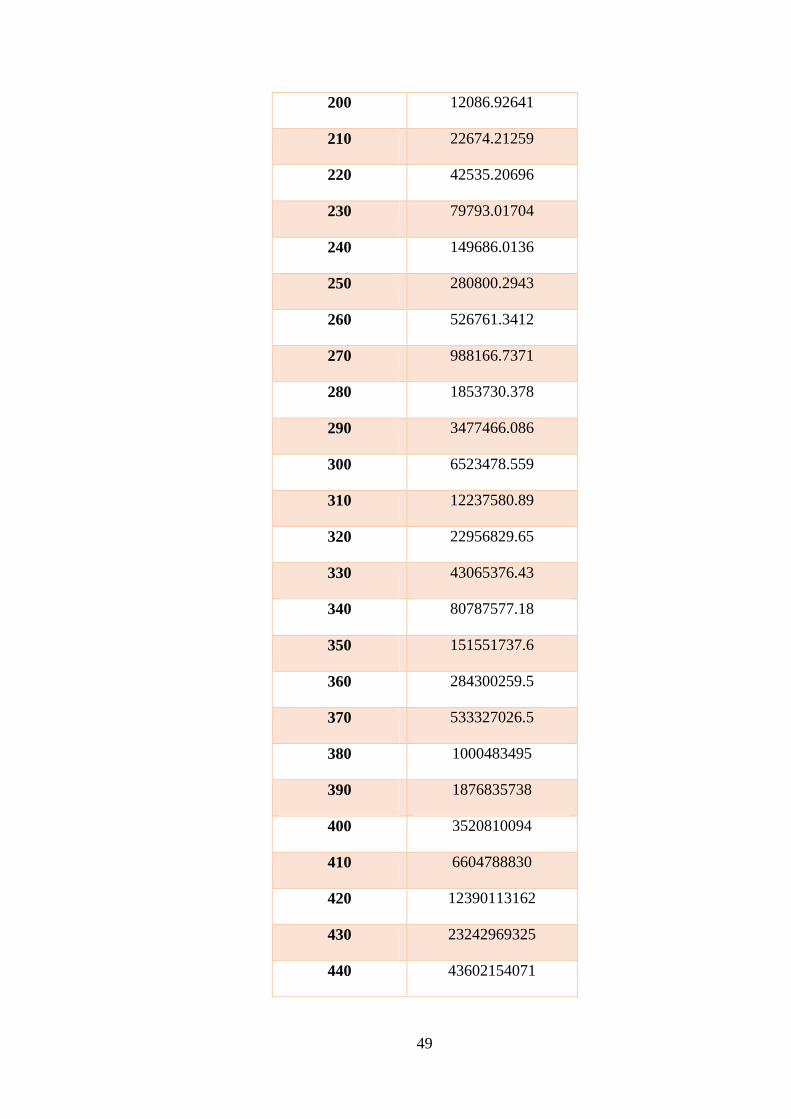
49
200 12086.92641
210 22674.21259
220 42535.20696
230 79793.01704
240 149686.0136
250 280800.2943
260 526761.3412
270 988166.7371
280 1853730.378
290 3477466.086
300 6523478.559
310 12237580.89
320 22956829.65
330 43065376.43
340 80787577.18
350 151551737.6
360 284300259.5
370 533327026.5
380 1000483495
390 1876835738
400 3520810094
410 6604788830
420 12390113162
430 23242969325
440 43602154071

50
450 81794533779
460 1.53441E+11
470 2.87844E+11
480 5.39975E+11
490 1.01295E+12
500 1.90023E+12
510 3.56469E+12
51
The results of CP potential based from Hartt and Lysogorski Equation
Distance (m) CP Potential (V)
0 0
3 0.2370375
5 0.3950625
8 0.6321
10 0.790125
20 1.58025
30 2.370375
40 3.1605
50 3.950625
60 4.74075
70 5.530875
80 6.321
90 7.111125
100 7.90125
110 8.691375
120 9.4815
130 10.271625
140 11.06175
150 11.851875
160 12.642
170 13.432125
52
180 14.22225
190 15.012375
200 15.8025
210 16.592625
220 17.38275
230 18.172875
240 18.963
250 19.753125
260 20.54325
270 21.333375
280 22.1235
290 22.913625
300 23.70375
310 24.493875
320 25.284
330 26.074125
340 26.86425
350 27.654375
360 28.4445
370 29.234625
380 30.02475
390 30.814875
400 31.605
53
410 32.395125
420 33.18525
430 33.975375
440 34.7655
450 35.555625
460 36.34575
470 37.135875
480 37.926
490 38.716125
500 39.50625
510 40.296375