Embed Size (px)
Citation preview
Bundesanstalt für Materialforshung und -prüfung (BAM)
Climatic Stability of Polymer Optical Fibers (POF)
Dissertation zur Erlangung des akademischen Grades
"doctor rerum naturalium" (Dr. rer. nat.)
in der Wissenschaftsdisziplin "Physikalische Chemie"
eingereicht an der Mathematisch-Naturwissenschaftlichen Fakultät
der Universität Potsdam
von Anilkumar Appajaiah
Potsdam, den 16 August 2004
Acknowledgments I am beholden to the ‘Federal Institute for Materials Research and Testing (BAM)’ and the ‘University of Potsdam’ (both of in Germany) for creating me an opportunity to carry out my dissertation. With a sense of profound gratitude I would like to express my heartfelt thanks to Prof. W. Daum and Dr. W. Czepluch of BAM for their inspiration, support, advice, encouragement, recommendations and fruitful guidance in bringing out this project to a successful end. I would like to express my sincere gratefulness to Prof. H-G. Löhmannsröben of the university of Potsdam and Prof. H. Poisel of the university of Applied Sciences, Nürnberg, as reviewers of my work. Also for their guidance, cooperation and advice in improving the thesis. I like to express my deep gratitude to Dr. H.G. Kretzschmar and Dr. V. Wachtendorf of BAM for their constant support in setting-up of the experimental work and precious discussion of the results particularly of infrared and chemiluminescence measurements. I am very thankful to all other colleagues of the ‘Department of Measurements and Testing Technology; Sensors (BAM-S.1)’ for their nice cooperation. Especially I want to express many thanks to my laboratory colleagues: Dr. Witt, Dr. Döring, Mr. Kadoke, Mr. Jankowski, Mr. Gründer, Mr. Hammer, Mr. Günther, Mr. Otto and Dr. Steckert for their general assistance, cooperation and their kindness, which all made a pleasant environment during the completion of my dissertation. I am very grateful to co-workers of the ‘Department of Performance of Polymeric Materials (BAM-VI)’ especially to Mrs. Klein, Mrs. Bistritz, Mrs. Bertus, Mr. Neubert and Mrs. Dr. Krüger for their collaboration and assistance in carrying out the measurements. I would like to express my gratitude to Indian colleagues: Prof. Selvarajan, Dr. Srinivas and Dr. Siddaramaiah for their constant encouragement and discussion in doing this dissertation work. My thanks also to Indian friends: Mr. Murthy, Mr. Jeevananda, Mr. Mahaveer, Mr. Prasanna, Mr. Lawrence and others who extended their friendship, even across the distances, filled me with pleasure. I must express my profound gratitude to my beloved parents: Mr. Appajaiah and Mrs. Kempajamma, and to my brothers: Mr. Ashok and Mr. Arun Kumar for their continuous inspiration and moral support in carrying my doctoral work for the past few years. I am deeply indebted to my wife Mrs. Savitha for her constant support and patience during the shaping up of the thesis. Finally, I express my thanks to the people who helped me directly or indirectly in my doctoral work and/or for my pleasant stay in Berlin.
List of Publications [1] Aging behavior of polymer optical fibers: Characterization of thermo-oxidative
stability by chemiluminescence, Anilkumar Appajaiah and Volker Wachtendorf, Proceedings of the Polymer Optical Fibers (POF) International Conference, Germany, September 28-30, 2004, pp. 166-173.
[2] Chemiluminescence investigation of high temperature and humidity aging of
PMMA Based polymer optical fibres (POF), Anilkumar Appajaiah, Volker Wachtendorf, and Lukasz Jankowski, Proceedings of the (POF) Conference, U.S.A., 2003, pp. 152-155.
[3] Climatic aging of PMMA based polymer optical fibers (POF): Analysis of
polymer degradation, Anilkumar Appajaiah and Hans-Juergen Kretzschmar, 3rd International IEEE Conference on Polymers and Adhesives in Microelectronics and Photonics, Polytronic 2003, Montreux, Switzerland, 2003, pp. 57-62.
[4] Modelling the light propagation through aged and unaged POFs, Lukasz
Jankowski, Anilkumar Appajaiah, Christian-Alexander Bunge and Joseba Zubia, Proceedings of the POF Conference, U.S.A., 2003, pp. 148-151.
[5] Climatic aging or degradation of plastic optical fibers (POFs): Chemical
analyses, Anilkumar Appajaiah and Hans-Juergen Kretzschmar, Proceedings of the POF Conference, Japan, 2002, pp. 213-216.
[6] A review on aging or degradation of polymer optical fibers (POFs): Polymer
chemistry and mathematical approach, Anilkumar Appajaiah and Lukasz Jankowski, Proceedings of the POF Conference, The Netherlands, 2001, pp. 317-324.
[7] Photosensitive sol-gel waveguides on silicon substartes as MOEM devices,
A. Selvarajan, A. Anil Kumar, D. Anil Kumar, G.M. Hegde and T. Srinivas, SPIE 7th Intl. Symposium on Smart Structures and Materials, U.S.A., Vol. 3990, 2000.
[8] Bragg Grating on Ce3+ doped sol-gel waveguides for sensor applications,
G.M. Hegde, A. Anil Kumar, T. Kiran Kumar and A. Selvarajan, Proceedings of the International Conference on Smart Materials, Structures and Systems, July 1999, Indian Institute of Science, India, 1999.
List of Symbols αa Absorption co-efficient θ1, θ2 Angle of incidence and refraction χ Anharmonicity constant α Attenuation or optical loss δ Bending vibrations k Boltzmann constant Cu(90) Cabbens factor φCL Chemiluimnescence quantum yield θC Critical angle ρ Density ε Dielectric constant Dc Diffusion co-efficient ∆S Entropy of reaction ∆H Enthalpy of reaction ∆HR Enthalpy of reaction φFlu Fluorescence quantum yield Tf Fictive temperature ∆G Free energy change ν1 Fundamental vibration frequency R Gas constant Tg Glass transition temperature κ Interatomic force constant βT Isothermal compressibility L Length of the fiber θmax Maximum acceptance angle εa Molar absorption co-efficient Tm Melting temperature Mn Number average molecular weight h Planck’s constant υ Quantum number r Radius n Refractive index n1, n2 Refractive indices of two media ncore Refractive index of the core nclad Refractive index of the cladding na Refractive index of air
µ Reduced mass τ Turbidity αT Thermal expansion co-efficient C Velocity of light λ Wavelength of light
Mw Weight average molecular weight
List of Abbreviations ATR Attenuated total reflection CCD Charge coupled device CL Chemiluminescence CYTOP Cyclic transparent optical polymer D Deuterium D2B Digital domestic bus DSC Differential scanning calorimetry FTIR Fourier transform infrared GI Graded-index GPC Gel permeation chromatography IR Infrared MMA Methyl methacrylate MOST Media oriented system transport LAN Local area network LED Light emitting diode NA Numerical aperture PMT Photomultiplier tube PD Polydispersity PA 12 Polyamide 12 PC Polycarbonate PE Polyethylene PMMA Poly(methyl methacrylate) PFA Poly(fluoroalkyl acrylate) PFMA Poly(fluoroalkyl methacrylate) POF Polymer Optical Fiber PS Polystyrene PTFE Polytetrafluoroethylene RH Relative humidity SEM Scanning electron microscope SI Step-index TG Thermogravimetry UV Ultra-violet
i
CONTENTS
SUMMARY .................................................................................................................. I
ZUSAMMENFASSUNG ............................................................................................A
1 INTRODUCTION..................................................................................................1
2 BASICS OF FIBER OPTIC..................................................................................5
2.1 SNELL’S LAW AND TOTAL INTERNAL REFLECTION..................................................5 2.2 OPTICAL FIBERS .....................................................................................................6 2.3 TYPES OF OPTICAL FIBER........................................................................................7 2.4 REFRACTIVE INDEX DISTRIBUTION.........................................................................8 2.4.1 Step-index (SI) ...................................................................................................9 2.4.2 Graded-index (GI)............................................................................................10 2.5 NUMERICAL APERTURE ........................................................................................10 2.6 OPTICAL ATTENUATION OR OPTICAL LOSS ...........................................................11
3 POLYMER OPTICAL FIBERS (POFS) – TECHNOLOGICAL ASPECTS 13
3.1 MOTIVATION........................................................................................................13 3.1.1 Technical background......................................................................................14 3.2 ADVANTAGES AND APPLICATIONS .......................................................................15 3.3 POF MATERIALS ..................................................................................................16 3.3.1 Materials of the core ........................................................................................16 3.3.1.1 Poly (methyl methacrylate) (PMMA)............................................................16 3.3.1.2 Deuterated polymers.....................................................................................17 3.3.1.3 Fluoropolymers.............................................................................................18 3.3.2 Materials of the cladding .................................................................................19 3.3.3 Materials of the jacket......................................................................................21
4 OPTICAL LOSS MECHANISM AND RELIABILITY OF POFS.................22
4.1 OPTICAL LOSS MECHANISM IN POFS....................................................................22 4.2 INTRINSIC LOSS FACTOR.......................................................................................23 4.2.1 Absorption overtones .......................................................................................24 4.2.2 Electronic transitions .......................................................................................26 4.2.3 Rayleigh scattering...........................................................................................27 4.3 EXTRINSIC LOSS FACTOR......................................................................................28 4.3.1 Absorption by contaminants ............................................................................28 4.3.2 Scattering due to physical imperfections .........................................................28 4.4 RELIABILITY OF POFS..........................................................................................29 4.4.1 Environmental effects ......................................................................................29 4.4.2 Industrial environmental stress factors of POFs ..............................................30 4.4.3 Climatic stability of POFs – State of the art ....................................................31
ii
5 THERMAL OXIDATIVE DEGRADATION OF POLYMERS .....................32
5.1 INTRODUCTION - POLYMER DEGRADATION ..........................................................32 5.2 THERMAL OXIDATIVE DEGRADATION PROCESSES IN POLYMERS...........................33 5.2.1 Maximum rate of oxygen consumption or induction time...............................35 5.2.2 Oxygen diffusion control in polymers .............................................................35 5.3 THE ROLE OF MOISTURE IN OXIDATIVE DEGRADATION OF POLYMERS ..................36 5.3.1 Dual mechanism of water transportation .........................................................37 5.3.2 Reversible and irreversible physical influences of water ................................38 5.3.3 Chemical interaction of water in polymers ......................................................39
6 CHEMILUMINESCENCE METHOD OF INVESTIGATION OF THERMAL OXIDATIVE STABILITY/DEGRADATION.............................40
6.1 CHEMILUMINESCENCE (CL) – GENERAL REMARKS .............................................40 6.2 PHYSICAL CHEMISTRY BACKGROUND ..................................................................41 6.2.1 Electronic excitation and bonding ...................................................................41 6.2.2 Excitation by chemical reactions .....................................................................43 6.2.3 Chemiluminescence and quantum yield ..........................................................44 6.3 EVALUATION OF POLYMER OXIDATION PROCESSES ..............................................46 6.3.1 Polymer oxidation scheme for chemiluminescence.........................................46 6.4 TYPES OF MEASUREMENTS...................................................................................49
7 EXPERIMENTAL DETAILS.............................................................................51
7.1 MATERIALS AND SAMPLE PREPARATION ..............................................................51 7.1.1 POFs and bulk material selection ....................................................................51 7.1.2 POF sample preparation...................................................................................53 7.2 CLIMATIC EXPOSURES OR AGING..........................................................................54 7.2.1 Exposure conditions.........................................................................................54 7.2.2 Exposure tests ..................................................................................................55 7.3 OPTICAL TRANSMISSION MEASUREMENTS............................................................57 7.3.1 Measurements by using multiplexer ................................................................57 7.3.2 Measurements by using miniature spectrometer..............................................58 7.4 POF CLADDING EXTRACTION...............................................................................58 7.5 CHEMILUMINESCENCE EXPERIMENTS...................................................................59 7.5.1 Instrumentation ................................................................................................60 7.5.2 Sampling ..........................................................................................................62 7.5.3 Measurements ..................................................................................................62 7.6 FTIR MEASUREMENTS .........................................................................................63 7.6.1 Attenuated total reflection (ATR) - FTIR........................................................64 7.6.1.1 Practical aspects...........................................................................................64 7.6.1.2 Measurements ...............................................................................................65 7.7 SUPPLEMENTARY MEASUREMENTS ......................................................................66
iii
8 RESULTS AND DISCUSSION...........................................................................67
8.1 CHARACTERIZATION OF THE UNEXPOSED POFS...................................................67 8.1.1 Glass transition (Tg) and melting temperature (Tm) by DSC ...........................67 8.1.2 Molecular weights by GPC..............................................................................71 8.1.3 Chemical compositions analysis by FTIR .......................................................72 8.2 CLIMATIC EXPOSURE OF POF CABLES .................................................................77 8.2.1 Online optical transmission measurements......................................................77 8.2.2 Investigation of thermo-oxidative stability/degradation using CL ..................79 8.2.2.1 Initial peak and plateau behavior .................................................................80 8.2.2.2 CL of the unexposed bare POFs ...................................................................82 8.2.2.3 CL of the unexposed claddings .....................................................................84 8.2.2.4 CL of the exposed bare POFs and claddings................................................85 8.2.3 Investigation of climatic exposure influences using FTIR ..............................90 8.2.4 Investigation of climatic exposure effects using supplementary methods.......95 8.2.4.1 Thermal stability analysis by thermogravimetry (TG)..................................95 8.2.4.2 UV/visible transmittance...............................................................................98 8.2.4.3 Molecular weight analysis ............................................................................99 8.2.5 Spectral transmission measurements .............................................................100 8.2.6 Optical transmission loss - possible explanation ...........................................101 8.3 CLIMATIC EXPOSURES OF BARE POFS................................................................103 8.3.1 Online optical transmission measurements....................................................103 8.3.1.1 Exposure to temperature-humid climates ...................................................103 8.3.1.2 Exposure to temperature with very low humid climates.............................115 8.3.2 Investigation of thermo-oxidative stability/degradation using CL ................120 8.3.2.1 Comparison of the unexposed bare POF with, core and cladding.............120 8.3.2.2 Comparison of the unexposed bare POFs ..................................................123 8.3.2.3 CL peak emission behavior versus initial transmission loss ......................125 8.3.2.4 CL of samples exposed to 92 °C / 50 %RH.................................................126 8.3.2.5 CL of samples exposed to 100 °C / low humidity .......................................130 8.3.2.6 CL of samples exposed to 90 °C / low humidity .........................................134 8.3.2.7 Summary .....................................................................................................137 8.4 SHORT-TERM CLIMATIC EXPOSURES OF BARE POFS...........................................138
9 CONCLUSIONS AND OUTLOOK .................................................................143
REFERENCES.........................................................................................................148
Summary
I
Summary
Polymer optical fibers (POFs) are a rather new tool for high-speed data transfer by
modulated light. They allow the transport of high amounts of data over distances up to
about 100 m without be influenced by external electromagnetic fields. Due to organic
chemical nature of POFs, they are sensitive to the climate of their environment and
therefore the optical fiber properties are as well. Hence, the optical stability is a key
issue for long-term applications of POFs.
The causes for a loss of optical transmission due to climatic exposures
(aging/degradation) are researched by means of chemical analytical tools such as
chemiluminescence (CL) and Fourier transform infrared (FTIR) spectroscopy for five
different (with respect to manufacturers) step-index multimode PMMA based POFs
and for seven different climatic conditions. Three of the five POF samples are studied
more in detail to realize the effects of individual parameters and for forecasting long-
term optical stability by short-term exposure tests.
At first, the unexposed POF components (core, cladding, and bare POF as
combination of core and cladding) are characterized with respect to important
physical and chemical properties. The glass transition temperature Tg, and the melting
temperature Tm are in the region of 120 °C to 140 °C, the molecular weight (Mw) of
cores is in the order of 105 g mol-1. POFs are found to have different chemical
compositions of their claddings as could be detected by FTIR, but identical
compositions of their cores.
Summary
II
Two of the POFs are exposed as cables (core, cladding and jacket) for about 3300
hours to the climate 92 °C / 95 % relative humidity (RH) resulting in a different
transmission decrease. Investigating the related unexposed and exposed bare POFs for
degradation using CL, FTIR, thermogravimetry (TG), UV/visible transmittance and
gel permeation chromatography (GPC) suggest that claddings of POFs are more
affected than cores. Probably the observed loss of transmission is mainly due to
increased light absorption and imperfections at the core-cladding boundary caused by
a large degradation of claddings. Hence, it is highly possible that the optical
transmission stability of POFs is governed mainly by the thermo-oxidative stability of
the cladding and minor of the core.
Three bare POFs (core and cladding only) are exposed for different duration of
exposure time (30 hours to 4500 hours) to 92 °C / 95 %RH, 92 °C / 50 %RH, 50 °C /
95 %RH, 90 °C / low humidity, 100 °C / low humidity, 110 °C / low humidity and
120 °C / low humidity. In these climates their transmission variations are found to be
different from each other, too.
The outcomes strongly inform that under high temperature and high humid climates
physical changes such as volume expansion, are the main sources for the loss of
optical transmission. Also, the optical transmission stability of POFs is found to be
dependent on chemical compositions of claddings.
Under high temperature and low humid conditions, a loss of transmission at the early
stages of the exposure is mainly caused by physical changes, presumable by core-
cladding interface imperfections. For the later stages of exposures it is proposed to an
additional increase of light absorption by core and cladding owes to degradation.
Optical simulation results obtained parallel by Mr. L. Jankowski (a PhD student of
BAM) are found to confirm these results. For bare POFs, too, the optical stability of
POFs seems to depend on their thermo-oxidative stability.
Some short-term exposure tests are conducted to realize influences of individual
climatic parameters on the transmission property of POFs. It is found that at stationary
high temperature and variable humidity conditions POFs display to a certain amount a
reversible transmission loss due to physically absorbed water. But in the case of
varying temperature and constant high humidity such reversibility is hardly
Summary
III
noticeable. However, at room temperature and varying humidity, POFs display fully
reversible transmission loss.
The whole research described above has to be regarded as a starting point for further
investigations. The restricted distribution of fundamental POF data by the
manufacturers and the time consuming aging by climatic exposures restrict the results
more or less to the samples, investigated here. Significant general statements require
for example additional information concerning the variation of POF properties due to
production. Nevertheless the tests, described here, have the capability for
approximating and forecasting the long-term optical transmission stability of POFs.
Zusammenfassung
A
Zusammenfassung
Optische Polymerfasern stellen ein relativ neues Medium zur
Hochgeschwindigkeitsdatenübertragung mittels moduliertem Licht dar. Sie gestatten
die Verbreitung großer Datenmengen über Entfernungen bis zu ca. 100 m, ohne eine
Beeinflussung durch externe elektromagnetischen Feldern. Jedoch reagieren die
Fasern und somit auch ihre optischen Eigenschaften aufgrund des organisch-
chemischen Faseraufbaus empfindlich auf das Klima ihrer Umgebung.
Die Ursachen für die Abnahme der optischen Transmission aufgrund von
klimatischen Einflüssen (Alterung, Degradation) werden mittels chemisch
analytischer Verfahren wie Chemilumineszenz (CL) und Fourier Transform Infrarot
(FTIR) Spektroskopie untersucht. Dabei kommen fünf, von verschiedenen Herstellern
bezogene, Multimode- POFs aus PMMA in sieben verschiedenen Klimaten zum
Einsatz. Drei dieser fünf POFs werden genauer untersucht, um den Einfluss einzelner
Parameter festzustellen und optische Langzeitstabilität aufgrund von Kurzzeittests
vorherzusagen.
Als erstes erfolgt eine Kennzeichnung unbeanspruchter POF Komponenten (Kern,
Mantel und nackte POF als Kombination von Kern und Mantel) über ihre
physikalischen und chemischen Eigenschaften. Die Glas- und die
Schmelztemperaturen liegen im Bereich von 120 °C bis 140 °C, das
Molekulargewicht des Kerns bei größenordnungsmäßig 105 g mol-1. FTIR-
Zusammenfassung
B
Messungen zeigen zwar Unterschiede in der chemischen Zusammensetzung der
Mäntel aber keine Unterschiede bei den Kernen.
Bei zwei der POF Proben , die als Kabel ( Kern, Mantel und Schutzhülle) für 3300
Stunden einem Klima aus 92 °C und 95 % relativer Feuchte (r.F.) ausgesetzt waren,
verringern sich daraufhin die optische Transmissionen in unterschiedlicher Weise. Die
Untersuchung der zugehörigen nackten POFs mittels CL, FTIR, Thermogravimetrie
(TG), UV/VIS und Gel Permeation Chromatographie (GPC) lässt eine stärkere
Schädigung der Mäntel als der Kerne vermuten. Wahrscheinlich führt eine starke
Manteldegradation zu einer erhöhten Absorption und Fehlstellen im Mantel und damit
zu einer Transmissionsabnahme. Daher scheint die optische Stabilität der POF stärker
durch die thermo-oxidative Stabilität des Mantels bestimmt zu sein als durch die des
Kernes.
Drei nackte POFs (Kern und Mantel) sind unterschiedlich lang (30 Stunden bis 3000
Stunden) folgenden Klimaten ausgesetzt: 92 °C / 95 % r.F., 92 °C / 50 % r.F., 50 °C /
95 % r.F., 90 °C / geringe Feuchte, 100 °C / geringe Feuchte, 110 °C / geringe
Feuchte and 120 °C / geringe Feuchte. Auch in diesen Klimaten ergaben sich
probenbedingte unterschiedliche Transmissionsänderungen.
Die Ergebnisse deuten stark darauf hin, dass bei gleichzeitig hoher Temperatur und
hoher Feuchte physikalische Änderungen wie die Volumenausdehnung die
Hauptursachen für die Abnahme der optischen Transmission bilden. Ein weiterer
Einflussfaktor ist die chemische Zusammensetzung der Mäntel.
Bei Kombination von hoher Temperatur und geringer Feuchte erzeugen in den
Anfangsstadien der Alterung physikalische Änderungen Transmissionsabnahmen,
vermutlich entstehen Fehlstellen in der Kern-Mantel-Grenzschicht. Hinzukommen in
den späteren Stadien wahrscheinlich zunehmende Lichtabsorption in Kern und
Mantel. L. Jankowski (Doktorand in der BAM) bestätigt diese Annahme durch
parallel ausgeführte optische Simulationsrechnungen. Auch für nackte POFs scheint
also die thermo-oxidative Stabilität die optische Stabilität zu bestimmen.
Kurzzeitalterungstests sollen Aufschluss über den Einfluss individueller
Klimaparameter auf die POF Eigenschaften geben. Es zeigt sich bei dauerhaft hoher
Temperatur und variabler Feuchte aufgrund des physikalisch absorbierten Wassers bis
zu einem gewissen Grad ein reversibles Verhalten des Transmissionsverlustes. Dieses
Zusammenfassung
C
Verhalten tritt aber nur kaum merkbar auf, wenn bei konstanter hoher Feuchte die
Temperatur variiert wird. Bei Raumtemperatur und variabler Feuchte stellt sich
jedoch ein voll reversibles Verhalten des Transmissionsverlustes ein.
Die hier beschriebenen Untersuchungen sind als Ausgangspunkt für weitergehende
Forschungen zu verstehen. Die begrenzte Zurverfügungstellung von POF Basisdaten
durch die Hersteller und der zeitaufwendige klimabedingte Alterungsprozess
beschränken die Ergebnisse mehr oder weniger auf die untersuchten Proben.
Signifikante allgemeine Aussagen erfordern aber beispielsweise zusätzliche
statistische Daten der Produktionsschwankungen von POF Eigenschaften. Dennoch
besitzen die hier beschriebenen Tests das Potential für eine Annäherung an die
optische Langzeitstabilität und deren Vorhersage.
1 Introduction
1
1 Introduction
The present era is often called as “information age”. One of the basic requirements for
information is the speed at which data can be transferred or gathered through cables.
Copper cables were the main medium for data transmission before glass and polymer
fiber cables have arrived to the market. But they have the disadvantage of increasing
inductive loss with the increasing data rate. Additionally, they are very sensitive to
electromagnetic radiation generated by neighboring cables and on the other hand
sources of radiations themselves, causing large errors in the data transmission (so
called the cross-talk). Nevertheless, these problems can be solved by means of optical
fibers made out of inorganic glasses and organic polymers. Besides the data
transmission, optical fibers have found a wide range of applications from sensors to
decorative elements.
It is no doubt that inorganic glass optical fibers are superior to polymer optical fibers
(POFs) with respect to high rate data communication over long-distances. However,
with the glass fibers, technical difficulties such as small core diameter and small
numerical aperture (NA) make the installation uneasy and expensive. The larger
diameter and NA of POFs facilitates and reduces the cost of installation, but because
of their high attenuation, restricts their usage in the present to a length in the order of
100 m. Nevertheless, the recent breakthrough in large-scale manufacturing graded-
index POF promises much lower attenuation. From the viewpoint of the functional
1 Introduction
2
property, the core and cladding are the major parts that influence the optical quality of
the POF [1,2,3].
POFs have found many application areas out of which the area of automobile field is a
major consumer. Nevertheless, depending on ultimate applications, POFs are
employed under various environmental stresses such as climatic (e.g.: temperature
and humidity), mechanical (e.g.: repeated bending and impact) and biological (e.g.:
microorganisms) ones. For all long-term applications under these environmental stress
factors the optical reliability is a key issue [3].
It is well established that changes in physical and chemical properties of polymer
materials take place due to degradation as a result of outdoor exposures, influenced by
temperature and humidity. In outdoor use, the oxidation is known to take place in
many organic substances including polymers [56].
The utility of conventional methods such as Fourier transform infrared spectroscopy
(FTIR) coupled with thermogravimetry (TG) and differential scanning calorimetry
(DSC) etc. is limited by their lacking sensitivity to monitor thermo-oxidative
degradation of polymers. In contrast, the chemiluminescence (CL) technique has been
known for many years for monitoring the thermal oxidation in many organic
compounds and organic polymers [65-76]. Since the development of single photon
counting technique, CL has been demonstrated to be a powerful tool to investigate the
thermo-oxidative stability of a number of polymers including poly(methyl
methacrylate) (PMMA) based POFs [51,52].
The present PhD thesis will focus mainly on three issues.
Influences of climatic stress factors temperature and humidity on the optical
transmission stability of PMMA based different POFs (with respect to
manufacturers) in view of their long-term reliability.
Investigation of the thermo-oxidative degradation/stability of the unexposed and
exposed POFs. This mainly uses CL because of its large selectivity and high
sensitivity.
It proposes possible mechanisms for optical transmission altering due to climatic
exposures.
1 Introduction
3
At the same time, another PhD work is prepared by Mr. Jankowski (of BAM),
modeling the optical transmission through the unexposed and exposed POFs with
respect to their optical characteristics such as scattering/attenuation. Some of the
results from this work will utilize for comparing the chemical analysis results of the
present study.
The thesis comprises seven chapters.
Chapter 2 will introduce the basics of fiber optics that are applicable to POFs. Here,
the main emphasis is paid to review the optical fiber structure and optical terms that
are often used in this thesis.
Chapter 3 will focus on technological aspects of POFs. Here, the recent developments
in bandwidth achievement, polymerization and fabrication techniques, advantages
over glass optical fibers and application areas of POFs are provided. However, much
attention is paid to materials that are used for core, cladding and jacket. Special
interest is given to cladding materials as its chemical nature was not disclosed by
manufacturers.
In Chapter 4, the loss mechanism and reliability of POFs are reviewed. The
prominence is given to understand intrinsic and extrinsic loss factors of POFs. The
industrial environmental stress factors are classified and state of the art of reliability
testing and understanding of the transmission loss mechanism in stressed POFs are
reviewed.
Chapter 5 and 6 will focus on chemical aspects of thermo-oxidative degradation of
polymers and its detection by employing CL. These are studied in detail in view of
fact that climatic exposures lead to oxidative degradation of POFs and its detection
needs sensitive methods like CL. As CL is a new technique for the analysis of POFs it
is reviewed in little more detail. Also, physical and chemical effects of water
(humidity or moisture) in polymers and on their thermo-oxidative degradation are
extensively reviewed in the direction of humidity substantially affect the optical
stability of POFs.
Chapter 7 is the experimental part. It provides details of materials, sample preparation,
exposure tests, exposure conditions, optical measurements, CL, DSC, attenuated total
reflection (ATR) FTIR, UV/visible transmittance, TG, GPC (gel permeation
1 Introduction
4
chromatography) and SEM (scanning electron microscopy) measurements are
employed in the present work. Some components of the instruments used here (e.g.:
CL) are prototypes and therefore described in more detail. Also, a method of the
separation of the cladding/core by using solvents is described.
Chapter 8 is the results and discussion part. It is structured mainly into four sections.
In the first section, individual components (bare POF, core and cladding) of the
unexposed POFs are characterized for their important physical constants (glass
transition Tg, glass melting temperature Tm and molecular weights) and chemical
compositions by using DSC, GPC and FTIR.
In the second section, the optical transmission stability of two POF cables (having
core, cladding and jacket) exposed to the climate 92 °C / 95 % relative humidity
(RH) is investigated. The transmission loss behavior is tried to be correlated with
physical and chemical changes of POFs. The relative thermo-oxidative stability of
the unexposed bare POFs and claddings is investigated by using CL. The exposed
samples (bare POF, cladding and core) are investigated in relation to degradation
by using CL, FTIR, TG, UV/visible transmittance and GPC. Finally, the possible
mechanisms for the loss of transmission of POFs are proposed.
In the third section, the optical transmission stability under seven different
temperature and humid climates is investigated for three bare POF samples (core
with cladding only). The possible mechanisms for the observed loss of
transmission at the early stages of exposures are researched to some extent. For
the first time, the relative thermo-oxidative stability of the individual components
bare POF, cladding and core is investigated as a model by using CL. CL is
explored to detect degradation of the exposed bare POFs and claddings. The
probable causes for the loss of transmission are discussed.
In the fourth section, three short-term exposure tests are carried out for three bare
POF samples to realize influences of temperature and humidity on the optical
transmission of POFs. Using these measurements, possibilities for approximating
the optical transmission stability under long-term exposures are explored.
2 Basics of Fiber Optic
5
2 Basics of Fiber Optic
2.1 Snell’s law and total internal reflection
The ratio of the velocity of a light wave in vacuum (Cv) to the velocity of a light wave
in a medium (Cm) is defined as the refractive index (n) of that medium and it can be
expressed as:
m
v
CC
n = . (2-1)
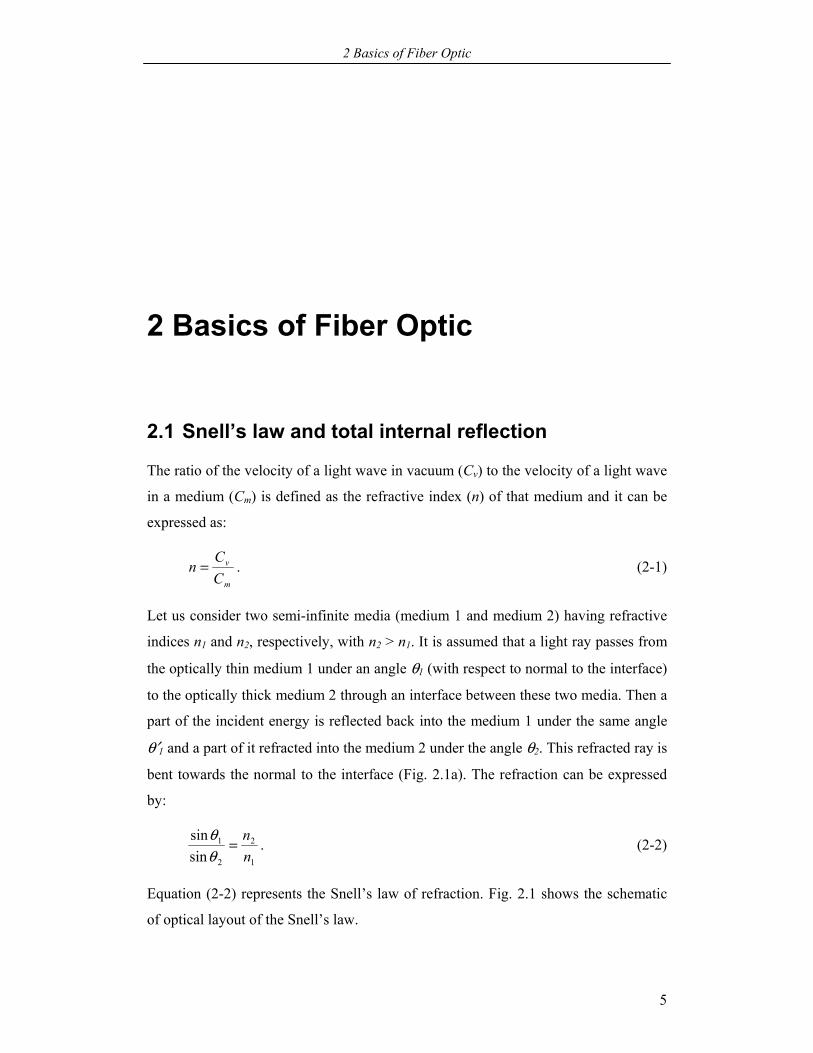
Let us consider two semi-infinite media (medium 1 and medium 2) having refractive
indices n1 and n2, respectively, with n2 > n1. It is assumed that a light ray passes from
the optically thin medium 1 under an angle θ1 (with respect to normal to the interface)
to the optically thick medium 2 through an interface between these two media. Then a
part of the incident energy is reflected back into the medium 1 under the same angle
θ′1 and a part of it refracted into the medium 2 under the angle θ2. This refracted ray is
bent towards the normal to the interface (Fig. 2.1a). The refraction can be expressed
by:
1
2
2
1
sinsin
nn
=θθ . (2-2)
Equation (2-2) represents the Snell’s law of refraction. Fig. 2.1 shows the schematic
of optical layout of the Snell’s law.
2 Basics of Fiber Optic
6
Optically thin medium (n1)
Optically thick medium (n2)
θ 1
θ 1
(a) (b)
θ ′ 1 θ 1 > θ c
(c)
θ 1θ 2 θ ′ 1
θ 1 = θ c
θ ′ 1
θ2
θ2
Figure 2.1: Schematic representation of the Snell’s law of refraction and total
internal reflection.
The same phenomenon is observed when a light ray passes from the medium 2 of n2
to the medium 1 of n1 but here the refracted ray is bent away from the normal to the
interface (Fig. 2.1b). But at a particular angle of incidence - called as critical angle (θ1
= θC) – refracted light beam passes perpendicular to the normal (θ2 = 90°), i.e. grazes
along the interface (Fig. 2.1c). When the angle of incidence is increased beyond θC,
all incident light is totally reflected back, nothing is transmitted (Fig. 2.1c). This
phenomenon is called as total internal reflection. It is the fundamental optical effect
for light propagation through optical fibers. The critical angle (θC) is given by:
= −
1
21sinnn
Cθ . (2-3)
2.2 Optical fibers
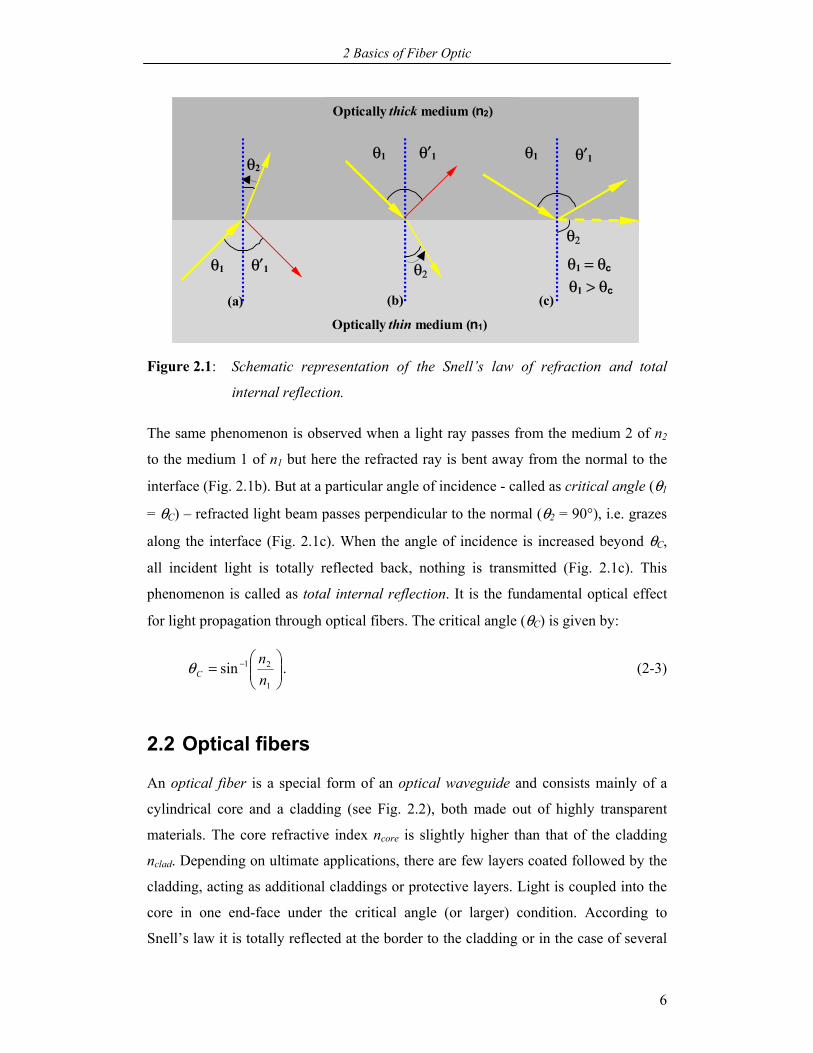
An optical fiber is a special form of an optical waveguide and consists mainly of a
cylindrical core and a cladding (see Fig. 2.2), both made out of highly transparent
materials. The core refractive index ncore is slightly higher than that of the cladding
nclad. Depending on ultimate applications, there are few layers coated followed by the
cladding, acting as additional claddings or protective layers. Light is coupled into the
core in one end-face under the critical angle (or larger) condition. According to
Snell’s law it is totally reflected at the border to the cladding or in the case of several
2 Basics of Fiber Optic
7
claddings exist within the outermost cladding – guided in this way through the whole
fiber and leaves the fiber at the other end-face. So far the theory, in practice there are
problems, which will be discussed later.
The core is made up of either inorganic or organic (polymer) materials or combination
of both. The well-known inorganic material is glass (SiO2), and poly(methyl
methacrylate) (PMMA) is the known organic polymer material. But other polymers
such as polystyrene and polycarbonate are also known core materials. CYTOP and
Teflon AF are the recently developed perfluoropolymers as core materials. A few
attempts have been made to use of elastomers based on silicon with organic entities as
core materials (see Section 3.3).
The core diameter for instance in silica based optical fibers typically varies from 5 µm
up to about 100 µm and in polymer optical fibers (POFs) from 200 µm up to about
1000 µm. The cladding diameter of POFs typically is in the range from 20 µm up to
50 µm higher than the core, in glass fibers even more. Fig. 2.2 shows the geometry of
an optical fiber.
Core Cladding
Jacket
Figure 2.2:
Geometry of an optical
fiber.
2.3 Types of optical fiber
Optical fibers are characterized by their physical structure (refractive index
distribution of the core) and transmission properties. With respect to data transmission
they can be classified into two types based on the number of light modes that supports
by an optical fiber. The types are:
2 Basics of Fiber Optic
8
Single-mode.
Multimode.
According to mode theory, sets of guided electromagnetic waves are used to call
modes of an optical fiber. An optical fiber is always being able to propagate at least
one mode, which is referred as the fundamental mode of the fiber.
In single mode optical fibers, the core size (diameter) is small and it is typically
around 8 µm to 10 µm. This type of fibers allows only lowest order or the
fundamental mode and is suitable for the applications preferably at 1300 nm
wavelength. Single mode optical fibers have lower signal loss and higher information
capacity (i.e. bandwidth) than multimode optical fibers. These fibers are capable of
transferring higher amounts of optical data due to lower fiber dispersion.
Multimode (describes the number of different light intensity distributions of light
within the fiber) optical fibers support over 100 modes depending on the core
diameter and numerical aperture NA, describing the angular region of light coupled
into the fiber. As the core size and NA increase, the number of mode increases. The
main disadvantage of multimode optical fibers is high modal dispersion, which
directly reduces the bandwidth of the fibers because the information transport
(bandwidth) is mode dependent. Multimode optical fibers have some advantages
compared to single mode ones, e.g.: ease of light launch, ease of connection and the
use of cheap light emitting diodes LEDs (normally for single mode optical fibers,
laser diodes are used). However, optimization of core diameter, NA and refractive
index of the fiber can lead to an increase in bandwidth. For instance, a polymer optical
fiber with a NA of 0.5, and a core radius of 0.5 mm, at a λ of 650 nm can support up
to 3 million modes.
2.4 Refractive index distribution
In optical waveguides the light guidance takes place through the phenomenon total
internal reflection (see Fig. 2.1). The light propagation in an optical fiber is mainly
dependent on the refractive index distribution or profile of the core. Based on this
optical fibers are categorized into step-index (SI) and graded-index (GI) fibers.
2 Basics of Fiber Optic
9
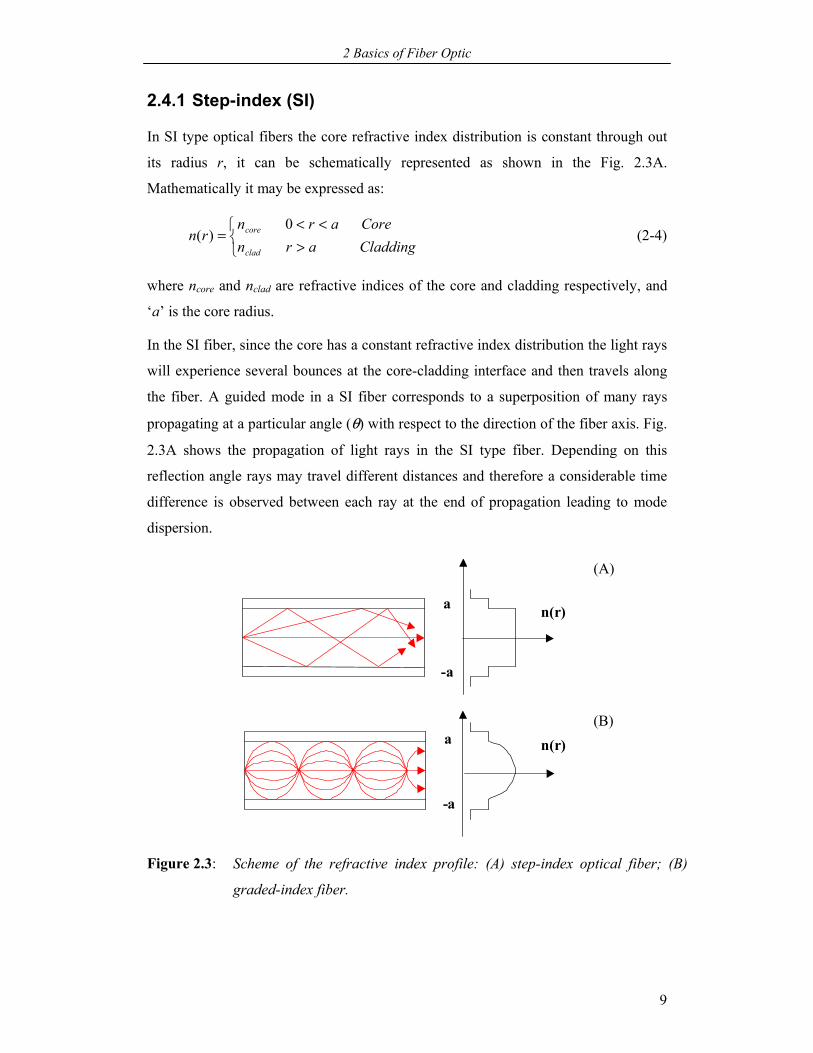
2.4.1 Step-index (SI)
In SI type optical fibers the core refractive index distribution is constant through out
its radius r, it can be schematically represented as shown in the Fig. 2.3A.
Mathematically it may be expressed as:
><<
=CladdingarnCorearn
rnclad
core 0)( (2-4)
where ncore and nclad are refractive indices of the core and cladding respectively, and
‘a’ is the core radius.
In the SI fiber, since the core has a constant refractive index distribution the light rays
will experience several bounces at the core-cladding interface and then travels along
the fiber. A guided mode in a SI fiber corresponds to a superposition of many rays
propagating at a particular angle (θ) with respect to the direction of the fiber axis. Fig.
2.3A shows the propagation of light rays in the SI type fiber. Depending on this
reflection angle rays may travel different distances and therefore a considerable time
difference is observed between each ray at the end of propagation leading to mode
dispersion.
n(r)
-a
a
(A)
-a
n(r) a
(B)
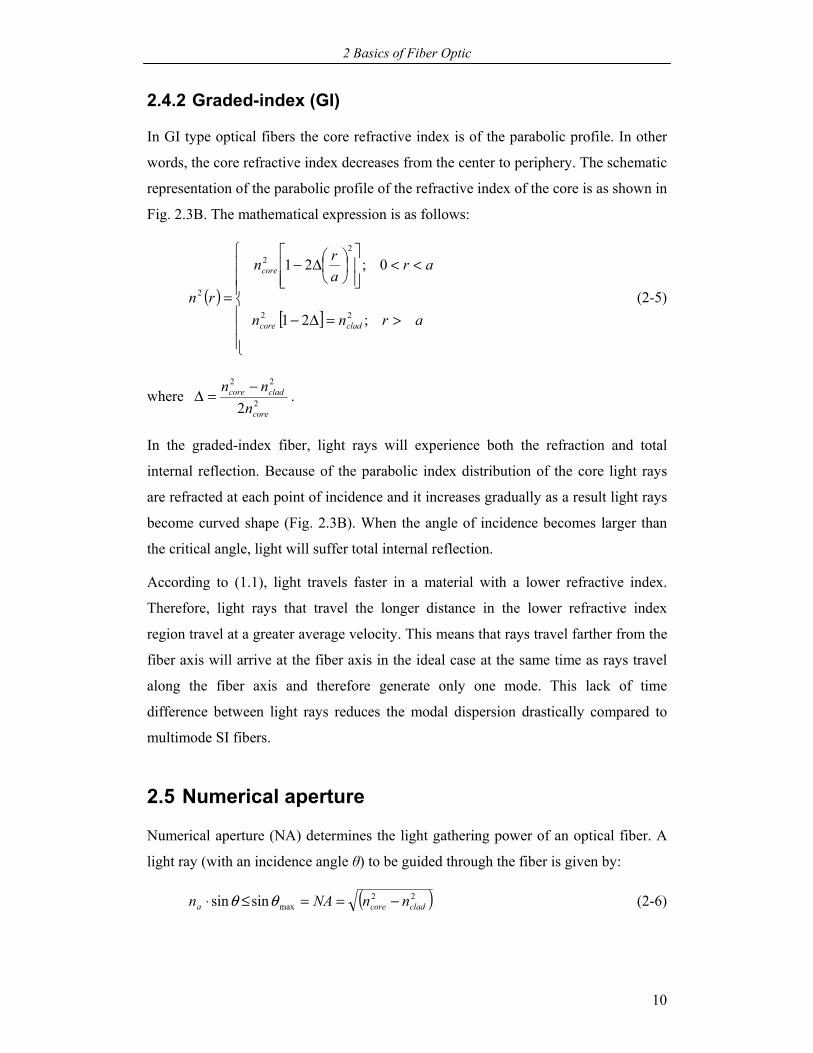
Figure 2.3: Scheme of the refractive index profile: (A) step-index optical fiber; (B)
graded-index fiber.
2 Basics of Fiber Optic
10
2.4.2 Graded-index (GI)
In GI type optical fibers the core refractive index is of the parabolic profile. In other
words, the core refractive index decreases from the center to periphery. The schematic
representation of the parabolic profile of the refractive index of the core is as shown in
Fig. 2.3B. The mathematical expression is as follows:
( )[ ]
>=∆−
<<
∆−
=arnn
ararn
rn
cladcore
core
;21
0;21
22
22
2 (2-5)
where 2
22
2 core
cladcore
nnn −
=∆ .
In the graded-index fiber, light rays will experience both the refraction and total
internal reflection. Because of the parabolic index distribution of the core light rays
are refracted at each point of incidence and it increases gradually as a result light rays
become curved shape (Fig. 2.3B). When the angle of incidence becomes larger than
the critical angle, light will suffer total internal reflection.
According to (1.1), light travels faster in a material with a lower refractive index.
Therefore, light rays that travel the longer distance in the lower refractive index
region travel at a greater average velocity. This means that rays travel farther from the
fiber axis will arrive at the fiber axis in the ideal case at the same time as rays travel
along the fiber axis and therefore generate only one mode. This lack of time
difference between light rays reduces the modal dispersion drastically compared to
multimode SI fibers.
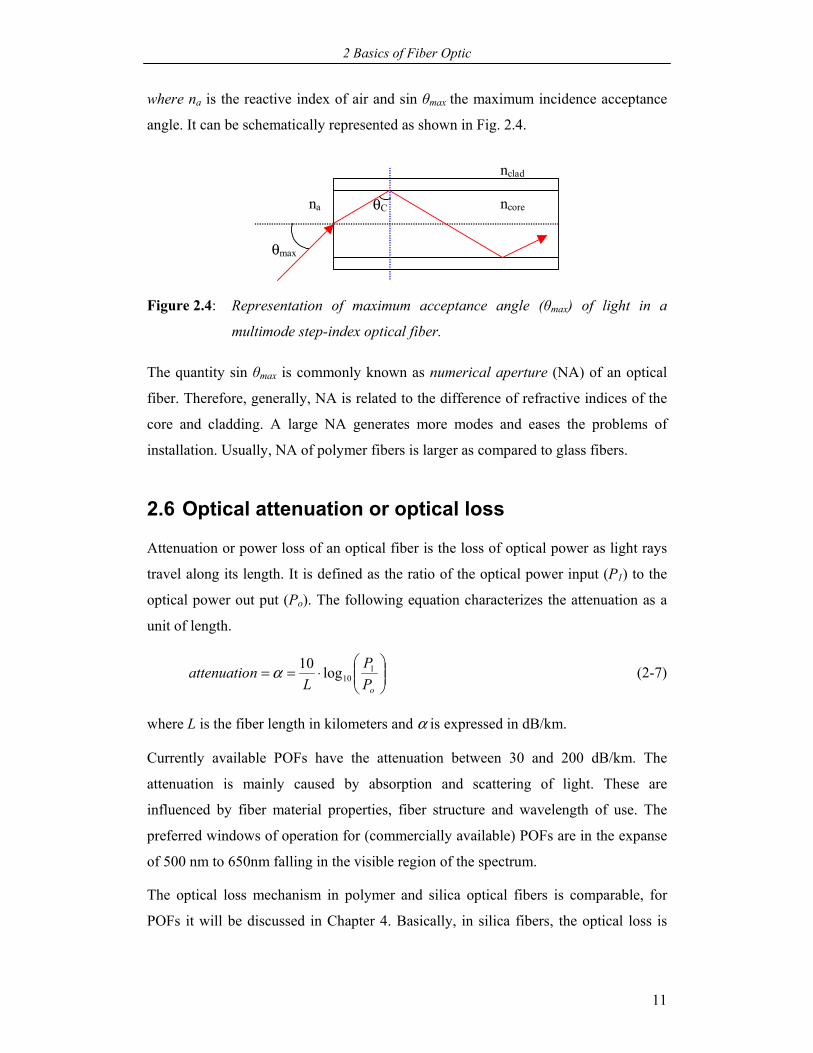
2.5 Numerical aperture
Numerical aperture (NA) determines the light gathering power of an optical fiber. A
light ray (with an incidence angle θ) to be guided through the fiber is given by:
( )22maxsinsin cladcorea nnNAn −==≤⋅ θθ (2-6)
2 Basics of Fiber Optic
11
where na is the reactive index of air and sin θmax the maximum incidence acceptance
angle. It can be schematically represented as shown in Fig. 2.4.
na
θmax
θC
nclad
ncore
Figure 2.4: Representation of maximum acceptance angle (θmax) of light in a
multimode step-index optical fiber.
The quantity sin θmax is commonly known as numerical aperture (NA) of an optical
fiber. Therefore, generally, NA is related to the difference of refractive indices of the
core and cladding. A large NA generates more modes and eases the problems of
installation. Usually, NA of polymer fibers is larger as compared to glass fibers.
2.6 Optical attenuation or optical loss
Attenuation or power loss of an optical fiber is the loss of optical power as light rays
travel along its length. It is defined as the ratio of the optical power input (P1) to the
optical power out put (Po). The following equation characterizes the attenuation as a
unit of length.
⋅==
oPP
Lnattenuatio 1
10log10α (2-7)
where L is the fiber length in kilometers and α is expressed in dB/km.
Currently available POFs have the attenuation between 30 and 200 dB/km. The
attenuation is mainly caused by absorption and scattering of light. These are
influenced by fiber material properties, fiber structure and wavelength of use. The
preferred windows of operation for (commercially available) POFs are in the expanse
of 500 nm to 650nm falling in the visible region of the spectrum.
The optical loss mechanism in polymer and silica optical fibers is comparable, for
POFs it will be discussed in Chapter 4. Basically, in silica fibers, the optical loss is
2 Basics of Fiber Optic
12
separated into intrinsic and extrinsic losses, which are mainly due to absorption and
scattering, respectively.
Light scattering processes in an optical fiber can be broadly divided into microscopic
and macroscopic scattering. In the microscopic type, two kinds of scattering i.e.
Rayleigh scattering and Mie scattering are observed. Rayleigh scattering takes place
when the size of the defect (density fluctuation in the fiber) is less than about one-
tenth of the wavelength of light under operation. When it is equivalent or greater than
one-tenth of the wavelength, then is called Mie scattering. Macroscopic or bulk
scattering is mainly caused by imperfections such as micro bends and micro cracks
and voids in the fiber.
References for Chapter 2 are [1,2,3].
3 Polymer Optical Fibers (POFs) – Technological Aspects
13
3 Polymer Optical Fibers (POFs) – Technological Aspects
3.1 Motivation
The present era is often called as “information age”. Since the invention of “computer
technology”, it has almost become that our present everyday business (i.e. education,
job, banking, entertainment, collection and distribution of information etc.) cannot
proceed without the computer. One of the requirements for the computer-based
business is how fast the data can be transmitted to another computer through the
cables. Indeed, the advent of “internet technology”, the computer has to meet high
rate data transformation and gather. Copper cables were the main source of data
transmission before glass and polymer fiber cables have arrived to the market. But
copper cables are not able meet the high rate data transmission because of high loss.
Moreover, they are very sensitive to electromagnetic radiations and on the other hand
sources of radiations causing large errors in data transmission (so called the cross-
talk). These problems can be solved by means of optical fibers made out of glass and
polymers [2,3,4]. Moreover, the development of laser technology has strengthened
their use especially in the telecommunication industry. Because polymer optical fibers
(POFs) have some great advantages (see Section 3.2) over glass optical fibers as well
as copper fibers, they are largely preferred for optical data communication particularly
over shorter distances.
3 Polymer Optical Fibers (POFs) – Technological Aspects
14
3.1.1 Technical background
A polymer optical fiber (POF) consists mainly of the (polymer) core and cladding.
Therefore the basic principles of fiber optics hold also for POFs, too. Poly (methyl
methacrylate) (PMMA), polystyrene (PS) and polycarbonate (PC) are the most used
polymers as core materials in commercially available multimode step-/graded-index
POFs.
POFs are having the history since 1960 and they were first commercialized in 1970’s
[3,4]. DuPont from the United States and Mitsubishi Rayon from Japan were the two
main competitors of the POF market in 1970’s. The first commercialized PMMA
based POF exhibited an optical loss of more than 1000 dB/km [3,4]. The reduction of
optical loss of POFs is a major challenge for materials scientists as well as for optical
engineers in the area optical data communication.
One of the main causes of high optical loss of PMMA, PS and PC based POFs is the
C-H vibrations absorption, which can be substantially reduced by replacing hydrogen
atoms with heavier atoms such as fluorine, chlorine and deuterium [5,6].
By means of molecular engineering such as perfluorination and deuteration of
polymers, it has become possible to reduce the attenuation < 50 dB/km at the visible
and near infrared region of the spectrum [7,8]. Although it is still higher compared to
glass fibers, due to a few major advantages of POFs (see Section 3.2) increased their
use in the area of optical data communication, remarkably in the last two decades.
POFs are now replacing copper cables and glass fibers in the short-distance optical
data communication field.
Since the advantage of GI over SI optical fibers in achieving high rate optical data
transmission led the researchers to develop GI POFs. Recently, there are a few GI-
POFs based on perfluoropolymers have been developed specially to meet high
bandwidth and low attenuation. LUCINA based on CYTOP, is a recently
introduced GI POF for high optical performance [9]. Using this POF it is possible to
achieve the transmission speed of ~ 1.2 Gb/s/km with an attenuation of 30 dB/km
[7,9].
3 Polymer Optical Fibers (POFs) – Technological Aspects
15
The most important property of POFs is the optical transmission, which mainly
depends on core materials, drawing process and conditions employed in the
manufacturing process.
For producing polymers (core materials) of SI POFs, bulk polymerization technique is
preferred because of the purity advantage of an obtainable polymer [4,10].
Continuous-, batch- extrusion and melt spinning are the most used drawing techniques
for POF manufacturing [3,4,5,11].
Since last three decades the following polymerization techniques have been to
proposed to produce the preform for GI POFs [12,13,14,15,16,17]:
Two-step copolymerization technique.
Photo copolymerization technique.
Interface-gel copolymerization technique.
Dopant diffusion technique.
Centrifugal field technique.
Fabrication of GI POFs mainly uses the preform hot-drawing technique
[3,4,11,17,18].
3.2 Advantages and applications
The main advantages of POFs over glass multi mode optical fibers are [3,4,7]:
Easy installation owing to large diameter (typically 0.25 mm – 1 mm).
Efficient light coupling owing to large numerical aperture (NA) (typically 0.5 i.e.
60°).
High ductility (or low modulus) and resistance to impact and vibrations.
Low cost of production (also their connectors).
The major applications fields of POFs are [3,7,11,19,20,21]:
Data communication field (e.g.: local area network LAN and home networks).
Automotive field (e.g.: entertainment networks, navigation systems, systems,
digital domestic bus D2B and media oriented system transport MOST).
3 Polymer Optical Fibers (POFs) – Technological Aspects
16
Lighting technology (e.g.: traffic signal-, airport signal-, street lighting and for
decorative purposes).
Sensor technology (e.g.: temperature, humidity, methanol, inorganic acids and
Bragg grating sensors).
Specialty POFs (e.g.: fiber light amplifiers and scintillating fibers).
3.3 POF materials
3.3.1 Materials of the core
The important criteria for core or cladding materials are high transparency and fiber or
film forming ability. Until recently, thermoplastics are proven to be best suitable for
the core fiber fabrication. Among the thermoplastics PMMA, PS, and PC are the well-
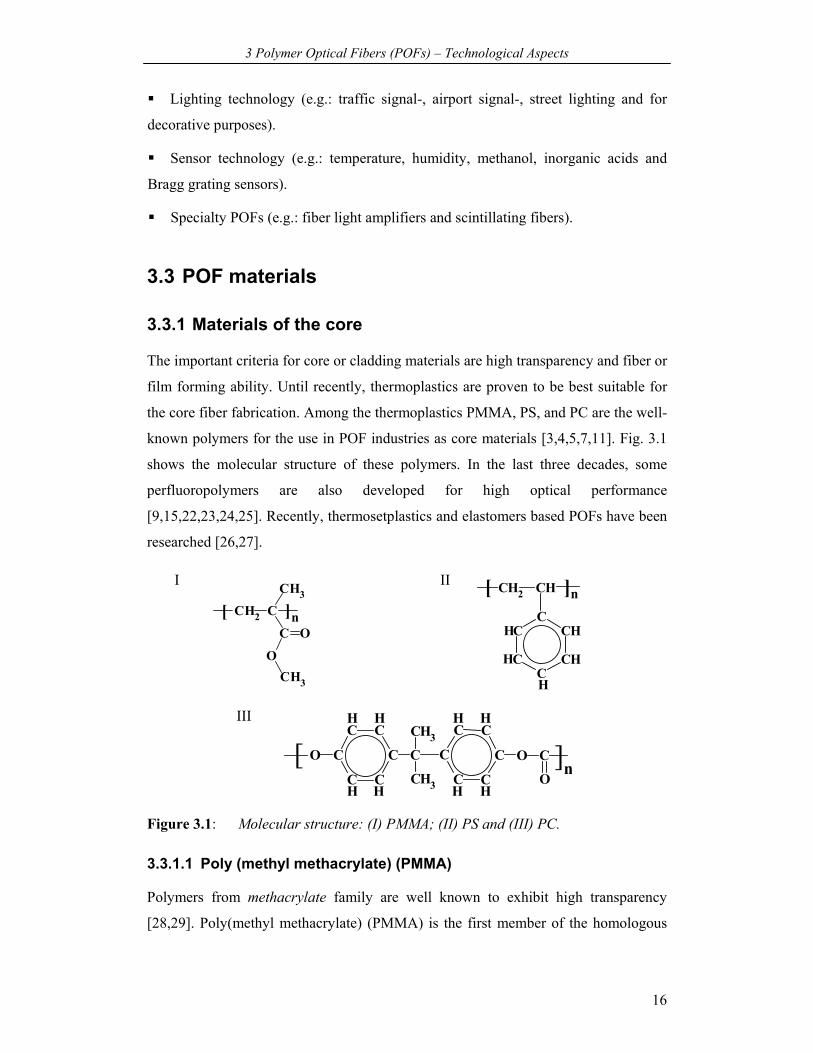
known polymers for the use in POF industries as core materials [3,4,5,7,11]. Fig. 3.1
shows the molecular structure of these polymers. In the last three decades, some
perfluoropolymers are also developed for high optical performance
[9,15,22,23,24,25]. Recently, thermosetplastics and elastomers based POFs have been
researched [26,27].
C
C O
CH3
CH3
O
CH2[ ]n
CH2 CH[ ]
H
H
H
n
C
C CHC
CCH
H
HH
H
H
H
H
H
[ ]n
C C
C
C
O
C
C C
CH3
CH3
C
C
O C
O
C
C
C C
Figure 3.1: Molecular structure: (I) PMMA; (II) PS and (III) PC.
3.3.1.1 Poly (methyl methacrylate) (PMMA)
Polymers from methacrylate family are well known to exhibit high transparency
[28,29]. Poly(methyl methacrylate) (PMMA) is the first member of the homologous
III
III
3 Polymer Optical Fibers (POFs) – Technological Aspects
17
series. It may be called as ‘high-tech polymer’. It is commercially better known as
Plexiglass®. PMMA has a wide range of applications from building material up to
data communication medium [28]. The research area of POFs is one of the promising
fields for a large consumption of extremely pure PMMA as a core material. Beside
PMMA, there are other methacrylate polymers exhibit very good optical properties
[28,29].
PMMA is building blocks of monomer methyl methacrylate (MMA). MMA is
produced from acetone. PMMA is manufactured by free radical polymerization using
bulk or suspension technique [30].
While the PMMA and PS core POFs are developed as typical SI POFs for the normal
conditional use, PC core POF is developed specially for high temperature applications
(Tg ≈ 145 °C of PC is higher than that of PMMA and PS). However, the optical loss
of all these is quite high especially of PC and PS based POFs [3,5,7,11].
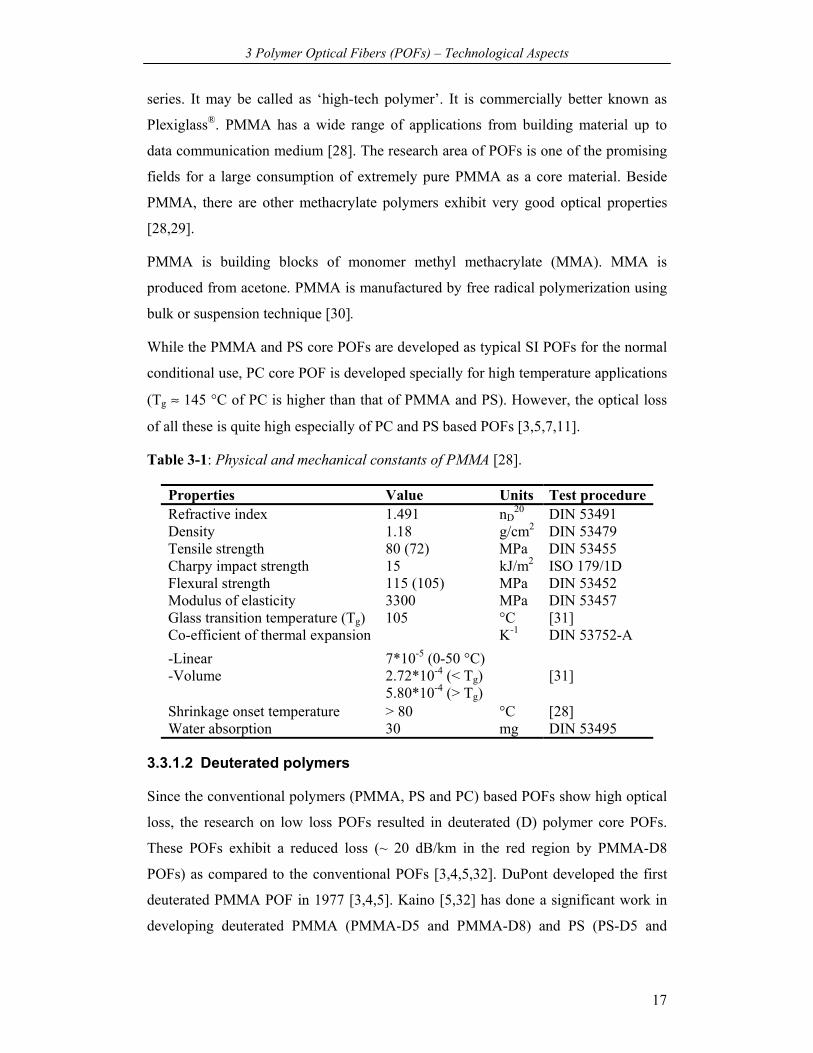
Table 3-1: Physical and mechanical constants of PMMA [28].
Properties Value Units Test procedure Refractive index 1.491 nD
20 DIN 53491 Density 1.18 g/cm2 DIN 53479 Tensile strength 80 (72) MPa DIN 53455 Charpy impact strength 15 kJ/m2 ISO 179/1D Flexural strength 115 (105) MPa DIN 53452 Modulus of elasticity 3300 MPa DIN 53457 Glass transition temperature (Tg) 105 °C [31] Co-efficient of thermal expansion K-1 -Linear 7*10-5 (0-50 °C)
DIN 53752-A
-Volume 2.72*10-4 (< Tg) 5.80*10-4 (> Tg)
[31]
Shrinkage onset temperature > 80 °C [28] Water absorption 30 mg DIN 53495
3.3.1.2 Deuterated polymers
Since the conventional polymers (PMMA, PS and PC) based POFs show high optical
loss, the research on low loss POFs resulted in deuterated (D) polymer core POFs.
These POFs exhibit a reduced loss (~ 20 dB/km in the red region by PMMA-D8
POFs) as compared to the conventional POFs [3,4,5,32]. DuPont developed the first
deuterated PMMA POF in 1977 [3,4,5]. Kaino [5,32] has done a significant work in
developing deuterated PMMA (PMMA-D5 and PMMA-D8) and PS (PS-D5 and
3 Polymer Optical Fibers (POFs) – Technological Aspects
18
PS-D8) POFs. Although these POFs have registered a reduced optical loss, they are
commercially less significant due to their large water absorption and high cost of
production.
3.3.1.3 Fluoropolymers
The fully halogenated homo- and copolymers or perfluoropolymers (e.g.:
polytertrafluoroethylene PTFE, polytetrafluoroethylene-co-hexafluoropropylene FEP)
are known to be highly crystalline in chemical nature, which gives rise to a high
optical loss owing to Rayleigh scattering [3,4]. In addition, their monomers are
unsuitable for the bulk polymerization and they have high melt viscosity, which
brings difficulty in fiber drawing. Therefore perfluoropolymers are unsuitable for the
core fiber of POFs.
Partially halogentaed polymers (e.g.: fluorinated acrylate polymers) would
compromise all the problems of crystallinity, polymerization and processing. Yet, the
main drawback of this type of polymers as core materials is a lower refractive index,
which yields difficulty in finding cladding materials of the refractive index close to
the core [3,4,15]. Therefore most of them are best suitable as cladding materials for SI
POFs.
Nevertheless, since the development of GI POFs, perfluoropolymers as well as
partially fluorinated polymers can be used as core materials but blended with other
polymers (e.g.: PMMA), copolymerized with other monomers or adding low
molecular weight dopants [3,4,7,14,33]. Duijnhoven has reported the possible uses of
blends of PMMA and poly(2,2,2-trifluoroethyl methacrylate) (PTFEMA) and blends
of PMMA and poly(2,2,3,3-tetrafluoropropyl methacrylate) (PTFPMA) as core
materials [17].
Still, perfluorocopolymers and partially fluorinated polymers show considerable
crystallinity and hence increase the scattering loss. On the other hand, further research
has focused on cyclic perfluoropolymers resulted in poly(perfluorobutenyl vinyl
ether) (CYTOP: Cyclic Transparent Optical Polymer) [9,25]. It is the first
perfluorocyclopolymer developed as a core material by Asahi Glass Company (AGC).
It is highly amorphous and transparent polymer, and has excellent thermal and
chemical properties. The optical fiber made out of CYTOP is commercially known
3 Polymer Optical Fibers (POFs) – Technological Aspects
19
as LUCINA introduced by AGC. Following CYTOP, 2,2- bistrifluoro-methyl-4,5-
difluoro-1,3-dioxole (TeflonAF) has been introduced by DuPont [23,25]. Most of
POFs based on perfluoropolymers show excellent optical properties in the far visible
and near infrared region of the spectrum.
3.3.2 Materials of the cladding
Two of the main requirements for cladding materials are low refractive index (but
close to the index of the core material) and good film forming ability. In addition, the
application of claddings can provide a good mechanical and thermal resistance to the
core.
A variety of cladding polymers have been developed since the invention of glass as
well as polymer optical fibers. As discussed above that perfluoropolymers and
partially fluorinated polymers alone are unsuitable for the fiber core, the research
centered on the possible use of them as cladding materials.
Actually, there are two classes of fluoropolymers, which are widely used as cladding
materials: copolymers of fluoroolefins and poly(fluoroalkyl acrylates) (PFAs) [22,34].
Out of these, PFAs are preferred because of their amorphous nature, high
transparency and good adhesion properties etc. As a result durable optical properties
can be obtained. Another main advantage of PFAs is their monomers easily coating
(by solution) on the core and can be easily photopolymerized.
In general, there are already a number of monomers of PFAs mainly for fiber optic
applications especially as cladding materials available in the market. Some monomers
of poly(fluoroalkyl methacrylates) are listed in Table 3-2 along with glass transition
temperature (Tg) and refractive index (n) of their corresponding homopolymers.
However, the formulation of cladding materials depends on individual optical fiber
producers. Some of them are presented here. Schleinitz et al. [36] have proposed
copolymers of fluorinated methyl and ethyl esters of acrylic and methacrylic acids as
cladding materials for the PMMA core. They also have proposed a few homo- and
copolymers of fluoroolefins. Kaino et al. [37] have claimed the following materials
for the cladding: 1H,1H,3H-tetrafluoropropyl methacrylate polymer blended with a
copolymer of vinylidenefluoride and tertafluoroetheylene, a copolymer of 1H,1H,5H-
octafluoropentyl methacrylate and 1H,1H -trifluoroethyl methacrylate, and
3 Polymer Optical Fibers (POFs) – Technological Aspects
20
1H,1H,5H-octafluoropentyl methacrylate polymer blended with a copolymer of
vinylidenefluoride and tetrafluoroetheylene. Hulme-Lowe et al. [38] have disclosed
different compositions of the cladding, which is mainly comprised of fluororinated
monoacrylate and a polyfunctional crosslinking acrylate with a number of additives.
Baran et al. [34] and Savu et al. [39] have investigated the cladding materials, which
are some homo- and copolymers of different fluoroalkyl esters: methacrylic and
acrylic and α-fluromethacrylic acids. Recently, Nakumura et al. [40] have reported
the PMMA POF with three-layer structure that is core, cladding and a protective
layer. The cladding material is mainly composed of a copolymer of long chain
fluoroalkyl methacrylate, methyl methacrylate and methacrylic acid. The protective
layer material is composed of a copolymer of vinylidenefluoride and
tetrafluoroethylene. More recently, Ballato et al. [41] have studied the possible use of
a copolymer of 2,2,3,3,4,4,4-heptafluoro-butyl-methacrylate (HFBMA) and methyl
methacrylate as a cladding for the PMMA core fiber.
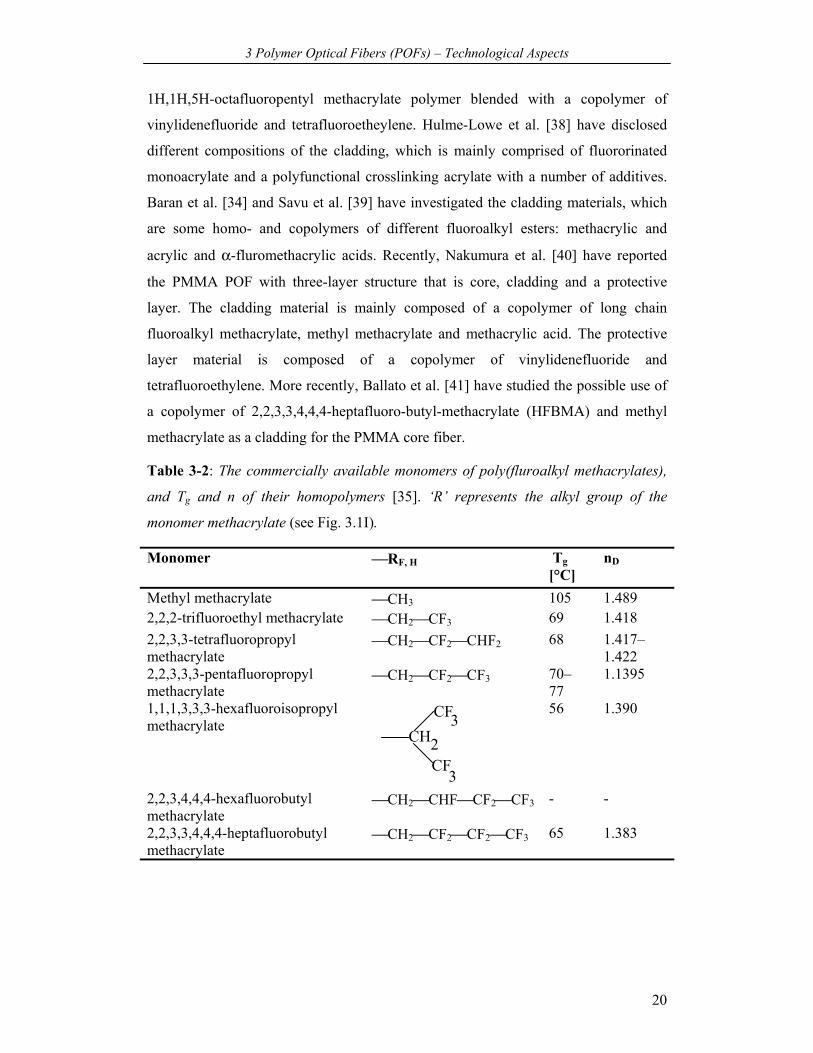
Table 3-2: The commercially available monomers of poly(fluroalkyl methacrylates),
and Tg and n of their homopolymers [35]. ‘R’ represents the alkyl group of the
monomer methacrylate (see Fig. 3.1I).
Monomer RF, H Tg [°C]
nD
Methyl methacrylate CH3 105 1.489 2,2,2-trifluoroethyl methacrylate CH2CF3 69 1.418 2,2,3,3-tetrafluoropropyl methacrylate
CH2CF2CHF2 68 1.417– 1.422
2,2,3,3,3-pentafluoropropyl methacrylate
CH2CF2CF3 70– 77
1.1395
1,1,1,3,3,3-hexafluoroisopropyl methacrylate
CH2
CF3
CF3
56 1.390
2,2,3,4,4,4-hexafluorobutyl methacrylate
CH2CHFCF2CF3 - -
2,2,3,3,4,4,4-heptafluorobutyl methacrylate
CH2CF2CF2CF3 65 1.383
3 Polymer Optical Fibers (POFs) – Technological Aspects
21
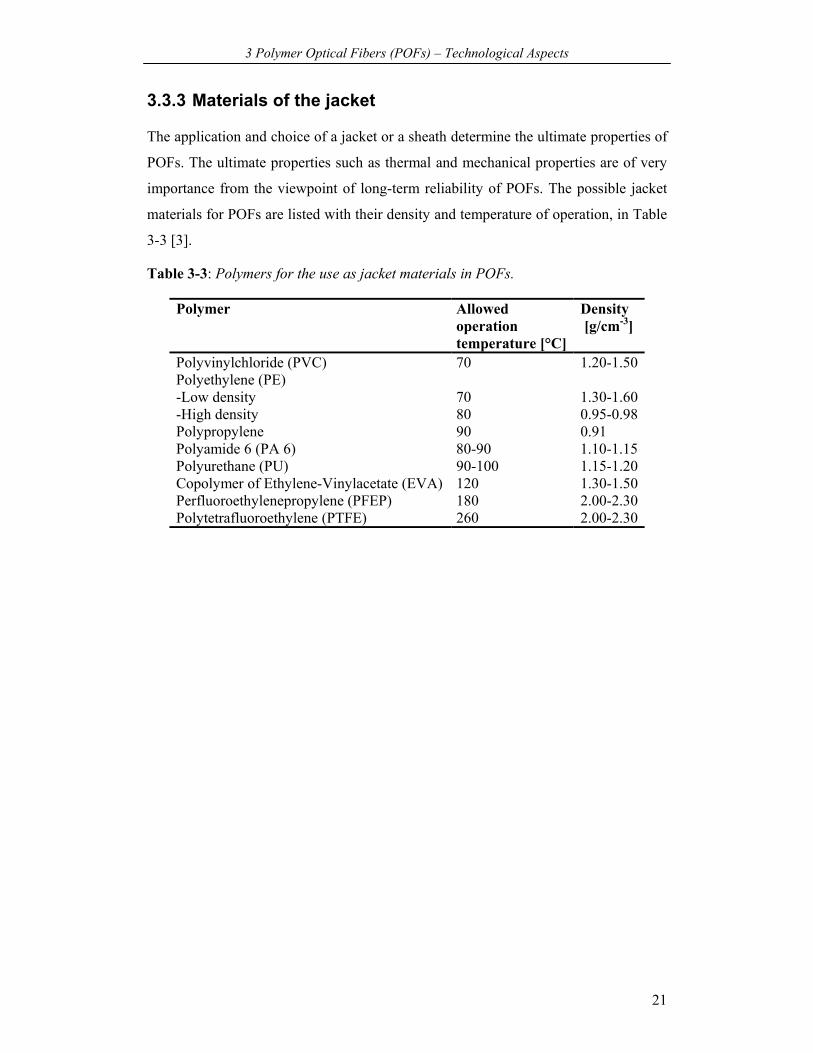
3.3.3 Materials of the jacket
The application and choice of a jacket or a sheath determine the ultimate properties of
POFs. The ultimate properties such as thermal and mechanical properties are of very
importance from the viewpoint of long-term reliability of POFs. The possible jacket
materials for POFs are listed with their density and temperature of operation, in Table
3-3 [3].
Table 3-3: Polymers for the use as jacket materials in POFs.
Polymer Allowed operation temperature [°C]
Density [g/cm-3]
Polyvinylchloride (PVC) 70 1.20-1.50 Polyethylene (PE) -Low density -High density
70 80
1.30-1.60 0.95-0.98
Polypropylene 90 0.91 Polyamide 6 (PA 6) 80-90 1.10-1.15 Polyurethane (PU) 90-100 1.15-1.20 Copolymer of Ethylene-Vinylacetate (EVA) 120 1.30-1.50 Perfluoroethylenepropylene (PFEP) 180 2.00-2.30 Polytetrafluoroethylene (PTFE) 260 2.00-2.30
4 Optical Loss Mechanism and Reliability of POFs
22
4 Optical Loss Mechanism and Reliability of POFs
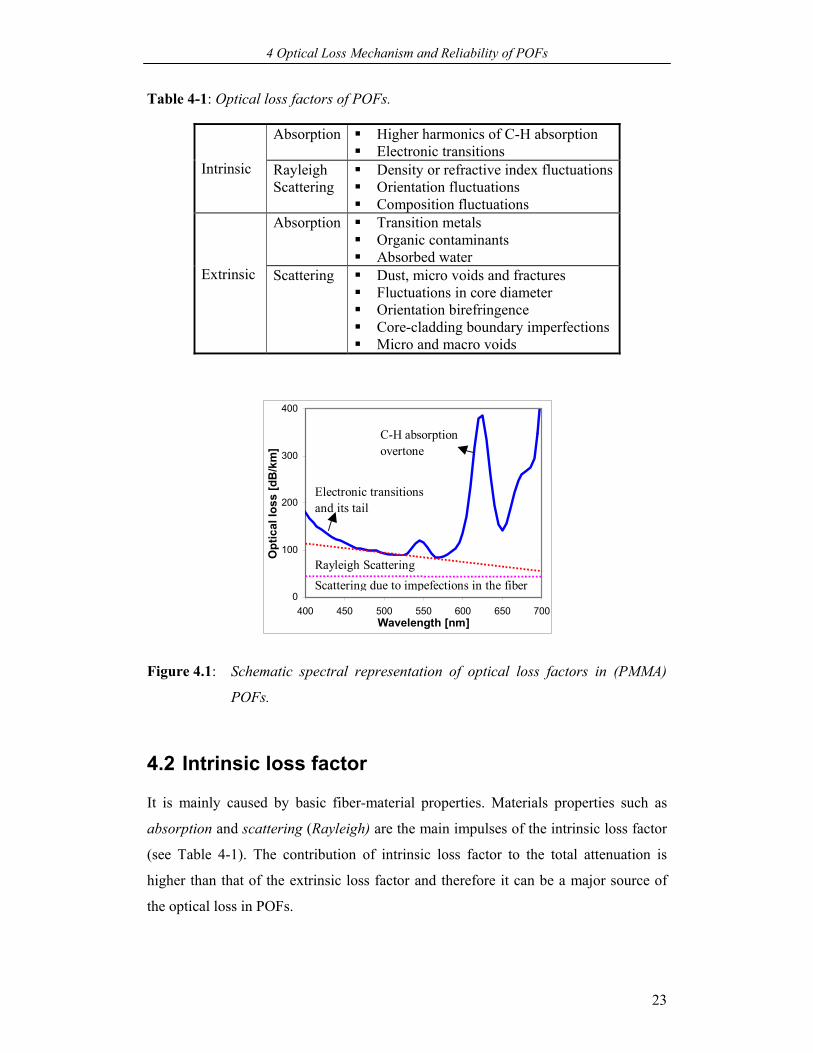
4.1 Optical loss mechanism in POFs
Since the development of polymer optical fibers, the primary importance has been
given to understand and to reduce their optical transmission loss. Likewise in glass
optical fibers, the optical loss factor of commercially available POFs can be divided
into intrinsic and extrinsic loss factors (see Chapter 1) [3-5,7,42]. Table 4-1 shows the
sources of loss factors, that is the optical loss mechanism of POFs. It can be
schematically spectrally represented as shown in Fig. 4.1 [3-5,20,32,43], which uses
PMMA based POFs as an example.
4 Optical Loss Mechanism and Reliability of POFs
23
Table 4-1: Optical loss factors of POFs.
Absorption
Higher harmonics of C-H absorption Electronic transitions
Intrinsic Rayleigh
Scattering Density or refractive index fluctuations Orientation fluctuations Composition fluctuations
Absorption Transition metals Organic contaminants Absorbed water
Extrinsic Scattering
Dust, micro voids and fractures Fluctuations in core diameter Orientation birefringence Core-cladding boundary imperfections Micro and macro voids
0
100
200
300
400
400 450 500 550 600 650 700Wavelength [nm]
Opt
ical
loss
[dB
/km
]
Rayleigh Scattering
C-H absorption overtone
Electronic transitions and its tail
Scattering due to impefections in the fiber
Figure 4.1: Schematic spectral representation of optical loss factors in (PMMA)
POFs.
4.2 Intrinsic loss factor
It is mainly caused by basic fiber-material properties. Materials properties such as
absorption and scattering (Rayleigh) are the main impulses of the intrinsic loss factor
(see Table 4-1). The contribution of intrinsic loss factor to the total attenuation is
higher than that of the extrinsic loss factor and therefore it can be a major source of
the optical loss in POFs.
4 Optical Loss Mechanism and Reliability of POFs
24
4.2.1 Absorption overtones
In POFs, the primary sources of absorption are vibrations and electronic transitions of
molecular groups. These are the inherent property and can vary with types of
materials. In view of the fact that POFs core is made of organic materials (polymers),
vibrations of molecular groups such as carbon-hydrogen (C−H), carbon-deuterium
(C−D), carbon-fluorine (C−F), carbon-chlorine (C−Cl), carbon-bromine (C−Br),
oxygen-hydrogen (O−H), carbon double-bond oxygen (C=O), carbon-oxygen (C−O),
and carbon-carbon (C−C) are the fundamental origin of the absorption loss. Molecular
groups such as carbon double-bond carbon (C=C), and C=O are the origin of the
optical loss by light absorption owing to electronic transitions [5,6,43].
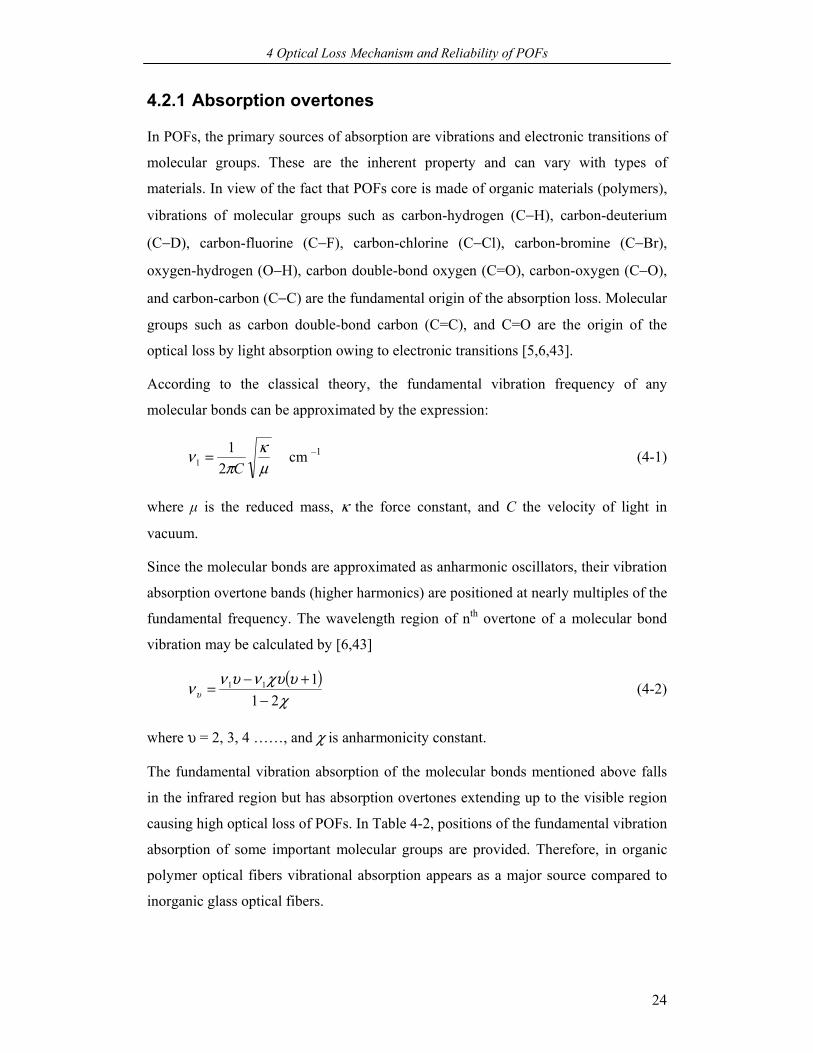
According to the classical theory, the fundamental vibration frequency of any
molecular bonds can be approximated by the expression:
µκ
πν
C21
1 = cm –1 (4-1)
where µ is the reduced mass, κ the force constant, and C the velocity of light in
vacuum.
Since the molecular bonds are approximated as anharmonic oscillators, their vibration
absorption overtone bands (higher harmonics) are positioned at nearly multiples of the
fundamental frequency. The wavelength region of nth overtone of a molecular bond
vibration may be calculated by [6,43]
( )χ
υχυνυννυ 21111
−+−
= (4-2)
where υ = 2, 3, 4 ……, and χ is anharmonicity constant.
The fundamental vibration absorption of the molecular bonds mentioned above falls
in the infrared region but has absorption overtones extending up to the visible region
causing high optical loss of POFs. In Table 4-2, positions of the fundamental vibration
absorption of some important molecular groups are provided. Therefore, in organic
polymer optical fibers vibrational absorption appears as a major source compared to
inorganic glass optical fibers.
4 Optical Loss Mechanism and Reliability of POFs
25
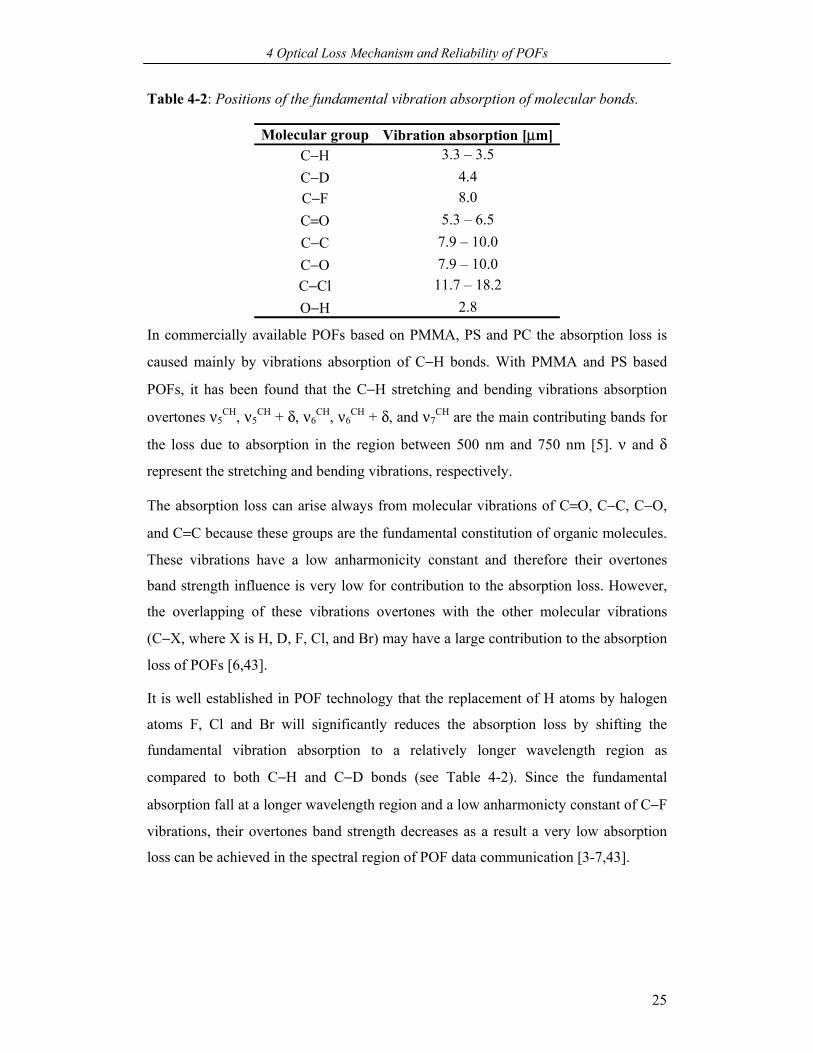
Table 4-2: Positions of the fundamental vibration absorption of molecular bonds.
Molecular group Vibration absorption [µm]C−H 3.3 – 3.5 C−D 4.4 C−F 8.0 C=O 5.3 – 6.5 C−C 7.9 – 10.0 C−O 7.9 – 10.0 C−Cl 11.7 – 18.2 O−H 2.8
In commercially available POFs based on PMMA, PS and PC the absorption loss is
caused mainly by vibrations absorption of C−H bonds. With PMMA and PS based
POFs, it has been found that the C−H stretching and bending vibrations absorption
overtones ν5CH, ν5
CH + δ, ν6CH, ν6
CH + δ, and ν7CH are the main contributing bands for
the loss due to absorption in the region between 500 nm and 750 nm [5]. ν and δ
represent the stretching and bending vibrations, respectively.
The absorption loss can arise always from molecular vibrations of C=O, C−C, C−O,
and C=C because these groups are the fundamental constitution of organic molecules.
These vibrations have a low anharmonicity constant and therefore their overtones
band strength influence is very low for contribution to the absorption loss. However,
the overlapping of these vibrations overtones with the other molecular vibrations
(C−X, where X is H, D, F, Cl, and Br) may have a large contribution to the absorption
loss of POFs [6,43].
It is well established in POF technology that the replacement of H atoms by halogen
atoms F, Cl and Br will significantly reduces the absorption loss by shifting the
fundamental vibration absorption to a relatively longer wavelength region as
compared to both C−H and C−D bonds (see Table 4-2). Since the fundamental
absorption fall at a longer wavelength region and a low anharmonicty constant of C−F
vibrations, their overtones band strength decreases as a result a very low absorption
loss can be achieved in the spectral region of POF data communication [3-7,43].
4 Optical Loss Mechanism and Reliability of POFs
26
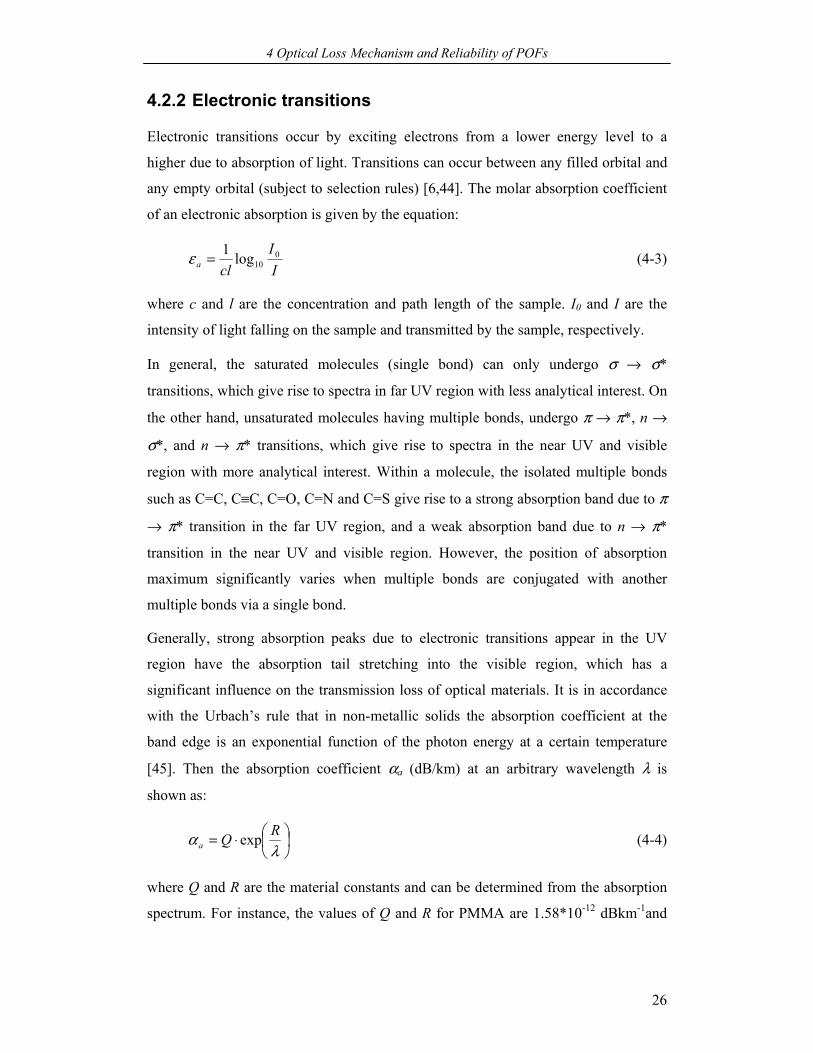
4.2.2 Electronic transitions
Electronic transitions occur by exciting electrons from a lower energy level to a
higher due to absorption of light. Transitions can occur between any filled orbital and
any empty orbital (subject to selection rules) [6,44]. The molar absorption coefficient
of an electronic absorption is given by the equation:
II
cla0
10log1=ε (4-3)
where c and l are the concentration and path length of the sample. I0 and I are the
intensity of light falling on the sample and transmitted by the sample, respectively.
In general, the saturated molecules (single bond) can only undergo σ → σ*
transitions, which give rise to spectra in far UV region with less analytical interest. On
the other hand, unsaturated molecules having multiple bonds, undergo π → π*, n →
σ*, and n → π* transitions, which give rise to spectra in the near UV and visible
region with more analytical interest. Within a molecule, the isolated multiple bonds
such as C=C, C≡C, C=O, C=N and C=S give rise to a strong absorption band due to π
→ π* transition in the far UV region, and a weak absorption band due to n → π*
transition in the near UV and visible region. However, the position of absorption
maximum significantly varies when multiple bonds are conjugated with another
multiple bonds via a single bond.
Generally, strong absorption peaks due to electronic transitions appear in the UV
region have the absorption tail stretching into the visible region, which has a
significant influence on the transmission loss of optical materials. It is in accordance
with the Urbach’s rule that in non-metallic solids the absorption coefficient at the
band edge is an exponential function of the photon energy at a certain temperature
[45]. Then the absorption coefficient αa (dB/km) at an arbitrary wavelength λ is
shown as:
⋅=
λα RQa exp (4-4)
where Q and R are the material constants and can be determined from the absorption
spectrum. For instance, the values of Q and R for PMMA are 1.58*10-12 dBkm-1and
4 Optical Loss Mechanism and Reliability of POFs
27
1.15*104 nm respectively at 500 nm. For PS, 1.10*10-5 dBkm-1 and 8.0*103 nm,
respectively at 500 nm and 600 nm [4,7].
4.2.3 Rayleigh scattering
It is caused mainly by fluctuations in density and composition and molecular
orientation of the polymer material.
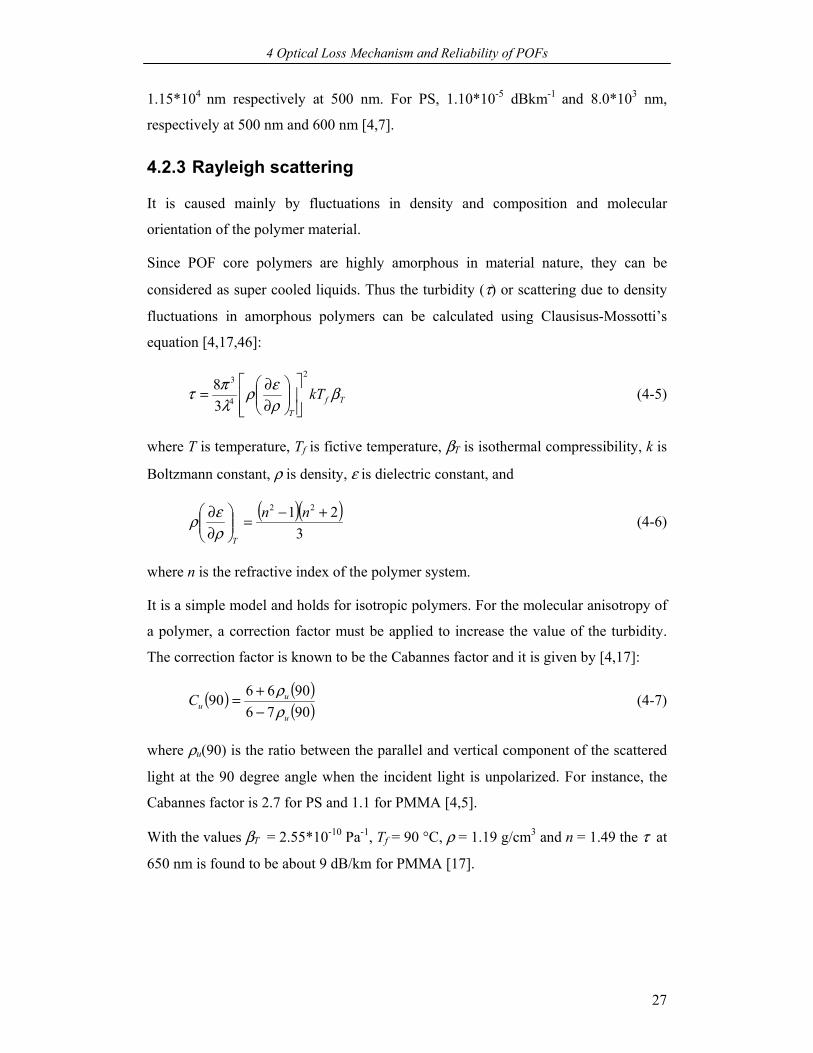
Since POF core polymers are highly amorphous in material nature, they can be
considered as super cooled liquids. Thus the turbidity (τ) or scattering due to density
fluctuations in amorphous polymers can be calculated using Clausisus-Mossotti’s
equation [4,17,46]:
TfT
kT βρερ
λπτ
2
4
3
38
∂∂= (4-5)
where T is temperature, Tf is fictive temperature, βT is isothermal compressibility, k is
Boltzmann constant, ρ is density, ε is dielectric constant, and
( )( )3
21 22 +−=
∂∂ nn
Tρερ (4-6)
where n is the refractive index of the polymer system.
It is a simple model and holds for isotropic polymers. For the molecular anisotropy of
a polymer, a correction factor must be applied to increase the value of the turbidity.
The correction factor is known to be the Cabannes factor and it is given by [4,17]:
( ) ( )( )9076906690
u
uuC
ρρ
−+= (4-7)
where ρu(90) is the ratio between the parallel and vertical component of the scattered
light at the 90 degree angle when the incident light is unpolarized. For instance, the
Cabannes factor is 2.7 for PS and 1.1 for PMMA [4,5].
With the values βT = 2.55*10-10 Pa-1, Tf = 90 °C, ρ = 1.19 g/cm3 and n = 1.49 the τ at
650 nm is found to be about 9 dB/km for PMMA [17].
4 Optical Loss Mechanism and Reliability of POFs
28
4.3 Extrinsic loss factor
It is caused chiefly by external contaminations in the fiber core and physical
imperfections in the fiber.
4.3.1 Absorption by contaminants
It has been well evidenced with glass optical fibers that the transition metal ions such
as cobalt, iron, nickel and manganese incorporated during the manufacturing process,
may cause a significant increase of the optical loss. Incorporation of such impurities
may be unavoidable, and they induce light absorption caused by electronic transitions
in the visible and near infrared region of the spectrum. Similar mechanisms or
processes also can take place in POFs [5,7,37].
The presence of small impurities such as polymerization inhibitors, initiators, chain
transfer agents, additives and polymerization byproducts are most likely be the
organic contaminants in POFs can cause a significant increase of the attenuation
either by light absorption or scattering [4,5,37].
Generally, polymers absorb a certain amount of water depending on their kind. The
water absorption by POF core polymers can induce an increase in attenuation cause
mainly by OH vibration absorption overtones and a minor scattering loss due to
agglomeration of water molecules. According to Kaino [5, 47], the most influential
OH absorption overtones are ν6OH, ν5
OH + δOH, ν5OH and ν4
OH + δOH, which appear in
the visible wavelength region 520 nm, 562 nm, 614 nm and 674 nm respectively. δOH
is the OH bending vibration, and νnOH is the nth OH stretching vibration. POFs made
of PMMA and PS show a significant increase in the attenuation due to high water
absorption as compared to POFs made of fluorinated and deuterated polymers. The
impact of O−H and C−H vibrations absorption overtones to the total attenuation is
comparable.
4.3.2 Scattering due to physical imperfections
During the fiber drawing process many imperfections such as dusts, micro-voids,
micro-cracks, core diameter fluctuation, orientation birefringence and core-cladding
4 Optical Loss Mechanism and Reliability of POFs
29
boundary imperfections are accompanied in the fiber. These typical imperfections can
increase the optical loss by light scattering, independent of wavelength.
Dusts, micro-voids and cracks can act as scattering centers and their physical size
mainly decides the light scattering mechanism in the fiber. Mainly the environment of
fiber production plant and fiber drawing temperature conditions introduce these
defects [5,7,37].
Kaino et al. [5] have investigated the influences of core diameter fluctuations and
found an increase of scattering intensity with increased core diameter fluctuations.
The influence of such fluctuations may be very significant when it exceeds 10 %.
Polymers show a certain extent of molecular alignment or orientation. The extent of
molecular orientation of an end polymer product is derived mainly by polymer
processing techniques (e.g.: injection molding, blow molding, compression molding
and extrusion.). It is also known that amorphous glassy polymers such as PMMA and
PS can exhibit molecular orientation. Some studies have shown that orientation
birefringence in glassy PMMA can cause of increased scattering intensity [4,46].
Dugas et al. [48,49] have found an increase of the optical loss due to structural
inhomogenities in the PMMA core fiber caused by molecular orientation, which
occurs as a result of fiber formation. Therefore, molecular orientation can be a serious
issue for the fabrication of low loss POFs.
Core-cladding interface imperfections arise mainly owing to adhesion inferiority of
the cladding [5,36,37]. It is known in optical fiber technology that one of the deciding
factors of the light guiding efficiency of an optical fiber is the adhesion strength of the
cladding [5,36,40]. Therefore, core-cladding imperfections can arise by materials of
the cladding and fiber drawing process as well.
4.4 Reliability of POFs
4.4.1 Environmental effects
POFs and polymer based optical components are referred as technical products, and
utilized for several optical applications under various environments. The
environments can be mechanical, climatic, chemical, biological and radiometric. The
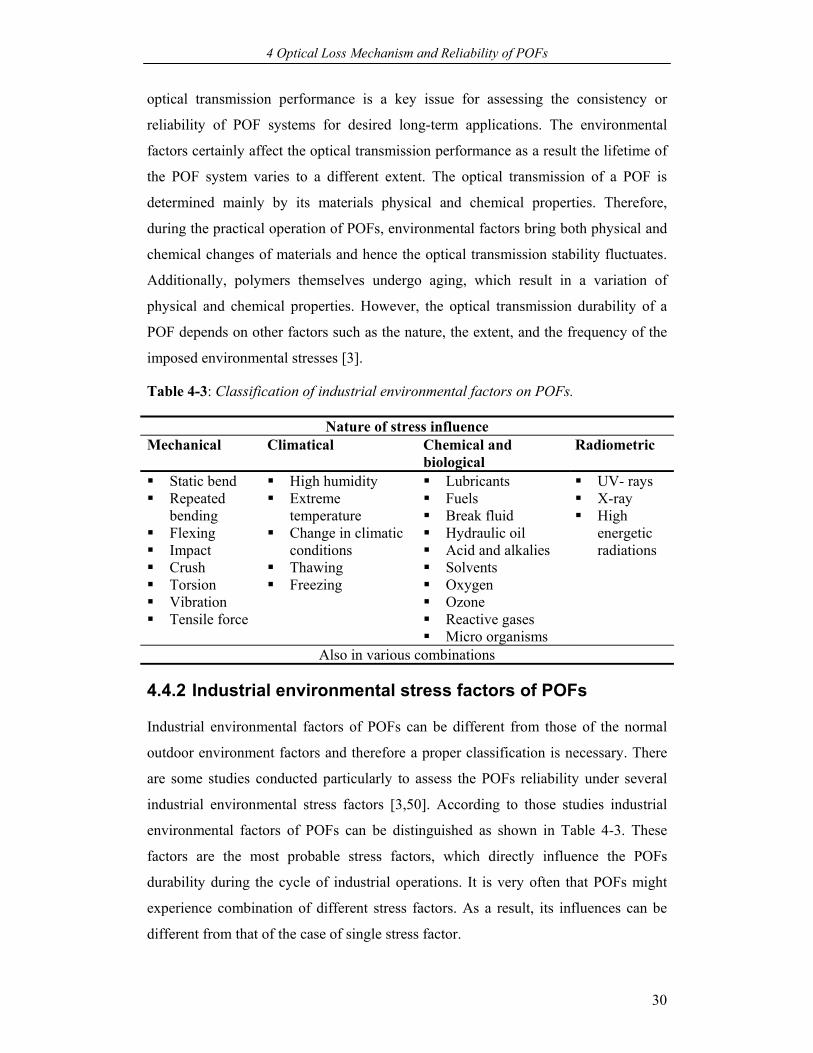
4 Optical Loss Mechanism and Reliability of POFs
30
optical transmission performance is a key issue for assessing the consistency or
reliability of POF systems for desired long-term applications. The environmental
factors certainly affect the optical transmission performance as a result the lifetime of
the POF system varies to a different extent. The optical transmission of a POF is
determined mainly by its materials physical and chemical properties. Therefore,
during the practical operation of POFs, environmental factors bring both physical and
chemical changes of materials and hence the optical transmission stability fluctuates.
Additionally, polymers themselves undergo aging, which result in a variation of
physical and chemical properties. However, the optical transmission durability of a
POF depends on other factors such as the nature, the extent, and the frequency of the
imposed environmental stresses [3].
Table 4-3: Classification of industrial environmental factors on POFs.
Nature of stress influence Mechanical Climatical Chemical and
biological Radiometric
Static bend Repeated
bending Flexing Impact Crush Torsion Vibration Tensile force
High humidity Extreme
temperature Change in climatic
conditions Thawing Freezing
Lubricants Fuels Break fluid Hydraulic oil Acid and alkalies Solvents Oxygen Ozone Reactive gases Micro organisms
UV- rays X-ray High
energetic radiations
Also in various combinations
4.4.2 Industrial environmental stress factors of POFs
Industrial environmental factors of POFs can be different from those of the normal
outdoor environment factors and therefore a proper classification is necessary. There
are some studies conducted particularly to assess the POFs reliability under several
industrial environmental stress factors [3,50]. According to those studies industrial
environmental factors of POFs can be distinguished as shown in Table 4-3. These
factors are the most probable stress factors, which directly influence the POFs
durability during the cycle of industrial operations. It is very often that POFs might
experience combination of different stress factors. As a result, its influences can be
different from that of the case of single stress factor.
4 Optical Loss Mechanism and Reliability of POFs
31
4.4.3 Climatic stability of POFs – State of the art
The industrial environmental factors are as discussed above (see Table 4-3) being the
most probable factors but due to the increasing use of POFs in automotive field, much
interest has been paid to climatic and mechanical reliability studies. Several research
reports concerning POFs reliability can be found especially in Proceedings of the
Polymer Optical Fibers International Conference have been conducted since 13 years.
There are only a few systematic investigations so far to understand the optical loss, in
molecular level, caused by industrial environmental stress factors [5,42,47,51,52,53].
Kaino et al. [5,47] have extensively studied the influences of humidity in different
POFs and found that water absorption leads to increase in optical loss due to light
absorption by water. Takezewa et al. [42] have investigated the effects of high
temperature (150 °C) exposure of crosslinked PMMA based POFs and found that
oxidative degradation products of the core polymer cause an increase of the optical
loss by light absorption. Schartel et al. [51,52] have studied the thermo-oxidative
degradation behavior of PMMA based SI-POFs. They have found that the optical
transmission stability of POFs is most likely be governed by the thermo-oxidative
stability of the core.
Though the climatic reliability investigations made by Daum et al. [3 and related
articles can be found in Proceedings of the POF conference] have come up with
significant results in predicting the stability of POFs but unable to describe strong
evidences for the instability caused by the climatic factors e.g.: temperature and
humidity. However, they have proposed a model for the deterioration of the optical
transmission under high temperature and humid conditions [3,54]. According to the
model, the loss of optical transmission of SI POFs (cables) occurs in four steps: a
definite loss of transmission within a short period (25 hours to 50 hours) after the
exposure start, following a very slow deterioration of transmission, following a phase
is characterized by rapid decline in the transmission and finally a uncommon but
typical process of increase of the transmission to a higher level when the humidity is
varied while the temperature is kept constant.
5 Thermal Oxidative Degradation of Polymers
32
5 Thermal Oxidative Degradation of Polymers
5.1 Introduction - polymer degradation
The term polymer degradation [55] is used to denote changes in physical and
chemical properties caused by chemical reactions involving the bond rupture
(scission) of the backbone of macromolecules.
The basic reactions steps of polymer degradation are initiation, propagation and
termination of radicals, which are the opposite processes of the polymerization of
monomers. The chemical reactions that occur by degradation can be broadly divided
into two mechanisms:
Chain reactions.
Non-chain (or single step) reactions.
Typically, chain reactions can lead to smaller fragments by the rupture of main chain
bonds. Low molecular weight compounds evolved by the rupture of main chain and
side chain bonds, elimination, crosslinking and cyclization reactions are commonly
resulted from non-chain reactions.
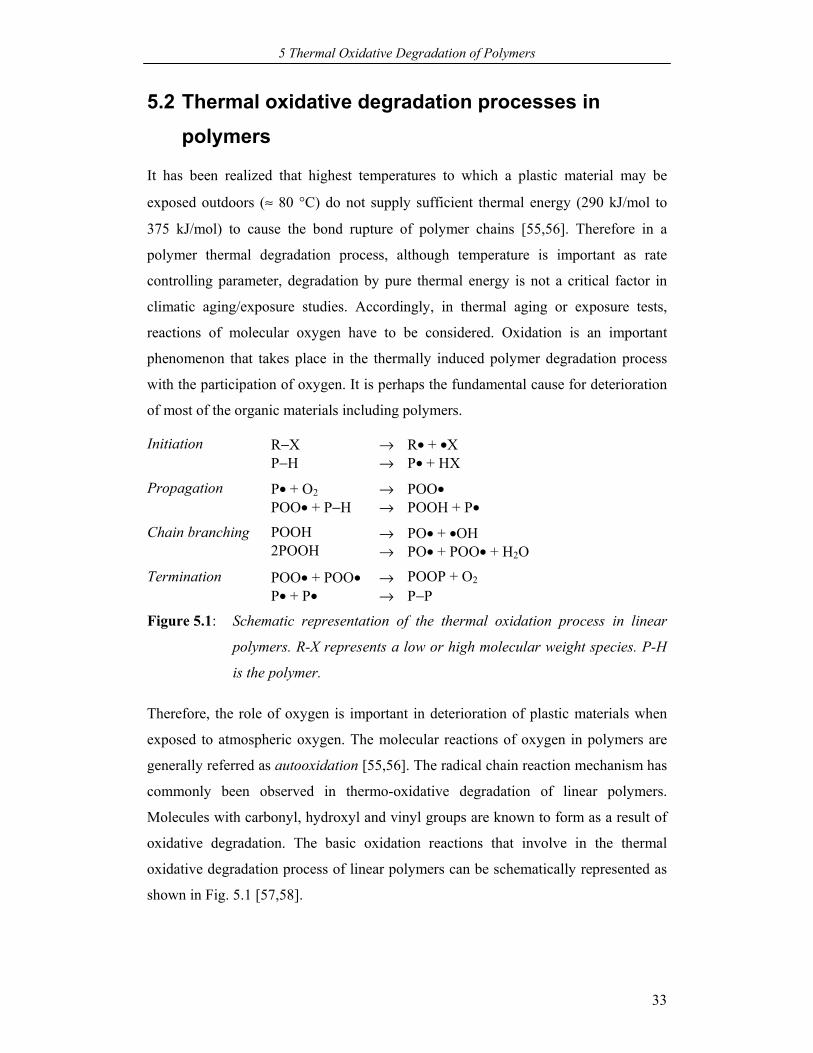
5 Thermal Oxidative Degradation of Polymers
33
5.2 Thermal oxidative degradation processes in polymers
It has been realized that highest temperatures to which a plastic material may be
exposed outdoors (≈ 80 °C) do not supply sufficient thermal energy (290 kJ/mol to
375 kJ/mol) to cause the bond rupture of polymer chains [55,56]. Therefore in a
polymer thermal degradation process, although temperature is important as rate
controlling parameter, degradation by pure thermal energy is not a critical factor in
climatic aging/exposure studies. Accordingly, in thermal aging or exposure tests,
reactions of molecular oxygen have to be considered. Oxidation is an important
phenomenon that takes place in the thermally induced polymer degradation process
with the participation of oxygen. It is perhaps the fundamental cause for deterioration
of most of the organic materials including polymers.
Initiation R−X → R• + •X P−H → P• + HX
Propagation P• + O2 → POO• POO• + P−H → POOH + P•
Chain branching POOH → PO• + •OH 2POOH → PO• + POO• + H2O
Termination POO• + POO• → POOP + O2 P• + P• → P−P
Figure 5.1: Schematic representation of the thermal oxidation process in linear
polymers. R-X represents a low or high molecular weight species. P-H
is the polymer.
Therefore, the role of oxygen is important in deterioration of plastic materials when
exposed to atmospheric oxygen. The molecular reactions of oxygen in polymers are
generally referred as autooxidation [55,56]. The radical chain reaction mechanism has
commonly been observed in thermo-oxidative degradation of linear polymers.
Molecules with carbonyl, hydroxyl and vinyl groups are known to form as a result of
oxidative degradation. The basic oxidation reactions that involve in the thermal
oxidative degradation process of linear polymers can be schematically represented as
shown in Fig. 5.1 [57,58].
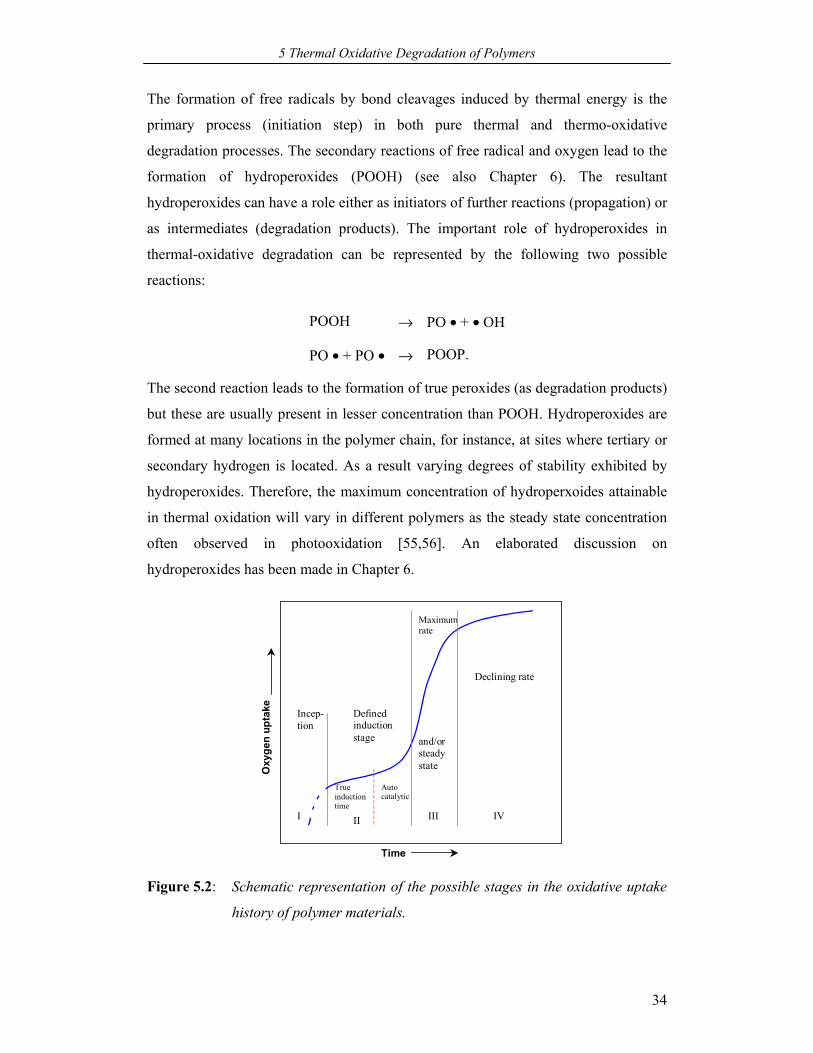
5 Thermal Oxidative Degradation of Polymers
34
The formation of free radicals by bond cleavages induced by thermal energy is the
primary process (initiation step) in both pure thermal and thermo-oxidative
degradation processes. The secondary reactions of free radical and oxygen lead to the
formation of hydroperoxides (POOH) (see also Chapter 6). The resultant
hydroperoxides can have a role either as initiators of further reactions (propagation) or
as intermediates (degradation products). The important role of hydroperoxides in
thermal-oxidative degradation can be represented by the following two possible
reactions:
POOH → PO • + • OH
PO • + PO • → POOP.
The second reaction leads to the formation of true peroxides (as degradation products)
but these are usually present in lesser concentration than POOH. Hydroperoxides are
formed at many locations in the polymer chain, for instance, at sites where tertiary or
secondary hydrogen is located. As a result varying degrees of stability exhibited by
hydroperoxides. Therefore, the maximum concentration of hydroperxoides attainable
in thermal oxidation will vary in different polymers as the steady state concentration
often observed in photooxidation [55,56]. An elaborated discussion on
hydroperoxides has been made in Chapter 6.
Time
Oxy
gen
upta
ke
I III IV
Incep- tion
Defined induction stage
Declining rate
Maximum rate
and/orsteady state
True induction time
Auto catalytic
II
Figure 5.2: Schematic representation of the possible stages in the oxidative uptake
history of polymer materials.
5 Thermal Oxidative Degradation of Polymers
35
It is known that many polymer materials tend to deteriorate in stages during the
thermal aging/exposure in the presence of atmospheric oxygen. The stages of
deterioration can be related to the stages of oxygen uptake by polymer materials.
Grassie and Feller [56] have discussed this subject in more detail. According to them
the possible stages of oxidative history of a polymer sample can be schematically
represented as shown in Fig. 5.2.
In the presence of weak bonds or links in the polymer chain the initiation of
degradation (either pure thermal or oxidative) is more prone to occur than at the so-
called stronger bonds (main chain and side chain bonds). The weak links or bonds are
(e.g.: π-bonds and head to head linkages in the main chain) referred to molecular
bonds of low dissociation energy [55,58].
5.2.1 Maximum rate of oxygen consumption or induction time
The induction time (also referred as time to failure of plastic materials) in oxidative
deterioration that involves the formation of hydroperoxides may be precisely defined
as the time of exposure before the maximum rate of oxygen consumption occurs
under any given set of conditions [56]. The maximum rate of oxygen consumption
can be generally related to the failure of the plastic material during the exposure tests.
The induction time varies with the molecular nature and physical state of polymers
substances. For instance, polyolefins and polyamides show a large variation in the
induction time during their thermo-oxidative degradation [56].
5.2.2 Oxygen diffusion control in polymers
At room temperature, reactions of the polymer with oxygen are purely diffusion
controlled and therefore the consumption of oxygen may be limited by the diffusion
of oxygen into the interior of the polymer sample. The temperature controlled
diffusion process in polymers can be expressed by the following Arrhenius type
equation [29,59]:
−
=RTEDD D
c exp0 , (5-1)
where D0 is independent pre-exponential, ED is activation energy for diffusion, R is
gas constant and T is absolute temperature. The ED for rubbery materials is higher
5 Thermal Oxidative Degradation of Polymers
36
than that for glassy materials. Therefore, the diffusion of oxygen is likely to be greater
at higher temperatures usually employed in thermal degradation studies. The energy
of activation for the diffusion is known to be lower (42 kJ/mol) than that of thermally
induced chemical reactions (84 kJ/mol or higher). The sample thickness is also a
limiting factor for the rate of reaction with oxygen relative to the rate of its diffusion
to the reactive sites. However, the critical thickness will not remain same as thermal
experiments are conducted at increasingly higher temperatures. Therefore, at higher
temperatures the reaction rate may be independent of diffusion limitation differed by
the thickness.
The diffusion of oxygen in a polymer substance of known thickness, under mild
conditions, can be expressed by using the Fick’s second law of diffusion according to
the equation [56,59]:
[ ] [ ] [ ] [ ]•=∂
∂=∂
∂ ROkxOD
tO
222
22 , (5-2)
where t is time, x is depth and [] represents the concentration.
Therefore, in a thermo-oxidative degradation process, the rate constant for the
formation of peroxides depends on the concentration of oxygen in the polymer
sample. Accordingly, the diffusion of oxygen directly relates the oxygen partial
pressure in the sample.
5.3 The role of moisture in oxidative degradation of polymers
Degradation of polymers usually is speeded up by the presence of moisture.
Generally, there are four important effects related to water in climatic degradation of
polymers [56].
Chemical: hydrolysis of functional groups such as ester and amide.
Physical: loss of the bond between the substrate and the polymer.
Photochemical: generation of hydroxyl radicals or other chemical species.
Physical/chemical: possible facilitation of ionization and the mobility of ionic
entities.
5 Thermal Oxidative Degradation of Polymers
37
Unfortunately, not much literature data are available regarding the particular role of
water in thermal-oxidative degradation due to climatic exposure. Nevertheless, it is
reported that water has a very little influence on free radical oxidation reactions that
involve in thermo-oxidative and photooxidative degradation of polymers [56]. It is
also reported that if the processes of thermal-oxidative deterioration depends on the
concentration of water in the polymer (e.g.: yarns of Nylon and Kevlar), it is useful to
consider the total rate of reaction meaning the combination of rate equations for
thermo-oxidative and thermo-hydrolytic [56]. Startsev et al. [60] have stated that
water can act as an activator for chemical reactions of deterioration and oxidation by
an increase of the molecular motion of the polymer chain when exposed to the humid
climate. Therefore, water could influence either directly or indirectly the degradation
reactions of the polymers when exposed to humidity.
In thermal aging tests, the relationship of the rate of deterioration in relation to
relative humidity (RH) is customarily considered. RH is the moisture content of air
relative to the maximum possible content of water in air at a particular temperature
and pressure. Therefore, the actual moisture content in a polymer substance is the
controlling factor directly relates the partial pressure of water vapor in a given
atmosphere. Because the moisture content is generally a result of an absorption
process, in most polymers substances of known thickness, the commonly encountered
deterioration response to relative humidity is an S-shaped curve [56]. The adsorption
isotherm is the main reason for this kind behavior and it can be expressed by two
well-known equations that are Freundlich and Langmuir’s adsorption isotherm [59].
5.3.1 Dual mechanism of water transportation
Water transport in amorphous glassy polymers such as PMMA takes place with a dual
mechanism. Part of water enters into the polymer network and causes the swelling of
the polymer, and part of it accommodates into pre-existing micro voids (or defects).
According to Turner [61], water uptake by the dual mechanism in PMMA may be
expressed (at equilibrium) by the following equation:
wfwD ⋅= , (5-3)
where wD indicates the weight percentage of water dissolved in the polymer and w is
the total water percentage including the amount of water allocated into micro voids of
5 Thermal Oxidative Degradation of Polymers
38
the polymer, f denotes the partitioning of water between two sorption modes and is a
constant at a given temperature.
5.3.2 Reversible and irreversible physical influences of water
It is known that water acts as a polar plasticizer for several organic polymers [56,60].
The plasticization effect of water usually results in a reduction of the glass transition
temperature (Tg) (also a reduction of strength and elasticity modulus) and an increase
of the thermal expansion co-efficient (αT).
The reduction of Tg of polymers during the climatic aging in the presence of humidity,
depends on the extent of water that is absorbed by the polymer and it may be
expressed by the following equation [60,62]:
( )gmgg TTk
dwdT
−−= , (5-4)
with limiting conditions Tg = Tg0 at w = 0; Tg = Tgm and dTg/dw = 0 at wm, where wm
is the maximum amount of absorbed water. At w > wc (some critical concentration),
the value of the exponent k indicator decreases.
The αT of polymers during the climatic aging in the presence of humidity, depends on
the water concentration w according to the equation shown below [60,62]:
( ) ( )[ ]wTkTTT += 10
αα (5-5)
where αT0 is the linear thermal expansion co-efficient, k(T) the co-efficient constant
which depends upon the measuring temperature.
The above two equations follow the classical theories of free volume or lattice models
and are true for a limited area of low concentrations of water.
The plasticizing effects of water in polymers during the climatic aging are completely
reversible when the supramolecular structure of the polymer remains unchanged and
chemical transformations are insignificant. This happens if the exposed polymer
sample is not heated beyond Tg of disordered regions of the polymer because the
molecular mobility of the segmental type is frozen at T < Tg. The plasticizing effects
are completely irreversible when water interacts with the segmental mobility of
polymer chains and this happens at T > Tg. This is often referred as structural
5 Thermal Oxidative Degradation of Polymers
39
relaxation of polymers by water. The absorbed water acting as plasticizer, reduces Tg
provides the segmental mobility and defreeze the physical process of structural
relaxation.
5.3.3 Chemical interaction of water in polymers
The transportation or absorption of water in polymer materials can lead to both
physical and chemical changes through chemical reactions predominantly hydrolysis
of the functional groups of the polymer [56]. The formation of hydrogen bonds
between water molecules and polymer chains (functional groups) is the main result of
chemical interaction of water with the polymer [63]. In some synthetic polymers such
as poly(vinyl acetate) and in biopolymers complete hydrolysis can take place,
however, several synthetic polymers undergo partial hydrolysis in the presence of
water [30]. The partial hydrolysis may be referred as hydration. Nevertheless, the
complete hydrolysis of the functional groups of a polymer is possible to take place
under either acidic or basic medium condition in an exposure to water or humidity for
longer period [56]. It is stated that during the acid hydrolysis some branching and
crosslinking also take place and therefore the degradation reaction is quite indistinct
[58]. Furthermore, the extent of the interaction of water with polymer chains on the
other hand can lead to different states of the water content in the polymer.
6 Chemiluminescence Method of Investigation of Thermal Oxidative Stability/Degradation
40
6 Chemiluminescence Method of Investigation of Thermal Oxidative Stability/Degradation
6.1 Chemiluminescence (CL) – General remarks
If atoms or molecules are electronically excited by an external energy and emit this
exciting energy, partly or totally, as radiation, this radiation is called luminescence.
The time difference between excitation and emission is at least 10–9 sec, but may
reach up to 105 sec. The first case may be called as fluorescence and the latter as
phosphorescence [64]
There are a lot of sources for the excitation, which are related to different
luminescence technique such as thermo-, pyro-, photo-, radio-, electro-, tribo-, crysto-,
bio- and chemi- luminescence. Eilhard Wiedemann [65] was the first to introduce the
term chemilunimescence to describe light, generated by chemical reactions. More
precisely, CL involves chemical reactions (often with oxygen), which produce atoms
or molecules in electronically excited states in sufficient quantity. By relaxation to the
ground state a broad spectrum of light is emitted, usually with wavelengths from 400
nm to 800 nm [65].
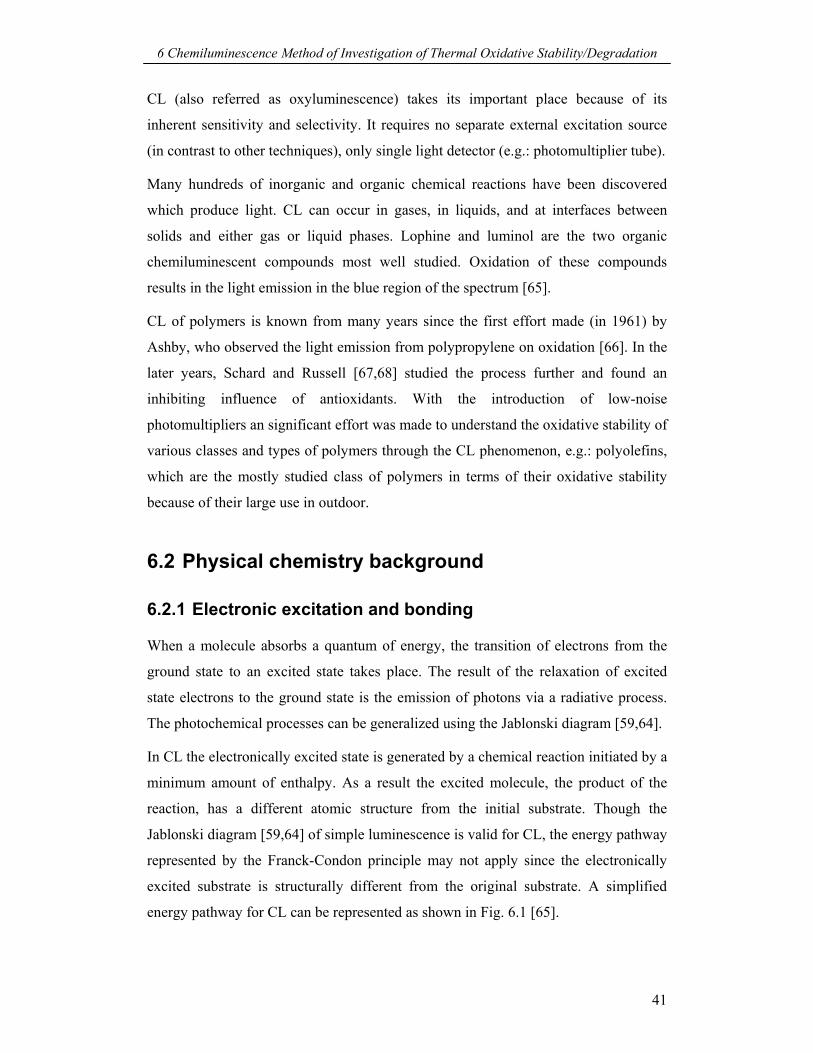
6 Chemiluminescence Method of Investigation of Thermal Oxidative Stability/Degradation
41
CL (also referred as oxyluminescence) takes its important place because of its
inherent sensitivity and selectivity. It requires no separate external excitation source
(in contrast to other techniques), only single light detector (e.g.: photomultiplier tube).
Many hundreds of inorganic and organic chemical reactions have been discovered
which produce light. CL can occur in gases, in liquids, and at interfaces between
solids and either gas or liquid phases. Lophine and luminol are the two organic
chemiluminescent compounds most well studied. Oxidation of these compounds
results in the light emission in the blue region of the spectrum [65].
CL of polymers is known from many years since the first effort made (in 1961) by
Ashby, who observed the light emission from polypropylene on oxidation [66]. In the
later years, Schard and Russell [67,68] studied the process further and found an
inhibiting influence of antioxidants. With the introduction of low-noise
photomultipliers an significant effort was made to understand the oxidative stability of
various classes and types of polymers through the CL phenomenon, e.g.: polyolefins,
which are the mostly studied class of polymers in terms of their oxidative stability
because of their large use in outdoor.
6.2 Physical chemistry background
6.2.1 Electronic excitation and bonding
When a molecule absorbs a quantum of energy, the transition of electrons from the
ground state to an excited state takes place. The result of the relaxation of excited
state electrons to the ground state is the emission of photons via a radiative process.
The photochemical processes can be generalized using the Jablonski diagram [59,64].
In CL the electronically excited state is generated by a chemical reaction initiated by a
minimum amount of enthalpy. As a result the excited molecule, the product of the
reaction, has a different atomic structure from the initial substrate. Though the
Jablonski diagram [59,64] of simple luminescence is valid for CL, the energy pathway
represented by the Franck-Condon principle may not apply since the electronically
excited substrate is structurally different from the original substrate. A simplified
energy pathway for CL can be represented as shown in Fig. 6.1 [65].
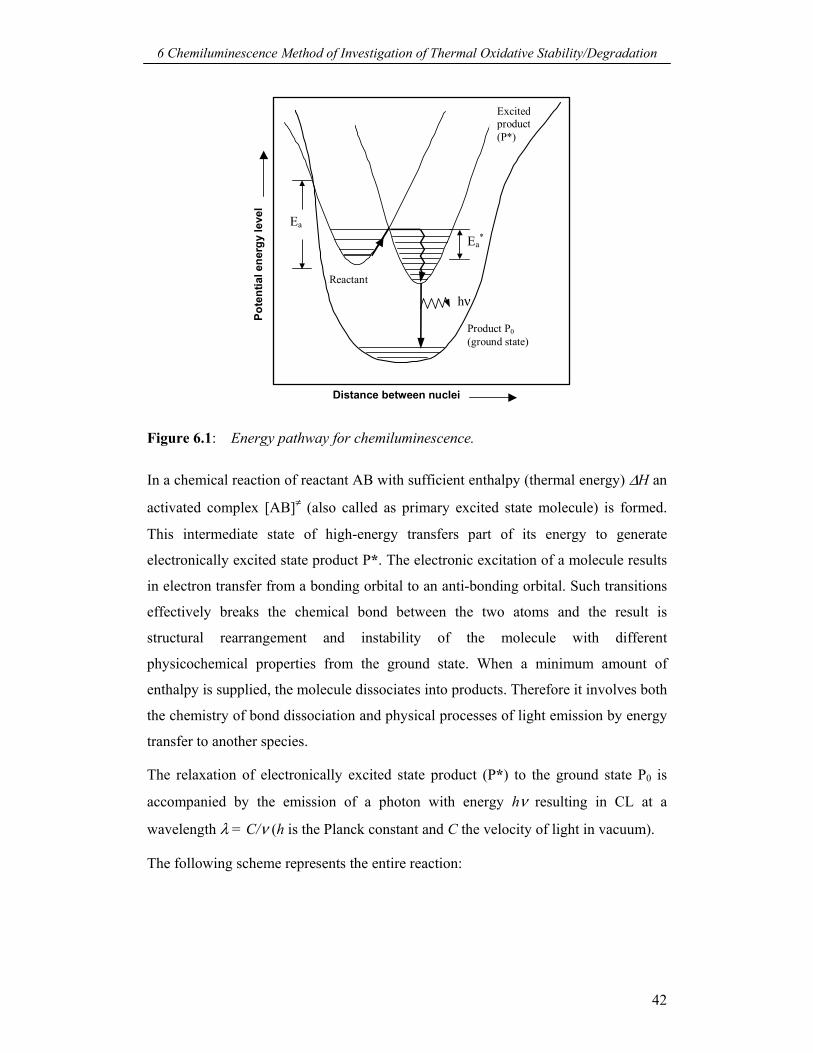
6 Chemiluminescence Method of Investigation of Thermal Oxidative Stability/Degradation
42
Pote
ntia
l ene
rgy
leve
l
Distance between nuclei
Ea Ea
*
Reactant
Product P0(ground state)
Excitedproduct(P*)
hν
Figure 6.1: Energy pathway for chemiluminescence.
In a chemical reaction of reactant AB with sufficient enthalpy (thermal energy) ∆H an
activated complex [AB]≠ (also called as primary excited state molecule) is formed.
This intermediate state of high-energy transfers part of its energy to generate
electronically excited state product P*. The electronic excitation of a molecule results
in electron transfer from a bonding orbital to an anti-bonding orbital. Such transitions
effectively breaks the chemical bond between the two atoms and the result is
structural rearrangement and instability of the molecule with different
physicochemical properties from the ground state. When a minimum amount of
enthalpy is supplied, the molecule dissociates into products. Therefore it involves both
the chemistry of bond dissociation and physical processes of light emission by energy
transfer to another species.
The relaxation of electronically excited state product (P*) to the ground state P0 is
accompanied by the emission of a photon with energy hν resulting in CL at a
wavelength λ = C/ν (h is the Planck constant and C the velocity of light in vacuum).
The following scheme represents the entire reaction:
6 Chemiluminescence Method of Investigation of Thermal Oxidative Stability/Degradation
43
AB
∆H→
[AB]≠
[AB]≠ → P*
P* → P0 + hν
∆H represents enthalpy of the reaction.
A chemiluminescent reaction has three essential features:
A sufficient high level of energy must be generated by the reaction for the
formation of an electronically excited state.
There must be a pathway by which this energy can be supplied to form an
electronically excited state.
The excited state product must be capable of losing its energy as a photon by
relaxation to the ground state.
6.2.2 Excitation by chemical reactions
Free energy (∆G) of a chemical reaction is given by [59,64]:
∆G = ∆H − T∆S (6-1)
where T is temperature.
For the CL reactions the entropy change (∆S) is very small, therefore ∆H and ∆G are
very similar in magnitude.
A minimum energy has to be absorbed to initiate the chemical reaction, the activation
energy (∆Ha). With this activation energy and enthalpy of the reaction (∆HR), the
energy available in a chemical reaction to produce a photon is given by:
Energy available = ∆Ha − ∆HR ≥ ∆E*≥ hν (6-2)
where ∆E* is the energy required to generate an electronically excited product.
∆E* will be higher than the energy required to produce a photon since the energy will
be lost during the complete process, however the required energy (∆E*) is ≥ 290
kJ/mol. The activation energy (∆Ha) of a chemiluminescent reaction will not be too
high if the reaction has to proceed to an observable rate. Normally, ∆Ha required for
6 Chemiluminescence Method of Investigation of Thermal Oxidative Stability/Degradation
44
organic bimolecular and unimolecular oxidation reaction is ≤ 150 kJ/mol and ≤ 100
kJ/mol respectively. Therefore, ∆HR is the main contributor to the excitation energy in
a chemiluminescent reaction.
The most common possible mechanisms with sufficient energy for generating an
excited state product are:
Electron transfer (e.g.: O + O + SO2 → O2 + SO2* → O2 + SO2 + hν).
Cleavage of linear or cyclic peroxides.
Cleavage of linear or cyclic peroxides is the most commonly observed reaction in
organic CL reactions. The most common excited product in an organic CL reaction,
where the oxidant is oxygen or its derivatives, is the carbonyl of a ketone.
6.2.3 Chemiluminescence and quantum yield
The exact detailed reaction mechanism of chemiluminescence has not been identified,
however some possible mechanisms that have been proposed so far are commonly
accepted for the evidence of CL [65,69,70]. The proposed mechanisms (for liquid
hydrocarbons) of the light emission are generally based on either a bimolecular
termination of peroxy radicals or direct decomposition of hydroperoxides or
metathesis reactions or molecular rearrangement, which are exoenergetic reactions in
nature.
The Russell mechanism (Fig. 6.2) [69-73] is the most widely used mechanism for the
description of CL in liquid phase oxidation of hydrocarbons but also discussed for
organic polymers. In this mechanism, the light emission reaction is a bimolecular
termination of alkyl (primary or secondary) peroxy radicals produced from the radical
autooxidation mechanism. Recombination of two active peroxy radicals produces an
excited carbonyl group directly through the cleavage of a six-membered ring as an
intermediate. An alcohol and an oxygen molecule are resulted as termination
byproducts. The formed excited carbonyl group stays directly in the triplet state,
which upon relaxing to the singlet ground state results in the emission of photons.
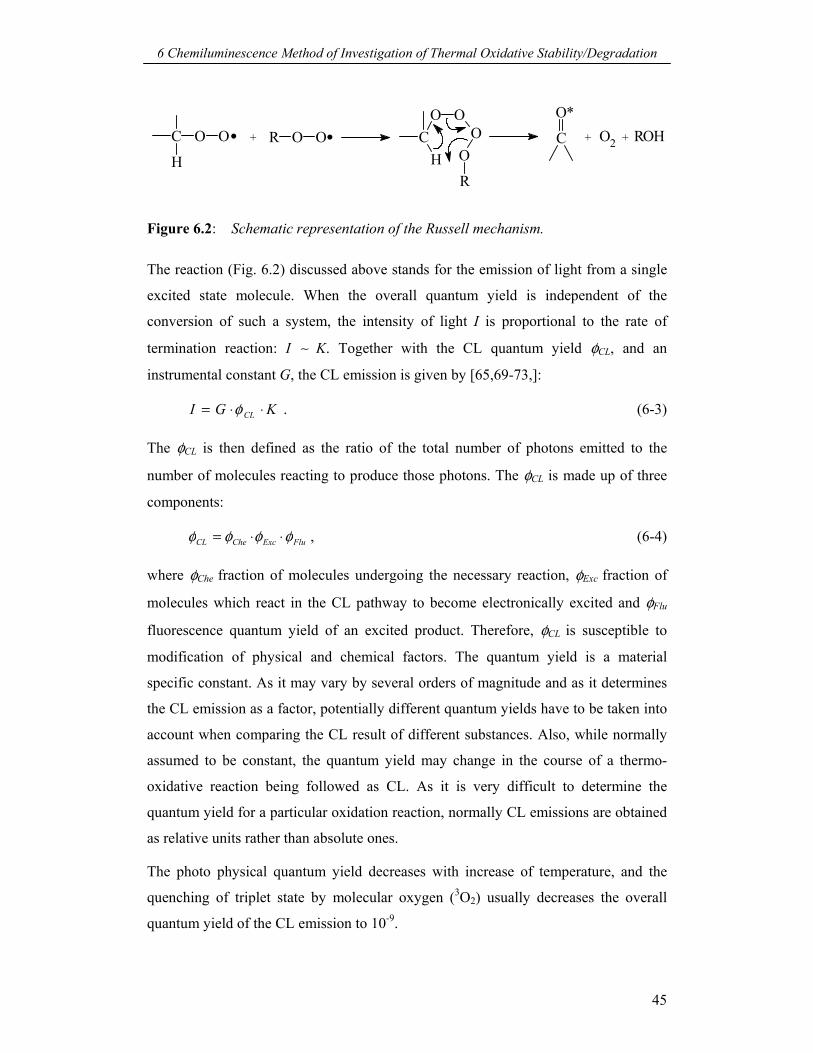
6 Chemiluminescence Method of Investigation of Thermal Oxidative Stability/Degradation
45
C
H
O O. + R O O CO O
HR
OO C
O*+ +O2 ROH.
Figure 6.2: Schematic representation of the Russell mechanism.
The reaction (Fig. 6.2) discussed above stands for the emission of light from a single
excited state molecule. When the overall quantum yield is independent of the
conversion of such a system, the intensity of light I is proportional to the rate of
termination reaction: I ∼ K. Together with the CL quantum yield φCL, and an
instrumental constant G, the CL emission is given by [65,69-73,]:
KGI CL ⋅⋅= φ . (6-3)
The φCL is then defined as the ratio of the total number of photons emitted to the
number of molecules reacting to produce those photons. The φCL is made up of three
components:
FluExcCheCL φφφφ ⋅⋅= , (6-4)
where φChe fraction of molecules undergoing the necessary reaction, φExc fraction of
molecules which react in the CL pathway to become electronically excited and φFlu
fluorescence quantum yield of an excited product. Therefore, φCL is susceptible to
modification of physical and chemical factors. The quantum yield is a material
specific constant. As it may vary by several orders of magnitude and as it determines
the CL emission as a factor, potentially different quantum yields have to be taken into
account when comparing the CL result of different substances. Also, while normally
assumed to be constant, the quantum yield may change in the course of a thermo-
oxidative reaction being followed as CL. As it is very difficult to determine the
quantum yield for a particular oxidation reaction, normally CL emissions are obtained
as relative units rather than absolute ones.
The photo physical quantum yield decreases with increase of temperature, and the
quenching of triplet state by molecular oxygen (3O2) usually decreases the overall
quantum yield of the CL emission to 10-9.
6 Chemiluminescence Method of Investigation of Thermal Oxidative Stability/Degradation
46
6.3 Evaluation of polymer oxidation processes
Polymer long-term performance can imply many things, however one of the most
important of those is the ability to resist the deteriorating effects of climatic
exposures, to which oxidation is a prominent contributor. Basically, the oxidation
process of polymers can be studied using the techniques such as differential scanning
calorimetry (DSC) and infrared (IR), and also by analysis of reaction products.
However, CL has attracted much attention because of its close association with
oxidation and its extreme sensitivity, which permits the study of oxidative reactions at
very early stages (much earlier than those at which IR and DSC become sufficiently
effective) [65,69].
Ultraweak CL from oxidation of organic substances has been known for many years
and the pioneering work of Ashby [66] and others [65-69], demonstrated CL from
oxidation of a variety of polymers. These earlier studies have noticed the following:
Significant light emission requires oxygen to be present, and the intensity is
proportional to the partial pressure of oxygen in contact with the surface.
The integrated emission intensity is proportional to the concentration of carbonyl
groups produce in the oxidation process.
Radical scavenging antioxidants decrease the intensity of light emission and
introduce an induction time before a significant light emission is observed.
Peroxide decomposing stabilizers also introduce an induction period in the CL
curve.
6.3.1 Polymer oxidation scheme for chemiluminescence
The oxidation scheme or model for organic polymers is based on the autooxidation
mechanism as generally represented for oxidation of liquid hydrocarbons. The
oxidation scheme for CL emission by polymers can be represented as shown in Fig.
6.3 [71-76].
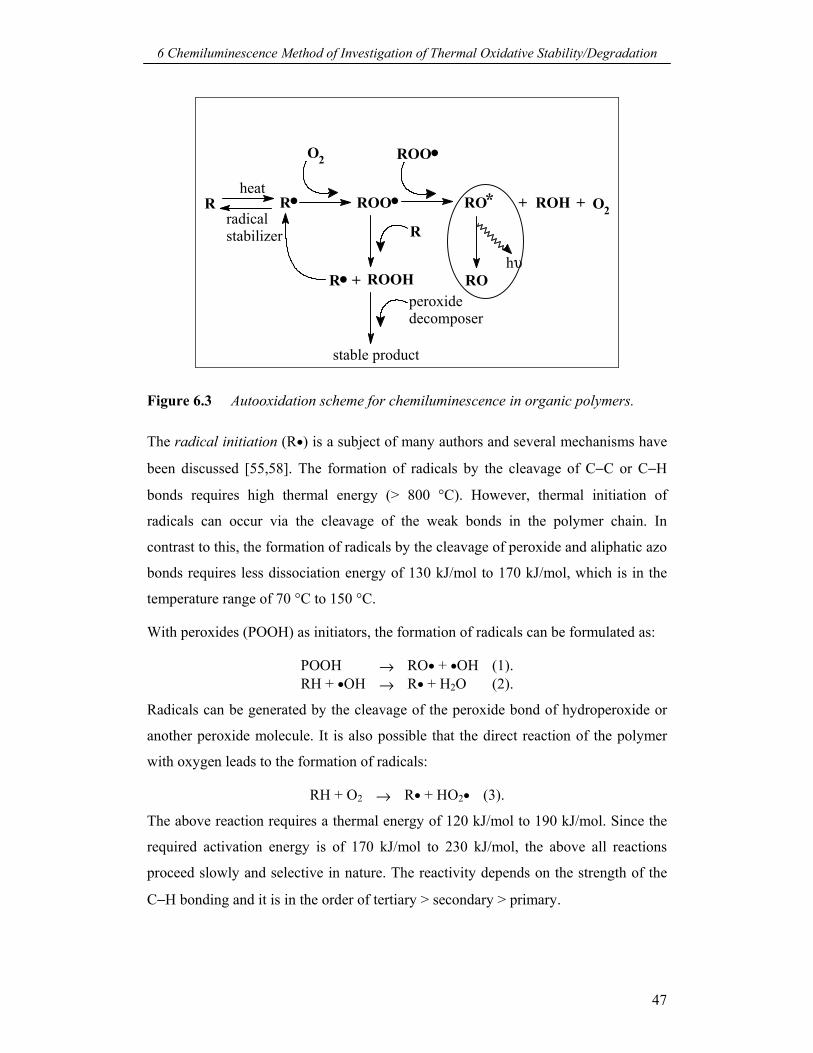
6 Chemiluminescence Method of Investigation of Thermal Oxidative Stability/Degradation
47
hυ
heat
radical stabilizer
R R ROO
RO
ROH O2+ +
ROOH+R
. ..
ROO.O2
R
stable product
peroxidedecomposer
*RO
Figure 6.3 Autooxidation scheme for chemiluminescence in organic polymers.
The radical initiation (R•) is a subject of many authors and several mechanisms have
been discussed [55,58]. The formation of radicals by the cleavage of C−C or C−H
bonds requires high thermal energy (> 800 °C). However, thermal initiation of
radicals can occur via the cleavage of the weak bonds in the polymer chain. In
contrast to this, the formation of radicals by the cleavage of peroxide and aliphatic azo
bonds requires less dissociation energy of 130 kJ/mol to 170 kJ/mol, which is in the
temperature range of 70 °C to 150 °C.
With peroxides (POOH) as initiators, the formation of radicals can be formulated as:
POOH → RO• + •OH (1).RH + •OH → R• + H2O (2).
Radicals can be generated by the cleavage of the peroxide bond of hydroperoxide or
another peroxide molecule. It is also possible that the direct reaction of the polymer
with oxygen leads to the formation of radicals:
RH + O2 → R• + HO2• (3).
The above reaction requires a thermal energy of 120 kJ/mol to 190 kJ/mol. Since the
required activation energy is of 170 kJ/mol to 230 kJ/mol, the above all reactions
proceed slowly and selective in nature. The reactivity depends on the strength of the
C−H bonding and it is in the order of tertiary > secondary > primary.
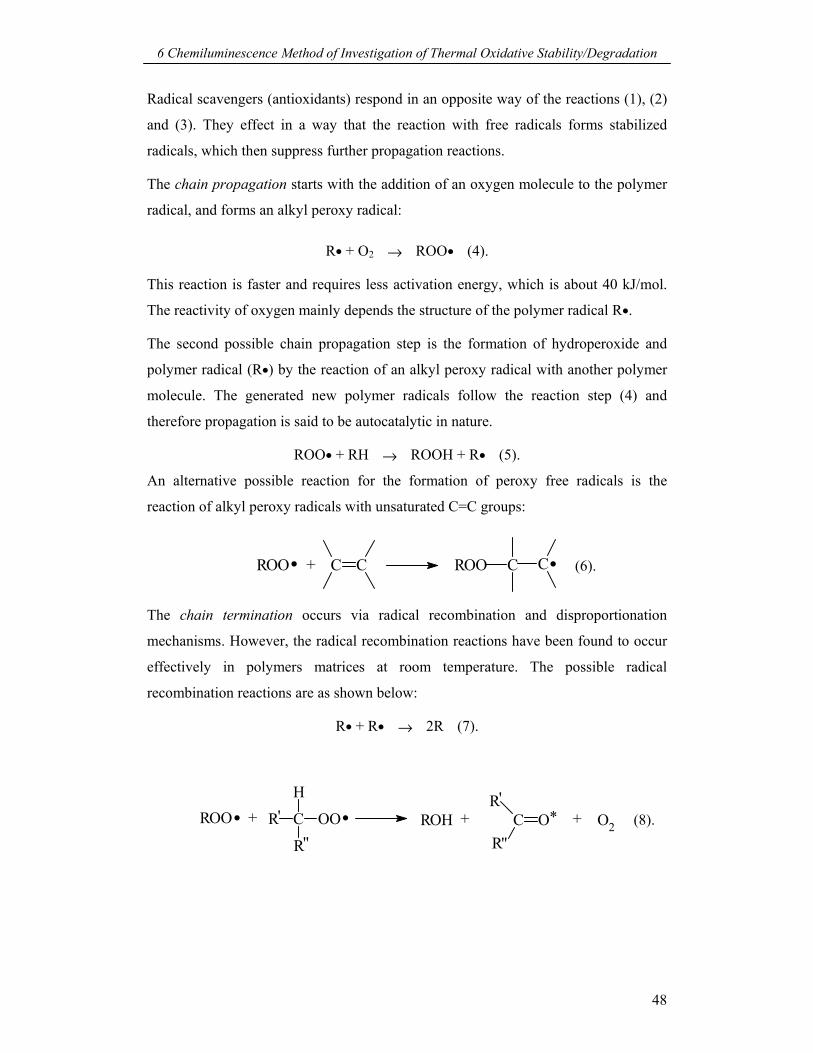
6 Chemiluminescence Method of Investigation of Thermal Oxidative Stability/Degradation
48
Radical scavengers (antioxidants) respond in an opposite way of the reactions (1), (2)
and (3). They effect in a way that the reaction with free radicals forms stabilized
radicals, which then suppress further propagation reactions.
The chain propagation starts with the addition of an oxygen molecule to the polymer
radical, and forms an alkyl peroxy radical:
R• + O2 → ROO• (4).
This reaction is faster and requires less activation energy, which is about 40 kJ/mol.
The reactivity of oxygen mainly depends the structure of the polymer radical R•.
The second possible chain propagation step is the formation of hydroperoxide and
polymer radical (R•) by the reaction of an alkyl peroxy radical with another polymer
molecule. The generated new polymer radicals follow the reaction step (4) and
therefore propagation is said to be autocatalytic in nature.
ROO• + RH → ROOH + R• (5).
An alternative possible reaction for the formation of peroxy free radicals is the
reaction of alkyl peroxy radicals with unsaturated C=C groups:
ROO. + C C ROO C C.
(6).
The chain termination occurs via radical recombination and disproportionation
mechanisms. However, the radical recombination reactions have been found to occur
effectively in polymers matrices at room temperature. The possible radical
recombination reactions are as shown below:
R• + R• → 2R (7).
ROO. + R' C
H
R''OO ROH C
R''O*
R'O2++.
(8).
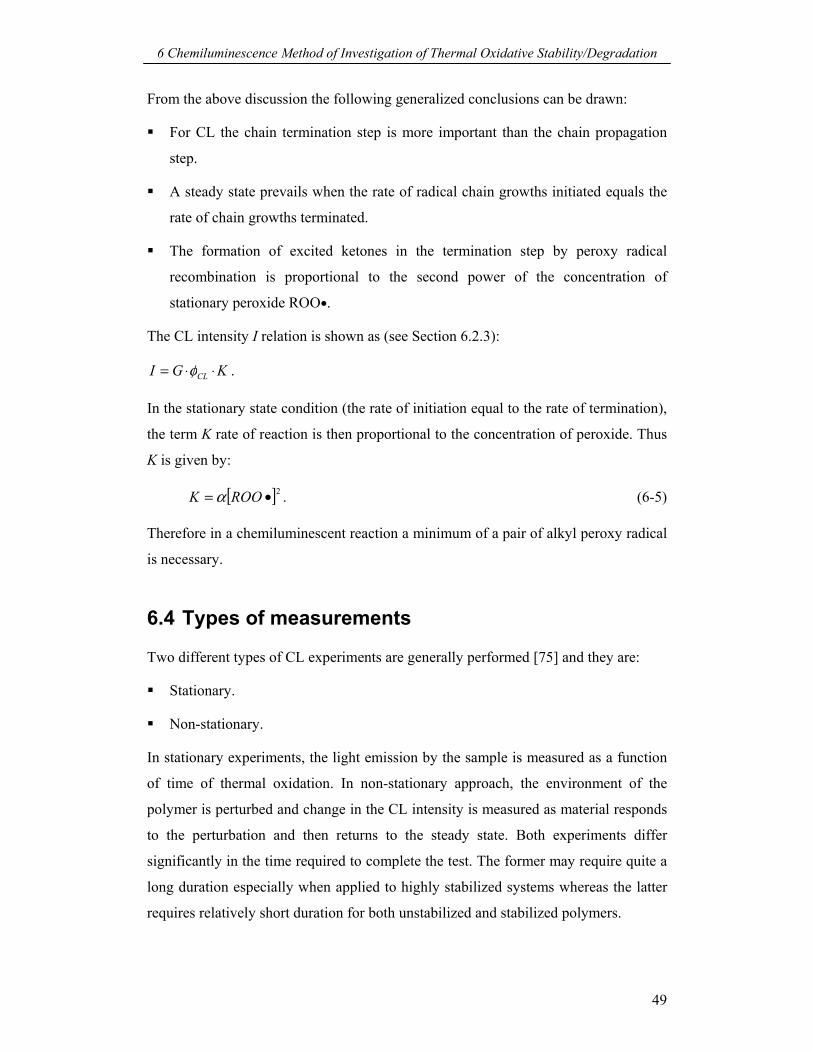
6 Chemiluminescence Method of Investigation of Thermal Oxidative Stability/Degradation
49
From the above discussion the following generalized conclusions can be drawn:
For CL the chain termination step is more important than the chain propagation
step.
A steady state prevails when the rate of radical chain growths initiated equals the
rate of chain growths terminated.
The formation of excited ketones in the termination step by peroxy radical
recombination is proportional to the second power of the concentration of
stationary peroxide ROO•.
The CL intensity I relation is shown as (see Section 6.2.3):
KGI CL ⋅⋅= φ .
In the stationary state condition (the rate of initiation equal to the rate of termination),
the term K rate of reaction is then proportional to the concentration of peroxide. Thus
K is given by:
[ ]2•= ROOK α . (6-5)
Therefore in a chemiluminescent reaction a minimum of a pair of alkyl peroxy radical
is necessary.
6.4 Types of measurements
Two different types of CL experiments are generally performed [75] and they are:
Stationary.
Non-stationary.
In stationary experiments, the light emission by the sample is measured as a function
of time of thermal oxidation. In non-stationary approach, the environment of the
polymer is perturbed and change in the CL intensity is measured as material responds
to the perturbation and then returns to the steady state. Both experiments differ
significantly in the time required to complete the test. The former may require quite a
long duration especially when applied to highly stabilized systems whereas the latter
requires relatively short duration for both unstabilized and stabilized polymers.
6 Chemiluminescence Method of Investigation of Thermal Oxidative Stability/Degradation
50
Stationary experiments at temperatures approaching ambient involve measuring small
changes in low intensities over a long period of time. For estimation of the oxidative
stability of a polymer at nearly ambient conditions, the usual procedure is to measure
the Arrhenius parameters at elevated temperatures and then extrapolate to room
temperature on the assumption that there has been no change in the mechanism. But
this route may not be precise because the stabilized polymers evidence to show
change in the mechanism.
Increasing of free radicals in the polymer by perturbing the stationary state of
oxidation is an alternative approach. This leads to an abrupt increase in the CL
intensity followed by decay as the system returns to the steady state. This decay curve
may be analyzed to supply the kinetic parameters for the oxidation reaction. This
method has been widely used to determine the absolute value of termination rate
constant and rate constant for radical scavenging by antioxidants in liquid
hydrocarbons and solid polymers as well. UV-irradiation, gas switching (changing the
gas atmosphere of the sample), temperature pulse and mechanical stress are the usual
perturbation methods for solid polymers.
7 Experimental Details
51
7 Experimental Details
7.1 Materials and sample preparation
7.1.1 POFs and bulk material selection
For the present PhD work, commercially available data communication grade POFs
made of poly(methyl methacrylate) (PMMA) were selected as a representative model
as they are largely being used for various optical applications. The chemical structure
and properties of PMMA are provided in Section 3.3.
In total, five POF samples were used. Two of them consisted core, cladding and jacket
(referred as POF cables), and they were received from a customer of BAM for the
basic research purpose. The other three samples consisted only core and cladding
(referred as bare POFs) and were purchased from three different manufacturers.
However, all the POF samples were step-index (SI) and multimode fibers with a
typical diameter of about 1 mm (core and cladding). Specifications of POF samples
are given in Table 7-1.
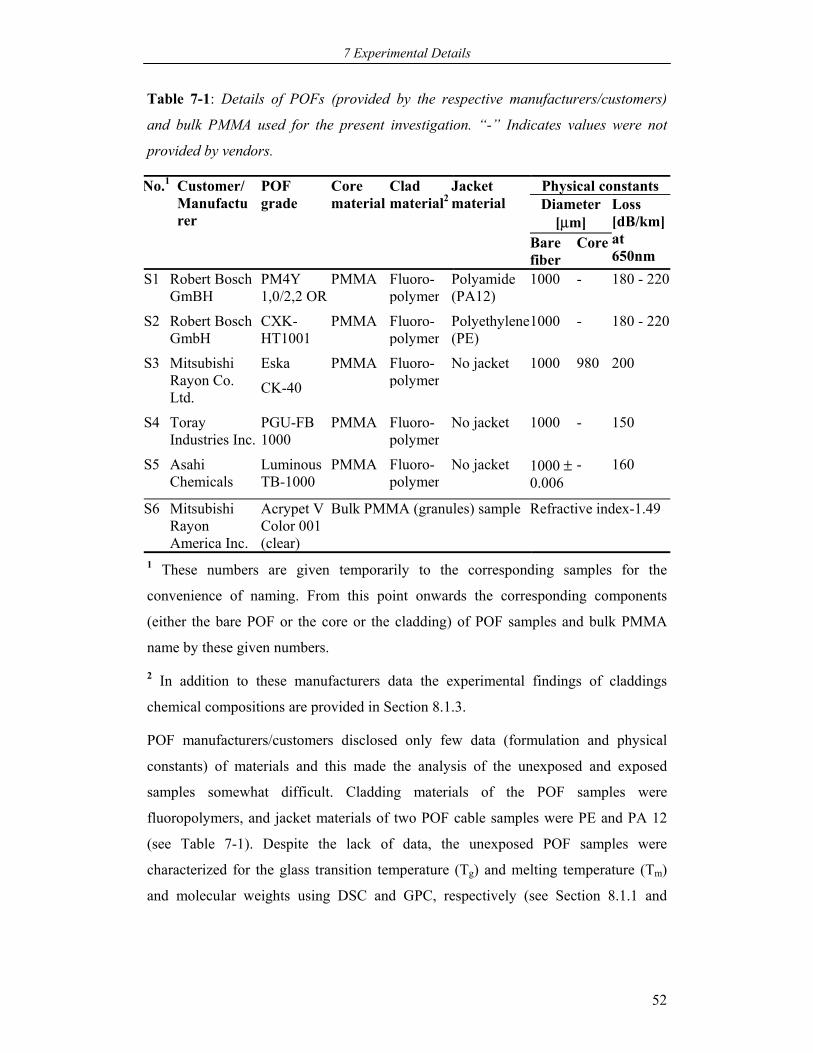
7 Experimental Details
52
Table 7-1: Details of POFs (provided by the respective manufacturers/customers)
and bulk PMMA used for the present investigation. “-” Indicates values were not
provided by vendors.
Physical constants Diameter
[µm]
No.1 Customer/ Manufacturer
POF grade
Core material
Clad material2
Jacket material
Bare fiber
Core
Loss [dB/km]at 650nm
S1 Robert Bosch GmBH
PM4Y 1,0/2,2 OR
PMMA Fluoro- polymer
Polyamide (PA12)
1000 - 180 - 220
S2 Robert Bosch GmbH
CXK-HT1001
PMMA Fluoro- polymer
Polyethylene (PE)
1000 - 180 - 220
S3 Mitsubishi Rayon Co. Ltd.
Eska
CK-40
PMMA Fluoro- polymer
No jacket 1000 980 200
S4 Toray Industries Inc.
PGU-FB 1000
PMMA Fluoro- polymer
No jacket 1000 - 150
S5 Asahi Chemicals
Luminous TB-1000
PMMA Fluoro- polymer
No jacket 1000 ± 0.006
- 160
S6 Mitsubishi Rayon America Inc.
Acrypet V Color 001 (clear)
Bulk PMMA (granules) sample
Refractive index-1.49
1 These numbers are given temporarily to the corresponding samples for the
convenience of naming. From this point onwards the corresponding components
(either the bare POF or the core or the cladding) of POF samples and bulk PMMA
name by these given numbers.
2 In addition to these manufacturers data the experimental findings of claddings
chemical compositions are provided in Section 8.1.3.
POF manufacturers/customers disclosed only few data (formulation and physical
constants) of materials and this made the analysis of the unexposed and exposed
samples somewhat difficult. Cladding materials of the POF samples were
fluoropolymers, and jacket materials of two POF cable samples were PE and PA 12
(see Table 7-1). Despite the lack of data, the unexposed POF samples were
characterized for the glass transition temperature (Tg) and melting temperature (Tm)
and molecular weights using DSC and GPC, respectively (see Section 8.1.1 and
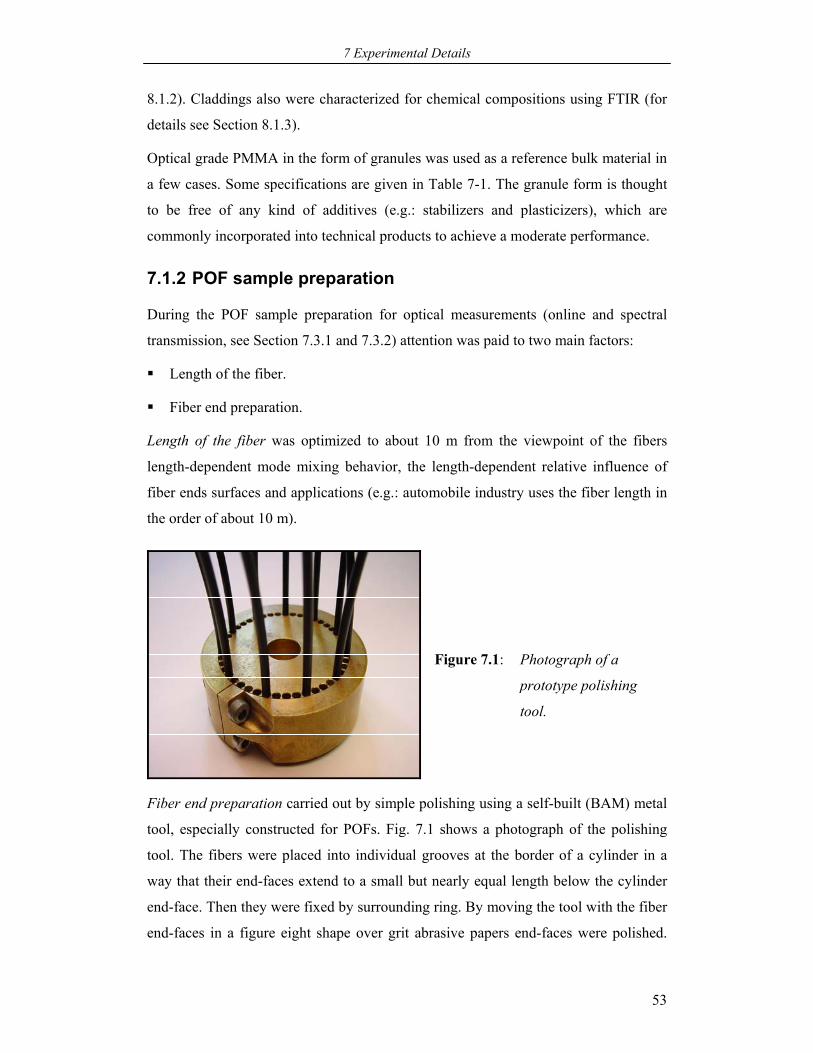
7 Experimental Details
53
8.1.2). Claddings also were characterized for chemical compositions using FTIR (for
details see Section 8.1.3).
Optical grade PMMA in the form of granules was used as a reference bulk material in
a few cases. Some specifications are given in Table 7-1. The granule form is thought
to be free of any kind of additives (e.g.: stabilizers and plasticizers), which are
commonly incorporated into technical products to achieve a moderate performance.
7.1.2 POF sample preparation
During the POF sample preparation for optical measurements (online and spectral
transmission, see Section 7.3.1 and 7.3.2) attention was paid to two main factors:
Length of the fiber.
Fiber end preparation.
Length of the fiber was optimized to about 10 m from the viewpoint of the fibers
length-dependent mode mixing behavior, the length-dependent relative influence of
fiber ends surfaces and applications (e.g.: automobile industry uses the fiber length in
the order of about 10 m).
Figure 7.1:
Photograph of a
prototype polishing
tool.
Fiber end preparation carried out by simple polishing using a self-built (BAM) metal
tool, especially constructed for POFs. Fig. 7.1 shows a photograph of the polishing
tool. The fibers were placed into individual grooves at the border of a cylinder in a
way that their end-faces extend to a small but nearly equal length below the cylinder
end-face. Then they were fixed by surrounding ring. By moving the tool with the fiber
end-faces in a figure eight shape over grit abrasive papers end-faces were polished.
7 Experimental Details
54
The polishing process started with a paper roughness of 40 µm and went down to 0.3
µm until the required surface smoothness of end-faces was obtained, inspected by
using a simple microscope. An advantage of this tool is at a time as many as 10 to 15
(even more) fibers ends can be polished.
However, in a few cases a pair of specially adapted pliers (Rennsteig Werkzeuge
GmbH, Germany) was used for fiber end cutting and end-face preparation.
The POF samples that were exposed and used for chemical investigations required no
fiber end preparation and specific length. In the case of POF cables (both the exposed
and unexposed), the jacket was first manually removed by using a wire-end stripper
(Siemens) and then bare POF samples were utilized for chemical investigations.
7.2 Climatic exposures or aging
7.2.1 Exposure conditions
Out of the three most influential industrial environmental factors of POFs (see Section
4.4), climatic influences on both the optical transmission and the material stability
were investigated. Table 7-2 provides details of climatic conditions that were applied
to POFs for a longer period of time. Some of these climatic stress factors were applied
for short period to investigate influences of individual climatic parameters on the
optical transmission by varying one parameter and keeping other as constant. Table
7-3 displays details of the applied short-term climatic exposure conditions.
7 Experimental Details
55
Table 7-2: Long-term climatic exposure conditions for POFs
No. Temperature* [°C]
Relative humidity (RH) [%]
Exposure time [Hours]
Remarks
1 92 ± 1 95 ± 2 3300 For POF cables S1 and S2 2 92 ± 1 95 ± 2 > 1000 For bare POFs S3-S5 3 92 ± 1 50 ± 2 3380 For bare POFs S3-S5 4 50 ± 1 95 ± 2 1660 For bare POFs S3-S5 5 90 ± 1 << 50 3290 For bare POFs S3-S5 6 100 ± 1 << 50 4500 For bare POFs S3-S5 7 110 ± 1 << 50 > 1000 For bare POFs S3-S5 8 120 ± 1 << 50 > 1000 For bare POFs S3-S5
No. 1-4: Climatic parameters, temperature and humidity, applied in combination and
these were intended and recorded values.
No. 5-8: Actually, temperature only was applied and measured but the humidity level
was approximated (dry heat condition).
* The uncertainty of the temperature refers to the place of the temperature sensor. This
is valid for all temperatures given for climatic exposures.
Table 7-3: Scheme of short-term climatic exposures of POFs.
No. Temperature Relative humidity (RH) 1 Steady:
(92 ± 1) °C Cycle: 50 % / 48 h and < 10 % / 48 h, … 80 % / 48 h and < 10 % / 48 h.
2 Cycle: (50 ± 1) °C / 48 h and 25 °C / 48 h, … (90 ± 1) °C / 48 h and 25 °C / 48 h.
Steady: (95 ± 2) %
3 Steady: (25 ± 1) °C
Cycle: 50 % / 48 h and < 10 % / 48 h, … 90 % / 48 h and < 10 % / 48 h.
7.2.2 Exposure tests
Using commercially available climatic chambers (VCS 4034-5/S and HC 4033,
Vötsch Industrietechnik GmbH, Germany) and an oven (Heraeus Instruments GmbH,
Germany) the long-term as well as short-term exposure tests (see Table 7-2, 7-3) were
performed. Exposure tests to temperature in combination with humidity were carried
out by using climatic chambers. Tests to temperature only were conducted by using
both, the oven and climatic chamber.
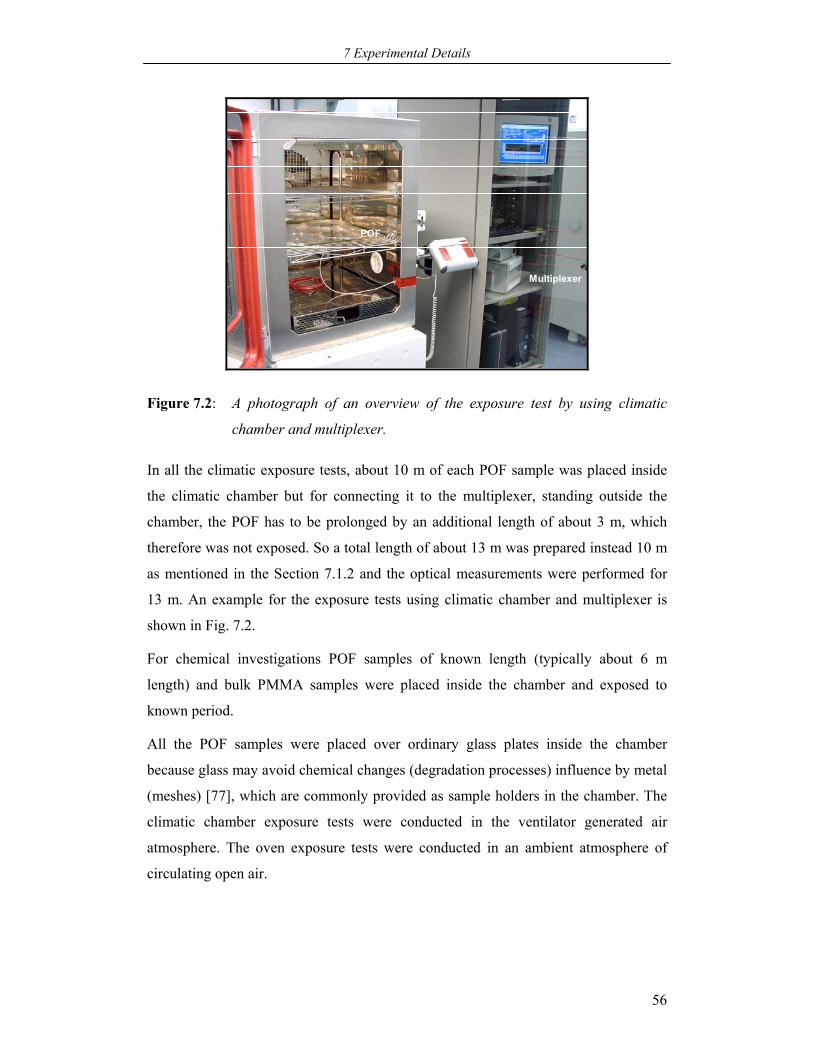
7 Experimental Details
56
Multiplexer
POF
Figure 7.2: A photograph of an overview of the exposure test by using climatic
chamber and multiplexer.
In all the climatic exposure tests, about 10 m of each POF sample was placed inside
the climatic chamber but for connecting it to the multiplexer, standing outside the
chamber, the POF has to be prolonged by an additional length of about 3 m, which
therefore was not exposed. So a total length of about 13 m was prepared instead 10 m
as mentioned in the Section 7.1.2 and the optical measurements were performed for
13 m. An example for the exposure tests using climatic chamber and multiplexer is
shown in Fig. 7.2.
For chemical investigations POF samples of known length (typically about 6 m
length) and bulk PMMA samples were placed inside the chamber and exposed to
known period.
All the POF samples were placed over ordinary glass plates inside the chamber
because glass may avoid chemical changes (degradation processes) influence by metal
(meshes) [77], which are commonly provided as sample holders in the chamber. The
climatic chamber exposure tests were conducted in the ventilator generated air
atmosphere. The oven exposure tests were conducted in an ambient atmosphere of
circulating open air.
7 Experimental Details
57
7.3 Optical transmission measurements
7.3.1 Measurements by using multiplexer
The optical transmission during the aging/exposure of POFs was measured using a
self-constructed special device called as multiplexer. It recorded the transmission at
three wavelengths regions, which were centered at 525 nm, 590 nm and 650 nm,
which made it possible to measure the transmission every 5 minutes (e.g.: for three
POF samples) during the exposure up to > 90 days. However, the transmission data
presented in the following sections were obtained by averaging the data recorded as
function of time at these three wavelengths. The multiplexer’s detailed working
principle can be found in [3,78].
The multiplexer mainly consists of three functional units:
The light source unit: Three light emitting diodes (LED) were used as the light
sources. Individual LED was launched into the individual POF by means of a
controllable shutter and a coupler.
The detector unit: A PIN photodiode followed by a low noise amplifier was
employed as a detector. Both the detector and the light source units were set on an
adjustable platform of the positioning system.
The positioning system: POF ends were inserted into the multiplexer via a fixed
special receptacle, uniformly spaced on a single plane. Switching between POFs
to be tested was executed by the linear positioning system using a stepping motor.
First, the optical transmission of POF samples was measured before the
aging/exposure started. This initial transmission value was considered as 100 %. Then
the subsequent transmission values were recorded during the exposure and related to
the initial value 100 %. Therefore, the outcomes of measurements were relative
transmission values.
However, these transmission values (%) can be converted to attenuation (α) values in
dB/km using the equation 2-7. For calculations of α, P0 is not absolutely 100 %
because there will be always a small loss of the transmission at the fiber ends faces
due to a small air gap between the POF connectors (this loss also is referred as Fresnel
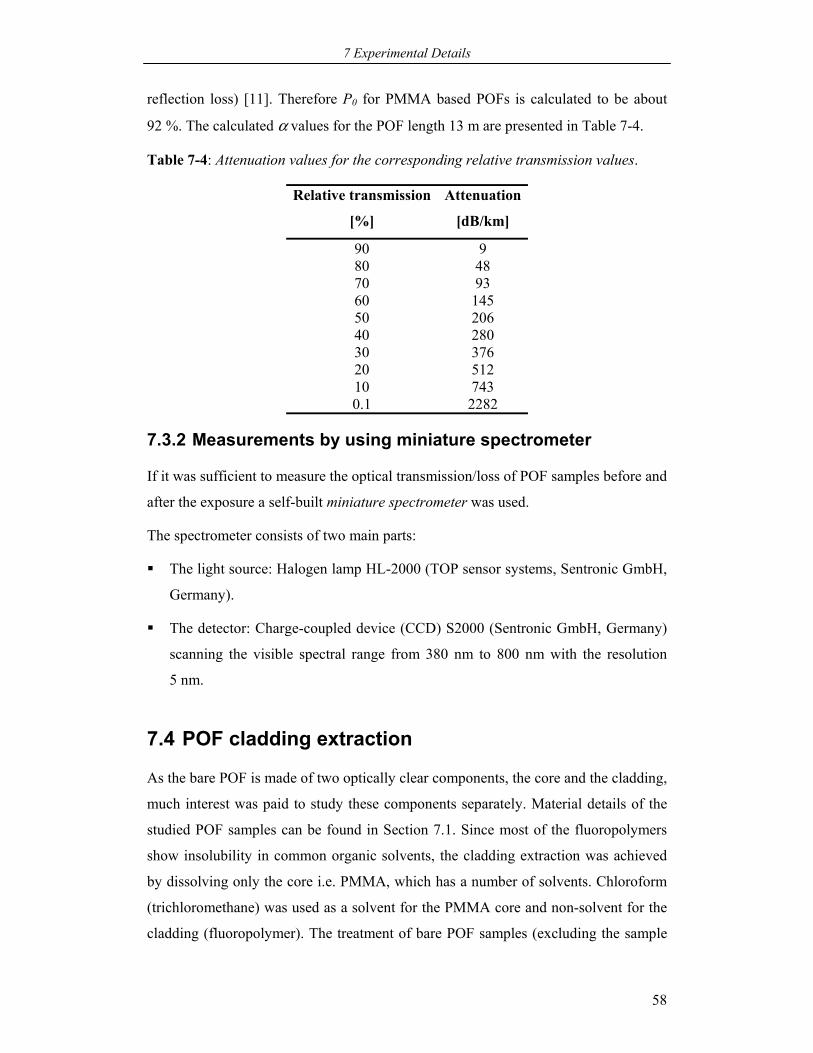
7 Experimental Details
58
reflection loss) [11]. Therefore P0 for PMMA based POFs is calculated to be about
92 %. The calculated α values for the POF length 13 m are presented in Table 7-4.
Table 7-4: Attenuation values for the corresponding relative transmission values.
Relative transmission
[%]
Attenuation
[dB/km]
90 9 80 48 70 93 60 145 50 206 40 280 30 376 20 512 10 743 0.1 2282
7.3.2 Measurements by using miniature spectrometer
If it was sufficient to measure the optical transmission/loss of POF samples before and
after the exposure a self-built miniature spectrometer was used.
The spectrometer consists of two main parts:
The light source: Halogen lamp HL-2000 (TOP sensor systems, Sentronic GmbH,
Germany).
The detector: Charge-coupled device (CCD) S2000 (Sentronic GmbH, Germany)
scanning the visible spectral range from 380 nm to 800 nm with the resolution
5 nm.
7.4 POF cladding extraction
As the bare POF is made of two optically clear components, the core and the cladding,
much interest was paid to study these components separately. Material details of the
studied POF samples can be found in Section 7.1. Since most of the fluoropolymers
show insolubility in common organic solvents, the cladding extraction was achieved
by dissolving only the core i.e. PMMA, which has a number of solvents. Chloroform
(trichloromethane) was used as a solvent for the PMMA core and non-solvent for the
cladding (fluoropolymer). The treatment of bare POF samples (excluding the sample
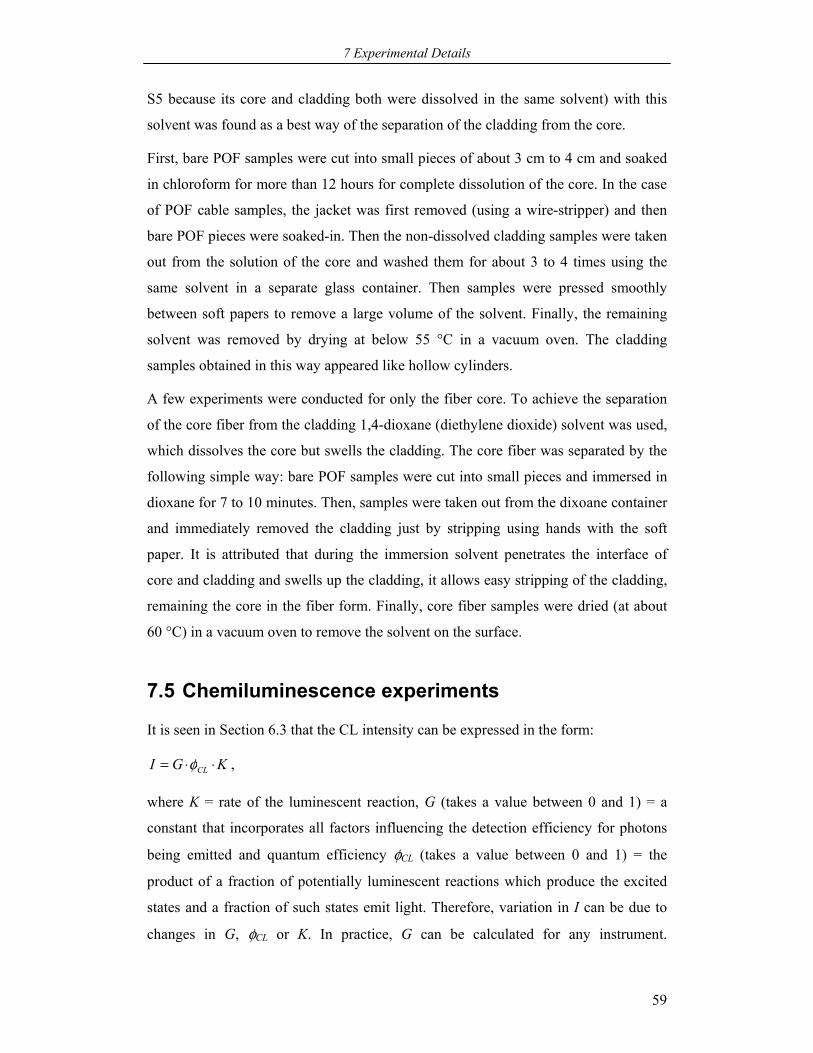
7 Experimental Details
59
S5 because its core and cladding both were dissolved in the same solvent) with this
solvent was found as a best way of the separation of the cladding from the core.
First, bare POF samples were cut into small pieces of about 3 cm to 4 cm and soaked
in chloroform for more than 12 hours for complete dissolution of the core. In the case
of POF cable samples, the jacket was first removed (using a wire-stripper) and then
bare POF pieces were soaked-in. Then the non-dissolved cladding samples were taken
out from the solution of the core and washed them for about 3 to 4 times using the
same solvent in a separate glass container. Then samples were pressed smoothly
between soft papers to remove a large volume of the solvent. Finally, the remaining
solvent was removed by drying at below 55 °C in a vacuum oven. The cladding
samples obtained in this way appeared like hollow cylinders.
A few experiments were conducted for only the fiber core. To achieve the separation
of the core fiber from the cladding 1,4-dioxane (diethylene dioxide) solvent was used,
which dissolves the core but swells the cladding. The core fiber was separated by the
following simple way: bare POF samples were cut into small pieces and immersed in
dioxane for 7 to 10 minutes. Then, samples were taken out from the dixoane container
and immediately removed the cladding just by stripping using hands with the soft
paper. It is attributed that during the immersion solvent penetrates the interface of
core and cladding and swells up the cladding, it allows easy stripping of the cladding,
remaining the core in the fiber form. Finally, core fiber samples were dried (at about
60 °C) in a vacuum oven to remove the solvent on the surface.
7.5 Chemiluminescence experiments
It is seen in Section 6.3 that the CL intensity can be expressed in the form:
KGI CL ⋅⋅= φ ,
where K = rate of the luminescent reaction, G (takes a value between 0 and 1) = a
constant that incorporates all factors influencing the detection efficiency for photons
being emitted and quantum efficiency φCL (takes a value between 0 and 1) = the
product of a fraction of potentially luminescent reactions which produce the excited
states and a fraction of such states emit light. Therefore, variation in I can be due to
changes in G, φCL or K. In practice, G can be calculated for any instrument.
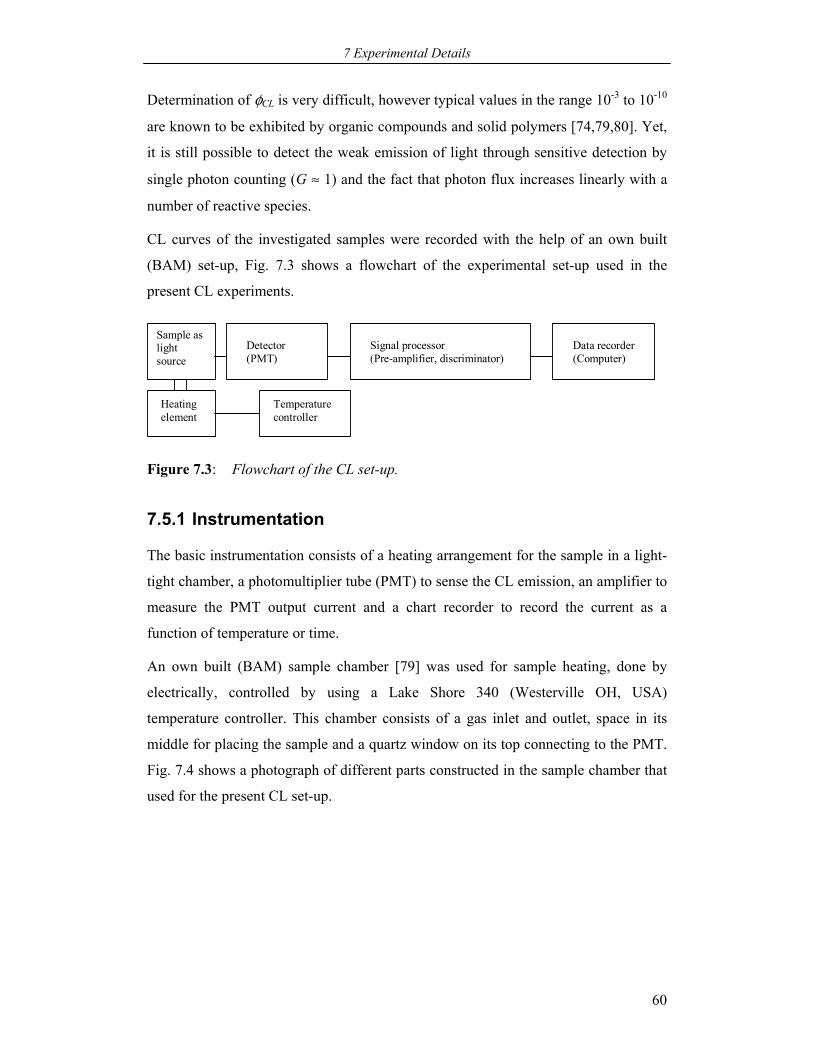
7 Experimental Details
60
Determination of φCL is very difficult, however typical values in the range 10-3 to 10-10
are known to be exhibited by organic compounds and solid polymers [74,79,80]. Yet,
it is still possible to detect the weak emission of light through sensitive detection by
single photon counting (G ≈ 1) and the fact that photon flux increases linearly with a
number of reactive species.
CL curves of the investigated samples were recorded with the help of an own built
(BAM) set-up, Fig. 7.3 shows a flowchart of the experimental set-up used in the
present CL experiments.
Heating element
Sample as light source
Detector (PMT)
Signal processor (Pre-amplifier, discriminator)
Temperature controller
Data recorder (Computer)
Figure 7.3: Flowchart of the CL set-up.
7.5.1 Instrumentation
The basic instrumentation consists of a heating arrangement for the sample in a light-
tight chamber, a photomultiplier tube (PMT) to sense the CL emission, an amplifier to
measure the PMT output current and a chart recorder to record the current as a
function of temperature or time.
An own built (BAM) sample chamber [79] was used for sample heating, done by
electrically, controlled by using a Lake Shore 340 (Westerville OH, USA)
temperature controller. This chamber consists of a gas inlet and outlet, space in its
middle for placing the sample and a quartz window on its top connecting to the PMT.
Fig. 7.4 shows a photograph of different parts constructed in the sample chamber that
used for the present CL set-up.
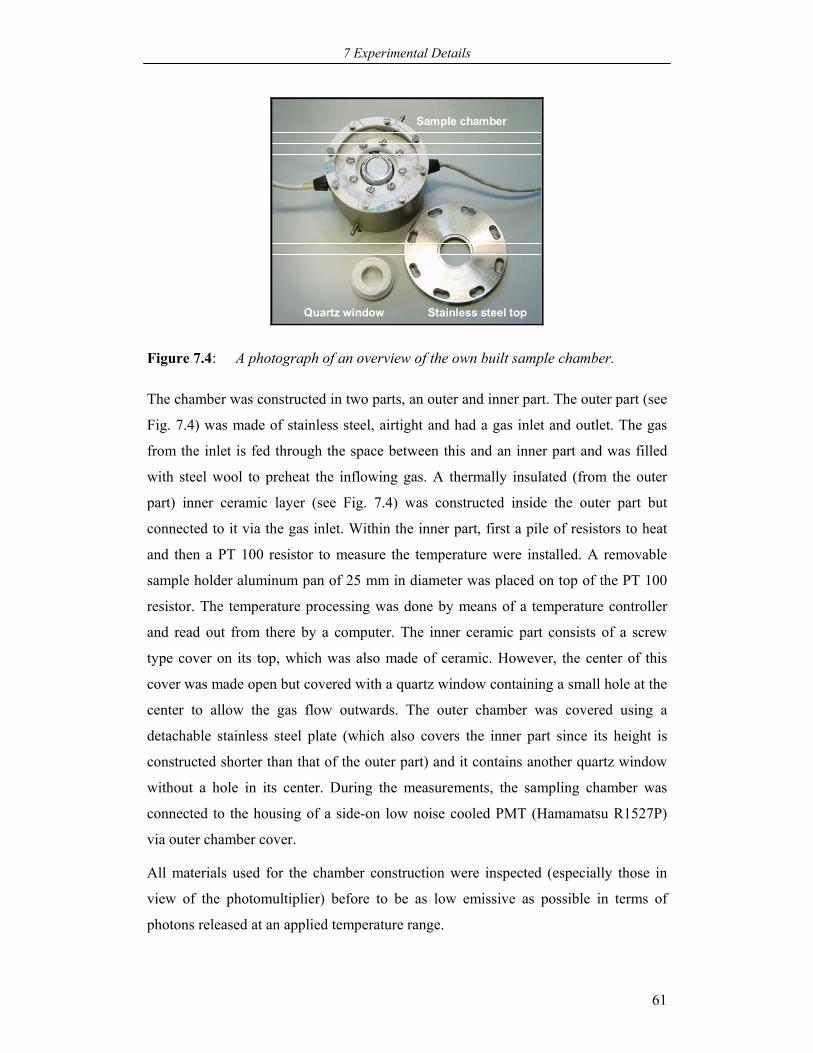
7 Experimental Details
61
Sample chamber
Quartz window Stainless steel top
Figure 7.4: A photograph of an overview of the own built sample chamber.
The chamber was constructed in two parts, an outer and inner part. The outer part (see
Fig. 7.4) was made of stainless steel, airtight and had a gas inlet and outlet. The gas
from the inlet is fed through the space between this and an inner part and was filled
with steel wool to preheat the inflowing gas. A thermally insulated (from the outer
part) inner ceramic layer (see Fig. 7.4) was constructed inside the outer part but
connected to it via the gas inlet. Within the inner part, first a pile of resistors to heat
and then a PT 100 resistor to measure the temperature were installed. A removable
sample holder aluminum pan of 25 mm in diameter was placed on top of the PT 100
resistor. The temperature processing was done by means of a temperature controller
and read out from there by a computer. The inner ceramic part consists of a screw
type cover on its top, which was also made of ceramic. However, the center of this
cover was made open but covered with a quartz window containing a small hole at the
center to allow the gas flow outwards. The outer chamber was covered using a
detachable stainless steel plate (which also covers the inner part since its height is
constructed shorter than that of the outer part) and it contains another quartz window
without a hole in its center. During the measurements, the sampling chamber was
connected to the housing of a side-on low noise cooled PMT (Hamamatsu R1527P)
via outer chamber cover.
All materials used for the chamber construction were inspected (especially those in
view of the photomultiplier) before to be as low emissive as possible in terms of
photons released at an applied temperature range.
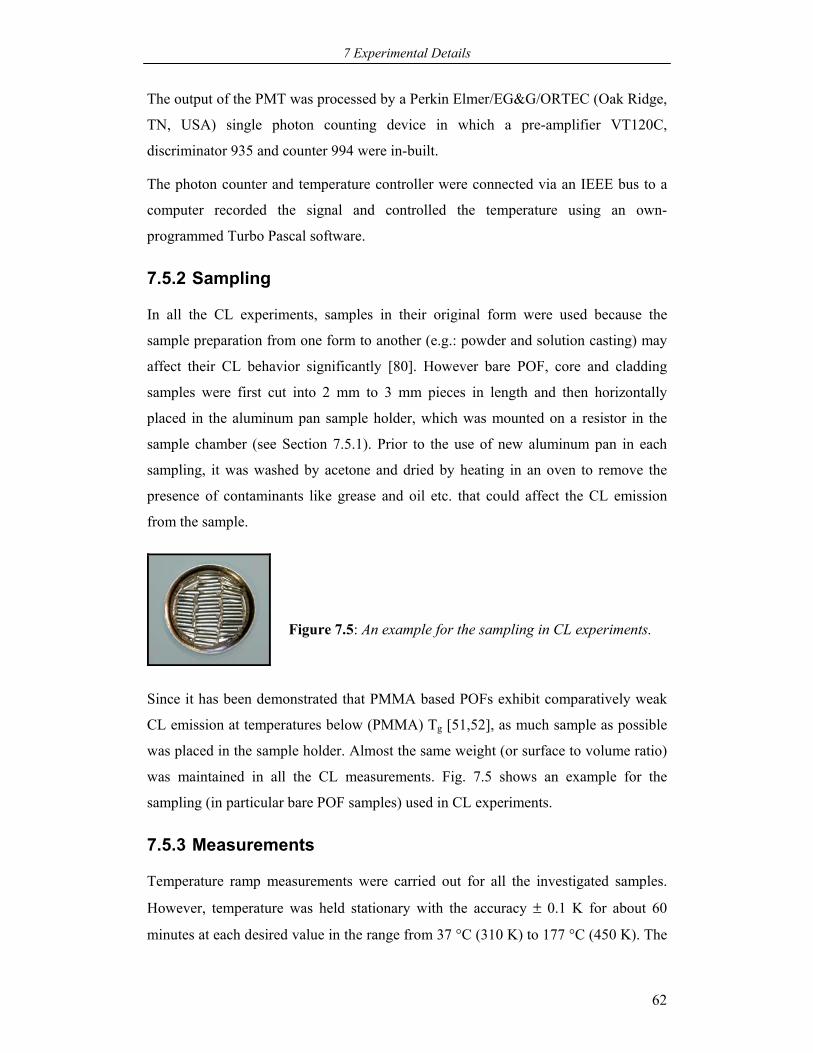
7 Experimental Details
62
The output of the PMT was processed by a Perkin Elmer/EG&G/ORTEC (Oak Ridge,
TN, USA) single photon counting device in which a pre-amplifier VT120C,
discriminator 935 and counter 994 were in-built.
The photon counter and temperature controller were connected via an IEEE bus to a
computer recorded the signal and controlled the temperature using an own-
programmed Turbo Pascal software.
7.5.2 Sampling
In all the CL experiments, samples in their original form were used because the
sample preparation from one form to another (e.g.: powder and solution casting) may
affect their CL behavior significantly [80]. However bare POF, core and cladding
samples were first cut into 2 mm to 3 mm pieces in length and then horizontally
placed in the aluminum pan sample holder, which was mounted on a resistor in the
sample chamber (see Section 7.5.1). Prior to the use of new aluminum pan in each
sampling, it was washed by acetone and dried by heating in an oven to remove the
presence of contaminants like grease and oil etc. that could affect the CL emission
from the sample.
Figure 7.5: An example for the sampling in CL experiments.
Since it has been demonstrated that PMMA based POFs exhibit comparatively weak
CL emission at temperatures below (PMMA) Tg [51,52], as much sample as possible
was placed in the sample holder. Almost the same weight (or surface to volume ratio)
was maintained in all the CL measurements. Fig. 7.5 shows an example for the
sampling (in particular bare POF samples) used in CL experiments.
7.5.3 Measurements
Temperature ramp measurements were carried out for all the investigated samples.
However, temperature was held stationary with the accuracy ± 0.1 K for about 60
minutes at each desired value in the range from 37 °C (310 K) to 177 °C (450 K). The
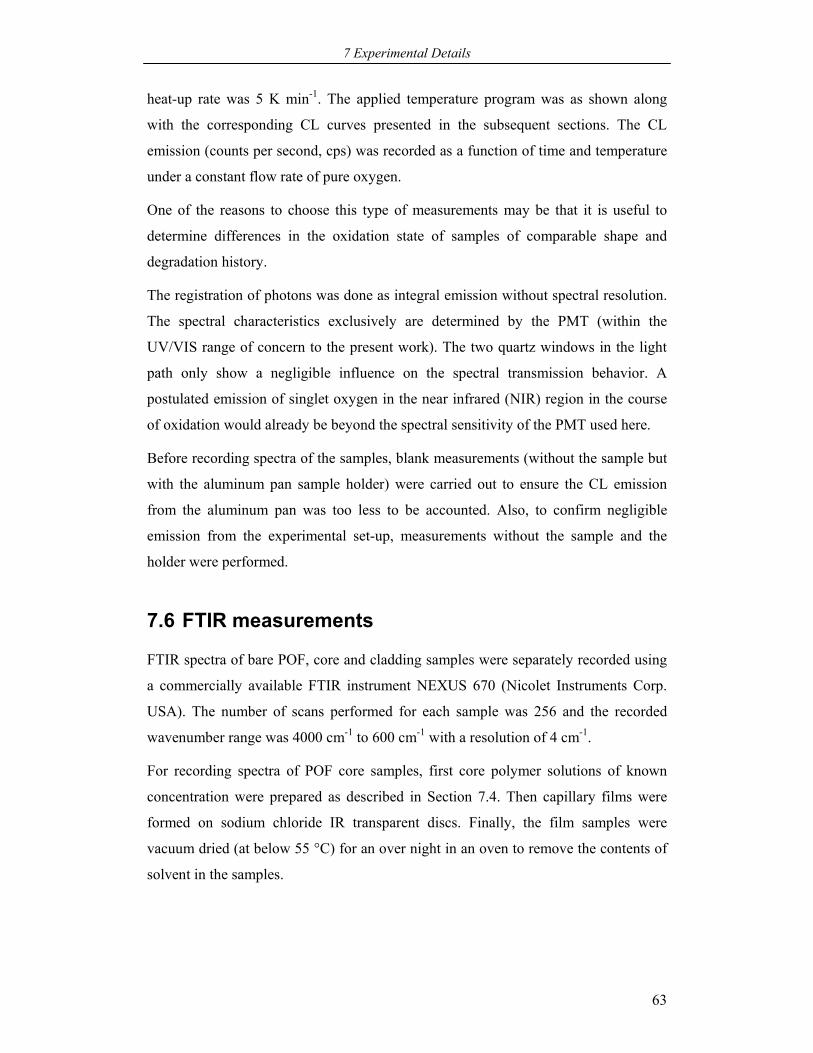
7 Experimental Details
63
heat-up rate was 5 K min-1. The applied temperature program was as shown along
with the corresponding CL curves presented in the subsequent sections. The CL
emission (counts per second, cps) was recorded as a function of time and temperature
under a constant flow rate of pure oxygen.
One of the reasons to choose this type of measurements may be that it is useful to
determine differences in the oxidation state of samples of comparable shape and
degradation history.
The registration of photons was done as integral emission without spectral resolution.
The spectral characteristics exclusively are determined by the PMT (within the
UV/VIS range of concern to the present work). The two quartz windows in the light
path only show a negligible influence on the spectral transmission behavior. A
postulated emission of singlet oxygen in the near infrared (NIR) region in the course
of oxidation would already be beyond the spectral sensitivity of the PMT used here.
Before recording spectra of the samples, blank measurements (without the sample but
with the aluminum pan sample holder) were carried out to ensure the CL emission
from the aluminum pan was too less to be accounted. Also, to confirm negligible
emission from the experimental set-up, measurements without the sample and the
holder were performed.
7.6 FTIR measurements
FTIR spectra of bare POF, core and cladding samples were separately recorded using
a commercially available FTIR instrument NEXUS 670 (Nicolet Instruments Corp.
USA). The number of scans performed for each sample was 256 and the recorded
wavenumber range was 4000 cm-1 to 600 cm-1 with a resolution of 4 cm-1.
For recording spectra of POF core samples, first core polymer solutions of known
concentration were prepared as described in Section 7.4. Then capillary films were
formed on sodium chloride IR transparent discs. Finally, the film samples were
vacuum dried (at below 55 °C) for an over night in an oven to remove the contents of
solvent in the samples.
7 Experimental Details
64
7.6.1 Attenuated total reflection (ATR) - FTIR
ATR is a constructive and widely applicable technique for obtaining FTIR spectra of
samples such as rubbers, fibers, food materials, cured resins, liquid samples and
powders without any sample preparation [81].
7.6.1.1 Practical aspects
Basically, this method uses the principle of the Snell’s law of refraction (see Section
2.1). The application of ATR in spectroscopy is based on the fact that although
complete internal reflection occurs at the interface, radiation does in fact penetrate a
short distance into the rarer medium. This penetrating radiation is called as the
evanescent wave. It can be partially absorbed by placing a sample in optical contact
with a dense medium (so called the internal reflection element, IRE, usually either a
prism or multireflection element) at which reflection occurs (see Fig. 7.6). To increase
the sensitivity a number of subsequent reflections can be used, the higher the angle of
incidence and thinner or longer the multireflection element the larger is the number of
reflections.
The reflected radiation can result in absorption spectrum that closely resembles the
transmission spectrum of a sample. However, the actual pattern depends on several
parameters; including refractive indices of the prism (or multireflection element) and
the sample, the angle of incidence of the radiation, penetration depth, the number of
reflections and the wavelength of radiation.
Sample
Prism
Sample
Sample
IRE
(a) (b)
Figure 7.6: Schematic representation of attenuated total reflectance in: (a) single
reflection prism; (b) multireflection element.
7 Experimental Details
65
Refractive indices of the prism and the sample are among the most important affecting
factors. The refractive index difference between these two ultimately results in
penetration depth of the evanescent wave. The larger the difference the shorter is the
penetration depth and the lower is the spectral contrast. However, when the refractive
index of the sample close to the same of the prism, the deeper is the penetration and
the higher is the spectral contrast. Germanium (Ge), zinc-selanide (ZnSe) and silicon
(Si) are the mostly used as prism materials having refractive indices > 2.2, 2.41 and
2.2 to 2.41 respectively.
ATR prisms can be constructed with different incidence angles (45° and 60° are
common). However, the angle of incidence (θ1) must be greater than the critical angle
(θc) for the total internal reflection to occur (see Section 2.1). Since θc varies across an
absorption band, θ1 should be considerably greater than θc. The penetration depth
decreases with increasing θ1, therefore, choosing a very large θ1 for general use is not
recommended.
The penetration depth is normally a fraction of a wavelength and determined by the
refractive index difference between the sample and prism, θ1, the wavelength and the
pressure used to hold the sample (solid hard samples only) against the prism. The
effect on the spectrum is that bands at longer wavelengths are more intense than those
at shorter wavelengths, relative to the transmission spectrum of the same material.
7.6.1.2 Measurements
ATR-FTIR spectra of bare POF and cladding samples were registered using a
commercially available smart golden gate–single reflection–diamond–ATR unit
(L.O.T.-Oriel GmbH, Germany). It had an IRE (prism) made out of Type-IIa-
Diamond with the incident angle 45°. The refractive index and the penetration depth
of the IRE were 2.4 µm and 4.4 µm, respectively. Using this ATR unit the spectral
range registered was 4000 cm-1 to 650 cm-1. The number of scans and the resolution
were same as measured in transmission FTIR (see Section 7.6).
It was found that the ATR-FTIR spectrum of the bare POF (core and cladding) was
equivalent to the spectrum of its cladding when measured them separately.
7 Experimental Details
66
7.7 Supplementary measurements
Differential scanning calorimetric (DSC) measurements were carried out to
determine Tg and Tm of POF samples employing a Seiko DSC 220C instrument.
Alumina pan served as the reference and the heating/cooling rate was 10 K min-1.
Gel permeation chromatography (GPC) method was used to characterize the
molecular weights of POF core samples by a Polymer Lab GPC 210 instrument.
Tetrahydrofuran (THF) was employed as an eluent with a flow rate of 1 ml min-1. A
refractive index detector analyzed the elutants. GPC columns were calibrated with a
PMMA standard. POF samples (1 mg ml-1) were first dissolved in THF and then the
solutions were filtered to remove the non-dissolved cladding prior to the injection.
UV/visible transmittance measurements were performed utilizing a commercially
available Varian Cary 300 Scan spectrophotometer. To record spectra (in a range of
180 nm to 850 nm) of core samples, solutions were prepared using spectrograde
dichloromethane solvent. Cladding samples obtained by the procedure as described in
Section 7.4 were directly taken for registering spectra. However, a special slit (a width
of less than the diameter of the bare POF or cladding) was self-built since the
diameter of cladding samples was 1 mm, which was too small to measure using the
provided one for normal film samples.
Thermogravimetry (TG) method was applied to analyze the thermal stability of POF
samples by using a TGA/SDTA 851 (Mettler Toledo GmbH, Germany) instrument.
The heating rate was 10 K min-1 under both air and nitrogen atmosphere.
Scanning electron microscope (SEM) pictures were taken from a Philips SEM 515
(pw6703) apparatus to analyze morphological changes of POF samples.
8 Results and Discussion
67
8 Results and Discussion
8.1 Characterization of the unexposed POFs
8.1.1 Glass transition (Tg) and melting temperature (Tm) by DSC
DSC is a technique in which the difference in heat flow between the sample and a
reference is monitored as a function of temperature and time, while the sample is
subjected to a controlled temperature program. With this technique, characteristic
temperatures (glass transition, melting, and crystallization temperature), melting and
crystallization behavior, specific heat capacity, heat of reaction, reaction kinetics,
oxidative stability and thermal stability can be studied. The glass transition (Tg) and
melting temperature (Tm) are the characteristics of amorphous and crystalline
materials, respectively.
The DSC determined Tg and Tm of POF and PMMA samples are provided in Table
8-1. DSC experimental curves shown in Fig. 8.1 can serve as a model for the bare
POF, cladding and core, which are compared with the reference bulk PMMA sample.
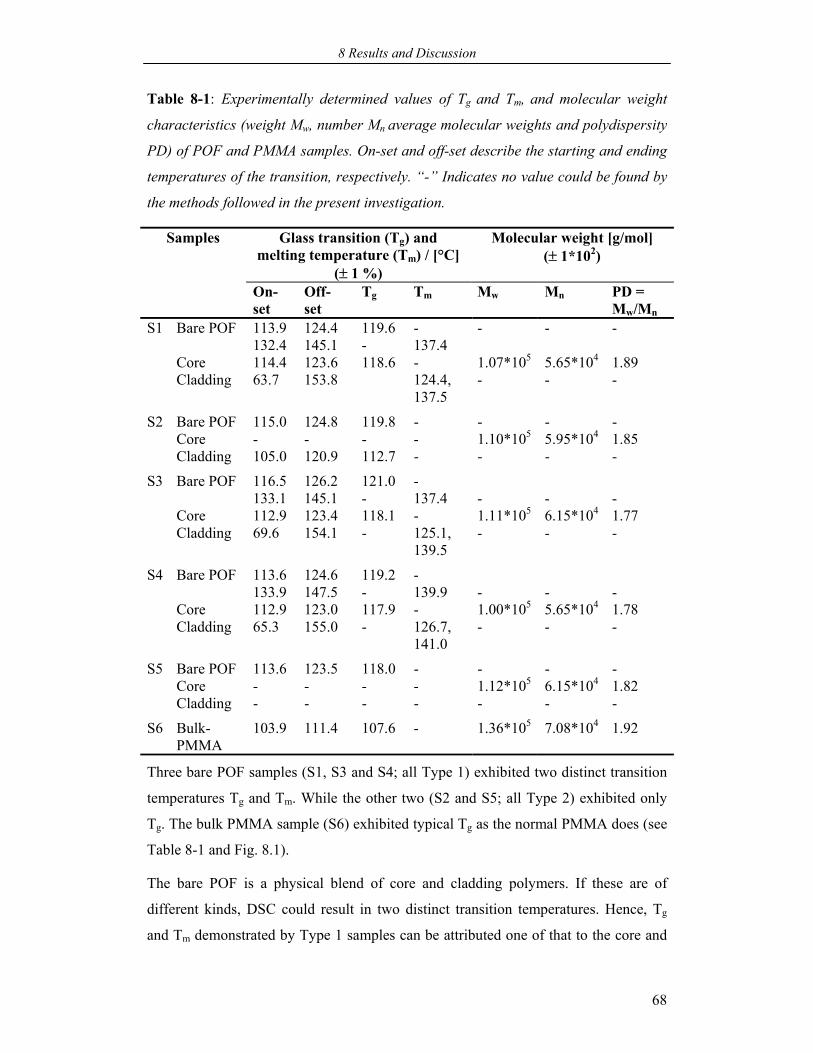
8 Results and Discussion
68
Table 8-1: Experimentally determined values of Tg and Tm, and molecular weight
characteristics (weight Mw, number Mn average molecular weights and polydispersity
PD) of POF and PMMA samples. On-set and off-set describe the starting and ending
temperatures of the transition, respectively. “-” Indicates no value could be found by
the methods followed in the present investigation.
Glass transition (Tg) and melting temperature (Tm) / [°C]
(± 1 %)
Molecular weight [g/mol] (± 1*102)
Samples
On-set
Off-set
Tg Tm Mw Mn PD = Mw/Mn
Bare POF 113.9 132.4
124.4 145.1
119.6 -
- 137.4
- - -
Core 114.4 123.6 118.6 - 1.07*105 5.65*104 1.89
S1
Cladding 63.7 153.8 124.4, 137.5
- - -
Bare POF 115.0 124.8 119.8 - - - - Core - - - - 1.10*105 5.95*104 1.85
S2
Cladding 105.0 120.9 112.7 - - - -
Bare POF 116.5 133.1
126.2 145.1
121.0 -
- 137.4
-
-
-
Core 112.9 123.4 118.1 - 1.11*105 6.15*104 1.77
S3
Cladding 69.6 154.1 - 125.1, 139.5
- - -
Bare POF 113.6 133.9
124.6 147.5
119.2 -
- 139.9
-
-
-
Core 112.9 123.0 117.9 - 1.00*105 5.65*104 1.78
S4
Cladding 65.3 155.0 - 126.7, 141.0
- - -
Bare POF 113.6 123.5 118.0 - - - - Core - - - - 1.12*105 6.15*104 1.82
S5
Cladding - - - - - - -
S6 Bulk- PMMA
103.9 111.4 107.6 - 1.36*105 7.08*104 1.92
Three bare POF samples (S1, S3 and S4; all Type 1) exhibited two distinct transition
temperatures Tg and Tm. While the other two (S2 and S5; all Type 2) exhibited only
Tg. The bulk PMMA sample (S6) exhibited typical Tg as the normal PMMA does (see
Table 8-1 and Fig. 8.1).
The bare POF is a physical blend of core and cladding polymers. If these are of
different kinds, DSC could result in two distinct transition temperatures. Hence, Tg
and Tm demonstrated by Type 1 samples can be attributed one of that to the core and
8 Results and Discussion
69
other to the cladding. Furthermore, Tg is believed to be of the core because it is
PMMA, which is well known to exhibit the same. Additionally, DSC measurements
to the core and cladding samples resulted in the same temperature region of Tg and Tm
as displayed by bare POF samples. Therefore, this result confirms that between these
two transitions, Tg should be of the core and obviously the other transition Tm should
be of the cladding. It reveals that the cladding is probably of crystalline in material
nature. Moreover, chemical compositions analysis by FTIR shows (see Section 8.1.3)
claddings of Type 1 probably be either a fluorinated polyolefin or a copolymer of
olefins and fluoroolefins, which is known for the crystalline material nature and
exhibits Tm.
Type 2 samples exhibited only Tg as a consequence of might be similar kinds of
polymers of the core and cladding, having the transition in the same temperature
region. This result indicates that Type 2 claddings are most likely of amorphous in
material nature. Additionally, the FTIR analysis reveals (see Section 8.1.3) that
Type 2 claddings resemble PMMA and therefore single Tg can be expected from
them.
Nevertheless, all bare POF samples displayed Tg of about 119 °C and Tm of three of
them was of about 137 °C (Table 8-1).
Samples of only the core displayed single transition temperature i.e. Tg and it was
found to be of about 118 °C, which is almost the same as obtained for bare POF
samples. This result verifies the fact that the obtained Tg of bare POFs samples should
be Tg of the core. However, for both the samples it was found higher compared to the
literature value (about 105 °C for atactic PMMA) and the experimentally found value
(Table 8-1) for the bulk PMMA sample S6. It indicates that PMMA of the core in the
POF could be having either a different structural configuration (syndio- or iso- tactic)
or molecularly orientated.
In the case of POFs, the structural configuration may not be the major source
influencing the optical properties. The higher the amorphous nature of the polymer
(the core) the lower is the optical loss (scattering loss) [3,4,15,25,36,37]. Syndio- and
iso- tactic natures of the polymer are known to exhibit higher degrees of crystallinity,
which can result in more optical loss due to scattering. Therefore polymers with these
configurations are less preferred. But the other fact, the molecular orientation, which
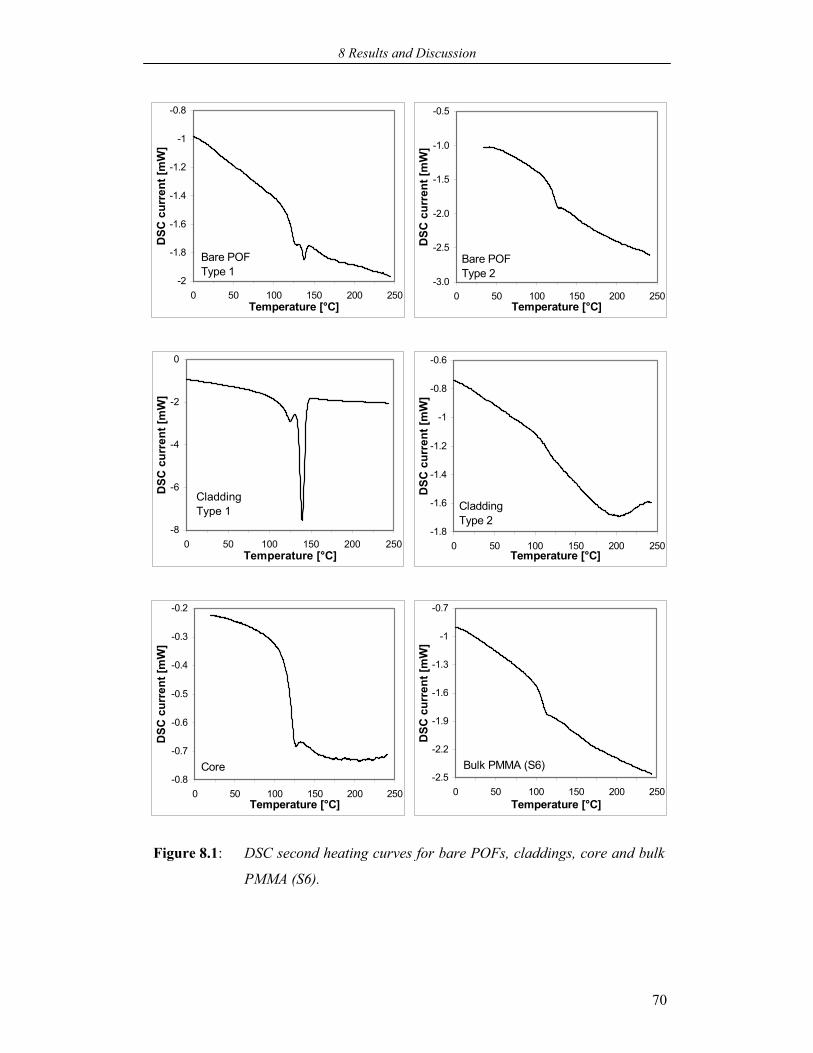
8 Results and Discussion
70
-2
-1.8
-1.6
-1.4
-1.2
-1
-0.8
0 50 100 150 200 250Temperature [°C]
DSC
cur
rent
[mW
]
Bare POFType 1
-3.0
-2.5
-2.0
-1.5
-1.0
-0.5
0 50 100 150 200 250Temperature [°C]
DSC
cur
rent
[mW
]
Bare POFType 2
-8
-6
-4
-2
0
0 50 100 150 200 250Temperature [°C]
DSC
cur
rent
[mW
]
Cladding Type 1
-1.8
-1.6
-1.4
-1.2
-1
-0.8
-0.6
0 50 100 150 200 250Temperature [°C]
DSC
cur
rent
[mW
]
Cladding Type 2
-0.8
-0.7
-0.6
-0.5
-0.4
-0.3
-0.2
0 50 100 150 200 250Temperature [°C]
DSC
cur
rent
[mW
]
Core-2.5
-2.2
-1.9
-1.6
-1.3
-1
-0.7
0 50 100 150 200 250Temperature [°C]
DSC
cur
rent
[mW
]
Bulk PMMA (S6)
Figure 8.1: DSC second heating curves for bare POFs, claddings, core and bulk
PMMA (S6).
8 Results and Discussion
71
is reported to occur in the core during the fiber drawing process, could result in an
increase of Tg of the polymer and also the scattering loss due to the orientation
birefringence [48,49]. Additionally, heating/cooling conditions that employ during the
fiber drawing process can result in the formation of different crystallite structures,
which have influences on Tg of the polymer [82]. Therefore, the molecular orientation
seemed to be the main cause for the obtained large Tg of POF and core samples.
Two melting temperatures (Tm) in the range from 124 °C to 137 °C were found for
three cladding samples (S1, S3 and S4; Type 1) (see Fig. 8.1). This could be a result
of either different crystallites (e.g.: different size) present in the polymer or a (block)
copolymer nature or a blend of two kinds of polymer of the cladding material. The
other cladding samples (S2 and S5; Type 2) exhibited only Tg and it was of about 112
°C. It is little lower than the value obtained for core (only) samples may be an
indication of the similar material nature of the cladding and the core (PMMA). The
FTIR results reveal a molecular similarity of these claddings with PMMA and it is
discussed in more detail in the later section.
From the DSC findings the followings can be claimed:
Tg of different POF samples was measured and compared with individual counter
parts (the core and cladding) and their typical DSC curves are shown in Fig. 8.1.
Tg of all bare POF and core samples lies in the same region and it was higher than
that of the bulk PMMA sample.
Regardless of claddings materials all bare POF samples showed almost similar Tg,
which indicates less influence of the cladding.
Either different crystallites or two different kinds of polymers should be
responsible for the obtained two melting temperatures of cladding samples.
8.1.2 Molecular weights by GPC
Experimentally found values of the molecular weights and polydispersity (PD) are
tabulated in Table 8-1. These values are corresponding to the core of POF samples
except the sample S5 because its cladding and core were both dissolved in the solvent
(THF) used for the experiments. The core of POFs possessed the molecular weight
(Mw) in the range from 1.07*105 to 1.12 *105 g mol-1.
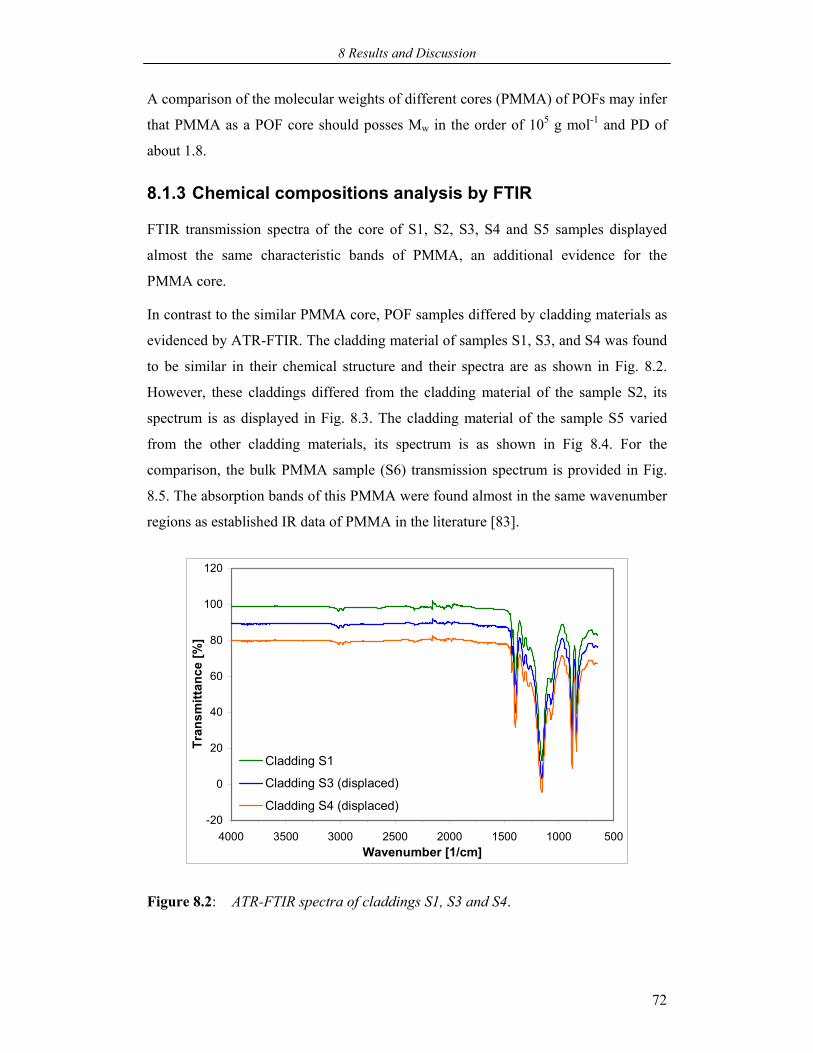
8 Results and Discussion
72
A comparison of the molecular weights of different cores (PMMA) of POFs may infer
that PMMA as a POF core should posses Mw in the order of 105 g mol-1 and PD of
about 1.8.
8.1.3 Chemical compositions analysis by FTIR
FTIR transmission spectra of the core of S1, S2, S3, S4 and S5 samples displayed
almost the same characteristic bands of PMMA, an additional evidence for the
PMMA core.
In contrast to the similar PMMA core, POF samples differed by cladding materials as
evidenced by ATR-FTIR. The cladding material of samples S1, S3, and S4 was found
to be similar in their chemical structure and their spectra are as shown in Fig. 8.2.
However, these claddings differed from the cladding material of the sample S2, its
spectrum is as displayed in Fig. 8.3. The cladding material of the sample S5 varied
from the other cladding materials, its spectrum is as shown in Fig 8.4. For the
comparison, the bulk PMMA sample (S6) transmission spectrum is provided in Fig.
8.5. The absorption bands of this PMMA were found almost in the same wavenumber
regions as established IR data of PMMA in the literature [83].
-20
0
20
40
60
80
100
120
5001000150020002500300035004000Wavenumber [1/cm]
Tran
smitt
ance
[%]
Cladding S1
Cladding S3 (displaced)
Cladding S4 (displaced)
Figure 8.2: ATR-FTIR spectra of claddings S1, S3 and S4.
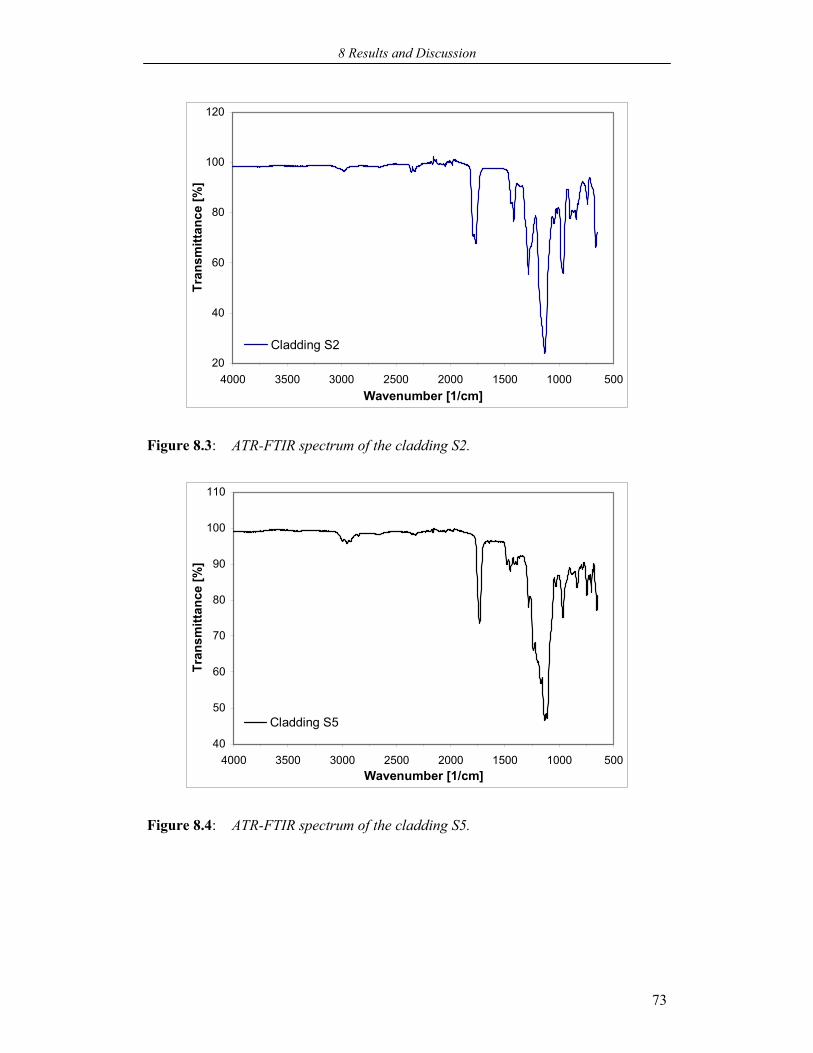
8 Results and Discussion
73
20
40
60
80
100
120
5001000150020002500300035004000Wavenumber [1/cm]
Tran
smitt
ance
[%]
Cladding S2
Figure 8.3: ATR-FTIR spectrum of the cladding S2.
40
50
60
70
80
90
100
110
5001000150020002500300035004000Wavenumber [1/cm]
Tran
smitt
ance
[%]
Cladding S5
Figure 8.4: ATR-FTIR spectrum of the cladding S5.
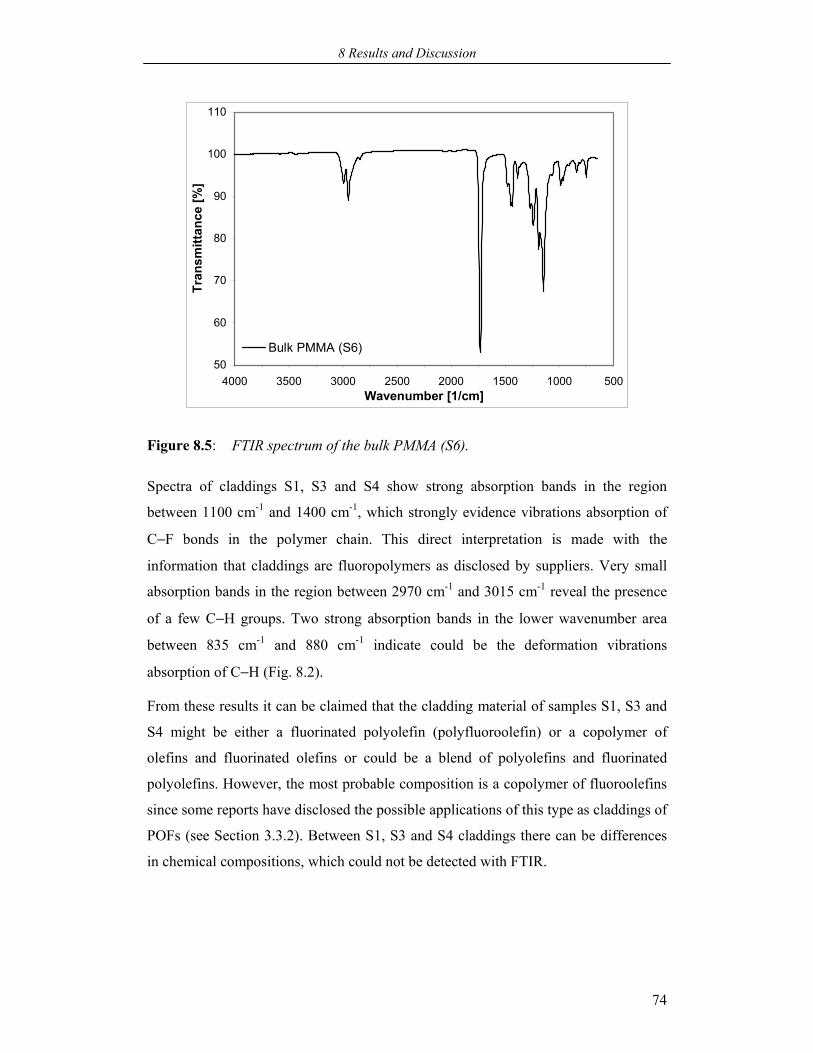
8 Results and Discussion
74
50
60
70
80
90
100
110
5001000150020002500300035004000Wavenumber [1/cm]
Tran
smitt
ance
[%]
Bulk PMMA (S6)
Figure 8.5: FTIR spectrum of the bulk PMMA (S6).
Spectra of claddings S1, S3 and S4 show strong absorption bands in the region
between 1100 cm-1 and 1400 cm-1, which strongly evidence vibrations absorption of
C−F bonds in the polymer chain. This direct interpretation is made with the
information that claddings are fluoropolymers as disclosed by suppliers. Very small
absorption bands in the region between 2970 cm-1 and 3015 cm-1 reveal the presence
of a few C−H groups. Two strong absorption bands in the lower wavenumber area
between 835 cm-1 and 880 cm-1 indicate could be the deformation vibrations
absorption of C−H (Fig. 8.2).
From these results it can be claimed that the cladding material of samples S1, S3 and
S4 might be either a fluorinated polyolefin (polyfluoroolefin) or a copolymer of
olefins and fluorinated olefins or could be a blend of polyolefins and fluorinated
polyolefins. However, the most probable composition is a copolymer of fluoroolefins
since some reports have disclosed the possible applications of this type as claddings of
POFs (see Section 3.3.2). Between S1, S3 and S4 claddings there can be differences
in chemical compositions, which could not be detected with FTIR.
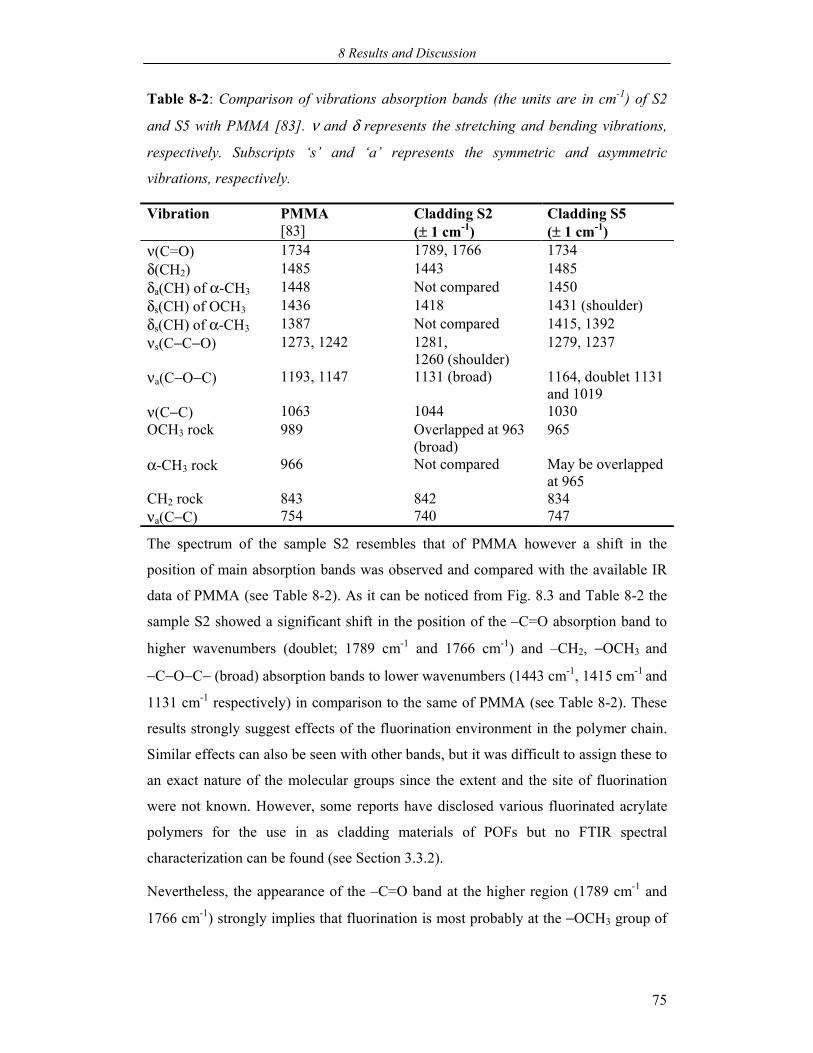
8 Results and Discussion
75
Table 8-2: Comparison of vibrations absorption bands (the units are in cm-1) of S2
and S5 with PMMA [83]. ν and δ represents the stretching and bending vibrations,
respectively. Subscripts ‘s’ and ‘a’ represents the symmetric and asymmetric
vibrations, respectively.
Vibration PMMA [83]
Cladding S2 (± 1 cm-1)
Cladding S5 (± 1 cm-1)
ν(C=O) 1734 1789, 1766 1734 δ(CH2) 1485 1443 1485 δa(CH) of α-CH3 1448 Not compared 1450 δs(CH) of OCH3 1436 1418 1431 (shoulder) δs(CH) of α-CH3 1387 Not compared 1415, 1392 νs(C−C−O) 1273, 1242 1281,
1260 (shoulder) 1279, 1237
νa(C−O−C) 1193, 1147 1131 (broad) 1164, doublet 1131 and 1019
ν(C−C) 1063 1044 1030 OCH3 rock 989 Overlapped at 963
(broad) 965
α-CH3 rock 966 Not compared May be overlapped at 965
CH2 rock 843 842 834 νa(C−C) 754 740 747
The spectrum of the sample S2 resembles that of PMMA however a shift in the
position of main absorption bands was observed and compared with the available IR
data of PMMA (see Table 8-2). As it can be noticed from Fig. 8.3 and Table 8-2 the
sample S2 showed a significant shift in the position of the –C=O absorption band to
higher wavenumbers (doublet; 1789 cm-1 and 1766 cm-1) and –CH2, −OCH3 and
−C−O−C− (broad) absorption bands to lower wavenumbers (1443 cm-1, 1415 cm-1 and
1131 cm-1 respectively) in comparison to the same of PMMA (see Table 8-2). These
results strongly suggest effects of the fluorination environment in the polymer chain.
Similar effects can also be seen with other bands, but it was difficult to assign these to
an exact nature of the molecular groups since the extent and the site of fluorination
were not known. However, some reports have disclosed various fluorinated acrylate
polymers for the use in as cladding materials of POFs but no FTIR spectral
characterization can be found (see Section 3.3.2).
Nevertheless, the appearance of the –C=O band at the higher region (1789 cm-1 and
1766 cm-1) strongly implies that fluorination is most probably at the −OCH3 group of
8 Results and Discussion
76
the polymer [84]. The broad and doublet of the –C=O band may also indicate could be
a copolymer of fluoroacrylate and non-fluoroacrylate monomer. The absorption band
of α-R (CH3) was not compared due to lack of spectral information however it is
possible that –R can be either CH3 or H or F [34]. The broad absorption band of
−C−O−C− in the lower region 1131 cm-1 reveals a overlap of C–F vibrations. The
fluorination at −OCH3 is most probably the substitution of hydrogen by fluorine
atoms but also could be the substitution by a linear fluorinated alkyl chain.
With these findings it can be claimed that the cladding of S2 should be an
poly(fluoroalkyl acrylate) (PFA).
The spectrum of S5 cladding shows more similarity in contrast to that of S2 with the
spectrum of PMMA (see Fig.8.4 and 8.5, and Table 8-2). However, a shift in the
position of absorption bands due to fluorination was observed. The main absorption
bands were compared and presented in Table 8-2. The broad and small absorption
bands in the region between 1060 cm-1 and 1300 cm-1 show a big influence of C−F
groups. The comparison of absorption bands with that of PMMA evidences the
fluorination is most likely be at the –OCH3 group of PMMA (see Table 8-2). Because
no shift in the position of the –C=O band compared to that of PMMA was observed,
the fluorination might be the substitution of hydrogen atoms by a linear fluorinated
alkyl chain [85].
The results support that the cladding S5 should be a poly(fluoroalkyl methacrylate)
(PFMA) but the extent of fluorination was found difficult to assign. It is also possible
that a copolymer or a blend of non-fluoroacrylate and fluoroacrylate polymers could
be the material of the cladding.
Although these findings give an overview of most likely chemical compositions of
claddings, the exact composition elucidation is very complicated since each
manufacturer/researcher use their own formulation to achieve better optical properties
(see Section 3.3.2 for details of cladding materials).
8 Results and Discussion
77
8.2 Climatic exposure of POF cables
The optical transmission stability of two POF cables S1 and S2, which are exposed to
a climate of 92 °C / 95 % relative humidity (RH), is investigated. The possible causes
for the loss of optical transmission due to climatic exposure are researched by several
means.
The chemiluminescence (CL) technique is applied to investigate the thermo-oxidative
degradation/stability of the unexposed and exposed samples. FTIR, TG, GPC and
UV/visible transmittance measurements are carried out to investigate climatic
exposure effects on POFs.
8.2.1 Online optical transmission measurements
The results of multiplexer measured optical transmission data of POF cables (S1 and
S2) are presented in Fig. 8.6. It is the average value of the three wavelengths (see
Section 7.3.1) transmission data, which were acquired as a function of time during the
exposure to the climate 92 °C / 95 %RH.
The transmission values (%) also can be expressed in dB/km, which is presented in
Table 7-4 and it can serve as a reference table.
The results clearly evidence a difference in the optical transmission stability between
the two POFs although they possessed the same core material PMMA. The sample S2
exhibited higher optical stability than that of the sample S1. Moreover, the
transmission loss behavior displayed by these samples was dissimilar from each other
as can be perceived from Fig. 8.6.
Within about 50 hours of the exposure, the optical transmission of both the POFs
decreased by a certain extent (about 6 %) and during this reduction they exhibited
similar behavior. These observations are similar to the findings by Daum et al., who
have investigated the reliability of different PMMA based POFs [3,54]. They have
proposed the initial reduction of the transmission to initial fluctuation of humidity in
the POF. Schartel et al. have proposed it to chemical changes mainly by oxidation of
low molecular weight species in the fiber core [51,52]. However, the initial reduction
of the transmission observed in the present case is attributed mainly to physical
changes (like softening of the polymer by mainly water molecules, for details of such
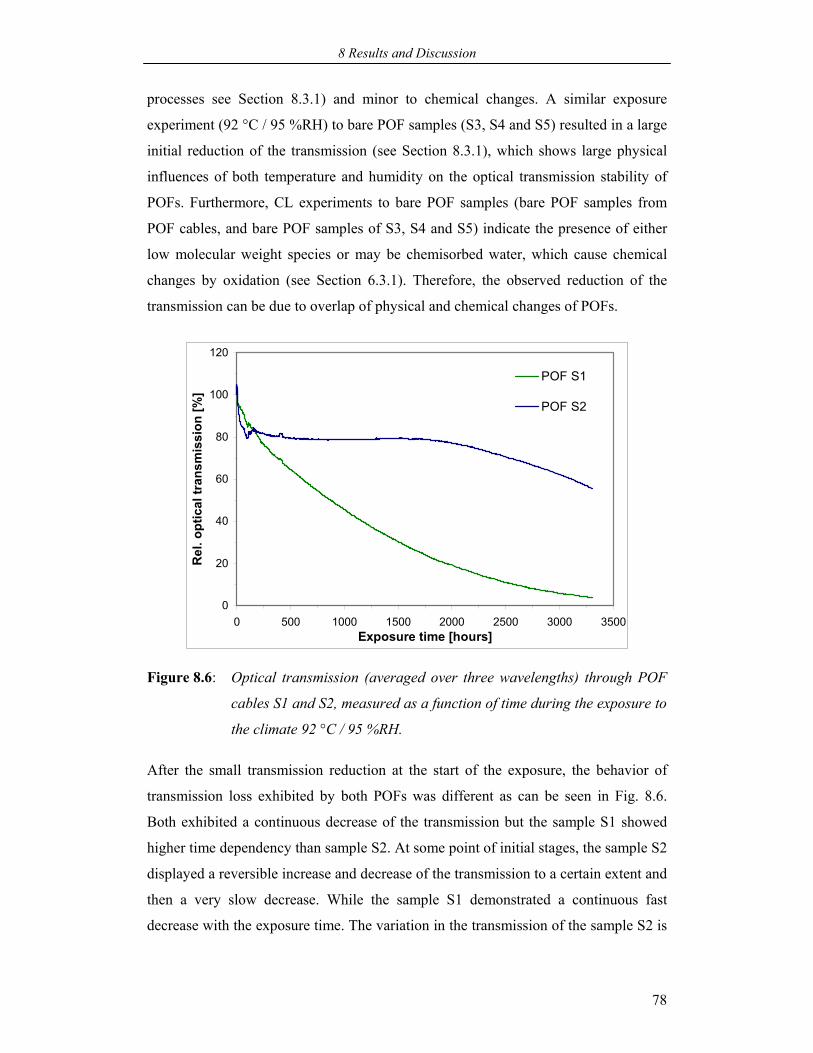
8 Results and Discussion
78
processes see Section 8.3.1) and minor to chemical changes. A similar exposure
experiment (92 °C / 95 %RH) to bare POF samples (S3, S4 and S5) resulted in a large
initial reduction of the transmission (see Section 8.3.1), which shows large physical
influences of both temperature and humidity on the optical transmission stability of
POFs. Furthermore, CL experiments to bare POF samples (bare POF samples from
POF cables, and bare POF samples of S3, S4 and S5) indicate the presence of either
low molecular weight species or may be chemisorbed water, which cause chemical
changes by oxidation (see Section 6.3.1). Therefore, the observed reduction of the
transmission can be due to overlap of physical and chemical changes of POFs.
0
20
40
60
80
100
120
0 500 1000 1500 2000 2500 3000 3500Exposure time [hours]
Rel
. opt
ical
tran
smis
sion
[%]
POF S1
POF S2
Figure 8.6: Optical transmission (averaged over three wavelengths) through POF
cables S1 and S2, measured as a function of time during the exposure to
the climate 92 °C / 95 %RH.
After the small transmission reduction at the start of the exposure, the behavior of
transmission loss exhibited by both POFs was different as can be seen in Fig. 8.6.
Both exhibited a continuous decrease of the transmission but the sample S1 showed
higher time dependency than sample S2. At some point of initial stages, the sample S2
displayed a reversible increase and decrease of the transmission to a certain extent and
then a very slow decrease. While the sample S1 demonstrated a continuous fast
decrease with the exposure time. The variation in the transmission of the sample S2 is
8 Results and Discussion
79
assigned to mainly additional physical changes, as chemical reactions alone would
show a monotonic decrease of the transmission. Physical changes are most likely be
due to the presence of humidity, and the extent of reversible transmission change
could depend on the materials properties of core, cladding and jacket. However, from
the position of the slow decrease of the transmission registered by the sample S2 and
the continuous decrease by the sample S1, the changes are attributed mainly to the
oxidative degradation of the polymer brought by the thermal energy. The results of
CL, FTIR, TG, UV/visible transmittance and GPC experiments demonstrate the
occurrence of degradation in the exposed samples, which might be the major cause for
the observed transmission loss of POFs.
8.2.2 Investigation of thermo-oxidative stability/degradation using CL
Exposures/aging of polymers results in changes of both chemical and physical
properties through undesired irreversible aging processes, which are related to
oxidation (see Chapter 5). The aging or exposure of polymers in presence of climatic
parameters (e.g.: temperature, and temperature and humidity), without UV exposure,
is thermo-oxidative in nature, which also is the case for CL and hence its results can
be directly used to assess their stability.
The utility of conventional methods such as FTIR coupled with TG, and DSC is
limited by their lacking sensitivity to monitor the thermo-oxidative degradation of
polymers. In contrary, the CL technique has been known for many years for
monitoring the thermal oxidation in many organic compounds and organic polymers
[65-76]. The basic auto-oxidation scheme for polymers is discussed in more detail in
Chapter 5 and 6. The CL emission in first approximation is proportional to the
oxidation reaction rate, higher emission meaning lower thermo-oxidative stability of
the sample under investigation and vice-versa. Therefore, it gives more
straightforward evaluation of the residual stabilization of the polymer than the other
techniques. Since the development of single photon counting technique, CL has been
demonstrated to be a powerful tool to investigate the thermo-oxidative stability of
many commodity and engineering polymeric materials, especially polyolefins [66-76]
and polyamides [69,75,86]. Recently, it has been successfully extended to study the
thermo-oxidative degradation behavior of optical polymers such as PMMA (POFs)
8 Results and Discussion
80
[51,52] and conjugated polymers [87]. These investigations have centered on
modeling of the oxidation behavior at a specified temperature range.
Bare POF and cladding samples (S1 and S2) both were investigated for their thermo-
oxidative stability using CL in the temperature range 107 °C (380 K) to 177 °C
(450 K). The applied temperature program was as presented along with CL curves
shown in subsequent paragraphs. Both the samples exhibited CL with no induction
period (see Section 5.2.1) in the selected temperature range. Because the investigated
samples maintained the same form and a constant initial weight, the results are
comparable and reliable. With bare POF samples (S3 and S4) it is modeled that the
total CL emission of the bare POF (core and cladding) is the contribution from both
the core and cladding (see Section 8.3.2).
8.2.2.1 Initial peak and plateau behavior
Both the unexposed bare POF and cladding samples exhibited an initial peak and
subsequent plateau CL emission behavior, which is shown in Fig. 8.7 for the bare
POF S1 and S2.
The observed peak and plateau CL emission behavior are similar to the findings of
previous studies (but the sampling technique is different from the present case),
showing the consistency of the CL method [51,52,87]. The initial peak behavior
observed in both the samples can be proposed to an extent of the consumption of low
molecular weight species such as monomer could present in the polymer matrix
reacting with oxygen and/or to the reaction of a fraction of the polymer accessible in
excess with already available or trapped oxygen in the polymer matrix. Therefore, the
reaction may be independent of diffusion of surrounding oxygen. Some previous
studies on CL of the cellulose polymer have reported such an initial peak, which is
mainly due to the chemisorbed water in the polymer [88]. If the second interpretation
is adopted the observed initial peak would represent an amount of the absorbed
humidity in the present samples (bare POF and cladding).
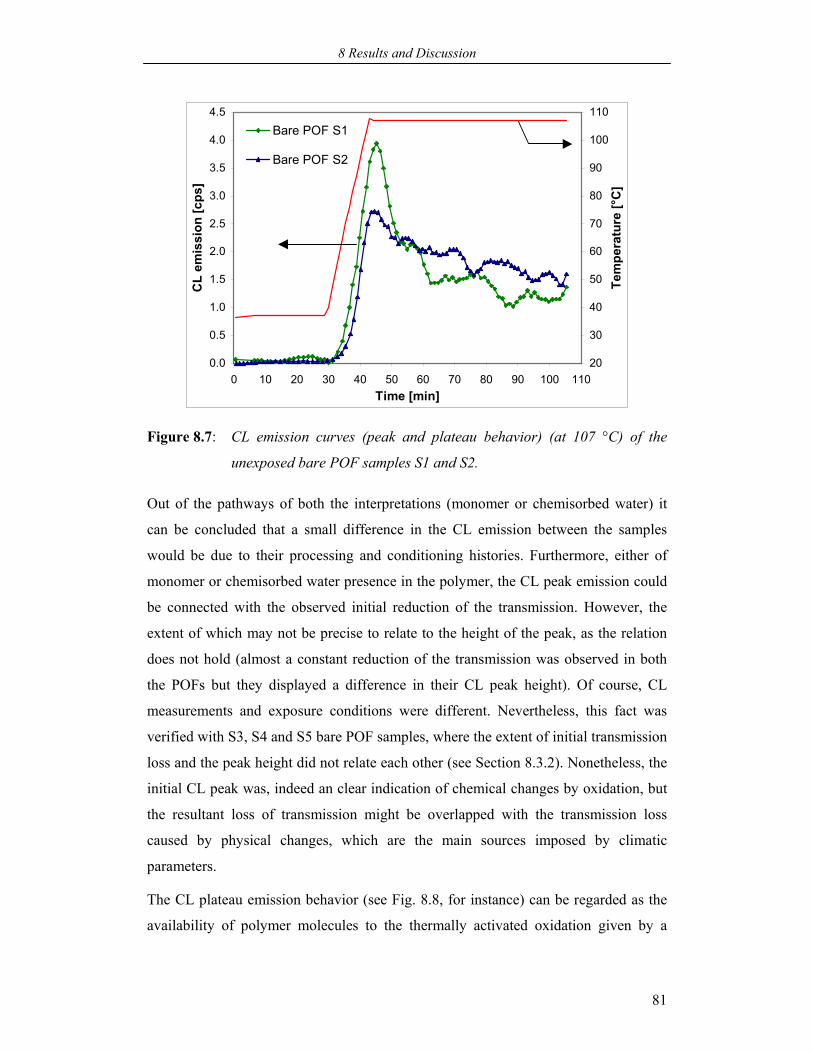
8 Results and Discussion
81
0.0
0.5
1.0
1.5
2.0
2.5
3.0
3.5
4.0
4.5
0 10 20 30 40 50 60 70 80 90 100 110Time [min]
CL
emis
sion
[cps
]
20
30
40
50
60
70
80
90
100
110
Tem
pera
ture
[°C
]
Bare POF S1
Bare POF S2
Figure 8.7: CL emission curves (peak and plateau behavior) (at 107 °C) of the
unexposed bare POF samples S1 and S2.
Out of the pathways of both the interpretations (monomer or chemisorbed water) it
can be concluded that a small difference in the CL emission between the samples
would be due to their processing and conditioning histories. Furthermore, either of
monomer or chemisorbed water presence in the polymer, the CL peak emission could
be connected with the observed initial reduction of the transmission. However, the
extent of which may not be precise to relate to the height of the peak, as the relation
does not hold (almost a constant reduction of the transmission was observed in both
the POFs but they displayed a difference in their CL peak height). Of course, CL
measurements and exposure conditions were different. Nevertheless, this fact was
verified with S3, S4 and S5 bare POF samples, where the extent of initial transmission
loss and the peak height did not relate each other (see Section 8.3.2). Nonetheless, the
initial CL peak was, indeed an clear indication of chemical changes by oxidation, but
the resultant loss of transmission might be overlapped with the transmission loss
caused by physical changes, which are the main sources imposed by climatic
parameters.
The CL plateau emission behavior (see Fig. 8.8, for instance) can be regarded as the
availability of polymer molecules to the thermally activated oxidation given by a
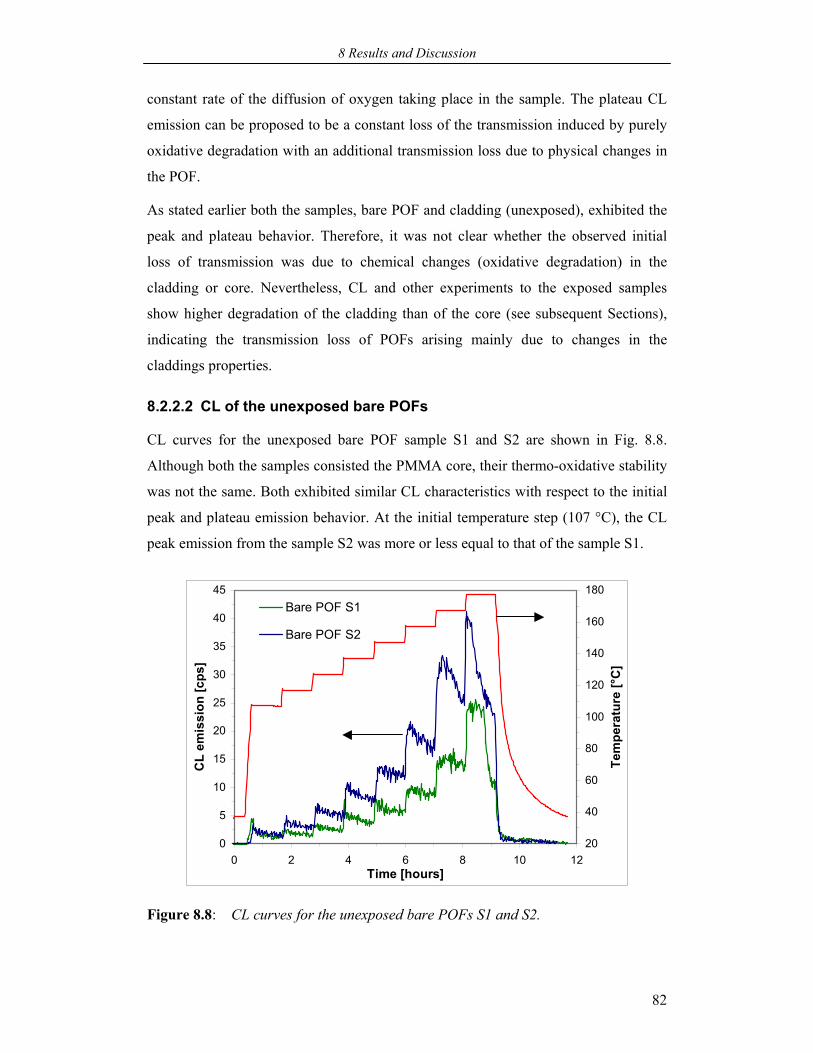
8 Results and Discussion
82
constant rate of the diffusion of oxygen taking place in the sample. The plateau CL
emission can be proposed to be a constant loss of the transmission induced by purely
oxidative degradation with an additional transmission loss due to physical changes in
the POF.
As stated earlier both the samples, bare POF and cladding (unexposed), exhibited the
peak and plateau behavior. Therefore, it was not clear whether the observed initial
loss of transmission was due to chemical changes (oxidative degradation) in the
cladding or core. Nevertheless, CL and other experiments to the exposed samples
show higher degradation of the cladding than of the core (see subsequent Sections),
indicating the transmission loss of POFs arising mainly due to changes in the
claddings properties.
8.2.2.2 CL of the unexposed bare POFs
CL curves for the unexposed bare POF sample S1 and S2 are shown in Fig. 8.8.
Although both the samples consisted the PMMA core, their thermo-oxidative stability
was not the same. Both exhibited similar CL characteristics with respect to the initial
peak and plateau emission behavior. At the initial temperature step (107 °C), the CL
peak emission from the sample S2 was more or less equal to that of the sample S1.
0
5
10
15
20
25
30
35
40
45
0 2 4 6 8 10 12Time [hours]
CL
emis
sion
[cps
]
20
40
60
80
100
120
140
160
180
Tem
pera
ture
[°C
]Bare POF S1
Bare POF S2
Figure 8.8: CL curves for the unexposed bare POFs S1 and S2.
8 Results and Discussion
83
However, in the subsequent temperature steps, the CL emission from the sample S2
was greater than that of the sample S1 but both showed an increasing trend. Possible
explanations are an increase of the mobility of polymer chains that are spatially
separated and an increase of the diffusion or dissolution of oxygen in the polymer
matrix. The polymer chain mobility could be additionally increased by the
plasticization of degradation products. At higher temperatures (167 °C and 177 °C),
the plateau behavior of the sample S2 marked to vanish but attained a broad
maximum and then decreased. This may not be surprising because higher
temperatures could result in the accumulation of reaction products that can quench the
excited state carbonyls, as a result a fast decay of the CL emission may be expected
[89]. The decay rate of CL could be enhanced by the mobility of both excited state
molecules and oxidation products due to melting of the polymer. The influence of
temperature on the decay rate can be seen in Fig. 8.8 in the fact that the CL emission
shows a less pronounced declining slope at 167 °C than at 177 °C. However, detail
investigations may be necessary to confirm these characteristics and will be done in a
future research.
The CL emission from the sample S2 was higher and appeared to be less thermo-
oxidative stable as compared to the sample S1. The difference in the CL emission
between the two samples is attributed predominantly due to a difference in the
chemical compositions of claddings because the core of both was PMMA. Additional
influencing factors could be polymer formulation, manufacturing and fiber drawing
conditions. But these differences are believed to be less significant because POFs
producers can use a similar formulation and drawing conditions in order to achieve
the transparency as high as possible. Therefore, the claddings should be responsible
for the observed differences in CL of bare POF samples. So it is believed that the CL
behavior of the bare POF is almost a model of cladding CL, except for lower emission
from the former mainly owing to the sample physical structure. CL of the claddings is
discussed in the subsequent section. It is known that the core (950 µm to 980 µm in
diameter) is a major part of the bare POF. But oxidation (using new oxygen from the
surrounding) of the bare POF sample starts first at the cladding and then spread to the
core because the cladding (50 µm to 20 µm in thickness) acts like a protective layer.
Therefore, it is possible to assume that the thermo-oxidative degradation of the core
should mainly depend on the diffusion constant of the cladding polymer. The
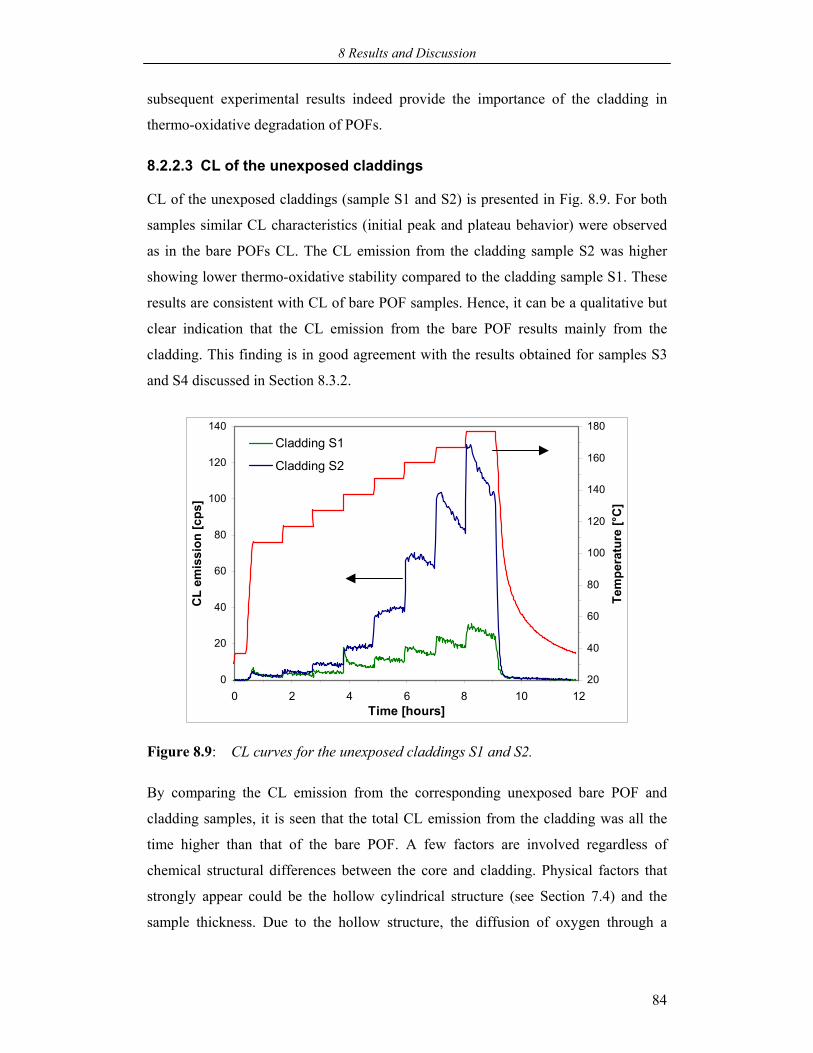
8 Results and Discussion
84
subsequent experimental results indeed provide the importance of the cladding in
thermo-oxidative degradation of POFs.
8.2.2.3 CL of the unexposed claddings
CL of the unexposed claddings (sample S1 and S2) is presented in Fig. 8.9. For both
samples similar CL characteristics (initial peak and plateau behavior) were observed
as in the bare POFs CL. The CL emission from the cladding sample S2 was higher
showing lower thermo-oxidative stability compared to the cladding sample S1. These
results are consistent with CL of bare POF samples. Hence, it can be a qualitative but
clear indication that the CL emission from the bare POF results mainly from the
cladding. This finding is in good agreement with the results obtained for samples S3
and S4 discussed in Section 8.3.2.
0
20
40
60
80
100
120
140
0 2 4 6 8 10 12Time [hours]
CL
emis
sion
[cps
]
20
40
60
80
100
120
140
160
180
Tem
pera
ture
[°C
]
Cladding S1
Cladding S2
Figure 8.9: CL curves for the unexposed claddings S1 and S2.
By comparing the CL emission from the corresponding unexposed bare POF and
cladding samples, it is seen that the total CL emission from the cladding was all the
time higher than that of the bare POF. A few factors are involved regardless of
chemical structural differences between the core and cladding. Physical factors that
strongly appear could be the hollow cylindrical structure (see Section 7.4) and the
sample thickness. Due to the hollow structure, the diffusion of oxygen through a
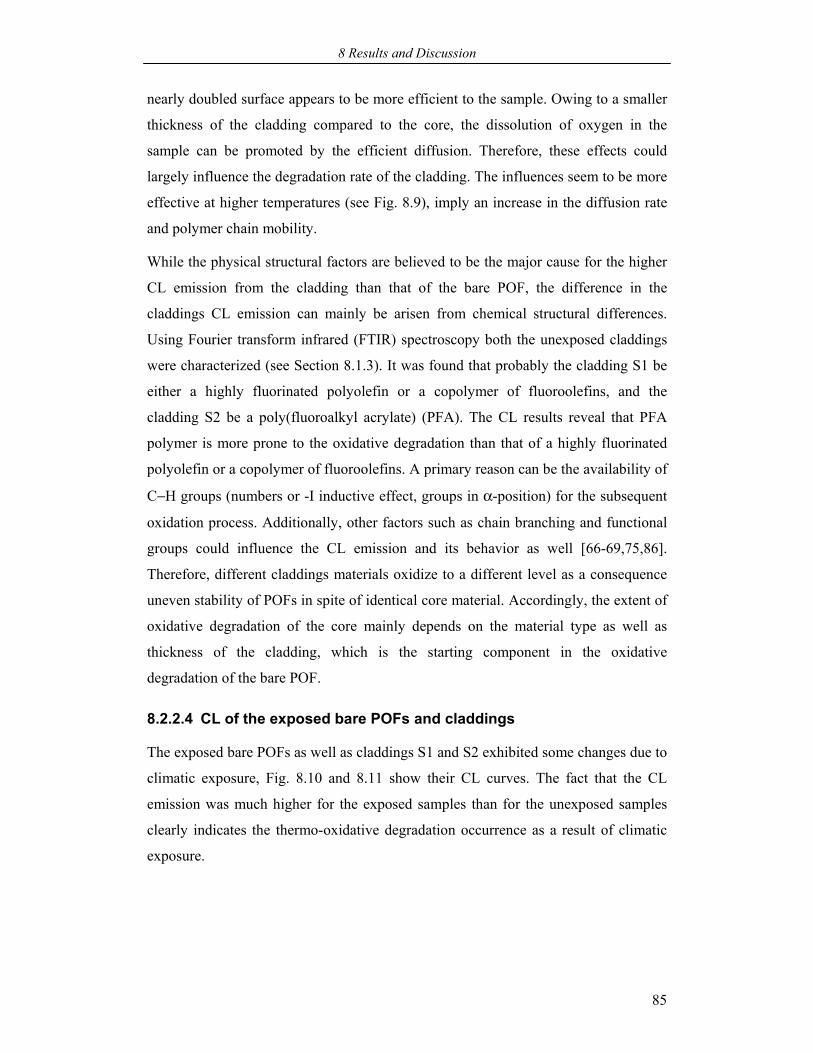
8 Results and Discussion
85
nearly doubled surface appears to be more efficient to the sample. Owing to a smaller
thickness of the cladding compared to the core, the dissolution of oxygen in the
sample can be promoted by the efficient diffusion. Therefore, these effects could
largely influence the degradation rate of the cladding. The influences seem to be more
effective at higher temperatures (see Fig. 8.9), imply an increase in the diffusion rate
and polymer chain mobility.
While the physical structural factors are believed to be the major cause for the higher
CL emission from the cladding than that of the bare POF, the difference in the
claddings CL emission can mainly be arisen from chemical structural differences.
Using Fourier transform infrared (FTIR) spectroscopy both the unexposed claddings
were characterized (see Section 8.1.3). It was found that probably the cladding S1 be
either a highly fluorinated polyolefin or a copolymer of fluoroolefins, and the
cladding S2 be a poly(fluoroalkyl acrylate) (PFA). The CL results reveal that PFA
polymer is more prone to the oxidative degradation than that of a highly fluorinated
polyolefin or a copolymer of fluoroolefins. A primary reason can be the availability of
C−H groups (numbers or -I inductive effect, groups in α-position) for the subsequent
oxidation process. Additionally, other factors such as chain branching and functional
groups could influence the CL emission and its behavior as well [66-69,75,86].
Therefore, different claddings materials oxidize to a different level as a consequence
uneven stability of POFs in spite of identical core material. Accordingly, the extent of
oxidative degradation of the core mainly depends on the material type as well as
thickness of the cladding, which is the starting component in the oxidative
degradation of the bare POF.
8.2.2.4 CL of the exposed bare POFs and claddings
The exposed bare POFs as well as claddings S1 and S2 exhibited some changes due to
climatic exposure, Fig. 8.10 and 8.11 show their CL curves. The fact that the CL
emission was much higher for the exposed samples than for the unexposed samples
clearly indicates the thermo-oxidative degradation occurrence as a result of climatic
exposure.
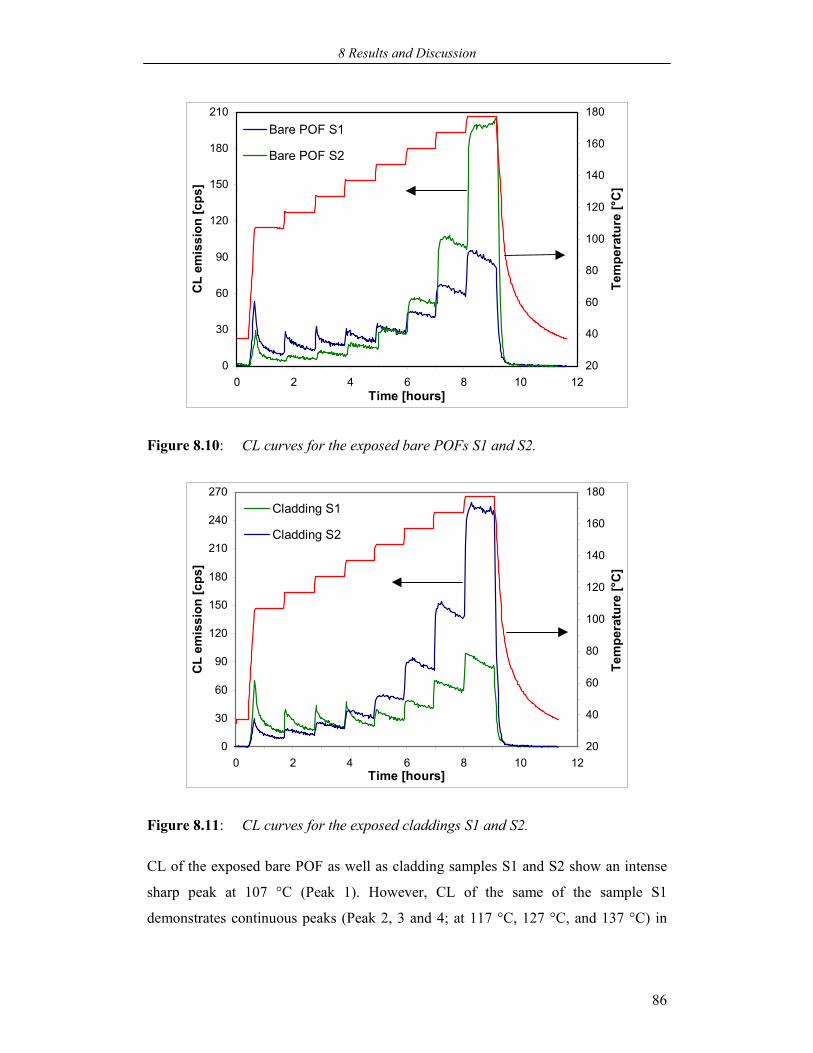
8 Results and Discussion
86
0
30
60
90
120
150
180
210
0 2 4 6 8 10 12Time [hours]
CL
emis
sion
[cps
]
20
40
60
80
100
120
140
160
180
Tem
pera
ture
[°C
]
Bare POF S1
Bare POF S2
Figure 8.10: CL curves for the exposed bare POFs S1 and S2.
0
30
60
90
120
150
180
210
240
270
0 2 4 6 8 10 12Time [hours]
CL
emis
sion
[cps
]
20
40
60
80
100
120
140
160
180
Tem
pera
ture
[°C
]
Cladding S1
Cladding S2
Figure 8.11: CL curves for the exposed claddings S1 and S2.
CL of the exposed bare POF as well as cladding samples S1 and S2 show an intense
sharp peak at 107 °C (Peak 1). However, CL of the same of the sample S1
demonstrates continuous peaks (Peak 2, 3 and 4; at 117 °C, 127 °C, and 137 °C) in
8 Results and Discussion
87
contrast to plateaus of the sample S2 for the subsequent temperature levels. The CL
peak behavior clearly implies the consumption of one of the reacting components of
the oxidation process. This could well be one or more of the involved low molecular
weight degradation products formed as a result of thermo-oxidative degradation by
climatic exposure. The peaks (Peak 1, 2, 3 and 4) could be interpreted as being due to
differences in oxidizing ability of various degradation products. The CL emission of
Peak 1 may be independent of the diffusion of external oxygen because in the
polymer matrix the use-up of dissolved oxygen itself may still be adequate to generate
peroxy radicals. To study the potential influence of external oxygen, CL of the
exposed bare POF samples under nitrogen atmosphere instead of oxygen was
investigated. The re-occurrence of Peak 1 was found though with lower emission and
with much lower emission of all the subsequent peaks and plateaus. It shows a
requirement of enough oxygen, which is necessary to oxidize the reactants
completely. Yet, the exposed samples peak behavior can be a direct indication of
readily oxidizable degradation products and therefore the peak intensity can be a
measure of an extent of the consumption of these products, at a particular temperature.
A comparison of the CL emission from the exposed sample S1 and S2 indicates lower
emission exhibited by the sample S2 at the initial four temperature steps (see Fig. 8.10
and 8.11). However, in the subsequent temperature steps, sample S2 exhibited much
higher CL emission than sample S1. This suggests that CL of the exposed sample S2
might involve one or more degradation mechanisms. Thermal aging of polymers may
lead to both degradation and crosslinking of polymer molecules [55,58]. In view of
this fact, the intensity of Peak 1 of the sample S2 could be related to the
decomposition of degradation products that are accumulated only at the surface of the
sample. Consequently, the first three plateaus (see Fig. 8.10 and 8.11) can be
proposed mainly to thermally activated oxidation of the available part of the
crosslinked polymer and their emission rate is controlled by the diffusion rate of
oxygen. Since crosslinking reduces the diffusion rate, the emission for the first three
plateaus was lower compared to that of sample S1. However, it was still higher than
that of the corresponding unexposed samples, which is probably due to the
decomposition of the remaining surface accumulated degradation products having
uneven thermo-oxidative stability. For the subsequent temperature levels (from
147 °C to 177 °C), the CL emission from the sample S2 started increasing and was
8 Results and Discussion
88
much higher than that of the sample S1. It can be due to the decomposition of
dissolved degradation products in the polymer matrix and an increase rate of oxygen
diffusion. Owing to high temperature the polymer can melt. As a result the
plasticization can positively influence the diffusion rate. Therefore, oxygen diffuses
efficiently into the polymer matrix and is utilized in the decomposition of dissolved
degradation products and an available part of the polymer as well.
From the above discussion of the results, the interpretation of the CL data so far can
be summarized as follows:
Up to the temperature level of 140 °C, the sample S1 exhibited four consecutive peaks
with higher emission and the following plateaus with lower emission as compared to
that of the sample S2. The fact that the CL emission from the exposed samples is
higher than for the corresponding unexposed samples clearly indicates the thermo-
oxidative degradation as a result of climatic exposure. The CL peaks imply mainly the
consumption of available readily oxidizable active species that newely become
available upon first reaching a new, higher temperature level. The following plateaus
emission derived mainly from oxidation of an available part of the polymer under
stationary conditions and governed by the individual diffusion rate of (new) oxygen
into the material. As compared to a variation (first decrease and then increase) of the
CL emission from the exposed sample S2, sample S1 displayed no such significant
variation. Therefore, it suggests that thermo-oxidative degradation could be the main
result of climatic exposure of the sample S1 in contrast to both thermo-oxidative
degradation and crosslinking of the sample S2.
A comparison of the total CL emission (integration of CL over time) shows a higher
value for the sample S2 than for the sample S1. It clearly evidences higher thermo-
oxidative degradation of the sample S2 as compared to the sample S1, as a result of
climatic exposure. This outcome is congruent to CL of the corresponding unexposed
samples that sample S2 exhibited lower thermo-oxidative stability than the sample S1.
Of course, other factors such as humidity and POF jacket were not taken into account
in the present CL experiments to the unexposed samples, although the actual climatic
exposure test was conducted in the presence of them. These factors could influence
CL of the bare POF and cladding as well. Not much data are available in regard to
influences of these factors. However, a previous investigation has found a decrease of
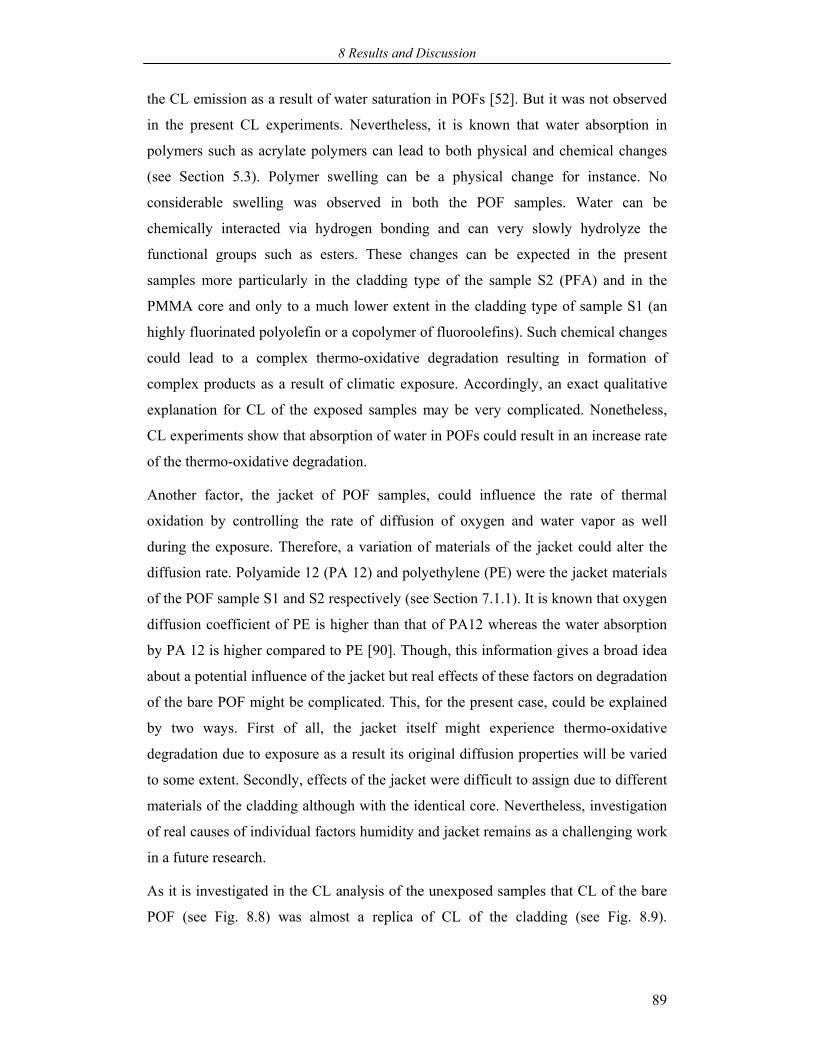
8 Results and Discussion
89
the CL emission as a result of water saturation in POFs [52]. But it was not observed
in the present CL experiments. Nevertheless, it is known that water absorption in
polymers such as acrylate polymers can lead to both physical and chemical changes
(see Section 5.3). Polymer swelling can be a physical change for instance. No
considerable swelling was observed in both the POF samples. Water can be
chemically interacted via hydrogen bonding and can very slowly hydrolyze the
functional groups such as esters. These changes can be expected in the present
samples more particularly in the cladding type of the sample S2 (PFA) and in the
PMMA core and only to a much lower extent in the cladding type of sample S1 (an
highly fluorinated polyolefin or a copolymer of fluoroolefins). Such chemical changes
could lead to a complex thermo-oxidative degradation resulting in formation of
complex products as a result of climatic exposure. Accordingly, an exact qualitative
explanation for CL of the exposed samples may be very complicated. Nonetheless,
CL experiments show that absorption of water in POFs could result in an increase rate
of the thermo-oxidative degradation.
Another factor, the jacket of POF samples, could influence the rate of thermal
oxidation by controlling the rate of diffusion of oxygen and water vapor as well
during the exposure. Therefore, a variation of materials of the jacket could alter the
diffusion rate. Polyamide 12 (PA 12) and polyethylene (PE) were the jacket materials
of the POF sample S1 and S2 respectively (see Section 7.1.1). It is known that oxygen
diffusion coefficient of PE is higher than that of PA12 whereas the water absorption
by PA 12 is higher compared to PE [90]. Though, this information gives a broad idea
about a potential influence of the jacket but real effects of these factors on degradation
of the bare POF might be complicated. This, for the present case, could be explained
by two ways. First of all, the jacket itself might experience thermo-oxidative
degradation due to exposure as a result its original diffusion properties will be varied
to some extent. Secondly, effects of the jacket were difficult to assign due to different
materials of the cladding although with the identical core. Nevertheless, investigation
of real causes of individual factors humidity and jacket remains as a challenging work
in a future research.
As it is investigated in the CL analysis of the unexposed samples that CL of the bare
POF (see Fig. 8.8) was almost a replica of CL of the cladding (see Fig. 8.9).
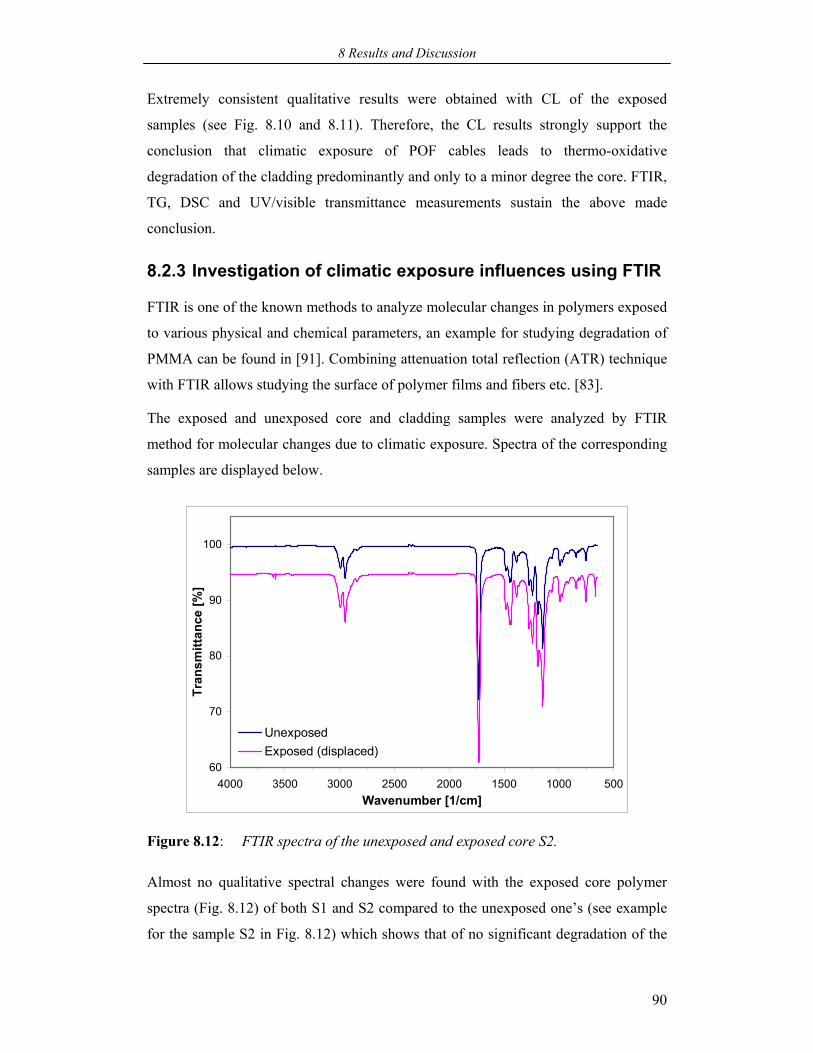
8 Results and Discussion
90
Extremely consistent qualitative results were obtained with CL of the exposed
samples (see Fig. 8.10 and 8.11). Therefore, the CL results strongly support the
conclusion that climatic exposure of POF cables leads to thermo-oxidative
degradation of the cladding predominantly and only to a minor degree the core. FTIR,
TG, DSC and UV/visible transmittance measurements sustain the above made
conclusion.
8.2.3 Investigation of climatic exposure influences using FTIR
FTIR is one of the known methods to analyze molecular changes in polymers exposed
to various physical and chemical parameters, an example for studying degradation of
PMMA can be found in [91]. Combining attenuation total reflection (ATR) technique
with FTIR allows studying the surface of polymer films and fibers etc. [83].
The exposed and unexposed core and cladding samples were analyzed by FTIR
method for molecular changes due to climatic exposure. Spectra of the corresponding
samples are displayed below.
60
70
80
90
100
5001000150020002500300035004000Wavenumber [1/cm]
Tran
smitt
ance
[%]
UnexposedExposed (displaced)
Figure 8.12: FTIR spectra of the unexposed and exposed core S2.
Almost no qualitative spectral changes were found with the exposed core polymer
spectra (Fig. 8.12) of both S1 and S2 compared to the unexposed one’s (see example
for the sample S2 in Fig. 8.12) which shows that of no significant degradation of the
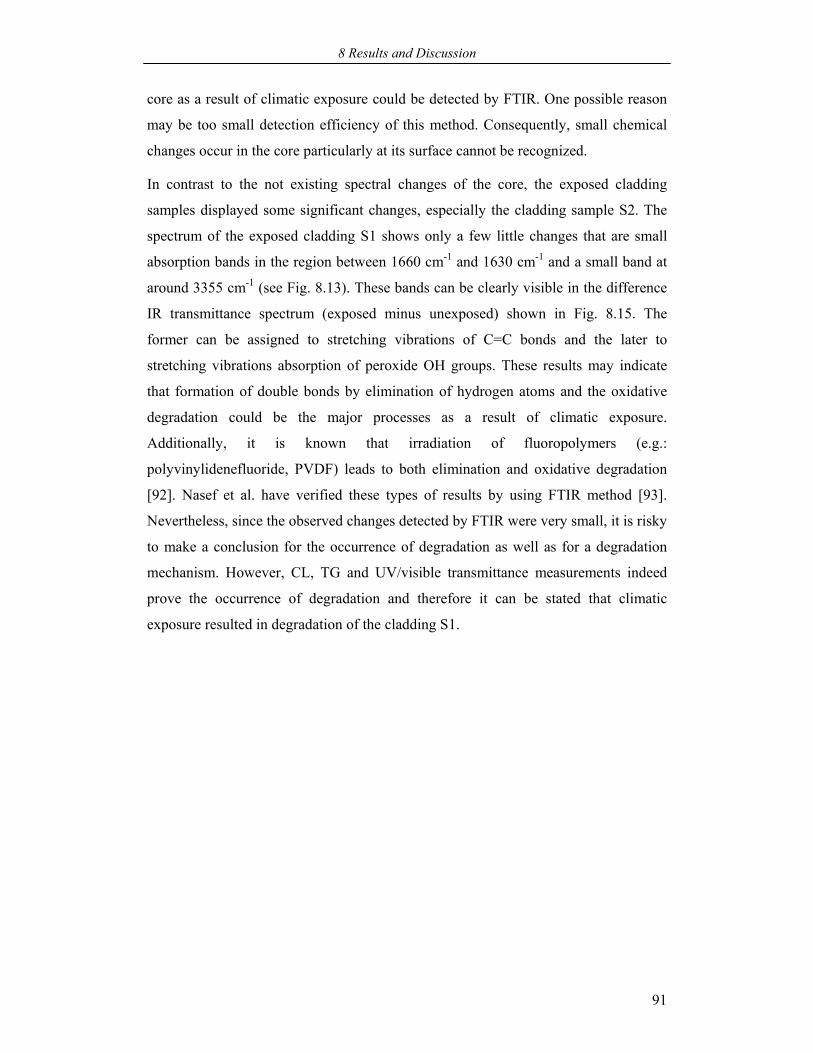
8 Results and Discussion
91
core as a result of climatic exposure could be detected by FTIR. One possible reason
may be too small detection efficiency of this method. Consequently, small chemical
changes occur in the core particularly at its surface cannot be recognized.
In contrast to the not existing spectral changes of the core, the exposed cladding
samples displayed some significant changes, especially the cladding sample S2. The
spectrum of the exposed cladding S1 shows only a few little changes that are small
absorption bands in the region between 1660 cm-1 and 1630 cm-1 and a small band at
around 3355 cm-1 (see Fig. 8.13). These bands can be clearly visible in the difference
IR transmittance spectrum (exposed minus unexposed) shown in Fig. 8.15. The
former can be assigned to stretching vibrations of C=C bonds and the later to
stretching vibrations absorption of peroxide OH groups. These results may indicate
that formation of double bonds by elimination of hydrogen atoms and the oxidative
degradation could be the major processes as a result of climatic exposure.
Additionally, it is known that irradiation of fluoropolymers (e.g.:
polyvinylidenefluoride, PVDF) leads to both elimination and oxidative degradation
[92]. Nasef et al. have verified these types of results by using FTIR method [93].
Nevertheless, since the observed changes detected by FTIR were very small, it is risky
to make a conclusion for the occurrence of degradation as well as for a degradation
mechanism. However, CL, TG and UV/visible transmittance measurements indeed
prove the occurrence of degradation and therefore it can be stated that climatic
exposure resulted in degradation of the cladding S1.
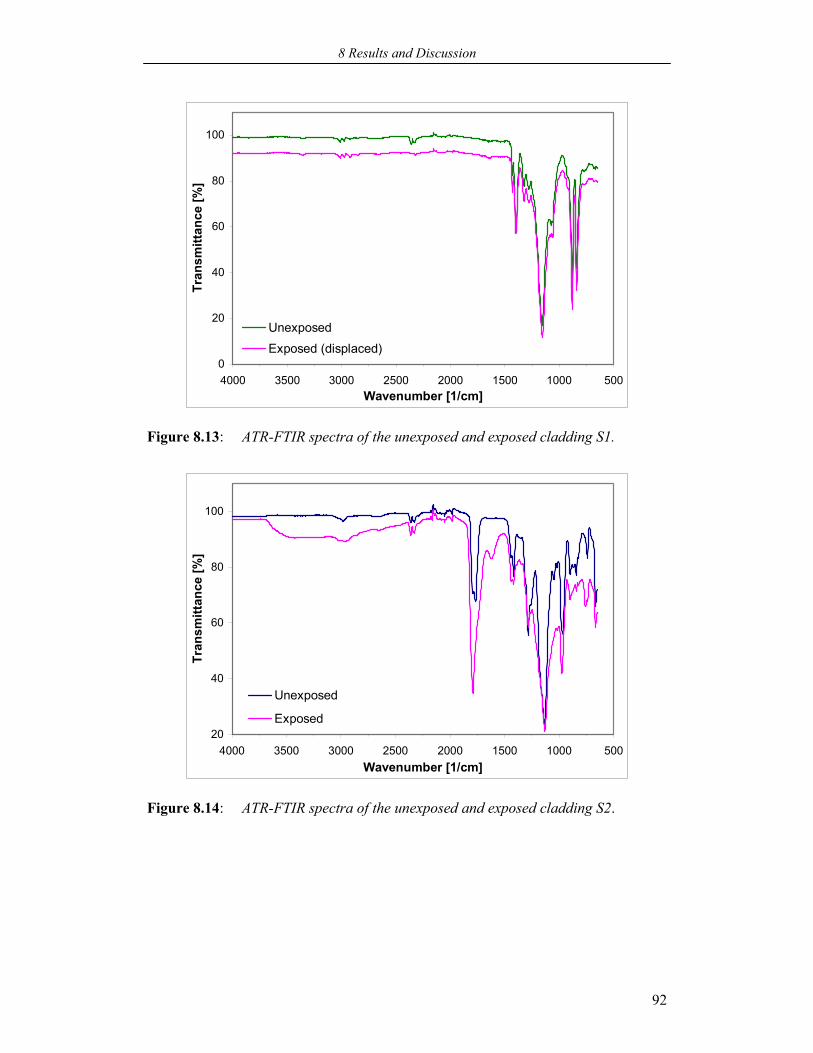
8 Results and Discussion
92
0
20
40
60
80
100
5001000150020002500300035004000Wavenumber [1/cm]
Tran
smitt
ance
[%]
Unexposed
Exposed (displaced)
Figure 8.13: ATR-FTIR spectra of the unexposed and exposed cladding S1.
20
40
60
80
100
5001000150020002500300035004000Wavenumber [1/cm]
Tran
smitt
ance
[%]
Unexposed
Exposed
Figure 8.14: ATR-FTIR spectra of the unexposed and exposed cladding S2.
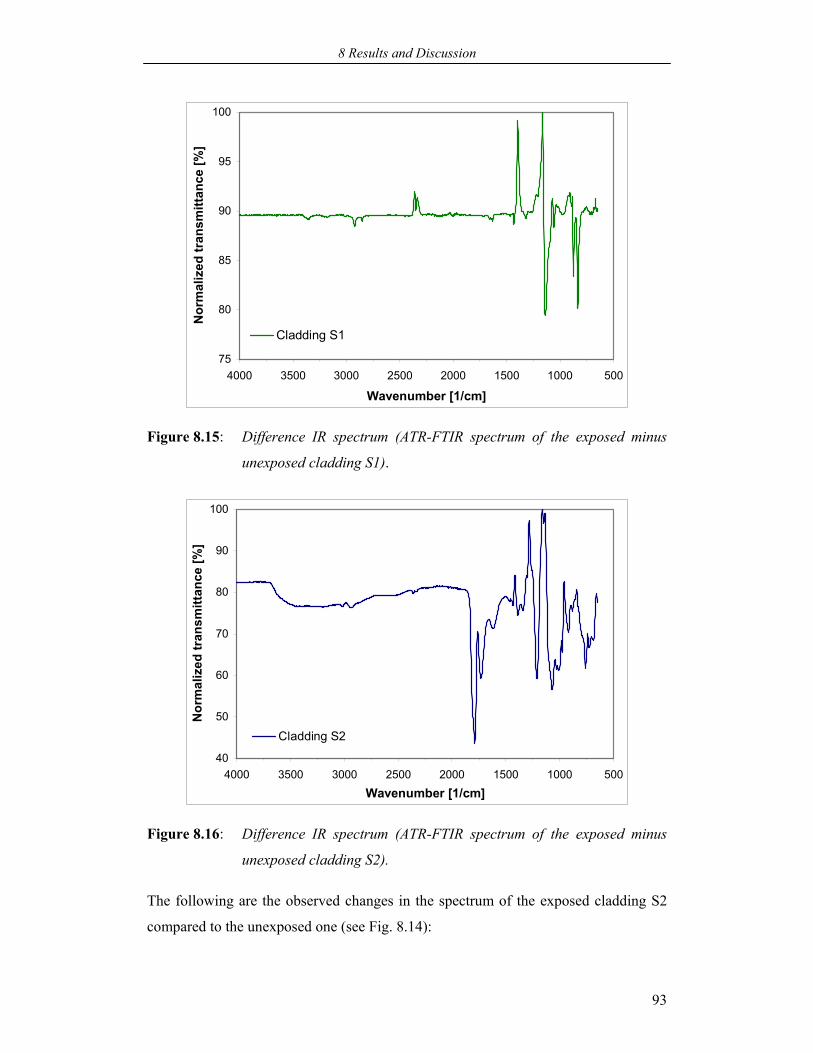
8 Results and Discussion
93
75
80
85
90
95
100
5001000150020002500300035004000
Wavenumber [1/cm]
Nor
mal
ized
tran
smitt
ance
[%]
Cladding S1
Figure 8.15: Difference IR spectrum (ATR-FTIR spectrum of the exposed minus
unexposed cladding S1).
40
50
60
70
80
90
100
5001000150020002500300035004000
Wavenumber [1/cm]
Nor
mal
ized
tran
smitt
ance
[%]
Cladding S2
Figure 8.16: Difference IR spectrum (ATR-FTIR spectrum of the exposed minus
unexposed cladding S2).
The following are the observed changes in the spectrum of the exposed cladding S2
compared to the unexposed one (see Fig. 8.14):
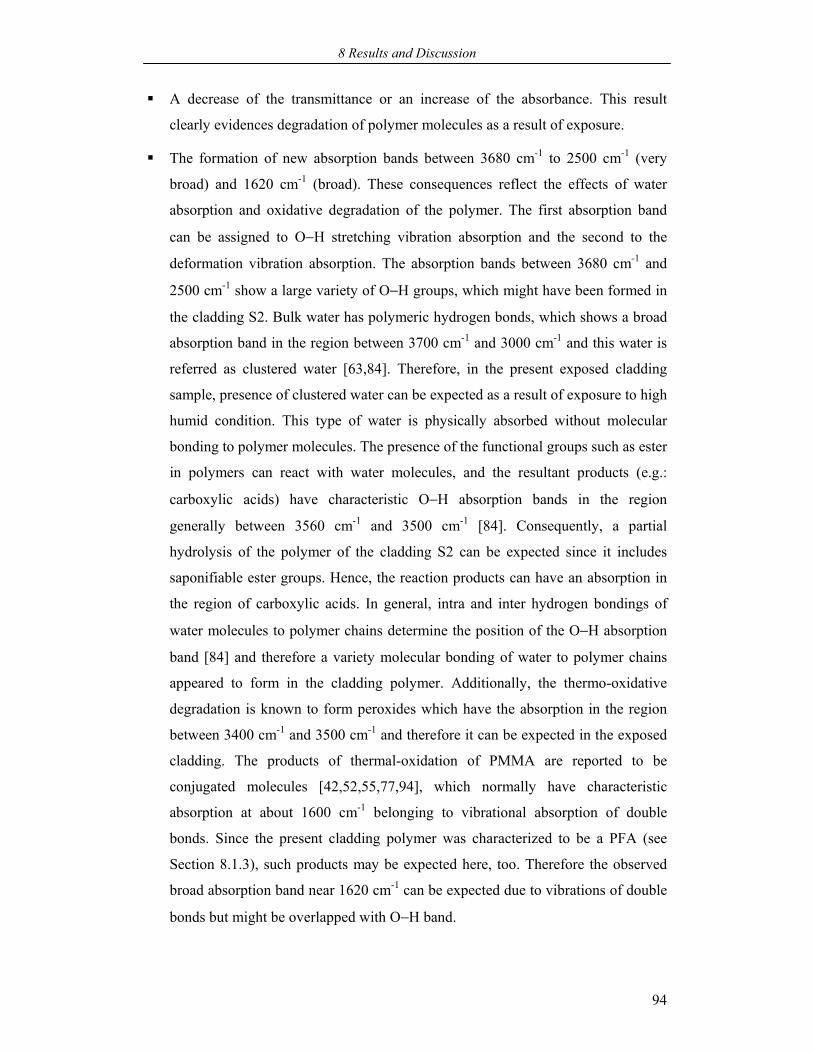
8 Results and Discussion
94
A decrease of the transmittance or an increase of the absorbance. This result
clearly evidences degradation of polymer molecules as a result of exposure.
The formation of new absorption bands between 3680 cm-1 to 2500 cm-1 (very
broad) and 1620 cm-1 (broad). These consequences reflect the effects of water
absorption and oxidative degradation of the polymer. The first absorption band
can be assigned to O−H stretching vibration absorption and the second to the
deformation vibration absorption. The absorption bands between 3680 cm-1 and
2500 cm-1 show a large variety of O−H groups, which might have been formed in
the cladding S2. Bulk water has polymeric hydrogen bonds, which shows a broad
absorption band in the region between 3700 cm-1 and 3000 cm-1 and this water is
referred as clustered water [63,84]. Therefore, in the present exposed cladding
sample, presence of clustered water can be expected as a result of exposure to high
humid condition. This type of water is physically absorbed without molecular
bonding to polymer molecules. The presence of the functional groups such as ester
in polymers can react with water molecules, and the resultant products (e.g.:
carboxylic acids) have characteristic O−H absorption bands in the region
generally between 3560 cm-1 and 3500 cm-1 [84]. Consequently, a partial
hydrolysis of the polymer of the cladding S2 can be expected since it includes
saponifiable ester groups. Hence, the reaction products can have an absorption in
the region of carboxylic acids. In general, intra and inter hydrogen bondings of
water molecules to polymer chains determine the position of the O−H absorption
band [84] and therefore a variety molecular bonding of water to polymer chains
appeared to form in the cladding polymer. Additionally, the thermo-oxidative
degradation is known to form peroxides which have the absorption in the region
between 3400 cm-1 and 3500 cm-1 and therefore it can be expected in the exposed
cladding. The products of thermal-oxidation of PMMA are reported to be
conjugated molecules [42,52,55,77,94], which normally have characteristic
absorption at about 1600 cm-1 belonging to vibrational absorption of double
bonds. Since the present cladding polymer was characterized to be a PFA (see
Section 8.1.3), such products may be expected here, too. Therefore the observed
broad absorption band near 1620 cm-1 can be expected due to vibrations of double
bonds but might be overlapped with O−H band.
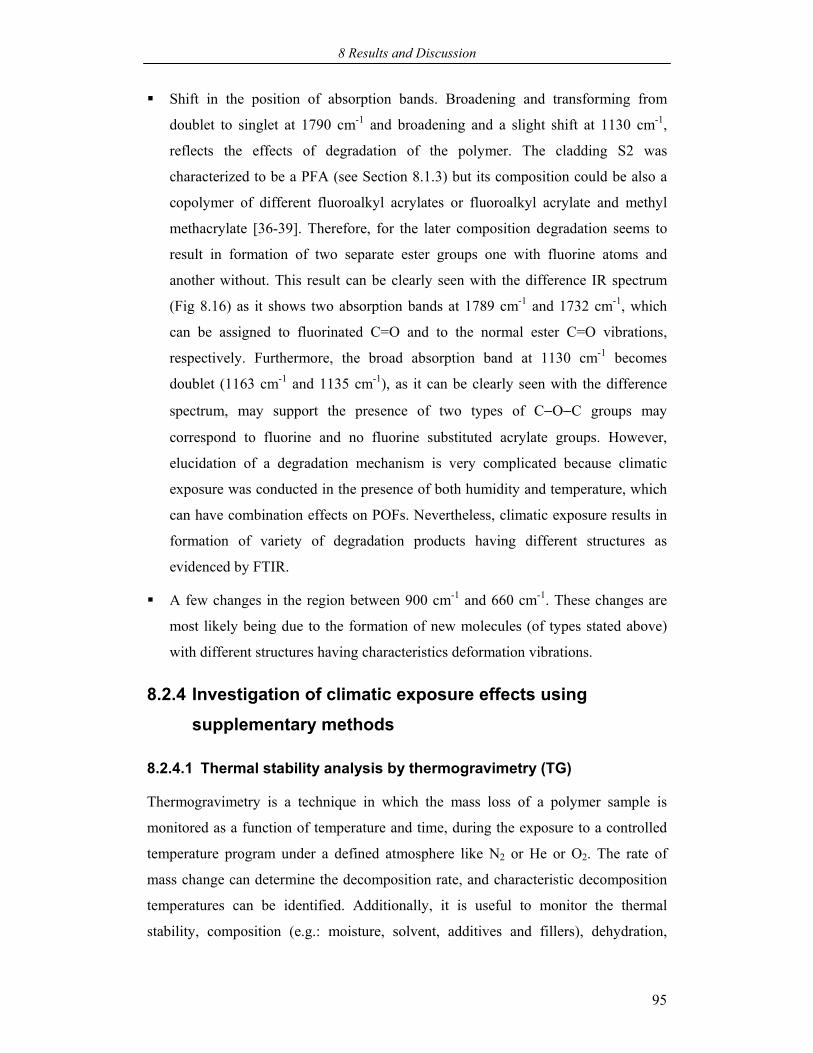
8 Results and Discussion
95
Shift in the position of absorption bands. Broadening and transforming from
doublet to singlet at 1790 cm-1 and broadening and a slight shift at 1130 cm-1,
reflects the effects of degradation of the polymer. The cladding S2 was
characterized to be a PFA (see Section 8.1.3) but its composition could be also a
copolymer of different fluoroalkyl acrylates or fluoroalkyl acrylate and methyl
methacrylate [36-39]. Therefore, for the later composition degradation seems to
result in formation of two separate ester groups one with fluorine atoms and
another without. This result can be clearly seen with the difference IR spectrum
(Fig 8.16) as it shows two absorption bands at 1789 cm-1 and 1732 cm-1, which
can be assigned to fluorinated C=O and to the normal ester C=O vibrations,
respectively. Furthermore, the broad absorption band at 1130 cm-1 becomes
doublet (1163 cm-1 and 1135 cm-1), as it can be clearly seen with the difference
spectrum, may support the presence of two types of C−O−C groups may
correspond to fluorine and no fluorine substituted acrylate groups. However,
elucidation of a degradation mechanism is very complicated because climatic
exposure was conducted in the presence of both humidity and temperature, which
can have combination effects on POFs. Nevertheless, climatic exposure results in
formation of variety of degradation products having different structures as
evidenced by FTIR.
A few changes in the region between 900 cm-1 and 660 cm-1. These changes are
most likely being due to the formation of new molecules (of types stated above)
with different structures having characteristics deformation vibrations.
8.2.4 Investigation of climatic exposure effects using supplementary methods
8.2.4.1 Thermal stability analysis by thermogravimetry (TG)
Thermogravimetry is a technique in which the mass loss of a polymer sample is
monitored as a function of temperature and time, during the exposure to a controlled
temperature program under a defined atmosphere like N2 or He or O2. The rate of
mass change can determine the decomposition rate, and characteristic decomposition
temperatures can be identified. Additionally, it is useful to monitor the thermal
stability, composition (e.g.: moisture, solvent, additives and fillers), dehydration,
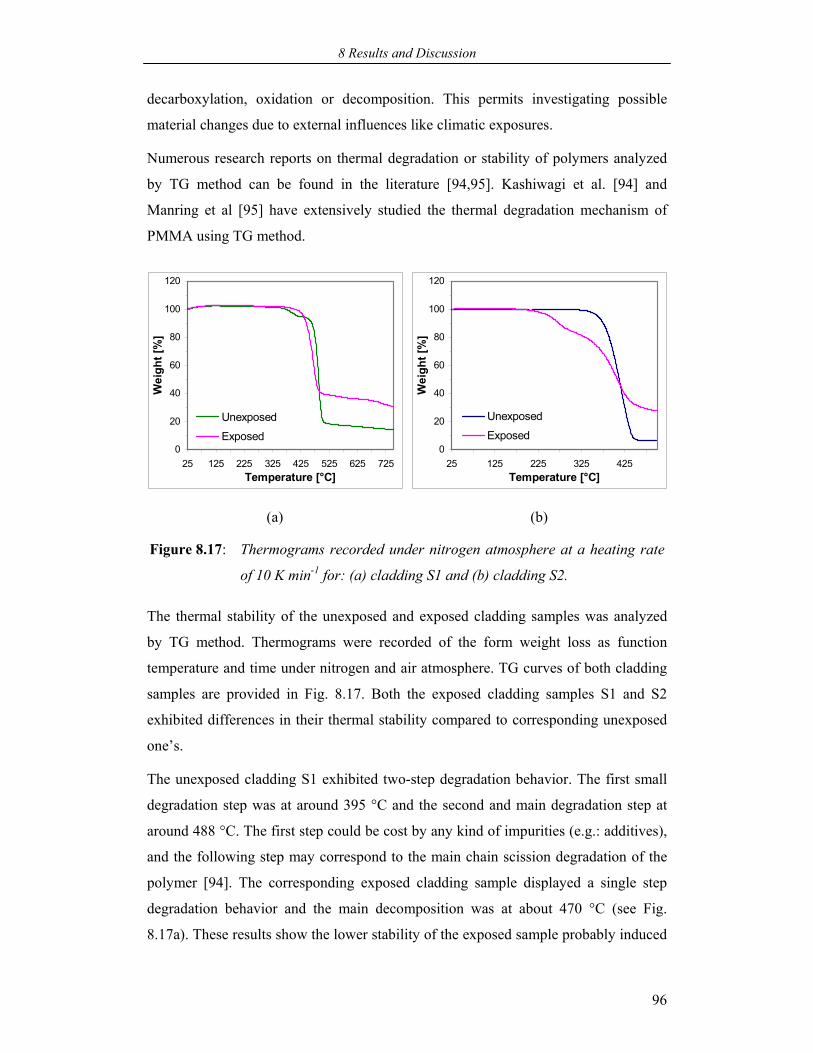
8 Results and Discussion
96
decarboxylation, oxidation or decomposition. This permits investigating possible
material changes due to external influences like climatic exposures.
Numerous research reports on thermal degradation or stability of polymers analyzed
by TG method can be found in the literature [94,95]. Kashiwagi et al. [94] and
Manring et al [95] have extensively studied the thermal degradation mechanism of
PMMA using TG method.
0
20
40
60
80
100
120
25 125 225 325 425 525 625 725Temperature [°C]
Wei
ght [
%]
Unexposed
Exposed0
20
40
60
80
100
120
25 125 225 325 425Temperature [°C]
Wei
ght [
%]
Unexposed
Exposed
(a) (b)
Figure 8.17: Thermograms recorded under nitrogen atmosphere at a heating rate
of 10 K min-1 for: (a) cladding S1 and (b) cladding S2.
The thermal stability of the unexposed and exposed cladding samples was analyzed
by TG method. Thermograms were recorded of the form weight loss as function
temperature and time under nitrogen and air atmosphere. TG curves of both cladding
samples are provided in Fig. 8.17. Both the exposed cladding samples S1 and S2
exhibited differences in their thermal stability compared to corresponding unexposed
one’s.
The unexposed cladding S1 exhibited two-step degradation behavior. The first small
degradation step was at around 395 °C and the second and main degradation step at
around 488 °C. The first step could be cost by any kind of impurities (e.g.: additives),
and the following step may correspond to the main chain scission degradation of the
polymer [94]. The corresponding exposed cladding sample displayed a single step
degradation behavior and the main decomposition was at about 470 °C (see Fig.
8.17a). These results show the lower stability of the exposed sample probably induced
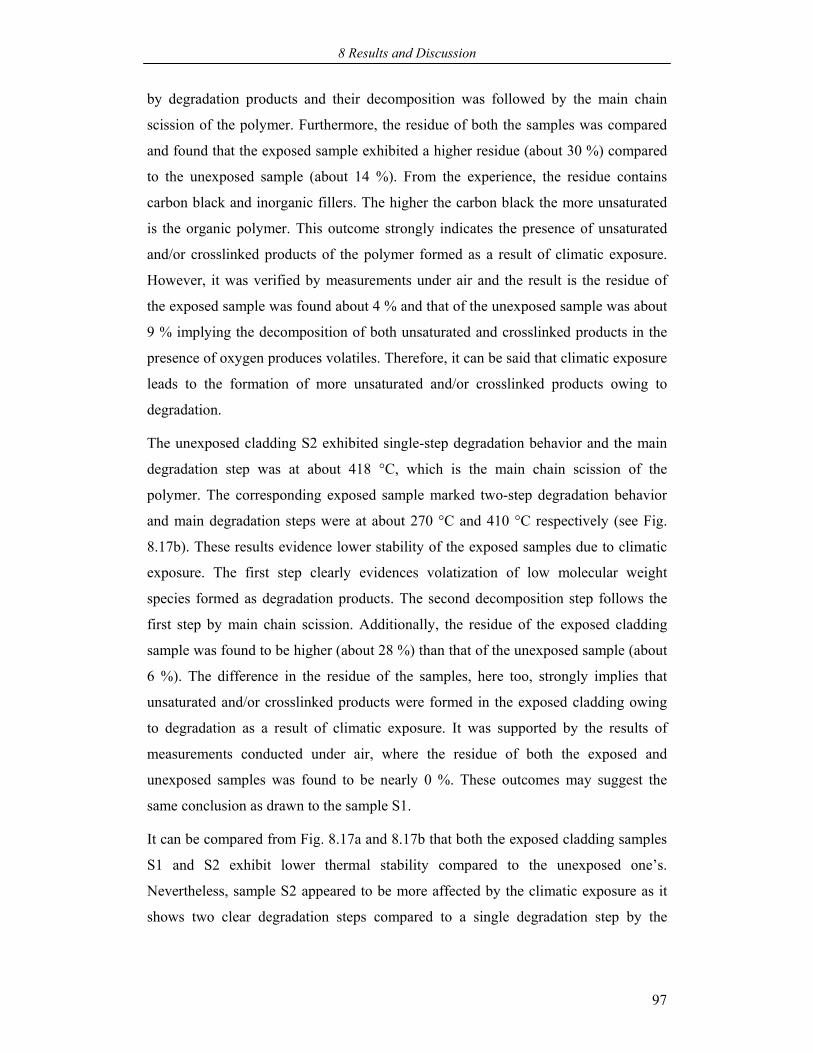
8 Results and Discussion
97
by degradation products and their decomposition was followed by the main chain
scission of the polymer. Furthermore, the residue of both the samples was compared
and found that the exposed sample exhibited a higher residue (about 30 %) compared
to the unexposed sample (about 14 %). From the experience, the residue contains
carbon black and inorganic fillers. The higher the carbon black the more unsaturated
is the organic polymer. This outcome strongly indicates the presence of unsaturated
and/or crosslinked products of the polymer formed as a result of climatic exposure.
However, it was verified by measurements under air and the result is the residue of
the exposed sample was found about 4 % and that of the unexposed sample was about
9 % implying the decomposition of both unsaturated and crosslinked products in the
presence of oxygen produces volatiles. Therefore, it can be said that climatic exposure
leads to the formation of more unsaturated and/or crosslinked products owing to
degradation.
The unexposed cladding S2 exhibited single-step degradation behavior and the main
degradation step was at about 418 °C, which is the main chain scission of the
polymer. The corresponding exposed sample marked two-step degradation behavior
and main degradation steps were at about 270 °C and 410 °C respectively (see Fig.
8.17b). These results evidence lower stability of the exposed samples due to climatic
exposure. The first step clearly evidences volatization of low molecular weight
species formed as degradation products. The second decomposition step follows the
first step by main chain scission. Additionally, the residue of the exposed cladding
sample was found to be higher (about 28 %) than that of the unexposed sample (about
6 %). The difference in the residue of the samples, here too, strongly implies that
unsaturated and/or crosslinked products were formed in the exposed cladding owing
to degradation as a result of climatic exposure. It was supported by the results of
measurements conducted under air, where the residue of both the exposed and
unexposed samples was found to be nearly 0 %. These outcomes may suggest the
same conclusion as drawn to the sample S1.
It can be compared from Fig. 8.17a and 8.17b that both the exposed cladding samples
S1 and S2 exhibit lower thermal stability compared to the unexposed one’s.
Nevertheless, sample S2 appeared to be more affected by the climatic exposure as it
shows two clear degradation steps compared to a single degradation step by the
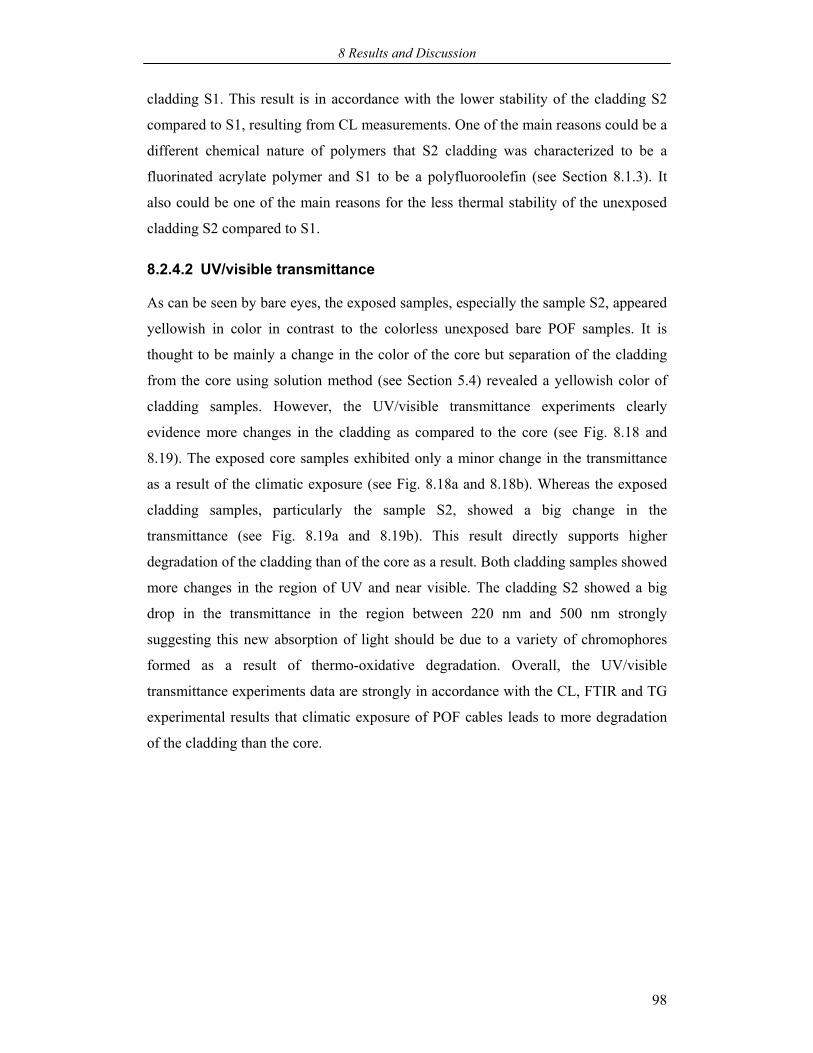
8 Results and Discussion
98
cladding S1. This result is in accordance with the lower stability of the cladding S2
compared to S1, resulting from CL measurements. One of the main reasons could be a
different chemical nature of polymers that S2 cladding was characterized to be a
fluorinated acrylate polymer and S1 to be a polyfluoroolefin (see Section 8.1.3). It
also could be one of the main reasons for the less thermal stability of the unexposed
cladding S2 compared to S1.
8.2.4.2 UV/visible transmittance
As can be seen by bare eyes, the exposed samples, especially the sample S2, appeared
yellowish in color in contrast to the colorless unexposed bare POF samples. It is
thought to be mainly a change in the color of the core but separation of the cladding
from the core using solution method (see Section 5.4) revealed a yellowish color of
cladding samples. However, the UV/visible transmittance experiments clearly
evidence more changes in the cladding as compared to the core (see Fig. 8.18 and
8.19). The exposed core samples exhibited only a minor change in the transmittance
as a result of the climatic exposure (see Fig. 8.18a and 8.18b). Whereas the exposed
cladding samples, particularly the sample S2, showed a big change in the
transmittance (see Fig. 8.19a and 8.19b). This result directly supports higher
degradation of the cladding than of the core as a result. Both cladding samples showed
more changes in the region of UV and near visible. The cladding S2 showed a big
drop in the transmittance in the region between 220 nm and 500 nm strongly
suggesting this new absorption of light should be due to a variety of chromophores
formed as a result of thermo-oxidative degradation. Overall, the UV/visible
transmittance experiments data are strongly in accordance with the CL, FTIR and TG
experimental results that climatic exposure of POF cables leads to more degradation
of the cladding than the core.
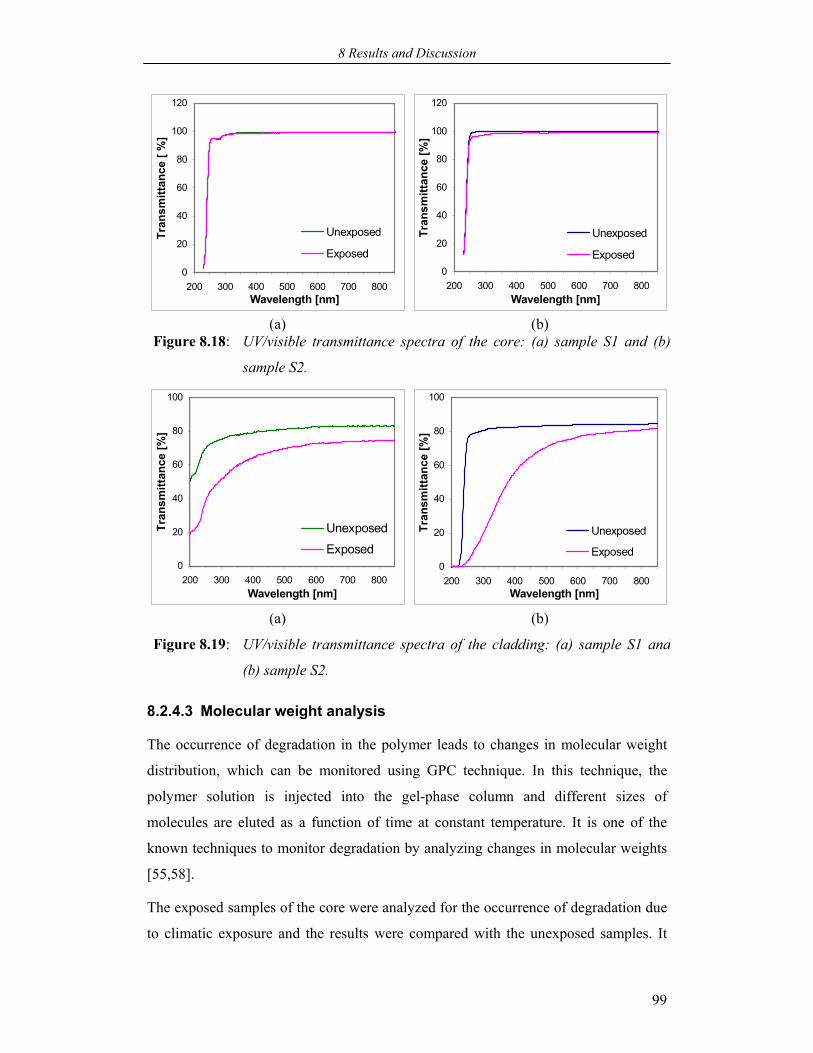
8 Results and Discussion
99
0
20
40
60
80
100
120
200 300 400 500 600 700 800Wavelength [nm]
Tran
smitt
ance
[ %
]
Unexposed
Exposed0
20
40
60
80
100
120
200 300 400 500 600 700 800Wavelength [nm]
Tran
smitt
ance
[%]
Unexposed
Exposed
(a) (b) Figure 8.18: UV/visible transmittance spectra of the core: (a) sample S1 and (b)
sample S2.
0
20
40
60
80
100
200 300 400 500 600 700 800Wavelength [nm]
Tran
smitt
ance
[%]
Unexposed
Exposed0
20
40
60
80
100
200 300 400 500 600 700 800Wavelength [nm]
Tran
smitt
ance
[%]
Unexposed
Exposed
(a) (b)
Figure 8.19: UV/visible transmittance spectra of the cladding: (a) sample S1 and
(b) sample S2.
8.2.4.3 Molecular weight analysis
The occurrence of degradation in the polymer leads to changes in molecular weight
distribution, which can be monitored using GPC technique. In this technique, the
polymer solution is injected into the gel-phase column and different sizes of
molecules are eluted as a function of time at constant temperature. It is one of the
known techniques to monitor degradation by analyzing changes in molecular weights
[55,58].
The exposed samples of the core were analyzed for the occurrence of degradation due
to climatic exposure and the results were compared with the unexposed samples. It
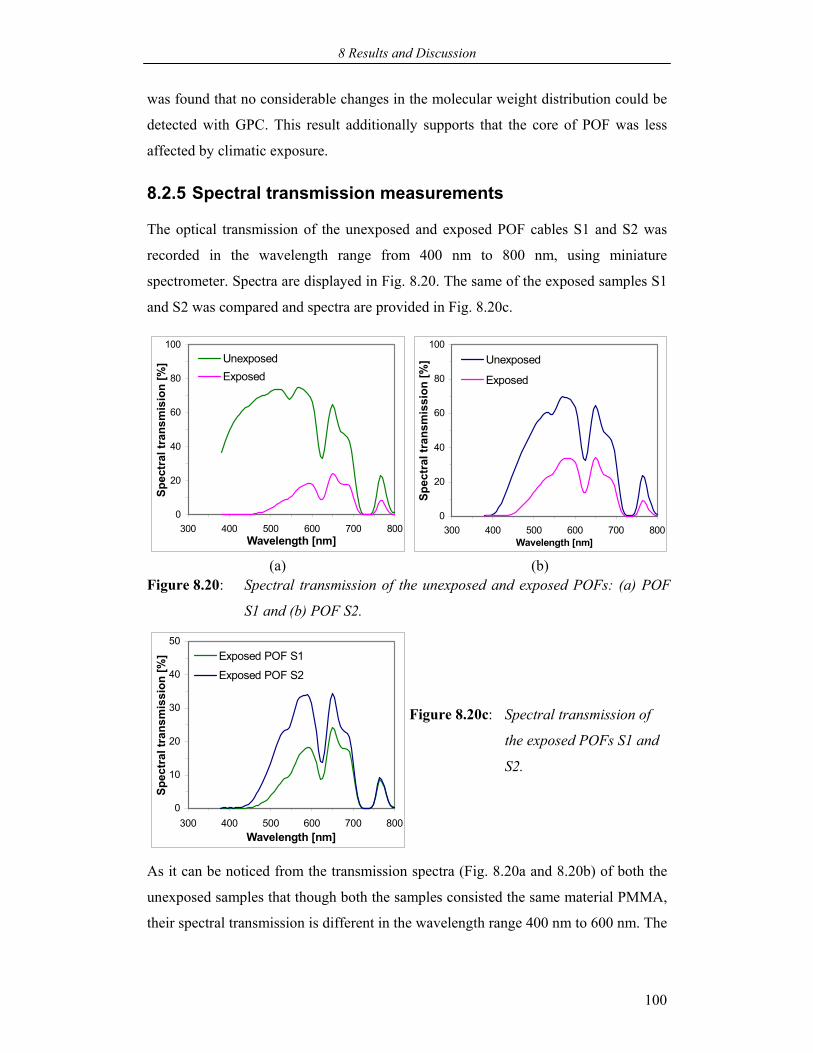
8 Results and Discussion
100
was found that no considerable changes in the molecular weight distribution could be
detected with GPC. This result additionally supports that the core of POF was less
affected by climatic exposure.
8.2.5 Spectral transmission measurements
The optical transmission of the unexposed and exposed POF cables S1 and S2 was
recorded in the wavelength range from 400 nm to 800 nm, using miniature
spectrometer. Spectra are displayed in Fig. 8.20. The same of the exposed samples S1
and S2 was compared and spectra are provided in Fig. 8.20c.
0
20
40
60
80
100
300 400 500 600 700 800Wavelength [nm]
Spec
tral
tran
smis
ion
[%] Unexposed
Exposed
(a)
0
20
40
60
80
100
300 400 500 600 700 800Wavelength [nm]
Spec
tral
tran
smis
sion
[%] Unexposed
Exposed
(b) Figure 8.20: Spectral transmission of the unexposed and exposed POFs: (a) POF
S1 and (b) POF S2.
0
10
20
30
40
50
300 400 500 600 700 800Wavelength [nm]
Spec
tral
tran
smis
sion
[%] Exposed POF S1
Exposed POF S2
Figure 8.20c:
Spectral transmission of
the exposed POFs S1 and
S2.
As it can be noticed from the transmission spectra (Fig. 8.20a and 8.20b) of both the
unexposed samples that though both the samples consisted the same material PMMA,
their spectral transmission is different in the wavelength range 400 nm to 600 nm. The
8 Results and Discussion
101
transmission of the POF S1 was found to be higher than that of the POF S2. These
results suggest that could be different claddings of these POF samples are responsible
for the observed difference in the transmission. In fact UV/visible transmittance
measurements to the unexposed claddings samples (see Section 8.2.4.2) show a
difference in transmittance characteristics as similar to the findings here. Therefore,
different claddings could be one reason for the observed difference in the transmission
characteristics of POFs S1 and S2. However, other factors such as formulation of
polymers could lead to differences in the transmission characteristics of POFs.
A significant decrease in the transmission was found in both the exposed POF
samples indicating climatic exposure effects. However, both showed a large decrease
at the lower wavelength region, which could be an indication of a large absorption of
light by choromophores that could form due to degradation as a result of climatic
exposure. This large absorption could induce the absorption loss at higher wavelength
regions according to Urbach’s rule (see Section 4.2.2). A comparison of the
transmission of the exposed POF samples (see Fig. 8.20c) shows more transmission
loss in POF S1 than in POF S2 as found in the online transmission measurements.
Both the POFs displayed a transmission loss probably due to absorption of light could
be in both the core and cladding. However, the chemical investigations strongly reveal
that the cladding of POFs was affected more than the core by climatic exposure.
Therefore, it is possible that the observed transmission loss in both the POFs could be
due to more absorption of light in the cladding and less in the core. Nevertheless, the
transmission loss can arise from different mechanisms owing to physical and chemical
changes of both the core and cladding.
8.2.6 Optical transmission loss - possible explanation
CL, FTIR, TG, UV/visible transmittance and GPC investigations show degradation
mainly of the cladding and minor of the core as a result of climatic exposure. In view
of the investigated results, it is proposed that the observed loss of optical transmission
in POFs could be derived mainly from an increase in light absorption by degradation
products of both the cladding and core and scattering of light owing to core-cladding
boundary imperfections.
8 Results and Discussion
102
Takezewa et al. [42] have reported that aging of (crosslinked) PMMA based POFs at
150 oC results in thermo-oxidative degradation of the core and due to which a
significant loss of transmission is observed. They have proposed that the loss of
transmission in POFs is mainly due to an increase in light absorption by conjugated
carbonyl compounds formed as degradation products.
It strongly agrees with our hypothesis that the loss of transmission most probably due
to increase in light absorption by the core and cladding as well. However, according
to the chemical analysis result, the core is less degraded than the cladding and
therefore higher light absorption losses by the cladding are possible.
When light is guided through the fiber by total internal reflection at the border
between the core and cladding a fraction of light goes into the cladding (so called the
evanescent light, see Section 7.6.1), is transported a small distance (in the order of
some wavelength units) in the cladding parallel to the fiber axis, and then goes into
the core. If the border is disturbed, e.g.: by degradation, not only the evanescent light
reaches the cladding but refracted light, too. So both can be absorbed in the cladding.
As a result, the basic fiber optic phenomenon, the total internal reflection within the
fiber, might be substantially reduced, causing a significant optical loss.
It is also possible that a large degradation of the cladding due to climatic exposure
could lead a change of the refractive index (n), which result in a variation of NA of
the fiber (see also Section 8.3.1.1). This change of NA relates the optical transmission
property of the POF. Therefore, it is likely that a loss of transmission could arise also
from a variation of n.
Further on, degradation of the cladding also could lead to change in its adhesion
strength, the extent of which may depend on its material. It is known in the POF
technology that one of the main requirements for the cladding is good adhesion, as
this significantly determines the functional property of the POF [5,36-40]. Therefore,
an improper adhesion can lead to core-cladding boundary imperfections, too, causing
scattering of light and resulting in an increase of the optical transmission loss.
Accordingly, climatic exposure could be assumed to decrease the adhesion strength of
the cladding of both the POF samples. Although the cladding sample S2 found to be
more degraded than the cladding sample S1, their corresponding POFs exhibited
contrary in optical transmission loss (POF S1 exhibited more transmission loss than
8 Results and Discussion
103
the POF S2, see Fig. 8.6). Therefore, it could be assumed that the adhesion strength of
the cladding of sample S1 should be decreased to a larger extent than that of sample
S2 because the core material of both was PMMA. It becomes obvious that mainly the
material chemical nature determines the adhesion property of the cladding. However,
the respective quantitative contributions of each source to the total transmission loss
remain to be studied in a future research.
8.3 Climatic exposures of bare POFs
The optical transmission stability of three bare POF (core with clad only) samples S3,
S4 and S5 is investigated. They are exposed to the climates 92 °C / 95 %RH, 92 °C /
50 %RH, 50 °C / 95 %RH, 120 °C / low humidity, 110 °C / low humidity, 100 °C /
low humidity and 90 °C / low humidity. Here the “low humidity” should be
understood as a value of << 50 %RH (dry heat condition). The possible causes for the
loss of optical transmission due to climatic exposures are discussed.
The chemiluminescence (CL) technique is mainly applied to investigate the thermo-
oxidative degradation/stability of the unexposed and exposed samples.
8.3.1 Online optical transmission measurements
8.3.1.1 Exposure to temperature-humid climates
The optical transmission loss behavior of bare POF samples S3, S4 and S5 exposed to
the climates 92 °C / 95 %RH, 92 °C / 50 %RH and 50 °C / 95 %RH, was monitored
by the multiplexer as a function of exposure time. The results presented in Fig. 8.21,
8.23 and 8.24, respectively, are the average values obtained at three wavelengths (550
nm, 590 nm and 650 nm).
The experiments clearly evidence a difference in the optical transmission stability
between the three POFs although they consisted the same core material PMMA. The
results also evidence strong influences of imposed humidity on the transmission
stability of POFs.
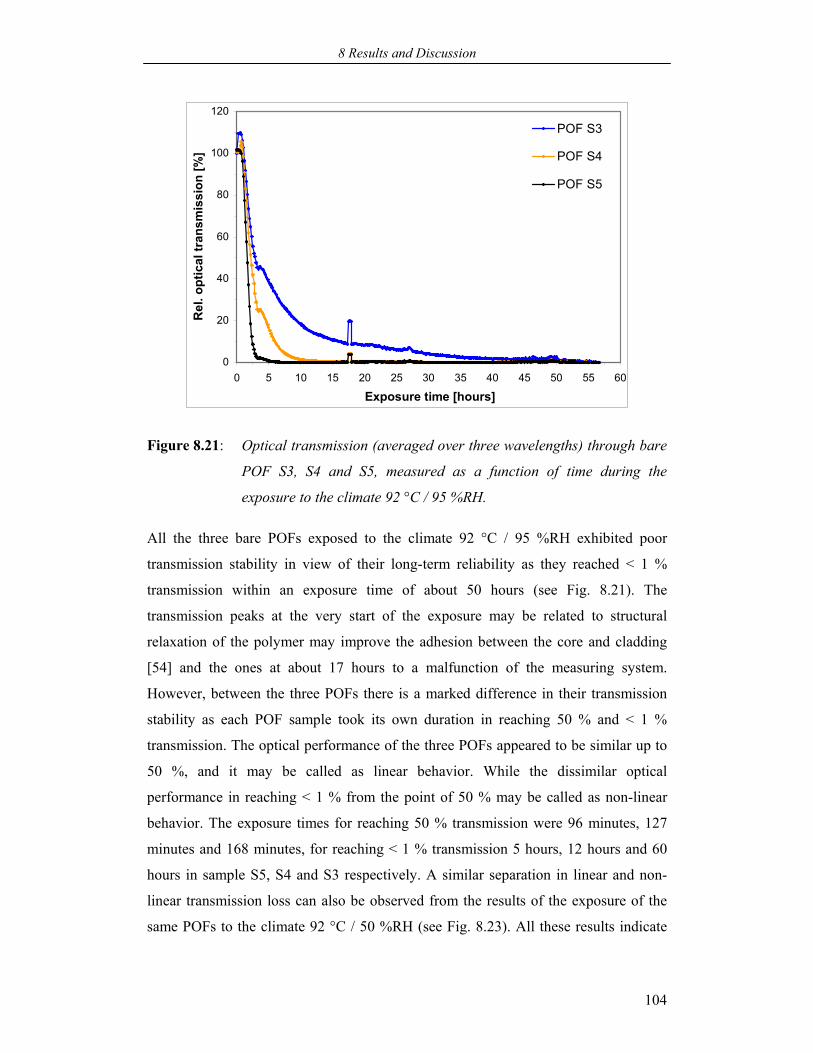
8 Results and Discussion
104
0
20
40
60
80
100
120
0 5 10 15 20 25 30 35 40 45 50 55 60
Exposure time [hours]
Rel
. opt
ical
tran
smis
sion
[%]
POF S3
POF S4
POF S5
Figure 8.21: Optical transmission (averaged over three wavelengths) through bare
POF S3, S4 and S5, measured as a function of time during the
exposure to the climate 92 °C / 95 %RH.
All the three bare POFs exposed to the climate 92 °C / 95 %RH exhibited poor
transmission stability in view of their long-term reliability as they reached < 1 %
transmission within an exposure time of about 50 hours (see Fig. 8.21). The
transmission peaks at the very start of the exposure may be related to structural
relaxation of the polymer may improve the adhesion between the core and cladding
[54] and the ones at about 17 hours to a malfunction of the measuring system.
However, between the three POFs there is a marked difference in their transmission
stability as each POF sample took its own duration in reaching 50 % and < 1 %
transmission. The optical performance of the three POFs appeared to be similar up to
50 %, and it may be called as linear behavior. While the dissimilar optical
performance in reaching < 1 % from the point of 50 % may be called as non-linear
behavior. The exposure times for reaching 50 % transmission were 96 minutes, 127
minutes and 168 minutes, for reaching < 1 % transmission 5 hours, 12 hours and 60
hours in sample S5, S4 and S3 respectively. A similar separation in linear and non-
linear transmission loss can also be observed from the results of the exposure of the
same POFs to the climate 92 °C / 50 %RH (see Fig. 8.23). All these results indicate
8 Results and Discussion
105
that both imposed temperature-humid condition and POF material properties could
influence the transmission stability of POFs.
In both the cases, the linear behavior and non-linear behavior, it seems that mainly the
absorption of water (humidity) by POFs plays an important role in causing the
transmission loss. As mentioned above the transmission of POFs reached nearly
< 1 % in about 50 hours. But the same POFs exposed to 100 °C / low humidity and
90 °C / low humidity for more than 3000 hours exhibited a transmission loss of about
65 % and 20 %, respectively (see Fig. 8.26 and 8.27). Moreover, the exposure of
POFs to 92 °C / 50 %RH led to a transmission loss of about 50 % at the end of about
3000 hours (see Fig. 8.23). These results could be the strong evidence for large
influences of high humidity and nearly total transmission loss at 92 °C / 95 %RH
should be due to mainly the water absorption by POFs. It appears to be very much
influenced by the imposed high temperature because the same POFs exposed to the
climate 50 °C / 95 %RH displayed a transmission loss of < 10 % at the end of 1500
hours (see Fig. 8.24).
Fig. 8.21 shows that an increase of water absorption in POFs decreases the optical
transmission down to < 1 %. It can be thought that the core of POFs is mainly
responsible for water absorption because it is thicker (~ 980 µm in diameter) than the
cladding (~ 20 µm in thickness). The core material of the three POFs was the same i.e.
PMMA, and water absorption or transportation in it occurs in a dual behavior as
already discussed [61] (see Section 5.3.1). The presence of impurities such as micro
voids and cracks in the core fiber depends on the fiber drawing history of POFs. To
reduce the optical loss, POF producers may use precise drawing methods and drawing
parameters to avoid the incorporation of impurities that could cause a large loss by
scattering. Therefore, in general, the presence of impurities such as micro voids,
cracks and dusts in the fiber will be neglectable small in number or even absent at the
state of the delivery, which was confirmed for the present POFs S3, S4 and S5 (the
length of tested fibers was about 13 m) by back scattering measurements with an
optical time domain reflectometer (OTDR) [3]. It can be concluded that the water
transportation into micro voids should be insignificant to induce the transmission to
< 1 % in few hours at 92 °C / 95 %RH.
8 Results and Discussion
106
Nevertheless, water transportation into the polymer matrix inducing the swelling of
the polymer has a significant effect on the transmission stability of POFs. The
swelling causes volume expansion of the polymer material, for instance, which may
be reversible in nature and is related to phenomena of wetting (sorption) and drying
(desorption). In the present case, too, a process of swelling in the sense that a
systematic increase of the diameter was observed (at the stages of 50 % and nearly
100 % loss of transmission) in all the three POF samples. Table 8-3 provides the
measured diameter of the POF samples. Yet, it appears to be irreversible because
almost no decrease in the diameter was found after heating the samples under a dry
condition and moreover they became brittle after bringing down to the room
temperature-humid condition. Additionally, the increase in the diameter resulted in a
significant contraction of the length of fibers. In view of this fact, the phenomenon of
swelling may not be suitable to explain the observed irreversible increase of the
diameter of POFs.
Table 8-3: Diameter of the unexposed and exposed (92 °C / 95 %RH) POF samples,
measured by using a simple electronic screw gauge (Mitutoya).
Diameter [µm] (± 5)
Bare POF
Before the exposure
At 50 % loss of transmission
At nearly 100 % loss of transmission
S3 1000 1030 1110 S4 1000 1041 1145 S5 1000 1090 1200
Nevertheless, it could be explained on the basis of water in polymers acting as a
plasticizer accompanied by an increase in the thermal-coefficient of expansion and a
reduction of the glass transition temperature (Tg) [60,62]. Amorphous polymers
including PMMA exhibit a known order of anisotropic thermal expansion. The
anisotropic nature of expansion mainly depends on the polymer processing history
(e.g.: extrusion, injection molding, compression and blow molding). In other words,
polymers exhibit the anisotropic expansion when the orientation of polymer chains
takes place [82]. Furthermore, the expansion co-efficient is believed to be lower in the
direction of the orientation than in the direction perpendicular. These effects are
related to the free volume theories of glassy polymers [60,62]. Such anisotropic
behavior of polymers can also be expected in the fiber core material PMMA of the
8 Results and Discussion
107
present investigated POFs because the core of them exhibited a Tg of about 118 °C,
which suggests the occurrence of the orientation of polymer chains. In the case of
isotropic behavior a Tg of about 105 °C would be expected. Dugas et al. have studied
the structural anomalies in PMMA core fibers and found an anisotropic nature of the
core due to the orientation of polymer chains [48,49]. Therefore, in the present POF
samples more expansion in the transversal direction than in the longitudinal direction
can be predicted. The anisotropic behavior of expansion of polymers can be well seen
when they are heated to their Tg and then cooled down. In the contemporary case of
climatic exposure, the set temperature was only 92 °C, which is far below the
observed Tg (of both core and POF samples). To cause the expansion in the duration
of 50 hours (at which all POFs had lost nearly all the transmission) is far earlier than
predicted by Dugas et al. [48,49]. Therefore the observed significant increase of the
diameter and a contraction of the length of fiber samples should be due to plasticizing
effects of water in the core of POFs. That means water in POFs reduced their Tg by
increasing the chain mobility. As a result the expansion occurred in a faster rate than
it would take when exposing to only 92 °C. Furthermore, the plasticizer effect seemed
to be irreversible because the observed expansion (diameter and contraction of length)
and brittle nature of the cooled samples is an indication of the occurrence of
molecular disorder. The irreversible plasticizing effect of water in polymers may be
referred as structural relaxation.
As already discussed, the poor stability of the three POFs is different for all of them.
The sample S5 had reached < 1 % transmission much earlier (5 hours) than the other
ones (12 and 60 hours). A possible explanation could be a difference in the cladding
material. As found by FTIR, the cladding of sample S5 has to be a poly(fluoroalkyl
methacrylate) (PFMA) and that of S3 and S4 be a polyfluoroolefin or a copolymer of
olefin and fluoroolefin (see Section 8.1.3). It is well known that acrylate polymers are
hydrophilic and fluoroolefin polymers are hydrophobic in nature. Therefore, it
appears that the acrylate cladding of the sample S5 supported the process of water
absorption by the core. Whereas the polyfluoroolefin type cladding of S3 and S4 acted
as a barrier. Consequently a difference in the rate of water absorption and thereby a
difference in the transmission loss rate between POFs can be expected. Therefore, it
can be stated that the more polar is the cladding, the faster is the migration of water
into the core. However, the observed difference in the transmission stability between
8 Results and Discussion
108
S3 and S4 may be due to a small difference either in chemical compositions of
claddings or physical structural anomalies in the core.
In general, significances of water absorption or water transportation in polymers are
changes in their both physical and chemical properties [60,62] (see Section 5.3).
Therefore, causes for an early drop off of the transmission in POFs could be changes
in both their physical and chemical properties. Most probable physical changes, for
instance, that could occur in POFs are volume expansion and refractive index change.
They induce inhomogeneities and/or imperfections, which are strongly responsible for
the optical loss by any type of scattering in POFs. Chemical changes, for instance, that
could occur in POFs are interaction of water with the functional groups and molecular
degradation. They are most probably responsible for the loss due to absorption of light
(see Chapter 4).
In the present exposure case, physical changes appeared to be the main sources for the
total loss of transmission of POFs because chemical changes that could be detected by
using chemiluminescence (CL), FTIR and GPC were insignificant to cause to the total
loss of transmission in a duration of < 50 hours. It is most likely that physical changes
are the main sources, e.g.: the observed increase in the diameter and contraction of the
fiber length resulting in total in a volume expansion. A change of the fiber diameter,
mainly related to change in the core diameter, is one of the important parameters that
influence the optical transmission [3,5,]. Therefore, the observed increase of the
diameter may be of one the main sources for the total loss of transmission in POFs.
The volume expansion (see above) of oriented glassy polymers generally means a
return of the molecular disorder from the ordered structure. Certainly such process can
be expected in the core fiber of the present samples, too, which induces structural
anomalies or inhomogenities within the core fiber resulting in a decrease of the
transmission due to scattering of light.
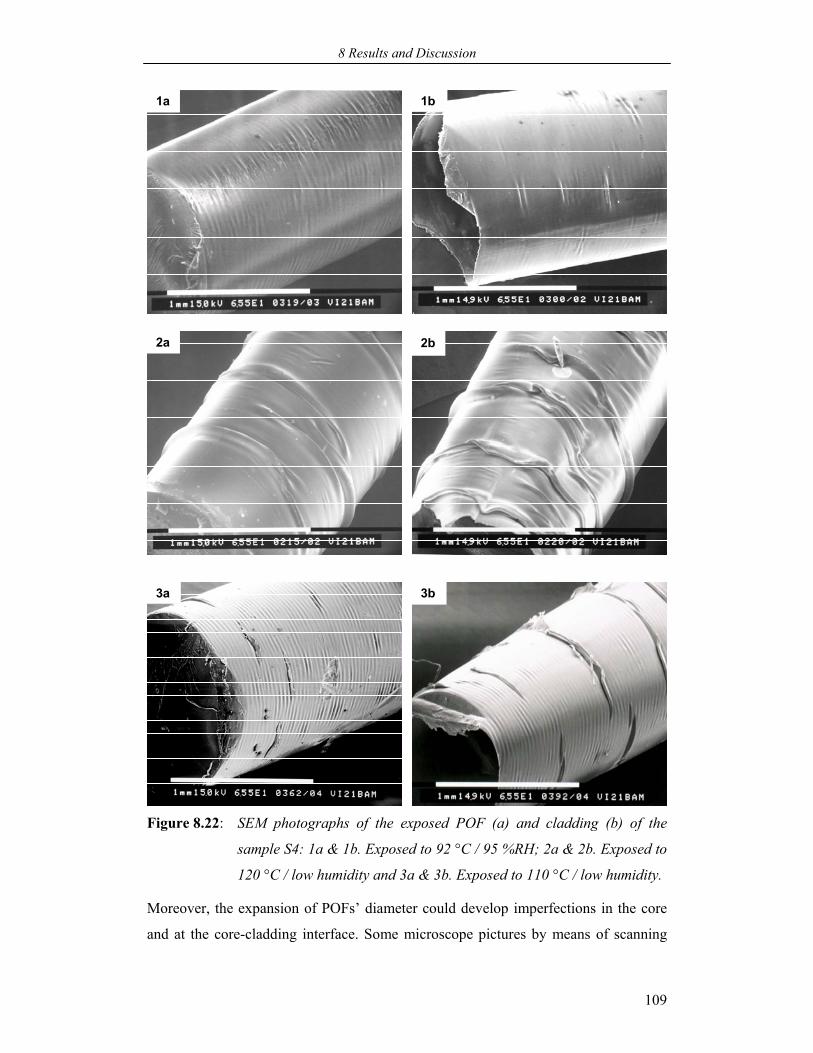
8 Results and Discussion
109
1a
1b
2a 2b
3a 3b
Figure 8.22: SEM photographs of the exposed POF (a) and cladding (b) of the
sample S4: 1a & 1b. Exposed to 92 °C / 95 %RH; 2a & 2b. Exposed to
120 °C / low humidity and 3a & 3b. Exposed to 110 °C / low humidity.
Moreover, the expansion of POFs’ diameter could develop imperfections in the core
and at the core-cladding interface. Some microscope pictures by means of scanning
8 Results and Discussion
110
electron microscope (SEM) were taken to observe the surface morphology of the post-
exposed samples. Fig. 8.22 shows SEM photographs of both the POF and cladding of
the sample S4 as an example. A kind of shrinkage/folding on the surface of POF
samples (except in the sample S5) was found (see Fig. 8.22, 1a). An identical
shrinkage/folding was found in claddings, too (see Fig. 8.22, 1b). Therefore, it can be
realized that shrinkage/folding is related to the cladding not the core. A cause for the
shrinkage/folding could be the applied high temperature-humid condition (92 °C / 95
%RH) creating a state, which is near to the melting temperature of claddings. This
seems to be possible because for the same POF samples exposed to 120 °C and
110 °C with very low humid condition, the SEM shows a more pronounced
shrinkage/folding than for the samples exposed to 92 °C / 95 %RH (see Fig. 8.22).
Consequently, such shrinkage/folding structures could create structural imperfections
mainly at the core-cladding interface during the early stages of the exposure. As a
result a large increase of the optical loss due to scattering can be expected. Therefore,
the formation shrinkage/folding structures should be one of the main causes, too, for
the total loss of transmission in POFs.
Previous investigations have showed that PMMA and some fluoropolymers exhibit a
negative thermo optic coefficient (TOC) [96], which describes a change of the
refractive index n with temperature T. Prod’homme derived an equation that relates
dn/dT to volume expansion (or density) and electronic polarisibility of the materials,
as shown in equation (8-1) [97],
))(( βϕ −= nfdTdn (8-1)
where β is the volume expansion co-efficient, f (n), is defined as
nnnnf
6)2)(1()(
22 +−= , (8-2)
and ϕ is the temperature co-efficient of electronic polarisibility P, defined as
dTdP
P1=ϕ . (8-3)
According to this theory, TOC depends on the terms ϕ and β. Most of the optical
polymers exhibit negative TOC (e.g.: PMMA shows a negative TOC in the order of
8 Results and Discussion
111
10–4), which suggests that the term β dominates over the term ϕ, because f(n) is
always positive. In view of the Prode’homme theory it can be assumed that POFs
exhibit a negative change in the refractive index. At the exposure condition
92 °C / 95 %RH, the temperature itself could influence the volume expansion, which
will be well enhanced by the water absorption process. Therefore a considerable
change in the refractive index can be expected to take place in POFs. Consequently
the variation in n within the fiber generating inhomogenities mainly in the core cause
more microscopic scattering loss (e.g.: Rayleigh scattering), as it is known.
Additionally, a change of n results in a variation of NA, which governs the
transmission property of POFs. Therefore, a significant contribution to the total
optical loss from refractive index changes is possible.
Additionally, it is observed that all the three POF samples exhibited very similar
transmission losses at all the three wavelengths, which suggests that scattering
happened at inhomogenities, with extensions much larger (geometrical optics) or
much smaller (Rayleigh scattering) than the wavelength. In the first case it could be a
supplementary evidence for the transmission loss mainly due to physical changes in
POFs. Therefore, physical changes appear to play an important role to cause the total
loss of transmission in POFs when exposed to the climate 92 °C / 95 %RH. Finally,
under this exposure climate, the optical transmission stability of the three POFs can be
characterized in the following order: POF S3 > POF S4 > POF S5.
As can be noticed from the optical measurements at the climatic exposure
92 °C / 50 %RH all the three POFs exhibited quite a good optical stability compared
to that of the same exposed to 92 °C / 95 %RH (see Fig. 8.21 and 8.23). The peaks on
the curves in Fig. 8.23 are the noise probably creating by a small variation in humidity
of the system. The results of this exposure can be a clear indication of the large effect
of high humidity on the optical stability of POFs. However, the optical performance
exhibited by each of them was different as can be seen from the experimental data
shown in Fig. 8.23. The POF sample S5 exhibited higher performance compared to S3
and S4. The sample S5 displayed only about 25 % loss (75 % transmission) whereas
the sample S3 and S4 displayed about 60 % loss (40 % transmission) and 52 % loss
(48 % transmission), respectively, at the end of about 3380 hours. However all the
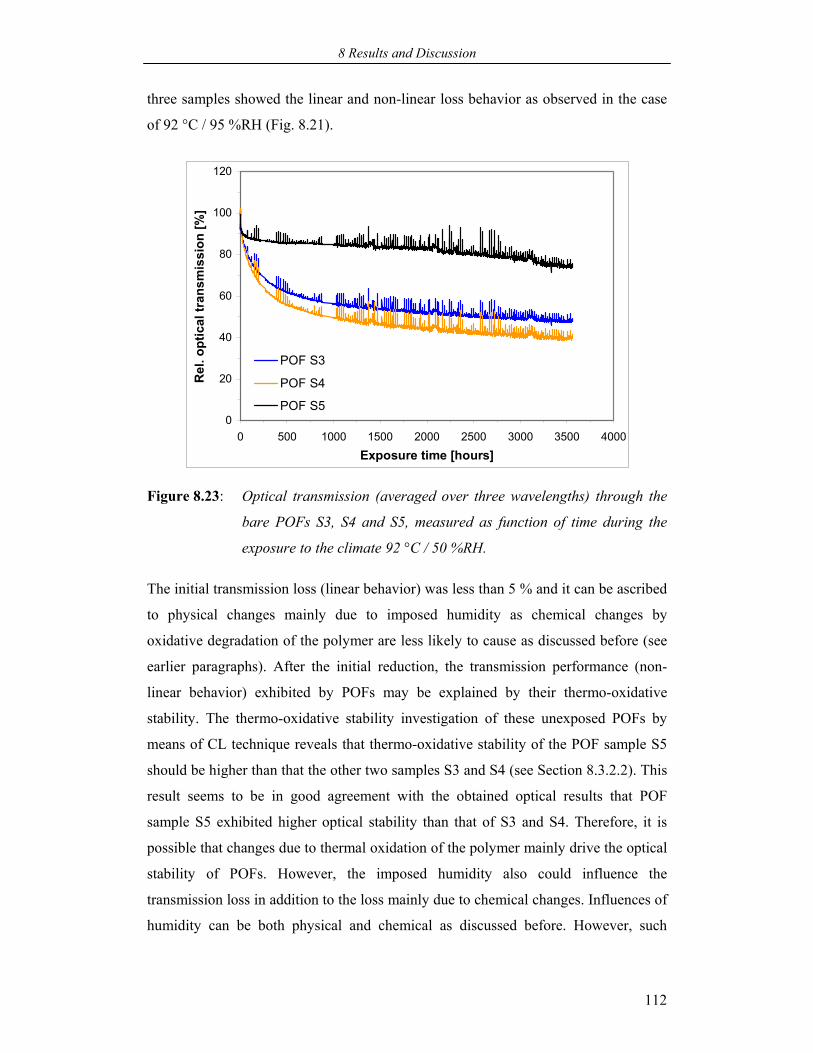
8 Results and Discussion
112
three samples showed the linear and non-linear loss behavior as observed in the case
of 92 °C / 95 %RH (Fig. 8.21).
0
20
40
60
80
100
120
0 500 1000 1500 2000 2500 3000 3500 4000
Exposure time [hours]
Rel
. opt
ical
tran
smis
sion
[%]
POF S3
POF S4
POF S5
Figure 8.23: Optical transmission (averaged over three wavelengths) through the
bare POFs S3, S4 and S5, measured as function of time during the
exposure to the climate 92 °C / 50 %RH.
The initial transmission loss (linear behavior) was less than 5 % and it can be ascribed
to physical changes mainly due to imposed humidity as chemical changes by
oxidative degradation of the polymer are less likely to cause as discussed before (see
earlier paragraphs). After the initial reduction, the transmission performance (non-
linear behavior) exhibited by POFs may be explained by their thermo-oxidative
stability. The thermo-oxidative stability investigation of these unexposed POFs by
means of CL technique reveals that thermo-oxidative stability of the POF sample S5
should be higher than that the other two samples S3 and S4 (see Section 8.3.2.2). This
result seems to be in good agreement with the obtained optical results that POF
sample S5 exhibited higher optical stability than that of S3 and S4. Therefore, it is
possible that changes due to thermal oxidation of the polymer mainly drive the optical
stability of POFs. However, the imposed humidity also could influence the
transmission loss in addition to the loss mainly due to chemical changes. Influences of
humidity can be both physical and chemical as discussed before. However, such
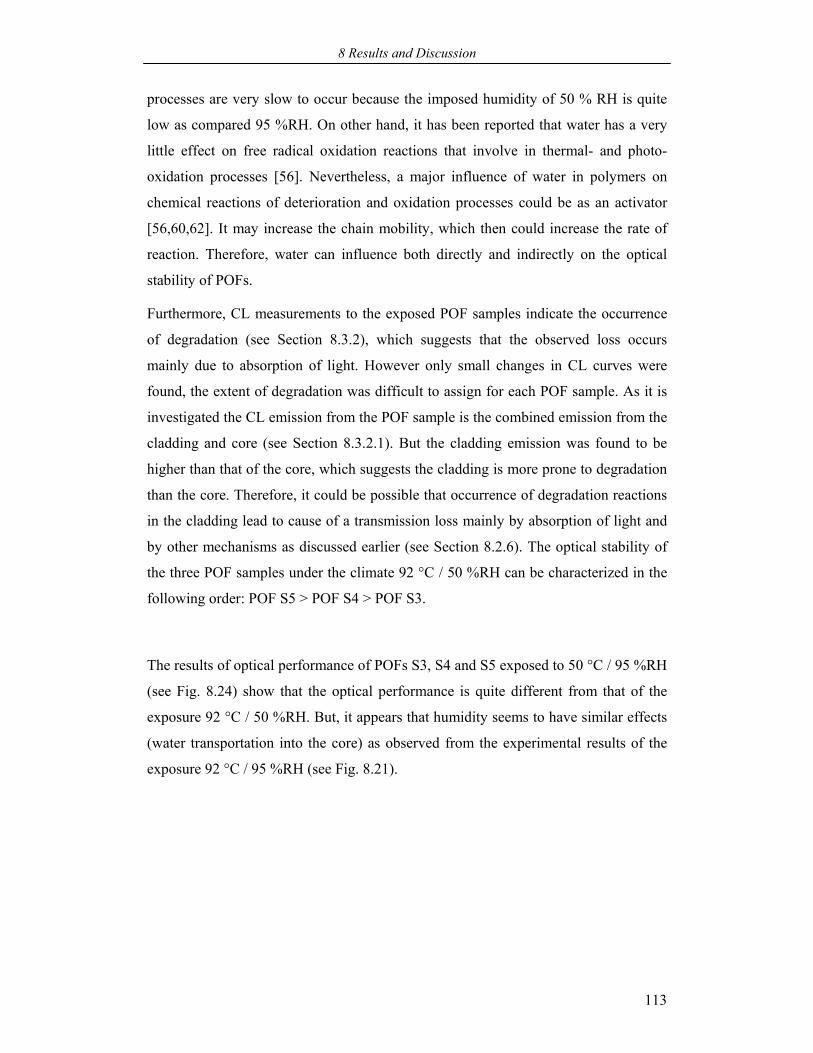
8 Results and Discussion
113
processes are very slow to occur because the imposed humidity of 50 % RH is quite
low as compared 95 %RH. On other hand, it has been reported that water has a very
little effect on free radical oxidation reactions that involve in thermal- and photo-
oxidation processes [56]. Nevertheless, a major influence of water in polymers on
chemical reactions of deterioration and oxidation processes could be as an activator
[56,60,62]. It may increase the chain mobility, which then could increase the rate of
reaction. Therefore, water can influence both directly and indirectly on the optical
stability of POFs.
Furthermore, CL measurements to the exposed POF samples indicate the occurrence
of degradation (see Section 8.3.2), which suggests that the observed loss occurs
mainly due to absorption of light. However only small changes in CL curves were
found, the extent of degradation was difficult to assign for each POF sample. As it is
investigated the CL emission from the POF sample is the combined emission from the
cladding and core (see Section 8.3.2.1). But the cladding emission was found to be
higher than that of the core, which suggests the cladding is more prone to degradation
than the core. Therefore, it could be possible that occurrence of degradation reactions
in the cladding lead to cause of a transmission loss mainly by absorption of light and
by other mechanisms as discussed earlier (see Section 8.2.6). The optical stability of
the three POF samples under the climate 92 °C / 50 %RH can be characterized in the
following order: POF S5 > POF S4 > POF S3.
The results of optical performance of POFs S3, S4 and S5 exposed to 50 °C / 95 %RH
(see Fig. 8.24) show that the optical performance is quite different from that of the
exposure 92 °C / 50 %RH. But, it appears that humidity seems to have similar effects
(water transportation into the core) as observed from the experimental results of the
exposure 92 °C / 95 %RH (see Fig. 8.21).
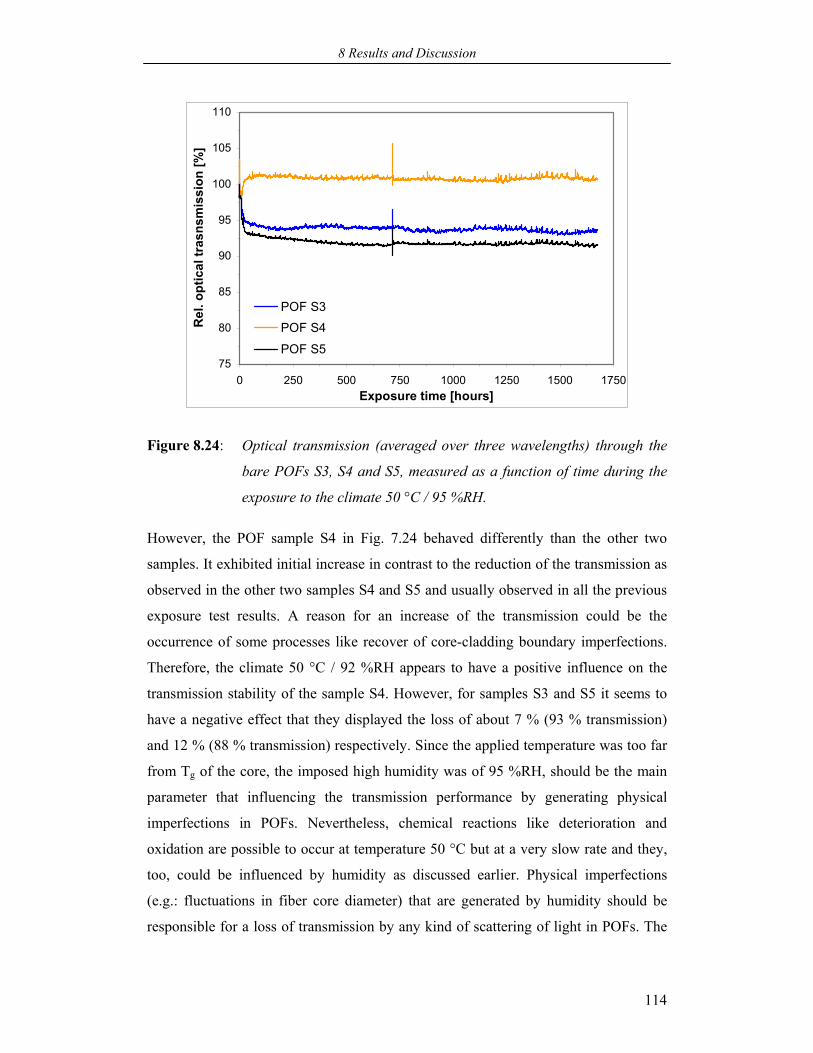
8 Results and Discussion
114
75
80
85
90
95
100
105
110
0 250 500 750 1000 1250 1500 1750Exposure time [hours]
Rel
. opt
ical
tras
nsm
issi
on [%
]
POF S3POF S4
POF S5
Figure 8.24: Optical transmission (averaged over three wavelengths) through the
bare POFs S3, S4 and S5, measured as a function of time during the
exposure to the climate 50 °C / 95 %RH.
However, the POF sample S4 in Fig. 7.24 behaved differently than the other two
samples. It exhibited initial increase in contrast to the reduction of the transmission as
observed in the other two samples S4 and S5 and usually observed in all the previous
exposure test results. A reason for an increase of the transmission could be the
occurrence of some processes like recover of core-cladding boundary imperfections.
Therefore, the climate 50 °C / 92 %RH appears to have a positive influence on the
transmission stability of the sample S4. However, for samples S3 and S5 it seems to
have a negative effect that they displayed the loss of about 7 % (93 % transmission)
and 12 % (88 % transmission) respectively. Since the applied temperature was too far
from Tg of the core, the imposed high humidity was of 95 %RH, should be the main
parameter that influencing the transmission performance by generating physical
imperfections in POFs. Nevertheless, chemical reactions like deterioration and
oxidation are possible to occur at temperature 50 °C but at a very slow rate and they,
too, could be influenced by humidity as discussed earlier. Physical imperfections
(e.g.: fluctuations in fiber core diameter) that are generated by humidity should be
responsible for a loss of transmission by any kind of scattering of light in POFs. The
8 Results and Discussion
115
optical stability of the three POF samples under the climate 50 °C / 92 %RH can be
distinguished in the following order: POF S4 > POF S3 > POF S5.
Short-term exposure experiments to these POFs more clearly reveal effects of
individual climatic parameter on the optical stability, which will be discussed in the
later section.
8.3.1.2 Exposure to temperature with very low humid climates
The experimental results of the optical performance of POFs S3, S4 and S5 exposed
to 110 °C / low humidity, 100 °C / low humidity and 90 °C / low humidity are shown
in Fig. 8.25, 8.26 and 8.28, respectively. The presented data are again the average
value of the data for three wavelengths and recorded as a function exposure time.
The results clearly evidence the importance of temperature that alone would be
sufficient to tear down the transmission of POFs to a different extent.
0
20
40
60
80
100
120
0 50 100 150 200 250 300 350 400 450 500
Exposure time [hours]
Rel
. opt
ical
tran
smis
sion
[%]
POF S3
POF S4
POF S5
Figure 8.25: Optical transmission (averaged over three wavelengths) through bare
POFs S3, S4 and S5, measured as function of time during the
exposure to the climate 110 °C / low humidity.
At a first step, POF samples S3, S4 and S5 were exposed to 120 °C / low humidity.
They exhibited the total loss of transmission as soon as the temperature had reached
the set point; therefore no figures for the optical transmission are presented.
8 Results and Discussion
116
Obviously, the reason is a mechanical softening and subsequent loss in optical
properties at high temperature, which was above the observed Tg (of about 118 °C) of
the core and near to the observed melting point (of about 127 °C) of claddings. A
significant increase in diameter, brittleness, and shrinkage/folding of the cladding
were observed, which is similar to the results obtained from the exposure test at 92 °C
/ 95 %RH. However the changes were more pronounced under the exposure 120 °C /
low humidity (see Fig. 8.22).
The exposure of POFs S3, S4 and S5 to the climate 110 °C / low humidity resulted in
similar consequences as observed in the exposure of 92 °C / 95 %RH and 120 °C /
low humidity. The optical transmission performance of these POF samples is
represented in Fig. 8.25. The transmission curves are very similar to the ones
observed by the exposure to the climatic 92 °C / 95 %RH (see Fig. 8.21). The
outcomes of both the exposures were compared and indicate similar changes to cause
total loss of transmission in both the cases. However, the influencing parameter in the
former case is temperature and in the later case is humidity. Yet, the rate of
transmission loss exhibited by POFs under the climate 110 °C / low humidity was low
compared to that of under 92 °C / 95 %RH. The loss of nearly all transmission
occurred in the duration of about 28 hours, 210 hours and 590 hours in S5, S4 and S3
respectively. It may suggest that the combination of high temperature and humid
climate generate a condition, which is stronger than the condition 110 °C / low
humidity. As a result, a faster rate of the transmission loss was observed in the former
case. Nevertheless, here too, main sources for the transmission loss are expected to be
physical changes of POFs, because well-pronounced changes like increase in
diameter, brittleness and shrinkage/folding were found. For example, the
shrinkage/folding observed through SEM is shown in Fig. 8.22. Therefore, the
observed loss of transmission can be ascribed mainly to scattering. However,
chemical reactions could also take place to some extent and they are known to cause
the loss by light absorption.
The optical measurements consequences of the exposure to 100 °C / low humidity are
presented in Fig. 8.26. They show a strong initial drop-off of the optical transmission
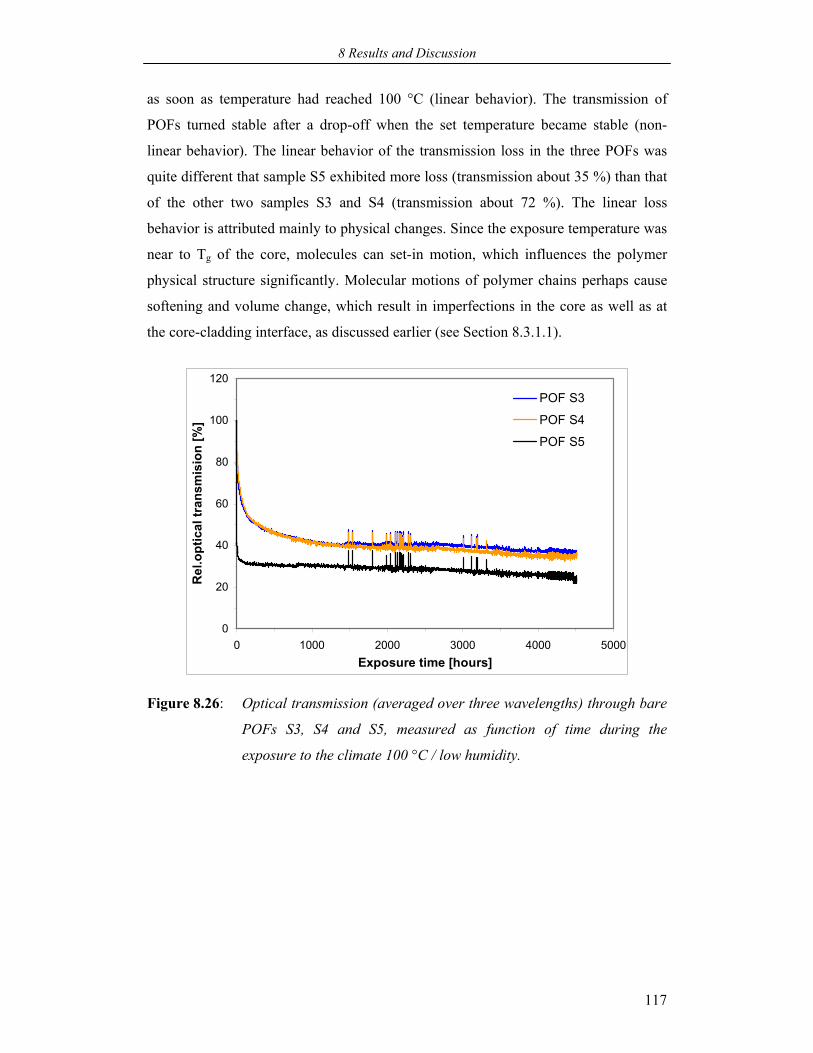
8 Results and Discussion
117
as soon as temperature had reached 100 °C (linear behavior). The transmission of
POFs turned stable after a drop-off when the set temperature became stable (non-
linear behavior). The linear behavior of the transmission loss in the three POFs was
quite different that sample S5 exhibited more loss (transmission about 35 %) than that
of the other two samples S3 and S4 (transmission about 72 %). The linear loss
behavior is attributed mainly to physical changes. Since the exposure temperature was
near to Tg of the core, molecules can set-in motion, which influences the polymer
physical structure significantly. Molecular motions of polymer chains perhaps cause
softening and volume change, which result in imperfections in the core as well as at
the core-cladding interface, as discussed earlier (see Section 8.3.1.1).
0
20
40
60
80
100
120
0 1000 2000 3000 4000 5000Exposure time [hours]
Rel
.opt
ical
tran
smis
ion
[%]
POF S3
POF S4
POF S5
Figure 8.26: Optical transmission (averaged over three wavelengths) through bare
POFs S3, S4 and S5, measured as function of time during the
exposure to the climate 100 °C / low humidity.
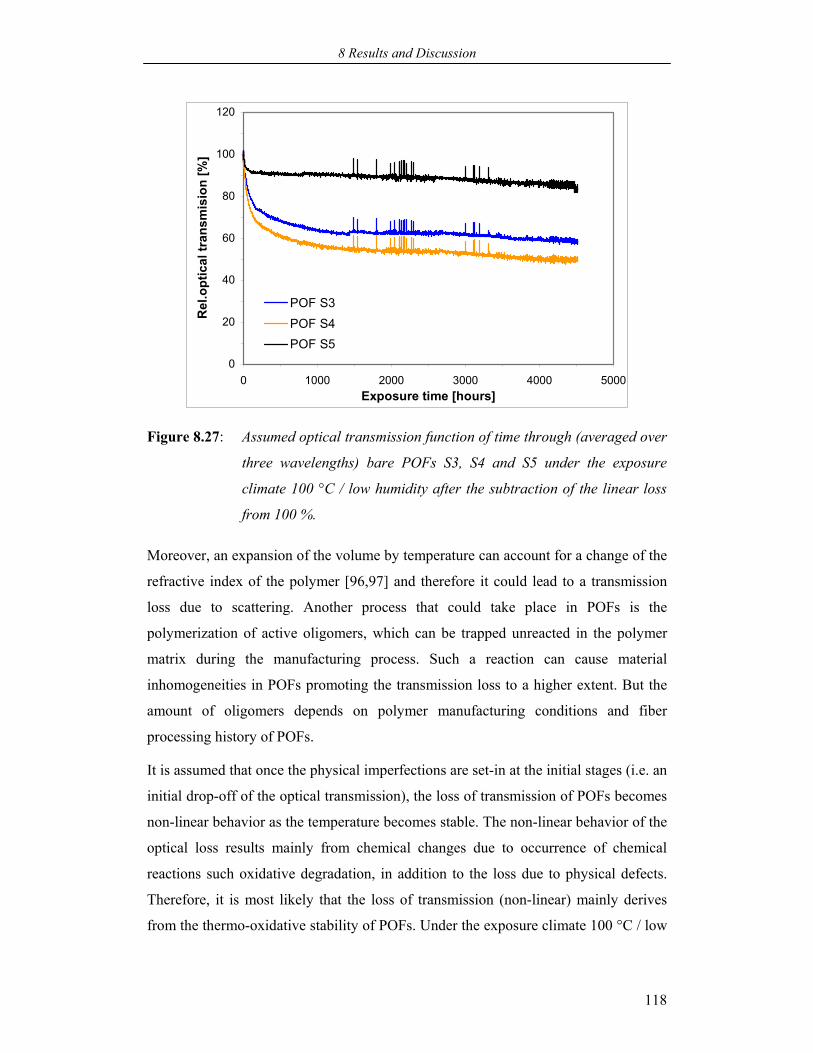
8 Results and Discussion
118
0
20
40
60
80
100
120
0 1000 2000 3000 4000 5000Exposure time [hours]
Rel
.opt
ical
tran
smis
ion
[%]
POF S3POF S4POF S5
Figure 8.27: Assumed optical transmission function of time through (averaged over
three wavelengths) bare POFs S3, S4 and S5 under the exposure
climate 100 °C / low humidity after the subtraction of the linear loss
from 100 %.
Moreover, an expansion of the volume by temperature can account for a change of the
refractive index of the polymer [96,97] and therefore it could lead to a transmission
loss due to scattering. Another process that could take place in POFs is the
polymerization of active oligomers, which can be trapped unreacted in the polymer
matrix during the manufacturing process. Such a reaction can cause material
inhomogeneities in POFs promoting the transmission loss to a higher extent. But the
amount of oligomers depends on polymer manufacturing conditions and fiber
processing history of POFs.
It is assumed that once the physical imperfections are set-in at the initial stages (i.e. an
initial drop-off of the optical transmission), the loss of transmission of POFs becomes
non-linear behavior as the temperature becomes stable. The non-linear behavior of the
optical loss results mainly from chemical changes due to occurrence of chemical
reactions such oxidative degradation, in addition to the loss due to physical defects.
Therefore, it is most likely that the loss of transmission (non-linear) mainly derives
from the thermo-oxidative stability of POFs. Under the exposure climate 100 °C / low
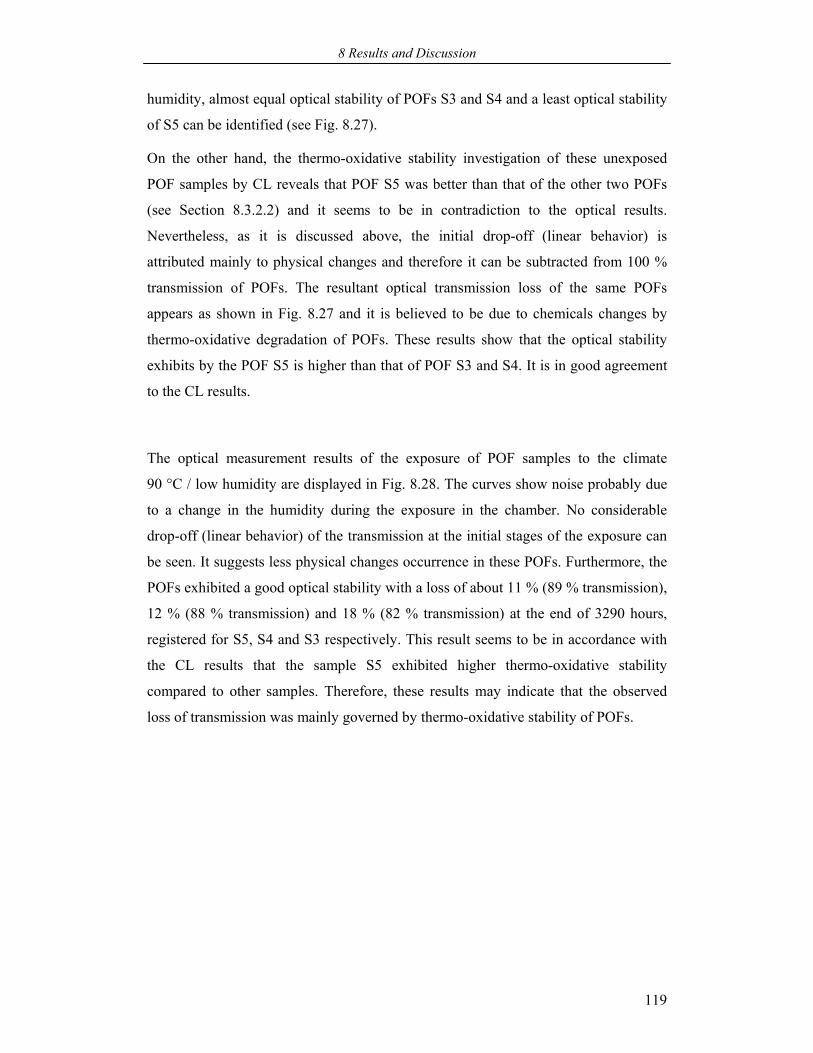
8 Results and Discussion
119
humidity, almost equal optical stability of POFs S3 and S4 and a least optical stability
of S5 can be identified (see Fig. 8.27).
On the other hand, the thermo-oxidative stability investigation of these unexposed
POF samples by CL reveals that POF S5 was better than that of the other two POFs
(see Section 8.3.2.2) and it seems to be in contradiction to the optical results.
Nevertheless, as it is discussed above, the initial drop-off (linear behavior) is
attributed mainly to physical changes and therefore it can be subtracted from 100 %
transmission of POFs. The resultant optical transmission loss of the same POFs
appears as shown in Fig. 8.27 and it is believed to be due to chemicals changes by
thermo-oxidative degradation of POFs. These results show that the optical stability
exhibits by the POF S5 is higher than that of POF S3 and S4. It is in good agreement
to the CL results.
The optical measurement results of the exposure of POF samples to the climate
90 °C / low humidity are displayed in Fig. 8.28. The curves show noise probably due
to a change in the humidity during the exposure in the chamber. No considerable
drop-off (linear behavior) of the transmission at the initial stages of the exposure can
be seen. It suggests less physical changes occurrence in these POFs. Furthermore, the
POFs exhibited a good optical stability with a loss of about 11 % (89 % transmission),
12 % (88 % transmission) and 18 % (82 % transmission) at the end of 3290 hours,
registered for S5, S4 and S3 respectively. This result seems to be in accordance with
the CL results that the sample S5 exhibited higher thermo-oxidative stability
compared to other samples. Therefore, these results may indicate that the observed
loss of transmission was mainly governed by thermo-oxidative stability of POFs.
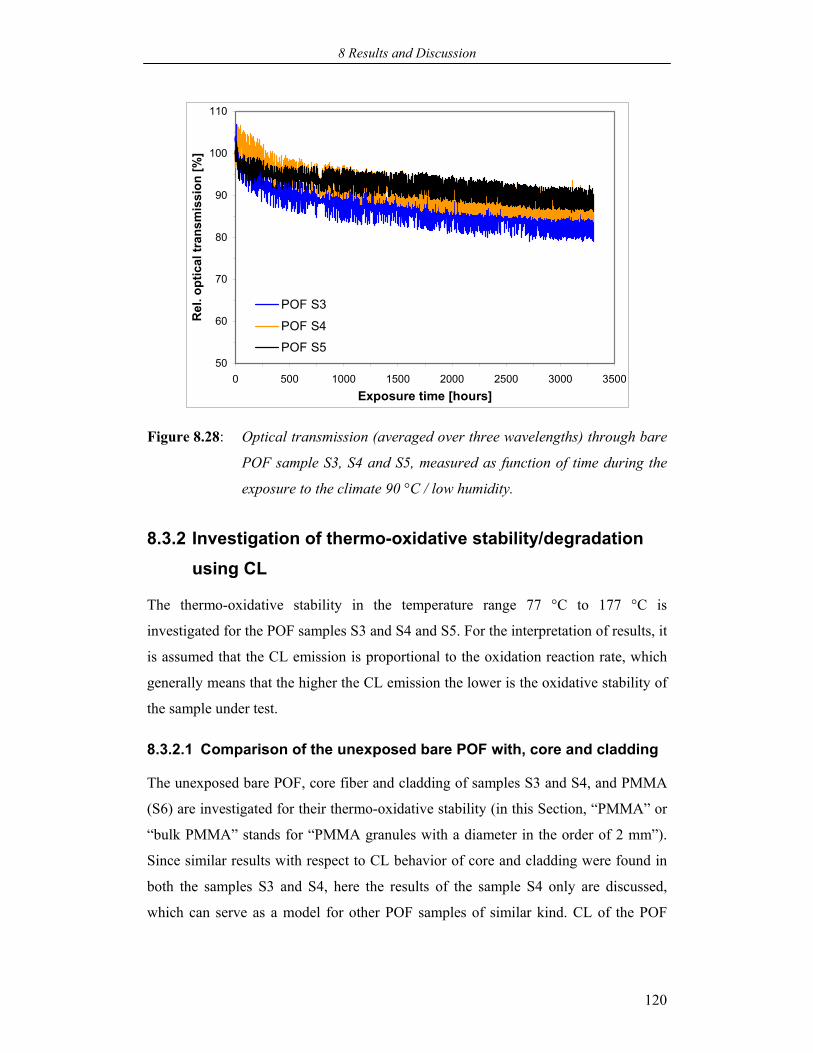
8 Results and Discussion
120
50
60
70
80
90
100
110
0 500 1000 1500 2000 2500 3000 3500Exposure time [hours]
Rel
. opt
ical
tran
smis
sion
[%]
POF S3
POF S4
POF S5
Figure 8.28: Optical transmission (averaged over three wavelengths) through bare
POF sample S3, S4 and S5, measured as function of time during the
exposure to the climate 90 °C / low humidity.
8.3.2 Investigation of thermo-oxidative stability/degradation using CL
The thermo-oxidative stability in the temperature range 77 °C to 177 °C is
investigated for the POF samples S3 and S4 and S5. For the interpretation of results, it
is assumed that the CL emission is proportional to the oxidation reaction rate, which
generally means that the higher the CL emission the lower is the oxidative stability of
the sample under test.
8.3.2.1 Comparison of the unexposed bare POF with, core and cladding
The unexposed bare POF, core fiber and cladding of samples S3 and S4, and PMMA
(S6) are investigated for their thermo-oxidative stability (in this Section, “PMMA” or
“bulk PMMA” stands for “PMMA granules with a diameter in the order of 2 mm”).
Since similar results with respect to CL behavior of core and cladding were found in
both the samples S3 and S4, here the results of the sample S4 only are discussed,
which can serve as a model for other POF samples of similar kind. CL of the POF
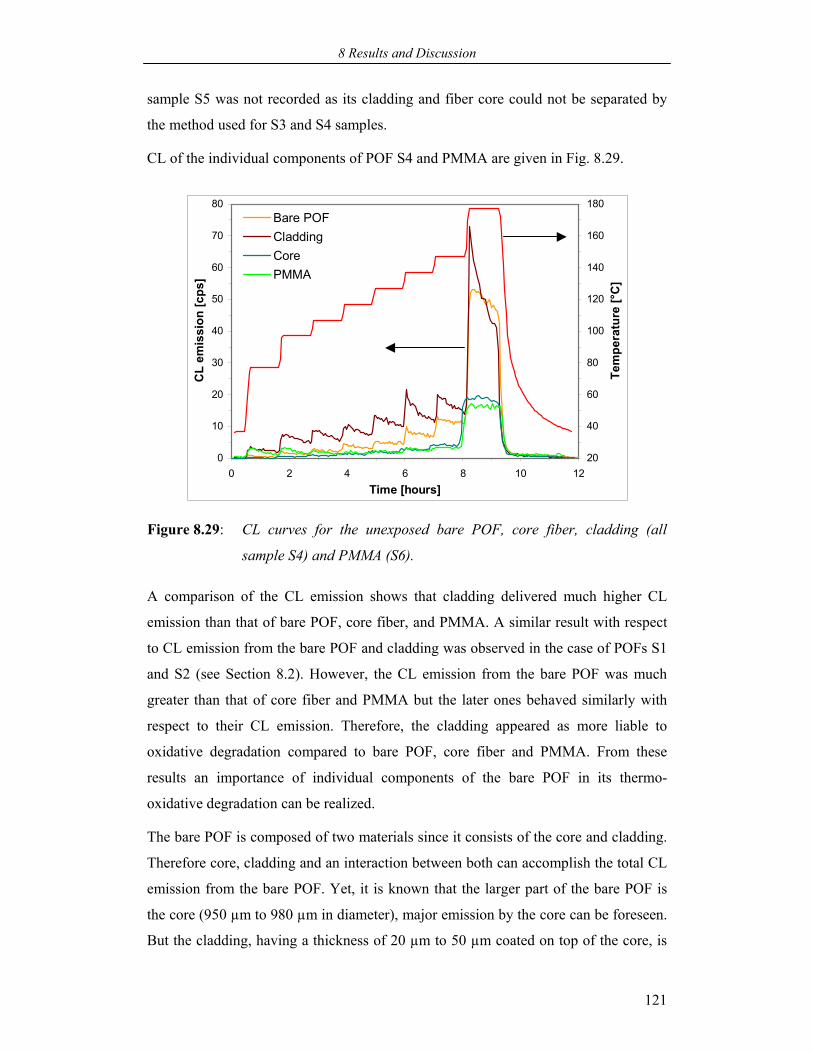
8 Results and Discussion
121
sample S5 was not recorded as its cladding and fiber core could not be separated by
the method used for S3 and S4 samples.
CL of the individual components of POF S4 and PMMA are given in Fig. 8.29.
0
10
20
30
40
50
60
70
80
0 2 4 6 8 10 12Time [hours]
CL
emis
sion
[cps
]
20
40
60
80
100
120
140
160
180
Tem
pera
ture
[°C
]
Bare POFCladdingCorePMMA
Figure 8.29: CL curves for the unexposed bare POF, core fiber, cladding (all
sample S4) and PMMA (S6).
A comparison of the CL emission shows that cladding delivered much higher CL
emission than that of bare POF, core fiber, and PMMA. A similar result with respect
to CL emission from the bare POF and cladding was observed in the case of POFs S1
and S2 (see Section 8.2). However, the CL emission from the bare POF was much
greater than that of core fiber and PMMA but the later ones behaved similarly with
respect to their CL emission. Therefore, the cladding appeared as more liable to
oxidative degradation compared to bare POF, core fiber and PMMA. From these
results an importance of individual components of the bare POF in its thermo-
oxidative degradation can be realized.
The bare POF is composed of two materials since it consists of the core and cladding.
Therefore core, cladding and an interaction between both can accomplish the total CL
emission from the bare POF. Yet, it is known that the larger part of the bare POF is
the core (950 µm to 980 µm in diameter), major emission by the core can be foreseen.
But the cladding, having a thickness of 20 µm to 50 µm coated on top of the core, is
8 Results and Discussion
122
not only acting as a rarer medium (to guide light in the fiber by total internal
reflection) but also as a protective coating for the oxidative degradation of the core.
Therefore, thermo-oxidative degradation of the core is most likely dependent on the
oxygen diffusion coefficient of the cladding. The larger contribution from the
cladding to the total CL emission from the bare POF compared to that of the core (see
Fig. 8.29) suggests higher thermo-oxidative stability of the core than of the cladding.
It is confirmed by nearly consistent CL of the core (which is PMMA) and the bulk
PMMA sample.
Of course many factors are involved in the relatively high CL emission from the
cladding. For instance, physical geometry and chemical compositions of samples play
an important role. As already quoted, cladding samples appeared as hollow cylinders
when the core was removed (see Section 7.4). This cylindrical structure makes it
possible for oxygen to diffuse from all directions. As a result, a large part of the
polymer is available to the oxidation scheme. In contrary, the core has a closed
cylindrical fiber structure resulting in a decreasing diffusion of oxygen from the
periphery towards the center of the fiber. Consequently, the relative amount of
polymer available for oxidation will be less compared to the one of the cladding and
the core may have a depth dependent oxidative degradation profile, at least at
temperatures below its Tg. The same mechanism may be applicable to bulk PMMA
since the size of the granules was comparable to the diameter of the core.
It seems that chemical compositions also would create differences in CL emission
from the core and cladding. Because the core material of the present POFs was
PMMA and it is different from cladding materials that were found to be
polyfluoroolefins and PFMA (see Section 8.1.3). Therefore, it is possible that
differences in chemical compositions of claddings and cores would additionally
responsible for differences in their CL emission (particularly the respective quantum
efficiencies may be different).
From the above results the following may be condensed:
CL suggests that thermo-oxidative degradation of the bare POF is predominantly
of the cladding and minor of the core.
The thermo-oxidative stability of the cladding was found to be lower than that of
the core and PMMA.
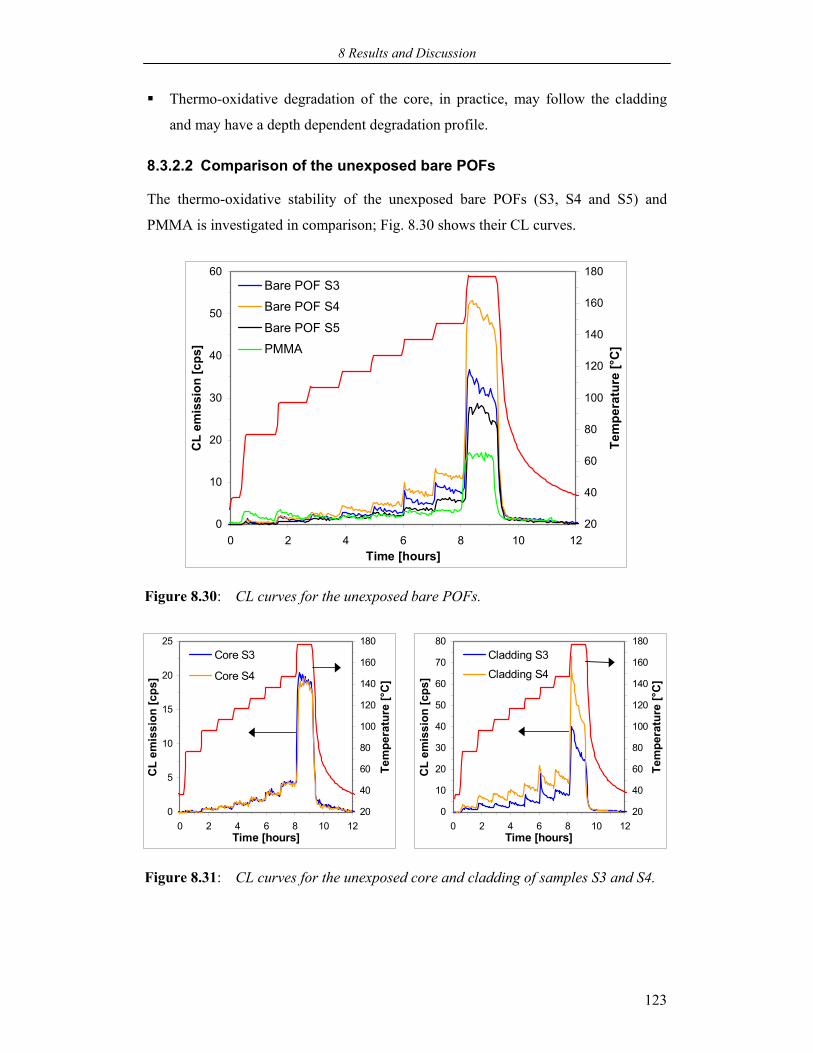
8 Results and Discussion
123
Thermo-oxidative degradation of the core, in practice, may follow the cladding
and may have a depth dependent degradation profile.
8.3.2.2 Comparison of the unexposed bare POFs
The thermo-oxidative stability of the unexposed bare POFs (S3, S4 and S5) and
PMMA is investigated in comparison; Fig. 8.30 shows their CL curves.
0
10
20
30
40
50
60
0 2 4 6 8 10 12Time [hours]
CL
emis
sion
[cps
]
20
40
60
80
100
120
140
160
180
Tem
pera
ture
[°C
]
Bare POF S3Bare POF S4
Bare POF S5PMMA
Figure 8.30: CL curves for the unexposed bare POFs.
0
5
10
15
20
25
0 2 4 6 8 10 12Time [hours]
CL
emis
sion
[cps
]
20
40
60
80
100
120
140
160
180
Tem
pera
ture
[°C
]
Core S3
Core S4
0
10
20
30
40
50
60
70
80
0 2 4 6 8 10 12Time [hours]
CL
emis
sion
[cps
]
20
40
60
80
100
120
140
160
180Te
mpe
ratu
re [°
C]
Cladding S3
Cladding S4
Figure 8.31: CL curves for the unexposed core and cladding of samples S3 and S4.
8 Results and Discussion
124
The CL emission difference between bare POF samples was observed. It shows a
difference in their thermo-oxidative stability although they possessed the same core
material PMMA. The thermo-oxidative stability of the investigated samples was
found to be in the order of S4 < S3 < S5 < bulk PMMA, as they exhibited CL
emission in the reverse order (see Fig. 8.30).
In order to realize the observed difference in their stability, CL of the core and
cladding of samples S3 and S4 was separately recorded and compared; their CL
curves are shown in Fig. 8.31. CL of the same of the sample S5 was not recorded, as
they could not be separated by the method found for S3 and S4 (see Section 7.4). The
comparison of CL of core samples clearly suggests almost equal thermo-oxidative
stability as they displayed almost equal height in their CL emission. It also shows the
CL consistency in displaying material uniformity of core samples. In contrast,
cladding samples displayed a marked difference in their stability, as the height of their
CL emission was different. The sample S4 exhibited higher CL emission compared to
that of the sample S3 indicating its lower thermo-oxidative stability. The same was
observed with CL of their respective bare POF samples. Therefore, from these results
it can be understood that the observed difference in the stability of bare POFs might
be due to a difference in the stability of claddings. It confirms higher stability of the
bare POF S5 compared to S3 and S4 is probably due to its cladding, which was
experimentally found to be an PFMA (see Section 8.1.3). If this assumption is true,
the cladding of the type sample S5 shows higher stability than the polyfluoroolefin
cladding of the type S3 and S4 (see Section 8.1.3).
Nevertheless, both the claddings as well as core samples behaved similarly in their CL
emission. Core samples exhibited a plateau emission behavior, which could be related
to thermally activated degradation processes controlled by the diffusion rate of
oxygen [51,52,74,86]. The claddings also displayed the plateau emission behavior,
however, seemed to exhibit the peak emission behavior in the temperature range
127 °C to 177 °C (see Fig. 8.31). A similar behavior of plateau and peak emission can
also be found in their respective unexposed bare POF samples (see Fig. 8.30), which
additionally supports the result that CL emission from the bare POF was mainly from
the cladding and minor the core (see Section. 8.3.2.1). Nevertheless, the peak
emission of both may be related to their melting since they exhibited melting
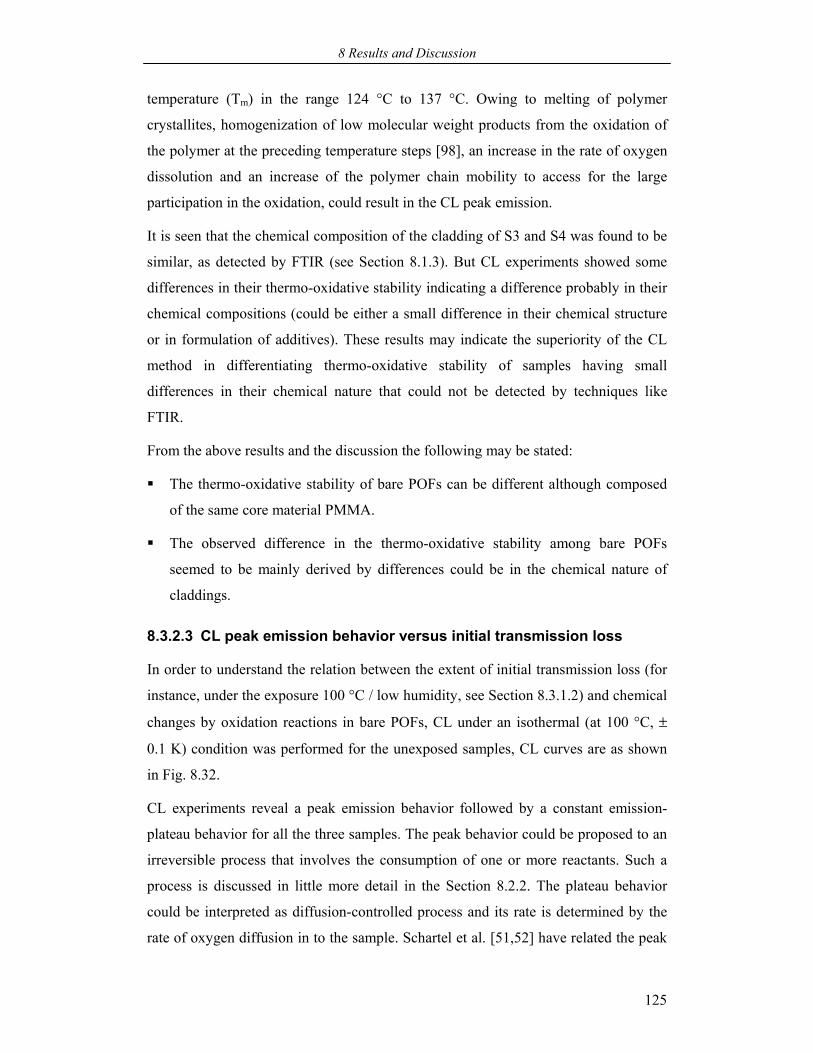
8 Results and Discussion
125
temperature (Tm) in the range 124 °C to 137 °C. Owing to melting of polymer
crystallites, homogenization of low molecular weight products from the oxidation of
the polymer at the preceding temperature steps [98], an increase in the rate of oxygen
dissolution and an increase of the polymer chain mobility to access for the large
participation in the oxidation, could result in the CL peak emission.
It is seen that the chemical composition of the cladding of S3 and S4 was found to be
similar, as detected by FTIR (see Section 8.1.3). But CL experiments showed some
differences in their thermo-oxidative stability indicating a difference probably in their
chemical compositions (could be either a small difference in their chemical structure
or in formulation of additives). These results may indicate the superiority of the CL
method in differentiating thermo-oxidative stability of samples having small
differences in their chemical nature that could not be detected by techniques like
FTIR.
From the above results and the discussion the following may be stated:
The thermo-oxidative stability of bare POFs can be different although composed
of the same core material PMMA.
The observed difference in the thermo-oxidative stability among bare POFs
seemed to be mainly derived by differences could be in the chemical nature of
claddings.
8.3.2.3 CL peak emission behavior versus initial transmission loss
In order to understand the relation between the extent of initial transmission loss (for
instance, under the exposure 100 °C / low humidity, see Section 8.3.1.2) and chemical
changes by oxidation reactions in bare POFs, CL under an isothermal (at 100 °C, ±
0.1 K) condition was performed for the unexposed samples, CL curves are as shown
in Fig. 8.32.
CL experiments reveal a peak emission behavior followed by a constant emission-
plateau behavior for all the three samples. The peak behavior could be proposed to an
irreversible process that involves the consumption of one or more reactants. Such a
process is discussed in little more detail in the Section 8.2.2. The plateau behavior
could be interpreted as diffusion-controlled process and its rate is determined by the
rate of oxygen diffusion in to the sample. Schartel et al. [51,52] have related the peak
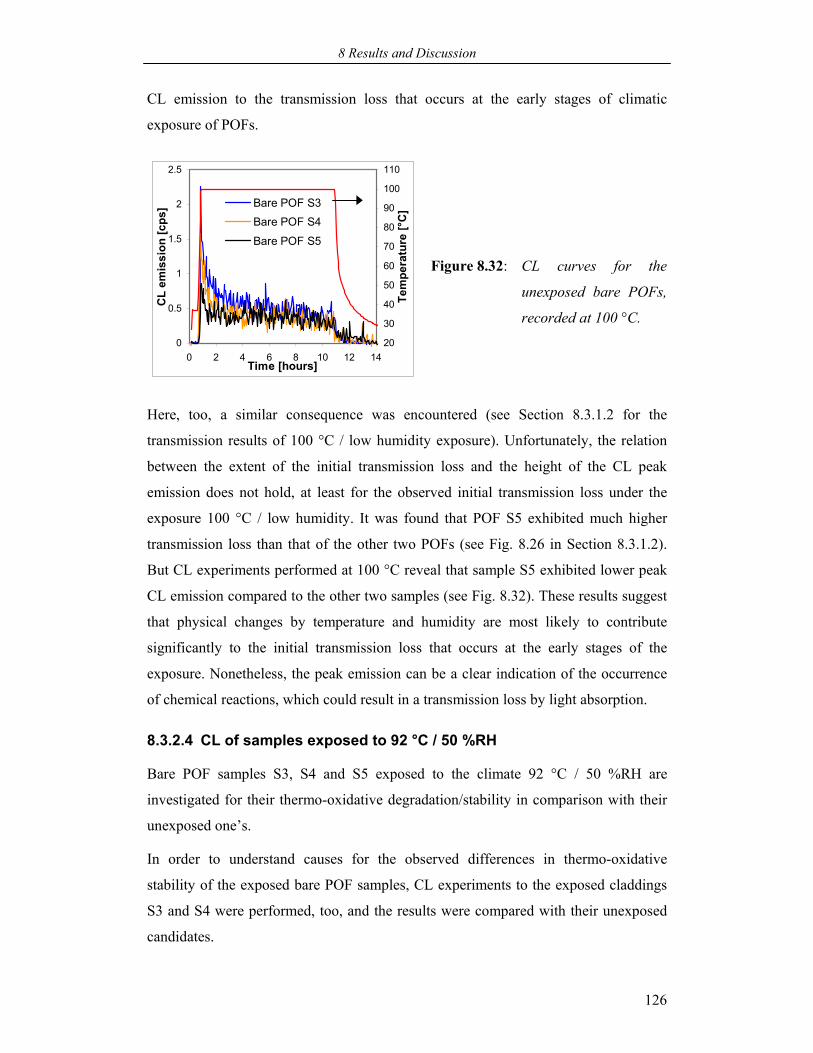
8 Results and Discussion
126
CL emission to the transmission loss that occurs at the early stages of climatic
exposure of POFs.
0
0.5
1
1.5
2
2.5
0 2 4 6 8 10 12 14Time [hours]
CL
emis
sion
[cps
]
20
30
40
50
60
70
80
90
100
110
Tem
pera
ture
[°C
]Bare POF S3Bare POF S4
Bare POF S5
Figure 8.32:
CL curves for the
unexposed bare POFs,
recorded at 100 °C.
Here, too, a similar consequence was encountered (see Section 8.3.1.2 for the
transmission results of 100 °C / low humidity exposure). Unfortunately, the relation
between the extent of the initial transmission loss and the height of the CL peak
emission does not hold, at least for the observed initial transmission loss under the
exposure 100 °C / low humidity. It was found that POF S5 exhibited much higher
transmission loss than that of the other two POFs (see Fig. 8.26 in Section 8.3.1.2).
But CL experiments performed at 100 °C reveal that sample S5 exhibited lower peak
CL emission compared to the other two samples (see Fig. 8.32). These results suggest
that physical changes by temperature and humidity are most likely to contribute
significantly to the initial transmission loss that occurs at the early stages of the
exposure. Nonetheless, the peak emission can be a clear indication of the occurrence
of chemical reactions, which could result in a transmission loss by light absorption.
8.3.2.4 CL of samples exposed to 92 °C / 50 %RH
Bare POF samples S3, S4 and S5 exposed to the climate 92 °C / 50 %RH are
investigated for their thermo-oxidative degradation/stability in comparison with their
unexposed one’s.
In order to understand causes for the observed differences in thermo-oxidative
stability of the exposed bare POF samples, CL experiments to the exposed claddings
S3 and S4 were performed, too, and the results were compared with their unexposed
candidates.
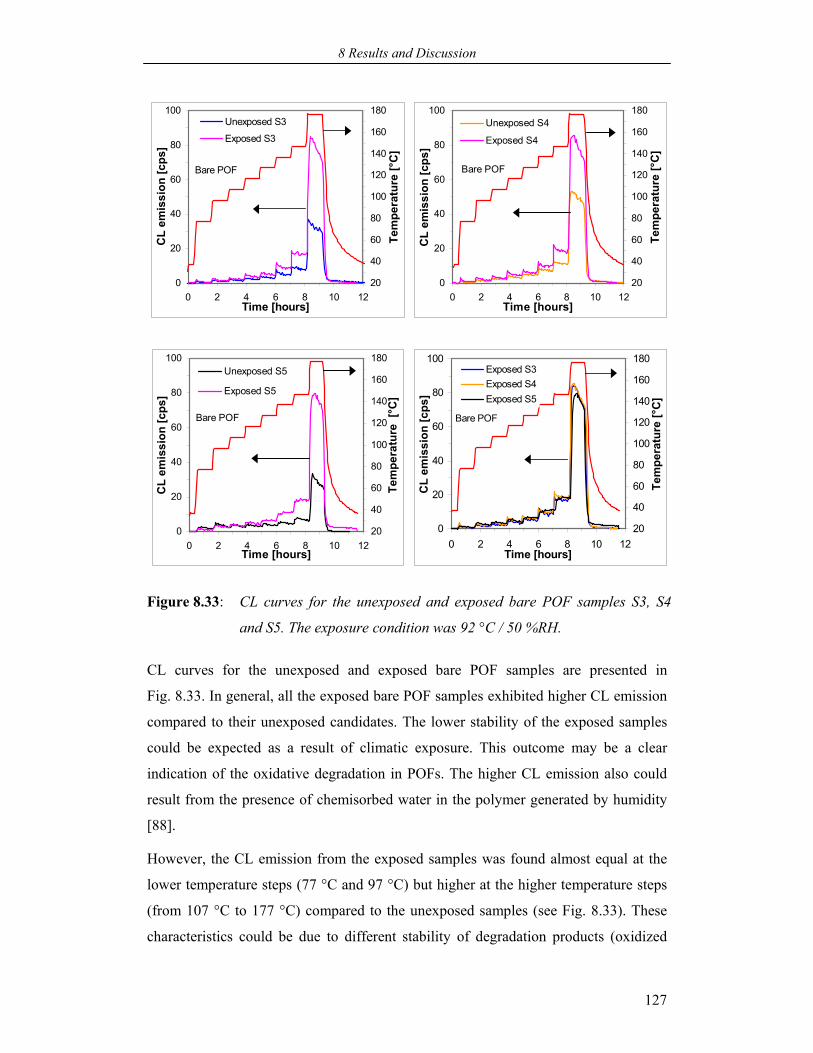
8 Results and Discussion
127
0
20
40
60
80
100
0 2 4 6 8 10 12Time [hours]
CL
emis
sion
[cps
]
20
40
60
80
100
120
140
160
180
Tem
pera
ture
[°C
]
Unexposed S3
Exposed S3
Bare POF
0
20
40
60
80
100
0 2 4 6 8 10 12Time [hours]
CL
emis
sion
[cps
]
20
40
60
80
100
120
140
160
180
Tem
pera
ture
[°C
]
Unexposed S4
Exposed S4
Bare POF
0
20
40
60
80
100
0 2 4 6 8 10 12Time [hours]
CL
emis
sion
[cps
]
20
40
60
80
100
120
140
160
180
Tem
pera
ture
[°C
]
Unexposed S5
Exposed S5
Bare POF
0
20
40
60
80
100
0 2 4 6 8 10 12Time [hours]
CL
emis
sion
[cps
]
20
40
60
80
100
120
140
160
180
Tem
pera
ture
[°C
]
Exposed S3Exposed S4Exposed S5
Bare POF
Figure 8.33: CL curves for the unexposed and exposed bare POF samples S3, S4
and S5. The exposure condition was 92 °C / 50 %RH.
CL curves for the unexposed and exposed bare POF samples are presented in
Fig. 8.33. In general, all the exposed bare POF samples exhibited higher CL emission
compared to their unexposed candidates. The lower stability of the exposed samples
could be expected as a result of climatic exposure. This outcome may be a clear
indication of the oxidative degradation in POFs. The higher CL emission also could
result from the presence of chemisorbed water in the polymer generated by humidity
[88].
However, the CL emission from the exposed samples was found almost equal at the
lower temperature steps (77 °C and 97 °C) but higher at the higher temperature steps
(from 107 °C to 177 °C) compared to the unexposed samples (see Fig. 8.33). These
characteristics could be due to different stability of degradation products (oxidized
8 Results and Discussion
128
moieties) that form as a result of oxidative degradation due to climatic exposure. It
also could be possible that the dissolution of oxygen in the sample at temperatures
below their Tg may not be adequate to decompose all oxidized moieties but be
sufficient or enough, at least for those which accumulated at the surface of the sample.
The ranking of the exposed samples concerning the oxidative degradation was found
difficult to assign as the comparison shows almost a similar rate of the CL emission
from all the samples (see Fig. 8.33).
In view of the fact that the CL emission from the bare POF is the combined emission
from both the core and cladding, CL of the exposed claddings were compared with
their unexposed one’s, which is shown in Fig. 8.34. Both the exposed claddings S3
and S4 exhibited a considerable decrease in the CL emission in the whole investigated
temperature range in comparison with the unexposed samples. The significant
decrease in the CL emission indicates an increased stability, which could be caused by
processes like crosslinking varying diffusion properties of the polymer [99]. It could
also results from quenching of the excited state products by molecules that form due
to oxidation as a result of climatic exposure.
However, CL emission comparison between the exposed claddings S3 and S4 yields
no significant changes (see Fig 8.34), which indicates that no ranking could be made
easily with respect to their degradation changes.
Nevertheless, in general, in result to the relative lower thermo-oxidative stability
exhibited by the exposed bare POFs, the exposed claddings did not show such result.
Therefore, it might be possible that the observed relative lower stability of the
exposed bare POFs could cause by the core. That means the relative stability of the
core appears to be decreased due to its thermo-oxidative degradation owing to
climatic exposure.
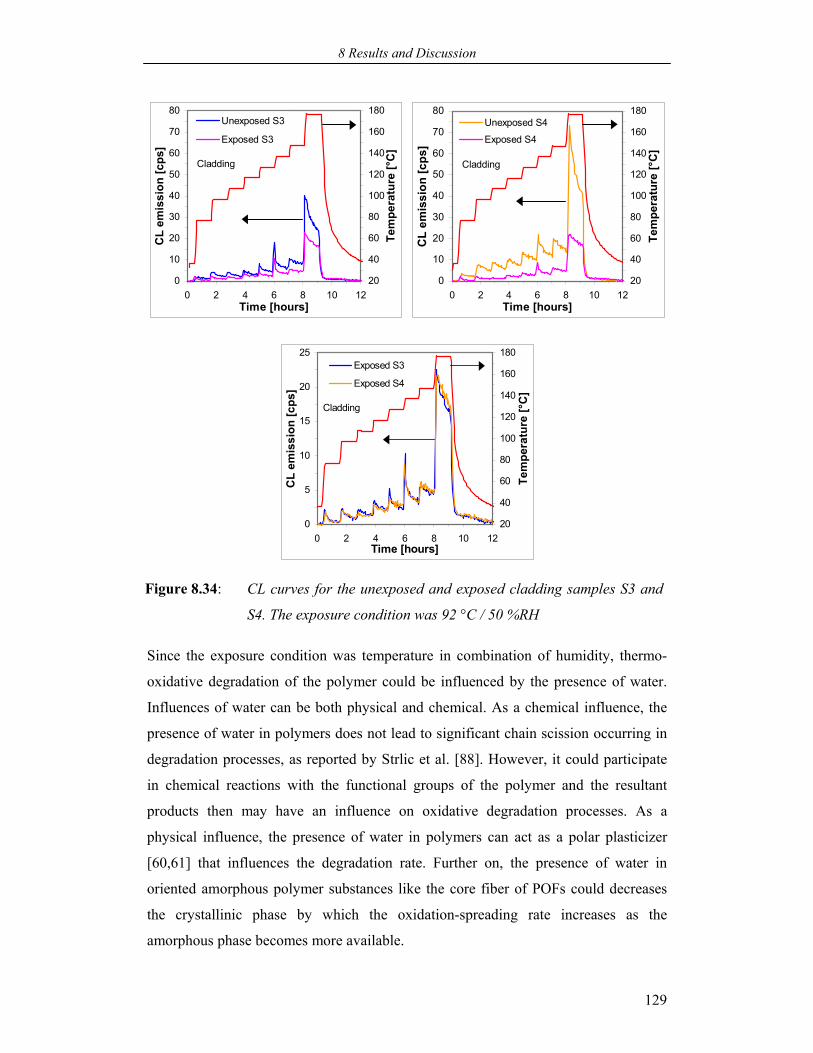
8 Results and Discussion
129
0
10
20
30
40
50
60
70
80
0 2 4 6 8 10 12Time [hours]
CL
emis
sion
[cps
]
20
40
60
80
100
120
140
160
180
Tem
pera
ture
[°C
]
Unexposed S3
Exposed S3
Cladding
0
10
20
30
40
50
60
70
80
0 2 4 6 8 10 12Time [hours]
CL
emis
sion
[cps
]
20
40
60
80
100
120
140
160
180
Tem
pera
ture
[°C
]
Unexposed S4
Exposed S4
Cladding
0
5
10
15
20
25
0 2 4 6 8 10 12Time [hours]
CL
emis
sion
[cps
]
20
40
60
80
100
120
140
160
180
Tem
pera
ture
[°C
]
Exposed S3
Exposed S4
Cladding
Figure 8.34: CL curves for the unexposed and exposed cladding samples S3 and
S4. The exposure condition was 92 °C / 50 %RH
Since the exposure condition was temperature in combination of humidity, thermo-
oxidative degradation of the polymer could be influenced by the presence of water.
Influences of water can be both physical and chemical. As a chemical influence, the
presence of water in polymers does not lead to significant chain scission occurring in
degradation processes, as reported by Strlic et al. [88]. However, it could participate
in chemical reactions with the functional groups of the polymer and the resultant
products then may have an influence on oxidative degradation processes. As a
physical influence, the presence of water in polymers can act as a polar plasticizer
[60,61] that influences the degradation rate. Further on, the presence of water in
oriented amorphous polymer substances like the core fiber of POFs could decreases
the crystallinic phase by which the oxidation-spreading rate increases as the
amorphous phase becomes more available.
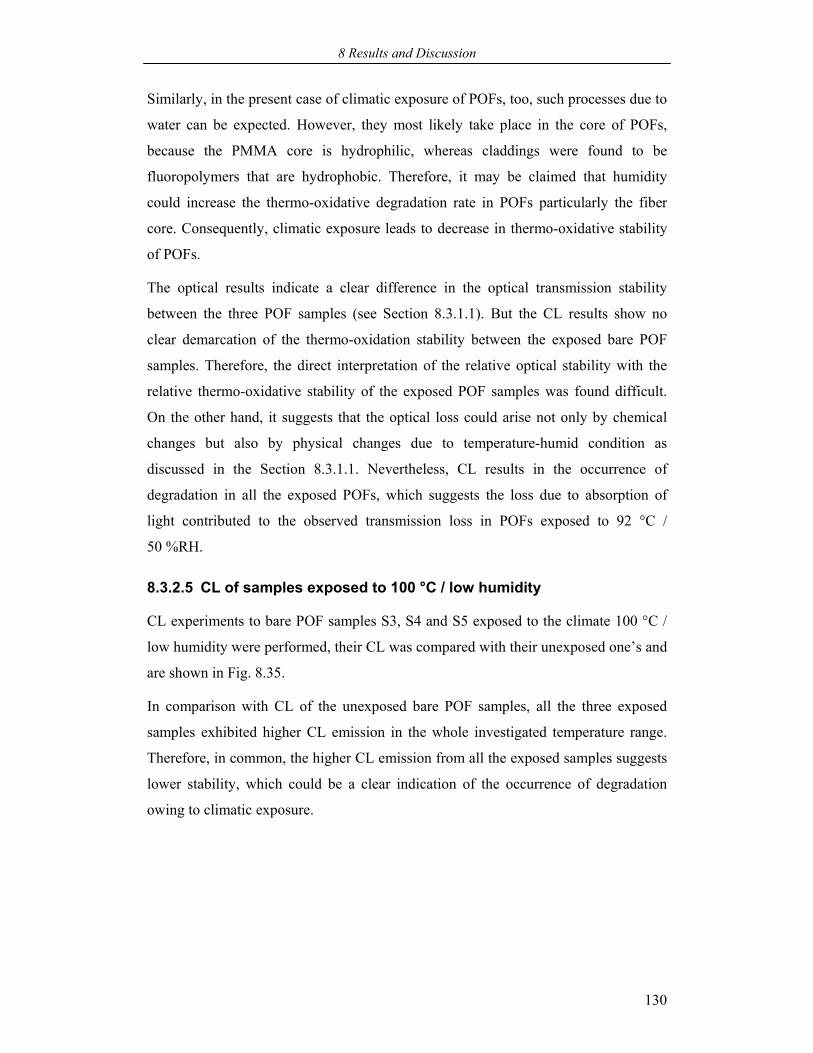
8 Results and Discussion
130
Similarly, in the present case of climatic exposure of POFs, too, such processes due to
water can be expected. However, they most likely take place in the core of POFs,
because the PMMA core is hydrophilic, whereas claddings were found to be
fluoropolymers that are hydrophobic. Therefore, it may be claimed that humidity
could increase the thermo-oxidative degradation rate in POFs particularly the fiber
core. Consequently, climatic exposure leads to decrease in thermo-oxidative stability
of POFs.
The optical results indicate a clear difference in the optical transmission stability
between the three POF samples (see Section 8.3.1.1). But the CL results show no
clear demarcation of the thermo-oxidation stability between the exposed bare POF
samples. Therefore, the direct interpretation of the relative optical stability with the
relative thermo-oxidative stability of the exposed POF samples was found difficult.
On the other hand, it suggests that the optical loss could arise not only by chemical
changes but also by physical changes due to temperature-humid condition as
discussed in the Section 8.3.1.1. Nevertheless, CL results in the occurrence of
degradation in all the exposed POFs, which suggests the loss due to absorption of
light contributed to the observed transmission loss in POFs exposed to 92 °C /
50 %RH.
8.3.2.5 CL of samples exposed to 100 °C / low humidity
CL experiments to bare POF samples S3, S4 and S5 exposed to the climate 100 °C /
low humidity were performed, their CL was compared with their unexposed one’s and
are shown in Fig. 8.35.
In comparison with CL of the unexposed bare POF samples, all the three exposed
samples exhibited higher CL emission in the whole investigated temperature range.
Therefore, in common, the higher CL emission from all the exposed samples suggests
lower stability, which could be a clear indication of the occurrence of degradation
owing to climatic exposure.
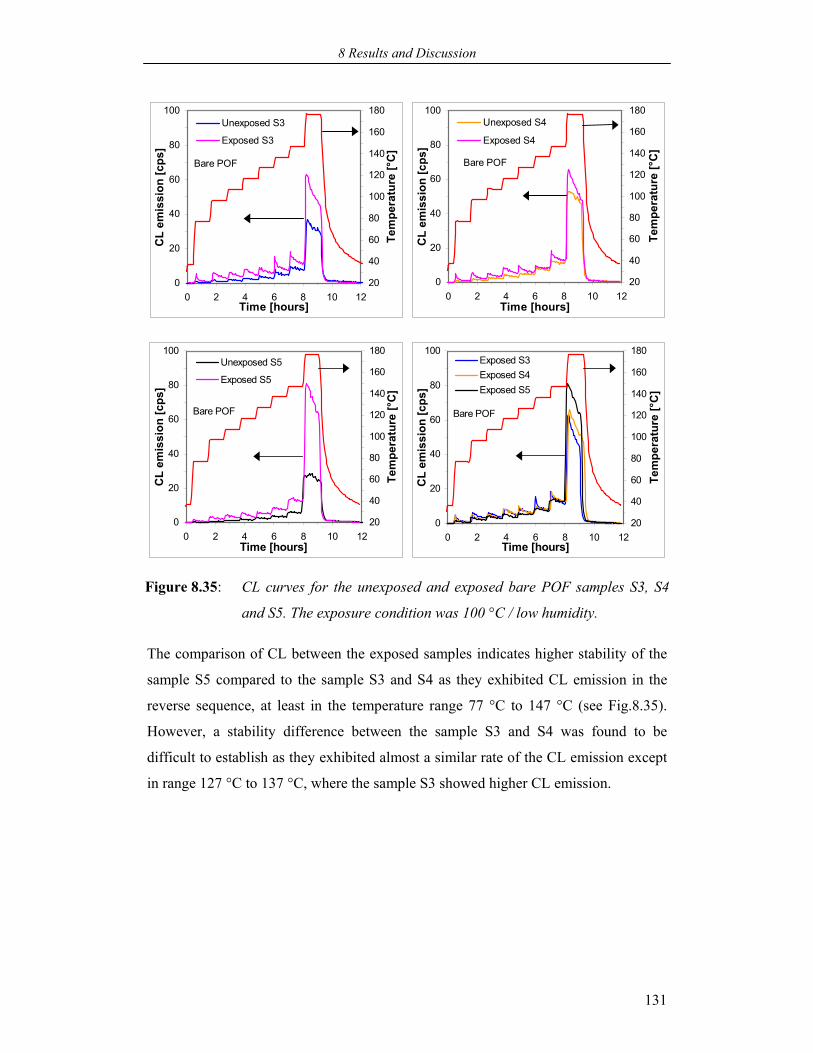
8 Results and Discussion
131
0
20
40
60
80
100
0 2 4 6 8 10 12Time [hours]
CL
emis
sion
[cps
]
20
40
60
80
100
120
140
160
180
Tem
pera
ture
[°C
]
Unexposed S3
Exposed S3
Bare POF
0
20
40
60
80
100
0 2 4 6 8 10 12Time [hours]
CL
emis
sion
[cps
]
20
40
60
80
100
120
140
160
180
Tem
pera
ture
[°C
]
Unexposed S4
Exposed S4
Bare POF
0
20
40
60
80
100
0 2 4 6 8 10 12Time [hours]
CL
emis
sion
[cps
]
20
40
60
80
100
120
140
160
180
Tem
pera
ture
[°C
]
Unexposed S5
Exposed S5
Bare POF
0
20
40
60
80
100
0 2 4 6 8 10 12Time [hours]
CL
emis
sion
[cps
]
20
40
60
80
100
120
140
160
180
Tem
pera
ture
[°C
]
Exposed S3Exposed S4Exposed S5
Bare POF
Figure 8.35: CL curves for the unexposed and exposed bare POF samples S3, S4
and S5. The exposure condition was 100 °C / low humidity.
The comparison of CL between the exposed samples indicates higher stability of the
sample S5 compared to the sample S3 and S4 as they exhibited CL emission in the
reverse sequence, at least in the temperature range 77 °C to 147 °C (see Fig.8.35).
However, a stability difference between the sample S3 and S4 was found to be
difficult to establish as they exhibited almost a similar rate of the CL emission except
in range 127 °C to 137 °C, where the sample S3 showed higher CL emission.
8 Results and Discussion
132
0
10
20
30
40
50
60
70
80
0 2 4 6 8 10 12Time [hours]
CL
emis
sion
[cps
]
20
40
60
80
100
120
140
160
180
Tem
pera
ture
[°C
]
Unexposed S3
Exposed S3
Cladding
0
10
20
30
40
50
60
70
80
0 2 4 6 8 10 12Time [hours]
CL
emis
sion
[cps
]
20
40
60
80
100
120
140
160
180
Tem
pera
ture
[°C
]
Unexposed S4Exposed S4
Cladding
0
5
10
15
20
25
30
35
40
0 2 4 6 8 10 12Time [hours]
CL
emis
sion
[cps
]
20
40
60
80
100
120
140
160
180
Tem
pera
ture
[°C
]
Exposed S3
Exposed S4
Cladding
Figure 8.36: CL curves for the unexposed and exposed cladding samples S3 and
S4. The exposure condition was 100 °C / low humidity.
CL emission curves for the unexposed and exposed claddings S3 and S4 are shown in
Fig. 8.36. The results, in overall, show similar consequences as observed in CL of
claddings exposed to 92 °C / 50 %RH. Both the exposed claddings, especially S4,
displayed significant lower CL emission suggesting their higher stability compared to
their unexposed candidates. However, CL emission at their Tm (137 °C) was found
different, because both the exposed samples exhibited almost equal peak emission.
This result indicates a decomposition of oxidized products that become homogenized
due to melting (of the polymer) and therefore largely participate in oxidation and an
increase in the diffusion rate of oxygen. Nevertheless, a decrease of the CL emission
exhibited by both the claddings, may be attributed to crosslinking and/or to quenching
of excited state products by molecules produced from oxidation. In order of rating the
above effects with respect to the exposed claddings both their CL was compared
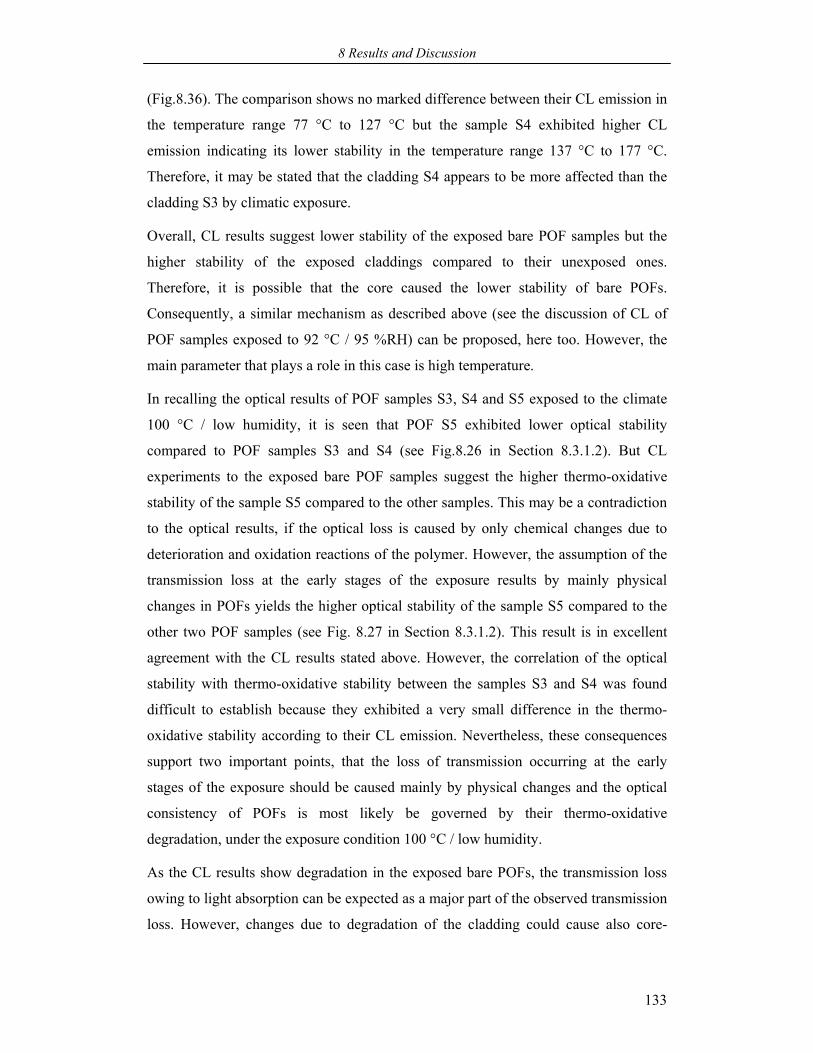
8 Results and Discussion
133
(Fig.8.36). The comparison shows no marked difference between their CL emission in
the temperature range 77 °C to 127 °C but the sample S4 exhibited higher CL
emission indicating its lower stability in the temperature range 137 °C to 177 °C.
Therefore, it may be stated that the cladding S4 appears to be more affected than the
cladding S3 by climatic exposure.
Overall, CL results suggest lower stability of the exposed bare POF samples but the
higher stability of the exposed claddings compared to their unexposed ones.
Therefore, it is possible that the core caused the lower stability of bare POFs.
Consequently, a similar mechanism as described above (see the discussion of CL of
POF samples exposed to 92 °C / 95 %RH) can be proposed, here too. However, the
main parameter that plays a role in this case is high temperature.
In recalling the optical results of POF samples S3, S4 and S5 exposed to the climate
100 °C / low humidity, it is seen that POF S5 exhibited lower optical stability
compared to POF samples S3 and S4 (see Fig.8.26 in Section 8.3.1.2). But CL
experiments to the exposed bare POF samples suggest the higher thermo-oxidative
stability of the sample S5 compared to the other samples. This may be a contradiction
to the optical results, if the optical loss is caused by only chemical changes due to
deterioration and oxidation reactions of the polymer. However, the assumption of the
transmission loss at the early stages of the exposure results by mainly physical
changes in POFs yields the higher optical stability of the sample S5 compared to the
other two POF samples (see Fig. 8.27 in Section 8.3.1.2). This result is in excellent
agreement with the CL results stated above. However, the correlation of the optical
stability with thermo-oxidative stability between the samples S3 and S4 was found
difficult to establish because they exhibited a very small difference in the thermo-
oxidative stability according to their CL emission. Nevertheless, these consequences
support two important points, that the loss of transmission occurring at the early
stages of the exposure should be caused mainly by physical changes and the optical
consistency of POFs is most likely be governed by their thermo-oxidative
degradation, under the exposure condition 100 °C / low humidity.
As the CL results show degradation in the exposed bare POFs, the transmission loss
owing to light absorption can be expected as a major part of the observed transmission
loss. However, changes due to degradation of the cladding could cause also core-
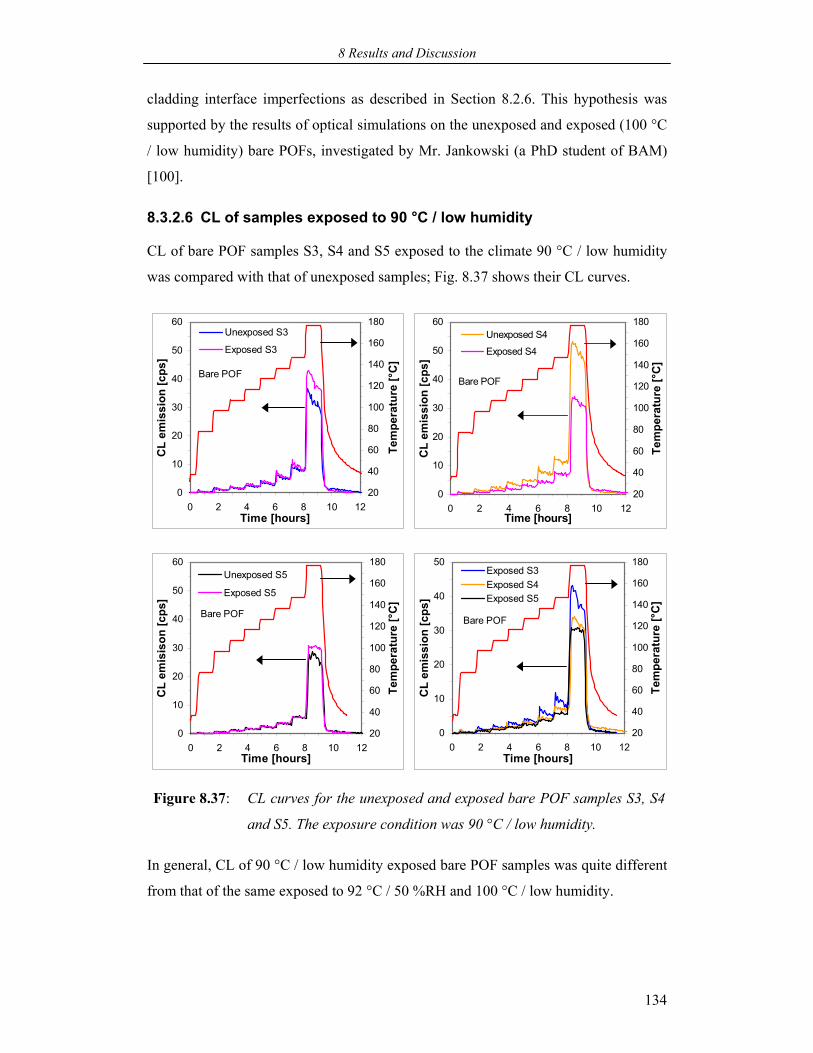
8 Results and Discussion
134
cladding interface imperfections as described in Section 8.2.6. This hypothesis was
supported by the results of optical simulations on the unexposed and exposed (100 °C
/ low humidity) bare POFs, investigated by Mr. Jankowski (a PhD student of BAM)
[100].
8.3.2.6 CL of samples exposed to 90 °C / low humidity
CL of bare POF samples S3, S4 and S5 exposed to the climate 90 °C / low humidity
was compared with that of unexposed samples; Fig. 8.37 shows their CL curves.
0
10
20
30
40
50
60
0 2 4 6 8 10 12Time [hours]
CL
emis
sion
[cps
]
20
40
60
80
100
120
140
160
180
Tem
pera
ture
[°C
]
Unexposed S3
Exposed S3
Bare POF
0
10
20
30
40
50
60
0 2 4 6 8 10 12Time [hours]
CL
emis
sion
[cps
]
20
40
60
80
100
120
140
160
180
Tem
pera
ture
[°C
]
Unexposed S4
Exposed S4
Bare POF
0
10
20
30
40
50
60
0 2 4 6 8 10 12Time [hours]
CL
emis
ison
[cps
]
20
40
60
80
100
120
140
160
180
Tem
pera
ture
[°C
]
Unexposed S5
Exposed S5
Bare POF
0
10
20
30
40
50
0 2 4 6 8 10 12Time [hours]
CL
emis
sion
[cps
]
20
40
60
80
100
120
140
160
180
Tem
pera
ture
[°C
]
Exposed S3Exposed S4Exposed S5
Bare POF
Figure 8.37: CL curves for the unexposed and exposed bare POF samples S3, S4
and S5. The exposure condition was 90 °C / low humidity.
In general, CL of 90 °C / low humidity exposed bare POF samples was quite different
from that of the same exposed to 92 °C / 50 %RH and 100 °C / low humidity.
8 Results and Discussion
135
CL of bare POF samples S3 and S5 was found to be similar as they delivered almost
equal emission implying equal stability but higher emission in the temperature range
147 °C to 177 °C suggesting its lower stability (see Fig. 8.37). While the sample S4
displayed a decrease in CL emission suggesting its increased stability compared to the
unexposed sample as a result of climatic exposure (see Fig. 8.37).
The decrease of the CL emission may be explained in two ways.
(A): It could result from a decrease of the concentration of one or more participating
reactants of the oxidation process. The participating reactants most likely are pre-
dissolved oxygen and low molecular weight species like monomer present in the
polymer. These reactants appear to be substantially consumed in the oxidation process
during the course of climatic exposure. The spreading of the degradation process from
these preceding steps to polymer molecules seems to be only thermally activated, as
the content of pre-dissolved oxygen had already consumed. However, the exposure
temperature was relatively low (90 °C) by which the thermally activated degradation
is very less likely to occur. Consequently, in parallel, the oxidative degradation of the
polymer could slowly begin to take place with the availability of new oxygen, but it
appears to be needed a longer period than the present exposure time (see Fig. 8.28 in
Section 8.3.1.2) for oxygen to effectively reach the polymer.
(B): Another possible explanation could be the taking place of crosslinking of
polymer chains could lead to a slow rate of oxidative degradation by hindering the
diffusion rate of oxygen. This process appears to be dominating in the whole exposure
time resulting in a very less oxidation of the polymer as indicated by CL with respect
to lower emission.
In either case, the exposure time seemed to be not long enough to oxidize polymer
molecules, as the sample S4 exhibited the lower CL emission. But it appears to be just
enough for the sample S3 and S5, as they demonstrated higher CL emission in the
temperature range 147 to 177 °C (see Fig. 8.37).
In some cases, stabilization effects of oxygen are discussed for the oxidative
degradation of PMMA with respect to weight loss [94]. Therefore, it is also possible
that oxygen could induce such effects in POFs during the climatic exposure. As a
result, a decrease of the CL emission from the exposed samples (S4) may be the case.
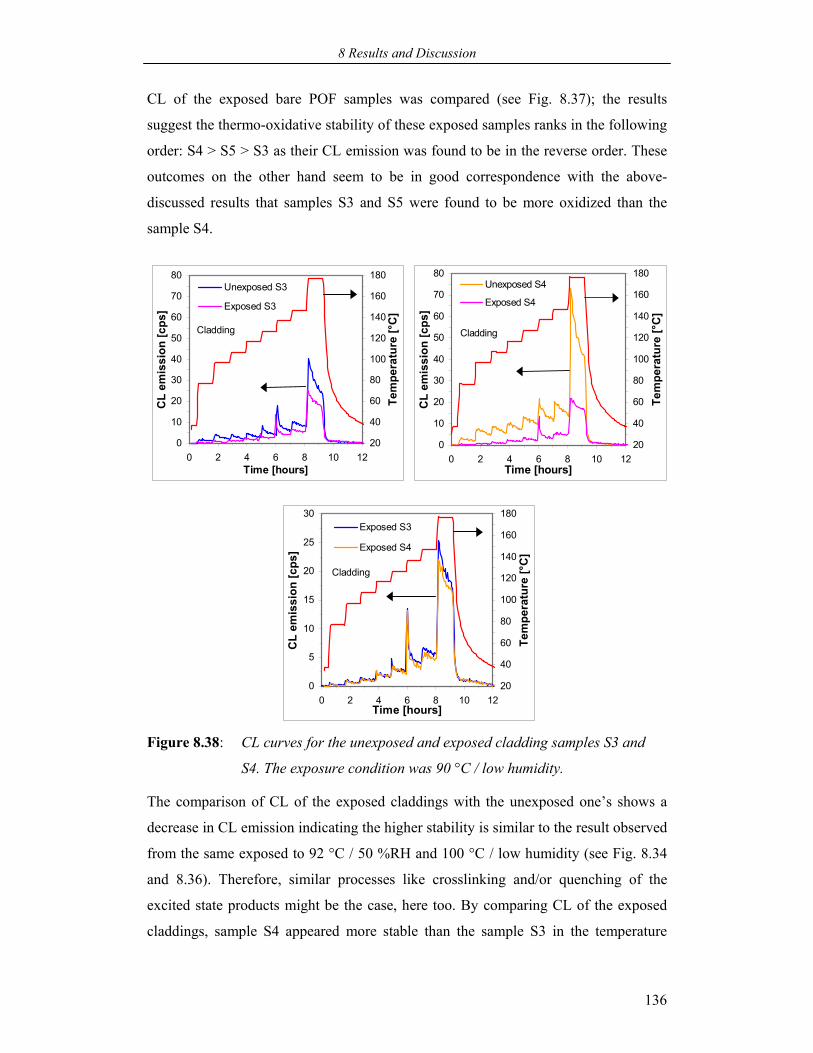
8 Results and Discussion
136
CL of the exposed bare POF samples was compared (see Fig. 8.37); the results
suggest the thermo-oxidative stability of these exposed samples ranks in the following
order: S4 > S5 > S3 as their CL emission was found to be in the reverse order. These
outcomes on the other hand seem to be in good correspondence with the above-
discussed results that samples S3 and S5 were found to be more oxidized than the
sample S4.
0
10
20
30
40
50
60
70
80
0 2 4 6 8 10 12Time [hours]
CL
emis
sion
[cps
]
20
40
60
80
100
120
140
160
180
Tem
pera
ture
[°C
]
Unexposed S3
Exposed S3
Cladding
0
10
20
30
40
50
60
70
80
0 2 4 6 8 10 12Time [hours]
CL
emis
sion
[cps
]
20
40
60
80
100
120
140
160
180
Tem
pera
ture
[°C
]
Unexposed S4
Exposed S4
Cladding
0
5
10
15
20
25
30
0 2 4 6 8 10 12Time [hours]
CL
emis
sion
[cps
]
20
40
60
80
100
120
140
160
180Te
mpe
ratu
re [°
C]
Exposed S3
Exposed S4
Cladding
Figure 8.38: CL curves for the unexposed and exposed cladding samples S3 and
S4. The exposure condition was 90 °C / low humidity.
The comparison of CL of the exposed claddings with the unexposed one’s shows a
decrease in CL emission indicating the higher stability is similar to the result observed
from the same exposed to 92 °C / 50 %RH and 100 °C / low humidity (see Fig. 8.34
and 8.36). Therefore, similar processes like crosslinking and/or quenching of the
excited state products might be the case, here too. By comparing CL of the exposed
claddings, sample S4 appeared more stable than the sample S3 in the temperature
8 Results and Discussion
137
range 127 °C to 177 °C (see Fig. 8.38). Therefore, it may be claimed that the cladding
S3 was more susceptible than the cladding S4 to degradation by climatic exposure.
CL of the exposed bare POFs and claddings show as a similar consequence an
increase of the stability due to climatic exposure. However, it is seen from CL of
samples exposed to 92 °C / 50 %RH and 100 °C / low humidity that, though claddings
exhibited an increased stability, bare POFs displayed lower stability, indicating the
cause mainly by the core. With this knowledge, it can be here claimed that the
observed increase or decrease of the stability of POFs causing mainly by the core.
In comparing the optical stability with thermo-oxidative stability of bare POFs, the
results are seemed to be in good agreement. However, coming to the point of loss
mechanism, it is believed that the thermal-oxidation of POFs mainly causes the
absorption loss. But it is seen that the increased thermo-oxidative stability of POFs as
a consequence of climatic exposure could result by the (possible) mechanisms
discussed above. Therefore, in view of the two proposed mechanisms, it appears that
degradation products from the decomposition of low molecular weight species like
monomer and crosslinking as well could increase the optical loss by significant light
absorption.
8.3.2.7 Summary
From these results and the discussion the following may be summarized:
The thermo-oxidative stability of POFs exposed to the climate 92 °C / 50 %RH
and 100 °C / low humidity was found to be lower than that of unexposed one’s
indicating the occurrence of degradation.
The thermo-oxidative stability of POF S4 exposed to the climate 90 °C / low
humidity was found higher than that of the unexposed one indicating some
stabilization effects by climatic exposure.
All the exposed claddings exhibited a consistent result higher stability compared
to the unexposed ones owing to climatic exposure.
The optical transmission stability of POFs seemed to be mainly governed by their
thermo-oxidative stability.
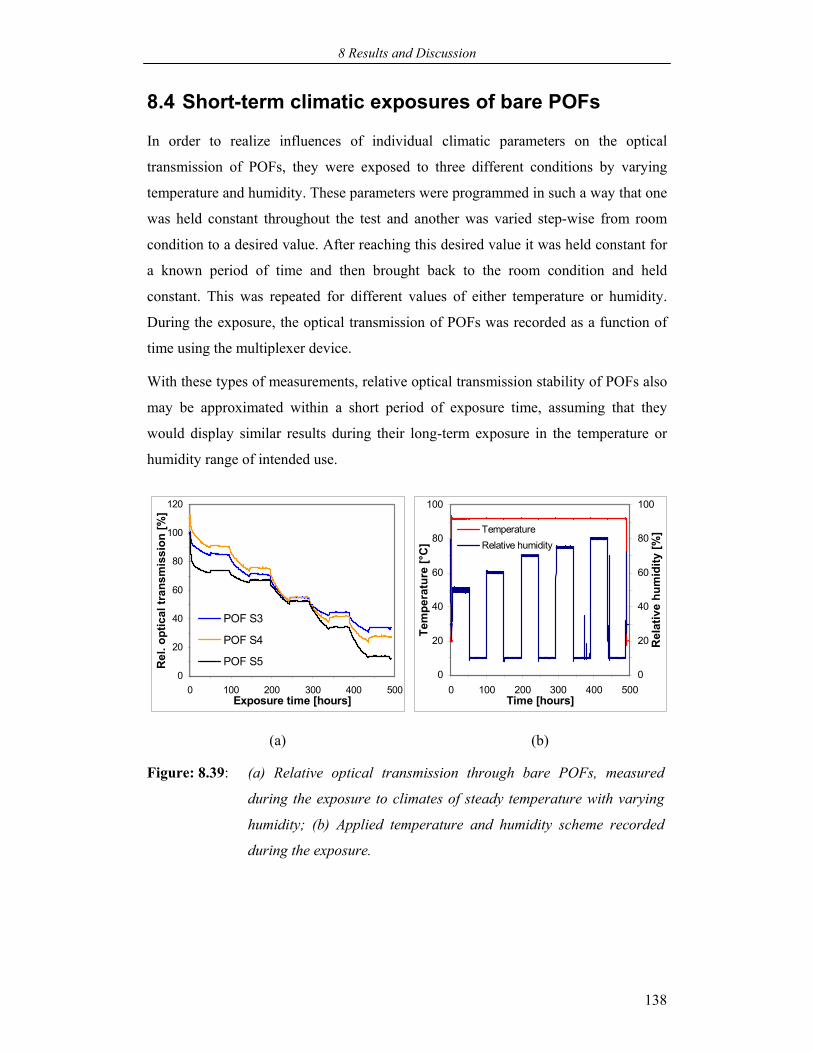
8 Results and Discussion
138
8.4 Short-term climatic exposures of bare POFs
In order to realize influences of individual climatic parameters on the optical
transmission of POFs, they were exposed to three different conditions by varying
temperature and humidity. These parameters were programmed in such a way that one
was held constant throughout the test and another was varied step-wise from room
condition to a desired value. After reaching this desired value it was held constant for
a known period of time and then brought back to the room condition and held
constant. This was repeated for different values of either temperature or humidity.
During the exposure, the optical transmission of POFs was recorded as a function of
time using the multiplexer device.
With these types of measurements, relative optical transmission stability of POFs also
may be approximated within a short period of exposure time, assuming that they
would display similar results during their long-term exposure in the temperature or
humidity range of intended use.
0
20
40
60
80
100
120
0 100 200 300 400 500Exposure time [hours]
Rel
. opt
ical
tran
smis
sion
[%]
POF S3
POF S4
POF S50
20
40
60
80
100
0 100 200 300 400 500Time [hours]
Tem
pera
ture
[°C
]
0
20
40
60
80
100
Rel
ativ
e hu
mid
ity [%
]TemperatureRelative humidity
(a) (b)
Figure: 8.39: (a) Relative optical transmission through bare POFs, measured
during the exposure to climates of steady temperature with varying
humidity; (b) Applied temperature and humidity scheme recorded
during the exposure.
8 Results and Discussion
139
POFs were exposed to various levels of humidity from 50 %RH up to 80 %RH with a
stationary temperature of 92 °C, the optical results are as shown Fig. 8.39a. The
applied program of temperature and humidity was as shown in Fig. 8.39b. It was
actually recorded during the exposure, with the help of an in-built software of climatic
chamber.
The experiments demonstrate that the optical transmission stability of POFs under
high temperature with humidity condition would follow the extent of imposed
humidity. Small reversible and large irreversible transmission changes can be seen
(see Fig. 8.39a). The reversible changes of the transmission happened when the
humidity turned to its lowest value and was followed by a constant transmission when
the humidity stayed at this low value. The irreversible change of the transmission
could be caused by both physical and chemical structural changes of POFs, some of
them are discussed in the earlier Section 8.3.1. However, a reversible increase of the
transmission after brought down the humidity to as low as 10 %RH (temperature was
always 92 °C), suggests the evaporation (desorption) of physically absorbed water
from the polymer. This water could be situated either in the core-cladding interface or
in the polymer. In any case, it indicates that physically absorbed water in POFs
reduces the transmission to a certain extent with the ability to recover.
The experimental results, at the first glance, do not seem to match the observed
transmission results of long-term exposure of POFs. For instance, the optical
transmission stability of POFs was found to be in the order of S5 > S3 > S4 (optical
results of the long-term exposure of POFs to 92 °C / 50 %RH, see Section 8.3.1.1).
But short-term exposure test under similar condition POFs displayed the opposite
results. However, by careful observation of the transmission loss behavior, the results
appeared to be in the similar order. The transmission loss displayed by the sample S5
was found to be constant, whereas the samples S3 and S4 demonstrated to be
decreasing at the end of the humidity stress (Fig. 8.39a). If the extrapolation is made
by assuming the transmission variation following the end point, the transmission
stability appears to be in the order as found in the results of long-term exposure to
92 °C / 50 %RH. However, the loss exhibited at the initial stages of the short-term
exposure was different from the long-term exposure, which could be due to sampling
history of POFs before exposing to stresses in the climatic chamber.
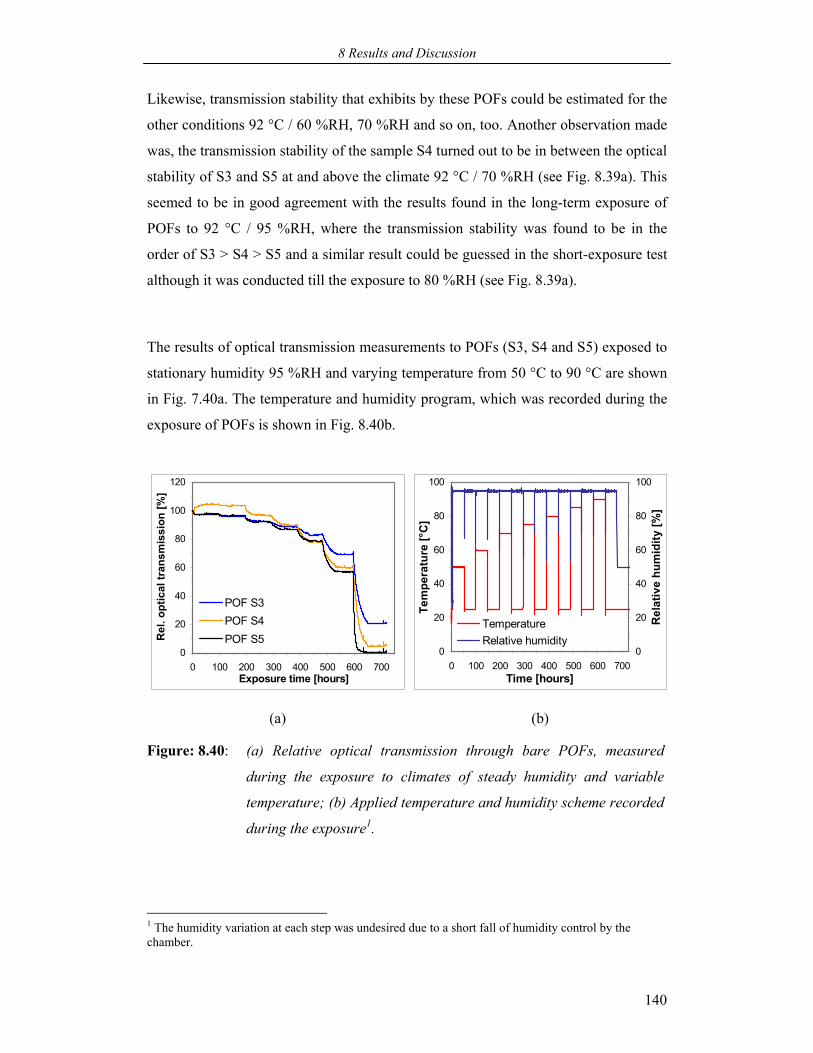
8 Results and Discussion
140
Likewise, transmission stability that exhibits by these POFs could be estimated for the
other conditions 92 °C / 60 %RH, 70 %RH and so on, too. Another observation made
was, the transmission stability of the sample S4 turned out to be in between the optical
stability of S3 and S5 at and above the climate 92 °C / 70 %RH (see Fig. 8.39a). This
seemed to be in good agreement with the results found in the long-term exposure of
POFs to 92 °C / 95 %RH, where the transmission stability was found to be in the
order of S3 > S4 > S5 and a similar result could be guessed in the short-exposure test
although it was conducted till the exposure to 80 %RH (see Fig. 8.39a).
The results of optical transmission measurements to POFs (S3, S4 and S5) exposed to
stationary humidity 95 %RH and varying temperature from 50 °C to 90 °C are shown
in Fig. 7.40a. The temperature and humidity program, which was recorded during the
exposure of POFs is shown in Fig. 8.40b.
1 The humidity variation at each step was undesired due to a short fall of humidity control by the chamber.
0
20
40
60
80
100
120
0 100 200 300 400 500 600 700Exposure time [hours]
Rel
. opt
ical
tran
smis
sion
[%]
POF S3POF S4POF S5
0
20
40
60
80
100
0 100 200 300 400 500 600 700Time [hours]
Tem
pera
ture
[°C
]
0
20
40
60
80
100
Rel
ativ
e hu
mid
ity [%
]
TemperatureRelative humidity
(a) (b)
Figure: 8.40: (a) Relative optical transmission through bare POFs, measured
during the exposure to climates of steady humidity and variable
temperature; (b) Applied temperature and humidity scheme recorded
during the exposure1.
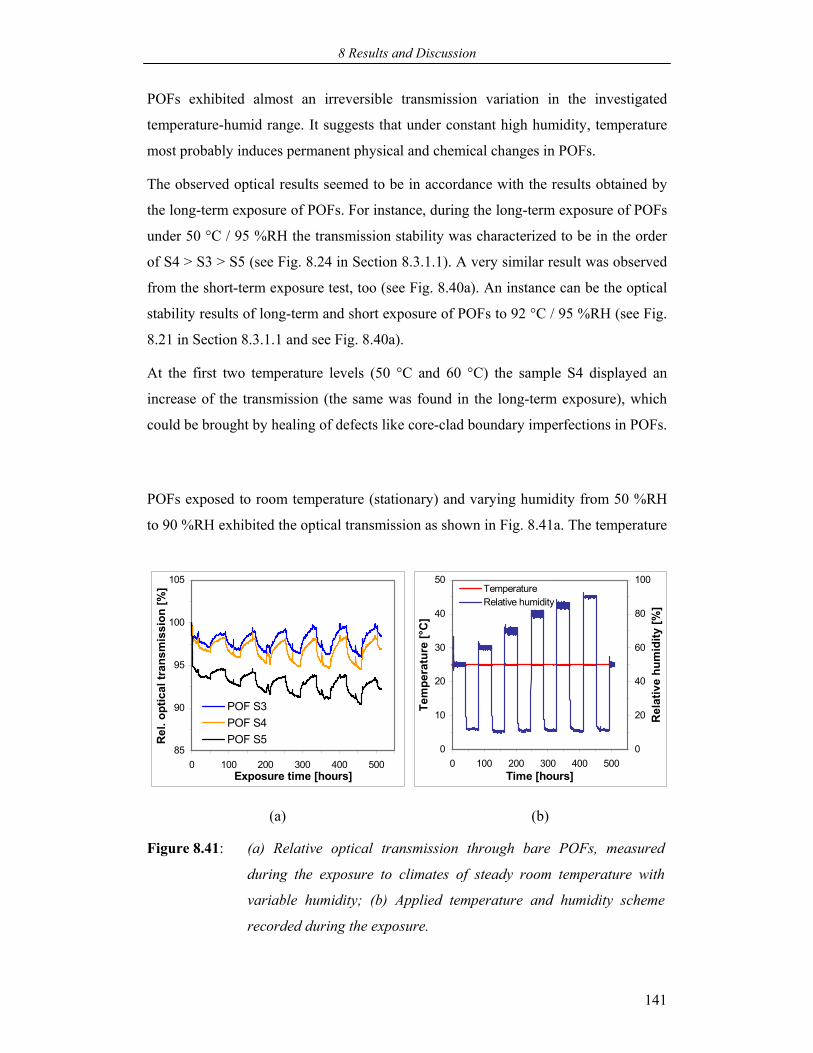
8 Results and Discussion
141
POFs exhibited almost an irreversible transmission variation in the investigated
temperature-humid range. It suggests that under constant high humidity, temperature
most probably induces permanent physical and chemical changes in POFs.
The observed optical results seemed to be in accordance with the results obtained by
the long-term exposure of POFs. For instance, during the long-term exposure of POFs
under 50 °C / 95 %RH the transmission stability was characterized to be in the order
of S4 > S3 > S5 (see Fig. 8.24 in Section 8.3.1.1). A very similar result was observed
from the short-term exposure test, too (see Fig. 8.40a). An instance can be the optical
stability results of long-term and short exposure of POFs to 92 °C / 95 %RH (see Fig.
8.21 in Section 8.3.1.1 and see Fig. 8.40a).
At the first two temperature levels (50 °C and 60 °C) the sample S4 displayed an
increase of the transmission (the same was found in the long-term exposure), which
could be brought by healing of defects like core-clad boundary imperfections in POFs.
POFs exposed to room temperature (stationary) and varying humidity from 50 %RH
to 90 %RH exhibited the optical transmission as shown in Fig. 8.41a. The temperature
85
90
95
100
105
0 100 200 300 400 500Exposure time [hours]
Rel
. opt
ical
tran
smis
sion
[%]
POF S3POF S4POF S5
0
10
20
30
40
50
0 100 200 300 400 500Time [hours]
Tem
pera
ture
[°C
]
0
20
40
60
80
100
Rel
ativ
e hu
mid
ity [%
]
TemperatureRelative humidity
(a) (b)
Figure 8.41: (a) Relative optical transmission through bare POFs, measured
during the exposure to climates of steady room temperature with
variable humidity; (b) Applied temperature and humidity scheme
recorded during the exposure.
8 Results and Discussion
142
and humidity plan was as shown in Fig. 8.41b.
Consequences show that at room temperature condition the optical transmission
stability of POFs mainly derives from the degree of water absorption. It appears
mostly as a physical absorption because POFs exhibited almost an equal comeback of
the transmission from the point where the humidity reduced to as low as 10 %RH (see
7.39a). The rate of transmission loss seemed to depend on humidity imposed on
POFs. Furthermore, the results suggest that the rate of water absorption by POFs
highly depends on the chemical composition of the cladding as the sample S5
appeared to show more transmission loss than the other two samples.
With this short-term exposure test, the optical transmission stability of POFs could be
estimated as follows, the sample S5 exhibited lower stability than the other two
samples S3 and S4 in the investigated temperature-humid conditions.
Although the short-term exposure tests were emerged as reasonable for approximating
the relative optical transmission stability of POFs, the absolute finding (in a short
exposure period) of the optical transmission stability is very difficult since the optical
transmission of POFs depends on several parameters, which could influence the
optical transmission stability to a different extent during the exposure.
9 Conclusions and Outlook
143
9 Conclusions and Outlook
The present PhD work has performed the experimental work in the direction of the
climatic reliability of POFs for long-term applications. Most of the interest has been
paid to mechanisms involved in the loss of optical transmission due to climatic
exposures. Also, an effort has been put to explore sensitive analytical methods such as
chemilumnescence (CL) for the investigation of degradation in POFs.
In the contemporary work step-index, multimode and poly(methyl methacrylate)
(PMMA) based POFs were utilized as a model. The optical performance of three
POFs under seven different temperature and humid climates was investigated. With
the help of the known loss mechanisms, the causes for a loss of transmission due to
climatic exposures were researched by means of analytical methods such as CL and
Fourier transform infrared (FTIR) spectroscopy. As a new effort, influences of
climatic parameters on individual POF components bare POF (core with clad only),
cladding and core were studied. By employing CL, the thermo-oxidative stability of
individual components was modeled.
With the experiments, results and discussion of the present work, the following are
summarized as conclusions:
One fundamental requirement for carrying out the experiments, to encounter the
difficulty in receiving the individual POF components (core and cladding) from
manufacturers, was resolved by a solvent method found, as the best way of
9 Conclusions and Outlook
144
extracting the cladding and core for the chemical analysis. It is assumed that the
solvent does not significantly affect the polymer due to the separation process.
Because all the investigated samples were separated in similar conditions, possible
residual influences of this effect on the results should be neglectable. Therefore
obtained results are at least comparable.
As a primary task, the unexposed components of POFs were investigated for their
physical constants and chemical compositions. The glass transition temperature
(Tg) of the fiber core, produced from PMMA, was found higher than that of the
normal amorphous PMMA polymer suggesting an orientation influence of
polymer chains. Cladding samples were found to exhibit both Tg and melting
temperature (Tm), indicating both amorphous and crystalline polymers as cladding
materials.
With molecular weight findings, no considerable difference between POF cores
was found though they were received from different manufacturers.
Chemical compositions investigations revealed similar core material, PMMA, but
three different chemical sorts of cladding material: polyfluoroolefins,
poly(fluoroalkyl acrylates) (PFA) and poly(fluoroalkyl methacrylates) (PFMA).
Therefore, POFs can be distinguished by cladding materials but not by the core.
The climatic exposure (92 °C / 95 %RH) of two POF cables (core, cladding and
jacket) showed a different optical performance although both had the same core
material PMMA. It suggests that the optical performance of POFs is not only
confined to the core material. The transmission performance behavior of both the
samples was correlated with physical and chemical changes of POFs. Physical
changes (e.g.: fiber diameter fluctuations and refractive index variations) appear to
cause loss of transmission at the early stages and chemical changes due to mainly
thermo-oxidative degradation to cause loss in the later stages of the exposure.
CL investigation of the relative thermo-oxidative stability of the unexposed bare
POFs revealed a difference in their stability. Because investigations of their
cladding samples found a similar result it is confirmed that differences in cladding
materials were responsible for the observed difference in thermo-oxidative
stability of bare POFs, an important practical result. CL investigations of the
exposed bare POFs and claddings revealed clearly degradation in both the
9 Conclusions and Outlook
145
samples. Their relative degradation was according to the stability of the
unexposed samples. These results show the consistency of the CL method.
The occurrence of degradation more in the cladding and less in the core was
confirmed by complementary methods FTIR, TG, UV/visible transmittance and
GPC. The observed loss of transmission was correlated with increased light
absorption and imperfections at the core-cladding interface, mainly due to
degradation of the cladding. The imperfections were most likely arising due to
substantial decrease in the adhesion strength of the cladding as a result of
degradation. Therefore, it can be stated that the optical transmission stability of
POFs is mainly governed by their thermo-oxidative stability (largely of the
cladding).
Three bare POFs (core with cladding only) were exposed to seven different
combinations of temperature and humidity. The optical performance of these
POFs was different and poor under 92 °C / 95 %RH, 100 °C / low humidity, 110
°C / low humidity and 120 °C / low humidity, mainly according to the chemical
nature of their claddings. Hence, the role of cladding is realized for their
responsibility for long-term optical stability. However, in searching causes for the
loss of transmission at the early stages of exposures, physical changes due to high
temperature and high humidity were found, e.g.: volume expansion (believed to
cause core-cladding boundary imperfections).
The bare POFs exposed 50 °C / 95 %RH, 90 °C / 50 %RH, 90 °C / low humidity
displayed better optical stability compared to other exposures. At the early stages,
some small changes in the transmission were observed and are related to physical
changes. The changes at the later stages of exposures are related chemical
changes, mainly thermo-oxidative degradation of POFs.
Using CL, for the first time, the relative thermo-oxidative stability of bare POF,
core and cladding was investigated. It was found that the cladding was more prone
to the oxidative degradation (than the core) and the stability of the bare POF was
mainly depending on the stability of the cladding. Further on a difference in the
thermo-oxidative stability of the three bare POFs was found, mainly due to
claddings as confirmed by CL experiments to core and claddings.
9 Conclusions and Outlook
146
The degradation detection in bare POFs exposed to 90 °C / 50 %RH, 100 °C / low
humidity and 90 °C / low humidity indicated a higher CL emission than for the
unexposed samples. But, in contrary CL of the exposed claddings showed a
decrease in the CL emission compared to the unexposed ones. Therefore, reactions
like crosslinking or stable oxidized molecules or less oxidation are proposed to
take place as a result of oxidation. Causes for the observed loss of transmission
seemed to arise by increased light absorption in the core owing to degradation but
also in the cladding. This degradation may induce imperfections (e.g.: core-
cladding interface) and/or inhomogeneities (e.g.: refractive index variations).
The hypothesis of the formation of such imperfections was supported by the PhD
work of Mr. Jankowski (BAM), who found by optical simulations an increased
attenuation mainly due to core-clad interface imperfections in the exposed POFs
(100 °C / low humidity).
Some short-term exposure tests to realize the transmission reversibility by
temperature and humidity effects on bare POFs were performed by varying one
parameter and leaving other constant. POFs displayed reversible transmission
changes due to physically absorbed water. Temperature effects were found to be
irreversible indicating permanent changes in POFs. With these types of
measurements, reasonable results in predicting long-term optical stability of POFs
were obtained.
CL was found to be sensitive method for detecting small degradation of POFs,
which could not be detected by a method like FTIR. Therefore, it can be
recommended as a possible sensitive tool to test the thermo-oxidative stability of
POFs.
Up to now climatic exposure effects on POF core and POF cladding are researched to
some extent. The causes for the loss of transmission due to climatic exposures are
investigated to some scope. However, further research activities can be planned in the
direction of the following:
9 Conclusions and Outlook
147
Mechanisms proposed for the loss of transmission are proved to some level and
therefore can be taken as basis for further research.
The general extent of the contribution of each loss factor (e.g.: absorption and
scattering) to the total attenuation of POFs is overlooked in this work and
therefore it further should be studied more in detail.
By knowing more of the chemical compositions of claddings, their chemical
degradation mechanism can be refined.
A better understanding of the interaction between jacket materials and thermo-
oxidative stability of the core and the cladding will improve the aging forecast.
The until-now neglected mechanical constraints on the oxidative stability and
thereby optical stability of POFs can be included.
References
148
References
[1] Ghatak, A.K., and Shenoy, M.R. (Editors), Fiber Optics Through Experiments,
Viva Books Private Ltd., New Delhi, 1994.
[2] Dutton, H.R., Understanding Optical Communications, IBM International
Technical Support Organization, USA, 1st Edition, 1998.
[3] Daum, W., Krauser, J., Zamzow, P.E., and Ziemann, O., POF-Polymer Optical
Fibers for Data Communication, Springer-Verlag, Berlin Heidelberg, ISBN 3-
540-42009-6, 2002.
[4] Emslie, C., J. Materials Sci., 23, 1988, pp. 2281-2293.
[5] Kaino, T., Polymer Optical Fibers - Polymers for Lightwave and Integrated
Optics, Editor: Hornak, L.A., Marcel Dekker, Inc., New York, ISBN 0-8247-
8697-1, 1992, pp. 1-38.
[6] Groh, W., Macromolecular Chemistry, 189, 1988, pp. 2861-2874.
[7] Zubia, J., Arrue, J., Optical Fiber Technology, 7, 2001, pp. 101-140.
[8] Koike, Y., Ishigure, T., IEICE Trans. Electron. E82-C, 8, 1999, pp. 1553-1559.
[9] Onishi, T., Murofushi, H., Watanabe, Y., Takano, Y., Yoshida, R., Naritomi, M.,
Proceedings of the Polymer Optical Fibers (POF) Conference, 1998, pp. 39-42.
[10] Hulme-Lowe, A., Stacey, N., Polymer Glasses: Ultratransparency,
Encyclopedia of Materials, Editors: Buschow, K.H.J., Chan, R.W., Flemings,
References
149
M.C., Ilschner, B., Mahajan, S., Elsvier Scientific Publishing Co., Amsterdam,
2001, pp. 7351-7354.
[11] Weinert, A., Plastic Optical Fibers: Principles, Components, Installations,
Publicis MCD Verlag, ISBN 3-89578-135-5, 1999.
[12] Ohtsuka, Y., Koike, Y., Yamazaki, H., Applied Optics, 20, 280, 1981, pp. 2319.
[13] Koike, Y., Nihei, E., Tanio, N., Ohtsuka, Y., Applied Optics, 29, 18, 1990, pp.
2686-2691.
[14] Koike, Y., Graded index materials and components - Polymers for Lightwave
and Integrated Optics, Editor: Hornak, L.A., Marcel Dekker, Inc., New York,
ISBN 0-8247-8697-1, 1992, pp. 71-104.
[15] Murofushi, H., Proceedings of the POF Conference, 1996, pp. 17-23.
[16] Blyler, Jr., L.L., Ronaghan, C.A., Koeppen, C.S., Salamon, T., Proceedings of
the POF Conference, 1997, pp. 42-43.
[17] Duijnhoven, F.G.H., Gradient refractive index polymers produced in a
centrifugal field: preparation, characterization and properties, Technical
University, Eindhoven, The Netherlands, ISBN 90-386-2581-2, 1999.
[18] Takahashi, H., Kanazawa, T., Proceedings of the POF Conference, 1998, pp. 50-
54.
[19] Jaquet, P., SPIE, Plastic Optical Fibers, 1592, 1991, pp. 165-171.
[20] Thesis, J., Brockmeyer, A., Groh, W., Stehlin, T.F., Polymer optical fibers in
data communications and sensors applications - Polymers for lightwave and
integrated optics, Editor: Hornak, L.A., Marcel Dekker, Inc., New York, ISBN
0-8247-8697-1, 1992, pp. 39-70.
[21] Chu, P.L., Peng, G.D., Proceedings of the POF Conference, 1997, pp. 76-77.
[22] Rousseau, A., Boutevin, B., Bosc, D., Proceedings of the POF Conference,
1992, pp. 33-37.
[23] Imai, H., Proceedings of the POF Conference, 1997, pp. 25-26.
References
150
[24] Sakane, Y., Ono, M., Sato, H., Yabumoto, H., Kuwana, Y., Matsukura, I.,
Kobayashi, J., Kawakami, N., Hikita, M., Yamamoto, F. Proceedings of the
POF Conference, 2003, pp. 187-190.
[25] Okamoto, Y., Yang, Y., Mikes, F., Koike, Y., Proceedings of the POF
Conference, 2003, pp. 204-207.
[26] Flipsen, T., Design, synthesis and properties of new materials based on densely
cross-linked polymers for POF and amplifier applications, University of
Groningen, The Netherlands, ISBN 90-367-1206-8, 2000.
[27] Ishiharada, M., Kaneda, H., Chikaraishi, T., Tomita, S., Tanima, I., Naito, K.,
Proceedings of the POF Conference, 1992, pp. 38-42.
[28] Stickler, M., Rhein, T., Polymethacrylates, Ullamann’s Encyclopedia of
Industrial Chemistry, Editors: Elvers, B., Hawkins, S., G. Schultz, 5th Edition,
VCH Publishers, Inc., A.21, 1992.
[29] Van Krevelen, D.W., and Hoftyzer, P.J., Properties of Polymers, 2nd Edition,
Elsvier Scientific Publishing Co., Amsterdam, ISBN 0-444-41467-3, 1976.
[30] Odian, G., Principles of Polymerization, 3rd Edition, John Wiley and Sons, Inc.,
New York, ISBN 0-47161-0208, 1991.
[31] Wunderlich, W., Physical Constants of PMMA, Polymer Handbook, Editors:
Brandrup, J., Immergut, E.H., 3rd Edition, John Wiley and Sons, Inc., 1989.
[32] Kaino, T., J. Polymer Sci., Part A, 25, 1987, pp. 37-46.
[33] Koike, Y., Ishigure, T., Nehei, J. Lightwave Technology, 13, 1995, pp. 1475-
1489.
[34] Baran, A.M., Levin, V.M., Radushkevich, B.V., Tarasova, T.D., Proceedings of
the POF Conference, 1995, pp. 86-91.
[35] http://www.sigmaaldrich.com/img/assets/3900/Fluoromonomers_and_fluoropoly
mers_for_optapp.pdf
[36] Schleinitz, H.M., Stephan, P.G., US Patent, # 4,161,500, 1979.
[37] Kaino, T., Fujiki, M., Shigeo, N., Oikawa, S., US Patent, # 4,381,269, 1983.
References
151
[38] Hulme-Lowe, A.G., Doods, A.S., Babirad, S.A., Savu, P.M., US Patent,
# 4,968,116, 1990.
[39] Savu, P.M., McAllister, J.W., US Patent, # 5,148,511, 1992.
[40] Nakamura, K., Okumura, J., Irie, K., Muro, M., Kamo, J., Shimada, K., US
Patent, # 5,963,701, 1999.
[41] Ballato, J., Smith, D., Ellison, M., Gregory, R., National Textile Center Annual
Report, Clemson University, USA, 2001.
[42] Takezewa, Y., Tanno, S., Taketani, N., Ohara, S., Asano, H., J. Applied Polymer
Sci., 42, 1991, pp. 2811-2817.
[43] Groh, W., Kudler, J.E., Thesis, J., SPIE-Plastic Optical Fiber, 1592, 1991, pp.
20-30.
[44] Banwell, C.N., and McCash, E.M., Fundamentals of Molecular Spectroscopy, 4th
Edition, Tata McGraw-Hill Publishing Co. Ltd., New Delhi, ISBN 0-07-462025-
8, 1995.
[45] Kurik, M.V., Physica Status Solidi A, 8, 1971, pp. 9-45.
[46] Judd, R.E., Crist, B., J. Polymer Sci., Polymer Lett. Edn., 18, 1980, pp. 719.
[47] Kaino, T., Applied Optics, 24, 23, 1985, pp. 4192-4195.
[48] Pierrejean, I., Dugas, J., and Maurel, G., Proceedings of the POF Conference,
1992, pp. 96-100.
[49] Dugas, J., Maurel, G., Applied Optics, 31, 24, 1992, pp. 5069-5079.
[50] Daum, W., Brockmeyer, A., Goehlich, L., Proceedings of the POF Conference,
1992, pp. 91-95.
[51] Schartel, B., Krüger, S., Wachtendorf, W., Hennecke, M., Proceedings of the
POF Conference, 1998, pp. 248-249.
[52] Schartel, B., Krüger, S., Wachtendorf, W., Hennecke, M., J. Lightwave
Technology, 17, 11, 1999, pp. 2291-2296.
[53] Irie, S., Nishiguchi, Proceedings of the POF Conference, 1994, pp. 88-91.
References
152
[54] Ziemann, O., Daum,W., Bräuer, A., Schlick, J., Frank, W., Proceedings of the
POF Conference, 2000, pp. 173-177.
[55] Schnabel, W., Polymer Degradation: Principle and Practical Applications,
Hanser Gardner, Berlin, 1981.
[56] Feller, R.L., Accelerated Aging: Photochemical and Thermal Aspects, The J.
Paul Getty Trust, USA, ISBN 0-89236-125-5, 1994.
[57] Bolland, J.L., Gee, G., Trans Faraday Soc., 42, 1946, pp. 236.
[58] Jellinek, H.H.G., Degradation of Vinyl Polymers, Academic Press Inc.
Publishers, New York, 1955.
[59] (a): Moore, W.J., Physical Chemistry, 5th Edition, Longman Group Ltd.,
London, ISBN 0-582-44234-6, 1972; (b): Crank, J. and Park, G.S., Diffusion in
Polymers, 2nd edition, Academic Press inc., New York, 1968.
[60] Startsev, O.V., Krotov, A.S., Perov, B.V., Vapirov, Y.M., Proceedings of the 4th
European Conference of Advanced Materials and Processes - EUROMAT 95, 1,
1995, pp. 245-254.
[61] Turner, D.T., Polymer, 23, 1982, pp. 197-202.
[62] Startsev, O.V., Rudnev, V.P., Perov, B.V., Polymer Degradation and Stability,
39, 1993, pp. 373-379.
[63] Ichikawa, K., Mori, T., Kitano, H., Fukuda M., and Mochizuki, A., J. Polymer
Science: Part B, 39, 2001, pp. 2175-2182.
[64] Lakowicz, J.R., Principles of Fluorescence Spectroscopy, Plenum Publishing
Corp., New York, ISBN 0-306-41285-3, 1983.
[65] Campbell, A.K., Chemiluminescence: Principles and Applications in Biology
and Medicine, Ellis Horwood Ltd., Chichester, England, ISSN 0930-3367, 1988.
[66] Ashby, G.E., J. Polymer Sci., L, 1961, pp. 99-106.
[67] Schard, M.P., Russell, C.A., J. Applied Polymer Sci., 8, 1964, pp. 985-995.
[68] Schard, M.P., Polymer Engineering and Sci., 1965, pp. 246-253.
References
153
[69] Zlatkevich, L., Luminescence Techniques in Solid-State Polymer Research,
Editor: Zlatkevich, L., Marcel Decker, Inc., New York, ISBN 0-8247-8045-
0,1989.
[70] Billingham, N.C., Then, E.T.H., Gijsman, P.J., Polymer Degradation and
Stability, 34, 1991, pp. 263-277.
[71] Blakey I., George, G.A., Macromolecules 34, 2001, pp. 1873-1880.
[72] George, G.A., Developments in Polymer Degradation-3, Editors: Grassie, N.,
Applied Science Publishers, London, 1981.
[73] Kron, A., Stenberg, B., Reitberger, T., Billingham, N.C., Polymer Degradation
and Stability, 53, 1996, pp. 119-127.
[74] Wachtendorf, V., Untersuchung thermooxidativer Veränderungen an Polymeren
durch Chemilumineszenz, Verlag Dr. Köster, Berlin, ISBN 3-89574-241-4, 1996.
[75] George, G.A., Luminescence Techniques in Solid-State Polymer Research,
Editor: Zlatkevich, L., Marcel Decker, Inc., New York, ISBN 0-8247-8045-0,
1989.
[76] Kohler, D.R., Kröhnke, C., Polymer Degradation and Stability, 62, 1998, pp.
385-393, and in the same journal, 63, 1999, pp. 165-173.
[77] Martin, J.W., Dickens, B., Waksman, D., Bentz, D.P., Byrd, W.E., Embree, E.,
Roberts, W.E., J. Applied Polymer Sci., 34, 1987, pp. 377-393
[78] Günther, B., Czepluch, W., Mäder, K., Zedler, S., Proceedings of the POF
Conference, 2000, pp. 209-213.
[79] Wachtendorf, V., Jansen, K., Schulz, U., Tjandraatmadja, G., 9th Intl. Conf. on
Durability of Building and Construction Materials, Australia, 2002, pp. 239-249.
[80] Gijsman, P., Verdun, F., Polymer Degradation and Stability, 74, 2001, pp. 533-
542.
[81] Smith, A.L., Applied Infrared Spectroscopy - Chemical Analysis 54, Editors:
Elving, P.J., Winefordner, J.D., John Wiley & Sons Inc., New York, ISBN 0-
471-04378-8, 1979.
References
154
[82] Bodor, G., Structural Investigation of Polymers, Editors: Hodgkinson, J., Ellis
Horwood Ltd., Chichester, England, ISBN 0-13-852989-2, 1991.
[83] Buckles, J.M., Garay, J.C., Kaufmann, D.J., Layson, A.R., Columbia, M.R., The
Chemical Educator, (Springer-Verlag New York Inc.), 3, 3, 1998, pp. 1-11.
[84] Bellammy, L.J., The Infrared Spectra of Complex Molecules, 2nd Edition,
Methuen & Co. Ltd., London, 1958.
[85] Ciardelli, F., Aglietto, M., Montagnini di Mirabello, L., Passaglia, E.,
Giancristoforo, S., Castelvetro, V., Ruggeri, G., Progress in Organic Coatings,
32, 1197, pp. 43-50.
[86] Rychly, J., M-Rychla, L., Lanska, B., Polymer Degradation and Stability, 72,
2001, pp. 249-258.
[87] Schartel, B., Hennecke, M., Polymer Degradation and Stability, 67, 2000, pp.
249-253.
[88] Strlic, M., Kolar, J., Pihlar, B., Rychly, J., M- Rychla, L., Polymer Degradation
and Stability, 72, 2001, pp. 157-162.
[89] Broska, R., M-Rychla, L., Rychly, J., Mendenhall G.D., J. Photochemistry and
Photobiology A: Chem., 109, 1997, pp. 101-107.
[90] Pauly, S., Permeability and Diffusion Data – Polymer Handbook, Editors:
Brandrup, J., Immergut, E.H., 3rd Edition, John Wiley and Sons, Inc., 1989.
[91] Holland, B.J., Hay, J.N., Polymer, 42, 2001, pp. 4825-4835.
[92] Forsythe, J.S., Hill, D.J.T., Progress in Polymer Science, 25, 2000, pp. 101-136.
[93] Nasef, M.M., Dhalan, K.Z.M., Nuclear Instruments and Methods in Physics
Research (NIM) B, 201, 2003, pp. 604-614.
[94] Hirata, T., Kashiwagi, T., Brown, Macromolecules, 18, 1985, pp.1410-1418.
[95] Manring, L.E., Macromolecules, 22, 1989, pp. 2673-2677.
[96] Kang, E-S., Bae, J.Y., Bae, B-S., J. Sol-Gel Sci. & Tech. 26, 2003, pp 981-984.
[97] Jewell, J.M., J. Non-crystalline Solids, 146, 1992, pp 145-153.
References
155
[98] Rychly, J., M- Rychla, L., Jurcak, D., Polymer Degradation and Stability, 68,
2000, pp 239-246.
[99] Ahlblad, G., Reitberger, T., Terselius, B., Stenberg, B., Polymer Degradation
and Stability, 65, 1999, pp 179-184.
[100] Jankowski, L., Bunge, C-A., Zubia, J., Appajaiah, A., Proceedings of the POF
Conference, 2003, pp. 148-151.


![Presentación de PowerPoint€¦ · Extraction of cellulose and preparation of nanocellulose from sisal fibers. Cellulose, 15(1), 149-159 [3] Parkinson, J., & Gordon, R. (1999). Beyond](https://img.pdfslide.org/doc/110x75/5ec146897f1c2706171eedd8/presentacin-de-powerpoint-extraction-of-cellulose-and-preparation-of-nanocellulose.jpg)