Embed Size (px)
Citation preview
Determination of the complex refractive index of powder phosphors
ANASTASIIA SOLODOVNYK,1,2,3,5 DANIEL RIEDEL,2,6 BENJAMIN LIPOVŠEK,4,7 ANDRES OSVET,2 JESSICA GAST,1 EDDA STERN,1 KAREN FORBERICH,2 MIROSLAW BATENTSCHUK,2 JANEZ KRČ,4 MARKO TOPIČ,4 AND CHRISTOPH J. BRABEC
1,2,3
1Bavarian Center for Applied Energy Research (ZAE Bayern), Immerwahrstr. 2, 91058 Erlangen, Germany 2Institute of Materials for Electronics and Energy Technology (i-MEET), Friedrich-Alexander-Universität Erlangen-Nürnberg (FAU), Martensstr. 7, 91058 Erlangen, Germany 3Erlangen Graduate School in Advanced Optical Technologies (SAOT), FAU, Paul-Gordan-Str. 6, 91052 Erlangen, Germany 4University of Ljubljana, Faculty of Electrical Engineering, Tržaška 25, 1000 Ljubljana, Slovenia [email protected] [email protected] [email protected]
Abstract: We demonstrate a novel 2-step method to precisely determine both n and k of phosphors, luminescent inorganic particles, in the visible spectrum. To measure n we modified the Becke Line immersion method and verified its applicability in the absorption/ emission regions of phosphor particles (step 1). Particles were then embedded into a transparent binder and coated in thick layers (100-500 µm) on glass. Absorptance of the layers was measured with a novel approach: spectral angular resolved measurements. This method delivers accurate results by avoiding any errors from intense scattering inside the layers. A computational model was employed to extract k of particles from the measured absorptance data taking into account luminescence, scattering and re-absorption (step 2). The entire method was verified on reference materials. Finally, based on the proposed method, we determined in a broad wavelength range the n and k parameters for a variety of commonly used phosphors with few or no earlier reports on their n and k values (the complete set of numerical data is fully disclosed in the supplementary materials). © 2017 Optical Society of America
OCIS codes: (160.5690) Rare-earth-doped materials; (120.4530) Optical constants; (290.5850) Scattering, particles; (290.1483) BSDF, BRDF, and BTDF; (160.2540) Fluorescent and luminescent materials.
References and links
1. T. Shinkichi, “Principal phosphor materials and their optical properties,” in Phosphor Handbook (CRC Press, 2006).
2. E. Danielson, J. H. Golden, E. W. McFarland, C. M. Reaves, W. H. Weinberg, and X. D. Wu, “A combinatorialapproach to the discovery and optimization of luminescent materials,” Nature 389(6654), 944–948 (1997).
3. C. F. Bohren and D. R. Huffman, Absorption and Scattering of Light by Small Particles (Wiley, 1983). 4. R. Hu and X. Luo, “A model for calculating the bidirectional scattering properties of phosphor layer in white
light-emitting diodes,” J. Lightwave Technol. 30(21), 3376–3380 (2012).5. S. N. Lipnitskaya, K. D. Mynbaev, V. E. Bugrov, A. R. Kovsh, M. A. Odnoblyudov, and A. E. Romanov,
“Effects of light scattering in optical coatings on energy losses in LED devices,” Tech. Phys. Lett. 39(12), 1074–1077 (2013).
6. Z. Liu, S. Liu, K. Wang, and X. Luo, “Measurement and numerical studies of optical properties of YAG:Ce phosphor for white light-emitting diode packaging,” Appl. Opt. 49(2), 247–257 (2010).
7. E. Pavitra, G. S. R. Raju, J. Y. Park, L. Wang, B. K. Moon, and J. S. Yu, “Novel rare-earth-free yellowCa5Zn3.92In0.08(V0.99Ta0.01O4)(6) phosphors for dazzling white light-emitting diodes,” Sci. Rep. 5(1), 10296 (2015).
8. P. Pust, V. Weiler, C. Hecht, A. Tücks, A. S. Wochnik, A.-K. Henß, D. Wiechert, C. Scheu, P. J. Schmidt, and W. Schnick, “Narrow-band red-emitting Sr[LiAl3N4]:Eu2+ as a next-generation LED-phosphor material,” Nat. Mater. 13(9), 891–896 (2014).
9. X. Huang, “Solid-state lighting: Red phosphor converts white LEDs,” Nat. Photonics 8(10), 748–749 (2014).
Vol. 7, No. 8 | 1 Aug 2017 | OPTICAL MATERIALS EXPRESS 2943
#290094 https://doi.org/10.1364/OME.7.002943 Journal © 2017 Received 8 Mar 2017; revised 13 May 2017; accepted 15 May 2017; published 20 Jul 2017
10. S. Pimputkar, J. S. Speck, S. P. DenBaars, and S. Nakamura, “Prospects for LED lighting,” Nat. Photonics 3(4), 180–182 (2009).
11. T. Radcliffe, G. Barnea, B. Wowk, R. Rajapakshe, and S. Shalev, “Monte Carlo optimization of metal/phosphor screens at megavoltage energies,” Med. Phys. 20(4), 1161–1169 (1993).
12. P. F. Liaparinos, I. S. Kandarakis, D. A. Cavouras, H. B. Delis, and G. S. Panayiotakis, “Modeling granular phosphor screens by Monte Carlo methods,” Med. Phys. 33(12), 4502–4514 (2006).
13. J.-P. Moy, “Recent developments in X-ray imaging detectors,” Nucl. Instrum. Methods Phys. Res. 442(1-3), 26–37 (2000).
14. L. Wondraczek, M. Batentschuk, M. A. Schmidt, R. Borchardt, S. Scheiner, B. Seemann, P. Schweizer, and C. J. Brabec, “Solar spectral conversion for improving the photosynthetic activity in algae reactors,” Nat. Commun. 4, 2047 (2013).
15. C. Mi, J. Wu, Y. Yang, B. Han, and J. Wei, “Efficient upconversion luminescence from Ba5Gd8Zn4O21:Yb3+, Er3+ based on a demonstrated cross-relaxation process,” Sci. Rep. 6(1), 22545 (2016).
16. A. Solodovnyk, K. Forberich, E. Stern, J. Krč, M. Topič, M. Batentschuk, B. Lipovšek, and C. J. Brabec, “Highly transmissive luminescent down-shifting layers filled with phosphor particles for photovoltaics,” Opt. Mater. Express 5(6), 1296–1305 (2015).
17. B. Lipovšek, A. Solodovnyk, K. Forberich, E. Stern, J. Krč, C. J. Brabec, and M. Topič, “Optical model for simulation and optimization of luminescent down-shifting layers filled with phosphor particles for photovoltaics,” Opt. Express 23(15), A882–A895 (2015).
18. Z. Pan, Y.-Y. Lu, and F. Liu, “Sunlight-activated long-persistent luminescence in the near-infrared from Cr(3+)-doped zinc gallogermanates,” Nat. Mater. 11(1), 58–63 (2011).
19. W. Heller, “The Determination of Refractive Indices of Colloidal Particles by Means of a New Mixture Rule or from Measurements of Light Scattering,” Phys. Rev. 68(1-2), 5–10 (1945).
20. G. Blasse and B. C. Grabmaier, Luminescent Materials (Springer-Verlag, 1994). 21. H. K. Park, J. H. Oh, and Y. R. Do, “Toward scatter-free phosphors in white phosphor-converted light-emitting
diodes,” Opt. Express 20(9), 10218–10228 (2012). 22. B. K. Park, H. K. Park, J. H. Oh, J. R. Oh, and Y. R. Do, “Selecting Morphology of Y3Al5O12:Ce3+ Phosphors for
Minimizing Scattering Loss in the pc-LED Package,” J. Electrochem. Soc. 159(4), J96–J106 (2012). 23. G. David, K. Esat, I. Ritsch, and R. Signorell, “Ultraviolet broadband light scattering for optically-trapped
submicron-sized aerosol particles,” Phys. Chem. Chem. Phys. 18(7), 5477–5485 (2016). 24. M. S. Twardowski, E. Boss, J. B. Macdonald, W. S. Pegau, A. H. Barnard, and J. R. V. Zaneveld, “A model for
estimating bulk refractive index from the optical backscattering ratio and the implications for understanding particle composition in case I and case II waters,” J. Geophys. Res. 106(C7), 14129–14142 (2001).
25. A. B. Pluchino, S. S. Goldberg, J. M. Dowling, and C. M. Randall, “Refractive-index measurements of single micron-sized carbon particles,” Appl. Opt. 19(19), 3370–3372 (1980).
26. W. D. Dick, P. J. Ziemann, and P. H. McMurry, “Multiangle Light-Scattering Measurements of Refractive Index of Submicron Atmospheric Particles,” Aerosol Sci. Technol. 41(5), 549–569 (2007).
27. R. A. Carlton, “Polarized Light Microscopy,” in Pharmaceutical Microscopy (Springer-Verlag, 2011), pp. 7–64. 28. K. Spangenberg, “Die Einbettungsmethode,” Fortschr. Mineral. 7, 4–64 (1922). 29. F. D. Bloss, Optical Crystallography (Mineralogical Society of America Monograph Series, 1999), p. 239. 30. K. Strohmaier, “Photometrische Untersuchung der Beugungs- und Abbildungsvorgänge an Phasenobjekten,”
Dissertation (Eberhards-Karls-Universität zu Tübingen, 1952). 31. H. Tertsch, “Die Beckesche Lichtlinie,” Zentralblatt für Mikroskopische Forschung und Methodik 4, 296–307
(1949). 32. C. M. Keck, “Cyclosporine nanosuspensions,” Doctorate Disseration (Freie Universität Berlin, 2006). 33. R. Rath, “Fortschritte der Kristalldiagnose im Durchlicht,” Fortschr. Mineral. 46, 73–86 (1969). 34. R. C. Faust, “Refractive Index Determinations by the Central Illumination (Becke Line) Method,” Proc. Phys.
Soc. B 68(12), 1081–1094 (1955). 35. F. Rinne and M. Berek, “Bestimmung der Lichtbrechung,” in Anleitung zur allgemeinen und Polarisations-
Mikroskopie der Festkörper im Durchlicht, H. Schumann and F. Kornder, eds. (Schweizerbart Science Publishers, 1973), pp. 112–127.
36. G. A. Appleby, J. Zimmermann, S. Hesse, O. Karg, and H. von Seggern, “Sensitization and radiation hardening of the photostimulable X-ray storage phosphor CsBr:Eu2+,” J. Mater. Sci. Mater. Electron. 20(S1), 54–58 (2009).
37. R. Hu, X. Luo, H. Zheng, and S. Liu, “Optical constants study of YAG:Ce phosphor layer blended with SiO2 particles by Mie theory for white light-emitting diode package,” Frontiers of Optoelectronics 5(2), 138–146 (2012).
38. S. Leyre, G. Durinck, J. Hofkens, G. Deconinck, and P. Hanselaer, “Experimental determination of the absorption and scattering properties of YAG:Ce phosphor,” in Light, Energy and the Environment (Optical Society of America, Canberra, 2014), p. DTu4C.4.
39. L. Yang and B. Kruse, “Revised Kubelka-Munk theory. I. Theory and application,” J. Opt. Soc. Am. A 21(10), 1933–1941 (2004).
40. B. Lipovšek, J. Krč, and M. Topič, “Optical model for thin-film photovoltaic devices with large surface textures at the front side = Opticni model za tankoplastne fotonapetostne strukture z velikimi povrsinskimi teksturami na sprednji strani,” In Informacije MIDEM, 264–271 (2011).
Vol. 7, No. 8 | 1 Aug 2017 | OPTICAL MATERIALS EXPRESS 2944
41. A. Solodovnyk, A. Hollmann, A. Osvet, K. Forberich, E. Stern, M. Batentschuk, R. Klupp Taylor, and C. J. Brabec, “Luminescent down-shifting layers with Eu2+ and Eu3+ doped strontium compound particles for photovoltaics,” Proc. SPIE 91078, 9107806 (2014).
42. A. Solodovnyk, ZAE Bayern, Immerwahrstr. 2, 91058 Erlangen, and B. Lipovšek, D. Riedel, K. Forberich, E. Stern, M. Batenschuk, J. Krč, M. Topič, C. J. Brabec are preparing a manuscript to be called “Key Parameters of Efficient Phosphor-Filled Luminescent Down-Shifting Layers for Photovoltaics.”
43. H. H. Li, “Refractive index of alkali halides and its wavelength and temperature derivatives,” J. Phys. Chem. Ref. Data 5(2), 329–528 (1976).
44. M. Polyanskiy, “Refractive index database” (2016), retrieved 13.04.2016, http://refractiveindex.info/. 45. M. J. Dodge, I. H. Malitson, and A. I. Mahan, “A Special Method for Precise Refractive Index Measurement of
Uniaxial Optical Media,” Appl. Opt. 8(8), 1703–1705 (1969). 46. D. Riedel, T. Wehlus, T. C. G. Reusch, and C. J. Brabec, “Polymer-based scattering layers for internal light
extraction from organic light emitting diodes,” Org. Electron. 32, 27–33 (2016). 47. E. D. Palik, “Measurement of Optical Constants in the Vacuum Ultraviolet Spectral Region,” in Handbook of
Optical Constants of Solids, W. R. Hunter, ed. (Academic Press, 1985), pp. 69–88. 48. “Optical Data from Sopra S.A.,” (Software Spectra Inc., 2008). 49. Y. Kuwano, K. Suda, N. Ishizawa, and T. Yamada, “Crystal growth and properties of (Lu,Y)3Al5O12,” J. Cryst.
Growth 260(1-2), 159–165 (2004). 50. K. Wiśniewski, C. Koepke, A. Wojtowicz, W. Drozdowski, M. Grinberg, S. Kaczmarek, and J. Kisielewski,
“Excited State Absorption and Thermoluminescence in Ce and Mg Doped Yttrium Aluminum Garnet,” Acta Phys. Pol. A 95(3), 403–412 (1999).
1. Introduction
Were you ever struggling to find the optical constants of specific phosphors [1, 2] in literature? Indeed, complex refractive index (n – ik) [3] of phosphor particles and its wavelength dependency is essential for any accurate simulation of phosphor-filled optical systems: LEDs [4–10], screens [11, 12], light conversion layers for medical [13], biological [14] and solar energy applications [15–18].
Yet direct measurement of the complex refractive index is not straightforward [19]. Phosphors are inorganic luminescent materials doped with rare-earth or transition metal ions [20]. They are often produced as powders with particle sizes of 0.1-40 µm [5, 21, 22]. Most advances in measuring both, n and k, of particulate materials were made for aerosol particles in atmosphere [23]. The technique requires trapping of a single particle to measure the scattered light signal. Optical constants are then determined by fitting with the Mie scattering theory equations [23–26]. However, this method is difficult to apply to phosphor particles, as they have higher density, higher n than aerosol particles (n~1.3-1.5 [26]) and emit light. Moreover, due to the Kramers-Kronig condition, simultaneous measurements of n and k in the spectral region of rapid k change (often UV and visible), contain error [3]. We therefore address measurements of n and k of phosphors separately.
The method of Becke Line for determination of n of small solids belongs to the immersion methods [27–29]. It provides precision of Δn = ± 0.001 [29, 30] or less [31] and allows for measuring small particles [32]. The Becke Line (light halo, intensity maximum) appears due to asymmetrically diffracted light on the edges of particles [33–35]. We demonstrate that it is possible to apply the method to phosphors without any precision losses if not all the incident radiation is absorbed.
There are few reports on direct measurements of absorption coefficient, α, of stand-alone powder phosphors [36]. Instead, most reports involve spectral measurements of the total and diffuse transmittance and reflectance of layers with particles embedded into a transparent binder [6, 37, 38]. The effective absorption coefficient of such phosphor-filled layers, αEf, is then fitted with the Mie [3, 37] or Kubelka-Munk [39] theory. For the spectral measurements Liu et al. [6] suggested a double-integrating sphere system. However, multiple scattering effects in the integrating sphere cause increased re-absorption in phosphors and lead to an error. We therefore suggest spectral angular resolved scattering (SARS) measurements of transmittance and reflectance of phosphor-filled layers in air by using a spectrally selective detector. This method allows obtaining the absorptance of layers without errors due to re-absorption and photoluminescence.
Vol. 7, No. 8 | 1 Aug 2017 | OPTICAL MATERIALS EXPRESS 2945
A novel approach for determination of k of particles using an earlier developed optical model CROWM [17, 40] is presented. The model uses all experimental parameters of the phosphor-filled layers as well as n of particles measured with the Becke Line method. It iteratively varies k achieving a good match with the data measured by SARS.
All steps were carefully verified. Thus, we suggest a two-step method to precisely determine the optical constants of phosphors absorbing in the visible spectral region. Finally, we show the measured data for a number of commonly used phosphor materials with few/ no reports on their n and k.
2. Experimental
2.1 Experimental procedures related to n determination
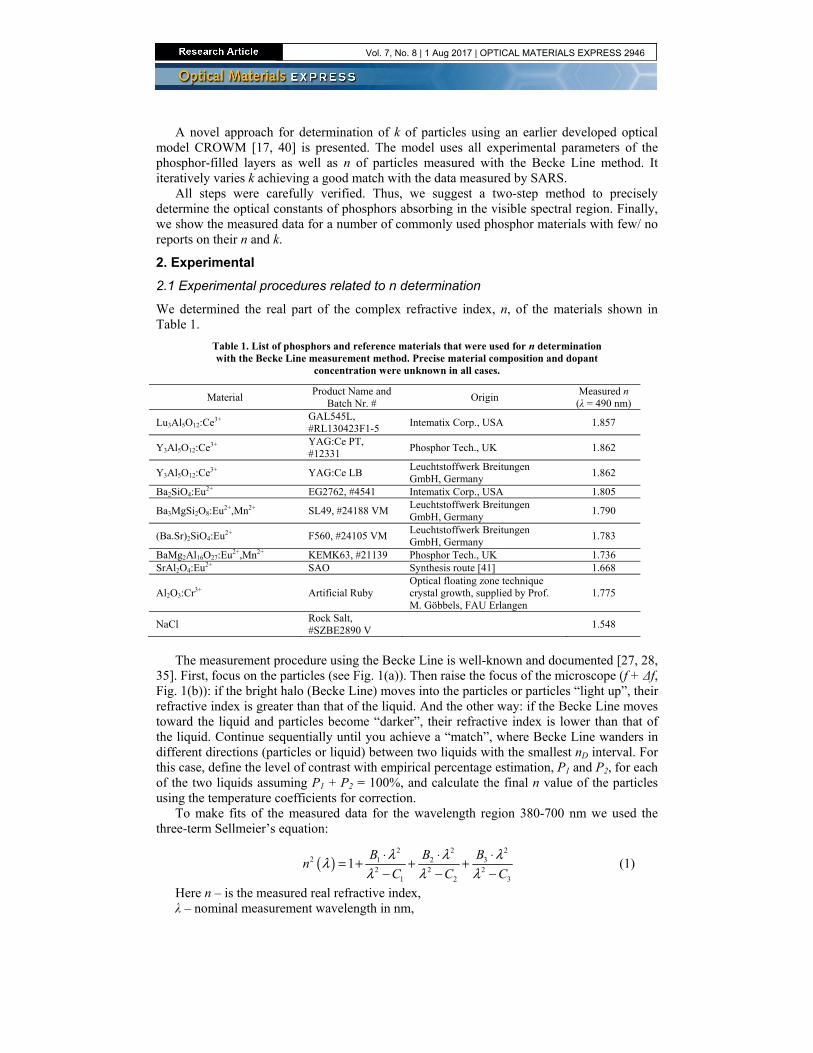
We determined the real part of the complex refractive index, n, of the materials shown in Table 1.
Table 1. List of phosphors and reference materials that were used for n determination with the Becke Line measurement method. Precise material composition and dopant
concentration were unknown in all cases.
Material Product Name and
Batch Nr. # Origin
Measured n (λ = 490 nm)
Lu3Al5O12:Ce3+ GAL545L, #RL130423F1-5
Intematix Corp., USA 1.857
Y3Al5O12:Ce3+ YAG:Ce PT, #12331
Phosphor Tech., UK 1.862
Y3Al5O12:Ce3+ YAG:Ce LB Leuchtstoffwerk Breitungen GmbH, Germany
1.862
Ba2SiO4:Eu2+ EG2762, #4541 Intematix Corp., USA 1.805
Ba3MgSi2O8:Eu2+,Mn2+ SL49, #24188 VM Leuchtstoffwerk Breitungen GmbH, Germany
1.790
(Ba.Sr)2SiO4:Eu2+ F560, #24105 VM Leuchtstoffwerk Breitungen GmbH, Germany
1.783
BaMg2Al16O27:Eu2+,Mn2+ KEMK63, #21139 Phosphor Tech., UK 1.736 SrAl2O4:Eu2+ SAO Synthesis route [41] 1.668
Al2O3:Cr3+ Artificial Ruby Optical floating zone technique crystal growth, supplied by Prof. M. Göbbels, FAU Erlangen
1.775
NaCl Rock Salt, #SZBE2890 V
1.548
The measurement procedure using the Becke Line is well-known and documented [27, 28,
35]. First, focus on the particles (see Fig. 1(a)). Then raise the focus of the microscope (f + Δf, Fig. 1(b)): if the bright halo (Becke Line) moves into the particles or particles “light up”, their refractive index is greater than that of the liquid. And the other way: if the Becke Line moves toward the liquid and particles become “darker”, their refractive index is lower than that of the liquid. Continue sequentially until you achieve a “match”, where Becke Line wanders in different directions (particles or liquid) between two liquids with the smallest nD interval. For this case, define the level of contrast with empirical percentage estimation, P1 and P2, for each of the two liquids assuming P1 + P2 = 100%, and calculate the final n value of the particles using the temperature coefficients for correction.
To make fits of the measured data for the wavelength region 380-700 nm we used the three-term Sellmeier’s equation:
( )22 2
2 31 22 2 2
1 2 3
1BB B
nC C C
λλ λλλ λ λ
⋅⋅ ⋅= + + +
− − − (1)
Here n – is the measured real refractive index, λ – nominal measurement wavelength in nm,
Vol. 7, No. 8 | 1 Aug 2017 | OPTICAL MATERIALS EXPRESS 2946
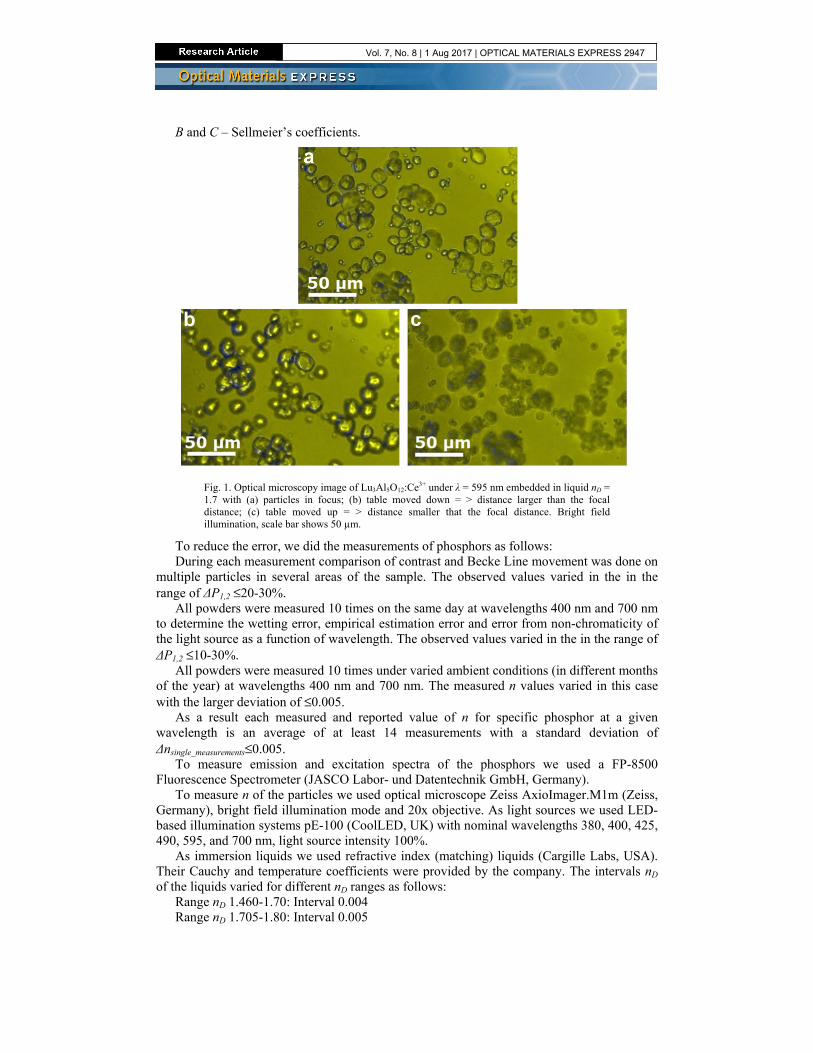
B and C – Sellmeier’s coefficients.
Fig. 1. Optical microscopy image of Lu3Al5O12:Ce3+ under λ = 595 nm embedded in liquid nD = 1.7 with (a) particles in focus; (b) table moved down = > distance larger than the focal distance; (c) table moved up = > distance smaller that the focal distance. Bright field illumination, scale bar shows 50 µm.
To reduce the error, we did the measurements of phosphors as follows: During each measurement comparison of contrast and Becke Line movement was done on
multiple particles in several areas of the sample. The observed values varied in the in the range of ΔP1,2 ≤20-30%.
All powders were measured 10 times on the same day at wavelengths 400 nm and 700 nm to determine the wetting error, empirical estimation error and error from non-chromaticity of the light source as a function of wavelength. The observed values varied in the in the range of ΔP1,2 ≤10-30%.
All powders were measured 10 times under varied ambient conditions (in different months of the year) at wavelengths 400 nm and 700 nm. The measured n values varied in this case with the larger deviation of ≤0.005.
As a result each measured and reported value of n for specific phosphor at a given wavelength is an average of at least 14 measurements with a standard deviation of Δnsingle_measurements≤0.005.
To measure emission and excitation spectra of the phosphors we used a FP-8500 Fluorescence Spectrometer (JASCO Labor- und Datentechnik GmbH, Germany).
To measure n of the particles we used optical microscope Zeiss AxioImager.M1m (Zeiss, Germany), bright field illumination mode and 20x objective. As light sources we used LED-based illumination systems pE-100 (CoolLED, UK) with nominal wavelengths 380, 400, 425, 490, 595, and 700 nm, light source intensity 100%.
As immersion liquids we used refractive index (matching) liquids (Cargille Labs, USA). Their Cauchy and temperature coefficients were provided by the company. The intervals nD of the liquids varied for different nD ranges as follows:
Range nD 1.460-1.70: Interval 0.004 Range nD 1.705-1.80: Interval 0.005
Vol. 7, No. 8 | 1 Aug 2017 | OPTICAL MATERIALS EXPRESS 2947
Range nD 1.81-2.00: Interval 0.01. As a substrate we used dielectric mirror (BB2-E02 Ø2”, ThorLabs, Germany). We put
droplets of two liquids used for comparison onto it, added a small amount of the powder into each droplet and covered with a cover glass. We pressed lightly from above to guarantee wetting between the liquid, particles and the cover glass. To cut off the emitted light for the measurements at the wavelengths 380, 400 and 425 nm we covered the samples with BG 3 (Schott AG, Germany) filter.
To measure the temperature a digital thermo-hygrometer (Kat.Nr.30.5015, TFA, Germany) was placed next to the microscope stage, measurement precision ± 1°C.
To measure particle size distributions we used a particle analyzer LS-100Q (Beckman-Coulter, Krefeld, Germany). The obtained distributions can be found elsewhere [42]. Particle size distribution of TiO2 nanoparticles was measured with NANO-flex 180°/ Stabino DLS nanoparticle sizing device.
2.2 Experimental procedures related to k determination
For the purpose of k determination, thick layers with phosphor particles were prepared as described elsewhere [16]. As a transparent binder we used QSil 218 (Batch Nr. #130824, ACC Silicones Ltd., UK) two-part (A + B) addition cure silicone elastomer with n = 1.457 at λ = 600 nm [16]. Particle volume concentration in the dried layers was kept to 6 vol. %. To prepare layers with TiO2 nanoparticles for verification purposes, we first treated toluene solution with TiO2 nanoparticles (rutile, 300 nm, Batch Nr. #US3547, US Research Nanomaterials Inc., USA) for 10 min with an ultrasonic finger, then mixed the solution with the binder and coated further as in the case of phosphor-filled layers. Float glass (Weidner Glas GmbH, Germany) with dimensions 25 mm × 25 mm × 1 mm were used as substrates.
To measure the thickness of the dried layers, we used a Nikon Eclipse L150 confocal microscope. The thickness of the dried phosphor-filled layers was in the range of 150-600 μm, and the thickness of the layers with TiO2 nanoparticles was in the range of 10-125 μm.
In the scope of this work, optical characterization of the layers refers to measuring the total reflectance, Rtot, and transmittance, Ttot, of the layers. These are required to determine the k parameter of the particles. To measure spectroscopic data of the layers we used a Perkin Elmer Lambda 950 double beam spectrometer with a 150 mm integrating sphere. Samples were placed in transmission and reflection ports of the sphere with the glass substrate in front of the layer with respect to illumination. Due to losses caused by scattering, the sum of total transmittance, total reflectance and absorptance was 94 ± 2% for all characterized layers.
The spectral angular resolved scattering (SARS) measurements were performed using a GON360-105 goniometer (Instrument Systems GmbH, Germany). Phosphor-filled layers on glass were measured with a collimated incident light beam perpendicular to the surface. As a light source we used an incoherent broad-band light source (LS500) with a spectrum from 220 nm up to NIR. A calibrated fiber coupled array spectrometer (CAS 140) is coupled to the integrating sphere which is rotated around the sample at a distance of 112 mm. The aperture of the integrating sphere had a diameter of 10 mm and the light spot at the sample was about 7 mm in diameter. The spectrally resolved intensity was measured with increments of 5°.
To determine the overall transmittance, reflectance and absorptance of the layers we integrate the intensity over the transmission and reflection hemispheres. We assumed a rotational symmetry of the light distribution with respect to the surface normal to the scattering layers. The measured intensities at each angle along the meridian were added up after multiplying by a factor accounting for the angle-dependent area of the spherical zones.
Vol. 7, No. 8 | 1 Aug 2017 | OPTICAL MATERIALS EXPRESS 2948
3. Results and discussion
Step 1. Determination of the real refractive index, n, and verification
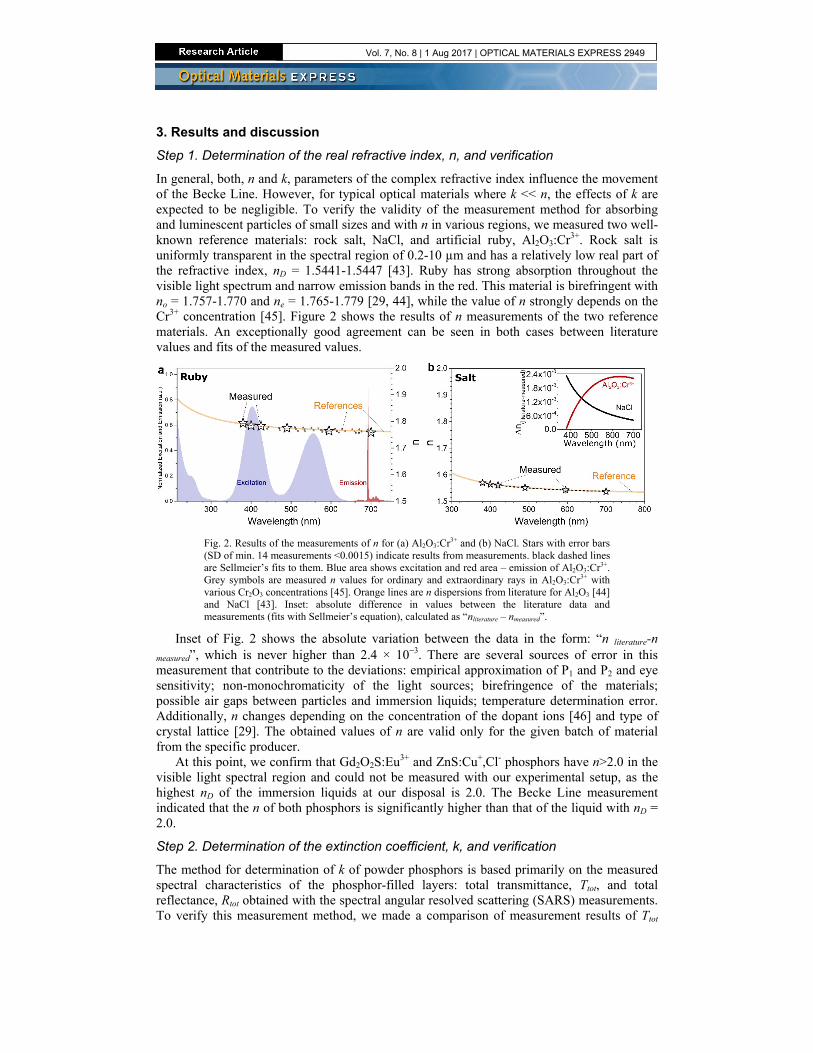
In general, both, n and k, parameters of the complex refractive index influence the movement of the Becke Line. However, for typical optical materials where k << n, the effects of k are expected to be negligible. To verify the validity of the measurement method for absorbing and luminescent particles of small sizes and with n in various regions, we measured two well-known reference materials: rock salt, NaCl, and artificial ruby, Al2O3:Cr3+. Rock salt is uniformly transparent in the spectral region of 0.2-10 µm and has a relatively low real part of the refractive index, nD = 1.5441-1.5447 [43]. Ruby has strong absorption throughout the visible light spectrum and narrow emission bands in the red. This material is birefringent with no = 1.757-1.770 and ne = 1.765-1.779 [29, 44], while the value of n strongly depends on the Cr3+ concentration [45]. Figure 2 shows the results of n measurements of the two reference materials. An exceptionally good agreement can be seen in both cases between literature values and fits of the measured values.
Fig. 2. Results of the measurements of n for (a) Al2O3:Cr3+ and (b) NaCl. Stars with error bars (SD of min. 14 measurements ˂0.0015) indicate results from measurements. black dashed lines are Sellmeier’s fits to them. Blue area shows excitation and red area – emission of Al2O3:Cr3+. Grey symbols are measured n values for ordinary and extraordinary rays in Al2O3:Cr3+ with various Cr2O3 concentrations [45]. Orange lines are n dispersions from literature for Al2O3 [44] and NaCl [43]. Inset: absolute difference in values between the literature data and measurements (fits with Sellmeier’s equation), calculated as “nliterature – nmeasured”.
Inset of Fig. 2 shows the absolute variation between the data in the form: “n literature-n measured”, which is never higher than 2.4 × 10⁻³. There are several sources of error in this measurement that contribute to the deviations: empirical approximation of P1 and P2 and eye sensitivity; non-monochromaticity of the light sources; birefringence of the materials; possible air gaps between particles and immersion liquids; temperature determination error. Additionally, n changes depending on the concentration of the dopant ions [46] and type of crystal lattice [29]. The obtained values of n are valid only for the given batch of material from the specific producer.
At this point, we confirm that Gd2O2S:Eu3+ and ZnS:Cu+,Cl- phosphors have n>2.0 in the visible light spectral region and could not be measured with our experimental setup, as the highest nD of the immersion liquids at our disposal is 2.0. The Becke Line measurement indicated that the n of both phosphors is significantly higher than that of the liquid with nD = 2.0.
Step 2. Determination of the extinction coefficient, k, and verification
The method for determination of k of powder phosphors is based primarily on the measured spectral characteristics of the phosphor-filled layers: total transmittance, Ttot, and total reflectance, Rtot obtained with the spectral angular resolved scattering (SARS) measurements. To verify this measurement method, we made a comparison of measurement results of Ttot
Vol. 7, No. 8 | 1 Aug 2017 | OPTICAL MATERIALS EXPRESS 2949
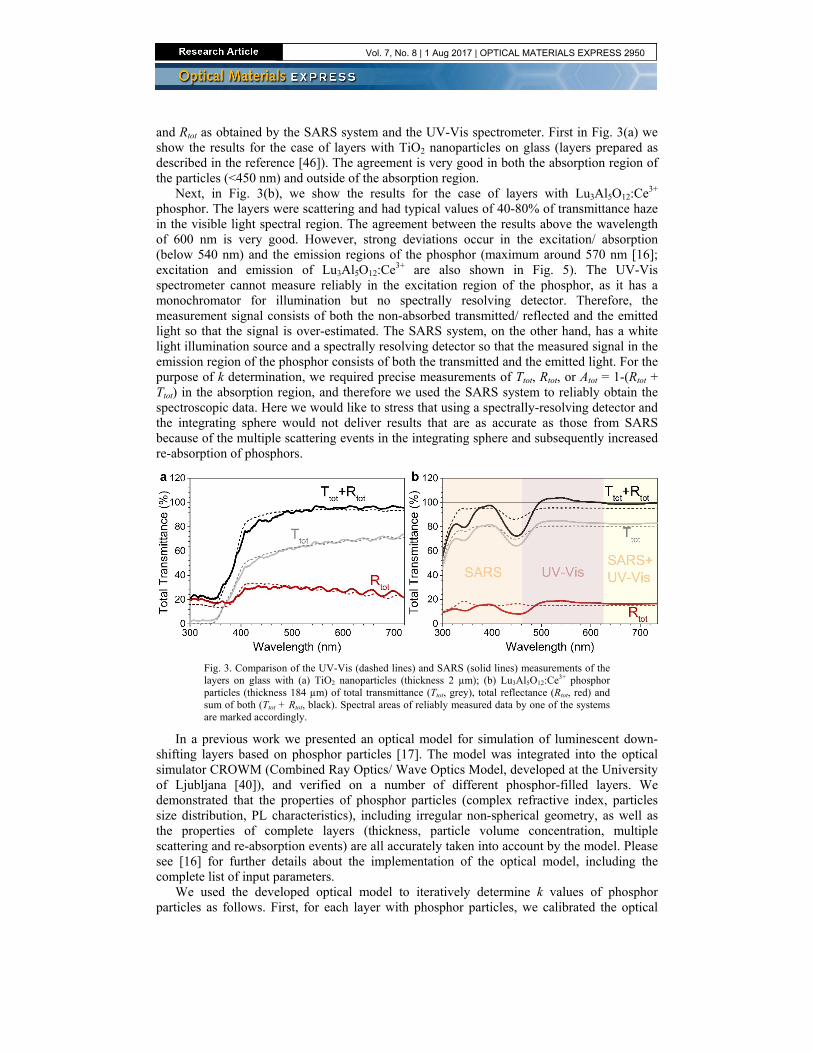
and Rtot as obtained by the SARS system and the UV-Vis spectrometer. First in Fig. 3(a) we show the results for the case of layers with TiO2 nanoparticles on glass (layers prepared as described in the reference [46]). The agreement is very good in both the absorption region of the particles (<450 nm) and outside of the absorption region.
Next, in Fig. 3(b), we show the results for the case of layers with Lu3Al5O12:Ce3+ phosphor. The layers were scattering and had typical values of 40-80% of transmittance haze in the visible light spectral region. The agreement between the results above the wavelength of 600 nm is very good. However, strong deviations occur in the excitation/ absorption (below 540 nm) and the emission regions of the phosphor (maximum around 570 nm [16]; excitation and emission of Lu3Al5O12:Ce3+ are also shown in Fig. 5). The UV-Vis spectrometer cannot measure reliably in the excitation region of the phosphor, as it has a monochromator for illumination but no spectrally resolving detector. Therefore, the measurement signal consists of both the non-absorbed transmitted/ reflected and the emitted light so that the signal is over-estimated. The SARS system, on the other hand, has a white light illumination source and a spectrally resolving detector so that the measured signal in the emission region of the phosphor consists of both the transmitted and the emitted light. For the purpose of k determination, we required precise measurements of Ttot, Rtot, or Atot = 1-(Rtot + Ttot) in the absorption region, and therefore we used the SARS system to reliably obtain the spectroscopic data. Here we would like to stress that using a spectrally-resolving detector and the integrating sphere would not deliver results that are as accurate as those from SARS because of the multiple scattering events in the integrating sphere and subsequently increased re-absorption of phosphors.
Fig. 3. Comparison of the UV-Vis (dashed lines) and SARS (solid lines) measurements of the layers on glass with (a) TiO2 nanoparticles (thickness 2 µm); (b) Lu3Al5O12:Ce3+ phosphor particles (thickness 184 µm) of total transmittance (Ttot, grey), total reflectance (Rtot, red) and sum of both (Ttot + Rtot, black). Spectral areas of reliably measured data by one of the systems are marked accordingly.
In a previous work we presented an optical model for simulation of luminescent down-shifting layers based on phosphor particles [17]. The model was integrated into the optical simulator CROWM (Combined Ray Optics/ Wave Optics Model, developed at the University of Ljubljana [40]), and verified on a number of different phosphor-filled layers. We demonstrated that the properties of phosphor particles (complex refractive index, particles size distribution, PL characteristics), including irregular non-spherical geometry, as well as the properties of complete layers (thickness, particle volume concentration, multiple scattering and re-absorption events) are all accurately taken into account by the model. Please see [16] for further details about the implementation of the optical model, including the complete list of input parameters.
We used the developed optical model to iteratively determine k values of phosphor particles as follows. First, for each layer with phosphor particles, we calibrated the optical
Vol. 7, No. 8 | 1 Aug 2017 | OPTICAL MATERIALS EXPRESS 2950
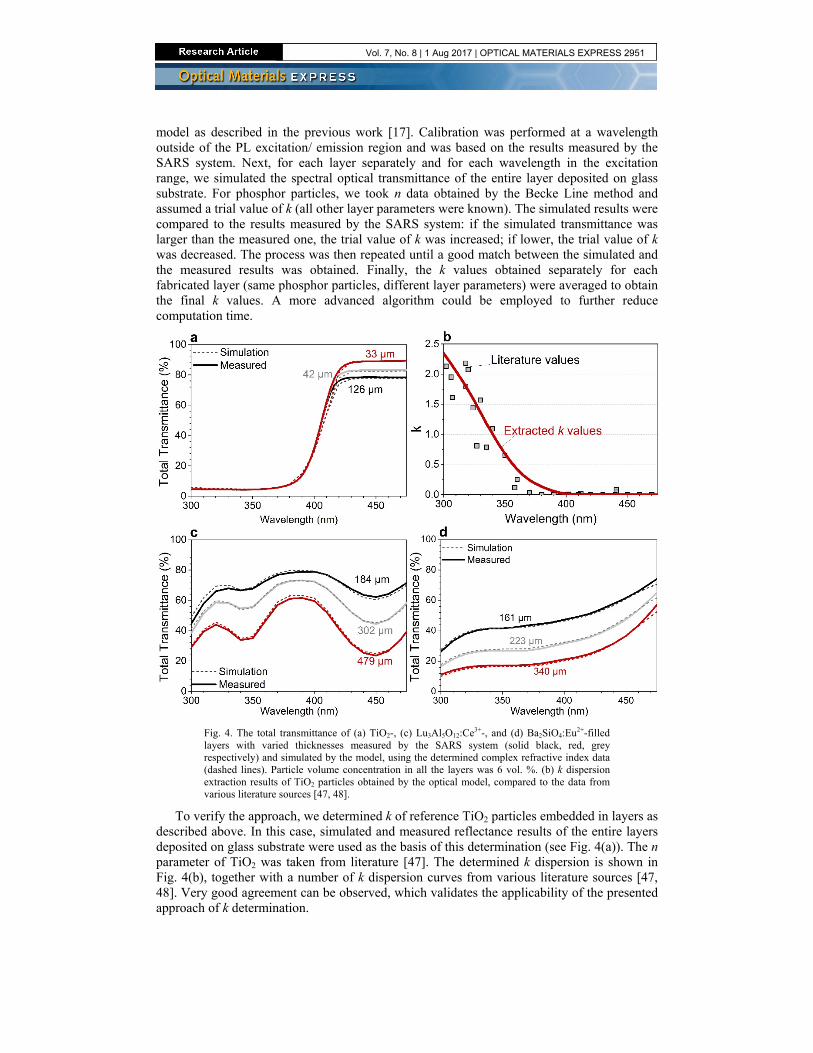
model as described in the previous work [17]. Calibration was performed at a wavelength outside of the PL excitation/ emission region and was based on the results measured by the SARS system. Next, for each layer separately and for each wavelength in the excitation range, we simulated the spectral optical transmittance of the entire layer deposited on glass substrate. For phosphor particles, we took n data obtained by the Becke Line method and assumed a trial value of k (all other layer parameters were known). The simulated results were compared to the results measured by the SARS system: if the simulated transmittance was larger than the measured one, the trial value of k was increased; if lower, the trial value of k was decreased. The process was then repeated until a good match between the simulated and the measured results was obtained. Finally, the k values obtained separately for each fabricated layer (same phosphor particles, different layer parameters) were averaged to obtain the final k values. A more advanced algorithm could be employed to further reduce computation time.
Fig. 4. The total transmittance of (a) TiO2-, (c) Lu3Al5O12:Ce3+-, and (d) Ba2SiO4:Eu2+-filled layers with varied thicknesses measured by the SARS system (solid black, red, grey respectively) and simulated by the model, using the determined complex refractive index data (dashed lines). Particle volume concentration in all the layers was 6 vol. %. (b) k dispersion extraction results of TiO2 particles obtained by the optical model, compared to the data from various literature sources [47, 48].
To verify the approach, we determined k of reference TiO2 particles embedded in layers as described above. In this case, simulated and measured reflectance results of the entire layers deposited on glass substrate were used as the basis of this determination (see Fig. 4(a)). The n parameter of TiO2 was taken from literature [47]. The determined k dispersion is shown in Fig. 4(b), together with a number of k dispersion curves from various literature sources [47, 48]. Very good agreement can be observed, which validates the applicability of the presented approach of k determination.
Vol. 7, No. 8 | 1 Aug 2017 | OPTICAL MATERIALS EXPRESS 2951
In Fig. 4(c-d) we show comparison between the total transmittance measured by the SARS system (solid lines) and that simulated by the optical model (dashed lines) using the determined n and (averaged) k data of two phosphors: Lu3Al5O12:Ce3+ and Ba2SiO4:Eu2+. Very good agreement can be observed for all the layers with different layer thicknesses. The discrepancies can primarily be related to experimental errors in determination of the phosphor-filled layer parameters (particle volume concentration, thickness, homogeneous dispersion of particles in the matrix), which are taken as the input parameters in the optical model.
The accuracy of the proposed method depends primarily on the accuracy of the input parameters. The measured transmittance/ reflectance results in UV-Vis spectrometer and SARS have accuracy of 1% and 5% respectively. The thickness of the particle-filled layers was measured with an error of ± 5-8 µm, so the particle volume concentration has deviations of less than 0.5%. The (complex) refractive indices of all the supporting materials (polymer binder, glass substrate) were determined earlier [16]. Another input parameter is n, which was measured in the first step, and the particle size distribution.
4. Measured n and k parameters of phosphors
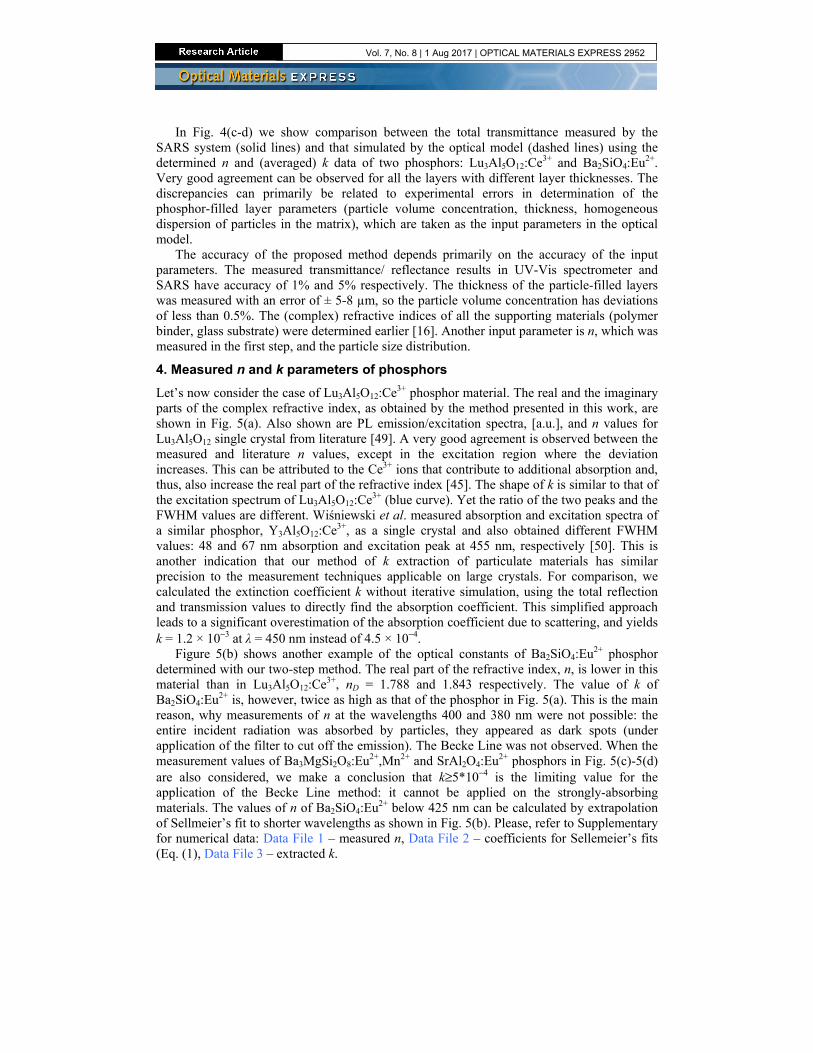
Let’s now consider the case of Lu3Al5O12:Ce3+ phosphor material. The real and the imaginary parts of the complex refractive index, as obtained by the method presented in this work, are shown in Fig. 5(a). Also shown are PL emission/excitation spectra, [a.u.], and n values for Lu3Al5O12 single crystal from literature [49]. A very good agreement is observed between the measured and literature n values, except in the excitation region where the deviation increases. This can be attributed to the Ce3+ ions that contribute to additional absorption and, thus, also increase the real part of the refractive index [45]. The shape of k is similar to that of the excitation spectrum of Lu3Al5O12:Ce3+ (blue curve). Yet the ratio of the two peaks and the FWHM values are different. Wiśniewski et al. measured absorption and excitation spectra of a similar phosphor, Y3Al5O12:Ce3+, as a single crystal and also obtained different FWHM values: 48 and 67 nm absorption and excitation peak at 455 nm, respectively [50]. This is another indication that our method of k extraction of particulate materials has similar precision to the measurement techniques applicable on large crystals. For comparison, we calculated the extinction coefficient k without iterative simulation, using the total reflection and transmission values to directly find the absorption coefficient. This simplified approach leads to a significant overestimation of the absorption coefficient due to scattering, and yields k = 1.2 × 10⁻³ at λ = 450 nm instead of 4.5 × 10⁻⁴.
Figure 5(b) shows another example of the optical constants of Ba2SiO4:Eu2+ phosphor determined with our two-step method. The real part of the refractive index, n, is lower in this material than in Lu3Al5O12:Ce3+, nD = 1.788 and 1.843 respectively. The value of k of Ba2SiO4:Eu2+ is, however, twice as high as that of the phosphor in Fig. 5(a). This is the main reason, why measurements of n at the wavelengths 400 and 380 nm were not possible: the entire incident radiation was absorbed by particles, they appeared as dark spots (under application of the filter to cut off the emission). The Becke Line was not observed. When the measurement values of Ba3MgSi2O8:Eu2+,Mn2+ and SrAl2O4:Eu2+ phosphors in Fig. 5(c)-5(d) are also considered, we make a conclusion that k≥5*10−4 is the limiting value for the application of the Becke Line method: it cannot be applied on the strongly-absorbing materials. The values of n of Ba2SiO4:Eu2+ below 425 nm can be calculated by extrapolation of Sellmeier’s fit to shorter wavelengths as shown in Fig. 5(b). Please, refer to Supplementary for numerical data: Data File 1 – measured n, Data File 2 – coefficients for Sellemeier’s fits (Eq. (1), Data File 3 – extracted k.
Vol. 7, No. 8 | 1 Aug 2017 | OPTICAL MATERIALS EXPRESS 2952
Fig. 5. Results of the complex refractive index measurements for (a) Lu3Al5O12:Ce3+, (b) Ba2SiO4:Eu2+, (c) Ba3MgSi2O8:Eu2+,Mn2+ and (d) SrAl2O4:Eu2+ phosphors. Stars with red error bars (SD of min. 14 measurements ˂0.0015) indicate n results from Becke Line measurements and their standard deviation, black lines are Sellmeier’s fits to them. Grey areas shows k results. Blue and red dotted lines show excitation and emission spectra respectively. Orange line and circles in (a) are measured data and dispersion fit from literature [49].
Finally, while the determined n and k parameters are valid for the particular phosphor batches and providers as shown in Table 1. It should be noted that the refractive index for other batches of the same material will differ due to the unavoidable difference in the concentration of the dopant ions, as well as the different amount of disorder in the crystal lattice.
5. Summary
We suggested a method to determine n and k of phosphor particles using the following steps: measurement of n of powder, processing and spectral measurement of phosphor-filled layers, and computational extraction of k.
First we adapted the Becke Line immersion measurement method to measure the real part of the refractive index of particulate materials with pronounced absorption and/ or luminescence in the visible spectral range with a precision of ± 2.5 × 10⁻³. The method can be applied under any desired wavelength as long as the microscope detector is sensitive in that spectral region. The upper limit of the refractive index that can be measured is determined by the highest two available refractive index liquids (in our case n = 2.0).
After embedding phosphor particles into transparent binder we performed novel spectral angular resolved scattering measurements of the layers. The SARS setup allows for determination of spectral characteristics of scattering luminescence layers with high precision, taking all multiple scattering, absorption and re-emission events into account. The absorptance of luminescent scattering layers is furthermore only valid outside of the emission region of the phosphors. The method therefore works best with materials with large Stokes shifts.
With the known parameters of the phosphor particles and layers such as particle volume concentration, layer thickness and particle size distribution, we involved our optical model to
Vol. 7, No. 8 | 1 Aug 2017 | OPTICAL MATERIALS EXPRESS 2953
iteratively extract k values from the measured spectral characteristics for Lu3Al5O12:Ce3+, Ba2SiO4:Eu2+, Ba3MgSi2O8:Eu2+,Mn2+ and SrAl2O4:Eu2+ powder phosphors.
Thus, we demonstrated that the suggested method allows for precise determination of n and k parameters of phosphors without the need for sophisticated equipment or large amounts of material. The method was verified on several reference powders. The major limitation for application of the method are the size of the phosphor particles and their absorptive characteristics (the particles need to be seen under the optical microscope), the range of immersion liquids at our disposal (cannot determine n of the particles outside this range), and the precision, with which all properties of the phosphors and phosphor-filled layers are obtained.
Funding
Bavarian Academic Center for Central, Eastern and Southeastern Europe (BAYHOST); Erlangen Graduate School in Advanced Optical Technologies (SAOT); Bavarian Research Foundation (BFS) (1006-11); Slovenian Research Agency (P2-0197); Cluster of Excellence Engineering of Advanced Materials (EAM); EU-project SOLPROCEL (“Solution Processed high performance transparent organic photovoltaic cells”, Grant no. 604506); Open Access Publishing.
Acknowledgments
We acknowledge support by Deutsche Forschungsgemeinschaft and Friedrich-Alexander Universität Erlangen-Nürnberg (FAU) within the funding programme Open Access Publishing.
We are grateful to Prof. Ulf Peschel (FSU Jena) and Prof. Matthias Göbbels (FAU Erlangen-Nürnberg) for their insight and helpful feedback. Thanks to CoolLED for providing the LED spectra, to Ms. Beate Müller (FAU Erlangen) for preparing ruby powder, to Dr. Daniel Hagmeier for size distribution measurements of TiO2 nanoparticles, to Ms. Taylor Uekert for literature search, and to Ms. Marina Högerle for SARS measurements.
Vol. 7, No. 8 | 1 Aug 2017 | OPTICAL MATERIALS EXPRESS 2954


![Capsule & Powder Technology] - Bickel & Wolf HOeFLIGER/1 Modu-C_d.pdf · Capsule & Powder Technology] - Optionale Tara/Brutto-Waage für die Stichproben - Modu-C kontrolle oder 100%-Qualitätskontrolle](https://img.pdfslide.org/doc/110x75/5e1c6045626e4d6d4779fb2b/capsule-powder-technology-bickel-hoefliger1-modu-cdpdf-capsule.jpg)


![Capsule & Powder Technology - files.vogel.de · 2/3 [Capsule & Powder Technology] Modu-C MS Modu-C – die ultimative Maschine für die Kapselbefüllung. KompaktesDesign inpharmagerechter](https://img.pdfslide.org/doc/110x75/5d66de9888c99356368b84f6/capsule-powder-technology-filesvogelde-23-capsule-powder-technology.jpg)