Embed Size (px)
Citation preview
Differential Effects of Drug Interventions and DietaryLifestyle in Developing Type 2 Diabetes andComplications: A Systems Biology Analysis in LDLr2/2MiceMarijana Radonjic1., Peter Y. Wielinga2*., Suzan Wopereis1, Thomas Kelder1, Varshna S. Goelela1,
Lars Verschuren1, Karin Toet2, Wim van Duyvenvoorde2, Bianca van der Werff van der Vat3,
Johanna H. M. Stroeve1, Nicole Cnubben4, Teake Kooistra2, Ben van Ommen1, Robert Kleemann2
1Microbiology and Systems Biology, TNO, Zeist, The Netherlands, 2Metabolic Health Research, TNO, Leiden, The Netherlands, 3Quality and Safety, TNO, Zeist, The
Netherlands, 4 Pharmacokinetics and Human Studies, TNO, Zeist, The Netherlands
Abstract
Excess caloric intake leads to metabolic overload and is associated with development of type 2 diabetes (T2DM). Currentdisease management concentrates on risk factors of the disease such as blood glucose, however with limited success. Wehypothesize that normalizing blood glucose levels by itself is insufficient to reduce the development of T2DM andcomplications, and that removal of the metabolic overload with dietary interventions may be more efficacious. We exploredthe efficacy and systems effects of pharmaceutical interventions versus dietary lifestyle intervention (DLI) in developingT2DM and complications. To mimic the situation in humans, high fat diet (HFD)-fed LDLr2/2 mice with already establisheddisease phenotype were treated with ten different drugs mixed into HFD or subjected to DLI (switch to low-fat chow), for 7weeks. Interventions were compared to untreated reference mice kept on HFD or chow only. Although most of the drugsimproved HFD-induced hyperglycemia, drugs only partially affected other risk factors and also had limited effect on diseaseprogression towards microalbuminuria, hepatosteatosis and atherosclerosis. By contrast, DLI normalized T2DM risk factors,fully reversed hepatosteatosis and microalbuminuria, and tended to attenuate atherogenesis. The comprehensive beneficialeffect of DLI was reflected by normalized metabolite profiles in plasma and liver. Analysis of disease pathways in liverconfirmed reversion of the metabolic distortions with DLI. This study demonstrates that the pathogenesis of T2DM towardscomplications is reversible with DLI and highlights the differential effects of current pharmacotherapies and their limitationto resolve the disease.
Citation: Radonjic M, Wielinga PY, Wopereis S, Kelder T, Goelela VS, et al. (2013) Differential Effects of Drug Interventions and Dietary Lifestyle in Developing Type2 Diabetes and Complications: A Systems Biology Analysis in LDLr2/2 Mice. PLoS ONE 8(2): e56122. doi:10.1371/journal.pone.0056122
Editor: Massimo Federici, University of Tor Vergata, Italy
Received September 4, 2012; Accepted January 4, 2013; Published February 15, 2013
Copyright: � 2013 Radonjic et al. This is an open-access article distributed under the terms of the Creative Commons Attribution License, which permitsunrestricted use, distribution, and reproduction in any medium, provided the original author and source are credited.
Funding: The authors have no support or funding to report.
Competing Interests: The authors have declared that no competing interests exist.
* E-mail: [email protected]
. These authors contributed equally to this work.
Introduction
Type 2 diabetes mellitus (T2DM) is a multifactorial metabolic
disease that is associated with multiple life-threatening complica-
tions such as cardiovascular disease (CVD) [1]. 366 million people
suffer from diabetes worldwide, with another 280 million at high
risk of developing the disease [2]. Despite major advances in
understanding the pathogenesis of the disease and effective
therapies to normalize plasma glucose and to reduce risk factors,
incident rates of T2DM steadily increase and cardiovascular
complications remain the largest cause of morbidity and mortality
in T2DM patients [3]. Also, therapeutic treatment of other
important comorbidities, including nephropathy, retinopathy and
non-alcoholic liver disease, remain challenging. There is in-
creasing evidence that current T2DM disease management
concentrates on a symptom of the disease, i.e. blood glucose, but
leaves the true underlying cause, viz. metabolic overload, un-
affected, and thus fails to impact upon the major complications
associated with T2DM [4–6]. It is assumed that diet-related
changes in lifestyle may reverse metabolic distortions in central
organs (and systemically), thereby exerting a beneficial effect on
causal paths of the disease.
Here we sought further evidence for the hypothesis that
normalizing blood glucose levels by itself is insufficient to reduce
the development of complications, and that removal of the
metabolic overload with dietary interventions may be more
efficacious. These hypotheses were tested in a diet-inducible
experimental model of disease, high-fat fed low-density lipoprotein
receptor-deficient (LDLr2/2) mice which develop multiple
T2DM-related complications in liver, aorta and kidney. Three
types of pharmacological interventions were tested, each of which
representing a specific category of drugs. The first category
encompassed conventional anti-diabetic drugs [7], viz. metformin,
a sulfonylurea compound (glibenclamide), two thiazolidinediones
(rosiglitazone and pioglitazone) and a DPP-4 inhibitor (sitagliptin).
PLOS ONE | www.plosone.org 1 February 2013 | Volume 8 | Issue 2 | e56122
The second category contained lipid-modulating compounds
(fenofibrate, the LXR agonist T0901317 and atorvastatin) which
also possess anti-inflammatory vasculoprotective properties [8].
Thirdly, we evaluated two anti-inflammatory compounds (rofe-
coxib and salicylate) with the aim to interfere in metabolic
inflammation, a driver of the pathogenesis towards complications
[9,10]. Finally and different from the drug approach, we explored
the effects of a specific lifestyle intervention, viz. reduction of the
metabolic pressure by switching to a low-fat chow diet.
To mimic the human disease situation, drug and lifestyle
interventions were started once early hallmarks of the disease
including central adiposity, hyperglycemia, hyperinsulinemia and
dyslipidemia were established. The different treatment strategies
were evaluated with respect to plasma risk factors (glucose, insulin,
triglycerides and cholesterol), diabetic complications (fatty liver,
microalbuminuria, atherosclerosis) as well as metabolic distur-
bances assessed by changes in metabolite, protein and gene
expression profiles in liver and plasma. The results may provide
insight into the shortcomings of current T2DM treatment
regimens, but could also open new avenues for novel therapeutic
paradigms based on a systems approach.
Materials and Methods
Animals Experiment and InterventionsAnimal experiments were approved by an independent
Committee on the Ethics of Animal Experiments (Zeist, The
Netherlands) (Permit Number: 2935). LDLr2/2 mice had free
access to low fat maintenance chow diet (Sniff R/M diet
V1530, Uden, The Netherlands) until the start of the study.
N= 132 animals were fed a high fat diet (HFD) for nine weeks
to established obesity-associated hyperglycemia, hyperinsuline-
mia, hypertriglyceridemia and hypercholesterolemia. Separate
animals (n = 9) remained on chow for the entire experiment
(reference age-matched control). The HFD-fed mice were
matched into thirteen groups based on body weight. The first
group (n= 9) was sacrificed immediately to define the condition
at the start of the interventions with drugs and lifestyle. The
second group (n = 15) was continued on HFD and remained
untreated. The pharmacological intervention groups (each n= 9)
received HFD supplemented with one of the following drugs (all
w/w): the anti- diabetic drug metformin (0.250%), glibenclamide
(0.010%), sitagliptin (0.020%), rosiglitazone (0.010%) and
pioglitazone (0.010%); the lipid modulating compounds fenofi-
brate (0.050%), T0901317 (0.010%) and atorvastatin (0.010%);
the anti-inflammatory compounds salicylate (0.40%) and rofe-
coxib (0.034%). The last intervention group (n= 9) was switched
back to chow (dietary lifestyle intervention; DLI). Spot urine
and 5 hr fasting blood samples were collected over time and
after 7 weeks of treatment, mice were sacrificed to analyze
organs.
Analyses in Plasma and UrinePlasma lipids were measured with kits 11489437 (cholesterol)
and 11488872 (triglycerides) from Roche Diagnostics (Almere,
The Netherlands) [11]. Plasma glucose was quantified by glucose
hexokinase method (Instruchemie, Delfzijl, The Netherlands) and
plasma insulin by ELISA (Ultrasensitive mouse insulin ELISA,
Mercodia, Uppsala, Sweden) to calculate QUICKI insulin
sensitive index as reported [12]. For analysis of cytokines and
hormones, Bio-Rad 23-multiplex (#171-F11241) and Bio-Plex_-
Pro-Mouse diabetes 8-plex (#171-F7001M) were used, respec-
tively. To assess glomerular barrier function, urinary albumin
(Exocell Inc. Philadelphia, PA, USA) and creatinine concentra-
tions were determined (Bethyl Laboratories Inc. Montgomery,
TX, USA).
Analysis of Atherosclerosis and HepatosteatosisAtherosclerosis was analyzed blindly in hematoxylin-phloxine-
saffron-stained serial cross-sections (n = 4 per mouse) of the aortic
arch (40 mm intervals) and scored essentially as described [13]
using an Olympus BX51 microscope and Cell̂D software
(Olympus, Zoeterwoude, The Netherlands).
Liver homogenates were prepared to extract lipids to quantify
steatosis by the Bligh-and-Dyer method using silica-gel-60 plates
and thin layer chromatography. A Hewlett Packard Scanjet 4500c
with Tina software (version-2.09) was used to integrate density
areas and calculate lipid concentrations.
Hepatic Transcriptome AnalysisTotal RNA was isolated using the NucleoSpinH RNA II kit from
Macherey-Nagel. The quality control of RNA samples, RNA
labelling and hybridisation were performed at ServiceXS (Leiden,
The Netherlands) as previously described [14]. Per sample, 750 ng
of cRNA was used to hybridise to the MouseRef-8 v2 Expression
BeadChip (Illumina, Inc., San Diego, CA, U.S.A.). Image analysis
and extraction of expression data were performed with Illumina
Genomestudio Gene Expression software using default settings.
The microarray data from this publication have been submitted to
the Array Express repository (accession number E-MTAB-1063)
and will be additionally available via Phenotype database http://
ls10ds.dbnp.org.
Microarray Data Preprocessing, Visualization, Statisticaland Pathway AnalysisThe probe-level, background subtracted expression values
were used as input for lumi package [15] of the R/
Bioconductor (http://www.bioconductor.org; http://www.r-
project.org) to perform quality control and a quantile normal-
ization. Unexpressed probes (p.0.01 in all experiments) were
removed from the further analyses, leaving 15725 probes for the
analysis. Differentially expressed probes were identified using the
limma package of the R/Bioconductor [16]. The calculated P-
values were corrected for multiple testing. False discovery rate
of 5% (q-value,0.05) was used as a threshold for significance of
the differential expression.
Hierarchical clustering of differentially expressed transcripts and
metabolites and proteins with significantly different concentrations
were performed in R (http://www.r-project.org), using Pearson
correlation to calculate the distance matrix and complete linkage
for hierarchical clustering. Identification of overrepresented Gene
Ontology functional categories among differentially expressed
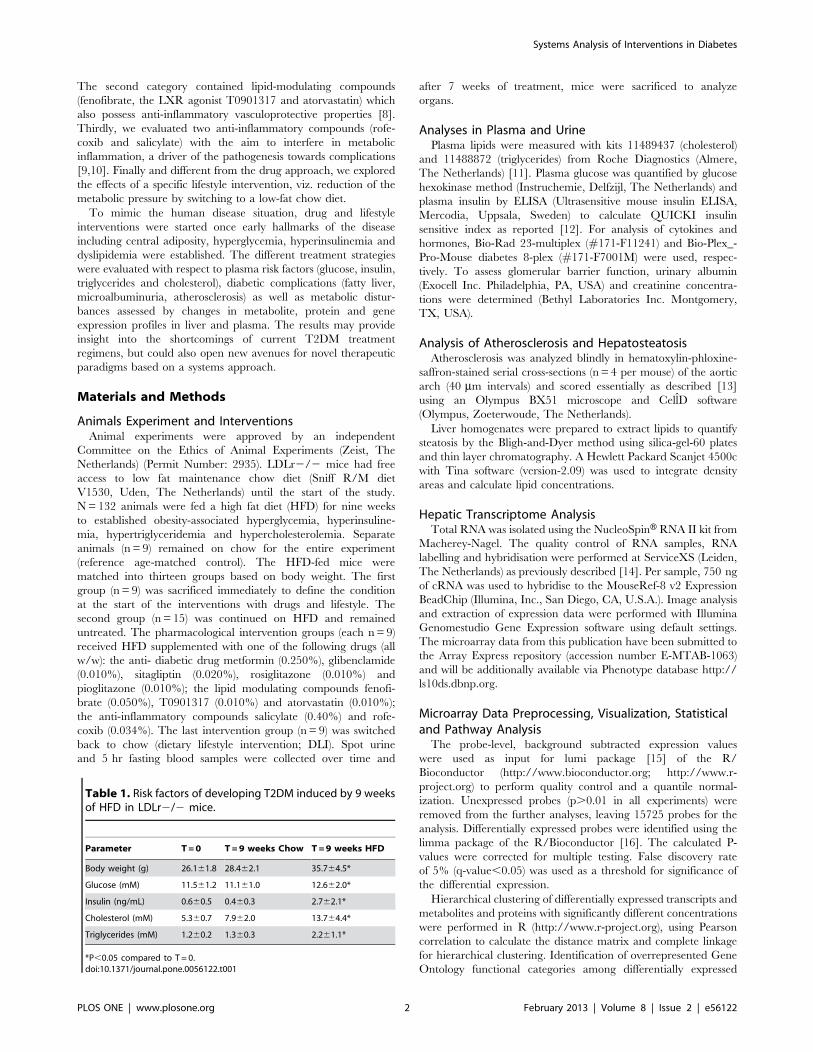
Table 1. Risk factors of developing T2DM induced by 9 weeksof HFD in LDLr2/2 mice.
Parameter T=0 T=9 weeks Chow T=9 weeks HFD
Body weight (g) 26.161.8 28.462.1 35.764.5*
Glucose (mM) 11.561.2 11.161.0 12.662.0*
Insulin (ng/mL) 0.660.5 0.460.3 2.762.1*
Cholesterol (mM) 5.360.7 7.962.0 13.764.4*
Triglycerides (mM) 1.260.2 1.360.3 2.261.1*
*P,0.05 compared to T = 0.doi:10.1371/journal.pone.0056122.t001
Systems Analysis of Interventions in Diabetes
PLOS ONE | www.plosone.org 2 February 2013 | Volume 8 | Issue 2 | e56122
probes was performed using MetaCore (GeneGo Inc.) and
DAVID Functional Annotation Clustering tool (version date
February 2012) [17]. Heatmaps representing P-values of the
selected functional categories across the treatment groups and
gene expression of selected genes was generated using Heatmap-
Viewer module within the GenePattern analysis suite [18]. The
network analysis of the differentially expressed probes in the
lifestyle group was performed using Ingenuity Pathways Analysis
(Ingenuity Systems. Available: www.ingenuity.com. Accessed
2012).
GC-MS Analysis of a Broad Range of Metabolites inPlasma and LiverThe GC-MS method used for the measurement of a broad
range of metabolites was reported previously [19]. In the
present study, 20 mL plasma or 10 mg lyophilized liver tissue
were extracted and further derivatized. For liver, a 30 minute
ultrasonic extraction was performed. The protocols for control
of performance of the GC-MS system, normalization of study
samples and correction of systematic errors and annotation of
metabolites have been reported in [20]. For quality control
commercially available mouse plasma and liver biopsies from
LDLr2/2 mice were used.
Liver Extraction and SPE LC-MS/MS Analysis ofEicosanoidsLiver samples were collected and directly supplemented with an
inhibitor cocktail containing paraoxon, BHT, AUDA, indometh-
acin, and PMSF to prevent eicosanoid oxidation and breakdown.
The liver samples were precipitated with methanol (1:5), and
incubated for 30 minutes on ice. Samples were subsequently
centrifuged (59 at 30006g and 4uC) and the supernatant was
transferred to a glass tube. Just before loading on activated HLB
columns, 4.75 mL MQ water containing 0.1% v/v FA was added
to the methanol extract, diluting the extract to 20% methanol.
After loading, the columns were washed with 2 mL 20% methanol
in MQ water containing 0.1% FA, and the columns were allowed
to dry for 15 minutes. The SPE columns were eluted with 2 mL
methanol and the samples were captured in tubes already
containing 20 mL of 10% glycerol and 500 mM BHT in ethanol.
The tubes were placed in a water bath at 40uC and the methanol
was evaporated under a gentle stream of nitrogen, reconstituted in
100 ml ethanol containing another internal standard (CUDA) and
immediately used for LC-MS/MS analysis as described by Balvers
et al. [21].
Biological Interpretation of Hepatic Metabolome DataFunctional analysis of the data was performed in Ingenuity
Pathway Analysis (www.ingenuity.com. Accessed 2012), MetaCore
(GeneGo Inc.), PubMed (http://www.ncbi.nlm.nih.gov), nutri-
tional metabolomics database for metabolites and proteins (http://
wiki.nugo.org) and Human Metabolome database (http://www.
hmdb.ca).
Statistical AnalysisAll data (except transcriptome) were analyzed for treatment
differences using analysis of variance (ANOVA) taking possible
cage-effects into account. If the ANOVA indicated an overall
treatment effect, comparisons between treatment-means were
performed. For all ANOVA models the ANOVA assumptions
were checked by looking at the residuals from the ANOVA model.
Data were log-transformed (natural logarithm) or rank-trans-
formed if necessary. If the absolute value of a residual exceeded
three times the residual standard deviation, the corresponding data
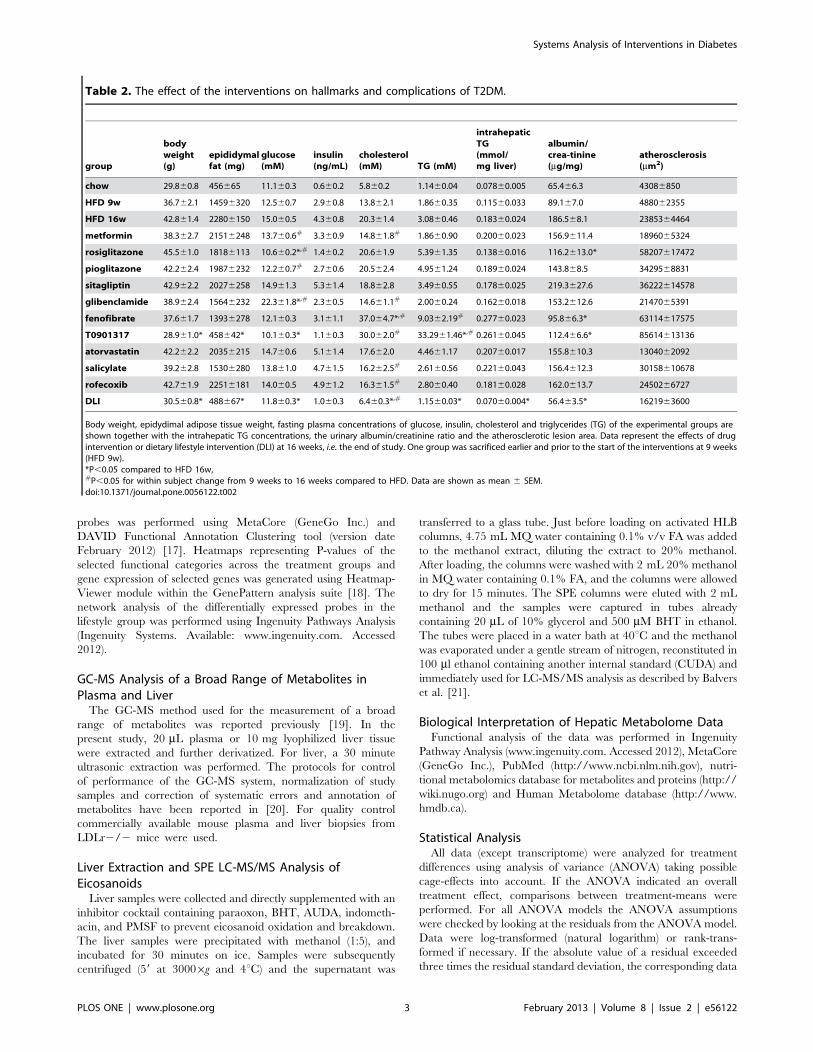
Table 2. The effect of the interventions on hallmarks and complications of T2DM.
group
bodyweight(g)
epididymalfat (mg)
glucose(mM)
insulin(ng/mL)
cholesterol(mM) TG (mM)
intrahepaticTG(mmol/mg liver)
albumin/crea-tinine(mg/mg)
atherosclerosis(mm2)
chow 29.860.8 456665 11.160.3 0.660.2 5.860.2 1.1460.04 0.07860.005 65.466.3 43086850
HFD 9w 36.762.1 14596320 12.560.7 2.960.8 13.862.1 1.8660.35 0.11560.033 89.167.0 488062355
HFD 16w 42.861.4 22806150 15.060.5 4.360.8 20.361.4 3.0860.46 0.18360.024 186.568.1 2385364464
metformin 38.362.7 21516248 13.760.6# 3.360.9 14.861.8# 1.8660.90 0.20060.023 156.9611.4 1896065324
rosiglitazone 45.561.0 18186113 10.660.2*,# 1.460.2 20.661.9 5.3961.35 0.13860.016 116.2613.0* 58207617472
pioglitazone 42.262.4 19876232 12.260.7# 2.760.6 20.562.4 4.9561.24 0.18960.024 143.868.5 3429568831
sitagliptin 42.962.2 20276258 14.961.3 5.361.4 18.862.8 3.4960.55 0.17860.025 219.3627.6 36222614578
glibenclamide 38.962.4 15646232 22.361.8*,# 2.360.5 14.661.1# 2.0060.24 0.16260.018 153.2612.6 2147065391
fenofibrate 37.661.7 13936278 12.160.3 3.161.1 37.064.7*,# 9.0362.19# 0.27760.023 95.866.3* 63114617575
T0901317 28.961.0* 458642* 10.160.3* 1.160.3 30.062.0# 33.2961.46*,# 0.26160.045 112.466.6* 85614613136
atorvastatin 42.262.2 20356215 14.760.6 5.161.4 17.662.0 4.4661.17 0.20760.017 155.8610.3 1304062092
salicylate 39.262.8 15306280 13.861.0 4.761.5 16.262.5# 2.6160.56 0.22160.043 156.4612.3 30158610678
rofecoxib 42.761.9 22516181 14.060.5 4.961.2 16.361.5# 2.8060.40 0.18160.028 162.0613.7 2450266727
DLI 30.560.8* 488667* 11.860.3* 1.060.3 6.460.3*,# 1.1560.03* 0.07060.004* 56.463.5* 1621963600
Body weight, epidydimal adipose tissue weight, fasting plasma concentrations of glucose, insulin, cholesterol and triglycerides (TG) of the experimental groups areshown together with the intrahepatic TG concentrations, the urinary albumin/creatinine ratio and the atherosclerotic lesion area. Data represent the effects of drugintervention or dietary lifestyle intervention (DLI) at 16 weeks, i.e. the end of study. One group was sacrificed earlier and prior to the start of the interventions at 9 weeks(HFD 9w).*P,0.05 compared to HFD 16w,#P,0.05 for within subject change from 9 weeks to 16 weeks compared to HFD. Data are shown as mean 6 SEM.doi:10.1371/journal.pone.0056122.t002
Systems Analysis of Interventions in Diabetes
PLOS ONE | www.plosone.org 3 February 2013 | Volume 8 | Issue 2 | e56122
point was removed from the data. Within subject changes over
time were analyzed with paired Student’s T-test. For GC-MS,
multiplex and eicosanoids data a Dunnett’s adjustment was used to
correct for multiple comparisons between the high fat treatment
and drug/lifestyle interventions. False discovery rate was used to
correct for multiple testing (significance threshold FDR,0.05).
The SAS statistical software package V9.1.3 (SAS institute Inc.,
North Carolina, USA) was used for univariate statistical analysis.
Data are presented as mean 6 SD, unless mentioned otherwise.
Results
Differential Effects of Drugs and Lifestyle Interventionson Risk FactorsPrior to intervention with pharmaceuticals or dietary lifestyle,
male LDLr2/2 mice were fed a high fat diet (HFD) for 9 weeks
to establish risk factors of developing T2DM including mild
obesity, hyperglycemia, hyperinsulinemia, hypercholesterolemia
and hypertriglyceridemia (Table 1). In week 9, the mice were
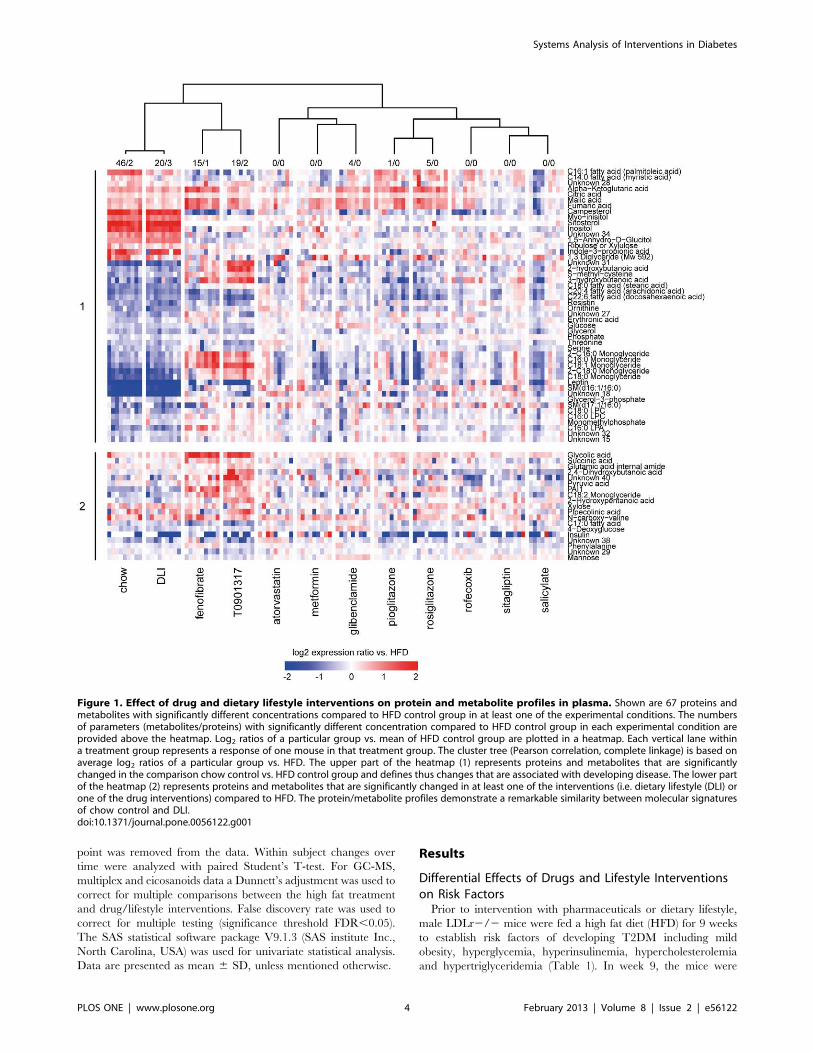
Figure 1. Effect of drug and dietary lifestyle interventions on protein and metabolite profiles in plasma. Shown are 67 proteins andmetabolites with significantly different concentrations compared to HFD control group in at least one of the experimental conditions. The numbersof parameters (metabolites/proteins) with significantly different concentration compared to HFD control group in each experimental condition areprovided above the heatmap. Log2 ratios of a particular group vs. mean of HFD control group are plotted in a heatmap. Each vertical lane withina treatment group represents a response of one mouse in that treatment group. The cluster tree (Pearson correlation, complete linkage) is based onaverage log2 ratios of a particular group vs. HFD. The upper part of the heatmap (1) represents proteins and metabolites that are significantlychanged in the comparison chow control vs. HFD control group and defines thus changes that are associated with developing disease. The lower partof the heatmap (2) represents proteins and metabolites that are significantly changed in at least one of the interventions (i.e. dietary lifestyle (DLI) orone of the drug interventions) compared to HFD. The protein/metabolite profiles demonstrate a remarkable similarity between molecular signaturesof chow control and DLI.doi:10.1371/journal.pone.0056122.g001
Systems Analysis of Interventions in Diabetes
PLOS ONE | www.plosone.org 4 February 2013 | Volume 8 | Issue 2 | e56122
Systems Analysis of Interventions in Diabetes
PLOS ONE | www.plosone.org 5 February 2013 | Volume 8 | Issue 2 | e56122
subjected to different interventions, for 7 weeks (Table 2). Body
weight in HFD-fed control mice continued to increase, while chow
control mice hardly gained weight. This effect was reflected by the
epididymal fat weight, which was significantly increased in HFD
mice compared to chow fed mice. The anti-diabetic drugs and
anti-inflammatory compounds had no significant effects on body
weight and epididymal fat. The LXR agonist T0901317 was the
only drug of the lipid modulating compounds that significantly
reduced body weight and epididymal fat compared to HFD at
t = 16 weeks. Dietary lifestyle intervention (DLI), i.e. switching to
a low-fat chow diet, resulted in a significant decrease in body
weight and epididymal fat mass. In week 16, the DLI group was
fully comparable to the control group which was kept on chow
during the entire experimental period.
Continuous HFD feeding until week 16 also further increased
fasting plasma glucose and insulin relative to week 9. Fasting
glucose and insulin remained stable and low in chow control mice.
The glucose-lowering drugs rosiglitazone and pioglitazone signif-
icantly decreased glucose, even below the starting level of the
intervention. Metformin significantly attenuated the increase in
plasma glucose compared to the increase observed in the HFD
group. Sitagliptin had no significant effects and glibenclamide
increased fasting glucose. Plasma insulin tended to decrease with
rosiglitazone, and the other anti-diabetic drugs had no significant
effects on insulin. Plasma glucose was also significantly reduced by
the lipid modulator T0901317, fenofibrate fully prevented a further
increase in glucose and atorvastatin attenuated hyperglycemia.
These effects were achieved in absence of significant effects on
plasma insulin (and T0901317 even tended to reduce insulin
levels). The anti-inflammatory drugs also slightly attenuated
a further increase in plasma glucose without affecting plasma
insulin. DLI fully normalized glucose and insulin levels which were
comparable to chow control.
Continuous HFD feeding also further increased plasma
cholesterol while cholesterol levels remained constant and low
on chow. Metformin and glibenclamide blocked the HFD-induced
elevation of cholesterol almost completely, while the other glucose
modulating drugs had no effect on plasma cholesterol. The lipid-
modulating drug atorvastatin also tended to attenuate an increase
in cholesterol whereas T0901317 and fenofibrate significantly
increased plasma cholesterol. Both anti-inflammatory drugs
attenuated the increase in plasma cholesterol. DLI was the only
intervention that reduced plasma cholesterol beyond the starting
level and comparable to chow control mice.
Similar to cholesterol, plasma triglycerides also increased
gradually with continuous HFD feeding and chow reference mice
remained low in plasma triglycerides. The glucose lowering agents
had no significant effects on plasma triglycerides. Fenofibrate and
T0901317 significantly increased triglycerides. Atorvastatin and
the anti-inflammatory drugs did not affect plasma triglycerides
while plasma triglyceride levels of the DLI group returned to chow
control levels.
Differential Effects of Drugs and Lifestyle Interventionson Diabetic ComplicationsWe next analyzed hepatic triglyceride concentrations, albumin/
creatinine ratio and atherosclerosis as measures of diabetic
complications in liver, kidney and vessel wall (Table 2). HFD
feeding resulted in liver steatosis which developed gradually over
time and which was characterized by significantly higher
intrahepatic triglyceride concentrations at the end of the study
relative to control chow. None of the drug interventions had
a significant effect on intrahepatic triglycerides. Rosiglitazone
attenuated the HFD-induced development of steatosis slightly and
fenofibrate and T0901317 even enhanced steatosis (all not
significant). By contrast, DLI significantly reduced intrahepatic
triglyceride levels and the livers of this group were comparable to
chow control.
The urinary albumin/creatinine ratio, a marker of renal
functioning and microvascular complications, increased gradually
with HFD feeding and was elevated compared to chow. Micro-
albuminuria was attenuated by rosiglitazone, while the other anti-
diabetic drugs had no significant effect. Fenofibrate and T0901317
treated mice exhibited a significantly lower albumin/creatinine
ratio than HFD controls, whereas atorvastatin and both anti-
inflammatory drugs had no effect. In DLI mice, the albumin/
creatinine ratio was fully normalized and similar to chow controls
indicating complete reversal of micro-albuminuria.
In week 16, HFD treated mice developed early atherosclerosis
and atherosclerotic plaques of moderate severity while chow
control animals hardly displayed lesions. Atherosclerosis was not
significantly affected by the drugs. Some drugs even tended to
enhance atherosclerosis; the anti-diabetic drug rosiglitazone and
the lipid-modulating drugs fenofibrate exhibited a greater lesion
area than HFD controls but the effect did not reach statistical
significance. Atorvastatin and DLI exhibited the smallest lesion
area and mainly mild lesions (not significant).
Effect of Interventions on Plasma Metabolome andProteomeTo infer the effect of interventions on HFD-induced alterations
of whole-body homeostasis, we profiled circulating plasma
metabolites and proteins (153 molecules in total, Dataset S1).
Compared to chow control, HFD treatment alone induced
pronounced and significant changes in the plasma metabolome
and proteome (Figure 1, Dataset S2). Changes include disease-
related metabolites such as glucose, 2-hydroxybutanoic acid, 3-
hydroxybutanoic acid, 1,5-anhydro-D-glucitol as well as endocrine
factors such as leptin and resistin (P,0.05) which reflect the
metabolic distortion of homeostasis in the circulation. HFD
treatment also affected the plasma concentrations of monoglycer-
ides and phospholipids, citric acid cycle intermediates, specific free
fatty acids and glycerol while circulating inflammatory cytokines
and branched chain amino acid concentrations remained un-
changed (Figure 2, Figure S1).
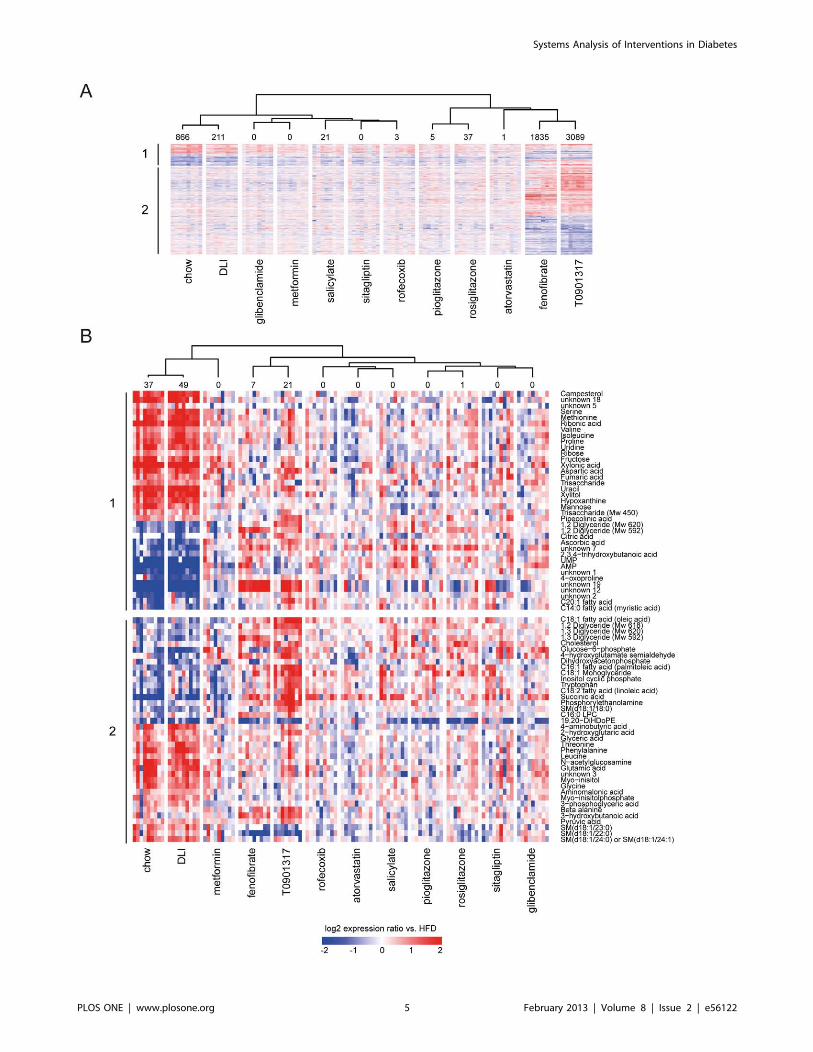
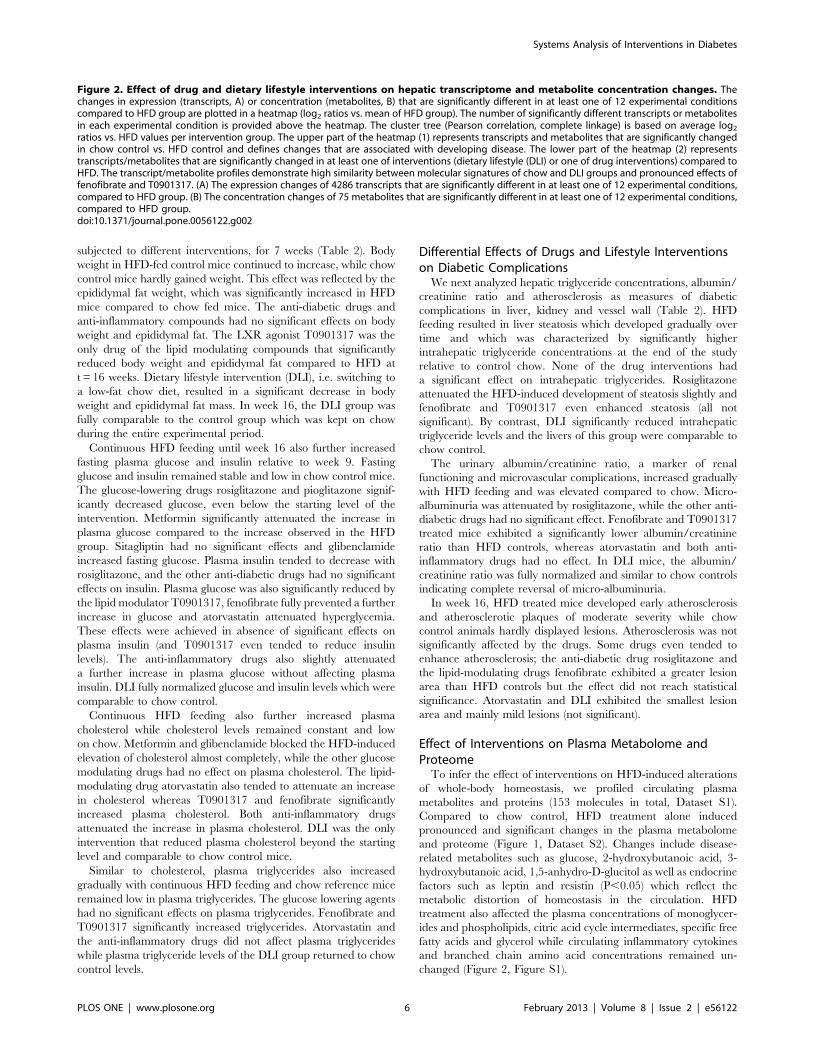
Figure 2. Effect of drug and dietary lifestyle interventions on hepatic transcriptome and metabolite concentration changes. Thechanges in expression (transcripts, A) or concentration (metabolites, B) that are significantly different in at least one of 12 experimental conditionscompared to HFD group are plotted in a heatmap (log2 ratios vs. mean of HFD group). The number of significantly different transcripts or metabolitesin each experimental condition is provided above the heatmap. The cluster tree (Pearson correlation, complete linkage) is based on average log2ratios vs. HFD values per intervention group. The upper part of the heatmap (1) represents transcripts and metabolites that are significantly changedin chow control vs. HFD control and defines changes that are associated with developing disease. The lower part of the heatmap (2) representstranscripts/metabolites that are significantly changed in at least one of interventions (dietary lifestyle (DLI) or one of drug interventions) compared toHFD. The transcript/metabolite profiles demonstrate high similarity between molecular signatures of chow and DLI groups and pronounced effects offenofibrate and T0901317. (A) The expression changes of 4286 transcripts that are significantly different in at least one of 12 experimental conditions,compared to HFD group. (B) The concentration changes of 75 metabolites that are significantly different in at least one of 12 experimental conditions,compared to HFD group.doi:10.1371/journal.pone.0056122.g002
Systems Analysis of Interventions in Diabetes
PLOS ONE | www.plosone.org 6 February 2013 | Volume 8 | Issue 2 | e56122
Systems Analysis of Interventions in Diabetes
PLOS ONE | www.plosone.org 7 February 2013 | Volume 8 | Issue 2 | e56122
Interventions with T0901317 and fenofibrate as well as DLI had
a pronounced effect on the plasma metabolome and proteome
profiles. The other drugs had no or minor effects on the plasma
metabolome and proteome, suggesting a more local action of these
drugs within their target tissues (Figure 1).
Hierarchical clustering analysis revealed that the DLI profile
strongly resembled the plasma metabolite and protein profile of
the chow control group, demonstrating that DLI reversed nearly
all HFD-induced distortions. By contrast, T0901317 and fenofi-
brate reversed the profiles only partially: the plasma concentration
of molecules related to citric acid cycle, amino acid metabolism,
urea cycle, satiety as well as adipokines were similar to control
group on chow, but ketone bodies and monoglycerides changed in
an opposite way, possibly pointing to a further, yet partial,
aggravation of specific metabolic distortions.
Effect of Interventions on the Liver Transcriptome andMetabolomeTo assess the impact of interventions on the homeostasis of
a central metabolic organ, we analyzed the liver by combined
transcriptomics and metabolomics (Figure 2, Dataset S2). The
lipid-modulating drugs T0901317 and fenofibrate (which target
the liver to activate the transcription factors LXR and PPARa,respectively) showed pronounced effects on the hepatic transcrip-
tome and metabolome. Rosiglitazone, pioglitazone and rofecoxib
affected the liver metabolome and transcriptome profiles to a much
lesser extent, and other drugs hardly had an effect. By contrast, the
liver transcriptome and metabolome profiles of the DLI and chow
control groups were remarkably alike. This is consistent with the
plasma profiling data and indicates that DLI reversed metabolic
distortions caused by HFD feeding.
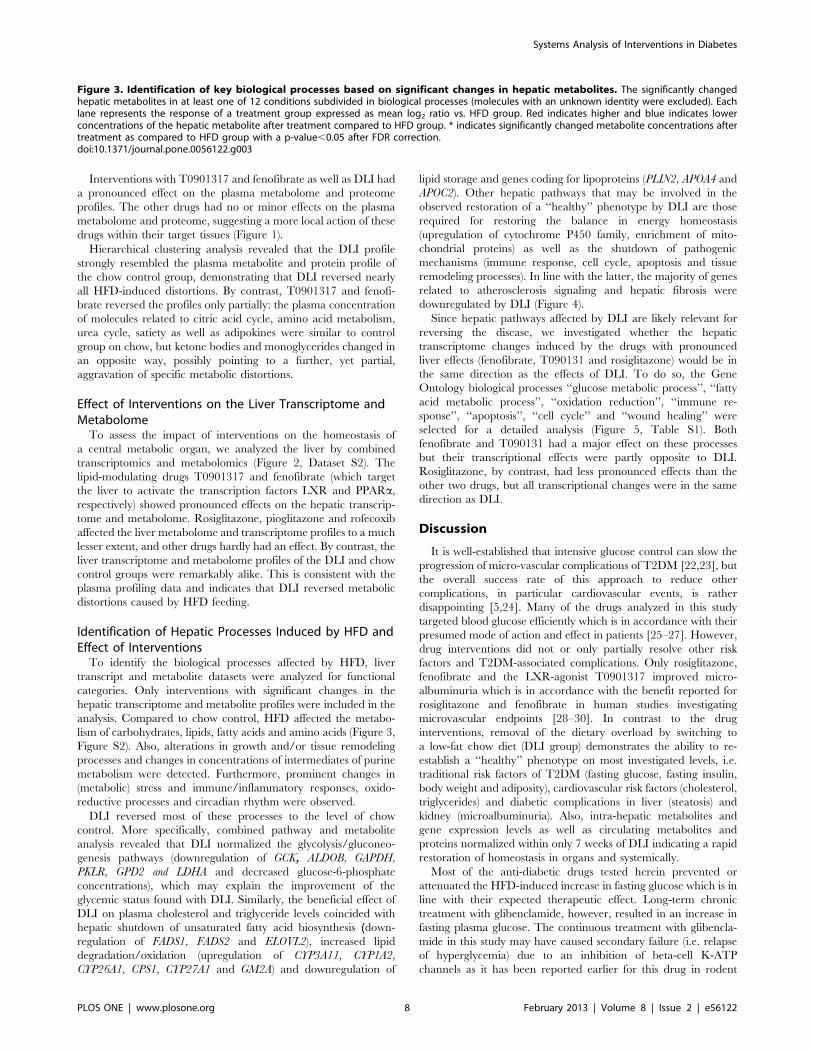
Identification of Hepatic Processes Induced by HFD andEffect of InterventionsTo identify the biological processes affected by HFD, liver
transcript and metabolite datasets were analyzed for functional
categories. Only interventions with significant changes in the
hepatic transcriptome and metabolite profiles were included in the
analysis. Compared to chow control, HFD affected the metabo-
lism of carbohydrates, lipids, fatty acids and amino acids (Figure 3,
Figure S2). Also, alterations in growth and/or tissue remodeling
processes and changes in concentrations of intermediates of purine
metabolism were detected. Furthermore, prominent changes in
(metabolic) stress and immune/inflammatory responses, oxido-
reductive processes and circadian rhythm were observed.
DLI reversed most of these processes to the level of chow
control. More specifically, combined pathway and metabolite
analysis revealed that DLI normalized the glycolysis/gluconeo-
genesis pathways (downregulation of GCK, ALDOB, GAPDH,
PKLR, GPD2 and LDHA and decreased glucose-6-phosphate
concentrations), which may explain the improvement of the
glycemic status found with DLI. Similarly, the beneficial effect of
DLI on plasma cholesterol and triglyceride levels coincided with
hepatic shutdown of unsaturated fatty acid biosynthesis (down-regulation of FADS1, FADS2 and ELOVL2), increased lipid
degradation/oxidation (upregulation of CYP3A11, CYP1A2,
CYP26A1, CPS1, CYP27A1 and GM2A) and downregulation of
lipid storage and genes coding for lipoproteins (PLIN2, APOA4 and
APOC2). Other hepatic pathways that may be involved in the
observed restoration of a ‘‘healthy’’ phenotype by DLI are those
required for restoring the balance in energy homeostasis
(upregulation of cytochrome P450 family, enrichment of mito-
chondrial proteins) as well as the shutdown of pathogenic
mechanisms (immune response, cell cycle, apoptosis and tissue
remodeling processes). In line with the latter, the majority of genes
related to atherosclerosis signaling and hepatic fibrosis were
downregulated by DLI (Figure 4).
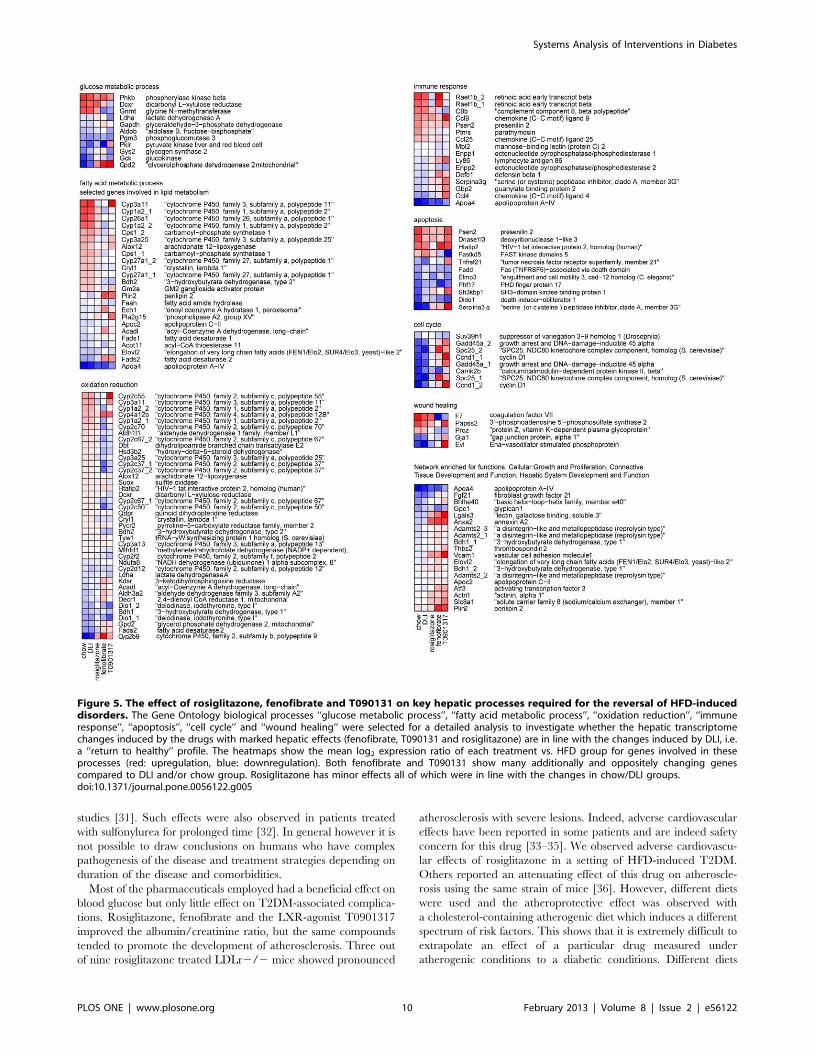
Since hepatic pathways affected by DLI are likely relevant for
reversing the disease, we investigated whether the hepatic
transcriptome changes induced by the drugs with pronounced
liver effects (fenofibrate, T090131 and rosiglitazone) would be in
the same direction as the effects of DLI. To do so, the Gene
Ontology biological processes ‘‘glucose metabolic process’’, ‘‘fatty
acid metabolic process’’, ‘‘oxidation reduction’’, ‘‘immune re-
sponse’’, ‘‘apoptosis’’, ‘‘cell cycle’’ and ‘‘wound healing’’ were
selected for a detailed analysis (Figure 5, Table S1). Both
fenofibrate and T090131 had a major effect on these processes
but their transcriptional effects were partly opposite to DLI.
Rosiglitazone, by contrast, had less pronounced effects than the
other two drugs, but all transcriptional changes were in the same
direction as DLI.
Discussion
It is well-established that intensive glucose control can slow the
progression of micro-vascular complications of T2DM [22,23], but
the overall success rate of this approach to reduce other
complications, in particular cardiovascular events, is rather
disappointing [5,24]. Many of the drugs analyzed in this study
targeted blood glucose efficiently which is in accordance with their
presumed mode of action and effect in patients [25–27]. However,
drug interventions did not or only partially resolve other risk
factors and T2DM-associated complications. Only rosiglitazone,
fenofibrate and the LXR-agonist T0901317 improved micro-
albuminuria which is in accordance with the benefit reported for
rosiglitazone and fenofibrate in human studies investigating
microvascular endpoints [28–30]. In contrast to the drug
interventions, removal of the dietary overload by switching to
a low-fat chow diet (DLI group) demonstrates the ability to re-
establish a ‘‘healthy’’ phenotype on most investigated levels, i.e.
traditional risk factors of T2DM (fasting glucose, fasting insulin,
body weight and adiposity), cardiovascular risk factors (cholesterol,
triglycerides) and diabetic complications in liver (steatosis) and
kidney (microalbuminuria). Also, intra-hepatic metabolites and
gene expression levels as well as circulating metabolites and
proteins normalized within only 7 weeks of DLI indicating a rapid
restoration of homeostasis in organs and systemically.
Most of the anti-diabetic drugs tested herein prevented or
attenuated the HFD-induced increase in fasting glucose which is in
line with their expected therapeutic effect. Long-term chronic
treatment with glibenclamide, however, resulted in an increase in
fasting plasma glucose. The continuous treatment with glibencla-
mide in this study may have caused secondary failure (i.e. relapse
of hyperglycemia) due to an inhibition of beta-cell K-ATP
channels as it has been reported earlier for this drug in rodent
Figure 3. Identification of key biological processes based on significant changes in hepatic metabolites. The significantly changedhepatic metabolites in at least one of 12 conditions subdivided in biological processes (molecules with an unknown identity were excluded). Eachlane represents the response of a treatment group expressed as mean log2 ratio vs. HFD group. Red indicates higher and blue indicates lowerconcentrations of the hepatic metabolite after treatment compared to HFD group. * indicates significantly changed metabolite concentrations aftertreatment as compared to HFD group with a p-value,0.05 after FDR correction.doi:10.1371/journal.pone.0056122.g003
Systems Analysis of Interventions in Diabetes
PLOS ONE | www.plosone.org 8 February 2013 | Volume 8 | Issue 2 | e56122
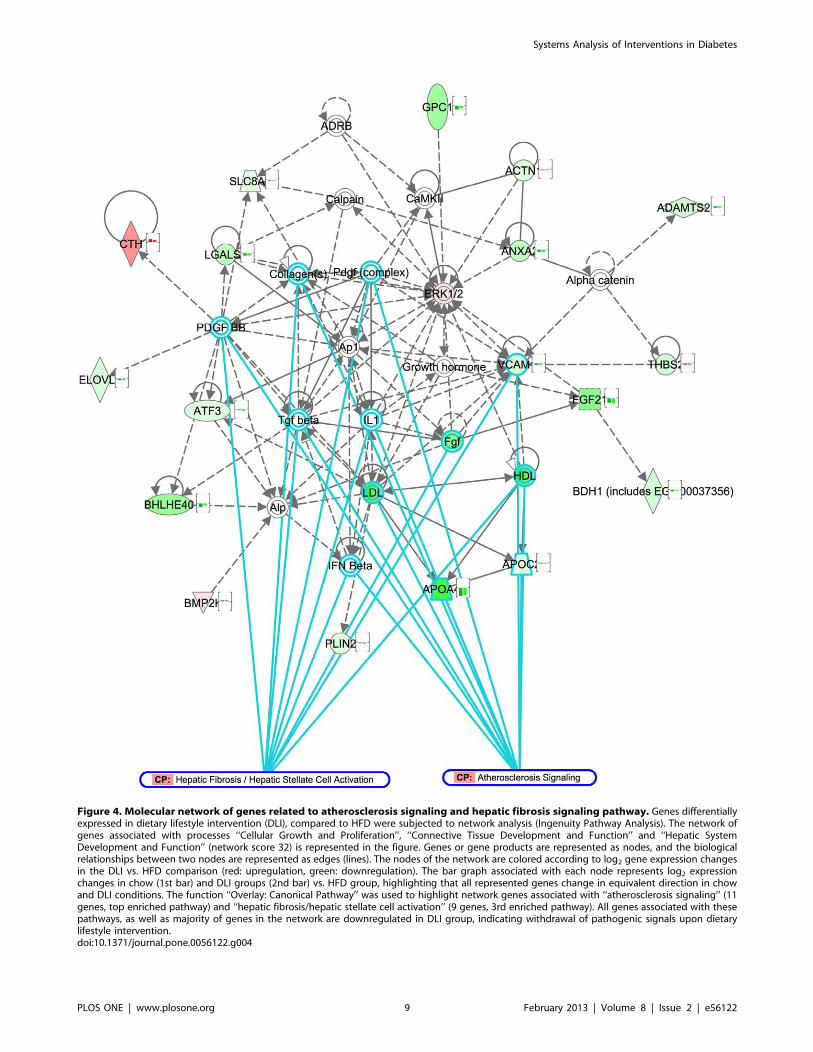
Figure 4. Molecular network of genes related to atherosclerosis signaling and hepatic fibrosis signaling pathway. Genes differentiallyexpressed in dietary lifestyle intervention (DLI), compared to HFD were subjected to network analysis (Ingenuity Pathway Analysis). The network ofgenes associated with processes ‘‘Cellular Growth and Proliferation’’, ‘‘Connective Tissue Development and Function’’ and ‘‘Hepatic SystemDevelopment and Function’’ (network score 32) is represented in the figure. Genes or gene products are represented as nodes, and the biologicalrelationships between two nodes are represented as edges (lines). The nodes of the network are colored according to log2 gene expression changesin the DLI vs. HFD comparison (red: upregulation, green: downregulation). The bar graph associated with each node represents log2 expressionchanges in chow (1st bar) and DLI groups (2nd bar) vs. HFD group, highlighting that all represented genes change in equivalent direction in chowand DLI conditions. The function ‘‘Overlay: Canonical Pathway’’ was used to highlight network genes associated with ‘‘atherosclerosis signaling’’ (11genes, top enriched pathway) and ‘‘hepatic fibrosis/hepatic stellate cell activation’’ (9 genes, 3rd enriched pathway). All genes associated with thesepathways, as well as majority of genes in the network are downregulated in DLI group, indicating withdrawal of pathogenic signals upon dietarylifestyle intervention.doi:10.1371/journal.pone.0056122.g004
Systems Analysis of Interventions in Diabetes
PLOS ONE | www.plosone.org 9 February 2013 | Volume 8 | Issue 2 | e56122
studies [31]. Such effects were also observed in patients treated
with sulfonylurea for prolonged time [32]. In general however it is
not possible to draw conclusions on humans who have complex
pathogenesis of the disease and treatment strategies depending on
duration of the disease and comorbidities.
Most of the pharmaceuticals employed had a beneficial effect on
blood glucose but only little effect on T2DM-associated complica-
tions. Rosiglitazone, fenofibrate and the LXR-agonist T0901317
improved the albumin/creatinine ratio, but the same compounds
tended to promote the development of atherosclerosis. Three out
of nine rosiglitazone treated LDLr2/2 mice showed pronounced
atherosclerosis with severe lesions. Indeed, adverse cardiovascular
effects have been reported in some patients and are indeed safety
concern for this drug [33–35]. We observed adverse cardiovascu-
lar effects of rosiglitazone in a setting of HFD-induced T2DM.
Others reported an attenuating effect of this drug on atheroscle-
rosis using the same strain of mice [36]. However, different diets
were used and the atheroprotective effect was observed with
a cholesterol-containing atherogenic diet which induces a different
spectrum of risk factors. This shows that it is extremely difficult to
extrapolate an effect of a particular drug measured under
atherogenic conditions to a diabetic conditions. Different diets
Figure 5. The effect of rosiglitazone, fenofibrate and T090131 on key hepatic processes required for the reversal of HFD-induceddisorders. The Gene Ontology biological processes ‘‘glucose metabolic process’’, ‘‘fatty acid metabolic process’’, ‘‘oxidation reduction’’, ‘‘immuneresponse’’, ‘‘apoptosis’’, ‘‘cell cycle’’ and ‘‘wound healing’’ were selected for a detailed analysis to investigate whether the hepatic transcriptomechanges induced by the drugs with marked hepatic effects (fenofibrate, T090131 and rosiglitazone) are in line with the changes induced by DLI, i.e.a ‘‘return to healthy’’ profile. The heatmaps show the mean log2 expression ratio of each treatment vs. HFD group for genes involved in theseprocesses (red: upregulation, blue: downregulation). Both fenofibrate and T090131 show many additionally and oppositely changing genescompared to DLI and/or chow group. Rosiglitazone has minor effects all of which were in line with the changes in chow/DLI groups.doi:10.1371/journal.pone.0056122.g005
Systems Analysis of Interventions in Diabetes
PLOS ONE | www.plosone.org 10 February 2013 | Volume 8 | Issue 2 | e56122
may induce different disease pathways within the vasculature and
the factors which participate in the disease process may differ.
T0901317 treatment increased plasma triglycerides and choles-
terol levels as reported previously for this drug by us and others [37–
39]. Under conditions of experimental T2DM, T0901317 treated
mice tended to develop more atherosclerosis than the HFD control
group. In absence of conditions of T2DM, T0901317 treatment
diminished the lesion load [38]. A recent study, performed in
LDLr2/2 mice, shows differential pro- and anti-atherogenic
effects of T0901317 depending on the vascular bed analyzed [40]
which may explain the discrepancy. Another explanation may be
related to the different diets used (and thus cardiovascular risk factors
induced) as outlined above for rosiglitazone. Indeed, studies showing
atheroprotective effects of T09031317 employed atherogenic diets
which contain high concentrations of cholesterol [37] or cholester-
ol/cholate [38]. TheHFDused in hereinwas not supplementedwith
cholesterol. Because LXR activators are stimulating cholesterol
efflux (as part of their atheroprotective effect) it is likely that
differences in cholesterol content of diets may skew a disease model
towards a particular phenotype inwhich cholesterol trafficking plays
a greater role.
An important finding of this study is that the disease process is
reversible and that risk factors and associated early pathologies
(micro-albuminuria, hepatosteatosis) can be resolved. It requires
further analyses to investigate whether the disease can be reversed
at all stages or whether there is a ‘point of no return’. The fact that
atherosclerosis in the DLI group was not resolved within a period
of 7 weeks suggests that such a point may exist for macrovascular
complications. On the other hand, it is also possible that
restoration of macrovascular damage is a relatively slow process
which requires either more time to regress as reported [41], or
pharmacotherapy [37,42].
Consistent with the pronounced effect of DLI herein, early
intervention with intensive lifestyle reduces the cardiovascular risk
and improves the glucose tolerance profile in subjects at risk for
T2DM [43]. Also, a meta-analysis of thirteen human studies
investigating the effect of lifestyle interventions points to a reversion
of early diabetic phenotype with lifestyle [44] which is consistent
with our findings. Data of this meta-analysis however do not allow
to assess whether these benefits are sustained and will translate into
longer term prevention of cardiovascular disease.
Multiple risk factors can contribute to T2DM development in an
individual patient, and the nature of the underlying disease processes
can vary between patients. Targeting single targets or single risk
factors – for instance using a ‘one drug, one target approach’ - is
likely an ineffective strategy to resolve the entire complexity of the
disease phenotype. Restoring the balance in one physiological
process may lead to re-routing of the problem to other part(s) of the
system. Combinations of drug therapies may cover multiple disease-
associated manifestations, but have the increased likelihood of
undesirable side effects as a tradeoff [45]. Lifestyle intervention does
not act on the disease symptoms but rather withdraws the cause of
disease (i.e. metabolic pressure). Consequently, the problem is
tackled at its origin and therefore has a realistic potential to
systemically reverse the disease. It is of importance to gain further
insight into themolecularmechanisms of DLI in order to harmonize
lifestyle and pharmacotherapy optimally.
Besides the evidently relevant processes, such as glucose, lipid/
fatty-acid metabolism and inflammation, the present study
identified processes related to the redox status of the cell, cell
cycle/apoptosis and tissue remodeling as vital for re-establishing
the health phenotype by DLI. This supports emerging therapeutic
approaches for metabolic disease such as restoring endoplasmic
reticulum function and stress [46].
Taken together, the presented findings provide insight into the
limitations of current T2DM treatment regimens andmay open new
avenues for novel therapeutic paradigms based on a systems
approach. DLI has the potential to fully resolve HFD induces
metabolic distortions in the liver and systemically, and stops the
progression of T2DM and important complications associated with
it. Insight from DLI may be used for development of rational drug
(combination) therapies that mimic the beneficial effects of DLI.
Supporting Information
Figure S1 Biological processes represented amongsignificantly changed plasma metabolites and proteins.The significantly changed plasma metabolites and proteins in at
least one of 12 conditions are subdivided in biological processes
(molecules with an unknown identity were excluded). Each lane
represents the response of a treatment group expressed as mean
log2 ratios vs. HFD group. Red indicates higher and blue indicates
lower concentrations of the plasma molecule after treatment
compared to HFD group. *indicates significantly changed
molecule concentrations after treatment as compared to HFD
group with a p-value,0.05 after FDR correction.
(PDF)
Figure S2 Biological processes affected by drug anddietary lifestyle interventions on a transcriptome level.Representative Gene Ontology Biological Process categories
overrepresented among differentially expressed transcripts in
dietary lifestyle (DLI) and drug intervention groups (vs. HFD),
and their corresponding p-values (heatmap). The clustering tree
highlights a similarity between process-enrichment profiles of
chow control and DLI groups and between fenofibrate and
T0901317 groups.
(PDF)
Table S1 The effect of rosiglitazone, fenofibrate andT090131 on key hepatic processes required for thereversal of HFD-induced disorders. Gene Ontology bi-
ological processes ‘‘glucose metabolic process’’, ‘‘fatty acid
metabolic process’’, ‘‘oxidation reduction’’, ‘‘immune response’’,
‘‘apoptosis’’, ‘‘cell cycle’’ and ‘‘wound healing’’ were selected for
a detailed analysis to compare to the changes induced by DLI, i.e.
a ‘‘return to healthy’’ profile. The number of genes in these
processes that are regulated in the same or opposite manner
between T090131, fenofibrate or rosiglitazone group and DLI
group are shown.
(PDF)
Dataset S1 Overview of metabolites and proteins ana-lyzed in plasma and liver. GCMS metabolic profiling
platform nr 1, multiplex proteome analyses platform nr 2 and
Eicosanoid LCMS analyses platform nr 3.
(XLS)
Dataset S2 Significantly changed plasma and hepaticmolecules in the different treatments (week 16) com-pared to 16 weeks of HFD. FDR significance: 0 =. not
significant after FDR correction. FDR significance: 1 =.
significant after FDR correction. Abbreviations used: DMCs:
Differentially changed Metabolite Concentrations, DPCs: Differ-
entially changed Protein Concentrations. DEPs: Differentially
Expressed Probes, FC: fold change, FDR: false discovery rate.
LDLR: low density lipoprotein receptor-deficient mice, DLI:
Dietary Lifestyle Intervention.
(XLS)
Systems Analysis of Interventions in Diabetes
PLOS ONE | www.plosone.org 11 February 2013 | Volume 8 | Issue 2 | e56122
Acknowledgments
The authors are grateful to Erik Offerman, Rob Mariman and Annie Jie
for analytical help. We also thank Marjan van Erk for assistance in analysis
of transcriptome data, and Jildau Bouwman and Jeroen Wesbeek for
making transcriptome data available via Phenotype database (http://www.
dbnp.org/). We would like to thank Alain van Gool for critical reading of
the manuscript and scientific advice.
Author Contributions
Conceived and designed the experiments: PYW LV NC T. Kooistra BVO
RK. Performed the experiments: PYW WVD. Analyzed the data: MR
PYW SW T. Kelder VSG KT WVD BvdWvdV JHMS RK. Wrote the
paper: MR PYW SW T. Kooistra BVO RK.
References
1. Nolan CJ, Damm P, Prentki M (2011) Type 2 diabetes across generations: Frompathophysiology to prevention and management. Lancet 378(9786): 169–181.
2. Whiting DR, Guariguata L, Weil C, Shaw J (2011) IDF diabetes atlas: Globalestimates of the prevalence of diabetes for 2011 and 2030. Diabetes Res Clin
Pract 94(3): 311–321.
3. Little PJ, Chait A, Bobik A (2011) Cellular and cytokine-based inflammatoryprocesses as novel therapeutic targets for the prevention and treatment of
atherosclerosis. Pharmacol Ther 131(3): 255–268.4. Action to Control Cardiovascular Risk in Diabetes Study Group, Gerstein HC,
Miller ME, Byington RP, Goff DC Jr, et al. (2008) Effects of intensive glucose
lowering in type 2 diabetes. N Engl J Med 358(24): 2545–2559.5. Turnbull FM, Abraira C, Anderson RJ, Byington RP, Chalmers JP, et al. (2009)
Intensive glucose control and macrovascular outcomes in type 2 diabetes.Diabetologia 52(11): 2288–2298.
6. Yudkin JS, Richter B, Gale EA (2010) Intensified glucose lowering in type 2diabetes: Time for a reappraisal. Diabetologia 53(10): 2079–2085.
7. Ismail-Beigi F (2012) Clinical practice. glycemic management of type 2 diabetes
mellitus. N Engl J Med 366(14): 1319–1327.8. Kleemann R, Bureeva S, Perlina A, Kaput J, Verschuren L, et al. (2011) A
systems biology strategy for predicting similarities and differences of drug effects:Evidence for drug-specific modulation of inflammation in atherosclerosis. BMC
Syst Biol 5: 125.
9. Hansson GK, Hermansson A (2011) The immune system in atherosclerosis. NatImmunol 12(3): 204–212.
10. Hotamisligil GS (2008) Inflammation and endoplasmic reticulum stress inobesity and diabetes. Int J Obes (Lond) 32 Suppl 7: S52–4.
11. Wielinga PY, Yakala GK, Heeringa P, Kleemann R, Kooistra T (2011)Beneficial effects of alternate dietary regimen on liver inflammation, athero-
sclerosis and renal activation. PLoS One 6(3): e18432.
12. Katz A, Nambi SS, Mather K, Baron AD, Follmann DA, et al. (2000)Quantitative insulin sensitivity check index: A simple, accurate method for
assessing insulin sensitivity in humans. J Clin Endocrinol Metab 85(7): 2402–2410.
13. Kooistra T, Verschuren L, de Vries-van der Weij J, Koenig W, Toet K, et al.
(2006) Fenofibrate reduces atherogenesis in ApoE*3Leiden mice: Evidence formultiple antiatherogenic effects besides lowering plasma cholesterol. Arterioscler
Thromb Vasc Biol 26(10): 2322–2330.14. Radonjic M, de Haan JR, van Erk MJ, van Dijk KW, van den Berg SA, et al.
(2009) Genome-wide mRNA expression analysis of hepatic adaptation to high-
fat diets reveals switch from an inflammatory to steatotic transcriptionalprogram. PLoS One 4(8): e6646.
15. Du P, Kibbe WA, Lin SM (2008) Lumi: A pipeline for processing illuminamicroarray. Bioinformatics 24(13): 1547–1548.
16. Smyth GK (2004) Linear models and empirical bayes methods for assessingdifferential expression in microarray experiments. Stat Appl Genet Mol Biol 3:
Article3.
17. Dennis G Jr, Sherman BT, Hosack DA, Yang J, Gao W, et al. (2003) DAVID:Database for annotation, visualization, and integrated discovery. Genome Biol
4(5): P3.18. Reich M, Liefeld T, Gould J, Lerner J, Tamayo P, et al. (2006) GenePattern 2.0.
Nat Genet 38(5): 500–501.
19. Koek MM, Jellema RH, van der Greef J, Tas AC, Hankemeier T (2011)Quantitative metabolomics based on gas chromatography mass spectrometry:
Status and perspectives. Metabolomics 7(3): 307–328.20. Wopereis S, Rubingh CM, van Erk MJ, Verheij ER, van Vliet T, et al. (2009)
Metabolic profiling of the response to an oral glucose tolerance test detects subtlemetabolic changes. PLoS One 4(2): e4525.
21. Balvers MG, Verhoeckx KC, Bijlsma S, Rubingh CM, Meijerink J, et al. (2012)
Fish oil and inflammatory status alter the n-3 to n-6 balance of theendocannabinoid and oxylipin metabolomes in mouse plasma and tissue.
Metabolomics 8(6): 1130–1147.22. UK Prospective Diabetes Study (UKDPS) Group (1998) Intensive blood-glucose
control with sulphonylureas or insulin compared with conventional treatment
and risk of complications in patients with type 2 diabetes (UKPDS 33). UKprospective diabetes study (UKPDS) group. Lancet 352(9131): 837–853.
23. Terry T, Raravikar K, Chokrungvaranon N, Reaven PD (2012) Does aggressiveglycemic control benefit macrovascular and microvascular disease in type 2
diabetes? insights from ACCORD, ADVANCE, and VADT. Curr Cardiol Rep14(1): 79–88.
24. Yudkin JS, Richter B, Gale EA (2011) Intensified glucose control in type 2diabetes–whose agenda? Lancet 377(9773): 1220–1222.
25. Krentz AJ, Bailey CJ (2005) Oral antidiabetic agents: Current role in type 2diabetes mellitus. Drugs 65(3): 385–411.
26. Kahn SE, Haffner SM, Heise MA, Herman WH, Holman RR, et al. (2006)
Glycemic durability of rosiglitazone, metformin, or glyburide monotherapy.N Engl J Med 355(23): 2427–2443.
27. Dluhy RG, McMahon GT (2008) Intensive glycemic control in the ACCORDand ADVANCE trials. N Engl J Med 358(24): 2630–2633.
28. Pistrosch F, Herbrig K, Kindel B, Passauer J, Fischer S, et al. (2005)
Rosiglitazone improves glomerular hyperfiltration, renal endothelial dysfunc-tion, and microalbuminuria of incipient diabetic nephropathy in patients.
Diabetes 54(7): 2206–2211.29. Ansquer JC, Foucher C, Rattier S, Taskinen MR, Steiner G, et al. (2005)
Fenofibrate reduces progression to microalbuminuria over 3 years in a placebo-controlled study in type 2 diabetes: Results from the diabetes atherosclerosis
intervention study (DAIS). Am J Kidney Dis 45(3): 485–493.
30. Wierzbicki AS (2006) FIELDS of dreams, fields of tears: A perspective on thefibrate trials. Int J Clin Pract 60(4): 442–449.
31. Remedi MS, Nichols CG (2008) Chronic antidiabetic sulfonylureas in vivo:Reversible effects on mouse pancreatic beta-cells. PLoS Med 5(10): e206.
32. Riedel AA, Heien H, Wogen J, Plauschinat CA (2007) Loss of glycemic control
in patients with type 2 diabetes mellitus who were receiving initial metformin,sulfonylurea, or thiazolidinedione monotherapy. Pharmacotherapy 27(8): 1102–
1110.33. Abbas A, Blandon J, Rude J, Elfar A, Mukherjee D (2012) PPAR- gamma
agonist in treatment of diabetes: Cardiovascular safety considerations.Cardiovasc Hematol Agents Med Chem 10(2): 124–134.
34. Tolman KG (2011) The safety of thiazolidinediones. Expert Opin Drug Saf
10(3): 419–428.35. Friedland SN, Leong A, Filion KB, Genest J, Lega IC, et al. (2012) The
cardiovascular effects of peroxisome proliferator-activated receptor agonists.Am J Med 125(2): 126–133.
36. Gupte AA, Liu JZ, Ren Y, Minze LJ, Wiles JR, et al. (2010) Rosiglitazone
attenuates age- and diet-associated nonalcoholic steatohepatitis in male low-density lipoprotein receptor knockout mice. Hepatology 52(6): 2001–2011.
37. Verschuren L, de Vries-van der Weij J, Zadelaar S, Kleemann R, Kooistra T.(2009) LXR agonist suppresses atherosclerotic lesion growth and promotes lesion
regression in apoE*3Leiden mice: Time course and mechanisms. J Lipid Res
50(2): 301–311.38. Terasaka N, Hiroshima A, Koieyama T, Ubukata N, Morikawa Y, et al. (2003)
T-0901317, a synthetic liver X receptor ligand, inhibits development ofatherosclerosis in LDL receptor-deficient mice. FEBS Lett 536(1–3): 6–11.
39. Peng D, Hiipakka RA, Xie JT, Reardon CA, Getz GS, et al. (2010) Differentialeffects of activation of liver X receptor on plasma lipid homeostasis in wild-type
and lipoprotein clearance-deficient mice. Atherosclerosis 208(1): 126–133.
40. Peng D, Hiipakka RA, Reardon CA, Getz GS, Liao S (2009) Differential anti-atherosclerotic effects in the innominate artery and aortic sinus by the liver X
receptor agonist T0901317. Atherosclerosis 203(1): 59–66.41. Gijbels MJ, van der CM, van dL, Emeis JJ, Havekes LM, et al. (1999)
Progression and regression of atherosclerosis in APOE3-leiden transgenic mice:
An immunohistochemical study. Atherosclerosis 143(1): 15–25.42. Rayner KJ, Sheedy FJ, Esau CC, Hussain FN, Temel RE, et al. (2011)
Antagonism of miR-33 in mice promotes reverse cholesterol transport andregression of atherosclerosis. J Clin Invest 121(7): 2921–2931.
43. Goldberg RB, Temprosa M, Haffner S, Orchard TJ, Ratner RE, et al. (2009)Effect of progression from impaired glucose tolerance to diabetes on
cardiovascular risk factors and its amelioration by lifestyle and metformin
intervention: The diabetes prevention program randomized trial by the diabetesprevention program research group. Diabetes Care 32(4): 726–732.
44. Dunkley AJ, Charles K, Gray LJ, Camosso-Stefinovic J, Davies MJ, et al. (2012)Effectiveness of interventions for reducing diabetes and cardiovascular disease
risk in people with metabolic syndrome: Systematic review and mixed treatment
comparison meta-analysis. Diabetes Obes Metab.45. Grundy SM (2009) Advancing drug therapy of the metabolic syndrome. Nat Rev
Drug Discov 8(5): 341–341.46. Engin F, Hotamisligil GS (2010) Restoring endoplasmic reticulum function by
chemical chaperones: An emerging therapeutic approach for metabolic diseases.Diabetes Obes Metab 12 Suppl 2: 108–115.
Systems Analysis of Interventions in Diabetes
PLOS ONE | www.plosone.org 12 February 2013 | Volume 8 | Issue 2 | e56122