Embed Size (px)
Citation preview
Dispersion coherence and noise
of Fourier domain mode locked lasers
Benjamin R Biedermann Wolfgang Wieser Christoph M Eigenwillig
Thomas Klein and Robert Huber
Lehrstuhl fuumlr BioMolekulare Optik Fakultaumlt fuumlr Physik Ludwig-Maximilians-Universitaumlt Muumlnchen
Oettingenstr 67 80538 Munich Germany
Corresponding author RobertHuberPhysikUni-MuenchenDE
Abstract We report on the effect of chromatic dispersion on coherence
length and noise of Fourier Domain Mode Locked (FDML) lasers An
FDML laser with a sweep range of 100nm around 1550nm has been
investigated Cavity configurations with and without dispersion
compensation have been analyzed using different widths of the intra-cavity
optical band-pass filter The measurements are compared to non-FDML
wavelength swept laser sources Based on these observations a simple
model is developed providing a connection between timing photon cavity
lifetime and characteristic time constant of the filter In an optimized
configuration an instantaneous laser linewidth of 20pm is observed
corresponding to a 10x narrowing compared to the intra-cavity optical band-
pass filter A relative intensity noise of -133dBcHz or 02 at 100MHz
detection bandwidth during sweep operation is observed For optimum
operation the filter drive frequency has to be set within 2ppm or 120mHz at
51kHz
2009 Optical Society of America
OCIS codes (1403600) Lasers tunable (1104500) Imaging systems Optical coherence
tomography (1203180) Instrumentation measurement and metrology Interferometry
(1104280) Noise in imaging systems (2602030) Dispersion (1704500) Optical coherence
tomography
References and links
1 R Huber M Wojtkowski and J G Fujimoto Fourier Domain Mode Locking (FDML) A new laser
operating regime and applications for optical coherence tomography Opt Express 14 3225-3237 (2006)
2 R Huber M Wojtkowski K Taira J G Fujimoto and K Hsu Amplified frequency swept lasers for
frequency domain reflectometry and OCT imaging design and scaling principles Opt Express 13 3513-
3528 (2005)
3 D Huang E A Swanson C P Lin J S Schuman W G Stinson W Chang M R Hee T Flotte K
Gregory C A Puliafito and J G Fujimoto Optical Coherence Tomography Science 254 1178-1181
(1991)
4 S H Yun G J Tearney J F de Boer N Iftimia and B E Bouma High-speed optical frequency-domain
imaging Opt Express 11 2953-2963 (2003)
5 S H Yun C Boudoux G J Tearney and B E Bouma High-speed wavelength-swept semiconductor
laser with a polygon-scanner-based wavelength filter Opt Lett 28 1981-1983 (2003)
6 R Huber M Wojtkowski J G Fujimoto J Y Jiang and A E Cable Three-dimensional and C-mode
OCT imaging with a compact frequency swept laser source at 1300 nm Opt Express 13 10523-10538
(2005)
7 M Y Jeon J Zhang and Z P Chen Characterization of Fourier domain mode-locked wavelength swept
laser for optical coherence tomography imaging Opt Express 16 3727-3737 (2008)
8 M Y Jeon J Zhang Q Wang and Z Chen High-speed and wide bandwidth Fourier domain mode-locked
wavelength swept laser with multiple SOAs Opt Express 16 2547-2554 (2008)
9 G Y Liu A Mariampillai B A Standish N R Munce X J Gu and I A Vitkin High power
wavelength linearly swept mode locked fiber laser for OCT imaging Opt Express 16 14095-14105 (2008)
10 Y Mao C Flueraru S Sherif and S Chang High performance wavelength-swept laser with mode-locking
technique for optical coherence tomography Opt Commun 282 88-92 (2009)
11 D C Adler R Huber and J G Fujimoto Phase-sensitive optical coherence tomography at up to 370000
lines per second using buffered Fourier domain mode-locked lasers Opt Lett 32 626-628 (2007)
106598 - $1500 USD Received 26 Jan 2009 revised 24 Apr 2009 accepted 27 Apr 2009 published 29 May 2009
(C) 2009 OSA 8 June 2009 Vol 17 No 12 OPTICS EXPRESS 9947
12 T Klein W Wieser B R Biedermann C M Eigenwillig G Palte and R Huber Raman-pumped
Fourier-domain mode-locked laser analysis of operation and application for optical coherence tomography
Opt Lett 33 2815-2817 (2008)
13 J J Armstrong M S Leigh D D Sampson J H Walsh D R Hillman and P R Eastwood Quantitative
upper airway imaging with anatomic optical coherence tomography American Journal of Respiratory and
Critical Care Medicine 173 226-233 (2006)
14 D C Adler S W Huang R Huber and J G Fujimoto Photothermal detection of gold nanoparticles
using phase-sensitive optical coherence tomography Opt Express 16 4376-4393 (2008)
15 D C Adler J Stenger I Gorczynska H Lie T Hensick R Spronk S Wolohojian N Khandekar J Y
Jiang S Barry A E Cable R Huber and J G Fujimoto Comparison of three-dimensional optical
coherence tomography and high resolution photography for art conservation studies Opt Express 15
15972-15986 (2007)
16 P M Andrews Y Chen M L Onozato S W Huang D C Adler R A Huber J Jiang S E Barry A E
Cable and J G Fujimoto High-resolution optical coherence tomography imaging of the living kidney
Laboratory Investigation 88 441-449 (2008)
17 R Huber D C Adler V J Srinivasan and J G Fujimoto Fourier domain mode locking at 1050 nm for
ultra-high-speed optical coherence tomography of the human retina at 236000 axial scans per second Opt
Lett 32 2049-2051 (2007)
18 L A Kranendonk X An A W Caswell R E Herold S T Sanders R Huber J G Fujimoto Y Okura
and Y Urata High speed engine gas thermometry by Fourier-domain mode-locked laser absorption
spectroscopy Opt Express 15 15115-15128 (2007)
19 L A Kranendonk R Huber J G Fujimoto and S T Sanders Wavelength-agile H2O absorption
spectrometer for thermometry of general combustion gases Proc Combust Inst 31 783-790 (2007)
20 V J Srinivasan D C Adler Y L Chen I Gorczynska R Huber J S Duker J S Schuman and J G
Fujimoto Ultrahigh-Speed Optical Coherence Tomography for Three-Dimensional and En Face Imaging of
the Retina and Optic Nerve Head Invest Ophthalmol Visual Sci 49 5103-5110 (2008)
21 D C Adler Y Chen R Huber J Schmitt J Connolly and J G Fujimoto Three-dimensional
endomicroscopy using optical coherence tomography Nature Photonics 1 709-716 (2007)
22 S W Huang A D Aguirre R A Huber D C Adler and J G Fujimoto Swept source optical coherence
microscopy using a Fourier domain mode-locked laser Opt Express 15 6210-6217 (2007)
23 M W Jenkins D C Adler M Gargesha R Huber F Rothenberg J Belding M Watanabe D L Wilson
J G Fujimoto and A M Rollins Ultrahigh-speed optical coherence tomography imaging and visualization
of the embryonic avian heart using a buffered Fourier Domain Mode Locked laser Opt Express 15 6251-
6267 (2007)
24 E J Jung C S Kim M Y Jeong M K Kim M Y Jeon W Jung and Z P Chen Characterization of
FBG sensor interrogation based on a FDML wavelength swept laser Opt Express 16 16552-16560 (2008)
25 V J Srinivasan R Huber I Gorczynska J G Fujimoto J Y Jiang P Reisen and A E Cable High-
speed high-resolution optical coherence tomography retinal imaging with a frequency-swept laser at 850
nm Opt Lett 32 361-363 (2007)
26 J Zhang Q Wang B Rao Z P Chen and K Hsu Swept laser source at 1 mu m for Fourier domain
optical coherence tomography Appl Phys Lett 89 3 (2006)
27 M A Choma M V Sarunic C H Yang and J A Izatt Sensitivity advantage of swept source and Fourier
domain optical coherence tomography Opt Express 11 2183-2189 (2003)
28 C M Eigenwillig B R Biedermann G Palte and R Huber K-space linear Fourier domain mode locked
laser and applications for optical coherence tomography Opt Express 16 8916-8937 (2008)
29 R Huber D C Adler and J G Fujimoto Buffered Fourier domain mode locking unidirectional swept
laser sources for optical coherence tomography imaging at 370000 liness Opt Lett 31 2975-2977 (2006)
30 S Nezam B J Vakoc A E Desjardins G J Tearney and B E Bouma Increased ranging depth in
optical frequency domain imaging by frequency encoding Opt Lett 32 2768-2770 (2007)
31 Y Yasuno Y J Hong S Makita M Yamanari M Akiba M Miura and T Yatagai In vivo high-contrast
imaging of deep posterior eye by 1-mu m swept source optical coherence tomography and scattering optical
coherence angiography Opt Express 15 6121-6139 (2007)
32 Y Yasuno V D Madjarova S Makita M Akiba A Morosawa C Chong T Sakai K P Chan M Itoh
and T Yatagai Three-dimensional and high-speed swept-source optical coherence tomography for in vivo
investigation of human anterior eye segments Opt Express 13 10652-10664 (2005)
33 A Yariv Optical Electronics in Modern Communication (Oxford University Press Inc Oxford 1997)
34 B Biedermann W Wieser C Eigenwillig G Palte D Adler V Srinivasan J Fujimoto and R Huber
Real time en face Fourier-domain optical coherence tomography with direct hardware frequency
demodulation Opt Lett 33 2556-2558 (2008)
35 A Bilenca S H Yun G J Tearney and B E Bouma Numerical study of wavelength-swept
semiconductor ring lasers the role of refractive-index nonlinearities in semiconductor optical amplifiers and
implications for biomedical imaging applications Opt Lett 31 760-762 (2006)
106598 - $1500 USD Received 26 Jan 2009 revised 24 Apr 2009 accepted 27 Apr 2009 published 29 May 2009
(C) 2009 OSA 8 June 2009 Vol 17 No 12 OPTICS EXPRESS 9948
36 H F Taylor Intensity noise and spontaneous emission coupling in superluminescent light-sources IEEE
J Quantum Electron 26 94-97 (1990)
1 Introduction
Recently the introduction of Fourier Domain Mode Locking (FDML) [1] has helped to
overcome physical limitations of the sweep repetition rate of rapidly wavelength swept laser
sources [2] Such sources can be employed for optical coherence tomography (OCT) [3] using
frequency domain detection [4] This technique is called swept source OCT (ss-OCT) or
optical frequency domain imaging (OFDI) Especially for wavelengths longer than 1050nm
where standard silicon based line array detectors cannot be used ss-OCT appears attractive in
order to achieve fastest imaging rates Standard swept lasers for OCT [2 5 6] essentially
consist of a laser gain medium for light amplification an output coupler for energy extraction
and a periodically driven optical band-pass filter for active wavelength selection FDML
lasers have an additional optical delay line with a length of several kilometers so that the
optical roundtrip frequency in the cavity is shifted down to several tens of kHz and can be
synchronized to the sweep frequency of the optical band-pass filter [1 7-10] In this operation
mode every sweep is seeded by the previous one leading to a much more stable laser
operation with respect to intensity and optical phase noise [11] In addition the laser has
better coherence properties by a reduction of the instantaneous linewidth making it suitable
for OCT applications that need large imaging ranges [12 13] FDML lasers have already
proven superior performance in a number of sensing and ranging applications [11 14-24]
In this paper we present a detailed analysis of coherence and noise of FDML lasers
depending on filter drive frequency detuning and amount of cavity dispersion The results
provide insight into phase and amplitude noise of the laser light itself
Because the optical delay line is implemented as additional km-long single mode fiber the
laser cavity can exhibit a significant amount of chromatic dispersion resulting in different
roundtrip times for different wavelength components It has been demonstrated that a limited
amount of dispersion can be tolerated at 1050nm and 1310nm and the output power and the
maximum sweep bandwidth can be optimized by an appropriate choice of filter bandwidth
and sweep rate even in a dispersive regime [17] However the influence of chromatic
dispersion on laser intensity noise and instantaneous coherence properties has not been
investigated in detail yet
In this paper we address the questions (1) How much dispersion compensation is
necessary for optimum laser performance (2) What is the connection between sweep filter
bandwidth and amount of dispersion compensation (3) How does chromatic dispersion affect
the effective cavity photon life time ie how many roundtrips can a photon make in the laser
despite missynchronization due to dispersion (4) How do timing mismatch effects caused by
detuning the drive frequency of the sweep filter affect coherence and noise and how does this
interact with time mismatch effects caused by dispersion (5) How much improvement in
coherence length and reduction in noise can be achieved by a dispersion compensated setup
To investigate these questions we implemented an FDML laser at 1550nm center wavelength
because dispersion compensation fiber (DCF) to cancel chromatic dispersion in standard
single mode fiber (SMF) is readily available at this wavelength The dispersion compensated
setup can be converted to a setup with higher dispersion by exchanging the spool of DCF with
one of SMF In addition we have used two different fiber Fabry-Peacuterot tunable filters (FFP-
TF) as optical band-pass filter one with a 028nm bandwidth and one with a 002nm
bandwidth
106598 - $1500 USD Received 26 Jan 2009 revised 24 Apr 2009 accepted 27 Apr 2009 published 29 May 2009
(C) 2009 OSA 8 June 2009 Vol 17 No 12 OPTICS EXPRESS 9949
2 Experimental setup
21 Setup of the laser and the detection scheme for noise and coherence length
Figure 1 shows the FDML laser which consists of a semiconductor optical amplifier (SOA
Covega Corp - type BOA1004) as polarization dependent broadband gain medium centered at
1550nm Two optical isolators (ISO) before and after the amplifier ensure unidirectional
lasing 30 of the intensity is coupled out of the resonator by a 7030 coupler
The remaining light in the cavity passes through a polarization controller (PC) a spool of
335m of either standard single mode fiber (SMF OFS - type Allwave ZWP) or dispersion
compensation fiber (DCF OFS - type LLWBDK-C) and a spool of 3650m SMF After
passing through a FFP-TF of either 028nm (Lambda Quest LLC - finesse 600 free spectral
range (FSR) ~168nm) or 002nm (Micron Optics Inc - finesse 4800 FSR 100nm) full width
at half maximum (FWHM) transmission window the light is coupled back to the SOA 90
of the light intensity from the laser is attenuated to ~1mW and detected with a 100MHz
bandwidth photo receiver (Thorlabs - type PDB150C and 100MHz low-pass filter Mini-
Circuits) The signal is sampled by an analog-to-digital converter (ADC) at a rate of 200MSs
and a resolution of 12bits (GaGe Applied Technologies - model CS12400)
The remaining 10 of the light pass through a Mach Zehnder interferometer (MZI)
consisting of two 5050 couplers and a variable delay line The delay line is actuated by a step
motor and can be controlled by a personal computer The interference signal is detected with a
1GHz bandwidth photo diode (Menlo Systems - model FPD310) and sampled with a digital
oscilloscope (Tektronix Inc - model DPO7104) at 25GSs with 8 bit resolution The tuning
frequency of the FFP-TF is given by the total optical path length of the cavity and is ~51kHz
The average output power of the laser was around 35mW
By removing the delay fibers a non-FDML laser could be configured for comparison The
cavity length was 18m and this laser was used as a fixed wavelength source and as swept
source at lower repetition rates
3 Chromatic dispersion
In our FDML laser cavity chromatic dispersion is the main cause for synchronization errors
polarization mode dispersion (PMD) is neglected in our analysis It is lt400fs according to the
specifications of lt02ps(km05
) and therefore much smaller than chromatic dispersion
The main part of chromatic dispersion is caused by the long spool of single mode fiber of
the delay line which essentially consists of fused silica For fibers the chromatic dispersion is
Fig 1 Schematic diagram of the FDML ring laser and the two detection schemes The
laser consists of a semiconductor optical amplifier with two built-in isolators a 7030
output coupler a spool of 335m of DCF or SMF fiber a spool of 3650m SMF fiber and a
fiber FFP-TF as optical filter The power detection is based on a 100MHz photo diode that
is AD converted The coherence length measurement is done with a Mach Zehnder
interferometer whose output is detected on a 1GHz photodiode and AD converted The
piezo voltage of the FFP as well as the delay of the interferometer are adjusted by a
computer
106598 - $1500 USD Received 26 Jan 2009 revised 24 Apr 2009 accepted 27 Apr 2009 published 29 May 2009
(C) 2009 OSA 8 June 2009 Vol 17 No 12 OPTICS EXPRESS 9950
usually given by the parameter D(λ) in units of ps(nmkm) In our case to quantify the
synchronization mismatch after one roundtrip for the different wavelength components caused
by dispersion in a cavity of length l it is more practical to use the relative roundtrip time
difference τ(λ) with respect to a center wavelength λc which is given by the integral
int=λ
λλλλτ
c
dDl )()( If we assume perfect synchronization in the center of the sweep at
1550nm the dispersion of the FDML laser can be expressed as roundtrip time mismatch for a
certain wavelength relative to the center wavelength For highly accurate compensation the
total dispersion of the cavity was measured with a home built dispersion analyzer We used
335m of dispersion compensation fiber and adjusted the length of the standard single mode
fiber such that the dispersion was minimal in a 100nm window from 1500nm to 1600nm
where the laser is operated As can be seen from Figs 2(a) and 2(b) the relative roundtrip
time mismatch has been reduced by nearly two orders of magnitude by the use of DCF and is
on the order of several tens of picoseconds with the DCF For a narrower range of ~40nm
around 1550nm it is only a few ps To understand the influence of dispersion on FDML
operation in a simple model we estimate the maximum possible photon cavity lifetime which
is a measure for how many roundtrips a photon can make until it is absorbed This value can
be used to compare FDML with continuous wave (cw) operation in lasers [12]
In this simple model the number of possible roundtrips gives the maximum number of
repetitive filtering events in the laser limited by missynchronization caused by dispersion The
transmission through a Fabry-Peacuterot cavity around the transmission wavelength λ0 is given by
the Airy formula
∆
minus
+
=
fsr
FT
λ
λλπ
π
λ02
2
sin2
1
1)(
where F denotes the finesse of the filter and ∆λfsr the free spectral range When the filter is
sinusoidally tuned over a range of ∆λ=α∆λfsr with a frequency f the maximum sweep speed is
given by vmax=πfα∆λfsr The maximum number of roundtrips n in a cavity with chromatic
dispersion is reached when the additional loss q caused by the nth filtering event exceeds the
effective gain of the cavity which is around 10dB for our laser A lower limit for the number
of roundtrips can then be estimated to be
ταπ
π
f
Fn
q
2
10 1102
arcsin
minus
=
In the experiment the number of roundtrips will be higher because the filter drive frequency
is matched to the roundtrip time of wavelength components in the center of the sweep So the
maximum roundtrip time mismatch will occur at the edges of the sweep where the filter scan
speed is slower due to the sinusoidal drive waveform In Figure 2c the expected number of
Fig 2 Measured relative roundtrip time difference and dispersion for the cavity (a) Without
dispersion compensation and (b) with dispersion compensation (c) Calculated number of
possible roundtrips in the cavity as a function of the relative roundtrip time difference
106598 - $1500 USD Received 26 Jan 2009 revised 24 Apr 2009 accepted 27 Apr 2009 published 29 May 2009
(C) 2009 OSA 8 June 2009 Vol 17 No 12 OPTICS EXPRESS 9951
roundtrips n is plotted for the two fiber Fabry-Peacuterots with different transmission bandwidths
used in this experiment For the 028nm and the 002nm FWHM filter the number of
roundtrips rises from below 10 and below 1 in the case without to around 1000 and 100 in the
case with dispersion compensation respectively This consideration does not account for
amplitude- and phase-noise effects caused by the amplification in the SOA that is required to
balance the losses However an effect of the increased number of filtering events should be
seen in the instantaneous coherence length and linewidth as well as in the noise performance
4 Instantaneous coherence length and linewidth
41 Measuring the linewidth of rapidly swept lasers
The instantaneous linewidth or coherence length of a laser is of high interest for a
comprehensive understanding of the laser operation because it is linked to its phase noise
properties Characterizing the instantaneous linewidth of rapidly swept lasers is not straight
forward because the laser sweeps or switches wavelength on a time scale of nanoseconds far
beyond the typical acquisition time of spectrometers Furthermore for many applications not
only the instantaneous linewidth but also the jitter or uncertainty of the center wavelength is
important because in most cases rapidly swept lasers are used to encode optical wavelength in
time As a consequence a highly accurate timendashwavelength relation between successive
sweeps is required not only a narrow linewidth Furthermore it is often important to correlate
the time-wavelength jitter to the jitter of neighboring wavelengths to distinguish between a
ldquoshiftrdquo of the whole spectrum from a ldquobreathingrdquo in between wavelength regions within the
sweep Therefore sampling techniques using fast shutters are also not the ideal solution In
some cases for special spectral positions narrow gas absorption features can be used to get
access to the laser linewidth [18 19] but they also only represent a spectral gate and do not
directly measure the laser linewidth
For these reasons rapidly swept lasers are often characterized using a Michelson
interferometer or a MZI The laser is wavelength swept and the fringe signal is observed while
the arm length imbalance of the interferometer is increased The decay or roll-off in fringe
amplitude ie fringe visibility over arm length difference is then often used to quantify the
instantaneous coherence length [2 25 26] However this approach does not account for phase
fluctuations in the sweep An alternative is to resample the signal to an equidistant raster in
optical frequency and perform a Fourier transform for each arm length mismatch When the
resulting peaks are plotted versus arm length difference the roll-off of peak amplitudes can be
considered as a measure for the ldquoaveragerdquo instantaneous coherence length of the source over
the sweep This method to measure swept laser sources is most often used in OCT
applications because it also provides the point spread functions (PSF) the axial resolution in
OCT applications [2 27] and information about the accuracy of the time-frequency
resampling step [28] We will apply this method here and derive the parameter R - a single
number to characterize the roll-off
42 Interferometric roll-off measurements of FDML laser
In an FDML laser it is expected that the instantaneous linewidth depends on the bandwidth of
the FFP-TF and on the number of successive spectral filtering events narrowing the spectrum
In FDML operation for a constant FWHM filter bandwidth (FBW) the cavity photon lifetime
or the number of possible roundtrips should increase with smaller relative roundtrip time
difference τ caused by dispersion and lower tuning range of the filter α (see section 3)
Figure 3 shows the Fourier transforms for different arm length imbalances in a Michelson
interferometer corresponding to the measured PSFs in OCT application As described the
envelope of the roll-off is the Fourier transform of the ldquoaveragedrdquo instantaneous spectrum the
shape of each peak corresponds to the envelope spectrum of the whole sweep The scale is
adjusted such that it corresponds to the offset in a Michelson interferometer that is half the
106598 - $1500 USD Received 26 Jan 2009 revised 24 Apr 2009 accepted 27 Apr 2009 published 29 May 2009
(C) 2009 OSA 8 June 2009 Vol 17 No 12 OPTICS EXPRESS 9952
difference in optical path length The tuning range of the laser was 100nm The displayed data
was recorded from the sweep which runs from long to short wavelengths As previously
reported [29] a significant difference for the other sweep direction could not be observed It
can be seen that in the case of the FFP-TF with a FBW=028nm there is a substantial increase
in coherence length by dispersion compensation (Figs 3(a) and 3(b)) For the FFP with
FBW=002nm there is only a very minor increase in coherence length (Figs 3(c) and (d)) but
the coherence is already very good in the non-compensated setup and comparable to the
dispersion compensated setup with the FBW=028nm filter For a more quantitative
discussion we will introduce the R-number for swept laser sources
43 The R-number A measure for coherence
For further discussion of the coherence properties we want to derive a single number to
characterize the roll-off properties of wavelength swept lasers This parameter R should have
the following 3 properties (1) It should be numerically stable and robust against systematic
errors This means in contrast to the often cited 6dB roll-off point [30] it ideally takes all
measured PSFs into account using the maximum available amount of information (2) R
should be proportional to the coherence length rather than any inverse quantity like spectral
width Thus a better source has a higher R number (3) R should have a descriptive unit that
makes it easy to judge the sources practical use especially in OCT and ranging applications
Such a R-number with the described properties will be derived in the following
Figure 3 shows that the roll-offs exhibit a predominantly single exponential decay
characteristic which would correspond to a Lorentzian shaped instantaneous spectrum Such
an exponential decay ie a linear roll-off on a logarithmic scale has been observed for most
rapidly swept laser sources over a major part [1 14 30] or almost the entire range [21 25 27
29 31 32] of measured delay settings in the interferometer In the cases where the roll-off
does not exhibit a highly linear roll-off on a logarithmic scale often the measured range was
too small only up to a roll-off of 5-10dB If the measurement extends to a range of 20dB or
more roll-offs of most sources appear to exhibit the exponential coherence decay
characteristic
Now to quantify the coherence roll-off properties of the laser with a single number an
exponential decay curve is fitted to the signal maxima of the linear PSFs and the inverse decay
constant in units of mmdB is used as a measure of coherence ndash we term this constant roll-off
length R At the center wavelength of the laser an inverse Fourier transform of the
transmission spectrum of the 20pm and 028nm FBW FFP-TFs lead to R-numbers of
R=13mmdB and R=014mmdB respectively (see Table 1 ndash column iFFT spectrum)
Fig 3 Roll-off of PSFs for different setups with 100nm tuning range a) dispersion
compensated FBW=028nm b) uncompensated FBW=028nm c) dispersion compensated
FBW=002nm d) uncompensated FBW=002nm
106598 - $1500 USD Received 26 Jan 2009 revised 24 Apr 2009 accepted 27 Apr 2009 published 29 May 2009
(C) 2009 OSA 8 June 2009 Vol 17 No 12 OPTICS EXPRESS 9953
Fig 4 Decay constant of the roll-off plotted versus cavity detuning for varying FFP filter
bandwidth and amount of dispersion at a tuning range of 100nm (a) dispersion compensated
FBW=028nm (b) dispersion uncompensated FBW=028nm (c) dispersion compensated
FBW=002nm (d) dispersion uncompensated FBW=002nm
44 Coherence and drive frequency detuning
To investigate the dependence of the coherence properties on timing mismatch effects caused
by chromatic dispersion and detuning of the filter drive frequency we measured the R-number
dependence on drive frequency for setups with different total dispersion The laser has been
detuned relative to the frequency with maximum R-number
Depending on cavity losses FBW of the FFP-TF and SOA gain detuning of more than
10Hz suppresses lasing over the full 100nm tuning range and leads to an increased width of
the PSF However in the frequency range of Fig 4 of only plusmn8Hz no variation in the width of
the PSF could be observed In the dispersion compensated setup with FBW=028nm (Fig
4(a)) we observe a sharp feature within a very small frequency range of ~012Hz FWHM
where the R-number is improved up to 14mmdB Without dispersion compensation (Fig
4(b)) there is no such feature and the curve appears flatter with a FWHM of ~10Hz This
effect can be explained by the increased number of spectral filtering events through dispersion
compensation In the compensated setup it is possible to achieve good synchronization of all
wavelengths simultaneously Therefore the maximum achievable R-number is higher but
only for a very narrow range of filter drive frequencies The non-compensated setup is more
forgiving and less critical because due to dispersion there is always good synchronization in
some parts of the spectrum but never over the full sweep range So the curve in Fig 4(b) has
a lower maximum and is broader Compared to the width of the filter of FBW=028nm which
corresponds to an R-number of 014mmdB the dispersion compensated setup achieves a 2-
10x line narrowing the non-compensated setup a 2-4x improvement by FDML operation
Surprisingly with the FBW=002nm filter and with dispersion compensation (Fig 4(c))
there is no sharp resonance peak as in Fig 4(a) only a flat feature with a width of ~15Hz is
observed In the non-compensated setup the R-number is almost constant for all measured
values of detuning This observation may be explained by the optical filter response times and
will be discussed in the next sub-section
The maximum achievable R-numbers are summarized in Table 1 It also shows the R-
numbers for FDML lasers with reduced sweep range as well as for a non-FDML laser with a
FBW=028nm at 2kHz and 20kHz sweep rate The reduction in sweep range from 100nm to
40nm reduces the effective sweep speed and enables more effective roundtrips This leads to
an increase in the R-number
45 Resonance time constant of the FFP-TF
Most of the observed features in Fig 4 can be explained by the typical resonance time of the
FFP-TF For a FBW=028nm and a FBW=002nm at 1550nm corresponding to optical
frequency bandwidths of BW=35GHz and BW=25GHz the characteristic time constants
τ=1BW are 29ps and 400ps respectively We only consider ldquotypical timescalesrdquo for a rough
106598 - $1500 USD Received 26 Jan 2009 revised 24 Apr 2009 accepted 27 Apr 2009 published 29 May 2009
(C) 2009 OSA 8 June 2009 Vol 17 No 12 OPTICS EXPRESS 9954
estimate and neglect effects of the actual envelope of the E-field This means that in a simple
model any optical field passing through the filter is ldquowashed outrdquo over ~30ps or ~400ps
Table 1 R-numbers for different FBWs for dispersion uncompensated (DNC) and dispersion compensated (DC)
FDML lasers as well as for a standard swept laser iFFT gives the R-number corresponding to the different widths of
the FFP-TF calculated by inverse Fourier transformation of the FFP transmission spectrum
DNC 100nm DC 100nm DNC 40nm DC 40nm iFFT spectrum
FDML
FBW=028nm 06 14 09 17 014
FDML
FBW=002nm 09 12 10 10 13
Non FDML
FBW=028nm 036 (2 kHz) 014 (20 kHz)
The light intensity after the filter cannot change substantially on a time scale much faster than
the ~30ps or ~400ps Thus timing errors no matter if they are caused by dispersion or
detuning of the sweep filter drive frequency should only be critical if they are substantially
larger than the 30ps or 400ps
The observed peak feature in Fig 4(a) has a width of ~120mHz This corresponds to a
timing error of ∆T=∆fFDRIVEsup2=012Hz(51000Hz)sup2=46ps This value is on the order of the
characteristic time constant of the FBW=028nm filter of 30ps Accurate timing is needed due
to the fast response of the wide filter This means that an accurate setting of the sweep filter
drive frequency and good dispersion compensation is required
The observed wider peak feature in Fig 4(c) has a width of ~15Hz This corresponds to a
timing error of ∆T=∆fFDRIVEsup2=15Hz(51000Hz)sup2=577ps This value is on the order of the
characteristic time constant of the FBW=002nm filter of 400ps The peak in Fig 4(c) is
wider the coherence is good over a broad range Even if it appears non-intuitive timing is
less critical with the narrower filter because the characteristic time constant is longer
The observed wider peak feature in Fig 4(b) in the case of the non-dispersion-
compensated setup has a width of ~10Hz This corresponds to 4ns timing error which is
roughly the timing error caused by dispersion ∆T=16psnmkm35km50nm=2800ps In
Fig 1(d) no characteristic resonance or time constant is evident
So in a simple model most of the observed features in Fig 4 can be explained and we
observe that as a rule of thumb for FDML operation with maximal coherence length the
timing error caused by dispersion and sweep filter drive frequency error has to be on the order
of the typical filter time constant τ=1BW or less
5 Relative intensity noise (RIN)
51 Measuring the RIN of rapidly swept lasers
In the previous section the coherence properties and linewidth of FDML lasers have been
discussed They are related to the phase noise of the laser output In this section we will
investigate the amplitude noise of the FDML laser which is linked to the intensity noise of the
laser We will investigate the relative intensity noise (RIN) performance depending on the
amount of cavity dispersion and filter drive frequency detuning For this quantitative analysis
a discussion of how to measure noise in a rapidly wavelength swept laser will be given first
The power of a laser can be expressed as P=P0+∆P(t) with an offset power P0 and time
dependent fluctuations ∆P(t) When the intensity noise of a fixed wavelength continuous
wave (cw) laser is analyzed quantitatively often the single-sided noise power spectral density
S∆P(f) is used It can be measured with a photodiode and a radio frequency (RF) spectrum
analyzer or calculated by Fourier transformation of normalized power fluctuations recorded in
the time domain [33] Such measurements are shown in Fig 5 for the ASE output from the
106598 - $1500 USD Received 26 Jan 2009 revised 24 Apr 2009 accepted 27 Apr 2009 published 29 May 2009
(C) 2009 OSA 8 June 2009 Vol 17 No 12 OPTICS EXPRESS 9955
SOA (a-b) and the swept FDML laser (c-e) About 1mW of the output from the SOA or the
FDML laser was recorded with a 100MHz bandwidth photo receiver and digitized at
200Msampless at 12bit resolution A trace of 1 or 16 million points was Fourier transformed
and the square of the amplitude is displayed as power spectrum The equivalent RF-resolution
bandwidths (RBW) are 200Hz and 15Hz respectively The spectrum is normalized to units of
dBcHz by adding a constant on the logarithmic scale such that the DC component is
10log(1HzRBW)
52 Disadvantage of RIN characterization of wavelength swept lasers by the noise RF-
spectrum
It can be seen in Fig 5(a) that the noise power spectral density (PSD) of the ASE for the SOA
has an almost completely flat characteristic throughout the detection bandwidth at a mean
value of -126dBcHz At the very low frequency end lt2kHz the PSD slightly increases
(Fig 5(b)) For a cw light source the RF spectra provide direct access to noise performance
However in the case of wavelength swept lasers the disadvantage of the noise PSD
characterization can be seen in Figs 5(c)-5(e)
In wavelength swept laser sources the output power changes while the laser is tuned due
to the spectral dependence of the gain profile This results in a periodic power modulation
with the filter drive frequency This modulation does not represent noise but actually in many
OCT applications a specially tailored power envelope rather than constant output level is
desired [34] This modulation leads to a superimposed signal in the noise power spectral
density with equidistant frequencies corresponding to the laser cavity mode spacing The
feature appears as spikes with a 51kHz spacing in the RF spectrum (Fig 5(e)) similar to RF
spectra of pulsed lasers Especially because of their narrow frequency spacing the observed
peaks obscure the noise Furthermore the disadvantage of RF spectral analysis is that it
cannot measure the noise of the laser at different wavelengths
Thus it is better to use the root mean square value of relative intensity noise δPP which
is defined as
Fig 5 Normalized RF power spectra of ASE from the SOA (a-b) and the swept FDML laser (c-
e) The ASE emission shows a flat spectrum over almost the entire measurement bandwidth (a)
A slight increased noise level is observed for frequencies lt2kHz (b) The peak signals from
laser emission obscure measurement of the noise level (c) The background is flat at least for a
frequency range from 08MHz ndash 100MHz
106598 - $1500 USD Received 26 Jan 2009 revised 24 Apr 2009 accepted 27 Apr 2009 published 29 May 2009
(C) 2009 OSA 8 June 2009 Vol 17 No 12 OPTICS EXPRESS 9956
fSdffSP
P
P
PP
f
f
P ∆==∆
= ∆∆int2
1
)()(
0
2δ
where f1 and f2 are the boundaries of the detection bandwidth interval ∆f= f2-f1 of the
measurement system and S∆P is the mean noise PSD A drawback of this single number δPP
is that the information on the frequency dependence of the noise is lost However since the
noise PSD S∆P is almost flat over our measurement bandwidth ∆f as shown in Figs 5 (a)-5(e)
the noise power for any bandwidth can easily be calculated from the single RIN value δPP
The RIN δPP can be measured by recording the laser intensity with an ADC and calculating
the standard deviation of the samples This gives the mean noise PSD S∆P over the
measurement bandwidth The advantage of taking only the RIN for characterizing swept
source lasers is that this value can be measured for each wavelength of the laser
independently In our setup the mean noise PSD S∆P was determined by first measuring the
transient power of 100 unidirectional sweeps with a 150MHz photo diode and a 100MHz low-
pass filter sampling at 200MSs with a 12bit resolution ADC Each of the 100 records
consisted of 2000 samples corresponding to 10micros total duration for each record which is half
the cycle duration of the FDML laser
53 Intra-sweep and inter-sweep noise (sliding RIN ortho RIN)
In order to investigate the wavelength dependence of the RIN performance the sampling
points should be selected in a way such that all samples correspond to a particular wavelength
The symmetry of a repetitively wavelength swept laser source offers two distinct ways to
allocate the samples for the calculation of the standard deviation δPP
(1) The first method to measure wavelength resolved noise in periodically swept lasers is
to analyze the power fluctuations within one sweep over a short time span The measured
ldquointra-sweep noiserdquo can be understood as short term time fluctuations while the source is
sweeping The concept is sketched in Fig 6(a) in form of the magnified inset The samples to
calculate the RIN are taken with a very short time window over which the laser does not
significantly change its wavelength This ldquosliding RINrdquo standard deviation (STD) is calculated
by analyzing the deviation of several (~2-100) neighboring samples To account for the power
envelope of the laser a fit curve has to be subtracted from each sample point first
Alternatively the mean power value of each sample point determined by averaging a
sufficient number of sweeps can be subtracted The second method is valid if the integrated
noise power up to the repetition frequency is negligible compared to the power of the sliding
RIN bandwidth (see below) ie the fluctuation from sweep to sweep is substantially smaller
than fluctuations within one sweep In our case this ratio was ~1200 so we used the second
method because it is less complex and more robust than section wise data fitting The sliding
RIN is very critical for OCT applications because it directly affects the dynamic range If the
Fig 6 Intra-sweep noise (sliding RIN) and inter-sweep noise (ortho RIN)
106598 - $1500 USD Received 26 Jan 2009 revised 24 Apr 2009 accepted 27 Apr 2009 published 29 May 2009
(C) 2009 OSA 8 June 2009 Vol 17 No 12 OPTICS EXPRESS 9957
source power fluctuates within one sweep the fringe signal is modulated generating a
background Dual balancing does not reduce this effect and weak reflections might be
obscured by the noise background generated from a strong reflection We will refer to this
type of noise as intra-sweep noise measured with a ldquosliding RIN analysisrdquo In the frequency
domain the sliding RIN analysis measures the integrated noise from the maximum analog
bandwidth fmax in our case 100MHz down to 2fSRn with n being the number of neighboring
samples and fSR the sample rate The sketch in Fig 7(b) visualizes the relevant RF bandwidth
in the blue filled area which is only a part of the OCT relevant RF bandwidth For a
unidirectional ss-OCT setup the relevant RF-bandwidth stretches approximately from the
inverse sweep duration up to the maximum analog detection bandwidth For the bidirectional
sweep operation in our case this is from ~102kHz up to 100MHz (green filled area Fig 7(a)
(2) The second method to measure spectrally resolved noise in periodically wavelength swept
lasers is to select samples of different sweeps but at the same wavelength position This
measurement reflects the change of the intensity from one sweep to the next at a certain
wavelength position It would be directly relevant for spectroscopic measurements where
small changes in transmitted intensity are to be measured [18 19] The concept is sketched in
Fig 6(a) in form of the red marked dots indicating the temporal positions of the samples to
calculate the standard deviation for a certain wavelength It could be expected that this ldquointer-
sweep noiserdquo is suppressed in FDML lasers since they have a feedback in between sweeps
We measured this type of noise by calculating the standard deviation for one sample out of
each of the 100 acquired records at the same time position within each sweep Figure 6(b)
shows the concept and why we will refer to this type of noise as ldquointer-sweep noiserdquo or
ldquoortho-RINrdquo In the frequency domain this type of measurement covers a RF bandwidth from
half the laser repetition rate f down to the inverse sampling duration 1Tacquisition The
corresponding frequency span is indicated by the green filled area in Fig 7 (b) The temporal
spacing of the 100 samples is 20micros resulting in a RF bandwidth of 250Hz up to 25kHz
Fig 7 Schematic of relevant features in the RF power spectrum for a 51kHz sweep rate laser
and a 100MHz analog detection bandwidth a) Schematic of RF spectrum of a FDML laser
total spectrum (black) noise background (blue) bandwidth relevant for swept source OCT
(green filled area) b) Noise bandwidth measured with sliding-noise measurement (blue
colored) and ortho-noise measurement (green) If ortho-RIN is measured with high analog
bandwidth the noise content of all frequencies is aliased into the band between DC and frac12f
c) For an increasing number of samples taken into account the sliding noise approaches the
ortho-noise values
106598 - $1500 USD Received 26 Jan 2009 revised 24 Apr 2009 accepted 27 Apr 2009 published 29 May 2009
(C) 2009 OSA 8 June 2009 Vol 17 No 12 OPTICS EXPRESS 9958
However it is important to emphasize that the noise measured with this technique covers the
range from 250Hz up to 100MHz because higher frequency components are aliased into the
measured low frequency range (Fig 7(b)) as the analog bandwidth of the detection system is
100MHz The ortho-RIN measurement covers more than the OCT relevant RF-bandwidth and
is therefore the most conservative value which yields the worst case values for noise The
ortho-RIN values are always higher than the sliding RIN values This can be seen in Fig 7(c)
where the ortho-RIN is plotted (black curve) as well as the sliding RIN for different numbers
of neighboring points 2 up to 100 As described the ortho-noise covers a RF range of 250Hz
up to 100MHz the sliding RIN measurements cover 2MHz and 40MHz to 100MHz for 100
and 5 points respectively In the special case of n=2 both lower and upper cutoff frequencies
are 100MHz As the cutoff-edges of the frequency response are softened for smaller values of
n the response function still exhibits a significant effective area For higher values of
neighboring points the calculated noise value does not really represent the noise for a ldquosingle
wavelengthrdquo but rather for a range
Therefore we will use the ortho-noise (inter-sweep noise) values in the following To
measure the ortho-noise 100 records each of which contained 2000 samples of the intensity
trace of one sweep have been analyzed Then the standard deviation at fixed positions within
the records was calculated corresponding to certain wavelengths This yields the wavelength
dependence of the RIN δPP(λ) The calculated RIN values are then the integrated noise
spectral density for a detection bandwidth of 250Hz to 100MHz
The RIN of 1mW spectrally unfiltered ASE from the SOA has a value of 04 which
translates to a mean power spectral density of -128dBcHz over the 100MHz detection
bandwidth The relative intensity noise of ASE in a 028nm band ie the noise of ASE
transmitted through the filter is much higher and was measured to be -108dBcHz which
corresponds to a RIN of 4 This high value would be the RIN per pixel in spectral OCT
systems and may affect their dynamic range The RIN of a non-swept fixed wavelength short
fiber-ring laser (same setup no FDML fiber spool) with the same SOA and FFP-TF and a
power of 1mW gives a RIN value of 015 translating to a noise PSD of -136dBcHz This
a) b) c)
d) e) f)
Fig 8 RIN in FDML operation for different setups a) dispersion compensated
FBW=028nm FFP-TF (high to low wavelength sweep) b) uncompensated FBW=028nm
FFP-TF (high to low wavelength sweep) c) uncompensated FBW=028nm FFP-TF (low to
high wavelength sweep) d) dispersion compensated FBW=002nm FFP-TF (high to low
wavelength sweep) e) uncompensated FBW=002nm FFP-TF (high to low wavelength
sweep) f) uncompensated FBW=002nm FFP-TF (low to high wavelength sweep) The
different frequency ranges result from slight different cavity lengths for the different
setups
106598 - $1500 USD Received 26 Jan 2009 revised 24 Apr 2009 accepted 27 Apr 2009 published 29 May 2009
(C) 2009 OSA 8 June 2009 Vol 17 No 12 OPTICS EXPRESS 9959
was the lowest achievable with this setup The shot noise limit for a 1550nm light source with
1mW power is -156dBcHz equivalent to a RIN of 15middot10-4
at 100MHz detection bandwidth
44 The spectral dependence of ortho-RIN in FDML lasers
The RIN performance of non-FDML lasers typically exhibits a strong dependence on sweep
frequency especially for sweep rates near the single roundtrip limit [2] We observed for the
non-FDML laser an ortho-RIN value of 08 at 2kHz sweep rate and 30 for 25kHz sweep
rate measured at 100MHz analog detection bandwidth It is expected that FDML lasers are
less noisy than standard wavelength swept lasers as every wavelength component is seeded
by the light from the preceding roundtrips and therefore lasing does not have to be build up
from amplified spontaneous emission (ASE) repetively Obviously the seeding is only
efficient for all wavelength components if the laser is driven at its resonance frequency [1]
and if the chromatic dispersion lies below a certain threshold [17]
As with the coherence length a compensation of dispersion in the cavity should increase
the number of effective roundtrips for a specific wavelength and decrease noise Increasing
the finesse of the FFP should impede seeding therefore increased noise is expected As the
optimum laser frequency and each wavelength component are linked by the dispersion
relation we plot the relative intensity noise versus frequency and versus wavelength of the
laser The results are two dimensional plots where the RIN value is color coded (Fig 8)
Figures 8(b) and 8(c) show the ortho-RIN for the non-dispersion compensated cavity and
for a FBW=028nm for the two sweep directions of the laser In both plots there is a region of
low noise which follows the dispersion relation shown in Fig 2(a) While in non-FDML
swept lasers the sweep from short to long wavelengths exhibits more power [2] we found for
our FDML setup that the other sweep direction performs better with respect to RIN This is
consistent with the observation that the dynamic range in OCT application of FDML lasers at
1310nm was observed to be better for backward-sweeps (long to short wavelength
sweeping) [29] Also as previously reported we did not observe a significant difference
between in the roll-off length R for the two sweep directions [29] In FDML operation near
resonance the backward sweep does not exhibit reduced power compared to the forward
sweep as in non-FDML sources so it is unclear if there is a connection between the
observation of reduced RIN in one sweep direction and the frequency downshift by non-linear
effects in the SOA [35]
Surprisingly in the dispersion compensated case shown in Fig 8(a) both the absolute
value of noise and the frequency span of low noise operation is not better or even worse than
without the compensation fiber The region of low noise operation is narrower The behavior
is equal for both sweep directions As in the uncompensated case a line of low noise follows
qualitatively the dispersion relation given in Fig 2(b) when the frequency differences are
translated into relative roundtrip time differences Why the noise level is not lower than in the
uncompensated setup is currently unclear It might be speculated that the increased number of
effective roundtrips in the dispersion compensated setup makes the laser more sensitive to any
noise or perturbation Additionally the reduced linewidth and increased coherence length
might enhance parasitic non-linear effects due to the increased interaction length like
Brillouin scattering or four-wave mixing in the long fiber delay line Nevertheless in both the
dispersion compensated and the non-compensated setup with an FBW=028nm there are
frequency-wavelength combinations where the noise approaches 015 or -136dBcHz This
value was the noise observed for the fixed wavelength non-FDML short ring laser and might
be dominated by the gain element However in none of the FDML configurations
compensated or non-compensated there is a filter drive frequency where all wavelength
components exhibit this low noise level of 015
The FBW=002nm setup exhibits in general more noise than the setup with FBW=028nm
This may be explained by the inversely proportional increase of the noise of filtered ASE with
filter bandwidth [36] With high dispersion in the cavity the RIN for both sweep directions is
106598 - $1500 USD Received 26 Jan 2009 revised 24 Apr 2009 accepted 27 Apr 2009 published 29 May 2009
(C) 2009 OSA 8 June 2009 Vol 17 No 12 OPTICS EXPRESS 9960
shown in Figs 8(e) and 8(f) As in the case with the large bandwidth filter the noise
performance of the setup with high dispersion is better than that of the dispersion
compensated setup In the case with low dispersion shown in Fig 8(d) there is no decrease in
noise level visible The lack of sharp features in Figs 8(d) and 4(c) may again be explained by
the long filter response time
5 Conclusion
We investigated the noise performance and the coherence properties of an FDML laser with
different amounts of chromatic dispersion in the laser cavity The laser covered a wavelength
sweep range of 1500nm-1600nm at a sweep repetition rate of 2x51000 sweeps per second
For a systematic investigation the roll-off length R was introduced to specify the coherence
This value is numerically stable robust against errors and the graphic unit mmdB is useful for
OCT applications We show that for FDML lasers it is sufficient to characterize the RIN by
the standard deviation of the measured intensity at identical positions across successive
sweeps This ortho-noise value covers the full RF bandwidth relevant for optical sensing and
it can be measured for each wavelength independently
Compared to the used optical band-pass filter we observe a linewidth reduction in FDML
operation by a factor of 4 without dispersion compensation and more than a factor of 10 with
dispersion compensation The corresponding linewidth of the laser emission was around 20pm
using an FBW=028nm filter A drive frequency accuracy better than 120mHz at 51kHz was
required Using a more narrowband filter of FBW=20pm the synchronization is much less
critical and good coherence properties are observed over a larger range of drive frequencies
Sufficient coherence for depth ranging capabilities of several centimeters in OCT applications
is demonstrated
An analysis of the relative intensity noise shows that with the FDML laser -136dBcHz
RIN can be achieved over an RF measurement bandwidth of 250Hz to 100MHz This
corresponds to 015 power fluctuations At the laser power of 1mW this value is 20dB
higher than the shot noise limit
The underlying mechanisms causing the observed properties of coherence and noise can
be explained by the specific time constant of the intra-cavity filter The inverse time constant
corresponding to the optical filter bandwidth on a frequency scale corresponds well with the
time mismatch introduced by slight detuning of the filter drive frequency
The presented observations can serve as basis to estimate the performance achievable with
FDML lasers they can be used for the design and layout of FDML lasers tailored for specific
applications and they can serve as basis for a comprehensive theoretical understanding of
FDML in the future
Acknowledgment
We would like to acknowledge support from Prof W Zinth at the Ludwig-Maximilians-
University Munich This research was sponsored by the Emmy Noether program of the
German Research Foundation (DFG - HU 10062-1) and the European Union project FUN
OCT (FP7 HEALTH contract no 201880)
106598 - $1500 USD Received 26 Jan 2009 revised 24 Apr 2009 accepted 27 Apr 2009 published 29 May 2009
(C) 2009 OSA 8 June 2009 Vol 17 No 12 OPTICS EXPRESS 9961
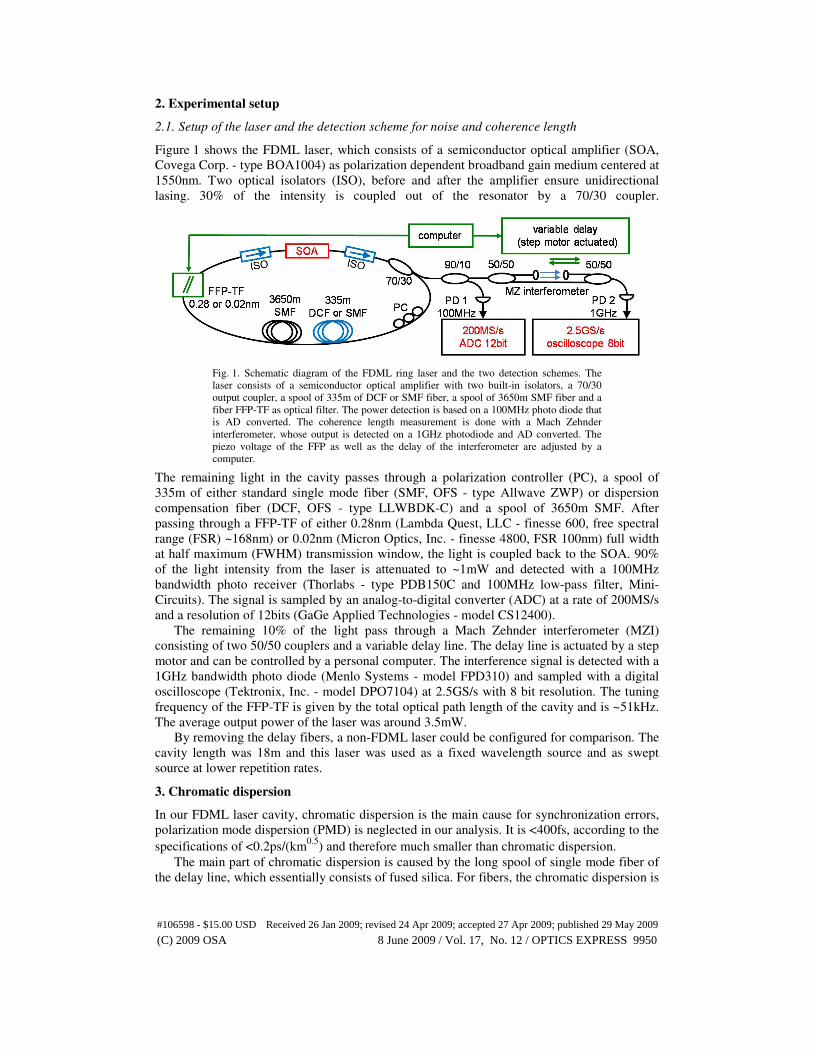
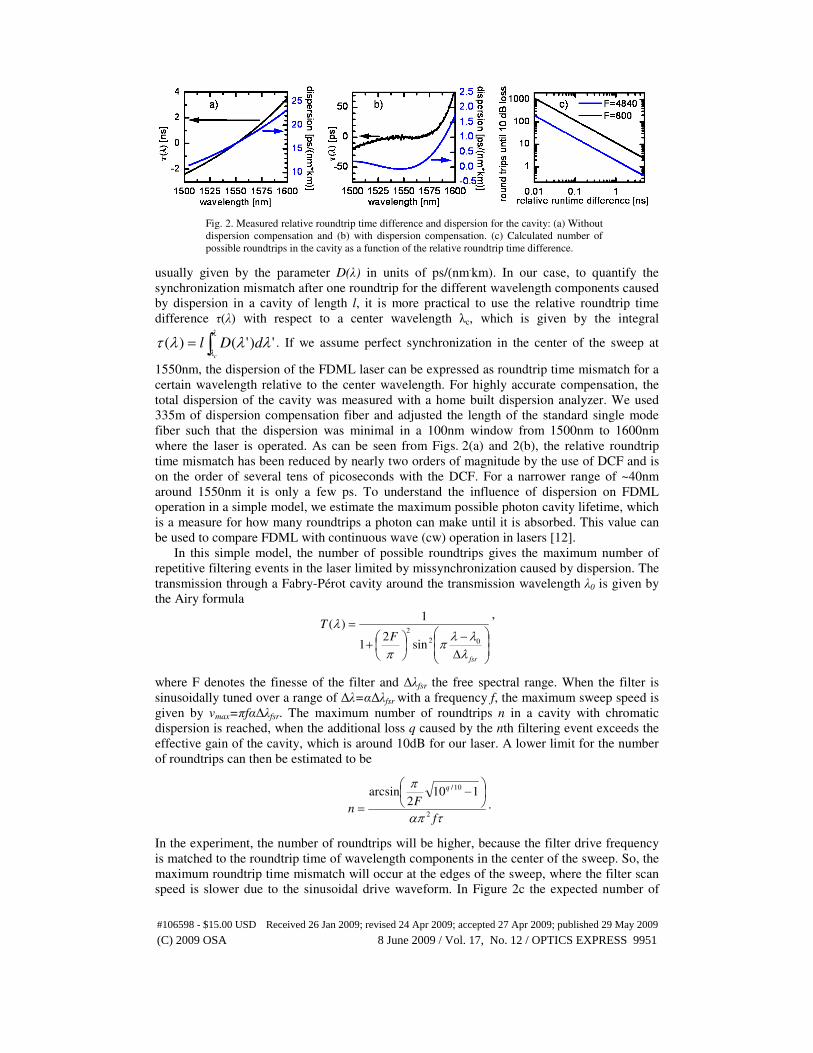
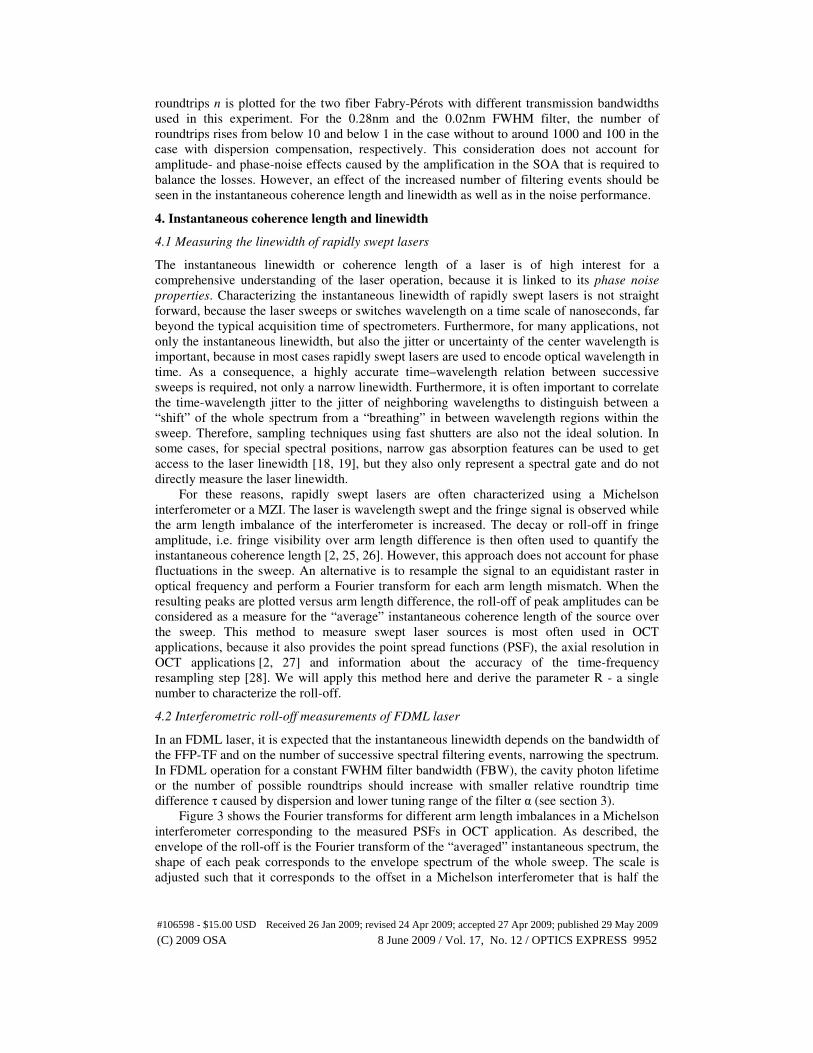
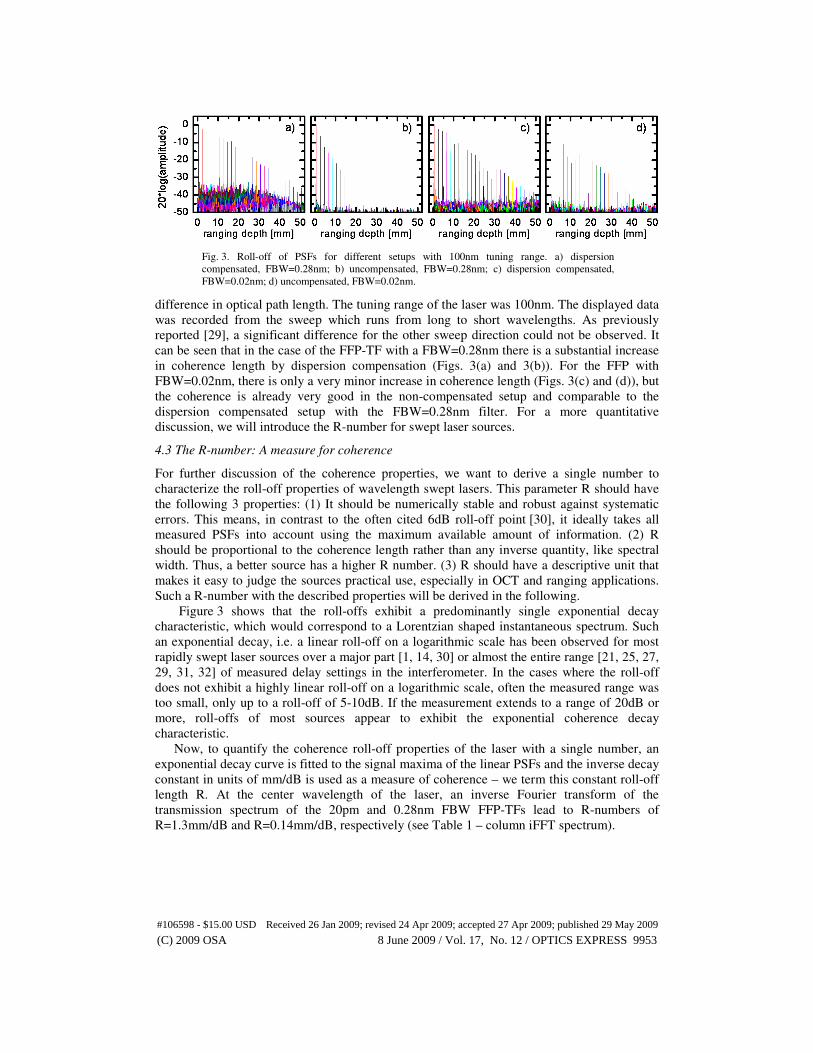
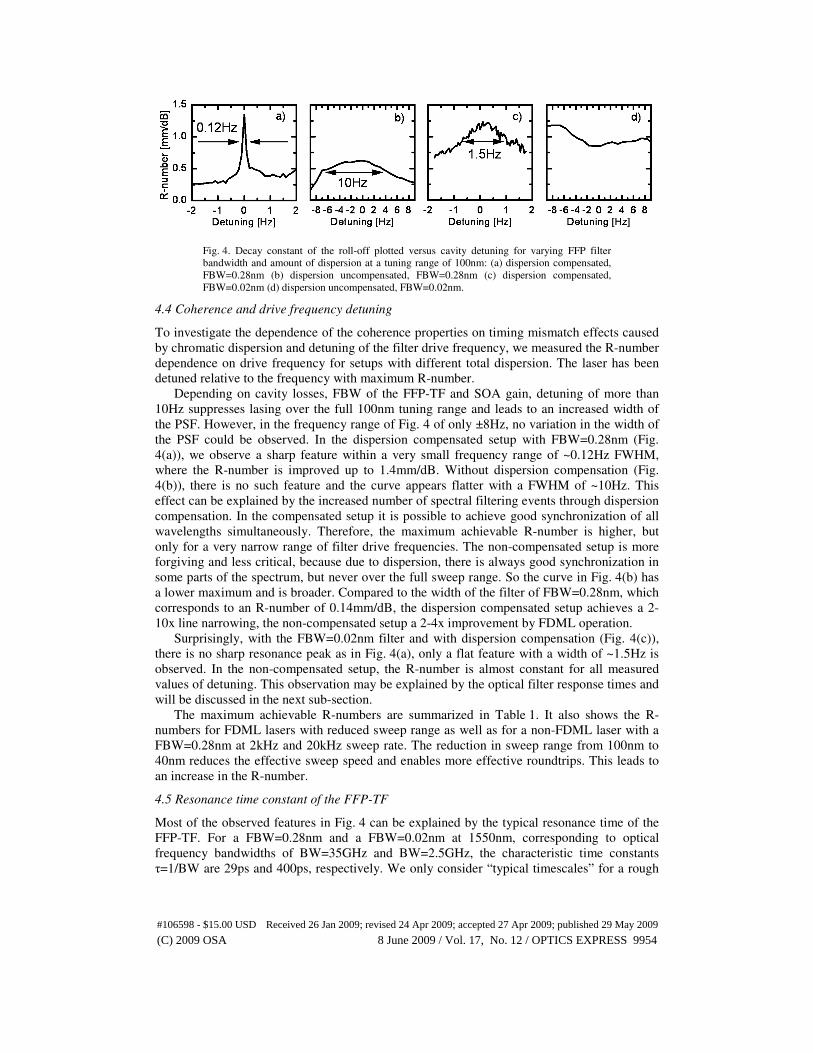
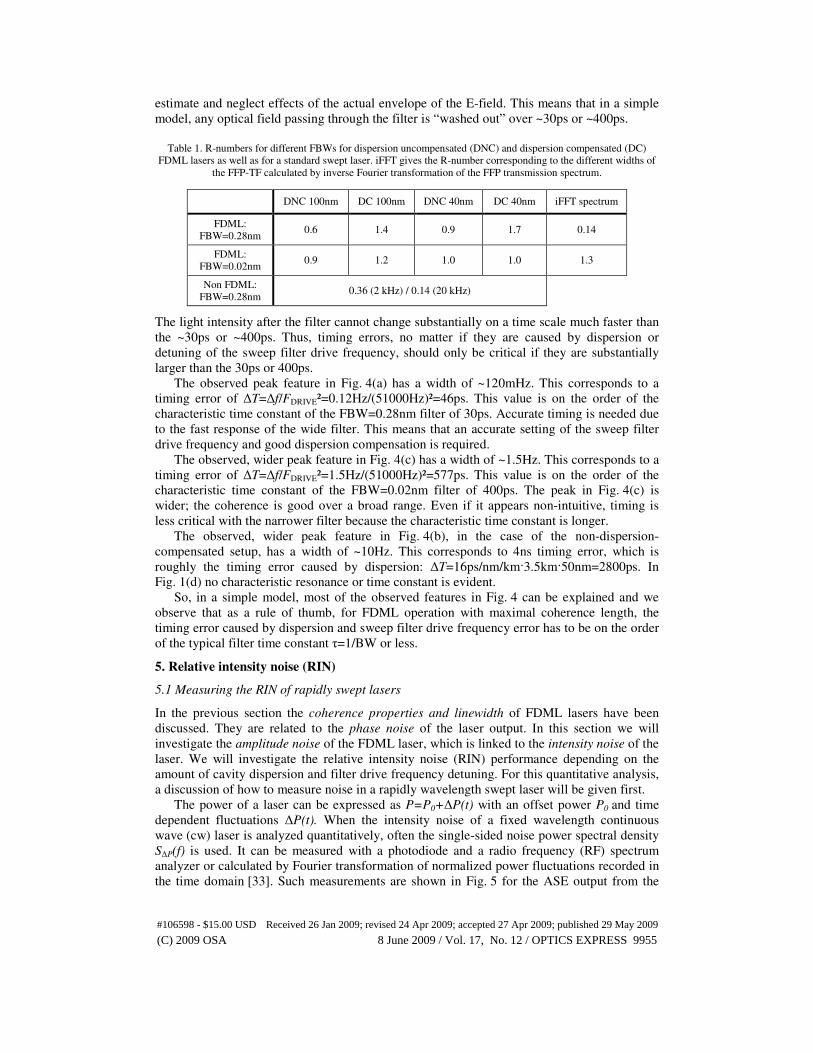
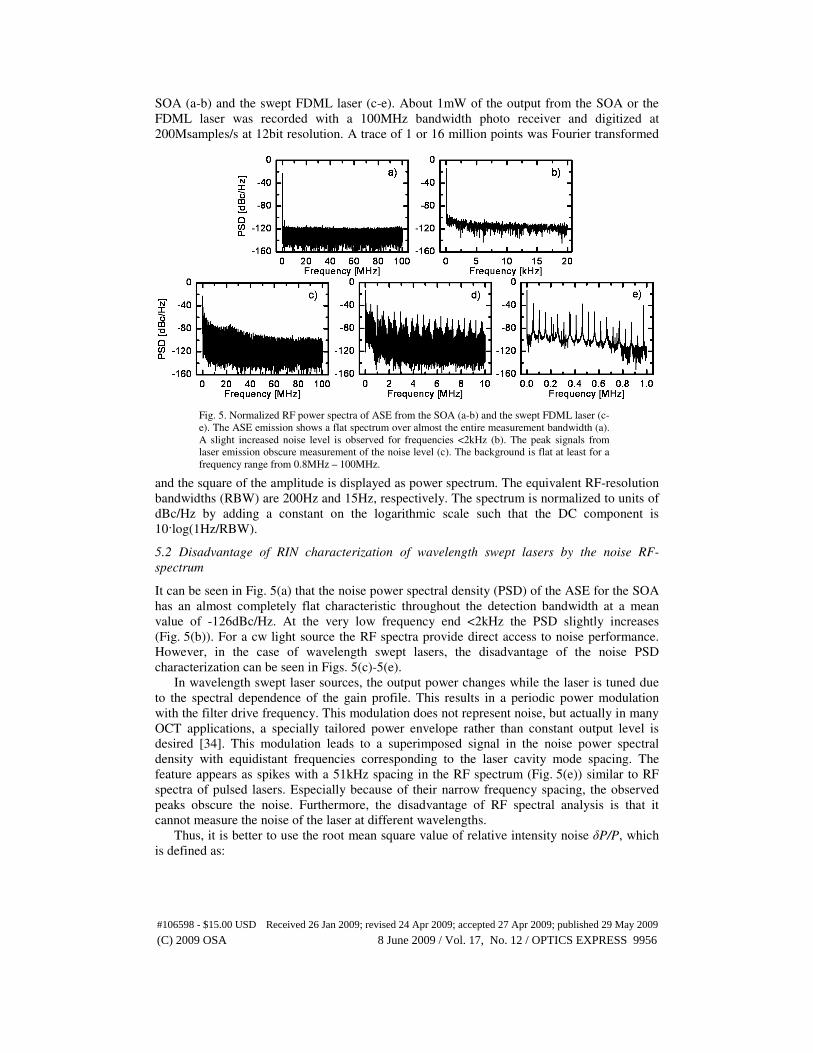
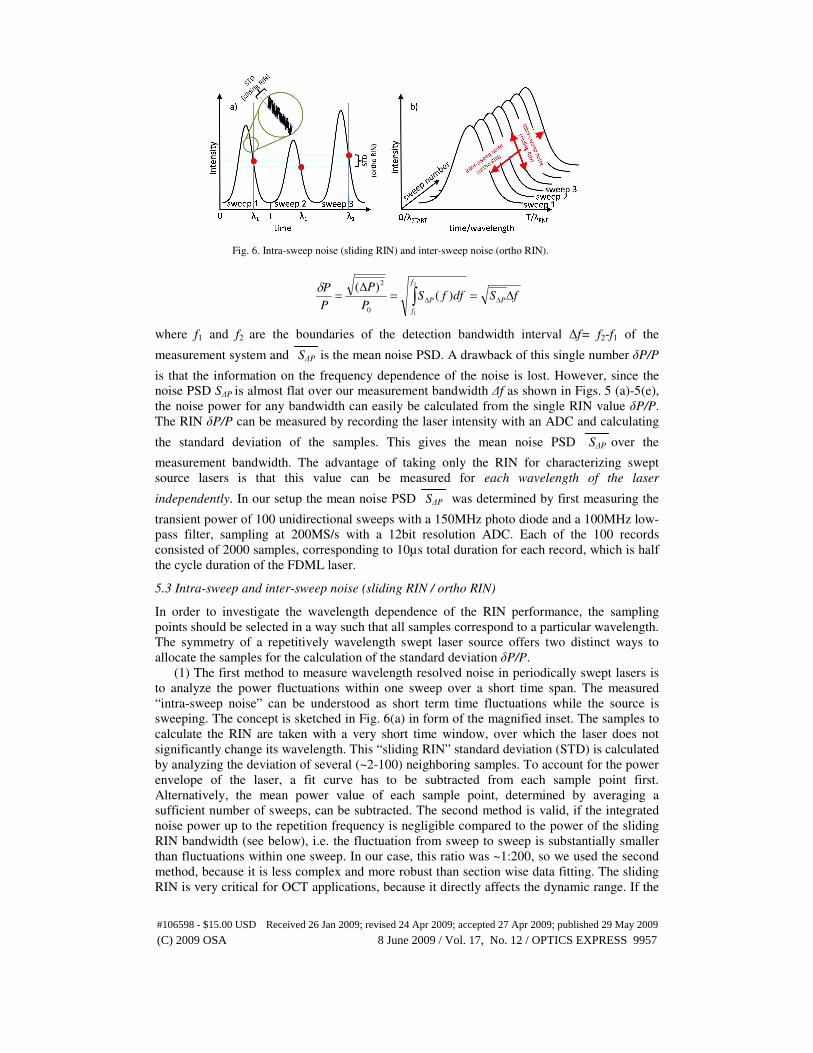
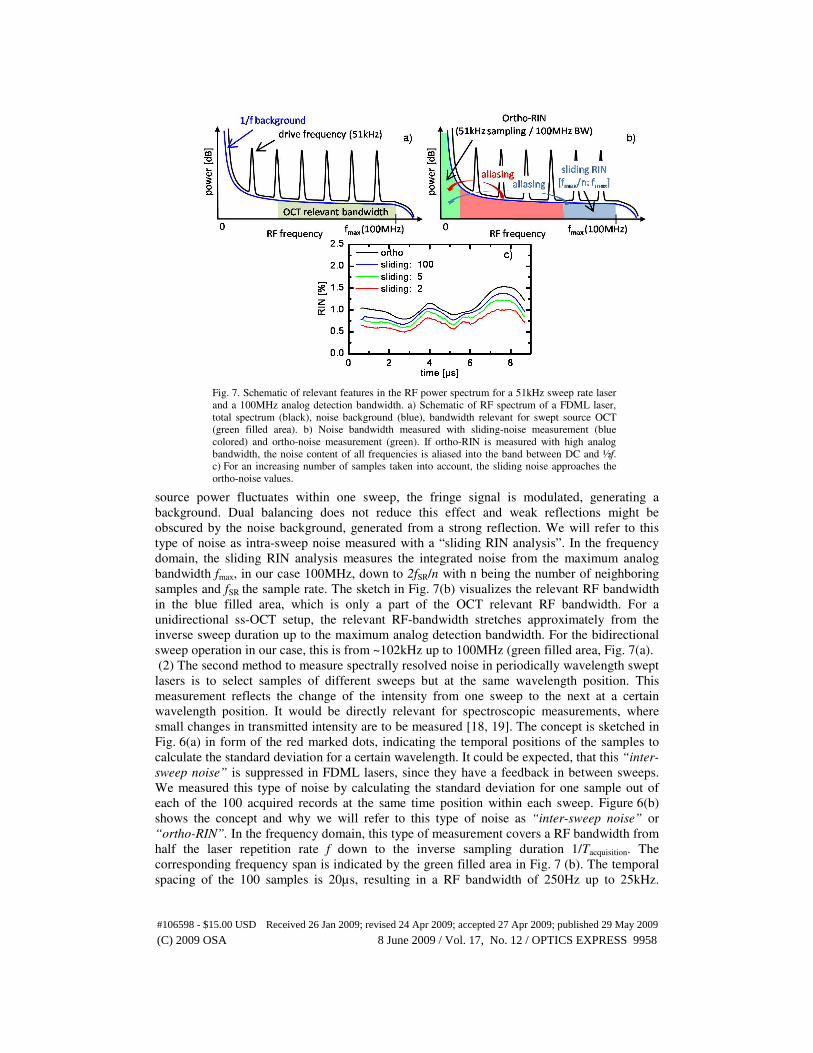
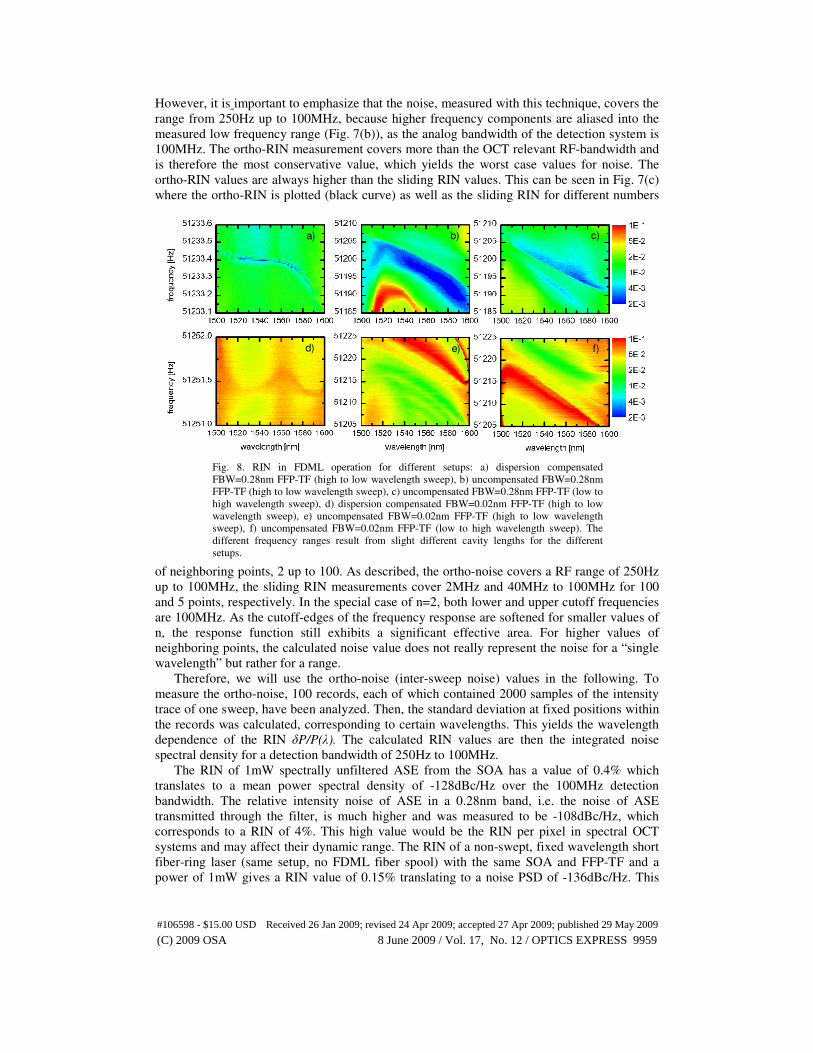