Embed Size (px)
Citation preview
Sehr geehrte Damen und Herren,
für Rückfragen zu der beigefügten Publikation „IPO Watch Europe Q4 2016“ stehen Ihnen folgende Ansprechpartner gerne zur Verfügung:
Nadja [email protected]. +49 211 981-2978
Christoph [email protected]. +49 69 9585-3415
Dirk [email protected]. +49 89 5790-5806
Dr. Rüdiger [email protected]. +49 211 981-2839
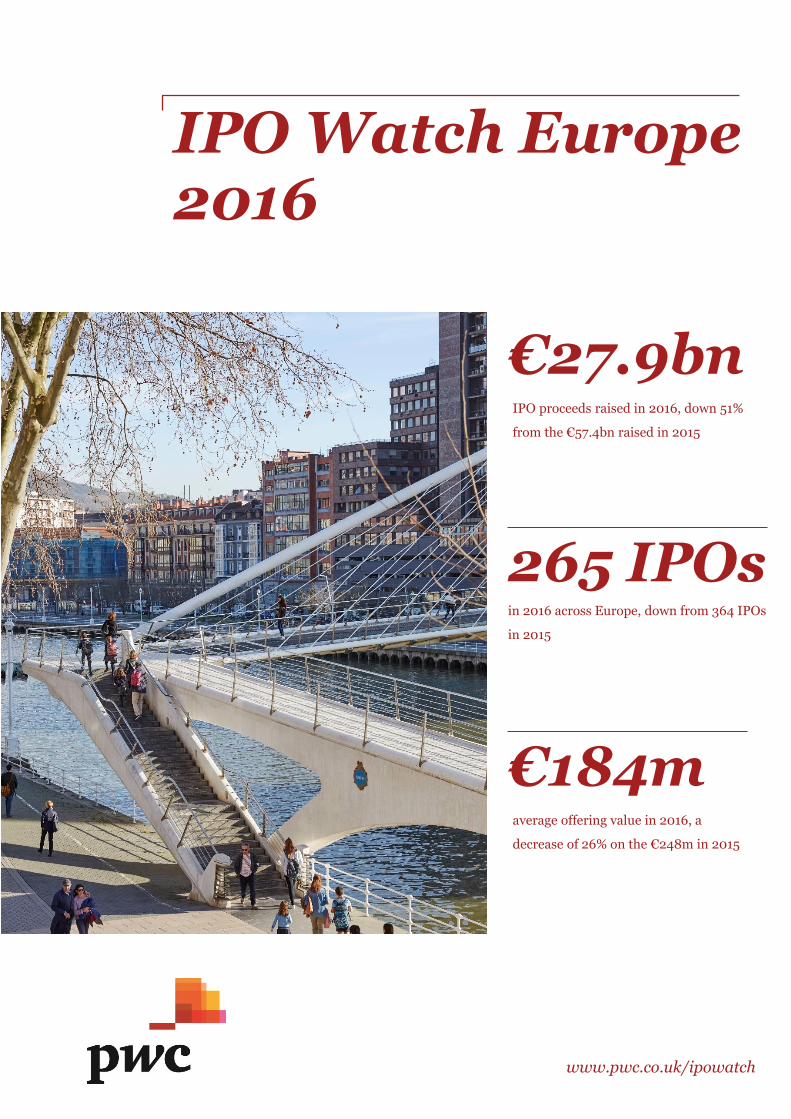
IPO Watch Europe 2016
www.pwc.co.uk/ipowatch
€27.9bn IPO proceeds raised in 2016, down 51%
from the €57.4bn raised in 2015
265 IPOsin 2016 across Europe, down from 364 IPOs
in 2015
€184maverage offering value in 2016, a
decrease of 26% on the €248m in 2015
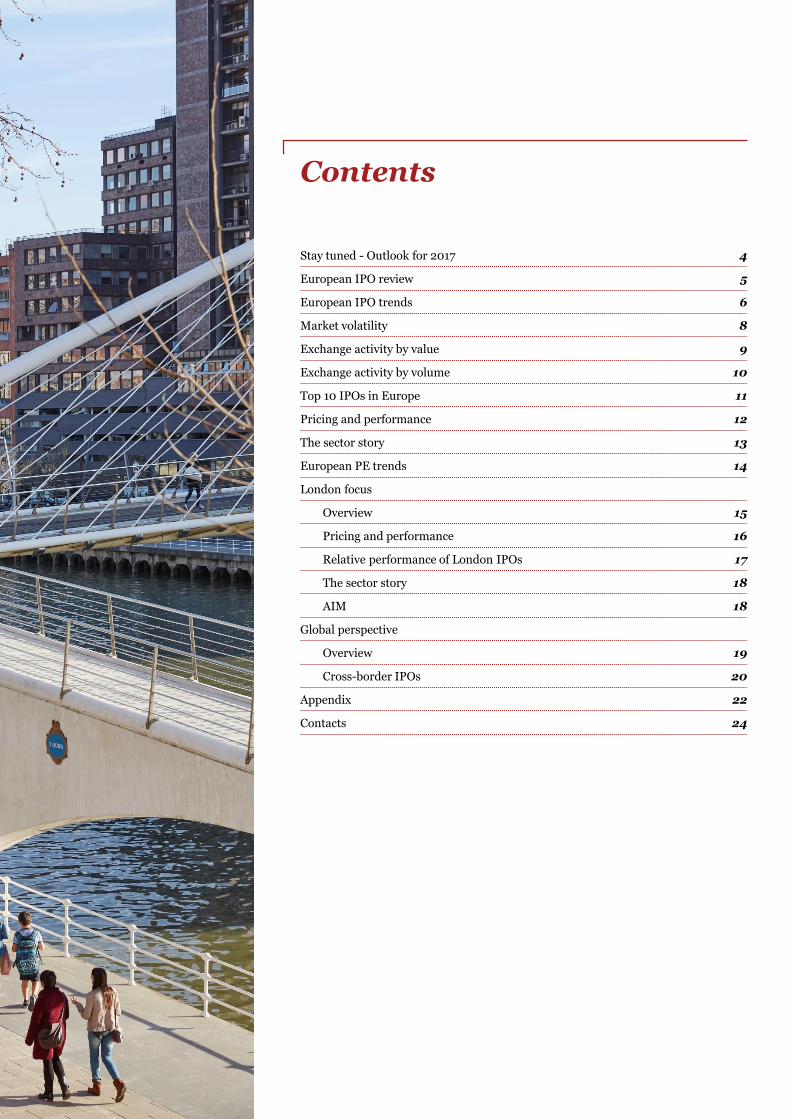
Stay tuned - Outlook for 2017 4
European IPO review 5
European IPO trends 6
Market volatility 8
Exchange activity by value 9
Exchange activity by volume 10
Top 10 IPOs in Europe 11
Pricing and performance 12
The sector story 13
European PE trends 14
London focus
Overview 15
Pricing and performance 16
Relative performance of London IPOs 17
The sector story 18
AIM 18
Global perspective
Overview 19
Cross-border IPOs 20
Appendix 22
Contacts 24
Contents
Stay tuned
Outlook for 2017
“As we move into 2017 investors will be looking at elections in France, Germany and the Netherlands, which have the potentialto unsettle the IPO markets across Europe. Despite the uncertainty that this brings, the European IPO pipeline looks healthy, as investors seek out investment opportunities with compelling and well-supported equity stories. The pipeline of cross-border IPO activity is also beginning to build, with a number of international companies looking at listing in London.
As a result of the current economic and political outlook, investors will continue to be more selective, backing IPO candidates with an attractive valuation, a differentiated product and an equity story which is underpinned by strong performance.”
Mark Hughes
Partner, UK Capital Markets Leader at PwC
The ongoing level of political uncertainty across Europe makes it challenging to predict levels of IPO activity for the year ahead. However, there are a number of factors to look out for over the coming year which will likely impact the level of IPO activity:
Geopolitical uncertainty set to continue
The political calendar for the year ahead has the potential to create further challenges for the IPO market. Germany, France, the Netherlands and potentially Italy will be going to the polls, and closer to home, the potential triggering of Article 50 in March and the shaping of the agreements to negotiate the UK's exit from the European Union may create difficult timing decisions for potential IPO candidates.
Political uncertainty looks set to stay. However, it appears that with each political shock experienced in 2016, the markets stabilised with increasing speed, as investors are becoming ‘used’ to dealing with a level of uncertainty surrounding the various economies, particularly the UK.
2017 IPO windows
A number of candidates postponed their plans for an IPO during 2016, creating a backlog of companies looking to list in 2017. This coupled with the 2017 political calendar could motivate issuers to hit the first feasible IPO window, implying a potentially busy first quarter for IPOs in Europe.
On the other hand, investors have been sitting on big cash positions and are looking for growth opportunities to invest in a world characterised by low interest rates. We expect them to remain attracted by IPOs as an asset class and keen to engage in early dialogue with issuers.
The ongoing volatility in the markets along with the solid investor interest means that IPOs will get done in 2017, however it would not be surprising to see IPO windows opening and closing with some rapidity. As such, those companies which are able to achieve successful transactions will be those which are fully prepared and thus able to launch in a relatively speedy timeframe.
Continuation of M&A activity
In spite of the geopolitical events in 2016, global M&A activity was strong and a number of mega M&A deals were completed.
In the wake of Brexit, the weakening of the pound has made UK companies more attractive for foreign companies, so in the UK at least, M&A activity is expected to continue during 2017.
The continuation of historically low interest rates and investor pressure on companies to find growth, means that companies across the Continent will consider acquisitions within Europe or globally to expand into new markets to achieve their growth strategy. We also expect them to seek opportunities to divest of non-core assets.
Reduced PE activity?
There was an overall slowdown in PE backed IPO activity in 2016, as market volatility increased and the valuation pressures intensified with institutional investors. That said, a number of large IPO exits were successfully achieved, and private equity houses are continuing to create the optionality to IPO portfolio businesses in 2017 and beyond. We would observe, however, that in many instances, owners are pursuing both a private and public sales track.
The year of the unicorn IPO?
The US is preparing for what may be a bumper crop of tech and ecommerce IPOs. Snap's well-documented IPO is probably the most anticipated since Facebook in 2012, and could be joined by a host of other unicorns looking to join the equity markets. To the East, a host of Chinese tech companies are also reportedly gearing up for a 2017 IPO. A number of high profile European tech unicorns could take the step into public life as they have reached a scale where they are hitting the limits of private financing and require the step-change offered by an IPO. Valuation will of course remain a key determinant, with many issuers already working to educate the market as to their progression and thereby achieve a step up from their latest private financings.
4 | IPO Watch Europe 2016
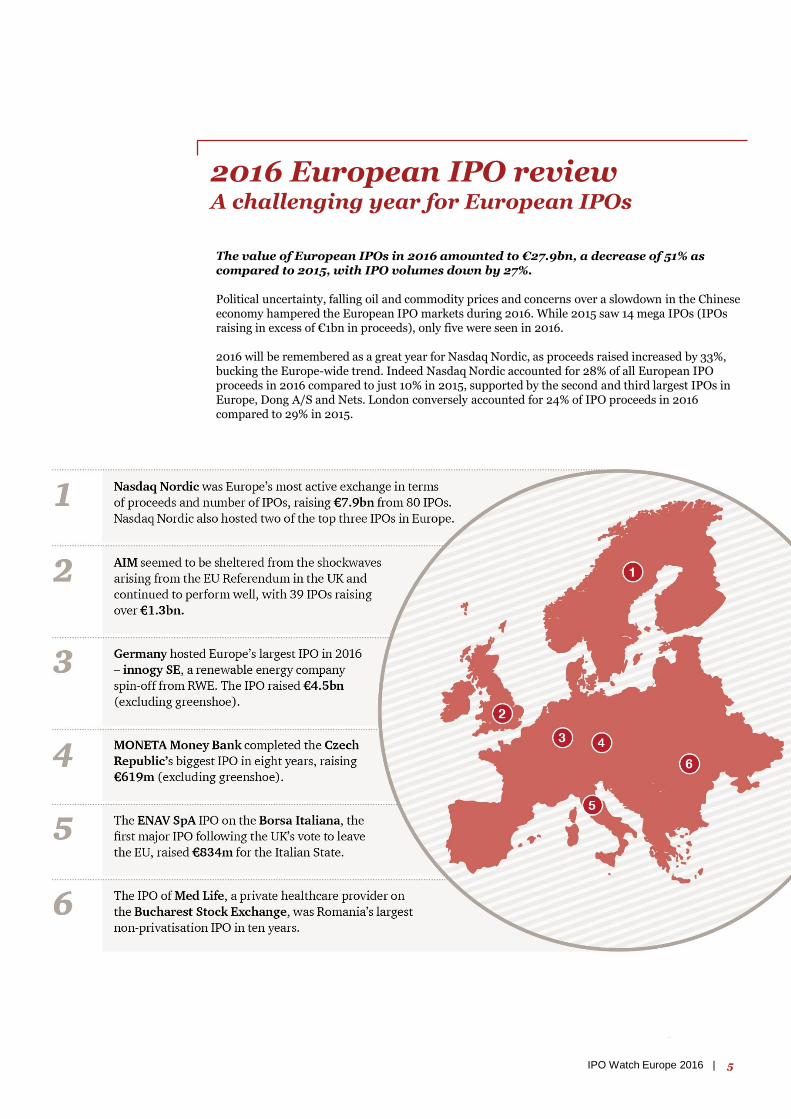
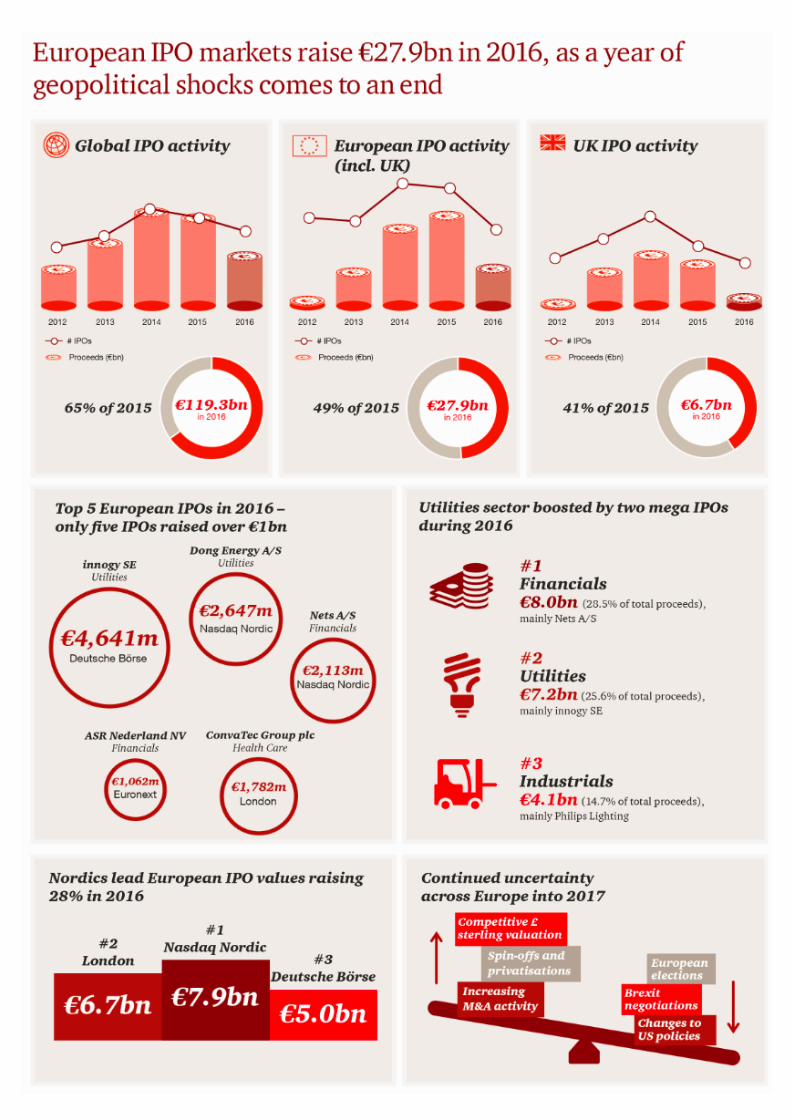
The value of European IPOs in 2016 amounted to €27.9bn, a decrease of 51% as compared to 2015, with IPO volumes down by 27%.
Political uncertainty, falling oil and commodity prices and concerns over a slowdown in the Chinese economy hampered the European IPO markets during 2016. While 2015 saw 14 mega IPOs (IPOs raising in excess of €1bn in proceeds), only five were seen in 2016.
2016 will be remembered as a great year for Nasdaq Nordic, as proceeds raised increased by 33%, bucking the Europe-wide trend. Indeed Nasdaq Nordic accounted for 28% of all European IPO proceeds in 2016 compared to just 10% in 2015, supported by the second and third largest IPOs in Europe, Dong A/S and Nets. London conversely accounted for 24% of IPO proceeds in 2016 compared to 29% in 2015.
2016 European IPO reviewA challenging year for European IPOs
5IPO Watch Europe 2016 |
2016 European IPO trendsIPO values down 51%, with €27.9bn raised annually and average deal size decreased by 26%
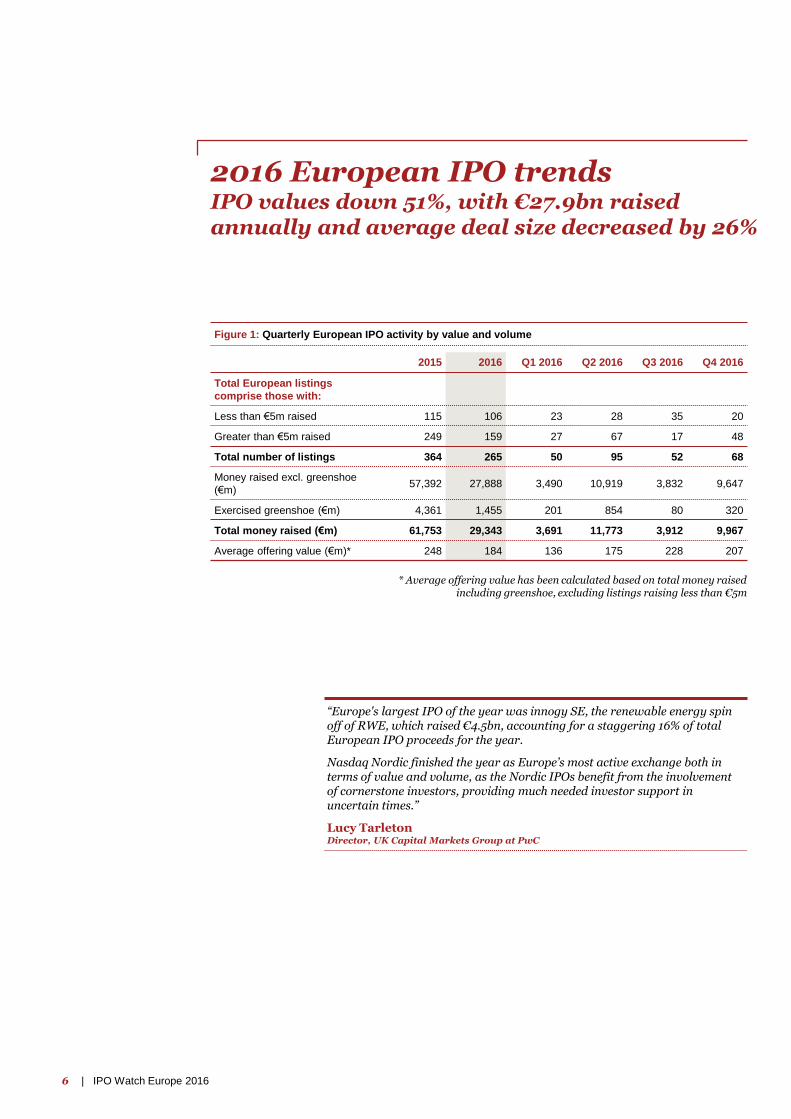
Figure 1: Quarterly European IPO activity by value and volume
* Average offering value has been calculated based on total money raised including greenshoe, excluding listings raising less than €5m
2015 2016 Q1 2016 Q2 2016 Q3 2016 Q4 2016
Total European listings
comprise those with:
Less than €5m raised 115 106 23 28 35 20
Greater than €5m raised 249 159 27 67 17 48
Total number of listings 364 265 50 95 52 68
Money raised excl. greenshoe
(€m)57,392 27,888 3,490 10,919 3,832 9,647
Exercised greenshoe (€m) 4,361 1,455 201 854 80 320
Total money raised (€m) 61,753 29,343 3,691 11,773 3,912 9,967
Average offering value (€m)* 248 184 136 175 228 207
“Europe's largest IPO of the year was innogy SE, the renewable energy spin off of RWE, which raised €4.5bn, accounting for a staggering 16% of total European IPO proceeds for the year.
Nasdaq Nordic finished the year as Europe’s most active exchange both in terms of value and volume, as the Nordic IPOs benefit from the involvement of cornerstone investors, providing much needed investor support in uncertain times.”
Lucy TarletonDirector, UK Capital Markets Group at PwC
7 | IPO Watch Europe 2016
6 | IPO Watch Europe 2016
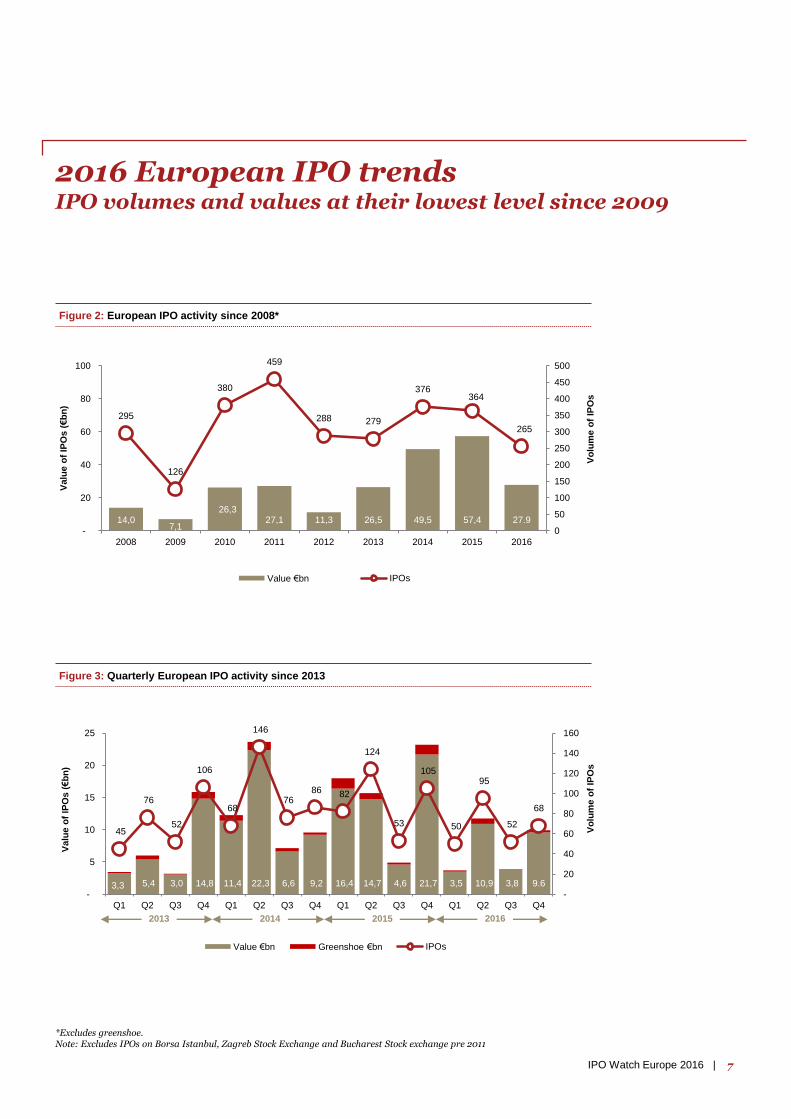
2016 European IPO trendsIPO volumes and values at their lowest level since 2009
Figure 2: European IPO activity since 2008*
Figure 3: Quarterly European IPO activity since 2013
Vo
lum
e o
f IP
Os
Vo
lum
e o
f IP
Os
3,3 5,4 3,0 14,8 11,4 22,3 6,6 9,2 16,4 14,7 4,6 21,7 3,5 10,9 3,8 9.6
45
76
52
106
68
146
76 86 82
124
53
105
50
95
52
68
-
20
40
60
80
100
120
140
160
-
5
10
15
20
25
Q1 Q2 Q3 Q4 Q1 Q2 Q3 Q4 Q1 Q2 Q3 Q4 Q1 Q2 Q3 Q4
Valu
e o
f IP
Os (€b
n)
Value €bn Greenshoe €bn IPOs
*Excludes greenshoe. Note: Excludes IPOs on Borsa Istanbul, Zagreb Stock Exchange and Bucharest Stock exchange pre 2011
14,07,1
26,327,1 11,3 26,5 49,5 57,4 27.9
295
126
380
459
288 279
376364
265
0
50
100
150
200
250
300
350
400
450
500
-
20
40
60
80
100
2008 2009 2010 2011 2012 2013 2014 2015 2016
Valu
e o
f IP
Os (€b
n)
Value €bn IPOs
2013 2014 2015 2016
7IPO Watch Europe 2016 |
China
stock
market
turmoil
QE by
ECB
Falling oil prices,
Chinese economy
slowdown and
threat of impending
bear market
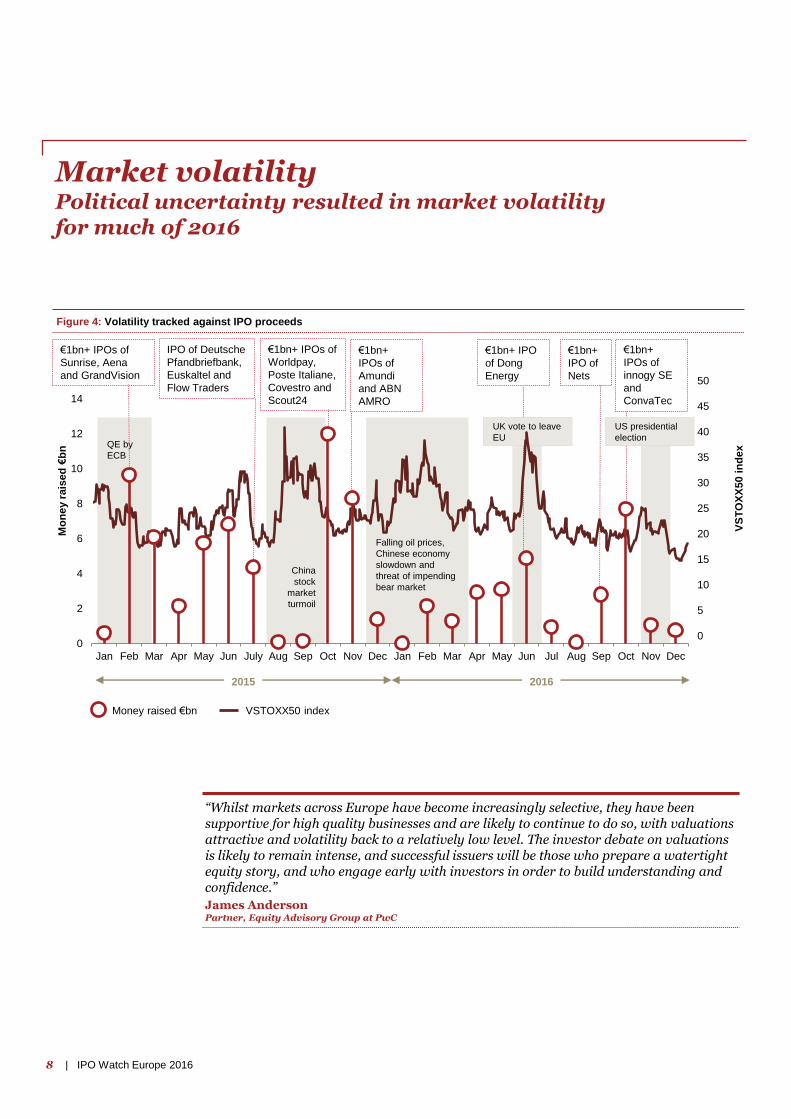
Market volatility Political uncertainty resulted in market volatility for much of 2016
Figure 4: Volatility tracked against IPO proceeds
Mo
ne
y r
ais
ed
€b
n
Money raised €bn VSTOXX50 index
2015 2016
€1bn+ IPOs of
Sunrise, Aena
and GrandVision
IPO of Deutsche
Pfandbriefbank,
Euskaltel and
Flow Traders
€1bn+ IPOs of
Worldpay,
Poste Italiane,
Covestro and
Scout24
VS
TO
XX
50 i
nd
ex
€1bn+
IPOs of
Amundi
and ABN
AMRO
€1bn+
IPOs of
innogy SE
and
ConvaTec
€1bn+
IPO of
Nets
€1bn+ IPO
of Dong
Energy
UK vote to leave
EU
8 | IPO Watch Europe 2016
“Whilst markets across Europe have become increasingly selective, they have been supportive for high quality businesses and are likely to continue to do so, with valuations attractive and volatility back to a relatively low level. The investor debate on valuations is likely to remain intense, and successful issuers will be those who prepare a watertight equity story, and who engage early with investors in order to build understanding and confidence.”
James AndersonPartner, Equity Advisory Group at PwC
US presidential
election
0
5
10
15
20
25
30
35
40
45
50
0
2
4
6
8
10
12
14
Jan Feb Mar Apr May Jun July Aug Sep Oct Nov Dec Jan Feb Mar Apr May Jun Jul Aug Sep Oct Nov Dec
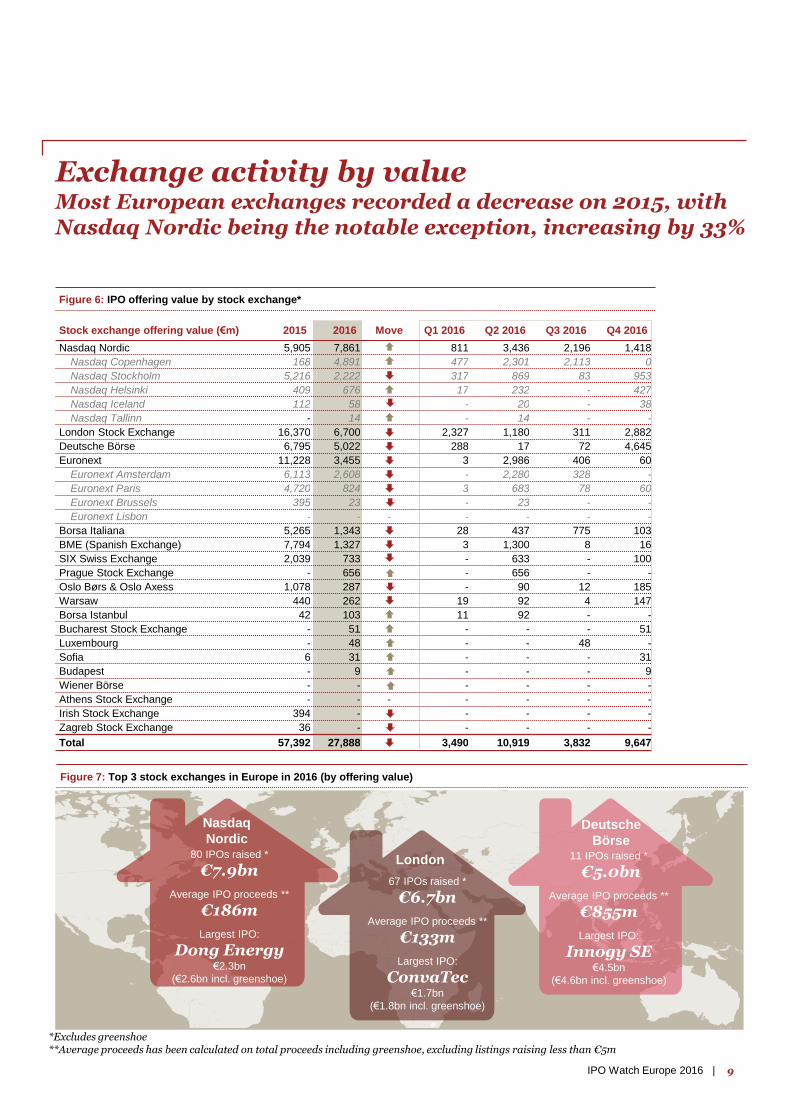
Figure 7: Top 3 stock exchanges in Europe in 2016 (by offering value)
*Excludes greenshoe**Average proceeds has been calculated on total proceeds including greenshoe, excluding listings raising less than €5m
London
67 IPOs raised *
€6.7bn
Average IPO proceeds **
€133m
Largest IPO:
ConvaTec€1.7bn
(€1.8bn incl. greenshoe)
Deutsche
Börse 11 IPOs raised *
€5.0bn
Average IPO proceeds **
€855m
Largest IPO:
Innogy SE €4.5bn
(€4.6bn incl. greenshoe)
Exchange activity by valueMost European exchanges recorded a decrease on 2015, with Nasdaq Nordic being the notable exception, increasing by 33%
Nasdaq
Nordic80 IPOs raised *
€7.9bn
Average IPO proceeds **
€186m
Largest IPO:
Dong Energy€2.3bn
(€2.6bn incl. greenshoe)
Stock exchange offering value (€m) 2015 2016 Move Q1 2016 Q2 2016 Q3 2016 Q4 2016
Nasdaq Nordic 5,905 7,861 811 3,436 2,196 1,418
Nasdaq Copenhagen 168 4,891 477 2,301 2,113 0
Nasdaq Stockholm 5,216 2,222 317 869 83 953
Nasdaq Helsinki 409 676 17 232 - 427
Nasdaq Iceland 112 58 - 20 - 38
Nasdaq Tallinn - 14 - 14 - -
London Stock Exchange 16,370 6,700 2,327 1,180 311 2,882
Deutsche Börse 6,795 5,022 288 17 72 4,645
Euronext 11,228 3,455 3 2,986 406 60
Euronext Amsterdam 6,113 2,608 - 2,280 328 -
Euronext Paris 4,720 824 3 683 78 60
Euronext Brussels 395 23 - 23 - -
Euronext Lisbon - - - - - - -
Borsa Italiana 5,265 1,343 28 437 775 103
BME (Spanish Exchange) 7,794 1,327 3 1,300 8 16
SIX Swiss Exchange 2,039 733 - 633 - 100
Prague Stock Exchange - 656 - 656 - -
Oslo Børs & Oslo Axess 1,078 287 - 90 12 185
Warsaw 440 262 19 92 4 147
Borsa Istanbul 42 103 11 92 - -
Bucharest Stock Exchange - 51 - - - 51
Luxembourg - 48 - - 48 -
Sofia 6 31 - - - 31
Budapest - 9 - - - 9
Wiener Börse - - - - - - -
Athens Stock Exchange - - - - - - -
Irish Stock Exchange 394 - - - - -
Zagreb Stock Exchange 36 - - - - -
Total 57,392 27,888 3,490 10,919 3,832 9,647
Figure 6: IPO offering value by stock exchange*
9IPO Watch Europe 2016 |
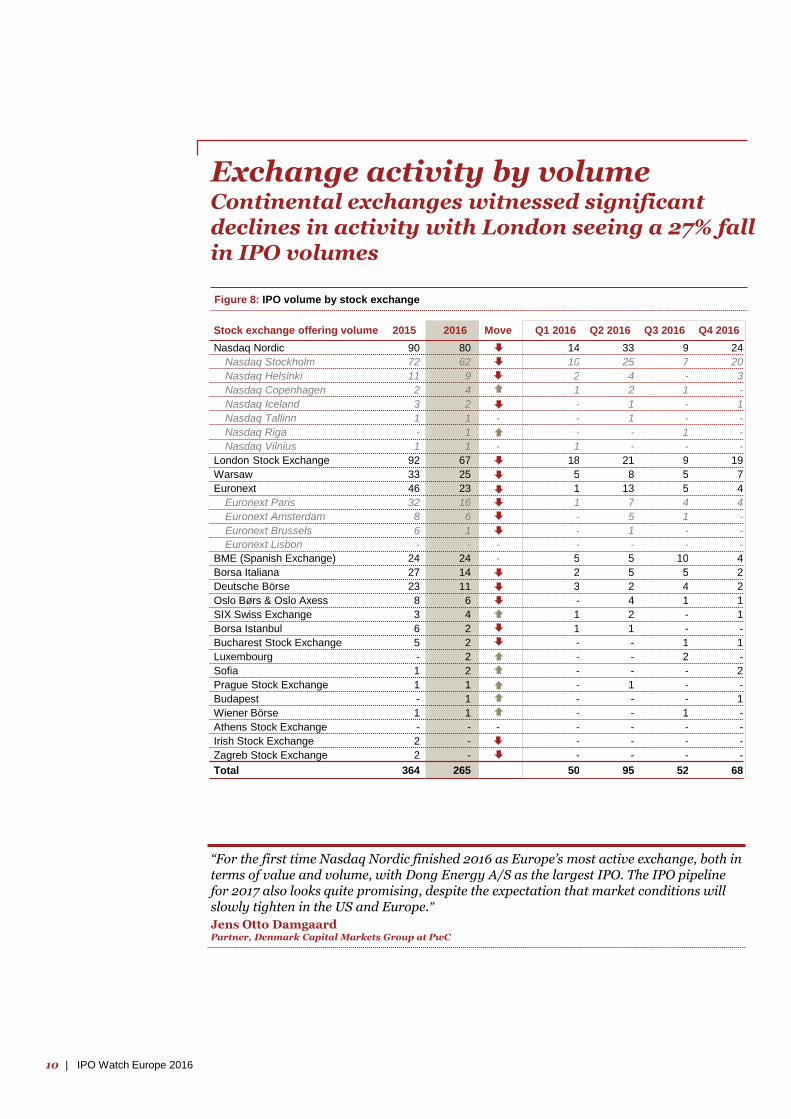
Stock exchange offering volume 2015 2016 Move Q1 2016 Q2 2016 Q3 2016 Q4 2016
Nasdaq Nordic 90 80 14 33 9 24
Nasdaq Stockholm 72 62 10 25 7 20
Nasdaq Helsinki 11 9 2 4 - 3
Nasdaq Copenhagen 2 4 1 2 1 -
Nasdaq Iceland 3 2 - 1 - 1
Nasdaq Tallinn 1 1 - - 1 - -
Nasdaq Riga - 1 - - 1 -
Nasdaq Vilnius 1 1 - 1 - - -
London Stock Exchange 92 67 18 21 9 19
Warsaw 33 25 5 8 5 7
Euronext 46 23 1 13 5 4
Euronext Paris 32 16 1 7 4 4
Euronext Amsterdam 8 6 - 5 1 -
Euronext Brussels 6 1 - 1 - -
Euronext Lisbon - - - - - - -
BME (Spanish Exchange) 24 24 - 5 5 10 4
Borsa Italiana 27 14 2 5 5 2
Deutsche Börse 23 11 3 2 4 2
Oslo Børs & Oslo Axess 8 6 - 4 1 1
SIX Swiss Exchange 3 4 1 2 - 1
Borsa Istanbul 6 2 1 1 - -
Bucharest Stock Exchange 5 2 - - 1 1
Luxembourg - 2 - - 2 -
Sofia 1 2 - - - 2
Prague Stock Exchange 1 1 - - 1 - -
Budapest - 1 - - - 1
Wiener Börse 1 1 - - - 1 -
Athens Stock Exchange - - - - - - -
Irish Stock Exchange 2 - - - - - -
Zagreb Stock Exchange 2 - - - - -
Total 364 265 50 95 52 68
Exchange activity by volume Continental exchanges witnessed significant declines in activity with London seeing a 27% fall in IPO volumes
Figure 8: IPO volume by stock exchange
“For the first time Nasdaq Nordic finished 2016 as Europe’s most active exchange, both in terms of value and volume, with Dong Energy A/S as the largest IPO. The IPO pipeline for 2017 also looks quite promising, despite the expectation that market conditions will slowly tighten in the US and Europe.”
Jens Otto DamgaardPartner, Denmark Capital Markets Group at PwC
10 | IPO Watch Europe 2016
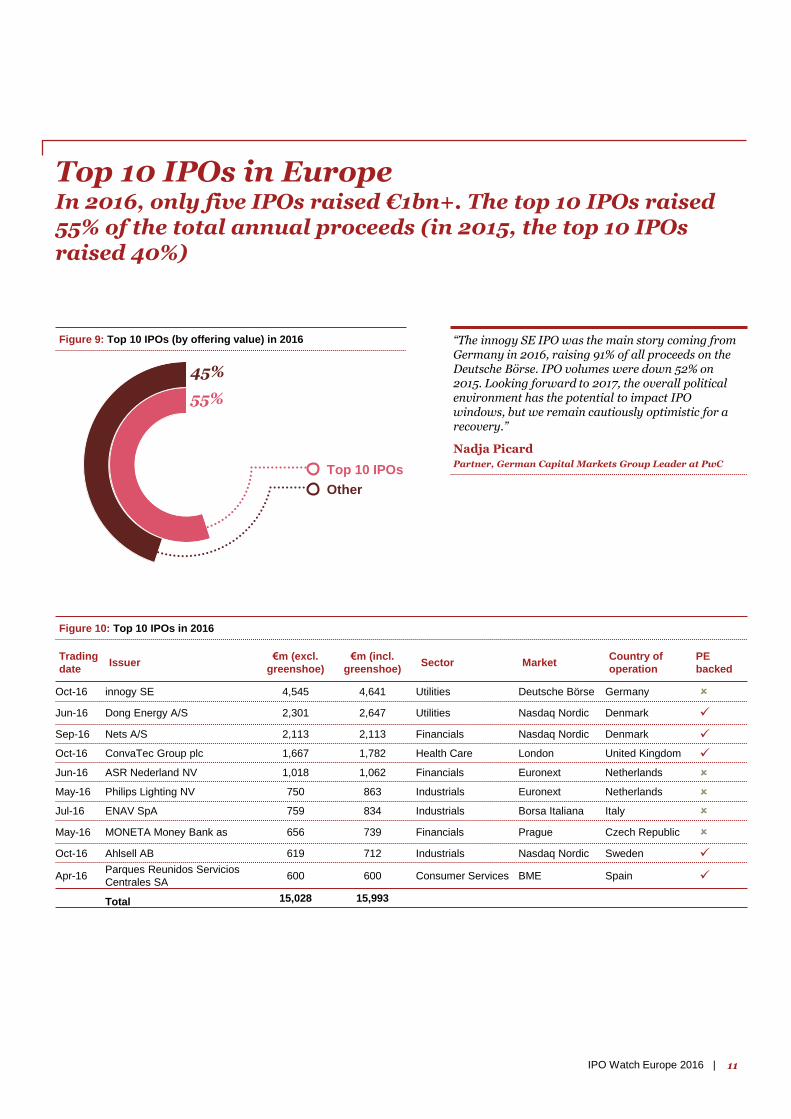
Trading
dateIssuer
€m (excl.
greenshoe)
€m (incl.
greenshoe)Sector Market
Country of
operation
PE
backed
Oct-16 innogy SE 4,545 4,641 Utilities Deutsche Börse Germany
Jun-16 Dong Energy A/S 2,301 2,647 Utilities Nasdaq Nordic Denmark
Sep-16 Nets A/S 2,113 2,113 Financials Nasdaq Nordic Denmark
Oct-16 ConvaTec Group plc 1,667 1,782 Health Care London United Kingdom
Jun-16 ASR Nederland NV 1,018 1,062 Financials Euronext Netherlands
May-16 Philips Lighting NV 750 863 Industrials Euronext Netherlands
Jul-16 ENAV SpA 759 834 Industrials Borsa Italiana Italy
May-16 MONETA Money Bank as 656 739 Financials Prague Czech Republic
Oct-16 Ahlsell AB 619 712 Industrials Nasdaq Nordic Sweden
Apr-16Parques Reunidos Servicios
Centrales SA600 600 Consumer Services BME Spain
Total 15,028 15,993
Top 10 IPOs in EuropeIn 2016, only five IPOs raised €1bn+. The top 10 IPOs raised 55% of the total annual proceeds (in 2015, the top 10 IPOs raised 40%)
Figure 10: Top 10 IPOs in 2016
Other
Top 10 IPOs
45%
55%
Figure 9: Top 10 IPOs (by offering value) in 2016 “The innogy SE IPO was the main story coming from Germany in 2016, raising 91% of all proceeds on the Deutsche Börse. IPO volumes were down 52% on 2015. Looking forward to 2017, the overall political environment has the potential to impact IPO windows, but we remain cautiously optimistic for a recovery.”
Nadja PicardPartner, German Capital Markets Group Leader at PwC
11IPO Watch Europe 2016 |
-8,3%
8,8%
13,9%
-11,2%
-17,6%
-5,9%
4,0%
1,8%
15,9%
8,6%
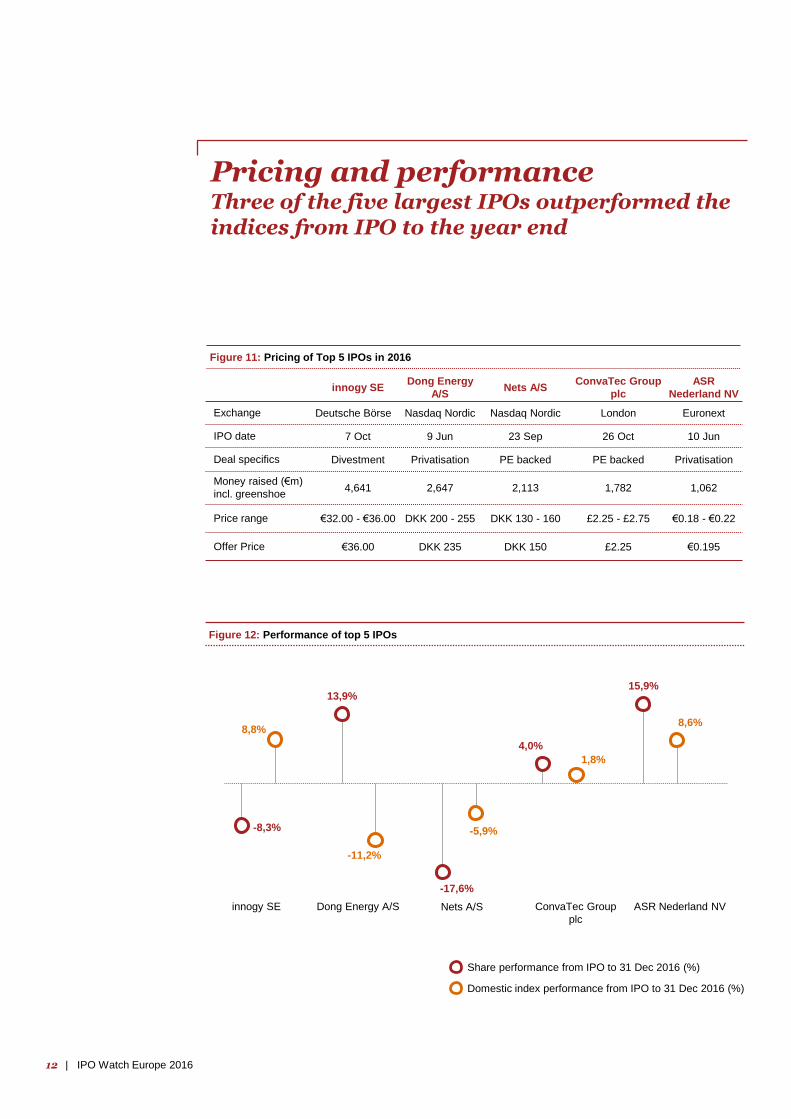
Pricing and performanceThree of the five largest IPOs outperformed the indices from IPO to the year end
Figure 11: Pricing of Top 5 IPOs in 2016
innogy SEDong Energy
A/SNets A/S
ConvaTec Group
plc
ASR
Nederland NV
Exchange Deutsche Börse Nasdaq Nordic Nasdaq Nordic London Euronext
IPO date 7 Oct 9 Jun 23 Sep 26 Oct 10 Jun
Deal specifics Divestment Privatisation PE backed PE backed Privatisation
Money raised (€m)
incl. greenshoe4,641 2,647 2,113 1,782 1,062
Price range €32.00 - €36.00 DKK 200 - 255 DKK 130 - 160 £2.25 - £2.75 €0.18 - €0.22
Offer Price €36.00 DKK 235 DKK 150 £2.25 €0.195
Figure 12: Performance of top 5 IPOs
Share performance from IPO to 31 Dec 2016 (%)
Domestic index performance from IPO to 31 Dec 2016 (%)
innogy SE Dong Energy A/S Nets A/S ConvaTec Group
plc
ASR Nederland NV
12 | IPO Watch Europe 2016
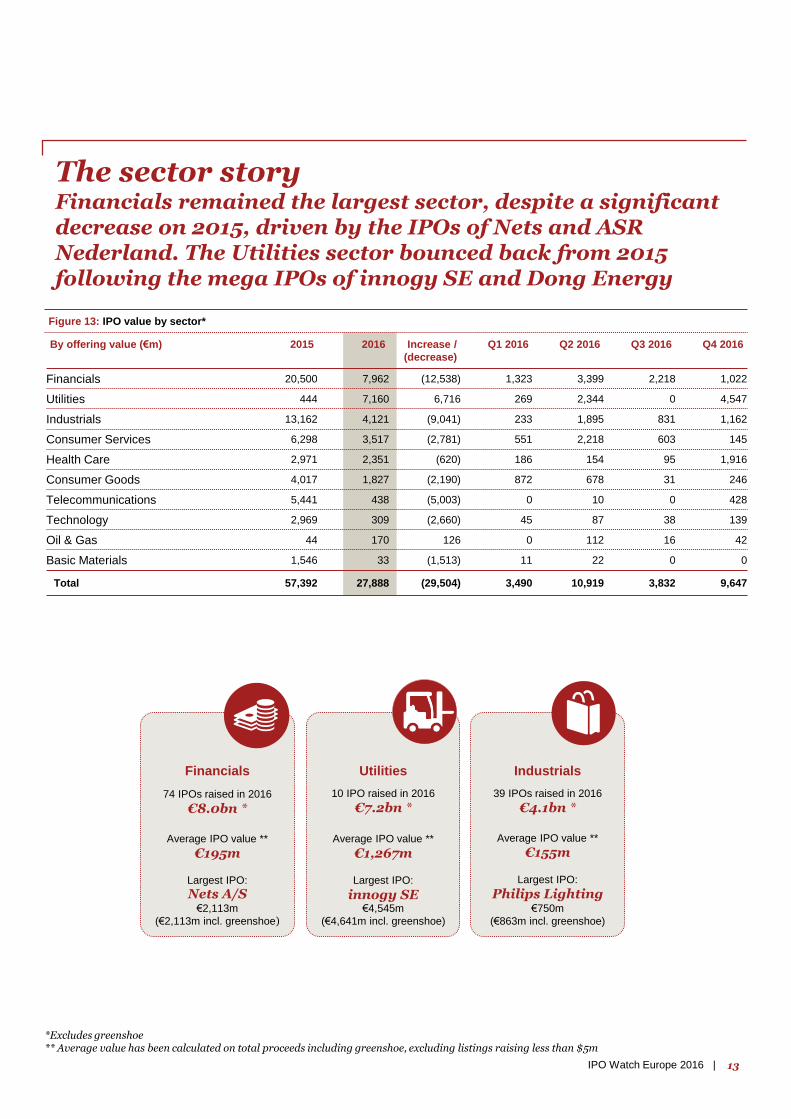
By offering value (€m) 2015 2016 Increase /
(decrease)
Q1 2016 Q2 2016 Q3 2016 Q4 2016
Financials 20,500 7,962 (12,538) 1,323 3,399 2,218 1,022
Utilities 444 7,160 6,716 269 2,344 0 4,547
Industrials 13,162 4,121 (9,041) 233 1,895 831 1,162
Consumer Services 6,298 3,517 (2,781) 551 2,218 603 145
Health Care 2,971 2,351 (620) 186 154 95 1,916
Consumer Goods 4,017 1,827 (2,190) 872 678 31 246
Telecommunications 5,441 438 (5,003) 0 10 0 428
Technology 2,969 309 (2,660) 45 87 38 139
Oil & Gas 44 170 126 0 112 16 42
Basic Materials 1,546 33 (1,513) 11 22 0 0
Total 57,392 27,888 (29,504) 3,490 10,919 3,832 9,647
The sector storyFinancials remained the largest sector, despite a significant decrease on 2015, driven by the IPOs of Nets and ASR Nederland. The Utilities sector bounced back from 2015 following the mega IPOs of innogy SE and Dong Energy
*Excludes greenshoe** Average value has been calculated on total proceeds including greenshoe, excluding listings raising less than $5m
Figure 13: IPO value by sector*
Industrials
39 IPOs raised in 2016
€4.1bn *
Average IPO value **
€155m
Largest IPO:
Philips Lighting€750m
(€863m incl. greenshoe)
Utilities
10 IPO raised in 2016
€7.2bn *
Average IPO value **
€1,267m
Largest IPO:
innogy SE€4,545m
(€4,641m incl. greenshoe)
Financials
74 IPOs raised in 2016
€8.0bn *
Average IPO value **
€195m
Largest IPO:
Nets A/S€2,113m
(€2,113m incl. greenshoe)
13IPO Watch Europe 2016 |
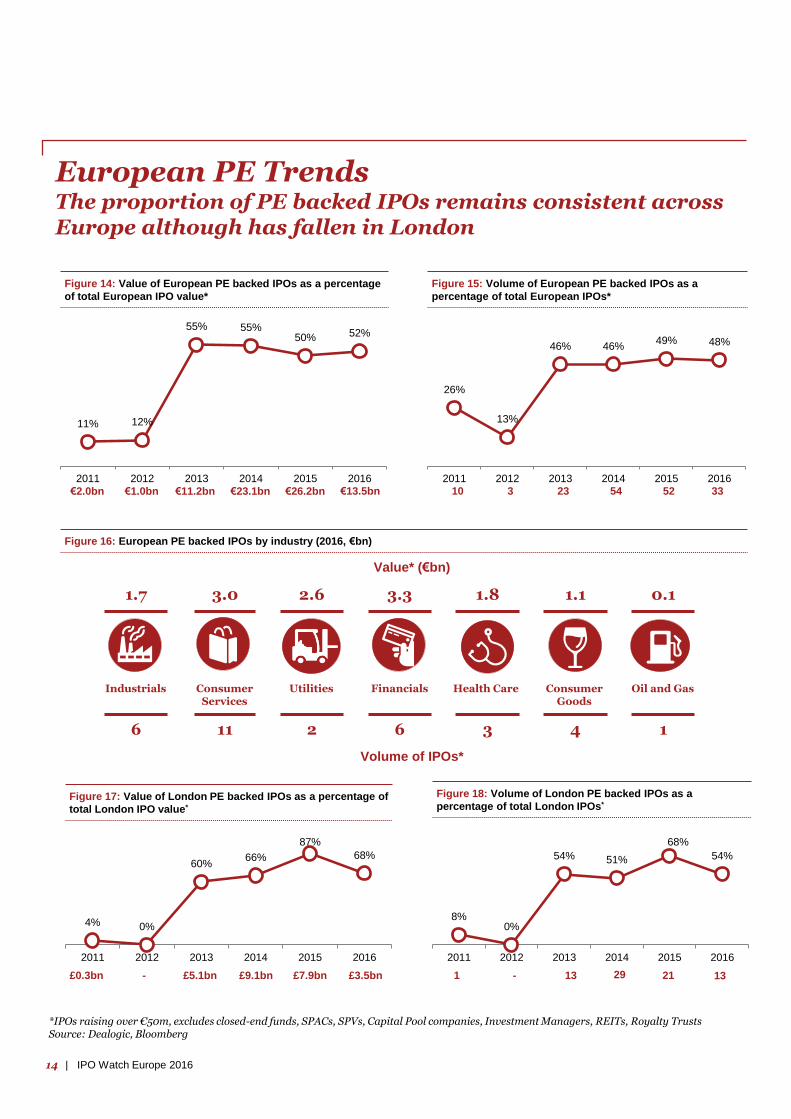
European PE TrendsThe proportion of PE backed IPOs remains consistent across Europe although has fallen in London
26%
13%
46% 46%49% 48%
2011 2012 2013 2014 2015 2016
11% 12%
55% 55%50% 52%
2011 2012 2013 2014 2015 2016
Figure 15: Volume of European PE backed IPOs as a
percentage of total European IPOs*
Figure 14: Value of European PE backed IPOs as a percentage
of total European IPO value*
8%0%
54% 51%
68%
54%
2011 2012 2013 2014 2015 2016
4% 0%
60%66%
87%
68%
2011 2012 2013 2014 2015 2016
Figure 18: Volume of London PE backed IPOs as a
percentage of total London IPOs*Figure 17: Value of London PE backed IPOs as a percentage of
total London IPO value*
Value* (€bn)
1.7 3.0 2.6 3.3 1.8 1.1 0.1
6 11 2 6 3 4 1
Volume of IPOs*
Figure 16: European PE backed IPOs by industry (2016, €bn)
*IPOs raising over €50m, excludes closed-end funds, SPACs, SPVs, Capital Pool companies, Investment Managers, REITs, Royalty TrustsSource: Dealogic, Bloomberg
€2.0bn €1.0bn €11.2bn €23.1bn €26.2bn €13.5bn 10 3 23 54 52 33
£0.3bn - £5.1bn £9.1bn £7.9bn £3.5bn 1 - 13 29 21 13
Industrials Consumer Services
Utilities Financials Health Care Consumer Goods
Oil and Gas
14 | IPO Watch Europe 2016
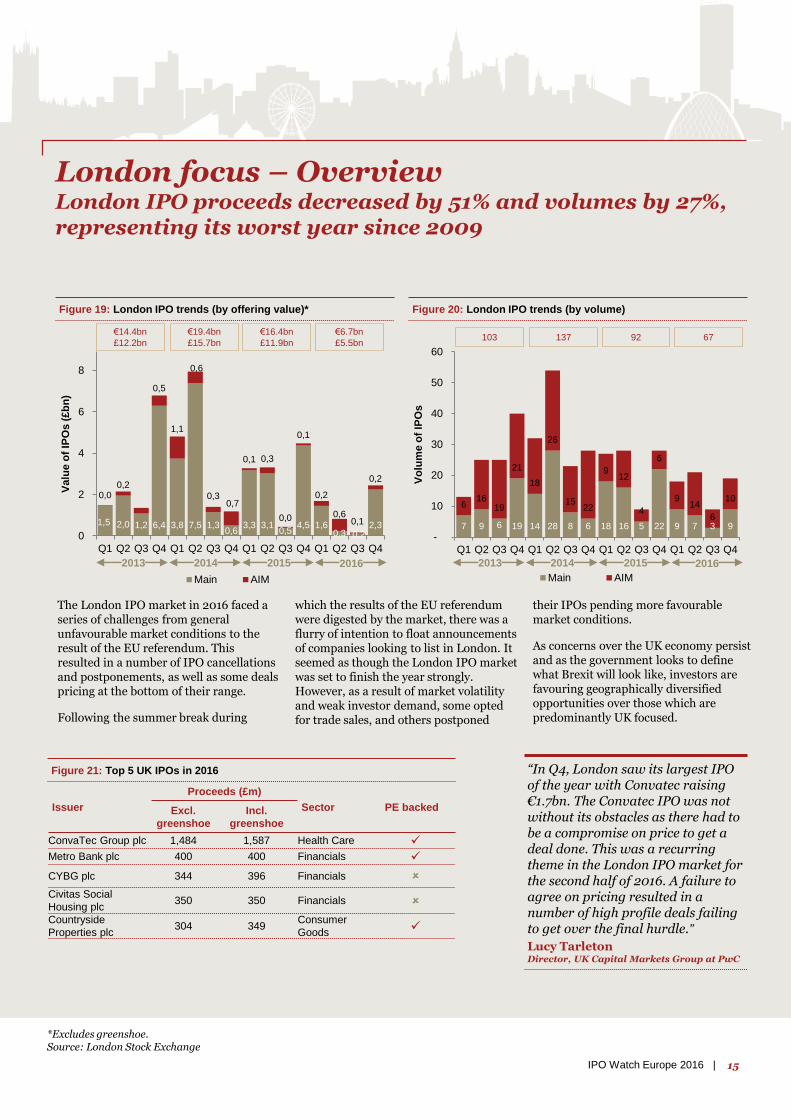
London focus – OverviewLondon IPO proceeds decreased by 51% and volumes by 27%, representing its worst year since 2009
Figure 19: London IPO trends (by offering value)* Figure 20: London IPO trends (by volume)
7 9 6 19 14 28 8 6 18 16 5 22 9 7 3 9
616
19
21
18
26
1522
912
4
6
914
6
10
-
10
20
30
40
50
60
Q1 Q2 Q3 Q4 Q1 Q2 Q3 Q4 Q1 Q2 Q3 Q4 Q1 Q2 Q3 Q4
Vo
lum
e o
f IP
Os
Main AIM
1,5 2,0 1,2 6,4 3,8 7,5 1,30,6
3,3 3,10,5
4,5 1,60,3 0,2
2,3
0,00,2
0,5
1,1
0,6
0,30,7
0,1 0,3
0,0
0,1
0,2
0,60,1
0,2
0
2
4
6
8
Q1 Q2 Q3 Q4 Q1 Q2 Q3 Q4 Q1 Q2 Q3 Q4 Q1 Q2 Q3 Q4
Valu
e o
f IP
Os (
£b
n)
Main AIM
2013 2014 2015 2016 2013 2014 2015 2016
The London IPO market in 2016 faced a series of challenges from general unfavourable market conditions to the result of the EU referendum. This resulted in a number of IPO cancellations and postponements, as well as some deals pricing at the bottom of their range.
Following the summer break during
which the results of the EU referendum were digested by the market, there was a flurry of intention to float announcements of companies looking to list in London. It seemed as though the London IPO market was set to finish the year strongly. However, as a result of market volatility and weak investor demand, some opted for trade sales, and others postponed
their IPOs pending more favourable market conditions.
As concerns over the UK economy persist and as the government looks to define what Brexit will look like, investors are favouring geographically diversified opportunities over those which are predominantly UK focused.
Issuer
Proceeds (£m)
Sector PE backedExcl.
greenshoe
Incl.
greenshoe
ConvaTec Group plc 1,484 1,587 Health Care
Metro Bank plc 400 400 Financials
CYBG plc 344 396 Financials
Civitas Social
Housing plc350 350 Financials
Countryside
Properties plc304 349
Consumer
Goods
Figure 21: Top 5 UK IPOs in 2016
*Excludes greenshoe.Source: London Stock Exchange
€14.4bn
£12.2bn
€19.4bn
£15.7bn
€16.4bn
£11.9bn
€6.7bn
£5.5bn103 137 92 67
“In Q4, London saw its largest IPO of the year with Convatec raising €1.7bn. The Convatec IPO was not without its obstacles as there had to be a compromise on price to get a deal done. This was a recurring theme in the London IPO market for the second half of 2016. A failure to agree on pricing resulted in a number of high profile deals failing to get over the final hurdle.”
Lucy TarletonDirector, UK Capital Markets Group at PwC
15IPO Watch Europe 2016 |
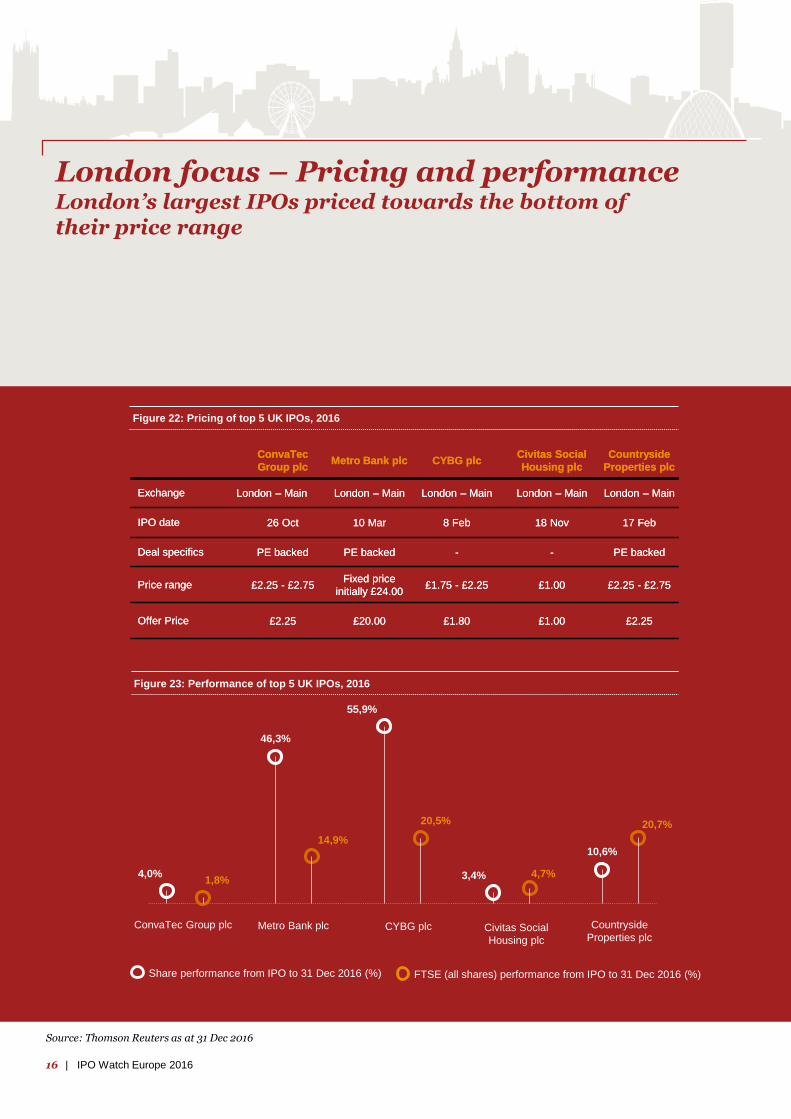
London focus – Pricing and performanceLondon’s largest IPOs priced towards the bottom of their price range
Source: Thomson Reuters as at 31 Dec 2016
ConvaTec
Group plcMetro Bank plc CYBG plc
Civitas Social
Housing plc
Countryside
Properties plc
Exchange London – Main London – Main London – Main London – Main London – Main
IPO date 26 Oct 10 Mar 8 Feb 18 Nov 17 Feb
Deal specifics PE backed PE backed - - PE backed
Price range £2.25 - £2.75Fixed price
initially £24.00£1.75 - £2.25 £1.00 £2.25 - £2.75
Offer Price £2.25 £20.00 £1.80 £1.00 £2.25
Figure 22: Pricing of top 5 UK IPOs, 2016
Figure 23: Performance of top 5 UK IPOs, 2016
Share performance from IPO to 31 Dec 2016 (%) FTSE (all shares) performance from IPO to 31 Dec 2016 (%)
ConvaTec
Group plcMetro Bank plc CYBG plc
Civitas Social
Housing plc
Countryside
Properties plc
Exchange London – Main London – Main London – Main London – Main London – Main
IPO date 26 Oct 10 Mar 8 Feb 18 Nov 17 Feb
Deal specifics PE backed PE backed - - PE backed
Price range £2.25 - £2.75Fixed price
initially £24.00£1.75 - £2.25 £1.00 £2.25 - £2.75
Offer Price £2.25 £20.00 £1.80 £1.00 £2.25
4,0%1,8%
46,3%
14,9%
55,9%
20,5%
3,4% 4,7%
10,6%
20,7%
ConvaTec Group plc Metro Bank plc CYBG plc Civitas Social
Housing plc
Countryside
Properties plc
16 | IPO Watch Europe 2016
4517877
646258
484644
393531292724242221
149884421
-1-1-1-1-1-2-2-2-4-6-7-8
-10-10-12-14-15-16
-20-23
-29-53
-80
-200% -100% 0% 100% 200% 300% 400% 500%
Blue Prism Group plc
Hotel Chocolat Group plc
MaxCyte Inc
Filta Group Holdings plc
Cerillion Technologies Ltd
Yu Group plc
Directa Plus srl
Luceco plc
Harwood Wealth Management Group plc
Warpaint London plc
CYBG plc
Metro Bank plc
ECSC Group plc
Autins Group plc
Van Elle plc
Comptoir Group plc
Joules Group plc
Big Sofa Technologies Group plc
LoopUp Group plc
Accrol Group Holdings plc
Ascential plc
Mereo Biopharma Group Ltd
Creo Medical Group plc
Pacific Industrial & Logistics REIT plc
ConvaTec Group plc
FreeAgent Holdings plc
Watkin Jones plc
Civitas Social Housing plc
RM Secured Direct Lending plc
BB Healthcare Trust plc
Hollywood Bowl Group plc
Ranger Direct Lending ZDP plc
Biffa plc
Draper Esprit LLP
Premier Asset Management Group plc
Midwich Group plc
Shield Therapeutics plc
Oxford BioDynamics plc
Hadrians Wall Secured Investments Ltd
Countryside Properties plc
Morses Club Ltd
Forterra plc
Oncimmune Holdings plc
Puma VCT 12 PLC
Dorcaster plc
Time Out Group Ltd
Osirium Technologies plc
Motorpoint Group plc
CMC Markets plc
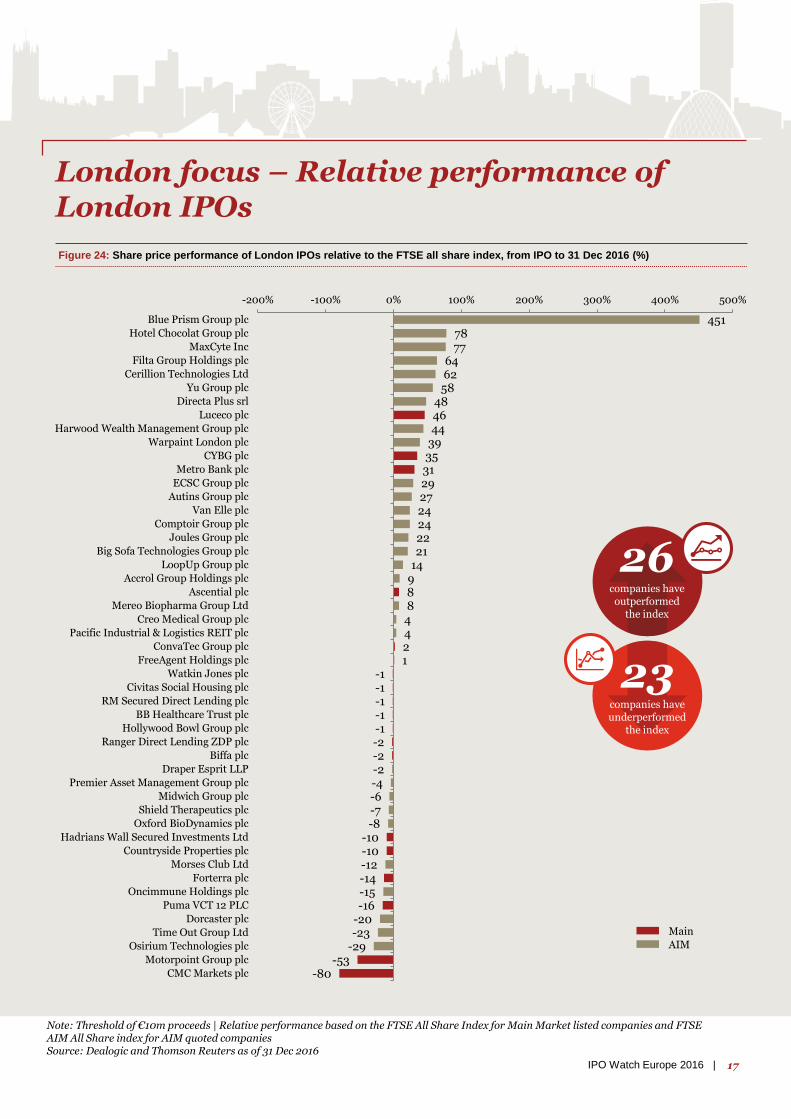
London focus – Relative performance of London IPOs
Figure 24: Share price performance of London IPOs relative to the FTSE all share index, from IPO to 31 Dec 2016 (%)
Note: Threshold of €10m proceeds | Relative performance based on the FTSE All Share Index for Main Market listed companies and FTSE AIM All Share index for AIM quoted companiesSource: Dealogic and Thomson Reuters as of 31 Dec 2016
Main
AIM
23companies have underperformed
the index
26companies have outperformed
the index
17IPO Watch Europe 2016 |
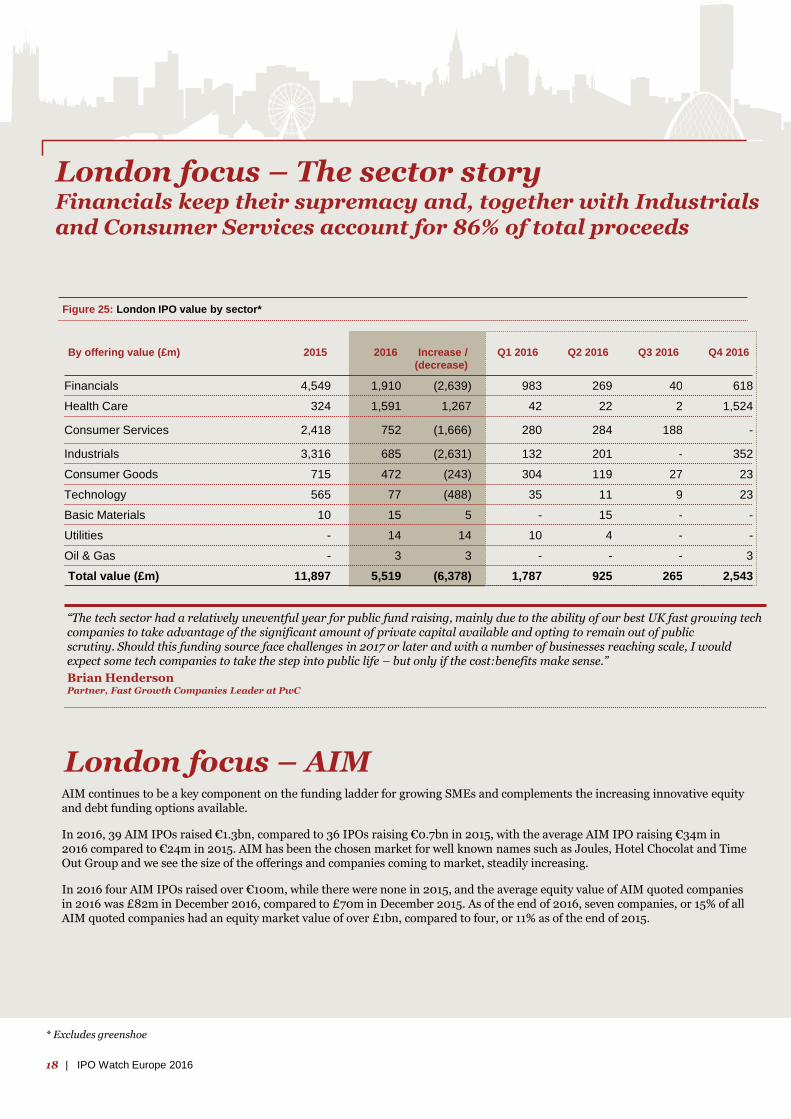
London focus – The sector storyFinancials keep their supremacy and, together with Industrials and Consumer Services account for 86% of total proceeds
By offering value (£m) 2015 2016 Increase /
(decrease)
Q1 2016 Q2 2016 Q3 2016 Q4 2016
Financials 4,549 1,910 (2,639) 983 269 40 618
Health Care 324 1,591 1,267 42 22 2 1,524
Consumer Services 2,418 752 (1,666) 280 284 188 -
Industrials 3,316 685 (2,631) 132 201 - 352
Consumer Goods 715 472 (243) 304 119 27 23
Technology 565 77 (488) 35 11 9 23
Basic Materials 10 15 5 - 15 - -
Utilities - 14 14 10 4 - -
Oil & Gas - 3 3 - - - 3
Total value (£m) 11,897 5,519 (6,378) 1,787 925 265 2,543
Figure 25: London IPO value by sector*
* Excludes greenshoe
“The tech sector had a relatively uneventful year for public fund raising, mainly due to the ability of our best UK fast growing tech companies to take advantage of the significant amount of private capital available and opting to remain out of public scrutiny. Should this funding source face challenges in 2017 or later and with a number of businesses reaching scale, I would expect some tech companies to take the step into public life – but only if the cost:benefits make sense.”
Brian HendersonPartner, Fast Growth Companies Leader at PwC
London focus – AIMAIM continues to be a key component on the funding ladder for growing SMEs and complements the increasing innovative equity and debt funding options available.
In 2016, 39 AIM IPOs raised €1.3bn, compared to 36 IPOs raising €0.7bn in 2015, with the average AIM IPO raising €34m in 2016 compared to €24m in 2015. AIM has been the chosen market for well known names such as Joules, Hotel Chocolat and Time Out Group and we see the size of the offerings and companies coming to market, steadily increasing.
In 2016 four AIM IPOs raised over €100m, while there were none in 2015, and the average equity value of AIM quoted companies in 2016 was £82m in December 2016, compared to £70m in December 2015. As of the end of 2016, seven companies, or 15% of all AIM quoted companies had an equity market value of over £1bn, compared to four, or 11% as of the end of 2015.
18 | IPO Watch Europe 2016
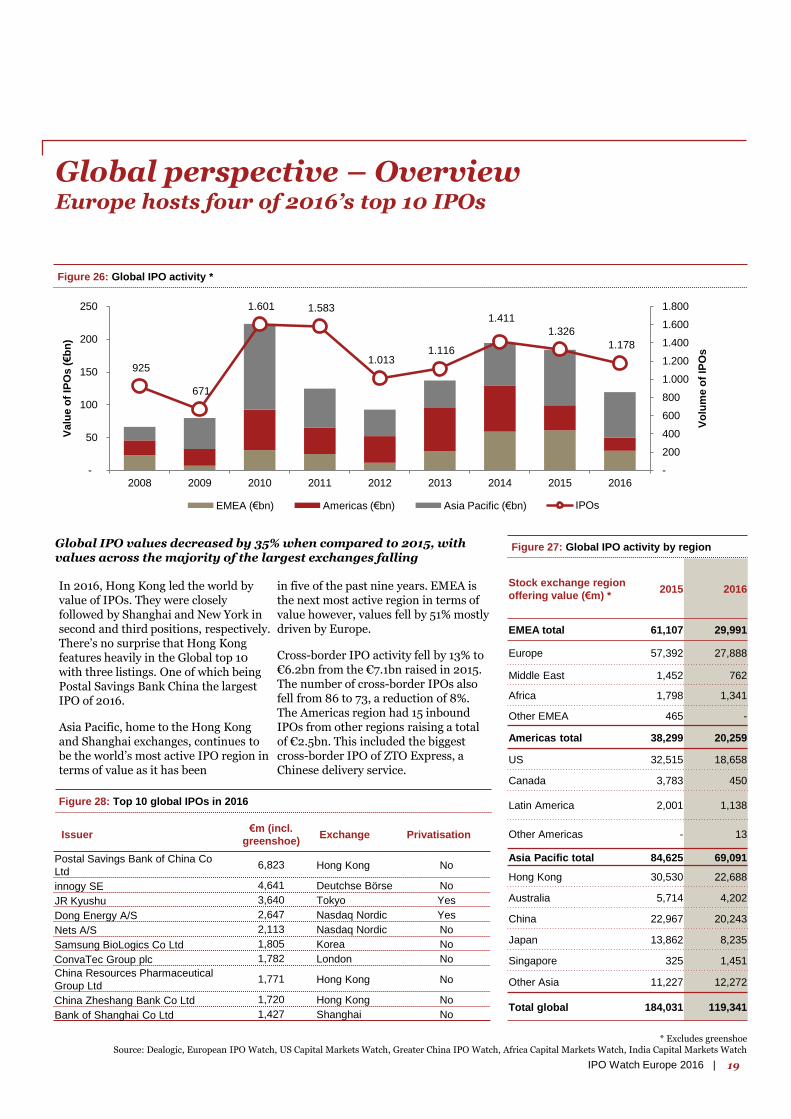
Global perspective – OverviewEurope hosts four of 2016’s top 10 IPOs
Figure 26: Global IPO activity *
925
671
1.601 1.583
1.013 1.116
1.411
1.326
1.178
-
200
400
600
800
1.000
1.200
1.400
1.600
1.800
-
50
100
150
200
250
2008 2009 2010 2011 2012 2013 2014 2015 2016
Vo
lum
e o
f IP
Os
Valu
e o
f IP
Os (€b
n)
EMEA (€bn) Americas (€bn) Asia Pacific (€bn) IPOs
Figure 27: Global IPO activity by region
* Excludes greenshoeSource: Dealogic, European IPO Watch, US Capital Markets Watch, Greater China IPO Watch, Africa Capital Markets Watch, India Capital Markets Watch
Issuer€m (incl.
greenshoe)Exchange Privatisation
Postal Savings Bank of China Co
Ltd6,823 Hong Kong No
innogy SE 4,641 Deutchse Börse No
JR Kyushu 3,640 Tokyo Yes
Dong Energy A/S 2,647 Nasdaq Nordic Yes
Nets A/S 2,113 Nasdaq Nordic No
Samsung BioLogics Co Ltd 1,805 Korea No
ConvaTec Group plc 1,782 London No
China Resources Pharmaceutical
Group Ltd1,771 Hong Kong No
China Zheshang Bank Co Ltd 1,720 Hong Kong No
Bank of Shanghai Co Ltd 1,427 Shanghai No
Figure 28: Top 10 global IPOs in 2016
In 2016, Hong Kong led the world by value of IPOs. They were closely followed by Shanghai and New York in second and third positions, respectively. There’s no surprise that Hong Kong features heavily in the Global top 10 with three listings. One of which being Postal Savings Bank China the largest IPO of 2016.
Asia Pacific, home to the Hong Kong and Shanghai exchanges, continues to be the world’s most active IPO region in terms of value as it has been
in five of the past nine years. EMEA is the next most active region in terms of value however, values fell by 51% mostly driven by Europe.
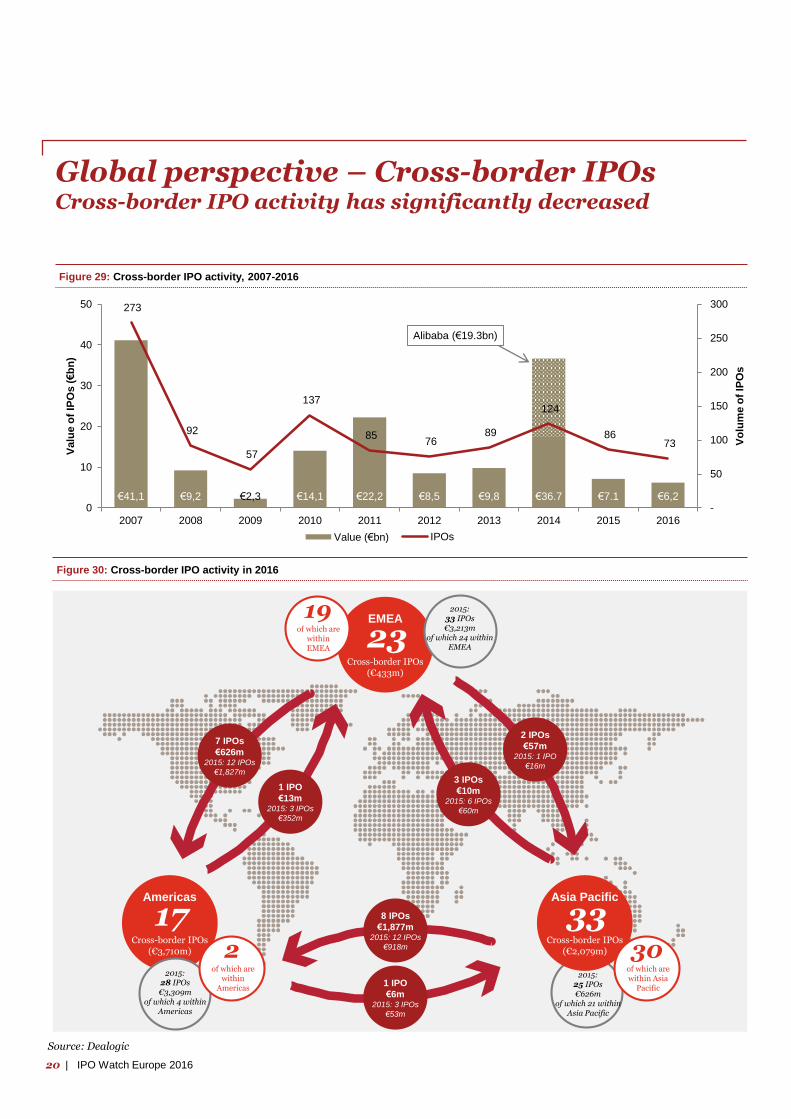
Cross-border IPO activity fell by 13% to €6.2bn from the €7.1bn raised in 2015. The number of cross-border IPOs also fell from 86 to 73, a reduction of 8%. The Americas region had 15 inbound IPOs from other regions raising a total of €2.5bn. This included the biggest cross-border IPO of ZTO Express, aChinese delivery service.
Stock exchange region
offering value (€m) * 2015 2016
EMEA total 61,107 29,991
Europe 57,392 27,888
Middle East 1,452 762
Africa 1,798 1,341
Other EMEA 465 -
Americas total 38,299 20,259
US 32,515 18,658
Canada 3,783 450
Latin America 2,001 1,138
Other Americas - 13
Asia Pacific total 84,625 69,091
Hong Kong 30,530 22,688
Australia 5,714 4,202
China 22,967 20,243
Japan 13,862 8,235
Singapore 325 1,451
Other Asia 11,227 12,272
Total global 184,031 119,341
Global IPO values decreased by 35% when compared to 2015, with values across the majority of the largest exchanges falling
19IPO Watch Europe 2016 |
€41,1 €9,2 €2,3 €14,1 €22,2 €8,5 €9,8 €36.7 €7.1 €6,2
273
92
57
137
85 76
89
124
86 73
-
50
100
150
200
250
300
0
10
20
30
40
50
2007 2008 2009 2010 2011 2012 2013 2014 2015 2016
Vo
lum
e o
f IP
Os
Valu
e o
f IP
Os (€b
n)
Value (€bn) IPOs
Global perspective – Cross-border IPOsCross-border IPO activity has significantly decreased
Figure 29: Cross-border IPO activity, 2007-2016
Figure 30: Cross-border IPO activity in 2016
€2.2bn
€
3 IPOs
€10m2015: 6 IPOs
€60m
7 IPOs
€626m2015: 12 IPOs
€1,827m
1 IPO
€13m2015: 3 IPOs
€352m
8 IPOs
€1,877m2015: 12 IPOs
€918m
1 IPO
€6m2015: 3 IPOs
€53m
EMEA
Cross-border IPOs(€433m)
23of which are
within EMEA
19
Americas
Cross-border IPOs(€3,710m)
17
of which are within
Americas
2
Asia Pacific
Cross-border IPOs(€2,079m)
33
of which are within Asia
Pacific
30
2 IPOs
€57m2015: 1 IPO
€16m
Source: Dealogic
Alibaba (€19.3bn)
2015:28 IPOs €3,309m
of which 4 within Americas
2015:25 IPOs €626m
of which 21 within Asia Pacific
2015:33 IPOs €3,213m
of which 24 within EMEA
20 | IPO Watch Europe 2016
Global perspective – Cross-border IPOs
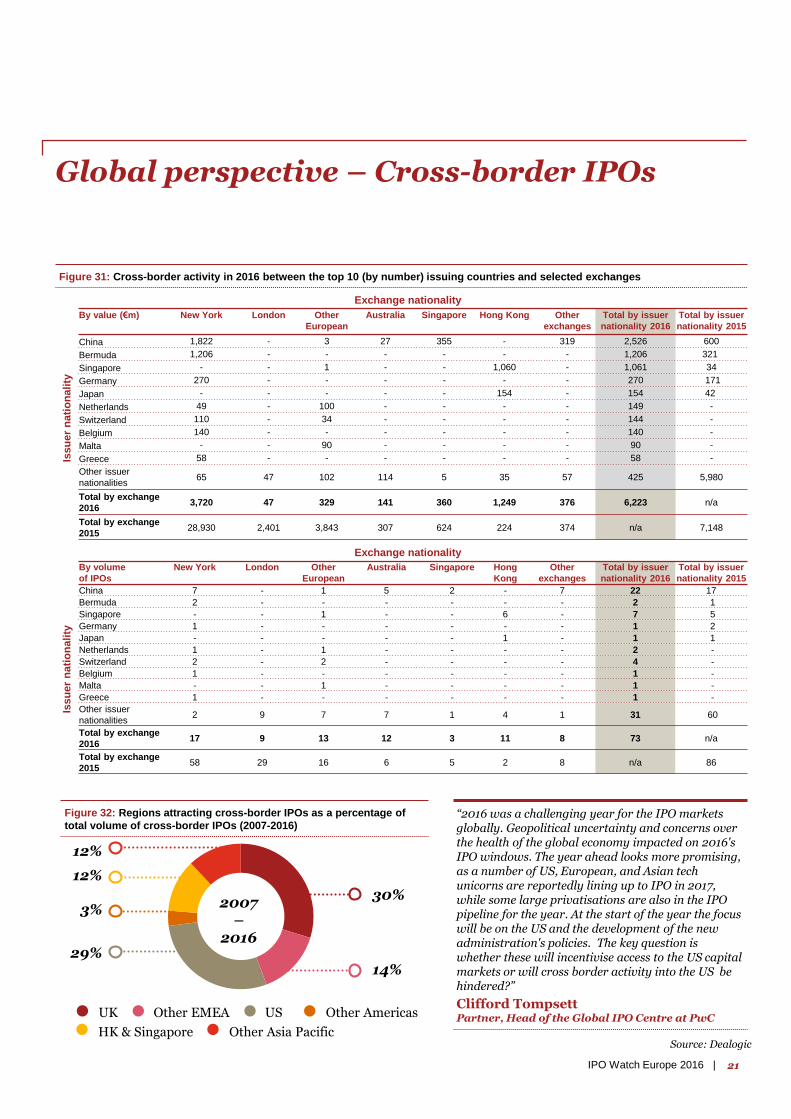
“2016 was a challenging year for the IPO markets globally. Geopolitical uncertainty and concerns over the health of the global economy impacted on 2016's IPO windows. The year ahead looks more promising, as a number of US, European, and Asian tech unicorns are reportedly lining up to IPO in 2017, while some large privatisations are also in the IPO pipeline for the year. At the start of the year the focus will be on the US and the development of the new administration's policies. The key question is whether these will incentivise access to the US capital markets or will cross border activity into the US be hindered?”
Clifford TompsettPartner, Head of the Global IPO Centre at PwC
Source: Dealogic
Figure 31: Cross-border activity in 2016 between the top 10 (by number) issuing countries and selected exchanges
14%
30%
29%
3%
Figure 32: Regions attracting cross-border IPOs as a percentage of
total volume of cross-border IPOs (2007-2016)
2007 –
2016
12%
12%
UK Other EMEA US Other Americas
HK & Singapore Other Asia Pacific
Issu
er
na
tio
na
lity
Issu
er
na
tio
na
lity
Exchange nationality
Exchange nationality
By value (€m) New York London Other
European
Australia Singapore Hong Kong Other
exchanges
Total by issuer
nationality 2016
Total by issuer
nationality 2015
China 1,822 - 3 27 355 - 319 2,526 600
Bermuda 1,206 - - - - - - 1,206 321
Singapore - - 1 - - 1,060 - 1,061 34
Germany 270 - - - - - - 270 171
Japan - - - - - 154 - 154 42
Netherlands 49 - 100 - - - - 149 -
Switzerland 110 - 34 - - - - 144 -
Belgium 140 - - - - - - 140 -
Malta - - 90 - - - - 90 -
Greece 58 - - - - - - 58 -
Other issuer
nationalities65 47 102 114 5 35 57 425 5,980
Total by exchange
20163,720 47 329 141 360 1,249 376 6,223 n/a
Total by exchange
201528,930 2,401 3,843 307 624 224 374 n/a 7,148
By volume
of IPOs
New York London Other
European
Australia Singapore Hong
Kong
Other
exchanges
Total by issuer
nationality 2016
Total by issuer
nationality 2015
China 7 - 1 5 2 - 7 22 17
Bermuda 2 - - - - - - 2 1
Singapore - - 1 - - 6 - 7 5
Germany 1 - - - - - - 1 2
Japan - - - - - 1 - 1 1
Netherlands 1 - 1 - - - - 2 -
Switzerland 2 - 2 - - - - 4 -
Belgium 1 - - - - - - 1 -
Malta - - 1 - - - - 1 -
Greece 1 - - - - - - 1 -
Other issuer
nationalities2 9 7 7 1 4 1 31 60
Total by exchange
201617 9 13 12 3 11 8 73 n/a
Total by exchange
201558 29 16 6 5 2 8 n/a 86
21IPO Watch Europe 2016 |

Appendix
20 | IPO Watch Europe 2016
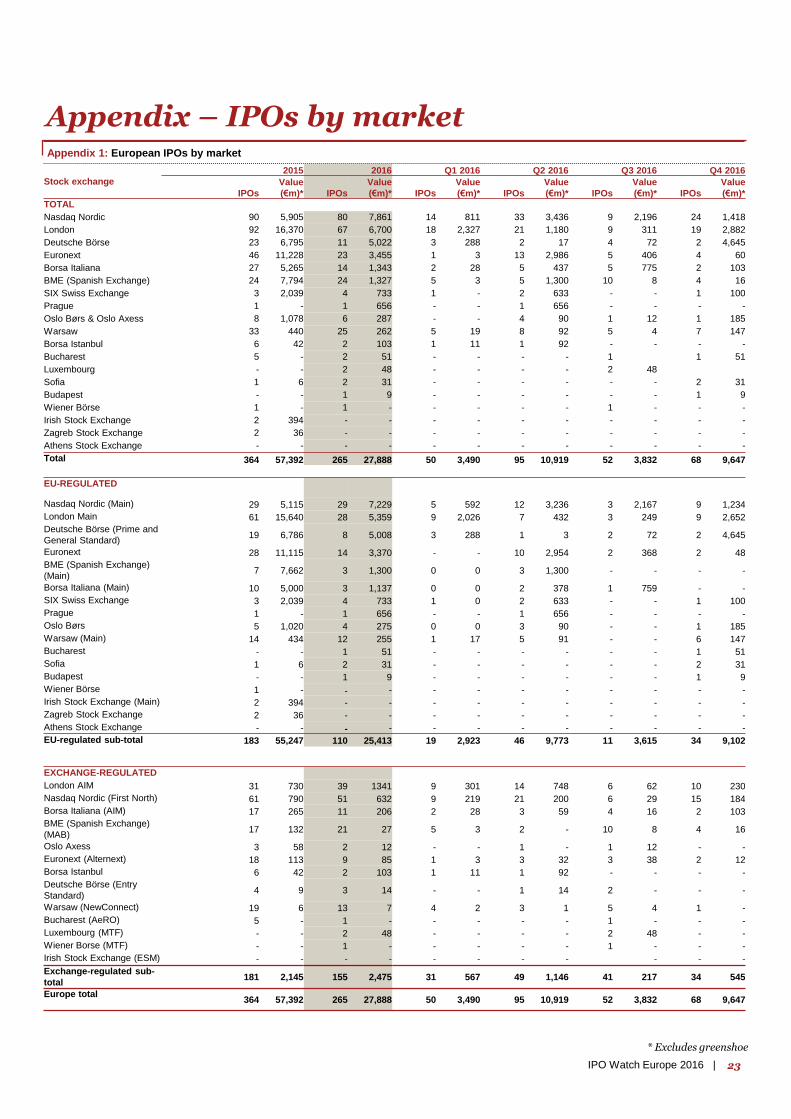
Appendix – IPOs by market
* Excludes greenshoe
Appendix 1: European IPOs by market
2015 2016 Q1 2016 Q2 2016 Q3 2016 Q4 2016
Stock exchange
IPOs
Value
(€m)* IPOs
Value
(€m)* IPOs
Value
(€m)* IPOs
Value
(€m)* IPOs
Value
(€m)* IPOs
Value
(€m)*
TOTAL
Nasdaq Nordic 90 5,905 80 7,861 14 811 33 3,436 9 2,196 24 1,418
London 92 16,370 67 6,700 18 2,327 21 1,180 9 311 19 2,882
Deutsche Börse 23 6,795 11 5,022 3 288 2 17 4 72 2 4,645
Euronext 46 11,228 23 3,455 1 3 13 2,986 5 406 4 60
Borsa Italiana 27 5,265 14 1,343 2 28 5 437 5 775 2 103
BME (Spanish Exchange) 24 7,794 24 1,327 5 3 5 1,300 10 8 4 16
SIX Swiss Exchange 3 2,039 4 733 1 - 2 633 - - 1 100
Prague 1 - 1 656 - - 1 656 - - - -
Oslo Børs & Oslo Axess 8 1,078 6 287 - - 4 90 1 12 1 185
Warsaw 33 440 25 262 5 19 8 92 5 4 7 147
Borsa Istanbul 6 42 2 103 1 11 1 92 - - - -
Bucharest 5 - 2 51 - - - - 1 1 51
Luxembourg - - 2 48 - - - - 2 48
Sofia 1 6 2 31 - - - - - - 2 31
Budapest - - 1 9 - - - - - - 1 9
Wiener Börse 1 - 1 - - - - - 1 - - -
Irish Stock Exchange 2 394 - - - - - - - - - -
Zagreb Stock Exchange 2 36 - - - - - - - - - -
Athens Stock Exchange - - - - - - - - - - - -
Total 364 57,392 265 27,888 50 3,490 95 10,919 52 3,832 68 9,647
EU-REGULATED
Nasdaq Nordic (Main) 29 5,115 29 7,229 5 592 12 3,236 3 2,167 9 1,234
London Main 61 15,640 28 5,359 9 2,026 7 432 3 249 9 2,652
Deutsche Börse (Prime and
General Standard) 19 6,786 8 5,008 3 288 1 3 2 72 2 4,645
Euronext 28 11,115 14 3,370 - - 10 2,954 2 368 2 48
BME (Spanish Exchange)
(Main) 7 7,662 3 1,300 0 0 3 1,300 - - - -
Borsa Italiana (Main) 10 5,000 3 1,137 0 0 2 378 1 759 - -
SIX Swiss Exchange 3 2,039 4 733 1 0 2 633 - - 1 100
Prague 1 - 1 656 - - 1 656 - - - -
Oslo Børs 5 1,020 4 275 0 0 3 90 - - 1 185
Warsaw (Main) 14 434 12 255 1 17 5 91 - - 6 147
Bucharest - - 1 51 - - - - - - 1 51
Sofia 1 6 2 31 - - - - - - 2 31
Budapest - - 1 9 - - - - - - 1 9
Wiener Börse 1 - - - - - - - - - - -
Irish Stock Exchange (Main) 2 394 - - - - - - - - - -
Zagreb Stock Exchange 2 36 - - - - - - - - - -
Athens Stock Exchange - - - - - - - - - - - -
EU-regulated sub-total 183 55,247 110 25,413 19 2,923 46 9,773 11 3,615 34 9,102
EXCHANGE-REGULATED
London AIM 31 730 39 1341 9 301 14 748 6 62 10 230
Nasdaq Nordic (First North) 61 790 51 632 9 219 21 200 6 29 15 184
Borsa Italiana (AIM) 17 265 11 206 2 28 3 59 4 16 2 103
BME (Spanish Exchange)
(MAB) 17 132 21 27 5 3 2 - 10 8 4 16
Oslo Axess 3 58 2 12 - - 1 - 1 12 - -
Euronext (Alternext) 18 113 9 85 1 3 3 32 3 38 2 12
Borsa Istanbul 6 42 2 103 1 11 1 92 - - - -
Deutsche Börse (Entry
Standard) 4 9 3 14 - - 1 14 2 - - -
Warsaw (NewConnect) 19 6 13 7 4 2 3 1 5 4 1 -
Bucharest (AeRO) 5 - 1 - - - - - 1 - - -
Luxembourg (MTF) - - 2 48 - - - - 2 48 - -
Wiener Borse (MTF) - - 1 - - - - - 1 - - -
Irish Stock Exchange (ESM) - - - - - - - - - - -
Exchange-regulated sub-
total 181 2,145 155 2,475 31 567 49 1,146 41 217 34 545
Europe total 364 57,392 265 27,888 50 3,490 95 10,919 52 3,832 68 9,647
23IPO Watch Europe 2016 |
This publication has been prepared for general guidance on matters of interest only, and does not constitute professional
advice. You should not act upon the information contained in this publication without obtaining specific professional advice.
No representation or warranty (express or implied) is given as to the accuracy or completeness of the information contained in
this publication, and, to the extent permitted by law, PricewaterhouseCoopers LLP, its members, employees and agents do
not accept or assume any liability, responsibility or duty of care for any consequences of you or anyone else acting, or
refraining to act, in reliance on the information contained in this publication or for any decision based on it.
© 2017 PricewaterhouseCoopers LLP. All rights reserved. In this document, “PwC” refers to PricewaterhouseCoopers LLP
which is a member firm of PricewaterhouseCoopers International Limited, each member firm of which is a separate legal
entity.
Contacts
IPO Watch Europe surveys all new primary market equity IPOs on Europe’s principal stock markets and market segments (including exchanges in Austria, Belgium, Croatia, Denmark, France, Germany, Greece, the Netherlands, Ireland, Italy, Luxembourg, Norway, Poland, Portugal, Romania, Spain, Sweden, Switzerland, Turkey and the UK) on a quarterly basis. Movements between markets on the same exchange are excluded.
This survey was conducted between 1 January and 31 December 2016 and captures IPOs based on their first trading date. All market data is sourced from the stock markets themselves and has not been independently verified by PricewaterhouseCoopers LLP.
About IPO Watch Europe
Katherine Howbrook (Press office)+44 (0) 20 7212 [email protected]
Mark Hughes+44 (0) 20 7804 [email protected]
Clifford Tompsett+44 (0) 20 7804 [email protected]
Peter Whelan+44 (0) 20 7804 [email protected]
Lucy Tarleton+44 (0) 20 7212 [email protected]