Embed Size (px)
Citation preview

Lecture Notes in LogisticsSeries Editors: Uwe Clausen · Michael ten Hompel · Robert de Souza
Dynamicsin Logistics
Hans-Jörg KreowskiBernd Scholz-ReiterKlaus-Dieter Thoben Editors
Third International Conference,LDIC 2012 Bremen, Germany,February/March 2012 Proceedings

Lecture Notes in Logistics
Series Editors
Uwe Clausen, Dortmund, GermanyMichael ten Hompel, Dortmund, GermanyRobert de Souza, Singapore, Singapore
For further volumes:http://www.springer.com/series/11220

Hans-Jörg Kreowski • Bernd Scholz-ReiterKlaus-Dieter ThobenEditors
Dynamics in Logistics
Third International Conference,LDIC 2012 Bremen, Germany,February/March 2012 Proceedings
123
EditorsProf. Dr.-Ing. Hans-Jörg KreowskiDepartment of Computer ScienceUniversity of BremenBremenGermany
Prof. Dr.-Ing. Bernd Scholz-ReiterRector of the University of BremenBremenGermany
Prof. Dr.-Ing. Klaus-Dieter ThobenBremer Institut für Produktion
und Logistik (BIBA)University of BremenBremenGermany
ISSN 2194-8917 ISSN 2194-8925 (electronic)ISBN 978-3-642-35965-1 ISBN 978-3-642-35966-8 (eBook)DOI 10.1007/978-3-642-35966-8Springer Heidelberg New York Dordrecht London
Library of Congress Control Number: 2013934015
� Springer-Verlag Berlin Heidelberg 2013This work is subject to copyright. All rights are reserved by the Publisher, whether the whole or part ofthe material is concerned, specifically the rights of translation, reprinting, reuse of illustrations,recitation, broadcasting, reproduction on microfilms or in any other physical way, and transmission orinformation storage and retrieval, electronic adaptation, computer software, or by similar or dissimilarmethodology now known or hereafter developed. Exempted from this legal reservation are briefexcerpts in connection with reviews or scholarly analysis or material supplied specifically for thepurpose of being entered and executed on a computer system, for exclusive use by the purchaser ofthe work. Duplication of this publication or parts thereof is permitted only under the provisions of theCopyright Law of the Publisher’s location, in its current version, and permission for use must always beobtained from Springer. Permissions for use may be obtained through RightsLink at the CopyrightClearance Center. Violations are liable to prosecution under the respective Copyright Law.The use of general descriptive names, registered names, trademarks, service marks, etc. in thispublication does not imply, even in the absence of a specific statement, that such names are exemptfrom the relevant protective laws and regulations and therefore free for general use.While the advice and information in this book are believed to be true and accurate at the date ofpublication, neither the authors nor the editors nor the publisher can accept any legal responsibility forany errors or omissions that may be made. The publisher makes no warranty, express or implied, withrespect to the material contained herein.
Printed on acid-free paper
Springer is part of Springer Science?Business Media (www.springer.com)
Preface
LDIC 2012 was the 3rd International Conference on Dynamics in Logistics held inBremen (Germany) from 27th February to 1st March 2012 together with a DoctoralWorkshop. The LDIC 2012 was held in conjunction with the new conference ‘‘TheImpact of Virtual, Remote and Real Logistics Labs’’ (ImViReLL’12). Similar to itspredecessors LDIC 2007 and LDIC 2009, it was organized by the Bremen ResearchCluster for Dynamics in Logistics (LogDynamics) of the University of Bremen incooperation with the Bremer Institut für Produktion und Logistik (BIBA), which isa scientific research institute affiliated to the university.
The scope of the conference targets the identification, analysis, and descriptionof the dynamics of logistic processes and networks. The spectrum of topics rangesfrom modeling and planning of processes and innovative methods like autonomouscontrol and knowledge management to the new technologies provided by radiofrequency identification, mobile communication, and networking. The growingdynamics in the area of logistics poses completely new challenges: logistic pro-cesses and networks have to rapidly and flexibly adapt to continuously changingconditions. LDIC 2012 provided a venue for researchers from academia andindustry interested in the technical advances in dynamics in logistics. The con-ference addressed research in logistics from a wide range of fields, e.g., engi-neering, computer science, and operations research.
The LDIC 2012 proceedings consist of two invited keynotes and 49 papersselected by a strong reviewing process. The volume is organized into the followingten subject areas: ‘‘Invited Papers’’, containing the contributions of the invitedspeakers, ‘‘Transport Logistics and Dynamic Routing’’, ‘‘Production Logistics andJob Shop Scheduling’’, ‘‘Modeling, Simulation, Optimization and Collaboration’’,‘‘Identification Technologies’’, ‘‘Mathematical Modeling in Transport andProduction Logistics’’, ‘‘Information, Communication, Risk and Failure’’,‘‘Autonomous Control’’, ‘‘Global Supply Chains and Industrial Application’’ and‘‘Considerations for a Future Internet of Things’’.
We would like to thank the members of the program and organization com-mittee and the secondary reviewers Jan Ole Berndt, Melanie Bloos, MarcusErmler, Vaggelis Giannikas, Michael Görges, Marc-André Isenberg, Farian
v

Krohne, Sabine Kuske, Walter Lang, Melanie Luderer, Michael Lütjen, JeanetteMansfeld, Afshin Mehrsai, Susanne Schukraft, Michael Teucke, Hendrik Thamer,Dirk Werthmann, and Jiani Wu for their help in the selection process. We arealso grateful to Aleksandra Himstedt, Jakub Piotrowski, Ingrid Rügge, DieterUckelmann, and several other colleagues for their support in the local organizationand for the technical assistance in running the conference system. Special thanksgo to Ingrid Rügge and Marcus Seifert for organizing the doctoral workshop ofLDIC 2012. We are particularly indebted to Caroline von Totth for her support inediting this volume and in careful unification of the print files of all the contri-butions. Moreover, we would like to acknowledge the financial support by theBIBA, the Research Cluster for Dynamics in Logistics (LogDynamics), the Centerfor Computing and Communication Technologies (TZI), and the University ofBremen. Finally, we appreciate once again the excellent cooperation with theSpringer-Verlag.
Bremen, November 2012 Hans-Jörg KreowskiBernd Scholz-Reiter
Klaus-Dieter Thoben
vi Preface

Committees
Program
Dieter Armbruster, Tempe (Arizona, USA)Abdelaziz Bouras, Lyon (France)Neil A. Duffie, Madison (Wisconsin, USA)Enzo M. Frazzon, Florianópolis (Brazil)Axel Hahn, Oldenburg (Germany)Mark Harrison, Cambridge (UK)Bonghee Hong, Pusan (Republic of Korea)Alamgir Hossain, Newcastle upon Tyne (UK)Kap Hwan Kim, Pusan (Republic of Korea)Antonio G. N. Novaes, Florianópolis (Brazil)Mykhailo Postan, Odessa (Ukraine)Christian Prins, Troyes (France)Antonio Rizzi, Parma (Italy)
Organization
Carmelita GörgHans-Dietrich HaasisAleksandra HimstedtMichael HülsmannHerbert KopferHans-Jörg Kreowski (co-chair)Michael LawoRainer MalakaJakub PiotrowskiRobert PorzelIngrid Rügge
vii

Bernd Scholz-Reiter (co-chair)Jörn SchönbergerMarcus SeifertKlaus-Dieter Thoben (co-chair)Caroline von TotthDieter UckelmannKatja Windt
viii Committees
Contents
Part I Invited Papers
The Future of Manufacturing Utilizing Tagging Technology . . . . . . . . 3Gisele Bennett
Fault Detection in Dynamic Vehicle Routing Operations. . . . . . . . . . . 13Antonio G. N. Novaes, Edson T. Bez and Paulo J. Burin
Part II Transport Logistics and Dynamic Routing
Knowledge Sharing in Intermodal Transport: A Multi-AgentBased Perspective . . . . . . . . . . . . . . . . . . . . . . . . . . . . . . . . . . . . . . . 35Jiani Wu and Hans-Dietrich Haasis
Emissions Minimization Vehicle Routing Problem in Dependenceof Different Vehicle Classes . . . . . . . . . . . . . . . . . . . . . . . . . . . . . . . . 49Heiko W. Kopfer and Herbert Kopfer
Product Intelligence in Intermodal Transportation: The DynamicRouting Problem . . . . . . . . . . . . . . . . . . . . . . . . . . . . . . . . . . . . . . . . 59Vaggelis Giannikas and Duncan McFarlane
Cargo Telematics for Operational Transport Excellenceand Strategic Knowledge Management. . . . . . . . . . . . . . . . . . . . . . . . 71Matthias Klumpp, Christof Kandel and Erik Wirsing
ix
Part III Production Logistics and Job Shop Scheduling
Towards an Integrated Production and Outbound DistributionPlanning Method . . . . . . . . . . . . . . . . . . . . . . . . . . . . . . . . . . . . . . . . 85Bernd Scholz-Reiter and Christian Meinecke
Supply Chain Integration by Human-Centred Alignmentof Lean Production Systems. . . . . . . . . . . . . . . . . . . . . . . . . . . . . . . . 93Yilmaz Uygun and Natalia Straub
The Multiple Batch Processing Machine Problem with StageSpecific Incompatible Job Families. . . . . . . . . . . . . . . . . . . . . . . . . . . 113Marc-Andrè Isenberg and Bernd Scholz-Reiter
Scheduling Multiple Batch Processing Machines with StageSpecific Incompatible Job Families. . . . . . . . . . . . . . . . . . . . . . . . . . . 125Marc-Andrè Isenberg and Bernd Scholz-Reiter
A Comparison of Network Characteristics in Metabolicand Manufacturing Systems. . . . . . . . . . . . . . . . . . . . . . . . . . . . . . . . 141Till Becker, Mirja Meyer, Moritz E. Beber, Katja Windtand Marc-Thorsten Hütt
Part IV Modeling, Simulation, Optimization and Collaboration
Conflicting Optimization Goals in Manufacturing Networks:A Statistical Analysis Based on an Idealized Discrete-Event Model . . . 153Reik V. Donner and Jörg Hanke
Modeling the Basic Cause-Effect Relationship Between SupplyChain Events and Performance . . . . . . . . . . . . . . . . . . . . . . . . . . . . . 163Georg Heinecke, Jonathan Köber, Andreas Kunz and Steffen Lamparter
The Importance of Managing Events in a Build-to-OrderSupply Chain: A Case Study at a Manufacturerof Agricultural Machinery . . . . . . . . . . . . . . . . . . . . . . . . . . . . . . . . . 175Jonathan Köber and Georg Heinecke
A Dynamic Approach to Measure the Effect of PostponementStrategy on the Performance of Manufacturingand Logistics Processes . . . . . . . . . . . . . . . . . . . . . . . . . . . . . . . . . . . 187Luiz Eduardo Simão and Mirian Buss Gonçalves
x Contents
Event Management for Uncertainties in Collaborative ProductionScheduling and Transportation Planning: A Review . . . . . . . . . . . . . . 199Bernd Scholz-Reiter, Yi Tan, Nagham El-Berishyand José B. S. Santos Jr.
Study on the Application of DCOR and SCOR Modelsfor the Sourcing Process in the Mineral Raw Material IndustrySupply Chain . . . . . . . . . . . . . . . . . . . . . . . . . . . . . . . . . . . . . . . . . . 211Raul Zuñiga, Marcus Seifert and Klaus-Dieter Thoben
Part V Identification Technologies
Service Oriented Platform for RFID-Enabled Real-TimeFleet Advanced Planning and Scheduling in Industrial Parks . . . . . . . 223L. Y. Pang, George Q. Huang and R. Y. Zhong
Towards Agile and Flexible Air Cargo Processes with LocalizationBased on RFID and Complex Event Processing . . . . . . . . . . . . . . . . . 235David Rüdiger, Moritz Roidl and Michael ten Hompel
Smart Agri-Food Logistics: Requirements for the Future Internet . . . 247C. N. Verdouw, H. Sundmaeker, F. Meyer, J. Wolfert and J. Verhoosel
Design and Implementation of a Virtual Reader for GeneratingMultiple Tag Data . . . . . . . . . . . . . . . . . . . . . . . . . . . . . . . . . . . . . . . 259Jiwan Lee, Wooseok Ryu, Joonho Kwon and Bonghee Hong
Dynamic Tag Identity-Based Encryption Schemefor Logistic Systems . . . . . . . . . . . . . . . . . . . . . . . . . . . . . . . . . . . . . 267Jongseok Choi and Howon Kim
Queuing Buffer Method for Enhancing Reliabilityof Capturing Application . . . . . . . . . . . . . . . . . . . . . . . . . . . . . . . . . . 277Taewoo Nam, Inhwan Lee, Byeongsam Kim and Keunhyuk Yeom
Part VI Mathematical Modeling in Transportand Production Logistics
Dynamic Optimization Model for Planning of IntegratedLogistical System Functioning . . . . . . . . . . . . . . . . . . . . . . . . . . . . . . 291Iryna V. Morozova, Mykhaylo Ya. Postan and Sergey Dashkovskiy
Contents xi
A Graph Model for the Integrated Scheduling of IntermodalTransport Operations in Global Supply Chains . . . . . . . . . . . . . . . . . 301Willian Chaves Mates, Enzo Morosini Frazzon, Jens Hartmannand Sérgio Fernando Mayerle
Exploitation of Due Date Reliability Potentials: MathematicalInvestigation of the Lead Time Syndrome . . . . . . . . . . . . . . . . . . . . . 313Mathias Knollmann and Katja Windt
A Multi-Level Programming Model and Solution Algorithmfor the Location of Distribution Centers with Uncertainty Demand . . . 327Patareeya Lasunon and Raknoi Akararungruangkul
A Method to Estimate the Accumulated Delivery Time Uncertaintyin Supply Networks . . . . . . . . . . . . . . . . . . . . . . . . . . . . . . . . . . . . . . 337Mehdi Safaei, Safir Issa, Marcus Seifert, Klaus-Dieter Thobenand Walter Lang
An LMI Approach to Exponential Stock Level Estimationfor Large-Scale Logistics Networks . . . . . . . . . . . . . . . . . . . . . . . . . . 349Hamid Reza Karimi
Part VII Information, Communication, Risk, and Failure
Characterization of Thermal Flow Sensors for Air FlowMeasurements in Transport Containers . . . . . . . . . . . . . . . . . . . . . . . 361Safir Issa and Walter Lang
Design and Implementation of Location-Based Handoff Schemefor Multimedia Data . . . . . . . . . . . . . . . . . . . . . . . . . . . . . . . . . . . . . 371Dong Hyun Kim and Jong Deok Kim
Reconfiguring Multi-Rate Wi-Fi Mesh Networks with FlowDisruption Constraints . . . . . . . . . . . . . . . . . . . . . . . . . . . . . . . . . . . 383Yafeng Zhou, Sang-Hwa Chung and Han-You Jeong
Maintenance Work Order Based on Event-Driven Informationof Condition-Monitoring Systems—A Genetic Algorithmfor Scheduling and Rescheduling of Dynamic Maintenance Orders . . . 395Marco Lewandowski, Oliver Siebenand, Stephan Oelkerand Bernd Scholz-Reiter
xii Contents
A Procedure for the Selection of a Supply Network Risk MitigationStrategy in Relational Arrangements . . . . . . . . . . . . . . . . . . . . . . . . . 405José B. S. Santos Júnior, Sérgio A. Loureiro and Orlando F. Lima Júnior
Optimization of Failure Behavior of a Decentralized High-Density2D Storage System . . . . . . . . . . . . . . . . . . . . . . . . . . . . . . . . . . . . . . 415Kai Furmans, Kevin R. Gue and Zäzilia Seibold
Part VIII Autonomous Control
Distributed Reinforcement Learning for Optimizing ResourceAllocation in Autonomous Logistics Processes . . . . . . . . . . . . . . . . . . 429Jan Ole Berndt and Otthein Herzog
Improving Returnable Transport Equipment Managementwith an Autonomous Approach . . . . . . . . . . . . . . . . . . . . . . . . . . . . . 441Rebecca Aggarwal and Ming K. Lim
Stability Analysis Scheme for Autonomously Controlled ProductionNetworks with Transportations . . . . . . . . . . . . . . . . . . . . . . . . . . . . . 453Sergey Dashkovskiy, Michael Görges and Lars Naujok
Towards the Learning Behaviour and Performanceof Artificial Neural Networks in Production Control. . . . . . . . . . . . . . 465Bernd Scholz-Reiter and Florian Harjes
Part IX Global Supply Chains and Industrial Application
A Framework of the Forces Influencing the Adaptationof the SCOR Model to the Situation of the ManufacturingIndustry in Developing Countries. . . . . . . . . . . . . . . . . . . . . . . . . . . . 477Fasika B. Georgise, Klaus-Dieter Thoben and Marcus Seifert
The Impact of Near Sourcing on Global Dynamic Supply Chains:A Case Study . . . . . . . . . . . . . . . . . . . . . . . . . . . . . . . . . . . . . . . . . . 489Anna Corinna Cagliano, Alberto De Marco and Carlo Rafele
Simulation-Based Analysis of Integrated Productionand Transport Logistics. . . . . . . . . . . . . . . . . . . . . . . . . . . . . . . . . . . 499Enzo Morosini Frazzon, Joarez Pintarelli, Thomas Makuschewitzand Bernd Scholz-Reiter
Contents xiii
Logistics Integrated Product Development in the GermanAutomotive Industry: Current State, Trends and Challenges . . . . . . . 509Ingrid Göpfert and Matthias Schulz
Efficient and Safe Transporting of Steel Sheetswith Permanent Magnets . . . . . . . . . . . . . . . . . . . . . . . . . . . . . . . . . . 521Johannes Schröck and Bernd Orlik
Part X Considerations for a Future Internet of Things
The Effective Method for Distributed Information Gainin EPC Network . . . . . . . . . . . . . . . . . . . . . . . . . . . . . . . . . . . . . . . . 531Taewoo Nam, Byeongsam Kim and Keunhyuk Yeom
Man–Machine-Interaction in the Field of Logistics:Example ‘‘Internet of Things’’ . . . . . . . . . . . . . . . . . . . . . . . . . . . . . . 545Lars Windelband and Georg Spöttl
Sensor Reader Emulator for Integrating Sensor Networksinto EPCglobal Network . . . . . . . . . . . . . . . . . . . . . . . . . . . . . . . . . . 557Joo-Ho Lee, Oh-Heum Kwon and Ha-Joo Song
A Design of Distributed Discovery Service of EPCglobal. . . . . . . . . . . 571Gihong Kim, Bonghee Hong and Joonho Kwon
xiv Contents

Part IInvited Papers
The Future of Manufacturing UtilizingTagging Technology
Gisele Bennett
Abstract Lean, agile, just-in-time, future, green, energy efficient and robust arejust some of the terms used to describe the next generation manufacturing. Thefocus for manufacturing is dependent on the year, the challenges, the featuretechnologies, the consumer demands, and business pressures. This paper discussesthe potential of the future of manufacturing, which utilizes technologies that allowfor real time visibility of location and condition of assets for use in decisionmaking to anticipate the manufacturing process and meet demands.
Introduction
Manufacturing process flow dates back to 1574 when King Henry III of Francewatches the Venice Aresnal build complete galley ships in less than an hour usingcontinuous flow processes (Lean Manufacturing History Timeline 2012). Manu-facturing research process, supply chain logistics, energy savings, policy, regula-tions, and consumer demands are inputs to a decision and control algorithm that canbe utilized to achieve desired outcomes in manufacturing. Even as early as 1760French General Jean-Baptiste de Gribeauval understood the significance of stan-dardized designs and interchangeable parts to facilitate repairs in the battlefield. Atthe beginning of the 20th century, automation and processes are introduced tomanufacturing by Ford and Toyota leading to the introduction of just-in-time in1938. All of the early implementations required manual oversight until robotics andautomation can be introduced. The information in this chapter is intended to aid the
G. Bennett (&)Georgia Tech Research Institute, Georgia Tech, Atlanta, GA 30332, USAe-mail: [email protected]
H.-J. Kreowski et al. (eds.), Dynamics in Logistics, Lecture Notes in Logistics,DOI: 10.1007/978-3-642-35966-8_1, � Springer-Verlag Berlin Heidelberg 2013
3
system engineer in how to achieve success in implementing Radio FrequencyIdentification (RFID) in a factory. By utilizing technology to generate data that canbe transformed into information to create a revolutionary approach to manufacturingwhile making evolutionary changes through knowledge of location and condition ofassets as inputs to optimization algorithms.
Manufacturing can be revolutionized with real time data that can be convertedto information and decisions that can be implemented just in time to produce thedesired outcomes. Just-in-Time (JIT) conjures up definitions in manufacturing forplanned elimination of all waste and continuous improvement of productivity.Although just-in-time is commonly used in manufacturing, we use the term as partof a strategy to utilize real time data in the decision and manufacturing processes.The desired outcomes could be to improve manufacturing throughput, reduce cost,or energy consumption. The optimal outcome could be to optimize all desiredoutputs resulting in a multivariate optimization problem that must considerinternal and external inputs. These inputs could be labor availability, health ofequipment [Mean-Time-Between-Failure (MTBF)], while outside factors such asweather, traffic problems or seasonal absence due to vacation could influenceworkforce availability. To achieve optimization, it is important to understand thecondition and location of all assets and the desired metric or goal to achieve at themanufacturing plant. Wireless manufacturing is beginning to proliferate the con-cept of the next generation factory (Huang et al. 2008).
To have full visibility, the manufacturer will need to have control over the dataformats and supply elements. Most manufacturers, because of globalization andoutsourcing, are becoming integrators. The challenge for competitiveness trans-forms into a management of the global network for all aspects of manufacturingfrom design to production and the ability to have a predictable and inexpensivelogistics network. As a consequence, intelligent prediction algorithms will need tofactor other elements such as human behavior, environmental, and businessobjectives into the optimization of the factory. The factory truly becomes a living,dynamic machine of production.
The objective of this paper is to present an overview of the challenges,opportunities, and references to research and experiments, with a focus on the useof RFID, to establish areas that need to be addressed before achieving full assetvisibility. This paper will review Radio Frequency Identification (RFID) tech-nologies for some of the asset visibility needed in manufacturing and the supplychain that supports a manufacturing environment. The use of the term assets in thispaper is intended to include equipment, supplies, and people.
RFID Challenge in a Manufacturing Environment
RFID is an enabling technology that can cost-effectively identify, monitor, track,and locate assets. Assets are defined as materials, components, processes, andpeople. RFID systems were categorized into 5 classes during the flurry of RFID in
4 G. Bennett
the consumer and US Department of Defense markets in the early 21st century. Thefive categories begin with a basic passive tag and progress to a tag that hadembedded sensors and can initiate communication. Rather than get caught up in theclasses of tags and various International Organization for Standardization (ISO)standards, for the purpose of this paper restrict the reference of RFID to passive oractive and to the implementation and physics of RFID systems in a manufacturingenvironment. Bennett and Herkert (2008) provide a detailed overview of the activeRFID systems and deployment considerations. Although some of the standards havebeen modified, an overview of the basic physics and frequency allocations and ISOstandards is provided by Bennett (2007). RFID systems are made up of a tag, airinterface (tag to reader), the reader, and network to connect readers to informationsystems. The basic system operation is to have a reader send energy to a tag for powerthen the tag send Identification (ID) data back to the reader. One of the primarydifferences between a passive and active system is an active RFID system has tagswith batteries that aid in increasing the read ranges between the reader and tag.
RFID historically has been used by Supply Chain Logistics (SCL) applicationsand not until the past decade have papers on the use of RFID in manufacturingstarted to increase in the literature. RFID has numerous challenges in a manu-facturing environment because of the harsh RF conditions. The challenges, whichare primarily with the basics of electromagnetics include: absorption, shielding,multi-path, diffraction, and antenna detuning to name a few. A factory hasimpediments to RFID systems that include racks, shelves, pallets, machinery,metal, walls, RF noise, and other assets that degrade RF communications (Remleyet al. 2008; Hellstrom and Wiberg 2009; Griffin et al. 2006). However, through acombination of technologies, the right site survey and choice of RFID technology,real time asset visibility and use of RFID in a manufacturing environment ispossible.
A factory or warehouse is a dynamic environment where there are constantlymoving parts, moving machinery, moving tags, etc. Although it may be feasible toimplement an RFID system in a static industrial environment, the dynamic aspectimposes a new set of challenges, even if the dynamic parts of the environment arecompletely unrelated to the system or the tags being tracked. Issues that areaffected by the environment are outlined in this section as a guide for areas toconsider before utilizing an RFID system in this type of environment. Some keyareas to identify when choosing an RFID system to use in a manufacturingenvironment are:
1. Tag Orientation: Because the orientation of the tag with a reader is important,we need to understand how the changing orientation of the tag and the taggedpart affect read rates and visibility. As the orientation of the tagged part ischanged, the orientation of the tag will certainly be changed. This change willaffect the signal strength received and therefore transmitted back to the reader.It is important to understand how this changes the performance of the specificsystem chosen and how can the change be mitigated. Furthermore, a change inorientation of the part might result in the part lying between the reader and the
The Future of Manufacturing Utilizing Tagging Technology 5
tag. By understanding the particular manufacturing process, we would want tochange the locations of the readers or the positions of the tags be chosen tominimize any consequences. Mercer et al. (2011) provide recent experimentsshowing the importance of tag orientation.
2. Moving Obstacles: All factories have some sort of automation, robotics, andmachinery creating lots of moving, metal, unmanned pieces of equipment.Assuming that the RFID tags are chosen appropriately such that movement ofthe part does not greatly affect the tags’ orientation relative to the reader, wewould want to design the RFID deployment to mitigate read capability due toother equipment obscuring the field of view of the reader. Some experimentshave been conducted on static obstructions that show the results depend on theentire area of interest, other objects and materials in the field of view, and thetype of tags used (James et al. 2010).
3. Tag Distance Resolution: The ability to distinguish what order items arepassing through an assembly line is referred to as sequencing and is veryimportant if we are to have a smart and adaptable manufacturing plant thatallows for custom orders. To accurately utilize sequencing, we need to be ableto read one tag at a time for parts that are closely clustered. Considering thatmost of current manufacturing takes place on an assembly line, it is safe toassume that tags will constantly be brought into and out of range of the readers.Most readers are designed for a wide field of view leading to multiple tag readsand some tags that are missed in the scan. However, if we are trying to achievesequencing, which requires higher resolution in distinguishing between tag 1and tag 2, we will require a reader that has a narrower field of view. Repro-gramming readers for a narrow field of view is possible giving the opportunityto actually have a sequencing feature in the asset information. Sequencing isimportant if we are to achieve a robust and agile manufacturing process.
4. Tag Read Rates: Current manufacturing processes can have very fastthroughputs. All tags and readers are not created equal and before deploymentin a high throughput section of the manufacturing processes, it will beimportant to determine how fast the tags can move while still allowing a highread probability. Strategic placement of readers can improve the read rates.Assuming normal operation of the manufacturing facility, it is important not toimplement technology that slows the manufacturing throughput. Recent testshave been conducted to evaluate read rates as a function of objects and tagplacement (Mercer et al. 2011). The results showed good read rates for semi-passive RFID tags that are battery assisted. However, when testing passive tagsnone achieved 100 % read rate even with increased reader exposure times (thetime the reader sees the tags—180s for this experiment).
Implementation is a function of the environment, system performance, anddesired outcomes. We have seen that RFID system performance changesdepending on the manufacturer and advancements in technology. A manufacturerof a passive RFID system one year could yield a less than desirable performanceand with advances in the next generation technology the same vendor could
6 G. Bennett
produce a new system with significant performance improvements. The key pointis that testing never stops and should be conducted on a regular basis to determineperformance. The papers referencing test results in this chapter will be obsolete ina couple of years and the experiments will need to be repeated. Especially in amanufacturing environment, site surveys and developing requirements for theapplication are critical to proper execution (Gaukler and Seifert 2007).
The Manufacturing Broker and Integrator
As manufacturing migrates to a supply management and a complex networkintegration with its suppliers and subassemblies, a network to manage the entireprocess becomes even more vital. Asset visibility, through RFID and other tech-nological means, through the global supply chain will facilitate better coordinationthrough accurate knowledge of the system state. A system as complex as amanufacturing environment can achieve inventory management using tagged andtracked data from parts for visibility. The key to success is to have agility andspeed with the ability to recognize and rapidly adapt to the particular and changingdemands that arise with consumer demand. Dynamic scheduling can be achievedthrough real-time information using intelligent tracking technologies. Although wevaguely define the manufacturing system, it is obvious that the future of mostmanufacturing is assembly with a complex outreach into numerous subsystemsthat must work together to produce the end product.
Sustainability
RFID tagged parts offer another level of future system support. RFID taggingsystems lend themselves not only to the manufacturing process but the productlifecycle as well. At the end of life of the product, certain parts could easily beidentified that require specific disposal methods such as those parts that containenvironmentally hazardous materials. The original equipment manufacturer(OEM) through their RFID tags can identify other parts in the product, that arereusable, and information such as service history and age could be retrieved todetermine the reusability. Parts that are too old to be safely reused could beimmediately taken to material recycling, while other reusable modules could bereentered into supply chain.
The early adoption of RFID tags usage by Michelin Tires for tread reading andtire tracking created an added value to the manufacturer and consumer. The initialuse of RFID in tires in the 2004 was to meet the US government TREAD(Transportation, Recall, Enhancement, Accountability, and Documentation) Actthat mandates car makers to track tires from model year 2004 and beyond for recallproblems. With the standards for tagging and the level of information provided by
The Future of Manufacturing Utilizing Tagging Technology 7
an EPC code, more detailed information is provided to the users for the unfortu-nate situations of recalls. Knowing when and where parts were manufactured,changes general recalls to targeted recalls saving significant costs in broadreplacement of defective parts. The use of the RFID tag by Michelin for identi-fication evolved into a value added feature that later included linkage to temper-ature and pressure that can be read through RFID readers.
Optimized Manufacturing and Smart Parts
Information about parts that are tagged and read by readers at a manufacturingstation could be used to control and change manufacturing station to performfunctions required for that part. Once complete, that information can be capturedand entered into a central control system. The parts now are smart and part of themanufacturing assembly decision-making. The concept of smart parts has beenpresented in numerous configurations from warehouse management and movementof inventory to manufacturing (Zhekun et al. 2004). Automotive manufacturershave adopted the use of RFID tags to carry customer individual orders. The tagsused are read/write capable and travel with the car during the production process.This tracking allows for integration into existing systems, reduces errors in theassembly of the unique car configuration, and can be reused at the end of theassembly. The use of RFID combined with GPS is presented by Brewer et al. todemonstrate the utility of multiple intelligent tracking technologies for use inmanufacturing (Brewer et al. 1999).
Prognostics
Up to this point, asset visibility was focused on the use of RFID and locationinformation. We have subsequently seen examples of RFID used for equipmentcontrol and post production information for value added and possibly productrecalls. Although RFID tags are not going to provide prognostics informationdirectly the use of RFID tags with integrated sensors could provide pieces of datathat contribute to the overall health monitoring of a system. Because the factory isfully outfitted with readers, the infrastructure is in place to add smarter tags for usein monitoring temperature or relative humidity in a particular area that requiresaccurate control, or emissions from machinery that could be indicators of failuremodes. Prognostics is a wide field and subject to extensive research but for thisarticle we are speculating that there are enough sensing modalities that can beadded to an RFID enabled tag to utilize the information for factory health moni-toring. Applications of prognostics range from diagnostics and predictions ofmachinery failures to using prognostics in the logistics system. Lopez De La Cruzet al. (2007) define a prognostics logistics structure as data acquisition into an
8 G. Bennett
information system that is an input into a logistics model that yields future pre-dictions. Chen et al. (2010) introduce the approach used in prognostics and healthmonitoring with RFID tags with integrated sensors such as temperature andhumidity to collect data for processing. The point of introducing prognostics in thischapter is to exploit the RFID infrastructure used for asset tracking to add anotherdata and information element to the overall manufacturing process. This infor-mation can be used for scheduling and routing of parts, e.g. rather than havescheduled maintenance for equipment use prognostics to repair on a usage basis.Having advanced knowledge of failures allows for optimal allocation of theremaining resources.
Decision Algorithms
Now that we have real time information of our assets and possibly health infor-mation on our machinery, what do we do with this information and what otherinformation and technology do we to create the agile factory. Earlier we intro-duced the use of external information for manufacturing and process flow. Onesuch information is weather—Meteorological (METAR)—data which is readilyavailable and accurate at least 24 h or greater. Seasonal events for localizedregions are also readily available. Although the future factory could have noworkforce, there is a greater chance that the workforce skills will evolve andpossibly be reduced. In either case, using this additional data into an optimizationequation for the factory as external inputs for resource availability could changethe production process. Suppose a snow storm is expected, energy consumptionwill increase and labor availability could be reduced. Can this information be usedto change the production rate? Suppose it is spring break and the majority of thelabor force follows that holiday schedule resulting in a reduction in labor. Thereare endless scenarios and theories on the use of external data in a factory settingand the decision algorithms to use. The focus was not on the algorithms for thispaper but on how to get the data for the algorithms and to ensure accuracy andconsistency in the information.
Conclusions
Real-time tracking in a manufacturing plant has challenges due to the physicsbehind the operation of RF systems in harsh, robust, and dynamic environments.Conducting the appropriate site survey, designing a system architecture, andconstant evaluation of tagging system performance increases the probability ofsuccessful deployment of RFID or any other tagging technology. The tagging andcondition information can produce benefits that include: tracking of units to gainreal-time visibility; rapid location of components and supplies, which lead to
The Future of Manufacturing Utilizing Tagging Technology 9
minimized costs of locating inventories (reduced man-hours); aid in recalls initi-ated by suppliers through accurate association of unique parts thus reducing cost ofbulk recalls; improved sequencing for parts installation resulting in a more agilemanufacturing process; adjustment in policy to use knowledge of location andvendor availability to improve timing for replenishment orders; and automaticreconfiguration for the future manufacturing plant to adjust production flow in realtime. RFID is one mode for intelligent tracking with significant benefits. Forsuccessful implementation, it is critical to evaluate the current state of the tech-nology and develop a system architecture that can provide the necessary data in atimely manner to users or systems that need turn that data into information fordecision making.
Acknowledgments The author would like to acknowledge the numerous discussions withDrs. Susan Smyth and Ninjang Huang on manufacturing and the collaborations and assistance inlaboratory measurements and background research by Allison Mercer, Ryan James, James Cai,Elani Spring, and Joseph Goldberg.
References
Bennett G (2007) RFID in the USA. In: Banks J, Pachano MA, Thompson LG, Hanny D (eds)RFID Applied, Wiley, NJ
Bennett G, Herkert R (2008) Deployment considerations for active RFID systems. In: Miles S,Sarma S, Williams J (eds) RFID technology and applications, Cambridge University Press,Cambridge
Brewer A, Sloan N, Landers T (1999) Intelligent tracking in manufacturing. J Intell Manuf10:245–250
Chen S, Tom K, Thomas L, Pecht M (2010) A wireless sensor system for prognostics and healthmanagement. IEEE Sens J 10(4):856–862
Gaukler G, Seifert R (2007) Applications of RFID in supply chains. In: Jung H, Chen FF, Jeong B(eds) Trends in supply chain design and management: technologies and methodologies,Springer, London
Griffin J et al (2006) RF tag antenna performance on various materials using radio link budgets.IEEE Antennas Wirel Propag Lett 5(1):247–250
Hellstrom D, Wiberg M (2009) Exploring an open-loop RFID implementation in the automotiveindustry. In Proceeding 14th IEEE conf. emerging technologies and factory automation,Mallorca, Spain, pp 1543–1546
Huang GQ, Zhang Y, Chen X, Newman ST (2008) RFID-enabled real-time wirelessmanufacturing for adaptive assembly planning and control. J Intell Manuf 19(6):701–713
James RK, Mercer AJ, Bennett G, McGuinness D, Smith B, Dowling J (2010) RF obstructionsand European RFID systems, Poster Session IEEE-RFID Orlando, 2011
Lean Manufacturing History and Timeline (2012) Factory strategies group, LLC. http://www.superfactory.com/content/timeline.html
Lopez De La Cruz AM, Veeke HPM, Lodewijks G (2007) Applicability of RFID in theprognostics of logistics systems, IEEE International Conference on Service Operations andLogistics, and Informatics (SOLI), Aug 2007
Mercer AJ, James RK, Bennett G, Patel P, Johnston C, Cai J (2011) Performance testing of RFIDsystems with RF-Harsh materials. In: Proceeding IEEE international conference on RFID-technologies and applications (RFID-TA), Sitges, Spain
10 G. Bennett

Remley K et al (2008) NIST tests of the wireless environment in automobile manufacturingfacilities. NIST Technical Note 1550, Oct 2008, pp 1–122
Zhekun L, Gadh R, Prabhu BS (2004) Applications of RFID technology and smart parts inmanufacturing. In: Proceeding ASME 2004 Desiging Engineering Technical Conferences andComputers and Information Engineering Conference, Salt Lake City, Utah, 2004
The Future of Manufacturing Utilizing Tagging Technology 11
Fault Detection in Dynamic VehicleRouting Operations
Antonio G. N. Novaes, Edson T. Bez and Paulo J. Burin
Introduction
The explosive growth in computer, communication, and information technology inrecent years, together with dramatic changes in organizations and markets, haveopened new forms of operating manufacturing and transport activities in anintegrated and collaborative way (Goel 2008). To optimize performance, supply-chain functions must operate in a coordinated manner. But the actual circum-stances observed in these operations make it difficult to implement it in manyinstances. Truck breakdowns, road traffic congestions, labour absences, customer’scancel or postponement of orders, among other random events, generate deviationsfrom the basic plans. Thus, the management of these integrated systems must beperformed in a dynamic way, revising the plans and schedules whenever itbecomes necessary and when system failures require corrective interventions.
An unbalanced and unstable integration of manufacturing and transport systemscan impair the competiveness of supply chains. This integration is even morerelevant along global supply chains due to longer transport lead-times and thenetwork complexity of manufacturing processes. Nowadays, production andtransport scheduling are still carried out sequentially, due in part to their
A. G. N. Novaes (&)Federal University of Santa Catarina, Rua Beija-Flor 112,Florianopolis 88062-253 SC, Brazile-mail: [email protected]
E. T. BezUnivali – Itajaí Valley University, São José, SC, Brazile-mail: [email protected]
P. J. BurinFederal University of Santa Catarina, Florianópolis, SC, Brazile-mail: [email protected]
H.-J. Kreowski et al. (eds.), Dynamics in Logistics, Lecture Notes in Logistics,DOI: 10.1007/978-3-642-35966-8_2, � Springer-Verlag Berlin Heidelberg 2013
13
complexity and current lack of appropriate heuristics for supporting a desirableintegration at the operational level. Especially within dynamic environments,production and transport systems must be properly integrated so that efficiency,responsiveness and flexibility could be achieved and sustained. Specially, thevision of a supply chain as synchronized systems of material and information flowsrequires that transport capabilities, level of utilization of resources and transit lead-times be appropriately employed in order to get the most effective and sustainableproduction scheduling (Frazzon et al. 2010).
The increasing complexity of technological processes, the availability ofadvanced sensor devices, and the existence of sophisticated information processingsystems, have opened the way to detect abrupt as well as latent changes in somecharacteristic properties of a system. Fault detection and diagnosis applied toautomatic control of technical systems have been extensively investigated in theliterature (Basseville and Nikiforov 1993; Isermann 1997, 2005; Simani et al.2010), but its concepts and methods have not been extended so far to services suchas freight transport and logistics. The objective of fault detection in integratedmanufacturing and logistics systems is to anticipate counteractions in order toavoid malfunctions and unexpected interruptions. Many fault monitoring problemscan be seen as the problem of detecting a change in the parameters of a dynamicstochastic system. Model-based fault diagnosis methods are designed to detectabnormal situations confronting real data with modelling estimates. It is assumedthat a discrepancy signal is directly or indirectly linked to a fault. Care must betaken to bypass model mismatches or noise in real measurements, which canerroneously be seen as a fault, giving rise to a false alarm in detection. Theseconsiderations have led to research efforts toward robust methods, with the aim ofminimizing such drawbacks (Simani et al. 2010).
Dynamic vehicle routing problems (DVRP) have received increasing attentionamong researchers (Psaraftis 1995; Larsen 2001; Ribeiro and Lorena 2005; Larsenet al. 2008; Golden et al. 2008; Novaes et al. 2011). These problems are usuallyrelated to efficiently assigning vehicles to tasks, such as picking-up components fromOEM facilities in a row, delivering cargo, or accomplishing other services in apreviously defined order, so that tasks are completed within a certain time limit andvehicle capacities are not exceeded (Figliozzi 2007, 2010). But in large andcongested urban areas, particularly in developing countries, transport operators tendto assign larger numbers of visits to their vehicles in order to increase revenue. Thisoften leads to non-performed orders at the end of the daily cycle-time, impairing thelogistics service level and postponing tasks to next day, or even later. This happensbecause, due to the volatile traffic conditions and the great number of random vari-ables along the route, the vehicle cycle-time usually shows great variability. But evenassuming that the fleet of vehicles has been well dimensioned, there are situations inwhich the traffic becomes exceptionally over-congested due to severe accidents,unpredictable public transport strikes, abnormal weather conditions, etc. However,when operating in a production schedule, comprising the pick-up of componentsfrom several OEM facilities in a row and carrying them to an assembler company, thevehicle has to accomplish its tasks within a pre-established JIT service level.
14 A. G. N. Novaes et al.
Traffic information systems, which have been installed in some large cities ofthe world, tend to increase the flow of vehicles by allowing higher vehicularspeeds and by offering less-congested alternative routes to drivers (Fleischmannet al. 2004). The benefits of using such traffic navigational systems in connectionwith vehicle routing in congested urban areas cannot be denied. But in developingcountries, the required large investments to install such systems often forbid itsextensive use. One of the objectives of this work is to show that simple dynamicvehicle routing procedures can dramatically improve the logistics performance ofthe servicing system. With an on-board computer, a fault-detection software, andsimple telematics devices linking the vehicle to nearby collaborative agents (othervehicles and the central depot), it is possible to attain better performance levels. Byanalysing vehicle operational data at specific regeneration points along the route, itis possible to anticipate the occurrence of unperformed tasks, emitting informationto other agents (vehicles, central depot), and transferring part of the tasks to otherparticipants. With this procedure the occurrence of unperformed tasks at the end ofa vehicle cycle-time can be dramatically reduced.
In a DVRP, not all information relevant to the planning of the routes is knownby the planner when the routing process begins, and information may change afterthe initial routes have been constructed (Larsen et al. 2008). In the applicationobject of this work, although the vehicle service is fully planned in advance, thepossible transfer of tasks to other agents and the eventual reprogramming of visitslead to changes in the routing process, thus characterizing a dynamic behaviour(Psaraftis 1995; Larsen 2001).
The Static Routing Problem
When modelling dynamic logistics problems it is necessary to quantify a numberof random parameters to be used in the main mathematical model. Larsen (2001)dedicates a full chapter of his work to the computer simulation of such data. Thereason is that real-life datasets are very often not available in such detail andaccuracy as to support a thorough investigation of dynamic problems. Then,randomly generated data and simulation are frequently used when designingdynamic logistics systems. We make use of such a technique to analyse importantparameters related to the routing vehicle cycle.
Throughout the paper an empirical case study will be examined based on a real-life Brazilian urban scenario. Let us consider an operating district of area A con-taining n OEM suppliers. The vehicle assigned to the district leaves the depot earlyin the morning, goes to the assigned district, performs the collecting service vis-iting the OEM suppliers, and goes to the assembler plant when all tasks arecompleted, or when the maximum allowed working time per day is to be reached,whichever occurs first. This complete time sequence makes up the vehicle cycle.In some practical circumstances more than one tour per day can be assigned to thesame truck. This implies extra line-haul costs, but depending on the cargo
Fault Detection in Dynamic Vehicle Routing Operations 15
characteristics, vehicle size restrictions and other factors, multiple daily tours pervehicle might sometimes be appropriate. For the sake of simplicity, we assumethat the vehicles perform just one cycle per day. The model can be easily modifiedto take into account multiple daily cycles. It is assumed a district of areaA ¼ 40 sq.km. located 7 km from the depot. The expected driving line-haul timefrom the depot to the district is tLH1 = 14 min and the line-haul time from the lastservice to the depot is admitted to be the same, i.e. tLH2 ¼ tLH1 ¼ 14 min, with astandard deviation rLH2 ¼ rLH1 ¼ 2:8 min, being both normally distributed. The
servicing time tðSTÞj at a generic client location, from the instant the vehicle stops
until it leaves to attend another client, is assumed to be described by a lognormal
distribution, with constant E½tðSTÞj � ¼ 11 min, and rðSTÞ
j ¼ 4:5 min. Assumingn servicing points randomly generated over the district, a combination of farthestinsertion and 3-OPT algorithms (Syslo et al. 2006) was applied in order to get theTravelling Salesman Problem (TSP) Euclidean route. A corrective coefficient(route factor) was then applied to the Euclidean distance to take into considerationthe road network impedance (Novaes and Burin 2009).
The vehicle average speed within the district under standard traffic conditions,is s0 ¼ 28 km/h, with the velocity reduced to s1 ¼ 15 km/h during over-con-gested situations. The speed, both in a normal traffic condition and during an over-congested situation, is represented by lognormal distributions (section SequentialAnalysis for Detecting Incipient Faults). It is assumed that over-congested situa-tions occur with probability p1 ¼ 0:20 (hypothesis H1), while standard conditionsprevail with probability p0 ¼ 0:80 (hypothesis H0).
Let H ¼ 8 h be the maximum vehicle crew working time per day and TC thevehicle cycle time, with TC � H. Assuming a number n of servicing points in thedistrict route, one is interested in estimating the expected number of visits that willbe effectively performed during the daily cycle-time, with the objective of keepingit within a pre-established service level. Since n is sufficiently large in ourapplications, TC can be assumed to be normally distributed according to the centrallimit theorem. Thus, it is necessary to estimate an upper extreme value for TC inorder to select an appropriate value for n.
Statistics of extremes have applications in many engineering domains (Gumbel1967; Smith 2003; Haan and Ferreira 2006). Consider M samples of an i.i.d.continuous random variable X, each sample of size m taken from the samepopulation. The asymptotic configuration, provided it exists, must be such thatthe largest value of any sample of size m taken from the population must have thesame distribution (Gumble 1967). Let X1;X2; . . .;Xmf g represent one such sample.Let Ym ¼ maxðX1; . . .;XmÞ be the sample maximum. The probability that thelargest value is below a generic value x is
Pr Ym� xf g ¼ FðxÞm; ð1Þ
FðxÞ being the cumulative probability distribution function of x. Since a lineartransformation does not change the form of the probability distribution, the
16 A. G. N. Novaes et al.
probability that the largest value is below x is equal to the probability of a linearfunction of x (Gumbel 1967)
FðxÞm ¼ F amx þ bmð Þ; ð2Þ
the two parameters am and bm being functions of m. It has been proved that, asm!1, expression (2) tends to the cumulative probability distribution H xð Þ ofthe Gumbel type in case X is described by exponential, normal, lognormal, orgamma distributions. The Gumbel distribution is (Gumbel 1967; Smith 2003)
limm!1
FðxÞm ¼ H xð Þ ¼ exp �exp �aðx� uÞ½ �f g; ð3Þ
where a and u are coefficients obtained via calibration. Let E½X� and r½X� be,respectively, the expected value and the standard variation of a sample formed bythe upper extreme values extracted from M sets containing, each set, m values of acontinuous variable X. Then, the estimated values of a and u are (Gumbel 1967)
1a¼p
6p
r [X]; and ð4Þ
r u ¼ pCVp
6� c; ð5Þ
where CV ¼ br X½ �=bE½X� is the coefficient of variation and c ¼ 0:57722. From (4)and (5) one gets
bu ¼ bE X½ � � 0:57722a
: ð6Þ
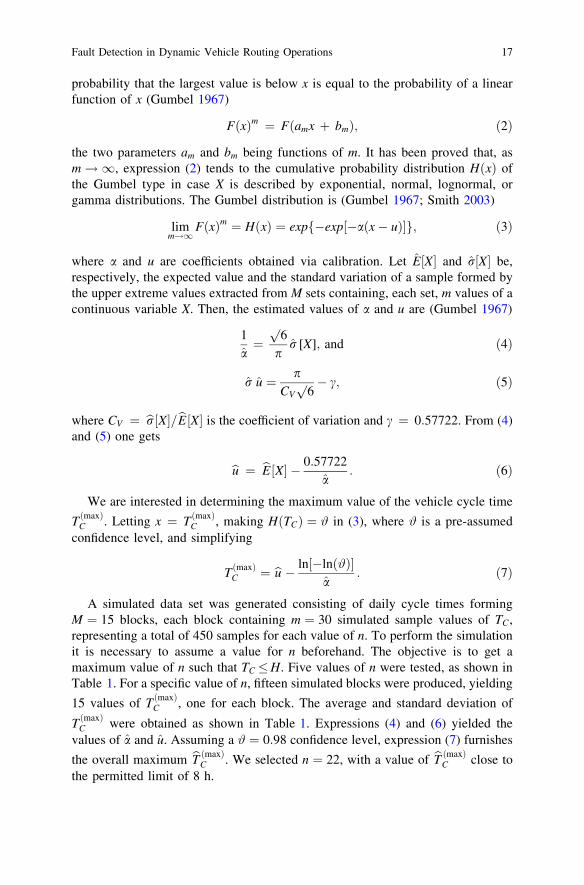
We are interested in determining the maximum value of the vehicle cycle time
T ðmaxÞC . Letting x ¼ TðmaxÞ
C , making H TCð Þ ¼ # in (3), where # is a pre-assumedconfidence level, and simplifying
TðmaxÞC ¼ bu � ln �lnð#Þ½ �
a: ð7Þ
A simulated data set was generated consisting of daily cycle times formingM ¼ 15 blocks, each block containing m ¼ 30 simulated sample values of TC,representing a total of 450 samples for each value of n. To perform the simulationit is necessary to assume a value for n beforehand. The objective is to get amaximum value of n such that TC �H. Five values of n were tested, as shown inTable 1. For a specific value of n, fifteen simulated blocks were produced, yielding
15 values of T ðmaxÞC , one for each block. The average and standard deviation of
T ðmaxÞC were obtained as shown in Table 1. Expressions (4) and (6) yielded the
values of a and u. Assuming a # ¼ 0:98 confidence level, expression (7) furnishes
the overall maximum bT ðmaxÞC . We selected n ¼ 22, with a value of bT ðmaxÞ
C close tothe permitted limit of 8 h.
Fault Detection in Dynamic Vehicle Routing Operations 17

Table 2 shows the static vehicle tour simulation framework. The line-haultravelling times from the depot to the district (outbound) and vice versa (inbound)are represented by tLH1 and tLH2 respectively in Table 2. The occurrence of
hypothesis H0 or H1 is represented by h. Variables di�1;i and tðhÞi�1;i are the distanceand the travelled time, respectively, from point i� 1 to point i in the route.The vehicle speed s is represented by log-normal distributions, which depend on theoccurrence of H0 or H1 (section Sequential Analysis for Detecting Incipient Faults).
The stopping time at point i is tðSTÞi ; and si is the cumulative elapsed time up to stage i.
Table 1 Searching for n such that TC �H
N E½TC � r½TC � a u T maxð ÞC (h)
20 7.12 0.2122 6.0443 7.0285 7.5821 7.40 0.1987 6.4547 7.3086 7.8422 7.61 0.2100 6.1074 7.5208 8.0423 7.96 0.1983 6.4677 7.8687 8.3624 8.14 0.2117 6.0589 8.0480 8.53
Table 2 Static route simulation framework
1. Assume a value for n and compute point density d ¼ n=A;2. i 0;3. Generate line-haul travelling times, tLH1 and tLH2, both normally distributed;4. Set s0 tLH1 þ tLH2;5. Generate random number e; if e� p0, h 0; if e [ p0, h 1 �ð Þ;6. i iþ 1 ði is the servicing point sequencial numberÞ;7. Generate value for di�1;i, Erlang distributed with parameter h ¼ 3;
8. Generate value for the route factor k2 (log-normal);
9. Generate stopping time tðSTÞi at point i, log-normally distributed;
10. If h ¼ 0, then E s½ � s0; else E s½ � s1:Generate speed value s (log-normal)11. ti�1;i di�1;i � k2=s;
12. si si�1 þ ti�1;i þ tðSTÞi
(a) If si�H and i\n, then nðPÞ n and TC ¼ si; go to (6);(b) If si�H and i ¼ n; thenBegin
nðPÞ n; TC si; go to (14);End(c) If si [ H thenBegin
nðPÞ ½n� i� 1ð Þ� ; TC si�1; go to (14);End
13. nðUÞ ½n� n Pð Þ�14. Repeat the process from (2) on until the number of replications is complete
(*) h = 0, hypothesis H0 and h ¼ 1, hypothesis H1;
18 A. G. N. Novaes et al.