Embed Size (px)
Citation preview
1
Identification of screening biomarkers for chromosomal
anomalies and pregnancy-related disorder using
quantitative plasma proteomics
Inauguraldissertation
zur
Erlangung der Würde eines Doktors der Philosophie
vorgelegt der
Philosophisch-Naturwissenschaftlichen Fakultät
der Universität Basel
von
Varaprasad Kolla
aus Wardha, India
Basel, 2011

2
Genehmigt von der Philosophisch-Naturwissenschaftlichen Fakultät
auf Antrag von:
Prof. Dr. Sinuhe Hahn
Prof. Dr. Urs Jenal
Prof. Dr. Paul Jenö
Basel, den 22.06.2010
Prof. Dr. Eberhard Parlow, Dekan

3
To
My Guru Sai Baba,
My Parents,
Abiraj


5 Acknowledgement
Acknowledgement
I would like to thank Prof. Dr. Sinuhe Hahn for giving me the opportunity to perform this
work in the Laboratory for Prenatal Medicine, University Hospital, Basel, Switzerland,
between August 2006 and May 2010.
I am very thankful to Prof. Dr. Urs Jenal for giving me the chance to my PhD in the
Faculty of Science, University of Basel, and Dr. Paul Jenö for being my co-referee of my
thesis and support with proteomics.
Many thanks to present and past members of the lab for the good time I had in and out
side the lab.
Ying, Corinne, Marianne, Nicole, Daniela, Iryna, Corina, Zeinab, Anurag, Simon, Reza,
Ramin, Alex, Chanchal, Karol.
I am very thankful to Vivian for all her support and affection during my time in lab.
I would like to thank PD. Dr. Lapaire, Dr. Huang, and Prof. Dr. Hoesli from University
Women’s Hospital, Basel for helping me in collecting the samples.
Many thanks to Suzette Moes, Biozentrum, University of Basel, for helping me in
analyzing the samples form the proteomics experiment.
I am very thankful to all my Indian friends in Basel who were always special to me and
helped me when ever I was in need. Navratna, Abiraj, Arpitha, Anurag, Divya,
Manjunath, Ashwini,Nidhi, Vivek, Harish, Manu, Srijit, Brinda, Richa, Ratnesh, Sudip,
Rejina, Jenish, Jhanvi, Sachin, Abhilasha. Murali, Reshmi, Arundhati.
I also thank my sister Uma, Dr. Naidu, Chintu, Chinky and my brother Chandrashekar,
Radhika, Aashi for supporting me all these years.
All this would not have been possible without constant support, blessing and love of my
parents Smt. K Laxmi and Shri. K.Ch. Pullaiah.
I would also like to extend my thanks to my in laws Mr and Mrs. Pereira, Adeline, Jude,
Shoheb, Nana for the trust and blessing they showed on me.
I would like to thank my wife Andrea for her love, patience and support during all these
years.
I would like to thank my guru Shri Sai Baba for guiding me always in right direction and
lifting my spirit high.


7 Table of Content
TABLE OF CONTENTS
TABLE OF CONTENTS.......................................................................................................... 7
1 Introduction: Prenatal screening, Invasive and Non-invasive Diagnosis..11
1.1 Current invasive procedures for prenatal diagnosis.......................................... 16
1.1.1 Amniocentesis:.................................................................................................................................... 16
1.1.2 Chorionic villus sampling.............................................................................................................. 17
1.2 Non-invasive prenatal diagnosis:............................................................................. 19
1.3 Mass spectroscopy based proteomics..................................................................... 20
1.4 Plasma proteomics for new screening biomarkers ............................................ 21
1.4.1 Two-dimensional gel electrophoresis (2-DE)..................................................................... 21
1.4.2 2-D Differential Gel Electrophoresis (2D DIGE) ................................................................ 22
1.4.3 Isobaric Tagging for Relative and Absolute Quantitation (iTRAQ) ......................... 23
1.5 Plasma proteomics for DS biomarker development .......................................... 25
1.6 Preeclampsia ................................................................................................................. 26
1.6.1 Plasma Proteomics for new screening biomarkers for Preeclampsia ................... 27
2 Analysis of Pre- and Post-Delivery Maternal Plasma Proteome using Free
Flow Electrophoresis and Shotgun Proteomics ........................................................29
2.1 Abstract ........................................................................................................................... 30
2.2 Introduction:.................................................................................................................. 31
2.3 Material and Methods: ................................................................................................ 32
2.4 Samples ........................................................................................................................... 32
2.5 Sample preparation ..................................................................................................... 33
8 Table of Content
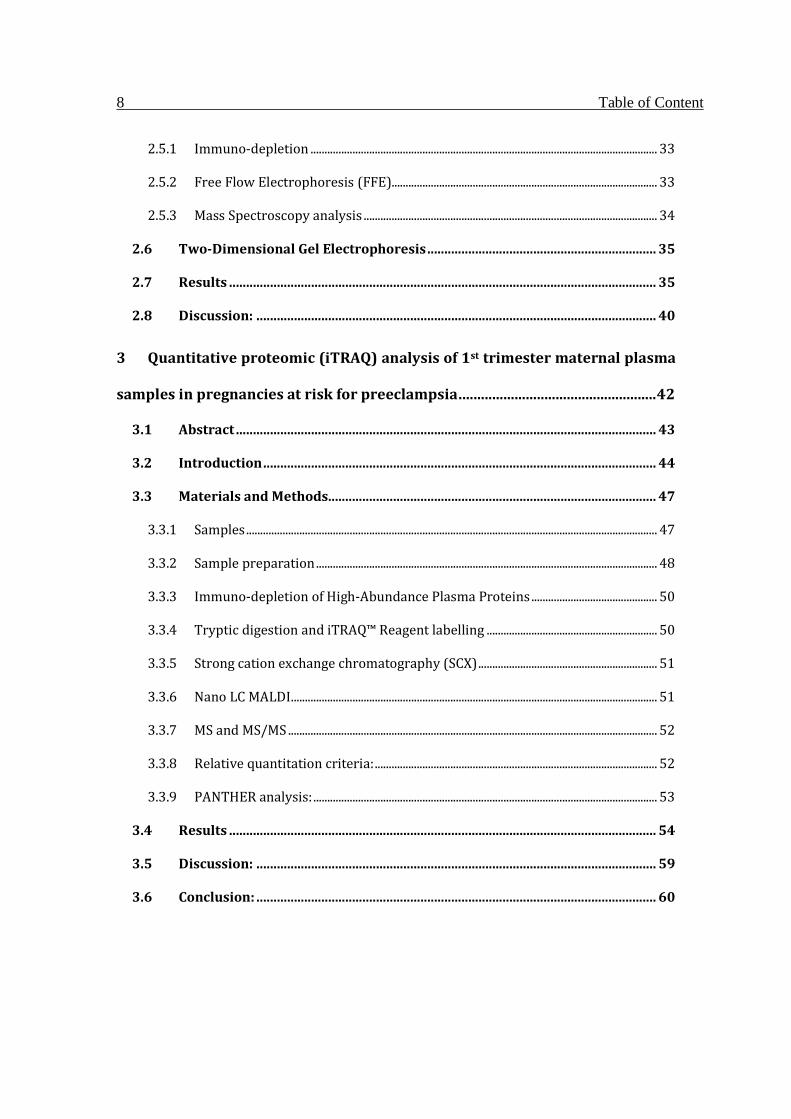
2.5.1 Immuno-depletion ............................................................................................................................ 33
2.5.2 Free Flow Electrophoresis (FFE)............................................................................................... 33
2.5.3 Mass Spectroscopy analysis ......................................................................................................... 34
2.6 Two-Dimensional Gel Electrophoresis................................................................... 35
2.7 Results ............................................................................................................................. 35
2.8 Discussion: ..................................................................................................................... 40
3 Quantitative proteomic (iTRAQ) analysis of 1st trimester maternal plasma
samples in pregnancies at risk for preeclampsia.....................................................42
3.1 Abstract ........................................................................................................................... 43
3.2 Introduction................................................................................................................... 44
3.3 Materials and Methods................................................................................................ 47
3.3.1 Samples................................................................................................................................................... 47
3.3.2 Sample preparation.......................................................................................................................... 48
3.3.3 Immuno-depletion of High-Abundance Plasma Proteins............................................. 50
3.3.4 Tryptic digestion and iTRAQ™ Reagent labelling ............................................................. 50
3.3.5 Strong cation exchange chromatography (SCX)................................................................ 51
3.3.6 Nano LC MALDI................................................................................................................................... 51
3.3.7 MS and MS/MS .................................................................................................................................... 52
3.3.8 Relative quantitation criteria:..................................................................................................... 52
3.3.9 PANTHER analysis:........................................................................................................................... 53
3.4 Results ............................................................................................................................. 54
3.5 Discussion: ..................................................................................................................... 59
3.6 Conclusion: ..................................................................................................................... 60

9 Table of Content
4 Examination of the 1st trimester maternal plasma proteome by SELDI in
pregnancies at risk for Preeclampsia ..........................................................................63
4.1 Abstract ........................................................................................................................... 64
4.1.1 Background........................................................................................................................................... 64
4.1.2 Results ..................................................................................................................................................... 64
4.1.3 Conclusion............................................................................................................................................. 64
4.2 Introduction................................................................................................................... 65
4.3 Materials and Methods................................................................................................ 65
4.3.1 Samples................................................................................................................................................... 65
4.3.2 Sample preparation.......................................................................................................................... 66
4.3.3 Plasma protein profiling ................................................................................................................ 67
4.3.4 Bioinformatics approach ............................................................................................................... 68
4.3.5 Classification process and final selection of features ..................................................... 69
4.4 Results and Discussion: .............................................................................................. 69
4.5 Conclusions .................................................................................................................... 73
5 Publication..................................................................................................................75
6 Discussion and Outlook........................................................................................ 115
7 References................................................................................................................ 121
8 Curriculum vitae..................................................................................................... 129


11 Introduction
1 Introduction: Prenatal screening, Invasive and No n-invasive Diagnosis.
12 Introduction
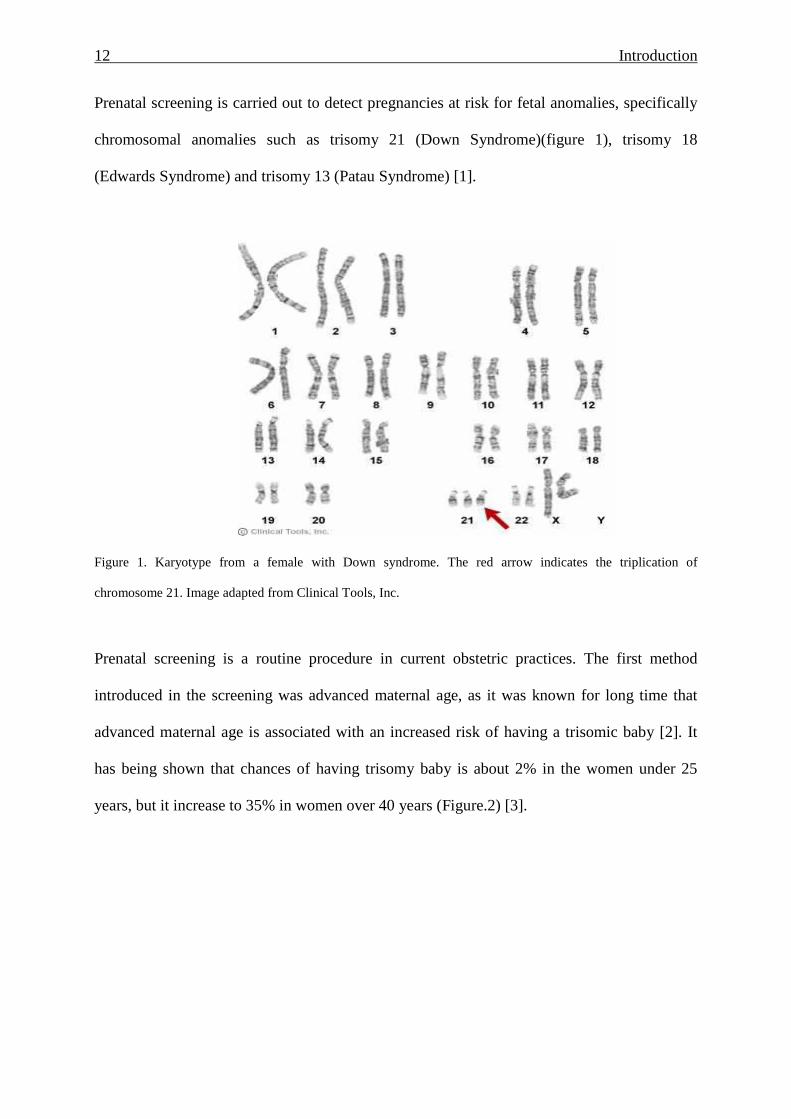
Prenatal screening is carried out to detect pregnancies at risk for fetal anomalies, specifically
chromosomal anomalies such as trisomy 21 (Down Syndrome)(figure 1), trisomy 18
(Edwards Syndrome) and trisomy 13 (Patau Syndrome) [1].
Figure 1. Karyotype from a female with Down syndrome. The red arrow indicates the triplication of
chromosome 21. Image adapted from Clinical Tools, Inc.
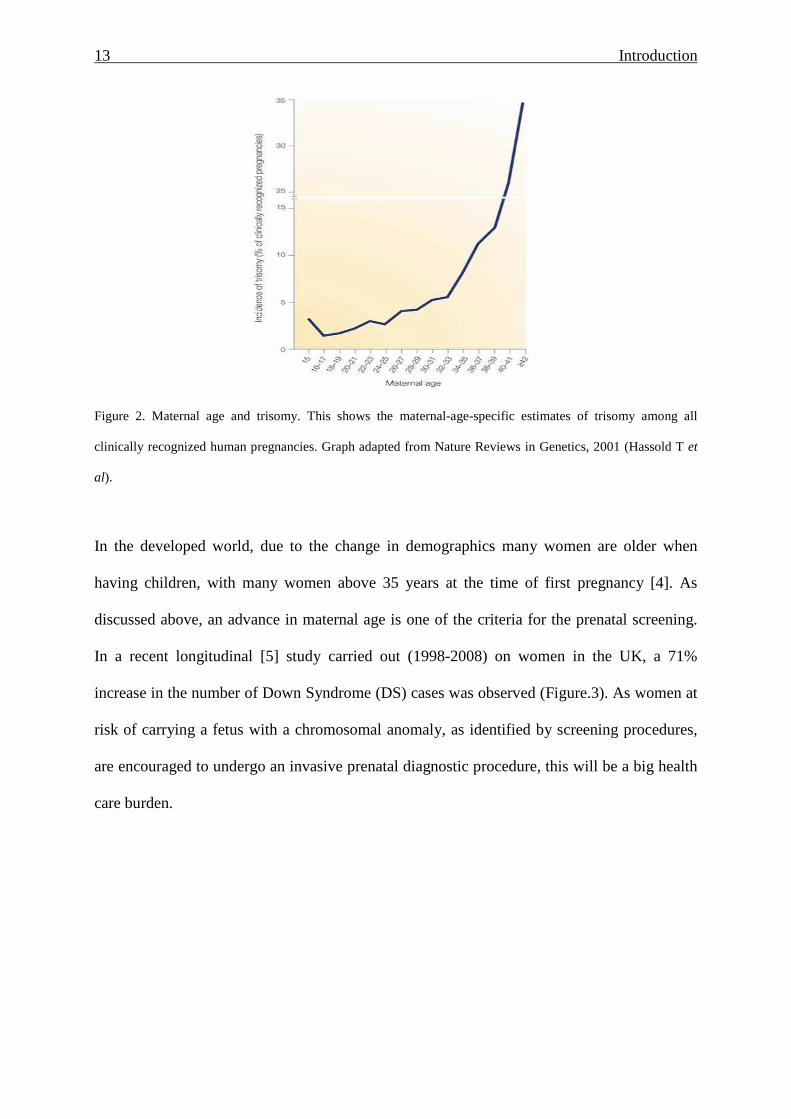
Prenatal screening is a routine procedure in current obstetric practices. The first method
introduced in the screening was advanced maternal age, as it was known for long time that
advanced maternal age is associated with an increased risk of having a trisomic baby [2]. It
has being shown that chances of having trisomy baby is about 2% in the women under 25
years, but it increase to 35% in women over 40 years (Figure.2) [3].
13 Introduction
Figure 2. Maternal age and trisomy. This shows the maternal-age-specific estimates of trisomy among all
clinically recognized human pregnancies. Graph adapted from Nature Reviews in Genetics, 2001 (Hassold T et
al).
In the developed world, due to the change in demographics many women are older when
having children, with many women above 35 years at the time of first pregnancy [4]. As
discussed above, an advance in maternal age is one of the criteria for the prenatal screening.
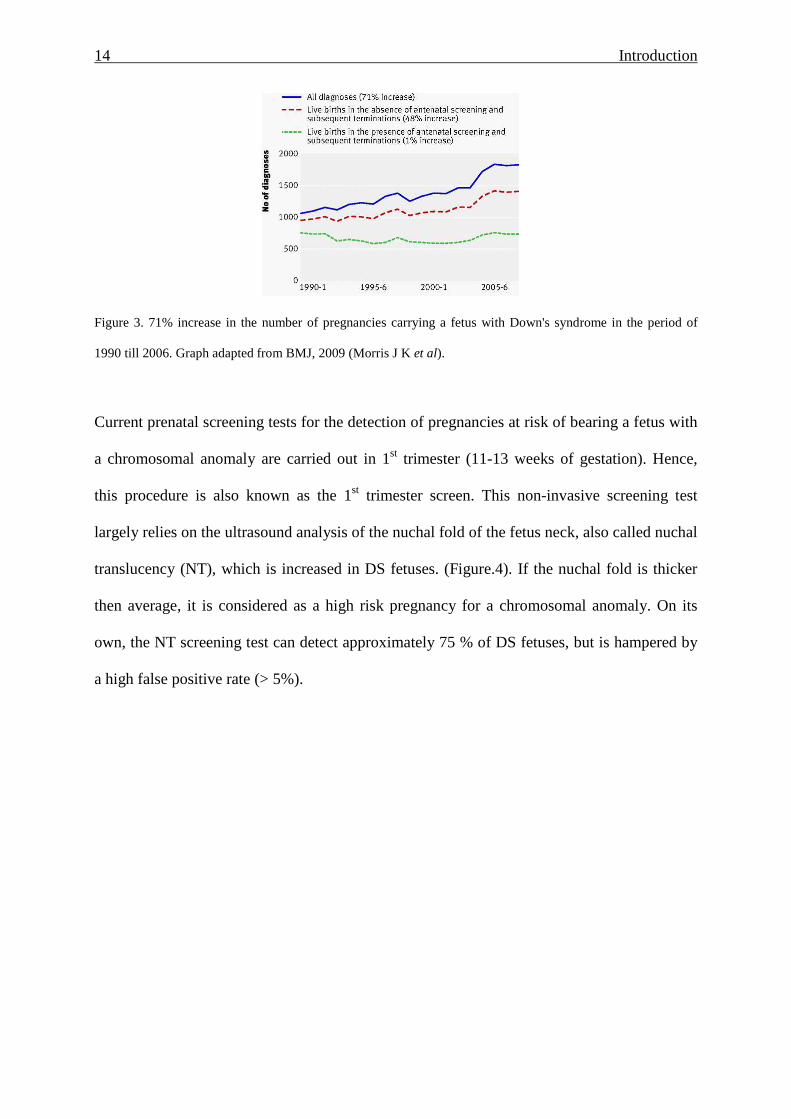
In a recent longitudinal [5] study carried out (1998-2008) on women in the UK, a 71%
increase in the number of Down Syndrome (DS) cases was observed (Figure.3). As women at
risk of carrying a fetus with a chromosomal anomaly, as identified by screening procedures,
are encouraged to undergo an invasive prenatal diagnostic procedure, this will be a big health
care burden.
14 Introduction
Figure 3. 71% increase in the number of pregnancies carrying a fetus with Down's syndrome in the period of
1990 till 2006. Graph adapted from BMJ, 2009 (Morris J K et al).
Current prenatal screening tests for the detection of pregnancies at risk of bearing a fetus with
a chromosomal anomaly are carried out in 1st trimester (11-13 weeks of gestation). Hence,
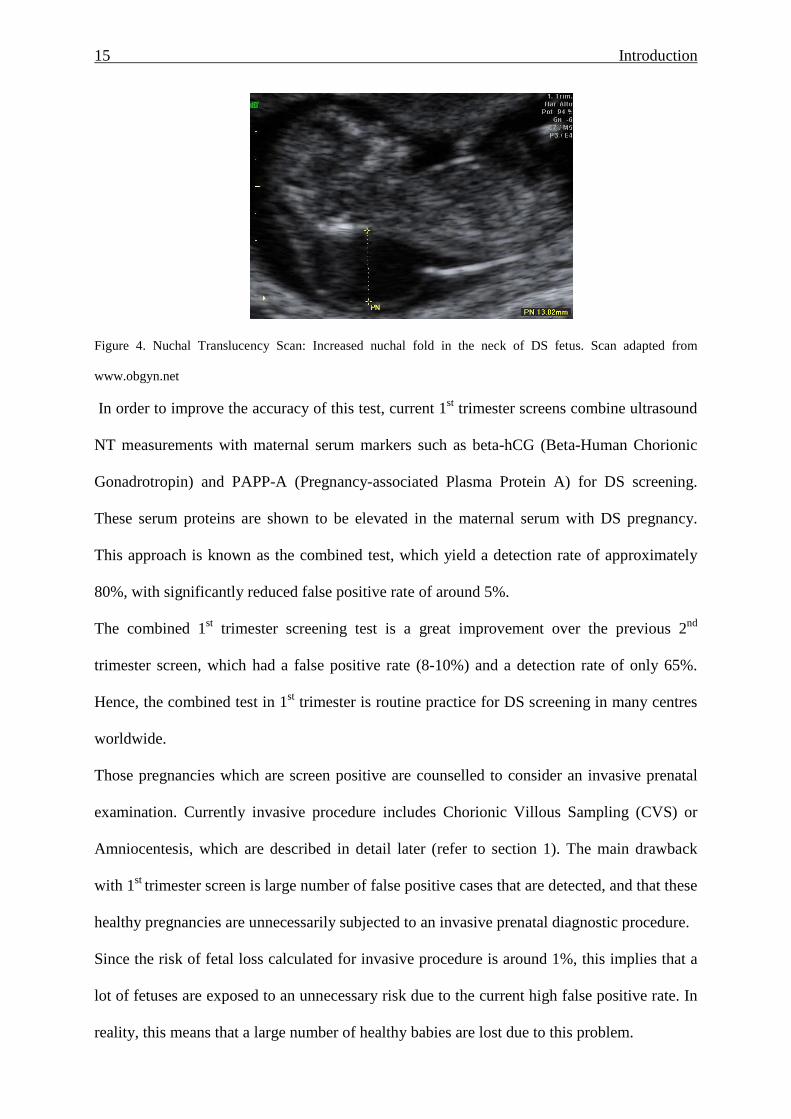
this procedure is also known as the 1st trimester screen. This non-invasive screening test
largely relies on the ultrasound analysis of the nuchal fold of the fetus neck, also called nuchal
translucency (NT), which is increased in DS fetuses. (Figure.4). If the nuchal fold is thicker
then average, it is considered as a high risk pregnancy for a chromosomal anomaly. On its
own, the NT screening test can detect approximately 75 % of DS fetuses, but is hampered by
a high false positive rate (> 5%).
15 Introduction
Figure 4. Nuchal Translucency Scan: Increased nuchal fold in the neck of DS fetus. Scan adapted from
www.obgyn.net
In order to improve the accuracy of this test, current 1st trimester screens combine ultrasound
NT measurements with maternal serum markers such as beta-hCG (Beta-Human Chorionic
Gonadrotropin) and PAPP-A (Pregnancy-associated Plasma Protein A) for DS screening.
These serum proteins are shown to be elevated in the maternal serum with DS pregnancy.
This approach is known as the combined test, which yield a detection rate of approximately
80%, with significantly reduced false positive rate of around 5%.
The combined 1st trimester screening test is a great improvement over the previous 2nd
trimester screen, which had a false positive rate (8-10%) and a detection rate of only 65%.
Hence, the combined test in 1st trimester is routine practice for DS screening in many centres
worldwide.
Those pregnancies which are screen positive are counselled to consider an invasive prenatal
examination. Currently invasive procedure includes Chorionic Villous Sampling (CVS) or
Amniocentesis, which are described in detail later (refer to section 1). The main drawback
with 1st trimester screen is large number of false positive cases that are detected, and that these
healthy pregnancies are unnecessarily subjected to an invasive prenatal diagnostic procedure.
Since the risk of fetal loss calculated for invasive procedure is around 1%, this implies that a
lot of fetuses are exposed to an unnecessary risk due to the current high false positive rate. In
reality, this means that a large number of healthy babies are lost due to this problem.

16 Introduction
In order to increase the accuracy of the 1st trimester screening test, a number of efforts have
been undertaken to increase efficacy and accuracy of the current procedure. This includes the
inclusion of a number of additional serum screening markers such as the inhibin, or
ultrasonography for the fetal nasal bone. Unfortunately, these have not lead to the desired
reduction in the FP rate.
Hence, it has become obvious that there is a need for additional biomarkers, which can add
more to the sensitivity and specificity of current non-invasive screening procedure.
This aspect forms the major aim of this thesis.
1.1 Current invasive procedures for prenatal diagn osis.
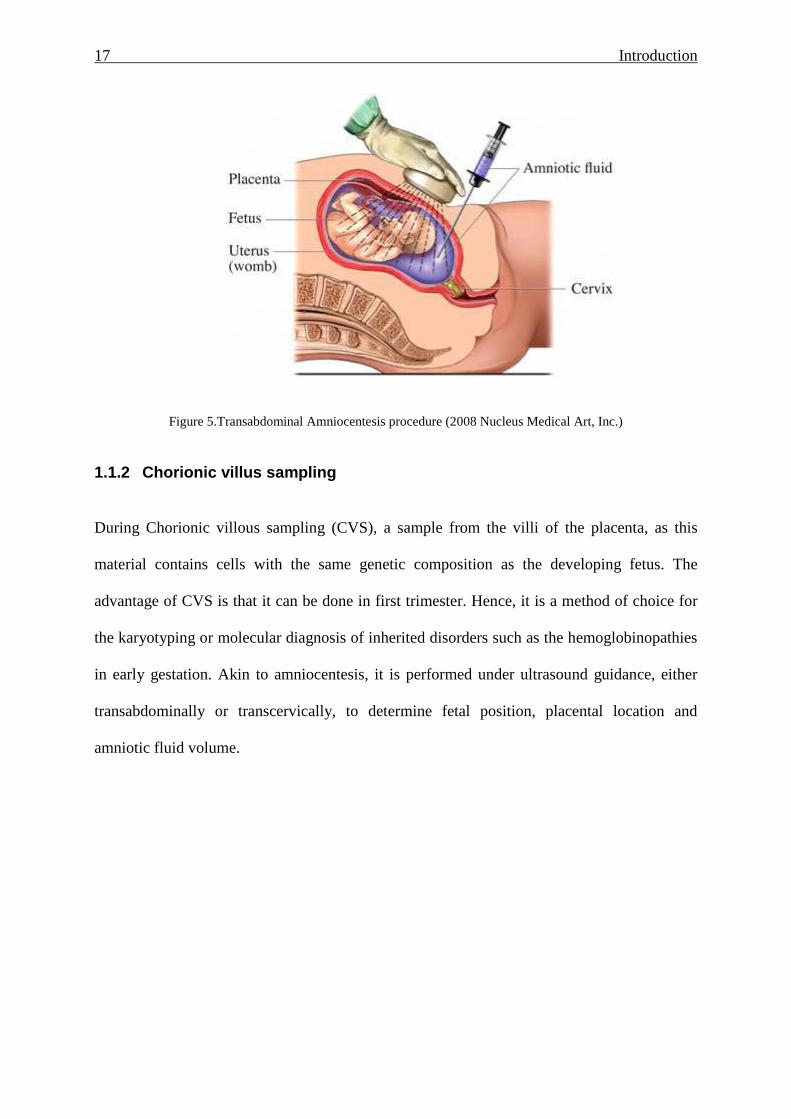
1.1.1 Amniocentesis:
In this procedure amniotic fluid (AF) is obtained from the fetal amnion, which contains
amniotic cells that can be used to determine whether a fetal chromosomal abnormality of
developing fetus is present. The procedure is performed under ultrasound guidance, whereby
a thin canulla is inserted into the amniotic sac and a volume of 15-20 ml of AF is collected
using a standard syringe. The procedure is usually done after 16 weeks of pregnancy.
Conventionally, the chromosomal analysis relies on karyotyping of cultured AF cells, a
procedure which can take up to 2 weeks. In order to improve the speed of the diagnosis, many
labs now offer direct fluorescent in situ hybridization (FISH) or QF-PCR (quantitative
fluorescence polymerase chain reaction) of uncultured AF cells [6].
17 Introduction
Figure 5.Transabdominal Amniocentesis procedure (2008 Nucleus Medical Art, Inc.)
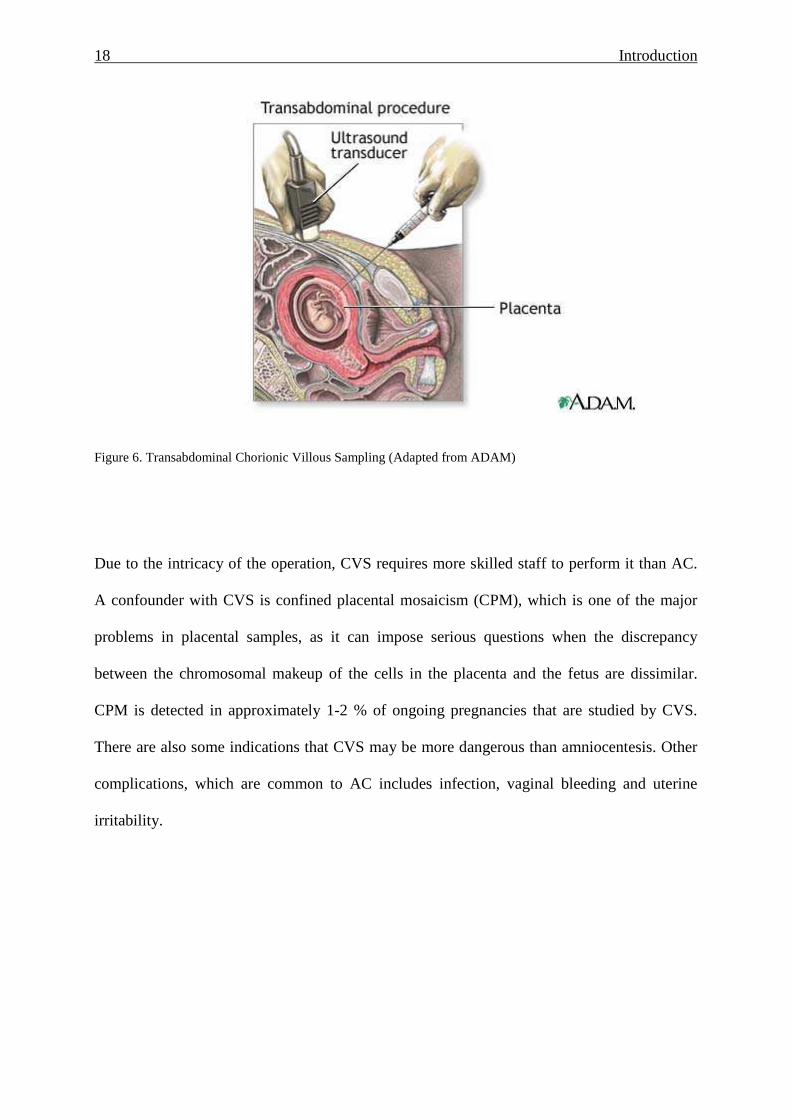
1.1.2 Chorionic villus sampling
During Chorionic villous sampling (CVS), a sample from the villi of the placenta, as this
material contains cells with the same genetic composition as the developing fetus. The
advantage of CVS is that it can be done in first trimester. Hence, it is a method of choice for
the karyotyping or molecular diagnosis of inherited disorders such as the hemoglobinopathies
in early gestation. Akin to amniocentesis, it is performed under ultrasound guidance, either
transabdominally or transcervically, to determine fetal position, placental location and
amniotic fluid volume.
18 Introduction
Figure 6. Transabdominal Chorionic Villous Sampling (Adapted from ADAM)
Due to the intricacy of the operation, CVS requires more skilled staff to perform it than AC.
A confounder with CVS is confined placental mosaicism (CPM), which is one of the major
problems in placental samples, as it can impose serious questions when the discrepancy
between the chromosomal makeup of the cells in the placenta and the fetus are dissimilar.
CPM is detected in approximately 1-2 % of ongoing pregnancies that are studied by CVS.
There are also some indications that CVS may be more dangerous than amniocentesis. Other
complications, which are common to AC includes infection, vaginal bleeding and uterine
irritability.
19 Introduction
1.2 Non-invasive prenatal diagnosis:
Due to the risk associated with invasive procedures, a large research effort has been expended
to the development of risk free alternatives. Current results indicate that we may be
approaching the long sought goal of Non-Invasive Prenatal Diagnosis (NIPD), whereby it will
be possible to identify hereditary single gene disorders or a chromosomal abnormality in the
growing fetus.
One of the routes explored for NIPD was via the enrichment of fetal cells, specifically
erythroblasts, from maternal blood. After the enrichment, the putative fetal cells were
examined by FISH analysis for the presence of a chromosomal anomaly. In the large a multi-
centre NIFTY study it was concluded that although promising, the sensitivity and specificity
was below the required clinical application.
A new avenue was provided by the detection of fetal cell-free DNA (cf-DNA) in maternal
plasma or serum [7, 8]. The advantage of this approach is that cff-DNA is more abundant than
fetal cells in maternal circulation. It is, however, hampered by the overwhelming presence of
maternal cell free DNA.
In order to overcome this deficit, our laboratory examined for possible biochemical
differences between maternal and fetal cf-DNA fragments. Here we made the striking
observation that a difference in the size exists between the fetal and maternal cf-DNA
fragments, in that the fetal fragments were smaller than maternal ones. We showed that this
difference could be used to selectively enrich the fetal cf-DNA sequences, thereby permitting
the detection of otherwise masked fetal loci, such as point-mutations or polymorphisms which
could assist with the determination of fetal aneuploidies [9]. In order for this approach to
become clinically practical, the enrichment procedure will need to be optimized and
automated.
Other attempts to overcome this drawback rely on epigenetic differences between mother and
20 Introduction
fetus, such as the maspin gene on chromosome 18 or the RASF1 gene [10]. Epigenetic
approaches are currently hindered by inefficient methods such as bisulfite conversion, which
leads to massive loss of epigenetically modified target DNA.
A further approach being explored is that of cell-free mRNA of placental origin, such as that
of the PLAC4 gene, which is located on chromosome 21. In a small pilot study, it has been
suggested that it may be possible to detect DS by such means [11]. However, this approach is
hampered by the instability of the placentally-derived mRNA, cost of processing and
shipment requiring dry-ice.
These facets are discussed in an invited review we wrote on new developments for NIPD of
chromosomal anomalies and single gene disorders (see publications) [12]. In this we also
describe the new strategies, such a next generations sequencing and digital PCR, being
explored in this field
1.3 Mass spectroscopy based proteomics
Proteomics is defined as the analysis of whole protein component of a tissue (e.g. brain), cell
(e.g. yeast) or a body fluid (blood or urine). More precisely it involves the determination of
identity of the protein present in the mixture and its relative and absolute quantity. Recently it
is also used to identify protein modifications (e.g. phosphorylation, glycosylation).
Applications of proteomics are very wide, with the major application in clinical research
being applied for the better understanding of biological processes and disease state. Examples
are, to find and validate new biomarkers (diagnostic and prognostic) or to understand the
pharmacodynamics and pharmacokinetics of a drug compound.
A specific proteome is very dynamic and can provide lot of information on the expression
pattern on normal vs. disease or control vs. treated. To study the proteome in its complexity,
advanced tool are required, and in this context mass spectroscopy has emerged as a powerful
technique for proteomic analysis.
21 Introduction
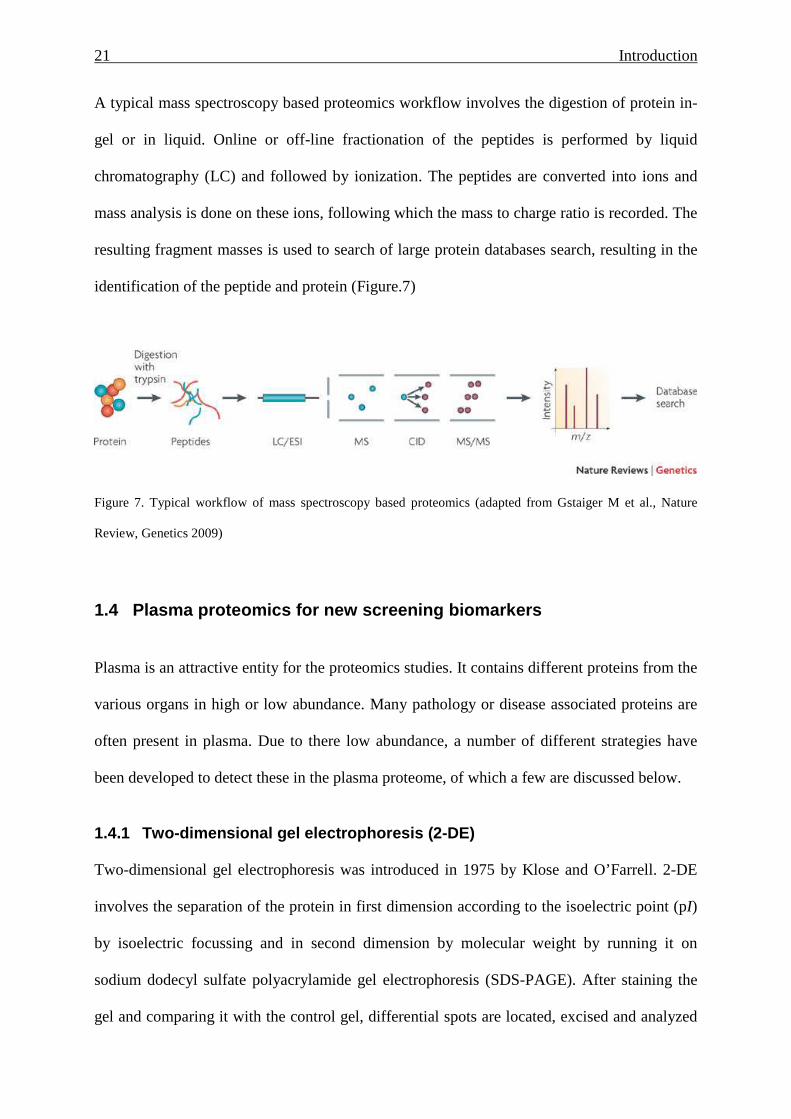
A typical mass spectroscopy based proteomics workflow involves the digestion of protein in-
gel or in liquid. Online or off-line fractionation of the peptides is performed by liquid
chromatography (LC) and followed by ionization. The peptides are converted into ions and
mass analysis is done on these ions, following which the mass to charge ratio is recorded. The
resulting fragment masses is used to search of large protein databases search, resulting in the
identification of the peptide and protein (Figure.7)
Figure 7. Typical workflow of mass spectroscopy based proteomics (adapted from Gstaiger M et al., Nature
Review, Genetics 2009)
1.4 Plasma proteomics for new screening biomarkers
Plasma is an attractive entity for the proteomics studies. It contains different proteins from the
various organs in high or low abundance. Many pathology or disease associated proteins are
often present in plasma. Due to there low abundance, a number of different strategies have
been developed to detect these in the plasma proteome, of which a few are discussed below.
1.4.1 Two-dimensional gel electrophoresis (2-DE)
Two-dimensional gel electrophoresis was introduced in 1975 by Klose and O’Farrell. 2-DE
involves the separation of the protein in first dimension according to the isoelectric point (pI)
by isoelectric focussing and in second dimension by molecular weight by running it on
sodium dodecyl sulfate polyacrylamide gel electrophoresis (SDS-PAGE). After staining the
gel and comparing it with the control gel, differential spots are located, excised and analyzed
22 Introduction
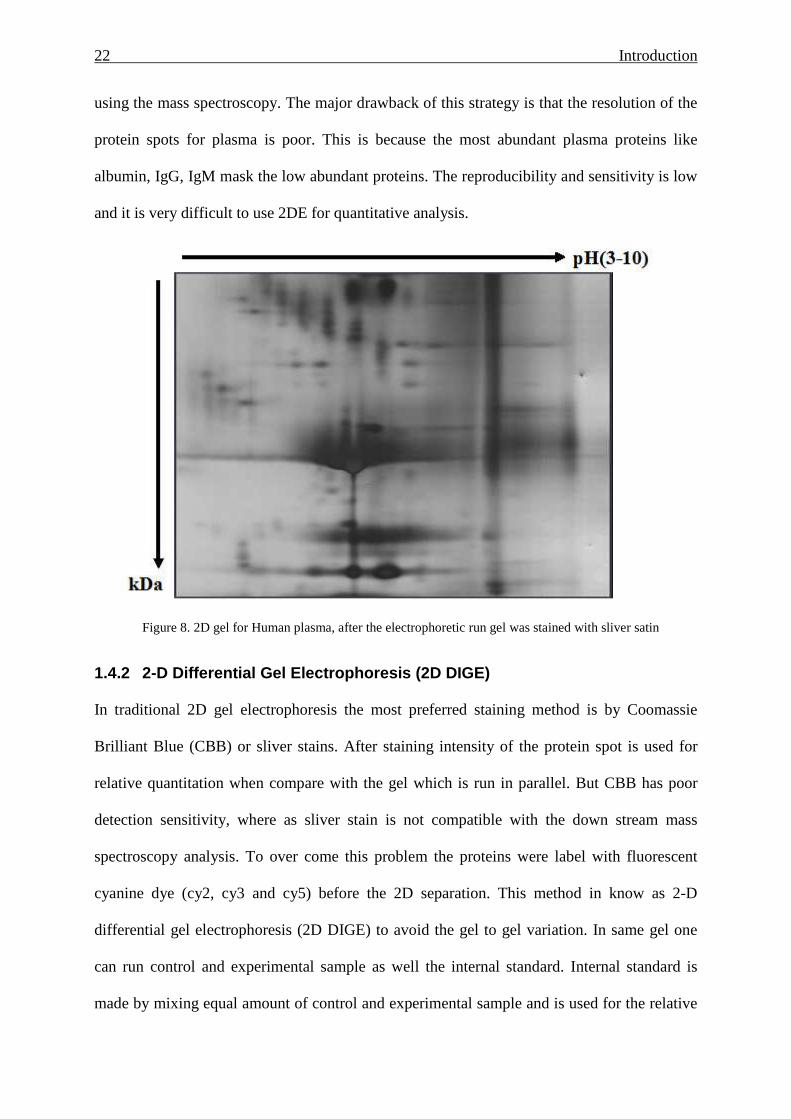
using the mass spectroscopy. The major drawback of this strategy is that the resolution of the
protein spots for plasma is poor. This is because the most abundant plasma proteins like
albumin, IgG, IgM mask the low abundant proteins. The reproducibility and sensitivity is low
and it is very difficult to use 2DE for quantitative analysis.
Figure 8. 2D gel for Human plasma, after the electrophoretic run gel was stained with sliver satin
1.4.2 2-D Differential Gel Electrophoresis (2D DIGE )
In traditional 2D gel electrophoresis the most preferred staining method is by Coomassie
Brilliant Blue (CBB) or sliver stains. After staining intensity of the protein spot is used for
relative quantitation when compare with the gel which is run in parallel. But CBB has poor
detection sensitivity, where as sliver stain is not compatible with the down stream mass
spectroscopy analysis. To over come this problem the proteins were label with fluorescent
cyanine dye (cy2, cy3 and cy5) before the 2D separation. This method in know as 2-D
differential gel electrophoresis (2D DIGE) to avoid the gel to gel variation. In same gel one
can run control and experimental sample as well the internal standard. Internal standard is
made by mixing equal amount of control and experimental sample and is used for the relative
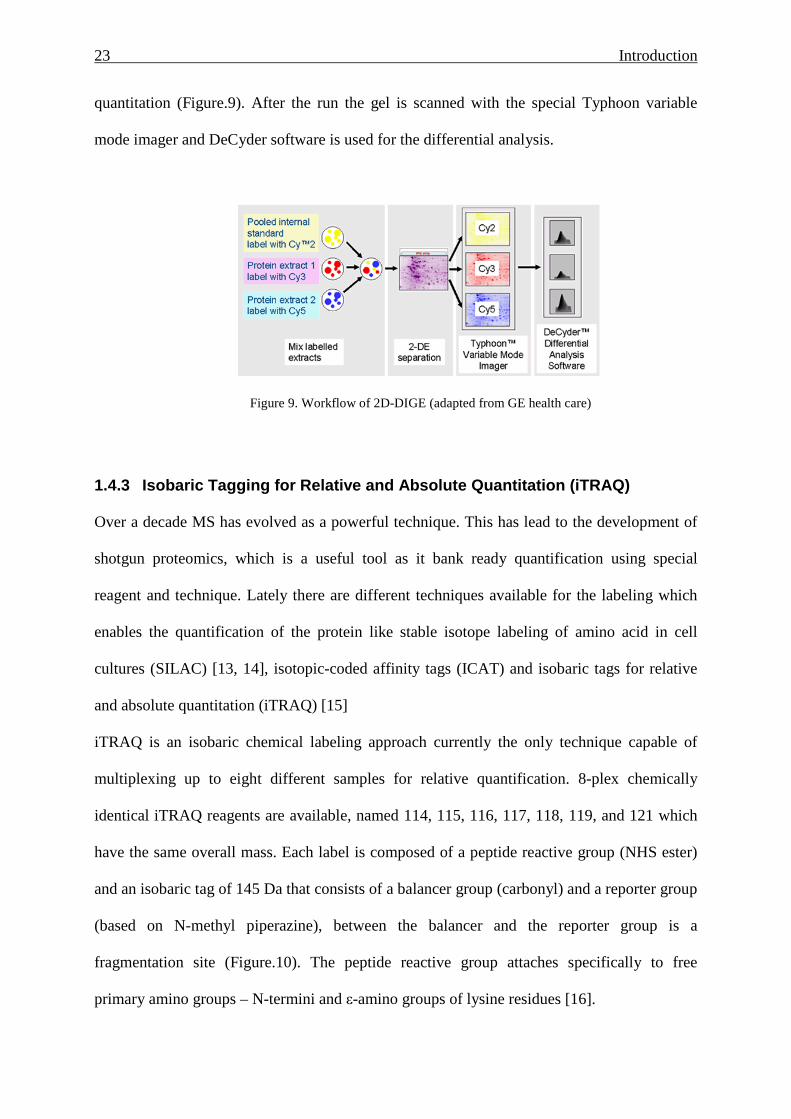
23 Introduction
quantitation (Figure.9). After the run the gel is scanned with the special Typhoon variable
mode imager and DeCyder software is used for the differential analysis.
Figure 9. Workflow of 2D-DIGE (adapted from GE health care)
1.4.3 Isobaric Tagging for Relative and Absolute Qu antitation (iTRAQ)
Over a decade MS has evolved as a powerful technique. This has lead to the development of
shotgun proteomics, which is a useful tool as it bank ready quantification using special
reagent and technique. Lately there are different techniques available for the labeling which
enables the quantification of the protein like stable isotope labeling of amino acid in cell
cultures (SILAC) [13, 14], isotopic-coded affinity tags (ICAT) and isobaric tags for relative
and absolute quantitation (iTRAQ) [15]
iTRAQ is an isobaric chemical labeling approach currently the only technique capable of
multiplexing up to eight different samples for relative quantification. 8-plex chemically
identical iTRAQ reagents are available, named 114, 115, 116, 117, 118, 119, and 121 which
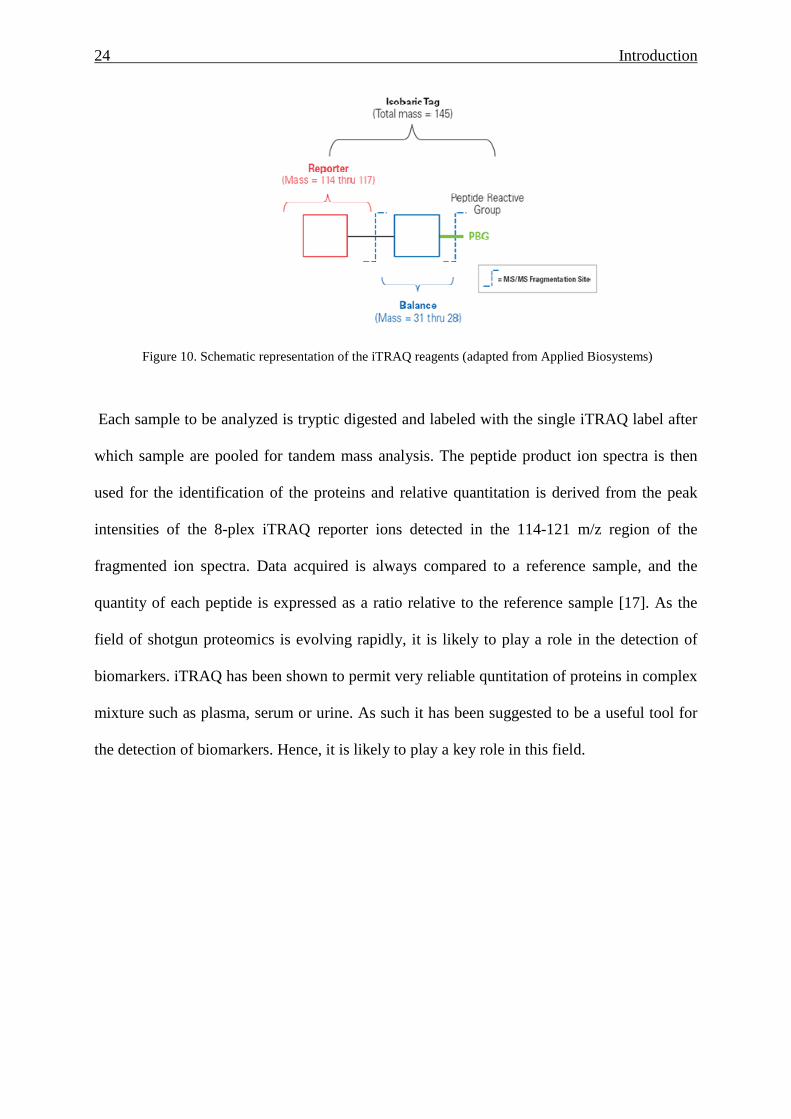
have the same overall mass. Each label is composed of a peptide reactive group (NHS ester)
and an isobaric tag of 145 Da that consists of a balancer group (carbonyl) and a reporter group
(based on N-methyl piperazine), between the balancer and the reporter group is a
fragmentation site (Figure.10). The peptide reactive group attaches specifically to free
primary amino groups – N-termini and ε-amino groups of lysine residues [16].
24 Introduction
Figure 10. Schematic representation of the iTRAQ reagents (adapted from Applied Biosystems)
Each sample to be analyzed is tryptic digested and labeled with the single iTRAQ label after
which sample are pooled for tandem mass analysis. The peptide product ion spectra is then
used for the identification of the proteins and relative quantitation is derived from the peak
intensities of the 8-plex iTRAQ reporter ions detected in the 114-121 m/z region of the
fragmented ion spectra. Data acquired is always compared to a reference sample, and the
quantity of each peptide is expressed as a ratio relative to the reference sample [17]. As the
field of shotgun proteomics is evolving rapidly, it is likely to play a role in the detection of
biomarkers. iTRAQ has been shown to permit very reliable quntitation of proteins in complex
mixture such as plasma, serum or urine. As such it has been suggested to be a useful tool for
the detection of biomarkers. Hence, it is likely to play a key role in this field.
25 Introduction
1.5 Plasma proteomics for DS biomarker development
Only a limited number of studies have attempted to use proteomic approaches for the
discovery of new biomarkers for pregnancies at-risk of carrying a fetus with DS. Two of these
used 2-DE (see above) approaches [21, 22], while a further used a SELDI method [23]. Of
these studies that by Nagalla and colleagues is the largest, having examined serum samples
from 56 pregnant women. This study used samples collected in both the 1st and 2nd trimester
of pregnancy, which were recruited as part of the NIH funded FASTER study, and largely
made use of the fluorescent 2D-DIGE process. In their study, 18 proteins were found to be
elevated in 1st trimester samples, which included members of the apoliprotein family,
clusterin and proteins involved in skeletal development (tetranectin). None of the identified
marker proteins attained any specificity in a blinded analysis of maternal serum samples.
The study by Kolialexi and colleagues [21] used traditional 2DE stained with Coomassie blue
on 20 maternal plasma samples (8 cases, 12 controls, 16-18 weeks of pregnancy), by which
means 8 candidate proteins were detected. Elevations were noted for apoliprotein E and serum
amyloid P-component. In contrast to the study by Nagalla et al., [22] a down regulation for
clusterin was noted.
The drawback or merits of the various approaches, as well as future development are
discussed in detail in our review on this topic [24].
In our experimental analysis we determined that the use of isobaric tagging (iTRAQ) was the
most promising for the quantitative analysis of changes in the maternal plasma proteome in
DS affected pregnancies. This approach forms a major part of this thesis (refer to section 3
and 5).
26 Introduction
1.6 Preeclampsia
Preeclampsia (PE) is a severe disorder of pregnancy and a major cause of fetal and maternal
mortality. It occurs almost 3-5% of pregnancies in developed countries, and is considerably
higher in less developed nations. The clinical symptoms include rapid hypertension in
previously normotensive women, as well as excess protein in urine. Other symptoms may
include oedema, severe headache and liver or kidney dysfunction [25].
The underlying aetiology of PE is unknown, but involves aberrant placentation. Frequently
the only therapeutic option is delivery of the baby and removal of the placenta, upon which
most cases with PE resolve. This, however, leads to the delivery of very premature fetus,
which is frequently affected by growth retardation. A major clinical concern is that no reliable
method exists to detect at-risk pregnancies, and hence, a many efforts are expended for the
development of new screening biomarkers. It is hoped that these markers will facilitate better
management of at-risk pregnancies, by permitting early therapeutic intervention [26].
Amongst the markers currently being explored are angiogenic factor like soluble fms-like
tyrosine kinase-1 (sFLT), placental growth factor (PIGF), vascular endothelial growth factor
(VEGF) [27] and endoglin which are produced by placenta, and whose abnormal expression
are thought to play a role in the hypertensive symptoms. Unfortunately changes in these
molecules only appear to occur in the 2nd trimester of pregnancy very shortly before onset of
symptoms [28].
Apolioprotein E (ApoE) is a major constituent of very low-density lipoprotein. As it has been
hypothesised that preeclampsia may developed because of abnormal lipid metabolism,
leading to oxidative stress, ApoE may play a role in this cascade. In this context it has been
27 Introduction
observed that women with PE have an abnormal lipid profile, which contributes to endothelial
dysfunction [29].
Inhibin A and Activin A are placentally produced glycoproteins that have been reported as
possible predictors for preeclampsia [30], although this may be limited to the 2nd trimester,
where elevations in inhibin A have been noted. First trimester inhibin A analysis has been
shown to have a low predictive value [31].
Pregnancy-associated plasma protein A (PAPP-A) is highly glycosylated protein and
produced by the developing trophoblast. Lower levels of PAPP-A appear to be present in first
trimester serum of pregnant women who subsequently develop PE, however, its specificity
has been questioned as alterations are also observed in other pregnancy related conditions
[32].
Hence, the quest continues for biomarkers that possess predictive value even in the 1st
trimester of pregnancy.
One of the most promising of those currently being examined is placental protein 13 (PP13), a
short diamer protein (32-kDa), which is highly expressed in placenta. During normal
pregnancy PP13 expression gradually increases with the gestational age [33]. Of interest is
that PP-13 expression is lower in women who subsequently develop preeclampsia when
compared to healthy controls [34]. The efficacy of PP-13 as a screening marker was
investigated in the EU funded Pregnancy project, in which our lab participated, and which
funded a large part of this thesis.
1.6.1 Plasma Proteomics for new screening biomarker s for Preeclampsia
As discussed above, currently no reliable early screening marker exists for the prediction of
preeclampsia. It is our hypothesis that as the placenta is in close contact with the maternal

28 Introduction
circulation, and as preeclampsia is associated with placental alterations, that these could be
detectable via analysis of the maternal plasma proteome. Such biomarkers could then be used
for the early detection of at-risk pregnancies, and thereby could assist with better management
of these. In our study we examined 1st trimester maternal plasma samples by quantitative
proteomic analysis using isobaric tagging for the detection of putative biomarkers.
29 Kolla et al, in preparation
2 Analysis of Pre- and Post-Delivery Maternal Plasm a Proteome using Free Flow Electrophoresis and Shotgu n Proteomics
Varaprasad Kolla1, Paul Jenö2, Suzette Moes2, Irene Hoesli1, Olav Lapaire1, and Sinuhe
Hahn1*
University Women’s Hospital/Department of Biomedicine, Basel, Switzerland
Biozentrum, University of Basel, Basel, Switzerland
* Address correspondence to:
Sinuhe Hahn PhD
Laboratory for Prenatal Medicine
University Women’s Hospital / Department of Biomedicine,
Hebelstrasse 20, CH 4031 Basel, Switzerland
Tel: ++41 61 265 9249
Fax: ++41 61 265 9399
E-mail: [email protected] / [email protected]

30 Kolla et al, in preparation
2.1 Abstract
Objectives: To examine whether there is difference in pre- and post-delivery maternal plasma
proteome by shotgun proteomics.
Methods: Blood samples were collected from pre- and 24 hr post- delivery sample. Plasma
extracted from the sample was subjected to 2 different types of pre-fractionation techniques,
namely immuno-depletion and free flow electrophoresis (FFE). Tryptic peptides were
analysed using mass spectroscopy (LC-MS/MS).
Results: Eleven plasma proteins were detected in pre delivery sample, which were absent
from the post delivery sample.
Conclusion: FFE and immuno-depletion are efficient system for pre-fractionation of maternal
plasma samples to remove albumin, thereby permitting the detection of changes in the
maternal plasma proteome which occur following delivery.
Keywords: Free Flow Electrophoresis, maternal plasma, shotgun proteomics
31 Kolla et al, in preparation
2.2 Introduction:
A successful pregnancy outcome depends on many different factors, which includes the
physiologic implantation of the placenta. The placenta is a dynamic organ which increasingly
nurtures the developing fetus with required nutrients and oxygen. It also helps to protect the
fetus against potentially adverse maternal immune responses [35]. The placenta is the direct
interface between the mother and developing fetus [36]. In this context it is noteworthy that a
number of pregnancy related disorders, such as preeclampsia, preterm labour or even fetal
aneuploidies, are associated with placental anomalies, which can contribute to the underlying
pathology. Furthermore, there is continuous shedding of trophoblast-derived micro-particles,
as well as liberation of cell-free nucleic acids and trophoblast deportation into the maternal
circulation by the placenta during almost all stages of fetal development [37]. Hence, and
analysis of the maternal plasma proteome for placenta-derived peptides may yield important
biological clues regarding various physiological and pathological states of fetal development
[38].
The aim of this study was to examine whether changes in the maternal plasma proteome
occurred as a result of delivery, due to removal of the placenta. For this purpose we examined
maternal plasma samples taken prior to and 24 hrs post removal of the placenta by before and
shotgun proteomics. This analysis permitted s to ascertain whether we could detect placenta
specific peptides and whether these were cleared from the maternal circulation post delivery.
In this study, we also attempted to optimize the method for the depletion of major abundant
proteins in plasma, as these are a great hindrance when desiring to detect less prevalent
peptides, such as those of fetal origin. We used the two commercially available depletion
column systems and the recently described Free Flow Electrophoresis (FFE) system [39]. FFE
essentially operates on the principal of isoelectric focusing (IEF). The usefulness of this
32 Kolla et al, in preparation
system is that it permits the clear separation of albumin from the remaining plasma proteins
[40].
2.3 Material and Methods:
Urea was purchased from Serva (Heidelberg, Germany). Sodium hydroxide, sulphuric acid
were purchased from Rield-de-Haen (St. Louis, Mo, USA). DL-2-Aminobutyric acid, glycyl-
glycine, ethanol-amine, 6-aminohexanoic acid, and N-acetylglycine were obtained from Fluka
(St. Louis). HEPES, AMPSO, and acetic acid were purchased from Roth (Karlsruhe,
Germany). ß-Alanin was obtained from Sigma-Aldrich (St. Louis). TAPS were purchased
from CalBiochem (Darmstadt, Germany). Sequencing grade trypsin was purchased from
Promega (Madison, WI, USA). FFE reagent, IEF prolyte Buffer2, IEF Prolyte Buffer 3-9, and
2-(-4 sulfophenylazol)1,8-dihydroxy-3,6-naphthalene di-sulfonic acid (SPADNS) were
bought from BD Diagnostics (Munich, Germany). SepPak cartridges were purchased from
Waters (Milford, MA, USA). Ultrafilteration spin columns (MWCO 3 kDa) were bought from
Vivascience (Hannover, Germany).
2.4 Samples
This study was approved by the Institutional Ethical Board of the University Hospital Basel,
Switzerland. Informed consent was taken from all the pregnant women who participated in
the study. Blood for this study was collected from six low risk pregnant women with singleton
pregnancies prior to and 24 hrs after an elective caesarean section. In this manner, the plasma
proteome was not influenced by the effect of labour.
33 Kolla et al, in preparation
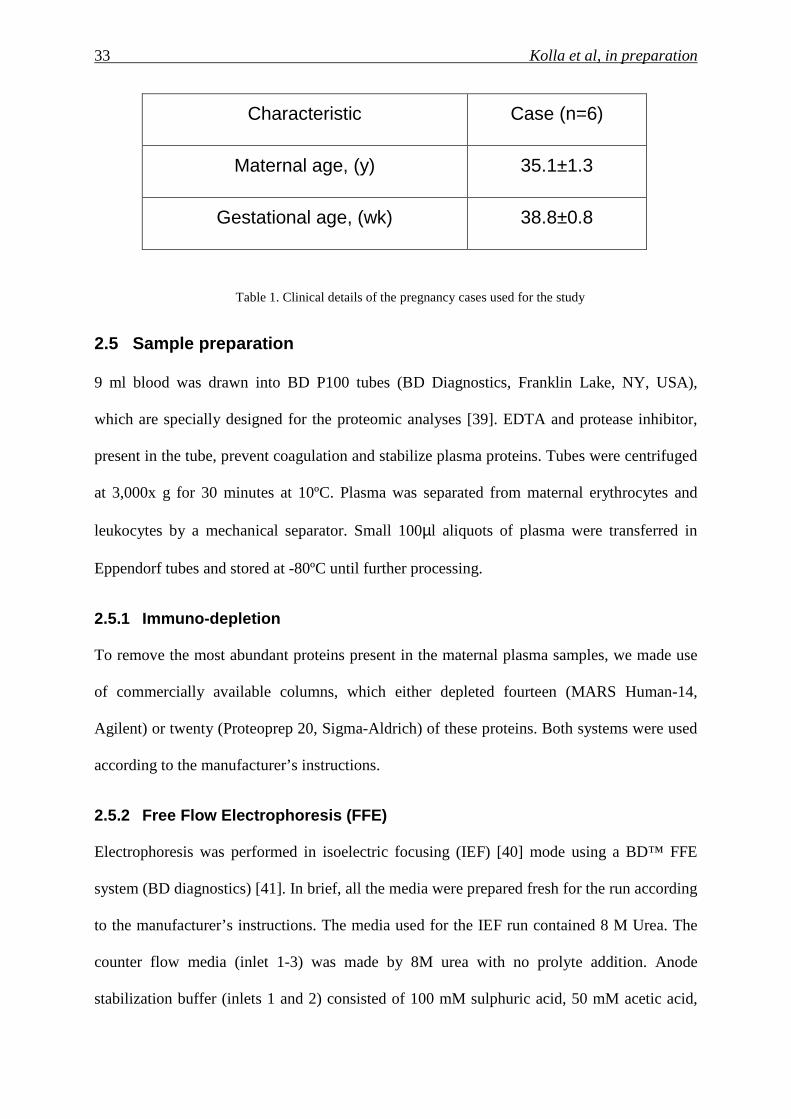
Characteristic Case (n=6)
Maternal age, (y) 35.1±1.3
Gestational age, (wk) 38.8±0.8
Table 1. Clinical details of the pregnancy cases used for the study
2.5 Sample preparation
9 ml blood was drawn into BD P100 tubes (BD Diagnostics, Franklin Lake, NY, USA),
which are specially designed for the proteomic analyses [39]. EDTA and protease inhibitor,
present in the tube, prevent coagulation and stabilize plasma proteins. Tubes were centrifuged
at 3,000x g for 30 minutes at 10ºC. Plasma was separated from maternal erythrocytes and
leukocytes by a mechanical separator. Small 100µl aliquots of plasma were transferred in
Eppendorf tubes and stored at -80ºC until further processing.
2.5.1 Immuno-depletion
To remove the most abundant proteins present in the maternal plasma samples, we made use
of commercially available columns, which either depleted fourteen (MARS Human-14,
Agilent) or twenty (Proteoprep 20, Sigma-Aldrich) of these proteins. Both systems were used
according to the manufacturer’s instructions.
2.5.2 Free Flow Electrophoresis (FFE)
Electrophoresis was performed in isoelectric focusing (IEF) [40] mode using a BD™ FFE
system (BD diagnostics) [41]. In brief, all the media were prepared fresh for the run according
to the manufacturer’s instructions. The media used for the IEF run contained 8 M Urea. The
counter flow media (inlet 1-3) was made by 8M urea with no prolyte addition. Anode
stabilization buffer (inlets 1 and 2) consisted of 100 mM sulphuric acid, 50 mM acetic acid,
34 Kolla et al, in preparation
100 mM DL-2aminobutytic acid and 30 mM glycyl-glycine; Depletion buffer 1 (inlet 3 and 5)
contained 29% of prolyte buffer 2 (BD Diagnostics); depletion buffer 2 contained 17%
prolyte buffer 2, 50 mM HEPES, and 42 mM 6-aminohexanoic acid; and cathodic
stabilization buffer (inlets 6 and 7) 100 mM sodium hydroxide, 30 mM ethanolamine, and 300
mM ß-alanin; anode and cathode electrode buffer contained 100 mM sulphuric acid and
sodium hydroxide respectively.
The instrument was operated in horizontal mode with a spacer of 0.4 mm and the filter paper
of 0.6 mm thickness. During entire depletion electrophoretic run the temperature was
maintained at 10ºC and the media flow rate was set at 60 ml/h, with a constant voltage of 700
V. Prior to electrophoresis, 500 ul of plasma was diluted ten times with the depletion buffer 2
and was introduced into the instrument from the sample port. After the fractionation, samples
were collected in a 96 well plate. About 2 ml of each fraction was collected. A volume of 500
ul of the each FFE fraction 24-33 was reduced in 10 mM TCEP for 60 min at 25ºC and
alkylated in the dark in 50 mM iodoacetic acid for the 60 min at 25ºC. The pH was adjusted to
7.8 with ammonium bicarbonate and the urea concentration was reduced to approximately 2
M using an ultra-filteration spin column Vivascience (Hannover, Germany).
2.5.3 Mass Spectroscopy analysis
The pooled FFE peptide fraction, as well as those from the immuno-depletion columns were
digested with trypsin (100 ng) at 37ºC for 16 h. Sep Pak™ C18 RP cartridges were used to
purify the peptides. The peptides were analysed by capillary liquid chromatography tandem
MS (LC/MS/MS) using a 300SB C-18 trap column (0.3x50mm) (Agilent Technologies,
Basel, Switzerland) connected to a 0.1 mm x 10 cm capillary separation column packed with
Magic C18 (5 µm particle diameter). The capillary column was connected to an Orbitrap FT
hybrid instrument (Thermo Finnigan, San Jose, CA, USA). A linear gradient from 2 to 60%
solvent B (0.1% acetic acid and 80% acetonitrile in water) in solvent A (0.1% acetic acid and
2% acetonitrile in water) in 85 min was delivered with a Rheos 2200 pump (Flux Instruments,
35 Kolla et al, in preparation
Basel, Switzerland) at a flow of 100 µl/min. A pre-column split was used to reduce the flow
to approximately 500 nl/min. 10 µl sample was injected with an autosampler, thermostated to
4°C onto the trap column for efficient desalting. The eluting peptides were ionized at 1.6 kV.
The mass spectrometer was operated in a data-dependent fashion so that peptide ions were
automatically selected for fragmentation by collision-induced dissociation (MS/MS) in the
Orbitrap. The MS/MS spectra were then searched against the data bank using TurboSequest
software [42].
2.6 Two-Dimensional Gel Electrophoresis
We performed the two dimensional electrophoresis on the immuno-depleted plasma, as well
as FFE depleted pooled fractions (24-33) using an ISODALT system. In this run, ampholine
pH 3-10 (Invitrogen) in the first dimension; and 11-19% linear acrlyamide gradient in the
second dimension was used. After electrophoresis the gels were stained with silver stain, and
then scanned by Pharmacia Image Scanner at 300 dpi, 16 bit [43].
2.7 Results
In this study we examined for differences in the maternal plasma proteome following deliver
via the use of shotgun proteomics. Samples were obtained from 6 cases with singleton
pregnancies, all of which were delivered by voluntary Caesarean section. Care was taken to
maintain the uniformity in the collection time for all the samples.
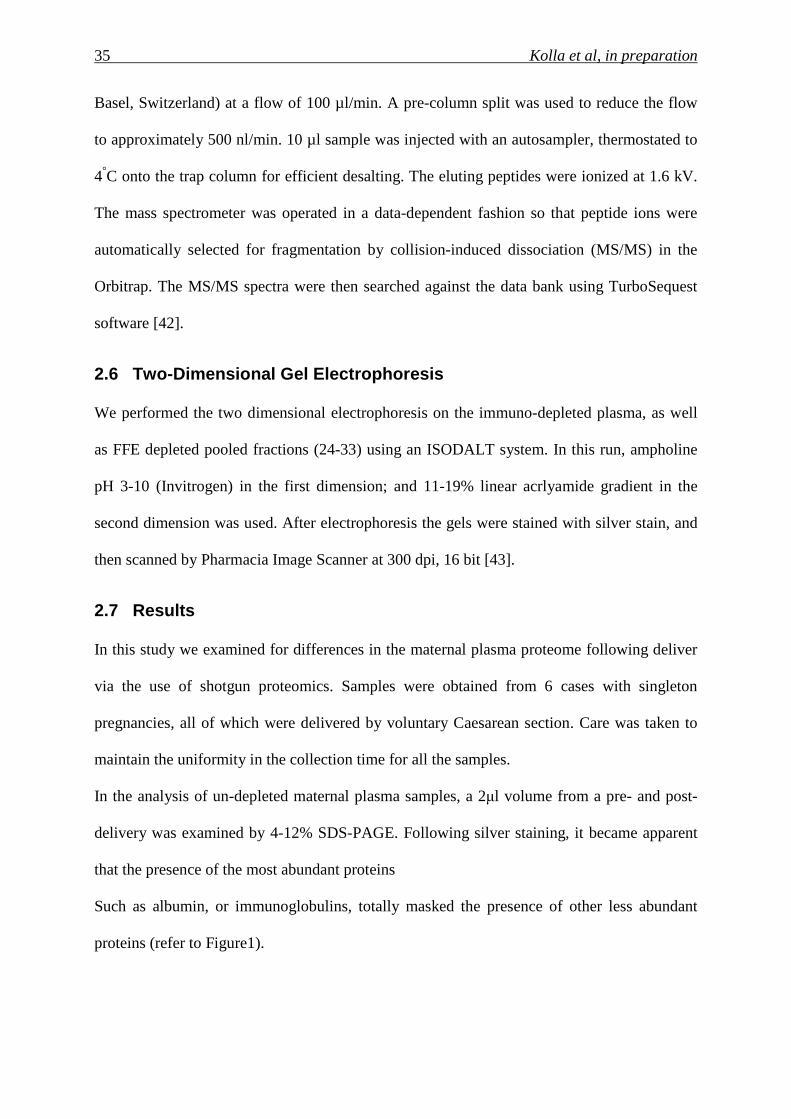
In the analysis of un-depleted maternal plasma samples, a 2µl volume from a pre- and post-
delivery was examined by 4-12% SDS-PAGE. Following silver staining, it became apparent
that the presence of the most abundant proteins
Such as albumin, or immunoglobulins, totally masked the presence of other less abundant
proteins (refer to Figure1).
36 Kolla et al, in preparation
Figure 1. Undepleted maternal plasma from (a) pre and (b) post delivery. A volume of 2µl was loaded on the 4-
12% SDS-PAGE. M represents the protein marker
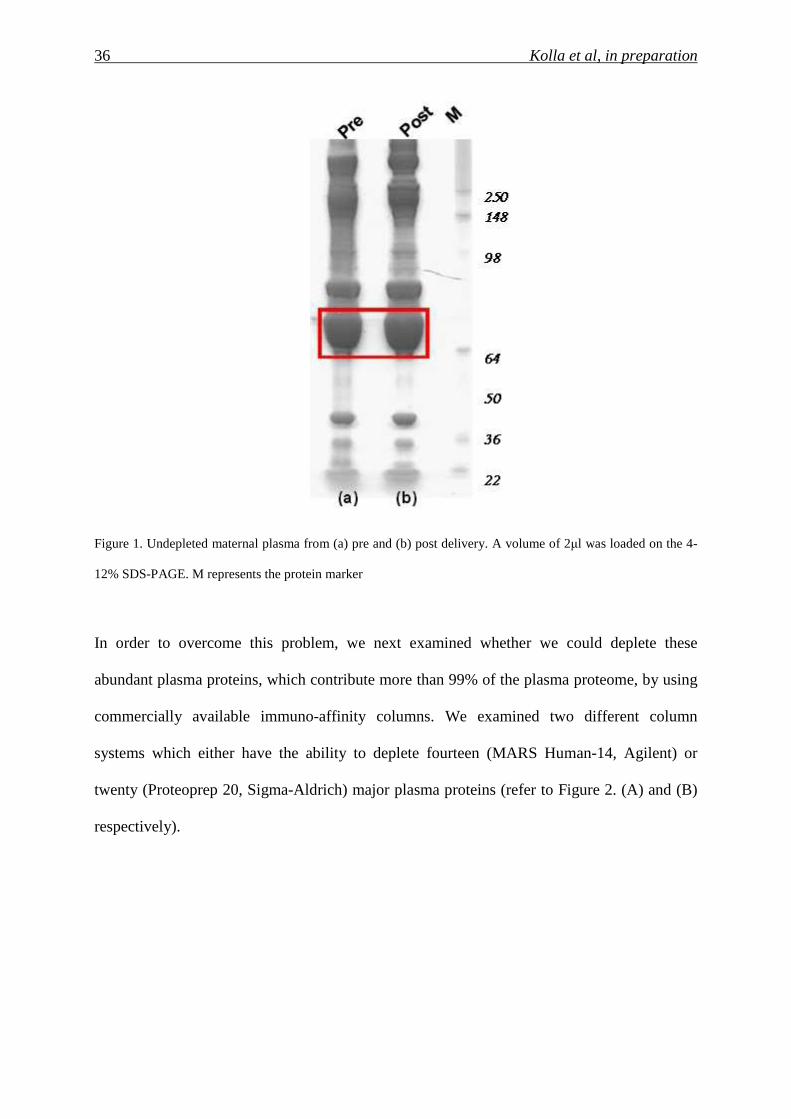
In order to overcome this problem, we next examined whether we could deplete these
abundant plasma proteins, which contribute more than 99% of the plasma proteome, by using
commercially available immuno-affinity columns. We examined two different column
systems which either have the ability to deplete fourteen (MARS Human-14, Agilent) or
twenty (Proteoprep 20, Sigma-Aldrich) major plasma proteins (refer to Figure 2. (A) and (B)
respectively).
37 Kolla et al, in preparation
Figure 2. Two dimensional electrophoresis of depleted maternal plasma was preformed in the ISODALT system.
After electrophoresis, the gels were sliver stained. (A) Depletion of fourteen major plasma protein.(MARS
Human-14, Agilent). (B) Depletion of twenty major plasma proteins (Proteoprep 20, Sigma-Aldrich).
We determined that although these immuno-depletion columns did permit reliable removal of
the most abundant plasma proteins, their use entailed a large number of washing steps which
resulted in low recovery of the desired placenta-derived proteins.
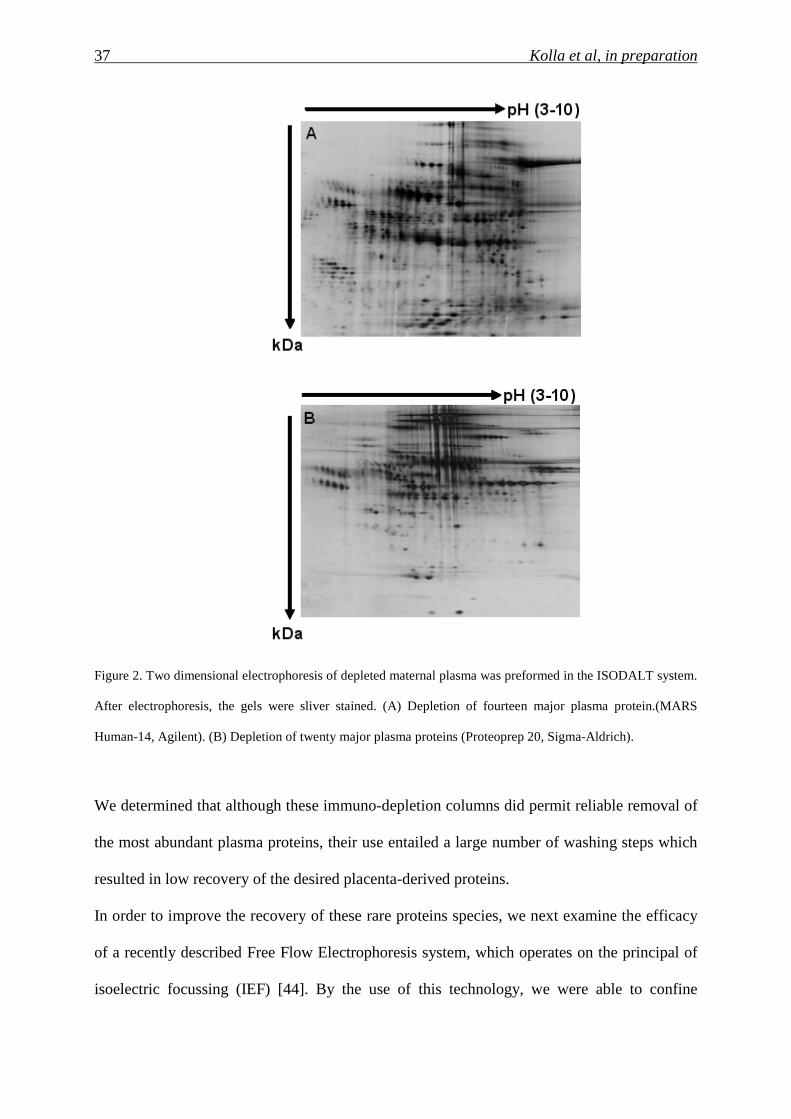
In order to improve the recovery of these rare proteins species, we next examine the efficacy
of a recently described Free Flow Electrophoresis system, which operates on the principal of
isoelectric focussing (IEF) [44]. By the use of this technology, we were able to confine
38 Kolla et al, in preparation
albumin into certain fractions (numbers 37-40), as is illustrated in Figure 3. The system was
used under denaturing conditions.
Figure 3. Separation of plasma using FFE protocol. SDS-PAGE (4-12%) analysis of the FFE fraction obtained
using the depletion protocol. Proteins were visualized by silver staining. Albumin has a molecular mass of
almost 50 kDa. A volume of 5 µl was loaded per FFE fraction. M indicates protein molecular weight marker.
39 Kolla et al, in preparation
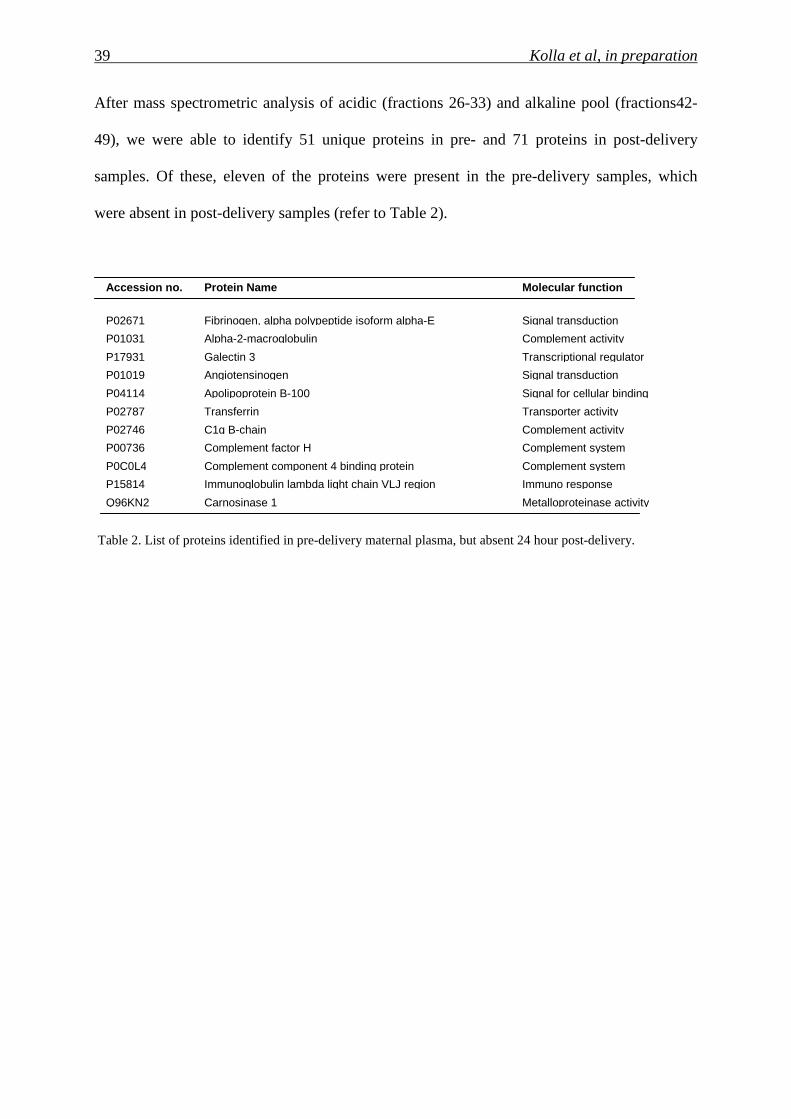
After mass spectrometric analysis of acidic (fractions 26-33) and alkaline pool (fractions42-
49), we were able to identify 51 unique proteins in pre- and 71 proteins in post-delivery
samples. Of these, eleven of the proteins were present in the pre-delivery samples, which
were absent in post-delivery samples (refer to Table 2).
Table 2. List of proteins identified in pre-delivery maternal plasma, but absent 24 hour post-delivery.
Metalloproteinase activity Carnosinase 1 Q96KN2 Immuno response Immunoglobulin lambda light chain VLJ region P15814 Complement system Complement component 4 binding protein P0C0L4 Complement system Complement factor H P00736 Complement activity C1q B-chain P02746 Transporter activity Transferrin P02787 Signal for cellular binding Apolipoprotein B-100 P04114 Signal transduction Angiotensinogen P01019 Transcriptional regulator Galectin 3 P17931 Complement activity Alpha-2-macroglobulin P01031 Signal transduction Fibrinogen, alpha polypeptide isoform alpha-E P02671
Molecular function
Protein Name
Accession no.

40 Kolla et al, in preparation
2.8 Discussion:
In this pilot study set out to examine whether changes in the maternal plasma proteome were
apparent following delivery (24 hr). In order to remove the most abundant proteins, such as
albumin, which mask the rare placentally-derived proteins from the maternal plasma sample
we tested two strategies. In the first we examined the use of two different commercially
available immuno-depletion columns, that either remove 14 (MARS Human-14, Agilent) or
twenty (Proteoprep 20, Sigma-Aldrich) of the major plasma proteins.
Our experience indicated that although though these immuno-depletion columns are
convenient to use, they do not permit optimal recovery or rare plasma proteins due to a large
number of washing steps.
In the second strategy we examined the use of a Free Flow Electrophoresis system. In our
experience this system permits a more optimal recovery of rare plasma proteins, as it permits
the effective removal of albumin, which constitutes almost 99% of the total plasma protein.
Furthermore, this system permits the fractionation of large plasma volumes (up to 3ml/h),
thereby permitting large-scale analyses.
A further advantage of the FFE system is that in the denaturing mode, it permits the recovery
of proteins which normally bind to albumin, and which would as such be removed by
methods relying on immuno-depletion. Consequently, it should permit the more optimal
recovery of rare proteins that would be achieved when using immuno-depletion strategies.
[45].
In our analysis of pre- and post delivery maternal plasma samples we were able to detect 11
proteins present in the former, but absent in the latter. Amongst the proteins we detected was
angiotensinogen (P01019) [46], which plays a physiological role in the regulation of
uteroplacental blood circulation. Alterations in the levels of this protein, as well as auto-
antibodies directed against the receptor have been implicated in the underlying aetiology
41 Kolla et al, in preparation
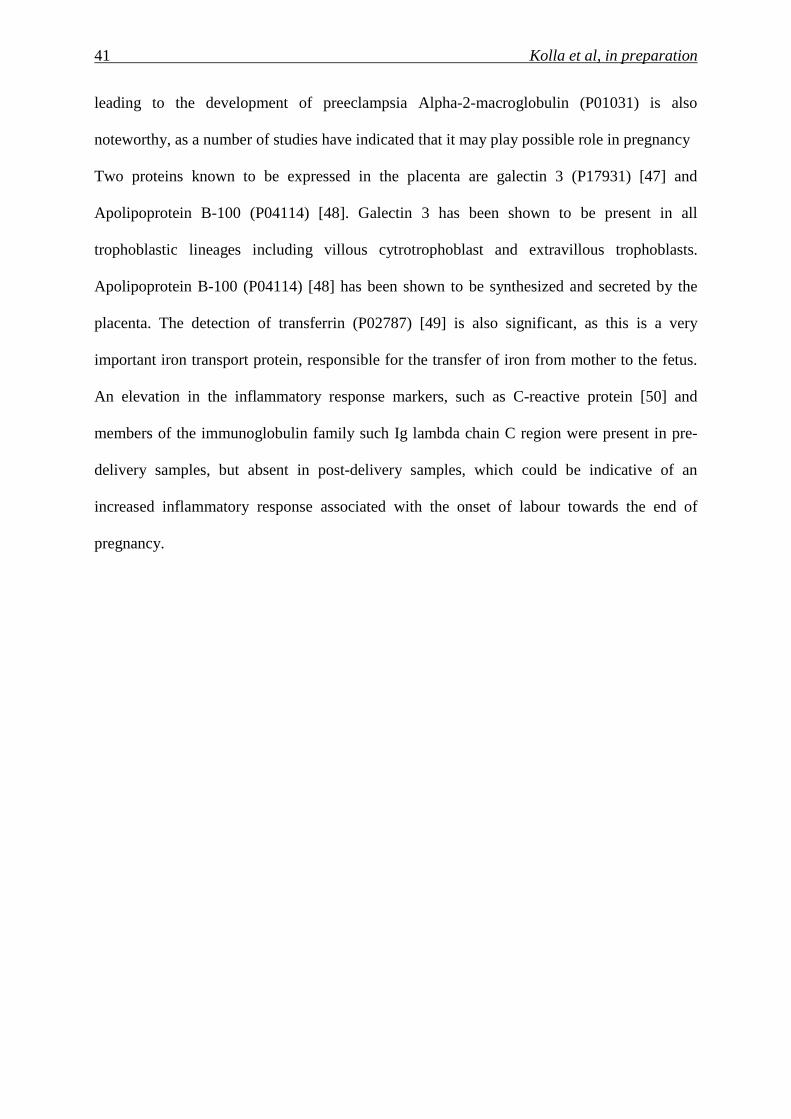
leading to the development of preeclampsia Alpha-2-macroglobulin (P01031) is also
noteworthy, as a number of studies have indicated that it may play possible role in pregnancy
Two proteins known to be expressed in the placenta are galectin 3 (P17931) [47] and
Apolipoprotein B-100 (P04114) [48]. Galectin 3 has been shown to be present in all
trophoblastic lineages including villous cytrotrophoblast and extravillous trophoblasts.
Apolipoprotein B-100 (P04114) [48] has been shown to be synthesized and secreted by the
placenta. The detection of transferrin (P02787) [49] is also significant, as this is a very
important iron transport protein, responsible for the transfer of iron from mother to the fetus.
An elevation in the inflammatory response markers, such as C-reactive protein [50] and
members of the immunoglobulin family such Ig lambda chain C region were present in pre-
delivery samples, but absent in post-delivery samples, which could be indicative of an
increased inflammatory response associated with the onset of labour towards the end of
pregnancy.
42 Kolla et al, in preparation
3 Quantitative proteomic (iTRAQ) analysis of 1 st trimester maternal plasma samples in pregnancies at risk for preeclampsia
Varaprasad Kolla1, Paul Jenö2, Suzette Moes2, Olav Lapaire1, Irene Hoesli1 and Sinuhe
Hahn1*
University Women’s Hospital/Department of Biomedicine, Basel, Switzerland
Biozentrum, University of Basel, Basel, Switzerland
* Address correspondence to:
Sinuhe Hahn PhD
Laboratory for Prenatal Medicine
University Women’s Hospital / Department of Biomedicine,
Hebelstrasse 20, CH 4031 Basel, Switzerland
Tel: ++41 61 265 9249
Fax: ++41 61 265 9399
E-mail: [email protected] / [email protected]
43 Kolla et al, in preparation
3.1 Abstract
A current major obstacle is that no reliable screening markers exist to detect pregnancies at
risk for preeclampsia. Quantitative proteomic analysis employing isobaric labelling (iTRAQ)
has been suggested to be suitable for the detection of potential plasma biomarkers, a feature
we recently verified in analysis of pregnancies with Down syndrome foetuses. We have now
examined whether this approach could yield biomarkers to screen pregnancies at risk for
preeclampsia. In our study, we used maternal plasma samples obtained at 12 weeks of
gestation, six from women who subsequently developed preeclampsia and six with
uncomplicated deliveries.
In our analysis, we observed elevations in 10 proteins in the preeclampsia study group when
compared to the healthy control group. These proteins included clusterin, fibrinogen,
fibronectin, angiotensinogen, increased levels of which are known to be associated with
preeclampsia. An elevation in the immune-modulatory molecule, galectin 3 binding protein,
was also noted. Our pilot study, therefore, indicates that quantitative proteomic iTRAQ
analysis could be a useful tool for the detection of new preeclampsia screening markers.
Key words: iTRAQ (Isobaric Tags for Relative and Absolute Quantitation), preeclampsia,
maternal plasma, biomarker, screening.
44 Kolla et al, in preparation
3.2 Introduction
Preeclampsia is a major health concern, as it is a leading cause of fetal and maternal mortality
and morbidity, worldwide. A major clinical deficit is that no reliable screening markers exist
to detect at-risk pregnancies, thereby offering no opportunity for intervening therapies prior to
the onset of symptoms. This is especially relevant for severe cases of early onset forms of the
disorder, resulting in the delivery of premature babies, who are frequently affected by intra-
uterine growth retardation.
It is widely accepted that the underlying aetiology of this enigmatic disorder, characterised by
sudden hypertension in previously normotensive pregnant women, involves the placenta. In
this context, the placentae of early onset preeclampsia are usually characterised by
abnormalities in trophoblast differentiation, lack of modification of the maternal spiral arteries
and ill-defined villous structure.
Recent studies have indicated that the clinical symptoms, such as hypertension and
proteinuria, are largely brought about by alterations in the levels of angiogenic factors
produced by the placenta such as placental growth factor (PIGF), vascular endothelial growth
factor (VEGF), soluble Flt-1 and endoglin [51] Although alterations in the levels of these
cytokines do precede the onset of clinical symptoms, it is not clear how effective they will be
as screening markers, as these changes occur relatively late in gestation.
A considerable effort in prenatal medicine is being devoted to the development of efficacious
first trimester screening tools, to detect pregnancies at risk for fetal aneuploidies, but also
pregnancy-related disorders such as preeclampsia, as this would permit sufficient time for
intervention. In this regard, quantitative changes at 11-14 weeks of pregnancy in proteins such
as ADAM-12 [52], PP-13 (placental protein -13) [53, 54], pregnancy-associated plasma
protein-A (PAPP-A) in combination with Doppler ultrasound, have been shown to posses
some predictive value in detecting cases at risk for preeclampsia [32].

45 Kolla et al, in preparation
Since the aetiological cascade leading to the development of manifest preeclampsia is multi-
factorial, it is very unlikely that a single molecule (or small group of analytes) will possess
sufficient sensitivity and specificity. Hence, new strategies will need to be explored in order
to increase the pool of biomarker candidates.
One such route is by proteomic analysis of the maternal plasma proteome. The underling
rationale for such investigations is that as the placenta is in direct contact with the maternal
circulation, proteins released by it should be detectable in maternal plasma. Since
preeclampsia is associated with structural placental anomalies, the underlying alterations in
protein expression should be reflected in plasma proteome. Consequently, this serve as a
promising route for the detection of biomarkers indicative of abnormal placentation [55]
Consequently, a number of studies have been carried out under this premise, and have shown
that alterations in protein expression are evident maternal serum or plasma of affected
pregnancies. Unfortunately the validity of these studies is limited, as they were performed on
samples obtained from cases with manifest symptoms, and furthermore, did not employ state-
of-the-art quantitative approaches permitting precise assessment of the extent of up- or down-
regulation of the newly discovered markers.
A further limitation in these studies is the extremely complex nature of the plasma / serum
proteome, whereby low abundance proteins are masked by the preponderance of a small
number of highly abundant plasma proteins. In addition, the high dynamic range of the
plasma proteome precludes the use of conventional proteomic strategies employing gel
electrophoresis, even when making use of fluorescent labelling e.g. DIGE (Difference Gel
Electrophoresis). Hence, the identification of new biomarkers in plasma/serum by
conventional proteomic approaches is not very feasible.
A method that has been proposed to largely overcome these deficits is isobaric labelling
(iTRAQ: Isobaric Tags for Absolute and Relative Quantitation) coupled with MALDI
TOF/TOF analysis. In this approach, the plasma peptides, following trypsin digestion, are
46 Kolla et al, in preparation
chemically labelled with a discrete set of isotopes via an amine-tagging reagent. These isotope
tags permit ready discrimination by mass spectrometry, thereby permitting comparative
quantification to a reference sample in a multiplex manner. To date, most applications have
made use of commercial 4-plex reagents, but 8-plex reagents are becoming available. By the
use of these different isobaric tags, it is possible to examine 4 or 8 different samples in a
single mass spectrometric analysis.
Since this method has been shown to permit highly reproducible comparative assessment of
tagged peptides, it has been suggested to be suitable for the discovery of biomarkers in
complex body fluid PE such as plasma. In a recent study we have shown that the iTRAQ
isobaric labelling approach may indeed be valid for the detection of biomarkers for pregnancy
related conditions, such as fetuses with Down syndrome, in that we were able to discern
quantitative alterations in known screening markers such as βhCG [56].
Confident by the validity of the iTRAQ methodology, we have now in a pilot experiment
investigated whether this approach could be suitable for the detection of biomarkers useful for
determining pregnancies at risk for preeclampsia. In this study we examined 12 maternal
plasma samples obtained at 12 weeks of pregnancy, of which 6 cases subsequently developed
preeclampsia, while 6 cases had uncomplicated deliveries.
Maternal plasma peptides were examined by 4-plex iTRAQ labelling in conjunction with a
4800 MALDI TOF/TOF analysis. Our results indicate that quantitative differences can be
already being detected in the first trimester of pregnancy between pregnancies which
subsequently developed preeclampsia and those which had normal healthy outcome.
47 Kolla et al, in preparation
3.3 Materials and Methods
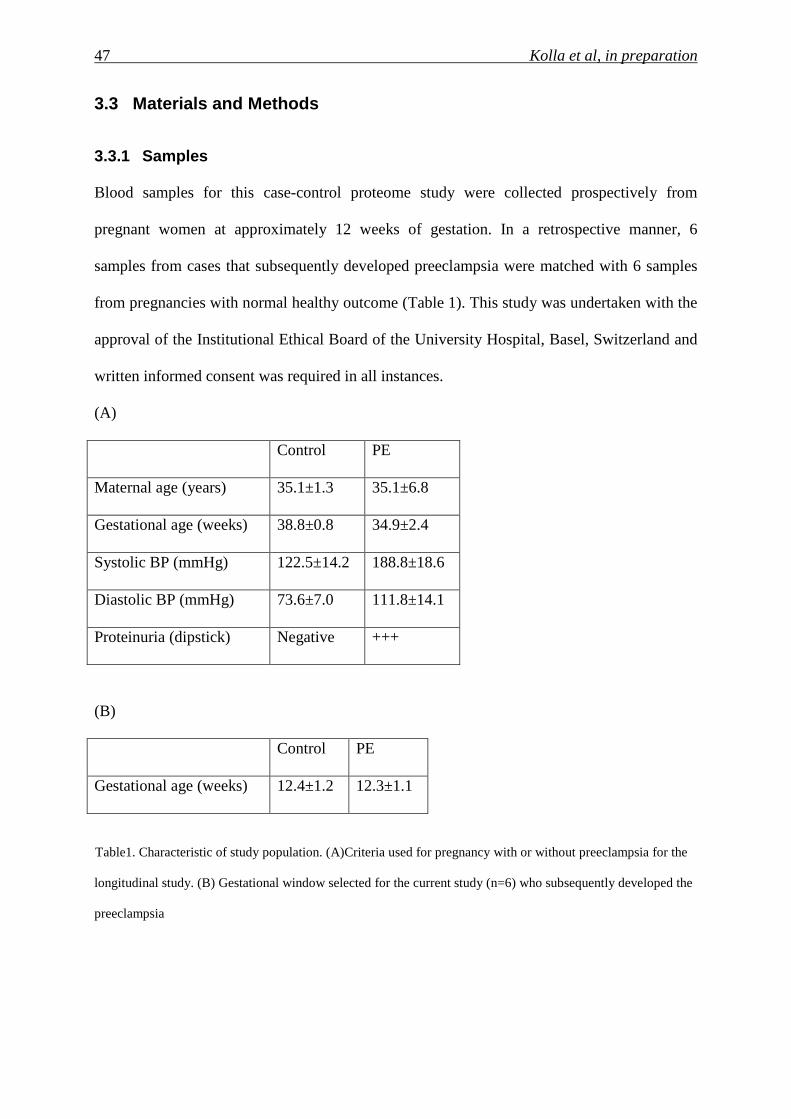
3.3.1 Samples
Blood samples for this case-control proteome study were collected prospectively from
pregnant women at approximately 12 weeks of gestation. In a retrospective manner, 6
samples from cases that subsequently developed preeclampsia were matched with 6 samples
from pregnancies with normal healthy outcome (Table 1). This study was undertaken with the
approval of the Institutional Ethical Board of the University Hospital, Basel, Switzerland and
written informed consent was required in all instances.
(A)
Control PE
Maternal age (years) 35.1±1.3 35.1±6.8
Gestational age (weeks) 38.8±0.8 34.9±2.4
Systolic BP (mmHg) 122.5±14.2 188.8±18.6
Diastolic BP (mmHg) 73.6±7.0 111.8±14.1
Proteinuria (dipstick) Negative +++
(B)
Control PE
Gestational age (weeks) 12.4±1.2 12.3±1.1
Table1. Characteristic of study population. (A)Criteria used for pregnancy with or without preeclampsia for the
longitudinal study. (B) Gestational window selected for the current study (n=6) who subsequently developed the
preeclampsia
48 Kolla et al, in preparation
3.3.2 Sample preparation
As described previously, 9 ml blood was drawn into BD P100 tubes (BD Diagnostics,
Franklin Lake, NY, USA), which are specially designed for proteomics experiments, in that
the EDTA (Ethylenediaminetetraacetic acid) and protease inhibitor present in the tube prevent
coagulation and stabilize the plasma proteome. Following phlebotomy the samples were
centrifuged at 3,000x g for 30 minutes at 10ºC, whereby the plasma was separated from the
cellular fraction by aid of a mechanical separator100µl aliquots were stored at -80ºC until
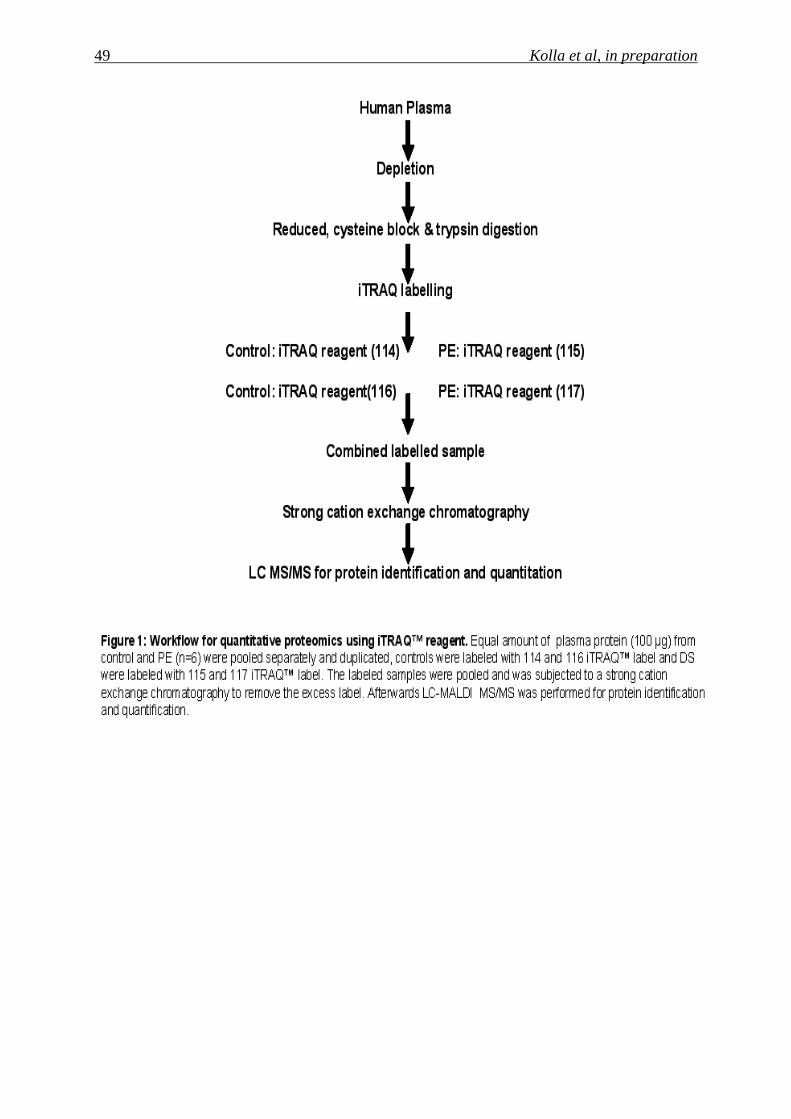
further use. For an overview of the work-flow used in this analysis refer to Figure 1.
49 Kolla et al, in preparation
50 Kolla et al, in preparation
3.3.3 Immuno-depletion of High-Abundance Plasma Pro teins
Highly abundant plasma proteins were depleted using ProteoMiner™Protein Enrichment Kit
(Bio-Rad Laboratories, Inc.), as per the manufacturer’s instructions. 1 ml of plasma was used
for the depletion and after the whole procedure, 300 µl was eluted in elution reagent. After
depletion protein concentration was measured by using RC-DC Protein assay kit (Bio-Rad
Laboratories, Inc.)
3.3.4 Tryptic digestion and iTRAQ™ Reagent labellin g
Equal amounts (100 µg) of depleted plasma protein from six of the PE cases and controls
were pooled separately in duplicate for the iTRAQ labelling. These samples were denatured
with 2% SPE in 500mM triethylammonium bicarbonate (TEAB) (Sigma-Aldrich) for 15
minutes at room temperature, following which they were reduced with 2µl of 50mM tri-(2-
carboxyethyl) phosphine (TCEP) (Sigma-Aldrich) at 60°C for 1h and were then alkylated
with 10mM s-Methylmethanethisulfonate (MMTS) for 10 minutes in room temperature. After
alkylation, the proteins were digested overnight at 37ºC with 1U/µl trypsin (TPCK treated)
(Applied Biosystems, Foster City, CA 94404, USA). Peptides were labelled with one unit of
iTRAQ™ Reagent Multi-plex kit (Applied Biosystems, Foster City, CA 94404, USA) that
was reconstituted in 70 µl of ethanol. iTRAQ labels 114, 116 were used separately for
labelling the pooled duplicated control sample and 115, 117 were used separately to label the
pooled duplicate preeclampsia samples. The iTRAQ labelling reagent solution was added to
the digest and incubated for 1h at room temperature. To assess the accuracy of the ratiometric
quantitation of iTRAQ reagent a split in signal was performed and the data was corrected as
described in detail by Unwin and colleague [57].

51 Kolla et al, in preparation
3.3.5 Strong cation exchange chromatography (SCX)
Strong cation exchange chromatography was preformed to remove the excess iTRAQ reagent
and interfering substances for the mass analysis. Dried peptides were resuspended in 200 ml
of Buffer A and were loaded on Poly Sulfoethyl A Column (200 mm length x 4.6 id, 5 µm
particle size, 200 Ǻ pore size) on a BioLC HPLC unit (Dionex). Buffer A consisted of 10mM
KHPO4 and 25% acetonitrile, 500 mM KCl, pH 3.0, and Buffer B consisted of 10mM
KH2PO4, 25% acetonitrile, and 500 mM KCl pH 3.0. The 60 min gradient comprised of 100%
Buffer A for 5min, 5-30% Buffer B for 40 min, 30-100% Buffer B for 5min, 100% Buffer B
for 5 min, and finally 100% Buffer A for 5 min. Ten fractions were collected using a Foxy Jr.
Fraction Collector (Dionex). Subsequently, these fractions were pooled according to the
chromatogram profile based on the peak intensity and the products dried in a vacuum
concentrator, after which they were stored at -20ºC prior to mass spectrometric analysis.
3.3.6 Nano LC MALDI
The dried SCX iTRAQ-labeled peptides were dissolved in Buffer A which consist of 95%
H2O, 5% acetonitrile, 0.1 % TFA and were loaded on C18 trap column (1mm x 300um i.d.
column) at 30 ul/min and separated on an analytical column (150 mm x 100 um i.d. column)
at 500 nL/min using the LC-packing Ultimate system. The peptides were separated using a
linearly increasing concentration of acetonitrile in Buffer B from 5% to 30% in 120 min, and
from 30% to 60% in 40 min. The elute was mixed with matrix (2 mg/ml alpha-cyano-4-
hydroxycinnamic acid in 80% acetonitrile, 0.1% TFA) at a flow rate of 800 nl/min and
deposited on an Opti-TOF LC/MALDI (Applied Biosystems) plate in 10S fractions, using an
automatic robot, (Probot,Dionex).
52 Kolla et al, in preparation
3.3.7 MS and MS/MS
The Mass spectrometer 4800 plus MALDI TOF/TOF™ Analyzer (Applied Biosystems) was
set to perform data acquisition in positive ion mode. An MS condition of 1000 shots per
spectrum was used. Monoisotopic precursor selection for MS/MS was done by automatic
precursor selection using an interpretation method using the12 most intense peaks per spot
with an MS/MS mode condition of 4000 laser shots per spectrum. Minimum peak width was
one fraction and mass tolerance was 80 ppm. Adduct tolerance (m/z) +/- 0.003. MSMS was
done with a gas pressure of 2x10⁻² bar in the collision cell Air was used as collision gas.
Protein Identification and Database Searches:
Protein identification and quantification was done by using the ProteinPiolt™ software v2.0
(Applied Biosystems; MPE-Sciex). The search was performed against the Human database of
UniProtKB/Swiss-Prot (Version 3.50) from the EBI website
(www.ebi.ac.uk./IPI/IPIhelp.html) and concatenated target-decoy database search strategy
was used to check the false positive rate [58] in our case it was found to be 0%, which
boosted the reliability of our data.
3.3.8 Relative quantitation criteria:
The Paragon algorithm [17, 59] in ProteinPiolt v2.0 software was used as the default search
program with digestion enzyme set as trypsin and methyl methanethiosulfonate as cysteine
modification. The search also included the possibility of more than eighty biological
modifications and amino acid substitution of up to two substitutions per peptide using the
BLOSUM 62 matrix. Data was normalized for loading error by bias correction calculated
with Progroup algorithm identified proteins with at least 95% confidence and with a
ProtScore of 1.3, were reported. The results obtained from ProteinPilot software v2.0 software
were exported to Microsoft Excel for the further analysis. The study was performed in double
duplex manner, where PE samples were labelled with 115 and 117; control was labelled with
114 and 116. Peptides were selected based on the criteria defined in the protein pilot software,

53 Kolla et al, in preparation
which means all the peptides were included for quantitation with an exception for those
without an iTRAQ modification or reporter ion, an area count less then 40 and peptides with p
value less then 0.001 were excluded [60]. As described by Gan and colleague in their study on
estimation of relative quantitative ratio from iTRAQ experiments, we also used only peptides
above or equal to 70 % confidence level for the estimation of relative quantitation [61].
3.3.9 PANTHER analysis:
The PANTHER database was used to elucidate the molecular function, biological process and
signalling pathway associated with each individual protein
(http://panther.appliedbiosystems.com)
54 Kolla et al, in preparation
3.4 Results
Samples were obtained from 6 cases with subsequent preeclampsia and 6 samples from
normal healthy deliveries. Care was taken to match both maternal and gestational age, to rule
out any confounding influence of these two parameters.
Low abundant plasma proteins were enriched by using ProteoMiner™Protein Enrichment Kit.
This was accomplished through the use of a large, highly diverse bead-based library of
combinatorial peptide ligands. When plasma was applied to the beads, a small fraction of the
high abundance proteins saturated their high affinity ligands and the excess high abundance
proteins were washed away. In addition a very small amount of high abundance proteins and
low abundance proteins were concentrated on their specific affinity ligands. This provides for
a significant enrichment of medium and low abundant plasma proteins.
The samples were pooled separately in and duplicate in order to have more precise analytical
replicate measurements. The iTRAQ analysis was done in double duplex style, the PE
samples were labelled with iTRAQ 115 and 117 and the control samples with iTRAQ 114 and
116, using the work-flow illustrated in Figure.1.
Following tandem MS MS, and by focussing on iTRAQ reporter ions in low molecular mass
range (114-117Da) for quantification, we identified 200 proteins with ≥ 95% confidence.
However, after manually rechecking the MS/MS data thoroughly peak by peak, only 167 out
of 200 proteins (83.5%) had a relative quantitation derived from the analysis of two or more
peptides, while for 30 proteins, the quantitation was based on single peptide. For 3 proteins no
quantitation could be ascertained by analysis using Protein Pilot. Figure.2 shows the MSMS
spectrum of the precursor ([M+H] +, m/z 1259.67 Da). In low mass region the reporter ions,
are seen while the where area under of the curve was used for quantification.
55 Kolla et al, in preparation
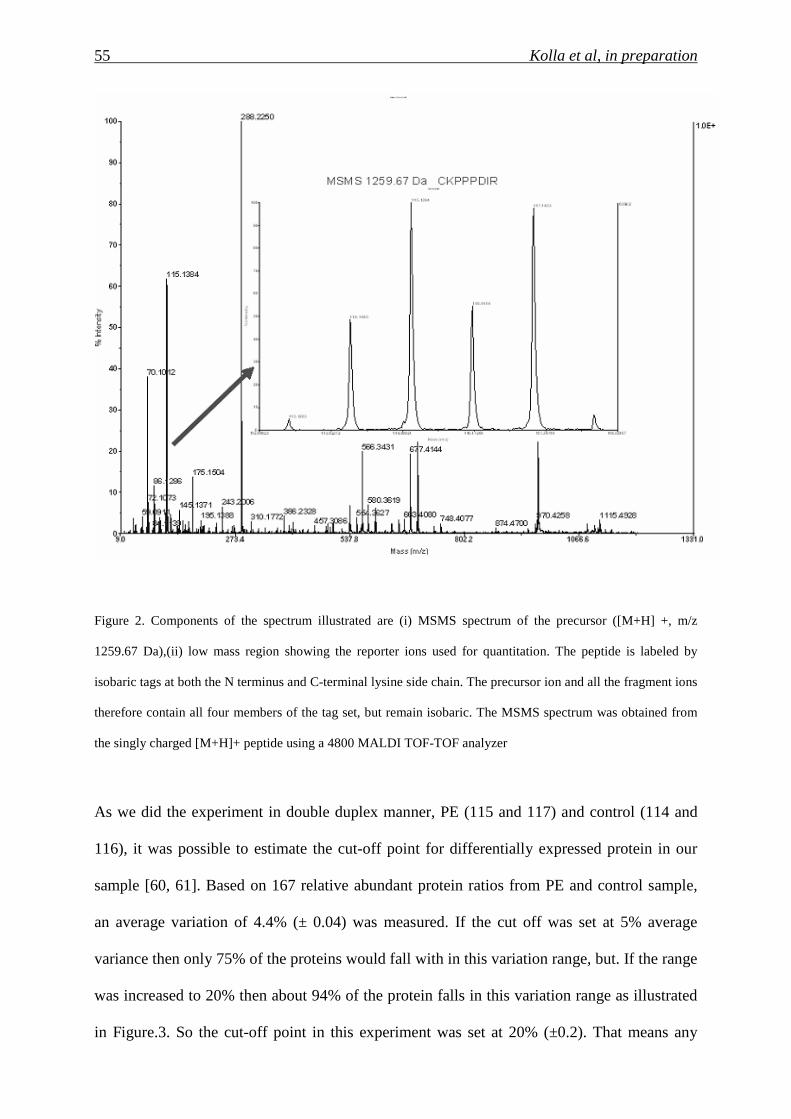
Figure 2. Components of the spectrum illustrated are (i) MSMS spectrum of the precursor ([M+H] +, m/z
1259.67 Da),(ii) low mass region showing the reporter ions used for quantitation. The peptide is labeled by
isobaric tags at both the N terminus and C-terminal lysine side chain. The precursor ion and all the fragment ions
therefore contain all four members of the tag set, but remain isobaric. The MSMS spectrum was obtained from
the singly charged [M+H]+ peptide using a 4800 MALDI TOF-TOF analyzer
As we did the experiment in double duplex manner, PE (115 and 117) and control (114 and
116), it was possible to estimate the cut-off point for differentially expressed protein in our
sample [60, 61]. Based on 167 relative abundant protein ratios from PE and control sample,
an average variation of 4.4% (± 0.04) was measured. If the cut off was set at 5% average
variance then only 75% of the proteins would fall with in this variation range, but. If the range
was increased to 20% then about 94% of the protein falls in this variation range as illustrated
in Figure.3. So the cut-off point in this experiment was set at 20% (±0.2). That means any
56 Kolla et al, in preparation
relative change in protein ratio below or above ± 1.2 fold was considered as differentially
under or over expressed.
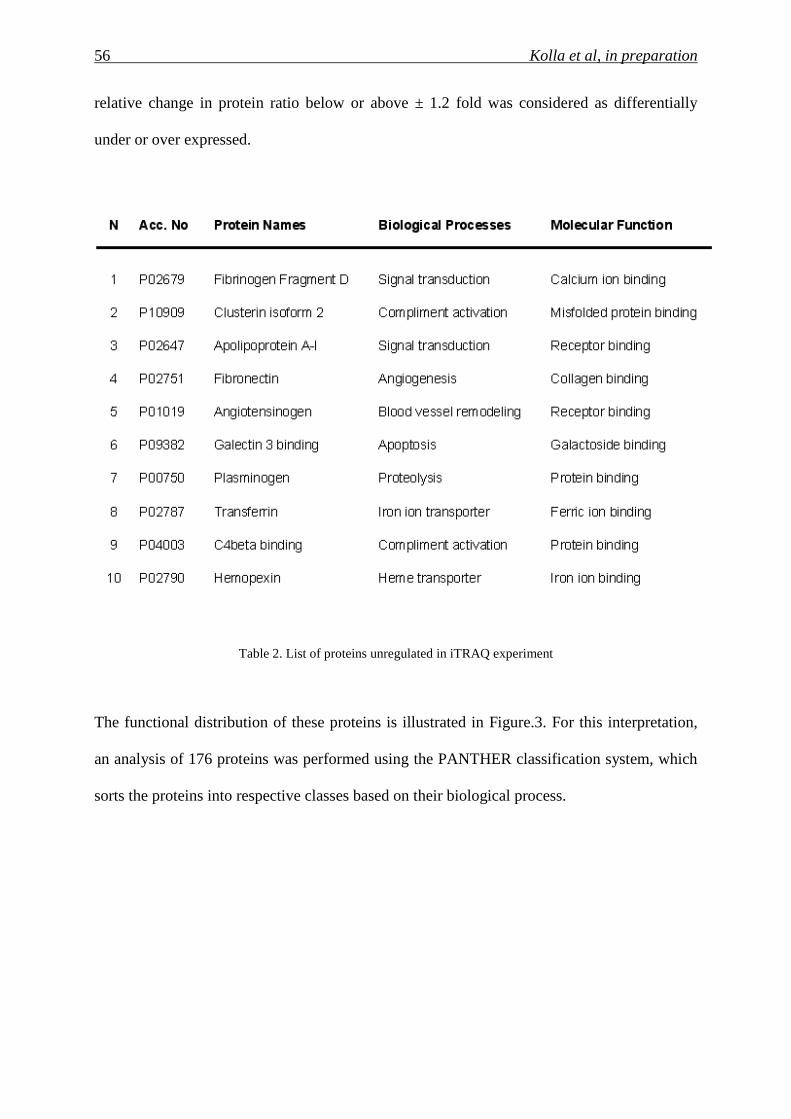
Table 2. List of proteins unregulated in iTRAQ experiment
The functional distribution of these proteins is illustrated in Figure.3. For this interpretation,
an analysis of 176 proteins was performed using the PANTHER classification system, which
sorts the proteins into respective classes based on their biological process.
57 Kolla et al, in preparation
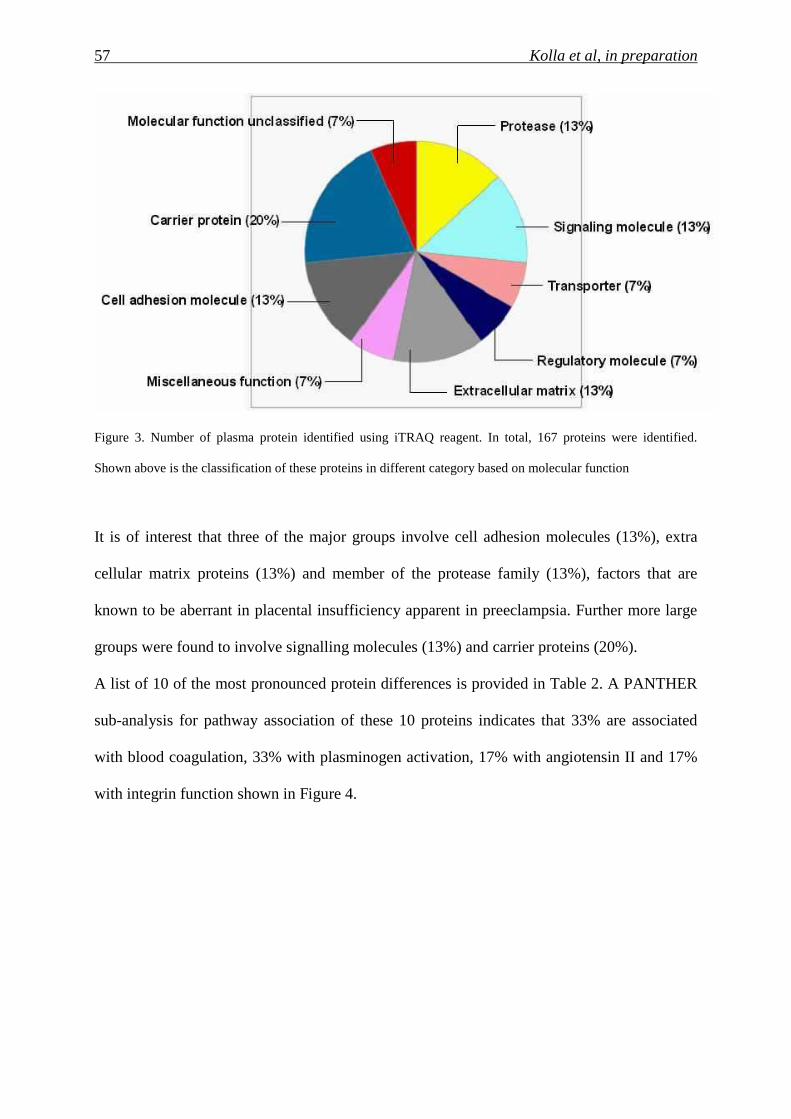
Figure 3. Number of plasma protein identified using iTRAQ reagent. In total, 167 proteins were identified.
Shown above is the classification of these proteins in different category based on molecular function
It is of interest that three of the major groups involve cell adhesion molecules (13%), extra
cellular matrix proteins (13%) and member of the protease family (13%), factors that are
known to be aberrant in placental insufficiency apparent in preeclampsia. Further more large
groups were found to involve signalling molecules (13%) and carrier proteins (20%).
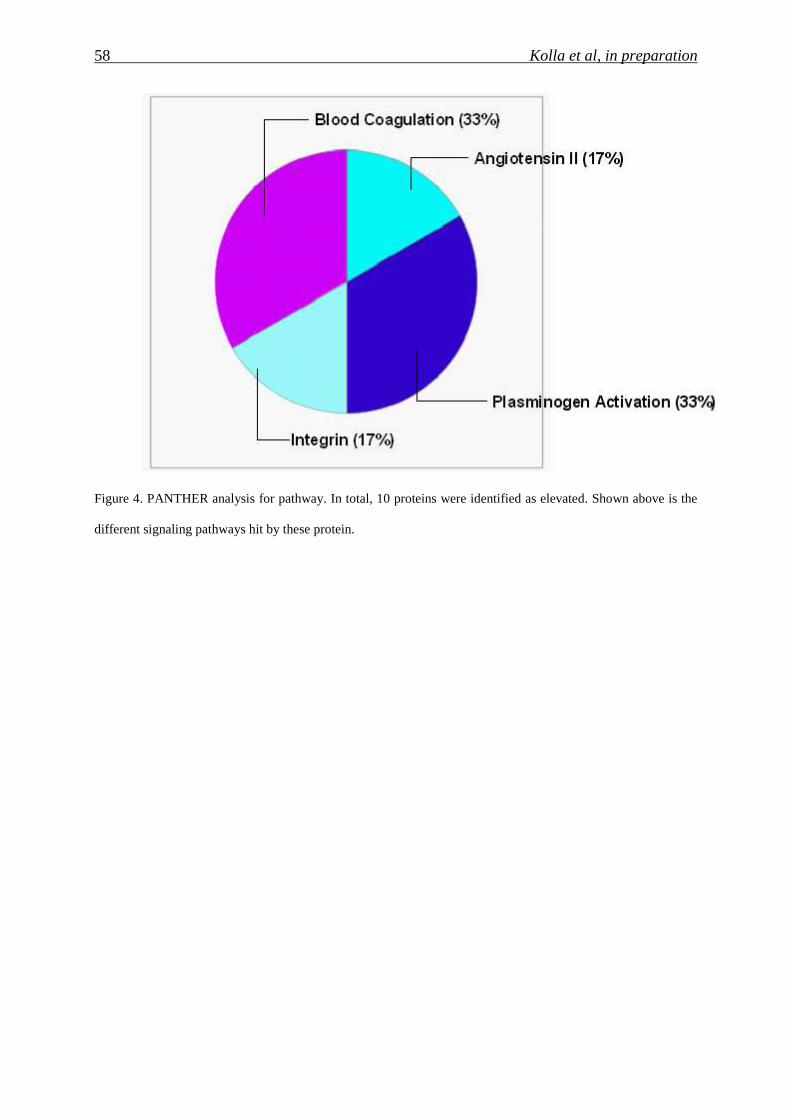
A list of 10 of the most pronounced protein differences is provided in Table 2. A PANTHER
sub-analysis for pathway association of these 10 proteins indicates that 33% are associated
with blood coagulation, 33% with plasminogen activation, 17% with angiotensin II and 17%
with integrin function shown in Figure 4.
58 Kolla et al, in preparation
Figure 4. PANTHER analysis for pathway. In total, 10 proteins were identified as elevated. Shown above is the
different signaling pathways hit by these protein.
59 Kolla et al, in preparation
3.5 Discussion:
The comparative quantitative assessment of serum or plasma proteins via iTRAQ isobaric
labelling combined with MALDI-TOF/TOF analysis has suggested to be suitable for the
detection of biomarkers. This is largely due to the highly reproducible nature of the system,
which exhibits little run-to-run variation, determined after a lengthy comparison of pooled
and individual of case and control samples, yielding a coefficient of variation of 11.7% [20].
In a previous proof-of- principle study, we examined whether this approach was suitable for
the detection of screening markers that could be sued to screen for pregnancies with a Down
syndrome fetus [56]. This analysis indicated that this approach may indeed be valid, as we
were capable of detecting known screening markers, since βhCG was determined to amongst
pool of elevated proteins.
In a preliminary proof-of-principle experiment, we have now assessed whether this method
could be suitable for the detection of biomarkers useful for PE screening. From our small-
scale preliminary evaluation we identified over 10 proteins whose concentration was altered
in the plasma of pregnancies with a PE compared to those with normal pregnancies.
It is of interest that glycoprotein clustrine isoform 2 was found elevated in our study. In one of
the recent study Blumenstein and colleague [62] has also seen the elevation in isoform of
clusterin. Other protein like angiotensinogen, which is was reported in PE to be elevated. The
presence of this important screening marker in our pool of elevated plasma proteins suggests
that the strategy we have chosen for the identification of new biomarkers is functional and
worthy of further pursuit.
That our assay is indeed detecting proteins of placental origin is illustrated by presence of
galectin 3which is a glycoprotein and derive its importance in pregnancy by playing potential
role in preventing the attack from maternal immune system on the developing fetus which can
be seen as foreign allograft [63]. This protein was amongst our list of up-regulated proteins,
60 Kolla et al, in preparation
apolipoprotein E3 isoform. The altered production of apoE3 in PE might impair reverse
cholesterol transport contributing to arterial damage [64].
Elevations in a number of inflammatory molecules C4 beta and fibronectin, most of which are
probably of maternal origin, may be a reflection of the elevated release of placental debris
which has been suggested to occur in pregnancies with PE. Williams and colleague has
reported the elevation of and fibrinogen in PE cases [65].
In our follow up studies we would like to validate these putative biomarkers using
immunoblot and Enzyme linked immunosorbent assay (ELISA). More recently Selected
Reaction Monitoring (SRM) has evolved as a method of choice for validation of biomarkers
using mass spectroscopy.
The increasing popularity of the iTRAQ approach due to its reproducibility and robustness,
including studies for cancer or inflammatory autoimmune disorder specific biomarkers
suggests that it will become the method of choice for future studies, until it is surpassed by a
new technical development. As pregnancy represents a unique constellation, whereby a
foreign being is supported and nourished by the host, it may serve as an ideal model for
proteomic analyses, as any unique markers should ideally disappear post delivery.
Furthermore, as very few specific biomarkers exist to assist with the screening of a number of
pregnancy related disorders, especially preeclampsia or preterm labour, it is likely that this
will become the focus of considerable research attention in the near future.
3.6 Conclusion:
In this report we conclude, isobaric labelling technique is a suitable approach for the
quantitative detection of new screening biomarkers in the plasma of pregnancies with a PE
compared to those with normal. In this preliminary proof-of-principle study, we were able to
detect quantitatively under or over expressed proteins. In the future additional studies, using

61 Kolla et al, in preparation
larger sample sizes will be required to identify a panel of biomarkers which can be used in
screening for PE pregnancies.
Acknowledgment:
We thank Vivian Kiefer for her technical assistance and Prof. E. Palmer and Dr. D. Huang for
the proof reading of the manuscript. This study was supported by PREGENESYS (ref.no.
37244), Sixth Frame Work (FP6) grant.

63 Kolla et al, in preparation
4 Examination of the 1 st trimester maternal plasma proteome by SELDI in pregnancies at risk for Preeclampsia
Varaprasad Kolla1, Narashima K2, Olav Lapaire1, Irene Hoesli1, Mahesh Choolani2 and
Sinuhe Hahn1, 2*,
1. University Women’s Hospital/Department of Biomedicine, Basel, Switzerland
2. Biomarker Discovery Laboratory, Department of Obstetrics and Gynaecology,
National University of Singapore, Singapore
64 Kolla et al, in preparation
4.1 Abstract
4.1.1 Background
Currently no reliable 1st trimester screening method exists to detect for pregnancies which
will develop preeclampsia. This deficit makes it difficult to develop appropriate intervention
strategies. As the underlying placental aetiology leading to the development of preeclampsia
is thought to occur early during gestation, we hypothesised that such changes may already be
evident in the maternal plasma proteome. Hence, such unique proteomic fingerprints could be
used to distinguish between pregnancies with healthy deliveries form those which developed
preeclampsia. For this purpose we investigated the use of Surface-Enhanced Laser
Desorption/Ionization Time-of-Flight mass spectrometry (SELDI-TOF-MS) SELDI.
4.1.2 Results
Unique spectral profiles were generated using SELDI-TOF-MS.A total of 8 peaks
corresponding to peptides and proteins in the range between 3.2 kDa and 22.2 kDa were
identified from a set of 26,707 representing the whole spectral analysis (0 to 60 kDa), were
identified which could discriminate pregnancies with normal deliveries to those which
developed preeclampsia.
4.1.3 Conclusion
Maternal plasma proteome fingerprinting by SELDI-TOF MS may lead to the development of
a set of markers which can be used in discern pregnancies at risk for preeclampsia.
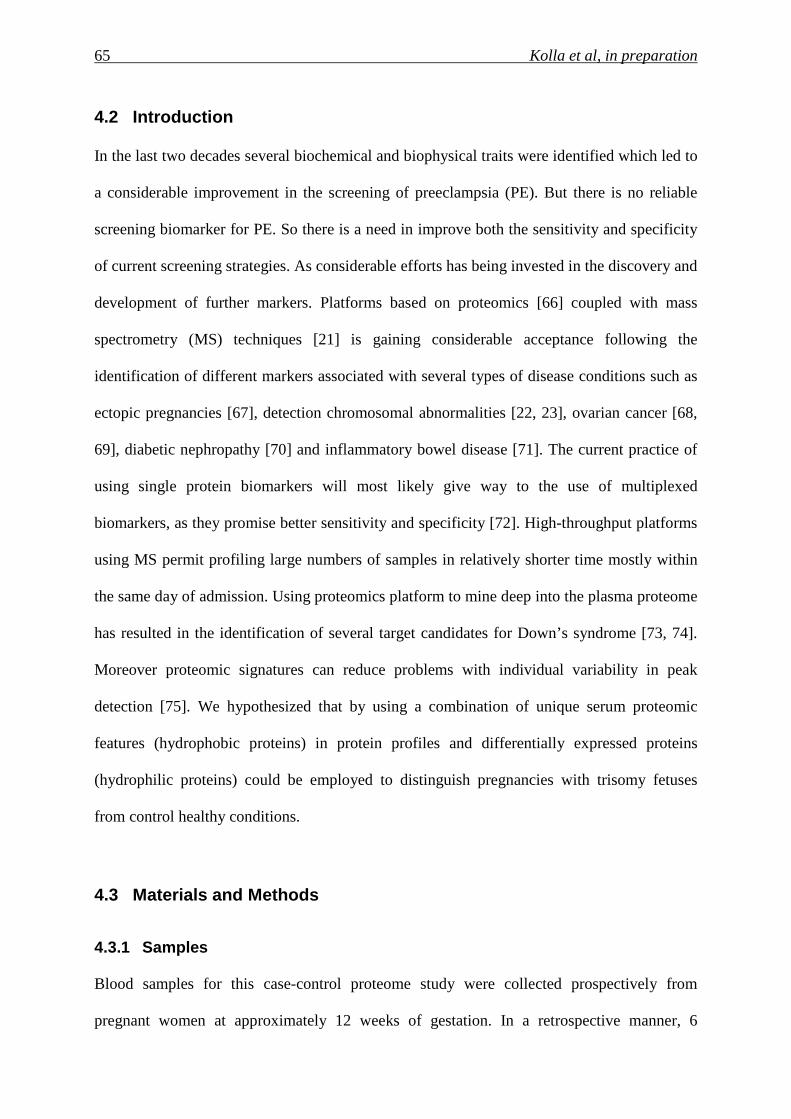
65 Kolla et al, in preparation
4.2 Introduction
In the last two decades several biochemical and biophysical traits were identified which led to
a considerable improvement in the screening of preeclampsia (PE). But there is no reliable
screening biomarker for PE. So there is a need in improve both the sensitivity and specificity
of current screening strategies. As considerable efforts has being invested in the discovery and
development of further markers. Platforms based on proteomics [66] coupled with mass
spectrometry (MS) techniques [21] is gaining considerable acceptance following the
identification of different markers associated with several types of disease conditions such as
ectopic pregnancies [67], detection chromosomal abnormalities [22, 23], ovarian cancer [68,
69], diabetic nephropathy [70] and inflammatory bowel disease [71]. The current practice of
using single protein biomarkers will most likely give way to the use of multiplexed
biomarkers, as they promise better sensitivity and specificity [72]. High-throughput platforms
using MS permit profiling large numbers of samples in relatively shorter time mostly within
the same day of admission. Using proteomics platform to mine deep into the plasma proteome
has resulted in the identification of several target candidates for Down’s syndrome [73, 74].
Moreover proteomic signatures can reduce problems with individual variability in peak
detection [75]. We hypothesized that by using a combination of unique serum proteomic
features (hydrophobic proteins) in protein profiles and differentially expressed proteins
(hydrophilic proteins) could be employed to distinguish pregnancies with trisomy fetuses
from control healthy conditions.
4.3 Materials and Methods
4.3.1 Samples
Blood samples for this case-control proteome study were collected prospectively from
pregnant women at approximately 12 weeks of gestation. In a retrospective manner, 6
66 Kolla et al, in preparation
samples from cases that subsequently developed preeclampsia were matched with 6 samples
from pregnancies with normal healthy outcome (Table 1). This study was undertaken with the
approval of the Institutional Ethical Board of the University Hospital, Basel, Switzerland and
written informed consent was required in all instances.
4.3.2 Sample preparation
As described previously, 9 ml blood was drawn into BD P100 tubes (BD Diagnostics,
Franklin Lake, NY, USA), which are specially designed for proteomics experiments, in that
the EDTA (Ethylenediaminetetraacetic acid) and protease inhibitor present in the tube prevent
coagulation and stabilize the plasma proteome. Following phlebotomy the samples were
centrifuged at 3,000x g for 30 minutes at 10ºC, whereby the plasma was separated from the
cellular fraction by aid of a mechanical separator, 100µl aliquots were stored at -80ºC until
further use.
67 Kolla et al, in preparation
(A)
Control PE
Maternal age (years) 35.1±1.3 35.1±6.8
Gestational age (weeks) 38.8±0.8 34.9±2.4
Systolic BP (mmHg) 122.5±14.2 188.8±18.6
Diastolic BP (mmHg) 73.6±7.0 111.8±14.1
Proteinuria (dipstick) Negative +++
(B)
Control PE
Gestational age (weeks) 12.4±1.2 12.3±1.1
Table 1. Characteristic of study population. (A)Criteria used for pregnancy with or without preeclampsia for the
longitudinal study. (B) Gestational window selected for the current study (n=6) who subsequently developed the
preeclampsia
4.3.3 Plasma protein profiling
Protein profiling was performed using the ProteinChip™ Biomarker System (Ciphergen
Biosystems®, Freemont, CA, USA), a SELDI-TOF MS platform. We used H50 (C8 reversed
phase/hydrophobic interaction chromatography) ProteinChip™ Array. Samples were applied
to H50 protein chip arrays (Ciphergen, Fremont, CA, USA) according to the manufacturer’s
protocol. Saturated solution of sinapinic acid in 50% acetonitrile, 0.5% trifluoroacetic acid
was applied twice to each spot on the array, with air drying between each application. To
minimize bias, plasma samples from mothers who developed PE and those with normal
outcome were assayed on the same chips. Plasma samples were analyzed using the Protein
Biology System 2 SELDI-TOF mass spectrometer (Ciphergen Biosystems). Peptides and
68 Kolla et al, in preparation
proteins below the 60 kDa range were ionized on a α-cyano-4-hydroxy-cinnamic acid matrix.
Known proteins were used for data calibration between experiments, and the mass accuracy
was determined daily using the Ciphergen Broad Range molecular weight standards (C100-
0001, Ciphergen Biosystems). Chips with plasma samples were analyzed under the following
conditions: laser intensity 260V, detector sensitivity 10, mass focus 30 kDa, with molecular
mass/charge (m/z) range from 0-60 kDa and mass optimization 3-60 kDa. Data were collected
by averaging 65 laser shots per sample. These were exported as raw data (Ciphergen PBSII™
software), and used without modification for downstream bioinformatics analyses. Spectra
were calibrated, baseline subtracted, and normalized. Qualified mass peaks (signal/noise >5;
cluster mass window at 0.3%) within the m/z range of 2–60 kDa were selected automatically.
Logarithmic transformation was applied to the peak intensity before analysis for biomarker
discovery. After biomarker discovery, the quality and intensity readings of the selected peaks
were manually reconfirmed from raw spectra.
4.3.4 Bioinformatics approach
We analyzed spectra of 6 control and 6 cases which developed PE. Each spectrum had 26,707
mass spectral components. To reduce non-specific peaks especially in the low mass range, we
eliminated the first 5,989 components that all corresponded to masses < 3kDa. We manually
inspected the remaining part of the spectra and selected 62 apparent peaks in the spectra with
the aim to select few that could be used to classify PE cases and separate them from the
control healthy cases. These 62 peaks served to generate initial feature set based on which the
individual cases were analyzed.
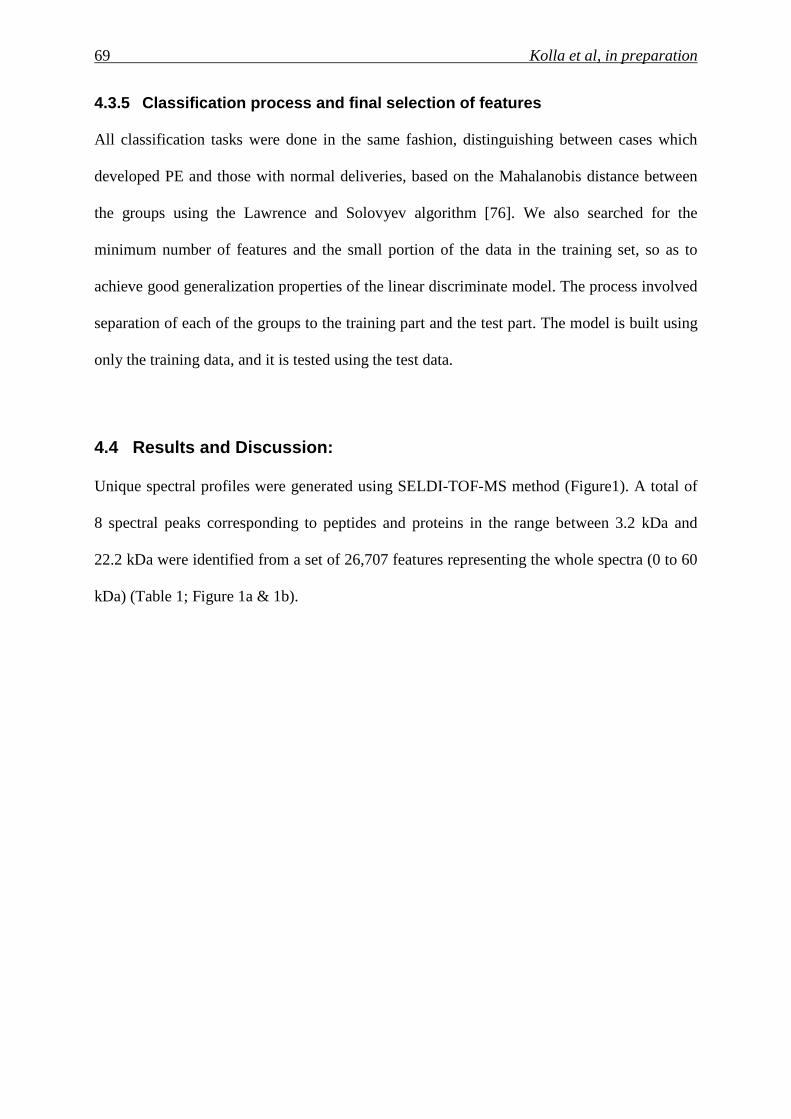
69 Kolla et al, in preparation
4.3.5 Classification process and final selection of features
All classification tasks were done in the same fashion, distinguishing between cases which
developed PE and those with normal deliveries, based on the Mahalanobis distance between
the groups using the Lawrence and Solovyev algorithm [76]. We also searched for the
minimum number of features and the small portion of the data in the training set, so as to
achieve good generalization properties of the linear discriminate model. The process involved
separation of each of the groups to the training part and the test part. The model is built using
only the training data, and it is tested using the test data.
4.4 Results and Discussion:
Unique spectral profiles were generated using SELDI-TOF-MS method (Figure1). A total of
8 spectral peaks corresponding to peptides and proteins in the range between 3.2 kDa and
22.2 kDa were identified from a set of 26,707 features representing the whole spectra (0 to 60
kDa) (Table 1; Figure 1a & 1b).
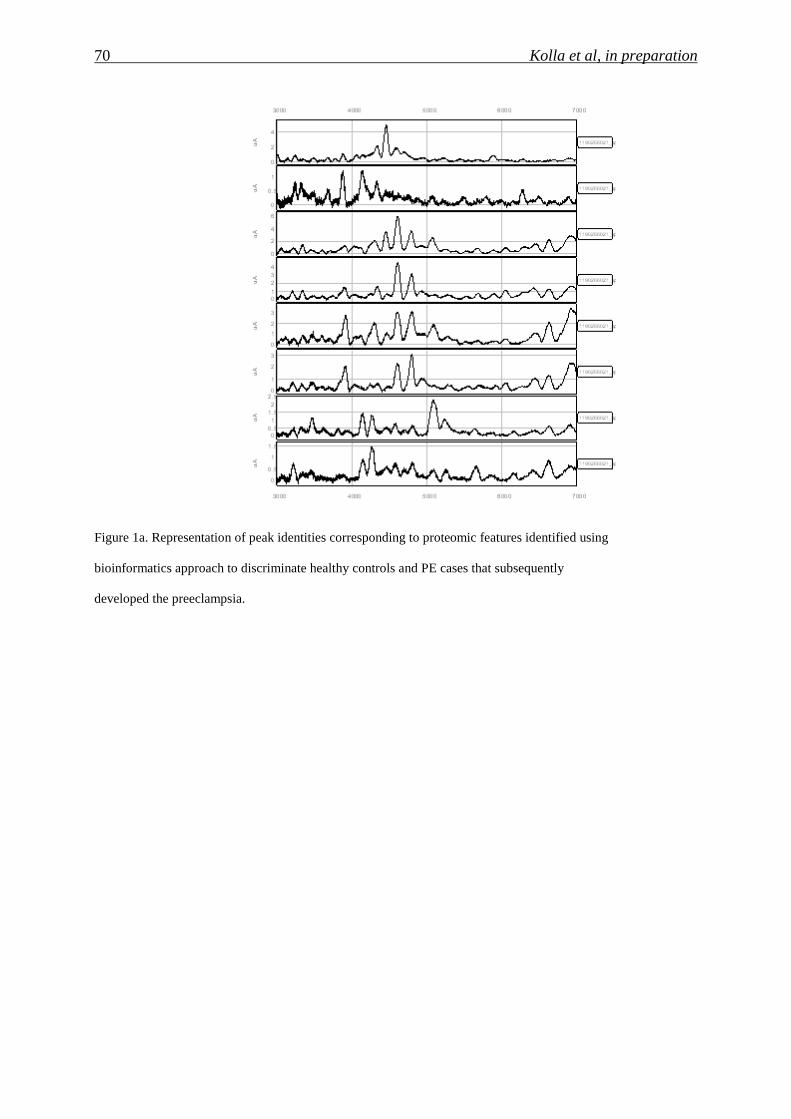
70 Kolla et al, in preparation
Figure 1a. Representation of peak identities corresponding to proteomic features identified using
bioinformatics approach to discriminate healthy controls and PE cases that subsequently
developed the preeclampsia.
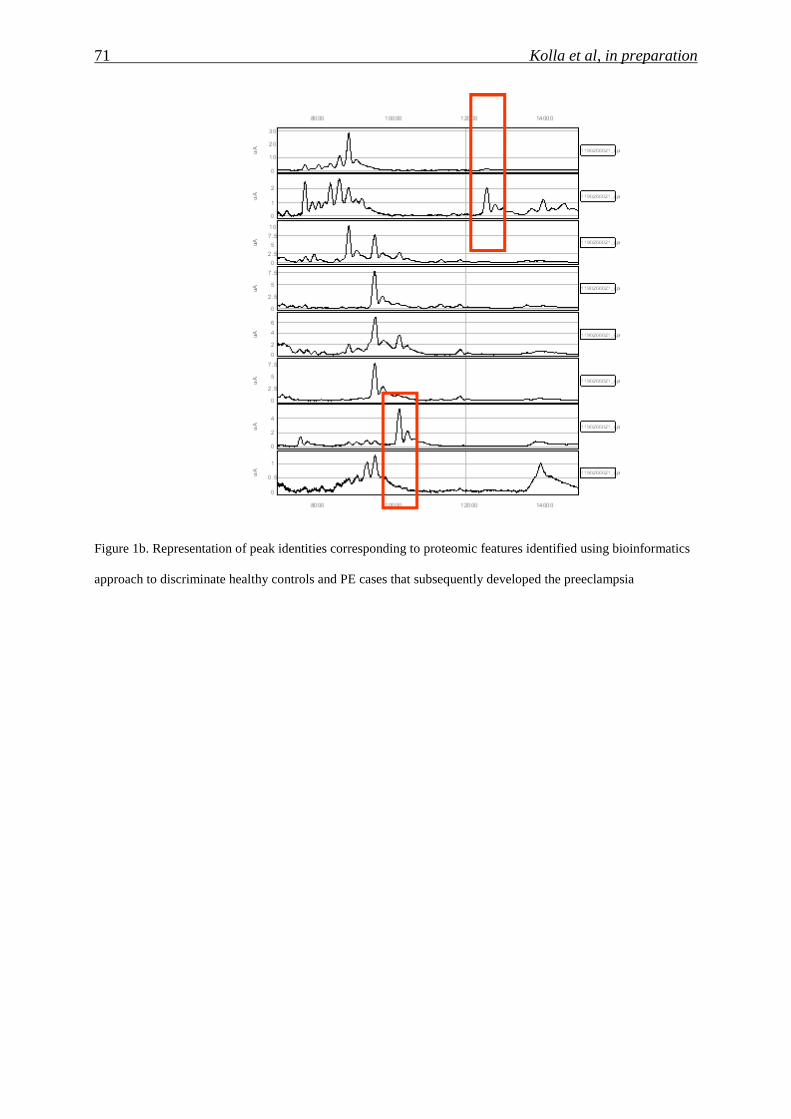
71 Kolla et al, in preparation
Figure 1b. Representation of peak identities corresponding to proteomic features identified using bioinformatics
approach to discriminate healthy controls and PE cases that subsequently developed the preeclampsia
72 Kolla et al, in preparation
Eight features were identified which could discriminate all control pregnancies from the PE –
before onset of PE.
Table 2. Proteomic features identified to discriminate PE conditions from normal are based on protein profiling
technique. Y is present and N is absent for peak.
Using SELDI platforms we tried to identify unique fingerprints of protein markers for
pregnancies at risk for PE. Some studies have previously reported on the use of maternal
serum [21, 23] and plasma [73]. The current study addresses these two important issues.
Results from our study indicates that it might be possible to effectively screen for pregnancies
at risk for PE using 2nd trimester maternal plasma samples and generating proteomic
fingerprints by SELDI-TOF MS analysis.
Protein profiling is a powerful technique to look at several hundred proteins in a single
spectrum [18].
Human serum is known to contain a complex mixture of different kinds of protein and
peptides [77], and it is suggested that a success in distinguishing healthy person from a patient
could be improved with the identification of unique features in protein profiles [78]. The
number of distinct features of spectral information detected in the mass spectrum of a
processed sample is a strong indicator of the information content of the signature. Recent
studies have focussed on using the power of SELDI techniques to study amniotic fluid,
cervical vaginal fluid for various disease conditions associated with the developing fetus such
as inflammation, infection [79], and neonatal sepsis and also to investigate into the
mechanisms of idiopathic preterm birth [80]. The same approach has been used to detect
73 Kolla et al, in preparation
ectopic pregnancies [67] and as well as Down syndrome [23]. Till now this approach has not
been explored for prenatal screening in a large scale as well as in clinical settings. In the
current analysis, the mass (mw) of the markers ranged between 3 kDa and 60 kDa with
majority of the markers in the range less than 22 kDa.
4.5 Conclusions
In summary, maternal plasma proteomic profiling with SELDI may prove to be a useful tool
for the screening of pregnancies at risk for PE. The accuracy of this approach, however,
requires large scale verification before it can be considered for clinical use.


75 Publication
5 Publication

77 Publication
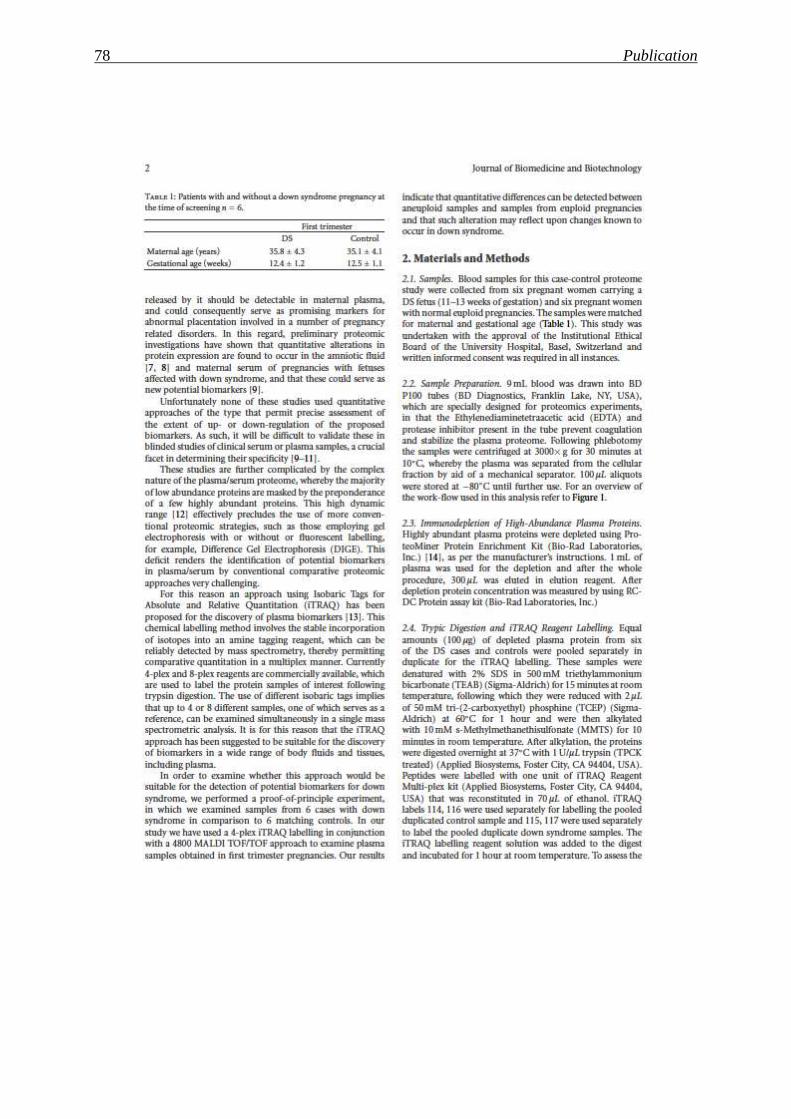
78 Publication
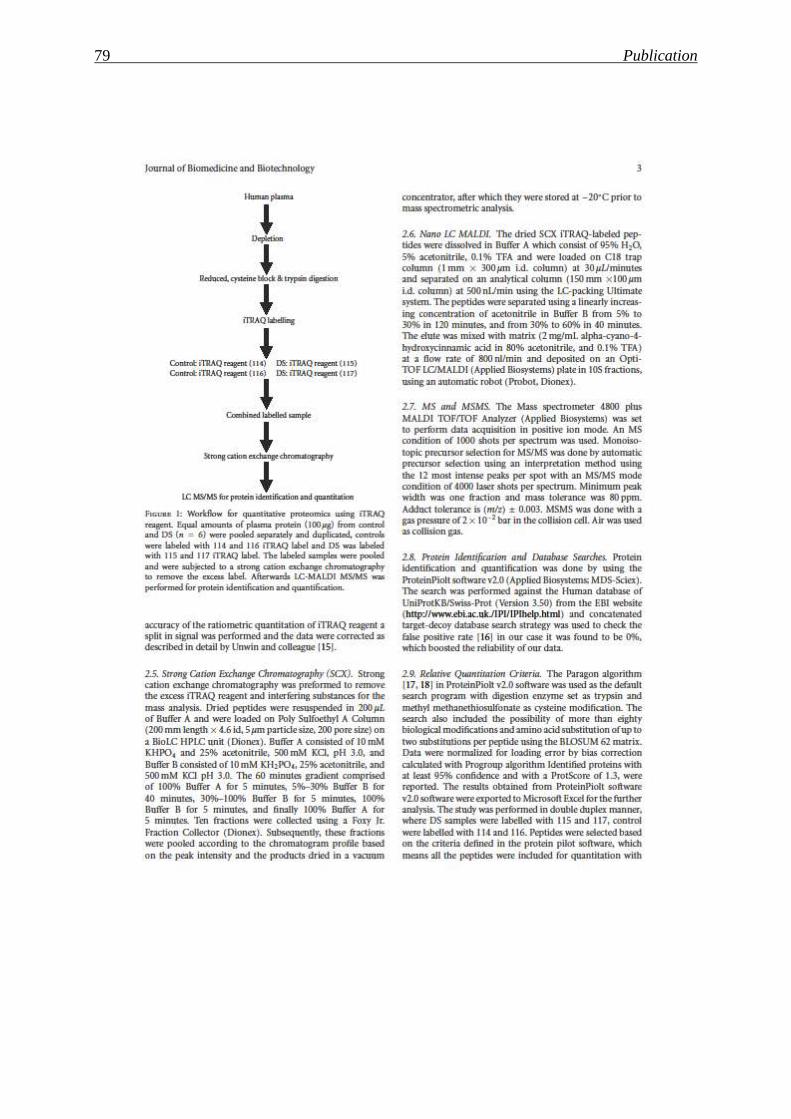
79 Publication
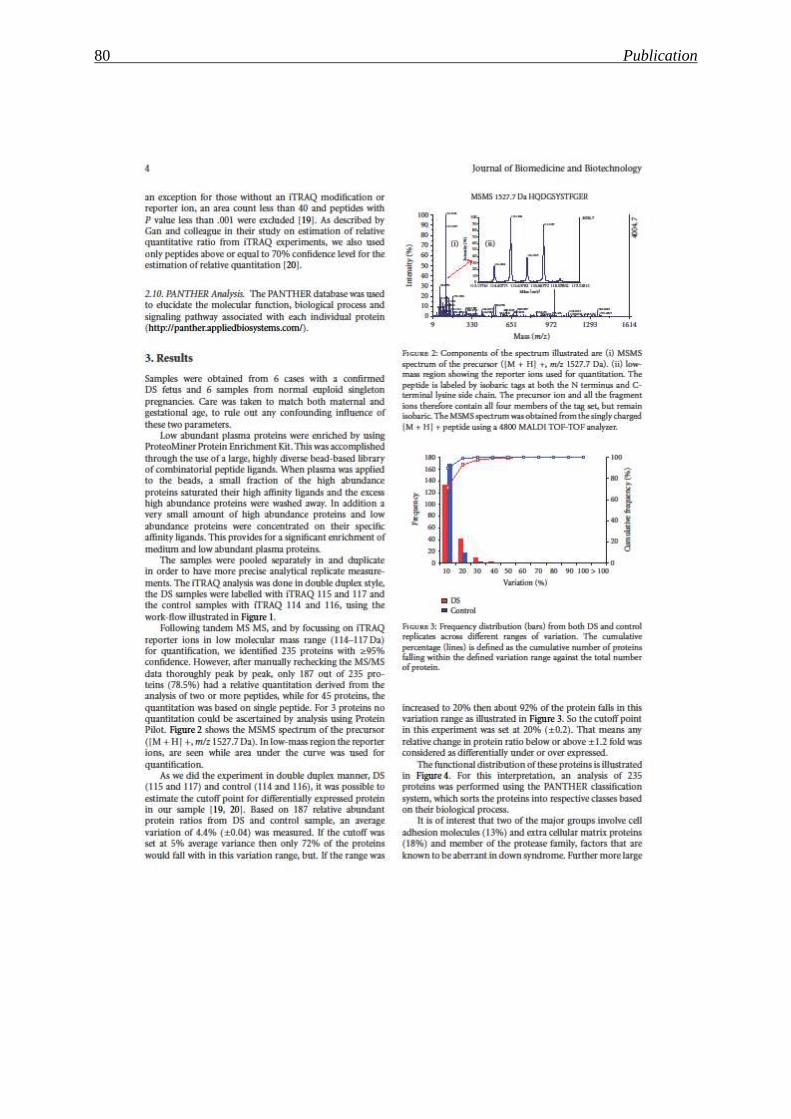
80 Publication
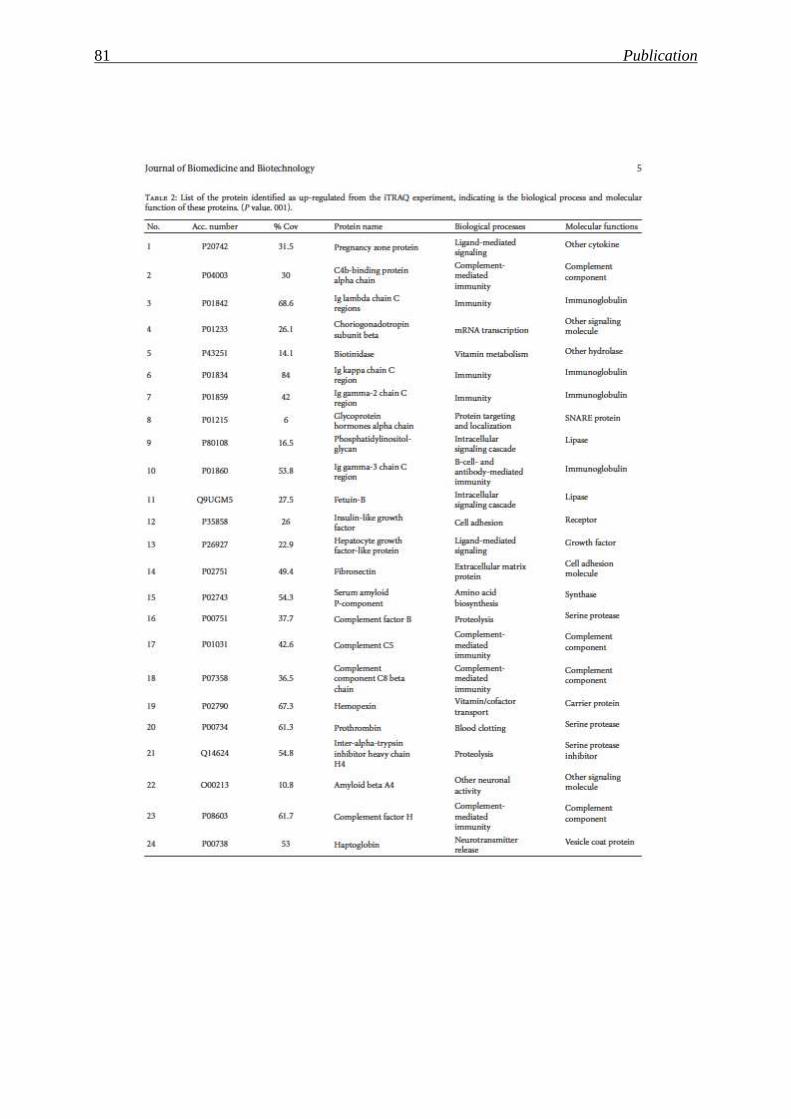
81 Publication
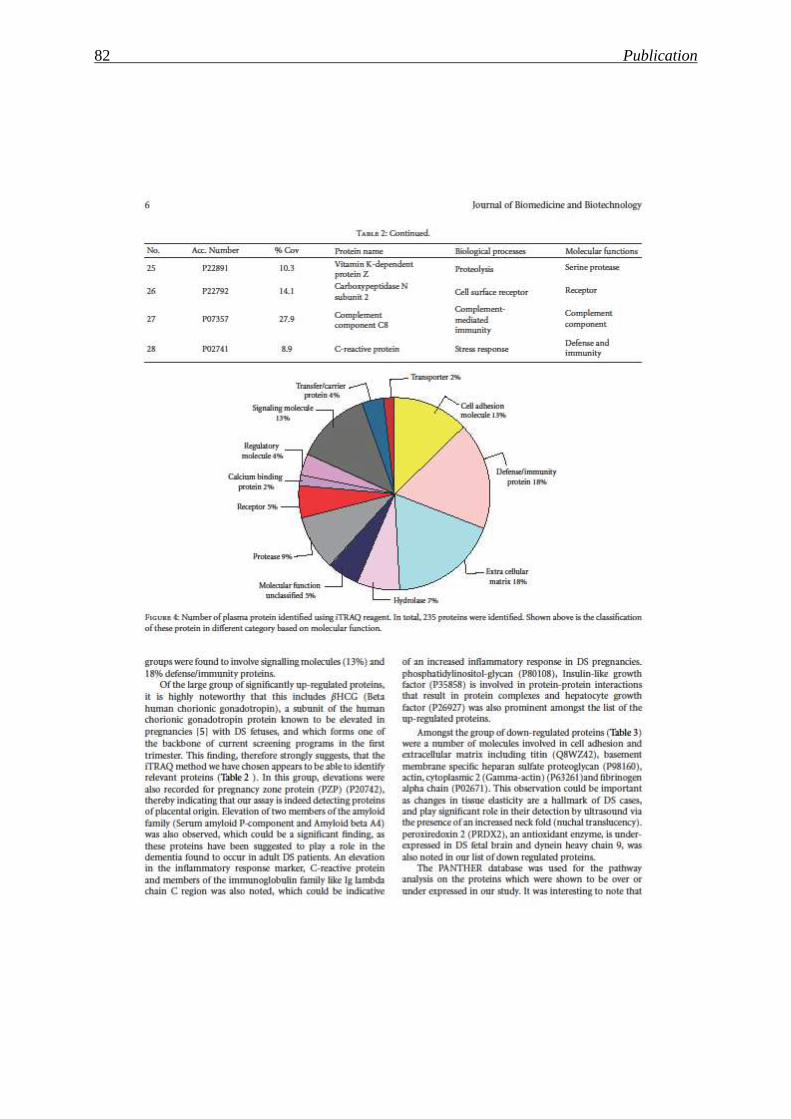
82 Publication
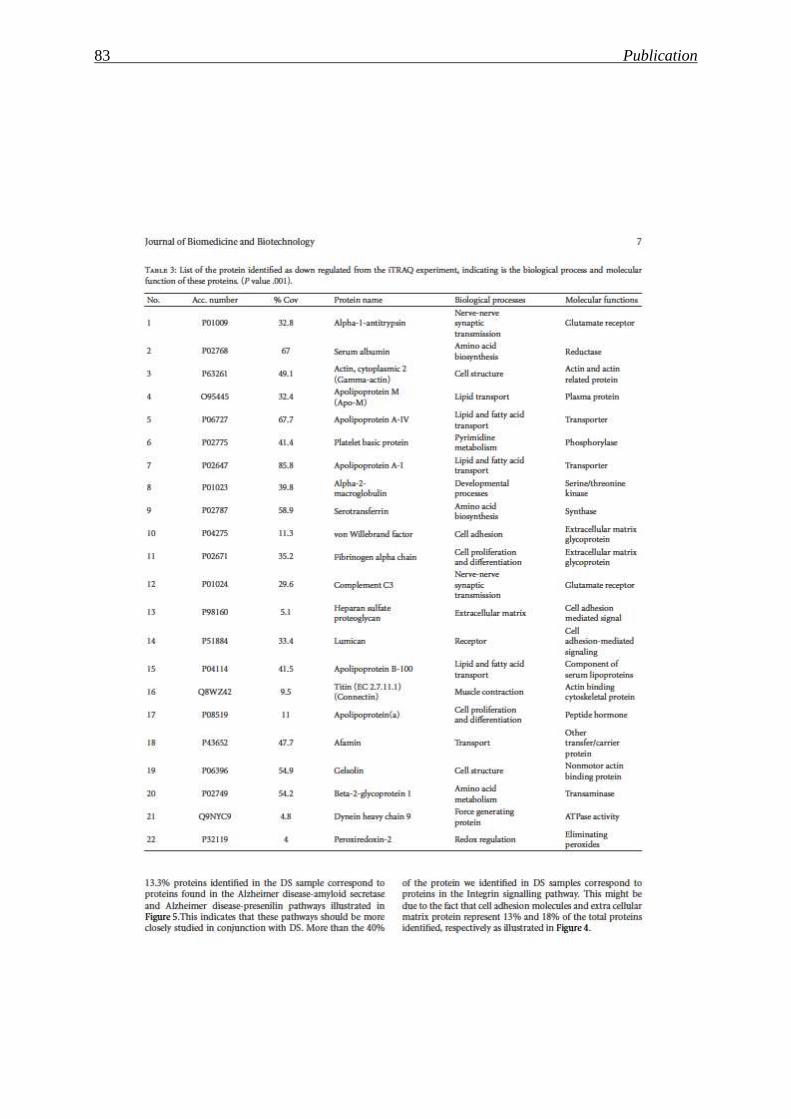
83 Publication
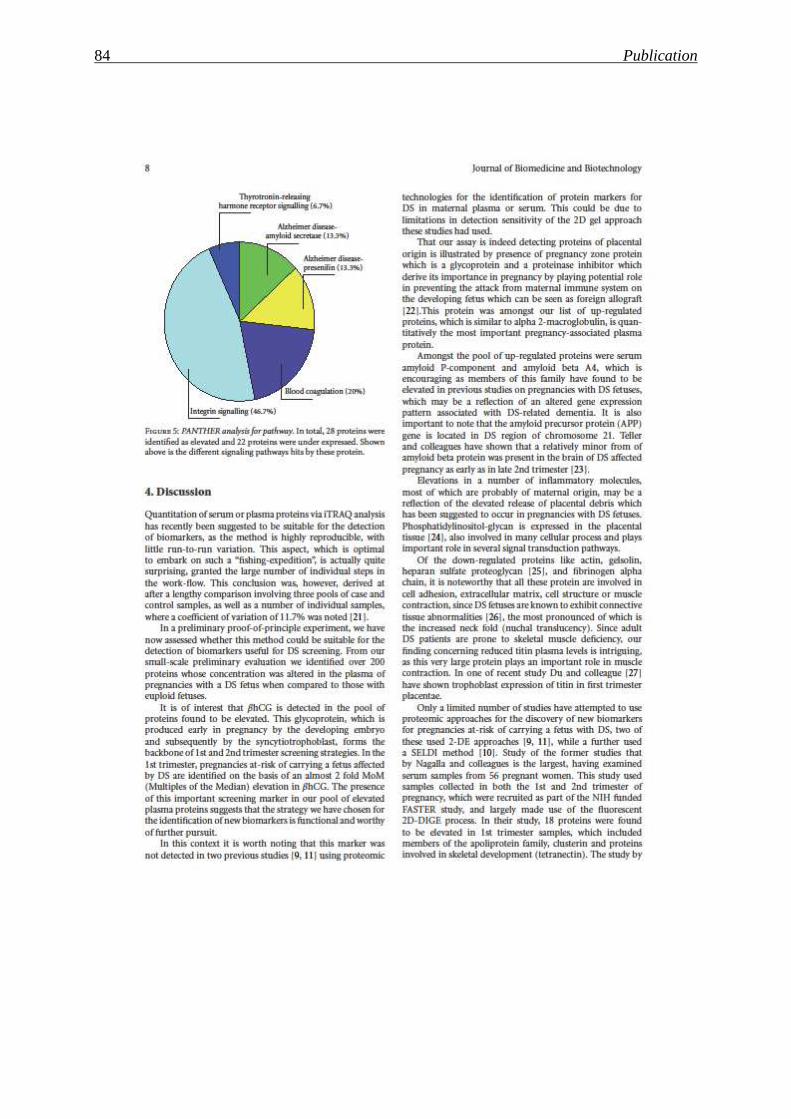
84 Publication
85 Publication
86 Publication
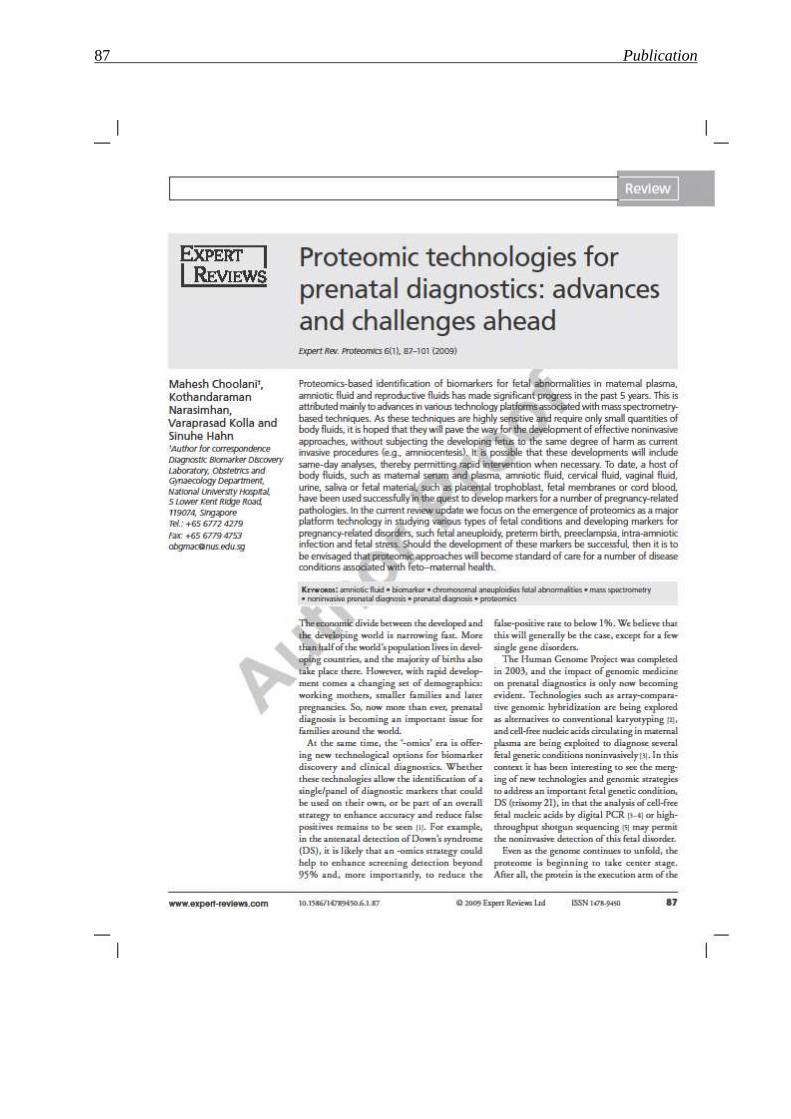
87 Publication
88 Publication
89 Publication
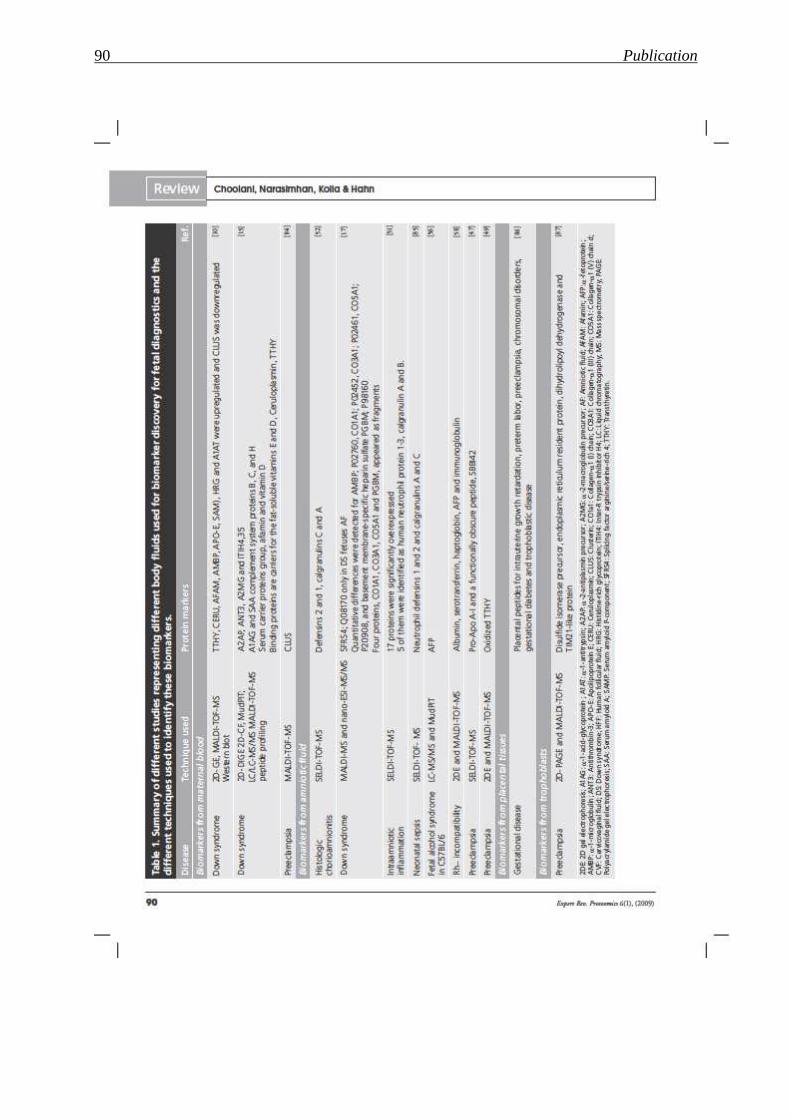
90 Publication
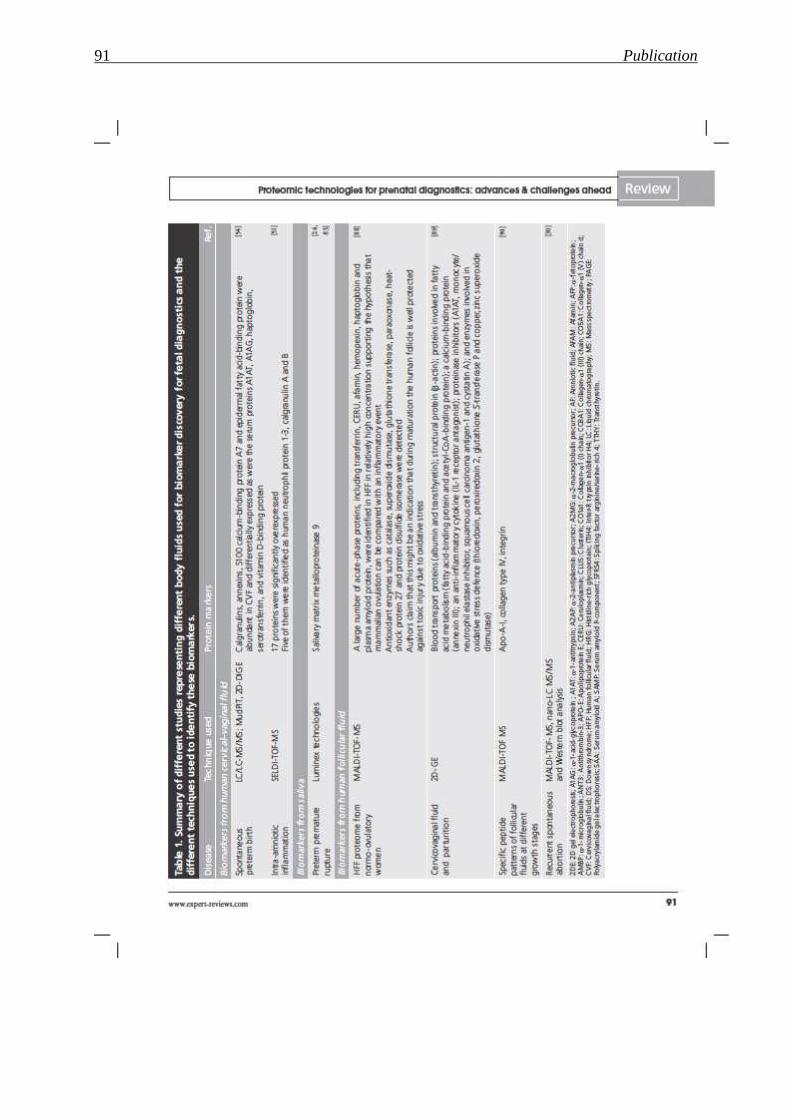
91 Publication
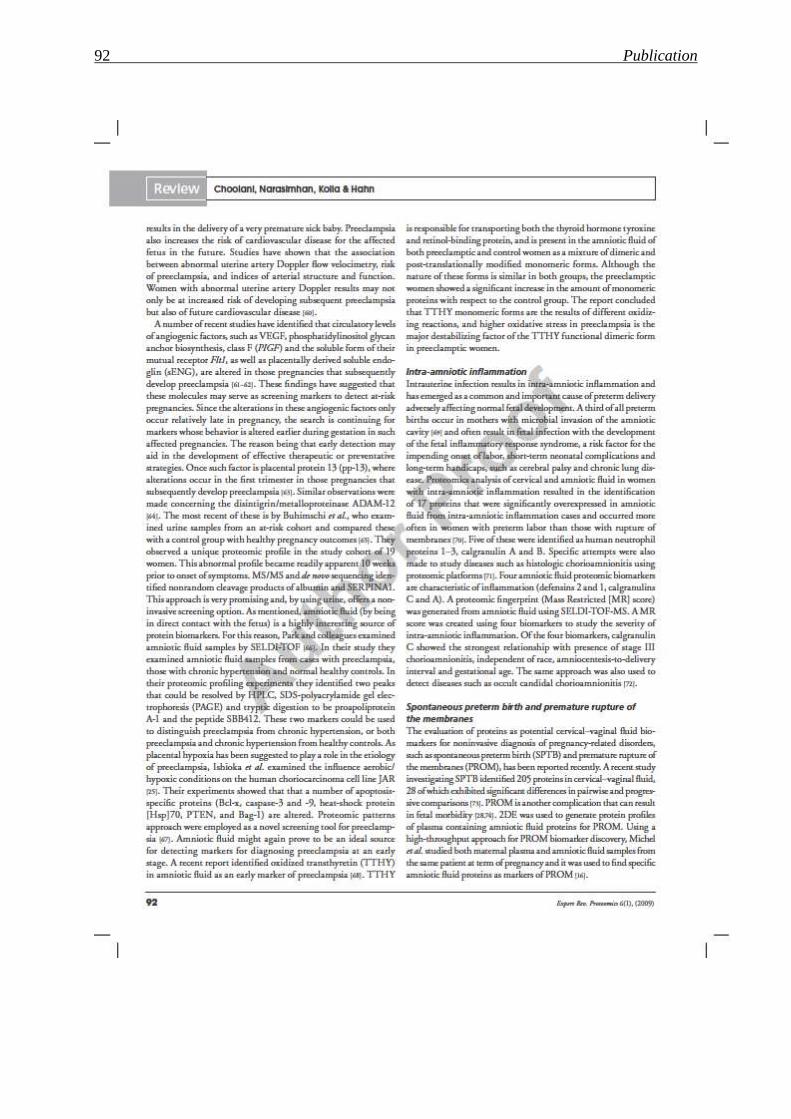
92 Publication
93 Publication
94 Publication
95 Publication
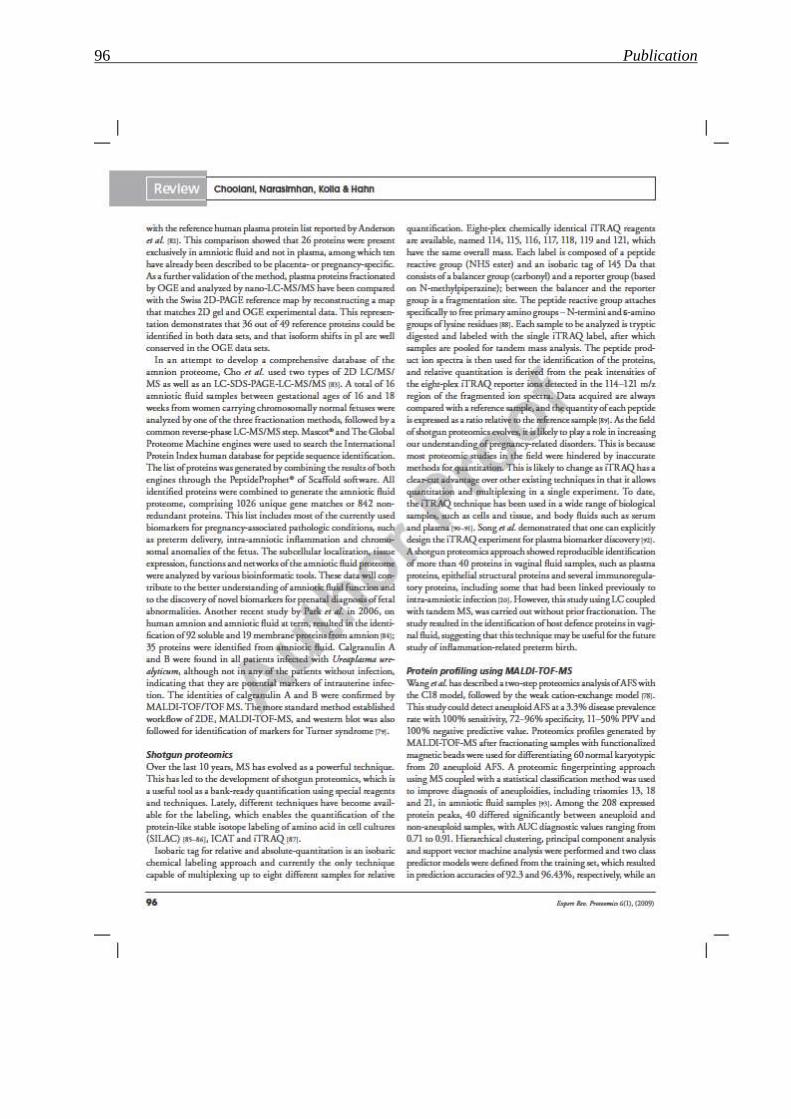
96 Publication
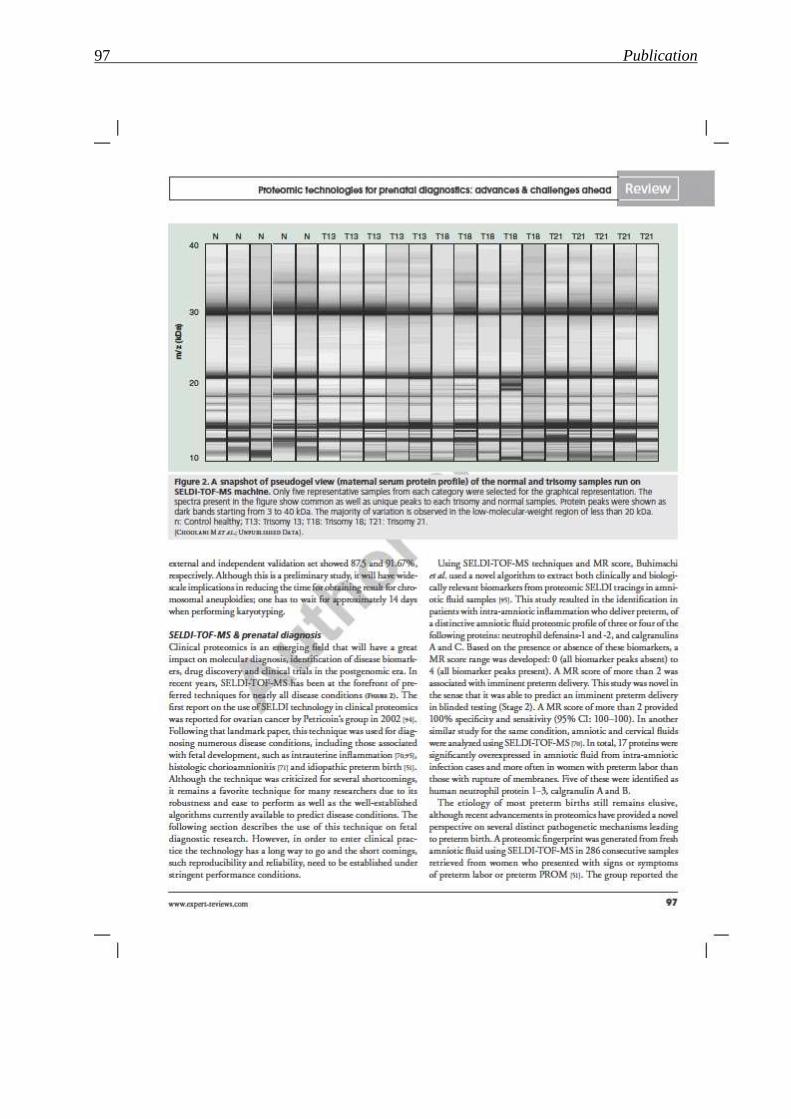
97 Publication
98 Publication
99 Publication
100 Publication
101 Publication
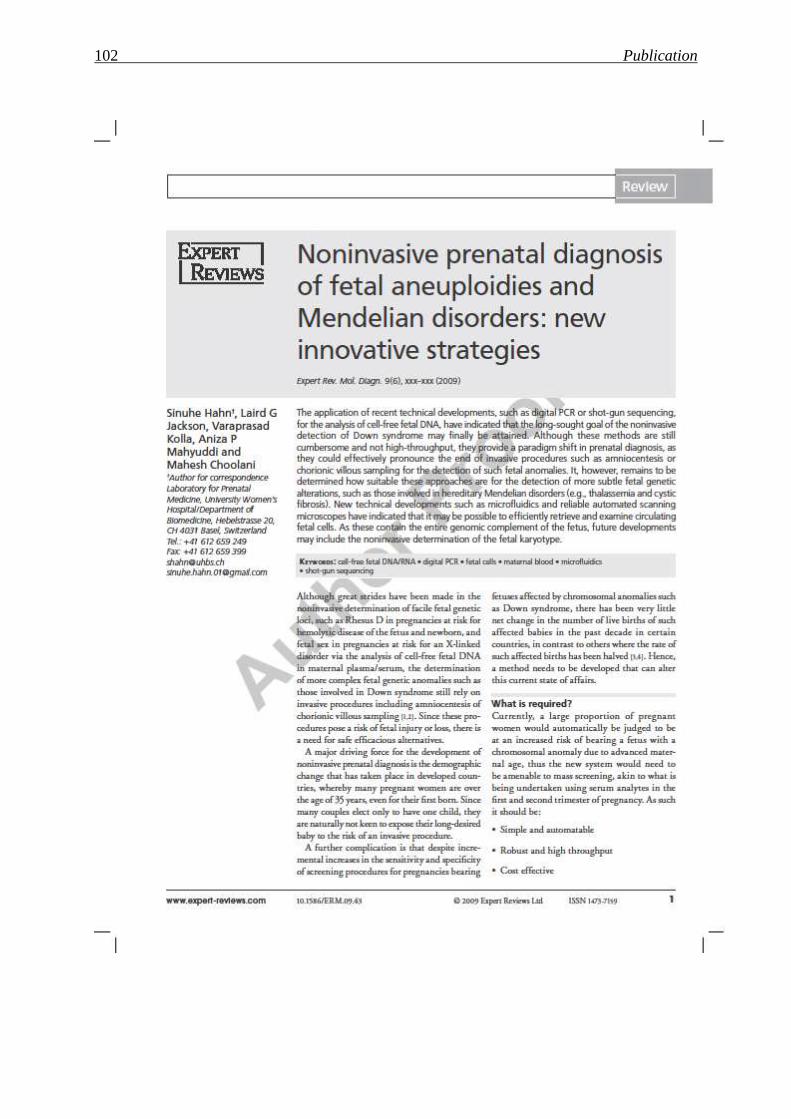
102 Publication
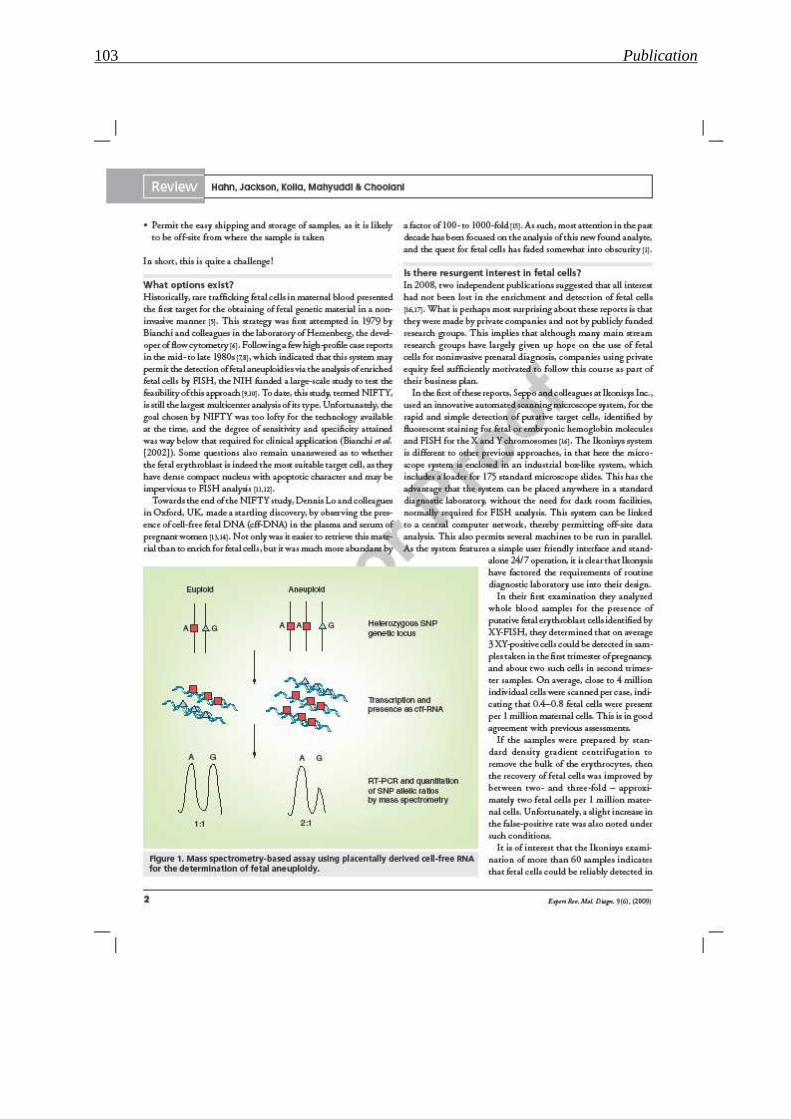
103 Publication
104 Publication
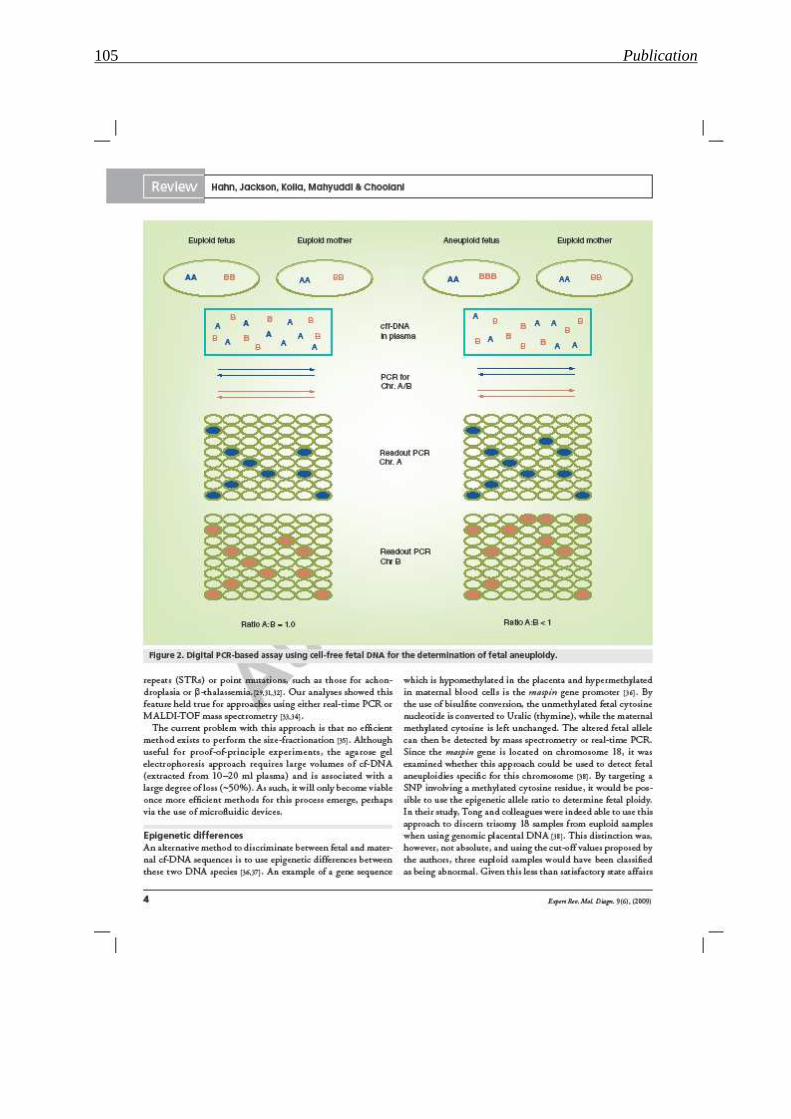
105 Publication
106 Publication
107 Publication
108 Publication
109 Publication
110 Publication
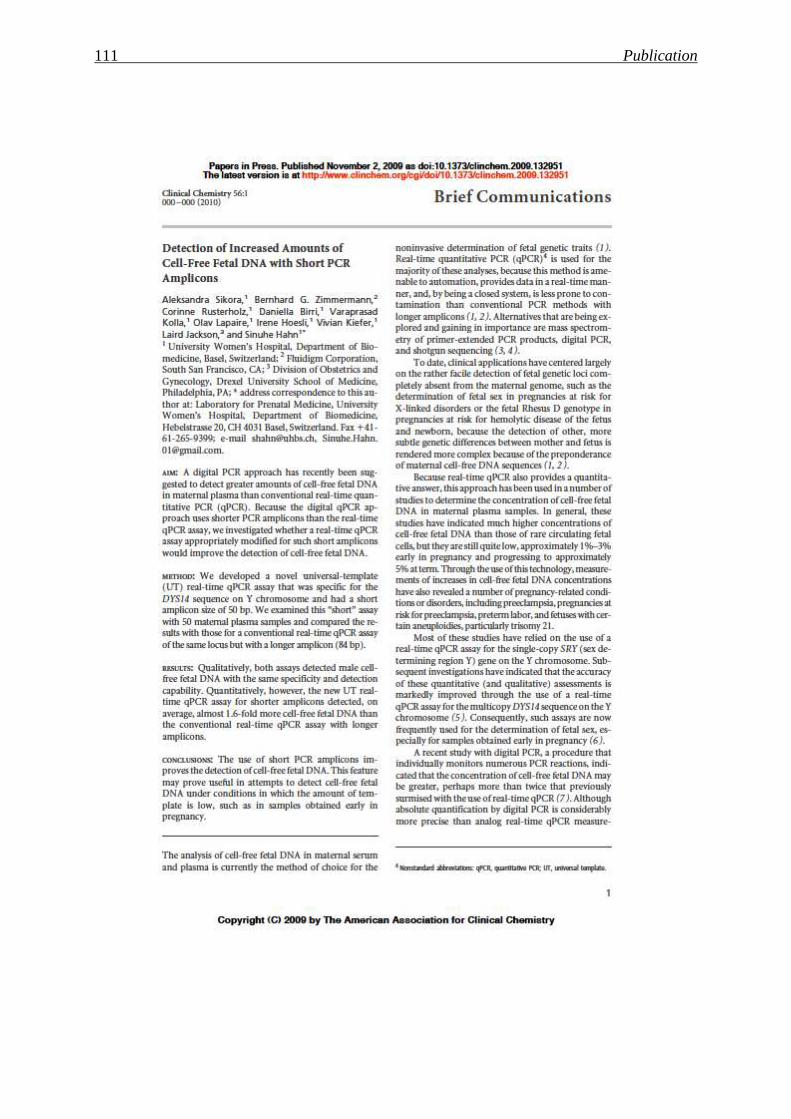
111 Publication
112 Publication
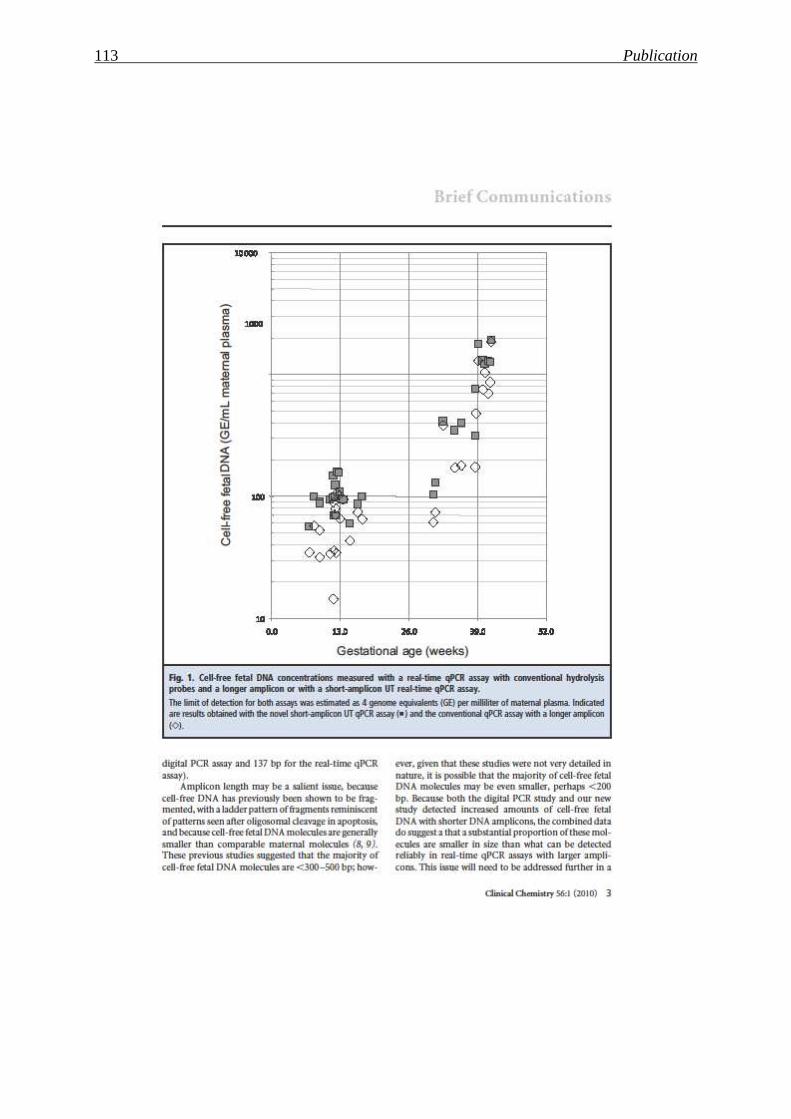
113 Publication
114 Publication
115 Discussion and Outlook
6 Discussion and Outlook
In this thesis, I investigated the use of a number of proteomic techniques for the purpose of
biomarker development to screen pregnancies at risk for DS or PE. Our hypothesis for this
approach was that both DS and PE involve structural changes in the placenta, which should be
evident in the maternal plasma proteome, since the placenta is in direct contact with the
maternal circulation.
A major complication we faced when dealing with the plasma proteome, is the overwhelming
presence of a discrete number of proteins, such as albumin, immunoglobulin, which mask less
abundant protein species, especially those released in less prodigious quantities by the
placenta. Strategies we took to overcome this issue included the use of a FFE device and
commercial depletion columns. Although initially promising, the FFE approach had to be
abandoned, due to the high concentrations of urea used in this procedure. The most successful
approach proved to be the immuno depletion using ProteoMiner™Protein Enrichment Kit
(Bio-Rad Laboratories, Inc.).
As DS and PE are unlikely to lead to the production of novel proteins, but rather be reflective
of changes in levels of protein expression, we needed a method to reliably quantify changes in
level of potential biomarkers. In our study we examined a number of approaches, including,
shotgun MS, SELDI and iTRAQ labelling. iTRAQ labelling has recently been suggested to be
the method of choice when considering biomarker development.
In our hands, this method was indeed shown to permit highly reproducible quantitation, and
we could readily discern differences between the plasma proteome in cases with DS fetuses
vs. controls, and well as in pregnancies at risk for PE and those with normal deliveries.
In our analysis of DS cases we were gratified to observe that we could detect known
biomarker molecules such as bHCG, a protein which is at the core of current screening
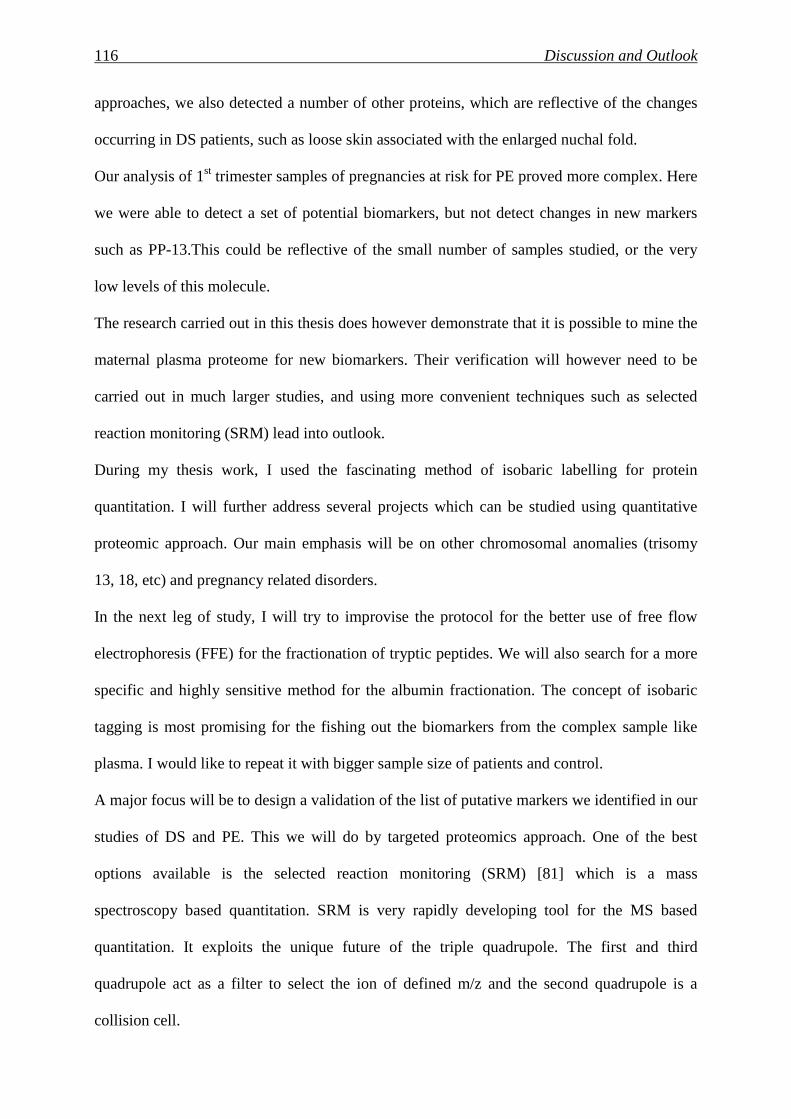
116 Discussion and Outlook
approaches, we also detected a number of other proteins, which are reflective of the changes
occurring in DS patients, such as loose skin associated with the enlarged nuchal fold.
Our analysis of 1st trimester samples of pregnancies at risk for PE proved more complex. Here
we were able to detect a set of potential biomarkers, but not detect changes in new markers
such as PP-13.This could be reflective of the small number of samples studied, or the very
low levels of this molecule.
The research carried out in this thesis does however demonstrate that it is possible to mine the
maternal plasma proteome for new biomarkers. Their verification will however need to be
carried out in much larger studies, and using more convenient techniques such as selected
reaction monitoring (SRM) lead into outlook.
During my thesis work, I used the fascinating method of isobaric labelling for protein
quantitation. I will further address several projects which can be studied using quantitative
proteomic approach. Our main emphasis will be on other chromosomal anomalies (trisomy
13, 18, etc) and pregnancy related disorders.
In the next leg of study, I will try to improvise the protocol for the better use of free flow
electrophoresis (FFE) for the fractionation of tryptic peptides. We will also search for a more
specific and highly sensitive method for the albumin fractionation. The concept of isobaric
tagging is most promising for the fishing out the biomarkers from the complex sample like
plasma. I would like to repeat it with bigger sample size of patients and control.
A major focus will be to design a validation of the list of putative markers we identified in our
studies of DS and PE. This we will do by targeted proteomics approach. One of the best
options available is the selected reaction monitoring (SRM) [81] which is a mass
spectroscopy based quantitation. SRM is very rapidly developing tool for the MS based
quantitation. It exploits the unique future of the triple quadrupole. The first and third
quadrupole act as a filter to select the ion of defined m/z and the second quadrupole is a
collision cell.
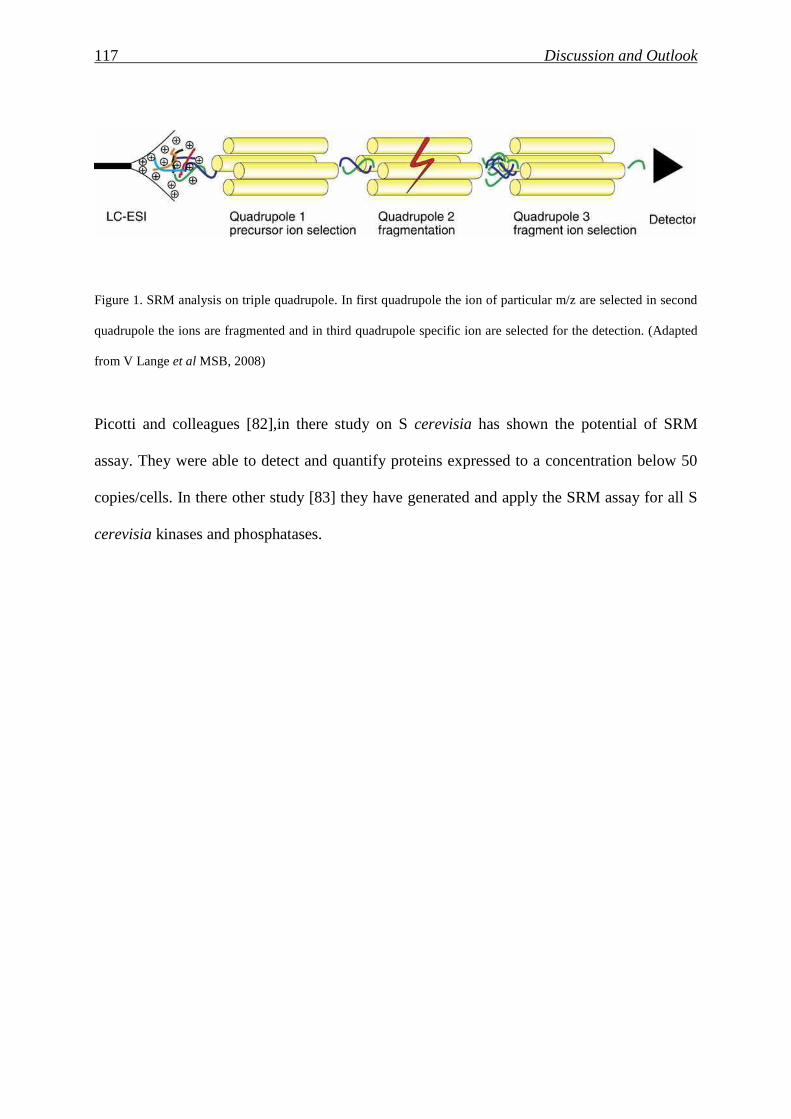
117 Discussion and Outlook
Figure 1. SRM analysis on triple quadrupole. In first quadrupole the ion of particular m/z are selected in second
quadrupole the ions are fragmented and in third quadrupole specific ion are selected for the detection. (Adapted
from V Lange et al MSB, 2008)
Picotti and colleagues [82],in there study on S cerevisia has shown the potential of SRM
assay. They were able to detect and quantify proteins expressed to a concentration below 50
copies/cells. In there other study [83] they have generated and apply the SRM assay for all S
cerevisia kinases and phosphatases.

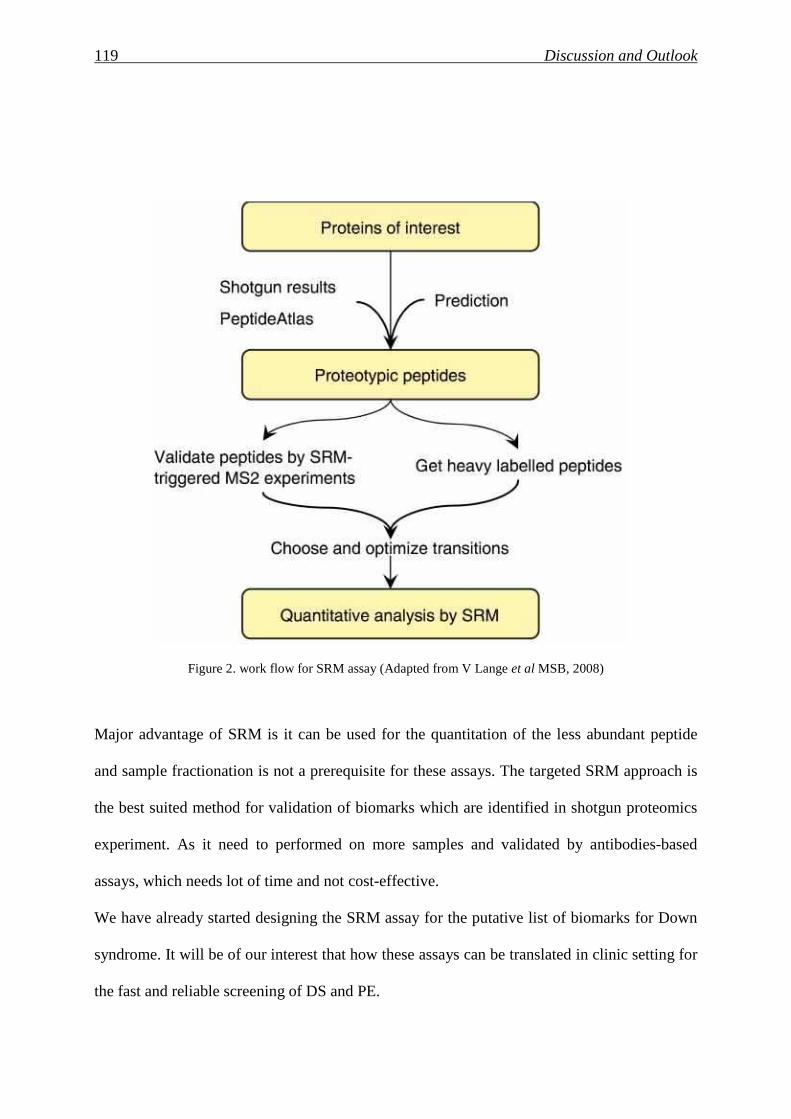
119 Discussion and Outlook
Figure 2. work flow for SRM assay (Adapted from V Lange et al MSB, 2008)
Major advantage of SRM is it can be used for the quantitation of the less abundant peptide
and sample fractionation is not a prerequisite for these assays. The targeted SRM approach is
the best suited method for validation of biomarks which are identified in shotgun proteomics
experiment. As it need to performed on more samples and validated by antibodies-based
assays, which needs lot of time and not cost-effective.
We have already started designing the SRM assay for the putative list of biomarks for Down
syndrome. It will be of our interest that how these assays can be translated in clinic setting for
the fast and reliable screening of DS and PE.

120 Discussion and Outlook
Urine is one of the most attractive biofluid in clinical proteomics. It is easy to collect and non-
invasive. It contains significant amount of protein and peptid which are of clinical value. We
are also indent to check the SRM assay in urine sample from DS and PE.

121 References
7 References
1. Nicolaides, K.H., First-trimester screening for Down's syndrome. N Engl J Med,
2004. 350(6): p. 619-21; author reply 619-21.
2. Penrose, L.S., The relative effects of paternal and maternal age in mongolism. 1933. J
Genet, 2009. 88(1): p. 9-14.
3. Hassold, T. and D. Chiu, Maternal age-specific rates of numerical chromosome
abnormalities with special reference to trisomy. Hum Genet, 1985. 70(1): p. 11-7.
4. Morton, N.E., et al., Maternal age in trisomy. Ann Hum Genet, 1988. 52(Pt 3): p. 227-
35.
5. Morris, J.K. and E. Alberman, Trends in Down's syndrome live births and antenatal
diagnoses in England and Wales from 1989 to 2008: analysis of data from the National Down
Syndrome Cytogenetic Register. BMJ, 2009. 339: p. b3794.
6. Wilson, R.D., et al., Amended Canadian guideline for prenatal diagnosis (2005)
change to 2005-techniques for prenatal diagnosis. J Obstet Gynaecol Can, 2005. 27(11): p.
1048-62.
7. Lo, Y.M., et al., Presence of fetal DNA in maternal plasma and serum. Lancet, 1997.
350(9076): p. 485-7.
8. Hahn, S. and W. Holzgreve, Fetal cells and cell-free fetal DNA in maternal blood: new
insights into pre-eclampsia. Hum Reprod Update, 2002. 8(6): p. 501-8.
9. Li, Y., et al., Size separation of circulatory DNA in maternal plasma permits ready
detection of fetal DNA polymorphisms. Clin Chem, 2004. 50(6): p. 1002-11.
10. Chim, S.S., et al., Detection of the placental epigenetic signature of the maspin gene in
maternal plasma. Proc Natl Acad Sci U S A, 2005. 102(41): p. 14753-8.
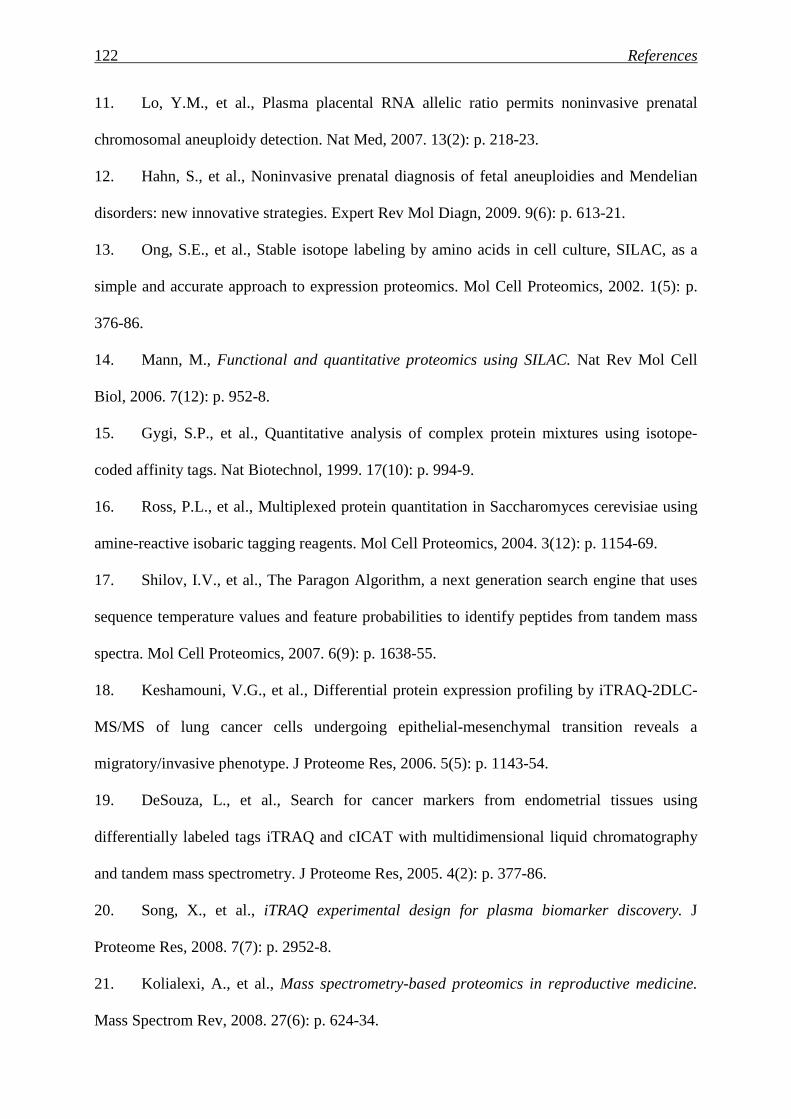
122 References
11. Lo, Y.M., et al., Plasma placental RNA allelic ratio permits noninvasive prenatal
chromosomal aneuploidy detection. Nat Med, 2007. 13(2): p. 218-23.
12. Hahn, S., et al., Noninvasive prenatal diagnosis of fetal aneuploidies and Mendelian
disorders: new innovative strategies. Expert Rev Mol Diagn, 2009. 9(6): p. 613-21.
13. Ong, S.E., et al., Stable isotope labeling by amino acids in cell culture, SILAC, as a
simple and accurate approach to expression proteomics. Mol Cell Proteomics, 2002. 1(5): p.
376-86.
14. Mann, M., Functional and quantitative proteomics using SILAC. Nat Rev Mol Cell
Biol, 2006. 7(12): p. 952-8.
15. Gygi, S.P., et al., Quantitative analysis of complex protein mixtures using isotope-
coded affinity tags. Nat Biotechnol, 1999. 17(10): p. 994-9.
16. Ross, P.L., et al., Multiplexed protein quantitation in Saccharomyces cerevisiae using
amine-reactive isobaric tagging reagents. Mol Cell Proteomics, 2004. 3(12): p. 1154-69.
17. Shilov, I.V., et al., The Paragon Algorithm, a next generation search engine that uses
sequence temperature values and feature probabilities to identify peptides from tandem mass
spectra. Mol Cell Proteomics, 2007. 6(9): p. 1638-55.
18. Keshamouni, V.G., et al., Differential protein expression profiling by iTRAQ-2DLC-
MS/MS of lung cancer cells undergoing epithelial-mesenchymal transition reveals a
migratory/invasive phenotype. J Proteome Res, 2006. 5(5): p. 1143-54.
19. DeSouza, L., et al., Search for cancer markers from endometrial tissues using
differentially labeled tags iTRAQ and cICAT with multidimensional liquid chromatography
and tandem mass spectrometry. J Proteome Res, 2005. 4(2): p. 377-86.
20. Song, X., et al., iTRAQ experimental design for plasma biomarker discovery. J
Proteome Res, 2008. 7(7): p. 2952-8.
21. Kolialexi, A., et al., Mass spectrometry-based proteomics in reproductive medicine.
Mass Spectrom Rev, 2008. 27(6): p. 624-34.
123 References
22. Nagalla, S.R., et al., Proteomic analysis of maternal serum in down syndrome:
identification of novel protein biomarkers. J Proteome Res, 2007. 6(4): p. 1245-57.
23. Busch, A., et al., Proteome analysis of maternal serum samples for trisomy 21
pregnancies using ProteinChip arrays and bioinformatics. J Histochem Cytochem, 2005.
53(3): p. 341-3.
24. Choolani, M., et al., Proteomic technologies for prenatal diagnostics: advances and
challenges ahead. Expert Rev Proteomics, 2009. 6(1): p. 87-101.
25. Davison, J.M., et al., New aspects in the pathophysiology of preeclampsia. J Am Soc
Nephrol, 2004. 15(9): p. 2440-8.
26. Meads, C.A., et al., Methods of prediction and prevention of pre-eclampsia: systematic
reviews of accuracy and effectiveness literature with economic modelling. Health Technol
Assess, 2008. 12(6): p. iii-iv, 1-270.
27. Venkatesha, S., et al., Lipocalin 2 antagonizes the proangiogenic action of ras in
transformed cells. Mol Cancer Res, 2006. 4(11): p. 821-9.
28. Rana, S., et al., Sequential changes in antiangiogenic factors in early pregnancy and
risk of developing preeclampsia. Hypertension, 2007. 50(1): p. 137-42.
29. Belo, L., et al., Apolipoprotein E and cholesteryl ester transfer protein polymorphisms
in normal and preeclamptic pregnancies. Eur J Obstet Gynecol Reprod Biol, 2004. 112(1): p.
9-15.
30. Kim, S.Y., et al., Maternal serum and amniotic fluid inhibin A levels in women who
subsequently develop severe preeclampsia. J Korean Med Sci, 2006. 21(3): p. 452-6.
31. Muttukrishna, S., et al., Uterine vein and maternal urinary levels of activin A and
inhibin A in pre-eclampsia patients. Clin Endocrinol (Oxf), 2006. 64(4): p. 469-73.
32. Spencer, K., N.J. Cowans, and K.H. Nicolaides, Low levels of maternal serum PAPP-
A in the first trimester and the risk of pre-eclampsia. Prenat Diagn, 2008. 28(1): p. 7-10.
124 References
33. Nicolaides, K.H., et al., A novel approach to first-trimester screening for early pre-
eclampsia combining serum PP-13 and Doppler ultrasound. Ultrasound Obstet Gynecol,
2006. 27(1): p. 13-7.
34. Chafetz, I., et al., First-trimester placental protein 13 screening for preeclampsia and
intrauterine growth restriction. Am J Obstet Gynecol, 2007. 197(1): p. 35 e1-7.
35. Robertson, S.A., Immune regulation of conception and embryo implantation-all about
quality control? J Reprod Immunol. 85(1): p. 51-7.
36. Gellersen, B., I.A. Brosens, and J.J. Brosens, Decidualization of the human
endometrium: mechanisms, functions, and clinical perspectives. Semin Reprod Med, 2007.
25(6): p. 445-53.
37. Gupta, A.K., et al., A comparative study of the effect of three different
syncytiotrophoblast micro-particles preparations on endothelial cells. Placenta, 2005. 26(1): p.
59-66.
38. Casals, E., et al., First-trimester biochemical markers for Down syndrome. Prenat
Diagn, 1999. 19(1): p. 8-11.
39. Nissum, M. and A.L. Foucher, Analysis of human plasma proteins: a focus on sample
collection and separation using free-flow electrophoresis. Expert Rev Proteomics, 2008. 5(4):
p. 571-87.
40. Malmstrom, J., et al., Optimized peptide separation and identification for mass
spectrometry based proteomics via free-flow electrophoresis. J Proteome Res, 2006. 5(9): p.
2241-9.
41. Moritz, R.L. and R.J. Simpson, Liquid-based free-flow electrophoresis-reversed-phase
HPLC: a proteomic tool. Nat Methods, 2005. 2(11): p. 863-73.
42. Gatlin, C.L., et al., Automated identification of amino acid sequence variations in
proteins by HPLC/microspray tandem mass spectrometry. Anal Chem, 2000. 72(4): p. 757-
63.
125 References
43. Luzzati, A.L., E. Giacomini, and I. Lefkovits, Expression of antibody-forming cell
clones in two-stage cultures: an attempt to separate proliferation and maturation events.
Immunology, 1985. 56(4): p. 597-603.
44. Ouvry-Patat, S.A., et al., Free-flow electrophoresis for top-down proteomics by
Fourier transform ion cyclotron resonance mass spectrometry. Proteomics, 2008. 8(14): p.
2798-808.
45. Nissum, M., et al., Two-dimensional separation of human plasma proteins using
iterative free-flow electrophoresis. Proteomics, 2007. 7(23): p. 4218-27.
46. Anton, L., et al., Activation of local chorionic villi angiotensin II levels but not
angiotensin (1-7) in preeclampsia. Hypertension, 2008. 51(4): p. 1066-72.
47. Jeschke, U., et al., Expression of galectin-1, -3 (gal-1, gal-3) and the Thomsen-
Friedenreich (TF) antigen in normal, IUGR, preeclamptic and HELLP placentas. Placenta,
2007. 28(11-12): p. 1165-73.
48. Madsen, E.M., et al., Human placenta secretes apolipoprotein B-100-containing
lipoproteins. J Biol Chem, 2004. 279(53): p. 55271-6.
49. Kralova, A., et al., Differential transferrin expression in placentae from normal and
abnormal pregnancies: a pilot study. Reprod Biol Endocrinol, 2008. 6: p. 27.
50. Bulla, R., et al., Decidual endothelial cells express surface-bound C1q as a molecular
bridge between endovascular trophoblast and decidual endothelium. Mol Immunol, 2008.
45(9): p. 2629-40.
51. Kim, S.Y., et al., Increased sFlt-1 to PlGF ratio in women who subsequently develop
preeclampsia. J Korean Med Sci, 2007. 22(5): p. 873-7.
52. Spencer, K., N.J. Cowans, and A. Stamatopoulou, ADAM12s in maternal serum as a
potential marker of pre-eclampsia. Prenat Diagn, 2008. 28(3): p. 212-6.
53. Akolekar, R., et al., Maternal serum placental protein 13 at 11-13 weeks of gestation
in preeclampsia. Prenat Diagn, 2009. 29(12): p. 1103-8.
126 References
54. Khalil, A., et al., First trimester maternal serum placental protein 13 for the prediction
of pre-eclampsia in women with a priori high risk. Prenat Diagn, 2009. 29(8): p. 781-9.
55. Norwitz, E.R., Defective implantation and placentation: laying the blueprint for
pregnancy complications. Reprod Biomed Online, 2006. 13(4): p. 591-9.
56. Kolla, V., et al., Quantitative proteomics analysis of maternal plasma in Down
syndrome pregnancies using isobaric tagging reagent (iTRAQ). J Biomed Biotechnol. 2010:
p. 952047.
57. Unwin, R.D., et al., Quantitative proteomic analysis using isobaric protein tags enables
rapid comparison of changes in transcript and protein levels in transformed cells. Mol Cell
Proteomics, 2005. 4(7): p. 924-35.
58. Elias, J.E. and S.P. Gygi, Target-decoy search strategy for increased confidence in
large-scale protein identifications by mass spectrometry. Nat Methods, 2007. 4(3): p. 207-14.
59. Mi, H., et al., PANTHER version 6: protein sequence and function evolution data with
expanded representation of biological pathways. Nucleic Acids Res, 2007. 35(Database
issue): p. D247-52.
60. Glen, A., et al., iTRAQ-facilitated proteomic analysis of human prostate cancer cells
identifies proteins associated with progression. J Proteome Res, 2008. 7(3): p. 897-907.
61. Gan, C.S., et al., Technical, experimental, and biological variations in isobaric tags for
relative and absolute quantitation (iTRAQ). J Proteome Res, 2007. 6(2): p. 821-7.
62. Blumenstein, M., et al., A proteomic approach identifies early pregnancy biomarkers
for preeclampsia: novel linkages between a predisposition to preeclampsia and cardiovascular
disease. Proteomics, 2009. 9(11): p. 2929-45.
63. Skornicka, E.L., et al., Pregnancy zone protein is a carrier and modulator of placental
protein-14 in T-cell growth and cytokine production. Cell Immunol, 2004. 232(1-2): p. 144-
56.
127 References
64. Atkinson, K.R., et al., An altered pattern of circulating apolipoprotein E3 isoforms is
implicated in preeclampsia. J Lipid Res, 2009. 50(1): p. 71-80.
65. Williams, V.K., et al., Fibrinogen concentration and factor VIII activity in women
with preeclampsia. Hypertens Pregnancy, 2007. 26(4): p. 415-21.
66. Rockett, J.C., Genomic and proteomic techniques applied to reproductive biology.
Genome Biol, 2001. 2(9): p. REPORTS4020.
67. Gerton, G.L., et al., A serum proteomics approach to the diagnosis of ectopic
pregnancy. Ann N Y Acad Sci, 2004. 1022: p. 306-16.
68. Rodland, K.D., Proteomics and cancer diagnosis: the potential of mass spectrometry.
Clin Biochem, 2004. 37(7): p. 579-83.
69. Zhang, Z., et al., Three biomarkers identified from serum proteomic analysis for the
detection of early stage ovarian cancer. Cancer Res, 2004. 64(16): p. 5882-90.
70. Otu, H.H., et al., Prediction of diabetic nephropathy using urine proteomic profiling 10
years prior to development of nephropathy. Diabetes Care, 2007. 30(3): p. 638-43.
71. Meuwis, M.A., et al., Biomarker discovery for inflammatory bowel disease, using
proteomic serum profiling. Biochem Pharmacol, 2007. 73(9): p. 1422-33.
72. Johann, D.J., Jr., et al., Clinical proteomics and biomarker discovery. Ann N Y Acad
Sci, 2004. 1022: p. 295-305.
73. Kolialexi, A., et al., Application of proteomics for the identification of differentially
expressed protein markers for Down syndrome in maternal plasma. Prenat Diagn, 2008.
28(8): p. 691-8.
74. Krantz, D., et al., First-trimester maternal dried blood Down syndrome screening
marker levels in early pregnancy loss. Prenat Diagn, 2006. 26(12): p. 1137-41.
75. Bajo, M., et al., Proteomic evaluation of intermediary metabolism enzyme proteins in
fetal Down's syndrome cerebral cortex. Proteomics, 2002. 2(11): p. 1539-46.
128 References
76. Lawrence, C.B. and V.V. Solovyev, Assignment of position-specific error probability
to primary DNA sequence data. Nucleic Acids Res, 1994. 22(7): p. 1272-80.
77. Adkins, J.N., et al., Toward a human blood serum proteome: analysis by
multidimensional separation coupled with mass spectrometry. Mol Cell Proteomics, 2002.
1(12): p. 947-55.
78. Wagner, M., et al., Computational protein biomarker prediction: a case study for
prostate cancer. BMC Bioinformatics, 2004. 5: p. 26.
79. Pettker, C.M., et al., Value of placental microbial evaluation in diagnosing intra-
amniotic infection. Obstet Gynecol, 2007. 109(3): p. 739-49.
80. Buhimschi, C.S., et al., Proteomic profiling of the amniotic fluid to detect
inflammation, infection, and neonatal sepsis. PLoS Med, 2007. 4(1): p. e18.
81. Lange, V., et al., Selected reaction monitoring for quantitative proteomics: a tutorial.
Mol Syst Biol, 2008. 4: p. 222.
82. Picotti, P., et al., Full dynamic range proteome analysis of S. cerevisiae by targeted
proteomics. Cell, 2009. 138(4): p. 795-806.
83. Picotti, P., et al., High-throughput generation of selected reaction-monitoring assays
for proteins and proteomes. Nat Methods. 7(1): p. 43-6.

129 Curriculum vitae
8 Curriculum vitae
Varaprasad Kolla
Lab for Prenatal Medicine, 416, Department of Biomedicine(DBM) Hebelstrasse, 20 4031, Basel Switzerland
Ph No. 0041 61 2659222
0041 61 2659223 Fax No.0041 61 2659399 E-Mail: [email protected]
PERSONAL DETAILS
Date of Birth : 11th December 1978
Nationality : Indian
Language Proficiency : English, Hindi, Marathi, Telugu (Fluent)
German (Basic)
EDUCATION AND REASEARCH EXPERIENCE
2006-till now Ph.D. thesis in Molecular Medicine. Lab for Prenatal Medicine Department of Biomedicine, University Hospital Basel, Switzerland EU Research fellowship (FP6-Pregenesys project)
Project: “ Early Identification of Screening Biomarker’s for Pregnancy related disorder using Proteomics approach.” Supervisor: Prof. Hahn.
Degree expected: May 2010
2005-2006 Scientific research assistant. Institute for Animal Pathology, Vet Swiss Faculty, University of Bern, Bern, Switzerland.
Project: “To investigate the role of Keratinocytes in Canine Atopic Dermatitis (AD)” Supervisor: Prof. E. J. Muller
2003-2005 Scientific research assistant.
Centre for Cellular and Molecular Biology (CCMB), Hyderabad, India
Project: “To identify the nonconventional role of Heat Shock Factors (HSF)” Supervisors: Dr. Usha Srinivas and Dr. A. S. Shreedhar.
130 Curriculum vitae
Project: “Developing Molecular marker for Handigodu disease and Leigh’s Syndrome” Supervisor: Dr. G.R. Chandak.
2002-2003 Advance Diploma Protein Modeling and Drug Design, GVK Bioscience, Hyderabad, India
2000-2002 Master degree (MSc.) in Biotechnology, Dept. Of Biotechnology, Amravati University, Amravati, India
Project: “Genetic Characterization of Multi Drug Resistant bacteria from Hospital waste” Supervisors: Dr. Thakare
Ph.D. PROJECT Project: “Identification of screening biomarker’s for pregnancy related disorders using proteomics approach” Down syndrome (DS) is the most common fetal chromosomal disorder in live births and a key cause of mental retardation. Current screening approaches are hampered by lack of specificity and a high false positive rate (>5%). Since the placenta is in direct contact with maternal circulation, we sought whether protein differences can be detected between affected and normal pregnancies. Preeclampsia, is a severe pregnancy related disorder, is leading cause of fetal and maternal mortality. No marker exists for reliable identification of at risk pregnancies. As the DS placentae show structural alteration and PE involves placental dysfunction, we examined whether quantitative iTRAQ proteomics of plasma sample could be used differentially expressed proteins.
LABORATORY SKILLS AND TECHNICAL EXPERTISE
Mass spectrometry and Proteomics
- Quantitative Phosphoproteomics using SILAC approach - Protein identification and characterization using nanoLC-MS/MS sequencing by Maldi-
TOF/TOF (4800 from Applied Biosystems) and ESI-LTQ-Orbitrap (Thermo Fischer). - Differential protein quantification by isobaric labeling approaches (iTRAQ) - 2D-gel electrophoresis and image analysis - Protein fractionation using Free Flow Electrophoresis (BD™ FFE system) in complex fluids
such as plasma
Bioinformatics
- Mass spectrometry platform dedicated software: Analyst (Applied Biosystems), Xcalibur (Thermo Electron
- Protein identification software: Mascot (Matrix Science), Sequest (Bioworks from ThermoElectron) , on-line proteomics and sequence analysis tools.
- Bioinformatic tools for proteomic quantification: Protein Pilot - Functional annotation tools : Ingenuity Pathway Analysis, Protein center, GoMiner, FatiGo,
PANTHER - Image analysis : Image Master 2D Platinum 5.0 (GE Healthcare), Quantity one (Biorad)

131 Curriculum vitae
Protein and Peptide Biochemistry
- Protein and peptide separation using mono- and two-dimensional gel electrophoresis and liquid chromatography-based systems (RP, ion exchange, affinity).
- Protein proteolysis using endoproteolytic enzymes or chemical reagents in-gel or in- solution.
Biology
- Cell culture, ELISA, Western blot analysis, Immuno precipitation (IP).
COMMUNICATIONS Talk ‘’ Biomarkers for Non-Invasive Prenatal Diagnosis and Pregnancy Related Disorders
Using Quantitative Proteomics’’. Swiss proteomics society annual meeting, ETH, Zurich, Switzerland, 2-4 December 2009
“Boimarker discovery Strategy for Trisomy 21 using Proteomics Tool” at Universitatklinikum , Gottingen, Germany, 24 October 2007
Conferences 2nd annual European Biomarkers Summit, Amsterdam, Netherlands, 4-5 September
2007 (poster presentation) Workshop SAFE Practical Workshop on Non-Invasive Prenatal Diagnosis, Ronzano, Bologna,
Italy, 24th -25th February, 2008
2nd EU-Summer school in Proteomic Basics ‘Protein Identification-MassSpectrometry’. Kloster Neustift, (Brixen, South Tyrol, Italy), 13th-19th July 2008
SAFE Proteomics Workshop at University of the West of England, Bristol, England, 26th -28th January 2007
Posters Varaprasad Kolla, Wolfgang Holzgreve, Sinuhe Hahn Biomarker discovery strategy for trisomy 21 using iTRAQ and 4800 plus MALDI TOF/TOF, European Biomarkers Summit, Amsterdam, 4-5 September 2007.
Course Faculty for ‘Course in Prenatal Genetic Diagnosis’ organised by European Cytogeneticists Association (ECA), Goldrain Castle-South Tyrol, Italy. 19th -24th September 2009
AWARDS AND ACHIEVEMENT Registration and travel grant to attendant 2nd EU-Summer school in Proteomic Basics ‘Protein Identification-MassSpectrometry’. Kloster Neustift, (Brixen, South Tyrol, Italy), 13th-19th July 2008. PROFFESIONAL MEMBERSHIP Swiss Proteomics Society (SPS) BioValley, Basel
132 Curriculum vitae
PUBLICATIONS Kolla V , Jenö P, Moes S, Tercanli S, Lapaire O, Choolani M, Hahn S. Quantitative proteomics analysis of maternal plasma in Down Syndrome pregnancies using isobaric tagging reagent (iTRAQ). J Biomed Biotechnol. Volume 2010(2010) Article ID 952047. Sikora A, Zimmermann BG, Rusterholz C, Birri D, Kolla V , Lapaire O., et al Detection of Increased Amount of Cell-Free Fetal DNA with Short PCR Amplicons. Clin Chem. 2010 Jan;56(1):136-8 Hahn S, Jackson LG, Kolla V , Mahyuddin AP, Choolani M. Noninvasive prenatal diagnosis of fetal aneuploidies and Mendelian disorders: new innovative strategies. Expert Rev Mol Diagn. 2009 Sep;9(6): 613-21. Review Choolani M, Narasimhan K, Kolla V , Hahn S. Proteomic Technologies for Prenatal Diagnostics: Advance and Challenges ahead Expert Rev Proteomics. 2009 Fab;6(1):87-101. Review Kolla V Prasad, Aftab Taiyab. D Jyothi, Usha K Srinivas, Amere S Sreedhar Heat shock transcription factors regulate heat induced cell death in a rat histiocytoma. J Biosci. 2007 Apr;32(3):585-93
The Indian Genome Variation database (IGVdb): a project overview Human Genetics. Hum Genet. 2005 Oct;118(1):1-11.
REFRENCES Prof. Hahn Prenatal Medicine DMB-Hebelstrasse 20, CH-4031, Basel Office Phone: +41 61 265 9249 Email: [email protected] Prof. Choolani Diagnostic Biomarker Discovery Laboratory Obstetrics and Gynaecology Department National University Hospital
5 Lower Kent Ridge Road, Singapore
Dr. Paul Jenö Mass Spectrometry ,Biozentrum, University of Basel, Klingelbergstrasse 50/70 CH-4056 Basel / Switzerland Office Phone: +41612672156 Email: [email protected]