Embed Size (px)
Citation preview
International Journal of
Environmental Research
and Public Health
Article
Impact of HVAC-Systems on the Dispersion ofInfectious Aerosols in a Cardiac Intensive Care Unit
Larisa Anghel 1,2, Cătălin-George Popovici 3, Cristian Stătescu 1,2,* , Radu Sascău 1,2,*,Marina Verdes, 3, Vasilică Ciocan 3, Ionela-Lăcrămioara S, erban 4, Minela Aida Mărănducă 4,Sebastian-Valeriu Hudis, teanu 3 and Florin-Emilian T, urcanu 3
1 Internal Medicine Department, Grigore T. Popa University of Medicine and Pharmacy, 700503 Ias, i, Romania;[email protected]
2 Cardiology Department, Cardiovascular Diseases Institute, Prof. Dr. George I.M. Georgescu, 700503 Ias, i, Romania3 Building Services Department, Faculty of Civil Engineering and Building Services, Gheorghe Asachi
Technical University, 700050 Iasi, Romania; [email protected] (C.-G.P.);[email protected] (M.V.); [email protected] (V.C.); [email protected] (S.-V.H.);[email protected] (F.-E.T, .)
4 Physiology Department, Grigore T. Popa University of Medicine and Pharmacy, 700503 Ias, i, Romania;[email protected] (I.-L.S, .); [email protected] (M.A.M.)
* Correspondence: [email protected] (C.S.); [email protected] (R.S.);Tel.: +40-0232-211834 (C.S. & R.S.)
Received: 19 July 2020; Accepted: 7 September 2020; Published: 10 September 2020�����������������
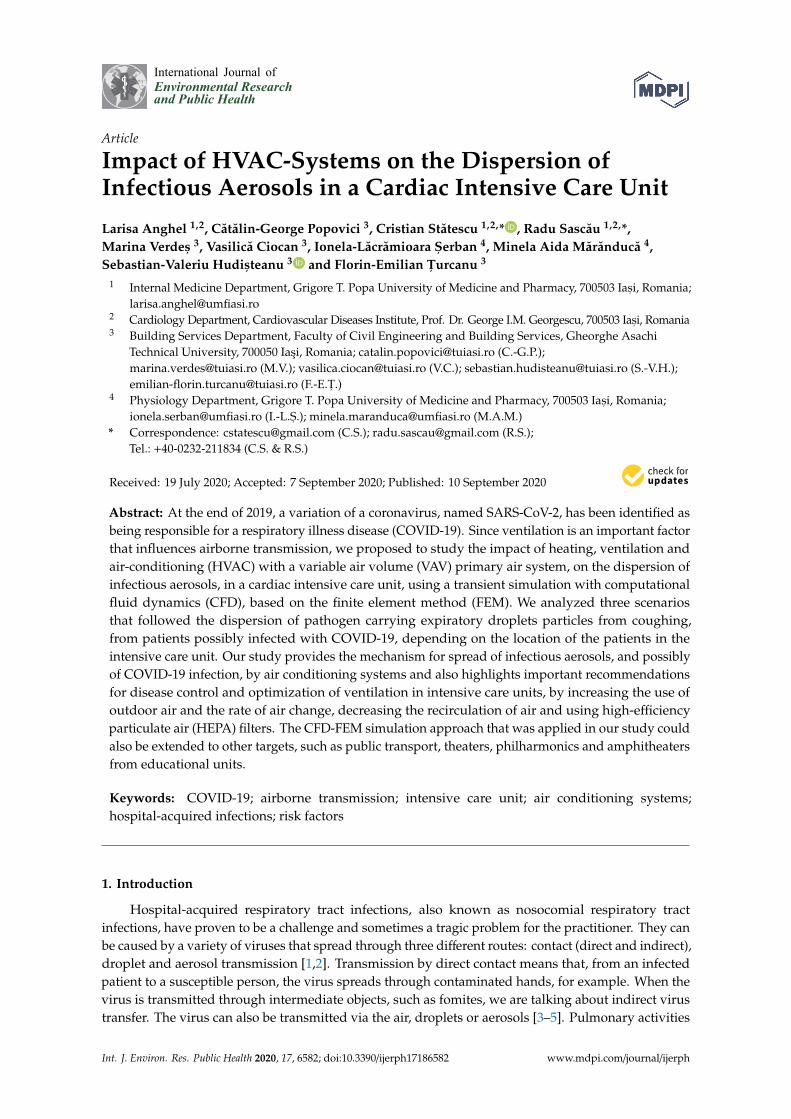
Abstract: At the end of 2019, a variation of a coronavirus, named SARS-CoV-2, has been identified asbeing responsible for a respiratory illness disease (COVID-19). Since ventilation is an important factorthat influences airborne transmission, we proposed to study the impact of heating, ventilation andair-conditioning (HVAC) with a variable air volume (VAV) primary air system, on the dispersion ofinfectious aerosols, in a cardiac intensive care unit, using a transient simulation with computationalfluid dynamics (CFD), based on the finite element method (FEM). We analyzed three scenariosthat followed the dispersion of pathogen carrying expiratory droplets particles from coughing,from patients possibly infected with COVID-19, depending on the location of the patients in theintensive care unit. Our study provides the mechanism for spread of infectious aerosols, and possiblyof COVID-19 infection, by air conditioning systems and also highlights important recommendationsfor disease control and optimization of ventilation in intensive care units, by increasing the use ofoutdoor air and the rate of air change, decreasing the recirculation of air and using high-efficiencyparticulate air (HEPA) filters. The CFD-FEM simulation approach that was applied in our study couldalso be extended to other targets, such as public transport, theaters, philharmonics and amphitheatersfrom educational units.
Keywords: COVID-19; airborne transmission; intensive care unit; air conditioning systems;hospital-acquired infections; risk factors
1. Introduction
Hospital-acquired respiratory tract infections, also known as nosocomial respiratory tractinfections, have proven to be a challenge and sometimes a tragic problem for the practitioner. They canbe caused by a variety of viruses that spread through three different routes: contact (direct and indirect),droplet and aerosol transmission [1,2]. Transmission by direct contact means that, from an infectedpatient to a susceptible person, the virus spreads through contaminated hands, for example. When thevirus is transmitted through intermediate objects, such as fomites, we are talking about indirect virustransfer. The virus can also be transmitted via the air, droplets or aerosols [3–5]. Pulmonary activities
Int. J. Environ. Res. Public Health 2020, 17, 6582; doi:10.3390/ijerph17186582 www.mdpi.com/journal/ijerph
Int. J. Environ. Res. Public Health 2020, 17, 6582 2 of 17
such as coughing [6,7], breathing [8], sneezing [8] or talking [9], are sources of bio-aerosols that canhave respiratory tract infections pathogens [7–9]. Large droplets (>10 microns), formed especiallyfrom coughing and sneezing, fall on surfaces and objects not further than 1–2 m from the infectedpatient [3,10]. People can catch the infection directly by standing within 1–2 meters of an infectedperson and breathing in these droplets. When people are standing within 1–2 meters of an infectedpatient or when they touch their mouth, nose or eyes after they touched the contaminated surfaces orobjects, they can catch the infection [10]. Droplets that evaporate (10 microns droplets evaporate in 0.2 s)and desiccate, form small particles (droplet nuclei or residue). Aerosols are small particles (<5 microns),with a slow velocity and may remain suspended in the air for hours and can be transported longdistances [1,4,11].
Respiratory viruses spread via these three routes depends on environmental factors, such ashumidity or temperature and crowding of people, and also on host factors such as receptor distributionall over the respiratory tract [5,11].
Airborne transmission is responsible for more than one third of hospital-acquired infections [12,13].This dangerous threat of airborne infection to human health has been reiterated by the severe acuterespiratory syndrome (SARS) in 2002–2003 [14,15], pandemic influenza A virus subtype H1N1 (A/H1N1)in 2009 [16], Middle East Respiratory Syndrome (MERS) in 2012 [17] and the ongoing pandemic ofcoronavirus disease 2019 (COVID-19), caused by severe acute respiratory syndrome coronavirus2 (SARS-CoV-2) [18].
Since 31 December 2019, when the Wuhan Municipal Health Commission reported 27 cases ofviral pneumonia, there was a rapid spread around the country and the entire world. This disease wasnamed Coronavirus Disease 2019 (COVID-19) by the World Health Organization. On 19 July 2020,the number of confirmed cases reached 14,007,791, with 597,105 deaths worldwide, according to theWorld Health Organization [19–21]. Coronaviruses have a small size of 70–120 nanometers [20–22]and SARS-CoV-2 remains active up to three hours in indoor air and up to three days on room surfaces,unless there is specific cleaning [20–26]. Because SARS-CoV-2 has such a small size, it can be carried byairflows, either in the room or in the extract air ducts of ventilation systems, and it can travel longdistances [25]. It is known that SARS-CoV-2 is mainly transmitted via respiratory droplets releasedfrom infected persons [19]. Current studies suggest that COVID-19 may be transmitted throughdroplets from patients with mild symptoms and even from asymptomatic ones [22], but not throughlong-range inhalation of aerosols, as in the case of tuberculosis or measles. However, considering thatmany respiratory infectious agents have a short-range aerosol transmission, this cannot be excludedin the case of SARS-CoV-2 infection, especially in poorly ventilated spaces or in crowded medicaldepartments [19]. According to the World Health Organization, during “medical aerosol generatingprocedures,” an airborne transmission of SARS-CoV-2 infection, through droplet nuclei (aerosols),can be encountered [26]. Until now, airborne transmission of SARS-CoV-2 has been demonstratedonly in a few experimental studies, and not for humans. In the absence of aerosol-generatingprocedures, further studies are needed in order to determine the role of aerosols in SARS-CoV-2transmission. Considering the small number of studies that evaluated the SARS-CoV-2 transmission inmedical departments, we aimed to evaluate the impact of heating, ventilation and air-conditioning(HVAC) systems on the dispersion of infectious aerosols, and possibly of COVID-19 transmission,in a cardiac intensive care unit. We chose this coronary intensive care unit due to the increasedaddressability of patients with serious health problems, who may require orotracheal intubation andmechanical ventilation.
Airborne transmission occurs more frequently in indoor environments where people spend over90% of their time [27], and it involves generation, transformation, transport and finally inhalation ofaerosols. Ventilation is one of the most important factors that influence airborne transmission [10].Thus far, few studies have demonstrated an association between ventilation of buildings and thetransmission of airborne infections [28–30]. Furthermore, there are no sufficient studies regarding theminimum ventilation requirements in hospitals, and especially in intensive care units, regarding the
Int. J. Environ. Res. Public Health 2020, 17, 6582 3 of 17
airborne transmission infections. Air purifiers with high-efficiency particulate air (HEPA) filters maybe a complementary way for removal of SARS-CoV-2 aerosols in healthcare settings. It is known thatthe disease spreads through droplet transmission, but studies are ongoing on what can stop or aid thetransmission, despite social distancing and a proper disinfection [31]. Maintaining distance from aninfected person might be insufficient and increasing the ventilation might be useful, considering thatthis will remove more particles [20].
Because ventilation is one of the most important factors that influence airborne transmission, it isnecessary to study the dispersion, heat and mass transfer of pathogen carrying expiratory dropletsfor better infection control strategies. Patients hospitalized in the cardiac intensive care units are athigh risk of developing major infections [32], which sometimes are associated with lethal clinicalconsequences and higher costs, due to prolonged hospitalizations and more frequent readmissions [33].Reducing the risk of hospital-acquired respiratory tract infections associated with air conditioningsystems is a key priority for improving intensive cardiac therapy. Considering that patients fromcardiac intensive care units are older and have other comorbidities that further increases their infectionrisk, COVID-19 infection represents a management challenge in these cases [34].
Considering the worldwide spread of the SARS-CoV-2 infection, the large number of infectedpeople and also deaths, we consider that it is critical to understand the modes of transmission ofSARS-CoV-2, in order to develop effective prevention and control strategies. In this clinical andepidemiological context, we proposed to study the impact of heating, ventilation and air-conditioningwith a variable air volume (VAV) primary air system on the dispersion of infectious aerosols, and possiblyon COVID-19 transmission, in a cardiac intensive care unit.
2. Materials and Methods
2.1. Room Model
The study was performed in a Cardiac Intensive Care Unit with an increased addressability ofpatients with serious health problems. The cardiac intensive care unit room contains seven bedswith the following geometry: Length ×Width ×Height = 13.00 m × 6.80 m × 2.75 m. The area of theroom is around 83 m2 and the volume is 229 m3. The intensive care unit is placed in the third windzone and the third climatic zone of Romania, with an outdoor temperature during winter of −18 °C(the design temperature). In order to study the dispersion of particles from coughing, influenced byair conditioning systems, we used the Computational Fluid Dynamics (CFD) approach, based on thefinite element method (FEM). The CFD models are the most used in order to improve the indoor airquality, but there still are two major challenges: turbulence modeling and experimental validation.Data acquisition was performed using a TESTO 480 equipment with an indoor air quality (IAQ) sensorfor airflow and particle concentration. Additionally, we used a TESTO DiSCmini particle counter tostudy the particle dispersion characteristics for PM10 and PM2.5. We evaluated these two parameters tosee the indoor air quality from the intensive care unit, with the existing heating system. Following themeasurements, we observed values above the upper limit in case of PM2.5 (the mean value was29 µg/m3) and at the upper limit of normal for PM10 (the mean value was 48 µg/m3). We used theseresults to define the particle concentration when we made the CFD simulation for the existing heatingsystem. The software used for CFD analysis was ANSYS FLUENT 2020 R1, with Elastic LicensingNumber 1078891, and we performed a three-dimensional (3D) numerical study of the indoor air.
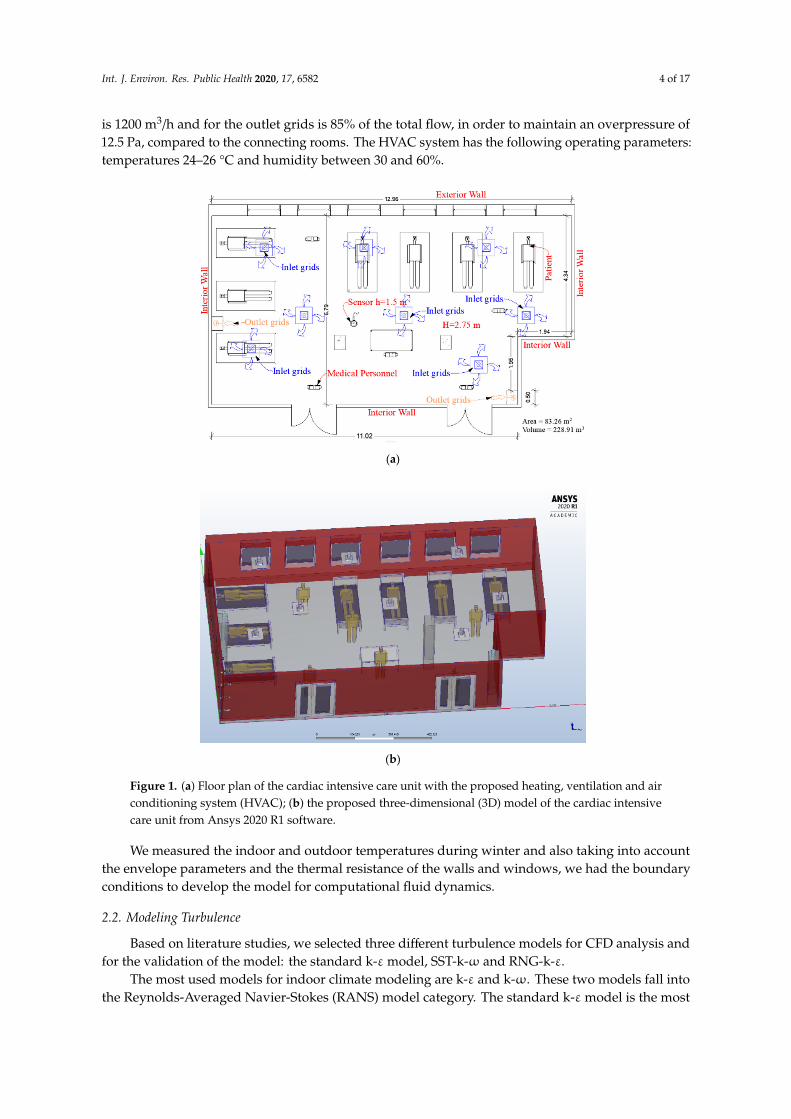
The heating system from the cardiac intensive care unit used static heaters, but, unfortunately,two years ago it was severely damaged by a fire. Considering the recommendation of the Federationof European Heating, Ventilation and Air Conditioning Associations (REHVA) [10] and the needs forthermal comfort and indoor air quality, it was changed with a heating, ventilation and air conditioningsystem (HVAC) (Figure 1). The HVAC system has seven inlet grids with the dimension of 600 × 600 mmand two outlet grids of 700 × 300 mm, placed in the lower third of the room height. The total airflowrate is 8400 m3/h and the system work with 100% fresh air supply. The airflow rate for each inlet grid
Int. J. Environ. Res. Public Health 2020, 17, 6582 4 of 17
is 1200 m3/h and for the outlet grids is 85% of the total flow, in order to maintain an overpressure of12.5 Pa, compared to the connecting rooms. The HVAC system has the following operating parameters:temperatures 24–26 °C and humidity between 30 and 60%.
Int. J. Environ. Res. Public Health 2020, 17, x FOR PEER REVIEW 4 of 17
an overpressure of 12.5 Pa, compared to the connecting rooms. The HVAC system has the following operating parameters: temperatures 24–26 ℃ and humidity between 30 and 60%.
(a)
(b)
Figure 1. (a) Floor plan of the cardiac intensive care unit with the proposed heating, ventilation and air conditioning system (HVAC); (b) the proposed three-dimensional (3D) model of the cardiac intensive care unit from Ansys 2020 R1 software.
We measured the indoor and outdoor temperatures during winter and also taking into account the envelope parameters and the thermal resistance of the walls and windows, we had the boundary conditions to develop the model for computational fluid dynamics.
2.2. Modeling Turbulence
Based on literature studies, we selected three different turbulence models for CFD analysis and for the validation of the model: the standard k-ε model, SST-k-ω and RNG-k-ε.
Figure 1. (a) Floor plan of the cardiac intensive care unit with the proposed heating, ventilation and airconditioning system (HVAC); (b) the proposed three-dimensional (3D) model of the cardiac intensivecare unit from Ansys 2020 R1 software.
We measured the indoor and outdoor temperatures during winter and also taking into accountthe envelope parameters and the thermal resistance of the walls and windows, we had the boundaryconditions to develop the model for computational fluid dynamics.
2.2. Modeling Turbulence
Based on literature studies, we selected three different turbulence models for CFD analysis andfor the validation of the model: the standard k-εmodel, SST-k-ω and RNG-k-ε.
The most used models for indoor climate modeling are k-ε and k-ω. These two models fall intothe Reynolds-Averaged Navier-Stokes (RANS) model category. The standard k-εmodel is the most
Int. J. Environ. Res. Public Health 2020, 17, 6582 5 of 17
used today. The basic idea was to develop an equation for ε, including reasonable approximations forcoefficients and to solve the equation of k with a similar equation.
The equations are expressed as follows:
∂(ρ ui)
∂t+∂(ρ uiuj)
∂xj=
∂∂xj
[(µ+ µt)
(∂ui
∂xj+∂uj
∂xi
)]−∂p∂xj
(1)
where:µt = Cµk2/ε (2)
The kinetic energy equation is of the form:
ρ∂k∂t
+ ρ uj∂k∂xj
=∂∂xj
[(µ+ µt/σk)
∂k∂xj
]+ Pk − ε (3)
Dissipation rate:
ρ∂ε∂t
+ ρ uj∂ε∂xj
=∂∂xj
[(µ+ µt/σε)
∂ε∂xj
]+ Cε1
ε
kPk −Cε2
ε2
k(4)
where the closing coefficients are defined as follows: Cε1 = 1.44; Cε2 = 1.92; Cµ = 0.09; σk = 1.0; σε = 1.3.In a more recent version of the k-εmodel a group renormalization theory (RNG) is used [35]. The RNG
model proposes a modification of the transport equation where the source term is solved as follows:
Sε =ε
k(Cε1P −Cε2D) −R (5)
In the standard model k-ε, the term R is missing; the term R is defined as follows:
R =Cµη3(1− η/η0)
1 + βη3ε2
k(6)
where β and η0 are constant and have the values 0.015 and 4.38, respectively.The effect that the correction has on the standard model k-ε, the introduction of this term R is the
ability to react to the rapid change of voltage and the simplification of the curvature of current lines.The constants in the turbulent transport equation have the following values: Cµ = 0.0845, σk = 0.718;
σε = 0.718, Cε1 = 1.42; Cε2 = 1.68.The RNG k-εmodel is better to model high and low Reynolds numbers in the same flow. This is
the reason why this turbulence model is preferred for ventilation, air quality problems and airborneinfection in healthcare units. Additionally, in our study, we observed the validation of the model forthe RNG k-ε turbulence model.
The k-ωmodel was developed by Kolmogorov [36]. It has several advantages over the k-εmodel,being able to calculate the unfavorable effects of pressure gradients. The Shear Stress Transport model(SST-k-ω) was first stated by Menter [37]. The equations describing the SST-k-ω model is based onboth components of the k-ε and k-ω turbulence model.
Kinetic energy equation:
∂ρ k∂t
= τij∂ui
∂xj−β ∗ ρ kω+
∂∂xj
[(µ+ σkµt)
∂k∂xj
](7)
Dissipation rate:
∂ρ ω∂t
=γ
νtτij∂ui
∂xj−β ∗ ρ ω2 +
∂∂xj
[(µ+ σkµt)
∂ω∂xj
]− 2ρ (1− F1)σω2
1ω
∂k∂xj
∂ω∂xj
(8)
Int. J. Environ. Res. Public Health 2020, 17, 6582 6 of 17
where:
2ρ (1− F1)σω21ω
∂k∂xj
∂ω∂xj
(9)
represents the cross-diffusion rate
Pω = γω
kτij∂ui
∂xj(10)
represents the production term
νt =kω
. (11)
The model constants have the following values: σk,1 = 1.176, σk,2 = 1, σω,1 = 2, σω,2 = 1.168,α1 = 0.31, βi,1 = 0.075, βi,2 = 0.0828.
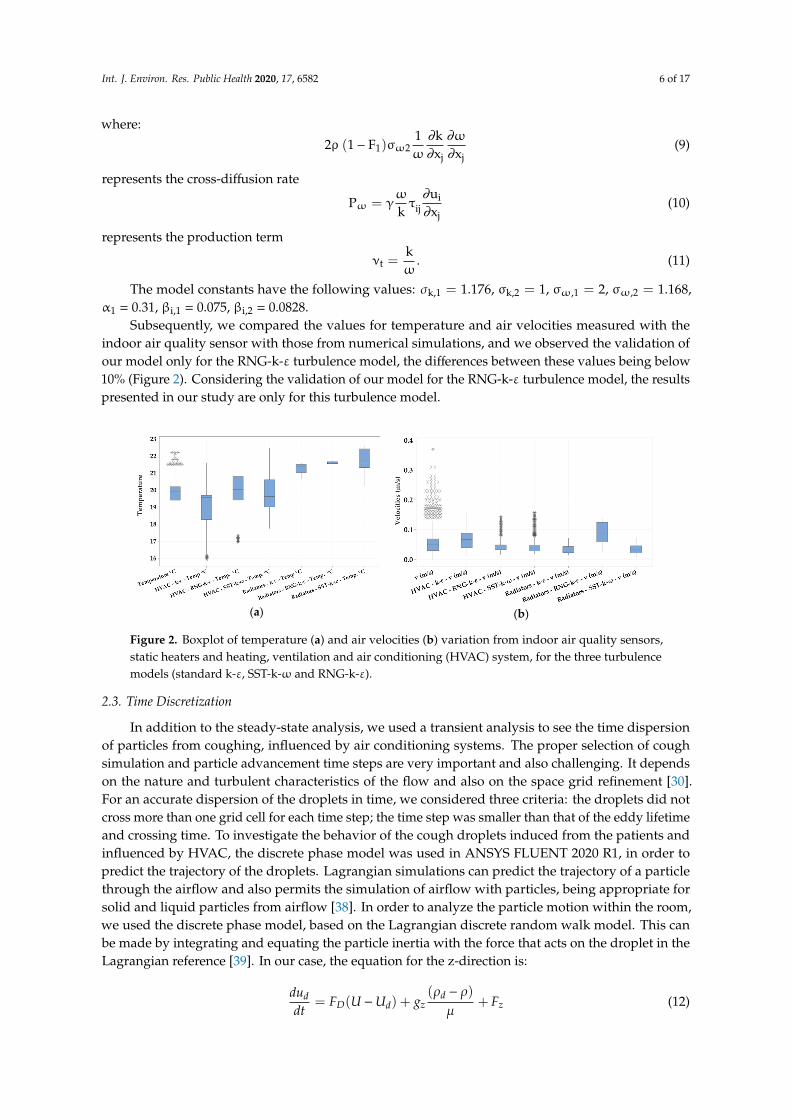
Subsequently, we compared the values for temperature and air velocities measured with theindoor air quality sensor with those from numerical simulations, and we observed the validation ofour model only for the RNG-k-ε turbulence model, the differences between these values being below10% (Figure 2). Considering the validation of our model for the RNG-k-ε turbulence model, the resultspresented in our study are only for this turbulence model.
Int. J. Environ. Res. Public Health 2020, 17, x FOR PEER REVIEW 6 of 17
iij
j
uPk xω
∂ω= γ τ∂
(10)
represents the production term
tkν =ω (11)
The model constants have the following values: k,1 1.176σ = , k,2 1σ = , ,1 2ωσ = , 2 1 168ωσ =, . ,
α1 = 0.31, βi,1 = 0.075, βi,2 = 0.0828. Subsequently, we compared the values for temperature and air velocities measured with the
indoor air quality sensor with those from numerical simulations, and we observed the validation of our model only for the RNG-k-ε turbulence model, the differences between these values being below 10% (Figure 2). Considering the validation of our model for the RNG-k-ε turbulence model, the results presented in our study are only for this turbulence model.
(a)
(b)
Figure 2. Boxplot of temperature (a) and air velocities (b) variation from indoor air quality sensors, static heaters and heating, ventilation and air conditioning (HVAC) system, for the three turbulence models (standard k-ε, SST-k-ω and RNG-k-ε).
2.3. Time Discretization
In addition to the steady-state analysis, we used a transient analysis to see the time dispersion of particles from coughing, influenced by air conditioning systems. The proper selection of cough simulation and particle advancement time steps are very important and also challenging. It depends on the nature and turbulent characteristics of the flow and also on the space grid refinement [30]. For an accurate dispersion of the droplets in time, we considered three criteria: the droplets did not cross more than one grid cell for each time step; the time step was smaller than that of the eddy lifetime and crossing time. To investigate the behavior of the cough droplets induced from the patients and influenced by HVAC, the discrete phase model was used in ANSYS FLUENT 2020 R1, in order to predict the trajectory of the droplets. Lagrangian simulations can predict the trajectory of a particle through the airflow and also permits the simulation of airflow with particles, being appropriate for solid and liquid particles from airflow [38]. In order to analyze the particle motion within the room, we used the discrete phase model, based on the Lagrangian discrete random walk model. This can be made by integrating and equating the particle inertia with the force that acts on the droplet in the Lagrangian reference [39]. In our case, the equation for the z-direction is: 𝑑𝑢𝑑𝑡 𝐹 𝑈 𝑈 𝑔 𝜌 𝜌µ 𝐹 (12)
where: 𝐹 𝑈 𝑈 is the drag force per unit droplet mass; 𝑈 is the velocity of the droplet;
Figure 2. Boxplot of temperature (a) and air velocities (b) variation from indoor air quality sensors,static heaters and heating, ventilation and air conditioning (HVAC) system, for the three turbulencemodels (standard k-ε, SST-k-ω and RNG-k-ε).
2.3. Time Discretization
In addition to the steady-state analysis, we used a transient analysis to see the time dispersionof particles from coughing, influenced by air conditioning systems. The proper selection of coughsimulation and particle advancement time steps are very important and also challenging. It dependson the nature and turbulent characteristics of the flow and also on the space grid refinement [30].For an accurate dispersion of the droplets in time, we considered three criteria: the droplets did notcross more than one grid cell for each time step; the time step was smaller than that of the eddy lifetimeand crossing time. To investigate the behavior of the cough droplets induced from the patients andinfluenced by HVAC, the discrete phase model was used in ANSYS FLUENT 2020 R1, in order topredict the trajectory of the droplets. Lagrangian simulations can predict the trajectory of a particlethrough the airflow and also permits the simulation of airflow with particles, being appropriate forsolid and liquid particles from airflow [38]. In order to analyze the particle motion within the room,we used the discrete phase model, based on the Lagrangian discrete random walk model. This canbe made by integrating and equating the particle inertia with the force that acts on the droplet in theLagrangian reference [39]. In our case, the equation for the z-direction is:
duddt
= FD(U −Ud) + gz(ρd − ρ)
µ+ Fz (12)
Int. J. Environ. Res. Public Health 2020, 17, 6582 7 of 17
where:FD(U −Ud) is the drag force per unit droplet mass;Ud is the velocity of the droplet;ρd is the density of the droplet;gz is the force of gravity of the droplet in z direction;µ is the molecular viscosityFz is an additional force.Using an HP Platform Z840, with two Xeon Processor E5-2690 v4, we performed the simulation on
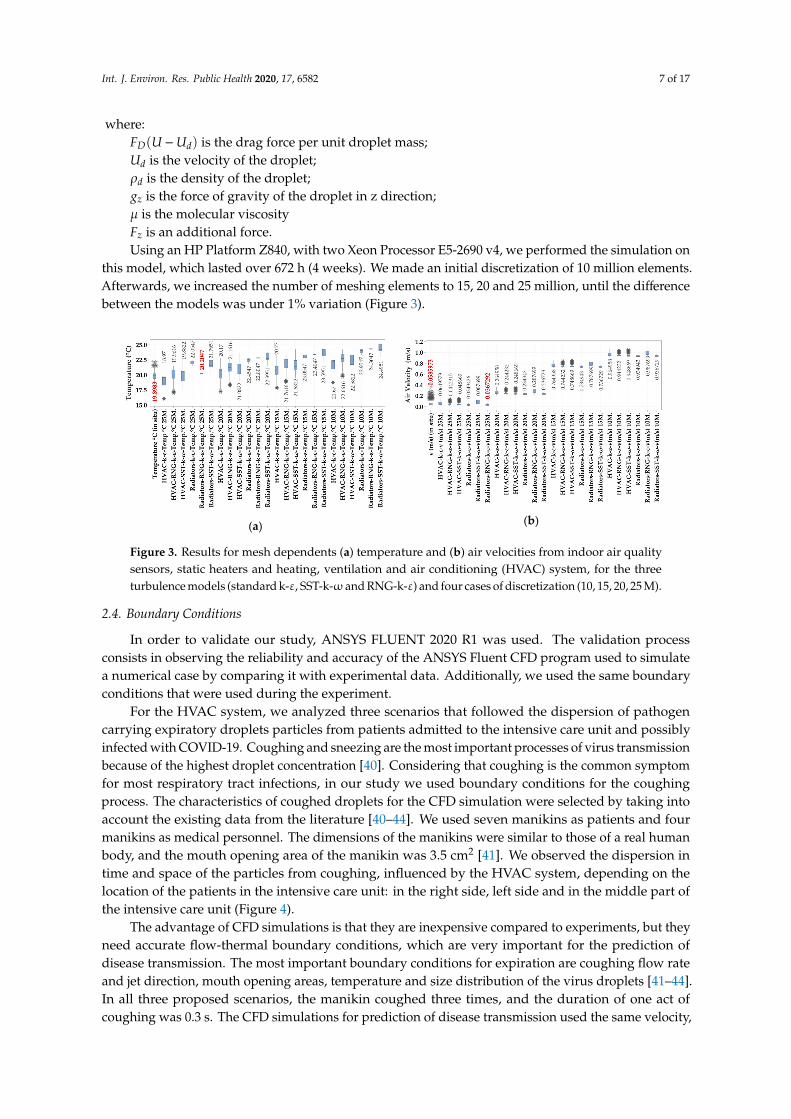
this model, which lasted over 672 h (4 weeks). We made an initial discretization of 10 million elements.Afterwards, we increased the number of meshing elements to 15, 20 and 25 million, until the differencebetween the models was under 1% variation (Figure 3).
Int. J. Environ. Res. Public Health 2020, 17, x FOR PEER REVIEW 7 of 17
𝜌 is the density of the droplet; 𝑔 is the force of gravity of the droplet in z direction; µ is the molecular viscosity 𝐹 is an additional force.
Using an HP Platform Z840, with two Xeon Processor E5-2690 v4, we performed the simulation on this model, which lasted over 672 h (4 weeks). We made an initial discretization of 10 million elements. Afterwards, we increased the number of meshing elements to 15, 20 and 25 million, until the difference between the models was under 1% variation (Figure 3).
(a)
(b)
Figure 3. Results for mesh dependents (a) temperature and (b) air velocities from indoor air quality sensors, static heaters and heating, ventilation and air conditioning (HVAC) system, for the three turbulence models (standard k-ε, SST-k-ω and RNG-k-ε) and four cases of discretization (10, 15, 20, 25 M).
2.4. Boundary Conditions
In order to validate our study, ANSYS FLUENT 2020 R1 was used. The validation process consists in observing the reliability and accuracy of the ANSYS Fluent CFD program used to simulate a numerical case by comparing it with experimental data. Additionally, we used the same boundary conditions that were used during the experiment.
For the HVAC system, we analyzed three scenarios that followed the dispersion of pathogen carrying expiratory droplets particles from patients admitted to the intensive care unit and possibly infected with COVID-19. Coughing and sneezing are the most important processes of virus transmission because of the highest droplet concentration [40]. Considering that coughing is the common symptom for most respiratory tract infections, in our study we used boundary conditions for the coughing process. The characteristics of coughed droplets for the CFD simulation were selected by taking into account the existing data from the literature [40–44]. We used seven manikins as patients and four manikins as medical personnel. The dimensions of the manikins were similar to those of a real human body, and the mouth opening area of the manikin was 3.5 cm2 [41]. We observed the dispersion in time and space of the particles from coughing, influenced by the HVAC system, depending on the location of the patients in the intensive care unit: in the right side, left side and in the middle part of the intensive care unit (Figure 4).
The advantage of CFD simulations is that they are inexpensive compared to experiments, but they need accurate flow-thermal boundary conditions, which are very important for the prediction of disease transmission. The most important boundary conditions for expiration are coughing flow rate and jet direction, mouth opening areas, temperature and size distribution of the virus droplets [41–44]. In all three proposed scenarios, the manikin coughed three times, and the duration of one act of coughing was 0.3 s. The CFD simulations for prediction of disease transmission used the same velocity, cough flow rate and mouth opening area. The particle size was between 2.5 µm and 200 µm. In Table 1 we presented the boundary conditions used in our CFD simulations.
Figure 3. Results for mesh dependents (a) temperature and (b) air velocities from indoor air qualitysensors, static heaters and heating, ventilation and air conditioning (HVAC) system, for the threeturbulence models (standard k-ε, SST-k-ω and RNG-k-ε) and four cases of discretization (10, 15, 20, 25 M).
2.4. Boundary Conditions
In order to validate our study, ANSYS FLUENT 2020 R1 was used. The validation processconsists in observing the reliability and accuracy of the ANSYS Fluent CFD program used to simulatea numerical case by comparing it with experimental data. Additionally, we used the same boundaryconditions that were used during the experiment.
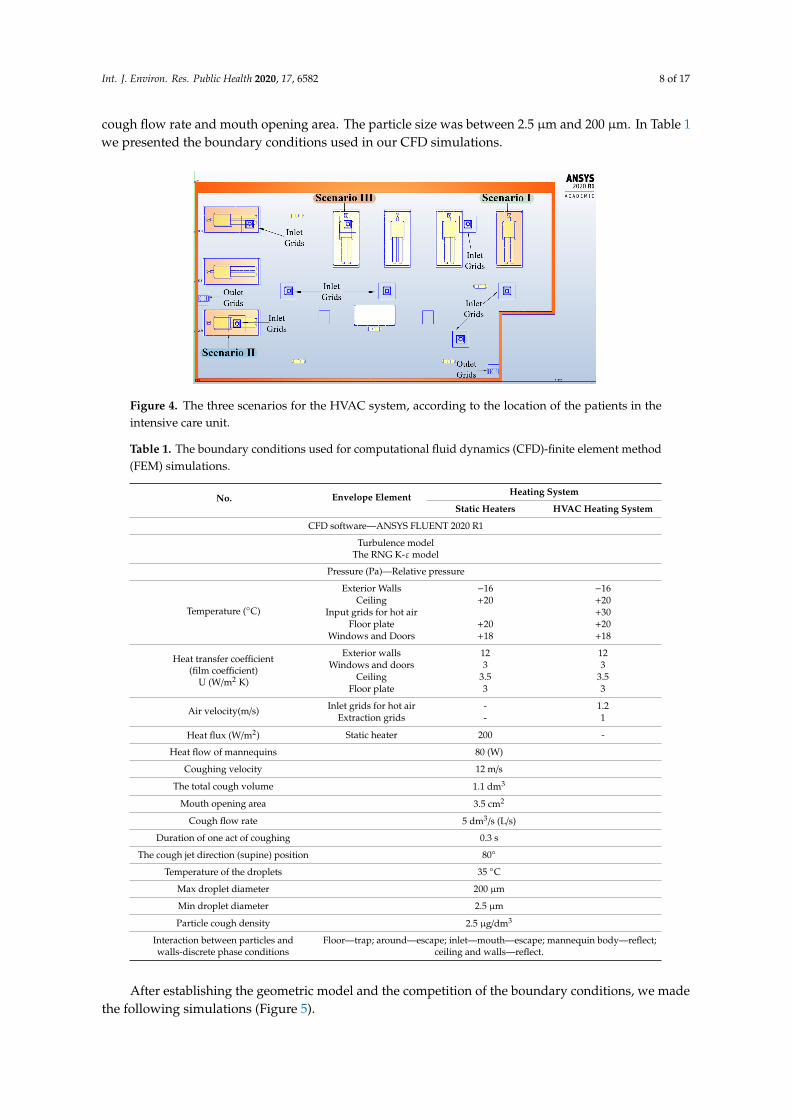
For the HVAC system, we analyzed three scenarios that followed the dispersion of pathogencarrying expiratory droplets particles from patients admitted to the intensive care unit and possiblyinfected with COVID-19. Coughing and sneezing are the most important processes of virus transmissionbecause of the highest droplet concentration [40]. Considering that coughing is the common symptomfor most respiratory tract infections, in our study we used boundary conditions for the coughingprocess. The characteristics of coughed droplets for the CFD simulation were selected by taking intoaccount the existing data from the literature [40–44]. We used seven manikins as patients and fourmanikins as medical personnel. The dimensions of the manikins were similar to those of a real humanbody, and the mouth opening area of the manikin was 3.5 cm2 [41]. We observed the dispersion intime and space of the particles from coughing, influenced by the HVAC system, depending on thelocation of the patients in the intensive care unit: in the right side, left side and in the middle part ofthe intensive care unit (Figure 4).
The advantage of CFD simulations is that they are inexpensive compared to experiments, but theyneed accurate flow-thermal boundary conditions, which are very important for the prediction ofdisease transmission. The most important boundary conditions for expiration are coughing flow rateand jet direction, mouth opening areas, temperature and size distribution of the virus droplets [41–44].In all three proposed scenarios, the manikin coughed three times, and the duration of one act ofcoughing was 0.3 s. The CFD simulations for prediction of disease transmission used the same velocity,
Int. J. Environ. Res. Public Health 2020, 17, 6582 8 of 17
cough flow rate and mouth opening area. The particle size was between 2.5 µm and 200 µm. In Table 1we presented the boundary conditions used in our CFD simulations.
Int. J. Environ. Res. Public Health 2020, 17, x FOR PEER REVIEW 8 of 17
Figure 4. The three scenarios for the HVAC system, according to the location of the patients in the intensive care unit.
Table 1. The boundary conditions used for computational fluid dynamics (CFD)-finite element method (FEM) simulations.
No. Envelope Element Heating System
Static Heaters HVAC Heating System CFD software—ANSYS FLUENT 2020 R1
Turbulence model The RNG K-ε model
Pressure (Pa)—Relative pressure
Temperature (°C)
Exterior Walls −16 −16 Ceiling +20 +20
Input grids for hot air +30 Floor plate +20 +20
Windows and Doors +18 +18
Heat transfer coefficient (film coefficient)
U (W/m2 K)
Exterior walls 12 12 Windows and doors 3 3
Ceiling 3.5 3.5 Floor plate 3 3
Air velocity(m/s) Inlet grids for hot air - 1.2
Extraction grids - 1 Heat flux (W/m2) Static heater 200 -
Heat flow of mannequins 80 (W) Coughing velocity 12 m/s
The total cough volume 1.1 dm³ Mouth opening area 3.5 cm2
Cough flow rate 5 dm³/s (L/s) Duration of one act of coughing 0.3 sec
The cough jet direction (supine) position 80° Temperature of the droplets 35 °C
Max droplet diameter 200 µm Min droplet diameter 2.5 µm Particle cough density 2.5 µg/dm³
Interaction between particles and walls-discrete phase conditions
Floor—trap; around—escape; inlet—mouth—escape; mannequin body—reflect; ceiling and walls—reflect.
After establishing the geometric model and the competition of the boundary conditions, we
made the following simulations (Figure 5).
Figure 4. The three scenarios for the HVAC system, according to the location of the patients in theintensive care unit.
Table 1. The boundary conditions used for computational fluid dynamics (CFD)-finite element method(FEM) simulations.
No. Envelope Element Heating System
Static Heaters HVAC Heating System
CFD software—ANSYS FLUENT 2020 R1
Turbulence modelThe RNG K-εmodel
Pressure (Pa)—Relative pressure
Temperature (◦C)
Exterior Walls −16 −16Ceiling +20 +20
Input grids for hot air +30Floor plate +20 +20
Windows and Doors +18 +18
Heat transfer coefficient(film coefficient)
U (W/m2 K)
Exterior walls 12 12Windows and doors 3 3
Ceiling 3.5 3.5Floor plate 3 3
Air velocity(m/s) Inlet grids for hot air - 1.2Extraction grids - 1
Heat flux (W/m2) Static heater 200 -
Heat flow of mannequins 80 (W)
Coughing velocity 12 m/s
The total cough volume 1.1 dm3
Mouth opening area 3.5 cm2
Cough flow rate 5 dm3/s (L/s)
Duration of one act of coughing 0.3 s
The cough jet direction (supine) position 80◦
Temperature of the droplets 35 ◦C
Max droplet diameter 200 µm
Min droplet diameter 2.5 µm
Particle cough density 2.5 µg/dm3
Interaction between particles andwalls-discrete phase conditions
Floor—trap; around—escape; inlet—mouth—escape; mannequin body—reflect;ceiling and walls—reflect.
After establishing the geometric model and the competition of the boundary conditions, we madethe following simulations (Figure 5).
Int. J. Environ. Res. Public Health 2020, 17, 6582 9 of 17
Int. J. Environ. Res. Public Health 2020, 17, x FOR PEER REVIEW 9 of 17
CFD ANALYSIS OF THE INTENSIVE CARE UNIT HVAC SYSTEM
Scenario I: Patient in the right side of the intensive care unitScenario II: Patient in the left side of the intensive care unitScenario III: Patients in the middle part of the intensive care unit
Meshing number of elements 10 M., 15 M., 20 M. and 25 M. and 4 wall layers
Turbulence Model k-ε Turbulence Model RNG k-ε Turbulence Model SST k-w
Figure 5. CFD analysis scheme for the cardiac intensive care unit simulations.
3. Results
3.1. Particle Dispersion for Static Heaters and HVAC
Initially, we analyzed the particle dispersion generated by the heating system that was present
before the fire: static heaters. Subsequently, we performed the same analysis for the heating system
that will be put into use after rehabilitation, namely HVAC. We wanted to highlight the difference
between these two heating systems, in terms of dispersion of infectious aerosols (Figure 6).
(a) (b)
(c)
(d)
Figure 6. Transient analysis of particles dispersion with no coughing and breathing events of the
patients for static heaters at (a) 2 s and (b) 5 s, and the air inflow dispersion for heating, ventilation
and air conditioning systems at (c) 2 s and (d) 5 s.
Figure 5. CFD analysis scheme for the cardiac intensive care unit simulations.
3. Results
3.1. Particle Dispersion for Static Heaters and HVAC
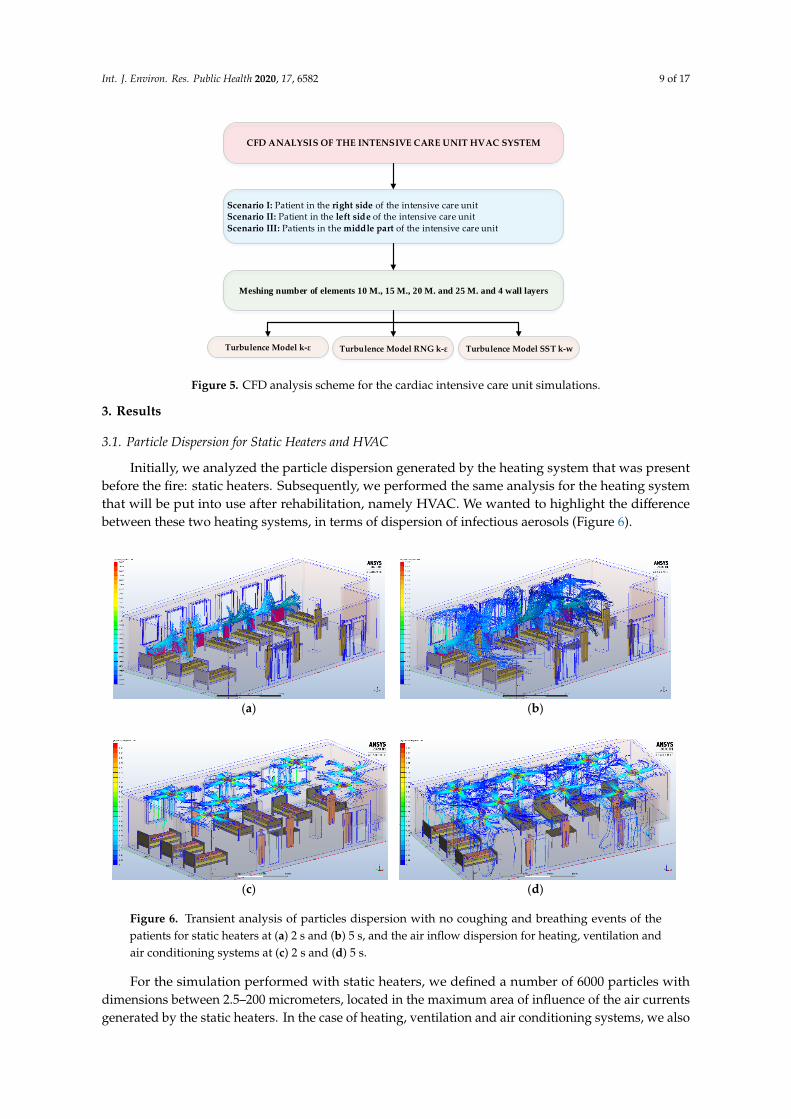
Initially, we analyzed the particle dispersion generated by the heating system that was presentbefore the fire: static heaters. Subsequently, we performed the same analysis for the heating systemthat will be put into use after rehabilitation, namely HVAC. We wanted to highlight the differencebetween these two heating systems, in terms of dispersion of infectious aerosols (Figure 6).
Int. J. Environ. Res. Public Health 2020, 17, x FOR PEER REVIEW 9 of 17
CFD ANALYSIS OF THE INTENSIVE CARE UNIT HVAC SYSTEM
Scenario I: Patient in the right side of the intensive care unitScenario II: Patient in the left side of the intensive care unitScenario III: Patients in the middle part of the intensive care unit
Meshing number of elements 10 M., 15 M., 20 M. and 25 M. and 4 wall layers
Turbulence Model k-ε Turbulence Model RNG k-ε Turbulence Model SST k-w
Figure 5. CFD analysis scheme for the cardiac intensive care unit simulations.
3. Results
3.1. Particle Dispersion for Static Heaters and HVAC
Initially, we analyzed the particle dispersion generated by the heating system that was present before the fire: static heaters. Subsequently, we performed the same analysis for the heating system that will be put into use after rehabilitation, namely HVAC. We wanted to highlight the difference between these two heating systems, in terms of dispersion of infectious aerosols (Figure 6).
(a) (b)
(c)
(d)
Figure 6. Transient analysis of particles dispersion with no coughing and breathing events of the patients for static heaters at (a) 2 s and (b) 5 s, and the air inflow dispersion for heating, ventilation and air conditioning systems at (c) 2 s and (d) 5 s.
Figure 6. Transient analysis of particles dispersion with no coughing and breathing events of thepatients for static heaters at (a) 2 s and (b) 5 s, and the air inflow dispersion for heating, ventilation andair conditioning systems at (c) 2 s and (d) 5 s.
For the simulation performed with static heaters, we defined a number of 6000 particles withdimensions between 2.5–200 micrometers, located in the maximum area of influence of the air currentsgenerated by the static heaters. In the case of heating, ventilation and air conditioning systems, we also
Int. J. Environ. Res. Public Health 2020, 17, 6582 10 of 17
used a number of 6000 particles with the same dimensions, which were split equally to the seveninlet grids. In a transient analysis of particle dispersion at 3 s after the air currents are generated byeach heating system, we observed the distribution of particles near the static heaters, without themspreading throughout the intensive care unit. With the HVAC system, the particles are distributed on allfour directions at the ceiling, foreshadowing a uniform distribution throughout the room. Although theHVAC system may initially appear to achieve a faster and more uniform distribution of infectingparticles, this is counterbalanced by the possibility of using HEPA filters, which are an adjunctivemeans for the decontamination of SARS-CoV-2 aerosols in healthcare settings [45–47].
3.2. Scenario 1
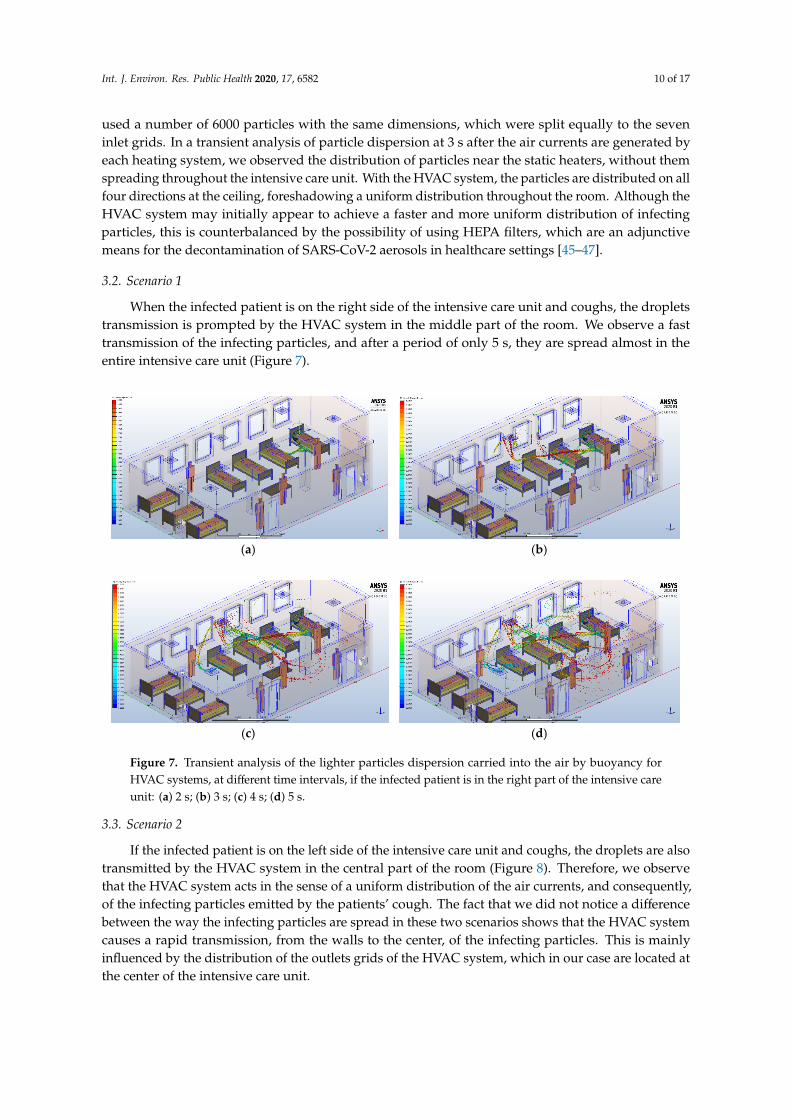
When the infected patient is on the right side of the intensive care unit and coughs, the dropletstransmission is prompted by the HVAC system in the middle part of the room. We observe a fasttransmission of the infecting particles, and after a period of only 5 s, they are spread almost in theentire intensive care unit (Figure 7).
Int. J. Environ. Res. Public Health 2020, 17, x FOR PEER REVIEW 10 of 17
For the simulation performed with static heaters, we defined a number of 6000 particles with dimensions between 2.5–200 micrometers, located in the maximum area of influence of the air currents generated by the static heaters. In the case of heating, ventilation and air conditioning systems, we also used a number of 6000 particles with the same dimensions, which were split equally to the seven inlet grids. In a transient analysis of particle dispersion at 3 s after the air currents are generated by each heating system, we observed the distribution of particles near the static heaters, without them spreading throughout the intensive care unit. With the HVAC system, the particles are distributed on all four directions at the ceiling, foreshadowing a uniform distribution throughout the room. Although the HVAC system may initially appear to achieve a faster and more uniform distribution of infecting particles, this is counterbalanced by the possibility of using HEPA filters, which are an adjunctive means for the decontamination of SARS-CoV-2 aerosols in healthcare settings [45–47].
3.2. Scenario 1
When the infected patient is on the right side of the intensive care unit and coughs, the droplets transmission is prompted by the HVAC system in the middle part of the room. We observe a fast transmission of the infecting particles, and after a period of only 5 s, they are spread almost in the entire intensive care unit (Figure 7).
(a) (b)
(c) (d)
Figure 7. Transient analysis of the lighter particles dispersion carried into the air by buoyancy for HVAC systems, at different time intervals, if the infected patient is in the right part of the intensive care unit: (a) 2 s; (b) 3 s; (c) 4 s; (d) 5 s.
3.3. Scenario 2
If the infected patient is on the left side of the intensive care unit and coughs, the droplets are also transmitted by the HVAC system in the central part of the room (Figure 8). Therefore, we observe that the HVAC system acts in the sense of a uniform distribution of the air currents, and consequently, of the infecting particles emitted by the patients' cough. The fact that we did not notice a difference between the way the infecting particles are spread in these two scenarios shows that the HVAC system causes a rapid transmission, from the walls to the center, of the infecting particles. This is
Figure 7. Transient analysis of the lighter particles dispersion carried into the air by buoyancy forHVAC systems, at different time intervals, if the infected patient is in the right part of the intensive careunit: (a) 2 s; (b) 3 s; (c) 4 s; (d) 5 s.
3.3. Scenario 2
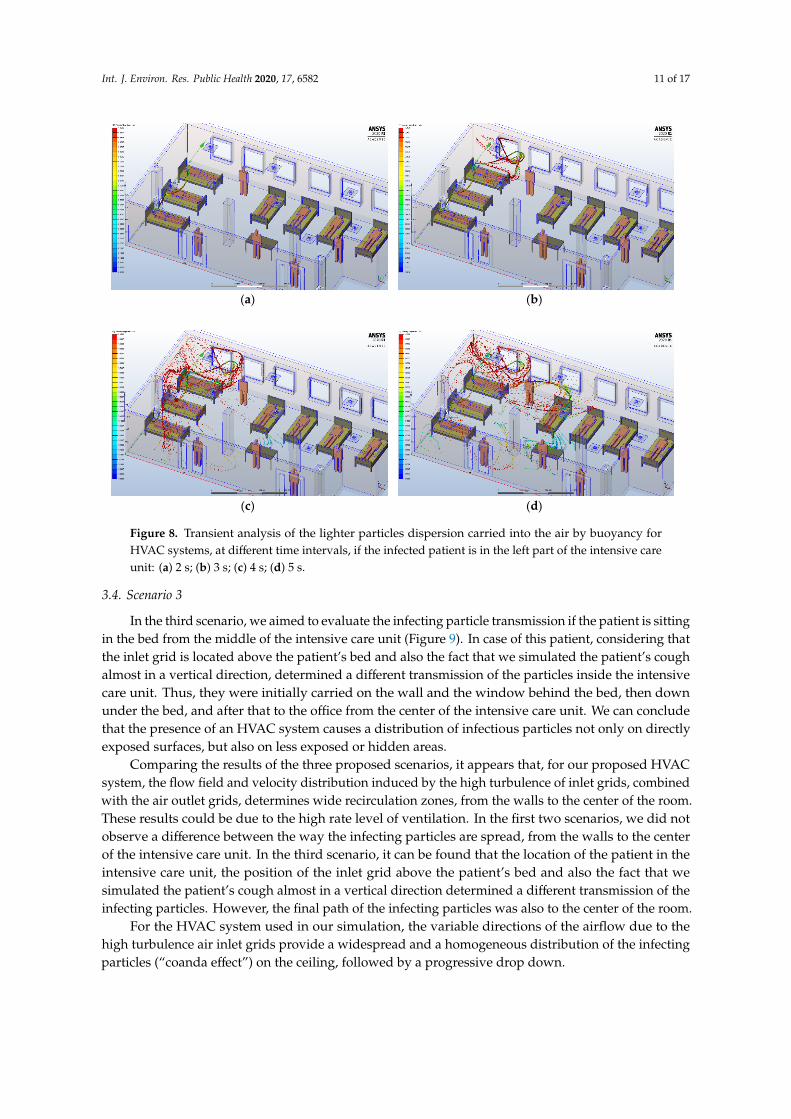
If the infected patient is on the left side of the intensive care unit and coughs, the droplets are alsotransmitted by the HVAC system in the central part of the room (Figure 8). Therefore, we observethat the HVAC system acts in the sense of a uniform distribution of the air currents, and consequently,of the infecting particles emitted by the patients’ cough. The fact that we did not notice a differencebetween the way the infecting particles are spread in these two scenarios shows that the HVAC systemcauses a rapid transmission, from the walls to the center, of the infecting particles. This is mainlyinfluenced by the distribution of the outlets grids of the HVAC system, which in our case are located atthe center of the intensive care unit.
Int. J. Environ. Res. Public Health 2020, 17, 6582 11 of 17
Int. J. Environ. Res. Public Health 2020, 17, x FOR PEER REVIEW 11 of 17
mainly influenced by the distribution of the outlets grids of the HVAC system, which in our case are located at the center of the intensive care unit.
(a) (b)
(c) (d)
Figure 8. Transient analysis of the lighter particles dispersion carried into the air by buoyancy for HVAC systems, at different time intervals, if the infected patient is in the left part of the intensive care unit: (a) 2 s; (b) 3 s; (c) 4 s; (d) 5 s.
3.4. Scenario 3
In the third scenario, we aimed to evaluate the infecting particle transmission if the patient is sitting in the bed from the middle of the intensive care unit (Figure 9). In case of this patient, considering that the inlet grid is located above the patient's bed and also the fact that we simulated the patient’s cough almost in a vertical direction, determined a different transmission of the particles inside the intensive care unit. Thus, they were initially carried on the wall and the window behind the bed, then down under the bed, and after that to the office from the center of the intensive care unit. We can conclude that the presence of an HVAC system causes a distribution of infectious particles not only on directly exposed surfaces, but also on less exposed or hidden areas.
Figure 8. Transient analysis of the lighter particles dispersion carried into the air by buoyancy forHVAC systems, at different time intervals, if the infected patient is in the left part of the intensive careunit: (a) 2 s; (b) 3 s; (c) 4 s; (d) 5 s.
3.4. Scenario 3
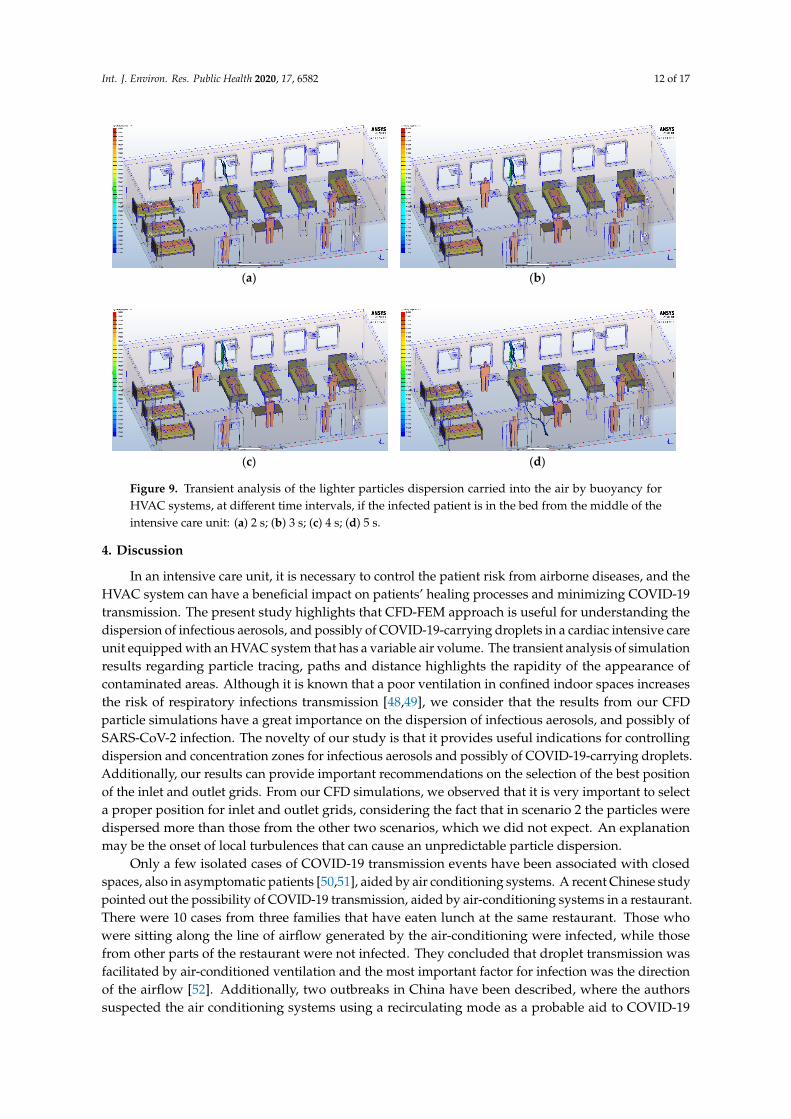
In the third scenario, we aimed to evaluate the infecting particle transmission if the patient is sittingin the bed from the middle of the intensive care unit (Figure 9). In case of this patient, considering thatthe inlet grid is located above the patient’s bed and also the fact that we simulated the patient’s coughalmost in a vertical direction, determined a different transmission of the particles inside the intensivecare unit. Thus, they were initially carried on the wall and the window behind the bed, then downunder the bed, and after that to the office from the center of the intensive care unit. We can concludethat the presence of an HVAC system causes a distribution of infectious particles not only on directlyexposed surfaces, but also on less exposed or hidden areas.
Comparing the results of the three proposed scenarios, it appears that, for our proposed HVACsystem, the flow field and velocity distribution induced by the high turbulence of inlet grids, combinedwith the air outlet grids, determines wide recirculation zones, from the walls to the center of the room.These results could be due to the high rate level of ventilation. In the first two scenarios, we did notobserve a difference between the way the infecting particles are spread, from the walls to the centerof the intensive care unit. In the third scenario, it can be found that the location of the patient in theintensive care unit, the position of the inlet grid above the patient’s bed and also the fact that wesimulated the patient’s cough almost in a vertical direction determined a different transmission of theinfecting particles. However, the final path of the infecting particles was also to the center of the room.
For the HVAC system used in our simulation, the variable directions of the airflow due to thehigh turbulence air inlet grids provide a widespread and a homogeneous distribution of the infectingparticles (“coanda effect”) on the ceiling, followed by a progressive drop down.
Int. J. Environ. Res. Public Health 2020, 17, 6582 12 of 17Int. J. Environ. Res. Public Health 2020, 17, x FOR PEER REVIEW 12 of 17
(a) (b)
(c) (d)
Figure 9. Transient analysis of the lighter particles dispersion carried into the air by buoyancy for HVAC systems, at different time intervals, if the infected patient is in the bed from the middle of the intensive care unit: (a) 2 s; (b) 3 s; (c) 4 s; (d) 5 s.
Comparing the results of the three proposed scenarios, it appears that, for our proposed HVAC system, the flow field and velocity distribution induced by the high turbulence of inlet grids, combined with the air outlet grids, determines wide recirculation zones, from the walls to the center of the room. These results could be due to the high rate level of ventilation. In the first two scenarios, we did not observe a difference between the way the infecting particles are spread, from the walls to the center of the intensive care unit. In the third scenario, it can be found that the location of the patient in the intensive care unit, the position of the inlet grid above the patient's bed and also the fact that we simulated the patient’s cough almost in a vertical direction determined a different transmission of the infecting particles. However, the final path of the infecting particles was also to the center of the room.
For the HVAC system used in our simulation, the variable directions of the airflow due to the high turbulence air inlet grids provide a widespread and a homogeneous distribution of the infecting particles (“coanda effect”) on the ceiling, followed by a progressive drop down.
4. Discussion
In an intensive care unit, it is necessary to control the patient risk from airborne diseases, and the HVAC system can have a beneficial impact on patients’ healing processes and minimizing COVID-19 transmission. The present study highlights that CFD-FEM approach is useful for understanding the dispersion of infectious aerosols, and possibly of COVID-19-carrying droplets in a cardiac intensive care unit equipped with an HVAC system that has a variable air volume. The transient analysis of simulation results regarding particle tracing, paths and distance highlights the rapidity of the appearance of contaminated areas. Although it is known that a poor ventilation in confined indoor spaces increases the risk of respiratory infections transmission [48,49], we consider that the results from our CFD particle simulations have a great importance on the dispersion of infectious aerosols, and possibly of SARS-CoV-2 infection. The novelty of our study is that it provides useful indications for controlling dispersion and concentration zones for infectious aerosols and
Figure 9. Transient analysis of the lighter particles dispersion carried into the air by buoyancy forHVAC systems, at different time intervals, if the infected patient is in the bed from the middle of theintensive care unit: (a) 2 s; (b) 3 s; (c) 4 s; (d) 5 s.
4. Discussion
In an intensive care unit, it is necessary to control the patient risk from airborne diseases, and theHVAC system can have a beneficial impact on patients’ healing processes and minimizing COVID-19transmission. The present study highlights that CFD-FEM approach is useful for understanding thedispersion of infectious aerosols, and possibly of COVID-19-carrying droplets in a cardiac intensive careunit equipped with an HVAC system that has a variable air volume. The transient analysis of simulationresults regarding particle tracing, paths and distance highlights the rapidity of the appearance ofcontaminated areas. Although it is known that a poor ventilation in confined indoor spaces increasesthe risk of respiratory infections transmission [48,49], we consider that the results from our CFDparticle simulations have a great importance on the dispersion of infectious aerosols, and possibly ofSARS-CoV-2 infection. The novelty of our study is that it provides useful indications for controllingdispersion and concentration zones for infectious aerosols and possibly of COVID-19-carrying droplets.Additionally, our results can provide important recommendations on the selection of the best positionof the inlet and outlet grids. From our CFD simulations, we observed that it is very important to selecta proper position for inlet and outlet grids, considering the fact that in scenario 2 the particles weredispersed more than those from the other two scenarios, which we did not expect. An explanationmay be the onset of local turbulences that can cause an unpredictable particle dispersion.
Only a few isolated cases of COVID-19 transmission events have been associated with closedspaces, also in asymptomatic patients [50,51], aided by air conditioning systems. A recent Chinese studypointed out the possibility of COVID-19 transmission, aided by air-conditioning systems in a restaurant.There were 10 cases from three families that have eaten lunch at the same restaurant. Those whowere sitting along the line of airflow generated by the air-conditioning were infected, while thosefrom other parts of the restaurant were not infected. They concluded that droplet transmission wasfacilitated by air-conditioned ventilation and the most important factor for infection was the directionof the airflow [52]. Additionally, two outbreaks in China have been described, where the authorssuspected the air conditioning systems using a recirculating mode as a probable aid to COVID-19
Int. J. Environ. Res. Public Health 2020, 17, 6582 13 of 17
transmission [53]. Thus, while the virus can be airborne, air-conditioning systems could aid virustransmission, under certain conditions such as airflow, improper filters or lack of ventilation.
High Efficiency Particulate Air filters have demonstrated good performance with particles ofthe SARS Cov-2 virus size (approximately 70−120 nm) and are used in airplanes and in healthcaresettings. Their important role in reducing the infection risk and in maintaining thermal comfort wasdemonstrated in a modeling study of the infection risk from SARS Cov-1 [54]. There are also somespeculations regarding the use of air filtration technology (HEPA filters) in damping the rate of viralspread. Studies show that droplets typically expelled by infected patients, range from droplets thatwe are all able to see, to those too small for our eyes (0.5 to 15 microns). Additionally, studies ofother viruses suggest that droplets of 1 micron are capable of carrying enough virus particles to causeinfections [44]. HEPA filters capture particles of this size and also capture 99.97% of particles thatare more than or equal to 0.3 microns in diameter. In theory, some experts say that considering thepossibility of HEPA filters to capture particles of such small size, all SARS Cov-2 virions could befiltered and captured, in this way reducing the contamination of the space [31]. Thus, they proposeinstalling HVAC systems with HEPA filters not only in the intensive care units, but also in high-trafficspaces, in order to decrease the number of viral particles present.
On 3 April 2020, the Federation of European Heating, Ventilation and Air ConditioningAssociations (REHVA), published the latest version of a guidance document where they summarize theadvice on the operation and use of building services in order to prevent the spread of the COVID-19 [10].
1. Increase air supply in order to bring as much outside air as reasonably possible. Thus,their recommendation is to start ventilation at least two hours before the building usage time andswitch to lower speed two hours after the building usage time, and keep the ventilation on 24/7,with lowered, but not switched off, ventilation rates when people are absent [10].
2. Humidification and air-conditioning have no effect in limiting the transmission of the virus, thus, they donot need to be adjusted. Coronaviruses are susceptible only to a humidity above 80% and a hightemperature, above 30 °C [10]. Unfortunately, these parameters are not acceptable in buildings, becausethey will increase the microbial growth and will affect the indoor thermal comfort [10].
3. Another recommendation is to inspect the heat recovery devices considering the fact thatmaintenance personnel should follow the standard safety procedures of dusty work [10]. They alsomention that when the HVAC system is equipped with a twin coil unit or another heat recoverydevice that completely separates the exhaust air side to the supply airside, virus particletransmission via heat recovery devices is no longer a problem. Regarding the use of recirculation,it is recommended to avoid central recirculation during SARS-CoV-2 episodes, in order to avoidresuspension of virus particles at room level [10].
4. Regarding the normal duct cleaning and maintenance procedures, no changes are needed and themost important two things are to increase fresh air supply and avoid recirculation of air [10].
5. Change of outdoor air filters or their replacement with other types of filters is not recommendedsooner than normal [10].
6. Room air cleaners have a similar effect compared to ventilation and they remove particles fromair. Devices that use electrostatic filtration principles for the supply or room air treatment may beuseful [10].
Our study has some limitations and can be further improved. Firstly, this is only a numericalsimulation study that evaluated the dispersion of infectious aerosols, and possibly of COVID-19airborne transmission, based on the characteristics of SARS-CoV-2 and on the methods used inprevious studies to evaluate airborne transmission for other infectious diseases. Further studiesare needed in order to determine the impact of HVAC-systems on SARS-CoV-2 transmission in realcases. Secondly, the results of numerical simulations are only qualitative, by images, and we onlyconsidered exhaled droplets by coughing. Other investigations may consider quantitative results forother respiratory activities, such as breathing, sneezing or speaking. Thirdly, the composition of the
Int. J. Environ. Res. Public Health 2020, 17, 6582 14 of 17
infectious aerosols is of great significance in order to evaluate the infectious risk, and this deservesfurther study. Another limitation of our study is that we removed from our simulations the heavierparticles, which usually fall to the ground, and we only focused on the lighter ones, which are carriedinto the air. This may be the reason why it seems that droplets air-dispersion is linear, rather than“clouds of droplets.” Additionally, the CFD characterization of the proposed HVAC system is more“case specific” for our cardiac intensive care unit. We are working now to find a more general CFDcharacterization that can be useful for the analysis of other targets, such as public transport, theaters,philharmonics and amphitheaters from educational units.
In an intensive care unit, it is necessary to have a negative pressure in order to reduce aerosolescape and also a high air-change rate to remove the infectious particles. Unfortunately, with the staticheaters, these parameters cannot be achieved. By using an HVAC system, it is possible to create notonly a negative pressure; in addition, we can prevent the transmission of the infectious particles outsidethe room when the medical staff use the door. Transmission of the infecting particles due to the airinlet grids is widespread and homogeneously distributed. This is counterbalanced by the possibility ofusing HEPA filters that are able to remove at least 90% of small particles, from inside and outside air.
5. Conclusions
In conclusion, our study provides the mechanism for the dispersion of infectious aerosols,and the possibly of COVID-19 infection, by air conditioning systems. It also highlights importantrecommendations regarding the selection of the best position of the inlet and outlet grids in an HVACsystem. Additionally, it can provide important recommendations for disease control and optimizationof ventilation in intensive care units, by increasing the rate of air change, decreasing recirculation of airand increasing the use of outdoor air and HEPA filters.
Author Contributions: Conceptualization, L.A., F.-E.T, ., R.S. and C.S.; methodology, C.-G.P., S.-V.H.; software,F.-E.T, ., S.-V.H.; validation, M.V., V.C. and C.S.; formal analysis, R.S.; investigation, L.A. and F.-E.T, .; resources,C.-G.P.; data curation, S.-V.H.; writing—original draft preparation, L.A.; writing—review and editing, L.A., R.S.,M.A.M. and C.S.; visualization, I.-L.S, . and M.A.M.; supervision, M.V., V.C. and I.-L.S, . All authors contributedequally to this manuscript. All authors have read and agreed to the published version of the manuscript.
Funding: This research received no external funding.
Conflicts of Interest: The authors declare no conflict of interest.
References
1. Kutter, J.S.; Spronken, M.I.; Fraaij, P.L.; Fouchier, R.A.; Herfst, S. Transmission routes of respiratory virusesamong humans. Curr. Opin. Virol. 2018, 28, 142–151. [CrossRef] [PubMed]
2. Siegel, J.D.; Rhinehart, E.; Jackson, M.; Chiarello, L.; Health Care Infection Control Practices AdvisoryCommittee. 2007 guideline for isolation precautions: Preventing transmission of infectious agents in healthcare settings. Am. J. Infect. Control 2007, 35, S65–S164. [CrossRef] [PubMed]
3. Gralton, J.; Tovey, E.; McLaws, M.L.; Rawlinson, W.D. The role of particle size in aerosolised pathogentransmission: A review. J. Infect. 2011, 62, 1–13. [CrossRef] [PubMed]
4. Fernstrom, A.; Goldblatt, M. Aerobiology and its role in the transmission of infectious diseases. J. Pathog.2013, 2013, 493960. [CrossRef] [PubMed]
5. Herfst, S.; Böhringer, M.; Karo, B.; Lawrence, P.; Lewis, N.S.; Mina, M.J.; Russell, C.J.; Steel, J.; de Swart, R.L.;Menge, C. Drivers of airborne human-to-human pathogen transmission. Curr. Opin. Virol. 2017, 22, 22–29.[CrossRef]
6. Villafruela, J.M.; Olmedo, I.; Berlanga, F.A.; Ruiz de Adana, M. Assessment of displacement ventilationsystems in airborne infection risk in hospital rooms. PLoS ONE 2019, 14, e0211390. [CrossRef]
7. Tang, J.W.; Nicolle, A.; Pantelic, J.; Koh, G.C.; De Wang, L.; Amin, M.; Klettner, C.A.; Cheong, D.K.; Sekhar, C.;Tham, K.W. Airflow dynamics of coughing in healthy human volunteers by shadowgraph imaging: An aidto aerosol infection control. PLoS ONE 2012, 7, e34818. [CrossRef]
Int. J. Environ. Res. Public Health 2020, 17, 6582 15 of 17
8. Tang, J.W.; Nicolle, A.D.; Klettner, C.A.; Pantelic, J.; Wang, L.; Suhaimi, A.B.; Tan, A.Y.; Ong, G.W.; Su, R.;Sekhar, C.; et al. Airflow dynamics of human jets: Sneezing and breathing-potential sources of infectiousaerosols. PLoS ONE 2013, 8, e59970. [CrossRef]
9. Gupta, J.K.; Lin, C.H.; Chen, Q. Characterizing exhaled airflow from breathing and talking. Indoor Air2010, 20, 31–39. [CrossRef]
10. Federation of European Heating VaACA. COVID-19 Guidance: REHVA. 2020. Available online: https://www.rehva.eu/fileadmin/user_upload/REHVA_COVID-9_guidance_document_ver2_20200403_1.pdf (accessed on3 April 2020).
11. Pica, N.; Bouvier, N.M. Environmental factors affecting the transmission of respiratory viruses. Curr. Opin. Virol.2012, 2, 90–95. [CrossRef]
12. Dancer, S.J. Controlling hospital-acquired infection: Focus on the role of the environment and new technologiesfor decontamination. Clin. Microbiol. Rev. 2014, 27, 665–690. [CrossRef] [PubMed]
13. Beggs, C.; Knibbs, L.D.; Johnson, G.R.; Morawska, L. Environmental contamination and hospital-acquiredinfection: Factors that are easily overlooked. Indoor Air 2015, 25, 462–474. [CrossRef] [PubMed]
14. Qian, H.; Zheng, X. Ventilation control for airborne transmission of human exhaled bio-aerosols in buildings.J. Thorac. Dis. 2018, 10, S2295–S2304. [CrossRef] [PubMed]
15. Zhong, N.S.; Zheng, B.J.; Li, Y.M.; Poon, L.L.M.; Xie, Z.H.; Chan, K.H.; Li, P.H.; Tan, S.Y.; Chang, Q.; Xie, J.P.;et al. Epidemiology and cause of severe acute respiratory syndrome (SARS) in Guangdong, People’s Republicof China, in February, 2003. Lancet 2003, 362, 1353–1358. [CrossRef]
16. Van Kerkhove, M.D.; Vandemaele, K.A.; Shinde, V.; Jaramillo-Gutierrez, G.; Koukounari, A.; Donnelly, C.A.;Carlino, L.O.; Owen, R.; Paterson, B.; Pelletier, L.; et al. Risk factors for severe outcomes following 2009influenza A (H1N1) infection: A global pooled analysis. PLoS Med. 2011, 8, e1001053. [CrossRef]
17. Kim, C.J.; Choi, W.S.; Jung, Y.; Kiem, S.; Seol, H.Y.; Woo, H.J.; Choi, Y.H.; Son, J.S.; Kim, K.H.; Kim, Y.S.; et al.Surveillance of the Middle East respiratory syndrome (MERS) coronavirus (CoV) infection in healthcareworkers after contact with confirmed MERS patients: Incidence and risk factors of MERS-CoV seropositivity.Clin. Microbiol. Infect. 2016, 22, 880–886. [CrossRef]
18. Sanche, S.; Lin, Y.T.; Xu, C.; Romero-Severson, E.; Hengartner, N.; Ke, R. High contagiousness and rapidspread of severe acute respiratory syndrome coronavirus 2. Emerg. Infect. Dis. 2020, 26, 1470–1477. [CrossRef]
19. WHO. Coronavirus Disease 2019 (COVID-19) Situation Report-73. Available online: https://apps.who.int/iris/handle/10665/331686 (accessed on 7 September 2020).
20. Ali, S.A.; Baloch, M.; Ahmed, N.; Ali, A.A.; Iqbal, A. The outbreak of Coronavirus Disease 2019(COVID-19)—An emerging global health threat. J. Infect. Public Health 2020, 13, 644–646.
21. Sohrabi, C.; Alsafi, Z.; O’Neill, N.; Khan, M.; Kerwan, A.; Al-Jabir, A.; Iosifidis, C.; Agha, R. World HealthOrganization declares global emergency: A review of the 2019 novel coronavirus (COVID-19). Intern. J. Surg.2020, 76, 71–76. [CrossRef]
22. Kelvin, K.-W.T.; Owen, T.-Y.T.; Cyril, C.-Y.Y.; Kwok-Hung, C.; Tak-Chiu, W.; Jacky, M.-C.C.; Wai-Shing, L.;Thomas, S.-H.C.; Chris, Y.-C.C.; Darshana, H.K.; et al. Consistent detection of 2019 novel coronavirus insaliva. Clin. Infect. Dis. 2020, 71, 841–843.
23. Eslami, H.; Jalili, M. The role of environmental factors to transmission of SARS-CoV-2 (COVID-19).AMB Express 2020, 10, 92. [CrossRef] [PubMed]
24. Van Doremalen, N.; Bushmaker, T.; Morris, D.H.; Holbrook, M.G.; Gamble, A.; Williamson, B.N.; Tamin, A.;Harcourt, J.L.; Thornburg, N.J.; Gerber, S.I.; et al. Aerosol and surface stability of SARS-CoV-2 as comparedwith SARS-CoV-1. N. Engl. J. Med. 2020, 382, 1564–1567. [CrossRef] [PubMed]
25. Guan, W.J.; Ni, Z.Y.; Hu, Y.; Liang, W.H.; Ou, C.Q.; He, J.X.; Liu, L.; Shan, H.; Lei, C.L.; Hui, D.S.; et al.Clinical characteristics of 2019 novel coronavirus infection in China. N. Engl. J. Med. 2020, 382, 1708–1720.[CrossRef] [PubMed]
26. WHO. Transmission of SARS-CoV-2: Implications for Infection Prevention Precautions. Available online:https://www.who.int/publications/i/item/modes-of-transmission-of-virus-causing-covid-19-implications-for-ipc-precaution-recommendations (accessed on 7 September 2020).
27. Zayas, G.; Chiang, M.C.; Wong, E.; MacDonald, F.; Lange, C.F.; Senthilselvan, A.; King, M. Cough aerosol inhealthy participants: Fundamental knowledge to optimize droplet-spread infectious respiratory diseasemanagement. BMC Pulm. Med. 2012, 12, 1–12. [CrossRef] [PubMed]
Int. J. Environ. Res. Public Health 2020, 17, 6582 16 of 17
28. Li, Y.; Leung, G.M.; Tang, J.W.; Yang, X.; Chao, C.Y.; Lin, J.Z.; Lu, J.W.; Nielsen, P.V.; Niu, J.; Qian, H.; et al.Role of ventilation in airborne transmission of infectious agents in the built environment–A multidisciplinarysystematic review. Indoor Air 2007, 17, 2–18. [CrossRef] [PubMed]
29. Gao, X.; Wei, J.; Lei, H.; Xu, P.; Cowling, B.J.; Li, Y. Building ventilation as an effective disease interventionstrategy in a dense indoor contact network in an ideal city. PLoS ONE 2016, 11, e0162481. [CrossRef][PubMed]
30. Gao, X.; Wei, J.; Cowling, B.J.; Li, Y. Potential impact of a ventilation intervention for influenza in the contextof a dense indoor contact network in Hong Kong. Sci. Total Environ. 2016, 569, 373–381. [CrossRef]
31. Morawska, L.; Tang, J.W.; Bahnfleth, W.; Bluyssen, P.M.; Boerstra, A.; Buonanno, G.; Cao, J.; Dancer, S.;Floto, A.; Querol, X.; et al. How can airborne transmission of COVID-19 indoors be minimised? Environ. Int.2020, 142, 105832. [CrossRef]
32. Setti, L.; Passarini, F.; De Gennaro, G.; Barbieri, P.; Perrone, M.G.; Borelli, M.; Palmisani, J.; Di Gilio, A.;Piscitelli, P.; Miani, A. Airborne transmission route of COVID-19: Why 2 meters/6 feet of inter-personaldistance could not be enough. Int. J. Environ. Res. Public Health 2020, 17, 2932. [CrossRef]
33. Alfonso-Sanchez, J.L.; Martinez, I.M.; Martín-Moreno, J.M.; González, R.S.; Botía, F. Analyzing the riskfactors influencing surgical site infections: The site of environmental factors. Can. J. Surg. 2017, 60, 155–161.[CrossRef]
34. Shajahan, A.; Culp, C.H.; Williamson, B. Effects of indoor environmental parameters related to buildingheating, ventilation, and air conditioning systems on patients’ medical outcomes: A review of scientificresearch on hospital buildings. Indoor Air 2019, 29, 161–176. [CrossRef] [PubMed]
35. Cortés, M.; Fazio, P.; Rao, J.; Bustamante, W.; Vera, S. CFD modelling of basic convection cases in enclosedenvironments: Needs of CFD beginners to acquire skills and confidence on CFD modelling. Rev. Ing. Constr.2014, 29, 22–45. [CrossRef]
36. Kolmogorov, A.N. Equations of turbulent motion in an incompressible fluid. Doklady Akademii Nauk 1941, 30, 299–303.37. Menter, F.R. Two-equation eddy-viscosity turbulence models for engineering applications. AIAA J. 1994, 32, 1598–1605.
[CrossRef]38. Qian, H.; Li, Y.; Nielsen, P.V.; Huang, X. Spatial distribution of infection risk of SRAS transmission in
a hospital ward. Build. Environ. 2009, 44, 1651–1658. [CrossRef]39. Ansys, I. ANSYS Fluent Theory Guide; Ansys, Inc.: Canonsburg, PA, USA, 2020.40. Zhao, B.; Zhang, Z.; Li, X. Numerical study of the transport of droplets or particles generated by respiratory
system indoors. Build. Environ. 2005, 40, 1032–1039. [CrossRef]41. Gupta, J.K.; Lin, C.H.; Chen, Q. Flow dynamics and characterization of a cough. Indoor Air 2009, 19, 517–525.
[CrossRef]42. Zhu, S.; Kato, S.; Yang, J.H. Study on transport characteristics of saliva droplets produced by coughing in
a calm indoor environment. Build. Environ. 2006, 41, 1691–1702. [CrossRef]43. Mahajan, R.P.; Singh, P.; Murty, G.E.; Aitkenhead, A.R. Relationship between expired lung volume, peak flow
rate and peak velocity time during a voluntary cough manoeuvre. Br. J. Anaesth. 1994, 72, 298–301. [CrossRef]44. Jayaweera, M.; Perera, H.; Gunawardana, B.; Manatunge, J. Transmission of COVID-19 virus by droplets and
aerosols: A critical review on the unresolved dichotomy. Environ. Res. 2020, 188, 109819. [CrossRef]45. Tay, J.K.; Khoo, M.L.C.; Loh, W.S. Surgical considerations for tracheostomy during the COVID-19 pandemic:
Lessons learned from the severe acute respiratory syndrome outbreak. JAMA Otolaryngol. Head Neck Surg.2020, 146, 517–518. [CrossRef] [PubMed]
46. Omolo, C.A.; Soni, N.; Fasiku, V.O.; Mackraj, I.; Govender, T. Update on therapeutic approaches and emergingtherapies for SARS-CoV-2 virus. Eur. J. Pharmacol. 2020, 883, 173348. [CrossRef] [PubMed]
47. Chigurupati, R.; Panchal, N.; Henry, A.M.; Batal, H.; Sethi, A.; D’innocenzo, R.; Mehra, P.; Krishnan, D.G.;Roser, S.M. Considerations for oral and maxillofacial surgeons in COVID-19 era: Can we sustain the solutionsto keep our patients and healthcare personnel safe? J. Oral Maxillofac. Surg. 2020, 78, 1241–1256. [CrossRef][PubMed]
48. Correia, G.; Rodrigues, L.; Silva, M.G.; Gonçalves, T. Airborne route and bad use of ventilation systems asnon-negligible factors in SARS-CoV-2 transmission. Med. Hypotheses 2020, 141, 109781. [CrossRef] [PubMed]
49. Luongo, J.C.; Fennelly, K.P.; Keen, J.A.; Zhai, Z.J.; Jones, B.W.; Miller, S.L. Role of mechanical ventilation in theairborne transmission of infectious agents in buildings. Indoor Air 2016, 26, 666–678. [CrossRef] [PubMed]
Int. J. Environ. Res. Public Health 2020, 17, 6582 17 of 17
50. Lu, J.; Gu, J.; Li, K.; Xu, C.; Su, W.; Lai, Z.; Zhou, D.; Yu, C.; Xu, B.; Yang, Z. COVID-19 outbreak associatedwith air conditioning in restaurant, Guangzhou, China, 2020. Emerg. Infect. Dis. 2020, 26, 1628–1631.[CrossRef]
51. Rothe, C.; Schunk, M.; Sothmann, P.; Bretzel, G.; Froeschl, G.; Wallrauch, C.; Zimmer, T.; Thiel, V.; Janke, C.;Guggemos, W.; et al. Transmission of 2019-nCoV infection from an asymptomatic contact in Germany.N. Engl. J. Med. 2020, 382, 970–971. [CrossRef]
52. Liu, Y.; Ning, Z.; Chen, Y.; Guo, M.; Liu, Y.; Gali, N.K.; Sun, L.; Duan, Y.; Cai, J.; Westerdahl, D.; et al.Aerodynamic analysis of SARS-CoV-2 in two Wuhan hospitals. Nature 2020, 582, 557–560. [CrossRef]
53. Morawska, L.; Cao, J. Airborne transmission of SARS-CoV-2: The world should face the reality. Environ. Int.2020, 139, 105730. [CrossRef]
54. You, R.; Lin, C.H.; Wei, D.; Chen, Q. Evaluating the commercial airliner cabin environment with different airdistribution systems. Indoor Air 2019, 29, 840–853. [CrossRef]
© 2020 by the authors. Licensee MDPI, Basel, Switzerland. This article is an open accessarticle distributed under the terms and conditions of the Creative Commons Attribution(CC BY) license (http://creativecommons.org/licenses/by/4.0/).