Embed Size (px)
Citation preview
Laser-Based Discharge Ignition forCapillary Waveguides
vonLars Goldberggeboren am
21. November 1987
Masterarbeit im Studiengang PhysikUniversität Hamburg
2013

Laserbasierte Entladungszündung für Kapillarwellenleiter
1. Gutachter: Dr. Jens Osterhoff2. Gutachter: Dr. Lucas Schaper
Abstract
Laser-plasma-wakefield accelerators are rapidly evolving and improving, but stillsuffer from instabilities in the generated electron-beam properties, largely due toshot-to-shot variations of laser and plasma parameters.
This thesis reports on a novel technique for shaping the transverse plasma-densityprofile in a plasma accelerator in order to minimise possible sources for timing andspatial fluctuations. This technique is based on laser triggering of a high voltageplasma discharge in a capillary. Also a new method for single-shot measurements oftime-dependent guiding profiles has been developed.
Therefore a discharge unit based on an impedance matched pulse-forming-networkwas set up and optimised. Laser-based discharge ignition was successfully shownand investigations regarding the dependence on laser timing and energy were per-formed. It was also demonstrated that laser-based discharge ignition has the abilityto significantly reduce the timing jitter and time lag for discharge ignition in capil-lary discharge waveguides. Furthermore studies on capillary discharge wave-guidingwith and without laser ignition have been performed and it was shown that, at leastin these experiments, laser-ignited capillary discharges suppress wave-guiding, eventhough ignition laser and capillary discharge individually support it.
Zusammenfassung
Trotz der schnellen Weiterentwicklung von Laser-Plasma Beschleunigern sinddie Eigenschaften der erzeugten Elektronenstrahlen noch immer sehr instabil. Diesist größtenteils auf Schuss zu Schuss Variationen der Laser- und Plasmaparameterzurückzuführen.
Diese Arbeit stellt eine neue Technik zur Formung des transversalen Dichteprofils ineinem Plasma Beschleuniger vor, basierend auf der Laserzündung von Kapillarent-ladungswellenleitern, um mögliche Ursachen der zeitlichen und räumlichen Fluktua-tionen zu minimieren. Außerdem wurde eine neue Methode entwickelt, mit der dieMessung zeitabhängiger Wellenleitungsprofile in einer einzigen Entladung ermöglichtwird.
Dazu wurde eine Entladungseinheit basierend auf einem angepassten pulsformen-den Netzwerk aufgebaut und optimiert. Lasergestützte Entladungszündung wurdeerfolgreich demonstriert und die Abhängigkeiten in Bezug auf den Auslösezeitpunktdes Lasers und die Laserenergie wurden untersucht. Es wurde außerdem gezeigt,dass lasergestützte Entladungszündung zu einem stabileren Zündzeitpunkt und einerverkürzten Zündzeit beiträgt. Weiterhin wurden Untersuchungen zu Kapillarentla-dungswellenleitern mit und ohne Laserzündung unternommen. Dabei wurde gezeigt,dass, zumindest in diesen Messungen, die Laserzündung von Kapillarentladungendie Wellenleitung unterdrückt, obwohl Zündlaser und Kapillarentladung sie einzelnunterstützen.

Contents
1 Introduction 1
2 Theoretical Principles 3
2.1 Plasmas . . . . . . . . . . . . . . . . . . . . . . . . . . . . . . . . . . . . . 3
2.1.1 Definition of Plasma . . . . . . . . . . . . . . . . . . . . . . . . . . 3
2.1.2 Debye Length . . . . . . . . . . . . . . . . . . . . . . . . . . . . . . 4
2.1.3 Plasma Frequency . . . . . . . . . . . . . . . . . . . . . . . . . . . . 4
2.1.4 Breakdowns and Paschen’s Law . . . . . . . . . . . . . . . . . . . . 5
2.2 Laser Wake-Field Acceleration . . . . . . . . . . . . . . . . . . . . . . . . . 7
2.3 Laser and Optics . . . . . . . . . . . . . . . . . . . . . . . . . . . . . . . . 9
2.3.1 Gaussian Beam Optics . . . . . . . . . . . . . . . . . . . . . . . . . 9
2.3.2 Wave Guiding in Plasma . . . . . . . . . . . . . . . . . . . . . . . . 10
2.4 Multi-Photon Ionisation . . . . . . . . . . . . . . . . . . . . . . . . . . . . 12
3 Experimental Setup 15
3.1 Lab Setup . . . . . . . . . . . . . . . . . . . . . . . . . . . . . . . . . . . . 15
3.2 Ignition Laser . . . . . . . . . . . . . . . . . . . . . . . . . . . . . . . . . . 17
3.3 Gas Targets . . . . . . . . . . . . . . . . . . . . . . . . . . . . . . . . . . . 19
3.4 Discharge Setup . . . . . . . . . . . . . . . . . . . . . . . . . . . . . . . . . 20
3.4.1 Setup and Optimisation . . . . . . . . . . . . . . . . . . . . . . . . 20
3.4.2 Energy and Ionisation Capability . . . . . . . . . . . . . . . . . . . 24
4 Experiments and Results 29
4.1 Laser-Based Discharge Ignition . . . . . . . . . . . . . . . . . . . . . . . . 29
4.1.1 Ionization Probability and Ion Distribution . . . . . . . . . . . . . . 29
4.1.2 Timing Dependence . . . . . . . . . . . . . . . . . . . . . . . . . . . 32
4.1.3 Laser Energy Dependence . . . . . . . . . . . . . . . . . . . . . . . 36
4.1.4 Jitter Reduction . . . . . . . . . . . . . . . . . . . . . . . . . . . . 37
4.2 Discharge Wave Guiding . . . . . . . . . . . . . . . . . . . . . . . . . . . . 39
4.2.1 Single-Shot Guiding Measurements . . . . . . . . . . . . . . . . . . 39
4.2.2 Breakdown Regime . . . . . . . . . . . . . . . . . . . . . . . . . . . 43
4.2.3 Laser Ignited Regime . . . . . . . . . . . . . . . . . . . . . . . . . . 49
5 Conclusions and Outlook 53
A Software 55
A.1 Jitter Calculation Script . . . . . . . . . . . . . . . . . . . . . . . . . . . . 55
A.2 Guiding-Analysis Script . . . . . . . . . . . . . . . . . . . . . . . . . . . . 57
Bibliography 61
Chapter 1
Introduction
Highly energetic electron beams are required for various applications such as free-electronlasers (FELs, [Kon79]) in material science and life science, or colliders in particle physics.Nowadays these beams are almost exclusively produced in conventional radiofrequency-cavities (see e.g. [Hum99]), which are limited to typical acceleration gradients below50MV/m due to electric or thermal breakdown [Sol09]. Hence, large machines on theorder of multiple 100m length are required to reach the desired energies. Laser-wakefieldaccelerators (LWFAs) in plasma [Taj79], on the other hand, are capable of providingacceleration gradients well above 10GV/m [Gor98], thereby allowing for much more com-pact devices on scales of centimetres. Currently, plasma-based devices are rapidly evolvingand improving, but still suffer from instabilities in the generated electron-beam properties,largely due to shot-to-shot variations of laser and plasma parameters [Man07], [Nak07],[Haf08].
In order to minimise possible sources for these fluctuations it is necessary to gain bettercontrol over laser and plasma parameters. One crucial point is the guiding of the laserdriver. Without guiding the accelerating region is limited to a few Rayleigh lengthsaround the focus of the laser driver, drastically limiting the maximum possible energygain of the accelerated electrons. Guiding the driver pulse over several Rayleigh lengthsincreases the maximum electron energy, which is then theoretically only limited by thelaser depletion and electron dephasing (see e.g. [Esa09]). The transverse density profilerequired for wave-guiding in plasma can be achieved by different techniques, one of thembeing capillary discharges (e.g. [Ehr98], [Spe01]). Thereby a high voltage (HV) is appliedto a gas filled capillary, igniting and heating a plasma. This causes a radially increasingdensity profile towards the cold capillary walls, which corresponds to a radially decreasingrefractive index [Lüs59], hence allowing for guiding of the laser pulse. However, capillarydischarges are subject to timing instabilities due to the statistical processes the ignitionis based on. The scope of this thesis is to investigate, if an ionising laser precursor canimprove timing stability, reduce the time lag and increase the usable voltage range and

2
time-window for guiding.
In chapter 2 an overview of the theoretical principles essential for the understandingof this thesis is given. The experimental setup is described and its crucial componentsare characterised in chapter 3. A novel method for single-shot measurements of time-dependent guiding profiles is described in chapter 4 and the results regarding laser-baseddischarge ignition and capillary wave-guiding are presented. Chapter 5 finally concludesthe thesis by summarising the results and giving an outlook to future investigations.
Chapter 2
Theoretical Principles
This chapter will explain the theoretical basics needed for the general understanding ofthis thesis. The first section covers the definition of a plasma and aspects of plasmabreakdowns and discharges essential for capillary-discharge waveguides. Then a shortdescription of laser wakefield acceleration is given, before Gaussian beam optics and waveguiding in plasmas are considered. At the end an insight to multi-photon ionisationessential for the laser ignition is given.
2.1 Plasmas
2.1.1 Definition of Plasma
A plasma (Greek, meaning “formed or moulded”), often referred to as the fourth stateof matter apart from the commonly known states solid, liquid and gaseous, consists ofcollectively behaving ionised matter. Strictly, ionised matter has to show the followingproperties to be considered a plasma [Keu12],[Ost09]:
1. Spatial quasi-neutrality: The physical dimensions of the plasma volume have to belarger than the Debye screening length λD.
2. Temporal quasi-neutrality: The plasma frequency must exceed the characteristicfrequency describing the processes under investigation, so charges can be shieldedrapidly.
3. Ideal plasma conditions: Two-body collisions have to be dominated by collectiveelectrostatic interactions (Λ > 1, see equation 2.3).
There are, however, less stringent definitions of plasma in use.
4 2.1. PLASMAS
2.1.2 Debye Length
The Debye length is defined by [Gol95]
λD =
√√√√ε0kBe2
(neTe
+∑
ion sorts
ZiniTi
)−1(2.1)
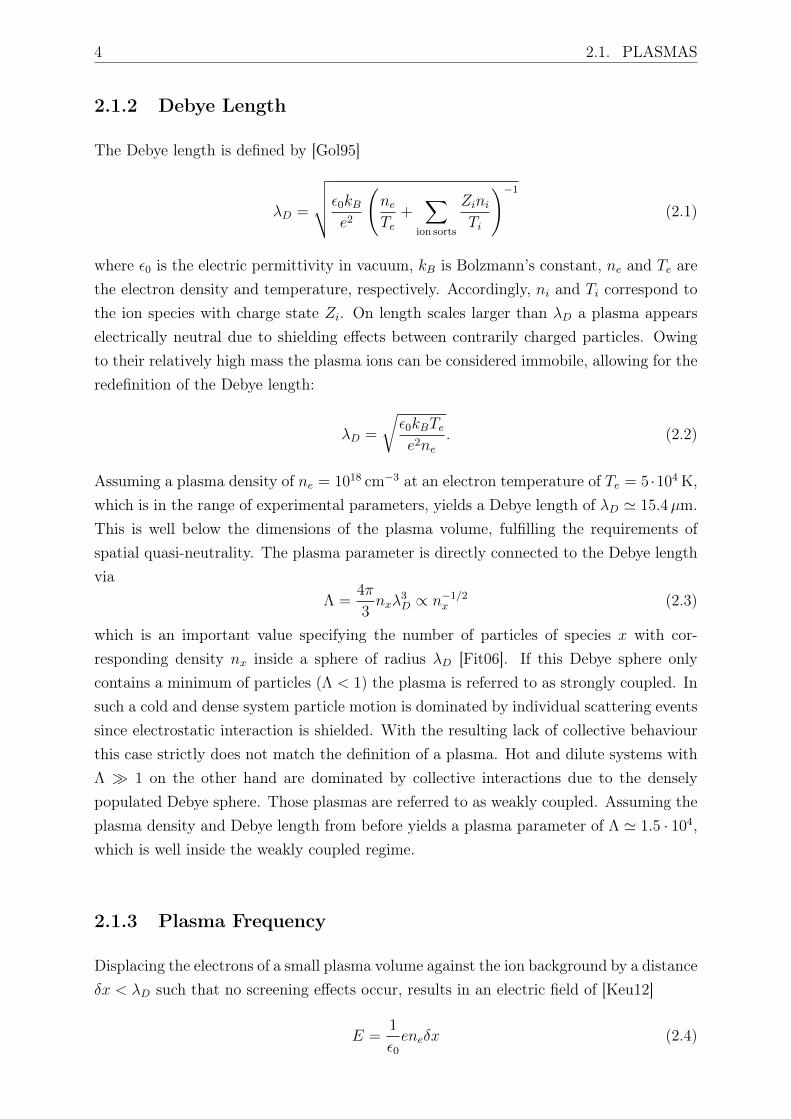
where ε0 is the electric permittivity in vacuum, kB is Bolzmann’s constant, ne and Te arethe electron density and temperature, respectively. Accordingly, ni and Ti correspond tothe ion species with charge state Zi. On length scales larger than λD a plasma appearselectrically neutral due to shielding effects between contrarily charged particles. Owingto their relatively high mass the plasma ions can be considered immobile, allowing for theredefinition of the Debye length:
λD =
√ε0kBTee2ne
. (2.2)
Assuming a plasma density of ne = 1018 cm−3 at an electron temperature of Te = 5 ·104 K,which is in the range of experimental parameters, yields a Debye length of λD ' 15.4µm.This is well below the dimensions of the plasma volume, fulfilling the requirements ofspatial quasi-neutrality. The plasma parameter is directly connected to the Debye lengthvia
Λ =4π
3nxλ
3D ∝ n−1/2x (2.3)
which is an important value specifying the number of particles of species x with cor-responding density nx inside a sphere of radius λD [Fit06]. If this Debye sphere onlycontains a minimum of particles (Λ < 1) the plasma is referred to as strongly coupled. Insuch a cold and dense system particle motion is dominated by individual scattering eventssince electrostatic interaction is shielded. With the resulting lack of collective behaviourthis case strictly does not match the definition of a plasma. Hot and dilute systems withΛ 1 on the other hand are dominated by collective interactions due to the denselypopulated Debye sphere. Those plasmas are referred to as weakly coupled. Assuming theplasma density and Debye length from before yields a plasma parameter of Λ ' 1.5 · 104,which is well inside the weakly coupled regime.
2.1.3 Plasma Frequency
Displacing the electrons of a small plasma volume against the ion background by a distanceδx < λD such that no screening effects occur, results in an electric field of [Keu12]
E =1
ε0eneδx (2.4)
CHAPTER 2. THEORETICAL PRINCIPLES 5
with the corresponding equation of motion for the electrons inside this field being
med2
dt2δx = −eE. (2.5)
This leads to a wave equation of the form
d2
dt2δx+
nee2
ε0meδx = 0. (2.6)
The eigenfrequency of this harmonic oscillation is called the electron-plasma frequency
ωp =
√nee2
ε0me
. (2.7)
describing the basic angular oscillation frequency of so called plasma or Langmuir waves.It also defines the time scale τe for collective electron effects to take place. Accordingly,the plasma frequency for the ion background with mass mi can be defined as ωp,i =√Z2i e
2ni/ε0mi. However, due to their relatively high mass the ion motion is negligible ontypical LWFA time scales, hence the plasma frequency ωp in the following refers to theelectron plasma frequency. On discharge time scales, on the other hand, the ion motioncan not be neglected. The dispersion relation for plasma waves is given by [Boh49]
ω2L = ω2
p +3kBTeme
k2L (2.8)
where kL is the so called Langmuir wave vector.
2.1.4 Breakdowns and Paschen’s Law
Electric breakdowns and ignition of plasma discharges in gases are complex topics, there-fore only a qualitative description of the main features will be given in this section. Formore detailed explanations see for example [Din05].
Electrical breakdown in gases is initiated by applying a high voltage (HV) between adischarge gap consisting of two electrodes. The breakdown starts with the generation ofa free electron due to an external source, e.g. natural radioactivity, cosmic radiation or anionising laser beam. Owing to the electric field between the electrodes the electron beginsto be accelerated towards the anode, generating more electrons by impact-ionisation ofthe gas. The newly created electrons, in turn, are accelerated in the electric field andionise the gas, causing an exponential growth of charged particles between the electrodes.Additional electrons are produced by positive ions colliding with the cathode (secondaryelectron emission). If the increasing current density reaches a critical value, a breakdownoccurs. The voltage necessary to initiate a breakdown UB depends on the product of the
6 2.1. PLASMAS
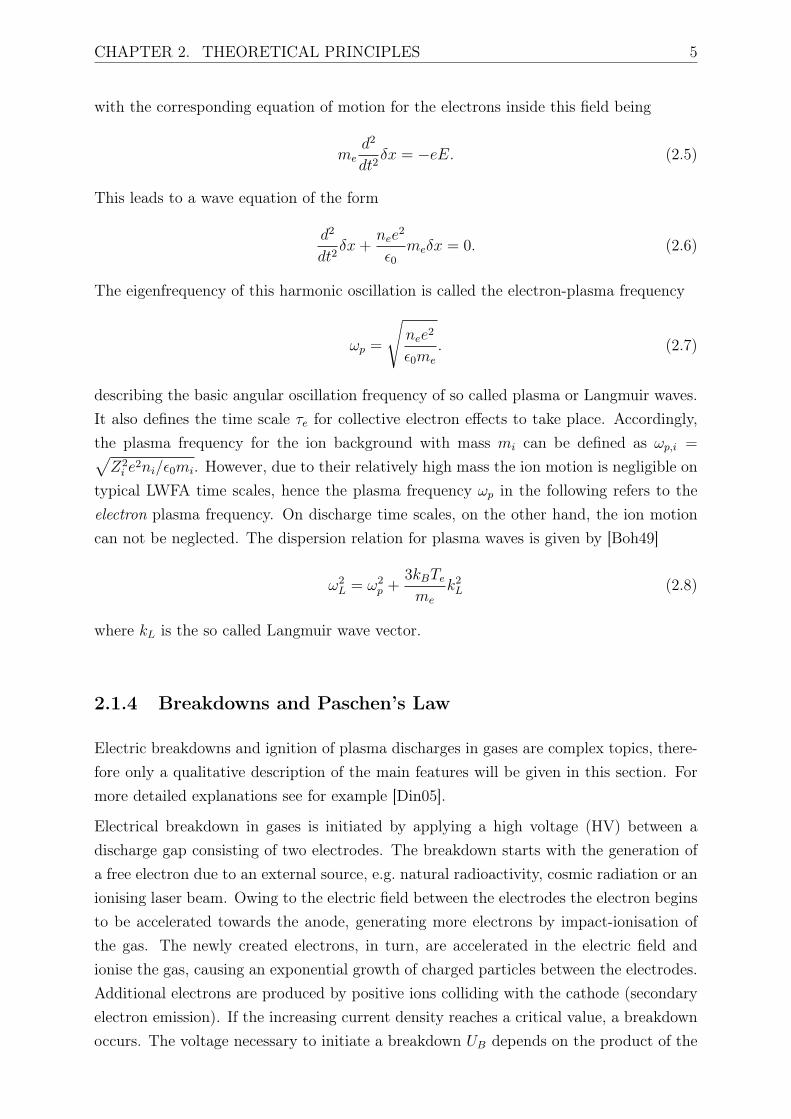
Figure 2.1: Paschen curves for helium, neon, argon, hydrogen and nitrogen. Plot from[WiC09*].
discharge-gap spacing d and the gas pressure p, UB = UB(pd) [Pas89]. This dependence,known as Paschen’s law, is shown in figure 2.1 for different gas types.
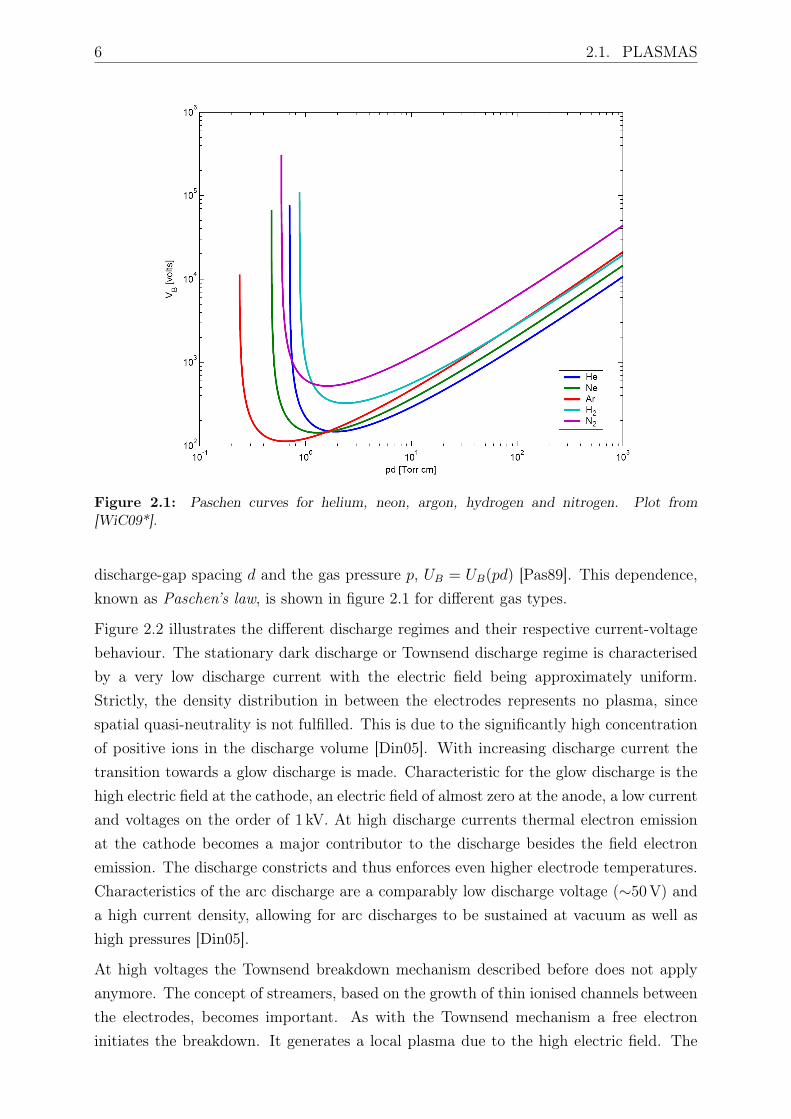
Figure 2.2 illustrates the different discharge regimes and their respective current-voltagebehaviour. The stationary dark discharge or Townsend discharge regime is characterisedby a very low discharge current with the electric field being approximately uniform.Strictly, the density distribution in between the electrodes represents no plasma, sincespatial quasi-neutrality is not fulfilled. This is due to the significantly high concentrationof positive ions in the discharge volume [Din05]. With increasing discharge current thetransition towards a glow discharge is made. Characteristic for the glow discharge is thehigh electric field at the cathode, an electric field of almost zero at the anode, a low currentand voltages on the order of 1 kV. At high discharge currents thermal electron emissionat the cathode becomes a major contributor to the discharge besides the field electronemission. The discharge constricts and thus enforces even higher electrode temperatures.Characteristics of the arc discharge are a comparably low discharge voltage (∼50V) anda high current density, allowing for arc discharges to be sustained at vacuum as well ashigh pressures [Din05].
At high voltages the Townsend breakdown mechanism described before does not applyanymore. The concept of streamers, based on the growth of thin ionised channels betweenthe electrodes, becomes important. As with the Townsend mechanism a free electroninitiates the breakdown. It generates a local plasma due to the high electric field. The
CHAPTER 2. THEORETICAL PRINCIPLES 7
Figure 2.2: Voltage versus current plot of all low-density plasma discharge regimes (darkdischarge, glow discharge and arc discharge modes). Plot from [Rot95].
plasma emits highly energetic photons, producing new electrons by photoionisation. Thegrowing streamer ultimately leads to a breakdown followed by an arc discharge, limitedby the power source. However, for further details it is referred to literature, e.g. [Mor97],due to the complexity of the streamer mechanism.
The discharge parameters used throughout this thesis correspond to the arc-dischargeregime. The measured impedance characteristics indicate that the transition is made viathe streamer mechanism.
2.2 Laser Wake-Field Acceleration
A laser wake-field accelerator (LWFA) is a laser-driven plasma-based accelerator. Theplasma needed is usually generated by ionising a gas via a high-voltage (HV) dischargeor the laser driver itself. Typically hydrogen or helium is used, since it can be fullyionised when generating the plasma due to its low atomic number and hence preventsionisation defocussing [Aug92]. When propagating through the plasma the laser-driver’sponderomotive force expels the plasma electrons in both, longitudinal and transversedirection. Because of their high mass compared to the electrons the ions can be consideredto form a static background, resulting in the laser leaving behind a region of positivecharge. The expelled electrons are then attracted by the resulting coulomb force andoscillate around their original position, leading to an electron density modulation with apeak behind the positively charged region following the driver. This plasma wave left bythe laser is called the wakefield. Its phase velocity is proportional to the group velocityof the driving laser pulse for a flat density profile. The longitudinal coulomb field created
8 2.2. LASER WAKE-FIELD ACCELERATION
−16 −14 −12 −10 −8 −6 −4 −2 0 2 4−1
−0.5
0
0.5
1
1.5
kpζ
∆n/ne
e0
a
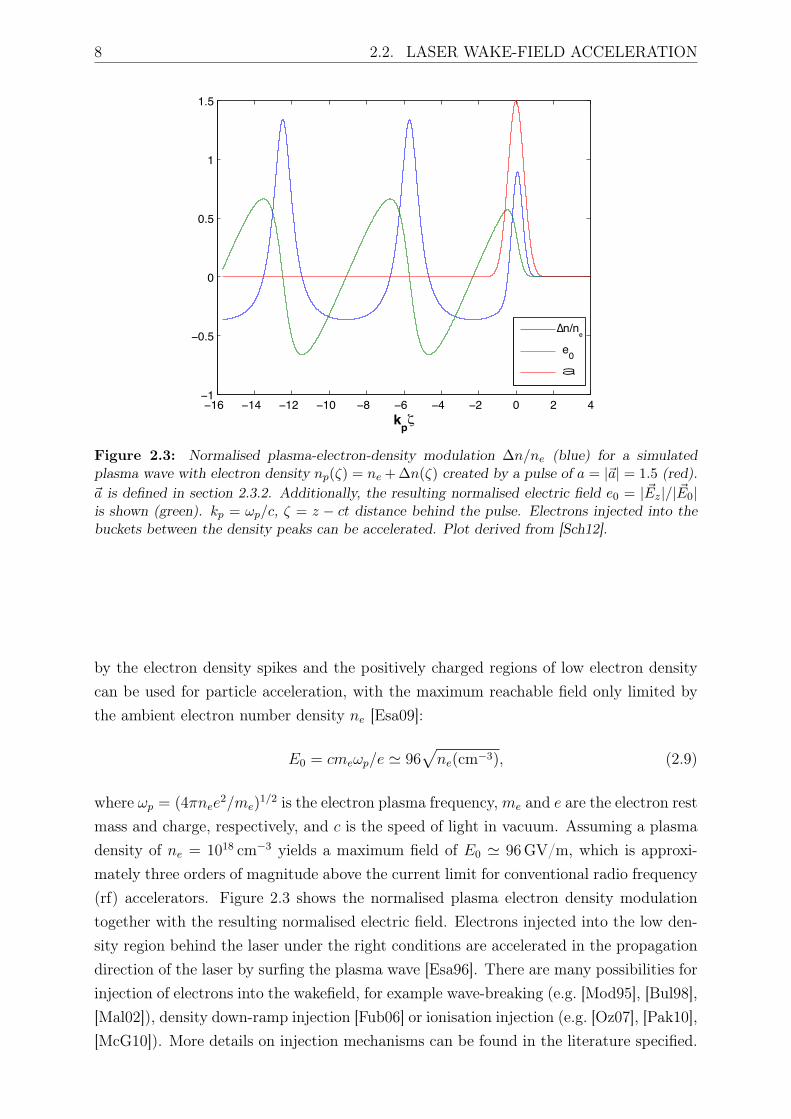
Figure 2.3: Normalised plasma-electron-density modulation ∆n/ne (blue) for a simulatedplasma wave with electron density np(ζ) = ne + ∆n(ζ) created by a pulse of a = |~a| = 1.5 (red).~a is defined in section 2.3.2. Additionally, the resulting normalised electric field e0 = | ~Ez|/| ~E0|is shown (green). kp = ωp/c, ζ = z − ct distance behind the pulse. Electrons injected into thebuckets between the density peaks can be accelerated. Plot derived from [Sch12].
by the electron density spikes and the positively charged regions of low electron densitycan be used for particle acceleration, with the maximum reachable field only limited bythe ambient electron number density ne [Esa09]:
E0 = cmeωp/e ' 96√ne(cm−3), (2.9)
where ωp = (4πnee2/me)
1/2 is the electron plasma frequency,me and e are the electron restmass and charge, respectively, and c is the speed of light in vacuum. Assuming a plasmadensity of ne = 1018 cm−3 yields a maximum field of E0 ' 96GV/m, which is approxi-mately three orders of magnitude above the current limit for conventional radio frequency(rf) accelerators. Figure 2.3 shows the normalised plasma electron density modulationtogether with the resulting normalised electric field. Electrons injected into the low den-sity region behind the laser under the right conditions are accelerated in the propagationdirection of the laser by surfing the plasma wave [Esa96]. There are many possibilities forinjection of electrons into the wakefield, for example wave-breaking (e.g. [Mod95], [Bul98],[Mal02]), density down-ramp injection [Fub06] or ionisation injection (e.g. [Oz07], [Pak10],[McG10]). More details on injection mechanisms can be found in the literature specified.
CHAPTER 2. THEORETICAL PRINCIPLES 9
2.3 Laser and Optics
2.3.1 Gaussian Beam Optics
In this subsection a brief overview of Gaussian beam optics is given. For a deeper insightplease refer to literature, e.g. [Sie86] or [Sve98].
The electric field of an electromagnetic (em) wave in the so-called scalar approximation,where em-fields are uniformly polarised, can be described by [Sve98]
E(x, y, z, t) = E(x, y, z)exp(jωt) (2.10)
with ω being the frequency. Assuming the wave to be propagating only at a small angleθ in z direction, in the so-called paraxial wave approximation, the complex amplitude Ecan be written as
E = u(x, y, z)exp[−(jkz)] (2.11)
with k = ω/c, c being the speed of light in vacuum. u is a slowly varying functioncompared to the wavelength scale and has to satisfy the paraxial wave equation
∇2⊥u− 2jk
∂u
∂z= 0 (2.12)
where ∇2⊥ = (∂2/∂x2) + (∂2/∂y2). Gaussian beams are a class of E-field solutions to the
paraxial wave equation. They represent an ideal case of real laser beams.
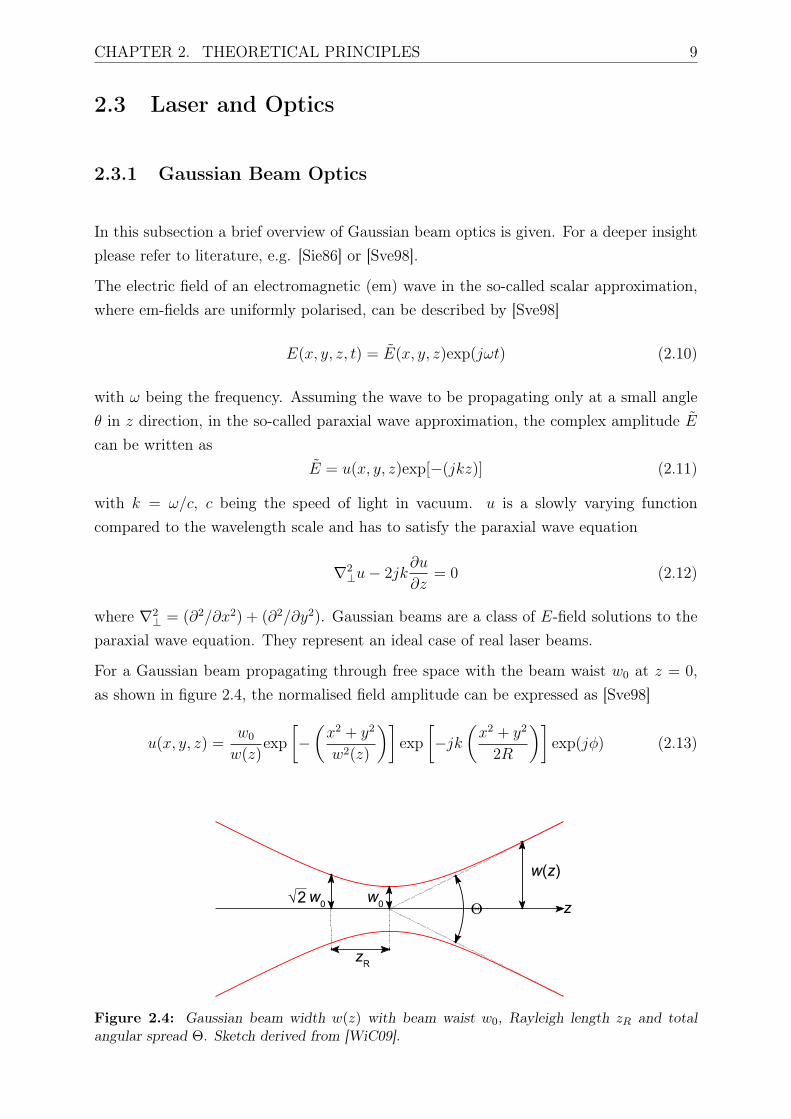
For a Gaussian beam propagating through free space with the beam waist w0 at z = 0,as shown in figure 2.4, the normalised field amplitude can be expressed as [Sve98]
u(x, y, z) =w0
w(z)exp
[−(x2 + y2
w2(z)
)]exp
[−jk
(x2 + y2
2R
)]exp(jφ) (2.13)
Figure 2.4: Gaussian beam width w(z) with beam waist w0, Rayleigh length zR and totalangular spread Θ. Sketch derived from [WiC09].
10 2.3. LASER AND OPTICS
where
w2(z) = w20
[1 +
(z
zR
)2]
(2.14)
is the beam radius at z,
R(z) =
[1 +
(zRz
)2](2.15)
is the phase-front radius at z with R(0) =∞ and φ is the phase. The length zR at whichthe beam radius has grown by a factor of
√2 is called the Rayleigh length and defined as
zR =πw2
0
λ, (2.16)
where λ is the laser wavelength. If the beam can be considered axial symmetric withr2 = x2 + y2 and has a Gaussian time dependence, i.e. for a laser pulse of finite length τ ,the field amplitude can also be written as
U(r, z, t) = E0w0
w(z)exp
[−(
r2
w2(z)
)]exp
[−jk
(r2
2R
)]exp
[−(t2
τ 2
)]exp(jφ) (2.17)
where E0 = U(0, 0, 0) is the peak amplitude of the electrical field.
2.3.2 Wave Guiding in Plasma
Optical guiding in plasma is based on refractive guiding. If the index of refraction ηr(r)has its maximum on axis, i.e. ∂ηr/∂r < 0, the phase velocity on axis is slower than offaxis, causing the phase fronts of the laser beam to curve and focus towards the axis. Inthis subsection only a brief summary of the guiding mechanisms in plasmas will be given,since only the qualitative aspects of guiding are of importance for this thesis. For anin-depth review see for example [Spr92], [Esa97], [Esa09].
The normalised vector potential of a laser field with vector potential ~A is defined by~a = e ~A/mec
2. For a = |~a| = 1 the kinetic energy gain of an electron in a half-cycle of alight wave is comparable to its rest energy. Hence, a = 1 denotes the threshold betweenthe sub-relativistic (a 1) and the relativistic case (a ≥ 1). For a laser of frequency ωpropagating through a plasma with the unperturbed plasma frequency ωp0 the refractiveindex in the limits a2 1, |∆np/n0| 1, and |δn/n0| 1 then is [Esa96]
ηr ' 1−ω2p0
2ω2
(1− a2
2+
∆npn0
+δn
n0
)(2.18)
where n0 = n(r = 0) is the on-axis plasma-electron density. This expression contains themain contributions to laser guiding in plasmas:
CHAPTER 2. THEORETICAL PRINCIPLES 11
The a2/2 term accounts for relativistic self-guiding that occurs for laser powers above acritical power Pc. The laser induces a relativistic electron motion, mainly a quivermotion in the transverse direction, hence varying the electron density and mass.For a laser intensity profile peaked on axis ∂a2/∂r < 0 the resulting profile of therefractive index (∂ηr/∂r < 0) leads to the possibility of guiding. However, since thelaser modifies the refractive index on the plasma frequency timescale rather thanthe laser frequency time scale, relativistic self-guiding is ineffective in preventing thediffraction of short (L ≤ λp) laser pulses [Spr92].
The ∆np/n0 term is responsible for preformed density channel guiding. Density chan-nels in plasma can be created, for example, by an intense laser pulse through acombination of ponderomotive and thermal effects or by capillary discharges. Aradially increasing density profile (∂n/∂r>0) corresponds to a radially decreasingrefractive index (∂ηr/∂r < 0), hence enables guiding. In the ideal case of a parabolicplasma channel the electron density is given by ∆np(r) = n0 + ∆n(r/r0)
2, wherer0 is the channel radius or, for a capillary discharge waveguide, approximately thecapillary radius. When no further ionisation takes place and ponderomotive andrelativistic effects are neglected, the so-called matched spot size is
wM =
(r20
πre∆n
) 14
(2.19)
with re being the classical electron radius [Esa97]. For a Gaussian beam focused atthe entrance to the channel with a spot size w0 = wM , the spot size remains constantthroughout the propagation through the channel. If w0 6= wM the spot size of thebeam will oscillate between w0 and w2
M/w0 with a length period of π2w2M/λ.
The δn/n0 term accounts for self-channeling and plasma wave guiding. When propa-gating in an initially uniform plasma, the radial ponderomotive force of a long laserpulse (L > λp) can expel electrons from the axis. This creates a density channelthat can enhance the effects of relativistic self-guiding and is called ponderomotiveself-channeling [Spr92]. Provided an ultrashort (L < λp) laser pulse is properlyphased within the wakefield and the wakefield amplitude is sufficiently large, thelaser pulse can also be guided by a plasma wave [Tin90]. For a density oscillationof the plasma wave of the form δn = δn(r) sin(kpζ), where ζ = z − ct is the dis-tance behind the laser pulse, δn > 0 and dδn/dr < 0, the regions of the plasmawave where sin(kpζ) < 0 enhance focussing, whereas the regions where sin(kpζ) > 0
enhance diffraction.
12 2.4. MULTI-PHOTON IONISATION
2.4 Multi-Photon Ionisation
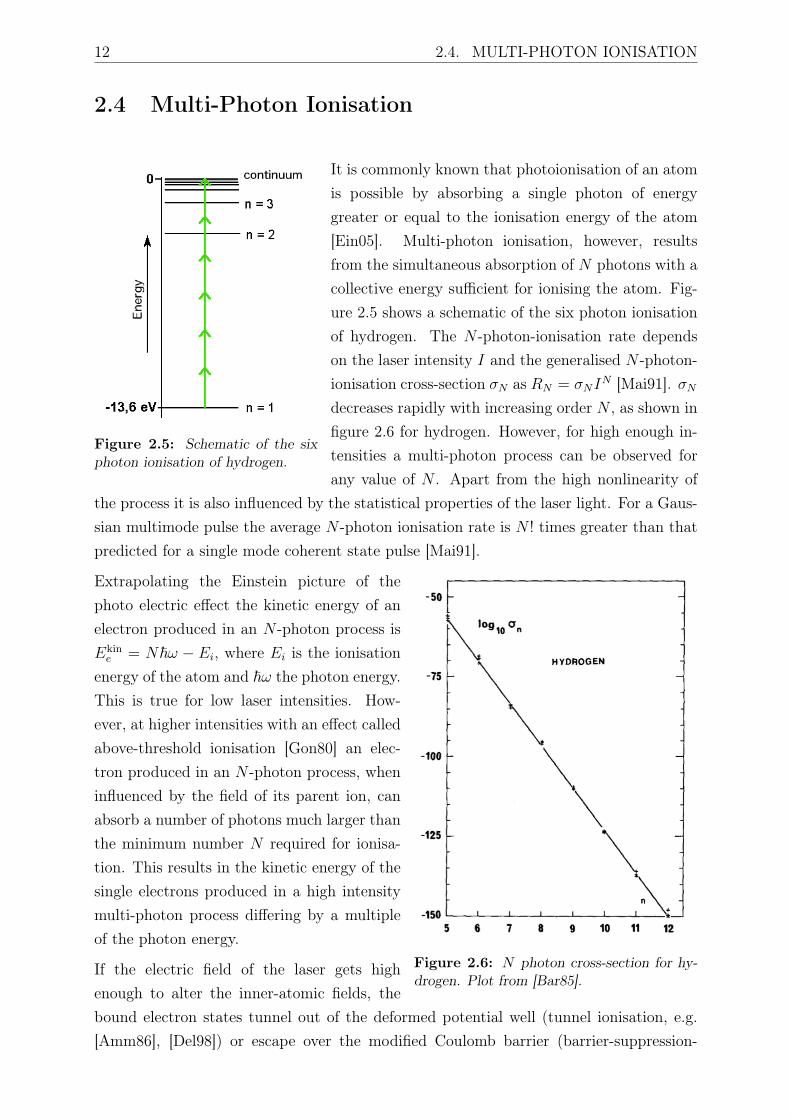
Figure 2.5: Schematic of the sixphoton ionisation of hydrogen.
It is commonly known that photoionisation of an atomis possible by absorbing a single photon of energygreater or equal to the ionisation energy of the atom[Ein05]. Multi-photon ionisation, however, resultsfrom the simultaneous absorption of N photons with acollective energy sufficient for ionising the atom. Fig-ure 2.5 shows a schematic of the six photon ionisationof hydrogen. The N -photon-ionisation rate dependson the laser intensity I and the generalised N -photon-ionisation cross-section σN as RN = σNI
N [Mai91]. σNdecreases rapidly with increasing order N , as shown infigure 2.6 for hydrogen. However, for high enough in-tensities a multi-photon process can be observed forany value of N . Apart from the high nonlinearity of
the process it is also influenced by the statistical properties of the laser light. For a Gaus-sian multimode pulse the average N -photon ionisation rate is N ! times greater than thatpredicted for a single mode coherent state pulse [Mai91].
Figure 2.6: N photon cross-section for hy-drogen. Plot from [Bar85].
Extrapolating the Einstein picture of thephoto electric effect the kinetic energy of anelectron produced in an N -photon process isEkine = N~ω − Ei, where Ei is the ionisation
energy of the atom and ~ω the photon energy.This is true for low laser intensities. How-ever, at higher intensities with an effect calledabove-threshold ionisation [Gon80] an elec-tron produced in an N -photon process, wheninfluenced by the field of its parent ion, canabsorb a number of photons much larger thanthe minimum number N required for ionisa-tion. This results in the kinetic energy of thesingle electrons produced in a high intensitymulti-photon process differing by a multipleof the photon energy.
If the electric field of the laser gets highenough to alter the inner-atomic fields, thebound electron states tunnel out of the deformed potential well (tunnel ionisation, e.g.[Amm86], [Del98]) or escape over the modified Coulomb barrier (barrier-suppression-
CHAPTER 2. THEORETICAL PRINCIPLES 13
ionisation, e.g. [Aug91], [Del98]). The Keldysh parameter[Kel65], [Per67]
γK =
√Ei
2Up, (2.20)
which expresses the ratio of the ionisation energy Ei to the ponderomotive potentialof the electromagnetic field Up, determines wether multi-photon mechanisms (γK > 1)or strong-field effects (γK 1) dominate the ionisation process. The ponderomotivepotential is defined as the average over one oscillation period of the electron quiver energyUp = 〈Eq〉 = 1
2me〈|~v|2〉, where the electron quiver velocity ~v is given by the equation of
motion for a free electron of charge e and massme in an oscillating light field with magneticfield ~B and electric field ~E under consideration of the Lorentz force [Max61]
med
dt(γ~v) = −e( ~E + ~v × ~B). (2.21)
In the sub-relativistic case (~v c) the relativistic factor γ = (1 − |~v|2/c2)−1/2 is ap-proximately unity and the ~v × ~B term is negligible since | ~B| = | ~E|/c. Hence equation2.21 reduces to me
d~vdt
= −e ~E from which the electron quiver motion can be obtained byintegrating over time. Assuming an electron initially at rest (~v0 = 0) and a slowly varyingelectric field amplitude compared to one oscillation (i.e. τ T = 2π/ω in equation 2.17)yields for the ponderomotive potential:
Up =e2
4meω2| ~E0|2 ≈ 9.33 · 10−6Iλ2 in eV. (2.22)

14 2.4. MULTI-PHOTON IONISATION
Chapter 3
Experimental Setup
The scope of this thesis is to investigate the possibility of laser-based discharge ignitionfor capillary waveguides and to determine advantages and disadvantages for the guidingof a laser driver. In this chapter the experimental setup is described. The measurementsand results are presented and analysed in chapter 4.
All measurements were carried out in the gas-target characterisation lab. The setup andits components are described and characterised in the following sections.
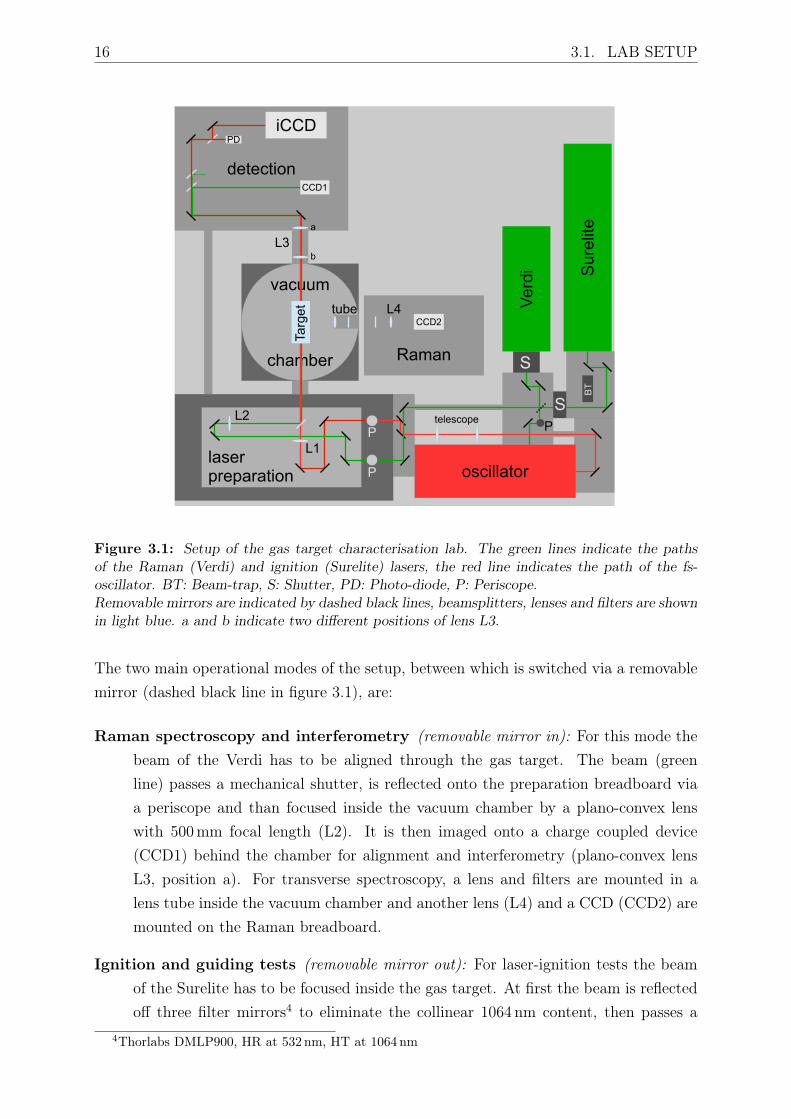
3.1 Lab Setup
The layout of the characterisation lab shown in figure 3.1 is designed to allow laser-baseddischarge ignition and laser guiding tests as well as Raman spectroscopy. Also the optionof longitudinal interferometry was kept in mind during the design phase.
The gas targets (which are described in section 3.3) that are used for the experiments aremounted on a Hexapod1, a six axis translation and rotation device, inside the vacuumchamber, which allows easy alignment to the laser beams via a computer interface.
The experiments required three different lasers to be used in two operational modes of thesetup. The Verdi2 is a continuous wave laser at a wavelength of 532 nm with a maximumoutput power of 5W. It is used either for Raman spectroscopy and interferometry, forpre-alignment of the gas target or to pump the fs-oscillator3 which is utilised as testlaser for guiding experiments. It emits fs-pulses with a central wavelength of 800 nm anda repetition rate of 79.48MHz with an average power of ∼250mW. A Surelite SL II-10pulse laser with a wavelength of 532 nm (frequency doubled) was used as discharge ignitionlaser and is described and characterised in section 3.2.
1PI M-824.3VG2Coherent Verdi V-53Femtolasers FEMTOSOURCE compact 20
16 3.1. LAB SETUP
detection
vacuum
chamber
laserpreparation
Raman
oscillator
Ver
di Sur
elite
S
S
BT
PDiCCD
CCD1
b
a
telescope
CCD2
L3
L2
L1
L4tube
P
P
P
Targ
et
Figure 3.1: Setup of the gas target characterisation lab. The green lines indicate the pathsof the Raman (Verdi) and ignition (Surelite) lasers, the red line indicates the path of the fs-oscillator. BT: Beam-trap, S: Shutter, PD: Photo-diode, P: Periscope.Removable mirrors are indicated by dashed black lines, beamsplitters, lenses and filters are shownin light blue. a and b indicate two different positions of lens L3.
The two main operational modes of the setup, between which is switched via a removablemirror (dashed black line in figure 3.1), are:
Raman spectroscopy and interferometry (removable mirror in): For this mode thebeam of the Verdi has to be aligned through the gas target. The beam (greenline) passes a mechanical shutter, is reflected onto the preparation breadboard viaa periscope and than focused inside the vacuum chamber by a plano-convex lenswith 500mm focal length (L2). It is then imaged onto a charge coupled device(CCD1) behind the chamber for alignment and interferometry (plano-convex lensL3, position a). For transverse spectroscopy, a lens and filters are mounted in alens tube inside the vacuum chamber and another lens (L4) and a CCD (CCD2) aremounted on the Raman breadboard.
Ignition and guiding tests (removable mirror out): For laser-ignition tests the beamof the Surelite has to be focused inside the gas target. At first the beam is reflectedoff three filter mirrors4 to eliminate the collinear 1064 nm content, then passes a
4Thorlabs DMLP900, HR at 532 nm, HT at 1064 nm
CHAPTER 3. EXPERIMENTAL SETUP 17
mechanical shutter and takes the path of the Verdi beam described above.For guiding experiments the oscillator is pumped by the Verdi at a typical power of∼3.5W. The beam emerging from the oscillator is expanded by a telescope beforeit is sent to the preparation breadboard and in turn focused into the gas target by aplano-convex lens with a focal length of 400mm. To ensure that the oscillator andSurelite overlap along the full path through the gas target they are both pre-alignedvia two iris apertures, one before and one behind the vacuum chamber. For finealignment the path of the beams at different positions in the vicinity of their foci isimaged by CCD1. Behind the chamber the oscillator beam can also be imaged ontoan intensified charge coupled device (iCCD)5 (L3 at position a) or collimated fordetection via a photodiode (L3 at position b). Therefore it passes two filter mirrors6
to eliminate the radiation of the Surelite and fluorescence from the sapphire of thegas target.
The setup is housed for laser safety reasons. In figure 3.1 this is indicated by grey boxes.
3.2 Ignition Laser
The Surelite SL II-10 is a quality-switched (Q-switched) flash-lamp pumped Nd:YAG7
laser that emits pulses of approximately 6 ns length full width at half maximum (FWHM),at a wavelength of 1064 nm. It has a maximum repetition rate of 10Hz and a designmaximum pulse energy of 650mJ. With the frequency doubler installed the design pulseenergy is 300mJ at a wavelength of 532 nm with a pulse length of ∼5 ns FWHM. Theoutput power is adjustable by varying the flash-lamp voltage.
To make sure the laser meets its design specifications the pulse energy was measured byplacing a power-meter8 at the position of the beam-trap (see figure 3.1), so the 1064 nmradiation after the first filter mirror was detected. Since the available power-meter headwas not designed for the power of the laser, a thin sapphire plate was placed in thebeam path and the reflection ('4.36%) was measured at different flash-lamp voltages.Afterwards a second measurement was taken without the sapphire plate, but only for lowflash-lamp voltages. All measurements were taken using the internal timing generators ofthe laser with the delay between the flash lamp and the Q-switch set to 195µs.
The results plotted in figure 3.2a show that the measurements are in good agreement witheach other within the 5% measurement error of the power meter. The slight differencein the slope may be due to a different alignment of the power meter head. However,
5Andor iStar DH334T-18-U-036Thorlabs DMLP567; Longpass at 567 nm7Neodymium doped Yttrium-Aluminium-Garnet8Thorlabs ES220C
18 3.2. IGNITION LASER
Pu
lse
Ener
gy (a
tt.)
[mJ]
0
5
10
15
20
25
30
Pulse Energy [mJ]
0
100
200
300
400
500
600
700
Flashlamp Voltage [kV]1 1.1 1.2 1.3 1.4 1.5 1.6 1.7
(a) 1064 nm
Puls
e En
ergy
[mJ]
0
20
40
60
80
100
120
140
Flashlamp Voltage [kV]1.1 1.2 1.3 1.4 1.5 1.6
(b) 532 nm
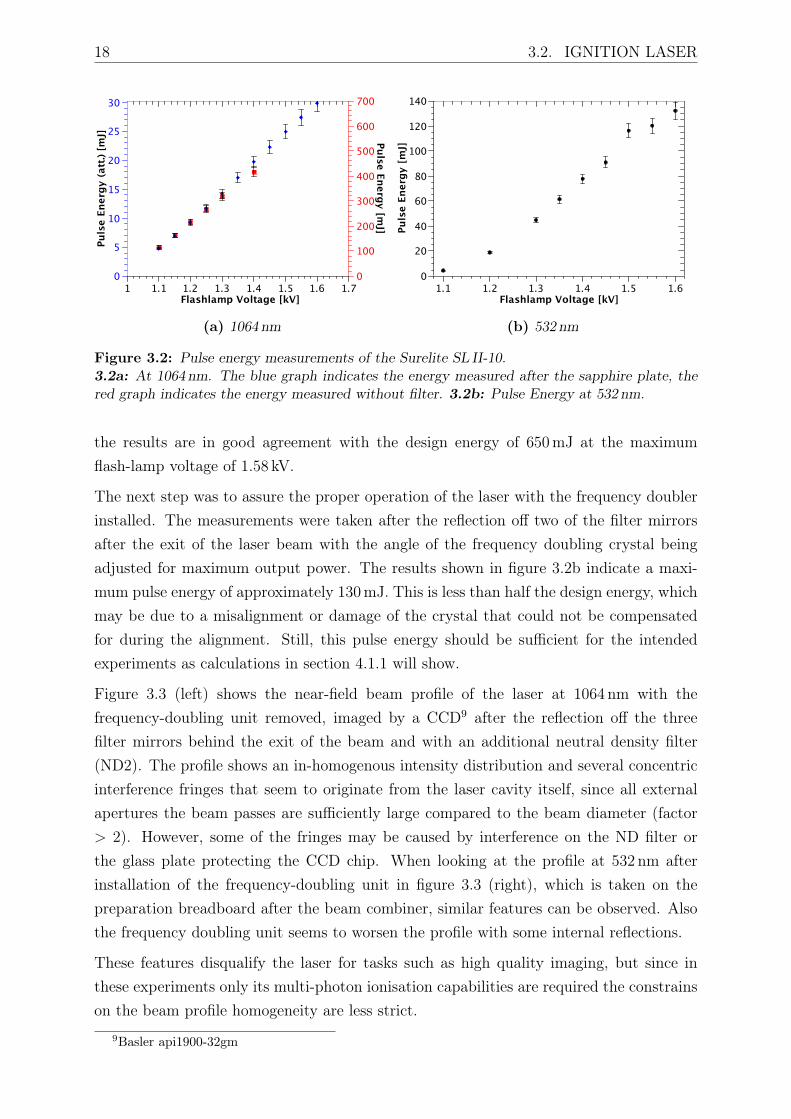
Figure 3.2: Pulse energy measurements of the Surelite SL II-10.3.2a: At 1064 nm. The blue graph indicates the energy measured after the sapphire plate, thered graph indicates the energy measured without filter. 3.2b: Pulse Energy at 532 nm.
the results are in good agreement with the design energy of 650mJ at the maximumflash-lamp voltage of 1.58 kV.
The next step was to assure the proper operation of the laser with the frequency doublerinstalled. The measurements were taken after the reflection off two of the filter mirrorsafter the exit of the laser beam with the angle of the frequency doubling crystal beingadjusted for maximum output power. The results shown in figure 3.2b indicate a maxi-mum pulse energy of approximately 130mJ. This is less than half the design energy, whichmay be due to a misalignment or damage of the crystal that could not be compensatedfor during the alignment. Still, this pulse energy should be sufficient for the intendedexperiments as calculations in section 4.1.1 will show.
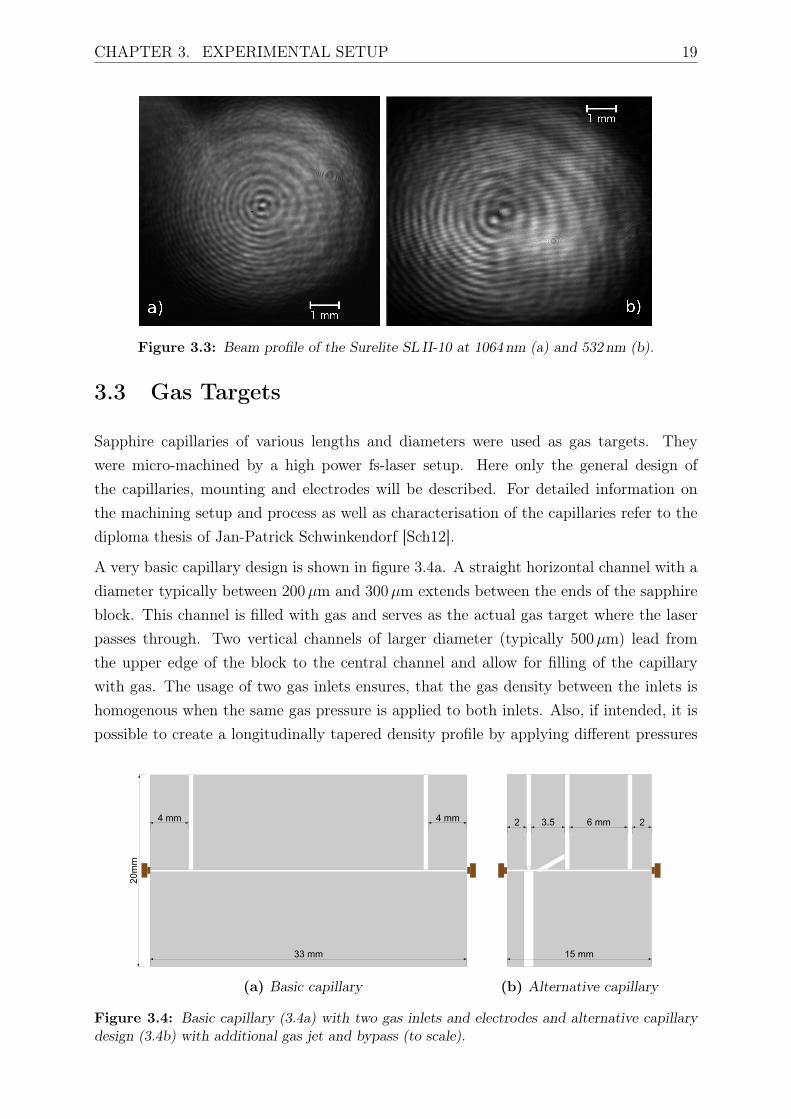
Figure 3.3 (left) shows the near-field beam profile of the laser at 1064 nm with thefrequency-doubling unit removed, imaged by a CCD9 after the reflection off the threefilter mirrors behind the exit of the beam and with an additional neutral density filter(ND2). The profile shows an in-homogenous intensity distribution and several concentricinterference fringes that seem to originate from the laser cavity itself, since all externalapertures the beam passes are sufficiently large compared to the beam diameter (factor> 2). However, some of the fringes may be caused by interference on the ND filter orthe glass plate protecting the CCD chip. When looking at the profile at 532 nm afterinstallation of the frequency-doubling unit in figure 3.3 (right), which is taken on thepreparation breadboard after the beam combiner, similar features can be observed. Alsothe frequency doubling unit seems to worsen the profile with some internal reflections.
These features disqualify the laser for tasks such as high quality imaging, but since inthese experiments only its multi-photon ionisation capabilities are required the constrainson the beam profile homogeneity are less strict.
9Basler api1900-32gm
CHAPTER 3. EXPERIMENTAL SETUP 19
Figure 3.3: Beam profile of the Surelite SL II-10 at 1064 nm (a) and 532 nm (b).
3.3 Gas Targets
Sapphire capillaries of various lengths and diameters were used as gas targets. Theywere micro-machined by a high power fs-laser setup. Here only the general design ofthe capillaries, mounting and electrodes will be described. For detailed information onthe machining setup and process as well as characterisation of the capillaries refer to thediploma thesis of Jan-Patrick Schwinkendorf [Sch12].
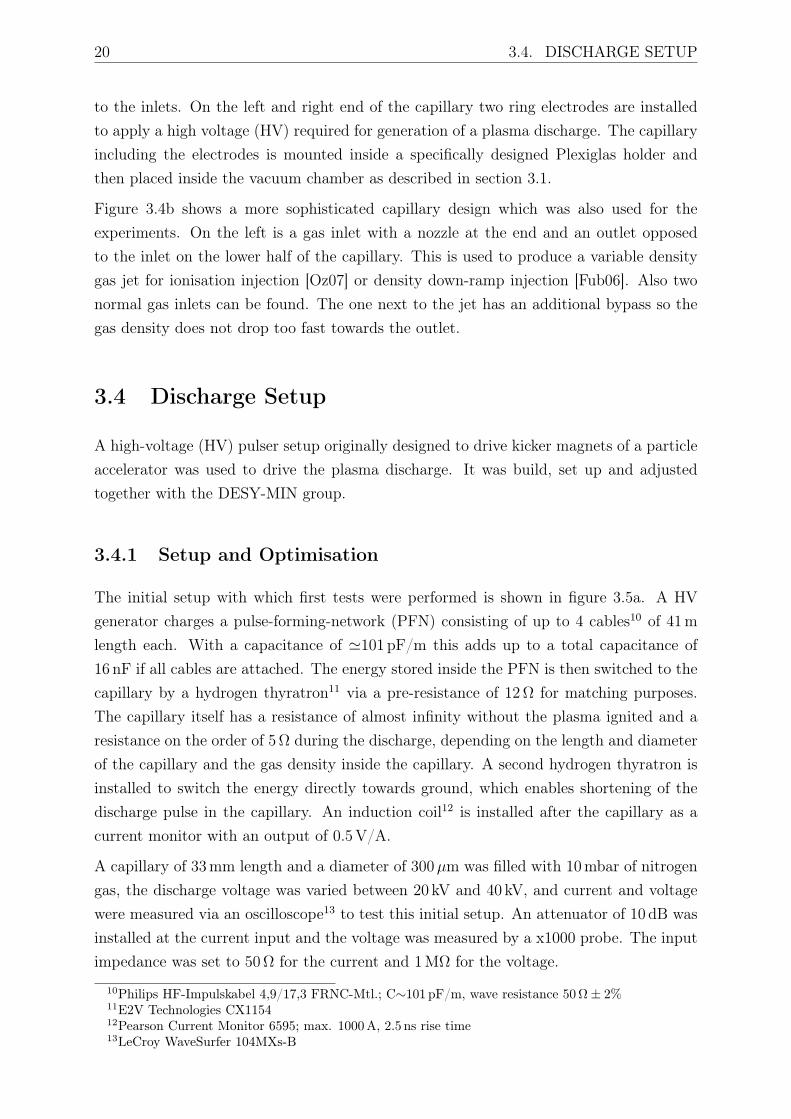
A very basic capillary design is shown in figure 3.4a. A straight horizontal channel with adiameter typically between 200µm and 300µm extends between the ends of the sapphireblock. This channel is filled with gas and serves as the actual gas target where the laserpasses through. Two vertical channels of larger diameter (typically 500µm) lead fromthe upper edge of the block to the central channel and allow for filling of the capillarywith gas. The usage of two gas inlets ensures, that the gas density between the inlets ishomogenous when the same gas pressure is applied to both inlets. Also, if intended, it ispossible to create a longitudinally tapered density profile by applying different pressures
33 mm
20m
m
4 mm 4 mm
(a) Basic capillary
15 mm
2 23.5 6 mm
(b) Alternative capillary
Figure 3.4: Basic capillary (3.4a) with two gas inlets and electrodes and alternative capillarydesign (3.4b) with additional gas jet and bypass (to scale).
20 3.4. DISCHARGE SETUP
to the inlets. On the left and right end of the capillary two ring electrodes are installedto apply a high voltage (HV) required for generation of a plasma discharge. The capillaryincluding the electrodes is mounted inside a specifically designed Plexiglas holder andthen placed inside the vacuum chamber as described in section 3.1.
Figure 3.4b shows a more sophisticated capillary design which was also used for theexperiments. On the left is a gas inlet with a nozzle at the end and an outlet opposedto the inlet on the lower half of the capillary. This is used to produce a variable densitygas jet for ionisation injection [Oz07] or density down-ramp injection [Fub06]. Also twonormal gas inlets can be found. The one next to the jet has an additional bypass so thegas density does not drop too fast towards the outlet.
3.4 Discharge Setup
A high-voltage (HV) pulser setup originally designed to drive kicker magnets of a particleaccelerator was used to drive the plasma discharge. It was build, set up and adjustedtogether with the DESY-MIN group.
3.4.1 Setup and Optimisation
The initial setup with which first tests were performed is shown in figure 3.5a. A HVgenerator charges a pulse-forming-network (PFN) consisting of up to 4 cables10 of 41mlength each. With a capacitance of '101 pF/m this adds up to a total capacitance of16 nF if all cables are attached. The energy stored inside the PFN is then switched to thecapillary by a hydrogen thyratron11 via a pre-resistance of 12Ω for matching purposes.The capillary itself has a resistance of almost infinity without the plasma ignited and aresistance on the order of 5Ω during the discharge, depending on the length and diameterof the capillary and the gas density inside the capillary. A second hydrogen thyratron isinstalled to switch the energy directly towards ground, which enables shortening of thedischarge pulse in the capillary. An induction coil12 is installed after the capillary as acurrent monitor with an output of 0.5V/A.
A capillary of 33mm length and a diameter of 300µm was filled with 10mbar of nitrogengas, the discharge voltage was varied between 20 kV and 40 kV, and current and voltagewere measured via an oscilloscope13 to test this initial setup. An attenuator of 10 dB wasinstalled at the current input and the voltage was measured by a x1000 probe. The inputimpedance was set to 50Ω for the current and 1MΩ for the voltage.
10Philips HF-Impulskabel 4,9/17,3 FRNC-Mtl.; C∼101 pF/m, wave resistance 50Ω± 2%11E2V Technologies CX115412Pearson Current Monitor 6595; max. 1000A, 2.5 ns rise time13LeCroy WaveSurfer 104MXs-B
CHAPTER 3. EXPERIMENTAL SETUP 21
HV
PFN
Rp
Cap
Thy1
Thy2
(a) Unoptimised discharge setup. R p=12Ω.
HV
PFN
Rp
Cap
R
Rg
Thy1
Thy2
(b) Optimised discharge setup. R p=20Ω.
Figure 3.5: Discharge setup as before (3.5a) and after (3.5b) optimisations. Cap = varying Ω,R = 2Ω, R g = 10MΩ.
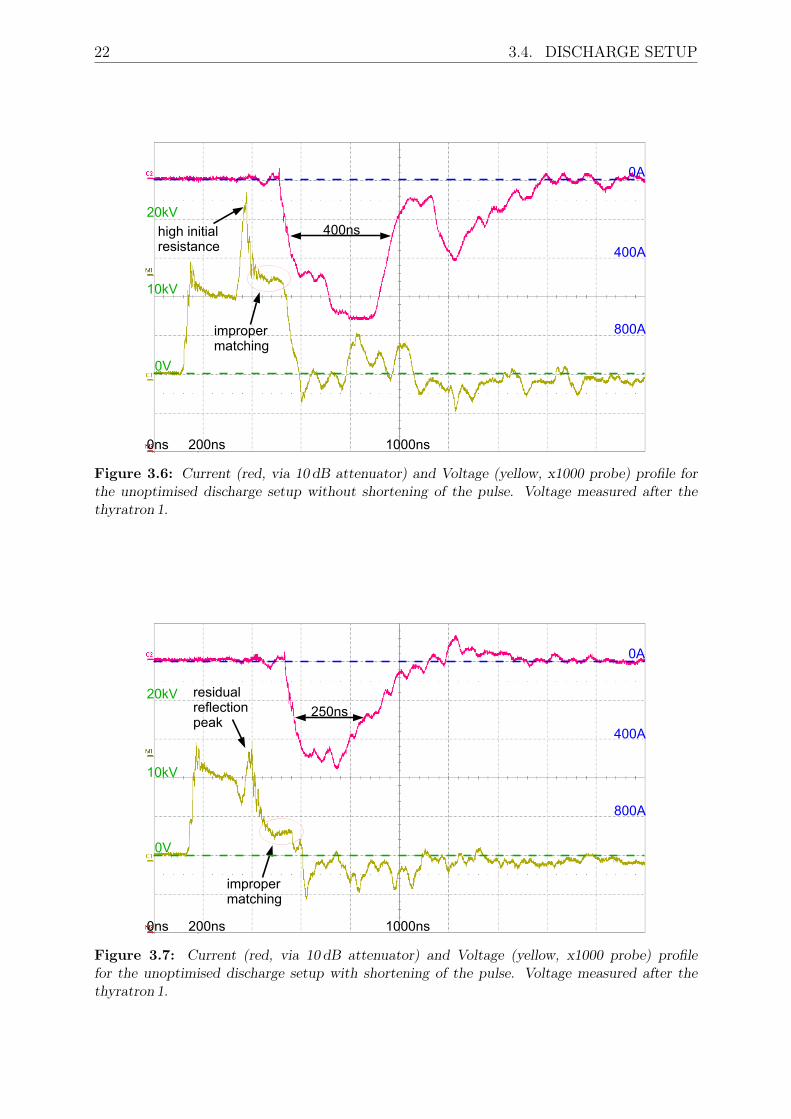
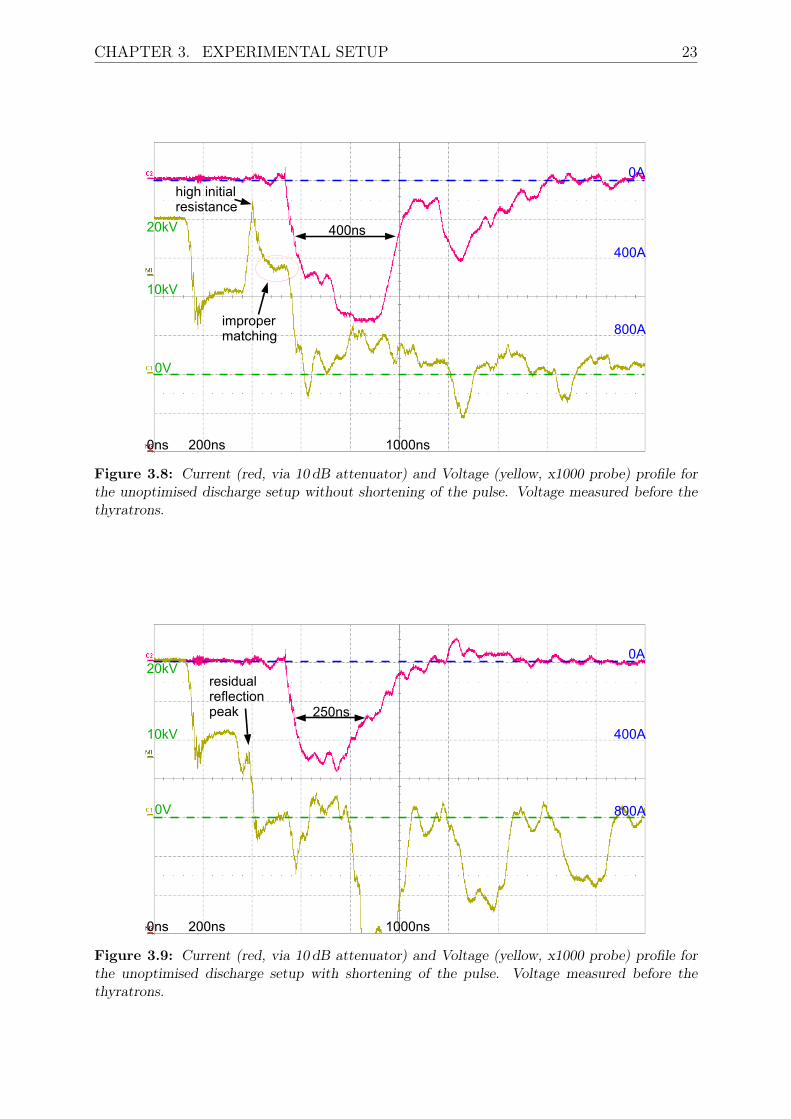
Figures 3.6 and 3.7 show the current through the capillary (red) and voltage (yellow)profiles for the unoptimized case with and without shortening of the pulse, with the voltagemeasured right after the first thyratron. The delay between the voltage and the current isdue to the fact that the voltage was measured directly at the pulser whereas the currentwas monitored at the capillary and travelled approximately 15m to the oscilloscope. Ascan be seen the profiles are far from smooth. There are numerous spikes due to reflectionsat the capillary and improper matching of the impedance. The high reflection peak in thevoltage profile is due to the high resistance of the capillary before the breakdown. Alsothe voltage not dropping to its initial value after the reflection peak is a clear indicationfor the impedance not being matched during the breakdown. If the pulse is shortened thespikes amplitude increases and the setup produces heavy electro-magnetic-pulses (EMPs),disturbing the control units. The same features can be observed if the voltage is measuredbefore the thyratrons (figures 3.8 and 3.9) directly at the PFN. The initially chargedvoltage drops to half its value when the discharge is triggered and decreases to zero whenthe discharge is over as it should, but there are also large reflection spikes and big noisepeaks. These become again more dominant for shortening of the pulse.
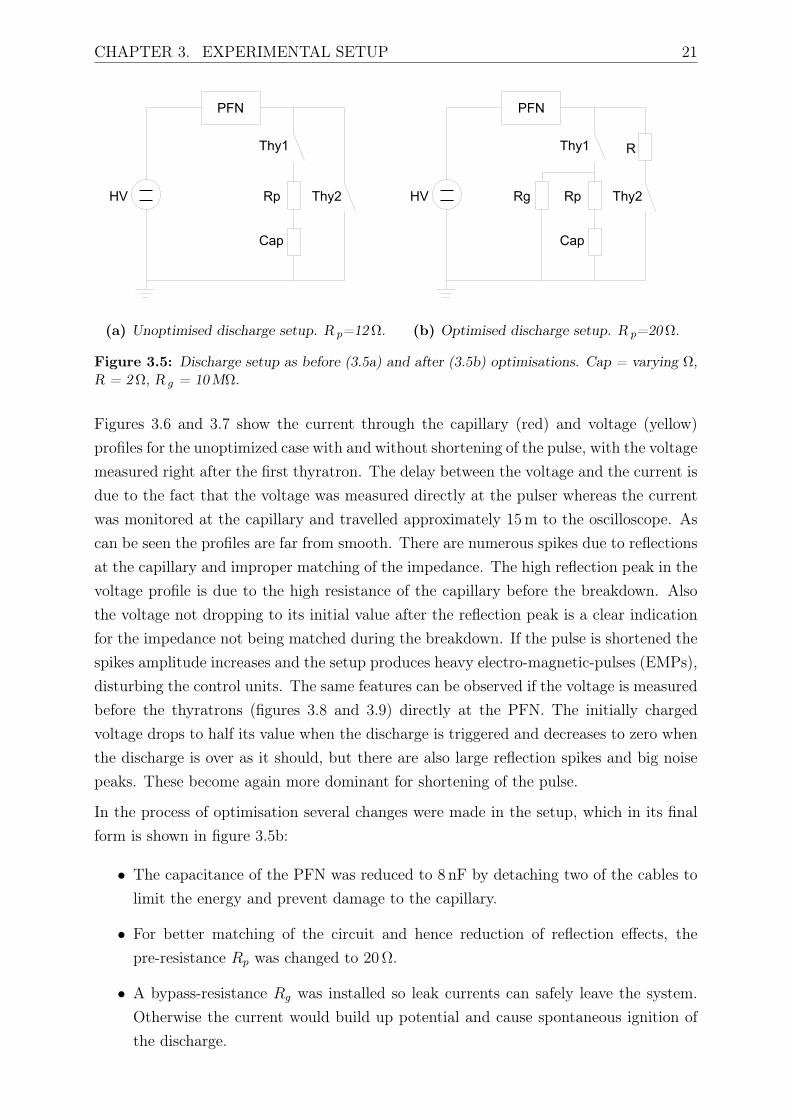
In the process of optimisation several changes were made in the setup, which in its finalform is shown in figure 3.5b:
• The capacitance of the PFN was reduced to 8 nF by detaching two of the cables tolimit the energy and prevent damage to the capillary.
• For better matching of the circuit and hence reduction of reflection effects, thepre-resistance Rp was changed to 20Ω.
• A bypass-resistance Rg was installed so leak currents can safely leave the system.Otherwise the current would build up potential and cause spontaneous ignition ofthe discharge.
22 3.4. DISCHARGE SETUP
400ns
impropermatching
high initialresistance
0V
10kV
20kV
0A
400A
800A
0ns 200ns 1000ns
Figure 3.6: Current (red, via 10 dB attenuator) and Voltage (yellow, x1000 probe) profile forthe unoptimised discharge setup without shortening of the pulse. Voltage measured after thethyratron 1.
250ns
residualreflection peak
impropermatching
0V
10kV
20kV
0A
400A
800A
0ns 200ns 1000ns
Figure 3.7: Current (red, via 10 dB attenuator) and Voltage (yellow, x1000 probe) profilefor the unoptimised discharge setup with shortening of the pulse. Voltage measured after thethyratron 1.
CHAPTER 3. EXPERIMENTAL SETUP 23
400ns
high initialresistance
impropermatching
0V
10kV
20kV
0A
400A
800A
0ns 200ns 1000ns
Figure 3.8: Current (red, via 10 dB attenuator) and Voltage (yellow, x1000 probe) profile forthe unoptimised discharge setup without shortening of the pulse. Voltage measured before thethyratrons.
impropermatching
250ns
residualreflectionpeak
0V
10kV
20kV0A
400A
800A
0ns 200ns 1000ns
Figure 3.9: Current (red, via 10 dB attenuator) and Voltage (yellow, x1000 probe) profile forthe unoptimised discharge setup with shortening of the pulse. Voltage measured before thethyratrons.
24 3.4. DISCHARGE SETUP
• An extra resistance R was installed before the second thyratron to ease the switchingand reduce the EMP. Thereby the discharge control units would not fail to operateanymore when shortening of the pulse is enabled.
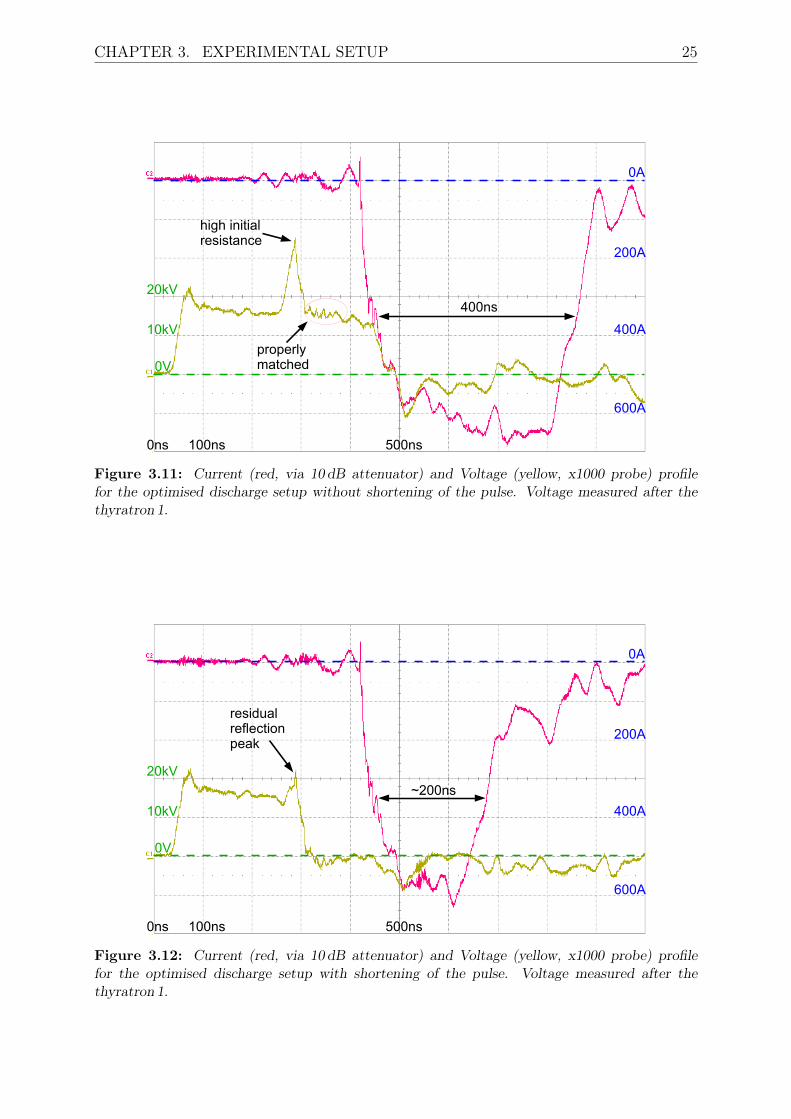
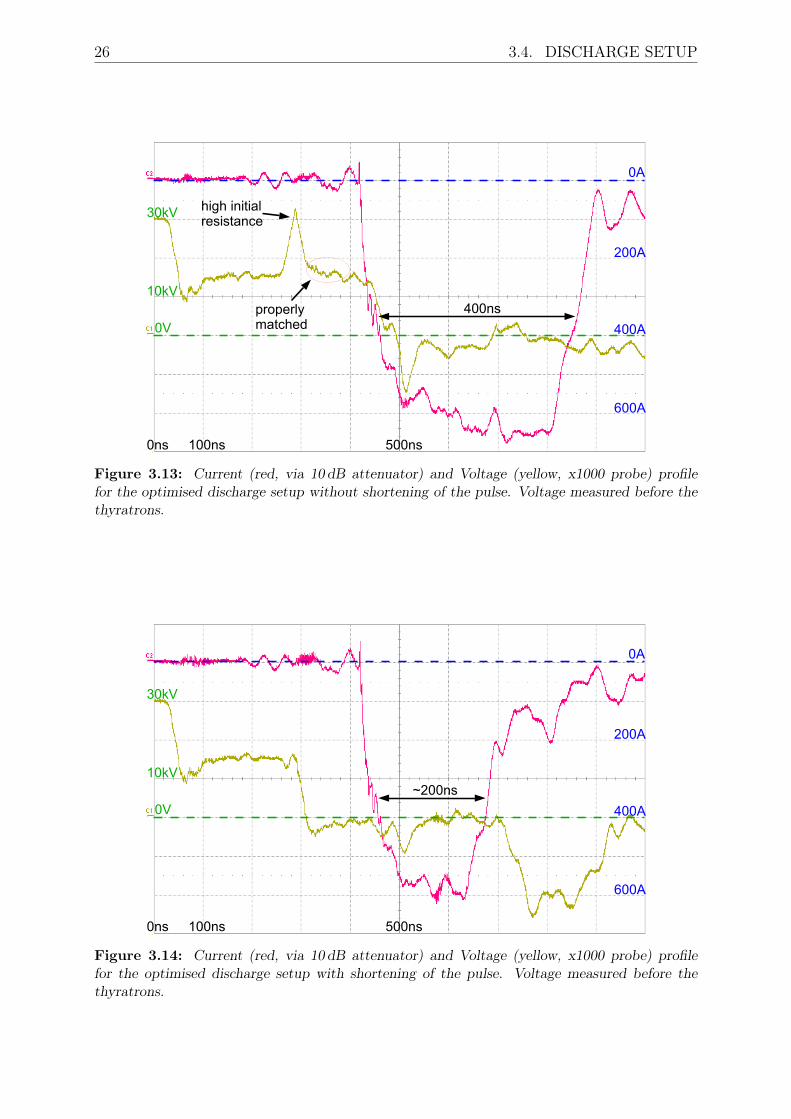
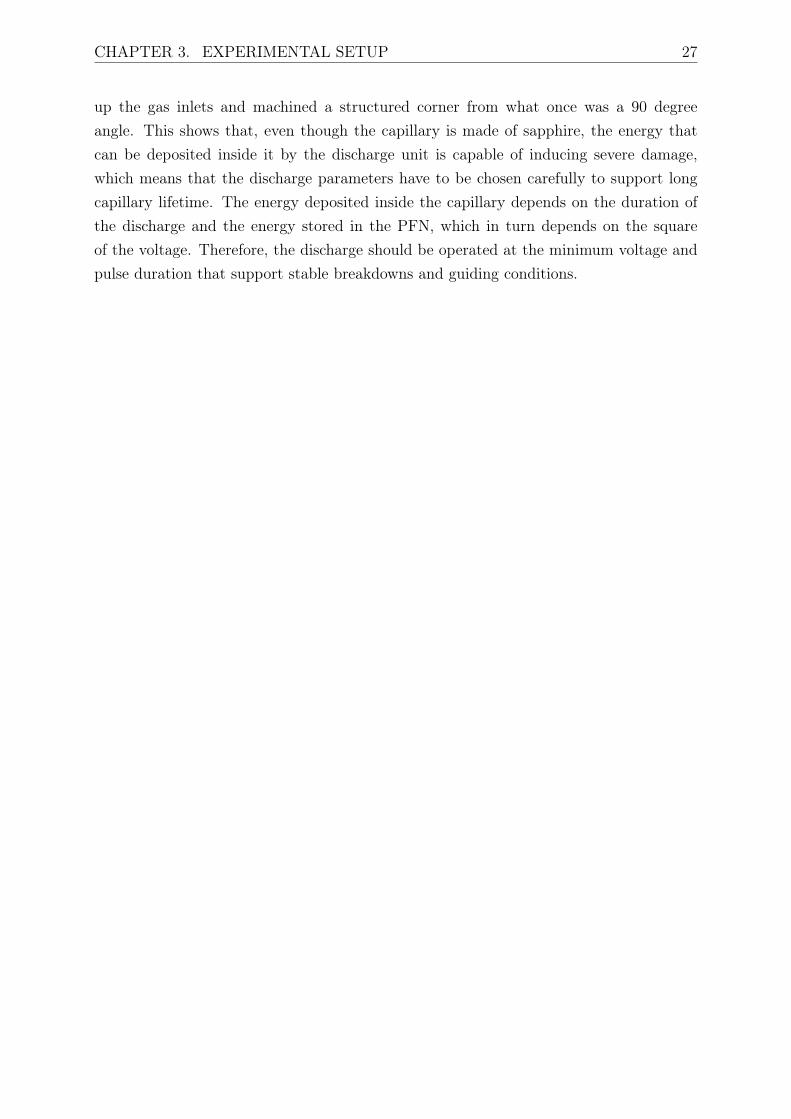
The optimisations lead to much smoother current and voltage profiles and allowed for safevariation of the pulse lengths between ∼200 ns and ∼400 ns. This is shown in figures 3.11,3.12, 3.13 and 3.14. Note that the high reflection peak is still visible. This is due to thehigh (almost infinite) initial resistance of the capillary before the discharge ignites andthe fact, that it is almost impossible to match the PFN to a quickly changing resistance.However, the voltage drops to its initial value behind the reflection, indicating a wellmatched impedance.
3.4.2 Energy and Ionisation Capability
If the total capacitance of the PFN of 8 nF is charged at a typical operating voltage of20 kV the stored energy equals 1.66 J. Considering a standard capillary of 33mm lengthwith a diameter of 200µm the gas density over the distance of 25mm between the two gasinlets can be assumed as homogenous. For nitrogen, which was used in the experiments,at a pressure of 100mbar there is a total of 4.17 · 1017 atoms in this region. With afirst order ionisation energy of 15.581± 0.008 eV [Tri89] the total energy required to fullyionise the gas is 1.04 J, so the energy stored in the PFN is sufficient for a full first orderionisation of the gas. This corresponds to a plasma density of 5.3 · 1018 cm−3. However,this is assuming a homogenous ionisation over the hole capillary volume between the gasinlets and neglecting second order ionisation, so it only gives a rough estimate of theplasma density.
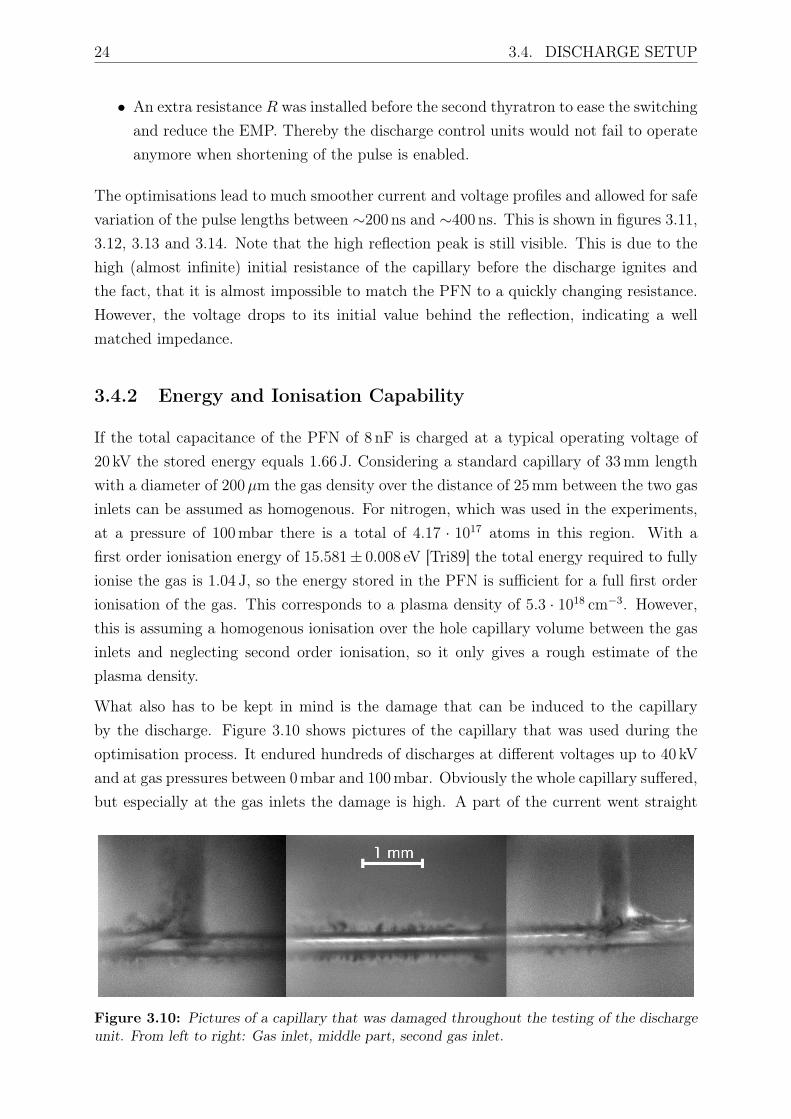
What also has to be kept in mind is the damage that can be induced to the capillaryby the discharge. Figure 3.10 shows pictures of the capillary that was used during theoptimisation process. It endured hundreds of discharges at different voltages up to 40 kVand at gas pressures between 0mbar and 100mbar. Obviously the whole capillary suffered,but especially at the gas inlets the damage is high. A part of the current went straight
Figure 3.10: Pictures of a capillary that was damaged throughout the testing of the dischargeunit. From left to right: Gas inlet, middle part, second gas inlet.
CHAPTER 3. EXPERIMENTAL SETUP 25
400ns
high initialresistance
properlymatched0V
10kV
20kV
0A
200A
400A
600A
0ns 100ns 500ns
Figure 3.11: Current (red, via 10 dB attenuator) and Voltage (yellow, x1000 probe) profilefor the optimised discharge setup without shortening of the pulse. Voltage measured after thethyratron 1.
properlymatched
~200ns
residualreflectionpeak
0V
10kV
20kV
0A
200A
400A
600A
0ns 100ns 500ns
Figure 3.12: Current (red, via 10 dB attenuator) and Voltage (yellow, x1000 probe) profilefor the optimised discharge setup with shortening of the pulse. Voltage measured after thethyratron 1.
26 3.4. DISCHARGE SETUP
properlymatched
0A
400ns
high initialresistance
0V
200A
400A
600A
10kV
30kV
0ns 100ns 500ns
Figure 3.13: Current (red, via 10 dB attenuator) and Voltage (yellow, x1000 probe) profilefor the optimised discharge setup without shortening of the pulse. Voltage measured before thethyratrons.
high initialresistance
properlymatched
~200ns
0V
10kV
30kV
0A
200A
400A
600A
0ns 100ns 500ns
Figure 3.14: Current (red, via 10 dB attenuator) and Voltage (yellow, x1000 probe) profilefor the optimised discharge setup with shortening of the pulse. Voltage measured before thethyratrons.
CHAPTER 3. EXPERIMENTAL SETUP 27
up the gas inlets and machined a structured corner from what once was a 90 degreeangle. This shows that, even though the capillary is made of sapphire, the energy thatcan be deposited inside it by the discharge unit is capable of inducing severe damage,which means that the discharge parameters have to be chosen carefully to support longcapillary lifetime. The energy deposited inside the capillary depends on the duration ofthe discharge and the energy stored in the PFN, which in turn depends on the squareof the voltage. Therefore, the discharge should be operated at the minimum voltage andpulse duration that support stable breakdowns and guiding conditions.

28 3.4. DISCHARGE SETUP
Chapter 4
Experiments and Results
In this chapter the experimental results regarding the laser-based discharge ignition andwave guiding with and without laser-based ignition are presented.
4.1 Laser-Based Discharge Ignition
First, results from theoretical calculations regarding the multi-photon ionisation of the gasby the laser are discussed before the experimental parameters and results are presented.
4.1.1 Ionization Probability and Ion Distribution
The laser-intensity distribution has to be calculated to estimate the initial ion distributionthe laser generates inside the capillary. Assuming a focussed Gaussian beam in time andspace as described in section 2.3.1, this is:
I(r, z, t) =ε0c
2|U(r, z, t)|2 = I0
w20
w2(z)e
−2r2
w2(z) e−2t2
τ2 (4.1)
where r is the radial distance from the beam centre, z is the longitudinal distance withz = 0 being at the focus point and t is the time with the pulse between t = −τ/2 andt = τ/2 (1/e2 duration). I0 is the peak intensity, w0 the beam radius at the waist and w(z)
is the beam radius at the distance z from the focus. Integrating the pulse in cylindricalcoordinates over r, φ and t leaves us with the total pulse energy:
Etot =(π
2
) 32I0w
20 τ. (4.2)
Rearranging equation 4.2 allows for calculation of the peak intensity:
I0 =(π
2
)− 32 Etot
w20 τ. (4.3)
30 4.1. LASER-BASED DISCHARGE IGNITION
The beam radius at the waist w0 can be approximated by [Sie86]:
w0 'fλ
D(4.4)
with f being the focal length of the lens used to focus the beam, λ the wavelength andD the beam diameter before focussing. With an initial beam diameter of 1 cm and afocal length of 500mm, the peak intensity equates to I0 = 1.87 · 1012 W
cm2 for the measuredmaximum pulse energy of the Surelite SL II-10 of 130mJ at 5 ns pulse duration. With thepoderomotive potential given by equation 2.22 and with an ionisation energy of 13.6 eVfor hydrogen this yields a Keldysh parameter (eq. 2.20) of γK ≈ 9.28, corresponding tothe multi-photon ionisation regime.
The ionisation rate for multi-photon processes involving N photons is [Mai91]:
RN = σNIN , (4.5)
where I is the laser intensity and σN is the generalised N -photon-ionisation cross-section.Accordingly, the ionisation probability for a flat-top pulse in space and time is given by
PN = σNINτ, (4.6)
where τ is the laser-pulse length. Assuming a Gaussian pulse in time and space theaverage ionisation probability at a position z along the beam axis is given by
〈PN(z)〉 =
σN2π∫0
∞∫0
∞∫−∞
IN(r, z, t) r dt dr dφ
πw2(z). (4.7)
This equates to
〈PN(z)〉 =
√π
8N3
(w0
w(z)
)2N
σNIN0 τ. (4.8)
Although the experiments in this thesis were carried out using nitrogen gas, the calcula-tions were made for hydrogen since the experiments will use hydrogen in the future andthe multi-photon ionisation cross-sections are well known. For an N -photon process theycan be estimated by [Bar85]:
σN = 6 · 109±0.5(5 · 10−14)N s−1 (W/cm2)−N . (4.9)
The cross-section for the six photon process of ionising hydrogen at a wavelength of 532 nmthen is
σ6 = 9.375 · 10−71 s−1 (W/cm2)−6. (4.10)
For the calculations of the ion distribution a homogenous atomic hydrogen number density
CHAPTER 4. EXPERIMENTS AND RESULTS 31
Ave
rage
Ion
Den
sity
[cm
-3]
1e+07
1e+08
1e+09
1e+10
1e+11
1e+12
1e+13
Position [mm]-8 -6 -4 -2 0 2 4 6 8
53.2µm focus 130mJ
90µm focus 80mJ
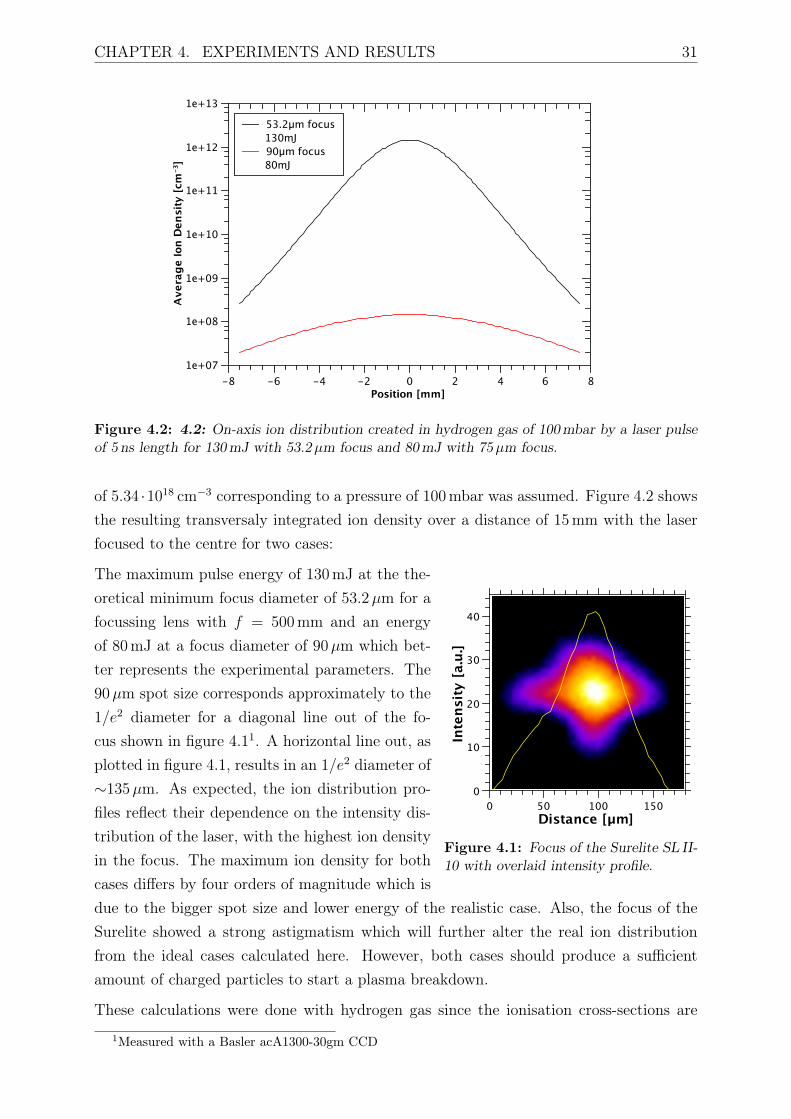
Figure 4.2: 4.2: On-axis ion distribution created in hydrogen gas of 100mbar by a laser pulseof 5 ns length for 130mJ with 53.2µm focus and 80mJ with 75µm focus.
of 5.34 ·1018 cm−3 corresponding to a pressure of 100mbar was assumed. Figure 4.2 showsthe resulting transversaly integrated ion density over a distance of 15mm with the laserfocused to the centre for two cases:
Inte
nsity
[a.u
.]
0
10
20
30
40
Distance [µm]0 50 100 150
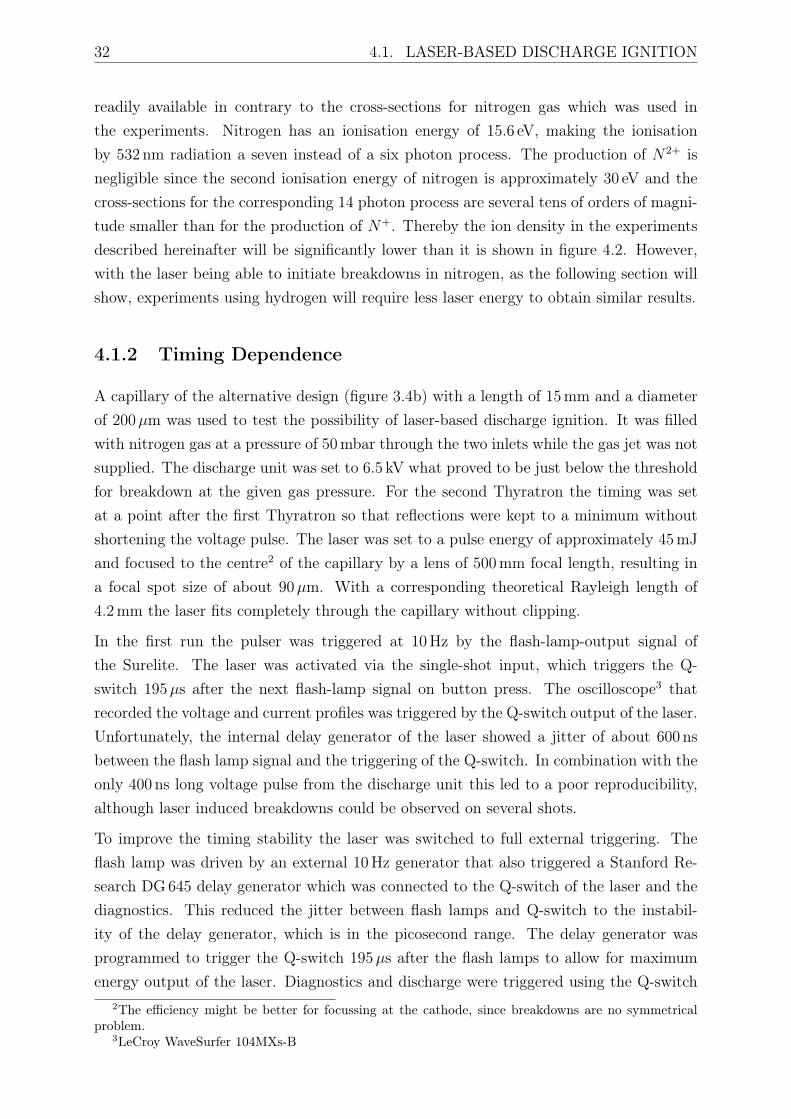
Figure 4.1: Focus of the Surelite SL II-10 with overlaid intensity profile.
The maximum pulse energy of 130mJ at the the-oretical minimum focus diameter of 53.2µm for afocussing lens with f = 500mm and an energyof 80mJ at a focus diameter of 90µm which bet-ter represents the experimental parameters. The90µm spot size corresponds approximately to the1/e2 diameter for a diagonal line out of the fo-cus shown in figure 4.11. A horizontal line out, asplotted in figure 4.1, results in an 1/e2 diameter of∼135µm. As expected, the ion distribution pro-files reflect their dependence on the intensity dis-tribution of the laser, with the highest ion densityin the focus. The maximum ion density for bothcases differs by four orders of magnitude which isdue to the bigger spot size and lower energy of the realistic case. Also, the focus of theSurelite showed a strong astigmatism which will further alter the real ion distributionfrom the ideal cases calculated here. However, both cases should produce a sufficientamount of charged particles to start a plasma breakdown.
These calculations were done with hydrogen gas since the ionisation cross-sections are
1Measured with a Basler acA1300-30gm CCD
32 4.1. LASER-BASED DISCHARGE IGNITION
readily available in contrary to the cross-sections for nitrogen gas which was used inthe experiments. Nitrogen has an ionisation energy of 15.6 eV, making the ionisationby 532 nm radiation a seven instead of a six photon process. The production of N2+ isnegligible since the second ionisation energy of nitrogen is approximately 30 eV and thecross-sections for the corresponding 14 photon process are several tens of orders of magni-tude smaller than for the production of N+. Thereby the ion density in the experimentsdescribed hereinafter will be significantly lower than it is shown in figure 4.2. However,with the laser being able to initiate breakdowns in nitrogen, as the following section willshow, experiments using hydrogen will require less laser energy to obtain similar results.
4.1.2 Timing Dependence
A capillary of the alternative design (figure 3.4b) with a length of 15mm and a diameterof 200µm was used to test the possibility of laser-based discharge ignition. It was filledwith nitrogen gas at a pressure of 50mbar through the two inlets while the gas jet was notsupplied. The discharge unit was set to 6.5 kV what proved to be just below the thresholdfor breakdown at the given gas pressure. For the second Thyratron the timing was setat a point after the first Thyratron so that reflections were kept to a minimum withoutshortening the voltage pulse. The laser was set to a pulse energy of approximately 45mJand focused to the centre2 of the capillary by a lens of 500mm focal length, resulting ina focal spot size of about 90µm. With a corresponding theoretical Rayleigh length of4.2mm the laser fits completely through the capillary without clipping.
In the first run the pulser was triggered at 10Hz by the flash-lamp-output signal ofthe Surelite. The laser was activated via the single-shot input, which triggers the Q-switch 195µs after the next flash-lamp signal on button press. The oscilloscope3 thatrecorded the voltage and current profiles was triggered by the Q-switch output of the laser.Unfortunately, the internal delay generator of the laser showed a jitter of about 600 nsbetween the flash lamp signal and the triggering of the Q-switch. In combination with theonly 400 ns long voltage pulse from the discharge unit this led to a poor reproducibility,although laser induced breakdowns could be observed on several shots.
To improve the timing stability the laser was switched to full external triggering. Theflash lamp was driven by an external 10Hz generator that also triggered a Stanford Re-search DG645 delay generator which was connected to the Q-switch of the laser and thediagnostics. This reduced the jitter between flash lamps and Q-switch to the instabil-ity of the delay generator, which is in the picosecond range. The delay generator wasprogrammed to trigger the Q-switch 195µs after the flash lamps to allow for maximumenergy output of the laser. Diagnostics and discharge were triggered using the Q-switch
2The efficiency might be better for focussing at the cathode, since breakdowns are no symmetricalproblem.
3LeCroy WaveSurfer 104MXs-B
CHAPTER 4. EXPERIMENTS AND RESULTS 33
Volta
ge [k
V]
-1
0
1
2
3
4
5
6
7
8Current [A
]
-10
0
10
20
30
40
50
60
70
80
Time [ns]0 200 400 600 800 1,000 1,200 1,400
VoltageCurrent
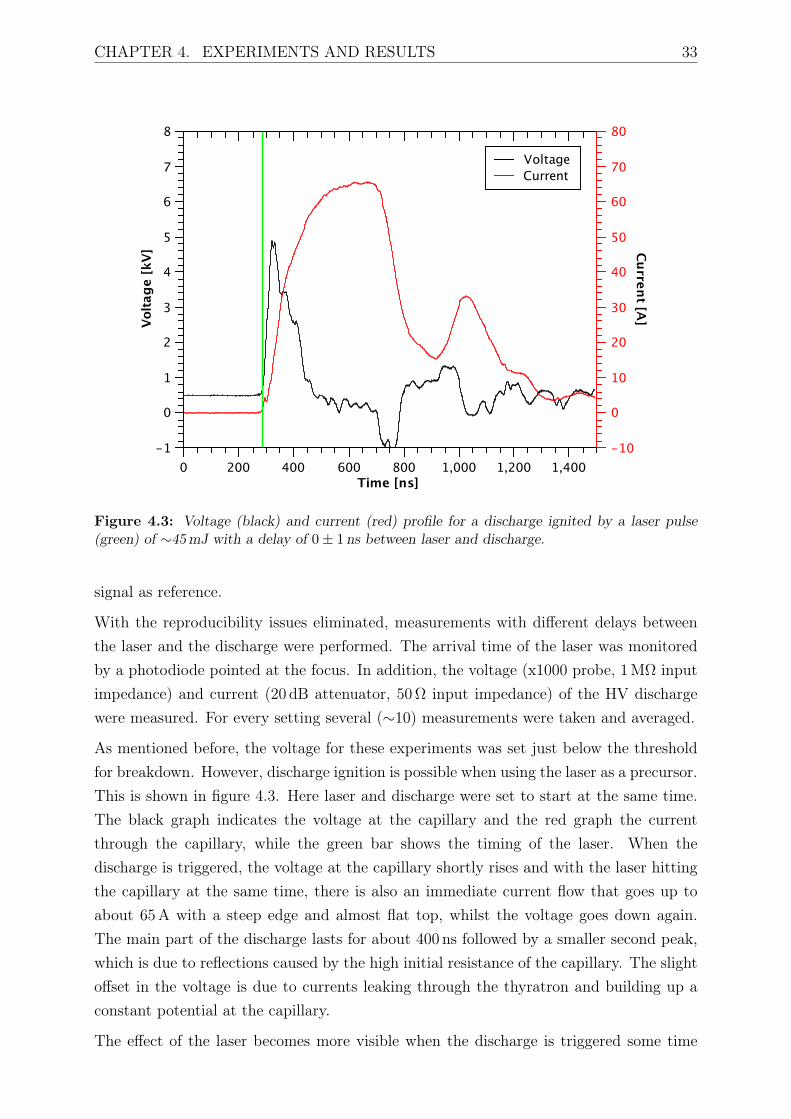
Figure 4.3: Voltage (black) and current (red) profile for a discharge ignited by a laser pulse(green) of ∼45mJ with a delay of 0± 1 ns between laser and discharge.
signal as reference.
With the reproducibility issues eliminated, measurements with different delays betweenthe laser and the discharge were performed. The arrival time of the laser was monitoredby a photodiode pointed at the focus. In addition, the voltage (x1000 probe, 1MΩ inputimpedance) and current (20 dB attenuator, 50Ω input impedance) of the HV dischargewere measured. For every setting several (∼10) measurements were taken and averaged.
As mentioned before, the voltage for these experiments was set just below the thresholdfor breakdown. However, discharge ignition is possible when using the laser as a precursor.This is shown in figure 4.3. Here laser and discharge were set to start at the same time.The black graph indicates the voltage at the capillary and the red graph the currentthrough the capillary, while the green bar shows the timing of the laser. When thedischarge is triggered, the voltage at the capillary shortly rises and with the laser hittingthe capillary at the same time, there is also an immediate current flow that goes up toabout 65A with a steep edge and almost flat top, whilst the voltage goes down again.The main part of the discharge lasts for about 400 ns followed by a smaller second peak,which is due to reflections caused by the high initial resistance of the capillary. The slightoffset in the voltage is due to currents leaking through the thyratron and building up aconstant potential at the capillary.
The effect of the laser becomes more visible when the discharge is triggered some time
34 4.1. LASER-BASED DISCHARGE IGNITION
Volta
ge [k
V]
-1
0
1
2
3
4
5
6
7
8Current [A
]
-10
0
10
20
30
40
50
60
70
80
Time [ns]-400 -200 0 200 400 600 800 1,000 1,200 1,400
VoltageCurrent
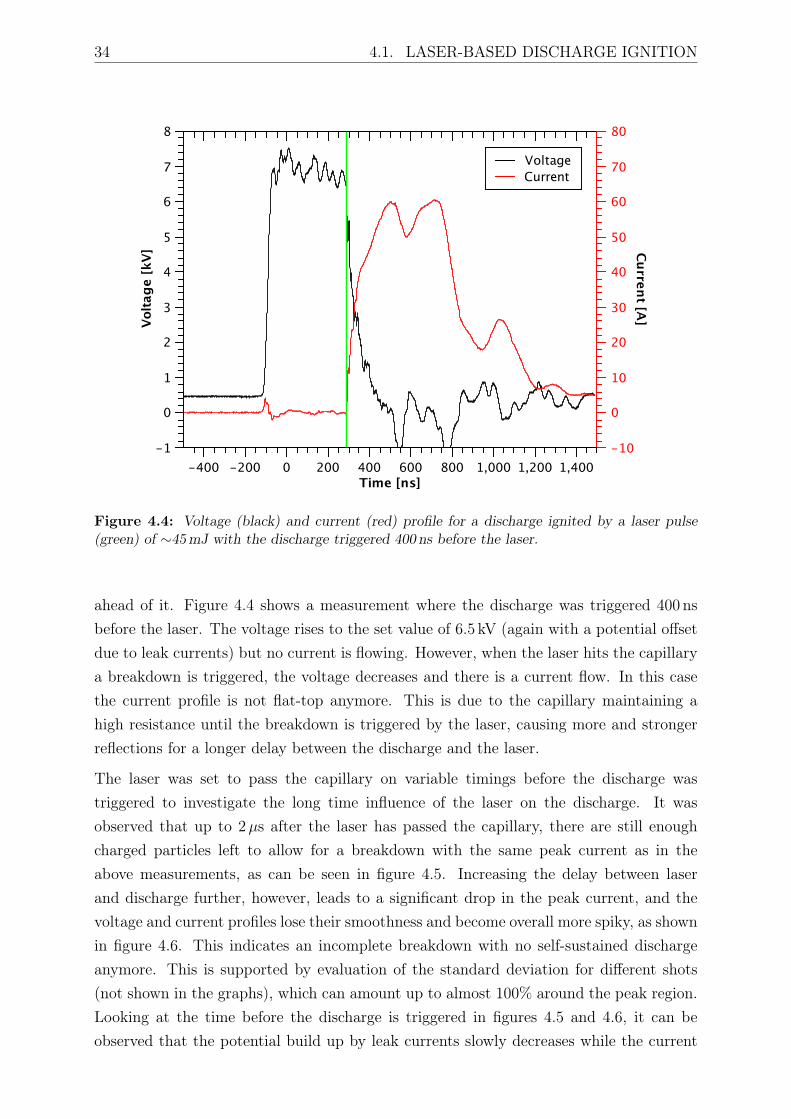
Figure 4.4: Voltage (black) and current (red) profile for a discharge ignited by a laser pulse(green) of ∼45mJ with the discharge triggered 400 ns before the laser.
ahead of it. Figure 4.4 shows a measurement where the discharge was triggered 400 nsbefore the laser. The voltage rises to the set value of 6.5 kV (again with a potential offsetdue to leak currents) but no current is flowing. However, when the laser hits the capillarya breakdown is triggered, the voltage decreases and there is a current flow. In this casethe current profile is not flat-top anymore. This is due to the capillary maintaining ahigh resistance until the breakdown is triggered by the laser, causing more and strongerreflections for a longer delay between the discharge and the laser.
The laser was set to pass the capillary on variable timings before the discharge wastriggered to investigate the long time influence of the laser on the discharge. It wasobserved that up to 2µs after the laser has passed the capillary, there are still enoughcharged particles left to allow for a breakdown with the same peak current as in theabove measurements, as can be seen in figure 4.5. Increasing the delay between laserand discharge further, however, leads to a significant drop in the peak current, and thevoltage and current profiles lose their smoothness and become overall more spiky, as shownin figure 4.6. This indicates an incomplete breakdown with no self-sustained dischargeanymore. This is supported by evaluation of the standard deviation for different shots(not shown in the graphs), which can amount up to almost 100% around the peak region.Looking at the time before the discharge is triggered in figures 4.5 and 4.6, it can beobserved that the potential build up by leak currents slowly decreases while the current
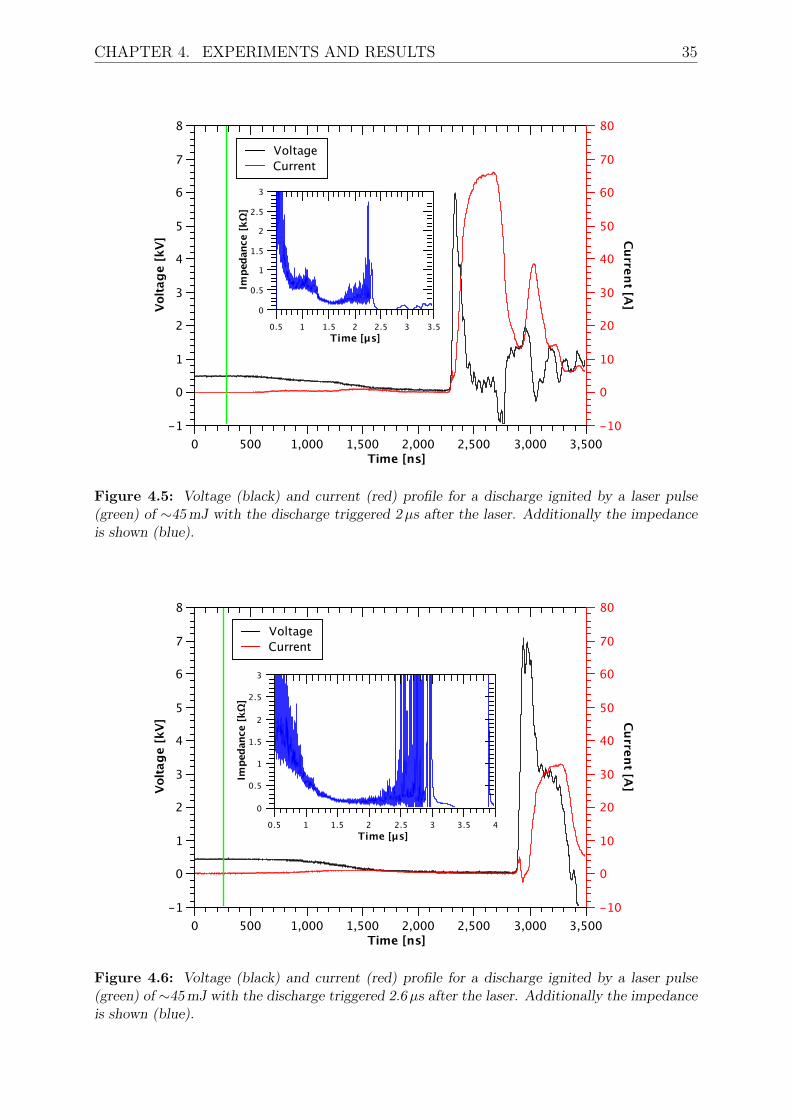
CHAPTER 4. EXPERIMENTS AND RESULTS 35
Volta
ge [k
V]
-1
0
1
2
3
4
5
6
7
8
Current [A]
-10
0
10
20
30
40
50
60
70
80
Time [ns]0 500 1,000 1,500 2,000 2,500 3,000 3,500
VoltageCurrent
Impe
danc
e [kΩ
]
0
0.5
1
1.5
2
2.5
3
Time [µs]0.5 1 1.5 2 2.5 3 3.5
Figure 4.5: Voltage (black) and current (red) profile for a discharge ignited by a laser pulse(green) of ∼45mJ with the discharge triggered 2µs after the laser. Additionally the impedanceis shown (blue).
Volta
ge [k
V]
-1
0
1
2
3
4
5
6
7
8
Current [A]
-10
0
10
20
30
40
50
60
70
80
Time [ns]0 500 1,000 1,500 2,000 2,500 3,000 3,500
VoltageCurrent
Impe
danc
e [kΩ
]
0
0.5
1
1.5
2
2.5
3
Time [µs]0.5 1 1.5 2 2.5 3 3.5 4
Figure 4.6: Voltage (black) and current (red) profile for a discharge ignited by a laser pulse(green) of ∼45mJ with the discharge triggered 2.6µs after the laser. Additionally the impedanceis shown (blue).
36 4.1. LASER-BASED DISCHARGE IGNITION
slightly increases after the laser arrived at the capillary. The small current flow maintainsa small channel of ions, allowing for a breakdown up to 2µs after the arrival of the laserpulse. This is much longer than the intrinsic recombination time of the electrons, which isestimated to be on the order of nanoseconds from the results of [Dou73]. After a timespanof ∼2µs the potential built up by the leak currents decreases almost to zero. With the leakcurrents not being able to maintain a potential that can sustain the small plasma channelthe resistance increases, impeding the breakdown and leading to low reproducibility.
4.1.3 Laser Energy Dependence
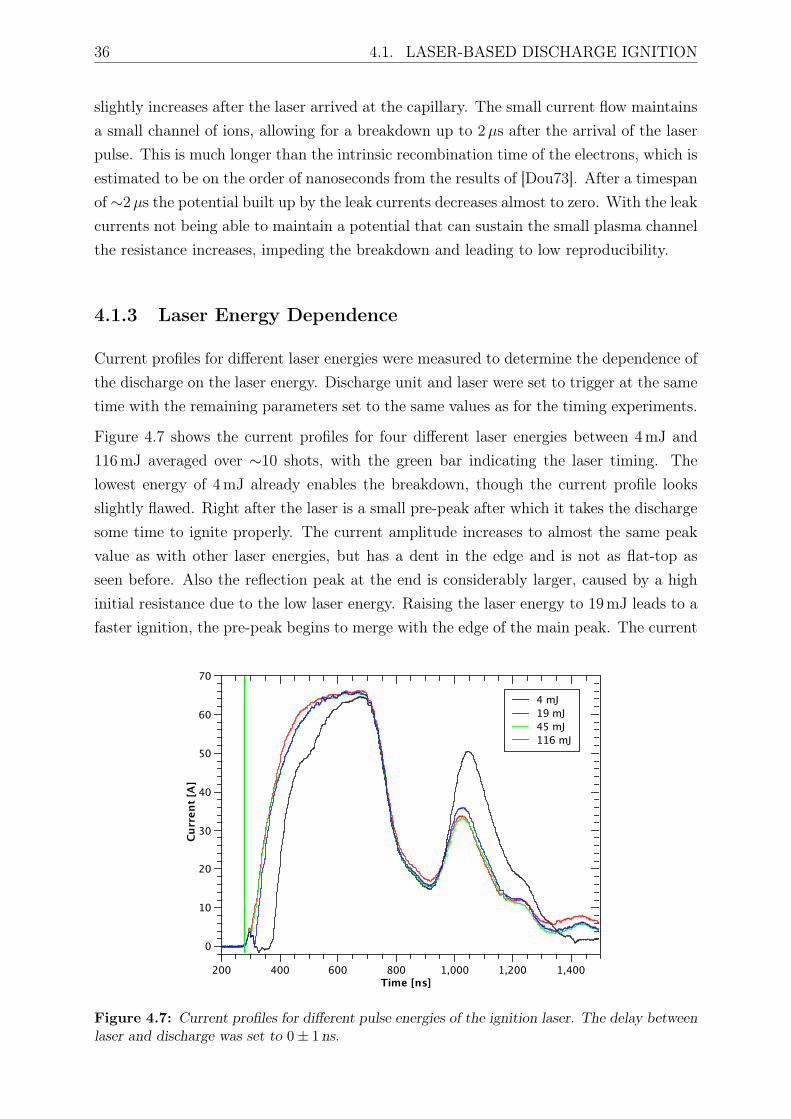
Current profiles for different laser energies were measured to determine the dependence ofthe discharge on the laser energy. Discharge unit and laser were set to trigger at the sametime with the remaining parameters set to the same values as for the timing experiments.
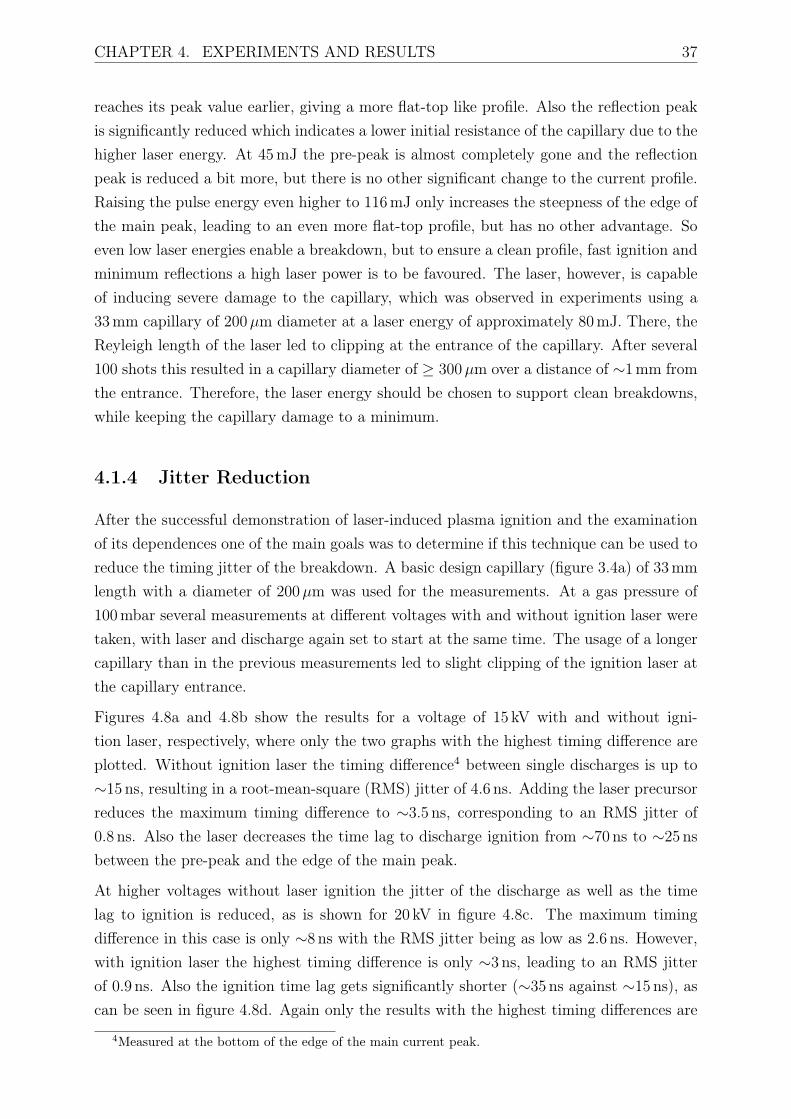
Figure 4.7 shows the current profiles for four different laser energies between 4mJ and116mJ averaged over ∼10 shots, with the green bar indicating the laser timing. Thelowest energy of 4mJ already enables the breakdown, though the current profile looksslightly flawed. Right after the laser is a small pre-peak after which it takes the dischargesome time to ignite properly. The current amplitude increases to almost the same peakvalue as with other laser energies, but has a dent in the edge and is not as flat-top asseen before. Also the reflection peak at the end is considerably larger, caused by a highinitial resistance due to the low laser energy. Raising the laser energy to 19mJ leads to afaster ignition, the pre-peak begins to merge with the edge of the main peak. The current
Curr
ent [
A]
0
10
20
30
40
50
60
70
Time [ns]200 400 600 800 1,000 1,200 1,400
4 mJ19 mJ45 mJ116 mJ
Figure 4.7: Current profiles for different pulse energies of the ignition laser. The delay betweenlaser and discharge was set to 0± 1 ns.
CHAPTER 4. EXPERIMENTS AND RESULTS 37
reaches its peak value earlier, giving a more flat-top like profile. Also the reflection peakis significantly reduced which indicates a lower initial resistance of the capillary due to thehigher laser energy. At 45mJ the pre-peak is almost completely gone and the reflectionpeak is reduced a bit more, but there is no other significant change to the current profile.Raising the pulse energy even higher to 116mJ only increases the steepness of the edge ofthe main peak, leading to an even more flat-top profile, but has no other advantage. Soeven low laser energies enable a breakdown, but to ensure a clean profile, fast ignition andminimum reflections a high laser power is to be favoured. The laser, however, is capableof inducing severe damage to the capillary, which was observed in experiments using a33mm capillary of 200µm diameter at a laser energy of approximately 80mJ. There, theReyleigh length of the laser led to clipping at the entrance of the capillary. After several100 shots this resulted in a capillary diameter of ≥ 300µm over a distance of ∼1mm fromthe entrance. Therefore, the laser energy should be chosen to support clean breakdowns,while keeping the capillary damage to a minimum.
4.1.4 Jitter Reduction
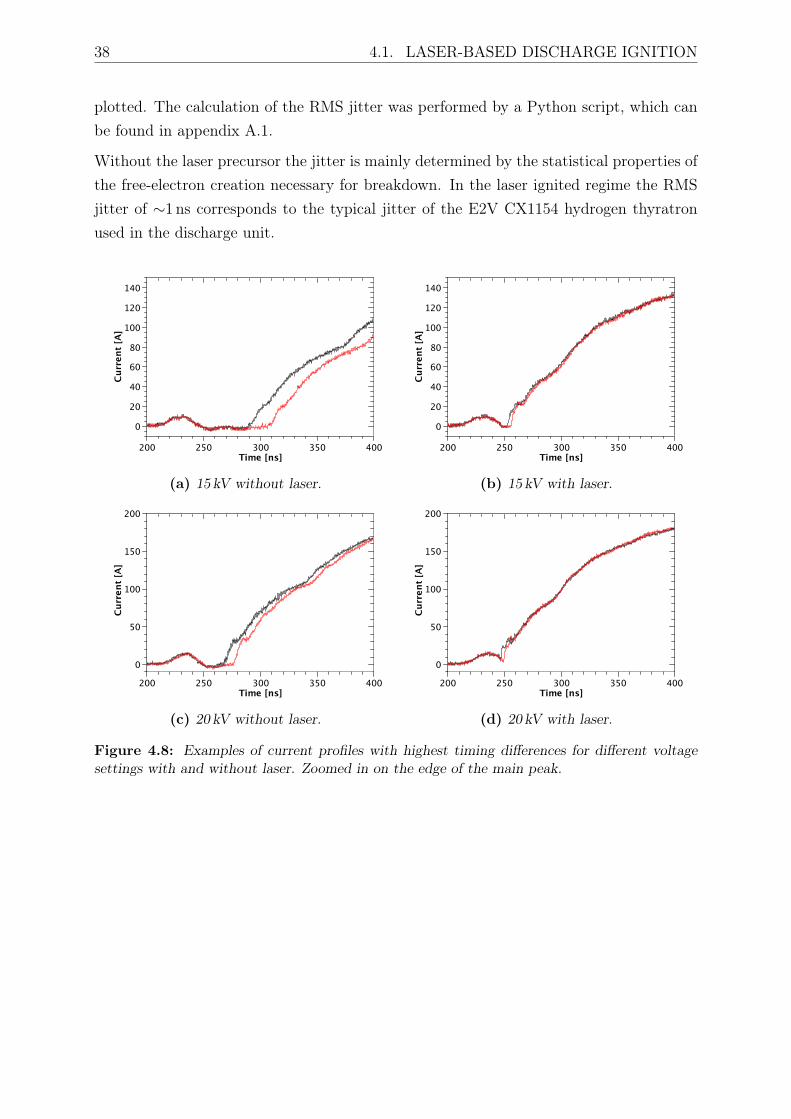
After the successful demonstration of laser-induced plasma ignition and the examinationof its dependences one of the main goals was to determine if this technique can be used toreduce the timing jitter of the breakdown. A basic design capillary (figure 3.4a) of 33mmlength with a diameter of 200µm was used for the measurements. At a gas pressure of100mbar several measurements at different voltages with and without ignition laser weretaken, with laser and discharge again set to start at the same time. The usage of a longercapillary than in the previous measurements led to slight clipping of the ignition laser atthe capillary entrance.
Figures 4.8a and 4.8b show the results for a voltage of 15 kV with and without igni-tion laser, respectively, where only the two graphs with the highest timing difference areplotted. Without ignition laser the timing difference4 between single discharges is up to∼15 ns, resulting in a root-mean-square (RMS) jitter of 4.6 ns. Adding the laser precursorreduces the maximum timing difference to ∼3.5 ns, corresponding to an RMS jitter of0.8 ns. Also the laser decreases the time lag to discharge ignition from ∼70 ns to ∼25 nsbetween the pre-peak and the edge of the main peak.
At higher voltages without laser ignition the jitter of the discharge as well as the timelag to ignition is reduced, as is shown for 20 kV in figure 4.8c. The maximum timingdifference in this case is only ∼8 ns with the RMS jitter being as low as 2.6 ns. However,with ignition laser the highest timing difference is only ∼3 ns, leading to an RMS jitterof 0.9 ns. Also the ignition time lag gets significantly shorter (∼35 ns against ∼15 ns), ascan be seen in figure 4.8d. Again only the results with the highest timing differences are
4Measured at the bottom of the edge of the main current peak.
38 4.1. LASER-BASED DISCHARGE IGNITION
plotted. The calculation of the RMS jitter was performed by a Python script, which canbe found in appendix A.1.
Without the laser precursor the jitter is mainly determined by the statistical properties ofthe free-electron creation necessary for breakdown. In the laser ignited regime the RMSjitter of ∼1 ns corresponds to the typical jitter of the E2V CX1154 hydrogen thyratronused in the discharge unit.
Curr
ent [
A]
0
20
40
60
80
100
120
140
Time [ns]200 250 300 350 400
(a) 15 kV without laser.
Curr
ent [
A]0
20
40
60
80
100
120
140
Time [ns]200 250 300 350 400
(b) 15 kV with laser.
Curr
ent [
A]
0
50
100
150
200
Time [ns]200 250 300 350 400
(c) 20 kV without laser.
Curr
ent [
A]
0
50
100
150
200
Time [ns]200 250 300 350 400
(d) 20 kV with laser.
Figure 4.8: Examples of current profiles with highest timing differences for different voltagesettings with and without laser. Zoomed in on the edge of the main peak.
CHAPTER 4. EXPERIMENTS AND RESULTS 39
4.2 Discharge Wave Guiding
In the previous sections it was successfully shown that a laser precursor can help to ignitethe plasma at low voltages, improves the time lag to ignition and reduces the timing jitter.In this section the investigations on the influence of laser ignition on wave guiding aredescribed and their results are presented. Also a new method that allows single-dischargemeasurements of time-dependent guiding profiles is described.
4.2.1 Single-Shot Guiding Measurements
Inte
nsity
[a.u
.]
0
10
20
30
40
50
60
Distance [µm]20 40 60 80 100 120
Figure 4.9: Focus of the fs-oscillator.
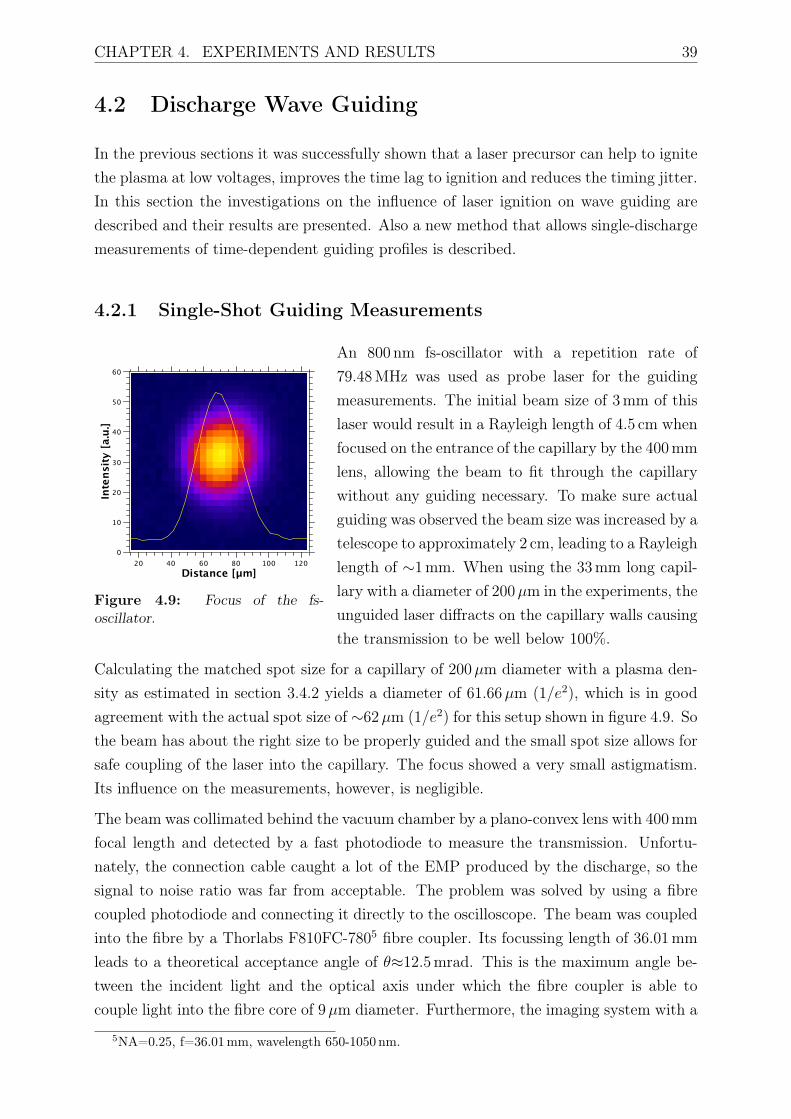
An 800 nm fs-oscillator with a repetition rate of79.48MHz was used as probe laser for the guidingmeasurements. The initial beam size of 3mm of thislaser would result in a Rayleigh length of 4.5 cm whenfocused on the entrance of the capillary by the 400mmlens, allowing the beam to fit through the capillarywithout any guiding necessary. To make sure actualguiding was observed the beam size was increased by atelescope to approximately 2 cm, leading to a Rayleighlength of ∼1mm. When using the 33mm long capil-lary with a diameter of 200µm in the experiments, theunguided laser diffracts on the capillary walls causingthe transmission to be well below 100%.
Calculating the matched spot size for a capillary of 200µm diameter with a plasma den-sity as estimated in section 3.4.2 yields a diameter of 61.66µm (1/e2), which is in goodagreement with the actual spot size of ∼62µm (1/e2) for this setup shown in figure 4.9. Sothe beam has about the right size to be properly guided and the small spot size allows forsafe coupling of the laser into the capillary. The focus showed a very small astigmatism.Its influence on the measurements, however, is negligible.
The beam was collimated behind the vacuum chamber by a plano-convex lens with 400mmfocal length and detected by a fast photodiode to measure the transmission. Unfortu-nately, the connection cable caught a lot of the EMP produced by the discharge, so thesignal to noise ratio was far from acceptable. The problem was solved by using a fibrecoupled photodiode and connecting it directly to the oscilloscope. The beam was coupledinto the fibre by a Thorlabs F810FC-7805 fibre coupler. Its focussing length of 36.01mmleads to a theoretical acceptance angle of θ≈12.5mrad. This is the maximum angle be-tween the incident light and the optical axis under which the fibre coupler is able tocouple light into the fibre core of 9µm diameter. Furthermore, the imaging system with a
5NA=0.25, f=36.01mm, wavelength 650-1050 nm.
40 4.2. DISCHARGE WAVE GUIDING
propagation distance of approximately 89.5 cm between the collimating lens and the fibrecoupler accepts a maximum deviation of δ ≈ 1.5mm of the exiting-beam waist from thefocus of the collimating lens6 (confer figure 4.10). For deviations δ >1.5mm the beamwill clip at the fibre entrance, resulting in less light transmitted to the photodiode. Thisis likely to cause measurement errors when the beam exits the capillary with changingdivergence during the experiments.
fibrecore
lens
f
δθ
Figure 4.10: Sketch of theacceptance angle θ and thewaist-position deviation δ.
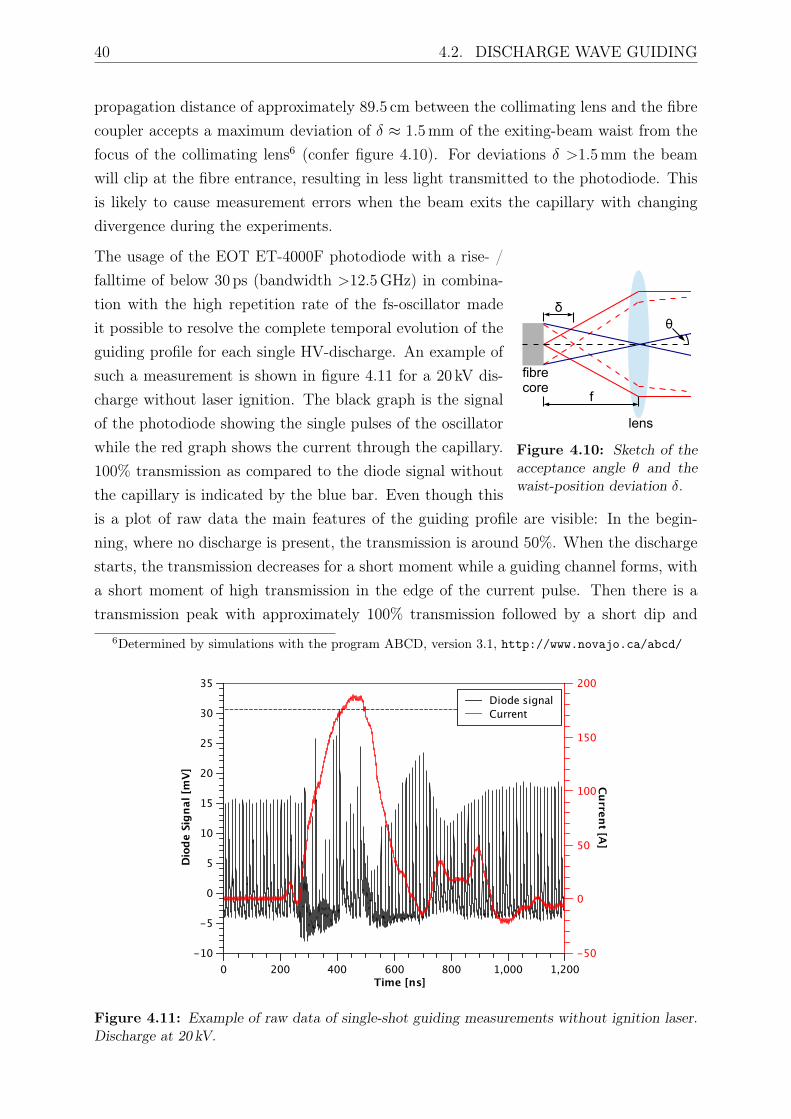
The usage of the EOT ET-4000F photodiode with a rise- /falltime of below 30 ps (bandwidth >12.5GHz) in combina-tion with the high repetition rate of the fs-oscillator madeit possible to resolve the complete temporal evolution of theguiding profile for each single HV-discharge. An example ofsuch a measurement is shown in figure 4.11 for a 20 kV dis-charge without laser ignition. The black graph is the signalof the photodiode showing the single pulses of the oscillatorwhile the red graph shows the current through the capillary.100% transmission as compared to the diode signal withoutthe capillary is indicated by the blue bar. Even though thisis a plot of raw data the main features of the guiding profile are visible: In the begin-ning, where no discharge is present, the transmission is around 50%. When the dischargestarts, the transmission decreases for a short moment while a guiding channel forms, witha short moment of high transmission in the edge of the current pulse. Then there is atransmission peak with approximately 100% transmission followed by a short dip and
6Determined by simulations with the program ABCD, version 3.1, http://www.novajo.ca/abcd/
Dio
de S
igna
l [m
V]
-10
-5
0
5
10
15
20
25
30
35
Current [A]
-50
0
50
100
150
200
Time [ns]0 200 400 600 800 1,000 1,200
Diode signalCurrent
Figure 4.11: Example of raw data of single-shot guiding measurements without ignition laser.Discharge at 20 kV.
CHAPTER 4. EXPERIMENTS AND RESULTS 41
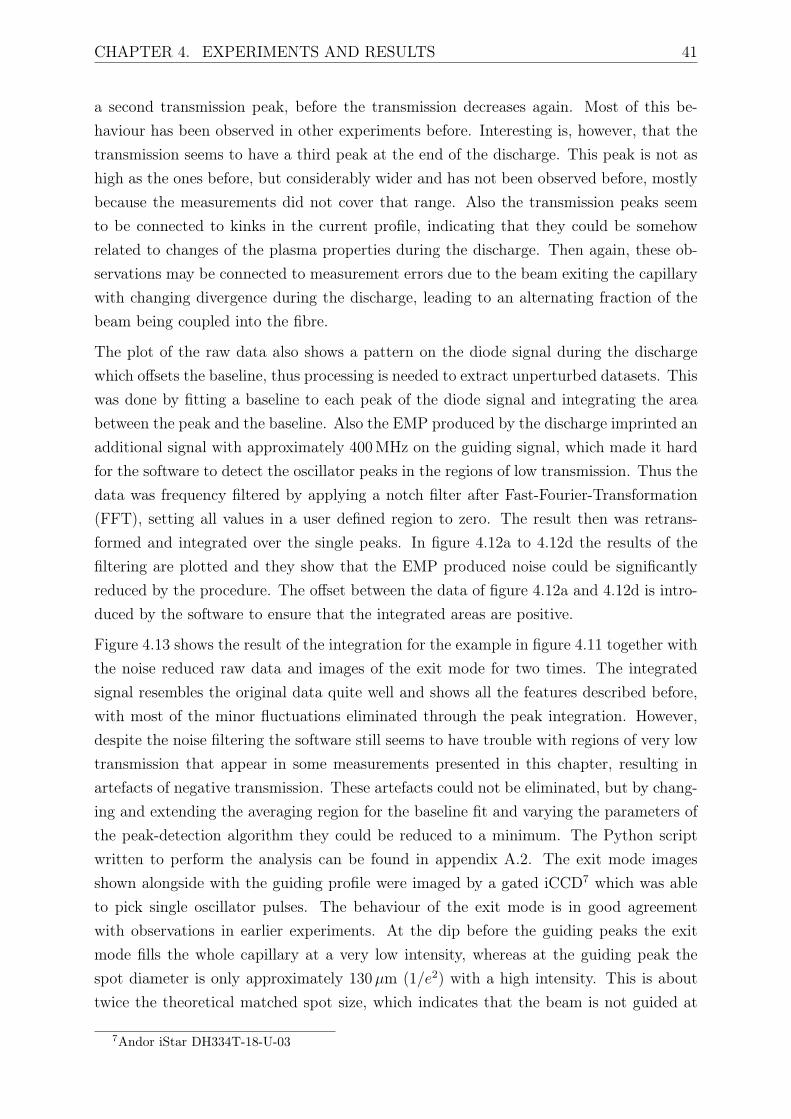
a second transmission peak, before the transmission decreases again. Most of this be-haviour has been observed in other experiments before. Interesting is, however, that thetransmission seems to have a third peak at the end of the discharge. This peak is not ashigh as the ones before, but considerably wider and has not been observed before, mostlybecause the measurements did not cover that range. Also the transmission peaks seemto be connected to kinks in the current profile, indicating that they could be somehowrelated to changes of the plasma properties during the discharge. Then again, these ob-servations may be connected to measurement errors due to the beam exiting the capillarywith changing divergence during the discharge, leading to an alternating fraction of thebeam being coupled into the fibre.
The plot of the raw data also shows a pattern on the diode signal during the dischargewhich offsets the baseline, thus processing is needed to extract unperturbed datasets. Thiswas done by fitting a baseline to each peak of the diode signal and integrating the areabetween the peak and the baseline. Also the EMP produced by the discharge imprinted anadditional signal with approximately 400MHz on the guiding signal, which made it hardfor the software to detect the oscillator peaks in the regions of low transmission. Thus thedata was frequency filtered by applying a notch filter after Fast-Fourier-Transformation(FFT), setting all values in a user defined region to zero. The result then was retrans-formed and integrated over the single peaks. In figure 4.12a to 4.12d the results of thefiltering are plotted and they show that the EMP produced noise could be significantlyreduced by the procedure. The offset between the data of figure 4.12a and 4.12d is intro-duced by the software to ensure that the integrated areas are positive.
Figure 4.13 shows the result of the integration for the example in figure 4.11 together withthe noise reduced raw data and images of the exit mode for two times. The integratedsignal resembles the original data quite well and shows all the features described before,with most of the minor fluctuations eliminated through the peak integration. However,despite the noise filtering the software still seems to have trouble with regions of very lowtransmission that appear in some measurements presented in this chapter, resulting inartefacts of negative transmission. These artefacts could not be eliminated, but by chang-ing and extending the averaging region for the baseline fit and varying the parameters ofthe peak-detection algorithm they could be reduced to a minimum. The Python scriptwritten to perform the analysis can be found in appendix A.2. The exit mode imagesshown alongside with the guiding profile were imaged by a gated iCCD7 which was ableto pick single oscillator pulses. The behaviour of the exit mode is in good agreementwith observations in earlier experiments. At the dip before the guiding peaks the exitmode fills the whole capillary at a very low intensity, whereas at the guiding peak thespot diameter is only approximately 130µm (1/e2) with a high intensity. This is abouttwice the theoretical matched spot size, which indicates that the beam is not guided at
7Andor iStar DH334T-18-U-03
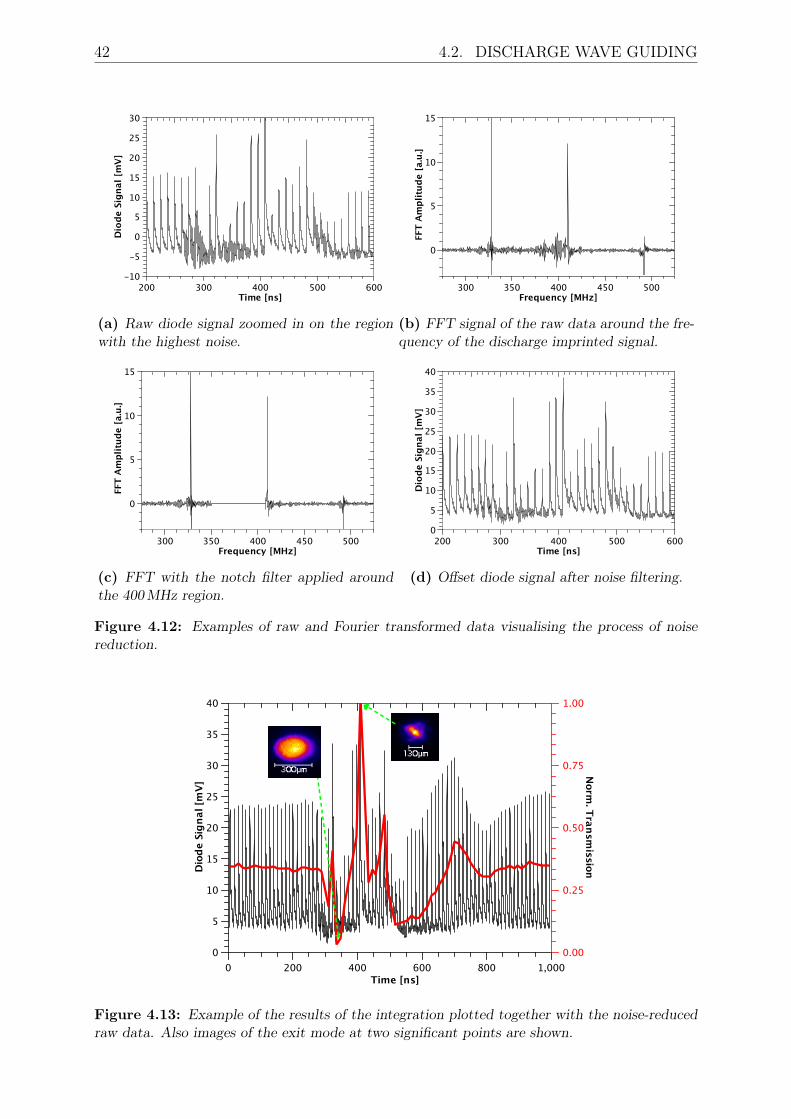
42 4.2. DISCHARGE WAVE GUIDING
D
iode
Sig
nal [
mV]
-10
-5
0
5
10
15
20
25
30
Time [ns]200 300 400 500 600
(a) Raw diode signal zoomed in on the regionwith the highest noise.
FFT
Ampl
itude
[a.u
.]
0
5
10
15
Frequency [MHz]300 350 400 450 500
(b) FFT signal of the raw data around the fre-quency of the discharge imprinted signal.
FFT
Ampl
itude
[a.u
.]
0
5
10
15
Frequency [MHz]300 350 400 450 500
(c) FFT with the notch filter applied aroundthe 400MHz region.
Dio
de S
igna
l [m
V]
0
5
10
15
20
25
30
35
40
Time [ns]200 300 400 500 600
(d) Offset diode signal after noise filtering.
Figure 4.12: Examples of raw and Fourier transformed data visualising the process of noisereduction.
Dio
de S
igna
l [m
V]
0
5
10
15
20
25
30
35
40
Norm
. Transmission
0.00
0.25
0.50
0.75
1.00
Time [ns]0 200 400 600 800 1,000
Figure 4.13: Example of the results of the integration plotted together with the noise-reducedraw data. Also images of the exit mode at two significant points are shown.
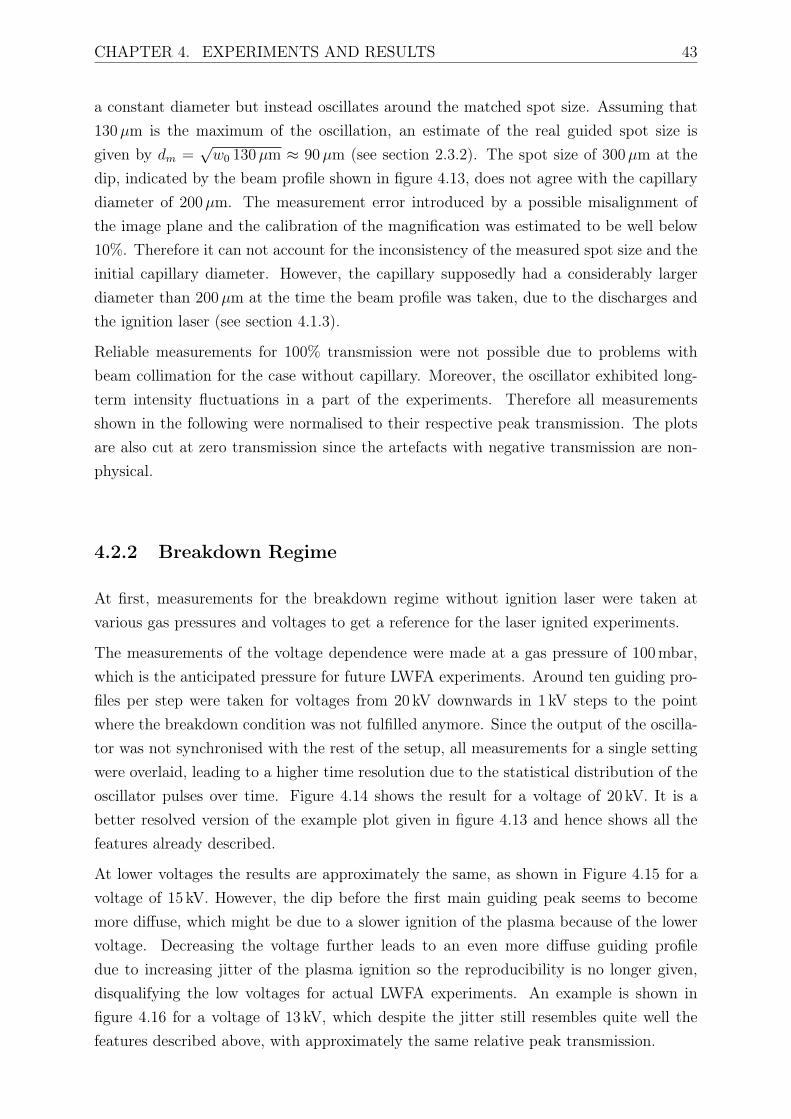
CHAPTER 4. EXPERIMENTS AND RESULTS 43
a constant diameter but instead oscillates around the matched spot size. Assuming that130µm is the maximum of the oscillation, an estimate of the real guided spot size isgiven by dm =
√w0 130µm ≈ 90µm (see section 2.3.2). The spot size of 300µm at the
dip, indicated by the beam profile shown in figure 4.13, does not agree with the capillarydiameter of 200µm. The measurement error introduced by a possible misalignment ofthe image plane and the calibration of the magnification was estimated to be well below10%. Therefore it can not account for the inconsistency of the measured spot size and theinitial capillary diameter. However, the capillary supposedly had a considerably largerdiameter than 200µm at the time the beam profile was taken, due to the discharges andthe ignition laser (see section 4.1.3).
Reliable measurements for 100% transmission were not possible due to problems withbeam collimation for the case without capillary. Moreover, the oscillator exhibited long-term intensity fluctuations in a part of the experiments. Therefore all measurementsshown in the following were normalised to their respective peak transmission. The plotsare also cut at zero transmission since the artefacts with negative transmission are non-physical.
4.2.2 Breakdown Regime
At first, measurements for the breakdown regime without ignition laser were taken atvarious gas pressures and voltages to get a reference for the laser ignited experiments.
The measurements of the voltage dependence were made at a gas pressure of 100mbar,which is the anticipated pressure for future LWFA experiments. Around ten guiding pro-files per step were taken for voltages from 20 kV downwards in 1 kV steps to the pointwhere the breakdown condition was not fulfilled anymore. Since the output of the oscilla-tor was not synchronised with the rest of the setup, all measurements for a single settingwere overlaid, leading to a higher time resolution due to the statistical distribution of theoscillator pulses over time. Figure 4.14 shows the result for a voltage of 20 kV. It is abetter resolved version of the example plot given in figure 4.13 and hence shows all thefeatures already described.
At lower voltages the results are approximately the same, as shown in Figure 4.15 for avoltage of 15 kV. However, the dip before the first main guiding peak seems to becomemore diffuse, which might be due to a slower ignition of the plasma because of the lowervoltage. Decreasing the voltage further leads to an even more diffuse guiding profiledue to increasing jitter of the plasma ignition so the reproducibility is no longer given,disqualifying the low voltages for actual LWFA experiments. An example is shown infigure 4.16 for a voltage of 13 kV, which despite the jitter still resembles quite well thefeatures described above, with approximately the same relative peak transmission.
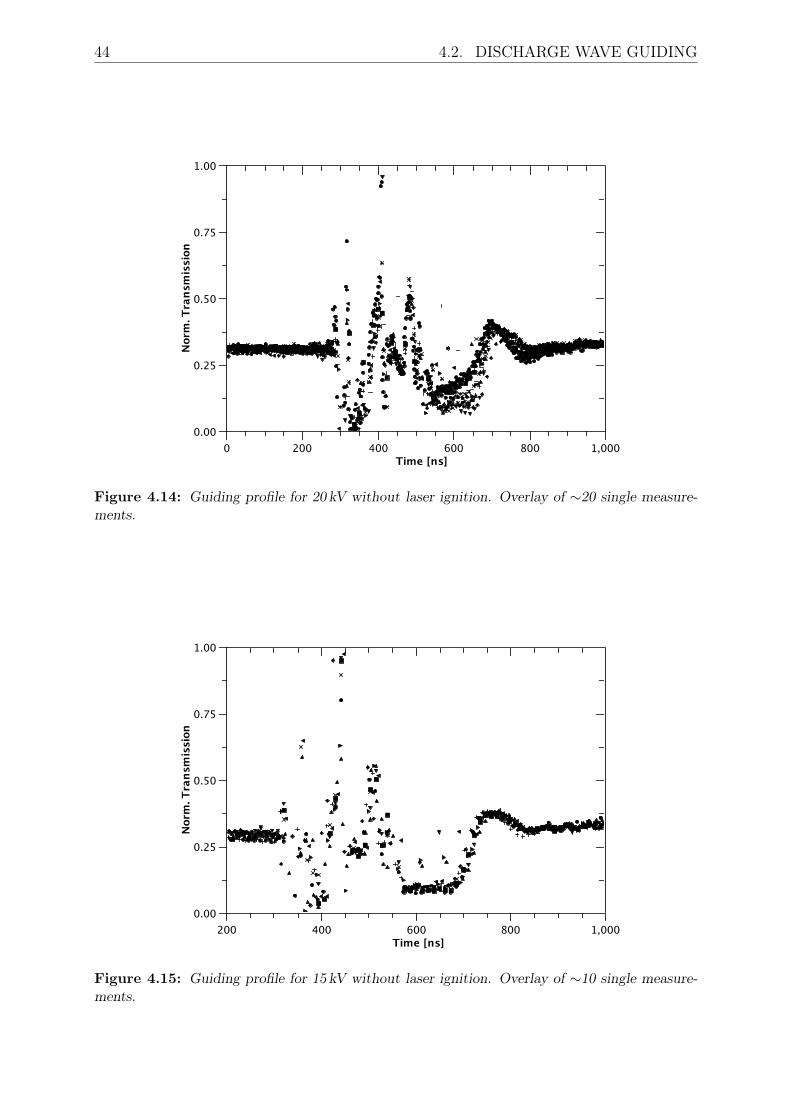
44 4.2. DISCHARGE WAVE GUIDING
Nor
m. T
rans
mis
sion
0.00
0.25
0.50
0.75
1.00
Time [ns]0 200 400 600 800 1,000
Figure 4.14: Guiding profile for 20 kV without laser ignition. Overlay of ∼20 single measure-ments.
Nor
m. T
rans
mis
sion
0.00
0.25
0.50
0.75
1.00
Time [ns]200 400 600 800 1,000
Figure 4.15: Guiding profile for 15 kV without laser ignition. Overlay of ∼10 single measure-ments.
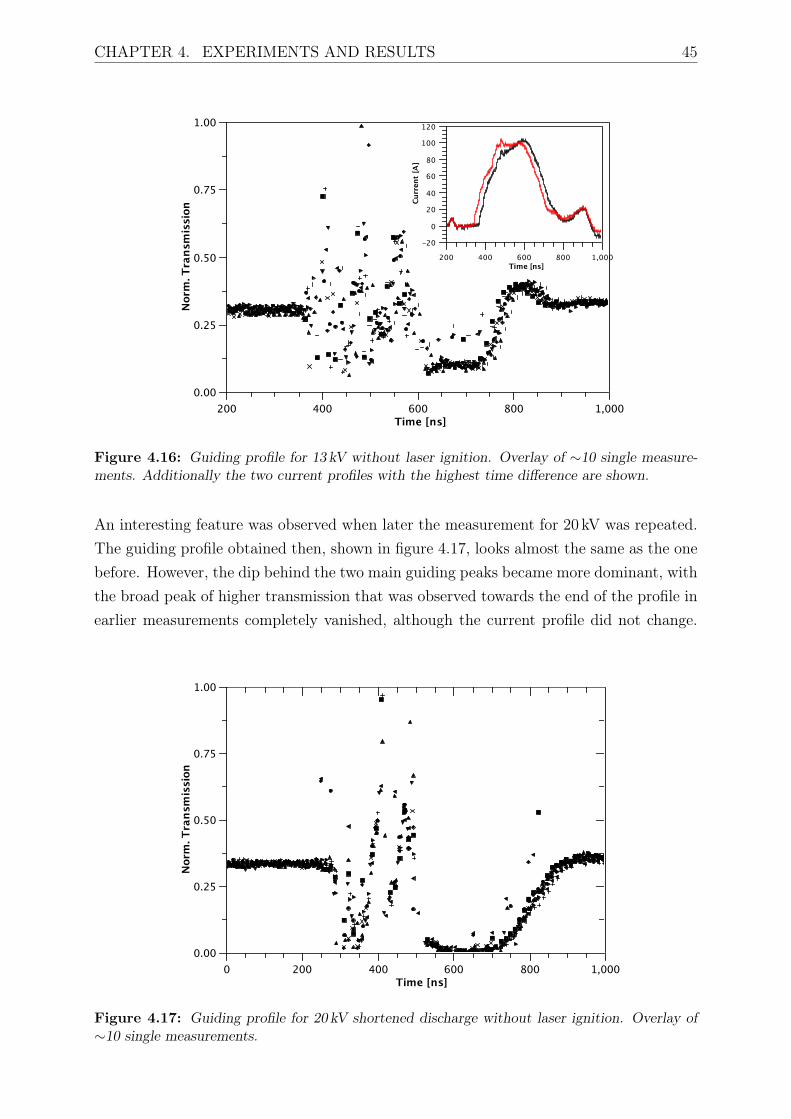
CHAPTER 4. EXPERIMENTS AND RESULTS 45
Nor
m. T
rans
mis
sion
0.00
0.25
0.50
0.75
1.00
Time [ns]200 400 600 800 1,000
Curr
ent
[A]
-20
0
20
40
60
80
100
120
Time [ns]200 400 600 800 1,000
Figure 4.16: Guiding profile for 13 kV without laser ignition. Overlay of ∼10 single measure-ments. Additionally the two current profiles with the highest time difference are shown.
An interesting feature was observed when later the measurement for 20 kV was repeated.The guiding profile obtained then, shown in figure 4.17, looks almost the same as the onebefore. However, the dip behind the two main guiding peaks became more dominant, withthe broad peak of higher transmission that was observed towards the end of the profile inearlier measurements completely vanished, although the current profile did not change.
Nor
m. T
rans
mis
sion
0.00
0.25
0.50
0.75
1.00
Time [ns]0 200 400 600 800 1,000
Figure 4.17: Guiding profile for 20 kV shortened discharge without laser ignition. Overlay of∼10 single measurements.
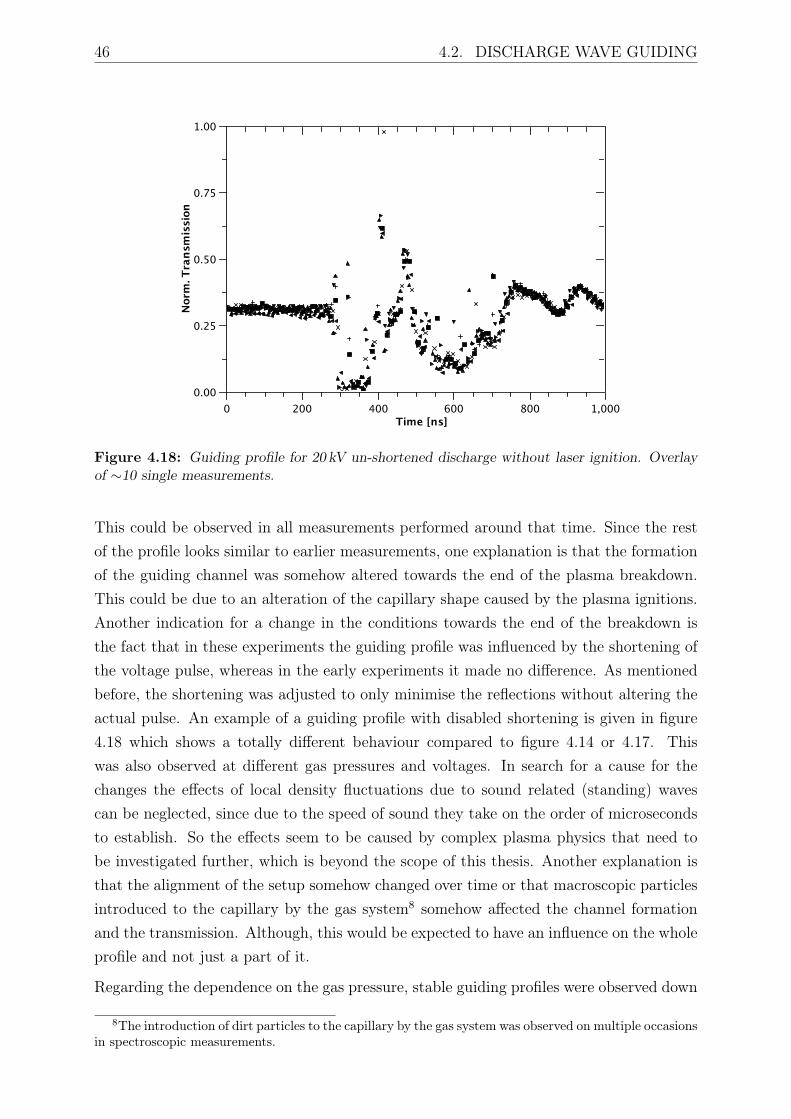
46 4.2. DISCHARGE WAVE GUIDING
Nor
m. T
rans
mis
sion
0.00
0.25
0.50
0.75
1.00
Time [ns]0 200 400 600 800 1,000
Figure 4.18: Guiding profile for 20 kV un-shortened discharge without laser ignition. Overlayof ∼10 single measurements.
This could be observed in all measurements performed around that time. Since the restof the profile looks similar to earlier measurements, one explanation is that the formationof the guiding channel was somehow altered towards the end of the plasma breakdown.This could be due to an alteration of the capillary shape caused by the plasma ignitions.Another indication for a change in the conditions towards the end of the breakdown isthe fact that in these experiments the guiding profile was influenced by the shortening ofthe voltage pulse, whereas in the early experiments it made no difference. As mentionedbefore, the shortening was adjusted to only minimise the reflections without altering theactual pulse. An example of a guiding profile with disabled shortening is given in figure4.18 which shows a totally different behaviour compared to figure 4.14 or 4.17. Thiswas also observed at different gas pressures and voltages. In search for a cause for thechanges the effects of local density fluctuations due to sound related (standing) wavescan be neglected, since due to the speed of sound they take on the order of microsecondsto establish. So the effects seem to be caused by complex plasma physics that need tobe investigated further, which is beyond the scope of this thesis. Another explanation isthat the alignment of the setup somehow changed over time or that macroscopic particlesintroduced to the capillary by the gas system8 somehow affected the channel formationand the transmission. Although, this would be expected to have an influence on the wholeprofile and not just a part of it.
Regarding the dependence on the gas pressure, stable guiding profiles were observed down
8The introduction of dirt particles to the capillary by the gas system was observed on multiple occasionsin spectroscopic measurements.
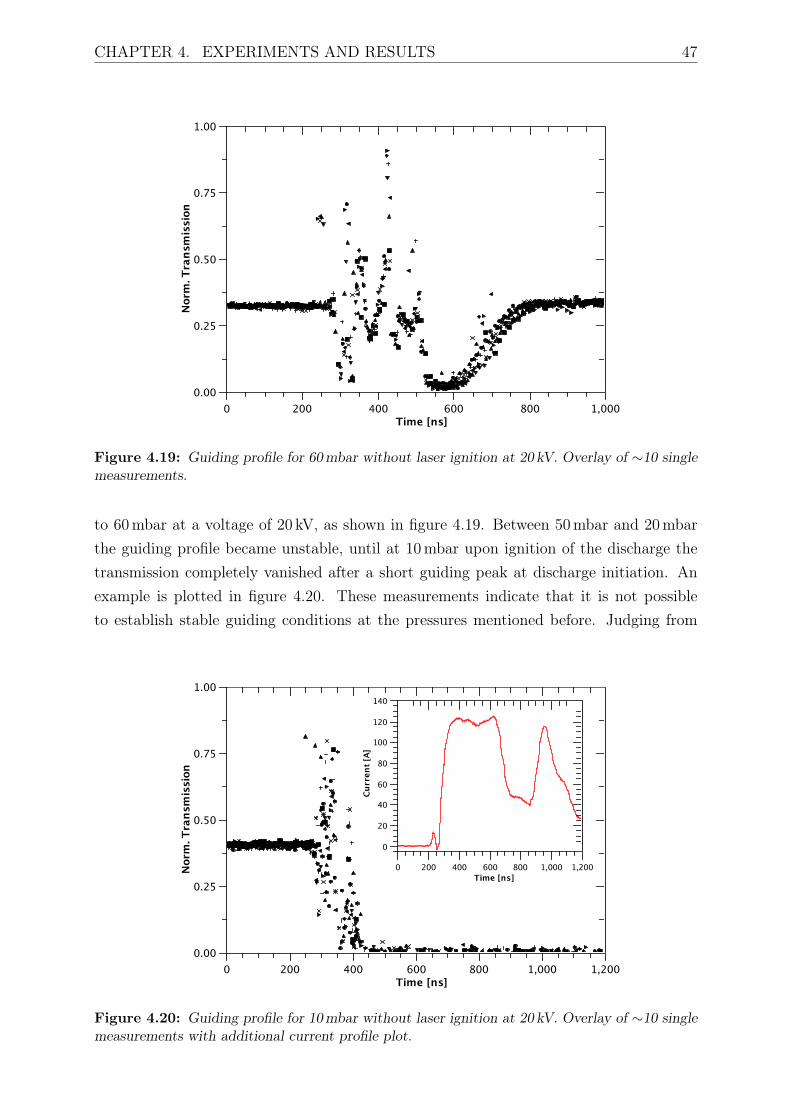
CHAPTER 4. EXPERIMENTS AND RESULTS 47
Nor
m. T
rans
mis
sion
0.00
0.25
0.50
0.75
1.00
Time [ns]0 200 400 600 800 1,000
Figure 4.19: Guiding profile for 60mbar without laser ignition at 20 kV. Overlay of ∼10 singlemeasurements.
to 60mbar at a voltage of 20 kV, as shown in figure 4.19. Between 50mbar and 20mbarthe guiding profile became unstable, until at 10mbar upon ignition of the discharge thetransmission completely vanished after a short guiding peak at discharge initiation. Anexample is plotted in figure 4.20. These measurements indicate that it is not possibleto establish stable guiding conditions at the pressures mentioned before. Judging from
Nor
m. T
rans
mis
sion
0.00
0.25
0.50
0.75
1.00
Time [ns]0 200 400 600 800 1,000 1,200
Curr
ent [
A]
0
20
40
60
80
100
120
140
Time [ns]0 200 400 600 800 1,000 1,200
Figure 4.20: Guiding profile for 10mbar without laser ignition at 20 kV. Overlay of ∼10 singlemeasurements with additional current profile plot.
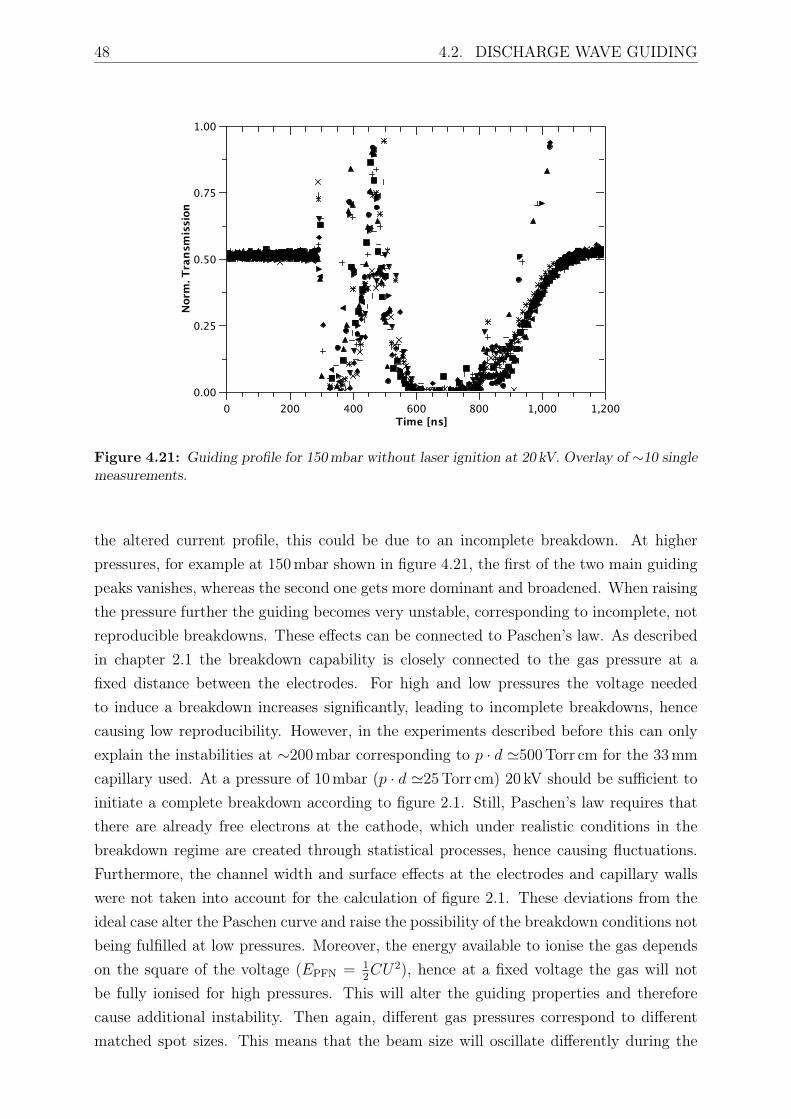
48 4.2. DISCHARGE WAVE GUIDING
Nor
m. T
rans
mis
sion
0.00
0.25
0.50
0.75
1.00
Time [ns]0 200 400 600 800 1,000 1,200
Figure 4.21: Guiding profile for 150mbar without laser ignition at 20 kV. Overlay of ∼10 singlemeasurements.
the altered current profile, this could be due to an incomplete breakdown. At higherpressures, for example at 150mbar shown in figure 4.21, the first of the two main guidingpeaks vanishes, whereas the second one gets more dominant and broadened. When raisingthe pressure further the guiding becomes very unstable, corresponding to incomplete, notreproducible breakdowns. These effects can be connected to Paschen’s law. As describedin chapter 2.1 the breakdown capability is closely connected to the gas pressure at afixed distance between the electrodes. For high and low pressures the voltage neededto induce a breakdown increases significantly, leading to incomplete breakdowns, hencecausing low reproducibility. However, in the experiments described before this can onlyexplain the instabilities at ∼200mbar corresponding to p · d '500Torr cm for the 33mmcapillary used. At a pressure of 10mbar (p · d '25Torr cm) 20 kV should be sufficient toinitiate a complete breakdown according to figure 2.1. Still, Paschen’s law requires thatthere are already free electrons at the cathode, which under realistic conditions in thebreakdown regime are created through statistical processes, hence causing fluctuations.Furthermore, the channel width and surface effects at the electrodes and capillary wallswere not taken into account for the calculation of figure 2.1. These deviations from theideal case alter the Paschen curve and raise the possibility of the breakdown conditions notbeing fulfilled at low pressures. Moreover, the energy available to ionise the gas dependson the square of the voltage (EPFN = 1
2CU2), hence at a fixed voltage the gas will not
be fully ionised for high pressures. This will alter the guiding properties and thereforecause additional instability. Then again, different gas pressures correspond to differentmatched spot sizes. This means that the beam size will oscillate differently during the
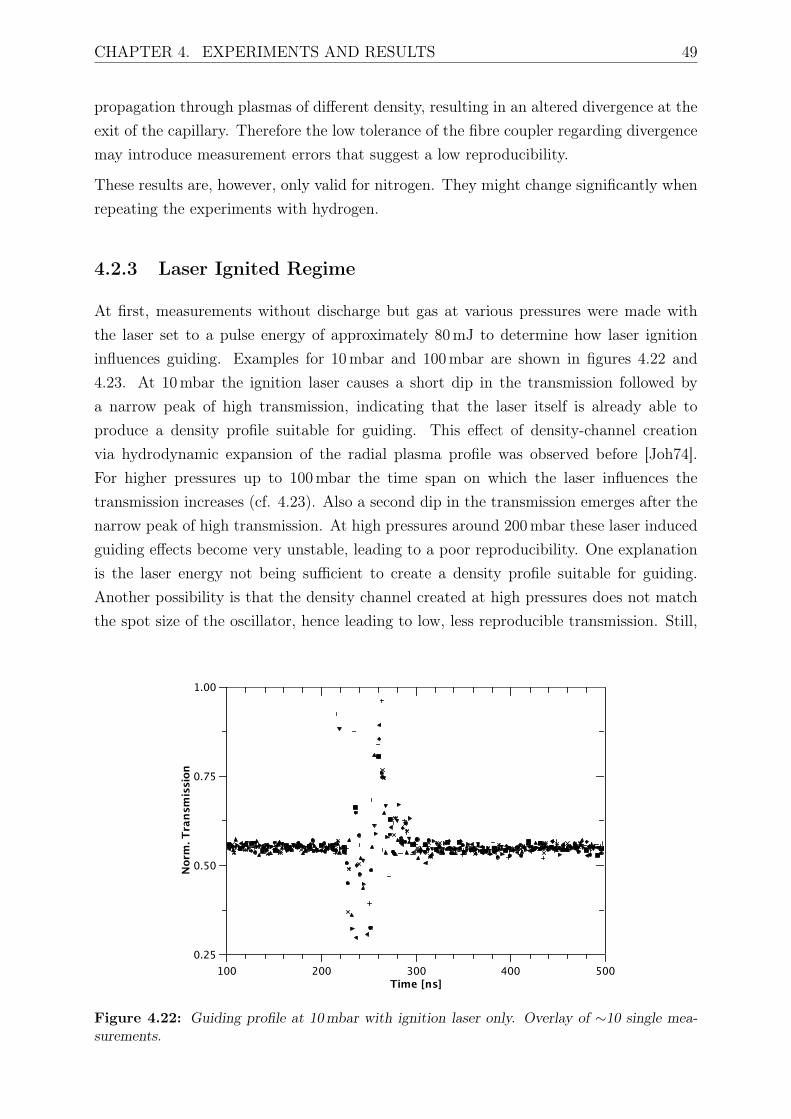
CHAPTER 4. EXPERIMENTS AND RESULTS 49
propagation through plasmas of different density, resulting in an altered divergence at theexit of the capillary. Therefore the low tolerance of the fibre coupler regarding divergencemay introduce measurement errors that suggest a low reproducibility.
These results are, however, only valid for nitrogen. They might change significantly whenrepeating the experiments with hydrogen.
4.2.3 Laser Ignited Regime
At first, measurements without discharge but gas at various pressures were made withthe laser set to a pulse energy of approximately 80mJ to determine how laser ignitioninfluences guiding. Examples for 10mbar and 100mbar are shown in figures 4.22 and4.23. At 10mbar the ignition laser causes a short dip in the transmission followed bya narrow peak of high transmission, indicating that the laser itself is already able toproduce a density profile suitable for guiding. This effect of density-channel creationvia hydrodynamic expansion of the radial plasma profile was observed before [Joh74].For higher pressures up to 100mbar the time span on which the laser influences thetransmission increases (cf. 4.23). Also a second dip in the transmission emerges after thenarrow peak of high transmission. At high pressures around 200mbar these laser inducedguiding effects become very unstable, leading to a poor reproducibility. One explanationis the laser energy not being sufficient to create a density profile suitable for guiding.Another possibility is that the density channel created at high pressures does not matchthe spot size of the oscillator, hence leading to low, less reproducible transmission. Still,
Nor
m. T
rans
mis
sion
0.25
0.50
0.75
1.00
Time [ns]100 200 300 400 500
Figure 4.22: Guiding profile at 10mbar with ignition laser only. Overlay of ∼10 single mea-surements.
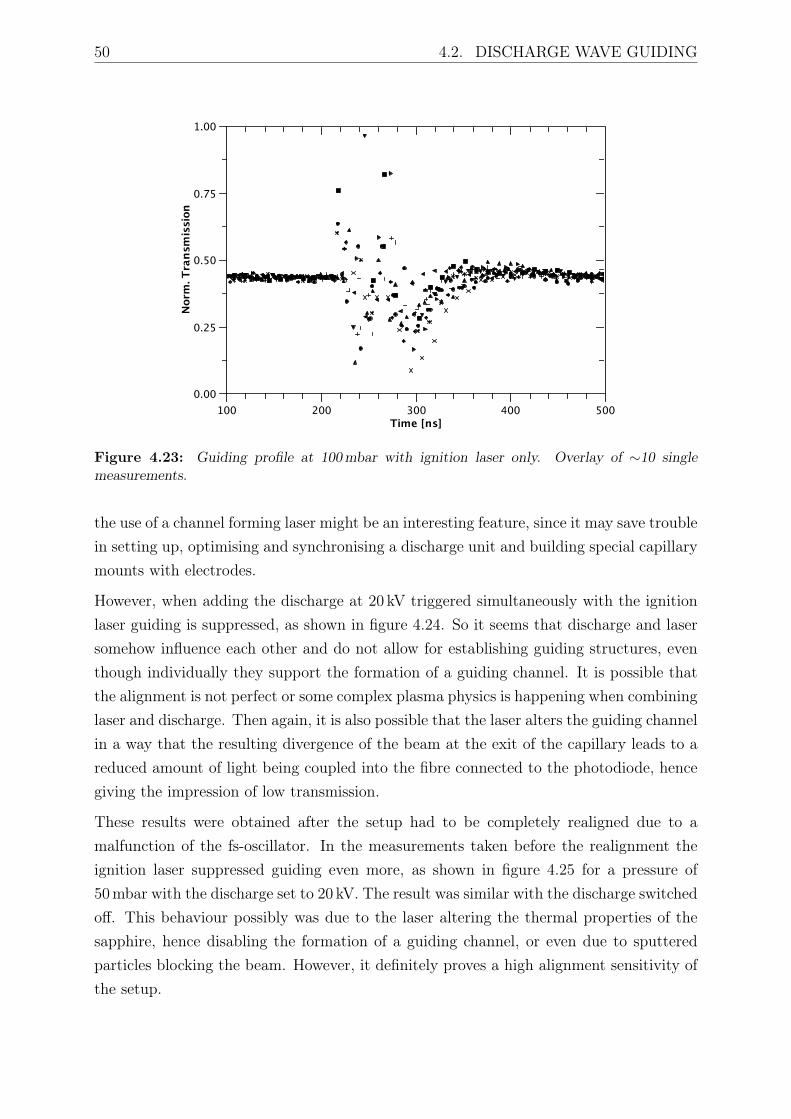
50 4.2. DISCHARGE WAVE GUIDING
Nor
m. T
rans
mis
sion
0.00
0.25
0.50
0.75
1.00
Time [ns]100 200 300 400 500
Figure 4.23: Guiding profile at 100mbar with ignition laser only. Overlay of ∼10 singlemeasurements.
the use of a channel forming laser might be an interesting feature, since it may save troublein setting up, optimising and synchronising a discharge unit and building special capillarymounts with electrodes.
However, when adding the discharge at 20 kV triggered simultaneously with the ignitionlaser guiding is suppressed, as shown in figure 4.24. So it seems that discharge and lasersomehow influence each other and do not allow for establishing guiding structures, eventhough individually they support the formation of a guiding channel. It is possible thatthe alignment is not perfect or some complex plasma physics is happening when combininglaser and discharge. Then again, it is also possible that the laser alters the guiding channelin a way that the resulting divergence of the beam at the exit of the capillary leads to areduced amount of light being coupled into the fibre connected to the photodiode, hencegiving the impression of low transmission.
These results were obtained after the setup had to be completely realigned due to amalfunction of the fs-oscillator. In the measurements taken before the realignment theignition laser suppressed guiding even more, as shown in figure 4.25 for a pressure of50mbar with the discharge set to 20 kV. The result was similar with the discharge switchedoff. This behaviour possibly was due to the laser altering the thermal properties of thesapphire, hence disabling the formation of a guiding channel, or even due to sputteredparticles blocking the beam. However, it definitely proves a high alignment sensitivity ofthe setup.
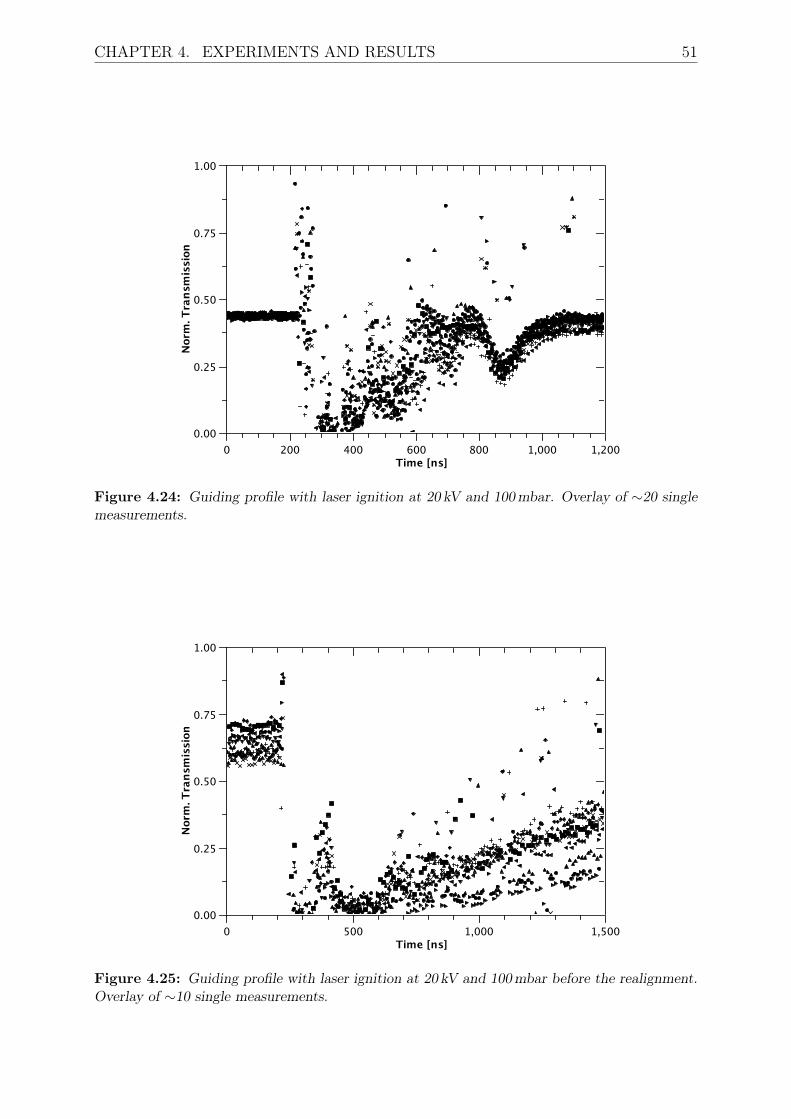
CHAPTER 4. EXPERIMENTS AND RESULTS 51
Nor
m. T
rans
mis
sion
0.00
0.25
0.50
0.75
1.00
Time [ns]0 200 400 600 800 1,000 1,200
Figure 4.24: Guiding profile with laser ignition at 20 kV and 100mbar. Overlay of ∼20 singlemeasurements.
Nor
m. T
rans
mis
sion
0.00
0.25
0.50
0.75
1.00
Time [ns]0 500 1,000 1,500
Figure 4.25: Guiding profile with laser ignition at 20 kV and 100mbar before the realignment.Overlay of ∼10 single measurements.

52 4.2. DISCHARGE WAVE GUIDING
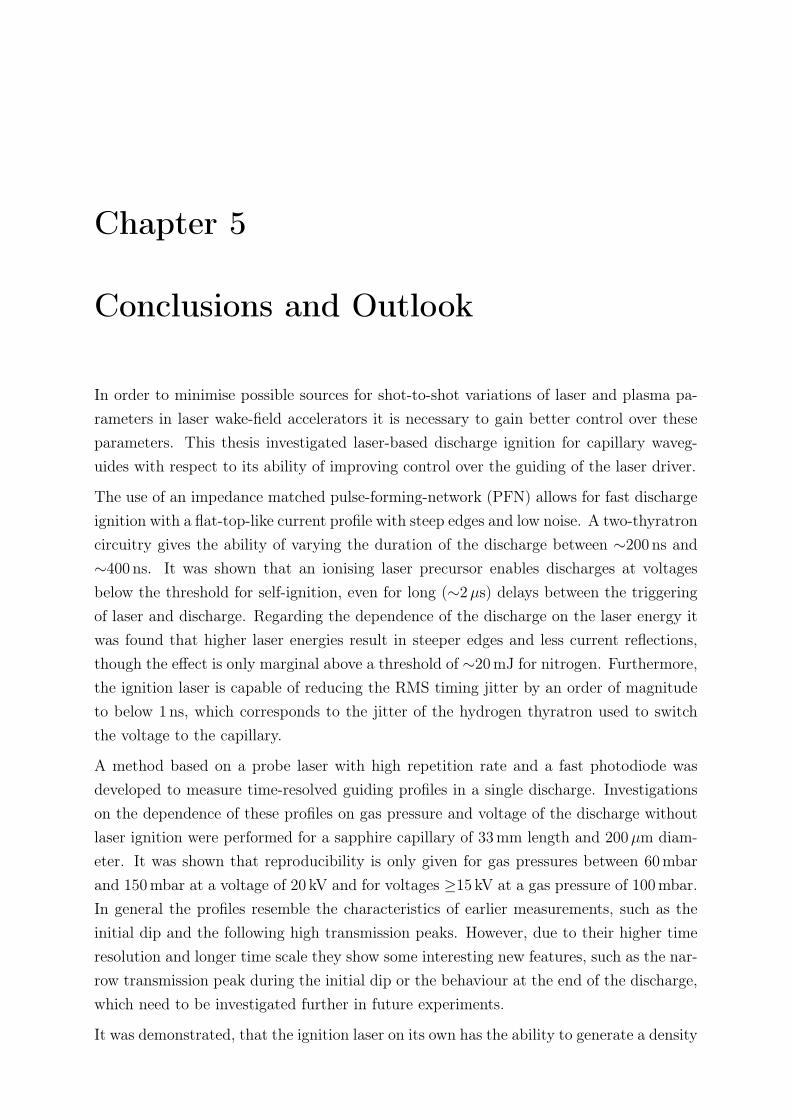
Chapter 5
Conclusions and Outlook
In order to minimise possible sources for shot-to-shot variations of laser and plasma pa-rameters in laser wake-field accelerators it is necessary to gain better control over theseparameters. This thesis investigated laser-based discharge ignition for capillary waveg-uides with respect to its ability of improving control over the guiding of the laser driver.
The use of an impedance matched pulse-forming-network (PFN) allows for fast dischargeignition with a flat-top-like current profile with steep edges and low noise. A two-thyratroncircuitry gives the ability of varying the duration of the discharge between ∼200 ns and∼400 ns. It was shown that an ionising laser precursor enables discharges at voltagesbelow the threshold for self-ignition, even for long (∼2µs) delays between the triggeringof laser and discharge. Regarding the dependence of the discharge on the laser energy itwas found that higher laser energies result in steeper edges and less current reflections,though the effect is only marginal above a threshold of ∼20mJ for nitrogen. Furthermore,the ignition laser is capable of reducing the RMS timing jitter by an order of magnitudeto below 1 ns, which corresponds to the jitter of the hydrogen thyratron used to switchthe voltage to the capillary.
A method based on a probe laser with high repetition rate and a fast photodiode wasdeveloped to measure time-resolved guiding profiles in a single discharge. Investigationson the dependence of these profiles on gas pressure and voltage of the discharge withoutlaser ignition were performed for a sapphire capillary of 33mm length and 200µm diam-eter. It was shown that reproducibility is only given for gas pressures between 60mbarand 150mbar at a voltage of 20 kV and for voltages ≥15 kV at a gas pressure of 100mbar.In general the profiles resemble the characteristics of earlier measurements, such as theinitial dip and the following high transmission peaks. However, due to their higher timeresolution and longer time scale they show some interesting new features, such as the nar-row transmission peak during the initial dip or the behaviour at the end of the discharge,which need to be investigated further in future experiments.
It was demonstrated, that the ignition laser on its own has the ability to generate a density
54
profile suitable for guiding at various pressures, but on a short time scale compared to thedischarge. However, the combination of discharge and ignition laser suppresses guiding, atleast in these experiments. The effect proved to be alignment sensitive which was shownby comparison of measurements before and after the setup had to be realigned. It wasalso discussed that the observed guiding profiles may be influenced by the coupling of thebeam into the fibre connected to the photodiode. It has a low tolerance regarding thedivergence of the incident beam due to the small fibre core diameter of 9µm. Therefore,a fibre of larger diameter will be used for further investigations.
Future experiments will include measurements with hydrogen (currently in preparation),different capillary diameters and lengths as well as different focussing of the ignitionlaser, e.g. with a longer Reyleigh length to better fit through the capillary or with thefocus moved closer to cathode. It is also planned to image the temporal evolution of thedischarge in the capillary. Furthermore, if the issue of guiding suppression by the ignitionlaser can be resolved, the possibility of using the laser to create deeper guiding channelsfor better matching to the spot size of the laser driver by heating the discharge createdelectrons near the capillary axis, as recently proposed [Bob13], will be investigated.

Appendix A
Software
A.1 Jitter Calculation Script
To calculate the RMS jitter in the laser-based discharge-ignition experiments a Pythonscript was written to extract the timings for a user-defined threshold value in the edgeof the current peak and to calculate the RMS value and the corresponding standarddeviation. It is shown below.
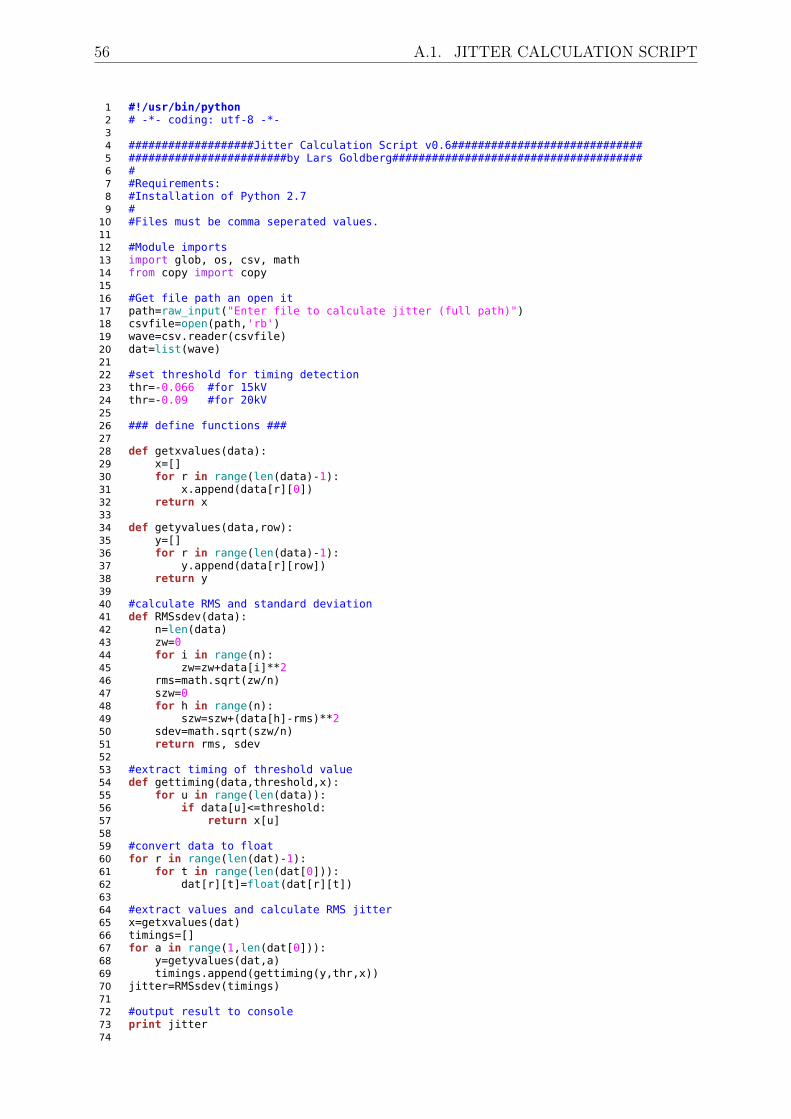
56 A.1. JITTER CALCULATION SCRIPT
1 #!/usr/bin/python2 # -*- coding: utf-8 -*-3 4 ###################Jitter Calculation Script v0.6#############################5 ########################by Lars Goldberg######################################6 #7 #Requirements:8 #Installation of Python 2.79 #
10 #Files must be comma seperated values.11 12 #Module imports13 import glob, os, csv, math14 from copy import copy15 16 #Get file path an open it17 path=raw_input("Enter file to calculate jitter (full path)")18 csvfile=open(path,'rb')19 wave=csv.reader(csvfile)20 dat=list(wave)21 22 #set threshold for timing detection23 thr=-0.066 #for 15kV24 thr=-0.09 #for 20kV25 26 ### define functions ###27 28 def getxvalues(data):29 x=[]30 for r in range(len(data)-1):31 x.append(data[r][0])32 return x33 34 def getyvalues(data,row):35 y=[]36 for r in range(len(data)-1):37 y.append(data[r][row])38 return y39 40 #calculate RMS and standard deviation41 def RMSsdev(data):42 n=len(data)43 zw=044 for i in range(n):45 zw=zw+data[i]**246 rms=math.sqrt(zw/n)47 szw=048 for h in range(n):49 szw=szw+(data[h]-rms)**250 sdev=math.sqrt(szw/n)51 return rms, sdev52 53 #extract timing of threshold value54 def gettiming(data,threshold,x):55 for u in range(len(data)):56 if data[u]<=threshold:57 return x[u]58 59 #convert data to float60 for r in range(len(dat)-1):61 for t in range(len(dat[0])):62 dat[r][t]=float(dat[r][t])63 64 #extract values and calculate RMS jitter65 x=getxvalues(dat)66 timings=[]67 for a in range(1,len(dat[0])):68 y=getyvalues(dat,a)69 timings.append(gettiming(y,thr,x))70 jitter=RMSsdev(timings)71 72 #output result to console73 print jitter74
APPENDIX A. SOFTWARE 57
75 #and write to file76 fil=open(path[0:len(path)-4]+"_jitter.csv",'w+')77 writer=csv.writer(fil)78 labels=["RMS value","standard deviation"]79 writer.writerow(labels)80 writer.writerow(jitter)81 fil.close()
A.2 Guiding-Analysis Script
The analysis of the guiding experiments required the single oscillator peaks to be detected,a baseline to be fitted to the peaks and the area between the peaks and the baseline to beintegrated. The Python script written to perform the analysis is shown hereinafter. Forpeak detection the peakdetect.py by Sixtenbe found athttps://gist.github.com/sixtenbe/1178136
as available in March 2013 was used.
58 A.2. GUIDING-ANALYSIS SCRIPT
1 #!/usr/local/bin/python2 # -*- coding: utf-8 -*-3 4 #################Pulse Integration Script v0.95###############################5 ########################by Lars Goldberg######################################6 #7 #Requirements:8 #Installation of Python 2.7 with the SciPy and NumPy packages9 #Uses the peakdetect.py by Sixtenbe found at
10 #https://gist.github.com/sixtenbe/117813611 #12 #Files should be .csv files with x-values in the first column. 13 14 15 #Module imports16 import glob, os, math, csv17 from copy import copy18 from scipy import integrate19 from scipy.fftpack import rfft, irfft20 from peakdetect import peakdetect21 22 23 #get the file directory24 foo=raw_input("Enter Image Directory or hit Enter for Current Working Directory ")25 if foo=="":26 place=os.getcwd()27 else:28 place=foo29 30 #get file names31 files=glob.glob(place+'/*.csv')32 33 #ensure directories34 if not os.path.exists(place+"/integrated"):35 os.makedirs(place+"/integrated")36 37 #set parameters38 lookahead=80 #lookaheah for peakdetection39 delta=0 #should be >=RMSnoise*540 back=22 #steps to start before the peak41 avrange=11 #range to average around start point for linear fit42 cut=550 #cutoff frequency for lowpass43 notch1=1400 #start and stop for notch filter44 notch2=163045 46 ###define functions###47 #gather x values48 def getxvalues(data):49 x=[]50 for r in range(len(data)-1):51 x.append(data[r][0])52 return x53 54 #gather y values55 def getyvalues(data,row):56 y=[]57 for r in range(len(data)-1):58 y.append(data[r][row])59 offset=abs(min(y))60 for t in range(len(y)):61 y[t]=y[t]+offset62 return y63 64 #linear fit through 2 points65 def fit(x1,y1,x2,y2):66 m=((y2-y1)/(x2-x1))67 b=((y1-m*x1)+(y2-m*x2))/268 return m, b69 70 #integrate area between baseline and peak71 def integration(fp,xlist,ylist,start,stop,bly):72 blArea=integrate.quad(lambda x: fp[0]*x+fp[1],xlist[start],xlist[stop])73 peakArea=integrate.simps(ylist[start:stop],xlist[start:stop])74
APPENDIX A. SOFTWARE 59
75 area=peakArea-blArea[0]76 xv=xlist[start+back]77 return xv, xlist[start], bly, fp[0], blArea[0], peakArea, area78 79 #save data to csv80 def savecsv(data,nr,name):81 z=item.find(place[len(place)-(len(place)/2):len(place)])82 fil=open(place+"/integrated/"+name[z+(len(place)/2):len(name)-4]+"_"+str(nr)+".csv",'w+')83 writer=csv.writer(fil)84 labels=["x-value","blx","bly","blslope","baseline area","peak area","area"]85 writer.writerow(labels)86 for row in data:87 writer.writerow(row)88 fil.close()89 print "Saved"+" "+name[z+(len(place)/2):len(name)-4]+"_"+str(nr)+".csv"90 91 #average of list of values92 def average(values):93 s=094 for i in range(len(values)):95 s=s+values[i]96 av=s/len(values)97 return av98 99 #lowpass frequency filter
100 def lowpass(data,cutoff):101 ft=rfft(data)102 for i in range(2*cutoff-1,len(ft)):103 ft[i]=0104 ift=irfft(ft)105 fil=open(place+"/integrated/FFT_example.csv",'w+')106 for h in range(len(ift)):107 fil.write(str(ft[h])+","+str(ift[h])+"\n")108 fil.close()109 return ift110 111 #notch frequency filter112 def notch(data,n1,n2):113 ft=rfft(data)114 for i in range(n1,n2+1):115 ft[i]=0116 ift=irfft(ft)117 fil=open(place+"/integrated/FFT_example.csv",'w+')118 for h in range(len(ift)):119 fil.write(str(ft[h])+","+str(ift[h])+"\n")120 fil.close()121 return ift122 123 #run integration for all data series and save124 #read the data, convert to float, fit baseline and integrate peaks125 for item in files:126 dat=list(csv.reader(open(item,'rb')))127 for r in range(len(dat)-1):128 for t in range(len(dat[0])):129 dat[r][t]=float(dat[r][t])130 result=[]131 xlist=getxvalues(dat)132 for j in range(1,len(dat[0])):133 ylist=notch(getyvalues(dat,j),notch1,notch2)134 mx,mn=peakdetect(ylist,xlist,lookahead,delta)135 mxx, mxy = zip(*mx)136 for u in range(len(mxx)-1):137 st=xlist.index(mxx[u])-back138 if st-avrange<0:139 continue140 else:141 en=xlist.index(mxx[u+1])-back142 bl=fit(xlist[st],average(ylist[st-avrange:st+avrange]),xlist[en],average(ylist
[en-avrange:en+avrange]))143 intres=integration(bl,xlist,ylist,st,en,average(ylist[st-avrange:st+avrange]))144 result.append(intres)145 savecsv(result,j,item)146 result=[]

60 A.2. GUIDING-ANALYSIS SCRIPT
141 en=xlist.index(mxx[u+1])-back142 bl=fit(xlist[st],average(ylist[st-avrange:st+avrange]),xlist[en],average(ylist[en-
avrange:en+avrange]))143 intres=integration(bl,xlist,ylist,st,en,average(ylist[st-avrange:st+avrange]))144 result.append(intres)145 savecsv(result,j,item)146 result=[]
Bibliography
[Amm86] M. V. Ammosov, N. B. Delone, V. P. Krainov, Tunnel ionisation of complexatoms and of atomic ions in an alternating electromagnetic field. Soviet PhysicsJETP, Vol. 64, No. 6 (1986)
[Aug91] S. Augst, D. D. Mayerhofe, D. Strickland, S. L. Chin, Laser ionization of noblegases by Coulomb-barrier suppression. J. Opt. Soc. Am. B, Vol. 8, No. 4, (1991)
[Aug92] T. Auguste, P. Monot, L.-A. Lompré, G. Mainfray, C. Manus, Defocusing effectsof a picosecond terawatt laser pulse in an underdense plasma. Optics Commu-nications, Vol. 89, No. 2-4, 145-148 (1992)
[Bar85] G. Baravian, G. Sultan, Determination of multiphoton ionization cross sectionsin focused laser experiments. Physica B+C, Vol 128, No. 3 (1985)
[Bob13] N. A. Bobrova, P. V. Sasorov, C. Benedetti, S. S. Bulanov, C. G. R. Geddes,C.B. Schroeder, E. Esarey, W. P. Leemans, Laser-heater assisted plasma channelformation in capillary discharge waveguides. Physics of Plasmas, Vol. 20, No.2 (2013)
[Boh49] D. Bohm, E. Gross, Theory of Plasma Oscillations. A. Origin of Medium-LikeBehavior. Phys. Rev., Vol. 75, 1851–1864 (1949)
[Bul98] S. Bulanov, N. Naumova, F. Pegoraro, J. Sakai, Particle injection into the waveacceleration phase due to nonlinear wake wave breaking. Phys. Rev. E, Vol. 58,No. 5, R5257-R5260 (1998)
[Del98] N. B. Delone, V. P. Krainov, Tunnel and barrier-suppression ionization ofatoms and ions in a laser radiation field. Phys.-Usp. Vol. 41, No. 5, 469-485(1998)
[Din05] A. Dinklage, T. Klinger, G. Marx, L. Schweikhard, Plasma Physics. Lect. NotesPhys. 670, Springer, Berlin Heidelberg (2005)
[Dou73] D. H. Douglas-Hamilton, Recombination rate measurements in nitrogen. J.Chem. Phys., Vol. 58, 4820 (1973)
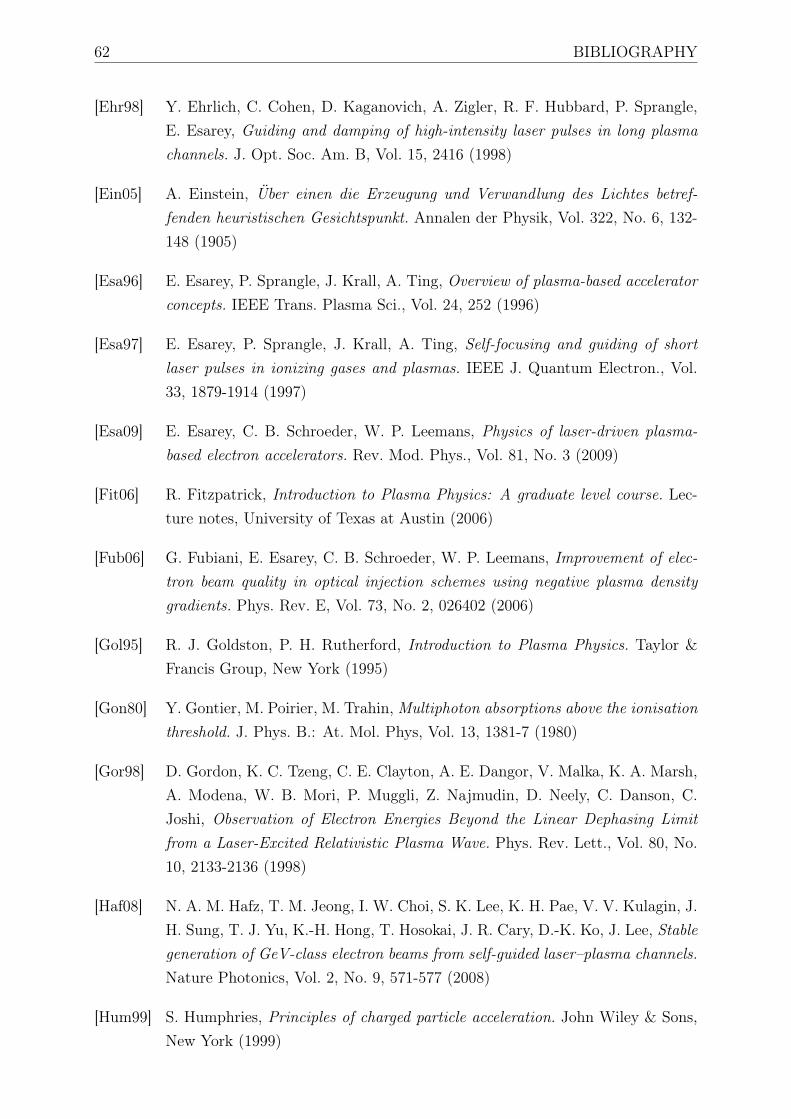
62 BIBLIOGRAPHY
[Ehr98] Y. Ehrlich, C. Cohen, D. Kaganovich, A. Zigler, R. F. Hubbard, P. Sprangle,E. Esarey, Guiding and damping of high-intensity laser pulses in long plasmachannels. J. Opt. Soc. Am. B, Vol. 15, 2416 (1998)
[Ein05] A. Einstein, Über einen die Erzeugung und Verwandlung des Lichtes betref-fenden heuristischen Gesichtspunkt. Annalen der Physik, Vol. 322, No. 6, 132-148 (1905)
[Esa96] E. Esarey, P. Sprangle, J. Krall, A. Ting, Overview of plasma-based acceleratorconcepts. IEEE Trans. Plasma Sci., Vol. 24, 252 (1996)
[Esa97] E. Esarey, P. Sprangle, J. Krall, A. Ting, Self-focusing and guiding of shortlaser pulses in ionizing gases and plasmas. IEEE J. Quantum Electron., Vol.33, 1879-1914 (1997)
[Esa09] E. Esarey, C. B. Schroeder, W. P. Leemans, Physics of laser-driven plasma-based electron accelerators. Rev. Mod. Phys., Vol. 81, No. 3 (2009)
[Fit06] R. Fitzpatrick, Introduction to Plasma Physics: A graduate level course. Lec-ture notes, University of Texas at Austin (2006)
[Fub06] G. Fubiani, E. Esarey, C. B. Schroeder, W. P. Leemans, Improvement of elec-tron beam quality in optical injection schemes using negative plasma densitygradients. Phys. Rev. E, Vol. 73, No. 2, 026402 (2006)
[Gol95] R. J. Goldston, P. H. Rutherford, Introduction to Plasma Physics. Taylor &Francis Group, New York (1995)
[Gon80] Y. Gontier, M. Poirier, M. Trahin, Multiphoton absorptions above the ionisationthreshold. J. Phys. B.: At. Mol. Phys, Vol. 13, 1381-7 (1980)
[Gor98] D. Gordon, K. C. Tzeng, C. E. Clayton, A. E. Dangor, V. Malka, K. A. Marsh,A. Modena, W. B. Mori, P. Muggli, Z. Najmudin, D. Neely, C. Danson, C.Joshi, Observation of Electron Energies Beyond the Linear Dephasing Limitfrom a Laser-Excited Relativistic Plasma Wave. Phys. Rev. Lett., Vol. 80, No.10, 2133-2136 (1998)
[Haf08] N. A. M. Hafz, T. M. Jeong, I. W. Choi, S. K. Lee, K. H. Pae, V. V. Kulagin, J.H. Sung, T. J. Yu, K.-H. Hong, T. Hosokai, J. R. Cary, D.-K. Ko, J. Lee, Stablegeneration of GeV-class electron beams from self-guided laser–plasma channels.Nature Photonics, Vol. 2, No. 9, 571-577 (2008)
[Hum99] S. Humphries, Principles of charged particle acceleration. John Wiley & Sons,New York (1999)
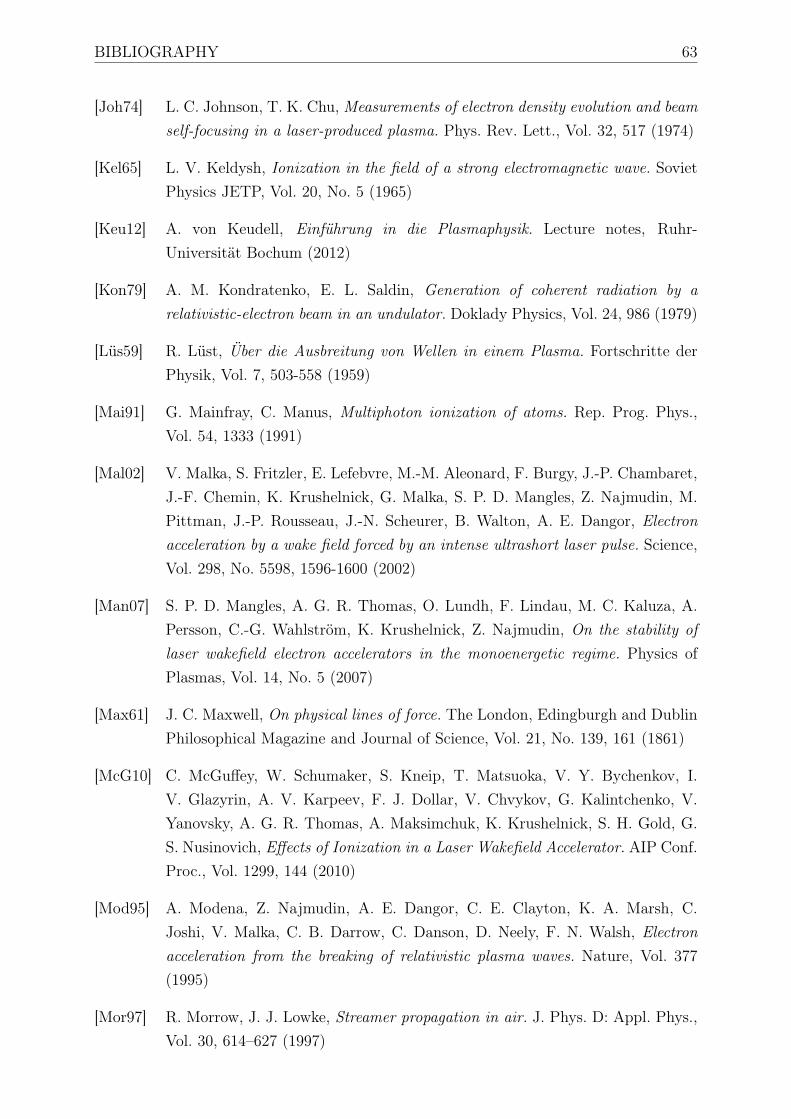
BIBLIOGRAPHY 63
[Joh74] L. C. Johnson, T. K. Chu, Measurements of electron density evolution and beamself-focusing in a laser-produced plasma. Phys. Rev. Lett., Vol. 32, 517 (1974)
[Kel65] L. V. Keldysh, Ionization in the field of a strong electromagnetic wave. SovietPhysics JETP, Vol. 20, No. 5 (1965)
[Keu12] A. von Keudell, Einführung in die Plasmaphysik. Lecture notes, Ruhr-Universität Bochum (2012)
[Kon79] A. M. Kondratenko, E. L. Saldin, Generation of coherent radiation by arelativistic-electron beam in an undulator. Doklady Physics, Vol. 24, 986 (1979)
[Lüs59] R. Lüst, Über die Ausbreitung von Wellen in einem Plasma. Fortschritte derPhysik, Vol. 7, 503-558 (1959)
[Mai91] G. Mainfray, C. Manus, Multiphoton ionization of atoms. Rep. Prog. Phys.,Vol. 54, 1333 (1991)
[Mal02] V. Malka, S. Fritzler, E. Lefebvre, M.-M. Aleonard, F. Burgy, J.-P. Chambaret,J.-F. Chemin, K. Krushelnick, G. Malka, S. P. D. Mangles, Z. Najmudin, M.Pittman, J.-P. Rousseau, J.-N. Scheurer, B. Walton, A. E. Dangor, Electronacceleration by a wake field forced by an intense ultrashort laser pulse. Science,Vol. 298, No. 5598, 1596-1600 (2002)
[Man07] S. P. D. Mangles, A. G. R. Thomas, O. Lundh, F. Lindau, M. C. Kaluza, A.Persson, C.-G. Wahlström, K. Krushelnick, Z. Najmudin, On the stability oflaser wakefield electron accelerators in the monoenergetic regime. Physics ofPlasmas, Vol. 14, No. 5 (2007)
[Max61] J. C. Maxwell, On physical lines of force. The London, Edingburgh and DublinPhilosophical Magazine and Journal of Science, Vol. 21, No. 139, 161 (1861)
[McG10] C. McGuffey, W. Schumaker, S. Kneip, T. Matsuoka, V. Y. Bychenkov, I.V. Glazyrin, A. V. Karpeev, F. J. Dollar, V. Chvykov, G. Kalintchenko, V.Yanovsky, A. G. R. Thomas, A. Maksimchuk, K. Krushelnick, S. H. Gold, G.S. Nusinovich, Effects of Ionization in a Laser Wakefield Accelerator. AIP Conf.Proc., Vol. 1299, 144 (2010)
[Mod95] A. Modena, Z. Najmudin, A. E. Dangor, C. E. Clayton, K. A. Marsh, C.Joshi, V. Malka, C. B. Darrow, C. Danson, D. Neely, F. N. Walsh, Electronacceleration from the breaking of relativistic plasma waves. Nature, Vol. 377(1995)
[Mor97] R. Morrow, J. J. Lowke, Streamer propagation in air. J. Phys. D: Appl. Phys.,Vol. 30, 614–627 (1997)
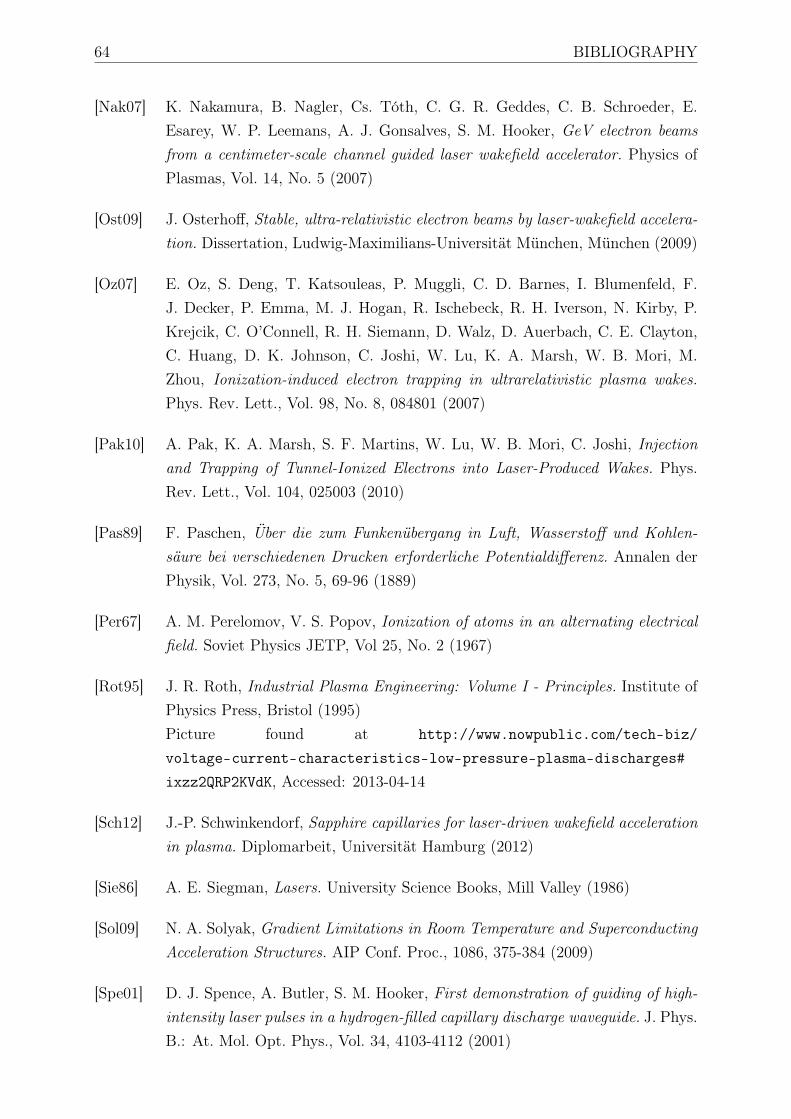
64 BIBLIOGRAPHY
[Nak07] K. Nakamura, B. Nagler, Cs. Tóth, C. G. R. Geddes, C. B. Schroeder, E.Esarey, W. P. Leemans, A. J. Gonsalves, S. M. Hooker, GeV electron beamsfrom a centimeter-scale channel guided laser wakefield accelerator. Physics ofPlasmas, Vol. 14, No. 5 (2007)
[Ost09] J. Osterhoff, Stable, ultra-relativistic electron beams by laser-wakefield accelera-tion. Dissertation, Ludwig-Maximilians-Universität München, München (2009)
[Oz07] E. Oz, S. Deng, T. Katsouleas, P. Muggli, C. D. Barnes, I. Blumenfeld, F.J. Decker, P. Emma, M. J. Hogan, R. Ischebeck, R. H. Iverson, N. Kirby, P.Krejcik, C. O’Connell, R. H. Siemann, D. Walz, D. Auerbach, C. E. Clayton,C. Huang, D. K. Johnson, C. Joshi, W. Lu, K. A. Marsh, W. B. Mori, M.Zhou, Ionization-induced electron trapping in ultrarelativistic plasma wakes.Phys. Rev. Lett., Vol. 98, No. 8, 084801 (2007)
[Pak10] A. Pak, K. A. Marsh, S. F. Martins, W. Lu, W. B. Mori, C. Joshi, Injectionand Trapping of Tunnel-Ionized Electrons into Laser-Produced Wakes. Phys.Rev. Lett., Vol. 104, 025003 (2010)
[Pas89] F. Paschen, Über die zum Funkenübergang in Luft, Wasserstoff und Kohlen-säure bei verschiedenen Drucken erforderliche Potentialdifferenz. Annalen derPhysik, Vol. 273, No. 5, 69-96 (1889)
[Per67] A. M. Perelomov, V. S. Popov, Ionization of atoms in an alternating electricalfield. Soviet Physics JETP, Vol 25, No. 2 (1967)
[Rot95] J. R. Roth, Industrial Plasma Engineering: Volume I - Principles. Institute ofPhysics Press, Bristol (1995)Picture found at http://www.nowpublic.com/tech-biz/
voltage-current-characteristics-low-pressure-plasma-discharges#
ixzz2QRP2KVdK, Accessed: 2013-04-14
[Sch12] J.-P. Schwinkendorf, Sapphire capillaries for laser-driven wakefield accelerationin plasma. Diplomarbeit, Universität Hamburg (2012)
[Sie86] A. E. Siegman, Lasers. University Science Books, Mill Valley (1986)
[Sol09] N. A. Solyak, Gradient Limitations in Room Temperature and SuperconductingAcceleration Structures. AIP Conf. Proc., 1086, 375-384 (2009)
[Spe01] D. J. Spence, A. Butler, S. M. Hooker, First demonstration of guiding of high-intensity laser pulses in a hydrogen-filled capillary discharge waveguide. J. Phys.B.: At. Mol. Opt. Phys., Vol. 34, 4103-4112 (2001)
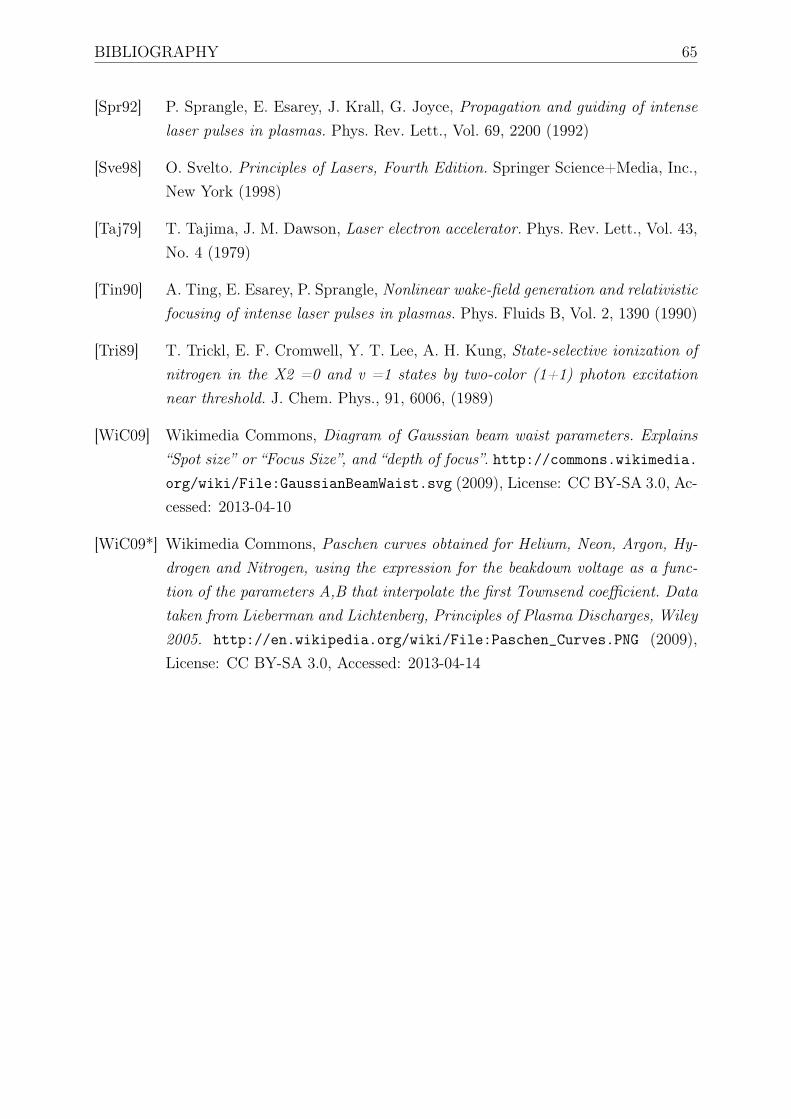
BIBLIOGRAPHY 65
[Spr92] P. Sprangle, E. Esarey, J. Krall, G. Joyce, Propagation and guiding of intenselaser pulses in plasmas. Phys. Rev. Lett., Vol. 69, 2200 (1992)
[Sve98] O. Svelto. Principles of Lasers, Fourth Edition. Springer Science+Media, Inc.,New York (1998)
[Taj79] T. Tajima, J. M. Dawson, Laser electron accelerator. Phys. Rev. Lett., Vol. 43,No. 4 (1979)
[Tin90] A. Ting, E. Esarey, P. Sprangle, Nonlinear wake-field generation and relativisticfocusing of intense laser pulses in plasmas. Phys. Fluids B, Vol. 2, 1390 (1990)
[Tri89] T. Trickl, E. F. Cromwell, Y. T. Lee, A. H. Kung, State-selective ionization ofnitrogen in the X2 =0 and v =1 states by two-color (1+1) photon excitationnear threshold. J. Chem. Phys., 91, 6006, (1989)
[WiC09] Wikimedia Commons, Diagram of Gaussian beam waist parameters. Explains“Spot size” or “Focus Size”, and “depth of focus”. http://commons.wikimedia.org/wiki/File:GaussianBeamWaist.svg (2009), License: CC BY-SA 3.0, Ac-cessed: 2013-04-10
[WiC09*] Wikimedia Commons, Paschen curves obtained for Helium, Neon, Argon, Hy-drogen and Nitrogen, using the expression for the beakdown voltage as a func-tion of the parameters A,B that interpolate the first Townsend coefficient. Datataken from Lieberman and Lichtenberg, Principles of Plasma Discharges, Wiley2005. http://en.wikipedia.org/wiki/File:Paschen_Curves.PNG (2009),License: CC BY-SA 3.0, Accessed: 2013-04-14

66 BIBLIOGRAPHY

Acknowledgements
I would like to thank everyone who helped make this thesis happen.
Special thanks go to:
Jens Osterhoff, my supervisor, for the opportunity to perform the work on this thesisin his group and for providing useful tips and tricks.
Lucas Schaper for his intense mentoring and the countless hours spent in the lab.
Jan-Patrick Schwinkendorf and Tobias Kleinwächter for enlightening conversationsand answering my (predominantly stupid) questions.
All other people in the plasma / FLA group for providing help and assistance when-ever needed.
The DESY-MIN group, especially Heinz-Jürgen Strahlendorf and Frank Obier, fortheir help with the setup of the discharge unit.
The University of Jena for providing the ignition laser.

Erklärung
Hiermit bestätige ich, dass die vorliegende Arbeit von mir selbständig verfasst wurde undich keine anderen als die angegebenen Hilfsmittel – insbesondere keine im Quellenverzeich-nis nicht benannten Internet-Quellen – benutzt habe und die Arbeit von mir vorher nichteinem anderen Prüfungsverfahren eingereicht wurde. Die eingereichte schriftliche Fassungentspricht der auf dem elektronischen Speichermedium. Ich bin damit einverstanden, dassdie Masterarbeit veröffentlicht wird.
Hamburg, den 29. April 2013
Lars Goldberg