Embed Size (px)
Citation preview

Daniel Rene Jorde
Learning from Power:Machine Learning onElectrical Signals

Fakultät für Informatik
Lehrstuhl für Anwendungs- und Middlewaresysteme
Learning from Power:Machine Learning on Electrical Signals
Daniel Rene Jorde
Vollständiger Abdruck der von der Fakultät für Informatik der Technischen UniversitätMünchen zur Erlangung des akademischen Grades eines
Doktors der Naturwissenschaften (Dr. rer. nat.)
genehmigten Dissertation.
Vorsitzender: apl. Prof. Dr. Georg Groh
Prüfer der Dissertation:1. Prof. Dr. Hans-Arno Jacobsen2. Prof. Dr. Alexander Horsch
Die Dissertation wurde am 29.10.2020 bei der Technische Universität München eingereicht unddurch die Fakultät für Informatik am 25.02.2021 angenommen.


Ad Astra

Abstract
Electricity is everywhere. It powers devices ranging from small appliances to largeindustrial machines. Seizing electrical signals to monitor the behaviour of electricalconsumers delivers insights that various applications, such as, for example, disaggregationof energy measurements and industrial condition monitoring, rely on. Non-intrusive loadmonitoring (NILM) techniques are one means for extracting device-level informationfrom electrical signals, without intrusively attaching sensors to each individual device.In this dissertation, we contribute new advancements to the steps of the NILM analysispipeline: data acquisition, event detection, and appliance identi�cation.
Data acquisition: We introduce the �rst extensive publicly-available dataset for NILM-based condition monitoring and analysis of industrial components in the �eld, namely,the co�eemaker electrical activity measurements (CREAM) dataset. More particularly,this dataset is the �rst one to include comprehensive ground-truth information andhigh-sampling-rate electrical signals of industrial electrical components that are activelyworking together to create products following a dedicated manufacturing process.
Event detection: Furthermore, we introduce a new multi-environment event detector(MEED) for high-sampling-rate electrical signals. MEED improves the current state of theart while being trained fully unsupervised. Thus, the algorithm does not require manualadaption when being used in new environments. In addition, we provide an extensivecategorisation of the existing state of the art in event detection for NILM. We identifyresearch gaps based on this review and conduct a benchmark of our MEED approachand four re-implemented state-of-the-art algorithms, showing that MEED achieves thehighest precision and recall on the BLUED and the BLOND dataset.
Appliance identi�cation: The subsequent appliance identi�cation step relies on previ-ously detected events. Appliance identi�cation algorithms use hand-crafted features so far.Di�erent appliances have di�erent features that represent them best, making the featureengineering highly dependent on the respective appliance composition. We overcomethis manual e�ort by introducing a new approach that applies a deep convolutionalneural network to extract features from the raw signals. By evaluating the algorithmon the WHITED and PLAID dataset, we show that it achieves F1-Scores of 1 and 0.69respectively.
v

Zusammenfassung
Elektrizität ist überall. Sie treibt Geräte von kleinen Haushaltsgeräten bis hin zu großenindustriellen Maschinen an. Die Nutzung von elektrischen Signalen zur Überwachungdes Verhaltens von elektrischen Verbrauchern liefert Einblicke auf denen verschiedensteAnwendungen basieren, wie zum Beispiel, die Disaggregation von Energiemessungen undindustrielle Zustandsüberwachung. Non-intrusive load monitoring (NILM) Technikensind ein Mittel, um gerätespezi�sche Informationen aus elektrischen Signalen zu extrahie-ren, ohne dabei invasiv Sensoren an den einzelnen Verbrauchern anzubringen. In dieserDissertation tragen wir neue Entwicklungen zu den Schritten der NILM-Analysepipelinebei: Datanaquise, Eventerkennung und Geräteidenti�kation.
Datanaquise: Wir stellen den ersten ausführlichen, ö�entlich verfügbaren Datensatzfür NILM basierte Zustandsüberwachung und Auswertungen auf dem Gebiet vor, denco�eemaker electrical activity measurements (CREAM) Datensatz. Insbesondere ist dieserDatensatz der Erste, der umfassende Referenzdaten und hochaufgelöste elektrische Signa-le von industriellen, elektrischen Komponenten enthält, die aktiv in einem dediziertenFertigungsprozess zusammenarbeiten, um mehrere Produkte zu erstellen.
Eventerkennung: Darüber hinaus stellen wir einen neuen, multi-umgebungs Even-terkennungsalgorithmus (MEED) für hochaufgelöste elektrische Signale vor. MEEDverbessert den aktuellen Stand der Technik, obwohl er vollständig unüberwacht trainiertwird. Daher benötigt der Algorithmus keine manuellen Anpassungen, wenn er in neuenUmgebungen verwendet wird. Außerdem stellen wir eine umfangreiche Kategorisierungdes existierenden Standes der Technik in der Eventerkennung für NILM zur Verfügung.Wir identi�zieren dabei, basierend auf diesem Überblick, Forschungslücken und führeneinen Benchmark unseres MEED Ansatzes mit vier neu implementierten Algorithmendes aktuellen Standes der Technik durch und zeigen, dass MEED die höchsten Precisionund Recall Werte auf den Datensätzen, BLUED und BLOND, erreicht.
Geräteidenti�kation: Der nachfolgende Schritt der Geräteidenti�kation stützt sich aufdie zuvor erkannten Events. Algorithmen zur Geräteidenti�kation verwenden traditio-nell händisch erarbeitete Charakteristiken. Verschiedene Geräte haben verschiedeneEigenschaften durch die sie am besten repräsentiert werden, was die Entwicklung derEigenschaften stark abhängig von der entsprechenden Gerätezusammenstellung macht.
vii

Wir überwinden diesen manuellen Aufwand durch die Einführung eines neuen Ansatzes,der ein tiefes, faltendes (convolutional) neuronales Netz verwendet, um Eigenschaftenaus den Rohsignalen zu extrahieren. Anhand der Auswertung des Algorithmus auf demWHITED und dem PLAID Datensatz zeigen wir, dass er entsprechende F1-Werte von 1und 0, 69 erreicht.
viii
Acknowledgments
All work contributing to this dissertation took place at the Department of Informaticsof the Technische Universität München under the supervision of Prof. Dr. Hans-ArnoJacobsen.
First, I would like to thank Prof. Dr. Hans-Arno Jacobsen for supporting me throughoutmy journey to this dissertation with his encouragement, his valuable feedback, his vastexperience, and for providing everything that allowed me to pursue my research.
Furthermore, I would like to thank Prof. Dr. Alexander Horsch for all the interestingtalks we had, his encouragement, and his agreement to be the second examiner of mydissertation. Also, I would like to thank Prof. Dr. Georg Groh for acting as chair of thecommittee and for inspiring me with his lecture on social computing.
I also want to thank all my colleagues at the chair. I am grateful for not only your feedbackand support on research matters but also for the great time we had, especially when atable-football match with you pushed me back on track. In particular, a huge thank youto Thomas Kriechbaumer, who acquired the funding for my position and who, togetherwith Christoph Doblander, continuously helped me with matters of all kinds. In addition,I want to especially thank Elias, Jan, Matthias, and Alexander for the great time we had.
I am grateful for all the support and the true friendship from by best friends, Benediktand Tetsuya. They cheered me up whenever we met and talked, despite the distance.
I am especially indebted to my parents Andrea and Norman, as well as my brothersMarcel and Sammy, for always listening to me and backing me up throughout my entirelife. You never stopped believing in me. Also, I want to thank my grandparents and myuncle Manfred for their continuous support.
Last but not least, I want to thank my wife, Ela. Thank you for all your love andunderstanding for my quirks and the long working hours. For your empathy and optimism,especially when I felt desperate. You are taking the burden from my shoulders bysupporting me whenever needed. Without you, all this would never have been possible.I also want to thank my yet unborn daughter Mila. Thank you for showing me what isreally important in life with your slight kicks in your mum’s belly. I love the two of you.
ix

Contents
Abstract v
Zusammenfassung vii
Acknowledgments ix
1 Introduction 11.1 Motivation . . . . . . . . . . . . . . . . . . . . . . . . . . . . . . . . . . . 21.2 Problem Statement . . . . . . . . . . . . . . . . . . . . . . . . . . . . . . 31.3 Approach . . . . . . . . . . . . . . . . . . . . . . . . . . . . . . . . . . . . 41.4 Contribution . . . . . . . . . . . . . . . . . . . . . . . . . . . . . . . . . . 61.5 Organization . . . . . . . . . . . . . . . . . . . . . . . . . . . . . . . . . . 8
2 Methodology 92.1 Non-Intrusive Load Monitoring . . . . . . . . . . . . . . . . . . . . . . . 92.2 Data Acquisition . . . . . . . . . . . . . . . . . . . . . . . . . . . . . . . . 142.3 Datasets . . . . . . . . . . . . . . . . . . . . . . . . . . . . . . . . . . . . 162.4 Performance Metrics . . . . . . . . . . . . . . . . . . . . . . . . . . . . . 172.5 Electrical Features . . . . . . . . . . . . . . . . . . . . . . . . . . . . . . . 182.6 Machine Learning . . . . . . . . . . . . . . . . . . . . . . . . . . . . . . . 21
3 Summary of Publications 253.1 CREAM, a component level co�eemaker electrical activity measurement
dataset . . . . . . . . . . . . . . . . . . . . . . . . . . . . . . . . . . . . . 263.2 MEED: An Unsupervised Multi-Environment Event Detector for Non-
Intrusive Load Monitoring . . . . . . . . . . . . . . . . . . . . . . . . . . 27
xi
CONTENTS
3.3 Event Detection for Energy Consumption Monitoring . . . . . . . . . . . 283.4 Electrical Appliance Classi�cation using Deep Convolutional Neural
Networks on High Frequency Current Measurements . . . . . . . . . . . 29
4 Discussion 31
5 Conclusions 35
List of Figures 43
Bibliography 45
Appendices 51A CREAM, a component level co�eemaker electrical activity measurement
dataset . . . . . . . . . . . . . . . . . . . . . . . . . . . . . . . . . . . . . 52B MEED: An Unsupervised Multi-Environment Event Detector for Non-
Intrusive Load Monitoring . . . . . . . . . . . . . . . . . . . . . . . . . . 75C Event Detection for Energy Consumption Monitoring . . . . . . . . . . . 82D Electrical Appliance Classi�cation using Deep Convolutional Neural
Networks on High Frequency Current Measurements . . . . . . . . . . . 91
xii
1
Introduction
Electrical signals can be found everywhere, from consumer products to large industrialmachinery. The speci�c inner workings and behaviour of appliances in�uence the elec-trical signals that power them [1, 2]. Thus, measuring these signals exhibits informationabout the components and appliances they are acquired from. We di�erentiate twoparadigms for measuring the respective voltage and current signals, namely, intrusiveload monitoring (ILM) and non-intrusive load monitoring (NILM). They represent thetrade-o� of either attaching a measurement device to every individual appliance andcomponent or of measuring multiple ones at the same time in a non-intrusive way [1].For obtaining the behaviour of individual appliances from the aggregate signal in thelatter approach, intelligent algorithms are necessary to retrieve information from thesignal.
The non-intrusive paradigm bears several advantages over ILM, such as, for example,a reduction in costs and maintenance, and the possibility to monitor appliances andcomponents for which an individual sensor placement is unfeasible. Monitoring theelectrical load of appliances and other electrical components enables various applications,such as energy breakdowns and condition monitoring of machinery [1, 3].
In this work, we focus on the NILM paradigm to monitor the electrical load of bothconsumer appliances and industrial components. NILM relies on the algorithms that are
1
1.1. MOTIVATION
used to disaggregate the aggregate sensor readings. This thesis identi�es research gapsalong the analysis pipeline of NILM and overcomes them subsequently by proposing newalgorithms and data.
1.1 Motivation
Two trends and challenges raise the demand for the analysis of electrical consumerappliances in households and o�ce environments on the one hand, and on industrialelectrical equipment on the other hand.
First, the depletion of natural resources with the simultaneous rise in demand for(electrical) energy is one of today’s main challenges [4]. Consequently, innovationsto reduce the amount of energy consumed and to improve the use of limited resourcesare necessary. One way is to advise end-users, both residential and industrial ones,on how they can save electrical energy [5, 6]. This can be done by providing detailedenergy breakdowns to identify anomalies and potential sources of energy waste [6].These energy breakdowns and appliance anomaly detection applications can be realisedby implementing respective measurement hardware and NILM algorithms. By non-intrusively measuring and disaggregating the power consumption of the entities ofinterest, such as, for example, residential households, one can provide per-applianceusage and energy demand information to raise end-user awareness [5, 6]. NILM wasinitially developed to provide per-appliance power usage information in residentialenvironments by applying disaggregation algorithms but is increasingly adapted in otherdomains [7, 8, 9, 10, 11].
The second major trend that lays the basis for an application area beside the residentialand o�ce sector is the increasing adaption of cyber-physical systems as the backbone ofnew industrial developments [12]. Detailed information about the behaviour of electricalcomponents lays the basis for implementing condition monitoring (CM) processes in theindustry [13]. NILM techniques can provide such per-component information, withoutthe need for deploying sensors to machinery in an intrusive way, as shown by the work ofSuzuki et al. [11]. Besides, analysing industrial equipment with NILM algorithms enables
2
1. INTRODUCTION
energy breakdowns that o�er the potential to achieve energy savings in the industrialsector.
In conclusion, both developments, the depletion of natural resources with the risingenergy demand, as well as the adoption of condition monitoring techniques in the industrymotivate the further development of NILM algorithms. In particular, these algorithmscontribute to reduce energy waste and to optimise the usage of industrial equipmentwithout intrusively attaching sensors to individual appliances and components.
1.2 Problem Statement
Recent advances in machine learning, such as the advancements in several �elds throughthe adoption of neural network-based algorithms, o�er opportunities to further improvethe state of the art in NILM along all steps of the analysis pipeline. We divided the NILMprocess, in particular, when being applied to high-sampling-rate data, into three stepsthat �nally result in the disaggregated load, namely, data acquisition, event detection,and appliance identi�cation, as shown in Figure 2.1.3.
Thus, the key problems and challenges of NILM that are covered in this thesis are describedwith respect to the step they belong to in the following. As NILM can be applied in varioussettings, the entities that are analysed can di�er substantially from whole appliances toindividual electrical components in industrial machinery. To facilitate readability andto follow the traditional naming of the �eld, we use the terms appliance and componentinterchangeably in the following to refer to the entity that is the target of the NILManalysis process.
Data acquisition NILM was initially developed to disaggregate load pro�les fromresidential environments [7]. As a result, most of the published datasets are from thisdomain [8]. To further transfer NILM techniques into the domain of condition monitoring,the need for a dataset to benchmark such algorithms arises. Currently, there is no high-sampling-rate dataset containing industrial components, such as motors and pumps, thatare triggered following a dedicated production process pattern.
3
1.3. APPROACH
Event detection In the �eld of NILM, various algorithms have been proposed to detectrelevant signal segments and state-changes in the high-sampling-rate voltage and currentwaveform [14, 15, 16, 17, 18, 19]. The existing algorithms are often tailored to a speci�csetting with a �xed appliance composition. Consequently, the algorithms need to bemanually adapted by human experts when being used in new environments, with apotentially dynamic appliance composition. Furthermore, there is no comprehensiveoverview of the existing approaches and no standard for evaluating the algorithmicperformance, making the algorithms hard to compare.
Appliance identi�cation Di�erent appliances have unique �ngerprints that are bestsuited to identify them [2, 20]. Traditional NILM approaches rely on manually derivedfeatures, that need to be �ned tuned for speci�c appliance compositions and settings.In contrast, neural network-based representation approaches promise to automaticallyextract features from the raw data, allowing the algorithms to generalise better withouthuman interference and manual �ne-tuning [21]. Thus, the adaption of such algorithmscan overcome the need for appliance speci�c feature engineering.
1.3 Approach
This dissertation presents multiple advancements along the complete analytical pipelineof NILM that have the potential to overcome the existing problems and challenges in the�eld.
Experimental results show, that NILM can be used for applications besides energydisaggregation, in particular, for monitoring industrial equipment [3, 11]. Most of theNILM algorithms have been developed with the purpose of disaggregating residentialload pro�les. In order to transfer these algorithms to an industrial setting for applications,such as condition monitoring, new datasets are necessary that contain industrial electricalcomponents. The usage of these components has to follow the patterns of a dedicatedproduction process. Thus, we introduce the co�eemaker electrical activity measurementsfor condition monitoring (CREAM) dataset. The dataset contains the fully-labelled ground-truth electrical signals of two industrial-grade co�eemakers with typical industrial
4
1. INTRODUCTION
electrical components. The purpose of this publicly available dataset is to provide abaseline for benchmarking condition monitoring algorithms on electrical signals, as itincludes over 370000 expert labelled electrical events and corresponding maintenanceand production process labels.
The event detection step is fundamental to all subsequent actions in the NILM pipelineon high-sampling-rate data, as it determines which signal segments are further processedfor appliance identi�cation and other applications. As outlined before, the existing eventdetection algorithms for NILM are developed and evaluated for speci�c, often not publiclyavailable environments [22]. In addition, the algorithms need to be tediously �ne-tunedwhen being transferred to another setting [22]. Furthermore, it is hard to comparethe wide variety of existing algorithms as they are often evaluated on non-public dataand use unknown parameters in the evaluation. We propose an unsupervised multi-environment event detector (MEED) for NILM to overcome the �rst issue [23]. Thisevent detector can identify relevant signal segments without human supervision in afully unsupervised way. At its heart, MEED relies on a denoising autoencoder modelwith bidirectional long short-term memory (LSTM) layers for encoding and decoding theinput. The only hyperparameter of MEED is a threshold on the mean-square-error (MSE)reconstruction error to determine events in the signal. This parameter is automatically setwith respect to the error produced at the end of the training procedure. We have releasedall source code of MEED to facilitate reproducibility. In addition to introducing MEED, wehave conducted an extensive literature review of the high-sampling-rate event detectionalgorithms for NILM to overcome the issues of reproducibility and comparability in the�eld [22]. Based on this review, we have re-implemented four of the state-of-the-artevent detection algorithms and evaluated them against MEED on two publicly availabledatasets, showing the superiority of MEED in event detection for NILM. To make ourapproach reproducible, we published all source code, including the four re-implementedapproaches, as open source.
Based on the detected events, one can determine the appliance that was responsible for therespective event by classifying the signal segments. Handcrafting features is a tedious task,that is dependent on the speci�c appliances that are used. The datasets in the �eld havea comparatively small number of samples per appliance type, making the classi�cationtask on high-sampling-rate data challenging, due to the curse-of-dimensionality. By
5
1.4. CONTRIBUTION
introducing a convolutional neural network (CNN) architecture, we show how the rawvoltage and current waveform can be used to automatically perform the classi�cationbased on the representation the network extracts from the raw input [24].
1.4 Contribution
With the goals of improving central aspects of the NILM analytical pipeline on theone hand and of facilitating the usage of NILM algorithms in industrial environmentsfor condition monitoring, on the other hand, this work presents new algorithms and anew dataset. In pursuit of achieving this, this dissertation includes the following maincontributions to the three steps of the analysis pipeline:
1. We introduce the co�eemaker electrical activity measurements for conditionmonitoring (CREAM) dataset to overcome the lack of datasets to benchmark NILMalgorithms on industrial components for advanced applications other than energydisaggregation. In particular, the dataset contains 370600 hand-labelled electricalevents and �ne-granular labels of manufactured products and maintenance actionstaken for two industrial-grade co�eemakers. The co�eemakers were selectedas they ful�l the requirements for a closed system in which industrial electricalcomponents, such as, for example, pumps and motors, are triggered according toa pre-de�ned manufacturing process to produce various products. The datasetcan be used to evaluate various algorithms, such as non-invasive condition moni-toring algorithms, component classi�cation techniques, and event detectors, on acomprehensive set of labels.
2. We present an unsupervised multi-environment event detector (MEED) that out-performs the existing state of the art in event detection on high-sampling-rateelectrical signals. The algorithm is fully unsupervised and requires no humanintervention when being used in multiple settings, such as residential and o�ceenvironments. Our approach lowers the amount of missed and falsely identi�edevents compared to the existing state of the art while generalising well betweendi�erent environments.
6
1. INTRODUCTION
3. We conduct an extensive review of the existing state of the art in event detectionfor high-sampling-rate NILM. By categorising the publications and distilling theevaluation criteria, we present an overview of algorithms that can be compared toeach other. Based on this, we identify shortcomings in the evaluation of the existingalgorithms and re-implement four state-of-the-art algorithms to evaluate themagainst our MEED algorithm. In addition, we make all source code publicly available,including the functions for evaluation, to overcome the issues of reproducibilityand comparability in the �eld.
4. We consider a new approach for performing appliance classi�cation on raw, high-dimensional voltage and current signals. The approach does not require hand-crafted, appliance speci�c feature engineering, as the CNN automatically extractsa suitable representation from the input. With the CNN based approach, weare able to achieve state-of-the-art results without dedicated feature engineering.In addition, we discuss possible data augmentation techniques to overcome theproblems resulting from the small datasets in the NILM �eld that arise when trainingdeep neural networks.
Parts of the content and contributions of this work have been accepted and published in:
• D. Jorde, T. Kriechbaumer, T. Berger, S. Zitzlsperger, and H.-A. Jacobsen. “CREAM, acomponent level co�eemaker electrical activity measurement dataset.” In: Scienti�cData (2020), accepted for publication on 15.10.2020
• D. Jorde, M. Kahl, and H.-A. Jacobsen. “MEED: An Unsupervised Multi-EnvironmentEvent Detector for Non-Intrusive Load Monitoring.” In: 2019 IEEE InternationalConference on Communications, Control, and Computing Technologies for Smart Grids(SmartGridComm). 2019, pp. 1–6. doi: 10.1109/SmartGridComm.2019.8909729
• D. Jorde and H.-A. Jacobsen. “Event Detection for Energy Consumption Mon-itoring.” In: IEEE Transactions on Sustainable Computing (2020), pp. 1–1. doi:10.1109/TSUSC.2020.3012066
7
1.5. ORGANIZATION
• D. Jorde, T. Kriechbaumer, and H.-A. Jacobsen. “Electrical Appliance Classi�cationusing Deep Convolutional Neural Networks on High Frequency Current Measure-ments.” In: 2018 IEEE International Conference on Communications, Control, andComputing Technologies for Smart Grids (SmartGridComm). 2018, pp. 1–6. doi:10.1109/SmartGridComm.2018.8587452
The latter paper on appliance identi�cation [24] is based on the master thesis of the authorof this dissertation. The master thesis was supervised by Prof. Dr. Hans-Arno Jacobsenand advised by Dr. Thomas Kriechbaumer and is entitled "Identi�cation of IndividualElectronic Appliances in High Frequency Energy Data using an Arti�cial Neural NetworkApproach". The thesis was submitted on the 12th of March 2018.
1.5 Organization
This dissertation is organised as follows. Chapter 2 presents the background to relevanttopics and our methodology for improving the existing state of the art along the NILManalytical pipeline. Chapter 3 presents a short summary of the publications that thisthesis comprises. In particular, we describe the main achievements of each paper andhighlight the author’s contributions. We have attached the respective publications tothis thesis in the Appendices A, B, C, and D. In Chapter 4, we discuss the results and ourcontributions to NILM in the larger context of the �eld. Chapter 5 concludes this thesis.
8
2
Methodology
This chapter gives an overview of the Non-Intrusive Load Monitoring (NILM) methodol-ogy, that is applied to disaggregate electrical signals in this thesis. In the �rst Section 2.1,we provide an overview of the analysis pipeline and the general setup of Non-IntrusiveLoad Monitoring techniques. In Section 2.2, we give an overview of data acquisitionsystems that are used to collect the data that is processed by the NILM algorithms. Inparticular, we describe the hardware used to collect the CREAM dataset in detail. In thesubsequent Section 2.3, we introduce the datasets that are used in this thesis to evaluatethe developed algorithms. The commonly used metrics to evaluate NILM algorithms arethen described in Section 2.4. Most of the NILM algorithms rely on the computation offeatures from the raw voltage and current signals. Hence, we describe commonly usedfeatures in Section 2.5. We then concluded this chapter by giving an overview of machinelearning methodologies applied to the electrical signals and features in Section 2.6.
2.1 Non-Intrusive Load Monitoring
When monitoring the electrical load of individual electrical components, or appliances,one can take two approaches. One can either intrusively attach sensors to each componentto measure the power consumption, or one can use a single sensor to measure the
9
2.1. NON-INTRUSIVE LOAD MONITORING
consumption of multiple components at the same time and apply intelligent algorithmsto separate the aggregate signal into the individual component signals afterwards [7].The amount of sensors used and the ease of monitoring the individual component’spower consumption represents a trade-o�. The intrusive placement of sensors introducescosts, such as for the acquisition and maintenance of the sensors, and is not feasible insome cases, due to the character and locations of individual components [1, 7]. The Non-Intrusive Load Monitoring methodology was introduced to reduce the number of sensorsused by disaggregating the aggregate consumption of multiple components measured bya single sensor [1, 7].
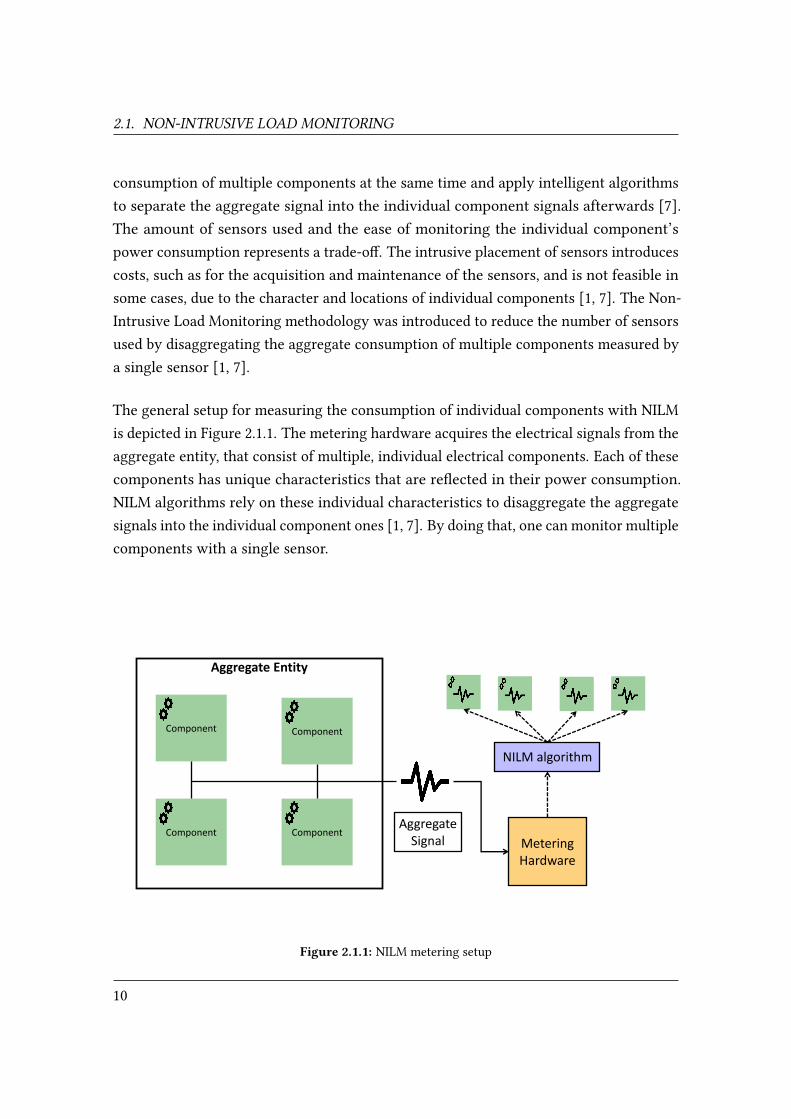
The general setup for measuring the consumption of individual components with NILMis depicted in Figure 2.1.1. The metering hardware acquires the electrical signals from theaggregate entity, that consist of multiple, individual electrical components. Each of thesecomponents has unique characteristics that are re�ected in their power consumption.NILM algorithms rely on these individual characteristics to disaggregate the aggregatesignals into the individual component ones [1, 7]. By doing that, one can monitor multiplecomponents with a single sensor.
MeteringHardware
Component
Component
Component
ComponentAggregate
Signal
NILM algorithm
Aggregate Entity
Figure 2.1.1: NILM metering setup
10
2. METHODOLOGY
NILM was originally introduced by Hart [7] to monitor residential appliances based on theaggregate consumption of a residential home. Referring to the terminology introducedbefore in Figure 2.1.1, each component is an electrical appliance, and the aggregate entityis a residential home. The metering hardware is then installed at the electrical mainsof the house to monitor the aggregate signal of the house. After applying the NILMalgorithms, one obtains the detailed consumption information for each of the appliances,such as typical household appliances like fridges. By analysing the aggregate voltage andcurrent recorded by a load monitor, Hart determines the turn-on and switch o� momentsof each appliance and their power consumption [7].
Other settings than the residential one, are, for example, industrial machinery or vessels.In the case of industrial machinery, the aggregate entity can be a complete machineconsisting of electrical components, such as heaters, pumps, and motors.
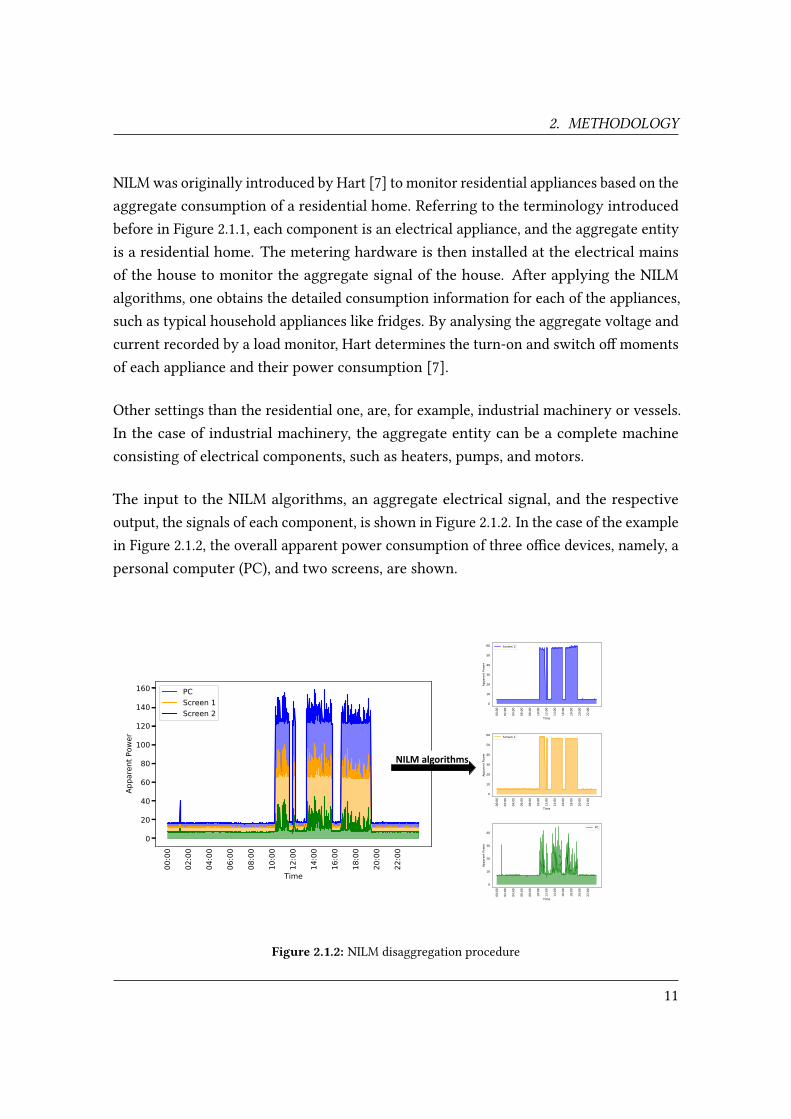
The input to the NILM algorithms, an aggregate electrical signal, and the respectiveoutput, the signals of each component, is shown in Figure 2.1.2. In the case of the examplein Figure 2.1.2, the overall apparent power consumption of three o�ce devices, namely, apersonal computer (PC), and two screens, are shown.
NILM algorithms
Figure 2.1.2: NILM disaggregation procedure
11
2.1. NON-INTRUSIVE LOAD MONITORING
Hart also derived a load model that describes the underlying problem of NILM. Thecentral idea behind this model is the parallel wiring of the components to be monitored.Consequently, the power the components consume is additive (to a �rst order approxi-mation) [7], resulting in the following equation for the aggregate power consumption attime t [7]:
P (t) =n∑i=1ai(t)Pi + e(t) (2.1.1)
The load of each component i when it is operating is modelled as a vector Pi . The errorterm e(t) represents the existing background noise and other errors. The boolean vectora(t) describes the state of the aggregate system at time t . When a component is activatedat time t , the vector has an 1 entry at index i [7].
Finding the correct combination of components that results in the aggregate powerconsumption measured, is an NP-complete "weighted set problem" [7]. Thus, variousheuristics and machine learning based algorithms have been designed to solve the problemand to determine the correct vector a(t) of activated and inactivated components for acertain time t [1, 7].
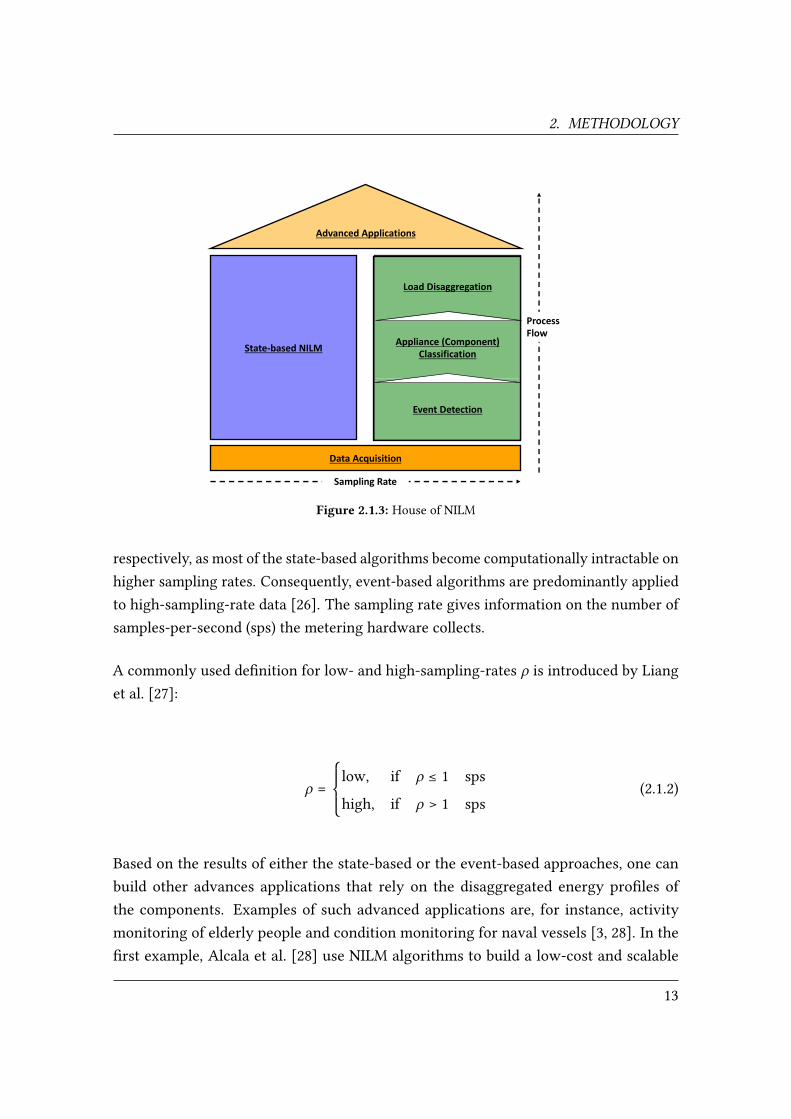
The wide variety of NILM algorithms can be divided into two sets: state-based (i.e., non-event based) NILM algorithms and event-based ones [26]. State-based algorithms aim todisaggregate the electrical signal into the individual components directly. In contrast,event-based algorithms rely on separating relevant and irrelevant signal segments beforedetermining the appliance status. Event-based algorithms detect state-changes of thecomponents in the signal. Thus, the event-based NILM algorithms consist of multiple-steps: the detection of events, the identi�cation of the component that is responsiblefor the event, and then the disaggregation of the aggregate signal [17]. The completeanalysis pipeline is depicted in Figure 2.1.3.
The precondition of NILM algorithms is the data acquisition, that is usually done usingsmart meter devices or other dedicated hardware solutions for measuring the electrical sig-nals. The two types of NILM algorithms are applied to data with di�erent sampling rates,
12
2. METHODOLOGY
State-based NILM Appliance (Component) Classification
Load Disaggregation
Event Detection
Advanced Applications
Data Acquisition
Sampling Rate
ProcessFlow
Figure 2.1.3: House of NILM
respectively, as most of the state-based algorithms become computationally intractable onhigher sampling rates. Consequently, event-based algorithms are predominantly appliedto high-sampling-rate data [26]. The sampling rate gives information on the number ofsamples-per-second (sps) the metering hardware collects.
A commonly used de�nition for low- and high-sampling-rates � is introduced by Lianget al. [27]:
� =⎧⎪⎪⎨⎪⎪⎩
low, if � ≤ 1 sps
high, if � > 1 sps(2.1.2)
Based on the results of either the state-based or the event-based approaches, one canbuild other advances applications that rely on the disaggregated energy pro�les ofthe components. Examples of such advanced applications are, for instance, activitymonitoring of elderly people and condition monitoring for naval vessels [3, 28]. In the�rst example, Alcala et al. [28] use NILM algorithms to build a low-cost and scalable
13
2.2. DATA ACQUISITION
activity monitoring system. A NILM algorithm determines the activity of people basedon the appliances that are active at certain moments in time. By doing so, the authors areable to �nd deviations from normal in the monitored people’s behaviour that can be usedto improve health-care services [28]. In the second example, Lindahl et al. [3] show theusage of disaggregated electrical load pro�les to perform fault detection in naval vesselsby analysing the health condition of the respective machinery in a non-intrusive way [3].
In contrast to small sampling rates (� ≤ 1), higher ones posses several advantages, suchas the possibility to disaggregate more and even smaller components from the aggregatesignal [6]. Furthermore, more features can be extracted from the high-sampling-ratedata. In particular, frequency-based features, such as, for example, harmonics, need aminimum sampling rate to compute them. Due to these advantages and the gaps in theresearch on high-sampling-rate NILM, this thesis focuses on this domain. Consequently,we discuss event-based algorithms in more detail than state-based ones.
2.2 Data Acquisition
The data the NILM algorithms process can be acquired using a wide variety of electricalmeters. Depending on their sampling rate capabilities, the meters can be classi�edas low-frequency energy meters or high-frequency meters. The features and signalcharacteristics that can be extracted from the electrical signals depend on the samplingrate. As an example, higher-order harmonics can only be extracted from high-sampling-rate signals full-�lling the Nyquist-Shannon sampling criteria [1]. In a comprehensivestudy, ul Haq and Jacobsen [29] analysed the capabilities of o�-the-shelf electrical meters.They show that more than 80% of the investigated hardware has a maximum samplingrate of 1 sps. Only a minority of the measurement devices provides sampling rates in therange of multiple thousands of samples-per-second [29]. High-sampling-rate data possessadvantages over lower sampling rates, as it increases the capabilities for successful NILMin settings with multiple devices [6]. On the other hand, the acquisition of such high-sampling-rate poses various challenges, such as the storage of the data [8]. To solvethe challenge of acquiring high-sampling-rate signals for appliances, Kriechbaumer etal. [30] designed the low-cost Mobile Energy Data Acquisition Laboratory (MEDAL). In
14
2. METHODOLOGY
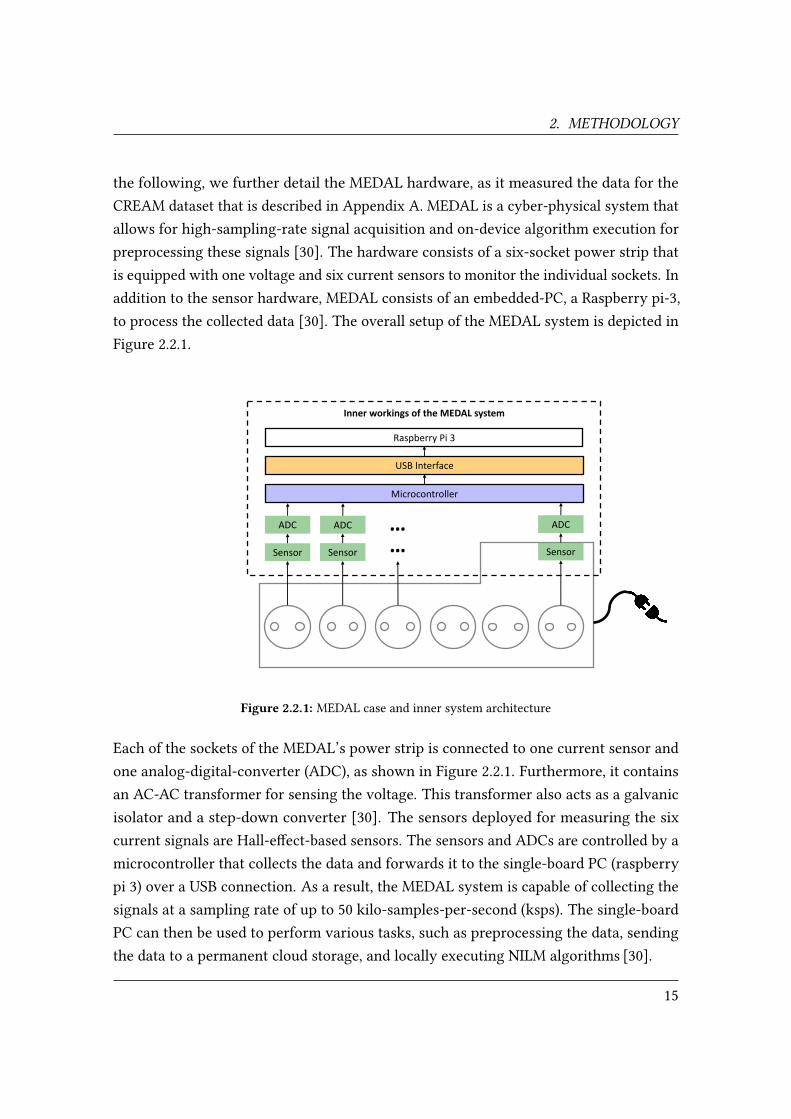
the following, we further detail the MEDAL hardware, as it measured the data for theCREAM dataset that is described in Appendix A. MEDAL is a cyber-physical system thatallows for high-sampling-rate signal acquisition and on-device algorithm execution forpreprocessing these signals [30]. The hardware consists of a six-socket power strip thatis equipped with one voltage and six current sensors to monitor the individual sockets. Inaddition to the sensor hardware, MEDAL consists of an embedded-PC, a Raspberry pi-3,to process the collected data [30]. The overall setup of the MEDAL system is depicted inFigure 2.2.1.
Raspberry Pi 3
Microcontroller
USB Interface
……Sensor
ADC
Sensor
ADC
Inner workings of the MEDAL system
Sensor
ADC
Figure 2.2.1: MEDAL case and inner system architecture
Each of the sockets of the MEDAL’s power strip is connected to one current sensor andone analog-digital-converter (ADC), as shown in Figure 2.2.1. Furthermore, it containsan AC-AC transformer for sensing the voltage. This transformer also acts as a galvanicisolator and a step-down converter [30]. The sensors deployed for measuring the sixcurrent signals are Hall-e�ect-based sensors. The sensors and ADCs are controlled by amicrocontroller that collects the data and forwards it to the single-board PC (raspberrypi 3) over a USB connection. As a result, the MEDAL system is capable of collecting thesignals at a sampling rate of up to 50 kilo-samples-per-second (ksps). The single-boardPC can then be used to perform various tasks, such as preprocessing the data, sendingthe data to a permanent cloud storage, and locally executing NILM algorithms [30].
15
2.3. DATASETS
2.3 Datasets
There are various publicly available datasets from di�erent research domains that arecommonly used to evaluate NILM-based algorithms. Most of the datasets have beencollected with a speci�c purpose, such as energy disaggregation, occupancy detection,demand prediction, and anomaly detection [31]. In the following, we describe the datasetsthat are used in this thesis. As the focus is on event-based NILM algorithms, the followingdatasets are all high-sampling-rate ones.
WHITED The Worldwide Household and Industry Transient Energy Dataset (WHITED) [32]contains isolated measurements of start-up moments of various appliance types. Theappliances were mostly recorded in multiple residential homes spread around the world.For each of the 110 appliances, multiple 5 second samples were recorded using a custom-designed low-cost sound card meter [32]. The sound card meter sampled WHITED at arate of 44 ksps with a 16 bit resolution ADC.
PLAID The Plug-Level Appliance Identi�cation Dataset (PLAID) [33] is available inmultiple-versions. The original version of the datasets contains the start-up moments of11 appliance classes, resulting in 1049 measurements. The dataset is sampled at 30 ksps.The appliances are residential ones, measured in 56 households in the USA [33].
BLUED In contrast to WHITED and PLAID that contain isolated appliance measure-ments, the Building Level fUlly-labeled dataset for Electricity Disaggregation (BLUED) [34]contains the aggregate power consumption of a US American home for one week. Thesignals of the two phases of the house are sampled at 12 ksps [17]. The aggregatemeasurements are complemented with turn-on and switch-o� events for all appliances.These events were recorded with plug-level power meters and light-intensity sensorsnear overhead lights. The two phases, phase A and B, contain 872 and 1548 eventsrespectively [17]. Looking at the appliances connected to each phase, one can see thatthe ones that are more complicated to disaggregate are connected to phase B. As theground-truth for this high-sampling-rate dataset is the most comprehensive one that ispublicly available, the BLUED dataset became the de-facto standard for evaluating eventdetection algorithms for NILM.
16
2. METHODOLOGY
BLOND The previously mentioned datasets are all recorded in residential environ-ments. The creators of the Building-Level O�ce eNvironment Dataset (BLOND) intendedto overcome this by making a high-sampling-rate, long-term dataset from an o�ceenvironment publicly available [8]. The dataset contains aggregate measurements of allthree phases of a German o�ce space. Furthermore, the authors used the previouslydescribed MEDAL [30] system to acquire the plug-level ground truth signals for everyappliance in the o�ce space [8]. The overall BLOND dataset is a composite of two parts:one dataset with the aggregate data being sampled at 50 ksps and another part with itbeing sampled at 250 ksps [8].
Looking at the existing datasets, one can see that there is no high-sampling-rate datasetwith industrial components to benchmark NILM-based algorithms. Hence, we havecreated the CREAM dataset that is described in Appendix A to overcome this shortcoming.
2.4 Performance Metrics
When evaluating event-based NILM algorithms, several metrics are commonly used.Most of them are based on the values of the confusion matrix between ground-truthand predicted values [17, 35]. The confusion matrix contains the counts of samples thatare True Positive (TP), False Positive (FP), True Negative (TN), and False Negative (FN).Based on these scores, one can compute the following metrics, that are also commonlyused in other machine learning application areas:
precision = TPTP + FP recall = TP
TP + FN FPR = FPFP + TN (2.4.1)
FPP = FPTP + FN F1-Score = 2 × recall × precision
recall + precision
For the evaluation of event detection algorithms, it is necessary to de�ne the determinationof the confusion matrix scores precisely. In the related literature, researchers applieddi�erent procedures to compute the respective scores [17, 35, 36]. As events can spread
17
2.5. ELECTRICAL FEATURES
over a longer time frame than a single point in time, a certain tolerance in time is requiredto determine correctly classi�ed events. Furthermore, the tolerance limit � is required asthe event labels in commonly used datasets can be imprecise, due to their often manualgeneration. Thus, for event detection algorithms, a true-positive event is a detected eventd that lies in temporal proximity of a ground truth event g, such that:
∃g ∶ d − � ≤ g ≤ d + � (2.4.2)
When evaluating appliance (component) classi�cation algorithms with multiple classes,the metrics for the overall performance for the classes in the dataset is computed bytaking the unweighted average of all per-class scores [37]. In particular, each metric iscalculated for every class individually �rst, before averaging them. In case there is a largeclass imbalance or if the misclassi�cation of one class is more severe then the one ofothers, one can weight the individual scores with a factor before averaging them.
2.5 Electrical Features
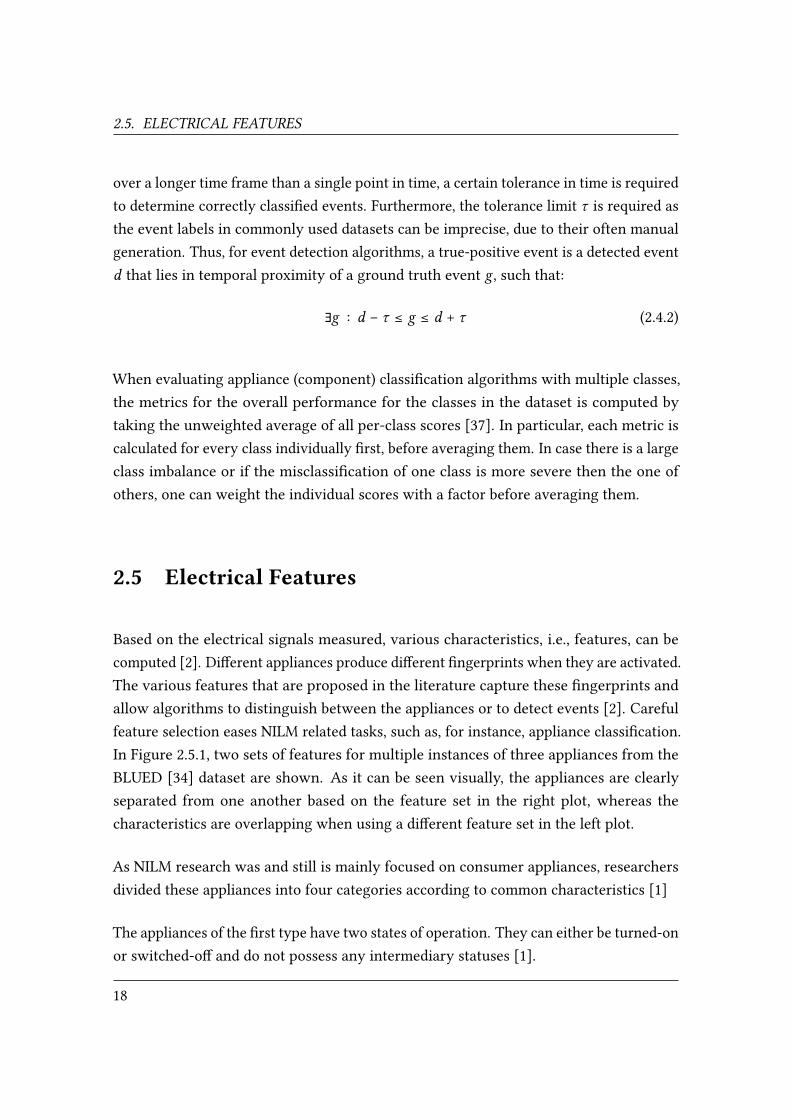
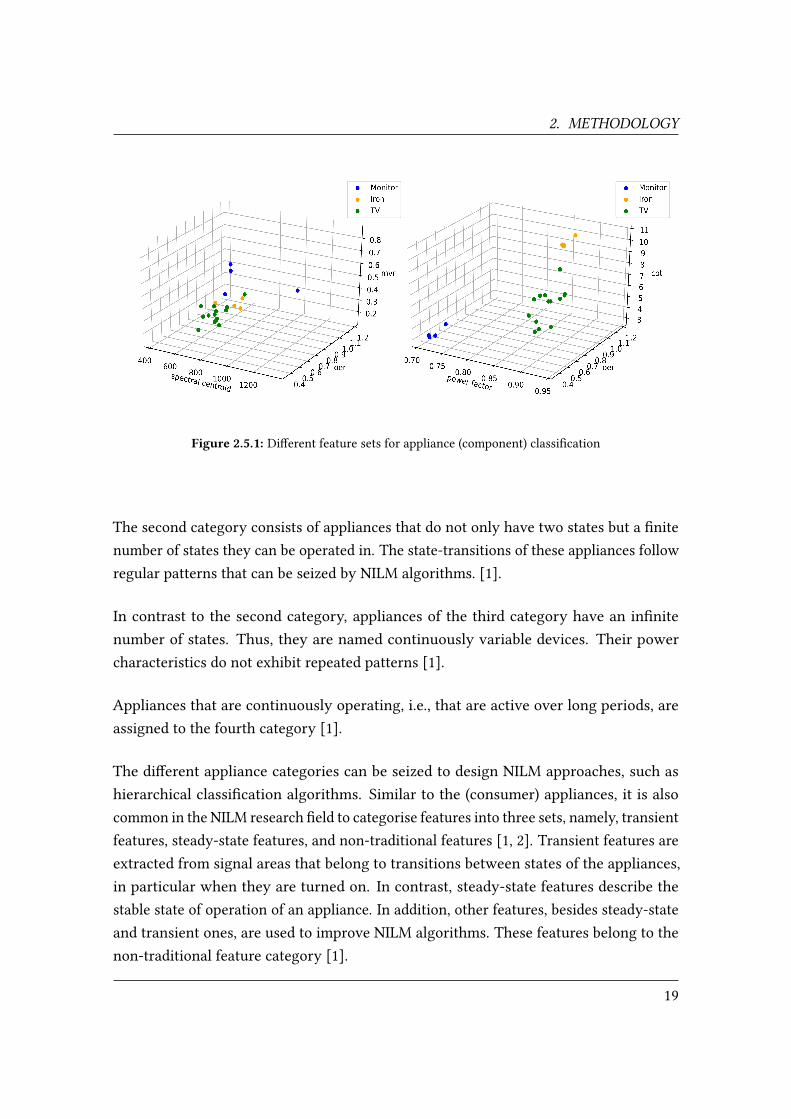
Based on the electrical signals measured, various characteristics, i.e., features, can becomputed [2]. Di�erent appliances produce di�erent �ngerprints when they are activated.The various features that are proposed in the literature capture these �ngerprints andallow algorithms to distinguish between the appliances or to detect events [2]. Carefulfeature selection eases NILM related tasks, such as, for instance, appliance classi�cation.In Figure 2.5.1, two sets of features for multiple instances of three appliances from theBLUED [34] dataset are shown. As it can be seen visually, the appliances are clearlyseparated from one another based on the feature set in the right plot, whereas thecharacteristics are overlapping when using a di�erent feature set in the left plot.
As NILM research was and still is mainly focused on consumer appliances, researchersdivided these appliances into four categories according to common characteristics [1]
The appliances of the �rst type have two states of operation. They can either be turned-onor switched-o� and do not possess any intermediary statuses [1].
18
2. METHODOLOGY
Figure 2.5.1: Di�erent feature sets for appliance (component) classi�cation
The second category consists of appliances that do not only have two states but a �nitenumber of states they can be operated in. The state-transitions of these appliances followregular patterns that can be seized by NILM algorithms. [1].
In contrast to the second category, appliances of the third category have an in�nitenumber of states. Thus, they are named continuously variable devices. Their powercharacteristics do not exhibit repeated patterns [1].
Appliances that are continuously operating, i.e., that are active over long periods, areassigned to the fourth category [1].
The di�erent appliance categories can be seized to design NILM approaches, such ashierarchical classi�cation algorithms. Similar to the (consumer) appliances, it is alsocommon in the NILM research �eld to categorise features into three sets, namely, transientfeatures, steady-state features, and non-traditional features [1, 2]. Transient features areextracted from signal areas that belong to transitions between states of the appliances,in particular when they are turned on. In contrast, steady-state features describe thestable state of operation of an appliance. In addition, other features, besides steady-stateand transient ones, are used to improve NILM algorithms. These features belong to thenon-traditional feature category [1].
19
2.5. ELECTRICAL FEATURES
When extracting features, especially transient ones, this is done based on a fundamentalassumption on appliance behaviour that was introduced by Hart in his seminal paper onNILM, namely, the Switching-Continuity-Principle (SCP) [7, 38]. This principle statesthat, in a small time interval, only up to one component (appliance) changes its state.Depending on the setting and the appliance composition, the SCP should only be rarelyviolated [38]. Based on the SCP, one can compute an appliance �ngerprint, in particular,based on the state-transitions, that belongs to only one individual appliance.
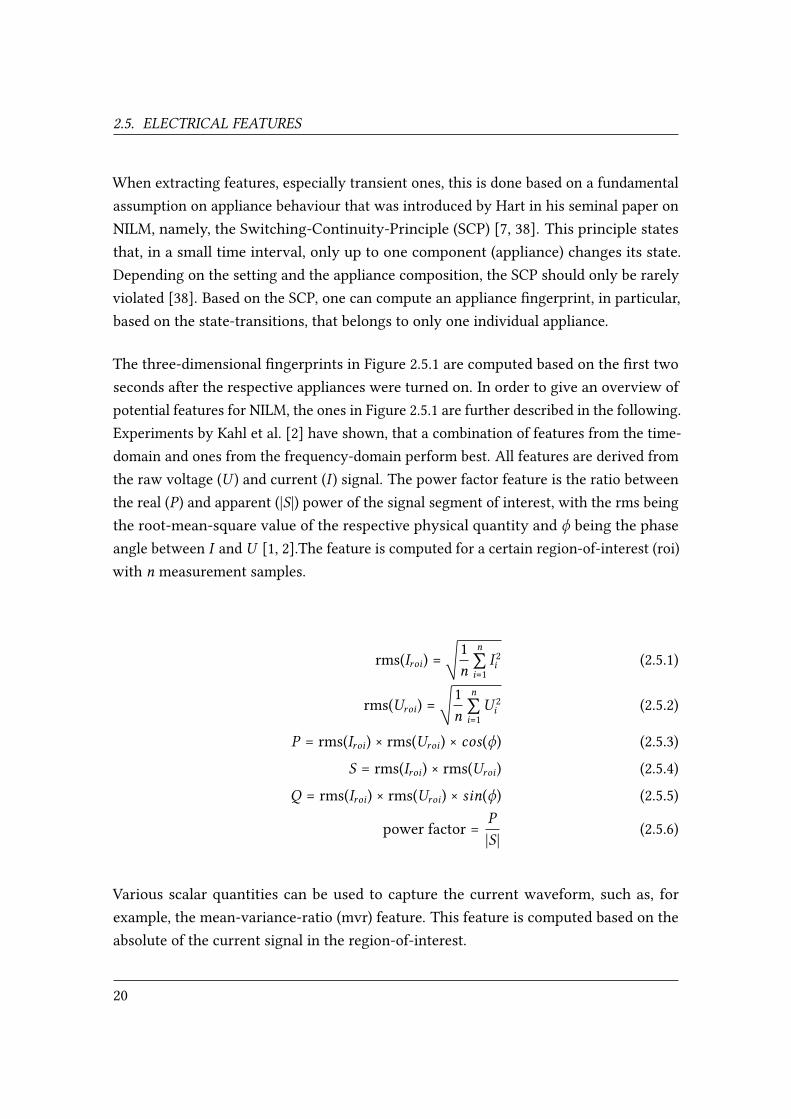
The three-dimensional �ngerprints in Figure 2.5.1 are computed based on the �rst twoseconds after the respective appliances were turned on. In order to give an overview ofpotential features for NILM, the ones in Figure 2.5.1 are further described in the following.Experiments by Kahl et al. [2] have shown, that a combination of features from the time-domain and ones from the frequency-domain perform best. All features are derived fromthe raw voltage (U ) and current (I ) signal. The power factor feature is the ratio betweenthe real (P ) and apparent (|S|) power of the signal segment of interest, with the rms beingthe root-mean-square value of the respective physical quantity and � being the phaseangle between I and U [1, 2].The feature is computed for a certain region-of-interest (roi)with n measurement samples.
rms(Iroi) =√1n
n∑i=1I 2i (2.5.1)
rms(Uroi) =√1n
n∑i=1U 2i (2.5.2)
P = rms(Iroi) × rms(Uroi) × cos(�) (2.5.3)S = rms(Iroi) × rms(Uroi) (2.5.4)
Q = rms(Iroi) × rms(Uroi) × sin(�) (2.5.5)
power factor = P|S| (2.5.6)
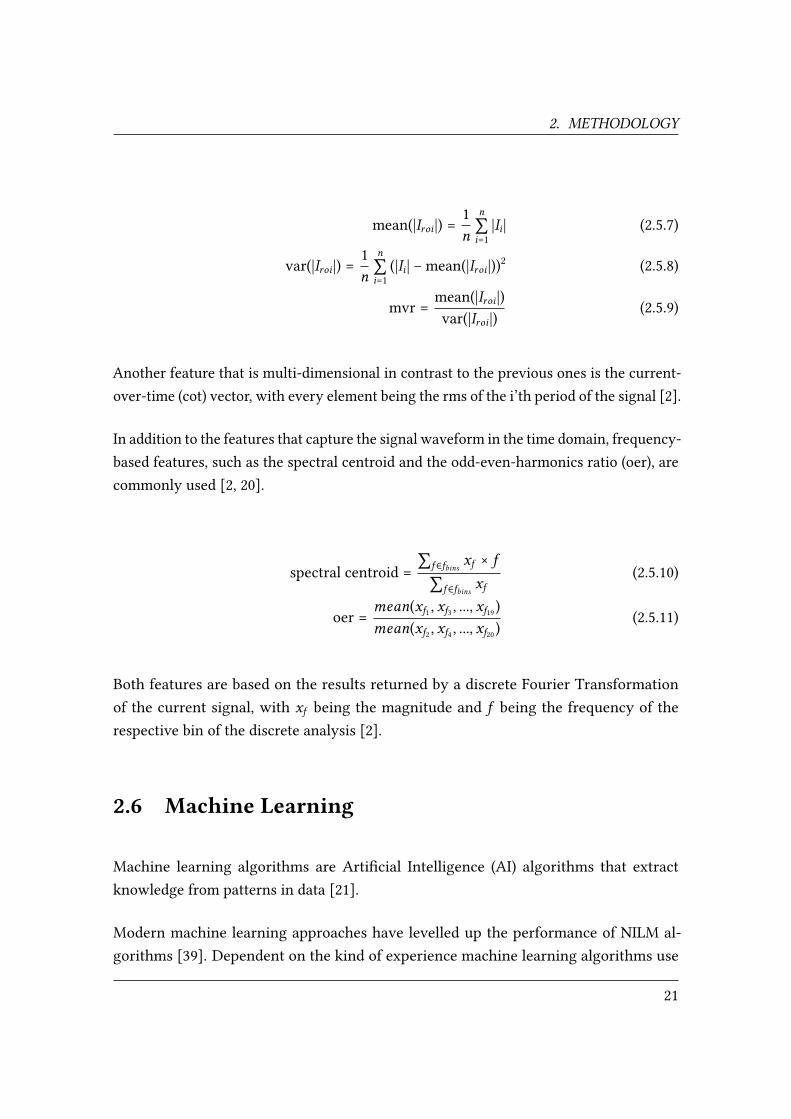
Various scalar quantities can be used to capture the current waveform, such as, forexample, the mean-variance-ratio (mvr) feature. This feature is computed based on theabsolute of the current signal in the region-of-interest.
20
2. METHODOLOGY
mean(|Iroi |) =1n
n∑i=1
|Ii | (2.5.7)
var(|Iroi |) =1n
n∑i=1(|Ii | − mean(|Iroi |))2 (2.5.8)
mvr = mean(|Iroi |)var(|Iroi |)
(2.5.9)
Another feature that is multi-dimensional in contrast to the previous ones is the current-over-time (cot) vector, with every element being the rms of the i’th period of the signal [2].
In addition to the features that capture the signal waveform in the time domain, frequency-based features, such as the spectral centroid and the odd-even-harmonics ratio (oer), arecommonly used [2, 20].
spectral centroid = ∑f ∈fbins xf × f∑f ∈fbins xf
(2.5.10)
oer = mean(xf1 , xf3 , ..., xf19)mean(xf2 , xf4 , ..., xf20)
(2.5.11)
Both features are based on the results returned by a discrete Fourier Transformationof the current signal, with xf being the magnitude and f being the frequency of therespective bin of the discrete analysis [2].
2.6 Machine Learning
Machine learning algorithms are Arti�cial Intelligence (AI) algorithms that extractknowledge from patterns in data [21].
Modern machine learning approaches have levelled up the performance of NILM al-gorithms [39]. Dependent on the kind of experience machine learning algorithms use
21
2.6. MACHINE LEARNING
during learning, one can classify them into three categories: supervised- , unsupervised-,and semi-supervised learning algorithms [21]. Supervised machine learning techniquesrely on datasets that contain labels for each sample in the dataset. The learning algorithmuses these labels to di�erentiate between the individual classes in the datasets [21].In contrast to supervised learning algorithms, unsupervised techniques do not rely onlabelled data. Semi-supervised learning algorithms are a hybrid form of both, supervisedand unsupervised techniques, and rely on partially labelled data. In the NILM research�eld, a di�erent de�nition of supervised- and unsupervised-learning is frequently used [38,40]. Unsupervised NILM algorithms can be trained in a supervised-way, in the sense ofthe machine learning de�nition with labelled training data. The unsupervised natureof these algorithms does not refer to the use of labelled training data but refers to thenon-availability of prior knowledge of the appliances or components in the setting ofinterest [38, 40]. In particular, general models of the existing appliances and componentsare transferred to an unknown setting. Using the three learning categories from machinelearning, unsupervised NILM algorithms are semi-supervised machine learning algo-rithms [38]. Hence, one has to carefully look at the de�nition of the term unsupervisedthat is used in the respective publications. In this thesis, we use the classic machinelearning de�nition.
The representation of the data, i.e., the electrical signals, in�uences the performanceof machine learning algorithms. Good representations of the information in the datafacilitate the learning task [21]. The same dataset can be represented using variousfeature combinations, as it is shown in Figure 2.5.1. Instead of manually handcraftingfeatures to represent the data, one can also use machine learning algorithms to extract agood representation from the data automatically. In particular, deep learning techniquesare capable of building complex representations from simpler concepts that are distilledfrom the data [21]. Several challenges in machine learning have motivated the usageof deep neural networks (NN), such as, for example, the curse-of-dimensionality. Thisproblem refers to the circumstance that many problems become more di�cult when thedata is high-dimensional [21]. The high-frequency electrical signals used in this thesis toperform NILM related analysis tasks are high-dimensional and pose several challenges,such as an increase in computational complexity, to the machine learning algorithms.The application of NN to NILM problems is promising and increasingly adapted [39, 41,42]. Commonly used NN architectures and building blocks are fully-connected neural
22
2. METHODOLOGY
networks (FCNN), convolutional neural networks (CNN), and recurrent neural networks(RNN) [21]. These particular building blocks are used in di�erent variations in this thesis;thus, they are brie�y described in the following.
FCNN The fully-connected feedforward type of neural network aims to approximate afunction f ∗. In the case of a classi�er, for example for appliance classi�cation, the FCNNlearns the parameters Θ of the mapping function y = f (x ; Θ). In particular, the modelselects the parameters during learning that match the true, underlying function best [21].In the feedforward FCNN, the information passes without feedback connections fromthe input to the output of the network [21].
CNN Convolutional neural networks are designed to process data with a grid-liketopology [21]. Time series data, such as electrical signals, can be interpreted as a one-dimensional grid with samples at regular (time) intervals [21]. The network relies on themathematical convolution operation. Convolutional neural networks often apply poolinglayers to learn hierarchical representations of the input. In contrast to traditional, plainFCNNs, CNNs rely on parameter sharing to reduce the number of parameters [21].
RNN Recurrent neural networks are designed to process sequential data [21]. Hence,they are well suited to process the raw electrical signal time-series data. Throughparameter sharing over the time indices, RNNs are able to process variable-lengthsequences. For every (time) step in the sequence, RNNs produce an output. This outputis then combined with the input of the next time step. A special type of RNNs is thelong short-term memory (LSTM) cell network that relies on multiple gate mechanisms tocapture long-term dependencies from the sequential input [21].
In the next chapter, we summarise our NILM-related publications, showing how wecontribute new advancements to the �eld of NILM by using the previously describedneural network architectures.
23

3
Summary of Publications
In this chapter, we summarise the individual contributions of this publication-baseddissertation. In particular, we provide the key ideas and achievements and the author’scontribution to each of the four accepted peer-reviewed publications.The following sections are ordered bottom-up with respect to the analysis pipeline ofNILM. First, we describe the CREAM dataset for condition monitoring in Section 3.1.Subsequently, we introduce our event detector MEED in Section 3.2. This is followedby our extensive literature review and algorithmic benchmark of the state of the art inevent detection for NILM in Section 3.3. Finally, we conclude this chapter by providingthe details on our appliance identi�cation approach in Section 3.4.
25
3.1. CREAM, A COMPONENT LEVEL COFFEEMAKER ELECTRICAL ACTIVITYMEASUREMENT DATASET
3.1 CREAM, a component level co�eemaker electricalactivity measurement dataset
Reference: D. Jorde, T. Kriechbaumer, T. Berger, S. Zitzlsperger, and H.-A. Jacobsen.“CREAM, a component level co�eemaker electrical activity measurement dataset.” In:Scienti�c Data (2020), accepted for publication on 15.10.2020
Full-text version enclosed: Appendix A
Summary: Non-intrusive condition monitoring delivers insights into the internal statesof industrial machinery. By analysing electrical signals, non-intrusive load monitoringtechniques can be used to derive the conditions of electrical components.
We introduce the �rst publicly available dataset for analysing the electrical signals ofindustrial electrical components that follow a variety of pre-de�ned processes to outputvarious products. Based on these requirements, we have selected two industrial-gradeco�eemakers, as they resemble a closed system that mimics an industrial manufacturingprocess. The dataset contains the continuous voltage and current readings of theco�eemakers, sampled at 6400 samples-per-second with the MEDAL measurement deviceand additional ground-truth information. In particular, we provide 370600 expert-labelledelectrical events, 1734 product events, and 3646 maintenance-related events.
We have implemented labelling tools to annotate the raw electrical signals and to re�nethe ones that are automatically generated by the respective co�eemaker at a one-minutegranularity, i.e., the product- and maintenance events. All tools and related source codeare released to the public to enable researchers to further extend the dataset.
The dataset can be used to benchmark various analysis tasks, e.g. to monitor thecondition of the pumps, heaters, and motors of the co�eemakers. In addition, the datasetprovides the most extensive amount of labelled electrical events in the �eld at the time ofpublication that can be used to develop new event detection algorithms.
Author’s contributions: Conceived and recorded the dataset. Adjusted and imple-mented tools. Executed parts of the labelling. Wrote the paper.
26
3. SUMMARY OF PUBLICATIONS
3.2 MEED:AnUnsupervisedMulti-Environment EventDetector for Non-Intrusive Load Monitoring
Reference: D. Jorde, M. Kahl, and H.-A. Jacobsen. “MEED: An Unsupervised Multi-Environment Event Detector for Non-Intrusive Load Monitoring.” In: 2019 IEEE Inter-national Conference on Communications, Control, and Computing Technologies for SmartGrids (SmartGridComm). 2019, pp. 1–6. doi: 10.1109/SmartGridComm.2019.8909729
Full-text version enclosed: Appendix B
Summary: The fundamental step of high-sampling-rate NILM is the detection of state-transitions of appliances and components. Enabled by accurate detection, various appli-cations, such as appliance classi�cation and energy disaggregation, can be implemented.Existing algorithms for detecting such events rely on expert made pre-de�ned rulesand patterns to detect relevant signal segments. These algorithms are customised tospeci�c environments, preventing them from generalising well to other environmentswithout manually adapting them. We overcome this limitation by introducing a newunsupervised, multi-environment event detector (MEED). At its heart, the algorithmapplies a two-step procedure to detect the events with high-precision in time. In the�rst step, the cumulative sum of a window of the current signal is fed to a denoisingautoencoder. As the events are rare by nature compared to non-event segments, the modelparameters are �ne-tuned to reconstruct non-event windows. Based on this, we use anautomatically determined threshold on the reconstruction error to detect event windows.In the second step of MEED, we apply a peak-detection procedure to precisely locatethe events. We compare our approach to two state-of-the-art algorithms on the o�ce-environment BLOND and the residential BLUED dataset. We outperform the existingalgorithms on both environments with respect to the recall and precision metric whiletraining MEED fully unsupervised. In particular, no manual adaption of the algorithm isnecessary. We release all models and code to facilitate reproducibility.
Author’s contributions: Conceived, developed, and implemented the approach. De-vised optimisations. Conducted analysis and experimental evaluation. Wrote the paper.
27
3.3. EVENT DETECTION FOR ENERGY CONSUMPTION MONITORING
3.3 EventDetection for EnergyConsumptionMonitor-ing
Reference: D. Jorde and H.-A. Jacobsen. “Event Detection for Energy ConsumptionMonitoring.” In: IEEE Transactions on Sustainable Computing (2020), pp. 1–1. doi: 10.1109/TSUSC.2020.3012066
Full-text version enclosed: Appendix C
Summary: In the �eld of NILM, various approaches for detecting relevant signal seg-ments and events have been proposed. As there is no uni�ed standard for evaluatingthese algorithms, many are evaluated on non-public datasets and according to unclearcriteria, making them hard to compare. We conduct an extensive literature review onthe existing state of the art in event detection for high-sampling-rate NILM approaches.In particular, we categorise the relevant publications with respect to the approachesproposed and the evaluation methods applied. Consequently, we are able to identifyseveral publications that can be compared to each other when carefully investigating thedatasets and evaluation methods used. Besides, we also list all approaches that are hardto compare to each other.
Based on this literature review, we select four state-of-the-art algorithms to performan algorithmic benchmark. We re-implement these approaches as no publicly availablesource code exists. We evaluate the approaches on two publicly available, heterogeneousdatasets from di�erent environments, namely the BLUED and the BLOND dataset. Fur-thermore, we compare the four algorithms with our recently proposed fully unsupervised,multi-environment event detector (MEED), showing that MEED improves the existingstate of the art with respect to both precision and recall.
Author’s contributions: Conceived, developed, and implemented the algorithms andthe benchmark. Performed literature review. Conducted analysis and experimentalevaluation. Wrote the paper.
28
3. SUMMARY OF PUBLICATIONS
3.4 ElectricalApplianceClassi�cationusingDeepCon-volutionalNeuralNetworks onHigh FrequencyCur-rent Measurements
Reference: D. Jorde, T. Kriechbaumer, and H.-A. Jacobsen. “Electrical ApplianceClassi�cation using Deep Convolutional Neural Networks on High Frequency CurrentMeasurements.” In: 2018 IEEE International Conference on Communications, Control,and Computing Technologies for Smart Grids (SmartGridComm). 2018, pp. 1–6. doi:10.1109/SmartGridComm.2018.8587452
Full-text version enclosed: Appendix D
Summary: Appliance Identi�cation is the central step in the NILM analysis pipelinethat extracts the appliance level signal information that various applications, such asenergy disaggregation and occupancy detection, directly rely on. We propose a newapproach that can directly be used on raw high-dimensional electrical signals to performthe classi�cation task. Traditional approaches for appliance classi�cation on NILM arebuilt based on hand-crafted features to identify the devices. Studies have shown that theideal feature sets for identifying electrical appliances are speci�c to the type of appliancethat is investigated. Consequently, experts need to manually develop and select features,tailored to the appliance composition of the respective setting. We overcome this byproposing a NN architecture that automatically extracts a suitable representation fromthe raw signals. The NN consists of one-dimensional convolutional and correspondingpooling layers. In addition to the algorithm, we propose two data augmentation methodsto increase the training dataset size, to overcome the issue of small datasets in the �eld. Weevaluate our approach on two publicly-available datasets, namely WHITED and PLAID,and achieve F1-scores of 1 and 0.69 respectively without manual feature engineering.
Author’s contributions: Conceived, developed, and implemented the approach. De-vised optimisations. Conducted analysis and experimental evaluation. Wrote the paper.The approach is based on the author’s master thesis, entitled "Identi�cation of IndividualElectronic Appliances in High Frequency Energy Data using an Arti�cial Neural NetworkApproach" (submitted on the 12.03.2018 at the Technical University of Munich).
29

4
Discussion
In this chapter, we discuss our contributions and �ndings in the larger context of researchon NILM techniques for analysing electrical signals.
On industrial NILM NILM was originally developed to provide detailed energybreakdowns based on the disaggregation of the electrical mains power consumption ofprivate households [1, 6, 7]. Over the years, researchers transferred the methods to otherdomains, such as individual industrial components [43], monitoring o�ce buildings [8],monitoring elderly people by detecting occupancy in houses [28], and monitoring thecondition of naval vassals [3]. Fundamental for developing algorithms for these domainsis the availability of adequate datasets. Without publicly available datasets, in particular,when the source code of the algorithm is also not available, comparing algorithmsbecomes challenging and prone to errors. Already 25 years ago, researchers applied NILMtechniques to industrial components [43], but the main focus remained with residentialhouseholds. Recently, the interest in industrial applications increased, and Suzuki etal. [11] showed the applicability of NILM algorithms to monitor industrial equipment.The dataset the authors used to evaluate their approach is not publicly available. Thereare two publicly available datasets containing electrical signals of industrial componentsto the best of our knowledge, the laboratory-measured industrial load of appliancecharacteristic dataset (LILACD) [10] dataset and the one by Martins et al. [9]. The �rstdataset comprises several industrial components, such as, for example, motors, that
31
are measured isolated and when being activate simultaneously. The LILAC dataset isrecorded under laboratory conditions, and the switching-patterns of the componentsdoes not follow a dedicated process pattern. Instead, the components are activatedsystematically to cover di�erent combinations of them [10, 44]. The dataset is measuredat high-sampling-rates and contains 1302 samples. The second industrial dataset waspublished by Martins et al. [9]. The authors used smart metering hardware to recordthe electrical energy consumption of a poultry feed factory in Brazil. In this factory,pellets of ration for poultry are produced based on corn and soybeans [9]. The datasetincludes electrical components of heavy-machinery from the factory, namely pelletisers,exhaust fans and double pole contactors [9]. The smart meters output the measuredsignal parameters once per second, which is low-frequency according to the previousde�nition. Using this dataset, the authors show the disaggregation of the consumption ofthe heavy-machinery with a neural network-based approach [9]. In the larger context ofmonitoring the conditions of machinery as non-invasive as possible, Suzuki et al. [11] andLindahl et al. [3] have shown the usefulness of NILM techniques. Despite this, there is noextensive dataset with industrial electrical components that are activated to manufactureproducts according to dedicated patterns publicly available. In particular, there is nodataset that is sampled at high rates and that provides an extensive ground-truth ofelectrical events, manufactured products, and implemented maintenance actions of aclosed system that is suited for benchmarking algorithms. With the CREAM dataset,we have released such a dataset to overcome the aforementioned issues and to furtherfacilitate research on industrial applications of NILM algorithms. In addition to the usecase of condition monitoring, the CREAM dataset provides 370600 labelled electricalevents, making it the largest dataset in the �eld to be used for evaluating event detectionalgorithms.
On reproducibility in NILM Event detection is fundamental for all high-sampling-rate NILM applications to separate relevant signal segments from irrelevant ones. Inour literature review [22], we categorise the existing approaches for high-sampling-rateelectrical signals. Hence, we provide the �rst extensive overview of such algorithms inthe �eld. We �nd several critical problems that need to be overcome to further improvethe existing state of the art. First, the evaluation procedures for event detection needto be uni�ed. Besides the use of di�erent metrics, one can observe that commonlyused metrics, such as confusion matrix based ones, are not computed in a uniform way.
32
4. DISCUSSION
Researchers need to communicate evaluation methods and potential tolerance levels forcomputing true positive events more clearly. To make our approach reproducible andcomparable with future work, we have publicly released all source code, in particular,also the evaluation functions. In addition to the evaluation procedures themselves,many approaches are evaluated on small and non-public datasets, making a comparisonbetween the approaches di�cult [22]. Furthermore, there is no publicly-available codebase for state-of-the-art event detection algorithms in the �eld. Hence, we have publiclyreleased all re-implemented algorithms and our MEED event detector to facilitate thereproducible in the �eld. The problem of evaluating event detection algorithms is alsodiscussed in other publications, such as, in the paper by Pereira et al. [35]. The authorsempirically explore 23 performance metrics for event detection algorithms. The authorsconclude that domain-speci�c metrics are dataset dependent, making it hard to use themin cross-dataset evaluations. Furthermore, Pereira et al. state that it is important toclearly highlight the trade-o� between the classical machine learning-based metrics thatare based on the confusion matrix, such as recall, precision and F-measures [35]. Thisparticularly concerns recall and precision, as detectors that are optimised with respect toeither of them have a di�erent focus while potentially achieving similar F-scores [35]. Inboth publications on event detection, we discuss this and the drawbacks of focusing oneither precision or recall. In general, we agree with Pereira et al. [35] that new metricsare necessary to benchmark event detection algorithms. If such metrics become available,public source code and datasets are fundamental for evaluating new approaches againstthe existing state of the art with respect to the new metrics.
On the generalisability of NILM With our event detection approach MEED, wepresent an event detector that can be used in multiple environments for NILM withoutthe need for manual adaptions of the algorithms with respect to the setting [23]. Recently,researcher such as, for example, Kahl et al. [45] evaluated NILM algorithms across multiple-datasets to show their performance independent of speci�c datasets. The researchersaim to overcome the common practice of the �eld, namely the evaluation of algorithmson isolated datasets, and, thus, on speci�c appliance compositions. By introducing anevent detector that can be used in multiple environments, such as residential and o�ceones, we similarly aim to overcome the issue of algorithms that are only developed forspeci�c settings and appliance compositions. Besides the lack of generalisability betweenenvironments, NILM algorithms, such as, for appliance identi�cation, rely on feature sets
33
that are dependent on the appliances used, as shown in the feature study by Kahl et al. [2].We introduce an approach based on convolutional neural networks to circumvent manualfeature engineering by automatically extracting a good representation from the raw,high-dimensional waveforms [24]. Neural networks are well suited for representationlearning [21]. Thus, they also gained popularity in the �eld of NILM, as a number ofpublications relying on neural networks and the state-of-the-art results they achieveare indicating [39, 41, 42, 46, 47, 48, 49]. The increasing adoption of neural networkapproaches, similar to the ones in this dissertation, promises new advances in NILM, inparticular, regarding the ability of the algorithms to generalise between datasets andenvironments.
34
5
Conclusions
NILM algorithms harvest insights from electrical signals without intrusively attachingsensors to each consumer. The NILM analysis pipeline for high-sampling-rate datacomprises multiple steps, with event detection and appliance (component) identi�cationbeing the fundamental ones. This thesis presented multiple advancements along theanalysis pipeline, in particular, a new industrial component dataset, a new event detectionalgorithm, a survey and extensive benchmark of the existing state of the art in eventdetection for NILM, and a new appliance identi�cation algorithm. The algorithmsdeveloped in this dissertation reduce manual interference by a domain expert and alleviatethe e�ort of adapting them when being used in multiple, heterogeneous environments.
With the new dataset for condition monitoring on electrical signals, namely the CREAMdataset, we provide an extensive ground-truth for high-sampling-rate, industrial electricalsignals. CREAM is the �rst publicly available dataset that enables the evaluation ofNILM based condition monitoring algorithms. For doing so, the dataset provides 370600expert labelled electrical events, information on the components responsible for theseevents, and relevant manufacturing-related labels, such as products manufactured andmaintenance actions taken. In order to provide such a dataset, we have selected twodi�erent industrial-grade co�eemakers that closely resemble a manufacturing processwith electrical components, while being a closed and fully controllable system. By creatingand re�ning labels for this dataset, we provide full transparency on the components used,
35
the products created, and the maintenance actions taken for both co�eemakers. We haveadded a second co�eemaker to the dataset, as it further enables the implementation ofcomparative benchmarks. With the intention to facilitate reproducibility and to enableresearchers to extend the dataset if needed, we have publicly released all related sourcecode and tools.
The fundamental step of the NILM analysis pipeline is event detection. We improvethe current state of the art and further contribute an extensive literature review withalgorithm implementations to the �eld in this thesis. First, we introduce MEED, a newmulti-environment event detection algorithm that can be used fully unsupervised incontrast to the existing approaches. The algorithm can be used in di�erent environments,such as o�ces spaces and residential houses, without the need for manually adapting thealgorithm to the respective setting. We compare MEED to two re-implemented state-of-the-art algorithms on two publicly available datasets, outperforming them with respect tothe recall and precision metrics. A two-step procedure lies at the heart of the algorithm,with the �rst step being a window-based denoising autoencoder to detect event windows,and the second step being a peak-detection algorithm for precisely allocating the eventsin time.
Furthermore, we contribute to the �eld of event detection by providing a comprehensiveoverview and categorisation of the existing state of the art in NILM. Based on thisoverview, we identify research gaps and select four state-of-the-art algorithms to re-implement them. Subsequently, we evaluate these algorithms against our MEED algorithmon two publicly available datasets. By releasing the source code of the algorithms andthe evaluation to the public, we aim to provide a reusable library for evaluating newalgorithms.
Appliance identi�cation is the step following the detection of events in the electrical signal.The output of the appliance identi�cation algorithms is the identi�cation of the electricalconsumer that is responsible for a certain event. Traditionally, manually engineeredfeatures are computed for a window around the event that captures the state of theappliance responsible for the event. These hand-crafted appliance signatures are custom-tailored to speci�c appliance types and settings. Thus, they require interference by domainexperts. We introduce a new approach that uses the raw voltage and current waveform
36
5. CONCLUSIONS
to extract a suitable representation and perform the classi�cation task automatically. Weovercome the challenge of the high-dimensional input and the comparatively small datasetsizes by introducing two data-augmentation techniques. By evaluating the approach ontwo publicly available datasets, namely the WHITED and the PLAID dataset, we achievestate-of-the-art results while avoiding manual feature engineering.
In the course of our work, we have identi�ed several aspects that may be targeted infuture work. We think that pursuing the following research directions has the potentialto further promote the �eld of NILM and the adaption of the algorithms in the industry:
More focus on applications other than energy disaggregation Energy disaggre-gation, in particular, on low-sampling-rate data has matured to a certain extend. Thepast research has mainly focused on energy disaggregation, while other applicationareas, such as occupancy detection and monitoring the conditions of industrial electricalequipment, were not pursued as much. Recent publications have shown the potentialof NILM, in particular, for analysing industrial equipment, in a non-invasive way [11].Thus, NILM research on other applications areas is promising.
More datasets from di�erent domains Most of the existing datasets for NILM areacquired at residential households. Only recently, a few datasets from other domains,such as, for example, o�ce ones have been released. To further pursue the adaption ofNILM techniques in other application areas, more publicly-available datasets from otherdomains are necessary to develop and evaluate the corresponding algorithms.
Uni�cation of themethods for evaluating event detectionmethods While thereare e�orts to unify the evaluation metrics and methods for event detection algorithms inNILM, the publications in the �eld still use heterogeneous evaluation approaches. Usingcommon metrics, or even a common code-based for evaluating high-sampling-rate eventdetection methods for NILM bears the chance to further advance the �eld.
More usage of publicly available datasets and source code Similar to the uni�ca-tion of the methods for evaluating event detection algorithms, the increasing usage ofpublicly-available datasets for evaluating the algorithms enables new ways to reproducethe research and to compare new algorithms with existing ones. Furthermore, only a fewsource code repositories for corresponding publications on NILM exist currently. Most of
37
the code released is on low-sampling-rate NILM, such as the NILM toolkit (NILMTK) [50].More publicly-available source code would enable more transparent benchmarks withnew algorithms, analogous to the use of public data.
Moving away from the standalone claim of NILM Most of the existing work onNILM focuses on the standalone usage of NILM algorithms for energy disaggregationand other applications and does not seize side-channel information, despite such featuresbeing mentioned in various publications [1, 51]. We are convinced that, in particularin an industrial setting, other sensor information than electrical signals can be used toimprove the insights into machine conditions. Electrical signals deliver a straightforward,non-invasive mean for collecting information on machinery, but under certain conditions,intrusive sensors can be applicable and improve the results of NILM.
38


Glossary
ADC analog-digital-converter
AI Arti�cial Intelligence
BLOND Building-Level O�ce eNvironment Dataset
BLUED Building Level fUlly-labeled dataset for Electricity Disaggregation
CNN Convolutional Neural Network
cot current-over-time
CREAM Co�eemakeR Electrical Activity Measurements
FCNN Fully-Connected Neural Network
FN False Negative
FP False Positive
LSTM Long Short-Term Memory
MEDAL Mobile Energy Data Acquisition Laboratory
MEED Multi-Environment Event Detector
NILM Non-Intrusive Load Monitoring
NILMTK Non-Intrusive Load Monitoring Toolkit
NN Neural Network
41
Glossary
oer odd-even-harmonics ratio
PC personal computer
PLAID Plug-Level Appliance Identi�cation Dataset
rms root-mean-square
RNN Recurrent Neural Network
roi region-of-interest
SCP Switching-Continuity-Principle
TN True Negative
TP True Positive
WHITED Worldwide Household and Industry Transient Energy Dataset
42
List of Figures
2.1.1 NILM metering setup . . . . . . . . . . . . . . . . . . . . . . . . . . 102.1.2 NILM disaggregation procedure . . . . . . . . . . . . . . . . . . . . . 112.1.3 House of NILM . . . . . . . . . . . . . . . . . . . . . . . . . . . . . . 132.2.1 MEDAL case and inner system architecture . . . . . . . . . . . . . . 152.5.1 Di�erent feature sets for appliance (component) classi�cation . . . . 19
43

Bibliography
[1] A. Zoha, A. Gluhak, M. A. Imran, and S. Rajasegarar. “Non-Intrusive Load Monitoring Approachesfor Disaggregated Energy Sensing: A Survey.” In: Sensors 12.12 (2012), pp. 16838–16866. doi:10.3390/s121216838.
[2] M. Kahl, A. Ul Haq, T. Kriechbaumer, and H.-A. Jacobsen. “A Comprehensive Feature Study forAppliance Recognition on High Frequency Energy Data.” In: Proceedings of the Eighth InternationalConference on Future Energy Systems. (Shatin, Hong Kong). New York, NY, USA: ACM, 2017, pp. 121–131. doi: 10.1145/3077839.3077845.
[3] P. A. Lindahl, D. H. Green, G. Bredariol, et al. “Shipboard Fault Detection Through NonintrusiveLoad Monitoring: A Case Study.” In: IEEE Sensors Journal 18.21 (2018), pp. 8986–8995.
[4] European Commission. EU Energy in Figures. 2018. isbn: 978-92-76-08818-9.
[5] J. Kelly and W. J. Knottenbelt. “Does Disaggregated Electricity Feedback reduce Domestic ElectricityConsumption? A Systematic Review of the Literature.” In: 3rd International Workshop on NILM. 2016,pp. 1–5. url: http://arxiv.org/abs/1605.00962 (visited on 06/06/2020).
[6] C. Armel, A. Gupta, G. Shrimali, and A. Albert. “Is Disaggregation the Holy Grail of Energy E�ciency?The Case of Electricity.” In: Energy Policy 52 (Jan. 2013), pp. 213–234.
[7] G. W. Hart. “Nonintrusive Appliance Load Monitoring.” In: Proceedings of the IEEE 80.12 (Dec. 1992),pp. 1870–1891.
[8] T. Kriechbaumer and H.-A. Jacobsen. “BLOND, a Building-Level O�ce Environment Dataset ofTypical Electrical Appliances.” In: Scienti�c Data 5.180048 (2018).
[9] P. B. M. Martins, J. G. R. C. Gomes, V. B. Nascimento, and A. R. de Freitas. “Application of a DeepLearning Generative Model to Load Disaggregation for Industrial Machinery Power ConsumptionMonitoring.” In: 2018 IEEE International Conference on Communications, Control, and ComputingTechnologies for Smart Grids (SmartGridComm). Aalborg: IEEE, Oct. 2018, pp. 1–6. doi: 10.1109/SmartGridComm.2018.8587415.
[10] M. Kahl, V. Krause, R. Hackenberg, et al. Measurement System and Dataset for in-depth Analysis ofAppliance Energy Consumption in Industrial Environment. https://www.in.tum.de/i13/resources/lilacd/. 2019.
45
BIBLIOGRAPHY
[11] R. Suzuki, S. Kohmoto, and T. Ogatsu. “Non-Intrusive Condition Monitoring for ManufacturingSystems.” In: 2017 25th European Signal Processing Conference (EUSIPCO). 2017, pp. 1390–1394.
[12] A. W. Colombo, S. Karnouskos, O. Kaynak, Y. Shi, and S. Yin. “Industrial Cyberphysical Systems: ABackbone of the Fourth Industrial Revolution.” In: IEEE Industrial Electronics Magazine 11.1 (2017),pp. 6–16.
[13] Condition Monitoring and Diagnostics of Machines — General Guidelines. Standard. Geneva, CH:International Organization, May 2018.
[14] T. Lu, Z. Xu, and B. Huang. “An Event-Based Nonintrusive Load Monitoring Approach: Using theSimpli�ed Viterbi Algorithm.” In: IEEE Pervasive Computing 16.4 (Oct. 2017), pp. 54–61.
[15] L. d. Baets, J. Ruyssinck, D. Deschrijver, and T. Dhaene. “Event Detection in NILM using CepstrumSmoothing.” In: 3rd International Workshop on NILM. May 2016, pp. 1–4. url: https : / /users.ugent.be/~didschri/papers/2016_05__NILM_Conf.pdf (visitedon 09/02/2020).
[16] J. M. Alcala, J. Urena, and A. Hernandez. “Event-based Detector for Non-Intrusive Load Monitoringbased on the Hilbert Transform.” In: Proceedings of the 2014 IEEE Emerging Technology and FactoryAutomation. Sept. 2014, pp. 1–4.
[17] K. D. Anderson, M. E. Berges, A. Ocneanu, D. Benitez, and J. M. F. Moura. “Event Detection for NonIntrusive Load Monitoring.” In: 38th Annual Conference on IEEE Industrial Electronics Society. Oct.2012, pp. 3312–3317.
[18] Y. Jin, E. Tebekaemi, M. Berges, and L. Soibelman. “Robust Adaptive Event Detection in Non-IntrusiveLoad Monitoring for Energy Aware Smart Facilities.” In: IEEE International Conference on Acoustics,Speech and Signal Processing. May 2011, pp. 4340–4343.
[19] K. S. Barsim and B. Yang. “Sequential Clustering-Based Event Detection for Non-Intrusive LoadMonitoring.” In: Proceedings of the 6th International Conference on Computer Science and InformationTechnology. Jan. 2016, pp. 77–85.
[20] N. Sadeghianpourhamami, J. Ruyssinck, D. Deschrijver, T. Dhaene, and C. Develder. “Comprehensivefeature selection for appliance classi�cation in NILM.” In: Energy and Buildings 151 (2017), pp. 98–106.doi: 10.1016/j.enbuild.2017.06.042.
[21] I. Goodfellow, Y. Bengio, and A. Courville. Deep learning. Cambridge, Massachusetts and London,England: MIT Press, 2016. url: http://www.deeplearningbook.org/.
[22] D. Jorde and H.-A. Jacobsen. “Event Detection for Energy Consumption Monitoring.” In: IEEE Trans-actions on Sustainable Computing (2020), pp. 1–1. doi: 10.1109/TSUSC.2020.3012066.
[23] D. Jorde, M. Kahl, and H.-A. Jacobsen. “MEED: An Unsupervised Multi-Environment Event Detectorfor Non-Intrusive Load Monitoring.” In: 2019 IEEE International Conference on Communications,Control, and Computing Technologies for Smart Grids (SmartGridComm). 2019, pp. 1–6. doi: 10.1109/SmartGridComm.2019.8909729.
46
BIBLIOGRAPHY
[24] D. Jorde, T. Kriechbaumer, and H.-A. Jacobsen. “Electrical Appliance Classi�cation using DeepConvolutional Neural Networks on High Frequency Current Measurements.” In: 2018 IEEE In-ternational Conference on Communications, Control, and Computing Technologies for Smart Grids(SmartGridComm). 2018, pp. 1–6. doi: 10.1109/SmartGridComm.2018.8587452.
[25] D. Jorde, T. Kriechbaumer, T. Berger, S. Zitzlsperger, and H.-A. Jacobsen. “CREAM, a componentlevel co�eemaker electrical activity measurement dataset.” In: Scienti�c Data (2020), accepted forpublication on 15.10.2020.
[26] Y. F. Wong, Y. Ahmet Sekercioglu, T. Drummond, and V. S. Wong. “Recent approaches to non-intrusive load monitoring techniques in residential settings.” In: IEEE Symposium on ComputationalIntelligence Applications in Smart Grid (CIASG 2013). IEEE, 2013, pp. 73–79.
[27] J. Liang, S. K. K. Ng, G. Kendall, and J. W. M. Cheng. “Load Signature Study—Part II. DisaggregationFramework, Simulation, and Applications.” In: IEEE Transactions on Power Delivery 25 (2 2010),pp. 561–569. doi: 10.1109/TPWRD.2009.2033800.
[28] J. Alcalá, J. Ureña, and Á. Hernández. “Activity supervision tool using Non-Intrusive Load MonitoringSystems.” In: 2015 IEEE 20th Conference on Emerging Technologies Factory Automation (ETFA). 2015,pp. 1–4.
[29] A. Haq and H.-A. Jacobsen. “Prospects of Appliance-Level Load Monitoring in O�-the-Shelf EnergyMonitors: A Technical Review.” In: Energies 11.1 (2018), p. 189. doi: 10.3390/en11010189.
[30] T. Kriechbaumer, A. Ul Haq, M. Kahl, and H.-A. Jacobsen. “MEDAL.” In: Proceedings of the EighthInternational Conference on Future Energy Systems. (Shatin, Hong Kong). New York, NY, USA: ACM,2017, pp. 216–221. doi: 10.1145/3077839.3077844.
[31] Y. Himeur, A. Alsalemi, F. Bensaali, and A. Amira. “Building power consumption datasets: Survey,taxonomy and future directions.” In: Energy and Buildings 227 (2020). doi: https://doi.org/10.1016/j.enbuild.2020.110404.
[32] M. Kahl, A. U. Haq, T. Kriechbaumer, and H.-A. Jacobsen. “Whited-a worldwide household andindustry transient energy data set.” In: 3rd International Workshop on Non-Intrusive Load Monitoring.(Vancouver, Canada). 2016.
[33] J. Gao, S. Giri, E. C. Kara, and M. Bergés. “PLAID. A Public Dataset of High-resolution ElectricalAppliance Measurements for Load Identi�cation Research: Demo Abstract.” In: Proceedings of the1st ACM Conference on Embedded Systems for Energy-E�cient Buildings. BuildSys’14. (Memphis, TN,USA). ACM. New York, NY, USA: ACM, 2014, pp. 198–199. doi:10.1145/2674061.2675032.
[34] K. D. Anderson, A. Ocneanu, D. Benitez, et al. “BLUED: A Fully Labeled Public Dataset for Event-based Non-Intrusive Load Monitoring Research.” In: Proceedings of the 2nd KDD Workshop on DataMining Applications in Sustainability. Jan. 2012, pp. 1–5.
[35] L. Pereira and N. Nunes. “An Experimental Comparison of Performance Metrics for Event De-tection a Algorithms in NILM.” In: 4th International Workshop on NILM. 2018. url: http://nilmworkshop.org/2018/proceedings/Paper_ID07.pdf (visited on 06/06/2020).
47
BIBLIOGRAPHY
[36] M. Valovage and M. Gini. “Label Correction and Event Detection for Electricity Disaggregation.”In: Proceedings of the 16th Conference on Autonomous Agents and MultiAgent Systems. May 2017,pp. 990–998.
[37] M. Kahl, T. Kriechbaumer, A. U. Haq, and H. Jacobsen. “Appliance classi�cation across multiple highfrequency energy datasets.” In: 2017 IEEE International Conference on Smart Grid Communications(SmartGridComm). 2017, pp. 147–152.
[38] S. Makonin. “Investigating the Switch Continuity Principle assumed in Non-Intrusive Load Moni-toring (NILM).” In: 2016 IEEE Canadian Conference on Electrical and Computer Engineering (CCECE).Piscataway, NJ, USA: IEEE, 2016, pp. 1–4. doi: 10.1109/CCECE.2016.7726787.
[39] J. Kelly and W. Knottenbelt. “Neural NILM.” In: Proceedings of the 2nd ACM BuildSys. New York NY:ACM, 2015, pp. 55–64. doi: 10.1145/2821650.2821672.
[40] O. Parson, S. Ghosh, M. Weal, and A. Rogers. “An unsupervised training method for non-intrusiveappliance load monitoring.” In: Arti�cial Intelligence 217 (2014), pp. 1–19. doi: https://doi.org/10.1016/j.artint.2014.07.010.
[41] H. Lange and M. Berges. “The Neural Energy Decoder: Energy Disaggregation by Combining BinarySubcomponents.” In: 3rd International Workshop on NILM. 2016.
[42] K. S. Barsim, L. Mauch, and B. Yang. “Neural Network Ensembles to Real-time Identi�cation ofPlug-level Appliance Measurements.” In: 3rd International Workshop on NILM. Vol. 2. 2016.
[43] S. B. Leeb, S. R. Shaw, and J. L. Kirtley. “Transient Event Detection in Spectral Envelope Estimates forNonintrusive Load Monitoring.” In: IEEE Transactions on Power Delivery 10.3 (July 1995), pp. 1200–1210.
[44] M. Kahl, V. Krause, R. Hackenberg, et al. “Measurement system and dataset for in-depth analysis ofappliance energy consumption in industrial environment.” In: tm - Technisches Messen 86.1 (2019).doi: https://doi.org/10.1515/teme-2018-0038.
[45] M. Kahl, T. Kriechbaumer, A. U. Haq, and H. Jacobsen. “Appliance classi�cation across multiple highfrequency energy datasets.” In: 2017 IEEE International Conference on Smart Grid Communications(SmartGridComm). 2017, pp. 147–152.
[46] P. Dash and K. Naik. “A Very Deep One Dimensional Convolutional Neural Network (VDOCNN)for Appliance Power Signature Classi�cation.” In: 2018 IEEE Electrical Power and Energy Conference(EPEC). Toronto, ON: IEEE, Oct. 2018, pp. 1–6. doi: 10.1109/EPEC.2018.8598355. (Visitedon 05/28/2019).
[47] P. Davies, J. Dennis, J. Hansom, et al. “Deep Neural Networks for Appliance Transient Classi�cation.”In: ICASSP 2019 - 2019 IEEE International Conference on Acoustics, Speech and Signal Processing(ICASSP). Brighton, United Kingdom: IEEE, May 2019, pp. 8320–8324. doi: 10.1109/ICASSP.2019.8682658. (Visited on 05/29/2019).
48
BIBLIOGRAPHY
[48] T.-T.-H. Le, J. Kim, and H. Kim. “Classi�cation performance using gated recurrent unit recurrentneural network on energy disaggregation.” In: 2016 International Conference on Machine Learningand Cybernetics (ICMLC). Jeju Island, South Korea: IEEE, July 2016, pp. 105–110. doi: 10.1109/ICMLC.2016.7860885. (Visited on 05/29/2019).
[49] M. Kaselimi, N. Doulamis, A. Doulamis, A. Voulodimos, and E. Protopapadakis. “Bayesian-optimizedBidirectional LSTM Regression Model for Non-intrusive Load Monitoring.” In: ICASSP 2019 - 2019IEEE International Conference on Acoustics, Speech and Signal Processing (ICASSP). Brighton, UnitedKingdom: IEEE, May 2019, pp. 2747–2751. doi: 10.1109/ICASSP.2019.8683110. (Visitedon 05/29/2019).
[50] N. Batra, J. Kelly, O. Parson, et al. “NILMTK.” In: Proceedings of the 5th international conference onFuture energy systems - e-Energy ’14 (2014). doi: 10.1145/2602044.2602051.
[51] N. Roux, B. Vrigneau, and O. Sentieys. “Improving NILM by Combining Sensor Data and LinearProgramming.” In: 2019 IEEE Sensors Applications Symposium (SAS) (2019), pp. 1–6. doi: 10.1109/SAS.2019.8706021.
49


Appendices
51
A. CREAM, A COMPONENT LEVEL COFFEEMAKER ELECTRICAL ACTIVITYMEASUREMENT DATASET
A CREAM, a component level co�eemaker electricalactivity measurement dataset
52
CREAM, a component level coffeemakerelectrical activity measurement dataset
Daniel Jorde 1, Thomas Kriechbaumer 1, Tim Berger 1,Stefan Zitzlsperger 1, Hans-Arno Jacobsen 1
October 26, 2020
1. Department of Computer Science, Chair for Application and Middle-ware Systems, Technical University of Munich, 85748 Garching, Germany. Cor-respondence and requests for materials should be addressed to D.J. (email:[email protected]).
Abstract
Monitoring the internal conditions of a machine is essential to increaseits production efficiency and to reduce energy waste. Non-intrusive con-dition monitoring techniques, such as analysing electrical signals, provideinsights by disaggregating a composite signal of a machine as a wholeinto the individual components to determine their states. Developingand evaluating new algorithms for condition monitoring and maintenance-related analysis tasks require a fully-labelled dataset for a machine, whichcomprises standard industrial components that are triggered following atypical manufacturing process to produce goods. For this purpose, weintroduce CREAM, a component level electrical measurement dataset fortwo industrial-grade coffeemakers, simulating industrial processes. Thedataset contains continuous voltage and current measurements providedat 6,400 samples per second, as well as the product and maintenance-related event labels, such as 370,600 expert-labelled component-level elec-trical events, 1,734 product ones and 3,646 maintenance ones. CREAMprovides fully-labelled ground-truth to establish a benchmark and compar-ative studies of manufacturing-related analysis in a controlled and trans-parent environment.
Background & SummaryRecent advances in artificial intelligence and the increasing implementation ofmodern cyber-physical systems in the manufacturing industry constitute thebackbone of a new industrial revolution [1]. The monitoring of current con-ditions and internal states of industrial machines is fundamental to increasethe production and energy efficiency [3]. The placement of sensors, to obtain
(c) Author's version of the accepted (15.10.2020) and soon to be published article: CREAM, a component level coffeemaker electrical activity measurement dataset, Scientific Data, Springer Nature
detailed information about the behaviour of the machine’s individual compo-nents, is fundamental in the condition monitoring (CM) process [3]. Instead ofintrusively measuring each component of a machine individually, an aggregatedsignal for multiple components can be considered. In a subsequent step, algo-rithms to extract the per-component information from an aggregate signal canbe applied. Such an approach can allow for avoiding invasive interference thatcauses various problems, such as high costs associated with sensor implemen-tation and warranty issues. Initially developed to provide feedback on energyconsumption in residential environments, non-intrusive load monitoring (NILM)is widely used for other purposes, such as CM [4, 5]. NILM algorithms can beused to disaggregate power signals measured at the electrical mains of a build-ing into the individual appliances [6, 7]. By implementing sensors, such as HallEffect current ones, electrical signals of a machine or appliance can be measuredin a non-intrusive manner [5]. Sampling the voltage and current signals at highrates is necessary to identify individual components when many other compo-nents are concurrently activated and to enable differentiation between smallerones [9]. To the best of our knowledge, there are two public datasets containingthe data on electrical measurements of industrial-like machinery. Both of themhave drawbacks, such as being either sampled at low rates [10] or comprisingonly individual appliances from a laboratory environment [11]. The first datasetcontains electrical parameters of a poultry feed factory, recorded for a durationof 111 days. The smart meters at the factory sample the data internally at8000 sps, but send out the down-sampled electrical features once per second.This dataset provides insights into the energy consumption of a factory usingNILM techniques for energy disaggregation. The machine components in thisfactory produce pellets of ration for poultry by processing corn or soybeans.The dataset comprises two pelletisers, two double-pole contactors, two exhaustfans and two milling machines. All appliances measured are horizontal motors[10]. In the second dataset, electrical signals for fifteen residential and industrialelectrical components were sampled at 50,000 sps in a laboratory environment.However, the utilised devices were not activated according to a dedicated pat-tern, for example, such as a production process, and no complementary infor-mation about conditions of components is provided [11]. In addition to thesetwo datasets, several other datasets containing sensor measurements for CMconcerning individual components were established [12, 13, 14]. These datasetscontain information about the isolated components using a dedicated sensorinfrastructure to obtain various parameters. The milling dataset by Agoginoand Goebel [12], for example, provides records on the wear of the milling in-sert of a milling machine, recorded at different speeds, feeds and depth of cut[12]. Some of the datasets provide additional information about detected faultsof components, such as, for example, a hydraulic test rig [14]. In particular,in this dataset, measurements on the condition of hydraulic components in aprimary working and a secondary cooling-filtration circuit are presented [14].The sensor data includes features such as, for example, pressure, motor power,temperature, and vibration, measured at least once per second. The dataset in-cludes component-specific failure information. The failure information for each
(c) Author's version of the accepted (15.10.2020) and soon to be published article: CREAM, a component level coffeemaker electrical activity measurement dataset, Scientific Data, Springer Nature
component is structured hierarchically, from full functionality to failure of thecomponent [14].
To construct a dataset that would enable the evaluation of algorithms fornon-invasive CM, event detection, and other manufacturing-related analysistasks, we formulated the following requirements. First, a considered machinehad to execute an industrial process, including typical electrical componentsthat are used in manufacturing, triggered following dedicated process patterns.Second, the environment and the machine had to be fully-controllable to avoidany unknown external interference. Third, the machine had to be equipped withsensors to record reliable ground-truth for events caused by components. Wefocused on the events related to the fabricated products and performed main-tenance actions. Following these requirements, we selected two distinct fully-automated, industrial-level coffeemakers to construct the proposed coffeemakerelectrical activity measurement (CREAM) dataset, to enable individual ma-chine analysis and comparative studies between the coffeemakers. We providehigh-resolution continuous measurements of the voltage and current signals ofthe coffeemakers acquired at 6,400 sps. During signal acquisition, the machinesproduced eight different product types, each following a unique internal process.Furthermore, we provide 370,600 expert-labelled electrical events, triggered bythe machine components. In addition, CREAM contains the labels for the threemain components of the coffeemakers, namely the respective heaters, pumps,and motors of the milling plants. The data are marked with the product andmaintenance labels, containing the information about the fabricated productsand performed maintenance actions. Therefore, the resulting dataset can beconsidered as a source for a wide variety of tasks, such as CM, product analysis,and maintenance prediction.
MethodsWe constructed the CREAM dataset based on the previously defined require-ments. For the JURA GIGA X8, the information accumulated in the datasetwas recorded for a period from 23 August 2018 to 8 October 2018. We recordedthe JURA GIGA X8 dataset for sixteen hours every day, except for the last one,8 October 2018, that was measured for eight hours. The data for the JURAGIGA X9 was recorded for 20 days, starting from 22 December 2018, for 15hours per day. The daily data acquisition time frames were chosen to cover themain periods the coffeemakers were activated. For both coffeemakers, the dataacquisition process was divided into three sub-steps, that apply equally to bothmachines. The data acquisition setup is shown in Figure 1. First, we sampledthe voltage and current signals of each coffeemaker at 6,400 sps. To execute thisstep, we utilised a custom measurement device for high-sampling rate plug-levelappliance recordings to achieve this, namely, the mobile energy data acquisitionlaboratory (MEDAL) measurement unit [15]. Simultaneously, we extracted theproduct and maintenance-related event logs from a serial port of the coffeemakerusing a single-board personal computer (PC). As the methodology described in
(c) Author's version of the accepted (15.10.2020) and soon to be published article: CREAM, a component level coffeemaker electrical activity measurement dataset, Scientific Data, Springer Nature
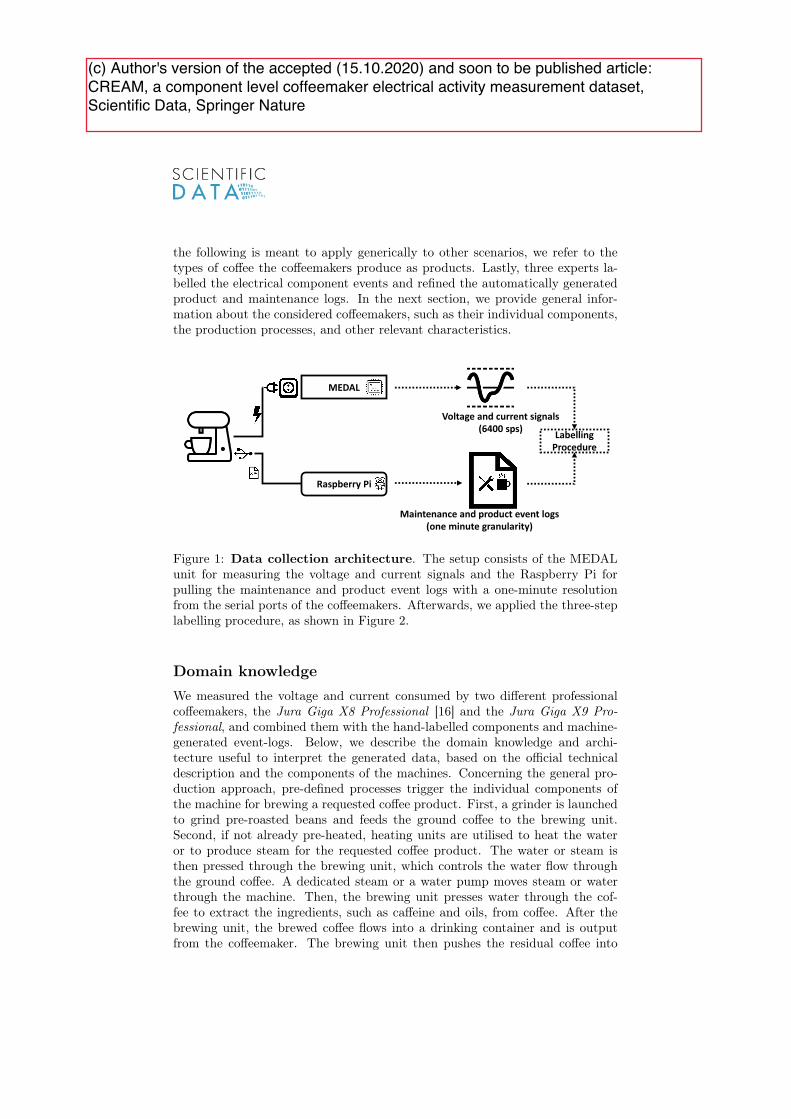
the following is meant to apply generically to other scenarios, we refer to thetypes of coffee the coffeemakers produce as products. Lastly, three experts la-belled the electrical component events and refined the automatically generatedproduct and maintenance logs. In the next section, we provide general infor-mation about the considered coffeemakers, such as their individual components,the production processes, and other relevant characteristics.
MEDAL
Raspberry Pi
Voltage and current signals(6400 sps)
Maintenance and product event logs(one minute granularity)
Labelling Procedure
Figure 1: Data collection architecture. The setup consists of the MEDALunit for measuring the voltage and current signals and the Raspberry Pi forpulling the maintenance and product event logs with a one-minute resolutionfrom the serial ports of the coffeemakers. Afterwards, we applied the three-steplabelling procedure, as shown in Figure 2.
Domain knowledgeWe measured the voltage and current consumed by two different professionalcoffeemakers, the Jura Giga X8 Professional [16] and the Jura Giga X9 Pro-fessional, and combined them with the hand-labelled components and machine-generated event-logs. Below, we describe the domain knowledge and archi-tecture useful to interpret the generated data, based on the official technicaldescription and the components of the machines. Concerning the general pro-duction approach, pre-defined processes trigger the individual components ofthe machine for brewing a requested coffee product. First, a grinder is launchedto grind pre-roasted beans and feeds the ground coffee to the brewing unit.Second, if not already pre-heated, heating units are utilised to heat the wateror to produce steam for the requested coffee product. The water or steam isthen pressed through the brewing unit, which controls the water flow throughthe ground coffee. A dedicated steam or a water pump moves steam or waterthrough the machine. Then, the brewing unit presses water through the cof-fee to extract the ingredients, such as caffeine and oils, from coffee. After thebrewing unit, the brewed coffee flows into a drinking container and is outputfrom the coffeemaker. The brewing unit then pushes the residual coffee into
(c) Author's version of the accepted (15.10.2020) and soon to be published article: CREAM, a component level coffeemaker electrical activity measurement dataset, Scientific Data, Springer Nature
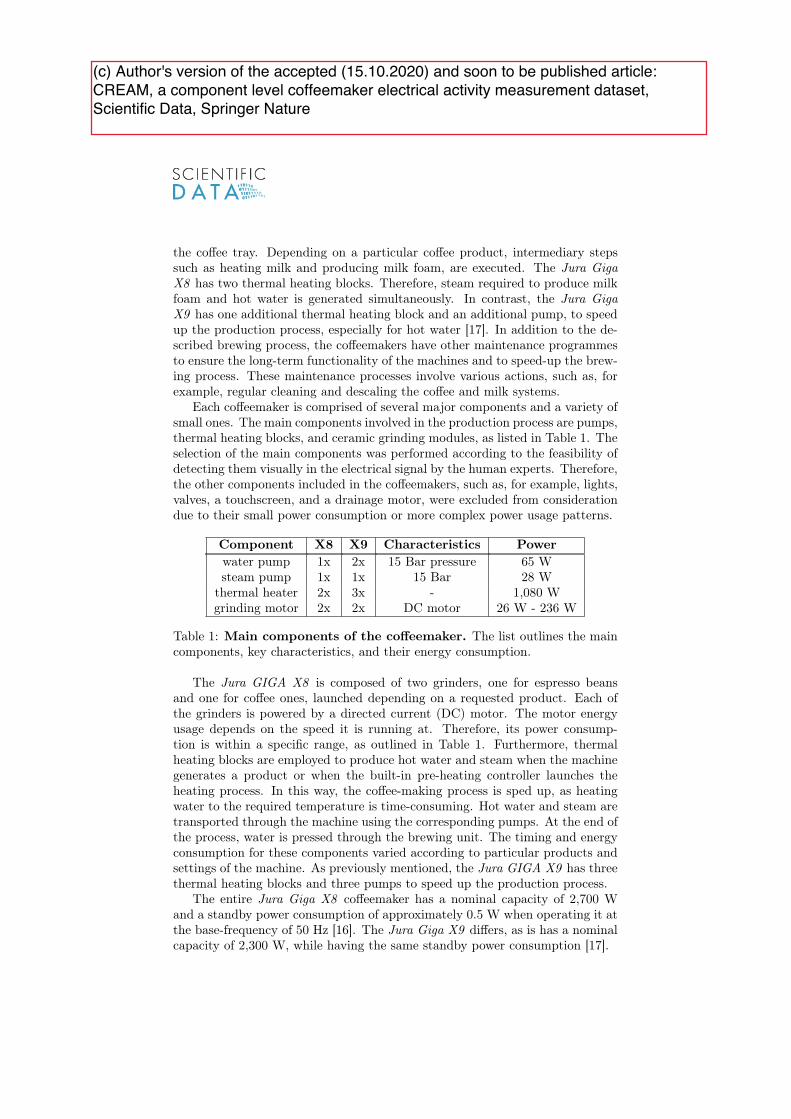
the coffee tray. Depending on a particular coffee product, intermediary stepssuch as heating milk and producing milk foam, are executed. The Jura GigaX8 has two thermal heating blocks. Therefore, steam required to produce milkfoam and hot water is generated simultaneously. In contrast, the Jura GigaX9 has one additional thermal heating block and an additional pump, to speedup the production process, especially for hot water [17]. In addition to the de-scribed brewing process, the coffeemakers have other maintenance programmesto ensure the long-term functionality of the machines and to speed-up the brew-ing process. These maintenance processes involve various actions, such as, forexample, regular cleaning and descaling the coffee and milk systems.
Each coffeemaker is comprised of several major components and a variety ofsmall ones. The main components involved in the production process are pumps,thermal heating blocks, and ceramic grinding modules, as listed in Table 1. Theselection of the main components was performed according to the feasibility ofdetecting them visually in the electrical signal by the human experts. Therefore,the other components included in the coffeemakers, such as, for example, lights,valves, a touchscreen, and a drainage motor, were excluded from considerationdue to their small power consumption or more complex power usage patterns.
Component X8 X9 Characteristics Powerwater pump 1x 2x 15 Bar pressure 65 Wsteam pump 1x 1x 15 Bar 28 W
thermal heater 2x 3x - 1,080 Wgrinding motor 2x 2x DC motor 26 W - 236 W
Table 1: Main components of the coffeemaker. The list outlines the maincomponents, key characteristics, and their energy consumption.
The Jura GIGA X8 is composed of two grinders, one for espresso beansand one for coffee ones, launched depending on a requested product. Each ofthe grinders is powered by a directed current (DC) motor. The motor energyusage depends on the speed it is running at. Therefore, its power consump-tion is within a specific range, as outlined in Table 1. Furthermore, thermalheating blocks are employed to produce hot water and steam when the machinegenerates a product or when the built-in pre-heating controller launches theheating process. In this way, the coffee-making process is sped up, as heatingwater to the required temperature is time-consuming. Hot water and steam aretransported through the machine using the corresponding pumps. At the end ofthe process, water is pressed through the brewing unit. The timing and energyconsumption for these components varied according to particular products andsettings of the machine. As previously mentioned, the Jura GIGA X9 has threethermal heating blocks and three pumps to speed up the production process.
The entire Jura Giga X8 coffeemaker has a nominal capacity of 2,700 Wand a standby power consumption of approximately 0.5 W when operating it atthe base-frequency of 50 Hz [16]. The Jura Giga X9 differs, as is has a nominalcapacity of 2,300 W, while having the same standby power consumption [17].
(c) Author's version of the accepted (15.10.2020) and soon to be published article: CREAM, a component level coffeemaker electrical activity measurement dataset, Scientific Data, Springer Nature
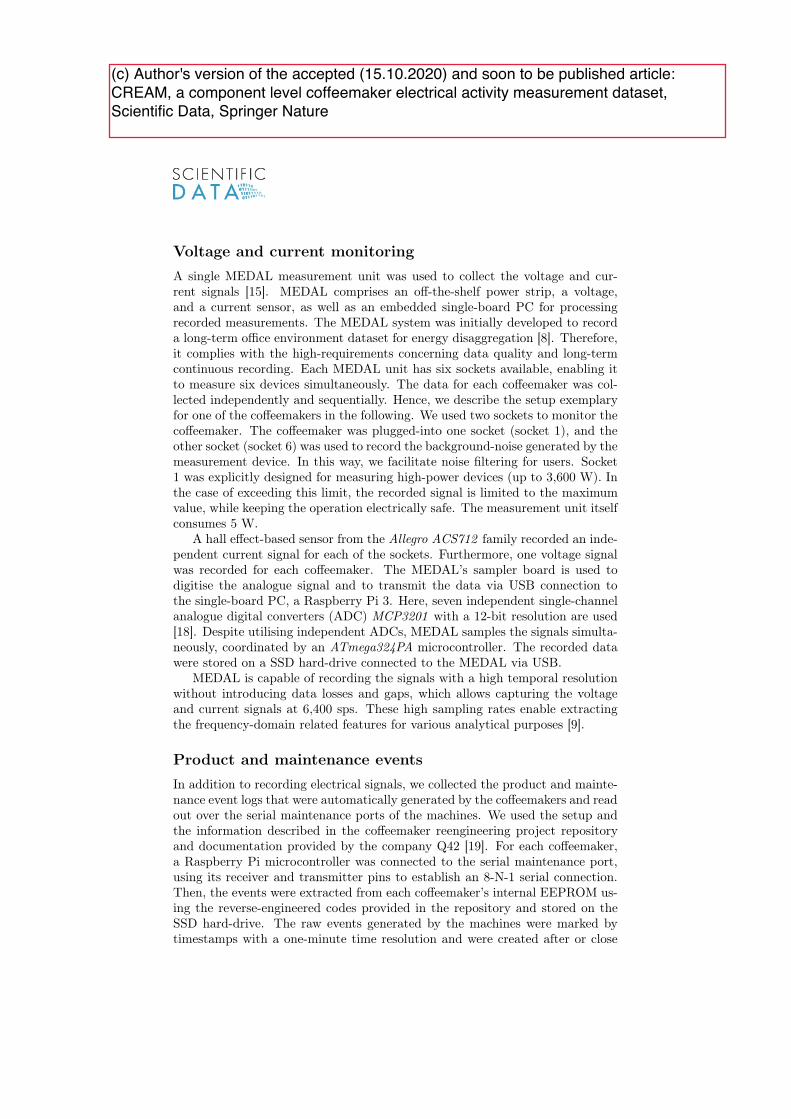
Voltage and current monitoringA single MEDAL measurement unit was used to collect the voltage and cur-rent signals [15]. MEDAL comprises an off-the-shelf power strip, a voltage,and a current sensor, as well as an embedded single-board PC for processingrecorded measurements. The MEDAL system was initially developed to recorda long-term office environment dataset for energy disaggregation [8]. Therefore,it complies with the high-requirements concerning data quality and long-termcontinuous recording. Each MEDAL unit has six sockets available, enabling itto measure six devices simultaneously. The data for each coffeemaker was col-lected independently and sequentially. Hence, we describe the setup exemplaryfor one of the coffeemakers in the following. We used two sockets to monitor thecoffeemaker. The coffeemaker was plugged-into one socket (socket 1), and theother socket (socket 6) was used to record the background-noise generated by themeasurement device. In this way, we facilitate noise filtering for users. Socket1 was explicitly designed for measuring high-power devices (up to 3,600 W). Inthe case of exceeding this limit, the recorded signal is limited to the maximumvalue, while keeping the operation electrically safe. The measurement unit itselfconsumes 5 W.
A hall effect-based sensor from the Allegro ACS712 family recorded an inde-pendent current signal for each of the sockets. Furthermore, one voltage signalwas recorded for each coffeemaker. The MEDAL’s sampler board is used todigitise the analogue signal and to transmit the data via USB connection tothe single-board PC, a Raspberry Pi 3. Here, seven independent single-channelanalogue digital converters (ADC) MCP3201 with a 12-bit resolution are used[18]. Despite utilising independent ADCs, MEDAL samples the signals simulta-neously, coordinated by an ATmega324PA microcontroller. The recorded datawere stored on a SSD hard-drive connected to the MEDAL via USB.
MEDAL is capable of recording the signals with a high temporal resolutionwithout introducing data losses and gaps, which allows capturing the voltageand current signals at 6,400 sps. These high sampling rates enable extractingthe frequency-domain related features for various analytical purposes [9].
Product and maintenance eventsIn addition to recording electrical signals, we collected the product and mainte-nance event logs that were automatically generated by the coffeemakers and readout over the serial maintenance ports of the machines. We used the setup andthe information described in the coffeemaker reengineering project repositoryand documentation provided by the company Q42 [19]. For each coffeemaker,a Raspberry Pi microcontroller was connected to the serial maintenance port,using its receiver and transmitter pins to establish an 8-N-1 serial connection.Then, the events were extracted from each coffeemaker’s internal EEPROM us-ing the reverse-engineered codes provided in the repository and stored on theSSD hard-drive. The raw events generated by the machines were marked bytimestamps with a one-minute time resolution and were created after or close
(c) Author's version of the accepted (15.10.2020) and soon to be published article: CREAM, a component level coffeemaker electrical activity measurement dataset, Scientific Data, Springer Nature
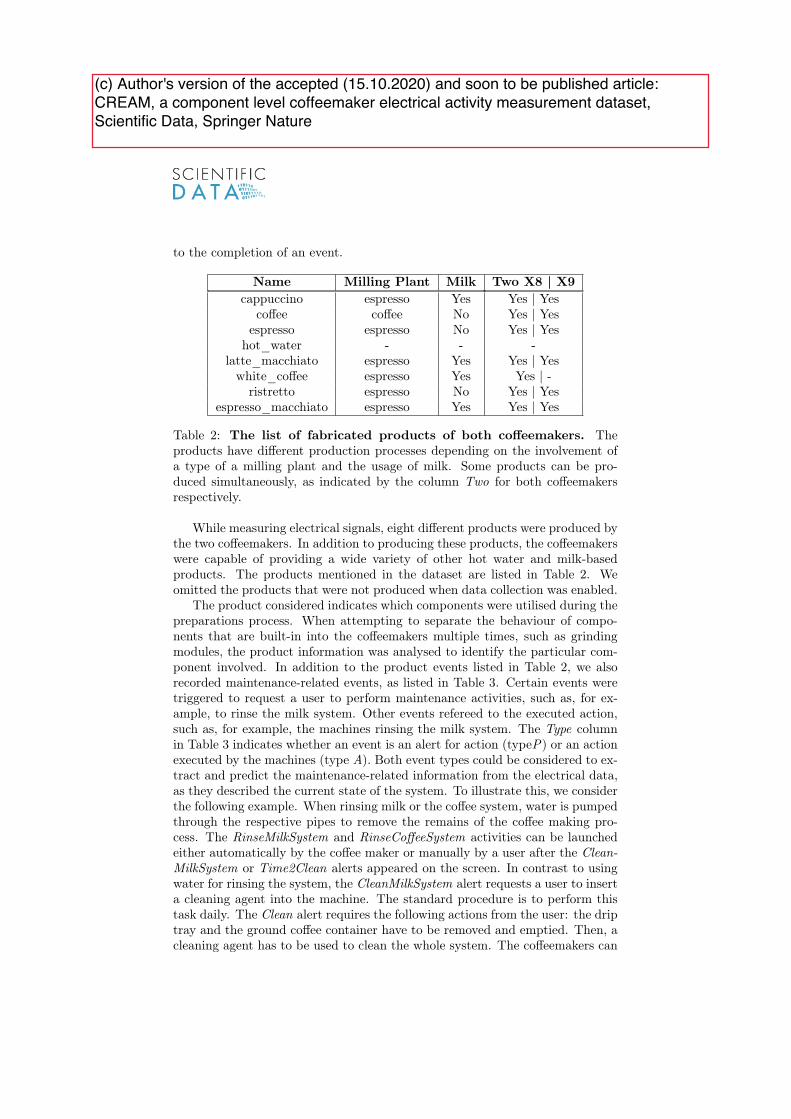
to the completion of an event.
Name Milling Plant Milk Two X8 | X9cappuccino espresso Yes Yes | Yes
coffee coffee No Yes | Yesespresso espresso No Yes | Yes
hot_water - - -latte_macchiato espresso Yes Yes | Yes
white_coffee espresso Yes Yes | -ristretto espresso No Yes | Yes
espresso_macchiato espresso Yes Yes | Yes
Table 2: The list of fabricated products of both coffeemakers. Theproducts have different production processes depending on the involvement ofa type of a milling plant and the usage of milk. Some products can be pro-duced simultaneously, as indicated by the column Two for both coffeemakersrespectively.
While measuring electrical signals, eight different products were produced bythe two coffeemakers. In addition to producing these products, the coffeemakerswere capable of providing a wide variety of other hot water and milk-basedproducts. The products mentioned in the dataset are listed in Table 2. Weomitted the products that were not produced when data collection was enabled.
The product considered indicates which components were utilised during thepreparations process. When attempting to separate the behaviour of compo-nents that are built-in into the coffeemakers multiple times, such as grindingmodules, the product information was analysed to identify the particular com-ponent involved. In addition to the product events listed in Table 2, we alsorecorded maintenance-related events, as listed in Table 3. Certain events weretriggered to request a user to perform maintenance activities, such as, for ex-ample, to rinse the milk system. Other events refereed to the executed action,such as, for example, the machines rinsing the milk system. The Type columnin Table 3 indicates whether an event is an alert for action (typeP) or an actionexecuted by the machines (type A). Both event types could be considered to ex-tract and predict the maintenance-related information from the electrical data,as they described the current state of the system. To illustrate this, we considerthe following example. When rinsing milk or the coffee system, water is pumpedthrough the respective pipes to remove the remains of the coffee making pro-cess. The RinseMilkSystem and RinseCoffeeSystem activities can be launchedeither automatically by the coffee maker or manually by a user after the Clean-MilkSystem or Time2Clean alerts appeared on the screen. In contrast to usingwater for rinsing the system, the CleanMilkSystem alert requests a user to inserta cleaning agent into the machine. The standard procedure is to perform thistask daily. The Clean alert requires the following actions from the user: the driptray and the ground coffee container have to be removed and emptied. Then, acleaning agent has to be used to clean the whole system. The coffeemakers can
(c) Author's version of the accepted (15.10.2020) and soon to be published article: CREAM, a component level coffeemaker electrical activity measurement dataset, Scientific Data, Springer Nature
Name Description TypeMillingPlantEspresso Grinding espresso beans AMillingPlantCoffee Grinding coffee beans ACleanMilkSystem Cleaning the milk system PRinseMilkSystem Rinsing the milk system A
Time2Clean Alert: Clean the coffee system PRinseCoffeeSystem Rinsing the coffee system A
Clean Clean the whole system A/PTime2Descale Descale the whole system A/P
Table 3: Maintenance-related events of both coffeemakers. The listrepresents all maintenance-related events in the dataset and their purpose.
not be used before the completion of the cleaning process, which takes approx-imately 20 minutes. Similarly, the Time2Descale alert requests a user to add adescaling tablet into the water and to run the descaling programme that takesapproximately 50 minutes [16, 17].
Labelling procedureThe behaviour of electrical components was captured in the voltage and cur-rent signals recorded by the MEDAL unit. The electrical signals were markedaccording to three sets of labels aiming to facilitate a wide variety of supervisedand unsupervised analysis techniques. We have defined an electrical event forboth coffeemakers individually, based on the key characteristics the acquiredsignals exhibit. For the Jura GIGA X8, an electrical event was defined as anincrease in the current signal equal to approximately one ampere that lastedover a time frame of at least 1 s. In order to capture all significant events, therecan be slight deviations from the event definition, as the data exhibits somevariation that we also captured in the labelling process. In contrast, the JuraGIGA X9 generated a vast amount of patterns with a shorter duration. Hence,to capture this behaviour, we have created two sets of electrical event labelsfor the Jura GIGA X9. The first set contains electrical events lasting over atime frame of at least 1 s, similar to the component events of the Jura GIGAX8, to enable comparative studies with the other coffeemaker. The second setof component events of the Jura GIGA X9 extends the first one with eventslasting at least 0.1 s. Thus, we have labelled 92,449 electrical events for theJura GIGA X8. For the second coffeemaker, we have created 278,151 electricalevents, including the 44,219 events labelled with a minimum duration of 1 s.
Among all registered electrical events, we created a subset that containedthe expert-labelled information about the individual main components thathad triggered these events. Furthermore, the two sets of the maintenance andproduct-related events that were automatically generated by the coffeemakerswere specified for each of the coffeemakers individually. Due to the aforemen-tioned granularity of one minute, these events were manually refined to match
(c) Author's version of the accepted (15.10.2020) and soon to be published article: CREAM, a component level coffeemaker electrical activity measurement dataset, Scientific Data, Springer Nature
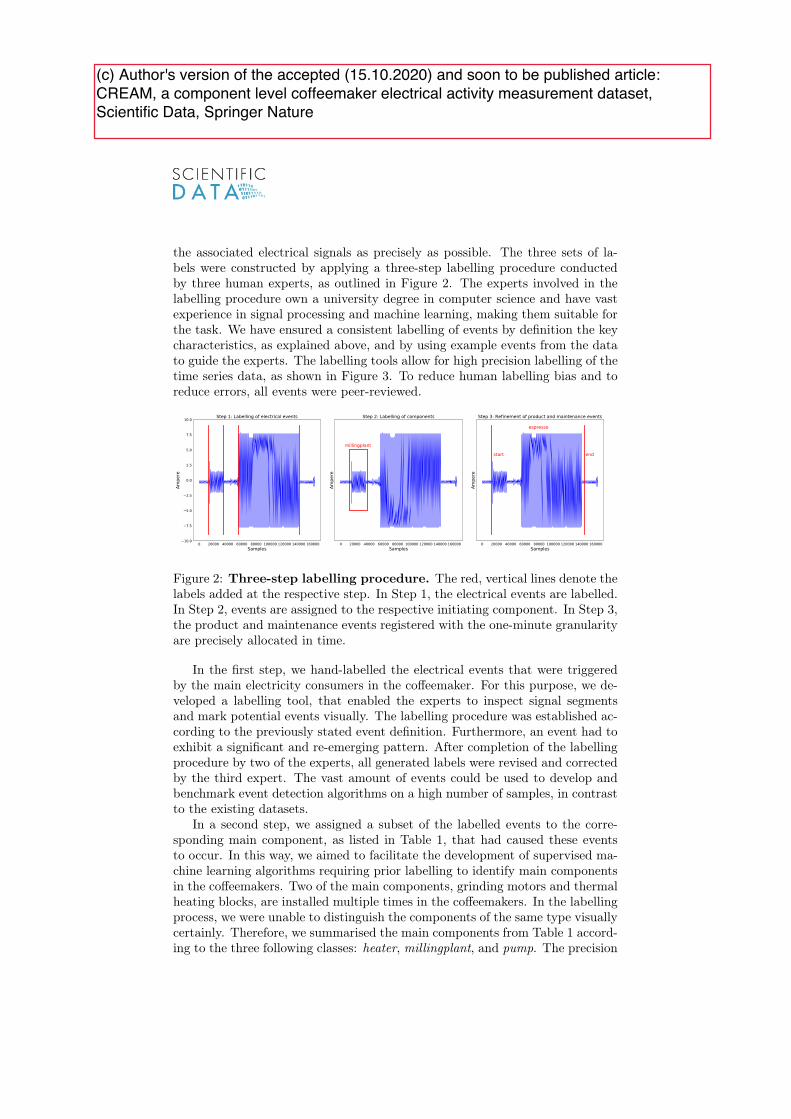
the associated electrical signals as precisely as possible. The three sets of la-bels were constructed by applying a three-step labelling procedure conductedby three human experts, as outlined in Figure 2. The experts involved in thelabelling procedure own a university degree in computer science and have vastexperience in signal processing and machine learning, making them suitable forthe task. We have ensured a consistent labelling of events by definition the keycharacteristics, as explained above, and by using example events from the datato guide the experts. The labelling tools allow for high precision labelling of thetime series data, as shown in Figure 3. To reduce human labelling bias and toreduce errors, all events were peer-reviewed.
Figure 2: Three-step labelling procedure. The red, vertical lines denote thelabels added at the respective step. In Step 1, the electrical events are labelled.In Step 2, events are assigned to the respective initiating component. In Step 3,the product and maintenance events registered with the one-minute granularityare precisely allocated in time.
In the first step, we hand-labelled the electrical events that were triggeredby the main electricity consumers in the coffeemaker. For this purpose, we de-veloped a labelling tool, that enabled the experts to inspect signal segmentsand mark potential events visually. The labelling procedure was established ac-cording to the previously stated event definition. Furthermore, an event had toexhibit a significant and re-emerging pattern. After completion of the labellingprocedure by two of the experts, all generated labels were revised and correctedby the third expert. The vast amount of events could be used to develop andbenchmark event detection algorithms on a high number of samples, in contrastto the existing datasets.
In a second step, we assigned a subset of the labelled events to the corre-sponding main component, as listed in Table 1, that had caused these eventsto occur. In this way, we aimed to facilitate the development of supervised ma-chine learning algorithms requiring prior labelling to identify main componentsin the coffeemakers. Two of the main components, grinding motors and thermalheating blocks, are installed multiple times in the coffeemakers. In the labellingprocess, we were unable to distinguish the components of the same type visuallycertainly. Therefore, we summarised the main components from Table 1 accord-ing to the three following classes: heater, millingplant, and pump. The precision
(c) Author's version of the accepted (15.10.2020) and soon to be published article: CREAM, a component level coffeemaker electrical activity measurement dataset, Scientific Data, Springer Nature
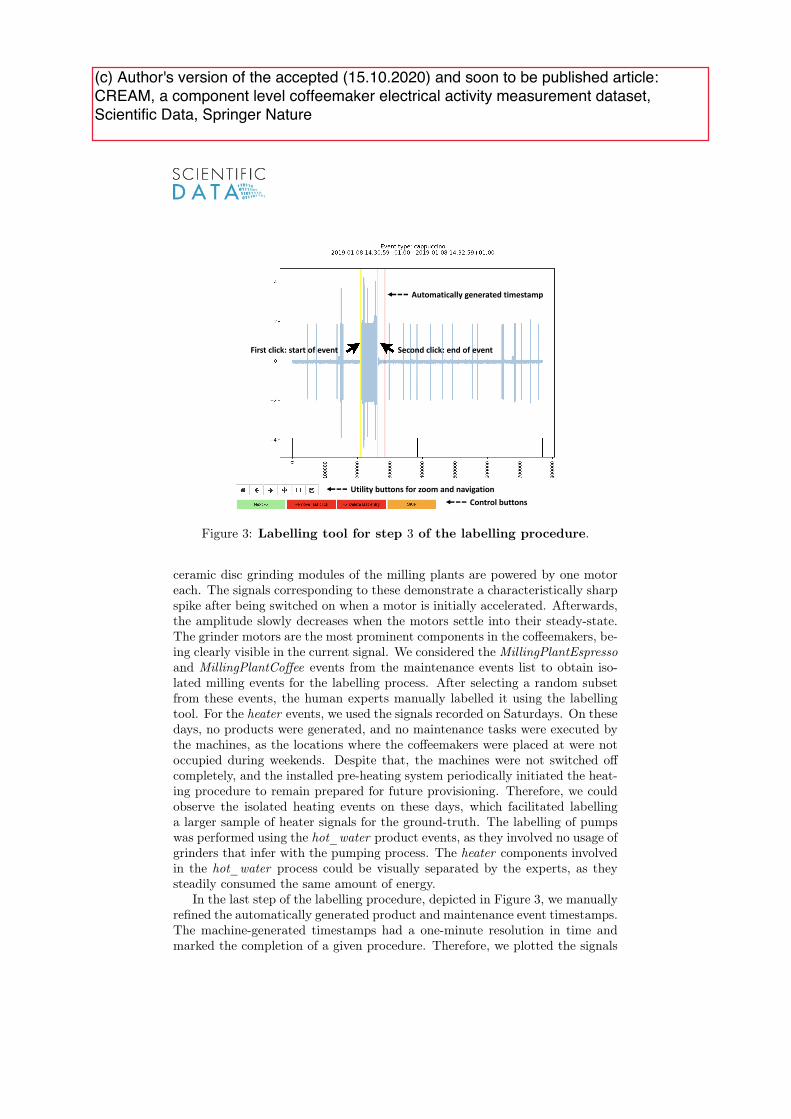
First click: start of event Second click: end of event
Automatically generated timestamp
Control buttonsUtility buttons for zoom and navigation
Figure 3: Labelling tool for step 3 of the labelling procedure.
ceramic disc grinding modules of the milling plants are powered by one motoreach. The signals corresponding to these demonstrate a characteristically sharpspike after being switched on when a motor is initially accelerated. Afterwards,the amplitude slowly decreases when the motors settle into their steady-state.The grinder motors are the most prominent components in the coffeemakers, be-ing clearly visible in the current signal. We considered the MillingPlantEspressoand MillingPlantCoffee events from the maintenance events list to obtain iso-lated milling events for the labelling process. After selecting a random subsetfrom these events, the human experts manually labelled it using the labellingtool. For the heater events, we used the signals recorded on Saturdays. On thesedays, no products were generated, and no maintenance tasks were executed bythe machines, as the locations where the coffeemakers were placed at were notoccupied during weekends. Despite that, the machines were not switched offcompletely, and the installed pre-heating system periodically initiated the heat-ing procedure to remain prepared for future provisioning. Therefore, we couldobserve the isolated heating events on these days, which facilitated labellinga larger sample of heater signals for the ground-truth. The labelling of pumpswas performed using the hot_water product events, as they involved no usage ofgrinders that infer with the pumping process. The heater components involvedin the hot_water process could be visually separated by the experts, as theysteadily consumed the same amount of energy.
In the last step of the labelling procedure, depicted in Figure 3, we manuallyrefined the automatically generated product and maintenance event timestamps.The machine-generated timestamps had a one-minute resolution in time andmarked the completion of a given procedure. Therefore, we plotted the signals
(c) Author's version of the accepted (15.10.2020) and soon to be published article: CREAM, a component level coffeemaker electrical activity measurement dataset, Scientific Data, Springer Nature
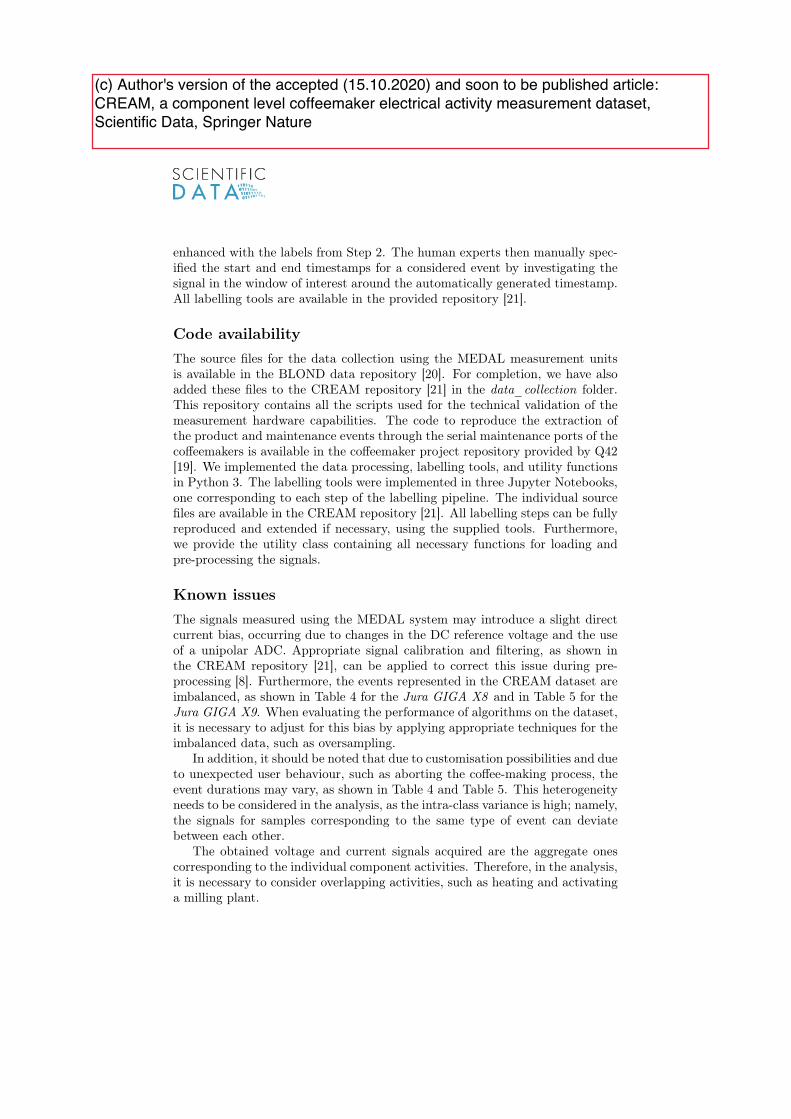
enhanced with the labels from Step 2. The human experts then manually spec-ified the start and end timestamps for a considered event by investigating thesignal in the window of interest around the automatically generated timestamp.All labelling tools are available in the provided repository [21].
Code availabilityThe source files for the data collection using the MEDAL measurement unitsis available in the BLOND data repository [20]. For completion, we have alsoadded these files to the CREAM repository [21] in the data_collection folder.This repository contains all the scripts used for the technical validation of themeasurement hardware capabilities. The code to reproduce the extraction ofthe product and maintenance events through the serial maintenance ports of thecoffeemakers is available in the coffeemaker project repository provided by Q42[19]. We implemented the data processing, labelling tools, and utility functionsin Python 3. The labelling tools were implemented in three Jupyter Notebooks,one corresponding to each step of the labelling pipeline. The individual sourcefiles are available in the CREAM repository [21]. All labelling steps can be fullyreproduced and extended if necessary, using the supplied tools. Furthermore,we provide the utility class containing all necessary functions for loading andpre-processing the signals.
Known issuesThe signals measured using the MEDAL system may introduce a slight directcurrent bias, occurring due to changes in the DC reference voltage and the useof a unipolar ADC. Appropriate signal calibration and filtering, as shown inthe CREAM repository [21], can be applied to correct this issue during pre-processing [8]. Furthermore, the events represented in the CREAM dataset areimbalanced, as shown in Table 4 for the Jura GIGA X8 and in Table 5 for theJura GIGA X9. When evaluating the performance of algorithms on the dataset,it is necessary to adjust for this bias by applying appropriate techniques for theimbalanced data, such as oversampling.
In addition, it should be noted that due to customisation possibilities and dueto unexpected user behaviour, such as aborting the coffee-making process, theevent durations may vary, as shown in Table 4 and Table 5. This heterogeneityneeds to be considered in the analysis, as the intra-class variance is high; namely,the signals for samples corresponding to the same type of event can deviatebetween each other.
The obtained voltage and current signals acquired are the aggregate onescorresponding to the individual component activities. Therefore, in the analysis,it is necessary to consider overlapping activities, such as heating and activatinga milling plant.
(c) Author's version of the accepted (15.10.2020) and soon to be published article: CREAM, a component level coffeemaker electrical activity measurement dataset, Scientific Data, Springer Nature
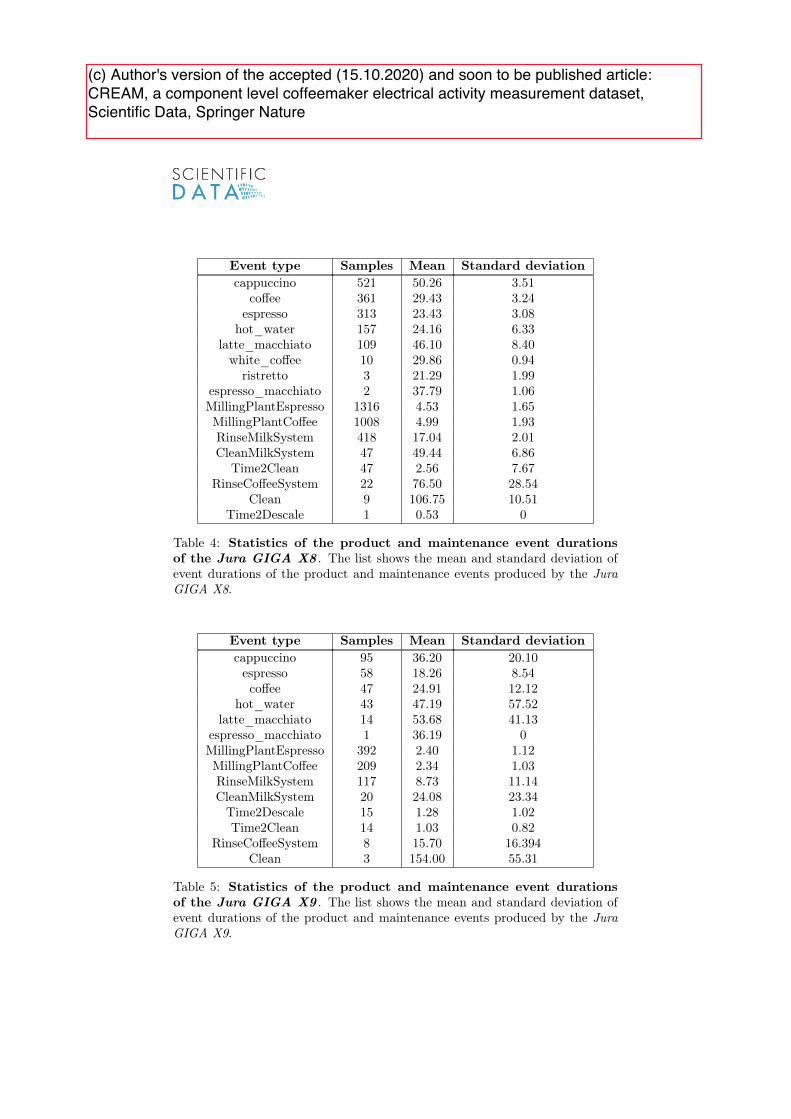
Event type Samples Mean Standard deviationcappuccino 521 50.26 3.51
coffee 361 29.43 3.24espresso 313 23.43 3.08
hot_water 157 24.16 6.33latte_macchiato 109 46.10 8.40
white_coffee 10 29.86 0.94ristretto 3 21.29 1.99
espresso_macchiato 2 37.79 1.06MillingPlantEspresso 1316 4.53 1.65MillingPlantCoffee 1008 4.99 1.93RinseMilkSystem 418 17.04 2.01CleanMilkSystem 47 49.44 6.86
Time2Clean 47 2.56 7.67RinseCoffeeSystem 22 76.50 28.54
Clean 9 106.75 10.51Time2Descale 1 0.53 0
Table 4: Statistics of the product and maintenance event durationsof the Jura GIGA X8 . The list shows the mean and standard deviation ofevent durations of the product and maintenance events produced by the JuraGIGA X8.
Event type Samples Mean Standard deviationcappuccino 95 36.20 20.10espresso 58 18.26 8.54coffee 47 24.91 12.12
hot_water 43 47.19 57.52latte_macchiato 14 53.68 41.13
espresso_macchiato 1 36.19 0MillingPlantEspresso 392 2.40 1.12MillingPlantCoffee 209 2.34 1.03RinseMilkSystem 117 8.73 11.14CleanMilkSystem 20 24.08 23.34
Time2Descale 15 1.28 1.02Time2Clean 14 1.03 0.82
RinseCoffeeSystem 8 15.70 16.394Clean 3 154.00 55.31
Table 5: Statistics of the product and maintenance event durationsof the Jura GIGA X9 . The list shows the mean and standard deviation ofevent durations of the product and maintenance events produced by the JuraGIGA X9.
(c) Author's version of the accepted (15.10.2020) and soon to be published article: CREAM, a component level coffeemaker electrical activity measurement dataset, Scientific Data, Springer Nature
Data RecordsThe CREAM [21] dataset contains the three measured signals generated by eachof the coffeemakers: the voltage, current and background-noise signal registeredby a socket in the MEDAL measurement unit. Furthermore, it comprises thelabels of electrical components, as well as the information about the productand maintenance events. The dataset is divided into two subfolders, one for theJura GIGA X8 and one for the Jura GIGA X9 respectively.
Data filesAll signals were sampled with 6,400 samples per second at the mains frequencyof 50 Hz. The signals obtained from the sensor input were stored as-is: inparticular, no dedicated pre-processing of the raw signals was performed toensure unbiased analysis of the data. In the CREAM repository, we provideexamples of possible pre-processing steps [21]. The dataset was structured withrespect to the individual days of recording so that one subfolder contains thedata files for each day in the data acquisition process. The raw data and themetadata were stored in HDF5 files. The utilised data formats and the metadataare similar to the ones used in the BLOND office environment dataset, as theMEDAL hardware was used in the latter as well.
Functionality to process this type of file is available in a variety of open-source and commercially available tools, making them easily accessible [8]. Intoeach of the HDF5 files, we embedded the corresponding file metadata in theform of HDF5 attributes that could be accessed either directly in the file root orin a specific HDF5-dataset, as described in Table 6. The value types of the dataare either short integer, floating point or ASCII-encoded byte strings. Parts ofthe metadata information is also encoded in the file names, for example, coffee-maker-2018-08-23T07-00-03.783395T+0200-0000001.hdf5 : The first sample ofthis file was recorded approximately at 07:00 23 October 2018, with a time zoneoffset of 2 hours. Furthermore, each file within a day has a sequence number,such as the sequence number 1, as represented in the example file name. Thesequence number uniquely identifies the file order within a particular day. Alltimestamps in CREAM, in particular, the ones from the labels and from thedata recordings, are synchronised. In the CREAM repository, we provide theexamples for handling timestamps and time zone information [21]. Each HDF5file contains one hour of data, and each day of CREAM, except the last one,contains sixteen HDF5 files, with the first file starting at approximately 06:00,and the last file ending at 22:00, covering the usual working hours. No daylightsaving time transitions or leap seconds have occurred during the process ofrecording. Therefore, one can fully rely on the timestamps provided in thedata. The MEDAL units automatically create the one hour file chunks, whilemeasuring the electrical signals without interruptions at 6,400 sps.
(c) Author's version of the accepted (15.10.2020) and soon to be published article: CREAM, a component level coffeemaker electrical activity measurement dataset, Scientific Data, Springer Nature
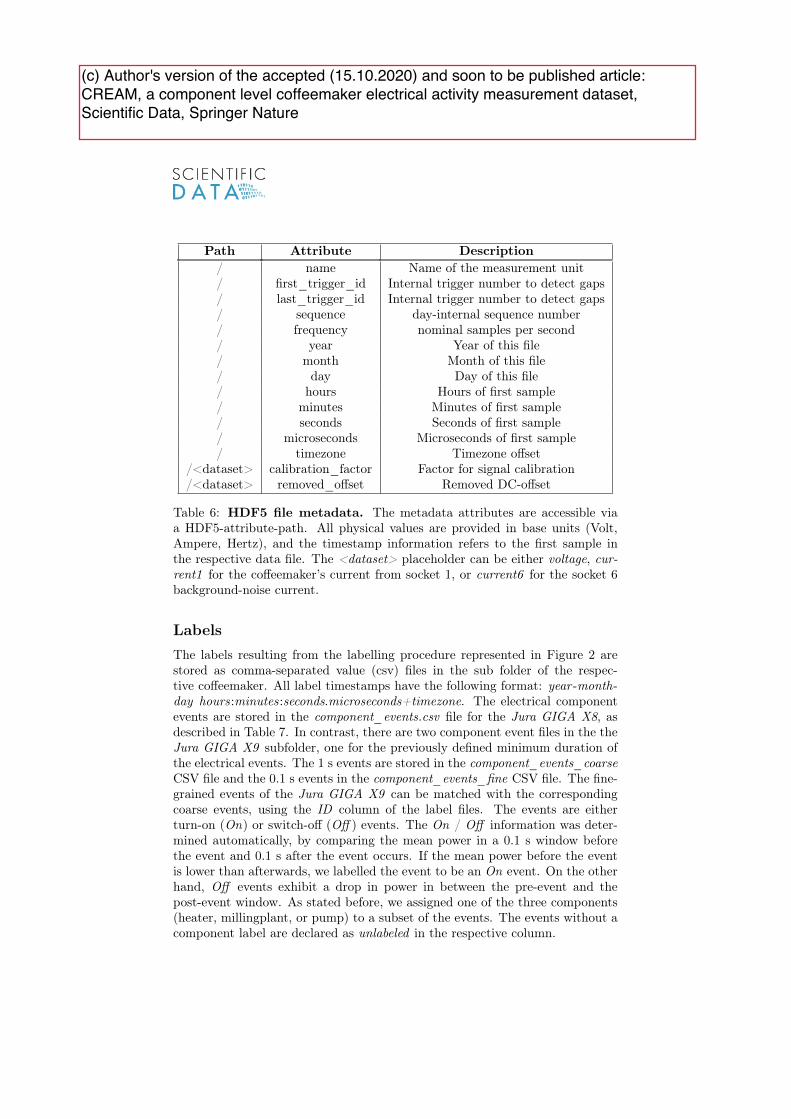
Path Attribute Description/ name Name of the measurement unit/ first_trigger_id Internal trigger number to detect gaps/ last_trigger_id Internal trigger number to detect gaps/ sequence day-internal sequence number/ frequency nominal samples per second/ year Year of this file/ month Month of this file/ day Day of this file/ hours Hours of first sample/ minutes Minutes of first sample/ seconds Seconds of first sample/ microseconds Microseconds of first sample/ timezone Timezone offset
/<dataset> calibration_factor Factor for signal calibration/<dataset> removed_offset Removed DC-offset
Table 6: HDF5 file metadata. The metadata attributes are accessible viaa HDF5-attribute-path. All physical values are provided in base units (Volt,Ampere, Hertz), and the timestamp information refers to the first sample inthe respective data file. The <dataset> placeholder can be either voltage, cur-rent1 for the coffeemaker’s current from socket 1, or current6 for the socket 6background-noise current.
LabelsThe labels resulting from the labelling procedure represented in Figure 2 arestored as comma-separated value (csv) files in the sub folder of the respec-tive coffeemaker. All label timestamps have the following format: year -month-day hours:minutes:seconds.microseconds+timezone. The electrical componentevents are stored in the component_events.csv file for the Jura GIGA X8, asdescribed in Table 7. In contrast, there are two component event files in the theJura GIGA X9 subfolder, one for the previously defined minimum duration ofthe electrical events. The 1 s events are stored in the component_events_coarseCSV file and the 0.1 s events in the component_events_fine CSV file. The fine-grained events of the Jura GIGA X9 can be matched with the correspondingcoarse events, using the ID column of the label files. The events are eitherturn-on (On) or switch-off (Off ) events. The On / Off information was deter-mined automatically, by comparing the mean power in a 0.1 s window beforethe event and 0.1 s after the event occurs. If the mean power before the eventis lower than afterwards, we labelled the event to be an On event. On the otherhand, Off events exhibit a drop in power in between the pre-event and thepost-event window. As stated before, we assigned one of the three components(heater, millingplant, or pump) to a subset of the events. The events without acomponent label are declared as unlabeled in the respective column.
(c) Author's version of the accepted (15.10.2020) and soon to be published article: CREAM, a component level coffeemaker electrical activity measurement dataset, Scientific Data, Springer Nature
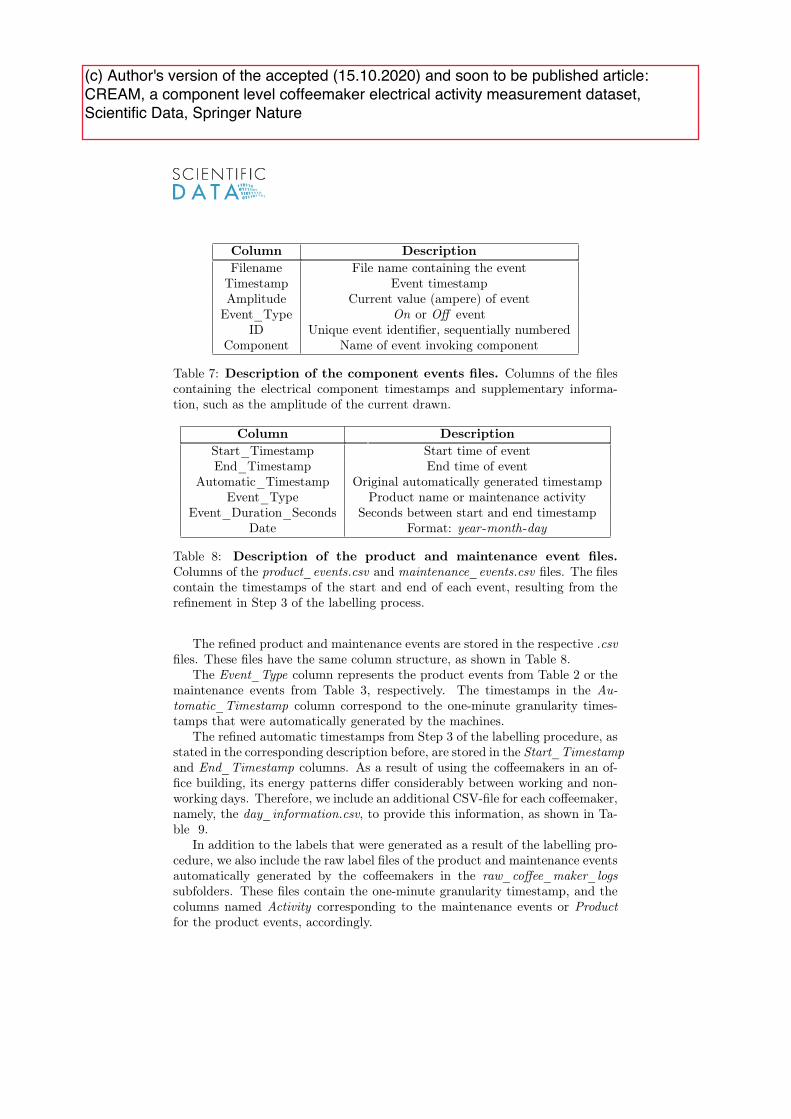
Column DescriptionFilename File name containing the event
Timestamp Event timestampAmplitude Current value (ampere) of event
Event_Type On or Off eventID Unique event identifier, sequentially numbered
Component Name of event invoking component
Table 7: Description of the component events files. Columns of the filescontaining the electrical component timestamps and supplementary informa-tion, such as the amplitude of the current drawn.
Column DescriptionStart_Timestamp Start time of eventEnd_Timestamp End time of event
Automatic_Timestamp Original automatically generated timestampEvent_Type Product name or maintenance activity
Event_Duration_Seconds Seconds between start and end timestampDate Format: year -month-day
Table 8: Description of the product and maintenance event files.Columns of the product_events.csv and maintenance_events.csv files. The filescontain the timestamps of the start and end of each event, resulting from therefinement in Step 3 of the labelling process.
The refined product and maintenance events are stored in the respective .csvfiles. These files have the same column structure, as shown in Table 8.
The Event_Type column represents the product events from Table 2 or themaintenance events from Table 3, respectively. The timestamps in the Au-tomatic_Timestamp column correspond to the one-minute granularity times-tamps that were automatically generated by the machines.
The refined automatic timestamps from Step 3 of the labelling procedure, asstated in the corresponding description before, are stored in the Start_Timestampand End_Timestamp columns. As a result of using the coffeemakers in an of-fice building, its energy patterns differ considerably between working and non-working days. Therefore, we include an additional CSV-file for each coffeemaker,namely, the day_information.csv, to provide this information, as shown in Ta-ble 9.
In addition to the labels that were generated as a result of the labelling pro-cedure, we also include the raw label files of the product and maintenance eventsautomatically generated by the coffeemakers in the raw_coffee_maker_logssubfolders. These files contain the one-minute granularity timestamp, and thecolumns named Activity corresponding to the maintenance events or Productfor the product events, accordingly.
(c) Author's version of the accepted (15.10.2020) and soon to be published article: CREAM, a component level coffeemaker electrical activity measurement dataset, Scientific Data, Springer Nature
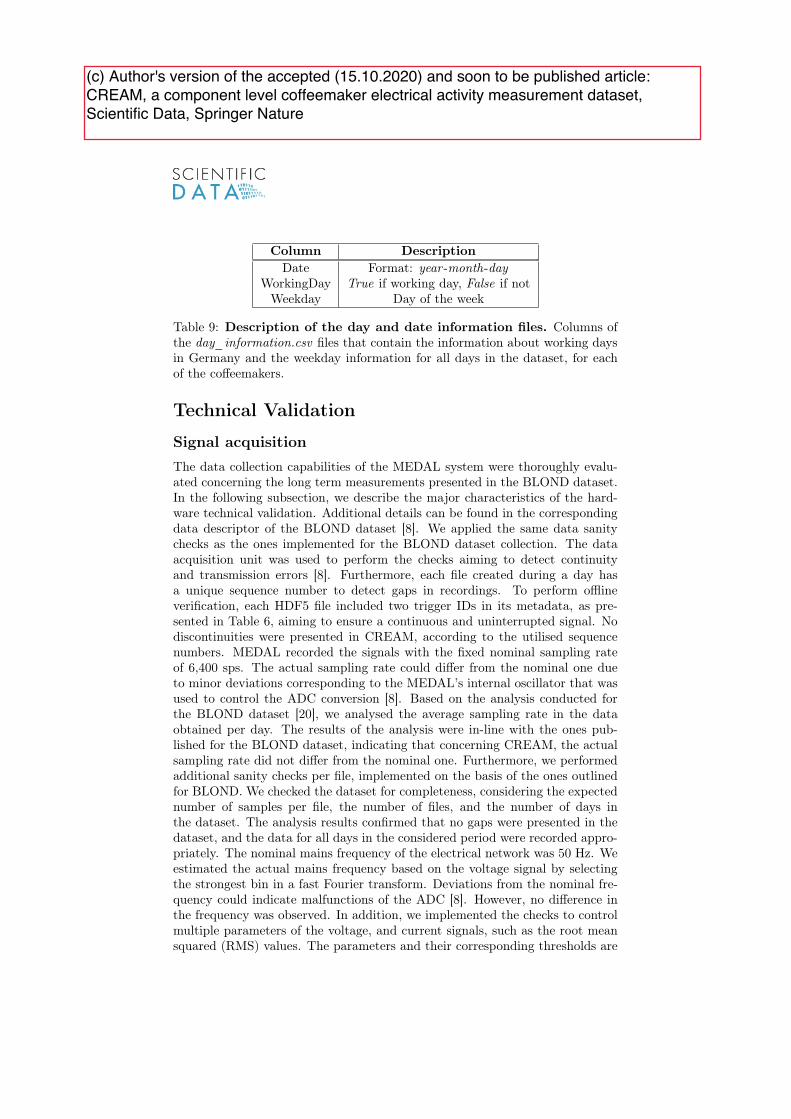
Column DescriptionDate Format: year -month-day
WorkingDay True if working day, False if notWeekday Day of the week
Table 9: Description of the day and date information files. Columns ofthe day_information.csv files that contain the information about working daysin Germany and the weekday information for all days in the dataset, for eachof the coffeemakers.
Technical Validation
Signal acquisitionThe data collection capabilities of the MEDAL system were thoroughly evalu-ated concerning the long term measurements presented in the BLOND dataset.In the following subsection, we describe the major characteristics of the hard-ware technical validation. Additional details can be found in the correspondingdata descriptor of the BLOND dataset [8]. We applied the same data sanitychecks as the ones implemented for the BLOND dataset collection. The dataacquisition unit was used to perform the checks aiming to detect continuityand transmission errors [8]. Furthermore, each file created during a day hasa unique sequence number to detect gaps in recordings. To perform offlineverification, each HDF5 file included two trigger IDs in its metadata, as pre-sented in Table 6, aiming to ensure a continuous and uninterrupted signal. Nodiscontinuities were presented in CREAM, according to the utilised sequencenumbers. MEDAL recorded the signals with the fixed nominal sampling rateof 6,400 sps. The actual sampling rate could differ from the nominal one dueto minor deviations corresponding to the MEDAL’s internal oscillator that wasused to control the ADC conversion [8]. Based on the analysis conducted forthe BLOND dataset [20], we analysed the average sampling rate in the dataobtained per day. The results of the analysis were in-line with the ones pub-lished for the BLOND dataset, indicating that concerning CREAM, the actualsampling rate did not differ from the nominal one. Furthermore, we performedadditional sanity checks per file, implemented on the basis of the ones outlinedfor BLOND. We checked the dataset for completeness, considering the expectednumber of samples per file, the number of files, and the number of days inthe dataset. The analysis results confirmed that no gaps were presented in thedataset, and the data for all days in the considered period were recorded appro-priately. The nominal mains frequency of the electrical network was 50 Hz. Weestimated the actual mains frequency based on the voltage signal by selectingthe strongest bin in a fast Fourier transform. Deviations from the nominal fre-quency could indicate malfunctions of the ADC [8]. However, no difference inthe frequency was observed. In addition, we implemented the checks to controlmultiple parameters of the voltage, and current signals, such as the root meansquared (RMS) values. The parameters and their corresponding thresholds are
(c) Author's version of the accepted (15.10.2020) and soon to be published article: CREAM, a component level coffeemaker electrical activity measurement dataset, Scientific Data, Springer Nature
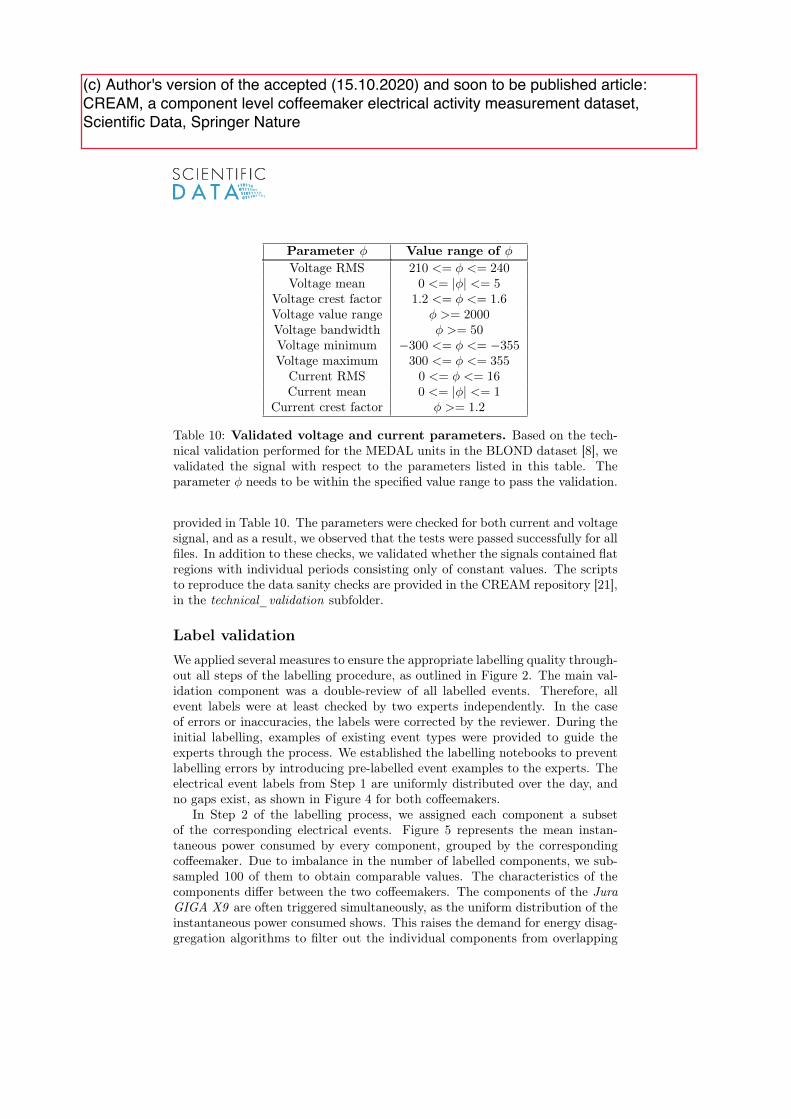
Parameter � Value range of �
Voltage RMS 210 <= � <= 240Voltage mean 0 <= |�| <= 5
Voltage crest factor 1.2 <= � <= 1.6Voltage value range � >= 2000Voltage bandwidth � >= 50Voltage minimum �300 <= � <= �355Voltage maximum 300 <= � <= 355
Current RMS 0 <= � <= 16Current mean 0 <= |�| <= 1
Current crest factor � >= 1.2
Table 10: Validated voltage and current parameters. Based on the tech-nical validation performed for the MEDAL units in the BLOND dataset [8], wevalidated the signal with respect to the parameters listed in this table. Theparameter � needs to be within the specified value range to pass the validation.
provided in Table 10. The parameters were checked for both current and voltagesignal, and as a result, we observed that the tests were passed successfully for allfiles. In addition to these checks, we validated whether the signals contained flatregions with individual periods consisting only of constant values. The scriptsto reproduce the data sanity checks are provided in the CREAM repository [21],in the technical_validation subfolder.
Label validationWe applied several measures to ensure the appropriate labelling quality through-out all steps of the labelling procedure, as outlined in Figure 2. The main val-idation component was a double-review of all labelled events. Therefore, allevent labels were at least checked by two experts independently. In the caseof errors or inaccuracies, the labels were corrected by the reviewer. During theinitial labelling, examples of existing event types were provided to guide theexperts through the process. We established the labelling notebooks to preventlabelling errors by introducing pre-labelled event examples to the experts. Theelectrical event labels from Step 1 are uniformly distributed over the day, andno gaps exist, as shown in Figure 4 for both coffeemakers.
In Step 2 of the labelling process, we assigned each component a subsetof the corresponding electrical events. Figure 5 represents the mean instan-taneous power consumed by every component, grouped by the correspondingcoffeemaker. Due to imbalance in the number of labelled components, we sub-sampled 100 of them to obtain comparable values. The characteristics of thecomponents differ between the two coffeemakers. The components of the JuraGIGA X9 are often triggered simultaneously, as the uniform distribution of theinstantaneous power consumed shows. This raises the demand for energy disag-gregation algorithms to filter out the individual components from overlapping
(c) Author's version of the accepted (15.10.2020) and soon to be published article: CREAM, a component level coffeemaker electrical activity measurement dataset, Scientific Data, Springer Nature
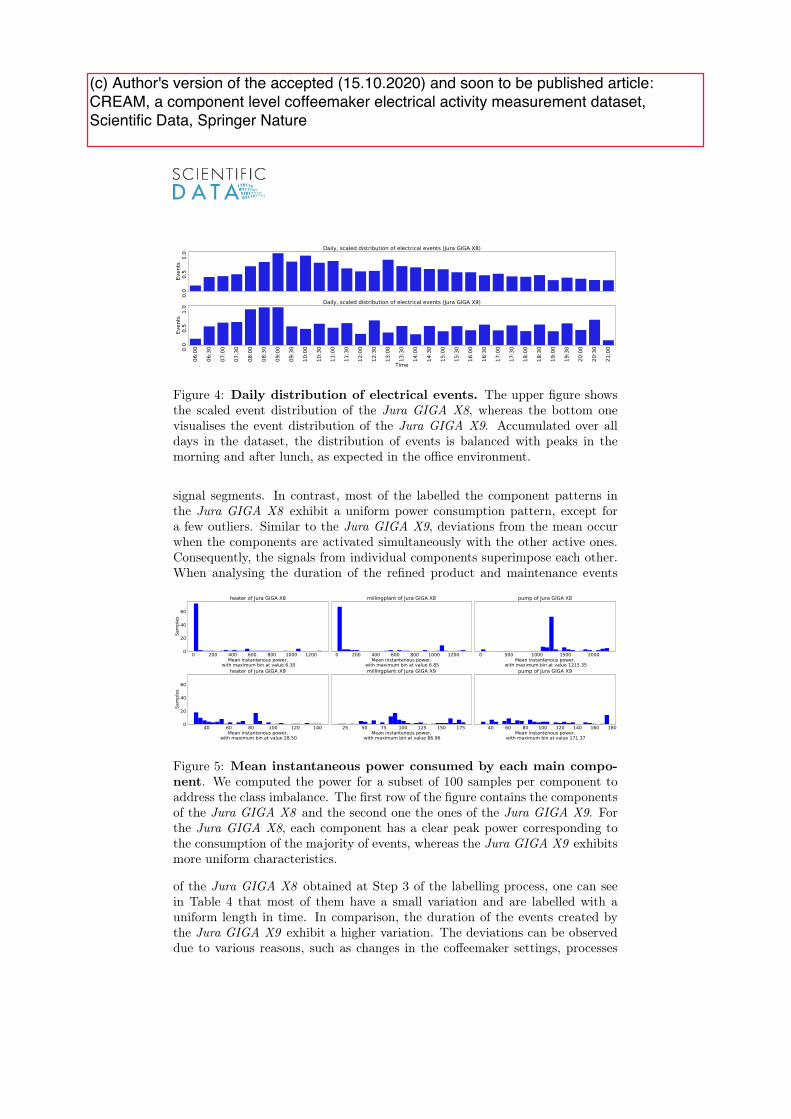
Figure 4: Daily distribution of electrical events. The upper figure showsthe scaled event distribution of the Jura GIGA X8, whereas the bottom onevisualises the event distribution of the Jura GIGA X9. Accumulated over alldays in the dataset, the distribution of events is balanced with peaks in themorning and after lunch, as expected in the office environment.
signal segments. In contrast, most of the labelled the component patterns inthe Jura GIGA X8 exhibit a uniform power consumption pattern, except fora few outliers. Similar to the Jura GIGA X9, deviations from the mean occurwhen the components are activated simultaneously with the other active ones.Consequently, the signals from individual components superimpose each other.When analysing the duration of the refined product and maintenance events
Figure 5: Mean instantaneous power consumed by each main compo-nent. We computed the power for a subset of 100 samples per component toaddress the class imbalance. The first row of the figure contains the componentsof the Jura GIGA X8 and the second one the ones of the Jura GIGA X9. Forthe Jura GIGA X8, each component has a clear peak power corresponding tothe consumption of the majority of events, whereas the Jura GIGA X9 exhibitsmore uniform characteristics.
of the Jura GIGA X8 obtained at Step 3 of the labelling process, one can seein Table 4 that most of them have a small variation and are labelled with auniform length in time. In comparison, the duration of the events created bythe Jura GIGA X9 exhibit a higher variation. The deviations can be observeddue to various reasons, such as changes in the coffeemaker settings, processes
(c) Author's version of the accepted (15.10.2020) and soon to be published article: CREAM, a component level coffeemaker electrical activity measurement dataset, Scientific Data, Springer Nature
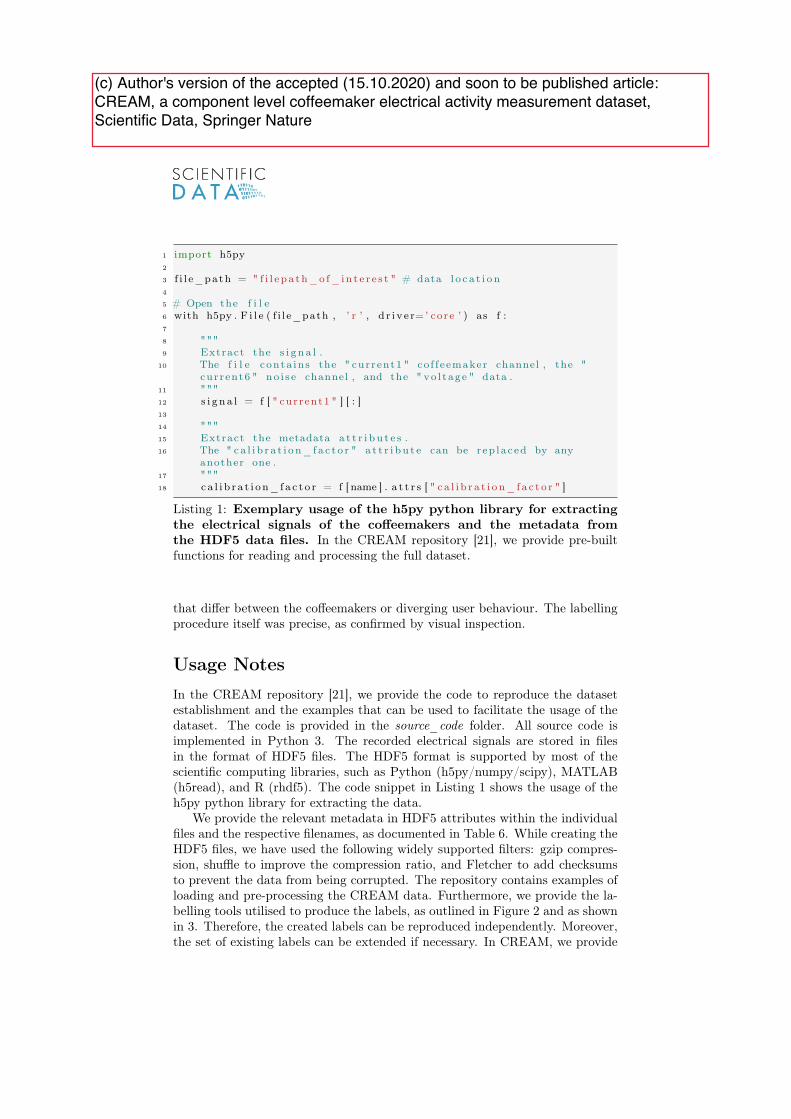
1 import h5py2
3 f i l e_path = " f i l e p a th_o f_ in t e r e s t " # data l o c a t i o n4
5 # Open the f i l e6 with h5py . F i l e ( f i l e_path , ’ r ’ , d r i v e r=’ core ’ ) as f :7
8 """9 Extract the s i g n a l .
10 The f i l e conta in s the " current1 " co f f eemaker channel , the "cur rent6 " no i s e channel , and the " vo l tage " data .
11 """12 s i g n a l = f [ " cur rent1 " ] [ : ]13
14 """15 Extract the metadata a t t r i b u t e s .16 The " c a l i b r a t i o n_ f a c t o r " a t t r i b u t e can be rep laced by any
another one .17 """18 c a l i b r a t i o n_ f a c t o r = f [ name ] . a t t r s [ " c a l i b r a t i o n_ f a c t o r " ]
Listing 1: Exemplary usage of the h5py python library for extractingthe electrical signals of the coffeemakers and the metadata fromthe HDF5 data files. In the CREAM repository [21], we provide pre-builtfunctions for reading and processing the full dataset.
that differ between the coffeemakers or diverging user behaviour. The labellingprocedure itself was precise, as confirmed by visual inspection.
Usage NotesIn the CREAM repository [21], we provide the code to reproduce the datasetestablishment and the examples that can be used to facilitate the usage of thedataset. The code is provided in the source_code folder. All source code isimplemented in Python 3. The recorded electrical signals are stored in filesin the format of HDF5 files. The HDF5 format is supported by most of thescientific computing libraries, such as Python (h5py/numpy/scipy), MATLAB(h5read), and R (rhdf5). The code snippet in Listing 1 shows the usage of theh5py python library for extracting the data.
We provide the relevant metadata in HDF5 attributes within the individualfiles and the respective filenames, as documented in Table 6. While creating theHDF5 files, we have used the following widely supported filters: gzip compres-sion, shuffle to improve the compression ratio, and Fletcher to add checksumsto prevent the data from being corrupted. The repository contains examples ofloading and pre-processing the CREAM data. Furthermore, we provide the la-belling tools utilised to produce the labels, as outlined in Figure 2 and as shownin 3. Therefore, the created labels can be reproduced independently. Moreover,the set of existing labels can be extended if necessary. In CREAM, we provide
(c) Author's version of the accepted (15.10.2020) and soon to be published article: CREAM, a component level coffeemaker electrical activity measurement dataset, Scientific Data, Springer Nature
the raw measurements to avoid any bias caused by data pre-processing. Despitethat, we recommend applying two pre-processing steps for most of the potentialanalysis techniques. First, we recommend to calibrate the signals according tothe calibration factors provided in the file metadata (see Table 6). Second, wesuggest removing any DC-bias by subtracting the mean offset from each mains-cycle in the signal. We provide the implementations for both pre-processingsteps in the repository, according to the instructions outlined in the BLONDrepository [20].
AcknowledgementsThis research was supported by the Federal Ministry for Economic Affairs andEnergy based on a decision by the German Bundestag and the Technical Univer-sity of Munich (TUM) within the funding programme Open Access Publishing.We would like to thank the company All for One Steeb AG for providing accessto coffeemaker logs and data. Furthermore, we want to thank the companyQ42 for publicly providing the code for accessing the serial port of the cof-feemakers. The icons used in Figure 1 are provided by the platform icons8(https://icons8.de/) for free usage.
Author ContributionsDaniel Jorde designed and performed the dataset collection, technical validationsteps and developed the software code and the manuscript. Thomas Kriech-baumer developed the MEDAL measurement unit and set up the necessarydata collection infrastructure. Tim Berger and Stefan Zitzlsperger, togetherwith Daniel Jorde, were responsible for the labelling of the events. Hans-ArnoJacobsen incepted the research project, lead and oversaw it, and provided con-ceptual guides while supervising Daniel Jorde’s Ph.D.
Competing InterestsThe authors declare no competing interests.
References[1] Colombo, A. W., Karnouskos, S., Kaynak, O., Shi, Y. & Yin, S. Industrial
Cyberphysical Systems: A Backbone of the Fourth Industrial Revolution.IEEE Industrial Electronics Magazine 11, 6–16 (2017).
[2] International Energy Agency. World Energy Outlook 2019. https://www.iea.org/reports/world-energy-outlook-2019 (2019).
(c) Author's version of the accepted (15.10.2020) and soon to be published article: CREAM, a component level coffeemaker electrical activity measurement dataset, Scientific Data, Springer Nature
[3] Condition Monitoring and Diagnostics of Machines — General Guidelines.Standard, International Organization for Standardization, Geneva, CH(2018).
[4] DeNucci, T. et al. Diagnostic Indicators for Shipboard Systems using Non-Intrusive Load Monitoring. In IEEE Electric Ship Technologies Symposium,413–420 (IEEE, Piscataway, NJ, 2005).
[5] Suzuki, R., Kohmoto, S. & Ogatsu, T. Non-Intrusive Condition Monitor-ing for Manufacturing Systems. In 2017 25th European Signal ProcessingConference (EUSIPCO), 1390–1394 (2017).
[6] Zoha, A., Gluhak, A., Imran, M. A. & Rajasegarar, S. Non-IntrusiveLoad Monitoring Approaches for Disaggregated Energy Sensing: A Survey.Sensors 16838–16866 (2012).
[7] Makonin, S. & Popowich, F. Nonintrusive Load Monitoring (NILM) Per-formance Evaluation. Energy Efficiency 8, 809–814 (2014).
[8] Kriechbaumer, T. & Jacobsen, H.-A. BLOND, a Building-Level OfficeEnvironment Dataset of Typical Electrical Appliances. Scientific Data 5(2018).
[9] Armel, C., Gupta, A., Shrimali, G. & Albert, A. Is Disaggregation theHoly Grail of Energy Efficiency? The Case of Electricity. Energy Policy52, 213–234 (2013).
[10] Martins, P. B. M., Gomes, J. G. R. C., Nascimento, V. B. & de Freitas,A. R. Application of a Deep Learning Generative Model to Load Disaggre-gation for Industrial Machinery Power Consumption Monitoring. In 2018IEEE International Conference on Communications, Control, and Comput-ing Technologies for Smart Grids (SmartGridComm), 1–6 (IEEE, Aalborg,2018).
[11] Kahl, M. et al. Measurement System and Dataset for in-depth Analysis ofAppliance Energy Consumption in Industrial Environment. https://www.in.tum.de/i13/resources/lilacd/ (2019).
[12] Agogino, A. & Goebel, K. Milling Dataset. https://ti.arc.nasa.gov/tech/dash/groups/pcoe/prognostic-data-repository/ (2007).
[13] Saxena, A. & Goebel, K. Turbofan Engine Degradation Simula-tion Data Set. https://ti.arc.nasa.gov/tech/dash/groups/pcoe/prognostic-data-repository/ (2008).
[14] Condition Monitoring of Hydraulic Systems Data Set. https://archive.ics.uci.edu/ml/datasets/Condition+monitoring+of+hydraulic+systems (2018).
(c) Author's version of the accepted (15.10.2020) and soon to be published article: CREAM, a component level coffeemaker electrical activity measurement dataset, Scientific Data, Springer Nature
[15] Kriechbaumer, T., Ul Haq, A., Kahl, M. & Jacobsen, H.-A. Medal: Acost-effective high-frequency energy data acquisition system for electricalappliances. In Proceedings of the Eighth International Conference on Fu-ture Energy Systems, e-Energy ’17, 216–221 (Association for ComputingMachinery, New York, NY, USA, 2017).
[16] JURA Elektroapparate AG. Giga X8 professional datasheet.https://www.jura.com/-/media/global/pdf/manuals-global/professional/GIGA-X8-G2/download_manual_jura_giga_x8.pdf(2020).
[17] JURA Elektroapparate AG. Giga X9 professional datasheet.https://us.jura.com/-/media/global/pdf/manuals-global/professional/GIGA-X9/download_manual_jura_giga_x9.pdf (2020).
[18] Microchip Technology Inc. Mcp3201 datasheet. http://ww1.microchip.com/downloads/en/DeviceDoc/21290D.pdf (2007).
[19] Q42. Coffee hack. https://github.com/Q42/coffeehack (2017).
[20] Kriechbaumer, T. Kriechi/building-level-office-environment-dataset: v1.0.Zenodo https://doi.org/10.5281/zenodo.838974 (2017).
[21] Jorde, D. & Jacobsen, H. CREAM: CoffeemakeR Electrical ActivityMeasurements for Condition Monitoring. Technical University of Munichhttps://doi.org/10.14459/2020mp1554766 (2020).
(c) Author's version of the accepted (15.10.2020) and soon to be published article: CREAM, a component level coffeemaker electrical activity measurement dataset, Scientific Data, Springer Nature

APPENDIX . APPENDICES
B MEED: An Unsupervised Multi-Environment EventDetector for Non-Intrusive Load Monitoring
75
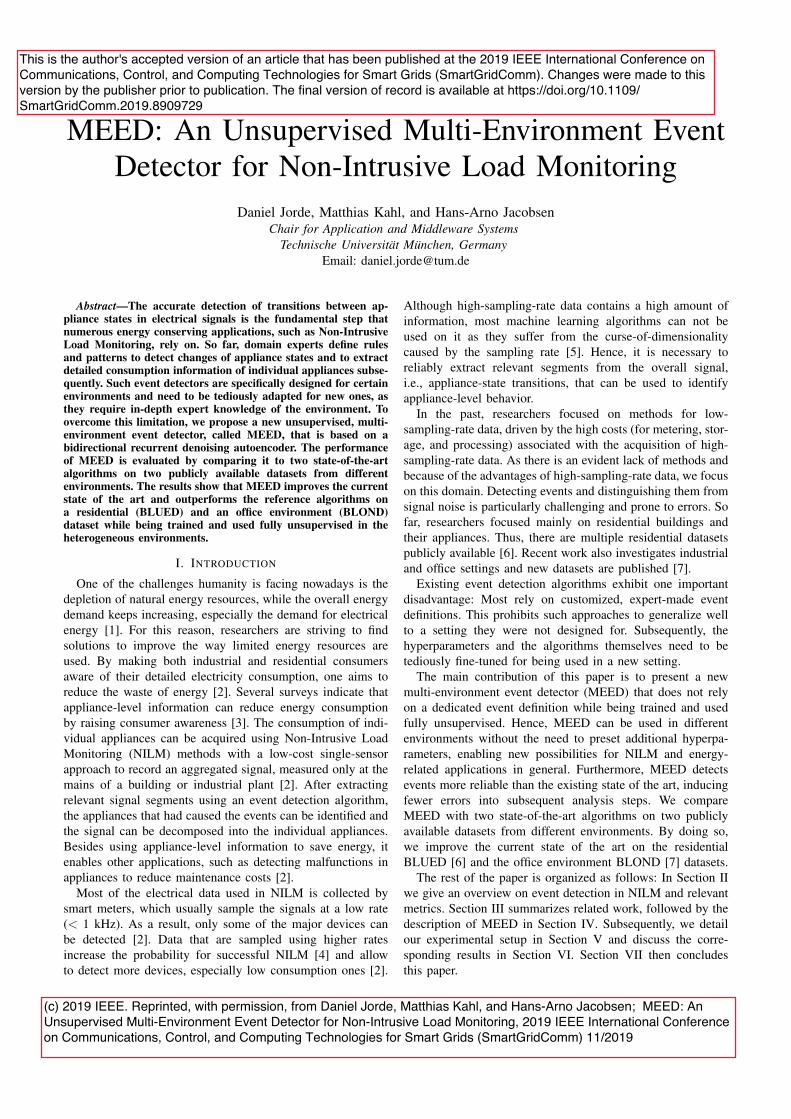
MEED: An Unsupervised Multi-Environment EventDetector for Non-Intrusive Load Monitoring
Daniel Jorde, Matthias Kahl, and Hans-Arno JacobsenChair for Application and Middleware Systems
Technische Universitat Munchen, GermanyEmail: [email protected]
Abstract—The accurate detection of transitions between ap-pliance states in electrical signals is the fundamental step thatnumerous energy conserving applications, such as Non-IntrusiveLoad Monitoring, rely on. So far, domain experts define rulesand patterns to detect changes of appliance states and to extractdetailed consumption information of individual appliances subse-quently. Such event detectors are specifically designed for certainenvironments and need to be tediously adapted for new ones, asthey require in-depth expert knowledge of the environment. Toovercome this limitation, we propose a new unsupervised, multi-environment event detector, called MEED, that is based on abidirectional recurrent denoising autoencoder. The performanceof MEED is evaluated by comparing it to two state-of-the-artalgorithms on two publicly available datasets from differentenvironments. The results show that MEED improves the currentstate of the art and outperforms the reference algorithms ona residential (BLUED) and an office environment (BLOND)dataset while being trained and used fully unsupervised in theheterogeneous environments.
I. INTRODUCTION
One of the challenges humanity is facing nowadays is thedepletion of natural energy resources, while the overall energydemand keeps increasing, especially the demand for electricalenergy [1]. For this reason, researchers are striving to findsolutions to improve the way limited energy resources areused. By making both industrial and residential consumersaware of their detailed electricity consumption, one aims toreduce the waste of energy [2]. Several surveys indicate thatappliance-level information can reduce energy consumptionby raising consumer awareness [3]. The consumption of indi-vidual appliances can be acquired using Non-Intrusive LoadMonitoring (NILM) methods with a low-cost single-sensorapproach to record an aggregated signal, measured only at themains of a building or industrial plant [2]. After extractingrelevant signal segments using an event detection algorithm,the appliances that had caused the events can be identified andthe signal can be decomposed into the individual appliances.Besides using appliance-level information to save energy, itenables other applications, such as detecting malfunctions inappliances to reduce maintenance costs [2].
Most of the electrical data used in NILM is collected bysmart meters, which usually sample the signals at a low rate(< 1 kHz). As a result, only some of the major devices canbe detected [2]. Data that are sampled using higher ratesincrease the probability for successful NILM [4] and allowto detect more devices, especially low consumption ones [2].
Although high-sampling-rate data contains a high amount ofinformation, most machine learning algorithms can not beused on it as they suffer from the curse-of-dimensionalitycaused by the sampling rate [5]. Hence, it is necessary toreliably extract relevant segments from the overall signal,i.e., appliance-state transitions, that can be used to identifyappliance-level behavior.
In the past, researchers focused on methods for low-sampling-rate data, driven by the high costs (for metering, stor-age, and processing) associated with the acquisition of high-sampling-rate data. As there is an evident lack of methods andbecause of the advantages of high-sampling-rate data, we focuson this domain. Detecting events and distinguishing them fromsignal noise is particularly challenging and prone to errors. Sofar, researchers focused mainly on residential buildings andtheir appliances. Thus, there are multiple residential datasetspublicly available [6]. Recent work also investigates industrialand office settings and new datasets are published [7].
Existing event detection algorithms exhibit one importantdisadvantage: Most rely on customized, expert-made eventdefinitions. This prohibits such approaches to generalize wellto a setting they were not designed for. Subsequently, thehyperparameters and the algorithms themselves need to betediously fine-tuned for being used in a new setting.
The main contribution of this paper is to present a newmulti-environment event detector (MEED) that does not relyon a dedicated event definition while being trained and usedfully unsupervised. Hence, MEED can be used in differentenvironments without the need to preset additional hyperpa-rameters, enabling new possibilities for NILM and energy-related applications in general. Furthermore, MEED detectsevents more reliable than the existing state of the art, inducingfewer errors into subsequent analysis steps. We compareMEED with two state-of-the-art algorithms on two publiclyavailable datasets from different environments. By doing so,we improve the current state of the art on the residentialBLUED [6] and the office environment BLOND [7] datasets.
The rest of the paper is organized as follows: In Section IIwe give an overview on event detection in NILM and relevantmetrics. Section III summarizes related work, followed by thedescription of MEED in Section IV. Subsequently, we detailour experimental setup in Section V and discuss the corre-sponding results in Section VI. Section VII then concludesthis paper.
This is the author's accepted version of an article that has been published at the 2019 IEEE International Conference on Communications, Control, and Computing Technologies for Smart Grids (SmartGridComm). Changes were made to this version by the publisher prior to publication. The final version of record is available at https://doi.org/10.1109/SmartGridComm.2019.8909729
(c) 2019 IEEE. Reprinted, with permission, from Daniel Jorde, Matthias Kahl, and Hans-Arno Jacobsen; MEED: An Unsupervised Multi-Environment Event Detector for Non-Intrusive Load Monitoring, 2019 IEEE International Conference on Communications, Control, and Computing Technologies for Smart Grids (SmartGridComm) 11/2019
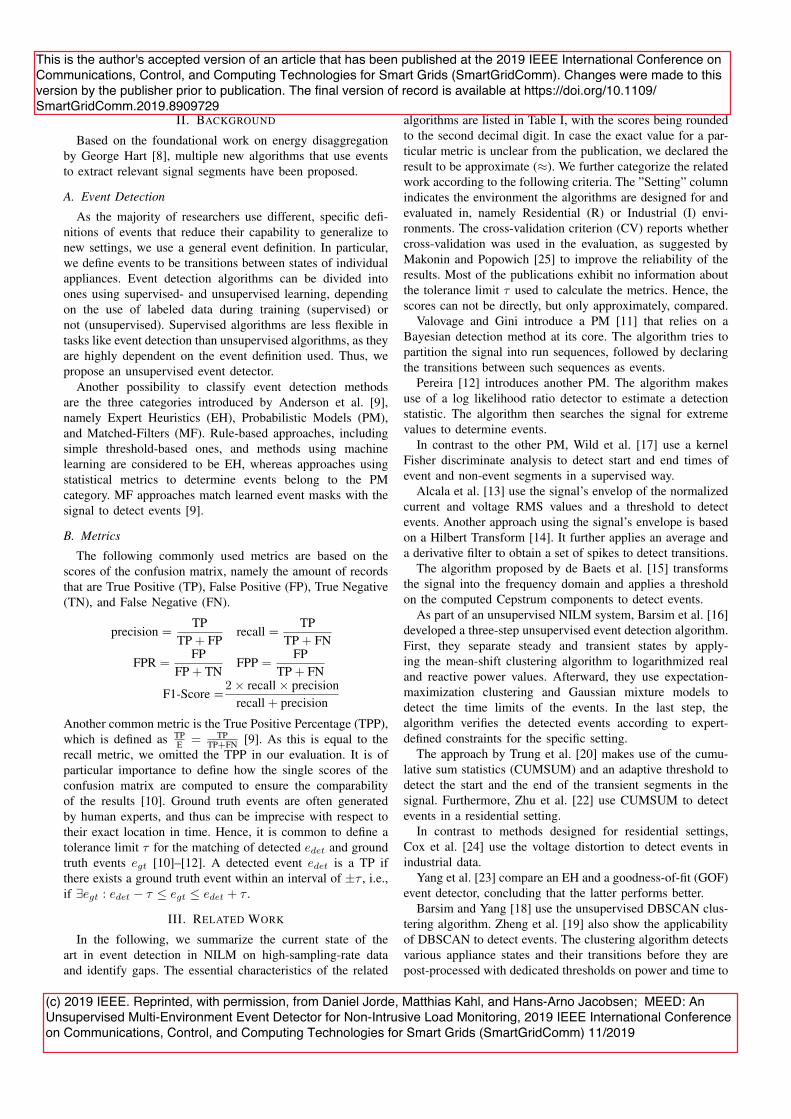
II. BACKGROUND
Based on the foundational work on energy disaggregationby George Hart [8], multiple new algorithms that use eventsto extract relevant signal segments have been proposed.
A. Event Detection
As the majority of researchers use different, specific defi-nitions of events that reduce their capability to generalize tonew settings, we use a general event definition. In particular,we define events to be transitions between states of individualappliances. Event detection algorithms can be divided intoones using supervised- and unsupervised learning, dependingon the use of labeled data during training (supervised) ornot (unsupervised). Supervised algorithms are less flexible intasks like event detection than unsupervised algorithms, as theyare highly dependent on the event definition used. Thus, wepropose an unsupervised event detector.
Another possibility to classify event detection methodsare the three categories introduced by Anderson et al. [9],namely Expert Heuristics (EH), Probabilistic Models (PM),and Matched-Filters (MF). Rule-based approaches, includingsimple threshold-based ones, and methods using machinelearning are considered to be EH, whereas approaches usingstatistical metrics to determine events belong to the PMcategory. MF approaches match learned event masks with thesignal to detect events [9].
B. Metrics
The following commonly used metrics are based on thescores of the confusion matrix, namely the amount of recordsthat are True Positive (TP), False Positive (FP), True Negative(TN), and False Negative (FN).
precision =TP
TP + FPrecall =
TPTP + FN
FPR =FP
FP + TNFPP =
FPTP + FN
F1-Score =2 ⇥ recall ⇥ precision
recall + precision
Another common metric is the True Positive Percentage (TPP),which is defined as TP
E = TPTP+FN [9]. As this is equal to the
recall metric, we omitted the TPP in our evaluation. It is ofparticular importance to define how the single scores of theconfusion matrix are computed to ensure the comparabilityof the results [10]. Ground truth events are often generatedby human experts, and thus can be imprecise with respect totheir exact location in time. Hence, it is common to define atolerance limit ⌧ for the matching of detected edet and groundtruth events egt [10]–[12]. A detected event edet is a TP ifthere exists a ground truth event within an interval of ±⌧ , i.e.,if 9egt : edet � ⌧ egt edet + ⌧ .
III. RELATED WORK
In the following, we summarize the current state of theart in event detection in NILM on high-sampling-rate dataand identify gaps. The essential characteristics of the related
algorithms are listed in Table I, with the scores being roundedto the second decimal digit. In case the exact value for a par-ticular metric is unclear from the publication, we declared theresult to be approximate (⇡). We further categorize the relatedwork according to the following criteria. The ”Setting” columnindicates the environment the algorithms are designed for andevaluated in, namely Residential (R) or Industrial (I) envi-ronments. The cross-validation criterion (CV) reports whethercross-validation was used in the evaluation, as suggested byMakonin and Popowich [25] to improve the reliability of theresults. Most of the publications exhibit no information aboutthe tolerance limit ⌧ used to calculate the metrics. Hence, thescores can not be directly, but only approximately, compared.
Valovage and Gini introduce a PM [11] that relies on aBayesian detection method at its core. The algorithm tries topartition the signal into run sequences, followed by declaringthe transitions between such sequences as events.
Pereira [12] introduces another PM. The algorithm makesuse of a log likelihood ratio detector to estimate a detectionstatistic. The algorithm then searches the signal for extremevalues to determine events.
In contrast to the other PM, Wild et al. [17] use a kernelFisher discriminate analysis to detect start and end times ofevent and non-event segments in a supervised way.
Alcala et al. [13] use the signal’s envelop of the normalizedcurrent and voltage RMS values and a threshold to detectevents. Another approach using the signal’s envelope is basedon a Hilbert Transform [14]. It further applies an average anda derivative filter to obtain a set of spikes to detect transitions.
The algorithm proposed by de Baets et al. [15] transformsthe signal into the frequency domain and applies a thresholdon the computed Cepstrum components to detect events.
As part of an unsupervised NILM system, Barsim et al. [16]developed a three-step unsupervised event detection algorithm.First, they separate steady and transient states by apply-ing the mean-shift clustering algorithm to logarithmized realand reactive power values. Afterward, they use expectation-maximization clustering and Gaussian mixture models todetect the time limits of the events. In the last step, thealgorithm verifies the detected events according to expert-defined constraints for the specific setting.
The approach by Trung et al. [20] makes use of the cumu-lative sum statistics (CUMSUM) and an adaptive threshold todetect the start and the end of the transient segments in thesignal. Furthermore, Zhu et al. [22] use CUMSUM to detectevents in a residential setting.
In contrast to methods designed for residential settings,Cox et al. [24] use the voltage distortion to detect events inindustrial data.
Yang et al. [23] compare an EH and a goodness-of-fit (GOF)event detector, concluding that the latter performs better.
Barsim and Yang [18] use the unsupervised DBSCAN clus-tering algorithm. Zheng et al. [19] also show the applicabilityof DBSCAN to detect events. The clustering algorithm detectsvarious appliance states and their transitions before they arepost-processed with dedicated thresholds on power and time to
This is the author's accepted version of an article that has been published at the 2019 IEEE International Conference on Communications, Control, and Computing Technologies for Smart Grids (SmartGridComm). Changes were made to this version by the publisher prior to publication. The final version of record is available at https://doi.org/10.1109/SmartGridComm.2019.8909729
(c) 2019 IEEE. Reprinted, with permission, from Daniel Jorde, Matthias Kahl, and Hans-Arno Jacobsen; MEED: An Unsupervised Multi-Environment Event Detector for Non-Intrusive Load Monitoring, 2019 IEEE International Conference on Communications, Control, and Computing Technologies for Smart Grids (SmartGridComm) 11/2019
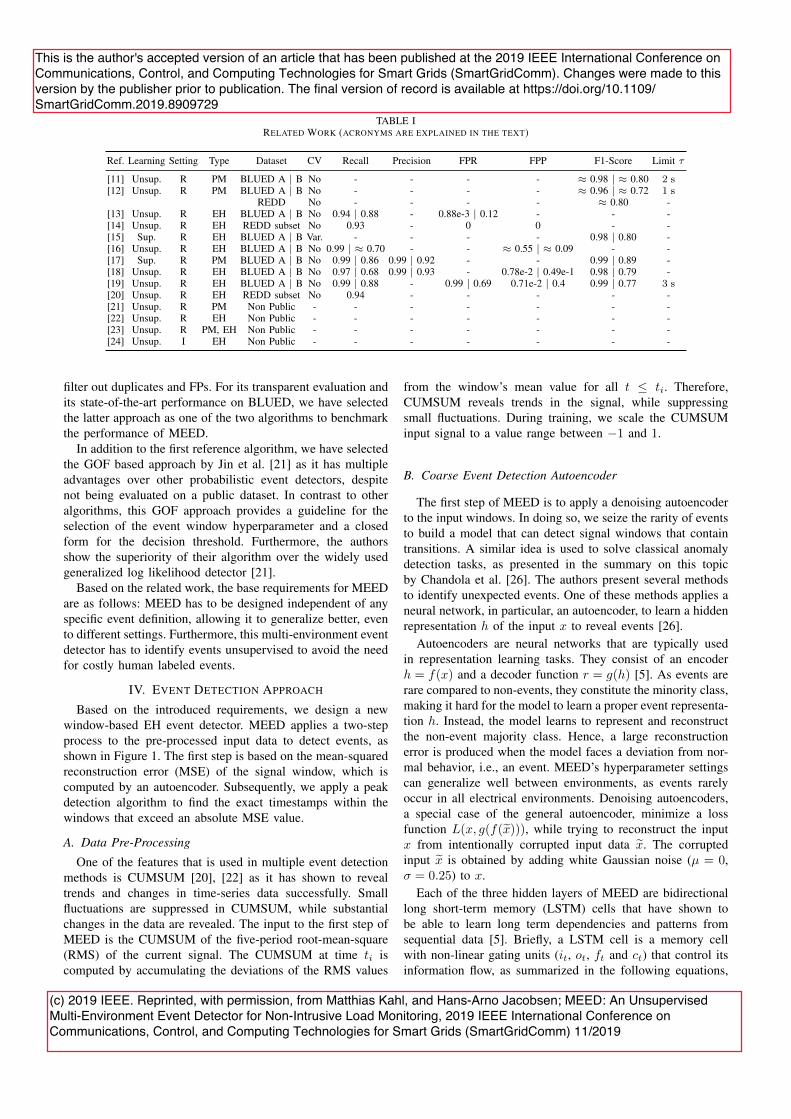
TABLE IRELATED WORK (ACRONYMS ARE EXPLAINED IN THE TEXT)
Ref. Learning Setting Type Dataset CV Recall Precision FPR FPP F1-Score Limit ⌧
[11] Unsup. R PM BLUED A | B No - - - - ⇡ 0.98 | ⇡ 0.80 2 s[12] Unsup. R PM BLUED A | B No - - - - ⇡ 0.96 | ⇡ 0.72 1 s
REDD No - - - - ⇡ 0.80 -[13] Unsup. R EH BLUED A | B No 0.94 | 0.88 - 0.88e-3 | 0.12 - - -[14] Unsup. R EH REDD subset No 0.93 - 0 0 - -[15] Sup. R EH BLUED A | B Var. - - - - 0.98 | 0.80 -[16] Unsup. R EH BLUED A | B No 0.99 | ⇡ 0.70 - - ⇡ 0.55 | ⇡ 0.09 - -[17] Sup. R PM BLUED A | B No 0.99 | 0.86 0.99 | 0.92 - - 0.99 | 0.89 -[18] Unsup. R EH BLUED A | B No 0.97 | 0.68 0.99 | 0.93 - 0.78e-2 | 0.49e-1 0.98 | 0.79 -[19] Unsup. R EH BLUED A | B No 0.99 | 0.88 - 0.99 | 0.69 0.71e-2 | 0.4 0.99 | 0.77 3 s[20] Unsup. R EH REDD subset No 0.94 - - - - -[21] Unsup. R PM Non Public - - - - - - -[22] Unsup. R EH Non Public - - - - - - -[23] Unsup. R PM, EH Non Public - - - - - - -[24] Unsup. I EH Non Public - - - - - - -
filter out duplicates and FPs. For its transparent evaluation andits state-of-the-art performance on BLUED, we have selectedthe latter approach as one of the two algorithms to benchmarkthe performance of MEED.
In addition to the first reference algorithm, we have selectedthe GOF based approach by Jin et al. [21] as it has multipleadvantages over other probabilistic event detectors, despitenot being evaluated on a public dataset. In contrast to otheralgorithms, this GOF approach provides a guideline for theselection of the event window hyperparameter and a closedform for the decision threshold. Furthermore, the authorsshow the superiority of their algorithm over the widely usedgeneralized log likelihood detector [21].
Based on the related work, the base requirements for MEEDare as follows: MEED has to be designed independent of anyspecific event definition, allowing it to generalize better, evento different settings. Furthermore, this multi-environment eventdetector has to identify events unsupervised to avoid the needfor costly human labeled events.
IV. EVENT DETECTION APPROACH
Based on the introduced requirements, we design a newwindow-based EH event detector. MEED applies a two-stepprocess to the pre-processed input data to detect events, asshown in Figure 1. The first step is based on the mean-squaredreconstruction error (MSE) of the signal window, which iscomputed by an autoencoder. Subsequently, we apply a peakdetection algorithm to find the exact timestamps within thewindows that exceed an absolute MSE value.
A. Data Pre-Processing
One of the features that is used in multiple event detectionmethods is CUMSUM [20], [22] as it has shown to revealtrends and changes in time-series data successfully. Smallfluctuations are suppressed in CUMSUM, while substantialchanges in the data are revealed. The input to the first step ofMEED is the CUMSUM of the five-period root-mean-square(RMS) of the current signal. The CUMSUM at time ti iscomputed by accumulating the deviations of the RMS values
from the window’s mean value for all t ti. Therefore,CUMSUM reveals trends in the signal, while suppressingsmall fluctuations. During training, we scale the CUMSUMinput signal to a value range between �1 and 1.
B. Coarse Event Detection Autoencoder
The first step of MEED is to apply a denoising autoencoderto the input windows. In doing so, we seize the rarity of eventsto build a model that can detect signal windows that containtransitions. A similar idea is used to solve classical anomalydetection tasks, as presented in the summary on this topicby Chandola et al. [26]. The authors present several methodsto identify unexpected events. One of these methods applies aneural network, in particular, an autoencoder, to learn a hiddenrepresentation h of the input x to reveal events [26].
Autoencoders are neural networks that are typically usedin representation learning tasks. They consist of an encoderh = f(x) and a decoder function r = g(h) [5]. As events arerare compared to non-events, they constitute the minority class,making it hard for the model to learn a proper event representa-tion h. Instead, the model learns to represent and reconstructthe non-event majority class. Hence, a large reconstructionerror is produced when the model faces a deviation from nor-mal behavior, i.e., an event. MEED’s hyperparameter settingscan generalize well between environments, as events rarelyoccur in all electrical environments. Denoising autoencoders,a special case of the general autoencoder, minimize a lossfunction L(x, g(f(ex))), while trying to reconstruct the inputx from intentionally corrupted input data ex. The corruptedinput ex is obtained by adding white Gaussian noise (µ = 0,� = 0.25) to x.
Each of the three hidden layers of MEED are bidirectionallong short-term memory (LSTM) cells that have shown tobe able to learn long term dependencies and patterns fromsequential data [5]. Briefly, a LSTM cell is a memory cellwith non-linear gating units (it, ot, ft and ct) that control itsinformation flow, as summarized in the following equations,
This is the author's accepted version of an article that has been published at the 2019 IEEE International Conference on Communications, Control, and Computing Technologies for Smart Grids (SmartGridComm). Changes were made to this version by the publisher prior to publication. The final version of record is available at https://doi.org/10.1109/SmartGridComm.2019.8909729
(c) 2019 IEEE. Reprinted, with permission, from Matthias Kahl, and Hans-Arno Jacobsen; MEED: An Unsupervised Multi-Environment Event Detector for Non-Intrusive Load Monitoring, 2019 IEEE International Conference on Communications, Control, and Computing Technologies for Smart Grids (SmartGridComm) 11/2019
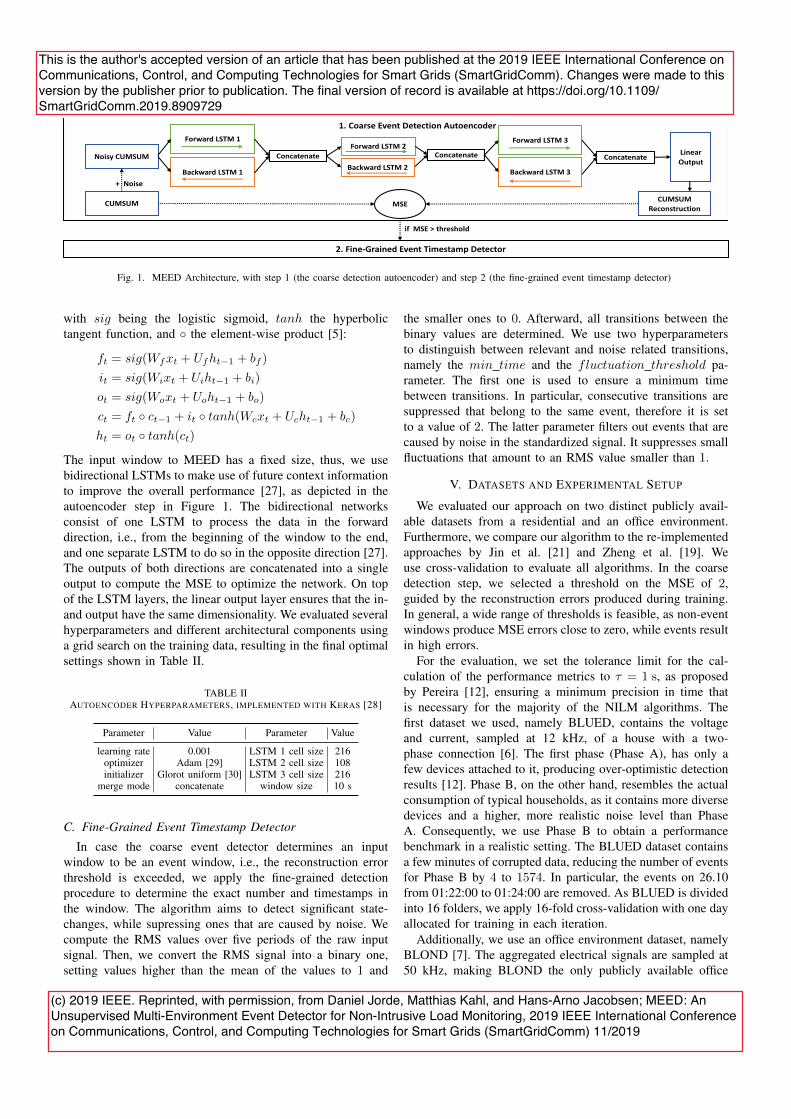
Forward LSTM 1
Backward LSTM 1
ConcatenateForward LSTM 2
Concatenate
Backward LSTM 2
Forward LSTM 3
Backward LSTM 3
ConcatenateLinear Output
Noisy CUMSUM
CUMSUM
+ Noise
CUMSUM Reconstruction
MSE
2. Fine-Grained Event Timestamp Detector
if MSE > threshold
1. Coarse Event Detection Autoencoder
Fig. 1. MEED Architecture, with step 1 (the coarse detection autoencoder) and step 2 (the fine-grained event timestamp detector)
with sig being the logistic sigmoid, tanh the hyperbolictangent function, and � the element-wise product [5]:
ft = sig(Wfxt + Ufht�1 + bf )
it = sig(Wixt + Uiht�1 + bi)
ot = sig(Woxt + Uoht�1 + bo)
ct = ft � ct�1 + it � tanh(Wcxt + Ucht�1 + bc)
ht = ot � tanh(ct)
The input window to MEED has a fixed size, thus, we usebidirectional LSTMs to make use of future context informationto improve the overall performance [27], as depicted in theautoencoder step in Figure 1. The bidirectional networksconsist of one LSTM to process the data in the forwarddirection, i.e., from the beginning of the window to the end,and one separate LSTM to do so in the opposite direction [27].The outputs of both directions are concatenated into a singleoutput to compute the MSE to optimize the network. On topof the LSTM layers, the linear output layer ensures that the in-and output have the same dimensionality. We evaluated severalhyperparameters and different architectural components usinga grid search on the training data, resulting in the final optimalsettings shown in Table II.
TABLE IIAUTOENCODER HYPERPARAMETERS, IMPLEMENTED WITH KERAS [28]
Parameter Value Parameter Value
learning rate 0.001 LSTM 1 cell size 216optimizer Adam [29] LSTM 2 cell size 108initializer Glorot uniform [30] LSTM 3 cell size 216
merge mode concatenate window size 10 s
C. Fine-Grained Event Timestamp Detector
In case the coarse event detector determines an inputwindow to be an event window, i.e., the reconstruction errorthreshold is exceeded, we apply the fine-grained detectionprocedure to determine the exact number and timestamps inthe window. The algorithm aims to detect significant state-changes, while supressing ones that are caused by noise. Wecompute the RMS values over five periods of the raw inputsignal. Then, we convert the RMS signal into a binary one,setting values higher than the mean of the values to 1 and
the smaller ones to 0. Afterward, all transitions between thebinary values are determined. We use two hyperparametersto distinguish between relevant and noise related transitions,namely the min time and the fluctuation threshold pa-rameter. The first one is used to ensure a minimum timebetween transitions. In particular, consecutive transitions aresuppressed that belong to the same event, therefore it is setto a value of 2. The latter parameter filters out events that arecaused by noise in the standardized signal. It suppresses smallfluctuations that amount to an RMS value smaller than 1.
V. DATASETS AND EXPERIMENTAL SETUP
We evaluated our approach on two distinct publicly avail-able datasets from a residential and an office environment.Furthermore, we compare our algorithm to the re-implementedapproaches by Jin et al. [21] and Zheng et al. [19]. Weuse cross-validation to evaluate all algorithms. In the coarsedetection step, we selected a threshold on the MSE of 2,guided by the reconstruction errors produced during training.In general, a wide range of thresholds is feasible, as non-eventwindows produce MSE errors close to zero, while events resultin high errors.
For the evaluation, we set the tolerance limit for the cal-culation of the performance metrics to ⌧ = 1 s, as proposedby Pereira [12], ensuring a minimum precision in time thatis necessary for the majority of the NILM algorithms. Thefirst dataset we used, namely BLUED, contains the voltageand current, sampled at 12 kHz, of a house with a two-phase connection [6]. The first phase (Phase A), has only afew devices attached to it, producing over-optimistic detectionresults [12]. Phase B, on the other hand, resembles the actualconsumption of typical households, as it contains more diversedevices and a higher, more realistic noise level than PhaseA. Consequently, we use Phase B to obtain a performancebenchmark in a realistic setting. The BLUED dataset containsa few minutes of corrupted data, reducing the number of eventsfor Phase B by 4 to 1574. In particular, the events on 26.10from 01:22:00 to 01:24:00 are removed. As BLUED is dividedinto 16 folders, we apply 16-fold cross-validation with one dayallocated for training in each iteration.
Additionally, we use an office environment dataset, namelyBLOND [7]. The aggregated electrical signals are sampled at50 kHz, making BLOND the only publicly available office
This is the author's accepted version of an article that has been published at the 2019 IEEE International Conference on Communications, Control, and Computing Technologies for Smart Grids (SmartGridComm). Changes were made to this version by the publisher prior to publication. The final version of record is available at https://doi.org/10.1109/SmartGridComm.2019.8909729
(c) 2019 IEEE. Reprinted, with permission, from Daniel Jorde, Matthias Kahl, and Hans-Arno Jacobsen; MEED: An Unsupervised Multi-Environment Event Detector for Non-Intrusive Load Monitoring, 2019 IEEE International Conference on Communications, Control, and Computing Technologies for Smart Grids (SmartGridComm) 11/2019
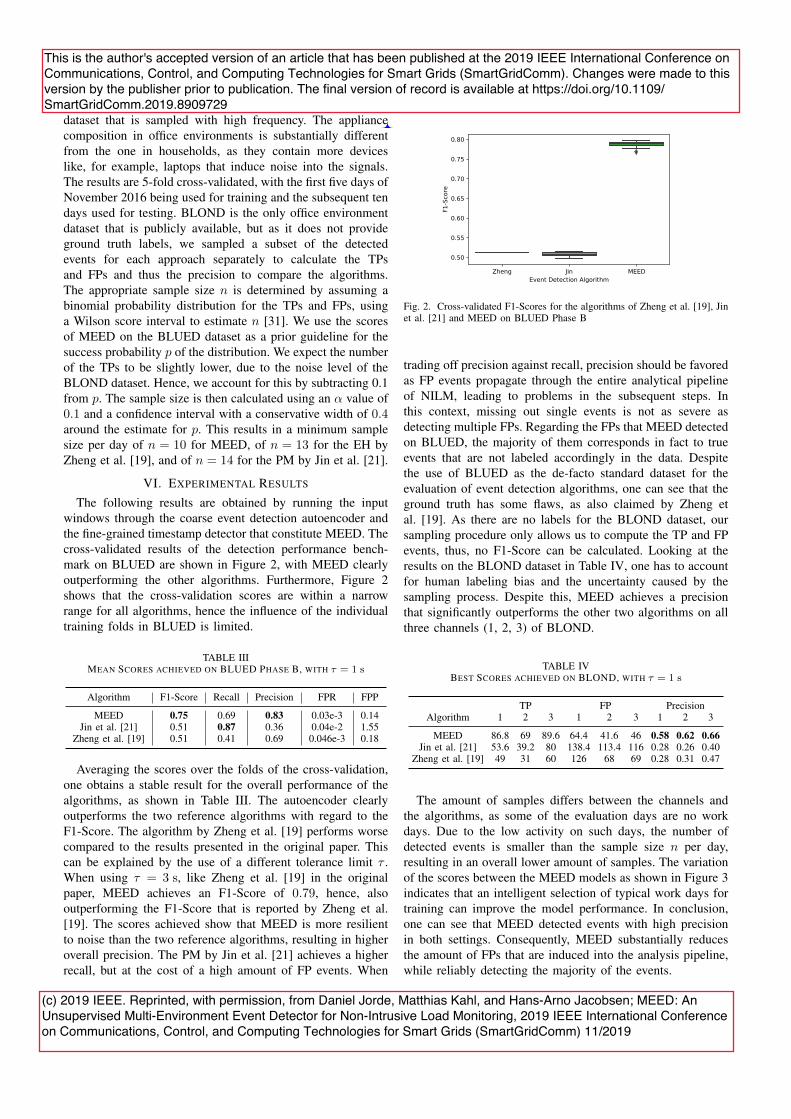
dataset that is sampled with high frequency. The appliancecomposition in office environments is substantially differentfrom the one in households, as they contain more deviceslike, for example, laptops that induce noise into the signals.The results are 5-fold cross-validated, with the first five days ofNovember 2016 being used for training and the subsequent tendays used for testing. BLOND is the only office environmentdataset that is publicly available, but as it does not provideground truth labels, we sampled a subset of the detectedevents for each approach separately to calculate the TPsand FPs and thus the precision to compare the algorithms.The appropriate sample size n is determined by assuming abinomial probability distribution for the TPs and FPs, usinga Wilson score interval to estimate n [31]. We use the scoresof MEED on the BLUED dataset as a prior guideline for thesuccess probability p of the distribution. We expect the numberof the TPs to be slightly lower, due to the noise level of theBLOND dataset. Hence, we account for this by subtracting 0.1from p. The sample size is then calculated using an ↵ value of0.1 and a confidence interval with a conservative width of 0.4around the estimate for p. This results in a minimum samplesize per day of n = 10 for MEED, of n = 13 for the EH byZheng et al. [19], and of n = 14 for the PM by Jin et al. [21].
VI. EXPERIMENTAL RESULTS
The following results are obtained by running the inputwindows through the coarse event detection autoencoder andthe fine-grained timestamp detector that constitute MEED. Thecross-validated results of the detection performance bench-mark on BLUED are shown in Figure 2, with MEED clearlyoutperforming the other algorithms. Furthermore, Figure 2shows that the cross-validation scores are within a narrowrange for all algorithms, hence the influence of the individualtraining folds in BLUED is limited.
TABLE IIIMEAN SCORES ACHIEVED ON BLUED PHASE B, WITH ⌧ = 1 s
Algorithm F1-Score Recall Precision FPR FPP
MEED 0.75 0.69 0.83 0.03e-3 0.14Jin et al. [21] 0.51 0.87 0.36 0.04e-2 1.55
Zheng et al. [19] 0.51 0.41 0.69 0.046e-3 0.18
Averaging the scores over the folds of the cross-validation,one obtains a stable result for the overall performance of thealgorithms, as shown in Table III. The autoencoder clearlyoutperforms the two reference algorithms with regard to theF1-Score. The algorithm by Zheng et al. [19] performs worsecompared to the results presented in the original paper. Thiscan be explained by the use of a different tolerance limit ⌧ .When using ⌧ = 3 s, like Zheng et al. [19] in the originalpaper, MEED achieves an F1-Score of 0.79, hence, alsooutperforming the F1-Score that is reported by Zheng et al.[19]. The scores achieved show that MEED is more resilientto noise than the two reference algorithms, resulting in higheroverall precision. The PM by Jin et al. [21] achieves a higherrecall, but at the cost of a high amount of FP events. When
Zheng Jin MEEDEvent Detection Algorithm
0.50
0.55
0.60
0.65
0.70
0.75
0.80
F1-S
core
Fig. 2. Cross-validated F1-Scores for the algorithms of Zheng et al. [19], Jinet al. [21] and MEED on BLUED Phase B
trading off precision against recall, precision should be favoredas FP events propagate through the entire analytical pipelineof NILM, leading to problems in the subsequent steps. Inthis context, missing out single events is not as severe asdetecting multiple FPs. Regarding the FPs that MEED detectedon BLUED, the majority of them corresponds in fact to trueevents that are not labeled accordingly in the data. Despitethe use of BLUED as the de-facto standard dataset for theevaluation of event detection algorithms, one can see that theground truth has some flaws, as also claimed by Zheng etal. [19]. As there are no labels for the BLOND dataset, oursampling procedure only allows us to compute the TP and FPevents, thus, no F1-Score can be calculated. Looking at theresults on the BLOND dataset in Table IV, one has to accountfor human labeling bias and the uncertainty caused by thesampling process. Despite this, MEED achieves a precisionthat significantly outperforms the other two algorithms on allthree channels (1, 2, 3) of BLOND.
TABLE IVBEST SCORES ACHIEVED ON BLOND, WITH ⌧ = 1 s
TP FP PrecisionAlgorithm 1 2 3 1 2 3 1 2 3
MEED 86.8 69 89.6 64.4 41.6 46 0.58 0.62 0.66Jin et al. [21] 53.6 39.2 80 138.4 113.4 116 0.28 0.26 0.40
Zheng et al. [19] 49 31 60 126 68 69 0.28 0.31 0.47
The amount of samples differs between the channels andthe algorithms, as some of the evaluation days are no workdays. Due to the low activity on such days, the number ofdetected events is smaller than the sample size n per day,resulting in an overall lower amount of samples. The variationof the scores between the MEED models as shown in Figure 3indicates that an intelligent selection of typical work days fortraining can improve the model performance. In conclusion,one can see that MEED detected events with high precisionin both settings. Consequently, MEED substantially reducesthe amount of FPs that are induced into the analysis pipeline,while reliably detecting the majority of the events.
This is the author's accepted version of an article that has been published at the 2019 IEEE International Conference on Communications, Control, and Computing Technologies for Smart Grids (SmartGridComm). Changes were made to this version by the publisher prior to publication. The final version of record is available at https://doi.org/10.1109/SmartGridComm.2019.8909729
(c) 2019 IEEE. Reprinted, with permission, from Daniel Jorde, Matthias Kahl, and Hans-Arno Jacobsen; MEED: An Unsupervised Multi-Environment Event Detector for Non-Intrusive Load Monitoring, 2019 IEEE International Conference on Communications, Control, and Computing Technologies for Smart Grids (SmartGridComm) 11/2019
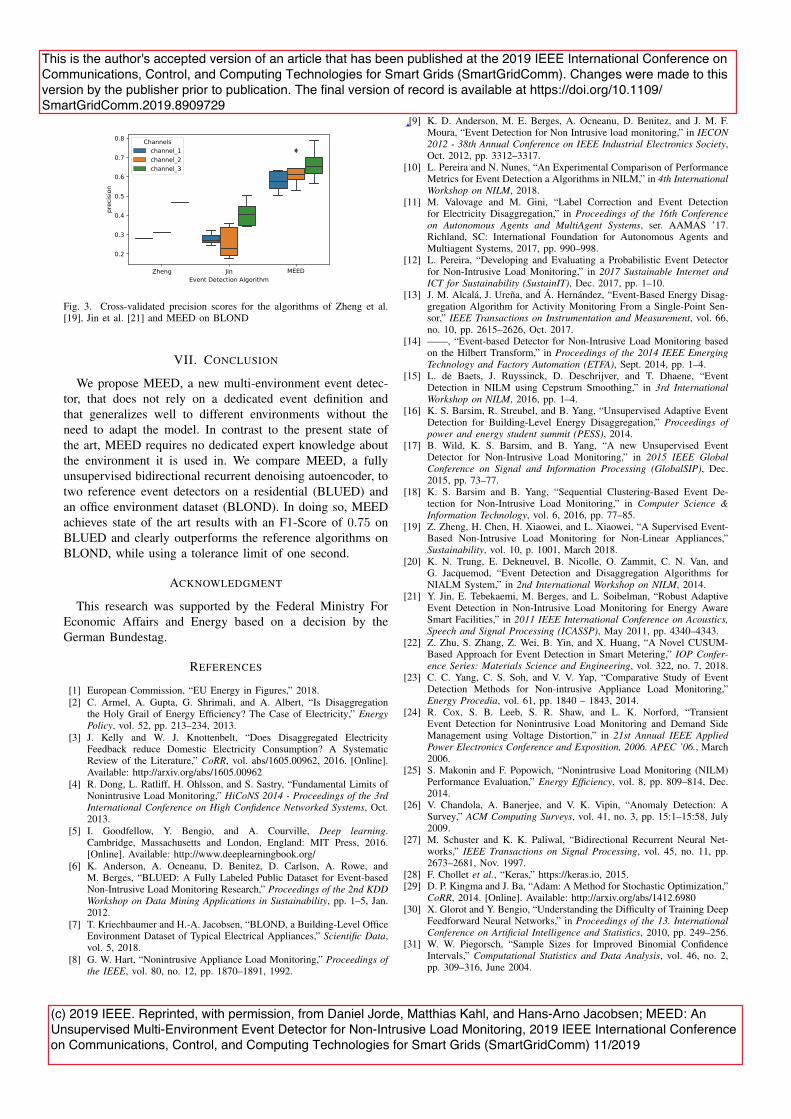
Zheng JinEvent Detection Algorithm
0.2
0.3
0.4
0.5
0.6
0.7
0.8
pre
cisi
on
Channels
channel_1
channel_2
channel_3
MEED
Fig. 3. Cross-validated precision scores for the algorithms of Zheng et al.[19], Jin et al. [21] and MEED on BLOND
VII. CONCLUSION
We propose MEED, a new multi-environment event detec-tor, that does not rely on a dedicated event definition andthat generalizes well to different environments without theneed to adapt the model. In contrast to the present state ofthe art, MEED requires no dedicated expert knowledge aboutthe environment it is used in. We compare MEED, a fullyunsupervised bidirectional recurrent denoising autoencoder, totwo reference event detectors on a residential (BLUED) andan office environment dataset (BLOND). In doing so, MEEDachieves state of the art results with an F1-Score of 0.75 onBLUED and clearly outperforms the reference algorithms onBLOND, while using a tolerance limit of one second.
ACKNOWLEDGMENT
This research was supported by the Federal Ministry ForEconomic Affairs and Energy based on a decision by theGerman Bundestag.
REFERENCES
[1] European Commission, “EU Energy in Figures,” 2018.[2] C. Armel, A. Gupta, G. Shrimali, and A. Albert, “Is Disaggregation
the Holy Grail of Energy Efficiency? The Case of Electricity,” EnergyPolicy, vol. 52, pp. 213–234, 2013.
[3] J. Kelly and W. J. Knottenbelt, “Does Disaggregated ElectricityFeedback reduce Domestic Electricity Consumption? A SystematicReview of the Literature,” CoRR, vol. abs/1605.00962, 2016. [Online].Available: http://arxiv.org/abs/1605.00962
[4] R. Dong, L. Ratliff, H. Ohlsson, and S. Sastry, “Fundamental Limits ofNonintrusive Load Monitoring,” HiCoNS 2014 - Proceedings of the 3rdInternational Conference on High Confidence Networked Systems, Oct.2013.
[5] I. Goodfellow, Y. Bengio, and A. Courville, Deep learning.Cambridge, Massachusetts and London, England: MIT Press, 2016.[Online]. Available: http://www.deeplearningbook.org/
[6] K. Anderson, A. Ocneanu, D. Benitez, D. Carlson, A. Rowe, andM. Berges, “BLUED: A Fully Labeled Public Dataset for Event-basedNon-Intrusive Load Monitoring Research,” Proceedings of the 2nd KDDWorkshop on Data Mining Applications in Sustainability, pp. 1–5, Jan.2012.
[7] T. Kriechbaumer and H.-A. Jacobsen, “BLOND, a Building-Level OfficeEnvironment Dataset of Typical Electrical Appliances,” Scientific Data,vol. 5, 2018.
[8] G. W. Hart, “Nonintrusive Appliance Load Monitoring,” Proceedings ofthe IEEE, vol. 80, no. 12, pp. 1870–1891, 1992.
[9] K. D. Anderson, M. E. Berges, A. Ocneanu, D. Benitez, and J. M. F.Moura, “Event Detection for Non Intrusive load monitoring,” in IECON2012 - 38th Annual Conference on IEEE Industrial Electronics Society,Oct. 2012, pp. 3312–3317.
[10] L. Pereira and N. Nunes, “An Experimental Comparison of PerformanceMetrics for Event Detection a Algorithms in NILM,” in 4th InternationalWorkshop on NILM, 2018.
[11] M. Valovage and M. Gini, “Label Correction and Event Detectionfor Electricity Disaggregation,” in Proceedings of the 16th Conferenceon Autonomous Agents and MultiAgent Systems, ser. AAMAS ’17.Richland, SC: International Foundation for Autonomous Agents andMultiagent Systems, 2017, pp. 990–998.
[12] L. Pereira, “Developing and Evaluating a Probabilistic Event Detectorfor Non-Intrusive Load Monitoring,” in 2017 Sustainable Internet andICT for Sustainability (SustainIT), Dec. 2017, pp. 1–10.
[13] J. M. Alcala, J. Urena, and A. Hernandez, “Event-Based Energy Disag-gregation Algorithm for Activity Monitoring From a Single-Point Sen-sor,” IEEE Transactions on Instrumentation and Measurement, vol. 66,no. 10, pp. 2615–2626, Oct. 2017.
[14] ——, “Event-based Detector for Non-Intrusive Load Monitoring basedon the Hilbert Transform,” in Proceedings of the 2014 IEEE EmergingTechnology and Factory Automation (ETFA), Sept. 2014, pp. 1–4.
[15] L. de Baets, J. Ruyssinck, D. Deschrijver, and T. Dhaene, “EventDetection in NILM using Cepstrum Smoothing,” in 3rd InternationalWorkshop on NILM, 2016, pp. 1–4.
[16] K. S. Barsim, R. Streubel, and B. Yang, “Unsupervised Adaptive EventDetection for Building-Level Energy Disaggregation,” Proceedings ofpower and energy student summit (PESS), 2014.
[17] B. Wild, K. S. Barsim, and B. Yang, “A new Unsupervised EventDetector for Non-Intrusive Load Monitoring,” in 2015 IEEE GlobalConference on Signal and Information Processing (GlobalSIP), Dec.2015, pp. 73–77.
[18] K. S. Barsim and B. Yang, “Sequential Clustering-Based Event De-tection for Non-Intrusive Load Monitoring,” in Computer Science &Information Technology, vol. 6, 2016, pp. 77–85.
[19] Z. Zheng, H. Chen, H. Xiaowei, and L. Xiaowei, “A Supervised Event-Based Non-Intrusive Load Monitoring for Non-Linear Appliances,”Sustainability, vol. 10, p. 1001, March 2018.
[20] K. N. Trung, E. Dekneuvel, B. Nicolle, O. Zammit, C. N. Van, andG. Jacquemod, “Event Detection and Disaggregation Algorithms forNIALM System,” in 2nd International Workshop on NILM, 2014.
[21] Y. Jin, E. Tebekaemi, M. Berges, and L. Soibelman, “Robust AdaptiveEvent Detection in Non-Intrusive Load Monitoring for Energy AwareSmart Facilities,” in 2011 IEEE International Conference on Acoustics,Speech and Signal Processing (ICASSP), May 2011, pp. 4340–4343.
[22] Z. Zhu, S. Zhang, Z. Wei, B. Yin, and X. Huang, “A Novel CUSUM-Based Approach for Event Detection in Smart Metering,” IOP Confer-ence Series: Materials Science and Engineering, vol. 322, no. 7, 2018.
[23] C. C. Yang, C. S. Soh, and V. V. Yap, “Comparative Study of EventDetection Methods for Non-intrusive Appliance Load Monitoring,”Energy Procedia, vol. 61, pp. 1840 – 1843, 2014.
[24] R. Cox, S. B. Leeb, S. R. Shaw, and L. K. Norford, “TransientEvent Detection for Nonintrusive Load Monitoring and Demand SideManagement using Voltage Distortion,” in 21st Annual IEEE AppliedPower Electronics Conference and Exposition, 2006. APEC ’06., March2006.
[25] S. Makonin and F. Popowich, “Nonintrusive Load Monitoring (NILM)Performance Evaluation,” Energy Efficiency, vol. 8, pp. 809–814, Dec.2014.
[26] V. Chandola, A. Banerjee, and V. K. Vipin, “Anomaly Detection: ASurvey,” ACM Computing Surveys, vol. 41, no. 3, pp. 15:1–15:58, July2009.
[27] M. Schuster and K. K. Paliwal, “Bidirectional Recurrent Neural Net-works,” IEEE Transactions on Signal Processing, vol. 45, no. 11, pp.2673–2681, Nov. 1997.
[28] F. Chollet et al., “Keras,” https://keras.io, 2015.[29] D. P. Kingma and J. Ba, “Adam: A Method for Stochastic Optimization,”
CoRR, 2014. [Online]. Available: http://arxiv.org/abs/1412.6980[30] X. Glorot and Y. Bengio, “Understanding the Difficulty of Training Deep
Feedforward Neural Networks,” in Proceedings of the 13. InternationalConference on Artificial Intelligence and Statistics, 2010, pp. 249–256.
[31] W. W. Piegorsch, “Sample Sizes for Improved Binomial ConfidenceIntervals,” Computational Statistics and Data Analysis, vol. 46, no. 2,pp. 309–316, June 2004.
This is the author's accepted version of an article that has been published at the 2019 IEEE International Conference on Communications, Control, and Computing Technologies for Smart Grids (SmartGridComm). Changes were made to this version by the publisher prior to publication. The final version of record is available at https://doi.org/10.1109/SmartGridComm.2019.8909729
(c) 2019 IEEE. Reprinted, with permission, from Daniel Jorde, Matthias Kahl, and Hans-Arno Jacobsen; MEED: An Unsupervised Multi-Environment Event Detector for Non-Intrusive Load Monitoring, 2019 IEEE International Conference on Communications, Control, and Computing Technologies for Smart Grids (SmartGridComm) 11/2019

C. EVENT DETECTION FOR ENERGY CONSUMPTION MONITORING
C Event Detection for Energy Consumption Monitor-ing
82
1
Event Detectionfor Energy Consumption Monitoring
Daniel Jorde, Hans-Arno Jacobsen, Fellow, IEEE
Abstract—The accurate detection of appliance state transitions in electrical signals is fundamental for numerous energy-conservingapplications. We present an extensive overview and categorization of the current state in event detection on high-sampling-rate signals.Existing approaches are designed for specific environments and need to be tediously adapted for new ones. Thus, we propose anunsupervised, multi-environment event detector, outperforming four state-of-the-art algorithms on two heterogeneous public datasets.
Index Terms—Event detection, non-intrusive load monitoring, neural nets, machine learning, energy-aware systems
F
1 INTRODUCTION
ONE of the challenges humanity is facing nowadaysis the depletion of natural energy resources, while
the overall energy demand keeps increasing, especially thedemand for electrical energy [1]. For this reason, researchersare striving to find solutions to improve the way limitedenergy resources are used. By making both industrial andresidential consumers aware of their detailed electricity con-sumption, one aims to reduce the waste of energy and buildmore sustainable electrical applications [2]. Several surveysindicate that appliance-level information can reduce energyconsumption by raising consumer awareness [3] and enablea variety of sustainable smart city applications for energysavings [4]. The consumption of individual appliances canbe acquired using Non-Intrusive Load Monitoring (NILM)methods with a low-cost single-sensor approach to recordan aggregated signal, measured only at the mains of anentity, such as a building or a composite device [2]. Afterextracting relevant signal segments using an event detectionalgorithm, the appliances that had caused the events canbe identified, and the signal can be decomposed into theindividual appliances. Most of the electrical data used inNILM is collected by smart meters, which usually samplethe signals at a low rate (< 1 kHz). As a result, onlysome of the major devices can be detected [2]. Data thatare sampled using higher rates increase the probability forsuccessful NILM [5] and allow to detect more devices [2].Due to problems arising with high sampling rates, suchas the curse-of-dimensionality for machine learning algo-rithms [6] and the amount of data to store and process,online applications must pre-process the data by reliablyextracting relevant segments, i.e., appliance-state transitions[7]. By only sending segments over the network, one canenable smart city applications, while overcoming infras-tructural problems due to the amount of communicationin large-scale Internet of Things settings [8]. In the past,researchers focused on low-sampling-rate data, driven bythe high costs (for metering, storage, and processing) asso-
• D. Jorde is with the Department of Computer Science, Technical Univer-sity of Munich, Germany. E-mail: [email protected]
• H.-A. Jacobsen is with the Department of Computer Science, TechnicalUniversity of Munich, Germany. Email: [email protected]
ciated with the acquisition of high-sampling-rate data. Asthere is an evident lack of methods, and because of theadvantages of high-sampling-rate data, we focus on thisdomain. Detecting events and distinguishing them fromsignal noise is particularly challenging and prone to errors.So far, researchers focused mainly on residential buildingsand their appliances. Thus, there are multiple residentialdatasets publicly available [9]. Recent work investigatesindustrial and office settings, and new datasets containingmeasurements of computational equipment are published[10]. Existing event detection algorithms exhibit one impor-tant disadvantage: Most rely on customized, expert-madeevent definitions. This prohibits such approaches from beingable to generalize well to a setting they were not designedfor. Subsequently, the algorithms need to be tediously fine-tuned for being used in a new setting.
The main contributions of this paper are as follows: First,we present the current state of the art in event detection forenergy consumption monitoring with NILM, based on anextensive literature review. In a comprehensive overview,we facilitate algorithm comparison by reporting all relevantmetrics and by categorizing existent approaches based onkey-characteristics. Second, we present, based on our previ-ous work [11], the state-of-the-art, multi-environment eventdetector (MEED) that does not rely on a dedicated eventdefinition while being trained and used fully unsupervised.Hence, MEED can be used in different environments withan automatically determined decision hyperparameter, en-abling new possibilities for NILM and energy-related ap-plications in general. Third, we conduct an extensive bench-mark test of the current state of the art by implementing fouralgorithms and by evaluating them compared to MEED ontwo publicly available datasets from different environments.We are publicly releasing all source code, all models, andthe parametrization for all algorithms used in this paper ina publicly available repository [12]. By doing so, we providethe first and most comprehensive implementation of high-sampling-rate event detection algorithms in the field.
The rest of the paper is organized as follows: In Section2 we give an overview on event detection in NILM and rel-evant metrics. Section 3 summarizes related work, followedby the description of MEED in Section 4. Subsequently, we
This is the author's accepted version of an article that has been published at the IEEE Transactions on Sustainable Computing. Changes were made to this version by the publisher prior to publication. The final version of record is available at https://doi.org/10.1109/TSUSC.2020.3012066
(c) 2020 IEEE. Reprinted, with permission, from Daniel Jorde, Hans-Arno Jacobsen; Event Detection for Energy Consumption Monitoring, IEEE Transaction on Sustainable Computing 07/2020
2
detail our experimental setup in Section 5 and discuss thecorresponding results in Section 6. Section 7 then concludesthis paper.
2 BACKGROUND
Based on the edge detection algorithm for NILM introducedin 1992 by George Hart [13], a variety of new algorithms thatuse events to extract relevant signal segments have beenproposed.
2.1 Event Detection
As most researchers use different, specific definitions ofevents that reduce their capability to generalize to newsettings, we use a general event definition. In particular, wedefine events to be transitions between states of individ-ual appliances. Event detection algorithms can be dividedinto ones using supervised- and unsupervised-learning, de-pending on the use of labeled data during training (su-pervised) or not (unsupervised). Algorithms relying on asmall number of labeled samples and a large number ofunlabeled samples are considered to be semi-supervised.Supervised and semi-supervised algorithms are less flexiblein tasks like event detection than unsupervised algorithms,as they are dependent on the event definition used forlabeling. Thus, we propose an unsupervised event detector.Another possibility to classify event detection methods isthe three categories introduced by Anderson et al. [14],namely Expert Heuristics (EH), Probabilistic Models (PM),and Matched-Filters (MF). Rule-based approaches, includ-ing simple threshold-based ones, and methods using ma-chine learning, are considered to be EH, whereas approachesusing statistical metrics to determine events belong to thePM category. Algorithms that match previously learnedevent masks with the signal to detect events are consideredto be MF approaches [14].
2.2 Metrics
The following commonly used metrics are based on thescores of the confusion matrix, namely the amount ofrecords that are True Positive (TP), False Positive (FP), TrueNegative (TN), and False Negative (FN).
precision =TP
TP + FPrecall =
TPTP + FN
FPP =FP
TP + FNF1-Score =
2 ⇥ recall ⇥ precisionrecall + precision
Metrics based on TN scores are omitted, because of theabsence of a uniform definition of true non-events, as theycan occur any time no event exists. Another metric that iscommonly used in the NILM literature is the True PositivePercentage (TPP), which is defined as TP
E = TPTP+FN [14]. As
this is equal to the recall metric, we omitted the TPP inour evaluation. It is of particular importance to define howthe single scores of the confusion matrix are computed toensure the comparability of the results [15]. Ground truthevents are often generated by human experts, and thus canbe imprecise with respect to their exact location in time.
Hence, it is common to define a tolerance limit ⌧ for thematching of detected events edet and ground truth eventsegt [15], [16], [17]. A detected event edet is a TP if thereexists a ground truth event within an interval of ±⌧ , i.e., if9egt : edet � ⌧ egt edet + ⌧ .
3 RELATED WORK
In the following, we summarize the current state of theart in event detection in NILM on high-sampling-rate dataand identify gaps. To ease the comparison of differentalgorithms, we have categorized the related literature intoapproaches that use complete, or clearly defined subsetsof public datasets and into works that use non-public, orundefined subsets of public data to evaluate their results.Based on this, publications falling into the first category arelisted in Table 1, and publications from the latter categoryare gathered in Table 2. We only list approaches that havebeen evaluated on real-world data. The essential characteris-tics of the related algorithms are listed in these tables, withthe scores being rounded to the second decimal digit. Incase the exact value for a particular metric is unclear fromthe publication, we declared the result to be approximate(⇡). The algorithms make use of either supervised- (sup.) orunsupervised-learning (unsup.) techniques. To the best ofour knowledge, there are no semi-supervised event detec-tion approaches for high-sampling-rate NILM, in contrastto several publications on low-sampling-rate data, such asthe one by Yang et al. [49] and Li et al. [50]. We furthercategorize the related work according to the followingcriteria. The ”Setting” column indicates the environmentthe algorithms are designed for and evaluated in, namelyResidential (R) or Industrial (I) environments. The cross-validation (CV) criterion reports whether CV was used inthe evaluation, as suggested by Makonin and Popowich[51] to improve the reliability of the results. Most of thepublications exhibit no information about the tolerance limit⌧ used to calculate the metrics. Hence, the scores can onlybe compared approximately and indirectly.
In the following, the publications listed in Table 1 arefurther detailed, as they share common characteristics intheir evaluations, making them comparable. Valovage andGini introduce a PM [16] that relies on a Bayesian detectionmethod at its core. The algorithm tries to partition the signalinto run sequences, followed by declaring the transitions be-tween such sequences as events. Pereira [17] introduces an-other PM. The algorithm makes use of a log-likelihood ratiodetector to estimate a detection statistic. The algorithm thensearches the signal for extreme values to determine events.In contrast to other PM, Wild et al. [22] use a kernel Fisherdiscriminate analysis to detect start and end times of eventsin a supervised way. Alcala et al. [18] use the signal’s enve-lope of the normalized current and voltage RMS values anda threshold to detect events. Another approach using thesignal’s envelope is based on a Hilbert Transform [19]. It fur-ther applies an average and a derivative filter to obtain a setof spikes to detect transitions. The algorithm proposed byde Baets et al. [20] transforms the signal into the frequencydomain and applies a threshold on the computed Cepstrumcomponents. A different frequency domain based feature isintroduced by Held et al. [26]. The authors represent the
This is the author's accepted version of an article that has been published at the IEEE Transactions on Sustainable Computing. Changes were made to this version by the publisher prior to publication. The final version of record is available at https://doi.org/10.1109/TSUSC.2020.3012066
(c) 2020 IEEE. Reprinted, with permission, from Daniel Jorde, Hans-Arno Jacobsen; Event Detection for Energy Consumption Monitoring, IEEE Transaction on Sustainable Computing 07/2020
3
TABLE 1Comparable Related Work (abbreviations are explained in the text)
Ref. Learning Setting Type Dataset CV Recall Precision FPP F1-Score Limit ⌧
[16] unsup. R PM BLUED A | B No - - - ⇡ 0.98 | ⇡ 0.80 2 s[17] unsup. R PM BLUED A | B No - - - ⇡ 0.96 | ⇡ 0.72 1 s
REDD No - - - ⇡ 0.80 -[18] unsup. R EH BLUED A | B No 0.94 | 0.88 - - - -[19] unsup. R EH REDD subset No 0.93 - 0 - -[20] sup. R EH BLUED A | B Var. - - - 0.98 | 0.80 -[21] unsup. R PM BLUED A | B Var. - - - ⇡ 0.98 | ⇡ 0.80 -[22] sup. R PM BLUED A | B No 0.99 | 0.86 0.99 | 0.92 - 0.99 | 0.89 -[23] unsup. R EH BLUED A | B No 0.97 | 0.68 0.99 | 0.93 0.78e-2 | 0.49e-1 0.98 | 0.79 -[24] unsup. R EH BLUED A | B No 0.99 | 0.88 - 0.71e-2 | 0.4 0.99 | 0.77 3 s[25] unsup. R EH REDD subset No 0.94 - - - -[26] unsup. R EH BLUED A | B No 1 | 0.94 0.99 | 0.95 - 0.99 | 0,94 -[27] unsup. R EH BLUED A No 0.94 - 0.79e-2 - -
TABLE 2Not directly comparable Related Work (abbreviations are explained in the text)
Ref. Learning Setting Type Dataset CV Recall Precision FPP F1-Score Limit ⌧
[28] sup. R EH BLUED A | B sampled 1:4 No 0.98 | 0.98 0.95 | 0.92 0.05e-1 | 0.09 0.96 | 0.95 -[29] unsup. R EH | PM 3 appliances No - 0.21 - - -[30] unsup. R PM REDD subset No - - - - -[31] unsup. R EH 6 appliances No - - - - -[32] sup. I MF 4 appliances No - - - - -[33] sup. I MF 4 appliances No - - - - -[34] unsup. R EH 4 appliances No - - - - -[35] unsup. R EH BLUED subset | simulated No - - - - -[36] unsup. R PM 3 residential units No 0.99 - 0.09e-1 - -[37] unsup. R PM 10 appliances No 0.73 0.76 0.23 - 3 samples[38] unsup. I EH 4 appliances No - - - - -[39] unsup. R EH 6 homes No - - - - -[40] unsup. R EH 15 appliances No 0.89 - - - -[41] unsup. R EH 5 appliances No - - - - -[42] unsup. R EH REDD subset No - - - - -[43] unsup. R PM, EH REDD subset No - - - - -[44] unsup. R EH 8 appliances No 0.96 1 0 0.98 -[45] unsup. R PM 29 appliances No - - - - -[46] unsup. I EH 14 appliances No - - - - -[47] unsup. R EH | PM 4 appliances No - - - - -[48] unsup. I EH 7 appliances No - - - 0.83 -
signal by applying a frequency invariant transformation toobtain a signal representation that emphasizes non-periodic,pulse-shaped components to detect events. The authors fine-tune the six hyper-parameters of the algorithm by runningan optimization algorithm over the full evaluation dataset.As no separated test set is used for the evaluation, thealgorithm’s parameters overfit the data, and the evaluationscores do not resemble a real-world setting. The approachby Trung et al. [25] makes use of the cumulative sumstatistics (CUMSUM) and an adaptive threshold to detectthe start and the end of the transient segments in the signal.Furthermore, Zhu et al. use CUMSUM to detect events ina residential setting. In contrast to methods designed forresidential settings, Cox et al. [38] use the voltage distortionof industrial data. Yang et al. [43] compare an EH and agoodness-of-fit (GOF) event detector, concluding that thelatter performs better. An enhanced GOF approach, basedon a chi-square test statistic, is introduced by Baets et al.[21]. In their work on event detection, Barsim and Yang[23] introduce three algorithm agnostic event models, thatoppose different generic constraints on events. The authorsevaluate their approach using the unsupervised DBSCAN
clustering algorithm. We have implemented this approachbecause of its performance and well-defined event modelto benchmark MEED. As many event detection algorithmssuffer from false positives, Lu and Li introduce a hybridapproach, consisting of a threshold-based base algorithmto detect events and two additional ones to filter out falseevents [27]. Zheng et al. [24] also show the applicability ofDBSCAN to detect events. The algorithm clusters appliancestates and transitions before they are post-processed withdedicated thresholds on power and time to filter out du-plicates and FPs. For its transparent evaluation and state-of-the-art performance on BLUED, we have selected thisalgorithm for the benchmark.
Despite the comparability issues, we have selected twodistinguished algorithms from Table 2 to benchmark ourapproach. The first algorithm is the GOF based approachby Jin et al. [36] as it has multiple advantages over otherprobabilistic event detectors, despite not being evaluatedon a public dataset. In contrast to other algorithms, thisGOF approach provides a guideline for the event windowhyperparameter and a closed form for the decision thresh-old. Furthermore, the authors show the superiority of their
This is the author's accepted version of an article that has been published at the IEEE Transactions on Sustainable Computing. Changes were made to this version by the publisher prior to publication. The final version of record is available at https://doi.org/10.1109/TSUSC.2020.3012066
(c) 2020 IEEE. Reprinted, with permission, from Daniel Jorde, Hans-Arno Jacobsen; Event Detection for Energy Consumption Monitoring, IEEE Transaction on Sustainable Computing 07/2020
4
algorithm over the widely used generalized log-likelihooddetector [36]. Besides this PM event detector, we haveselected a fast and straightforward, but well-performingtechnique by Liu et al. [35] that is based on a median filterand a ripple mitigation algorithm to separate meaningfulevents from other fluctuations in the signal [35].
The following base requirements for MEED are derivedfrom the related work presented: MEED has to be designedindependent of any specific event definition, allowing it togeneralize better, even to different settings. Furthermore,this multi-environment event detector has to identify eventsunsupervised, without the need for user-defined decisionhyperparameters. By doing so, one avoids costly humanlabelling of events and interventions. In contrast to existingunsupervised event detectors, MEED’s decision hyperpa-rameter is determined automatically.
4 EVENT DETECTION APPROACH
Based on the introduced requirements, we design a newwindow-based EH event detector. MEED applies a two-stepprocess to the pre-processed input data to detect events, asshown in Figure 1. The first step is based on the mean-squared reconstruction error (MSE) of the window, which iscomputed by an autoencoder model. Subsequently, we ap-ply a peak detection algorithm to find the exact timestampswithin the windows that exceed an absolute MSE value.
4.1 Data Pre-ProcessingOne of the features that are used in multiple event detectionmethods is CUMSUM [25], [44], as it has shown to revealtrends and changes in time-series data successfully. Smallfluctuations are suppressed in CUMSUM, while substantialchanges in the data are revealed. The input to the first stepof MEED is the CUMSUM of the five-period root-mean-square (RMS) of the current signal. The CUMSUM at timeti is computed by accumulating the deviations of the RMSvalues from the window’s mean value for all t ti. Duringtraining, we scale to values between �1 and 1.
4.2 Coarse Event Detection AutoencoderThe first step of MEED is to apply a denoising autoencoderto the input. In doing so, we seize the rarity of eventsto build a model that can detect windows that containtransitions. A similar idea is used to solve classical anomalydetection tasks, as presented in the summary on this topicby Chandola et al. [52]. The authors present several meth-ods to identify events. One of these methods applies aneural network, in particular, an autoencoder, to learn ahidden representation h of the input x to reveal events [52].Autoencoders are typically used in representation learningtasks. They consist of an encoder h = f(x) and a decoderfunction r = g(h) [6]. As events are rare compared to non-events, they constitute the minority class, making it hardfor the model to learn a proper event representation h.Instead, the model learns to represent and reconstruct thenon-event majority class. Hence, a large reconstruction erroris produced when the model faces a deviation from normalbehavior, i.e., an event. MEED’s hyperparameter settingscan generalize well between environments, as events rarely
occur in electrical environments. Denoising autoencoders,a special case of the general autoencoder, minimize a lossfunction L(x, g(f(ex))), while trying to reconstruct the inputx from intentionally corrupted input data ex. The corruptedinput ex is obtained by adding white Gaussian noise (µ = 0,� = 0.25) to x. Each of the three hidden layers of MEEDis a bidirectional long short-term memory (LSTM) cell thathas shown to be able to learn long term dependenciesand patterns from sequential data [6]. Briefly, a LSTM cellconsists of gating units (it, ot, ft and ct) that control itsinformation flow, as summarized in the following equations,with sig being the logistic sigmoid, tanh the hyperbolictangent function, and � the element-wise product [6]:
ft = sig(Wfxt + Ufht�1 + bf )
it = sig(Wixt + Uiht�1 + bi)
ot = sig(Woxt + Uoht�1 + bo)
ct = ft � ct�1 + it � tanh(Wcxt + Ucht�1 + bc)
ht = ot � tanh(ct)
The input window to MEED has a fixed size, thus, we usebidirectional LSTMs to make use of future context informa-tion to improve the overall performance [53], as depictedin the autoencoder architecture in step one in Figure 1. Thebidirectional networks consist of one LSTM to process thedata in the forward direction, i.e., from the beginning of thewindow to the end, and one separate LSTM to do so in theopposite direction [53]. The parameters of the forward andthe backward LSTMs are not shared, but the outputs of bothdirections are concatenated into a single output to computethe MSE to optimize the network during training. Each ofthe three autoencoder components, namely, the encoding,the embedding and the decoding layer, are represented bya bidirectional LSTM. On top of the LSTM cells, the linearoutput layer ensures that the in- and output have the samedimensionality. We evaluated several training hyperparam-eters and different architectural components using a gridsearch on the training data, resulting in the final optimalsettings shown in Table 3.
TABLE 3Autoencoder Hyperparameters, implemented with Keras [54]
Parameter Value Parameter Value
learning rate 0.001 LSTM 1 cell size 216optimizer Adam [55] LSTM 2 cell size 108initializer Glorot uniform [56] LSTM 3 cell size 216
merge mode concatenate window size 10 s
4.3 Fine-Grained Event Timestamp Detector
In case the coarse event detector determines an input win-dow to be an event window, i.e., the reconstruction errorthreshold is exceeded, we apply the fine-grained detectionprocedure to determine the exact number and timestamps inthe window. We compute the RMS values over five periodsof the raw input signal. Then, we convert the RMS signalinto a binary one, setting values higher than the mean of thevalues to 1 and the smaller ones to 0, revealing significantpeaks in the window. Relevant and noise-related transitions
This is the author's accepted version of an article that has been published at the IEEE Transactions on Sustainable Computing. Changes were made to this version by the publisher prior to publication. The final version of record is available at https://doi.org/10.1109/TSUSC.2020.3012066
(c) 2020 IEEE. Reprinted, with permission, from Daniel Jorde, Hans-Arno Jacobsen; Event Detection for Energy Consumption Monitoring, IEEE Transaction on Sustainable Computing 07/2020
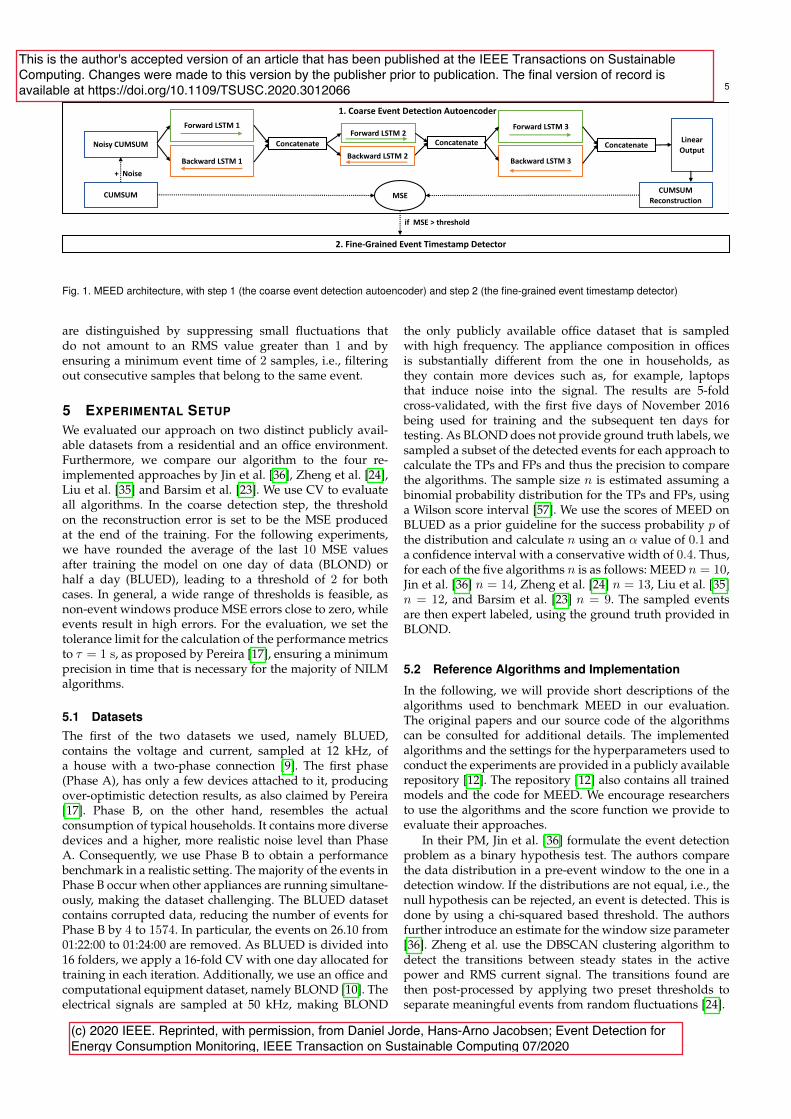
5
Forward LSTM 1
Backward LSTM 1
ConcatenateForward LSTM 2
Concatenate
Backward LSTM 2
Forward LSTM 3
Backward LSTM 3
ConcatenateLinear Output
Noisy CUMSUM
CUMSUM
+ Noise
CUMSUM Reconstruction
MSE
2. Fine-Grained Event Timestamp Detector
if MSE > threshold
1. Coarse Event Detection Autoencoder
Fig. 1. MEED architecture, with step 1 (the coarse event detection autoencoder) and step 2 (the fine-grained event timestamp detector)
are distinguished by suppressing small fluctuations thatdo not amount to an RMS value greater than 1 and byensuring a minimum event time of 2 samples, i.e., filteringout consecutive samples that belong to the same event.
5 EXPERIMENTAL SETUP
We evaluated our approach on two distinct publicly avail-able datasets from a residential and an office environment.Furthermore, we compare our algorithm to the four re-implemented approaches by Jin et al. [36], Zheng et al. [24],Liu et al. [35] and Barsim et al. [23]. We use CV to evaluateall algorithms. In the coarse detection step, the thresholdon the reconstruction error is set to be the MSE producedat the end of the training. For the following experiments,we have rounded the average of the last 10 MSE valuesafter training the model on one day of data (BLOND) orhalf a day (BLUED), leading to a threshold of 2 for bothcases. In general, a wide range of thresholds is feasible, asnon-event windows produce MSE errors close to zero, whileevents result in high errors. For the evaluation, we set thetolerance limit for the calculation of the performance metricsto ⌧ = 1 s, as proposed by Pereira [17], ensuring a minimumprecision in time that is necessary for the majority of NILMalgorithms.
5.1 DatasetsThe first of the two datasets we used, namely BLUED,contains the voltage and current, sampled at 12 kHz, ofa house with a two-phase connection [9]. The first phase(Phase A), has only a few devices attached to it, producingover-optimistic detection results, as also claimed by Pereira[17]. Phase B, on the other hand, resembles the actualconsumption of typical households. It contains more diversedevices and a higher, more realistic noise level than PhaseA. Consequently, we use Phase B to obtain a performancebenchmark in a realistic setting. The majority of the events inPhase B occur when other appliances are running simultane-ously, making the dataset challenging. The BLUED datasetcontains corrupted data, reducing the number of events forPhase B by 4 to 1574. In particular, the events on 26.10 from01:22:00 to 01:24:00 are removed. As BLUED is divided into16 folders, we apply a 16-fold CV with one day allocated fortraining in each iteration. Additionally, we use an office andcomputational equipment dataset, namely BLOND [10]. Theelectrical signals are sampled at 50 kHz, making BLOND
the only publicly available office dataset that is sampledwith high frequency. The appliance composition in officesis substantially different from the one in households, asthey contain more devices such as, for example, laptopsthat induce noise into the signal. The results are 5-foldcross-validated, with the first five days of November 2016being used for training and the subsequent ten days fortesting. As BLOND does not provide ground truth labels, wesampled a subset of the detected events for each approach tocalculate the TPs and FPs and thus the precision to comparethe algorithms. The sample size n is estimated assuming abinomial probability distribution for the TPs and FPs, usinga Wilson score interval [57]. We use the scores of MEED onBLUED as a prior guideline for the success probability p ofthe distribution and calculate n using an ↵ value of 0.1 anda confidence interval with a conservative width of 0.4. Thus,for each of the five algorithms n is as follows: MEED n = 10,Jin et al. [36] n = 14, Zheng et al. [24] n = 13, Liu et al. [35]n = 12, and Barsim et al. [23] n = 9. The sampled eventsare then expert labeled, using the ground truth provided inBLOND.
5.2 Reference Algorithms and Implementation
In the following, we will provide short descriptions of thealgorithms used to benchmark MEED in our evaluation.The original papers and our source code of the algorithmscan be consulted for additional details. The implementedalgorithms and the settings for the hyperparameters used toconduct the experiments are provided in a publicly availablerepository [12]. The repository [12] also contains all trainedmodels and the code for MEED. We encourage researchersto use the algorithms and the score function we provide toevaluate their approaches.
In their PM, Jin et al. [36] formulate the event detectionproblem as a binary hypothesis test. The authors comparethe data distribution in a pre-event window to the one in adetection window. If the distributions are not equal, i.e., thenull hypothesis can be rejected, an event is detected. This isdone by using a chi-squared based threshold. The authorsfurther introduce an estimate for the window size parameter[36]. Zheng et al. use the DBSCAN clustering algorithm todetect the transitions between steady states in the activepower and RMS current signal. The transitions found arethen post-processed by applying two preset thresholds toseparate meaningful events from random fluctuations [24].
This is the author's accepted version of an article that has been published at the IEEE Transactions on Sustainable Computing. Changes were made to this version by the publisher prior to publication. The final version of record is available at https://doi.org/10.1109/TSUSC.2020.3012066
(c) 2020 IEEE. Reprinted, with permission, from Daniel Jorde, Hans-Arno Jacobsen; Event Detection for Energy Consumption Monitoring, IEEE Transaction on Sustainable Computing 07/2020
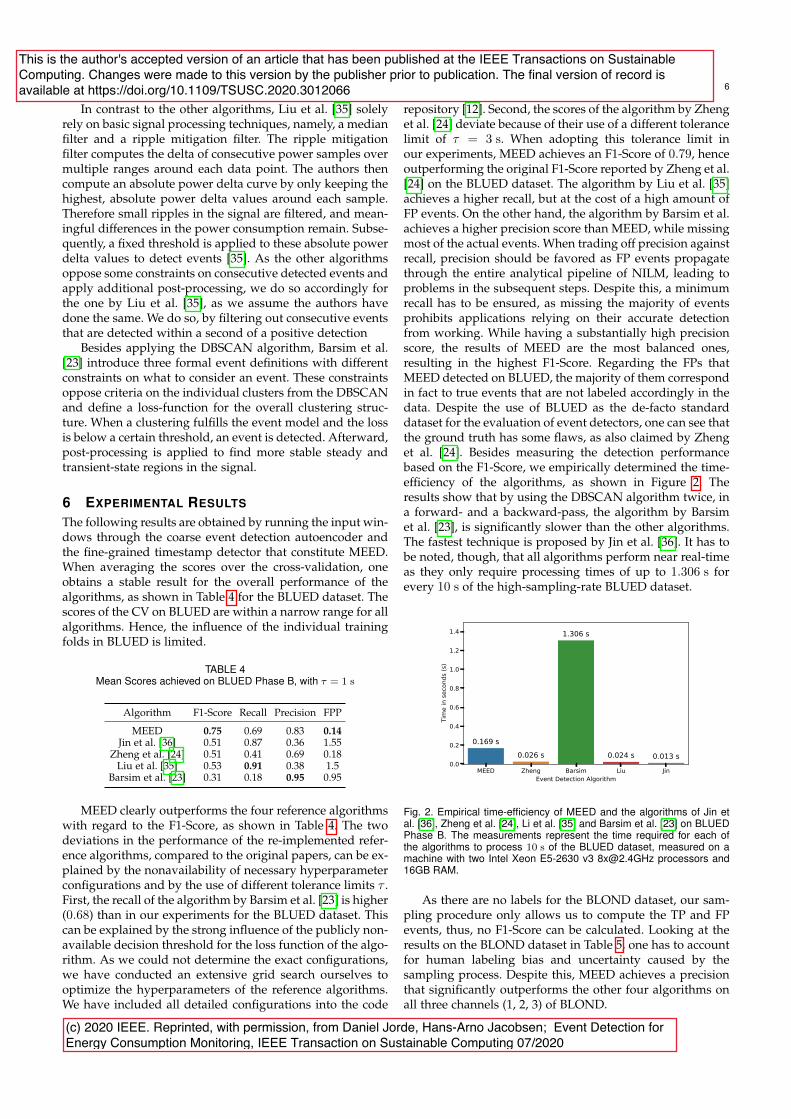
6
In contrast to the other algorithms, Liu et al. [35] solelyrely on basic signal processing techniques, namely, a medianfilter and a ripple mitigation filter. The ripple mitigationfilter computes the delta of consecutive power samples overmultiple ranges around each data point. The authors thencompute an absolute power delta curve by only keeping thehighest, absolute power delta values around each sample.Therefore small ripples in the signal are filtered, and mean-ingful differences in the power consumption remain. Subse-quently, a fixed threshold is applied to these absolute powerdelta values to detect events [35]. As the other algorithmsoppose some constraints on consecutive detected events andapply additional post-processing, we do so accordingly forthe one by Liu et al. [35], as we assume the authors havedone the same. We do so, by filtering out consecutive eventsthat are detected within a second of a positive detection
Besides applying the DBSCAN algorithm, Barsim et al.[23] introduce three formal event definitions with differentconstraints on what to consider an event. These constraintsoppose criteria on the individual clusters from the DBSCANand define a loss-function for the overall clustering struc-ture. When a clustering fulfills the event model and the lossis below a certain threshold, an event is detected. Afterward,post-processing is applied to find more stable steady andtransient-state regions in the signal.
6 EXPERIMENTAL RESULTS
The following results are obtained by running the input win-dows through the coarse event detection autoencoder andthe fine-grained timestamp detector that constitute MEED.When averaging the scores over the cross-validation, oneobtains a stable result for the overall performance of thealgorithms, as shown in Table 4 for the BLUED dataset. Thescores of the CV on BLUED are within a narrow range for allalgorithms. Hence, the influence of the individual trainingfolds in BLUED is limited.
TABLE 4Mean Scores achieved on BLUED Phase B, with ⌧ = 1 s
Algorithm F1-Score Recall Precision FPP
MEED 0.75 0.69 0.83 0.14Jin et al. [36] 0.51 0.87 0.36 1.55
Zheng et al. [24] 0.51 0.41 0.69 0.18Liu et al. [35] 0.53 0.91 0.38 1.5
Barsim et al. [23] 0.31 0.18 0.95 0.95
MEED clearly outperforms the four reference algorithmswith regard to the F1-Score, as shown in Table 4. The twodeviations in the performance of the re-implemented refer-ence algorithms, compared to the original papers, can be ex-plained by the nonavailability of necessary hyperparameterconfigurations and by the use of different tolerance limits ⌧ .First, the recall of the algorithm by Barsim et al. [23] is higher(0.68) than in our experiments for the BLUED dataset. Thiscan be explained by the strong influence of the publicly non-available decision threshold for the loss function of the algo-rithm. As we could not determine the exact configurations,we have conducted an extensive grid search ourselves tooptimize the hyperparameters of the reference algorithms.We have included all detailed configurations into the code
repository [12]. Second, the scores of the algorithm by Zhenget al. [24] deviate because of their use of a different tolerancelimit of ⌧ = 3 s. When adopting this tolerance limit inour experiments, MEED achieves an F1-Score of 0.79, henceoutperforming the original F1-Score reported by Zheng et al.[24] on the BLUED dataset. The algorithm by Liu et al. [35]achieves a higher recall, but at the cost of a high amount ofFP events. On the other hand, the algorithm by Barsim et al.achieves a higher precision score than MEED, while missingmost of the actual events. When trading off precision againstrecall, precision should be favored as FP events propagatethrough the entire analytical pipeline of NILM, leading toproblems in the subsequent steps. Despite this, a minimumrecall has to be ensured, as missing the majority of eventsprohibits applications relying on their accurate detectionfrom working. While having a substantially high precisionscore, the results of MEED are the most balanced ones,resulting in the highest F1-Score. Regarding the FPs thatMEED detected on BLUED, the majority of them correspondin fact to true events that are not labeled accordingly in thedata. Despite the use of BLUED as the de-facto standarddataset for the evaluation of event detectors, one can see thatthe ground truth has some flaws, as also claimed by Zhenget al. [24]. Besides measuring the detection performancebased on the F1-Score, we empirically determined the time-efficiency of the algorithms, as shown in Figure 2. Theresults show that by using the DBSCAN algorithm twice, ina forward- and a backward-pass, the algorithm by Barsimet al. [23], is significantly slower than the other algorithms.The fastest technique is proposed by Jin et al. [36]. It has tobe noted, though, that all algorithms perform near real-timeas they only require processing times of up to 1.306 s forevery 10 s of the high-sampling-rate BLUED dataset.
Fig. 2. Empirical time-efficiency of MEED and the algorithms of Jin etal. [36], Zheng et al. [24], Li et al. [35] and Barsim et al. [23] on BLUEDPhase B. The measurements represent the time required for each ofthe algorithms to process 10 s of the BLUED dataset, measured on amachine with two Intel Xeon E5-2630 v3 [email protected] processors and16GB RAM.
As there are no labels for the BLOND dataset, our sam-pling procedure only allows us to compute the TP and FPevents, thus, no F1-Score can be calculated. Looking at theresults on the BLOND dataset in Table 5, one has to accountfor human labeling bias and uncertainty caused by thesampling process. Despite this, MEED achieves a precisionthat significantly outperforms the other four algorithms onall three channels (1, 2, 3) of BLOND.
This is the author's accepted version of an article that has been published at the IEEE Transactions on Sustainable Computing. Changes were made to this version by the publisher prior to publication. The final version of record is available at https://doi.org/10.1109/TSUSC.2020.3012066
(c) 2020 IEEE. Reprinted, with permission, from Daniel Jorde, Hans-Arno Jacobsen; Event Detection for Energy Consumption Monitoring, IEEE Transaction on Sustainable Computing 07/2020
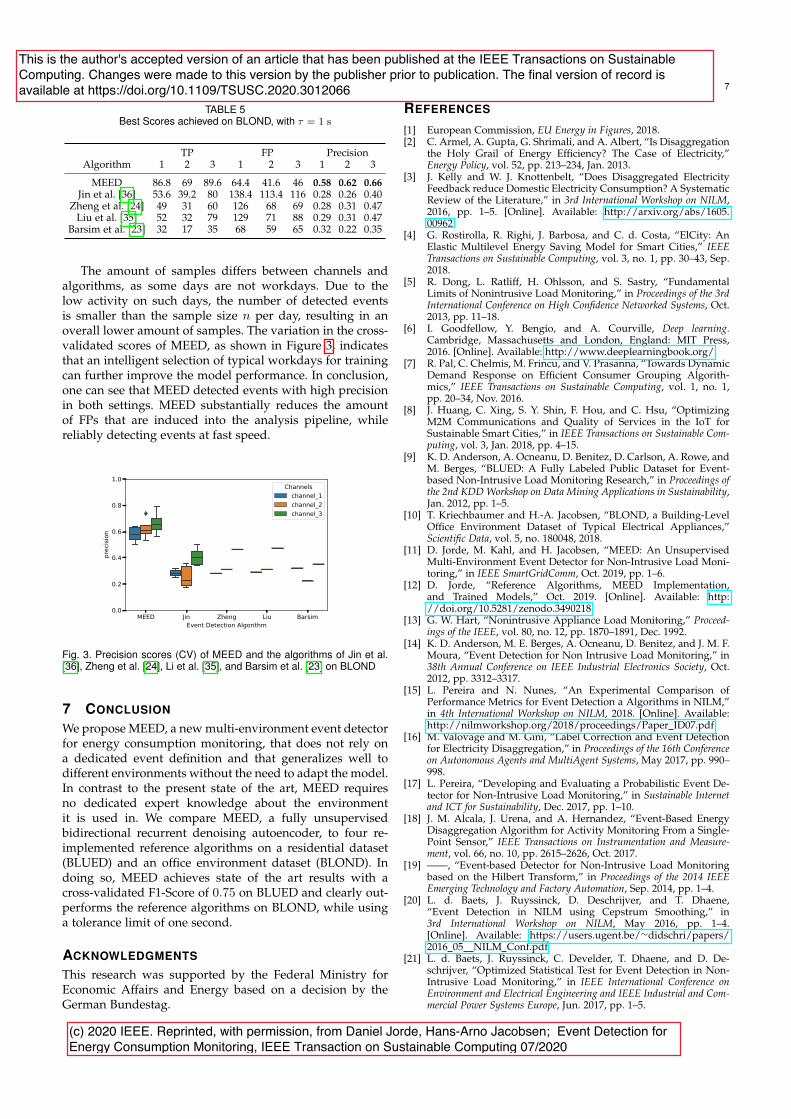
7
TABLE 5Best Scores achieved on BLOND, with ⌧ = 1 s
TP FP PrecisionAlgorithm 1 2 3 1 2 3 1 2 3
MEED 86.8 69 89.6 64.4 41.6 46 0.58 0.62 0.66Jin et al. [36] 53.6 39.2 80 138.4 113.4 116 0.28 0.26 0.40
Zheng et al. [24] 49 31 60 126 68 69 0.28 0.31 0.47Liu et al. [35] 52 32 79 129 71 88 0.29 0.31 0.47
Barsim et al. [23] 32 17 35 68 59 65 0.32 0.22 0.35
The amount of samples differs between channels andalgorithms, as some days are not workdays. Due to thelow activity on such days, the number of detected eventsis smaller than the sample size n per day, resulting in anoverall lower amount of samples. The variation in the cross-validated scores of MEED, as shown in Figure 3, indicatesthat an intelligent selection of typical workdays for trainingcan further improve the model performance. In conclusion,one can see that MEED detected events with high precisionin both settings. MEED substantially reduces the amountof FPs that are induced into the analysis pipeline, whilereliably detecting events at fast speed.
Fig. 3. Precision scores (CV) of MEED and the algorithms of Jin et al.[36], Zheng et al. [24], Li et al. [35], and Barsim et al. [23] on BLOND
7 CONCLUSION
We propose MEED, a new multi-environment event detectorfor energy consumption monitoring, that does not rely ona dedicated event definition and that generalizes well todifferent environments without the need to adapt the model.In contrast to the present state of the art, MEED requiresno dedicated expert knowledge about the environmentit is used in. We compare MEED, a fully unsupervisedbidirectional recurrent denoising autoencoder, to four re-implemented reference algorithms on a residential dataset(BLUED) and an office environment dataset (BLOND). Indoing so, MEED achieves state of the art results with across-validated F1-Score of 0.75 on BLUED and clearly out-performs the reference algorithms on BLOND, while usinga tolerance limit of one second.
ACKNOWLEDGMENTS
This research was supported by the Federal Ministry forEconomic Affairs and Energy based on a decision by theGerman Bundestag.
REFERENCES
[1] European Commission, EU Energy in Figures, 2018.[2] C. Armel, A. Gupta, G. Shrimali, and A. Albert, “Is Disaggregation
the Holy Grail of Energy Efficiency? The Case of Electricity,”Energy Policy, vol. 52, pp. 213–234, Jan. 2013.
[3] J. Kelly and W. J. Knottenbelt, “Does Disaggregated ElectricityFeedback reduce Domestic Electricity Consumption? A SystematicReview of the Literature,” in 3rd International Workshop on NILM,2016, pp. 1–5. [Online]. Available: http://arxiv.org/abs/1605.00962
[4] G. Rostirolla, R. Righi, J. Barbosa, and C. d. Costa, “ElCity: AnElastic Multilevel Energy Saving Model for Smart Cities,” IEEETransactions on Sustainable Computing, vol. 3, no. 1, pp. 30–43, Sep.2018.
[5] R. Dong, L. Ratliff, H. Ohlsson, and S. Sastry, “FundamentalLimits of Nonintrusive Load Monitoring,” in Proceedings of the 3rdInternational Conference on High Confidence Networked Systems, Oct.2013, pp. 11–18.
[6] I. Goodfellow, Y. Bengio, and A. Courville, Deep learning.Cambridge, Massachusetts and London, England: MIT Press,2016. [Online]. Available: http://www.deeplearningbook.org/
[7] R. Pal, C. Chelmis, M. Frincu, and V. Prasanna, “Towards DynamicDemand Response on Efficient Consumer Grouping Algorith-mics,” IEEE Transactions on Sustainable Computing, vol. 1, no. 1,pp. 20–34, Nov. 2016.
[8] J. Huang, C. Xing, S. Y. Shin, F. Hou, and C. Hsu, “OptimizingM2M Communications and Quality of Services in the IoT forSustainable Smart Cities,” in IEEE Transactions on Sustainable Com-puting, vol. 3, Jan. 2018, pp. 4–15.
[9] K. D. Anderson, A. Ocneanu, D. Benitez, D. Carlson, A. Rowe, andM. Berges, “BLUED: A Fully Labeled Public Dataset for Event-based Non-Intrusive Load Monitoring Research,” in Proceedings ofthe 2nd KDD Workshop on Data Mining Applications in Sustainability,Jan. 2012, pp. 1–5.
[10] T. Kriechbaumer and H.-A. Jacobsen, “BLOND, a Building-LevelOffice Environment Dataset of Typical Electrical Appliances,”Scientific Data, vol. 5, no. 180048, 2018.
[11] D. Jorde, M. Kahl, and H. Jacobsen, “MEED: An UnsupervisedMulti-Environment Event Detector for Non-Intrusive Load Moni-toring,” in IEEE SmartGridComm, Oct. 2019, pp. 1–6.
[12] D. Jorde, “Reference Algorithms, MEED Implementation,and Trained Models,” Oct. 2019. [Online]. Available: http://doi.org/10.5281/zenodo.3490218
[13] G. W. Hart, “Nonintrusive Appliance Load Monitoring,” Proceed-ings of the IEEE, vol. 80, no. 12, pp. 1870–1891, Dec. 1992.
[14] K. D. Anderson, M. E. Berges, A. Ocneanu, D. Benitez, and J. M. F.Moura, “Event Detection for Non Intrusive Load Monitoring,” in38th Annual Conference on IEEE Industrial Electronics Society, Oct.2012, pp. 3312–3317.
[15] L. Pereira and N. Nunes, “An Experimental Comparison ofPerformance Metrics for Event Detection a Algorithms in NILM,”in 4th International Workshop on NILM, 2018. [Online]. Available:http://nilmworkshop.org/2018/proceedings/Paper ID07.pdf
[16] M. Valovage and M. Gini, “Label Correction and Event Detectionfor Electricity Disaggregation,” in Proceedings of the 16th Conferenceon Autonomous Agents and MultiAgent Systems, May 2017, pp. 990–998.
[17] L. Pereira, “Developing and Evaluating a Probabilistic Event De-tector for Non-Intrusive Load Monitoring,” in Sustainable Internetand ICT for Sustainability, Dec. 2017, pp. 1–10.
[18] J. M. Alcala, J. Urena, and A. Hernandez, “Event-Based EnergyDisaggregation Algorithm for Activity Monitoring From a Single-Point Sensor,” IEEE Transactions on Instrumentation and Measure-ment, vol. 66, no. 10, pp. 2615–2626, Oct. 2017.
[19] ——, “Event-based Detector for Non-Intrusive Load Monitoringbased on the Hilbert Transform,” in Proceedings of the 2014 IEEEEmerging Technology and Factory Automation, Sep. 2014, pp. 1–4.
[20] L. d. Baets, J. Ruyssinck, D. Deschrijver, and T. Dhaene,“Event Detection in NILM using Cepstrum Smoothing,” in3rd International Workshop on NILM, May 2016, pp. 1–4.[Online]. Available: https://users.ugent.be/⇠didschri/papers/2016 05 NILM Conf.pdf
[21] L. d. Baets, J. Ruyssinck, C. Develder, T. Dhaene, and D. De-schrijver, “Optimized Statistical Test for Event Detection in Non-Intrusive Load Monitoring,” in IEEE International Conference onEnvironment and Electrical Engineering and IEEE Industrial and Com-mercial Power Systems Europe, Jun. 2017, pp. 1–5.
This is the author's accepted version of an article that has been published at the IEEE Transactions on Sustainable Computing. Changes were made to this version by the publisher prior to publication. The final version of record is available at https://doi.org/10.1109/TSUSC.2020.3012066
(c) 2020 IEEE. Reprinted, with permission, from Daniel Jorde, Hans-Arno Jacobsen; Event Detection for Energy Consumption Monitoring, IEEE Transaction on Sustainable Computing 07/2020
8
[22] B. Wild, K. S. Barsim, and B. Yang, “A new Unsupervised EventDetector for Non-Intrusive Load Monitoring,” in IEEE Global Con-ference on Signal and Information Processing (GlobalSIP), Dec. 2015,pp. 73–77.
[23] K. S. Barsim and B. Yang, “Sequential Clustering-Based EventDetection for Non-Intrusive Load Monitoring,” in Proceedings ofthe 6th International Conference on Computer Science and InformationTechnology, Jan. 2016, pp. 77–85.
[24] Z. Zheng, H. Chen, H. Xiaowei, and L. Xiaowei, “A SupervisedEvent-Based Non-Intrusive Load Monitoring for Non-Linear Ap-pliances,” Sustainability, vol. 10, no. 4, pp. 1001–1029, Mar. 2018.
[25] K. N. Trung, E. Dekneuvel, B. Nicolle, O. Zammit, C. N. Van, andG. Jacquemod, “Event Detection and Disaggregation Algorithmsfor NIALM System,” in 2h International Workshop on NILM,2014. [Online]. Available: https://pdfs.semanticscholar.org/11fb/703fe0a1c7cddc8fd8cf06671d0f661aad38.pdf
[26] P. Held, D. Weißhaar, S. Mauch, D. O. Abdeslam, and D. Beny-oucef, “Parameter Optimized Event Detection for NILM UsingFrequency Invariant Transformation of Periodic Signals (FIT-PS),”in IEEE 23rd International Conference on Emerging Technologies andFactory Automation, Sep. 2018, pp. 832–837.
[27] M. Lu and Z. Li, “A Hybrid Event Detection Approach forNon-Intrusive Load Monitoring,” IEEE Transactions on Smart Grid,vol. 11, no. 1, pp. 528–540, Jan. 2020.
[28] O. P. Patri, A. V. Panangadan, C. Chelmis, and V. K. Prasanna,“Extracting Discriminative Features for Event-Based ElectricityDisaggregation,” in IEEE Conference on Technologies for Sustainabil-ity, Jul. 2014, pp. 232–238.
[29] S. Houidi, F. Auger, H. B. A. Sethom, L. Miegeville, D. Fourer, andX. Jiang, “Statistical Assessment of Abrupt Change Detectors forNon-Intrusive Load Monitoring,” in IEEE International Conferenceon Industrial Technology, Feb. 2018, pp. 1314–1319.
[30] C. C. Yang, C. S. Soh, and V. V. Yap, “A Systematic Approachto ON-OFF Event Detection and Clustering Analysis of Non-Intrusive Appliance Load Monitoring,” Frontiers in Energy, vol. 9,no. 2, pp. 231–237, May 2015.
[31] Z. Zhu, Z. Wei, B. Yin, S. Zhang, and X. Wang, “A Novel Approachfor Event Detection in Non-Intrusive Load Monitoring,” in IEEEConference on Energy Internet and Energy System Integration, Nov.2017, pp. 1–5.
[32] S. B. Leeb and J. L. Kirtley, “A Multiscale Transient Event Detectorfor Nonintrusive Load Monitoring,” in 19th Annual Conference ofIEEE Industrial Electronics, Nov. 1993, pp. 354–359.
[33] S. B. Leeb, S. R. Shaw, and J. L. Kirtley, “Transient Event Detectionin Spectral Envelope Estimates for Nonintrusive Load Monitor-ing,” IEEE Transactions on Power Delivery, vol. 10, no. 3, pp. 1200–1210, Jul. 1995.
[34] L. Jiang, S. Luo, and J. Li, “Automatic Power Load Event Detectionand Appliance Classification based on Power Harmonic Featuresin Nonintrusive Appliance Load Monitoring,” in 8th Conference onIndustrial Electronics and Applications, Jun. 2013, pp. 1083–1088.
[35] M. Liu, J. Y. X. Wang, and J. Lu, “A new Event Detection Techniquefor Residential Load Monitoring,” in 18th International Conferenceon Harmonics and Quality of Power, May 2018.
[36] Y. Jin, E. Tebekaemi, M. Berges, and L. Soibelman, “RobustAdaptive Event Detection in Non-Intrusive Load Monitoring forEnergy Aware Smart Facilities,” in IEEE International Conference onAcoustics, Speech and Signal Processing, May 2011, pp. 4340–4343.
[37] F. Jazizadeh, A. Milad, and W. Jue, “Self-configuring EventDetection for Electricity Disaggregation,” in 4th InternationalWorkshop on NILM, Mar. 2018. [Online]. Available: http://nilmworkshop.org/2018/proceedings/Poster ID14.pdf
[38] R. Cox, S. B. Leeb, S. R. Shaw, and L. K. Norford, “Transient EventDetection for Nonintrusive Load Monitoring and Demand SideManagement using Voltage Distortion,” in 21st IEEE Applied PowerElectronics Conference and Exposition, Mar. 2006, pp. 1751–1757.
[39] S. N. Patel, T. Robertson, J. A. Kientz, M. S. Reynolds, and G. D.Abowd, “At the Flick of a Switch: Detecting and Classifyingunique Electrical Events on the Residential Power Line,” in Inter-national Conference on Ubiquitous Computing, Sep. 2007, pp. 271–288.
[40] P. Meehan, C. McArdle, and S. Daniels, “An Efficient, ScalableTime-Frequency Method for Tracking Energy Usage of DomesticAppliances using Two-Step Classification Algorithm,” Energies,vol. 7, no. 11, pp. 7041–7066, Oct. 2014.
[41] S. Wang and Y. Bo, “A Novel Nonintrusive Transient Event De-tection Based on the Current,” in 2nd International Conference onMechanical Control and Automation, 2017, pp. 298–304.
[42] T. Lu, Z. Xu, and B. Huang, “An Event-Based Nonintrusive LoadMonitoring Approach: Using the Simplified Viterbi Algorithm,”IEEE Pervasive Computing, vol. 16, no. 4, pp. 54–61, Oct. 2017.
[43] C. C. Yang, C. S. Soh, and V. V. Yap, “Comparative Study of EventDetection Methods for Non-intrusive Appliance Load Monitor-ing,” Energy Procedia, vol. 61, pp. 1840 – 1843, Jan. 2014.
[44] Z. Zhu, S. Zhang, Z. Wei, B. Yin, and X. Huang, “A Novel CUSUM-Based Approach for Event Detection in Smart Metering,” MaterialsScience and Engineering, vol. 322, no. 7, Mar. 2018.
[45] A. R. Rababaah and E. Tebekaemi, “Electric Load Monitoringof Residential Buildings using Goodness of Fit and Multi-LayerPerceptron Neural Networks,” in IEEE International Conference onComputer Science and Automation Engineering, May 2012, pp. 733–737.
[46] H.-H. Chang, K.-L. Chen, Y.-P. Tsai, and W.-J. Lee, “A New Mea-surement Method for Power Signatures of Nonintrusive DemandMonitoring and Load Identification,” IEEE Transactions on IndustryApplications, vol. 48, no. 2, pp. 764–771, Mar. 2012.
[47] H. Gao, L. Zhang, L. Qiao, and Z. Tang, “An Improved Permu-tation Entropy Algorithm for Non-intrusive Load State ChangeDetection,” in IEEE Innovative Smart Grid Technologies - Asia, May2018, pp. 886–890.
[48] S. Yi, X. Yin, Y. Diao, B. Wang, and P. Wu, “A New Event-detectionMethod Based on Composite Windows in NILM for IndustrialSettings,” in IEEE Sustainable Power and Energy Conference, Nov.2019, pp. 2768–2771.
[49] Y. Yang, J. Zhong, W. Li, T. A. Gulliver, and S. Li, “Semi-SupervisedMulti-Label Deep Learning based Non-intrusive Load Monitoringin Smart Grids,” IEEE Transactions on Industrial Informatics, pp. 1–11, Nov. 2019.
[50] D. Li and S. Dick, “Residential Household Non-Intrusive LoadMonitoring via Graph-Based Multi-Label Semi-Supervised Learn-ing,” IEEE Transactions on Smart Grid, vol. 10, no. 4, pp. 4615–4627,Aug. 2019.
[51] S. Makonin and F. Popowich, “Nonintrusive Load Monitoring(NILM) Performance Evaluation,” Energy Efficiency, vol. 8, pp.809–814, Dec. 2014.
[52] V. Chandola, A. Banerjee, and V. K. Vipin, “Anomaly Detection:A Survey,” ACM Computing Surveys, vol. 41, no. 3, pp. 1–58, Jul.2009.
[53] M. Schuster and K. K. Paliwal, “Bidirectional Recurrent NeuralNetworks,” IEEE Transactions on Signal Processing, vol. 45, no. 11,pp. 2673–2681, Nov. 1997.
[54] F. Chollet and others, Keras, 2015. [Online]. Available: https://keras.io
[55] D. P. Kingma and J. Ba, “Adam: A Method forStochastic Optimization,” in International Conference on LearningRepresentations, May 2015, pp. 1–15. [Online]. Available:http://arxiv.org/abs/1412.6980
[56] X. Glorot and Y. Bengio, “Understanding the Difficulty of TrainingDeep Feedforward Neural Networks,” in Proceedings of the 13.International Conference on AISTATS, May 2010, pp. 249–256.[Online]. Available: http://proceedings.mlr.press/v9/glorot10a/glorot10a.pdf
[57] W. W. Piegorsch, “Sample Sizes for Improved Binomial Confi-dence Intervals,” Computational Statistics and Data Analysis, vol. 46,no. 2, pp. 309–316, Jun. 2004.
Daniel Jorde received his M.Sc. in InformationSystems from the Technical University of Munich(TUM) in 2018. Currently, he is pursuing hisPh.D. at TUM, working on the MobiCM project.His research interests include various topics inthe area of non-intrusive power monitoring, pre-dictive maintenance, and machine learning ingeneral.
Hans-Arno Jacobsen received his Ph.D. de-gree at Humboldt University in Berlin. He en-gaged in postdoctoral research at INRIA, beforemoving to the University of Toronto in 2001.He researches the intersection of distributedsystems and data management, with a focuson middleware systems, event processing, andcyber-physical systems. He received the Alexan-der von Humboldt Professorship award to en-gage in research at TUM.
This is the author's accepted version of an article that has been published at the IEEE Transactions on Sustainable Computing. Changes were made to this version by the publisher prior to publication. The final version of record is available at https://doi.org/10.1109/TSUSC.2020.3012066
(c) 2020 IEEE. Reprinted, with permission, from Daniel Jorde, Hans-Arno Jacobsen; Event Detection for Energy Consumption Monitoring, IEEE Transaction on Sustainable Computing 07/2020
APPENDIX . APPENDICES
D Electrical Appliance Classi�cation using Deep Con-volutionalNeuralNetworks onHigh FrequencyCur-rent Measurements
91
Electrical Appliance Classification using DeepConvolutional Neural Networks on High Frequency
Current MeasurementsDaniel Jorde, Thomas Kriechbaumer, and Hans-Arno Jacobsen
Chair for Application and Middleware SystemsTechnische Universitat Munchen, Germany
Email: [email protected]
Abstract—Monitoring the energy demand of appliances canraise consumer awareness and therefore reduce energy consump-tion. Using a single-point measurement of mains energy consump-tion can keep costs and hardware complexity to a minimum. Thisdata stream of raw voltage and current measurements can beused in machine learning tasks to extract information. We applyDeep Convolutional Neural Networks on an electrical applianceclassification task, using raw high frequency start up events fromtwo datasets. We further present Data Augmentation techniquesto improve the model performance and evaluate different datanormalization techniques. We achieve a perfect classification onWHITED and a F1-Score of 0.69 on PLAID.
I. INTRODUCTION
Researchers are striving to find solutions to reduce the totalenergy consumption, due to climatic change and the increasingenergy demand of both industrial and residential consumers.By making consumers aware of their detailed energy con-sumption it is possible to achieve significant energy savings.Energy consumption data from electrical appliances can berecorded and analyzed to provide appropriate feedback to theconsumers and the utilities [1], [2]. Other applications aremotivated by the insights from performing such analysis: non-invasive monitoring of elderly people [3], anomaly detectionof malfunctioning devices to reduce maintenance costs [4],or condition monitoring on naval vessels [5]. The requiredinformation to enable such applications can be derived bymonitoring the electric appliances. One major approach isNon-Intrusive Load Monitoring (NILM). It aims to use aggre-gated electrical signals, for example, measured at the electricalmains of a building. NILM is a step-wise process and one of itsmajor steps is to identify individual appliances from the volt-age and current signals. The appliance identification problemis particularly challenging and therefore still not sufficientlysolved [2], [6]. Past research focused mainly on residentialareas and their appliances, which resulted in multiple publicdatasets of their measured electrical signals [7], [8].
Smart Meters are the most widespread devices to recordsuch aggregated data, usually at a low sampling rate (⇠ 1 Hz)[4]. Low frequency data provides only enough information toidentify some of the major appliances, making it challengingto identify multiple, smaller ones at the same time [4]. Withhigher sampling rates, it is possible to distinguish even suchappliances. Most of the ongoing research is dealing with
low frequency data from Smart Meters due to their growingdeployment rate. There is a clear lack of methods for thehigh frequency domain [9]. Methods using datasets that aresampled with a frequency of 1 Hz or less are considered aslow frequency methods according to [10]. We do not take lowfrequency data into account, due to the previously describedlimitations. Subsequently, approaches using datasets with ahigher sampling frequency are considered as high frequencymethods. In order to identify single appliances and to disag-gregate loads, most methods use manually derived appliancesignatures as features for various supervised machine learningclassifiers [2], [9]. Such features require extensive domainknowledge and are dependent on different appliance types [9].
The main contribution of this paper is to investigate theusage of the raw, high resolution current signal in orderto classify individual appliances with Deep ConvolutionalNeural Networks (DCNN). It is valid to assume the switchingcontinuity principle because of the high sampling rate ofthe measurements [11] and therefore to use datasets thattreat the appliance measurements isolated from one another.We compare our DCNN classification approach to the stateof the art approaches using handcrafted (manually-derived)features. Furthermore, we investigate multiple Data Augmen-tation (DA) techniques to improve the performance of theappliance identification classifier. Besides this, we investigatedifferent standardization and scaling methods to normalizethe data. Our classifier is designed to distinguish betweenmultiple appliance types. We use publicly available high fre-quency energy datasets: WHITED [7] and PLAID [8]. Thesedatasets already provide a clean signal trace with annotateddevice labels suitable for machine learning. Datasets withlong-term measurements, such as BLOND [12] or UK-DALE[13], do not provide this level of ground truth granularity.The evaluation considers multiple DCNN architectures andhyperparameter configurations.
The rest of the paper is organized as follows: In SectionII, related work is presented. In Section III, we present theDA and the normalization techniques together with our modelarchitecture. Section IV presents the experimental setup, fol-lowed by the evaluation of the experiments in Section V.Section VI then concludes this paper.
This is the author's accepted version of an article that has been published at the 2018 IEEE International Conference on Communications, Control, and Computing Technologies for Smart Grids (SmartGridComm). Changes were made to this version by the publisher prior to publication. The final version of record is available at https://doi.org/10.1109/SmartGridComm.2018.8587452
(c) 2018 IEEE. Reprinted, with permission, from Daniel Jorde, Thomas Kriechbaumer, and Hans-Arno Jacobsen; Electrical Appliance Classification using Deep Convolutional Neural Networks on High Frequency Current Measurements , 2018 IEEE International Conference on Communications, Control, and Computing Technologies for Smart Grids (SmartGridComm) 10/2018
II. RELATED WORK
Appliance identification, a subtask of energy disaggregation,can be modeled as a typical machine learning classificationproblem. Most of the machine learning techniques rely onusing pre-computed sets of features, i.e., individual appliancesignatures, to distinguish between appliances [9]. Frequentlyapplied algorithms are Hidden Markov Models [14]–[16],Support Vector Machines [17], [18], and k-Nearest Neigbors[9], [17]. Besides these algorithms, Artificial Neural Networks(ANN) are increasingly applied on the problem, due to theirsuccess in other research fields. They are applied to both low[19], [20] and high frequency datasets [21], [22]. When look-ing at the high frequency domain, most of the works proposesimple, fully-connected feedforward neural networks for resi-dential settings [23]–[28]. Apart from fully-connected ANNs,Baets et al. [22] proposed a DCNN for identifying differentappliances using VI-trajectory-based appliance signatures. Onthe other hand, several authors have applied Recurrent NeuralNetworks (RNNs) on low frequency data to both energydisaggregation [19], [29], [30] and appliance identification[20], [31] with great success, yet high frequency data have notbeen extensively tested with RNNs. The lack of methods usingRNNs in the high frequency domain can be explained by thehigh computational requirements for high-dimensional (highfrequency) input data. Even in the low frequency domain,some works in NILM rely on first using convolutional layersto down-sample the input signal and to detect features beforeapplying recurrent layers to it [19], [29]. Besides the differentalgorithms that are applied to the task, no approach directlyuses the raw signal to perform the appliance classification tothe best of our knowledge. Studies have shown that differentappliances and system settings require different appliance sig-natures [9]. Using a high frequency signal, without droppinginformation by pre-processing it extensively, promises to allowto distinguish between multiple, even smaller appliances [4]. Ingeneral, ANNs and in particular DCNNs, are able to efficientlyprocess high dimensional data and to automatically extractmeaningful features from it [32]. Problems in other researchfields, especially in audio related tasks, exhibit a structurethat is similar to the one of the appliance identificationproblem. In [33], the authors successfully used DCNNs torecognize environmental sounds, supporting the idea to alsoapply DCNNs to distinguish different appliance types. Theypropose a DCNN architecture which is able to handle longinput sequences, containing up to 32000 data points. The inputsequences we use for the appliance identification task exhibita similar length to the data used in the audio related task [33].Roos et al. [34] manually derived an appliance hierarchy, usingthe appliances’ inherit electrical components and behaviour.Furthermore, the authors claim that a hierarchical classificationapproach is likely to enhance the identification capabilitiesof a classifier. DCNNs are designed to automatically extracthierarchical features while performing the classification task[32]. Therefore, it seems possible that DCNNs can make use ofthe hierarchy of the appliance types to efficiently perform the
classification task. The manually designed appliance hierarchysupports the claim to deliver state of the art results on theidentification problem.
III. APPLIANCE IDENTIFICATION APPROACH
Our classification approach and the experiments we devel-oped are designed based on the following main design princi-ples: Raw Input and Flexibility. To fulfill the first requirement,as little pre-processing as possible should be applied on thedata. Therefore, only minimal normalization and scaling of theraw input signal is to be used. For the Flexibility requirement,the chosen model needs to be flexible with respect to newappliances. In order to being able to compare the results tothe ones obtained in [9], we used the same datasets andinput sizes. Only the current signal is used as an input tothe DCNNs in the following, because it exhibits most of theinformation necessary to perform the identification task [9].Both datasets are comparatively small with high dimensionalsamples, resulting in a particular hard classification problem[32]. To overcome this issue, the number of samples isincreased by applying two Data Augmentation techniques toboth datasets and the architecture of the DCNN is designedto learn hierarchical features while gradually down-samplingthe input signal. By doing this, the network learns a lowerdimensional feature representation that is used as an appliancesignature in the identification task.
A. Data Pre-Processing
We only apply a minimum amount of pre-processing tothe raw current signal and we evaluate three pre-processingtechniques and their influence on classification performance.Furthermore, we evaluated the performance when applyingno pre-processing at all to the input signal. Applying somepre-processing to the data is motivated by the circumstancethat neural networks usually benefit from a standardized input[32]. The first technique we applied, is a z-score normalizationto adjust the input to have zero mean and unit variance byapplying:
xnorm =x � µ
�
To estimate the standard deviation �, we take the standarddeviation over all samples in the dataset. In addition to this,we take the mean of each appliance window to estimatethe expected value µ for the normalization. This is a smallvariation to the procedure proposed by [19], that has shown toproduce more normalized input signals. Instead of normalizingthe signal, we also only scaled the input by using two differentmin-max scaling procedures. Therefore, we evaluated scalingthe data into two value ranges, i.e., [0, +1] and [�1, +1]respectively. The transformation to the first interval is givenby
xscaled =x � min(x)
max(x) � min(x)
This is the author's accepted version of an article that has been published at the 2018 IEEE International Conference on Communications, Control, and Computing Technologies for Smart Grids (SmartGridComm). Changes were made to this version by the publisher prior to publication. The final version of record is available at https://doi.org/10.1109/SmartGridComm.2018.8587452
(c) 2018 IEEE. Reprinted, with permission, from Daniel Jorde, Thomas Kriechbaumer, and Hans-Arno Jacobsen; Electrical Appliance Classification using Deep Convolutional Neural Networks on High Frequency Current Measurements , 2018 IEEE International Conference on Communications, Control, and Computing Technologies for Smart Grids (SmartGridComm) 10/2018
In order to scale the data into the second interval, we used theformula below.
xscaled = 2 ⇥ x � min(x)
max(x) � min(x)� 1
Besides the presented techniques, we also evaluated the clas-sifier without transforming the input data at all. In contrastto other approaches like [22], no down-sampling is appliedbefore feeding the data into the classifier.
B. Data Augmentation
One of the challenges in applying Deep Learning modelsto NILM datasets like WHITED and PLAID is the smallnumber of samples per class. Collecting sub-metered datausually requires a high effort and special metering devices[35], especially when sampling at high frequencies [4]. Inorder to support the training of neural networks, the numberof samples can be increased. In addition to this, training theclassifier with augmented data has a regularization effect onthe model, helping it to generalize better to new samples[32]. Special care must be given to DA transformations toavoid changing the class of the sample. In order to increasethe dataset size by an order of magnitude, we applied twotransformations to the samples:
1) Phase Shift: Shift the activation window by one phase.2) Half-Phase Flip: Shift the activation window by a half-
phase and flip the signal, i.e., change the signs.A phase shift increases the time in-variance, whereas a half-phase flip increases the flexibility of the classifier to variationsin the signal. Figure 1 shows the DA process. First, the originalwindow is shifted one phase to the left to generate a sample.Afterwards, the signal is shifted by a half-phase and the signsof the measurement points are inverted.
C. Model Architecture
Appliance identification can be modelled as a multi-classclassifications problem, where each instance gets assignedexactly one out of many possible classes. To increase theflexibility of the classifier and to facilitate parallel training andinference, we reformulated the multi-class problem into mul-tiple binary ones for an One-versus-All (OvA) approach. Wetrained one binary classifier per appliance type and aggregatedthe results afterwards. This results in n classifiers for the nappliance types we want to distinguish, with the nth
i classifier’spositive output belonging to appliance class ci 2 C. Each ofthe binary classifiers outputs two probabilities, one for thepositive and one for the negative class (i.e., all other classes).In the aggregation step we then take the highest positiveprobability over all classifiers and assign it to the particularsample. If, for each classifier, the negative class probability ishigher then the positive one, we assign the sample to a ”none”class. Using a ”none” class allows us to group and furtherinvestigate samples which are unknown to the classifier. Asappliance identification is one of the base steps for a lot ofapplications, miss-classifications can have a huge effect onthe whole process. The conservative treatment of samples for
which the network is uncertain about helps to detect problemsearly in the analytical pipeline. Each binary classifier is afully DCNN with the following architectural components: Thenon-linearities we used in the hidden layers of the networksare Rectified Linear Units (ReLU). Furthermore, we choseto use the Nesterov Accelerated Gradient optimizer, with amomentum weight of 0.9 [36]. For parameter initialization weused a Glorot initializer [37]. Works like [33], [38] have shownhow one can learn useful features from high-dimensional inputsignals by gradually down-sampling the input when it passesthrough the network. To prevent the network from overfit-ting the data, we used L2-regularization and early stopping.Motivated by the findings of Dai et al. [33] on the similaraudio classification tasks, we used large receptive fields inthe convolutional layers and multiple pooling layers to handlethe input. We then designed three DCNN architectures andevaluated them (Table I). Some of the hyperparameters differslightly between the datasets due to the different size of theinput vectors. The notation for the convolutional layers is asfollows: (filter,kernel,stride) x number. For the pooling layers,we denoted the kernel and the stride we used.
To obtain variations of the base architecture we stackeddifferent amounts of convolutional layers on one another.Besides this, we evaluated multiple hyperparameters (e.g.,stride and kernel sizes) to obtain a configuration that producesthe best results over all binary classifiers. All the poolingand the convolutional layers use same zero-padding, exceptthe Avg-Pooling layer, which uses valid padding. It takes theaverage value of every feature map at the end and produces,after flattening the output, a one-dimensional representation forthe appliances. We apply the softmax function at the end of thepipeline to condition the output signal. The cost function weuse is the cross-entropy cost function. When building multiplebinary classifiers, the distribution of the class labels in thetraining data becomes highly imbalanced. For each classifierni the amount of data for the class ci is much smaller then thecount of samples labelled with the negative class. Many real-world datasets are highly imbalanced, therefore a lot of solu-tions have been proposed by researchers from different fields[39]. This extrinsic between-class-imbalance can be solved byvarious methods, one type being cost-sensitive approaches.In general, one uses a cost matrix to assign different costvalues to the classes in order to adjust for the imbalance. Inthe binary case, one typically uses two values Cost(Maj,Min)and Cost(Min,Maj), with the first being the cost to classifyone sample from the minority class as a majority one and thelatter one exactly the other way round. To prevent imbalances,we assigned a higher cost to miss-classifying minority classsamples, i.e., Cost(Maj,Min) > Cost(Min,Maj) [39]. In [40] theauthors evaluated multiple cost-sensitive approaches for neuralnetwork classifiers. Among the proposed ones, we decided tochoose an approach that aims to adapt the network output byassigning class specific costs because of its simplicity. Thefactor we used to scale the outputs stems from the relativeclass imbalance, i.e. we use the proportion of minority classto majority class samples.
This is the author's accepted version of an article that has been published at the 2018 IEEE International Conference on Communications, Control, and Computing Technologies for Smart Grids (SmartGridComm). Changes were made to this version by the publisher prior to publication. The final version of record is available at https://doi.org/10.1109/SmartGridComm.2018.8587452
(c) 2018 IEEE. Reprinted, with permission, from Daniel Jorde, Thomas Kriechbaumer, and Hans-Arno Jacobsen; Electrical Appliance Classification using Deep Convolutional Neural Networks on High Frequency Current Measurements , 2018 IEEE International Conference on Communications, Control, and Computing Technologies for Smart Grids (SmartGridComm) 10/2018
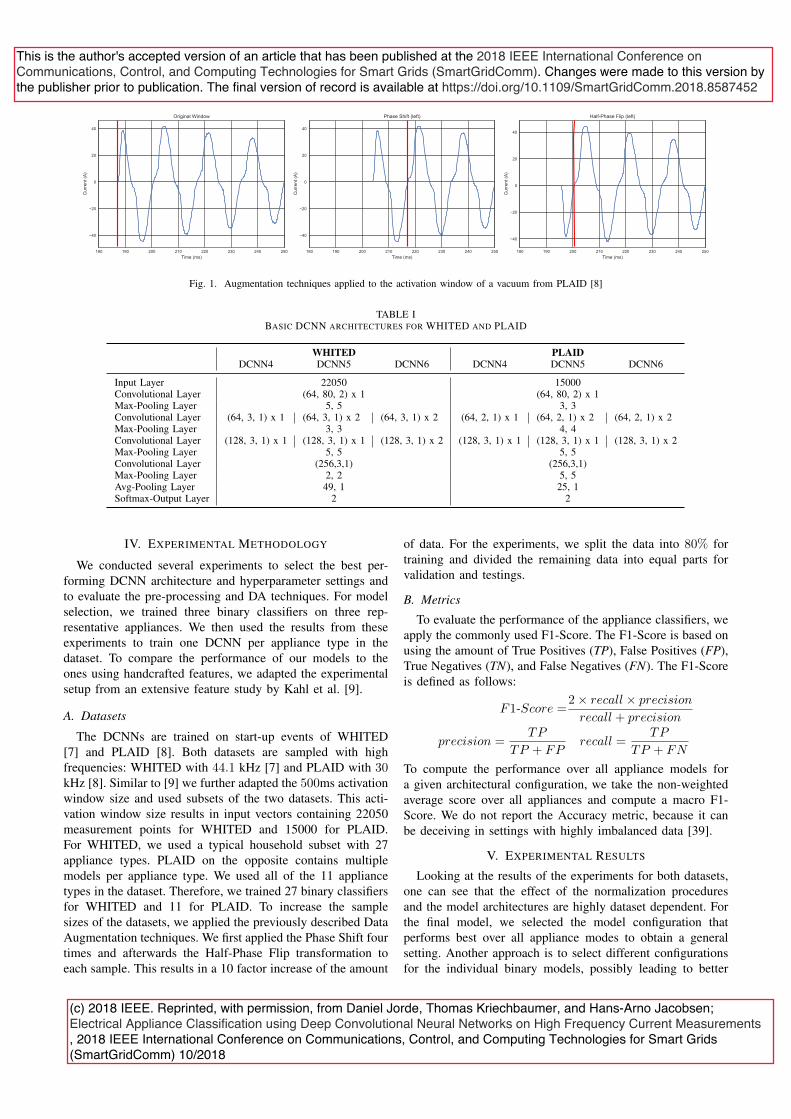
Fig. 1. Augmentation techniques applied to the activation window of a vacuum from PLAID [8]
TABLE IBASIC DCNN ARCHITECTURES FOR WHITED AND PLAID
WHITED PLAIDDCNN4 DCNN5 DCNN6 DCNN4 DCNN5 DCNN6
Input Layer 22050 15000Convolutional Layer (64, 80, 2) x 1 (64, 80, 2) x 1Max-Pooling Layer 5, 5 3, 3Convolutional Layer (64, 3, 1) x 1 (64, 3, 1) x 2 (64, 3, 1) x 2 (64, 2, 1) x 1 (64, 2, 1) x 2 (64, 2, 1) x 2Max-Pooling Layer 3, 3 4, 4Convolutional Layer (128, 3, 1) x 1 (128, 3, 1) x 1 (128, 3, 1) x 2 (128, 3, 1) x 1 (128, 3, 1) x 1 (128, 3, 1) x 2Max-Pooling Layer 5, 5 5, 5Convolutional Layer (256,3,1) (256,3,1)Max-Pooling Layer 2, 2 5, 5Avg-Pooling Layer 49, 1 25, 1Softmax-Output Layer 2 2
IV. EXPERIMENTAL METHODOLOGY
We conducted several experiments to select the best per-forming DCNN architecture and hyperparameter settings andto evaluate the pre-processing and DA techniques. For modelselection, we trained three binary classifiers on three rep-resentative appliances. We then used the results from theseexperiments to train one DCNN per appliance type in thedataset. To compare the performance of our models to theones using handcrafted features, we adapted the experimentalsetup from an extensive feature study by Kahl et al. [9].
A. Datasets
The DCNNs are trained on start-up events of WHITED[7] and PLAID [8]. Both datasets are sampled with highfrequencies: WHITED with 44.1 kHz [7] and PLAID with 30kHz [8]. Similar to [9] we further adapted the 500ms activationwindow size and used subsets of the two datasets. This acti-vation window size results in input vectors containing 22050measurement points for WHITED and 15000 for PLAID.For WHITED, we used a typical household subset with 27appliance types. PLAID on the opposite contains multiplemodels per appliance type. We used all of the 11 appliancetypes in the dataset. Therefore, we trained 27 binary classifiersfor WHITED and 11 for PLAID. To increase the samplesizes of the datasets, we applied the previously described DataAugmentation techniques. We first applied the Phase Shift fourtimes and afterwards the Half-Phase Flip transformation toeach sample. This results in a 10 factor increase of the amount
of data. For the experiments, we split the data into 80% fortraining and divided the remaining data into equal parts forvalidation and testings.
B. Metrics
To evaluate the performance of the appliance classifiers, weapply the commonly used F1-Score. The F1-Score is based onusing the amount of True Positives (TP), False Positives (FP),True Negatives (TN), and False Negatives (FN). The F1-Scoreis defined as follows:
F1-Score =2 ⇥ recall ⇥ precision
recall + precision
precision =TP
TP + FPrecall =
TP
TP + FN
To compute the performance over all appliance models fora given architectural configuration, we take the non-weightedaverage score over all appliances and compute a macro F1-Score. We do not report the Accuracy metric, because it canbe deceiving in settings with highly imbalanced data [39].
V. EXPERIMENTAL RESULTS
Looking at the results of the experiments for both datasets,one can see that the effect of the normalization proceduresand the model architectures are highly dataset dependent. Forthe final model, we selected the model configuration thatperforms best over all appliance modes to obtain a generalsetting. Another approach is to select different configurationsfor the individual binary models, possibly leading to better
This is the author's accepted version of an article that has been published at the 2018 IEEE International Conference on Communications, Control, and Computing Technologies for Smart Grids (SmartGridComm). Changes were made to this version by the publisher prior to publication. The final version of record is available at https://doi.org/10.1109/SmartGridComm.2018.8587452
(c) 2018 IEEE. Reprinted, with permission, from Daniel Jorde, Thomas Kriechbaumer, and Hans-Arno Jacobsen; Electrical Appliance Classification using Deep Convolutional Neural Networks on High Frequency Current Measurements , 2018 IEEE International Conference on Communications, Control, and Computing Technologies for Smart Grids (SmartGridComm) 10/2018
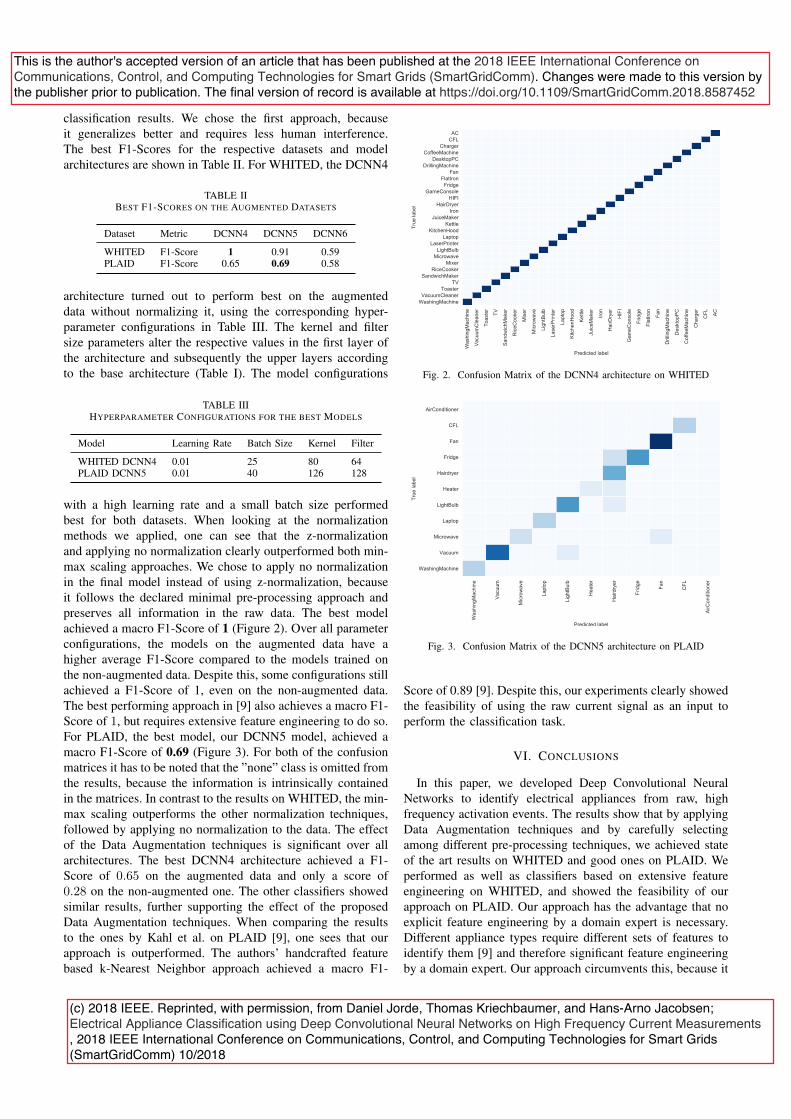
classification results. We chose the first approach, becauseit generalizes better and requires less human interference.The best F1-Scores for the respective datasets and modelarchitectures are shown in Table II. For WHITED, the DCNN4
TABLE IIBEST F1-SCORES ON THE AUGMENTED DATASETS
Dataset Metric DCNN4 DCNN5 DCNN6
WHITED F1-Score 1 0.91 0.59PLAID F1-Score 0.65 0.69 0.58
architecture turned out to perform best on the augmenteddata without normalizing it, using the corresponding hyper-parameter configurations in Table III. The kernel and filtersize parameters alter the respective values in the first layer ofthe architecture and subsequently the upper layers accordingto the base architecture (Table I). The model configurations
TABLE IIIHYPERPARAMETER CONFIGURATIONS FOR THE BEST MODELS
Model Learning Rate Batch Size Kernel Filter
WHITED DCNN4 0.01 25 80 64PLAID DCNN5 0.01 40 126 128
with a high learning rate and a small batch size performedbest for both datasets. When looking at the normalizationmethods we applied, one can see that the z-normalizationand applying no normalization clearly outperformed both min-max scaling approaches. We chose to apply no normalizationin the final model instead of using z-normalization, becauseit follows the declared minimal pre-processing approach andpreserves all information in the raw data. The best modelachieved a macro F1-Score of 1 (Figure 2). Over all parameterconfigurations, the models on the augmented data have ahigher average F1-Score compared to the models trained onthe non-augmented data. Despite this, some configurations stillachieved a F1-Score of 1, even on the non-augmented data.The best performing approach in [9] also achieves a macro F1-Score of 1, but requires extensive feature engineering to do so.For PLAID, the best model, our DCNN5 model, achieved amacro F1-Score of 0.69 (Figure 3). For both of the confusionmatrices it has to be noted that the ”none” class is omitted fromthe results, because the information is intrinsically containedin the matrices. In contrast to the results on WHITED, the min-max scaling outperforms the other normalization techniques,followed by applying no normalization to the data. The effectof the Data Augmentation techniques is significant over allarchitectures. The best DCNN4 architecture achieved a F1-Score of 0.65 on the augmented data and only a score of0.28 on the non-augmented one. The other classifiers showedsimilar results, further supporting the effect of the proposedData Augmentation techniques. When comparing the resultsto the ones by Kahl et al. on PLAID [9], one sees that ourapproach is outperformed. The authors’ handcrafted featurebased k-Nearest Neighbor approach achieved a macro F1-
Fig. 2. Confusion Matrix of the DCNN4 architecture on WHITED
Fig. 3. Confusion Matrix of the DCNN5 architecture on PLAID
Score of 0.89 [9]. Despite this, our experiments clearly showedthe feasibility of using the raw current signal as an input toperform the classification task.
VI. CONCLUSIONS
In this paper, we developed Deep Convolutional NeuralNetworks to identify electrical appliances from raw, highfrequency activation events. The results show that by applyingData Augmentation techniques and by carefully selectingamong different pre-processing techniques, we achieved stateof the art results on WHITED and good ones on PLAID. Weperformed as well as classifiers based on extensive featureengineering on WHITED, and showed the feasibility of ourapproach on PLAID. Our approach has the advantage that noexplicit feature engineering by a domain expert is necessary.Different appliance types require different sets of features toidentify them [9] and therefore significant feature engineeringby a domain expert. Our approach circumvents this, because it
This is the author's accepted version of an article that has been published at the 2018 IEEE International Conference on Communications, Control, and Computing Technologies for Smart Grids (SmartGridComm). Changes were made to this version by the publisher prior to publication. The final version of record is available at https://doi.org/10.1109/SmartGridComm.2018.8587452
(c) 2018 IEEE. Reprinted, with permission, from Daniel Jorde, Thomas Kriechbaumer, and Hans-Arno Jacobsen; Electrical Appliance Classification using Deep Convolutional Neural Networks on High Frequency Current Measurements , 2018 IEEE International Conference on Communications, Control, and Computing Technologies for Smart Grids (SmartGridComm) 10/2018
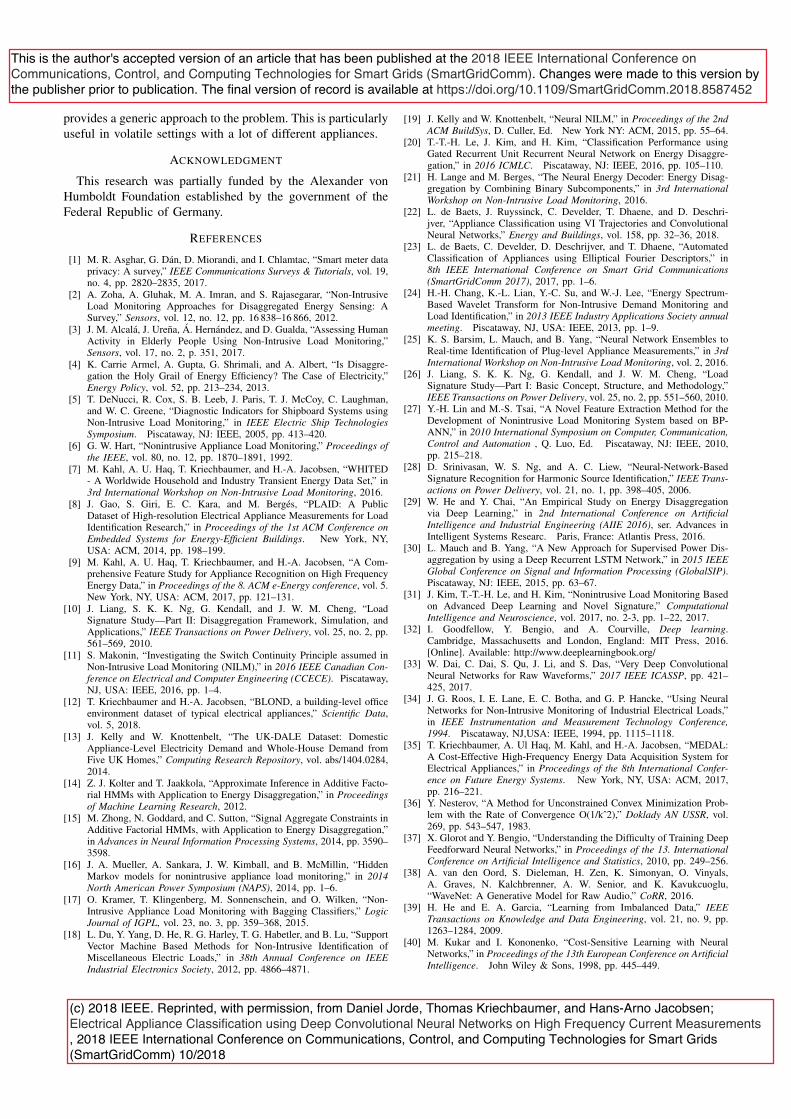
provides a generic approach to the problem. This is particularlyuseful in volatile settings with a lot of different appliances.
ACKNOWLEDGMENT
This research was partially funded by the Alexander vonHumboldt Foundation established by the government of theFederal Republic of Germany.
REFERENCES
[1] M. R. Asghar, G. Dan, D. Miorandi, and I. Chlamtac, “Smart meter dataprivacy: A survey,” IEEE Communications Surveys & Tutorials, vol. 19,no. 4, pp. 2820–2835, 2017.
[2] A. Zoha, A. Gluhak, M. A. Imran, and S. Rajasegarar, “Non-IntrusiveLoad Monitoring Approaches for Disaggregated Energy Sensing: ASurvey,” Sensors, vol. 12, no. 12, pp. 16 838–16 866, 2012.
[3] J. M. Alcala, J. Urena, A. Hernandez, and D. Gualda, “Assessing HumanActivity in Elderly People Using Non-Intrusive Load Monitoring,”Sensors, vol. 17, no. 2, p. 351, 2017.
[4] K. Carrie Armel, A. Gupta, G. Shrimali, and A. Albert, “Is Disaggre-gation the Holy Grail of Energy Efficiency? The Case of Electricity,”Energy Policy, vol. 52, pp. 213–234, 2013.
[5] T. DeNucci, R. Cox, S. B. Leeb, J. Paris, T. J. McCoy, C. Laughman,and W. C. Greene, “Diagnostic Indicators for Shipboard Systems usingNon-Intrusive Load Monitoring,” in IEEE Electric Ship TechnologiesSymposium. Piscataway, NJ: IEEE, 2005, pp. 413–420.
[6] G. W. Hart, “Nonintrusive Appliance Load Monitoring,” Proceedings ofthe IEEE, vol. 80, no. 12, pp. 1870–1891, 1992.
[7] M. Kahl, A. U. Haq, T. Kriechbaumer, and H.-A. Jacobsen, “WHITED- A Worldwide Household and Industry Transient Energy Data Set,” in3rd International Workshop on Non-Intrusive Load Monitoring, 2016.
[8] J. Gao, S. Giri, E. C. Kara, and M. Berges, “PLAID: A PublicDataset of High-resolution Electrical Appliance Measurements for LoadIdentification Research,” in Proceedings of the 1st ACM Conference onEmbedded Systems for Energy-Efficient Buildings. New York, NY,USA: ACM, 2014, pp. 198–199.
[9] M. Kahl, A. U. Haq, T. Kriechbaumer, and H.-A. Jacobsen, “A Com-prehensive Feature Study for Appliance Recognition on High FrequencyEnergy Data,” in Proceedings of the 8. ACM e-Energy conference, vol. 5.New York, NY, USA: ACM, 2017, pp. 121–131.
[10] J. Liang, S. K. K. Ng, G. Kendall, and J. W. M. Cheng, “LoadSignature Study—Part II: Disaggregation Framework, Simulation, andApplications,” IEEE Transactions on Power Delivery, vol. 25, no. 2, pp.561–569, 2010.
[11] S. Makonin, “Investigating the Switch Continuity Principle assumed inNon-Intrusive Load Monitoring (NILM),” in 2016 IEEE Canadian Con-ference on Electrical and Computer Engineering (CCECE). Piscataway,NJ, USA: IEEE, 2016, pp. 1–4.
[12] T. Kriechbaumer and H.-A. Jacobsen, “BLOND, a building-level officeenvironment dataset of typical electrical appliances,” Scientific Data,vol. 5, 2018.
[13] J. Kelly and W. Knottenbelt, “The UK-DALE Dataset: DomesticAppliance-Level Electricity Demand and Whole-House Demand fromFive UK Homes,” Computing Research Repository, vol. abs/1404.0284,2014.
[14] Z. J. Kolter and T. Jaakkola, “Approximate Inference in Additive Facto-rial HMMs with Application to Energy Disaggregation,” in Proceedingsof Machine Learning Research, 2012.
[15] M. Zhong, N. Goddard, and C. Sutton, “Signal Aggregate Constraints inAdditive Factorial HMMs, with Application to Energy Disaggregation,”in Advances in Neural Information Processing Systems, 2014, pp. 3590–3598.
[16] J. A. Mueller, A. Sankara, J. W. Kimball, and B. McMillin, “HiddenMarkov models for nonintrusive appliance load monitoring,” in 2014North American Power Symposium (NAPS), 2014, pp. 1–6.
[17] O. Kramer, T. Klingenberg, M. Sonnenschein, and O. Wilken, “Non-Intrusive Appliance Load Monitoring with Bagging Classifiers,” LogicJournal of IGPL, vol. 23, no. 3, pp. 359–368, 2015.
[18] L. Du, Y. Yang, D. He, R. G. Harley, T. G. Habetler, and B. Lu, “SupportVector Machine Based Methods for Non-Intrusive Identification ofMiscellaneous Electric Loads,” in 38th Annual Conference on IEEEIndustrial Electronics Society, 2012, pp. 4866–4871.
[19] J. Kelly and W. Knottenbelt, “Neural NILM,” in Proceedings of the 2ndACM BuildSys, D. Culler, Ed. New York NY: ACM, 2015, pp. 55–64.
[20] T.-T.-H. Le, J. Kim, and H. Kim, “Classification Performance usingGated Recurrent Unit Recurrent Neural Network on Energy Disaggre-gation,” in 2016 ICMLC. Piscataway, NJ: IEEE, 2016, pp. 105–110.
[21] H. Lange and M. Berges, “The Neural Energy Decoder: Energy Disag-gregation by Combining Binary Subcomponents,” in 3rd InternationalWorkshop on Non-Intrusive Load Monitoring, 2016.
[22] L. de Baets, J. Ruyssinck, C. Develder, T. Dhaene, and D. Deschri-jver, “Appliance Classification using VI Trajectories and ConvolutionalNeural Networks,” Energy and Buildings, vol. 158, pp. 32–36, 2018.
[23] L. de Baets, C. Develder, D. Deschrijver, and T. Dhaene, “AutomatedClassification of Appliances using Elliptical Fourier Descriptors,” in8th IEEE International Conference on Smart Grid Communications(SmartGridComm 2017), 2017, pp. 1–6.
[24] H.-H. Chang, K.-L. Lian, Y.-C. Su, and W.-J. Lee, “Energy Spectrum-Based Wavelet Transform for Non-Intrusive Demand Monitoring andLoad Identification,” in 2013 IEEE Industry Applications Society annualmeeting. Piscataway, NJ, USA: IEEE, 2013, pp. 1–9.
[25] K. S. Barsim, L. Mauch, and B. Yang, “Neural Network Ensembles toReal-time Identification of Plug-level Appliance Measurements,” in 3rdInternational Workshop on Non-Intrusive Load Monitoring, vol. 2, 2016.
[26] J. Liang, S. K. K. Ng, G. Kendall, and J. W. M. Cheng, “LoadSignature Study—Part I: Basic Concept, Structure, and Methodology,”IEEE Transactions on Power Delivery, vol. 25, no. 2, pp. 551–560, 2010.
[27] Y.-H. Lin and M.-S. Tsai, “A Novel Feature Extraction Method for theDevelopment of Nonintrusive Load Monitoring System based on BP-ANN,” in 2010 International Symposium on Computer, Communication,Control and Automation , Q. Luo, Ed. Piscataway, NJ: IEEE, 2010,pp. 215–218.
[28] D. Srinivasan, W. S. Ng, and A. C. Liew, “Neural-Network-BasedSignature Recognition for Harmonic Source Identification,” IEEE Trans-actions on Power Delivery, vol. 21, no. 1, pp. 398–405, 2006.
[29] W. He and Y. Chai, “An Empirical Study on Energy Disaggregationvia Deep Learning,” in 2nd International Conference on ArtificialIntelligence and Industrial Engineering (AIIE 2016), ser. Advances inIntelligent Systems Researc. Paris, France: Atlantis Press, 2016.
[30] L. Mauch and B. Yang, “A New Approach for Supervised Power Dis-aggregation by using a Deep Recurrent LSTM Network,” in 2015 IEEEGlobal Conference on Signal and Information Processing (GlobalSIP).Piscataway, NJ: IEEE, 2015, pp. 63–67.
[31] J. Kim, T.-T.-H. Le, and H. Kim, “Nonintrusive Load Monitoring Basedon Advanced Deep Learning and Novel Signature,” ComputationalIntelligence and Neuroscience, vol. 2017, no. 2-3, pp. 1–22, 2017.
[32] I. Goodfellow, Y. Bengio, and A. Courville, Deep learning.Cambridge, Massachusetts and London, England: MIT Press, 2016.[Online]. Available: http://www.deeplearningbook.org/
[33] W. Dai, C. Dai, S. Qu, J. Li, and S. Das, “Very Deep ConvolutionalNeural Networks for Raw Waveforms,” 2017 IEEE ICASSP, pp. 421–425, 2017.
[34] J. G. Roos, I. E. Lane, E. C. Botha, and G. P. Hancke, “Using NeuralNetworks for Non-Intrusive Monitoring of Industrial Electrical Loads,”in IEEE Instrumentation and Measurement Technology Conference,1994. Piscataway, NJ,USA: IEEE, 1994, pp. 1115–1118.
[35] T. Kriechbaumer, A. Ul Haq, M. Kahl, and H.-A. Jacobsen, “MEDAL:A Cost-Effective High-Frequency Energy Data Acquisition System forElectrical Appliances,” in Proceedings of the 8th International Confer-ence on Future Energy Systems. New York, NY, USA: ACM, 2017,pp. 216–221.
[36] Y. Nesterov, “A Method for Unconstrained Convex Minimization Prob-lem with the Rate of Convergence O(1/kˆ2),” Doklady AN USSR, vol.269, pp. 543–547, 1983.
[37] X. Glorot and Y. Bengio, “Understanding the Difficulty of Training DeepFeedforward Neural Networks,” in Proceedings of the 13. InternationalConference on Artificial Intelligence and Statistics, 2010, pp. 249–256.
[38] A. van den Oord, S. Dieleman, H. Zen, K. Simonyan, O. Vinyals,A. Graves, N. Kalchbrenner, A. W. Senior, and K. Kavukcuoglu,“WaveNet: A Generative Model for Raw Audio,” CoRR, 2016.
[39] H. He and E. A. Garcia, “Learning from Imbalanced Data,” IEEETransactions on Knowledge and Data Engineering, vol. 21, no. 9, pp.1263–1284, 2009.
[40] M. Kukar and I. Kononenko, “Cost-Sensitive Learning with NeuralNetworks,” in Proceedings of the 13th European Conference on ArtificialIntelligence. John Wiley & Sons, 1998, pp. 445–449.
This is the author's accepted version of an article that has been published at the 2018 IEEE International Conference on Communications, Control, and Computing Technologies for Smart Grids (SmartGridComm). Changes were made to this version by the publisher prior to publication. The final version of record is available at https://doi.org/10.1109/SmartGridComm.2018.8587452
(c) 2018 IEEE. Reprinted, with permission, from Daniel Jorde, Thomas Kriechbaumer, and Hans-Arno Jacobsen; Electrical Appliance Classification using Deep Convolutional Neural Networks on High Frequency Current Measurements , 2018 IEEE International Conference on Communications, Control, and Computing Technologies for Smart Grids (SmartGridComm) 10/2018