Embed Size (px)
Citation preview
Market stimulation of new airline routes

SEO Economisch Onderzoek - Roetersstraat 29 - 1018 WB Amsterdam - T (+31) 20 525 1630 - www.seo.nl - [email protected] ABN-AMRO IBAN: NL14ABNA0411744356 BIC: ABNANL2A - ING: IBAN: NL96INGB0004641100 BIC: INGBNL2A
KvK Amsterdam 41197444 - BTW NL 003023965 B01
Amsterdam, January 2016
Market stimulation of new airline routes
Thijs Boonekamp (SEO) Howard Riddiough (Schiphol Group)

The science of knowing” SEO Amsterdam Economics carries out independent applied economic research on behalf of national and international clients – both public institutions and private sector clients. Our research aims to make a major contribution to the decision-making processes of our clients. Originally founded by, and still affiliated with, the University of Amsterdam, SEO Amsterdam Economics is now an independent research group but retains a strong academic component. Oper-ating on a nonprofit basis, SEO continually invests in the intellectual capital of its staff by granting them time to pursue continuing education, publish in academic journals, and participate in academic networks and conferences. As a result, our staff is fully up to date on the latest economic theories and econometric techniques.
Disclaimer: This is a discussion paper, not a finished report. The content of this paper is not definite.
SEO-Discussion paper nr. 88 Copyright © 2017 SEO Amsterdam. All rights reserved. Data from this report may be used in articles, studies and syllabi, provided that the source is clearly and accurately mentioned. Data in this report may not be used for commercial purposes without prior permission of the author(s). Permission can be obtained by contacting: [email protected].
MARKET STIMULATION OF NEW AIRLINE ROUTES i
SEO AMSTERDAM ECONOMICS
Summary
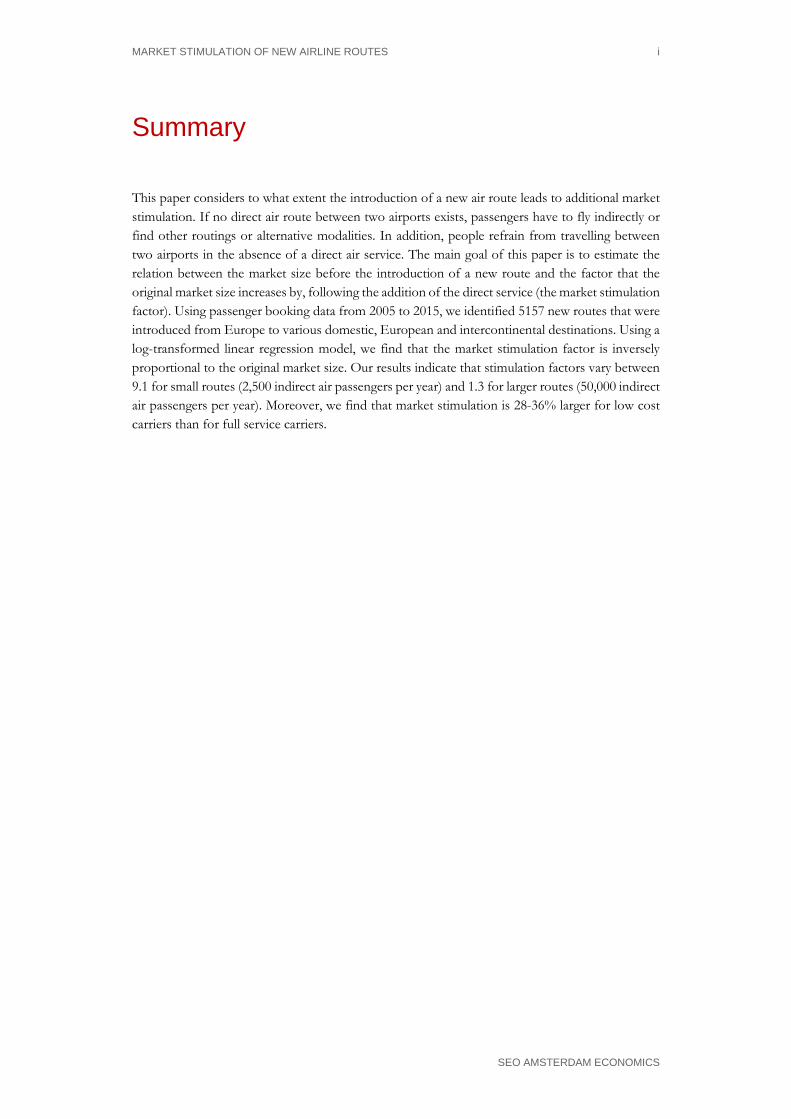
This paper considers to what extent the introduction of a new air route leads to additional market stimulation. If no direct air route between two airports exists, passengers have to fly indirectly or find other routings or alternative modalities. In addition, people refrain from travelling between two airports in the absence of a direct air service. The main goal of this paper is to estimate the relation between the market size before the introduction of a new route and the factor that the original market size increases by, following the addition of the direct service (the market stimulation factor). Using passenger booking data from 2005 to 2015, we identified 5157 new routes that were introduced from Europe to various domestic, European and intercontinental destinations. Using a log-transformed linear regression model, we find that the market stimulation factor is inversely proportional to the original market size. Our results indicate that stimulation factors vary between 9.1 for small routes (2,500 indirect air passengers per year) and 1.3 for larger routes (50,000 indirect air passengers per year). Moreover, we find that market stimulation is 28-36% larger for low cost carriers than for full service carriers.

MARKET STIMULATION OF NEW AIRLINE ROUTES
SEO AMSTERDAM ECONOMICS
Table of contents
Summary .............................................................................................................................. i
1 Introduction ............................................................................................................... 1
2 Literature review ....................................................................................................... 3
3 Definition of market stimulation and data ............................................................... 7 3.1 Definition of market stimulation ........................................................................................ 7
3.2 Data sources ........................................................................................................................... 8
3.3 Descriptive Statistics ............................................................................................................. 9
4 Empirical analysis.................................................................................................... 17 4.1 Model definition .................................................................................................................. 17
4.2 Results ................................................................................................................................... 18
4.3 Market stimulation .............................................................................................................. 20
5 Conclusions and further research steps ...................................................................23 5.1 Conclusions .......................................................................................................................... 23
5.2 Further research steps ......................................................................................................... 24
Literature ............................................................................................................................27
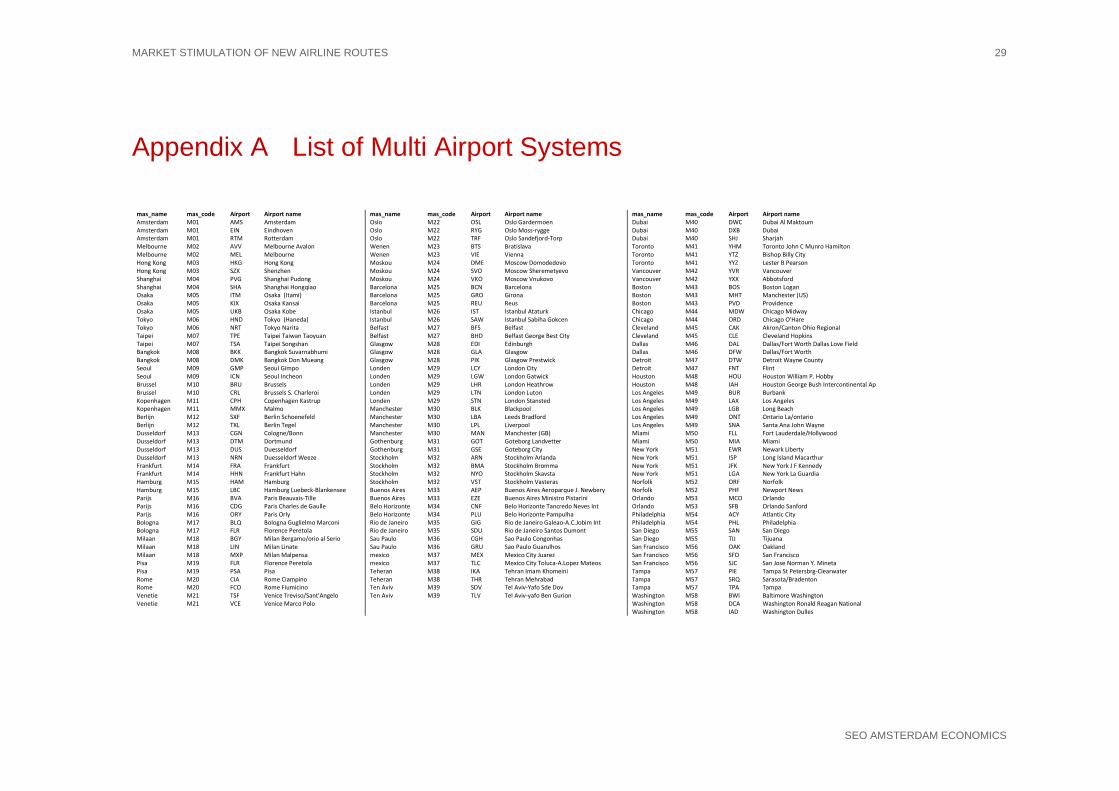
Appendix A List of Multi Airport Systems .....................................................................29


MARKET STIMULATION OF NEW AIRLINE ROUTES 1
SEO AMSTERDAM ECONOMICS
1 Introduction
For the analysis of business cases for new airline routes it is valuable to have good insight in the extent to which new air services generate additional demand. If a direct air service does not exist, passengers either travel using indirect air connections, use connections between different airports1 or use other transport modalities. Moreover, reduced travel costs following new direct services attracts additional demand that does not travel in the absence of a direct route. The main goal of this paper is to estimate the relation between the market size before the introduction of a new route and the factor that the original market size increases by, following the addition of the direct service (the market stimulation factor). By definition, this market stimulation factor encapsulates additional demand as well as a shift of demand from travel alternatives other than indirect air travel. While literature on air transport demand forecasting is widespread, few focus solely on the stimu-lation impact of new air services. To the best of our knowledge the market stimulation curve de-rived by IATA is the only existing research in this field, which has been applied in various studies (e.g. Sismanidou et al. 2013; Vilalta and Suau-Sanchez 2016). However, there is lack of empirical evidence of market stimulation, which is the research gap this paper taps into. By means of an extensive dataset of all new routes started between 2005 and 2015 in Europe we estimate market stimulation impacts of new air services. The paper is structured as follows: Chapter 2 presents the existing literature on market stimulation and passenger demand forecasting. Chapter 3 defines the concept of market stimulation and de-scribes the data used in our models. In chapter 4 the empirical model is defined and the results are presented. Chapter 5 concludes and presents potential further research steps.
1 This considers airports outside the respective multi airport system

MARKET STIMULATION OF NEW AIRLINE ROUTES 3
SEO AMSTERDAM ECONOMICS
2 Literature review
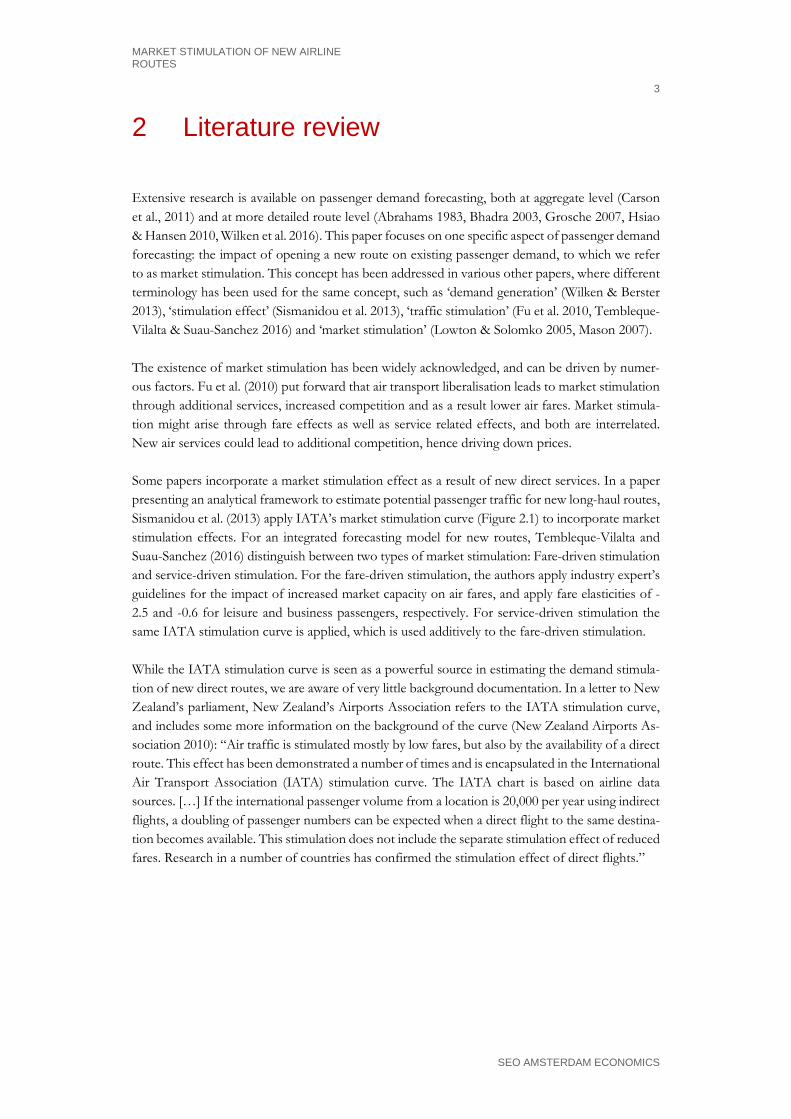
Extensive research is available on passenger demand forecasting, both at aggregate level (Carson et al., 2011) and at more detailed route level (Abrahams 1983, Bhadra 2003, Grosche 2007, Hsiao & Hansen 2010, Wilken et al. 2016). This paper focuses on one specific aspect of passenger demand forecasting: the impact of opening a new route on existing passenger demand, to which we refer to as market stimulation. This concept has been addressed in various other papers, where different terminology has been used for the same concept, such as ‘demand generation’ (Wilken & Berster 2013), ‘stimulation effect’ (Sismanidou et al. 2013), ‘traffic stimulation’ (Fu et al. 2010, Tembleque-Vilalta & Suau-Sanchez 2016) and ‘market stimulation’ (Lowton & Solomko 2005, Mason 2007). The existence of market stimulation has been widely acknowledged, and can be driven by numer-ous factors. Fu et al. (2010) put forward that air transport liberalisation leads to market stimulation through additional services, increased competition and as a result lower air fares. Market stimula-tion might arise through fare effects as well as service related effects, and both are interrelated. New air services could lead to additional competition, hence driving down prices. Some papers incorporate a market stimulation effect as a result of new direct services. In a paper presenting an analytical framework to estimate potential passenger traffic for new long-haul routes, Sismanidou et al. (2013) apply IATA’s market stimulation curve (Figure 2.1) to incorporate market stimulation effects. For an integrated forecasting model for new routes, Tembleque-Vilalta and Suau-Sanchez (2016) distinguish between two types of market stimulation: Fare-driven stimulation and service-driven stimulation. For the fare-driven stimulation, the authors apply industry expert’s guidelines for the impact of increased market capacity on air fares, and apply fare elasticities of -2.5 and -0.6 for leisure and business passengers, respectively. For service-driven stimulation the same IATA stimulation curve is applied, which is used additively to the fare-driven stimulation. While the IATA stimulation curve is seen as a powerful source in estimating the demand stimula-tion of new direct routes, we are aware of very little background documentation. In a letter to New Zealand’s parliament, New Zealand’s Airports Association refers to the IATA stimulation curve, and includes some more information on the background of the curve (New Zealand Airports As-sociation 2010): “Air traffic is stimulated mostly by low fares, but also by the availability of a direct route. This effect has been demonstrated a number of times and is encapsulated in the International Air Transport Association (IATA) stimulation curve. The IATA chart is based on airline data sources. […] If the international passenger volume from a location is 20,000 per year using indirect flights, a doubling of passenger numbers can be expected when a direct flight to the same destina-tion becomes available. This stimulation does not include the separate stimulation effect of reduced fares. Research in a number of countries has confirmed the stimulation effect of direct flights.”
4 CHAPTER 2
SEO AMSTERDAM ECONOMICS
Figure 2.1 IATA stimulation curve
Source: New Zealand Airports Association (2010)
Particularly low cost carriers have attracted many new air passengers over the last decades (De Wit & Zuidberg 2012). According to Wilken & Berster (2013), about 40% to 60% of all low cost carriers passengers come from other airlines or other modes of transport, the rest are newly generated passengers. Using two German cases, they show substantial market stimulation impacts of addi-tional low cost carrier services. On the Cologne-Hamburg route passenger demand doubled in early 2003, following the introduction of low-cost services by Hapag Lloyd Express. On the Co-logne-Berlin route, passenger demand increased from 35,000 to 55,000 passengers per month. Fu et al. (2014) show that in Japan demand elasticities of additional flight frequencies vary between 0.36 and 0.42. Hsiao and Hansen (2011), using US data from 5 combined sources, find frequency elasticities between 1.21 and 1.34 for direct services, and 0.79 to 0.96 for indirect services. To the best of our knowledge, none of these papers have focused solely on newly introduced services. The Transportation Research Board (TRB) committee on aviation economics and forecasting pre-sents various suggestions of how to estimate market stimulation impacts (Transportation Research Board 2002). One suggestion is to estimate market stimulation effects for a particular route by comparing stimulation effects of historically started new routes with similar competitive character-istics. Alternatively, quality of service index (QSI) models can be used to estimate stimulation ef-fects by applying user-specified elasticities to specify the demand effects following changes in ser-vice quality or generalised travel costs. However, the latter type of calculations are challenging, as generalised travel costs as well as total O&D passenger numbers are often unknown. While various studies have included service-related variables in their demand forecasting models (Abrahams 1983, Jorge-Calderón 1997, Hsiao & Hansen 2011), none of these have focussed solely on the aspect of market stimulation. As there happens to be a reverse causality issue between de-mand and supply of air services, service-related impacts on air travel might not be accurately esti-mated and results might be biased. In this paper, we estimate the factor by which the original

LITERATURE REVIEW 5
SEO ECONOMISCH ONDERZOEK
indirect market size has increased after the introduction of new air services originating from Eu-rope, in the period 2005-2015. Using this approach we can provide a stimulation curve based on empirical evidence. We can then observe whether market stimulation effect modelled on data span-ning the last decade match those of the IATA stimulation curve.

MARKET STIMULATION OF NEW AIRLINE ROUTES 7
SEO AMSTERDAM ECONOMICS
3 Definition of market stimulation and data
In order to estimate market stimulation we have constructed a database from four sources contain-ing information concerning: market sizes, eventual market stimulation, population size, GDP per capita and the service type of the airline responsible for opening a new direct air service. The sources used are: (i) Innovata and OAG Schedules (Airline Schedules), (ii) Diio Mi MIDT data (Passenger Movements), (iii) UN Urban Agglomeration population data (United Nations 2014) and (iv) World Bank (GDP data) (World Bank 2016).
3.1 Definition of market stimulation We have defined the market stimulation factor to be the relative difference between the market size n months prior to the introduction of the new direct air service and the market size n months following the market entry. The first step in this calculation is thus identifying when a new direct service is introduced. To do this we used Innovata Flight Schedules and MIDT data. A new direct service was defined as follows: 1. A route between two airports is considered as new if it has over 500 direct passengers per
month for a consecutive period of n months, while not carrying more than 500 passengers in total in the n previous months.2
2. Some airlines offer routes only in particular seasons, such as flights to popular summer holiday destinations. The above definition of a new route will consider some seasonal routes as “new” each year. To correct for this, only routes which were newly started once during the period of analysis were considered as new routes, while the others were considered as seasonal routes.
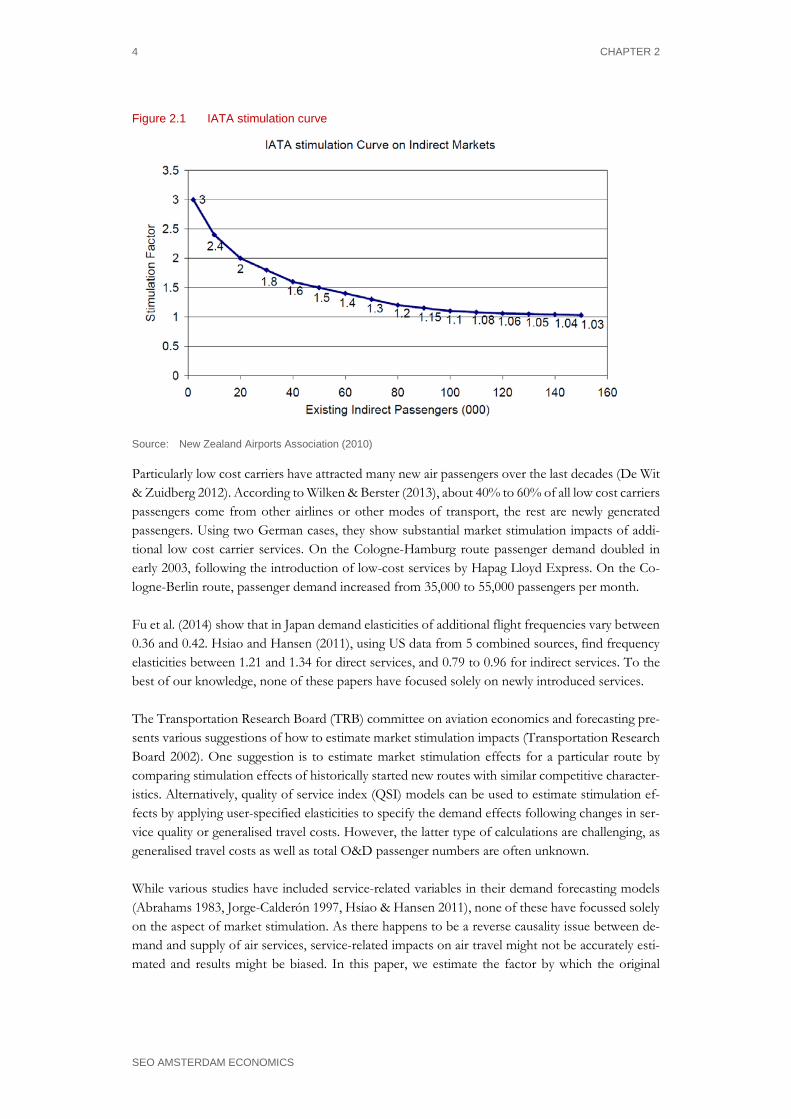
3. Some markets are served by more than one airport, leading to competition on the same routes via different airports. We distinguish between V-competition and parallel competition (see Figure 3.1), which is best explained by an example. The Milan-London market is for example served via a flight from Milan Linate to London Heathrow as well as a flight from Milan Linate to London Gatwick (V-competition). Moreover, the same market may also be served via two entirely different airport pairs serving the same airport system (parallel competition). Again, the Milan-London market is served by a flight from Linate to Heathrow, as well as by a flight from Malpensa to Gatwick. We control for both types of airport competition by aggregating airports to certain Multi Airport Systems, largely following Bonnefoy (2008) (see Appendix A). We do not consider a route as new if the same market is served by another alternative in terms of V- or parallel competition, during the period in which the considered “new” route is in service.
2 The upper boundary of 500 passengers over the previous n months is included to allow for some flexibility
in the data towards errors in the MIDT data.
8 CHAPTER 3
SEO AMSTERDAM ECONOMICS
Figure 3.1 V-competition and parallel competition
LGWLHR
LIN
LHR LGW
LIN MXP
V-competition Parallel competition
Source: SEO
3.2 Data sources Innovata Schedules Innovata schedules include global schedules for (theoretically) all commercial aviation flights. In-novata Schedules give detailed flight level information, as a result it is possible to identify the airline responsible for opening a new route. We believe that low cost airlines (LCCs) will enter a market offering lower prices thus further encouraging market growth. To control for this effect we have included a low cost dummy in our dataset that is equal to 1 if a route was opened by a low cost airline.3 Moreover, Innovata Schedules provides information on the total seat capacity offered by airlines. In estimating the level of market stimulation we control for the number of seats airlines put into the market. In case airlines put a larger number of seats into the market, they might see more potential in these routes.
MIDT Data After identifying new direct services, the next step is to define a market size for every particular route pairing. We achieved this by using MIDT data provided by Diio Mi. MIDT passenger data calculates total passenger numbers by applying a factor to travel agent air ticket sales, this factor varies depending on year, airline and route. Using data across the 10 year period between 2005 and 2015 we calculated the market size and the market stimulation. Thus our dependent variable, mar-ket stimulation, is calculated using a combination of Innovata schedules and MIDT data, as too is our key independent variable; market size.
UN Urban Agglomeration Population Data Arguably it is important to control for population size when estimating the effect of market size on the market stimulation. The United Nations (UN) provide a database giving the populations of Urban agglomerations of over 300,000 citizens from 1950 to 2030 (United Nations, 2014). Urban
3 The following carriers were considered as LCCs: Ryanair, Easyjet, Wizz Air, Norwegian, Vueling, Jet2,
Pegasus, Germanwings and Transavia.
DEFINITION OF MARKET STIMULATION AND DATA 9
SEO ECONOMISCH ONDERZOEK
agglomerations can be thought of as towns and cities, The UN collects population data from coun-cil or government census’, compiles this information and updates the data each year. The database includes the longitude and latitude of each urban agglomeration, this geographical information was used to calculate the population within 50km of each airport in our analysis, in line with Van Wijk (2007) and Suau-Sanchez et al. (2014). We will refer to this population calculation as the catchment population. Some airports are not located within 50km of an urban agglomeration of over 300,000 citizens. In order to be able to include these airports in our analysis, we set the population size to 100,000. This prevents the analysis from having a selection bias of only including new routes between airports around relatively large cities.
GDP Purchasing power may also determine to what extent a market is stimulated and so again is im-portant to control for. We collected the GDP per capita for each country in our database from 2005 to 2015 from World Bank data (World Bank 2016).
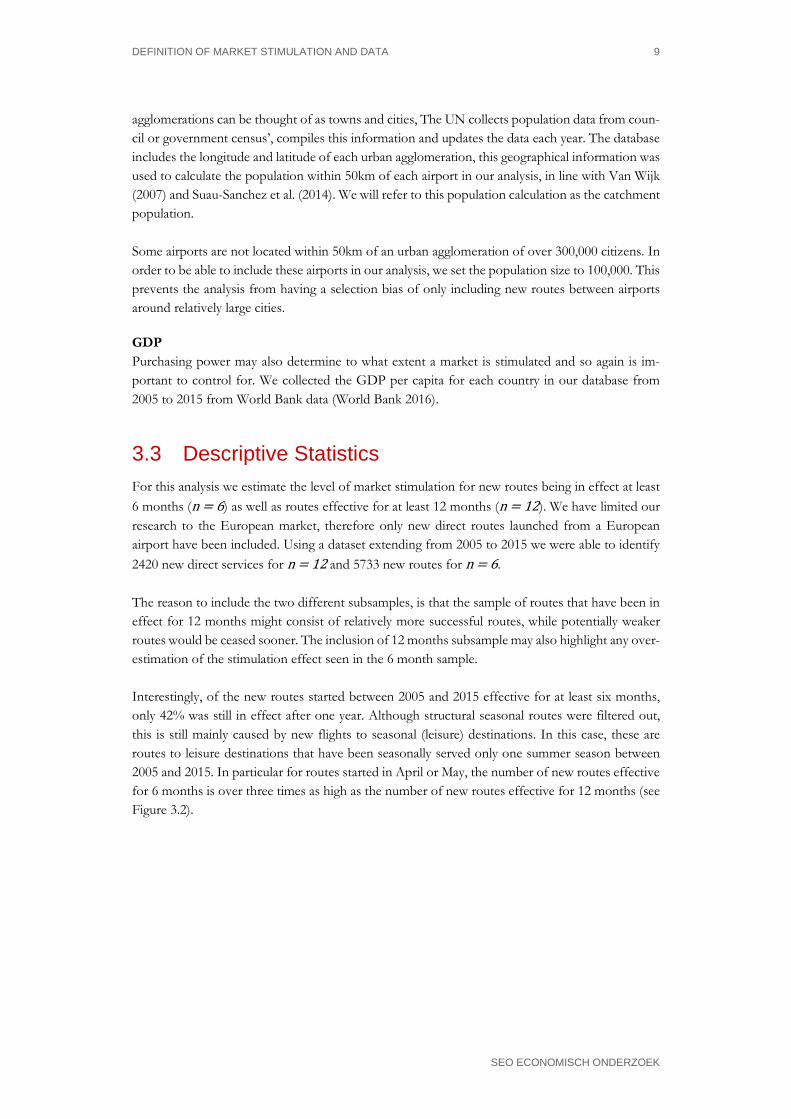
3.3 Descriptive Statistics For this analysis we estimate the level of market stimulation for new routes being in effect at least 6 months (n = 6) as well as routes effective for at least 12 months (n = 12). We have limited our research to the European market, therefore only new direct routes launched from a European airport have been included. Using a dataset extending from 2005 to 2015 we were able to identify 2420 new direct services for n = 12 and 5733 new routes for n = 6. The reason to include the two different subsamples, is that the sample of routes that have been in effect for 12 months might consist of relatively more successful routes, while potentially weaker routes would be ceased sooner. The inclusion of 12 months subsample may also highlight any over-estimation of the stimulation effect seen in the 6 month sample. Interestingly, of the new routes started between 2005 and 2015 effective for at least six months, only 42% was still in effect after one year. Although structural seasonal routes were filtered out, this is still mainly caused by new flights to seasonal (leisure) destinations. In this case, these are routes to leisure destinations that have been seasonally served only one summer season between 2005 and 2015. In particular for routes started in April or May, the number of new routes effective for 6 months is over three times as high as the number of new routes effective for 12 months (see Figure 3.2).
10 CHAPTER 3
SEO AMSTERDAM ECONOMICS
Figure 3.2 There are over twice as many route openings for n = 6 than for n = 12
Source: SEO Analysis
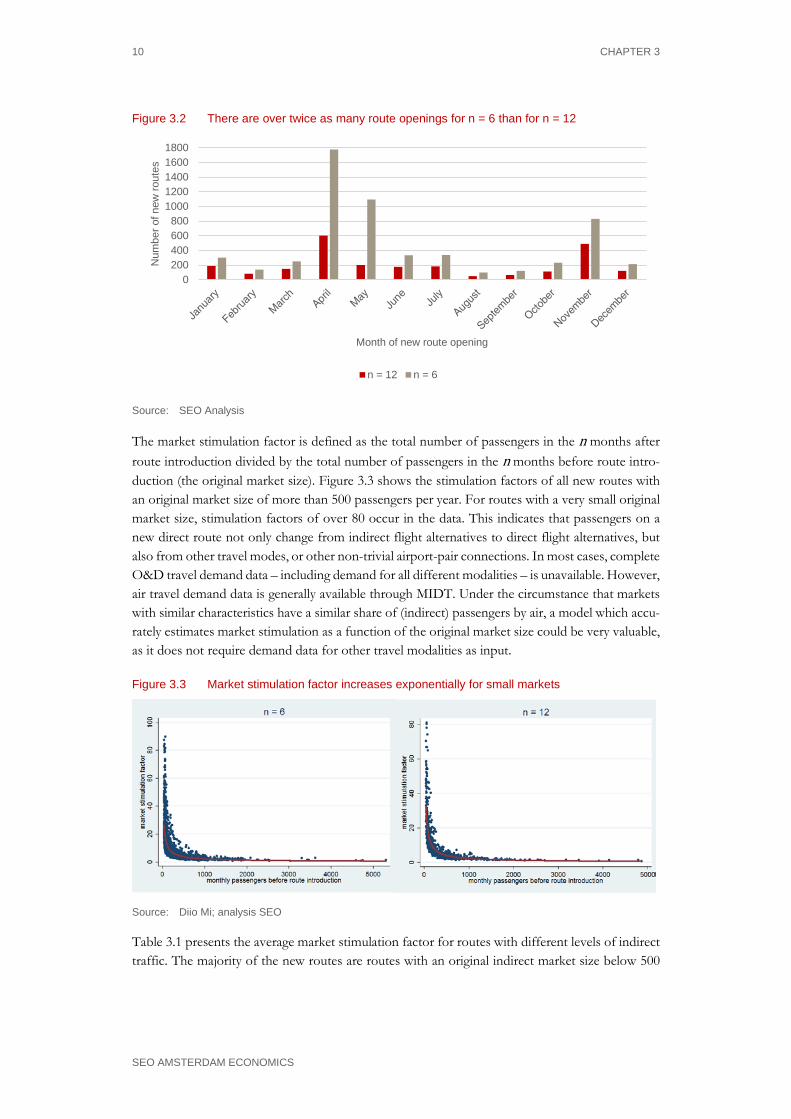
The market stimulation factor is defined as the total number of passengers in the n months after route introduction divided by the total number of passengers in the n months before route intro-duction (the original market size). Figure 3.3 shows the stimulation factors of all new routes with an original market size of more than 500 passengers per year. For routes with a very small original market size, stimulation factors of over 80 occur in the data. This indicates that passengers on a new direct route not only change from indirect flight alternatives to direct flight alternatives, but also from other travel modes, or other non-trivial airport-pair connections. In most cases, complete O&D travel demand data – including demand for all different modalities – is unavailable. However, air travel demand data is generally available through MIDT. Under the circumstance that markets with similar characteristics have a similar share of (indirect) passengers by air, a model which accu-rately estimates market stimulation as a function of the original market size could be very valuable, as it does not require demand data for other travel modalities as input.
Figure 3.3 Market stimulation factor increases exponentially for small markets
Source: Diio Mi; analysis SEO
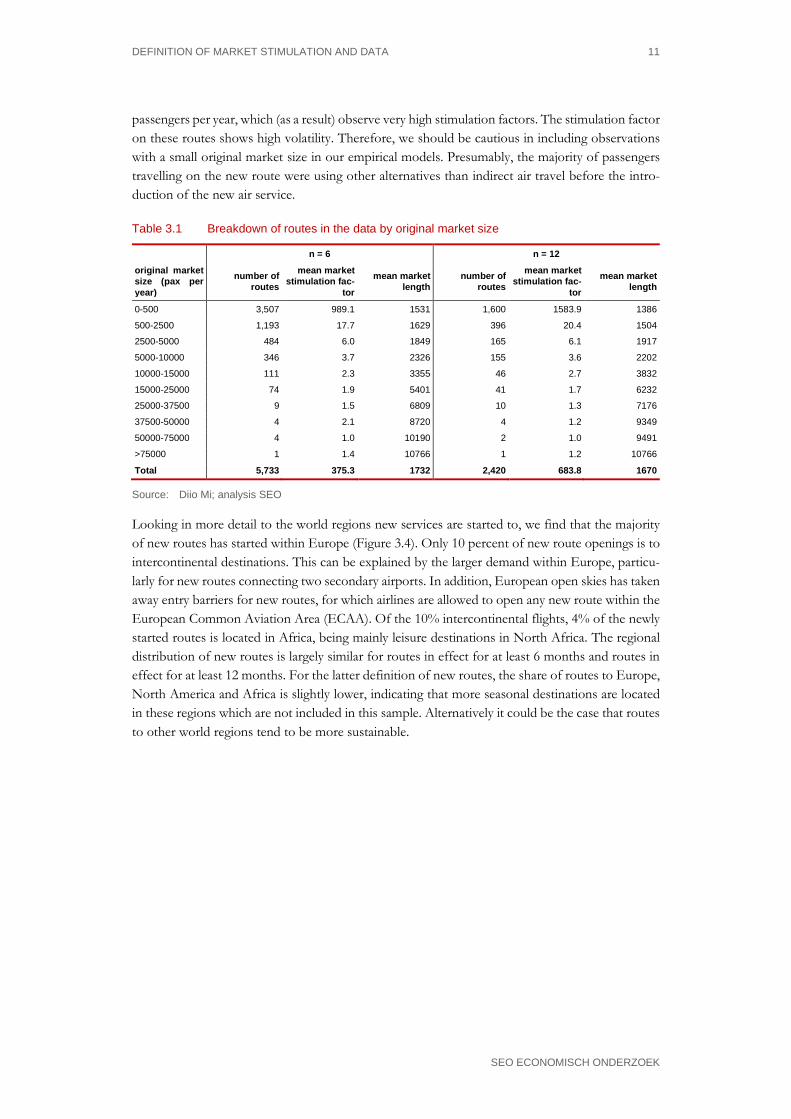
Table 3.1 presents the average market stimulation factor for routes with different levels of indirect traffic. The majority of the new routes are routes with an original indirect market size below 500
0200400600800
10001200140016001800
Num
ber o
f new
rout
es
Month of new route opening
n = 12 n = 6
DEFINITION OF MARKET STIMULATION AND DATA 11
SEO ECONOMISCH ONDERZOEK
passengers per year, which (as a result) observe very high stimulation factors. The stimulation factor on these routes shows high volatility. Therefore, we should be cautious in including observations with a small original market size in our empirical models. Presumably, the majority of passengers travelling on the new route were using other alternatives than indirect air travel before the intro-duction of the new air service.
Table 3.1 Breakdown of routes in the data by original market size
n = 6 n = 12 original market size (pax per year)
number of routes
mean market stimulation fac-
tor
mean market length
number of routes
mean market stimulation fac-
tor
mean market length
0-500 3,507 989.1 1531 1,600 1583.9 1386
500-2500 1,193 17.7 1629 396 20.4 1504
2500-5000 484 6.0 1849 165 6.1 1917
5000-10000 346 3.7 2326 155 3.6 2202
10000-15000 111 2.3 3355 46 2.7 3832
15000-25000 74 1.9 5401 41 1.7 6232
25000-37500 9 1.5 6809 10 1.3 7176
37500-50000 4 2.1 8720 4 1.2 9349
50000-75000 4 1.0 10190 2 1.0 9491
>75000 1 1.4 10766 1 1.2 10766
Total 5,733 375.3 1732 2,420 683.8 1670
Source: Diio Mi; analysis SEO
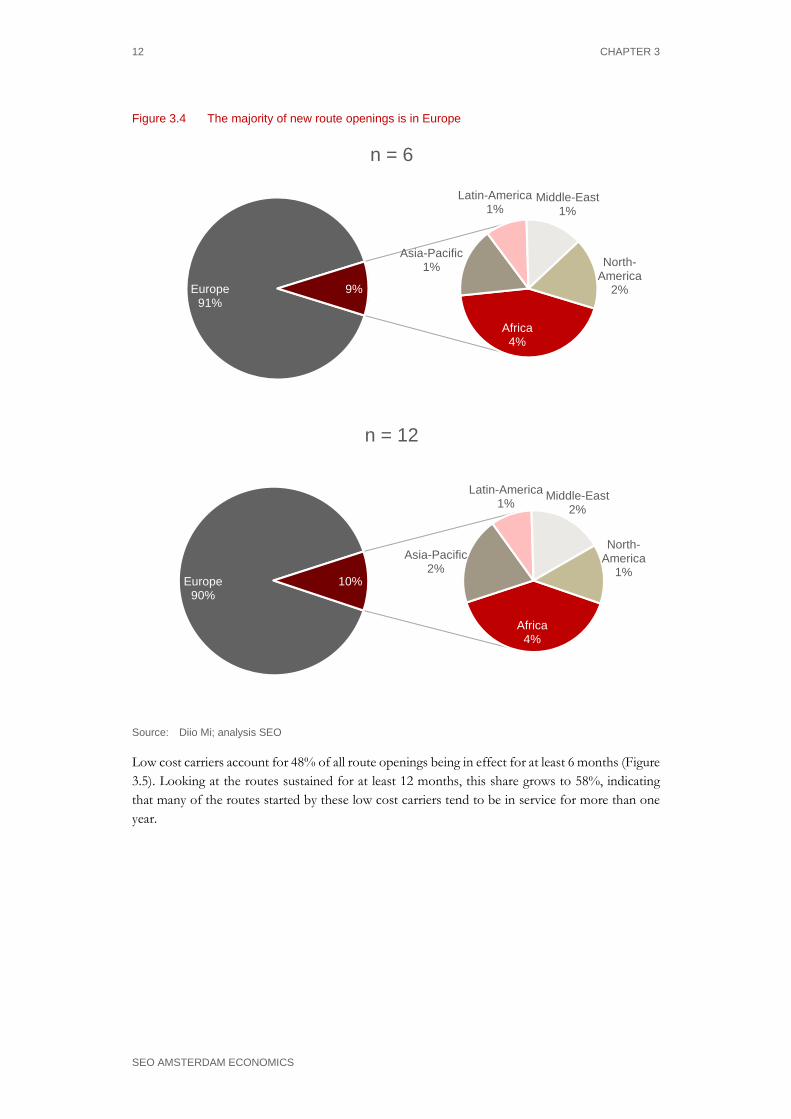
Looking in more detail to the world regions new services are started to, we find that the majority of new routes has started within Europe (Figure 3.4). Only 10 percent of new route openings is to intercontinental destinations. This can be explained by the larger demand within Europe, particu-larly for new routes connecting two secondary airports. In addition, European open skies has taken away entry barriers for new routes, for which airlines are allowed to open any new route within the European Common Aviation Area (ECAA). Of the 10% intercontinental flights, 4% of the newly started routes is located in Africa, being mainly leisure destinations in North Africa. The regional distribution of new routes is largely similar for routes in effect for at least 6 months and routes in effect for at least 12 months. For the latter definition of new routes, the share of routes to Europe, North America and Africa is slightly lower, indicating that more seasonal destinations are located in these regions which are not included in this sample. Alternatively it could be the case that routes to other world regions tend to be more sustainable.
12 CHAPTER 3
SEO AMSTERDAM ECONOMICS
Figure 3.4 The majority of new route openings is in Europe
Source: Diio Mi; analysis SEO
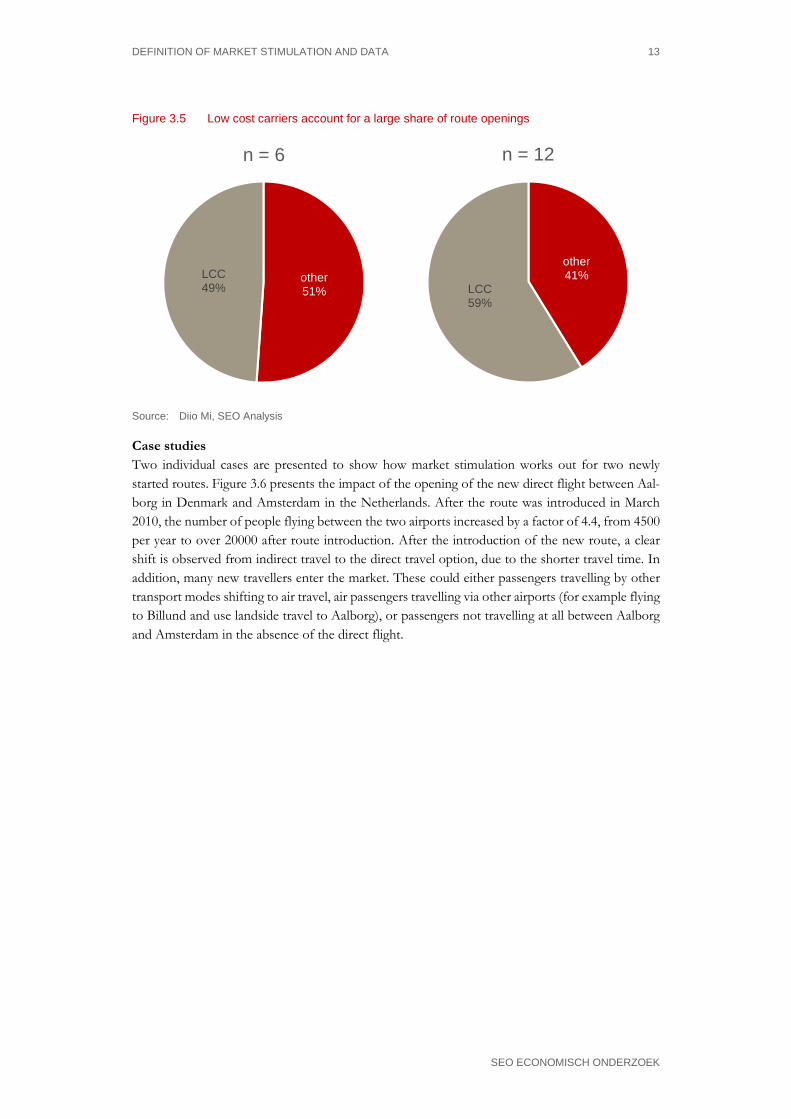
Low cost carriers account for 48% of all route openings being in effect for at least 6 months (Figure 3.5). Looking at the routes sustained for at least 12 months, this share grows to 58%, indicating that many of the routes started by these low cost carriers tend to be in service for more than one year.
Africa4%
Asia-Pacific1%
Europe91%
Latin-America1%
Middle-East1%
North-America
2%9%
n = 6
Africa4%
Asia-Pacific2%
Europe90%
Latin-America1% Middle-East
2%
North-America
1%10%
n = 12
DEFINITION OF MARKET STIMULATION AND DATA 13
SEO ECONOMISCH ONDERZOEK
Figure 3.5 Low cost carriers account for a large share of route openings
Source: Diio Mi, SEO Analysis
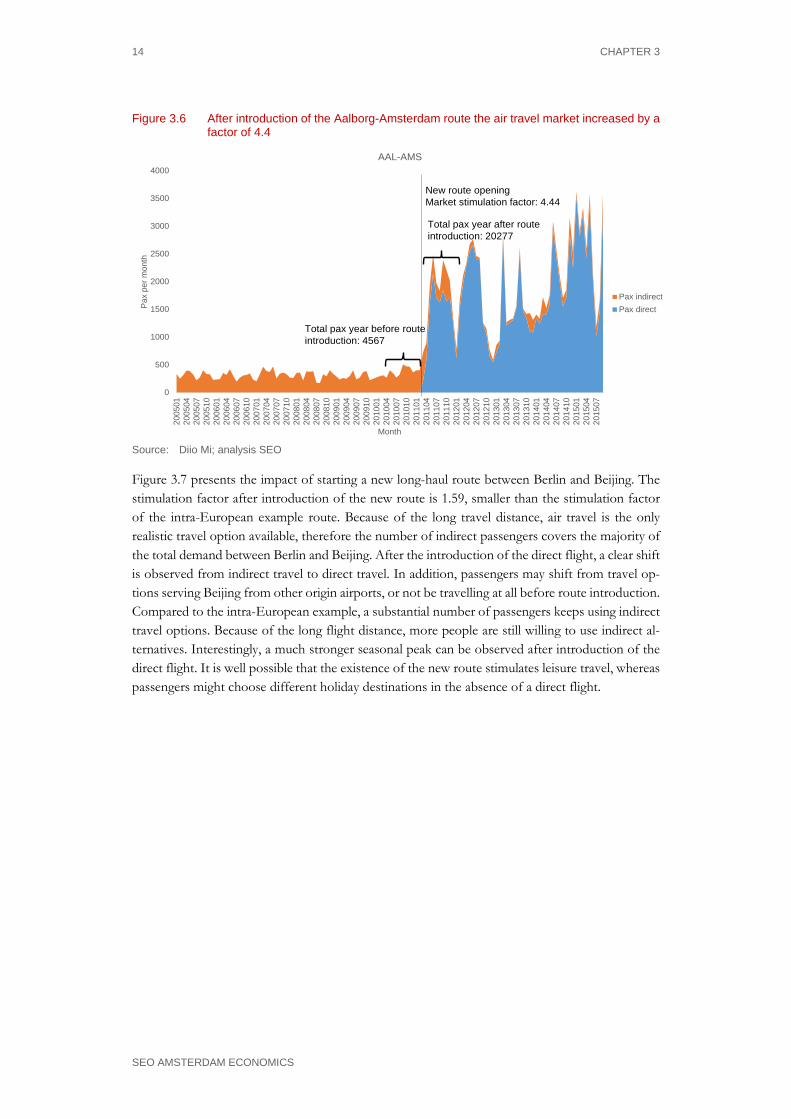
Case studies Two individual cases are presented to show how market stimulation works out for two newly started routes. Figure 3.6 presents the impact of the opening of the new direct flight between Aal-borg in Denmark and Amsterdam in the Netherlands. After the route was introduced in March 2010, the number of people flying between the two airports increased by a factor of 4.4, from 4500 per year to over 20000 after route introduction. After the introduction of the new route, a clear shift is observed from indirect travel to the direct travel option, due to the shorter travel time. In addition, many new travellers enter the market. These could either passengers travelling by other transport modes shifting to air travel, air passengers travelling via other airports (for example flying to Billund and use landside travel to Aalborg), or passengers not travelling at all between Aalborg and Amsterdam in the absence of the direct flight.
other51%
LCC49%
n = 6
other41%
LCC59%
n = 12
14 CHAPTER 3
SEO AMSTERDAM ECONOMICS
Figure 3.6 After introduction of the Aalborg-Amsterdam route the air travel market increased by a factor of 4.4
0
500
1000
1500
2000
2500
3000
3500
400020
0501
2005
0420
0507
2005
1020
0601
2006
0420
0607
2006
1020
0701
2007
0420
0707
2007
1020
0801
2008
0420
0807
2008
1020
0901
2009
0420
0907
2009
1020
1001
2010
0420
1007
2010
1020
1101
2011
0420
1107
2011
1020
1201
2012
0420
1207
2012
1020
1301
2013
0420
1307
2013
1020
1401
2014
0420
1407
2014
1020
1501
2015
0420
1507
Pax
per m
onth
Month
AAL-AMS
Pax indirectPax direct
Total pax year after route introduction: 20277
Total pax year before route introduction: 4567
New route openingMarket stimulation factor: 4.44
Source: Diio Mi; analysis SEO
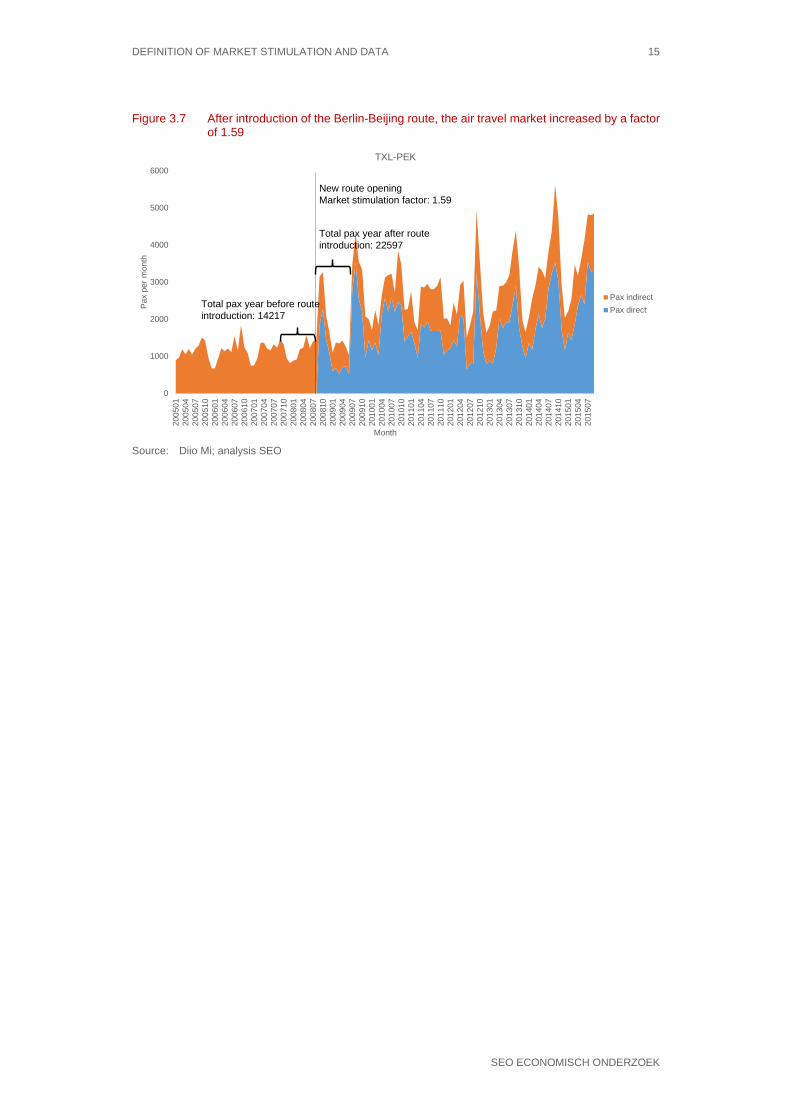
Figure 3.7 presents the impact of starting a new long-haul route between Berlin and Beijing. The stimulation factor after introduction of the new route is 1.59, smaller than the stimulation factor of the intra-European example route. Because of the long travel distance, air travel is the only realistic travel option available, therefore the number of indirect passengers covers the majority of the total demand between Berlin and Beijing. After the introduction of the direct flight, a clear shift is observed from indirect travel to direct travel. In addition, passengers may shift from travel op-tions serving Beijing from other origin airports, or not be travelling at all before route introduction. Compared to the intra-European example, a substantial number of passengers keeps using indirect travel options. Because of the long flight distance, more people are still willing to use indirect al-ternatives. Interestingly, a much stronger seasonal peak can be observed after introduction of the direct flight. It is well possible that the existence of the new route stimulates leisure travel, whereas passengers might choose different holiday destinations in the absence of a direct flight.
DEFINITION OF MARKET STIMULATION AND DATA 15
SEO ECONOMISCH ONDERZOEK
Figure 3.7 After introduction of the Berlin-Beijing route, the air travel market increased by a factor of 1.59
0
1000
2000
3000
4000
5000
600020
0501
2005
0420
0507
2005
1020
0601
2006
0420
0607
2006
1020
0701
2007
0420
0707
2007
1020
0801
2008
0420
0807
2008
1020
0901
2009
0420
0907
2009
1020
1001
2010
0420
1007
2010
1020
1101
2011
0420
1107
2011
1020
1201
2012
0420
1207
2012
1020
1301
2013
0420
1307
2013
1020
1401
2014
0420
1407
2014
1020
1501
2015
0420
1507
Pax
per m
onth
Month
TXL-PEK
Pax indirectPax direct
New route openingMarket stimulation factor: 1.59
Total pax year after route introduction: 22597
Total pax year before route introduction: 14217
Source: Diio Mi; analysis SEO

MARKET STIMULATION OF NEW AIRLINE ROUTES 17
SEO AMSTERDAM ECONOMICS
4 Empirical analysis
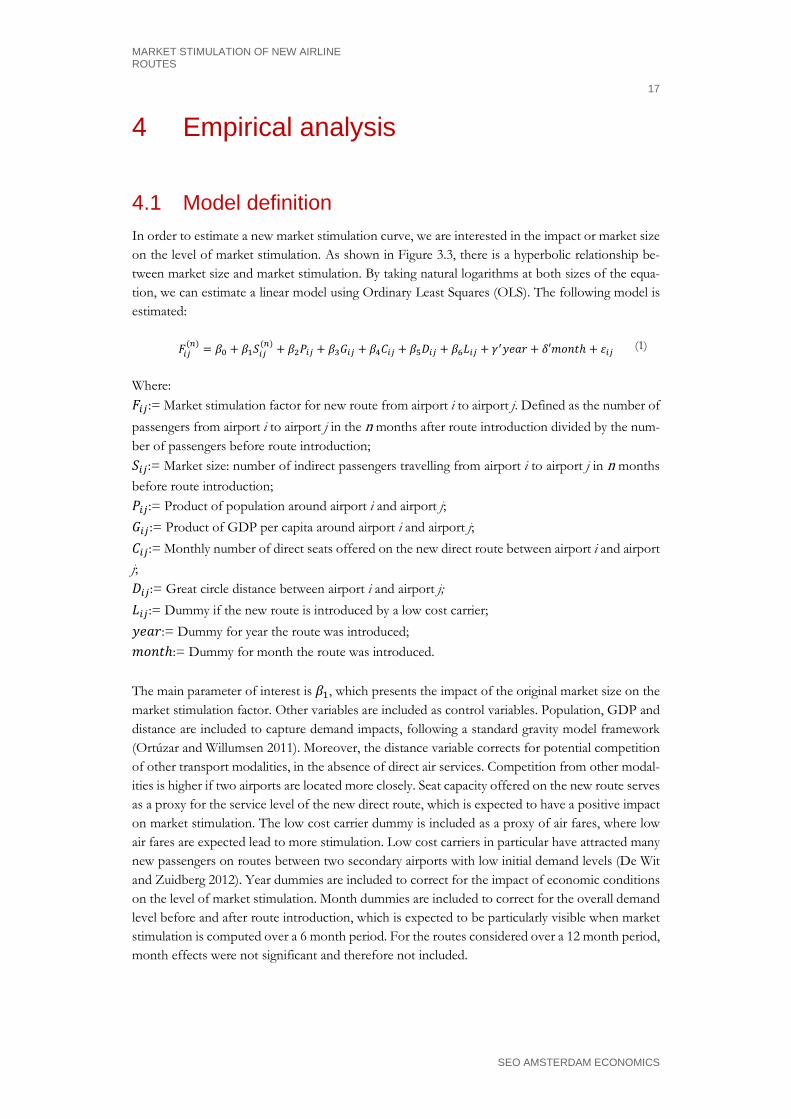
4.1 Model definition In order to estimate a new market stimulation curve, we are interested in the impact or market size on the level of market stimulation. As shown in Figure 3.3, there is a hyperbolic relationship be-tween market size and market stimulation. By taking natural logarithms at both sizes of the equa-tion, we can estimate a linear model using Ordinary Least Squares (OLS). The following model is estimated:
𝐹𝐹𝑖𝑖𝑖𝑖(𝑛𝑛) = 𝛽𝛽0 + 𝛽𝛽1𝑆𝑆𝑖𝑖𝑖𝑖
(𝑛𝑛) + 𝛽𝛽2𝑃𝑃𝑖𝑖𝑖𝑖 + 𝛽𝛽3𝐺𝐺𝑖𝑖𝑖𝑖 + 𝛽𝛽4𝐶𝐶𝑖𝑖𝑖𝑖 + 𝛽𝛽5𝐷𝐷𝑖𝑖𝑖𝑖 + 𝛽𝛽6𝐿𝐿𝑖𝑖𝑖𝑖 + 𝛾𝛾′𝑦𝑦𝑦𝑦𝑦𝑦𝑦𝑦 + 𝛿𝛿′𝑚𝑚𝑚𝑚𝑚𝑚𝑚𝑚ℎ + 𝜀𝜀𝑖𝑖𝑖𝑖 (1)
Where: 𝐹𝐹𝑖𝑖𝑖𝑖:= Market stimulation factor for new route from airport i to airport j. Defined as the number of passengers from airport i to airport j in the n months after route introduction divided by the num-ber of passengers before route introduction; 𝑆𝑆𝑖𝑖𝑖𝑖:= Market size: number of indirect passengers travelling from airport i to airport j in n months before route introduction; 𝑃𝑃𝑖𝑖𝑖𝑖:= Product of population around airport i and airport j; 𝐺𝐺𝑖𝑖𝑖𝑖 := Product of GDP per capita around airport i and airport j; 𝐶𝐶𝑖𝑖𝑖𝑖:= Monthly number of direct seats offered on the new direct route between airport i and airport j; 𝐷𝐷𝑖𝑖𝑖𝑖:= Great circle distance between airport i and airport j; 𝐿𝐿𝑖𝑖𝑖𝑖:= Dummy if the new route is introduced by a low cost carrier; 𝑦𝑦𝑦𝑦𝑦𝑦𝑦𝑦:= Dummy for year the route was introduced; 𝑚𝑚𝑚𝑚𝑚𝑚𝑚𝑚ℎ:= Dummy for month the route was introduced. The main parameter of interest is 𝛽𝛽1, which presents the impact of the original market size on the market stimulation factor. Other variables are included as control variables. Population, GDP and distance are included to capture demand impacts, following a standard gravity model framework (Ortúzar and Willumsen 2011). Moreover, the distance variable corrects for potential competition of other transport modalities, in the absence of direct air services. Competition from other modal-ities is higher if two airports are located more closely. Seat capacity offered on the new route serves as a proxy for the service level of the new direct route, which is expected to have a positive impact on market stimulation. The low cost carrier dummy is included as a proxy of air fares, where low air fares are expected lead to more stimulation. Low cost carriers in particular have attracted many new passengers on routes between two secondary airports with low initial demand levels (De Wit and Zuidberg 2012). Year dummies are included to correct for the impact of economic conditions on the level of market stimulation. Month dummies are included to correct for the overall demand level before and after route introduction, which is expected to be particularly visible when market stimulation is computed over a 6 month period. For the routes considered over a 12 month period, month effects were not significant and therefore not included.
18 CHAPTER 4
SEO AMSTERDAM ECONOMICS
4.2 Results This section presents the regression results of the model defined above. Two sets of results are presented: for routes operated for at least six months after route opening (n = 6) and for routes in effect for at least twelve months after route opening (n = 12). The two different sets of results allow for assessment of the robustness of the results. Routes being in effect for at least twelve months might include only the more successful routes, which potentially have a higher level of market stimulation, leading to an overestimation of the market stimulation impact. For each set of new routes four sets of results are presented, varying in minimum size of the market before route introduction. The full sample contains routes with a very low number of indirect passengers before route introduction, leading to very high market stimulation factors. Although the log-log form of the regression equation corrects for this non-linearity, results may still be af-fected by a large number of routes with very high market stimulation levels. Therefore, we present separate sets of results for the full sample and a minimum number of indirect passengers per annum (ppa) before route introduction of 500, 2500 and 5000.
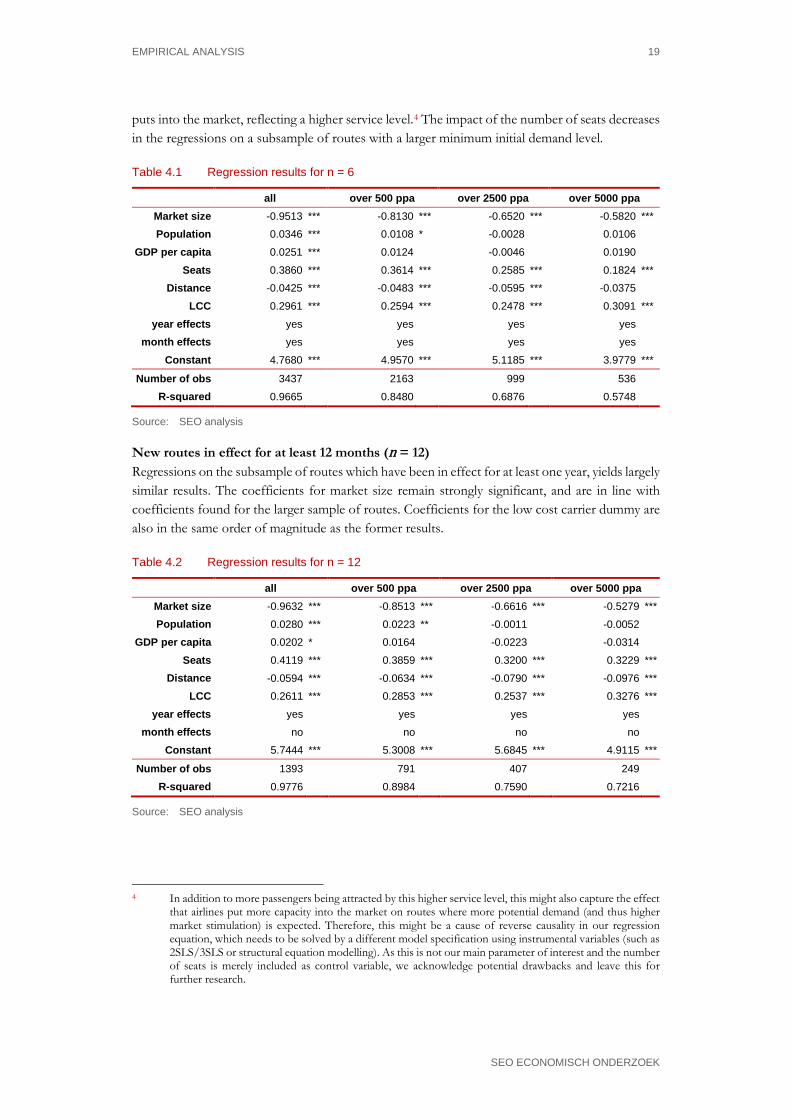
New routes in effect for at least 6 months (n = 6) Table 4.1 presents regression results for the sample of new routes being in effect for at least six months. For the full sample, all variables are significant and show the expected sign. Market size before route introduction is inversely related the market stimulation factor. These coefficients lead to higher stimulation factors than according to IATA’s stimulation curve, particularly for routes with a relatively small initial market size. In the next section we derive market stimulation curves as a function of initial demand, and compare this to other results found in literature. As expected, the coefficient for market size becomes less negative when the regression is run on a subsample of routes with a larger initial market size. In the full sample, the regression coefficients are affected by the strongly skewed distribution of market stimulation factors. New routes served by low cost carriers generate significantly more new passengers than new routes started by other carriers. Low air fares offered by these carriers lead to a substantial reduction in total travel costs for consumers, leading to a strong decrease in demand. Moreover, higher stimu-lation factors by low cost carriers are found because these carriers tend to start new routes between airport pairs with substantially lower initial demand levels: the average annual market size of routes started by low cost carriers is 750 passengers, compared to 2500 for routes started by other carriers. We find that new routes started by low cost carriers lead to 28%-36% more market stimulation. Population and GDP per capita show positive coefficients, supporting the hypothesis that more (potential) demand leads to a higher level of market stimulation. For distance a negative coefficient was found, also supporting this hypothesis, as demand tends to be higher between two more closely located regions (Jorge-Calderón 1997; Grosche et al 2007). Population and GDP lose significance when the estimation sample is reduced to routes with a larger initial market size. The number of seats offered show a significant positive correspondence with the market stimula-tion factor, indicating that market stimulation increases with the amount of seats the new carrier
EMPIRICAL ANALYSIS 19
SEO ECONOMISCH ONDERZOEK
puts into the market, reflecting a higher service level.4 The impact of the number of seats decreases in the regressions on a subsample of routes with a larger minimum initial demand level.
Table 4.1 Regression results for n = 6
all over 500 ppa over 2500 ppa over 5000 ppa Market size -0.9513 *** -0.8130 *** -0.6520 *** -0.5820 *** Population 0.0346 *** 0.0108 * -0.0028 0.0106
GDP per capita 0.0251 *** 0.0124 -0.0046 0.0190 Seats 0.3860 *** 0.3614 *** 0.2585 *** 0.1824 ***
Distance -0.0425 *** -0.0483 *** -0.0595 *** -0.0375 LCC 0.2961 *** 0.2594 *** 0.2478 *** 0.3091 ***
year effects yes yes yes yes month effects yes yes yes yes
Constant 4.7680 *** 4.9570 *** 5.1185 *** 3.9779 ***
Number of obs 3437 2163 999 536 R-squared 0.9665 0.8480 0.6876 0.5748
Source: SEO analysis
New routes in effect for at least 12 months (n = 12) Regressions on the subsample of routes which have been in effect for at least one year, yields largely similar results. The coefficients for market size remain strongly significant, and are in line with coefficients found for the larger sample of routes. Coefficients for the low cost carrier dummy are also in the same order of magnitude as the former results.
Table 4.2 Regression results for n = 12
all over 500 ppa over 2500 ppa over 5000 ppa Market size -0.9632 *** -0.8513 *** -0.6616 *** -0.5279 *** Population 0.0280 *** 0.0223 ** -0.0011 -0.0052
GDP per capita 0.0202 * 0.0164 -0.0223 -0.0314 Seats 0.4119 *** 0.3859 *** 0.3200 *** 0.3229 ***
Distance -0.0594 *** -0.0634 *** -0.0790 *** -0.0976 *** LCC 0.2611 *** 0.2853 *** 0.2537 *** 0.3276 ***
year effects yes yes yes yes month effects no no no no
Constant 5.7444 *** 5.3008 *** 5.6845 *** 4.9115 ***
Number of obs 1393 791 407 249 R-squared 0.9776 0.8984 0.7590 0.7216
Source: SEO analysis
4 In addition to more passengers being attracted by this higher service level, this might also capture the effect
that airlines put more capacity into the market on routes where more potential demand (and thus higher market stimulation) is expected. Therefore, this might be a cause of reverse causality in our regression equation, which needs to be solved by a different model specification using instrumental variables (such as 2SLS/3SLS or structural equation modelling). As this is not our main parameter of interest and the number of seats is merely included as control variable, we acknowledge potential drawbacks and leave this for further research.
20 CHAPTER 4
SEO AMSTERDAM ECONOMICS
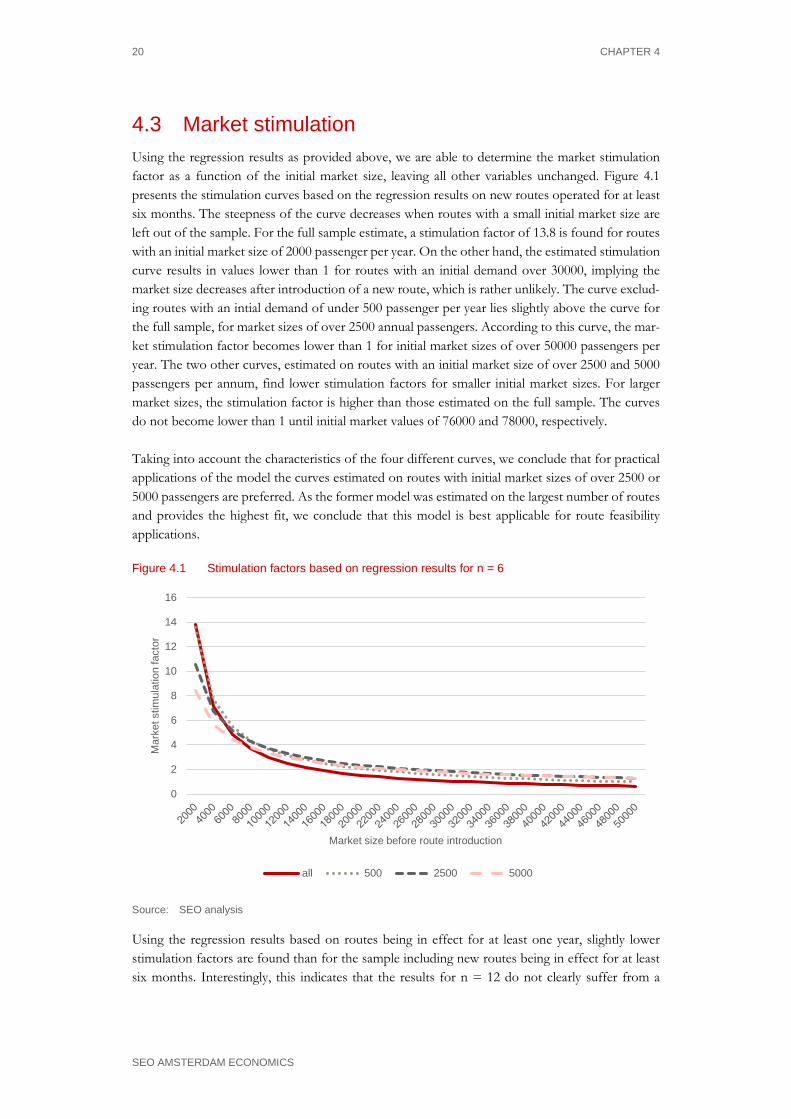
4.3 Market stimulation Using the regression results as provided above, we are able to determine the market stimulation factor as a function of the initial market size, leaving all other variables unchanged. Figure 4.1 presents the stimulation curves based on the regression results on new routes operated for at least six months. The steepness of the curve decreases when routes with a small initial market size are left out of the sample. For the full sample estimate, a stimulation factor of 13.8 is found for routes with an initial market size of 2000 passenger per year. On the other hand, the estimated stimulation curve results in values lower than 1 for routes with an initial demand over 30000, implying the market size decreases after introduction of a new route, which is rather unlikely. The curve exclud-ing routes with an intial demand of under 500 passenger per year lies slightly above the curve for the full sample, for market sizes of over 2500 annual passengers. According to this curve, the mar-ket stimulation factor becomes lower than 1 for initial market sizes of over 50000 passengers per year. The two other curves, estimated on routes with an initial market size of over 2500 and 5000 passengers per annum, find lower stimulation factors for smaller initial market sizes. For larger market sizes, the stimulation factor is higher than those estimated on the full sample. The curves do not become lower than 1 until initial market values of 76000 and 78000, respectively. Taking into account the characteristics of the four different curves, we conclude that for practical applications of the model the curves estimated on routes with initial market sizes of over 2500 or 5000 passengers are preferred. As the former model was estimated on the largest number of routes and provides the highest fit, we conclude that this model is best applicable for route feasibility applications.
Figure 4.1 Stimulation factors based on regression results for n = 6
Source: SEO analysis
Using the regression results based on routes being in effect for at least one year, slightly lower stimulation factors are found than for the sample including new routes being in effect for at least six months. Interestingly, this indicates that the results for n = 12 do not clearly suffer from a
0
2
4
6
8
10
12
14
16
Mar
ket s
timul
atio
n fa
ctor
Market size before route introduction
all 500 2500 5000
EMPIRICAL ANALYSIS 21
SEO ECONOMISCH ONDERZOEK
selection bias of only selecting the most succesful routes. On the contrary, more conservative estimates for market stimulation are found. Most likely, this is due to the large set of seasonal leisure routes in the full sample, for which relatively strong market stimulation factors are observed.
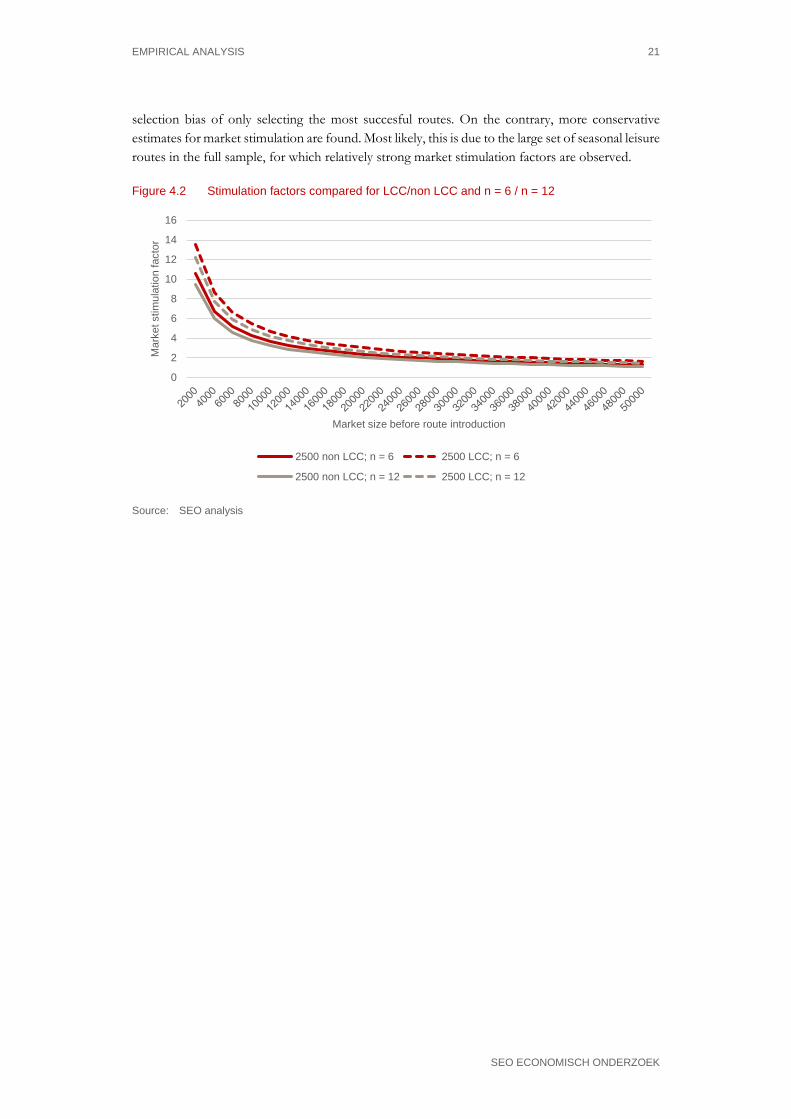
Figure 4.2 Stimulation factors compared for LCC/non LCC and n = 6 / n = 12
Source: SEO analysis
0
2
4
6
8
10
12
14
16
Mar
ket s
timul
atio
n fa
ctor
Market size before route introduction
2500 non LCC; n = 6 2500 LCC; n = 6
2500 non LCC; n = 12 2500 LCC; n = 12

MARKET STIMULATION OF NEW AIRLINE ROUTES 23
SEO AMSTERDAM ECONOMICS
5 Conclusions and further research steps
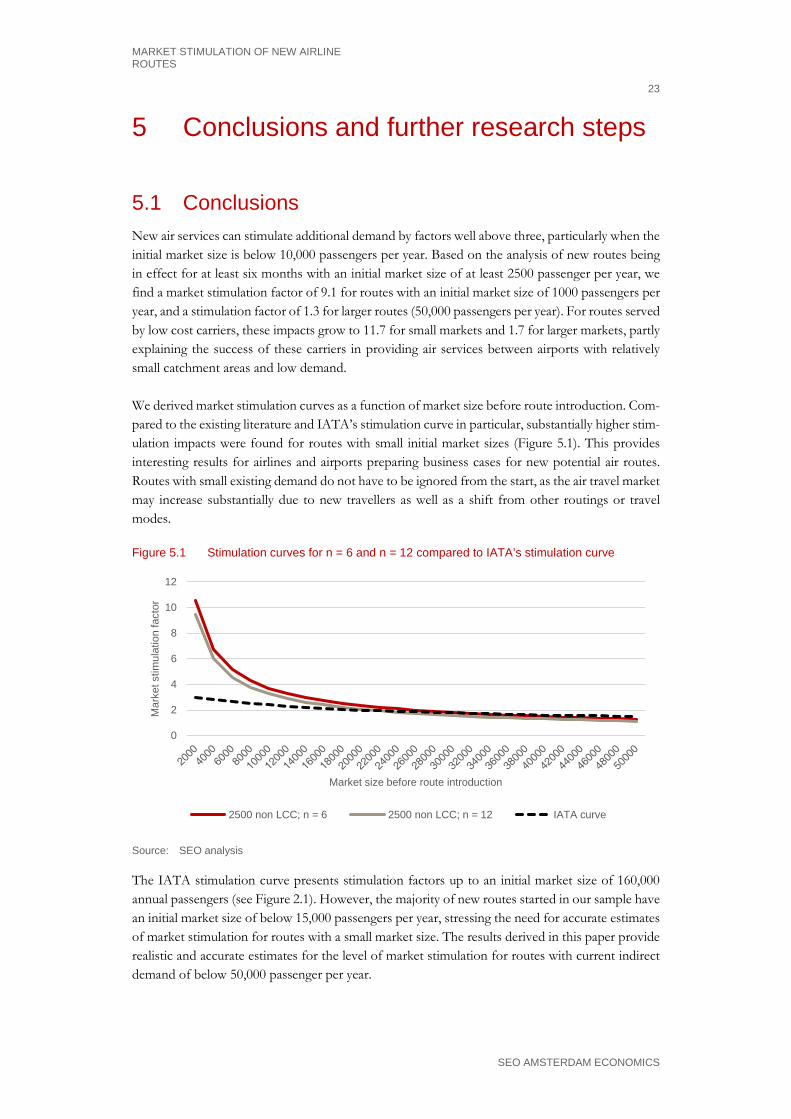
5.1 Conclusions New air services can stimulate additional demand by factors well above three, particularly when the initial market size is below 10,000 passengers per year. Based on the analysis of new routes being in effect for at least six months with an initial market size of at least 2500 passenger per year, we find a market stimulation factor of 9.1 for routes with an initial market size of 1000 passengers per year, and a stimulation factor of 1.3 for larger routes (50,000 passengers per year). For routes served by low cost carriers, these impacts grow to 11.7 for small markets and 1.7 for larger markets, partly explaining the success of these carriers in providing air services between airports with relatively small catchment areas and low demand. We derived market stimulation curves as a function of market size before route introduction. Com-pared to the existing literature and IATA’s stimulation curve in particular, substantially higher stim-ulation impacts were found for routes with small initial market sizes (Figure 5.1). This provides interesting results for airlines and airports preparing business cases for new potential air routes. Routes with small existing demand do not have to be ignored from the start, as the air travel market may increase substantially due to new travellers as well as a shift from other routings or travel modes.
Figure 5.1 Stimulation curves for n = 6 and n = 12 compared to IATA’s stimulation curve
Source: SEO analysis
The IATA stimulation curve presents stimulation factors up to an initial market size of 160,000 annual passengers (see Figure 2.1). However, the majority of new routes started in our sample have an initial market size of below 15,000 passengers per year, stressing the need for accurate estimates of market stimulation for routes with a small market size. The results derived in this paper provide realistic and accurate estimates for the level of market stimulation for routes with current indirect demand of below 50,000 passenger per year.
0
2
4
6
8
10
12
Mar
ket s
timul
atio
n fa
ctor
Market size before route introduction
2500 non LCC; n = 6 2500 non LCC; n = 12 IATA curve
24 CHAPTER 5
SEO AMSTERDAM ECONOMICS
Besides stimulation curves, there are also other ways to estimate market stimulation effects (Trans-portation Research Board 2002). One example is the use of generalised travel cost models (e.g. Fu et al. 2014), estimating demand stimulation as a result of a decrease in travel costs and service level. However, these are generally impossible to estimate in case travel costs before route introduction are unknown. In these cases, using empirical results from stimulation curves, such as those derived in this paper, help to provide accurate estimates. The models derived in this paper are appropriate to use in route feasibility studies, to assess the potential of new air services. All other variables used in the models also accessible from open source data for most airports worldwide, hence the model can be used to estimate market stimula-tion factors for new routes. As the current indirect demand level is known (and used as input to the model), the total demand prediction after introducing a new route can easily be estimated.
5.2 Further research steps We have not controlled for ticket fare in our model. This could potentially add value for the model, as air fares are likely to be one of the key drivers for market stimulation. Omitting this variable might lead to overestimating market stimulation impacts. In our current model, the low cost dummy will control for this effect to some extent, but it would be interesting to model the effect of fare on market stimulation. There could be three ways to model this effect:
(i) include a variable giving the percentage difference between the fare in the n months prior to the market entry and the n months after the entry;
(ii) include several dummy variables giving fare bins (i.e: $0 - $50, $51-$100, etc.); (iii) include the fare offered at market entry.
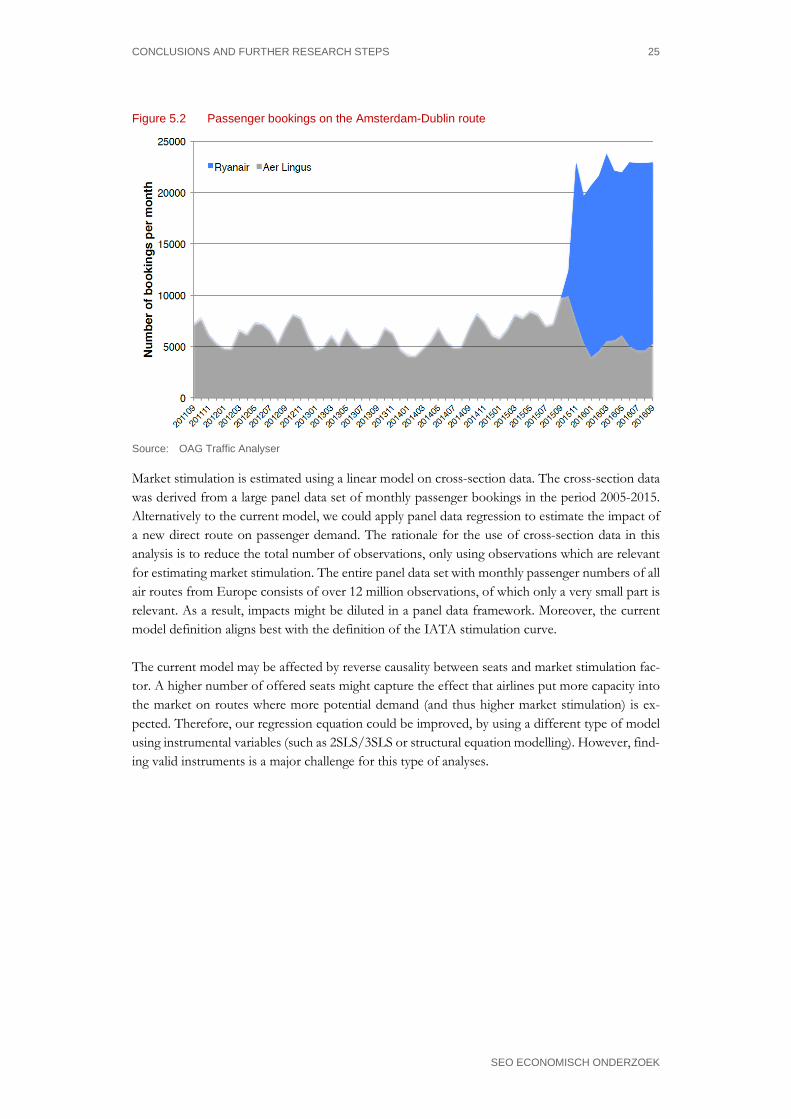
A challenge for including fare data is the availability and quality of the data. MIDT does provide average air fares on most markets, but they tend to be less accurate than passenger bookings data. This is primarily caused by the fact that only 44% of bookings by major airlines were done through GDSs, the main source for data in MIDT (ARG 2013). Another interesting extension of the model would be to include impacts of competition on stimu-lation, rather than only new direct routes. Entry of another carrier on a certain routes might as well stimulate passenger demand, particularly if this new entry leads to a strong reduction in fares. Figure 5.2 presents an example of this effect. In September 2015, Ryanair entered on the market Amster-dam-Dublin, which was previously only directly served by Aer Lingus. After the entry of Ryanair, passenger bookings quadrupled.
CONCLUSIONS AND FURTHER RESEARCH STEPS 25
SEO ECONOMISCH ONDERZOEK
Figure 5.2 Passenger bookings on the Amsterdam-Dublin route
Source: OAG Traffic Analyser
Market stimulation is estimated using a linear model on cross-section data. The cross-section data was derived from a large panel data set of monthly passenger bookings in the period 2005-2015. Alternatively to the current model, we could apply panel data regression to estimate the impact of a new direct route on passenger demand. The rationale for the use of cross-section data in this analysis is to reduce the total number of observations, only using observations which are relevant for estimating market stimulation. The entire panel data set with monthly passenger numbers of all air routes from Europe consists of over 12 million observations, of which only a very small part is relevant. As a result, impacts might be diluted in a panel data framework. Moreover, the current model definition aligns best with the definition of the IATA stimulation curve. The current model may be affected by reverse causality between seats and market stimulation fac-tor. A higher number of offered seats might capture the effect that airlines put more capacity into the market on routes where more potential demand (and thus higher market stimulation) is ex-pected. Therefore, our regression equation could be improved, by using a different type of model using instrumental variables (such as 2SLS/3SLS or structural equation modelling). However, find-ing valid instruments is a major challenge for this type of analyses.


MARKET STIMULATION OF NEW AIRLINE ROUTES 27
SEO AMSTERDAM ECONOMICS
Literature
Abrahams, M. (1983). A service quality model of air travel demand: an empirical study. Transporta-tion Research Part A. 17A(5), 385-393.
ARG (2013). Atmosphere’s Global Travel Industry Executive Survey, Q3 2012. (http://www.iata.org/whatwedo/stb/Documents/future-airline-distribution-report.pdf)
Bhadra, D. (2003). Demand for air travel in the United States: Bottom-up econometric estimation and implications for forecasts by origin and destination pairs. Journal of Air Transportation, 8(2), 19-56.
Bonnefoy, P.A., 2008. Scalability of the air transport system and the development of multiple air-port systems: a worldwide perspective. PhD thesis, MIT (Available at: http://hdl.han-dle.net/1721.1/46800 ).
Carson, R., Cenesizoglu, T., Parker, R. (2011). Forecasting (aggregate) demand for US commercial air travel. International Journal of Forecasting, 27, 923-941.
Evangelho, F., Huse, C., Linhares, A. (2005). Market entry of a low cost airline and impacts on the Brazilian business travellers. Journal of Air Transport Management, 11, 99-105.
Fu, X., Oum, T. H., & Zhang, A. (2010). Air transport liberalization and its impacts on airline competition and air passenger traffic. Transportation Journal, 49(4), 24-41
Fu, X., Oum, T. H., & Yan, J. (2014). An Analysis of Travel Demand in Japan's Intercity Market Empirical Estimation and Policy Simulation. Journal of Transport Economics and Policy, 48(1), 97-113.
Grosche, T., Rothlauf, F., Heinzl, A. (2007). Gravity models for airline passenger volume estima-tion. Journal of Air Transport Management, 13, 175-183.
Hsiao, C.-Y., Hansen M. (2011), A passenger demand model for air transportation in a hub-and-spoke network, Transportation Research Part E: Logistics and Transportation Review, 47(6), 1112-1125.
Jorge-Calderón, J. D. (1997). A demand model for schedule airline services on international Euro-pean routes. Journal of Air Transport Management, 3 (1), 23-35.
Lawton, T. C., & Solomko, S. (2005). When being the lowest cost is not enough: Building a suc-cessful low-fare airline business model in Asia. Journal of Air Transport Management, 11(6), 355-362.
Mason, K. (2007). The Challenge of the Low-cost Airlines. Revista Lusófona de Ciências Aeronáuticas. Accessed on August 29, 2016. http://revistas.ulusofona.pt/index.php/rlcaeronauticas/ar-ticle/viewFile/2325/1832 .
28 CHAPTER 5
SEO AMSTERDAM ECONOMICS
Ortúzar, J., and Willumsen, L. (2011). Modelling Transport. Fourth Edition. John Wiley & Sons Ltd, Chichester, West Sussex, United Kingdom.
Sismanidou, A., Tarradellas, J., Bel, G., Fageda, X. (2013). Estimating potential long-haul air pas-senger traffic in national networks containing two or more dominant cities. Journal of Transport Geography, 26, p. 108-116
Suau-Sanchez, P., Burghouwt, G., Pallares-Barbera, M. (2014). An appraisal of the CORINE land cover database in airport catchment area analysis using a GIS approach. Journal of Air Transport Management 34, p. 12-16.
Tembleque-Vilalta, M., Suau-Sanchez., P. (2016). A model to analyse the profitability of long-haul network development involving non-hub airports: The case of the Barcelona-Asian market. Case studies on Transport Policy, 4, p. 188-197.
Transportation Research Board (2002). TRB Transportation Research E-Circular E-C040: Avia-tion Demand Forecasting - A Survey of Methodologies includes examples of the diversity of techniques used in forecasting aviation system demand and market analyses.
United Nations, Department of Economic and Social Affairs, Population Division (2014). World Urbanization Prospects: The 2014 Revision, CD-ROM Edition.
Van Wijk, M. (2007). Airports as City Ports in the City-region. Netherlands Geographical Studies, vol. 353, Faculteit Geowetenschappen Universiteit Utrecht.
Wilken, D., & Berster, P. (2013). Low-cost carrier services in Germany and Europe – from novel to normal. Liberalization in aviation: Competition, cooperation and public policy (pp. 157-184). Ashgate Publishing Limited, Farnham, England.
Wilken, D., Berster, P. & Gelhausen (2016). Analysis of demand structures on intercontinental routes to and from Europe with a view to identifying potential for new low-cost services, Journal of Air Transport Management, http://dx.doi.org/10.1016/j.jairtraman.2016.04.018 .
De Wit, J., and Zuidberg, J. (2012). The growth limits of the low cost carrier model. Journal of Air Transport Management, 21, 17-23.
World Bank (2016). World Bank national accounts data, and OECD National Accounts data files. http://databank.worldbank.org/data/reports.aspx?source=2&se-ries=NY.GDP.PCAP.CD
New Zealand Airports Association (2010). Letter to the Chairperson of Primary Production Com-mittee. Accessed on August 26, 2016. https://www.parliament.nz/resource/en-nz/49SCPP_EVI_00DBHOH_BILL10325_1_A142230/77ebb73e33e93734b61685d386bd3bb04cd51d10 .
MARKET STIMULATION OF NEW AIRLINE ROUTES 29
SEO AMSTERDAM ECONOMICS
Appendix A List of Multi Airport Systems
mas_name mas_code Airport Airport name mas_name mas_code Airport Airport name mas_name mas_code Airport Airport name Amsterdam M01 AMS Amsterdam Oslo M22 OSL Oslo Gardermoen Dubai M40 DWC Dubai Al Maktoum Amsterdam M01 EIN Eindhoven Oslo M22 RYG Oslo Moss-rygge Dubai M40 DXB Dubai Amsterdam M01 RTM Rotterdam Oslo M22 TRF Oslo Sandefjord-Torp Dubai M40 SHJ Sharjah Melbourne M02 AVV Melbourne Avalon Wenen M23 BTS Bratislava Toronto M41 YHM Toronto John C Munro Hamilton Melbourne M02 MEL Melbourne Wenen M23 VIE Vienna Toronto M41 YTZ Bishop Billy City Hong Kong M03 HKG Hong Kong Moskou M24 DME Moscow Domodedovo Toronto M41 YYZ Lester B Pearson Hong Kong M03 SZX Shenzhen Moskou M24 SVO Moscow Sheremetyevo Vancouver M42 YVR Vancouver Shanghai M04 PVG Shanghai Pudong Moskou M24 VKO Moscow Vnukovo Vancouver M42 YXX Abbotsford Shanghai M04 SHA Shanghai Hongqiao Barcelona M25 BCN Barcelona Boston M43 BOS Boston Logan Osaka M05 ITM Osaka (Itami) Barcelona M25 GRO Girona Boston M43 MHT Manchester (US) Osaka M05 KIX Osaka Kansai Barcelona M25 REU Reus Boston M43 PVD Providence Osaka M05 UKB Osaka Kobe Istanbul M26 IST Istanbul Ataturk Chicago M44 MDW Chicago Midway Tokyo M06 HND Tokyo (Haneda) Istanbul M26 SAW Istanbul Sabiha Gokcen Chicago M44 ORD Chicago O'Hare Tokyo M06 NRT Tokyo Narita Belfast M27 BFS Belfast Cleveland M45 CAK Akron/Canton Ohio Regional Taipei M07 TPE Taipei Taiwan Taoyuan Belfast M27 BHD Belfast George Best City Cleveland M45 CLE Cleveland Hopkins Taipei M07 TSA Taipei Songshan Glasgow M28 EDI Edinburgh Dallas M46 DAL Dallas/Fort Worth Dallas Love Field Bangkok M08 BKK Bangkok Suvarnabhumi Glasgow M28 GLA Glasgow Dallas M46 DFW Dallas/Fort Worth Bangkok M08 DMK Bangkok Don Mueang Glasgow M28 PIK Glasgow Prestwick Detroit M47 DTW Detroit Wayne County Seoul M09 GMP Seoul Gimpo Londen M29 LCY London City Detroit M47 FNT Flint Seoul M09 ICN Seoul Incheon Londen M29 LGW London Gatwick Houston M48 HOU Houston William P. Hobby Brussel M10 BRU Brussels Londen M29 LHR London Heathrow Houston M48 IAH Houston George Bush Intercontinental Ap Brussel M10 CRL Brussels S. Charleroi Londen M29 LTN London Luton Los Angeles M49 BUR Burbank Kopenhagen M11 CPH Copenhagen Kastrup Londen M29 STN London Stansted Los Angeles M49 LAX Los Angeles Kopenhagen M11 MMX Malmo Manchester M30 BLK Blackpool Los Angeles M49 LGB Long Beach Berlijn M12 SXF Berlin Schoenefeld Manchester M30 LBA Leeds Bradford Los Angeles M49 ONT Ontario La/ontario Berlijn M12 TXL Berlin Tegel Manchester M30 LPL Liverpool Los Angeles M49 SNA Santa Ana John Wayne Dusseldorf M13 CGN Cologne/Bonn Manchester M30 MAN Manchester (GB) Miami M50 FLL Fort Lauderdale/Hollywood Dusseldorf M13 DTM Dortmund Gothenburg M31 GOT Goteborg Landvetter Miami M50 MIA Miami Dusseldorf M13 DUS Duesseldorf Gothenburg M31 GSE Goteborg City New York M51 EWR Newark Liberty Dusseldorf M13 NRN Duesseldorf Weeze Stockholm M32 ARN Stockholm Arlanda New York M51 ISP Long Island Macarthur Frankfurt M14 FRA Frankfurt Stockholm M32 BMA Stockholm Bromma New York M51 JFK New York J F Kennedy Frankfurt M14 HHN Frankfurt Hahn Stockholm M32 NYO Stockholm Skavsta New York M51 LGA New York La Guardia Hamburg M15 HAM Hamburg Stockholm M32 VST Stockholm Vasteras Norfolk M52 ORF Norfolk Hamburg M15 LBC Hamburg Luebeck-Blankensee Buenos Aires M33 AEP Buenos Aires Aeroparque J. Newbery Norfolk M52 PHF Newport News Parijs M16 BVA Paris Beauvais-Tille Buenos Aires M33 EZE Buenos Aires Ministro Pistarini Orlando M53 MCO Orlando Parijs M16 CDG Paris Charles de Gaulle Belo Horizonte M34 CNF Belo Horizonte Tancredo Neves Int Orlando M53 SFB Orlando Sanford Parijs M16 ORY Paris Orly Belo Horizonte M34 PLU Belo Horizonte Pampulha Philadelphia M54 ACY Atlantic City Bologna M17 BLQ Bologna Guglielmo Marconi Rio de Janeiro M35 GIG Rio de Janeiro Galeao-A.C.Jobim Int Philadelphia M54 PHL Philadelphia Bologna M17 FLR Florence Peretola Rio de Janeiro M35 SDU Rio de Janeiro Santos Dumont San Diego M55 SAN San Diego Milaan M18 BGY Milan Bergamo/orio al Serio Sau Paulo M36 CGH Sao Paulo Congonhas San Diego M55 TIJ Tijuana Milaan M18 LIN Milan Linate Sau Paulo M36 GRU Sao Paulo Guarulhos San Francisco M56 OAK Oakland Milaan M18 MXP Milan Malpensa mexico M37 MEX Mexico City Juarez San Francisco M56 SFO San Francisco Pisa M19 FLR Florence Peretola mexico M37 TLC Mexico City Toluca-A.Lopez Mateos San Francisco M56 SJC San Jose Norman Y. Mineta Pisa M19 PSA Pisa Teheran M38 IKA Tehran Imam Khomeini Tampa M57 PIE Tampa St Petersbrg-Clearwater Rome M20 CIA Rome Ciampino Teheran M38 THR Tehran Mehrabad Tampa M57 SRQ Sarasota/Bradenton Rome M20 FCO Rome Fiumicino Ten Aviv M39 SDV Tel Aviv-Yafo Sde Dov Tampa M57 TPA Tampa Venetie M21 TSF Venice Treviso/Sant'Angelo Ten Aviv M39 TLV Tel Aviv-yafo Ben Gurion Washington M58 BWI Baltimore Washington Venetie M21 VCE Venice Marco Polo Washington M58 DCA Washington Ronald Reagan National Washington M58 IAD Washington Dulles