Embed Size (px)
Citation preview
MASTERARBEIT / MASTER THESIS
Titel der Masterarbeit /Title of the master thesis
Biofuel Production in Developing Countries: A key to Sustainable Development?
Verfasser /Author
Shadi Mohebinejad
angestrebter akademischer Grad / acadamic degree aspired
Master (MA)
Wien, 2011
Studienkennzahl : A 067 805
Studienrichtung: Individuelles Masterstudium: Global Studies – a European Perspective
Betreuer/Supervisor: Univ. Prof. Alejandro Cunat
Abstract English
One of the main issues that world is facing is population growth. One of the critical issues
would be providing accessible, safe and reliable energy for the current population and the next
generation. Since the greatest share of population growth is in developing countries, this study
will focus on the biofuel production in developing countries. Biofuel is among those
renewable energies that can be a substitute for fossil fuels. However, the consequences and
effectiveness of biofuel on sustainable development is the subject of serious debate. For
instance, the main discussion regarding biodiesel concerns its current environmental,
economic and social impacts. Food security, deforestation, biodiversity extinction,
monocropping, soil degradation and water depletion are fundamental issues and this study
aims to address them. Therefore, this study used 2 series of indicators to evaluate the impact
of biofuel production: (i) Energy Indicators for Sustainable Development (EISD); (ii) “GBEP
Sustainability Indicators for Bioenergy” that both of them take into consideration three main
themes, economic, social and environmental pillars. India has been selected as a case study to
explore the economic, social and environmental aspects of biofuel production. India is the
second most populated country in the world and is a strong producer of biofuels while at the
same time facing serious issues, such as poverty and food security.
Abstract German
Eines der wichtigsten Probleme vor der die Welt steht ist das Bevölkerungswachstum. Eines
der kritischsten Aspekte wäre die Bereitstellung von zugänglicher, sicherer und verlässlicher
Energie für die derzeitige Bevölkerung und für die kommende Generation. Da der größte
Anteil am Bevölkerungswachstum in den Entwicklungsländern liegt, wird diese Studie den
Fokus auf die Produktion von Biotreibstoff in sich entwickelnden Ländern legen.
Biotreibstoff ist einer jener erneuerbaren Energiestoffe die als Ersatz für fossile Brennstoffe
gelten. Allerdings sind die Konsequenzen und Effizienz von Biotreibstoff für eine nachhaltige
Entwicklung Thema ernster Debatten. Zum Beispiel drehen sich die Diskussionen bezüglich
Biodiesel derzeit um Fragen der Auswirkungen auf Umwelt, Wirtschaft und Sozialem.
Nahrungsmittelsicherheit, Abholzung, das Verschwinden der Biodiversität, Monokultur,
Auslaugung der Böden und Wasserknappheit sind fundamentale Themen und diese Arbeit
zielt darauf diese zu thematisieren. Daher verwendet diese Studie zwei Serien von Indikatoren
zur Evaluierung des Einflusses der Produktion von Biotreibstoff: (i) Energieindikatoren für
nachhaltige Entwicklung (EISD); (ii) „GBEP Nachhaltige Indikatoren für Bioenergie“ die
beide die drei Säulen berücksichtigen: Ökonomie, Soziales und Umwelt. Indien ist das Land

mit der zweitgrößten Bevölkerung in der Welt und ein großer Produzent von Biotreibstoffe,
während es zeitgleich ernste Probleme wie Armut und Nahrungsmittelsicherheit lösen muss.

1. INTRODUCTION .................................................... 1
2. BIOFUEL .................................................................. 4
2.1. WHY BIOFUEL? ............................................................................................................................................ 4 2.2. WHAT IS BIOFUEL? ...................................................................................................................................... 5 2.3. PRO AND CONS ............................................................................................................................................ 9
2.3.1. Economic Aspects.............................................................................................................................. 11 2.3.1.1. Oil Dependency and Security.............................................................................................................. 11 2.3.1.2. Rural Development ............................................................................................................................. 12 2.3.1.3. Policies, Support Regimes and Mandates ........................................................................................... 13 2.3.1.4. Technologies ....................................................................................................................................... 13 2.3.1.5. Production, Consumption and Trade ................................................................................................... 14
2.3.2. Social Aspects ................................................................................................................................... 16 2.3.2.1. Food Security .............................................................................................................................................. 17
2.3.3. Ecological Aspects ............................................................................................................................ 19 2.3.3.1. Atmosphere ................................................................................................................................................. 20 2.3.3.2. Land ............................................................................................................................................................ 21 2.3.3.3. Water ........................................................................................................................................................... 23
3. SUSTAINABLE DEVELOPMENT ....................... 26
3.1. SUSTAINABLE DEVELOPMENT DEFINITION ................................................................................................ 26 3.2. THE IMPORTANCE OF ENERGY IN SUSTAINABLE DEVELOPMENT ............................................................... 27 3.3. SUSTAINABLE DEVELOPMENT INDICATORS ............................................................................................... 29
3.3.1. Energy Indicators and Sustainable Development (EISD) ................................................................. 30 3.3.2. Indicators for Assessing the Sustainable Production and Use of all Forms of Bioenergy (GBEP) .. 31 3.3.3. Comparison of Indicators ................................................................................................................. 33
4. INDIA AS A CASE STUDY .................................. 35
4.1. INTRODUCTION .......................................................................................................................................... 35 4.2. ETHANOL ................................................................................................................................................... 37
4.2.1. Policy / targets .................................................................................................................................. 38 4.2.2. Impacts .............................................................................................................................................. 43
4.2.2.1. Economic .................................................................................................................................................... 44 4.2.2.2. Social .......................................................................................................................................................... 45 4.2.2.3. Environmental ............................................................................................................................................. 49
4.3. BIODIESEL.................................................................................................................................................. 50 4.3.1. Policy/ Targets .................................................................................................................................. 50 4.3.2. Impacts .............................................................................................................................................. 56
4.3.2.1. Economic .................................................................................................................................................... 56 4.3.2.2. Social .......................................................................................................................................................... 57 4.3.2.3. Environmental ............................................................................................................................................. 59
5. CONCLUSION ....................................................... 65
BIBLIOGRAPHY ....................................................... 78
LIST OF TABLES AND FIGURES
Tables TABLE 1. PROJECTED DEMAND AND SUPPLY OF ETHANOL FOR 5% BLENDING WITH PETROL, SOURCE: GOI 2003, PLANNING
COMMISSION REPORT ....................................................................................................................................... 38
TABLE 2. MOLASSES AND ALCOHOL PRODUCTION CONSUMPTION TRENDS (IN MILLION LITERS); SOURCE: GOI 2003, PLANNING
COMMISSION REPORT ....................................................................................................................................... 39
TABLE 3. CLASSIFICATION OF SUGARCANE BELTS OF INDIA ................................................................................................. 44
TABLE 4.LAND REQUIRED (MHA) FOR MEETING THE PROJECTED BIOFUEL DEMAND FOR 2020. SOURCE: FAO (2008). MIELKE
(2007), JONGSCHAPP ET AL. (2007), FRESCO (2006), THOW AND WARHURST (2007). .............................................. 49
TABLE 5.WATER REQUIREMENTS FOR DIFFERENT BIOFUEL CROPS. SOURCE: WETLAND INTERNATIONAL ANNUAL REVIEW (2008). 50
TABLE 6.DETAILS OF PROGRESS ON BIOFUEL INITIATIVES IN VARIOUS STATES OF INDIA. SOURCE:(GOPINATHAN AND SUDHAKARAN
2009) ........................................................................................................................................................... 53
TABLE 7.CURRENT STATUS OF COMMERCIAL BIODIESEL PRODUCTION IN INDIA. SOURCE:(GOPINATHAN AND SUDHAKARAN 2009) 54
TABLE 8.MEAN ANNUAL ��� EMISSION (MT) UNDER DIFFERENT SCENARIOS. SOURCE: (RAVINDRANATH, SITA LAKSHMI, ET AL.
2010) ........................................................................................................................................................... 61
TABLE 9.���EMISSION FACTORS USED. SOURCE: FARGIONE ET AL. (2008) ....................................................................... 61
Figures
FIGURE 1, GBEP SUSTAINABILITY INDICATORS FOR BIONENERGY. SOURCE: FAO, MAY 2011 ................................................. 33
FIGURE 2, INDIAN SUGARCANE AREA AND PRODUCTION- A CYCLICAL TREND - SOURCE: COOPERATIVE SUGAR 40 (5), JANUARY
2009, NFCSF LTD., NEW DELHI. ................................................................................................................. 40
FIGURE 3, INDIAN CANE YIELDS AND SUGAR RECOVERY PERCENTAGES - SOURCE: COOPERATIVE SUGAR 40 (5), JANUARY
2009, NFCSF LTD., NEW DELHI. ................................................................................................................. 41
FIGURE 4. SUGARCANE UTILIZATION TRENDS FOR VARIOUS PURPOSES IN PERCENTAGE - SOURCE: COOPERATIVE SUGAR 40 (5),
JANUARY 2009, NFCSF LTD. NEW DELHI. ........................................................................................................... 41
FIGURE 5. TRENDS IN AREA UNDER FOOD PRODUCTION (IN MILLION HECTARES) AND THE FOOD GRAIN PRODUCTION AND DEMAND
( IN MILLION TONS) ALONG WITH POPULATION GROWTH FOR THE PERIOD 1950-1951 TO 2020-2021. SOURCE: TERI
(2008) .......................................................................................................................................................... 46
FIGURE 6.INDIAN SUGAR PRODUCTION AND CONSUMPTION - VICIOUS CYCLE. SOURCE: ISMA 2008 AND INCORPORATING 2008-
2009 .DATA ................................................................................................................................................... 48
FIGURE 7. TRENDS IN AREAS UNDER FOREST AND TREE COVER IN INDIA (MILLION HECTARES). SOURCE: (STATE OF FOREST REPORT
2007). .......................................................................................................................................................... 64
1
1. INTRODUCTION
The main aim of a policy maker’s decision in any country should be to establish adequate
provisions for achieving sustainable development. One of the critical issues that the world is
facing with is population growth and applying accurate solutions for coping with this reality.
The world population is projected to reach 8 billion in 2025 (UN 2011) and the majority of
this increase in the world population will occur in developing countries (Lal, et al. 2005, iv).
The fact that the greatest share of population growth in the world belongs to developing
countries reveals the need for more concerted efforts to find new, proper, and practical
solutions to deal with this issue. To provide for the growing population’s needs under the
umbrella of sustainable development, one of the vital factors is energy supply. Providing safe,
clean and affordable energy for the current population and the next generation is one of the
highest priorities. The need for everyone to have access to affordable energy sources, a great
dependence on fossil fuels, the depletion of finite resources, high oil import dependency, as
well as the critiques of the negative impact of fossil fuels on environment are the most
notable barriers that incite states to search for new options.
Since the transportation sector alone is 93% dependent on oil (IEA 2010), finding a reliable
substitute is crucial in policymaking. Biofuel has been produced and used in various different
countries. Biofuel offers, in comparison with other alternatives, several benefits; (i) it is
usable in current engines without requiring sophisticated modification; (ii) the use of biofuels
does not require time-consuming studies or research. However, the consequences and
effectiveness of biofuel on sustainable development is the subject of serious debate.
Therefore, biofuel production has not yet been implemented on a large scale with consistent
performance.
For instance, the main discussion regarding biodiesel concerns its current environmental,
economic and social impacts. Food security, deforestation, biodiversity extinction,
monocropping, soil degradation and water depletion are fundamental issues and this study
aims to address them. Also, one of the fundamental points is to have decent comprehension
of what biofuel is. Therefore, the second chapter introduces biofuel.
Further, it is essential to know why there is a need for biofuel production Or, in other words,
what the countries’ incentives for biofuel production are. The next stage is understanding
2
biofuel, how it is produced and what it is made of using which technologies; sub-chapters
will explore these areas. The last discussion, which reveals the importance of the question of
this study, discusses concerns regarding biofuel production and why there is a need to
consider all impacts of biofuel production, including positive and negative effects.
Further, since all the arguments refer back to sustainable development, it is vital to have a
comprehensive definition of sustainable development to have a clear and accurate prospective
for answering this work’s central question. Hence, the next action is to define sustainable
development and its key indicators. One of the most comprehensive and complete documents
on the subject is “Energy Indicators for Sustainable Development” which was issued by the
International Atomic Energy Agency (IAEA) through cooperation with several international
organizations such as the International Energy Agency (IEA), the United Nations Department
of Economic and Social Affairs (UNDESA), Eurostat, and the European Environment
Agency (EEA). The indicators presented in the document constitute a core set of Energy
Indicators for Sustainable Development (EISD) with corresponding methodologies and
guidelines for use among policymakers, energy analysts and statisticians (IAEA, et al. 2005,
3). In addition, the Food and Agriculture Organization of the United Nations (FAO) in
cooperation with the Global Bio-Energy Partnership (GBEP) recently published a list of
indicators under the title “GBEP Sustainability Indicators for Bioenergy” that takes into
consideration three main themes, economic, social and environmental pillars. The main
reason of to combine these two indicators is that FAO’s indicators are directly related to
bioenergy. Moreover, they cover some aspects that were not considered in the IAEA’s
indicators document. Therefore, the third chapter introduces the indicators and makes a
comparison, considering the fact that IAEA’s indicators are not only about bioenergy and the
fact that most of the related indicators can be chosen out of all presented indicators. In order
to best cover all aspects of biofuel production, a combined set of indicators will then be
presented.
Based on the chosen definition of sustainable development and its related indicators, India
has been selected as a case study to explore the economic, social and environmental aspects
of biofuel production. India is the second most populated country in the world and is a strong
producer of biofuels while at the same time facing serious issues, such as poverty and food
security.
3
It will also assess recent research that shows that not all biofuels and technologies have
remarkable environmental and social advantages when compared to fossil fuels (Melillo, et
al. 2009) (Ulgiati 2001). The advantages and disadvantages depend on the local conditions of
the region where biofuels production and consumption are implemented (Groom MJ, Gray
EM, Townsend PA. 2008).
Therefore, the study will keep in mind the fact that biofuel production itself cannot be judged
as simply being a good or bad solution: it depends on in which region, under which policies,
and with which technology it is being produced and used. It is for this reason that a more
precise answer to the question of the viability of biofuel can be achieved by focusing on the
local level and considering the different characteristics of each region. The main objective of
this study is therefore to determine under which circumstances biofuel production would
work best for developing countries. Which prerequisites should countries have in order to
establish viable biofuel industries? The fourth chapter addresses India’s biofuel production
conditions. A brief introduction to biofuel production in India will be presented. To have a
clear view about biofuel production there, this chapter has been divided into two major
sections: (i) Ethanol, and (ii) Biodiesel. Each section has two major parts; (i) Policy/targets,
and (ii) Impacts. The aim is to elaborate the expectations of the government from biofuel
production and their policies and programs to reach these goals. Further this chapter will
examine the impacts of these policies in action on three main pillars of sustainable
development: economy, society and environment. In order to examine the impacts, the
indicators that have discussed in chapter three will be used.
In conclusion, a summary of the study will be reviewed. In addition, some suggestions for
further needed research in this area will be presented.
4
2. BIOFUEL
2.1. Why Biofuel?
Undoubtedly, energy is one of the most essential factors for development and improvement
of the population’s life standards in any country. Nowadays, the world’s energy use and
supply cannot be seen as sustainable given the way existing technologies are implemented
(Jovanovic, Afghan and Bakic 2010), based on the fact that much of energy supply and use
are dependent on exhaustible resources or fossil fuels (United Nations 2007, 1). The world’s
primary energy demand has increased at rate of 2.0% on average per year since 1973 (IEA
2007). Moreover, approximately one third of the world’s population are still dependent on
non-commercial fuels (United Nations 2007, 1). Estimates show that 1.4 billion people, or
more than 20% of the global population, has no access to electricity and that 2.7 billion
people, around 40% of the global population, are dependent on traditional biomass for
cooking (IEA 2010, 56).Accumulating scientific evidence for the urgent need to combat
climate change has changed international and national awareness of these issues (IIASA, et
al. 2009, 21).
The aforementioned issues have led countries to seek for other sources of energy that can
contribute to climate change, reduce oil import dependence, and provide clean energy for less
developed regions. Searching for such sources of energy that are compatible with the concept
of sustainable development is the aim of policymakers. Biofuel is one of these substitute
sources of energy.What is more, rising oil prices, national energy security concerns, the
desire to increase rural incomes, and a host of new and improved technologies incite many
governments to enact powerful incentives for using these fuels (Worldwatch 2007, xviii),
Countries like the United States, Brazil, and European countries being examples. Biofuels
have been acclaimed as the potential for reducing greenhouse gas emissions, enhancing
energy security, and boosting rural development (IIASA, et al. 2009, 21).
The biofuel industry in most developing countries can be considered an opportunity to
enhance economic growth and to create lasting jobs, especially in rural areas, particularly due
to the transportation sector, which is one of the major consumers of fossil fuels and
5
responsible for around 23% of GHG (Greenhouse Gases) energy-related emissions (Lora, et
al. 2010). Estimates show that oil remains the dominant fuel in the transportation sector, with
a share of 77% in all transportation fuels. Most of the oil savings occur in road transport,
which accounts for more than 80% of all oil savings by 2035 (IEA 2010, 429). Biofuels can
replace fossil fuels to reduce the adverse impacts on climate change (Lora, et al. 2010).
Current biofuel targets for biofuels’ share in transportation fuel are projected at 12 percent in
developed countries and 8 percent fordeveloping countries by 2030 (IIASA, et al. 2009, 21).
Biofuel production can reduce imports or bring export opportunities, provide local farmers
with better opportunities and incomes, and boost national economies for developing
countries. Suitable natural conditions, such as availability of land and water, plus low labor
costs, and the fact that some crops such as sugarcane and palm oil (the most cost-effective
and GHG-saving crops) grow best in tropical conditions, provide developing countries in
tropical regions with a comparative advantage in growing biofuel feedstock (IIASA, et al.
2009, 21). In short, proponents of biofuel production claim that domestic biofuel production
can replace expensive oil imports, help unburden developing countries from staggering
energy import bills, stabilize currencies, and encourage foreign investment.
2.2. What is Biofuel?
It is essential to have a good comprehension of what exactly biofuel is and how it is being
produced. Therefore, this chapter presents a brief description of biofuel production and its
varied technologies.
Biofuel can be solid, liquid, or gaseous fuels that are produced from biomass materials
(Worldwatch 2007, 34). Ethanol and biodiesel are the two main liquid biofuels used largely
nowadays (Worldwatch 2007, 3) and can be blended with fossil gasoline and diesel
respectively (IIASA, et al. 2009, 21). Currently, ethanol is produced from sugar and starch
crops, while biodiesel is produced from vegetable oils or animal fats (Worldwatch 2007, 3).
As it has been mentioned above, the two main biofuels that are globally considered for the
transportation section are biodiesel and bioethanol.
In the early 1820s, American inventor Samuel Morey used ethanol and turpentine in the first
internal combustion engine. Yet, at the beginning of the 1900s, when automobiles were
becoming popular, the fuel market was flooded with cheap petroleum fuels (Worldwatch
6
2007, 5), whereas biofuel had only a small share of total fuel consumption during the early
20th century. They were, in several European countries such as France and Germany,
supported by policies and, at times, they neared 5 percent of the fuel supply. Biofuels were
often the favoured fuels in tropical areas with irregular supplies of petroleum and in enclosed
settings such as mines. For instance, during World War I and II, ethanol was used to
supplement petroleum in Europe, the U.S., and Brazil. However, the post-war period of
military demobilization plus the development of new oil fields in the 1940’s brought cheap
oil that virtually eliminated biofuels from the world fuel market. However, the oil crisis of the
1970’s once again stirred countries to search for an alternative to oil (Worldwatch 2007, 5).
Bioethanol
Bioethanol can be produced from a number of crops such as sugarcane, corn (maize), wheat,
and sugar beets (Lora, et al. 2010) or any feedstock that contains high starch or sugar content.
Maize, wheat, sugar cane and sugar beet are the main grains that produce energy through the
fermentation of carbohydrates. Traditionally, ethanol has been used for alcohol production,
yet it’s increasingly being used in transportation fuels. Bioethanol, after fermentation and
distillation, can be mixed with petrol/gasoline in different proportion. Low-level ethanol
blends like E10, which means 10 percent ethanol and 90 percent gasoline, can be used in
conventional vehicles. Other high-level blends, like E85, which means 85 percent ethanol and
15 percent gasoline, can only be used in specially motorized vehicles, such as flexible fuel
vehicles (FFVs). The blending of ethanol diminishes carbon monoxide emissions. Ethanol
production around the world has doubled since 2000 to 62 million liters in 2007, of which 86
percent is utilized as fuel ethanol (IIASA, et al. 2009, 34). Now, fuels can be 100% ethanol as
well, which is being produced in Brazil. Most of the world’s biofuel is used for
transportation; however, heating homes is another use for it (Worldwatch 2007, 3).
Biodiesel
Biodiesel can be produced from straight vegetable oils (edible and inedible), recycled waste,
vegetable oils, animal fat, and oils from biotechnological sources (yeasts, microalgae, etc.)

7
(Lora, et al. 2010). Biodiesel is produced through the transesterification of vegetable oils (a
chemical process) such as oil palm, rapeseed, soya been, and jatropha. This process produces
FAME, the chemical name for biodiesel and glycerol, or fatty acid methyl ester (FAME).
Glycerol is traditionally used in soaps (IIASA, et al. 2009, 34).
Heating these vegetable oils leads to reduction of viscosity, enabling them to be used directly
in diesel engines or, after chemical processing, for biodiesel production. Biodiesel can be
used either purely or by blending it with diesel. B20, which means 20 percent bio diesel and
80 percent diesel, and lower blends, such as B2, which means 2 percent biodiesel and 98
percent diesel, and B5, which stands for 5 percent biodiesel and 95 percent diesel, can be
used in diesel engines. B100, which is a pure biodiesel, and other high-level biodiesel blends
have been used, since 1994, in specific engines. Globally, about 6.5 billion liters of biodiesel
were produced in 2006, of which 75 percent was produced in the European Union (IIASA, et
al. 2009, 34).
Regarding technological use, biofuels can be divided into two groups based on the feedstock
used for production and the technologies used to convert that feedstock into fuel known as
first and Second-generation biofuels. The term “first generation biofuels” refers to the
technologies that usually utilize the sugar or starch portion of plants (e.g. sugarcane, sugar
beet cereals, and cassava) as feedstock to produce ethanol and those utilizing oil seed crops
(e.g, rapeseed, sunflower, soybean and palm oil) to produce biodiesel. (Rutz and Janssen
2007), (OECD_FAO 2008) Second-generation biofuels are those produced using
technologies that convert lignocellulosic biomass (e.g., agricultural and forest residues) and
advanced feedstock (e.g., Jatropha and micro-algae) (Worldwatch 2007). It is worth
mentioning that first-generation biofuels have already been in commercial production in
many countries for couple of years. Yet, Second-generation technologies just began
commercial production, except some regions such as Jatropha in India (Timilsina and
Shrestha 2010). The advantage of Second-generation tofirst generation is that Second-
generation biofuels can produce both food and fuel together unless non-food crops are
preferred; the first generation, by contrast, directly competes with food supply (Timilsina and
Shrestha 2010).
The process of biofuel production at the moment produces fuel and some by-product fuel and
residues simultaneously. The type and quantity of by-products are varied based on the biofuel
8
production chain. By-products might serve as precious livestock feed (e.g. rapeseed cake,
soybean meal, or Distillers’ Dried Grains with Solubles (DDGS)) and residues such as straw
and husks could be brought back to the field or used in co-firing. Some of the by-products
can be used for further industrial processing and (it is presumed) eventually consumer goods.
In this case, by-products should be acknowledged within the overall biofuel production chain
(IIASA, et al. 2009, 34).
Biofuel First Generation Technologies:
First generation ethanol is produced from sugars and starches. Simple sugars in a variety of
sugar crops are extracted and are the yeast ferments, the resulting wine is distilled into
ethanol. However, starches require an additional step. First, they are converted into simple
sugars through an enzymatic process under high heat. In this case energy consumption is
higher and, consequently, the cost of production increases (BNDES 2008). Biodiesel is
derived from lipids and is produced by mixing the oil with an alcohol like methanol or
ethanol through the chemical process of transesterification1. The biodiesel, fatty-acid methyl
ester (FAME) made from this process has 88-95% of the energy content of conventional
diesel, but better lubricity and a higher cetane value, and so can deliver fuel economy close to
that of conventional diesel (Timilsina and Shrestha 2010).
Nevertheless, biodiesel is not flawless. One of its characteristics is that it can be degraded by
exposure to air, heat, light, water and some metals; also, plugged filters in vehicles is a
common symptom (Ge, et al. 2009). Moreover, considering the fact that biodiesel has a
higher cold point/pour point than petroleum diesel, it can cloud and gel in cold temperatures,
which leads to difficulties in starting vehicles under cold conditions (Ge, et al. 2009).
Second-generation Technologies
Second-generation technologies are well-known for their low ��� emissions and the fact that
they do not utilize feedstock. Instead, they use materials such as residues and by-products
from agriculture and forestry as well as dedicated non-food related feed stocks, for instance,
1The action that is used to convert fats (triglycerides) into biodiesel.
9
woody and herbaceous plants (such as perennial grasses and fast growing tree species). The
expectation of second-generation biofuel reducing ��� emissions is significant (IIASA, et al.
2009, 34). However, the cost of Second-generation pathway technology is notable and
technological breakthroughs will be needed to reduce costs. Moreover, the large scale of
operation and substantial transportation costs involved in getting the raw materials to the
processing facilities should be considered as well. The estimates show that Second-generation
biofuels may become commercially available in the next 10 to 20 years (IIASA, et al. 2009,
34).
2.3. Pro and Cons
The aim of this sub-chapter is to address the main debates surrounding biofuel production and
its effects. More specifically, the factors that raise concerns for using biofuel production will
be at the centre of this chapter’s discussion. Evaluating biofuel production by considering
both positive and negative impacts on the three main pillars (economic, social and
environmental) will be presented to give an opportunity to policymakers to make the right
decision. This chapter is crucial in that it reveals the importance surrounding the emergence
of the central question in this study, which is: does biofuel production in developing countries
foster sustainable development?
This discussion will help in choosing the best indicators for sustainable development in order
to later conduct the quantitative section of this study. By knowing biofuel productions’
effects on specific areas, it will be easier to choose the move relevant and useful indicators
out of the whole basket of energy indicators for sustainable development.
In chapter 2.1, a brief description of the need for a new source of energy like biofuel will be
presented. At first glance, biofuel production looks like a promising approach. However,
recent research shows that caution is needed for countries’ targets regarding biofuel
production. The environmental benefits of expanded biofuel deployment and their
contribution to sustainable development are at the centre of deep debates (Scharlemann and
Laurance 2008). The main cons are: (i) first-generation biofuels compete with food crops in
the long run; (ii) there are limited arable land resources; (iii) the expansion into forest,
grassland and woodland areas; (iv) and land-use changes will result in notable carbon
emissions, negating the primary justification for carbon avoidance with biofuels (IIASA, et
10
al. 2009, 21).Particularly, biofuel expansion based on first-generation food crops needs more
caution considering the speed of the biofuel increase balance with the increase in overall
agricultural productivity. Otherwise, biofuel development leads to negative social
consequences or harmful environmental impacts (IIASA, et al. 2009, 21).
Mayer AL argues that the sustainability of the human environment system is determined
through three main characteristics: resilience to disturbances, both natural and anthropogenic;
desirability to human societies; and temporal and spatial scale boundaries (Mayes 2008).
Resilience and desirability present policy goals and the scale boundaries indicate the issues to
be monitored and managed to reach those goals. Hence, concerning biofuels, such issues are:
1. Biofuels should be carbon neutral, considering the necessity of fossil fuel substitution
and climate change mitigation.
2. Biofuel production should not have an effect on the quality, quantity and rational use
of available natural resources such as water and soil.
3. Biofuel production should not lead to undesirable social consequences, such as
starvation as a result of high food prices.
4. Biofuel production should contribute to society through economic development and
equity as well.
5. Biofuel production should not affect biodiversity (Lora, et al. 2010).
As a matter of fact, biofuel sustainability has environmental, economic, and social facets that
all interconnect. According to IISA research on biofuel and food security, sustainable biofuel
production and its use should result in the following achievements:
1. Significant greenhouse gas savings compared to the use of fossil fuels;
2. The use of environmentally sound agricultural and forestry management
systems for biofuel feedstock production;
3. Preservation of landscapes with significant value for biodiversity, mature
conservation, and cultural heritage;
4. Regard for the possibility of social exclusion; and
5. Integration with food, feed, and other biomass-use sectors considering
economic, security, and environmental implications of supply and demand
patterns (IIASA, et al. 2009, 62)
11
In the following sections, the economic, social and environmental dimensions (or three
pillars) will be explored in detail.
2.3.1. Economic Aspects
2.3.1.1. Oil Dependency and Security
The vital role of oil is not hidden from anybody since one of the most essential factors in
supplying goods, food and labour is mobility (Worldwatch 2007, 101) and the transportation
system overwhelming depends on a single fuel source: petroleum fuels provide an estimated
93 percent of global energy for transportation (IEA 2010). Oil reserves are concentrated in a
small number of countries, many of which suffer from economic and political instabilities.
Moreover, trade between oil exporters and oil importers is increasingly tense and vulnerable
(Worldwatch 2007, 101). Hence, substituting petroleum for another source of energy is
somehow unavoidable. Biofuel can be an alternative for oil in the transportation sector,
though biofuel alone cannot meet the increasing global demands for transportation
(Worldwatch 2007, 101). Furthermore, as converted oil supplies in many parts of the world
begin to dwindle in the years ahead, dependence upon Middle Eastern oil is expected to
grow, leaving the entire world more vulnerable to social and political developments in one of
the world’s least stable regions. In fact, of the world’s known potential of conventional
petroleum (364 billion tonnes), more than 70 percent is located in the so called ‘strategic
ellipse’, an area spanning much of the Middle East and Central Asia that is also home to 69
percent of known natural gas reserves (German Federal Institute for Geosciences and Natural
Resources 2006).
Some experts claim that compared with oil, biofuels can reduce many of the vulnerabilities
associated with today’s highly concentrated energy economy. Biofuel production, in contrast,
is considerably less concentrated because of the large land area needed to cultivate feedstock
and the low energy density of this feedstock that makes it less economical to transport long
distances. As a result, biofuel processing facilities are more numerous and spread over a
wider geographical area, contributing to a liquid fuel supply that is less vulnerable to
12
disruption. Biofuels also offer an opportunity for a more dispersed and equitably distributed
revenue stream (Worldwatch 2007, 106). Hence, for those countries with high dependencies
on oil, biofuel can be a more crucial substitute. It is even possible in some cases that due to
political securities and avoiding the negative effects of oil price vulnerabilities, decision-
makers, despite high costs, intend to establish a more robust biofuel industry (Worldwatch
2007, 106).
2.3.1.2. Rural Development
In general, developed and developing countries around the world show that average incomes
are lower and unemployment rates higher in rural areas than in their associated urban areas.
In addition, in the developing world, 57 percent of the total population lives in rural areas;
this portion will decrease to an estimated 33 percent by 2050. Moreover, over 70 percent of
the world’s poor and hungry live in rural areas. Therefore, increasing agricultural incomes
and enhancing rural development are among the essential objectives of development policies.
The solution could include a generation of employment opportunities out of increased biofuel
production and the establishment of rural biofuel processing industries, in addition to biofuel
marketing and distribution (IIASA, et al. 2009, 81). In this sense, Brazil is an example among
biofuel producing countries. Brazil’s experience has seen around 700,000 jobs generated in
the biofuel industry since the mid-1970’s. Estimations in other regions show that the EU
biofuel program will create around 100,000 rural jobs by 2020 and in the USA around
200,000 jobs (IIASA, et al. 2009, 81).
In sum, the contribution of biofuel development to increasing agriculture value added is
relatively insignificant. Estimations indicate approximately six to eight percent in developed
countries and only some three percent in developing countries by 2030. However, claimed
benefits of biofuel production to boost rural development should not rely only on feedstock
production; it will also require the setting up of an entire biofuel production chain. More
importantly, its impact can be found in fostering rural development (IIASA, et al. 2009, 23).
Potentially, biofuel production can have positive effects on rural habitants’ economic
conditions and offers them substantial rural economic benefits. However, it depends on
whether processing facilities are owned and operated by the farmers or not. Moreover, it
depends on whether the country as a whole only exports the raw material of biofuel
13
production or has the facilities for processed products. Obviously, raw material production
brings in less revenue (IIASA, et al. 2009, 118). On the other hand, some others claim that in
countries where there has been a strong expansion in biofuel production, employment in
farming appears to have decreased and a growing trend of workers employed in seasonal jobs
is observed (Ziegler 2010).
2.3.1.3. Policies, Support Regimes and Mandates
A number of countries around the world have adopted biofuel development policies,
including both developed and developing countries, such as the United States of America,
members of the European Union, Japan, Canada and Australia. Developing countries such as
China, India, the Philippines, and Thailand have also recently set domestic targets for biofuel
use (IIASA, et al. 2009, 37). Biofuel programs have proliferated globally, whether driven by
a desire to strengthen agricultural industries, achieve energy security, reduce GHG emissions,
or improve urban air quality (Timilsina and Shrestha 2010).
There are varied types of public support for the biofuels industry and a wide range of
different approaches to the type of government support implemented. Governments can
provide substantial support to biofuels by enabling them to compete effectually with
conventional gasoline and diesel. This support may include a combination of consumption
incentives (fuel tax reductions), production incentives (tax incentives, loan guarantees, and
direct subsidy payments) or mandatory consumption requirements (IIASA, et al. 2009, 37).
The OECD’s Economic Assessment of Biofuel Support Policies underlined that biofuels are,
at the moment, largely dependent on public funding to be viable (IIASA, et al. 2009, 37).
Based on the fact, it is politically challenging to remove biofuel incentives afterward.
Another issue which should be taken into consideration is how to implement support.
There are varied critiques which claim that government support of biofuel production in
OECD countries is costly, has an inadequate influence on reducing greenhouse gases and
improving energy security, and further has a significant impact on world food prices (IIASA,
et al. 2009, 36).
2.3.1.4. Technologies

14
Significantly, any country considering increased biofuel development needs to assess the
feasibility of adopting different biofuel feedstocks and processing infrastructures based on its
unique, natural resources, and economic context (IIASA, et al. 2009, 36). Without sufficient
innovation to make different sectors more efficient by using biofuels, even the successful
emergence of a biofuel industry is not able to have a significant effect on diminishing the use
of oil-based fuels. For instance, one of the most important and anticipated innovation is the
development of cellusios ethanol derived from plant stalks, leaves, and even wood to be
introduced commercially. More importantly, they make it possible to produce biofuel out of
agricultural and forestry wastes, as well as from non-food crops, such as switch grass, that
can be grown on degraded lands. Development for more efficient vehicles also plays an
important role in the transportation system (Worldwatch 2007, xix). Without smart,
innovative, and practical policies, the biofuel industry realistically cannot go in the right
direction.
2.3.1.5. Production, Consumption and Trade
Biofuel can be an option for oil imports reduction. But, are biofuels really cheaper than
petroleum fuels? Historically, biofuels have been more expensive than petroleum fuels and
today, nearly all biofuel industries still rely on extensive governmental support, mainly
subsidies, to be viable. Keep in mind that most biofuel crops can displace only a limited
amount of oil and, eventually, a rising demand for feedstock will put upward pressure on the
agricultural and food commodities prices (Worldwatch 2007, 118). Apart from sugarcane
based ethanol in Brazil, biofuels are not currently competitive without substantial government
support if oil prices are below US$70 per barrel (Doornbosch and Streenblik 2007).
Ethanol Costs
Costs differ by world regions, feedstock types, feedstock supply costs, the scale of bioenergy
production, and production time during the year, which is often seasonal (ipcc 2011).
According to IEA, the costs of ethanol production in new plants in Brazil are the lowest in the
world, which was $0.20 per liter in 2006 ($0.30 per liter for gasoline equivalents) (IEA

15
2006). This subsequently declined even further to $0.18 per liter (Worldwatch 2007). In
comparison with the cost of sugarcane-based ethanol in Brazil, grains-based ethanol costs
50% more in the US and 100% more in the EU. Transportation, blending and distribution
costs adds around $0.20 per liter to the retail price, whereas production costs for ethanol in
China are around $0.28 and 0.46$ per liter, depending on the price of the feedstock.
Moreover, sugar-based ethanol production in India costs is some $0.44 per liter (Worldwatch
2007). The IEA projects a reduction of one third in the cost of ethanol by 2030 as a result of
technological improvements and lower costs of feedstock (IEA 2006). However, the
increasing demand for ethanol due to mandates and targets, the influence of the fuel vs. food
discussion on this supply, and recent trends of feedstock prices suggest that ethanol’s cost
may not decline. In addition, unless the price of oil is high, ethanol production may not be
competitive without a substantial amount of subsidies (Timilsina and Shrestha 2010).
Biodiesel Costs
In general, biodiesel production from palm oil costs around $0.70 per liter, whereas rapeseed
oil-based biodiesel may cost up to $1.00 per liter, with soybean diesel in between (IEA 2006).
In China, biodiesel production costs, mainly from used cooking oil, range from $0.21 to
$0.42 (Worldwatch 2007). According to IEA, biodiesel production costs will diminish more
than 30% in the US and EU between 2005 and 2030 due to a decline in feedstock costs (IEA
2006), though it must be noted that the prices of biodiesel feedstock have, for the most part,
been moving in opposite directions since the IEA’s estimate was produced (Timilsina and
Shrestha 2010).
Global production of ethanol fuel grew from 30.8 billion liters in 2004 to 76 billion liters in
2009, with an average annual growth rate of 20%. The U.S. and Brazil alone accounted for
some 88% of the total in 2009 (Renewable Fuels Association 2008). Total global biodiesel
production remains small in comparison to ethanol, but its growth is higher than that of
ethanol, with an average annual growth rate of approximately50% between 2004 and 2009.
Germany, the U.S., France, and Italy are the biggest producers (Timilsina and Shrestha
2010). Despite this significant growth in biofuel production, the share of biofuels in total
transportation fuel was above 2% in 2004 in only three countries- Brazil, Cuba and Sweden
16
(IEA 2006). Moreover, global output accounted for only some 1% of total transportation fuel
consumption in 2005 (Doornbosch and Streenblik 2007). In 2007, production of ethanol was
still only about 4% of the global gasoline consumption of 1,300 billion liters (REN21 2008).
Considering total global trade trends, biofuels available relative to production output remains
modest; only about one tenth of total biofuel production by volume is traded internationally
(Masami, Donald and William 2007). Global trade for ethanol fuel was approximately 3
billion liters per year in 2006 and 2007, compared to less than one billion liters in 2000 (Licht
FO 2006i). Some 12%, or 1.3 billion liters, of total biodiesel production in 2007 was
internationally traded (Masami, Donald and William 2007). Based on this fact, some major
players, such as the U.S. and the EU, have targeted biofuel production for domestic
consumption, as few countries (Brazil being a major exception) have the ability to be great
exporters of ethanol or other biofuels (Timilsina and Shrestha 2010). Moreover, the current
situation is harsh for farmers in developing countries since developed countries’ policies of
tariffs, quotas and subsidies leave developing markets at a disadvantage (IIASA, et al. 2009,
81). On the other hand, global trade in biofuels has seemed to expand due to the comparative
advantage of some countries to produce biofuels, such as a favourable climate, lower labour
costs, and a greater availability of land (Timilsina and Shrestha 2010). For instance, tropical
countries have two or three times higher productivity when water scarcity is not a factor
(Philippe and Abigail 2006). Conversely, many countries may not be able to accomplish their
biofuel targets and mandates with domestic production alone (Timilsina and Shrestha 2010).
2.3.2. Social Aspects
Essential social factors in biofuel production include the need to share benefits with and
ensure involvement in decision making by local communities. Land tenure and the provision
of health and educational services are crucial issues (IIASA, et al. 2009, 81). For instance,
farmers need to be educated and given the proper resources and incentives to select crops
appropriately and to manage them in the most sustainable ways possible such that wildlife
habitat is maintained or improved and the use and impacts of chemical inputs are minimized
(Worldwatch 2007, 213). In addition, biofuel programs can possibly result in the
concentration of land among large commercial farmers to the omission of small farmers
17
(Ziegler 2010). Furthermore, the dispersion of biofuel production in some parts of the world
has resulted in violations of land rights and forced evictions. Among those who are
particularly affected are indigenous peoples, small landholders, and forest dwellers.
Furthermore, when discussing land rights, it is essential to take gender into account. Land
tenure systems throughout the world are systematically discriminating against women, very
often making land rights dependent on marital status (Ziegler 2010).
Moreover, since in rural areas many people depend on traditional biomass fuels and their
cooking environments are often extremely confined with notable risks of respiratory diseases,
biofuels can possibly contribute to reduction of the risks associated with traditional household
fuels such as charcoal and fuel wood (IIASA, et al. 2009, 81).Above all, the development of
biofuel production potentially has an important role to play in poverty reduction, and hence in
realizing the rights of everyone to an adequate standard of living, including food security.
Since food and fuel competition in biofuel production is a major concern, food security issues
will be discussed in detail below.
2.3.2.1. Food Security
The largest part of poor households’ income is allocated to food expenditures. Therefore,
rising food prices is a real threat for them and for food security generally, which is defined as
a lack of secure access to enough safe and nutritious food for normal growth and
development and for an active, healthy life (T. FAO 2008). There is a serious concern that
biofuel production works in opposition to food security. In 1970, about 900 million people in
developing countries, or one third of the total world population, was consistently
undernourished. This figure reached about one billion in 2008. Africa and South Asia were
the most effected regions in the world (IIASA, et al. 2009, 22).
The concerns arise because biofuel production forces upward pressure on world food prices.
Over the period of 1970-1990, world food prices constantly declined to nearly half, then
stagnated until 2002. Subsequently, from 2002 to 2007, world food prices increased around
140 percent. According to Baier’s research, the increase in worldwide biofuels production for
two years by the end of June 2008 accounted for almost 17 percent of the rise in corn prices
and 14 percent of the rise in soybean prices. Concerning sugar, the growth of the price of
18
sugar-based ethanol production in Brazil accounted for the entire boost of the sugar’s price
over the same time period (Baier, et al. 2009).
The increase in food prices was as a result of a number of factors, including increased
demand for biofuel feedstock and rising fuel and fertilizer prices (IIASA, et al. 2009, 22). It
also included other factors like strong income growth and subsequent demand for meat
products and feed grains for meat production in emerging economies, like China and India
(Schneph 2008); adverse weather conditions, like severe droughts in Australia (T. FAO
2008); growth in foreign exchange holdings by major food-importing countries and
protective policies adopted by some exporting and importing countries to suppress domestic
food price inflation (Trostle 2008); lower levels of global stocks of grains and oilseeds
(Zilberman, et al. 2008); and an increase in oil prices (Schmidhuber 2006).There is other
literature that, in addition to an assessment of the impacts of biofuels on the 2007-2008 food
crisis, project the impacts on food prices in the future. Some estimates indicate that
agricultural prices will rise by 30 percent due to biofuel targets by 2020 (IIASA, et al. 2009,
22). The International Food Policy Research Institute (IFPRI) estimates increases for maize
of 23-72%, wheat of 8-30%, oilseeds of 18-76%, and sugar of 11.5-66% considering the
changes necessary to implement countries’ plans that have been announced for biofuel
production levels by 2020 (ODI 2008).
There is another study which models the prices of basic foodstuffs in 2020 and 2030 under
several different scenarios for biofuel production. Based on the International Energy
Agency’s World Energy Outlook 2008 projections, price rises for both cereals and other
crops in 2020 are about 10 percent higher in comparison to a reference scenario where
biofuel development after 2008 is kept constant at the 2008 level (IIASA, et al. 2009, 23).
Moreover, this study examines the impact of expanded biofuel production on food supply as
well. The residual of the excess demand for cereals for biofuel production is met by reduced
food use mostly in developing countries. However, even in the worst case scenario, the
reduction in global cereal food consumption is about 29 million tons: that only represents a
1% decline from global cereal consumption of 2,775 million tons projected in the reference
case, where biofuel production is frozen at 2008 levels (IIASA, et al. 2009, 23).
In short, current knowledge of the significance of the impacts of biofuel on food prices is
highly sensitive to the models that have been used to assess those impacts. Partial equilibrium
19
models, which model the food and agriculture sectors, regardless of the sectors’ interaction
with other sectors of the economy, not surprisingly find higher impacts on food prices. On the
other hand, general equilibrium models, which take into consideration varied sectors and
agents, find the impacts to be relatively small (Timilsina and Shrestha 2010). Competition for
agricultural land is one of the main concerns. Currently, some 1.6 billion hectares of land are
used for crop production, whereas one billion hectares are under cultivation in developing
countries. Over the past 30 years, the global crop area expanded by around 5 million hectares
per year. In order to accommodate first-generation biofuels production, an additional 27
million hectares in 2020 and 37 million hectare in 2030 are expected to be cultivated (IIASA,
et al. 2009, 23).Food/fuel competition can be observed in the considerable decline of global
wheat and maize stocks. The increased demand for these food commodities as biofuel inputs
caused a surge in their prices in world markets, which in turn resulted in higher food prices
(Ziegler 2010).
2.3.3. Ecological Aspects
The world must not be duped into making a false choice between either economic growth or
environmental well-being. Economic growth and environmental well-being are
interdependent. We must choose both (Engel and Veglio 2010), for an ecological point of
view is really crucial to sustainability, since environmental problems in cultivating feedstock
for biofuels can be serious. However, the net environmental impact of land use for feedstock
production on habitat, biodiversity, and soil, water, and air quality depends on various
factors, such as the selection of feedstock, what crop the feedstock replaces, and how it is
managed (Worldwatch 2007, 196). The greatest environmental risks associated with biofuels
include the aforementioned impacts on habitat, biodiversity, and soil, air and water equality;
and the efficient use of water and subsequent recycling of it for fertilizer or absorbing it for
biogas. It is very significant to note that water availability and use are important limits on
biofuel production (Worldwatch 2007, 194). Furthermore, there can be air quality problems
related to feedstock production, so it is vital to review which countries are able to reduce
these adverse effects by shifting from petroleum diesel to biodiesel for farm machinery and to
regulate that limit or eliminate practices like field burning (Worldwatch 2007, 211).

20
In the section to follow, the impact of biofuel production on the atmosphere, land, and water
will be discussed individually.
2.3.3.1. Atmosphere
Climate change/Greenhouse gas emission
One significant impact of biofuel is diminishing the threat of global climate change.
Transportation is 96% dependent on oil (Worldwatch 2007, 101). Transportation serves
economic and social development through the distribution of goods and services and through
personal mobility. However, energy use for transportation also leads to the depletion of
resources and to air pollution and climate change. Reducing energy intensity in transportation
can reduce the environmental impacts of transportation while maintaining economic and
social benefits (IAEA, et al. 2005, 67-68). Further, the transportation sector alone is
responsible for about one quarter of global energy related greenhouse gas (GHG) emissions,
and that share is rising. Therefore, it is necessary to examine the claim that in the near future,
biofuel can be an option for effectively reducing the demand for oil and the associated
transportation-related warming emissions (Worldwatch 2007, 169).
In practice, it is not that simple. Although, a notable increase in biofuel production and use
could have a significant effect on emission reductions for transportation, it is possible that
would actually be a threat for warming world. This is because several factors play a role in
the overall climate impacts of biofuels: the most important factor is changes in land use,
choice of feedstock, and management practices. The greatest potential for reducing GHG
emissions lies in the development of next generation biofuel feed stocks and technologies
(Worldwatch 2007, xix). Moreover, while the Environmental Protection Agency (EPA) has
yet to issue Renewable Standard Fuel (RFS) rules to determine which fuels would meet the
greenhouse gas (GHG) reduction and land use restrictions specified in the Energy
Independence & Security Act (EISA), it is vital to examine whether biofuel products would
all meet the EISA biofuel requirements (U.S Energy Department 2008, 4).
However, there is doubt surrounding the question of the effectiveness of biofuel production in
diminishing climate change. Carbon losses as a result of land use changes occur at the time of
21
land conversion, yet greenhouse gas avoidance through the adoption of biofuels as a
substitute for fossil oil only accumulates slowly over time. Therefore, net greenhouse gas
avoidance resulting from the rapid expansion of first-generation biofuels will only be
achieved after several decades. In the short run until 2030, the net greenhouse gas balance
will be dominated by carbon debt as a result of direct and indirect land use changes (IIASA,
et al. 2009, 22). Furthermore greenhouse gasses are emitted at all stages of the biofuel
production chain: first, for the fuel used for the production, harvest, collection and
transportation of bioenergy feedstock; then for the energy needed to produce fertilizers and
pesticides; subsequently during chemical processing of feedstocks; and ultimately during the
distribution of biofuels to end users and its final use (IIASA, et al. 2009, 67).
2.3.3.2. Land
Land requirements for biofuel production competes with traditional demands of agriculture
and forestry. Furthermore, the growth of the global population as well as rising per capita
consumption in developing countries leads to boosted demands for land to sustain the food
supply in the future (Timilsina and Shrestha 2010). It is probable that some of this demand
will be met with improved crop yields per unit area, which in recent decades has been
increasing at about 1.5% for staple crops; however, this would only boost production by 40%
by 2020. Therefore, approximately 500Mha more land is required to be brought into
cultivation in order to meet the additional demands for food alone (Bustamante, et al. 2009).
Hence, biofuel cultivation will expand to natural forest and pasture land, especially where no
land supply response is assumed (Gurgel, Reilly and Paltsev 2007, Article 9). Biofuels
feedstock production targets up to 2020 suggest that these may be responsible for the
deforestation of over 20 million additional hectares while arable land expansion into
forestlands for food production will amount to 50 million hectares by 2020 (IIASA, et al.
2009, 23). On the other hand, forests play a vital role in environment, not only in producing
timber, wood, fuel, and other products, but also in conserving biodiversity, wildlife habitats,
mitigating global climate change, and protecting watersheds against soil degradation and
flood risks (IIASA, et al. 2009, 23).
22
Biodiversity and Soil Quality
Transformation of natural ecosystems, specifically natural forest and natural grasslands,
causes high losses of biodiversity. Using abandoned or degraded agricultural land or low
intensity grazing lands are relatively less (IIASA, et al. 2009, 24).
According to the Biofuels and Food Security’s research done by IIASA, the effect of biofuel
production on biodiversity can be categorized as follows: first in the utilization of land
according to the type of feedstock used: :
(i.e., feedstock specific characteristics together with typical field management
practices such as scale of operation, degree of mono-cropping, tillage methods,
fertilization intensity, use of agro chemicals to combat pest and diseases, use of
GMOs(Genetically Modified Organism), invasive characteristics of feedstocks etc.)
(IIASA, et al. 2009, 77)
Second, the pre-conversion land use or land cover situation:
Generally, conversions from natural areas to cultivation of first-generation feedstocks e.g.
soybean and palm oil, have the highest impact in terms of loss of biodiversity. Low or no
biodiversity losses occur when only the economic purpose changes, e.g. with rape grown for
vegetable oil for human consumption or for bio-diesel. On the other hand, positive
biodiversity effects can be achieved when converting intensively managed agricultural land
to less intensive uses (IIASA, et al. 2009, 77).
However, biofuels can affect soils both positively and negatively. Deforestation due to
plantation expansion may lead to the loss of soil carbon (Guo and Gifford 2002), (Murty, et
al. 2002) though growing perennials, such as oil palm, sugarcane, and switch grass instead of
annual crops, would be able to increase soil cover and organic levels. Obviously, the impacts
differ with crop type, soil type, nutrient demand, and the overall land preparation necessary
(Timilsina and Shrestha 2010). For instance, sugarcane generally has less of an impact on
soils than rapeseed, maize and other cereals (IEA 2006, Chapter 14). Although, the diversion
of agricultural residues, such as bagasse, as an energy input to biofuel production diminished
the amount of crop residues available for recycling that could degrade soil quality, and soil
organic matter in particular (Timilsina and Shrestha 2010). Another study explains that
23
soybean production for biodiesel in the U.S. needs much less fertilizer and pesticide per unit
of energy produced in comparison with maize production for ethanol, and that both
feedstocks fare poorly in comparison to second-generation feedstocks like switchgrass,
woody plants or a diverse mixture of prairie grasses and forbs (Hill, et al. 2006). IEA’s report
claims that perennial lingnocellulosic crops such as eucalyptus, poplar, willow or grasses can
be grown on poor quality land; moreover, they can increase soil carbon and quality with less-
intensive management and fewer fossil-energy inputs (IEA 2006, Chapter 14).
Generally, due to land conversion from natural cover to intensive annual crop production, the
organic body content of soil diminishes over time. The use of chemical fertilizers in order to
reintroduce nutrients into the soil and pesticides to cope with weeds, insects and blights
decreases soil biodiversity. Moreover, the use of nitrogen fertilizers leads to acidification of
soils and surface waters (Worldwatch 2007, 205). Nitrogen fertilizer use without taking
biofuels into account predicts a boost of an additional 40 million tons to 125 million tons in
the period of 2000 to 2030, up from 85 million tons in 2000. Biofuel targets would lead to an
additional use of about 10 million tons of nitrogen fertilizer, i.e. a 25 percent increase of
predicted growth without demand for first-generation biofuel feedstocks (IIASA, et al. 2009,
24).
2.3.3.3. Water
Water is a fundamental driver of agricultural production and it can be called as the most
precious input (IIASA, et al. 2009, 73). The agricultural sector accounts for approximately 70
percent of global freshwater use and as much as 90 percent of water resources in some
developing countries, due to highly inefficient irrigation (Pstel 2006, 52). Estimates indicate
agricultural water withdrawals will grow from 2630 km3 in 2000 to 2924 km3 in 2030 and to
3090 km3 in 2050, rises of 11 and 17 percent, respectively, in comparison to 2000. Climate
change and related warming might add an additional 5-9 percent in 2030 and 8-10 percent by
2050. Water demand for food production alone will grow substantially in the coming years
and is likely to intensify water scarcities in many regions (IIASA, et al. 2009, 24).
Water Use for Irrigation

24
There are vast differences in water use of varied feedstocks as well as major location-specific
differences in the amount of water available from rainfall and irrigated water resources.
Therefore, the required irrigation water per liter of bio-ethanol produced might differ broadly
across different locations (IIASA, et al. 2009, 75). For instance, cultivation of sugar-cane,
especially, is extremely water intensive (Worldwatch 2007, 208).
Dense water use during dry spells intensifies water scarcities and damages river ecosystems,
visible in Brazil and many other countries (F.O.Licht 2005k). Moreover, irrigation leads to
soil loss and leaching of nutrients and agro-chemical residues from the soil (Durbin 2006).
In 2005, there were 10 million ha used for cultivation of ethanol feedstocks, largely sugar
cane in Brazil, India, and South Africa, and maize in the United States of America and China.
Bio-ethanol feedstocks are responsible for about 1.4 percent of total evapotranspiration of
irrigation water withdrawals (IIASA, et al. 2009, 74).
According to the International Water Management Institute:
Globally, there is enough water to produce both food and biofuel. But, in countries
where water is already scarce, like India and China, growing biofuel crops will
intensify existing problems (IWMI 2008).
Water Quality
Increasing biofuel production will influence water quality as well as water quantity, both
through run-off of agro-chemicals and through harmful substances produced in feedstock
processing and conversion (IIASA, et al. 2009, 76). Normally, less than half the nitrogen in
fertilizer that is applied to crops is in fact taken up by them; the rest is dissolved in surface
water, absorbed into groundwater, or lost to the air (UNEP 2000). Among all food crops, corn
requires more pesticides and corn hybrids need more nitrogen fertilizer than any other crop.
Therefore, run-off of these chemicals can find their way into groundwater, resulting in
contamination and affecting water quality (Worldwatch 2007, 208).
Regardless of the biofuel feedstocks’ type, the enhanced competition for agricultural
resources as a result of biofuel feedstock production might add to the risk of intense

25
environmental pressure created by the overexploitation of resources, poor farming practices,
or the increased cycling of nutrients and pollutants beyond the protective and self-cleaning
capacities of biological systems (IIASA, et al. 2009, 76).

26
3. Sustainable Development
In the next stage, having reliable indicators is essential since any judgment needs to be based
on the proper assessment. The indicators should have certain criteria to be reliable and
practical at the same time. One of the most important criteria is the validity and reputation of
the source of the indicators. It should have such a framework that every country is able to use
it. In order to make these indicators practical, they have to be defined in a way that can be
easily measured. Moreover, data availability is very crucial in this sense, as an indicator
which looks nice but lacks any way to measure it would be useless. They can be good in
theory but not in practice. Another important aspect is the selection between a broad range of
different issues and indicators. The indicators should of course be simple enough to be
understandable and usable.
Based on the aforementioned reasons, two different packages of indicators have been
selected. First, the Energy Indicators for Sustainable Development (published, edited, and
issued by the International Atomic Energy Agency (IAEA) through cooperation with several
international organizations such as the International Energy Agency (IEA), the United
Nations Department of Economic and Social Affairs (UNDESA), Eurostat and the European
Environment Agency (EEA). The second one is GBEP Sustainable Indicators for Bioenergy,
which has recently been issued by the Food and Agriculture Organization of the United
Nations (FAO).
In this chapter, the first section will provide a definition of sustainable development. More
importantly will be the relation between energy and sustainable development, which will be
at the core of this study. These discussions would help us to choose the best indicators.
Further, it will include a brief description of each of these packages of indicators. Next, there
will be a comparison between these two lists of indicators in the aim of finding the best
combination.
3.1. Sustainable Development Definition Sustainable development is the main aim of any country planning. It is essential to ensure that
there is no conflict between the actions of each of the country planning’s items and
27
sustainable development in both the short and long run. The best definition for sustainable
development is the one in the Brundtland Report:
[Sustainbile development is] development that meets the needs of the present
without compromising the ability of future generations to meet their own
needs (WCED 1987).
Other definitions of sustainable development exist, though what really matters is having an
understanding of the crucial features of sustainable development. The term ‘development’
expresses the concept of a clean, healthy environment and preferences in terms of social
development, along with the satisfaction of economic needs and that the present generation
must not, through the destruction of ecological processes essential to life, endanger the ability
of future generations to be at least as well off as the current generation. There is broad
agreement that sustainable development has three pillars - economic, social and
environmental - and each policy must consider all three (APEC Energy Working Group
2002).
3.2. The Importance of Energy in Sustainable Development
It has been almost three decades since the topic of sustainable development emerged on the
international agenda though it is only lately that sustainable development and energy have
assumed greater eminence in international debates (APEC Energy Working Group 2002).
Energy is critical in sustainable development and poverty reduction determinations. It has
impacts on all development’s dimensions - social, economic, and environmental - including
livelihoods, agricultural productivity, access to water, health, education, population levels,
and gender-related issues. None of the Millennium Development Goals (MDGs) can be met
without improvement both in the quality and quantity of energy services in developing
countries (UNDP 2011).
Nowadays, the permanent increase of the world’s population brings up serious concerns.
Adequate and affordable energy supplies play a crucial role in economic development and the
transition from agricultural economies to modern industrial and service-oriented societies.
Energy is also essential for social and economic well-being improvements; moreover, it is
indispensible to most forms of industrial and commercial wealth generation. Furthermore, it
28
is a key for relieving poverty, improving human welfare, and raising living standards.
However, energy is only a tool for bigger purposes. The main goals are good health, high
living standards, a sustainable economy and a clean environment. Any type of energy,
whether it be coal, solar, nuclear, wind or any other, is in itself not necessarily good or bad;
each is only valued insofar as it can achieve these aims (IAEA, et al. 2005, 1).
However, current energy supply and consumption, based on limited resources of fossil fuels,
is considered to be environmentally unsustainable. On the other hand, there is no kind of
energy production or conversion technology which is completely without risk or waste. In
energy chains, which start with resource extraction and end with the provision of energy
services, pollution, emission and disposal often have severe health consequences and evident
negative environmental impacts as well. Any technology might not producing harmful
substances at the point of use, but emissions and wastes are always associated with its
manufacture and other stages of the life cycle. Among all kinds of energy, the burning of
fossil fuels is chiefly responsible for urban air pollution, regional acidification, and the risk of
human-induced climate change. (IAEA, et al. 2005, 1). The judicious use of resources,
technology, appropriate economic incentives and strategic policy planning at the local and
national levels are requisites for achieving sustainable economic development on a global
scale. Also, it needs regular monitoring of the impacts of selected policies and strategies to
observe whether they are furthering sustainable development or should be adjusted.
Considering that, the importance of being able to measure a country’s state of development
and to monitor its progress or lack of progress towards sustainability will be revealed (IAEA,
et al. 2005, 1-2).
In its assessment of the main policy challenges facing the movement toward more sustainable
energy sources, the UNESC notes that the governments are responsible for such actions;
therefore, governments are best placed to remove policy tensions. These tensions exist where
a careful balance must be pursued to achieve an optimum outcome in terms of economic and
social development in the face of potential negative externalities, such as environmental
consequences due to energy production and use (APEC Energy Working Group 2002).
Government action is essential to orient market forces on the path toward environmentally
sound solutions. Still, while accepting that the basic responsibility for sustainable energy
policy rests with governments, a participating approach including all stakeholders is desirable

29
to facilitate progress (APEC Energy Working Group 2002) The UN Economic and Social
Council (UN ESC) summarises that the underlying principles guiding the approach to energy
for sustainable development:
are embodied in an approach that seeks to promote the efficient production and
use of energy, wider-scale use of renewable sources, and transition to the next
generation of fossil fuel and nuclear energy technologies. The international
community can facilitate the movement from the present energy system to a more
sustainable development one by supporting capacity building, technology transfer
and investments in developing countries (UN 2001).
There are seven main challenges that are as follows:
1. Improvement of the accessibility of energy;
2. Improvement of energy efficiency;
3. Increase in the use of renewable energy sources;
4. Introducing advanced fossil-fuel technologies;
5. Improvement of nuclear energy technologies;
6. Improvement of the rural energy situation; and
7. Improvement of energy efficiency and the minimization of emissions in
transportation (APEC Energy Working Group 2002).
3.3. Sustainable Development Indicators Sustainable development basically refers to the common goal of governments, non-
governmental organizations, and companies to focus on the well-being of people, the planet,
and profits. Government leaders are acknowledging and facilitating the design and
application of sustainable development indicators for national governments and the world at
large. Some nongovernmental organizations have also independently organized multi-
stakeholder collaborative initiatives to create and maintain highly useful metrics
methodologies, scientific databases, research reports, and a variety of informative calculator
applications. Corporations, as well, are supporting the development of global and national
sustainable development indicators and measurement systems, as they too see the need for
30
policymakers and business leaders alike to progress from ignorance to knowledge and to
supply their organizations with the macro-level intelligence that will inevitably affect their
businesses (Wirtenberg, Russell and Lipsky 2008).
In 1992 the United Nations Conference on Environment and Development acknowledged the
indispensable role that indicators could play in helping countries make well-versed decisions
concerning sustainable development. The Commission on Sustainable Development (CSD)
approved its Work Programme on Indicators of Sustainable Development in 1995 at the
international level. Over the period from 1994 till 2001, the first two sets of CSD Indicators
of Sustainable Development were developed. These indicators have been tested, applied, and
used in many countries around the world as the basic elements of the development of national
indicators for sustainable development (United Nations 2007, 3).
The third edition of CSD indicators has been revised in order to respond to the decisions
taken by the CSD and the World Summit on Sustainable Development in 2002. This summit
was an encouragement for further work on indicators at the country level in line with national
conditions and priorities and invited the international community to support efforts of
developing countries in this regard (United Nations 2007, 3). This effort works for better
facilitation of national policymaking and performance measurements. The revised version has
a framework which addresses future risks, correlation between themes, sustainability ends,
and basic social needs (UNDESA 2001).
However, at one point, the UN ISD package contained more than 130 indicators. The last
version of the package includes 58 indicators categorized into four dimensions, 15 themes
and 38 sub-themes. When it became apparent that a vast set of indicators was unmanageable
and hard to use effectively, the number of indicators was restricted (IAEA, et al. 2005, 5).
3.3.1. Energy Indicators and Sustainable Development (EISD) The primitive work on energy indicators undertaken by the International Atomic Energy
Agency (IAEA) in with cooperation of UNDESA, the International Energy Agency(IEA) and
other international and national organizations was presented at the ninth session of the
Commission on Sustainable Development (CSD-9) in 2001 under the title “Indicators for
Sustainable Development” (ISED). Energy was a principal theme during this session. The
most vital issues identified at CSD9 were improving affordability of and accessibility to
31
modern energy services for the rural and urban poor, along with promoting less wasteful use
of energy sources by the rich. The distribution of information on clean and efficient
technologies, good practices, and adequate policies was identified as an essential contribution
to providing energy for sustainable development. The international community noted that
related information could guide decision makers to appropriate policy and energy supply
options, and that energy indicators were tools for monitoring the consequences of such choice
(IAEA, et al. 2005, 6).
The core set of energy indicators in use today, called Energy Indicators for Sustainable
Development (EISD), has been designed to provide information on current energy-related
trends in a framework that helps decision-making at the national level. It would give
countries the ability to assess effective energy policies for actions promoted at the World
Summit on Sustainable Development (WSSD), namely;
1. To integrate energy into socio-economic programmes;
2. To combine more renewable energy, energy efficiency and advanced energy
technologies to meet the growing need for energy services;
3. To increase the share of renewable energy options;
4. To reduce the flaring and venting of gas;
5. To establish domestic programmes on energy efficiency;
6. To improve the functioning and transparency of information in energy markets;
7. To reduce market distortions; and
8. To assist developing countries in their domestic efforts to provide energy services to
all sectors of their populations.
Moreover, the indicators should make it easier to identify which programmes are required for
sustainable development. It requires energy statistics to be collected besides the scope of
regional and national databases (IAEA, et al. 2005, 6).
3.3.2. Indicators for Assessing the Sustainable Production and Use of all Forms of
Bioenergy (GBEP)
On 24 May 2011, The Global Bioenergy Partnership (GBEP) approved a set of 24 voluntary,
science-based indicators for evaluating the sustainable production and use of all forms of
32
bioenergy. This agreement denotes the first global and government-level consensus for such
indicators (FAO 2011). . The Global Bioenergy Partnership was launched in January 2007 in
response to the July 2005 Gleneagles Plan of Action of the G8 +5 (Brazil, China, India,
Mexico and South Africa), which called for "a Global Bioenergy Partnership to support
wider, cost effective, biomass and biofuels deployment, particularly in developing countries
where biomass use is prevalent." Its partners at the moment consist of 23 national
governments and 13 international organizations, as well as 22 governments and nine
international organizations as observers (FAO, GBEP Sustainability Indicators for Bioenergy
2011).
The main aim of sustainability indicators for bioenergy is to assist countries in assessing and
developing national, sustainable forms of bioenergy production and use, dependant on
multilateral trade obligations. These indicators embody all three sustainability pillars
(economic, environmental and social)) and explicitly include provisions on: greenhouse gas
(GHG) emissions; biological diversity; the price and supply of a national food basket; access
to energy; economic development; land tenure; female and child labor; and energy security.
In addition, the indicators represent features by which the sustainability of biofuels
production and use can be measured, which are not rigid in terms of policy and are not legally
mandatory (FAO, GBEP Sustainability Indicators for Bioenergy 2011).
Moreover, the Partnership has approved the launch of a capacity-building initiative to
promote the optimum use of modern bioenergy for sustainable development
The table below shows the summary of the 24 indicators for the three pillars:
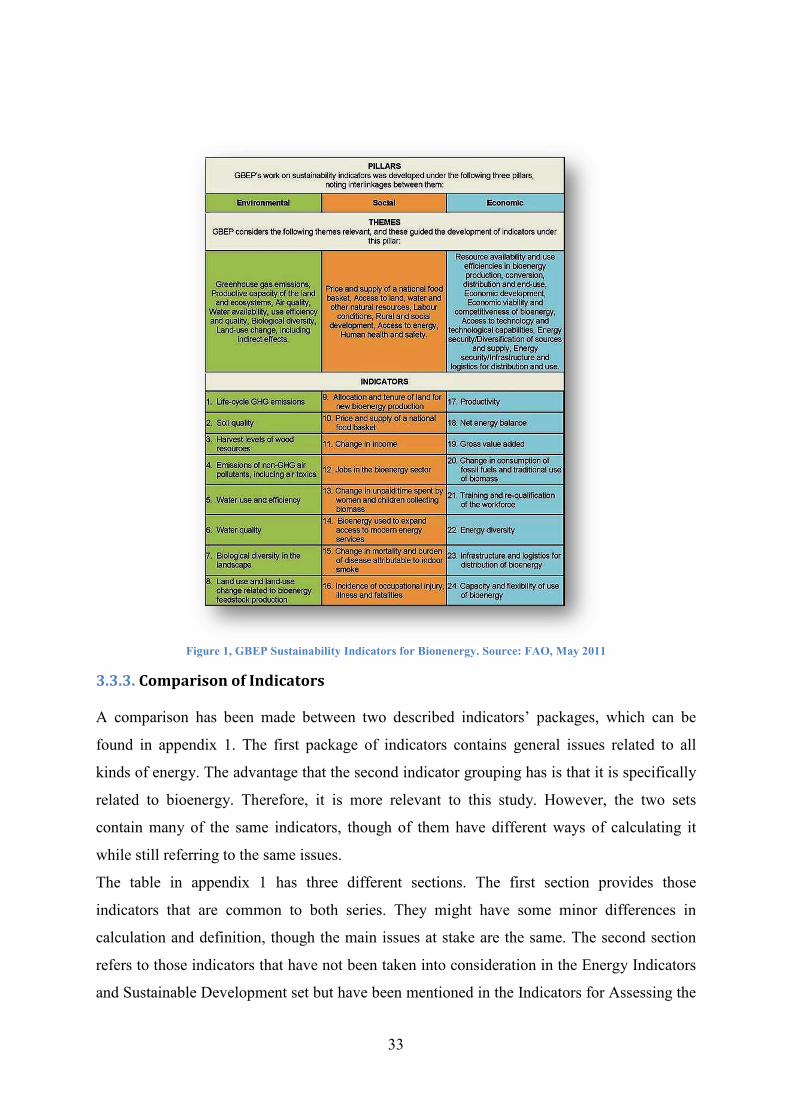
33
Figure 1, GBEP Sustainability Indicators for Bionenergy. Source: FAO, May 2011
3.3.3. Comparison of Indicators A comparison has been made between two described indicators’ packages, which can be
found in appendix 1. The first package of indicators contains general issues related to all
kinds of energy. The advantage that the second indicator grouping has is that it is specifically
related to bioenergy. Therefore, it is more relevant to this study. However, the two sets
contain many of the same indicators, though of them have different ways of calculating it
while still referring to the same issues.
The table in appendix 1 has three different sections. The first section provides those
indicators that are common to both series. They might have some minor differences in
calculation and definition, though the main issues at stake are the same. The second section
refers to those indicators that have not been taken into consideration in the Energy Indicators
and Sustainable Development set but have been mentioned in the Indicators for Assessing the
34
Sustainable Production and Use of all Forms of Bioenergy. The third section is those that
cannot be found in this set but have been included by the EISD. At the end, there are a few
indicators that are not related to the topic of this study but exist in EISD’s indicators and will
not be discussed in this study.
35
4. India as a Case Study
4.1. Introduction
In addition to the fact that India is a populous country, its economy has had a growth rate of
about 9 percent over the past few years. Due to this high growth rate, energy demand is also
growing rapidly to meet this high economic growth rate (Ravindranath, Sita Lakshmi, et al.
2010) . It is expected that the energy demand in India will be twice what it is now by 2030,
with transportation energy demands making up the fastest rate of growth (WEO 2007).
During 2007, India’s crude oil consumption was some 156 million tons, 77 percent of which
was imported. This statistic simply indicates the high dependency of India on oil imports
(Minisrty of Petroluem and Natural Gas 2007). The imports of oil in India are estimated to
rise to 6 million barrels per day by 2030, which would make India the third largest importer
of oil (IEA, World Energy Outlook 2007). Half of the demand of oil in India belongs to the
transportation sector and the country currently imports around three quarters of the oil it uses
for consumption (IIASA, et al. 2009, 53).
Due to volatile oil prices and uncertainty concerning the sustainability of oil supplies, India
has been searching for alternatives, petroleum products in particular, in order to promote
energy security. Biofuel is one of the most promising options (Ravindranath, Sita Lakshmi, et
al. 2010) since biofuels are renewable liquid fuels coming from biological raw material and
can be good substitutes for oil in the transportation sector. Moreover, ethanol and biodiesel
are promising for solving problems such as environmental degradation, energy security,
restricting imports, rural employment and agricultural economy (Planning Commission,
Government of India 2003, 1).
According to the Planning commission (Planning Commission, Government of India 2003,
2), the rationale of using biofuels for transportation in India can be described as follows:
• ethanol and biodiesel being superior fuels from an environmental point of view;
• use of biofuels becoming compelling in view of the tightening of automotive vehicle
emission standards and court interventions;
• the need to provide energy security, especially for rural areas;
36
• the need to create employment, especially for the rural poor living in areas having a
high incidence of land degradation;
• providing nutrients tothe soil, checking soil erosion, and thus preventing land
degradation;
• addressing global concerns relating to the containment of Carbon emissions;
• reducing dependence on oil imports;
• usability of biofuels in present engines without requiring any major
modifications;
• the production of biofuels utilizing presently under-utilised resources of land and of
molasses and, in the process, generating massive employment for the poor;
• the use of biofuels not requiring major or time-consuming studies or research; and
• the programme of production of biofuels in the country is feasible, is
environmentally desirable, and is less injurious to health and would address a
variety of concerns.
India has large areas of arable land as well as good climate conditions (tropical) with a decent
amount of rainfall in large parts of the areas in querstion to account for large biomass
production annually. Therefore, the country has good potential for biomass production, which
can then be processed into biofuels and used as substitutes for transportation fuels (Planning
Commission, Government of India 2003, 6).
In India ethanol is produced through the fermentation of molasses, which is one of the by-
products of sugar manufacture. India is the fourth biggest ethanol producer. The first three
countries are as follows; Brazil, the United States and China (Gonsalves 2006). India is a
large producer due to its four million hectares of irrigated, cultivated land. Approximately
1.2-1.8 million tons per year are used for ethanol (IIASA, et al. 2009, 53). As a matter of the
fact, India is now the world’s largest sugar consumer, which puts added pressure on the
ethanol industry (Gonsalves 2006).
Commercial production of biodiesel in India is not significant. Since the prices of vegetable
oil are high in the domestic market, it is not economically feasible to produce biodiesel
(IIASA, et al. 2009, 54). Based on the fact that the demand for edible oil is higher than its
domestic production, therefore, there is no possibility of diverting this oil for production of
bio-diesel (Planning Commission, Government of India 2003, 6). However, the strategy of
biodiesel production here is based on non-edible oils (mainly jatropha), as this would not
compete with food sources (IIASA, et al. 2009, 54). Good incentives for doing so is that there
are large areas of degraded forest land and unutilised public land, field boundaries, and fallow
lands of farmers where non-edible oil can be grown (Planning Commission, Government of
India 2003, 6). Jatrophacarcus, based on certain reasons, has been found to be the most

37
suitable species. It will use those lands that are mainly unproductive and are located in
poverty-stricken areas and degraded forests. The plantations would be within farmers’ field
boundaries, fallow lands, and on public lands such as along railways, roads and irrigation
canals (Planning Commission, Government of India 2003, 6).
On the other hand, India is a country with a large growing population, especially in rural
areas, which depends on agriculture, grazing land, and water resources for food production
and livelihoods. The population density is high, almost 350 persons per sq.km, which is a
limitation on land availability for food and fuel production. Therefore, it is essential to assess
the potential environmental and socio-economic implications of biofuel production plans
especially on net GHG benefits from land conversion, land available for food production,
water requirements, and biodiversity (Ravindranath, Sita Lakshmi, et al. 2010).
However, despite the advantages mentioned, it is necessary to be cautious about the adverse
impacts of biofuel production on the economy, society and environment. These effects might
even be barriers for sustainable development rather than being a path toward it. Some of the
main concerns have been discussed in the first chapter. Moreover, the previous chapter tried
to present a series of indicators that could contribute to feasible evaluationsTo continue, this
study will review India’s biofuel production program separately for ethanol and biodiesel.
The next stage will be examining the effect of biofuel production in India on sustainable
development based on the combination of indicators that have been discussed in the
preceding chapter.
4.2. Ethanol
In order to study ethanol production in India, this section is divided into two different parts.
The first part will be a review of the planning of the government and the targets they have set.
This section will review the expectation of the government from ethanol production in
different aspects. Later on, there will be a study on the effects of implementing these
policies. It will examine the advantages or disadvantages of ethanol impacts on different
economic, environmental and social dimensions based on the indicators that were discussed
in the previous chapter.
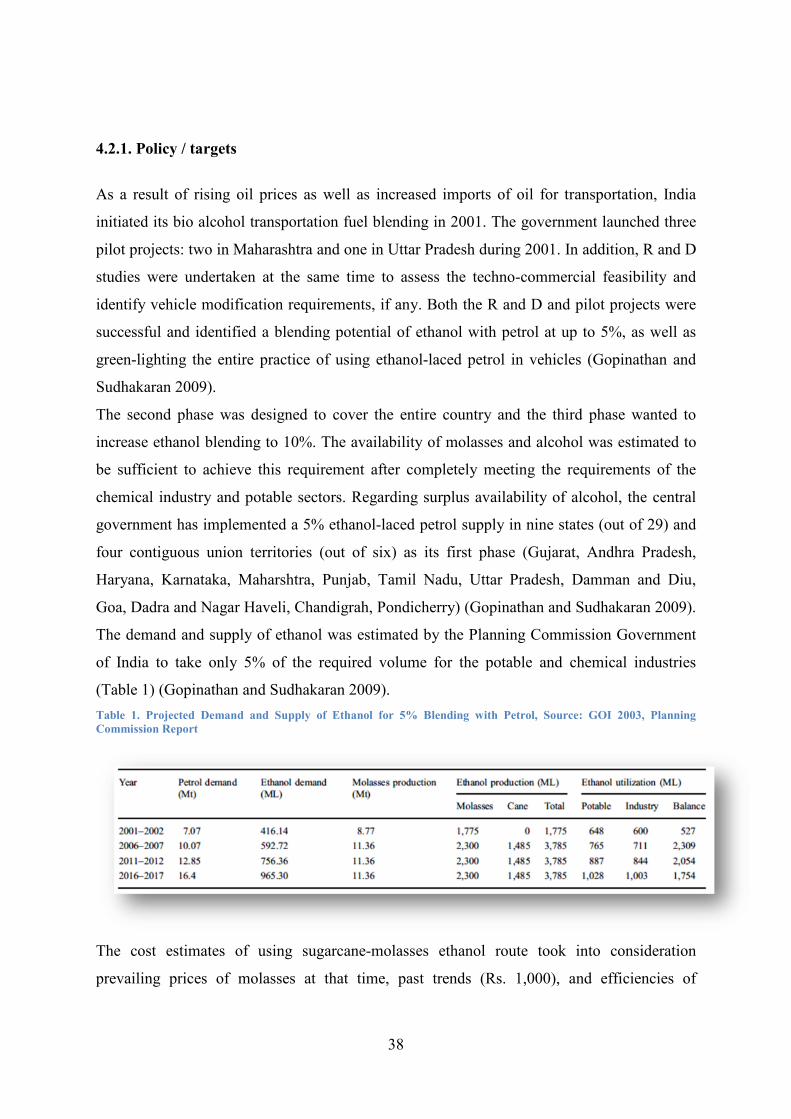
38
4.2.1. Policy / targets
As a result of rising oil prices as well as increased imports of oil for transportation, India
initiated its bio alcohol transportation fuel blending in 2001. The government launched three
pilot projects: two in Maharashtra and one in Uttar Pradesh during 2001. In addition, R and D
studies were undertaken at the same time to assess the techno-commercial feasibility and
identify vehicle modification requirements, if any. Both the R and D and pilot projects were
successful and identified a blending potential of ethanol with petrol at up to 5%, as well as
green-lighting the entire practice of using ethanol-laced petrol in vehicles (Gopinathan and
Sudhakaran 2009).
The second phase was designed to cover the entire country and the third phase wanted to
increase ethanol blending to 10%. The availability of molasses and alcohol was estimated to
be sufficient to achieve this requirement after completely meeting the requirements of the
chemical industry and potable sectors. Regarding surplus availability of alcohol, the central
government has implemented a 5% ethanol-laced petrol supply in nine states (out of 29) and
four contiguous union territories (out of six) as its first phase (Gujarat, Andhra Pradesh,
Haryana, Karnataka, Maharshtra, Punjab, Tamil Nadu, Uttar Pradesh, Damman and Diu,
Goa, Dadra and Nagar Haveli, Chandigrah, Pondicherry) (Gopinathan and Sudhakaran 2009).
The demand and supply of ethanol was estimated by the Planning Commission Government
of India to take only 5% of the required volume for the potable and chemical industries
(Table 1) (Gopinathan and Sudhakaran 2009).
Table 1. Projected Demand and Supply of Ethanol for 5% Blending with Petrol, Source: GOI 2003, Planning
Commission Report
The cost estimates of using sugarcane-molasses ethanol route took into consideration
prevailing prices of molasses at that time, past trends (Rs. 1,000), and efficiencies of
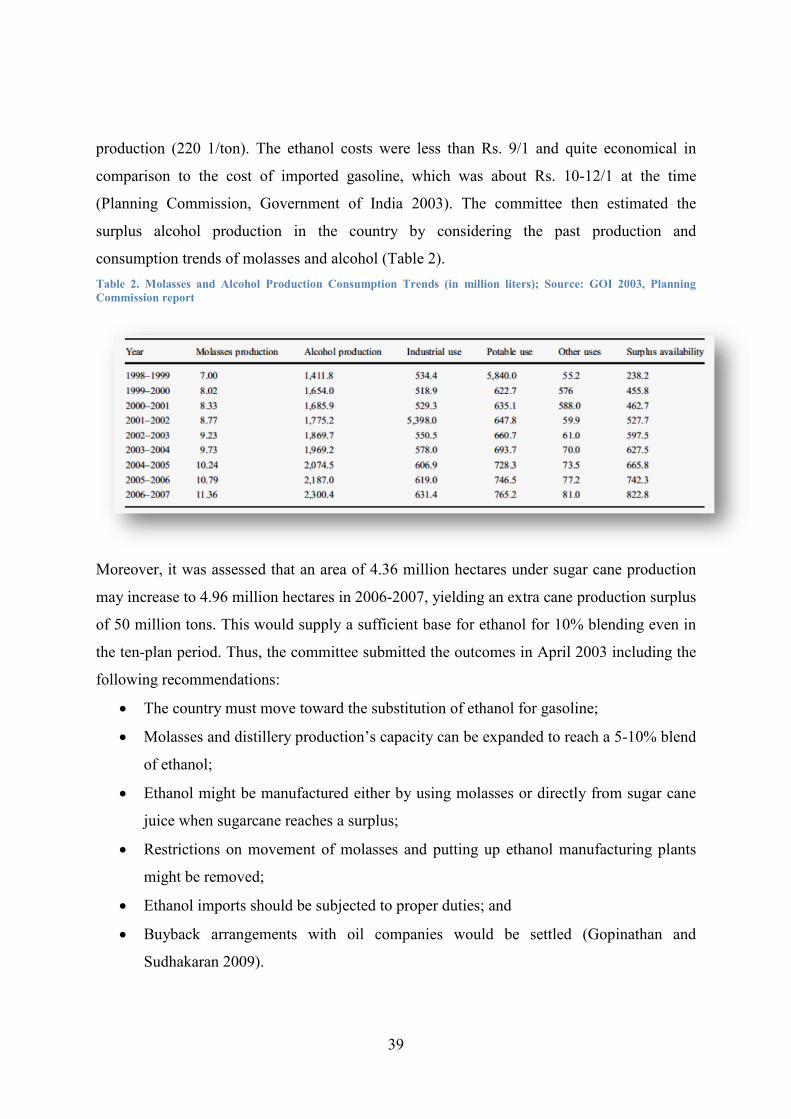
39
production (220 1/ton). The ethanol costs were less than Rs. 9/1 and quite economical in
comparison to the cost of imported gasoline, which was about Rs. 10-12/1 at the time
(Planning Commission, Government of India 2003). The committee then estimated the
surplus alcohol production in the country by considering the past production and
consumption trends of molasses and alcohol (Table 2).
Table 2. Molasses and Alcohol Production Consumption Trends (in million liters); Source: GOI 2003, Planning
Commission report
Moreover, it was assessed that an area of 4.36 million hectares under sugar cane production
may increase to 4.96 million hectares in 2006-2007, yielding an extra cane production surplus
of 50 million tons. This would supply a sufficient base for ethanol for 10% blending even in
the ten-plan period. Thus, the committee submitted the outcomes in April 2003 including the
following recommendations:
• The country must move toward the substitution of ethanol for gasoline;
• Molasses and distillery production’s capacity can be expanded to reach a 5-10% blend
of ethanol;
• Ethanol might be manufactured either by using molasses or directly from sugar cane
juice when sugarcane reaches a surplus;
• Restrictions on movement of molasses and putting up ethanol manufacturing plants
might be removed;
• Ethanol imports should be subjected to proper duties; and
• Buyback arrangements with oil companies would be settled (Gopinathan and
Sudhakaran 2009).
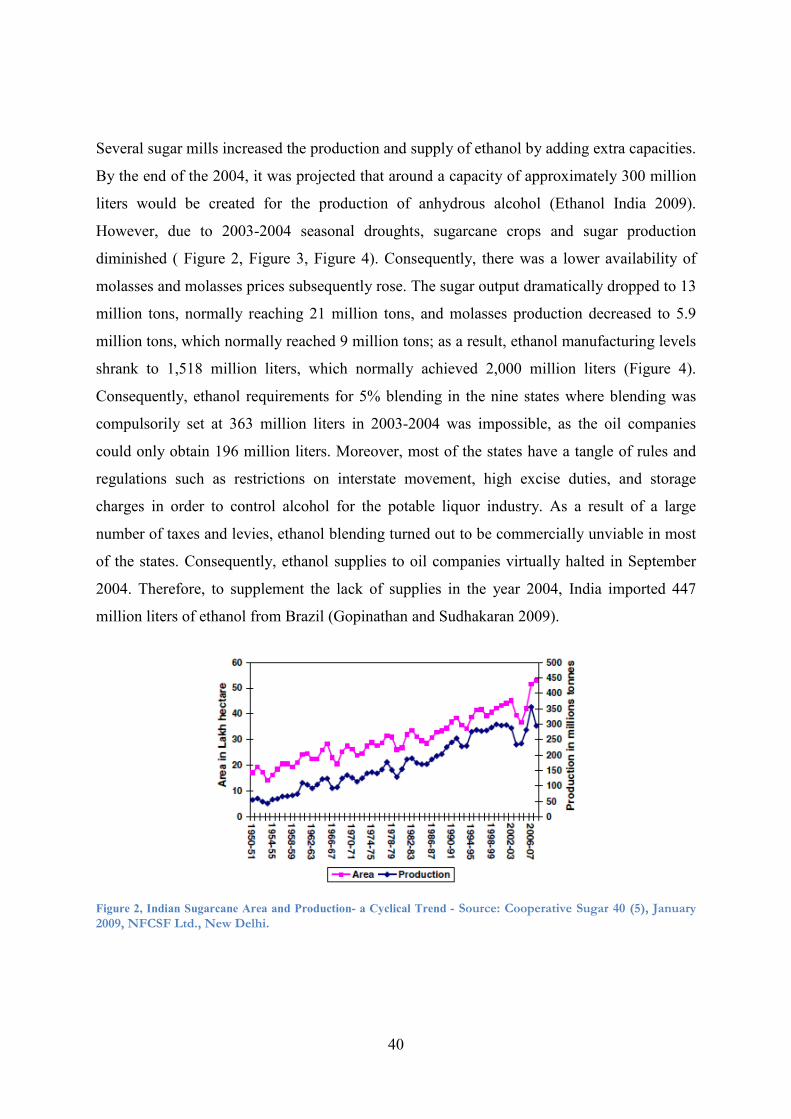
40
Several sugar mills increased the production and supply of ethanol by adding extra capacities.
By the end of the 2004, it was projected that around a capacity of approximately 300 million
liters would be created for the production of anhydrous alcohol (Ethanol India 2009).
However, due to 2003-2004 seasonal droughts, sugarcane crops and sugar production
diminished ( Figure 2, Figure 3, Figure 4). Consequently, there was a lower availability of
molasses and molasses prices subsequently rose. The sugar output dramatically dropped to 13
million tons, normally reaching 21 million tons, and molasses production decreased to 5.9
million tons, which normally reached 9 million tons; as a result, ethanol manufacturing levels
shrank to 1,518 million liters, which normally achieved 2,000 million liters (Figure 4).
Consequently, ethanol requirements for 5% blending in the nine states where blending was
compulsorily set at 363 million liters in 2003-2004 was impossible, as the oil companies
could only obtain 196 million liters. Moreover, most of the states have a tangle of rules and
regulations such as restrictions on interstate movement, high excise duties, and storage
charges in order to control alcohol for the potable liquor industry. As a result of a large
number of taxes and levies, ethanol blending turned out to be commercially unviable in most
of the states. Consequently, ethanol supplies to oil companies virtually halted in September
2004. Therefore, to supplement the lack of supplies in the year 2004, India imported 447
million liters of ethanol from Brazil (Gopinathan and Sudhakaran 2009).
Figure 2, Indian Sugarcane Area and Production- a Cyclical Trend - Source: Cooperative Sugar 40 (5), January 2009, NFCSF Ltd., New Delhi.
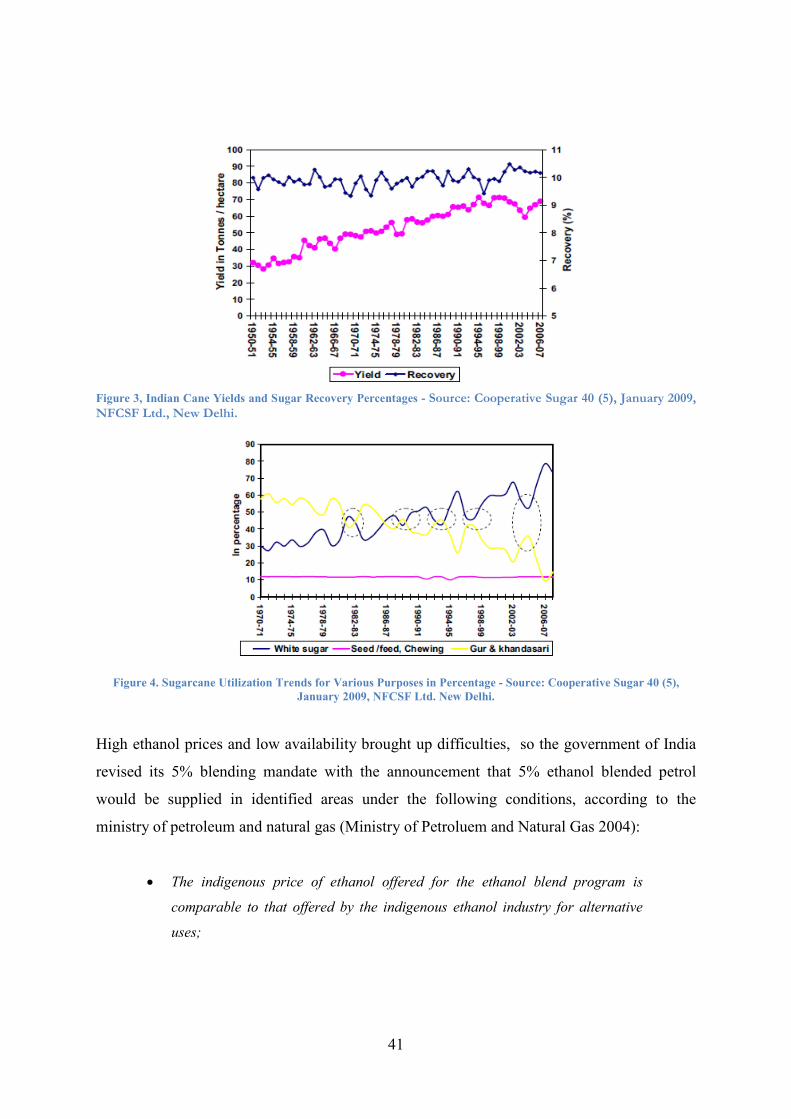
41
Figure 3, Indian Cane Yields and Sugar Recovery Percentages - Source: Cooperative Sugar 40 (5), January 2009, NFCSF Ltd., New Delhi.
Figure 4. Sugarcane Utilization Trends for Various Purposes in Percentage - Source: Cooperative Sugar 40 (5),
January 2009, NFCSF Ltd. New Delhi.
High ethanol prices and low availability brought up difficulties, so the government of India
revised its 5% blending mandate with the announcement that 5% ethanol blended petrol
would be supplied in identified areas under the following conditions, according to the
ministry of petroleum and natural gas (Ministry of Petroluem and Natural Gas 2004):
• The indigenous price of ethanol offered for the ethanol blend program is
comparable to that offered by the indigenous ethanol industry for alternative
uses;

42
• The indigenous delivery price of ethanol offered for the ethanol-blended petrol
program at a particular location is comparable to the import parity price of
petrol at that location; and
• There is an adequate supply of ethanol
In order to develop an integrated energy policy to deal with all aspects and forms of energy, a
new government expert committee was commissioned. The new reporting on molasses
scarcity differed from the previous committee on the potential of sugarcane ethanol for India.
The relative virtues of sugarcane ethanol and alternative technologies for ethanol development
are still under debate. Furthermore, it raised some other issues such as water scarcity, the lack
of sufficient arable areas for sugarcane, and a discussion about the availability of molasses-
based alcohols from the sugar industry, which is not expected to grow notably in the coming
years (Gopinathan and Sudhakaran 2009). Therefore, the committee made the some major
recommendations which are as follows (Government of India, Planning Commission 2006):
• Set import tariffs on alcohol independent of use and at a level no greater than that
for petroleum products.
• Do not mandate blending of ethanol with petrol and prices of ethanol at its
economic value vis-à-vis petrol.
• To encourage alternate routes to ethanol, such production may be procured at the
full trade parity price of petrol for 5-7 years instead of being purchased at its true
economic value based on calorific content duly adjusted for improved efficiency;
and
• Create incentives for cellulosic ethanol with investment credits.
The powerful monsoon in the year 2005-2006 increased sugarcane production, the viability
of molasses, and also led to rising prices of petroleum, creating renewed interest in the
ethanol program. In August 2005, due to government negotiations and agreements between
the sugar industry and oil marketing companies, the ethanol program restarted in a limited
number of designated states and union territories. In September 2006, the government of
India announced the second phase of the Ethanol Blending Program (EBP) as a result of the
strength of sugar production in that period. This program mandates 5% blending of ethanol
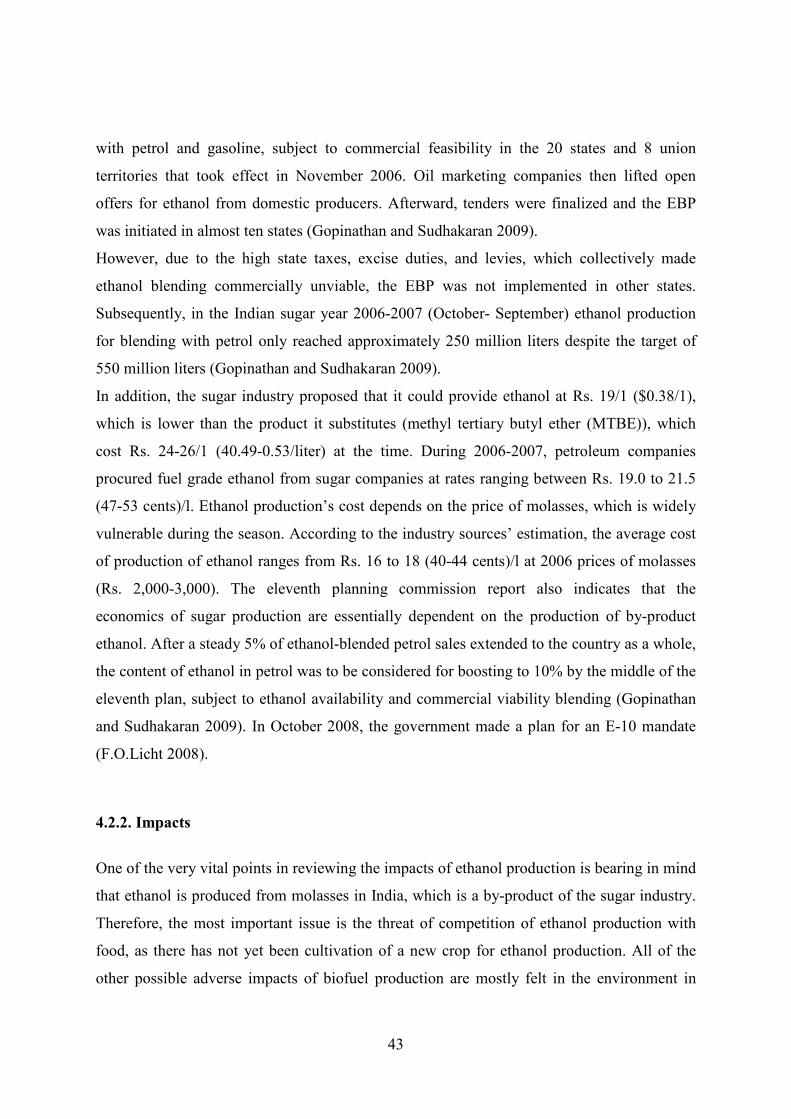
43
with petrol and gasoline, subject to commercial feasibility in the 20 states and 8 union
territories that took effect in November 2006. Oil marketing companies then lifted open
offers for ethanol from domestic producers. Afterward, tenders were finalized and the EBP
was initiated in almost ten states (Gopinathan and Sudhakaran 2009).
However, due to the high state taxes, excise duties, and levies, which collectively made
ethanol blending commercially unviable, the EBP was not implemented in other states.
Subsequently, in the Indian sugar year 2006-2007 (October- September) ethanol production
for blending with petrol only reached approximately 250 million liters despite the target of
550 million liters (Gopinathan and Sudhakaran 2009).
In addition, the sugar industry proposed that it could provide ethanol at Rs. 19/1 ($0.38/1),
which is lower than the product it substitutes (methyl tertiary butyl ether (MTBE)), which
cost Rs. 24-26/1 (40.49-0.53/liter) at the time. During 2006-2007, petroleum companies
procured fuel grade ethanol from sugar companies at rates ranging between Rs. 19.0 to 21.5
(47-53 cents)/l. Ethanol production’s cost depends on the price of molasses, which is widely
vulnerable during the season. According to the industry sources’ estimation, the average cost
of production of ethanol ranges from Rs. 16 to 18 (40-44 cents)/l at 2006 prices of molasses
(Rs. 2,000-3,000). The eleventh planning commission report also indicates that the
economics of sugar production are essentially dependent on the production of by-product
ethanol. After a steady 5% of ethanol-blended petrol sales extended to the country as a whole,
the content of ethanol in petrol was to be considered for boosting to 10% by the middle of the
eleventh plan, subject to ethanol availability and commercial viability blending (Gopinathan
and Sudhakaran 2009). In October 2008, the government made a plan for an E-10 mandate
(F.O.Licht 2008).
4.2.2. Impacts
One of the very vital points in reviewing the impacts of ethanol production is bearing in mind
that ethanol is produced from molasses in India, which is a by-product of the sugar industry.
Therefore, the most important issue is the threat of competition of ethanol production with
food, as there has not yet been cultivation of a new crop for ethanol production. All of the
other possible adverse impacts of biofuel production are mostly felt in the environment in
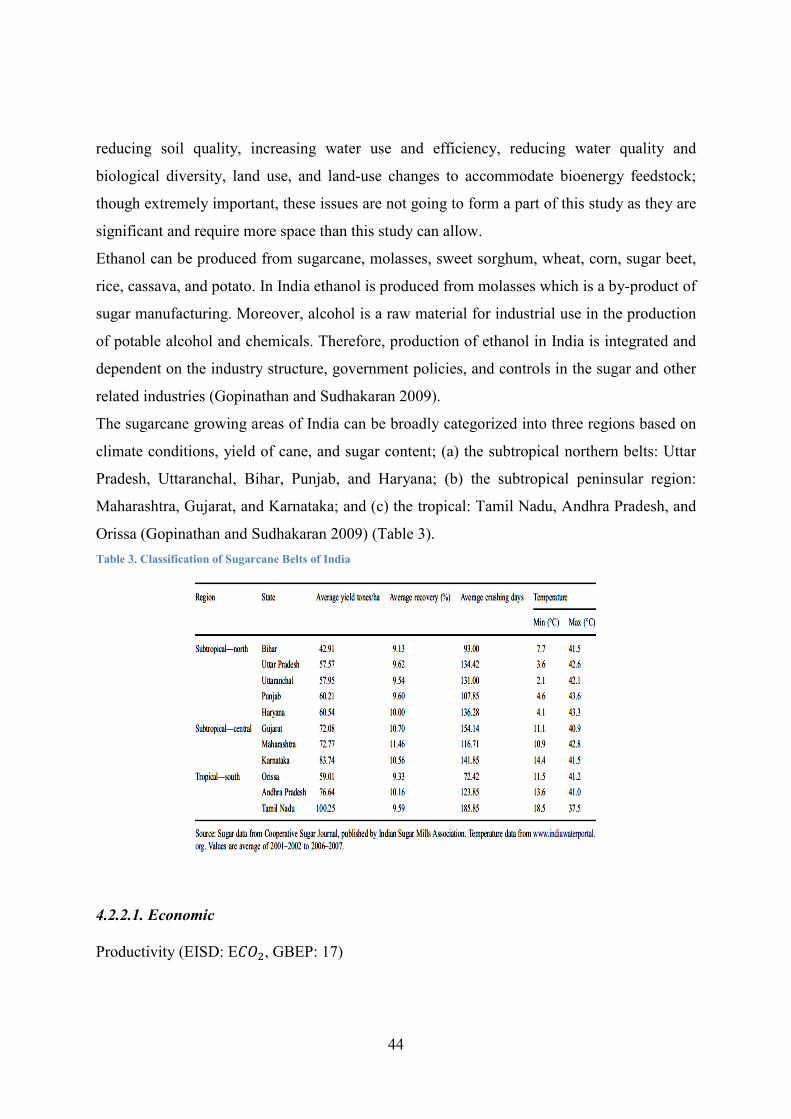
44
reducing soil quality, increasing water use and efficiency, reducing water quality and
biological diversity, land use, and land-use changes to accommodate bioenergy feedstock;
though extremely important, these issues are not going to form a part of this study as they are
significant and require more space than this study can allow.
Ethanol can be produced from sugarcane, molasses, sweet sorghum, wheat, corn, sugar beet,
rice, cassava, and potato. In India ethanol is produced from molasses which is a by-product of
sugar manufacturing. Moreover, alcohol is a raw material for industrial use in the production
of potable alcohol and chemicals. Therefore, production of ethanol in India is integrated and
dependent on the industry structure, government policies, and controls in the sugar and other
related industries (Gopinathan and Sudhakaran 2009).
The sugarcane growing areas of India can be broadly categorized into three regions based on
climate conditions, yield of cane, and sugar content; (a) the subtropical northern belts: Uttar
Pradesh, Uttaranchal, Bihar, Punjab, and Haryana; (b) the subtropical peninsular region:
Maharashtra, Gujarat, and Karnataka; and (c) the tropical: Tamil Nadu, Andhra Pradesh, and
Orissa (Gopinathan and Sudhakaran 2009) (Table 3).
Table 3. Classification of Sugarcane Belts of India
4.2.2.1. Economic
Productivity (EISD: E���, GBEP: 17)
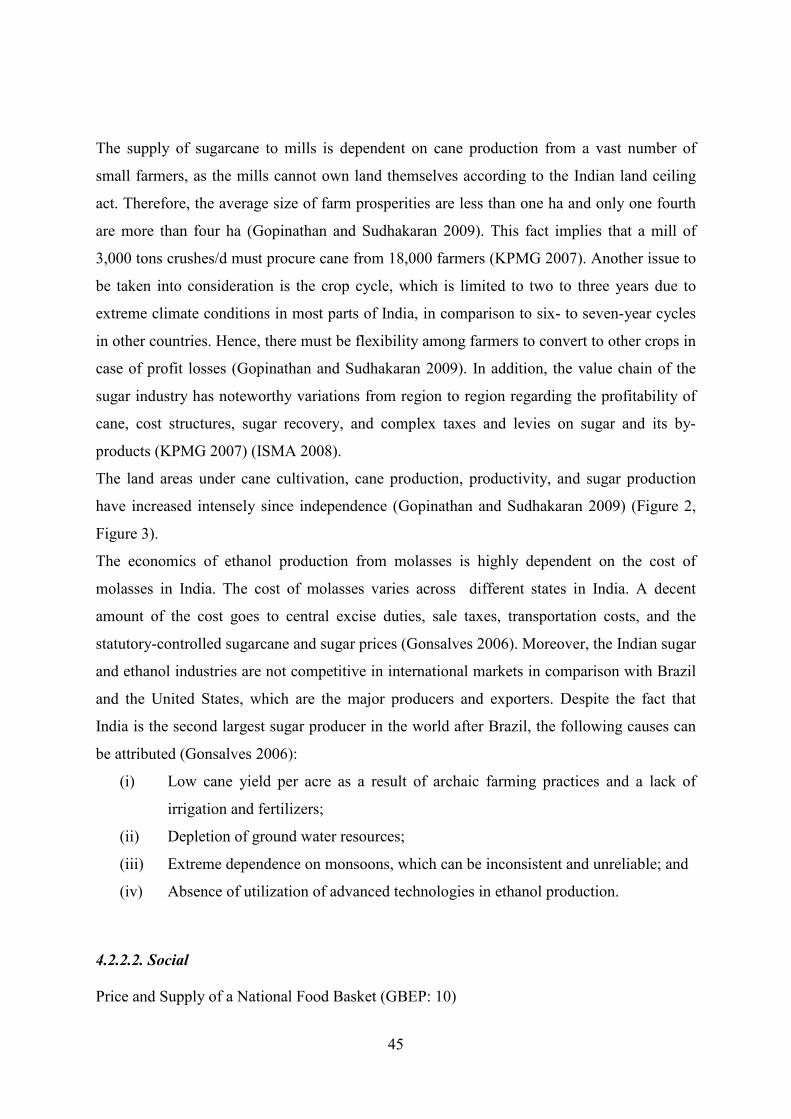
45
The supply of sugarcane to mills is dependent on cane production from a vast number of
small farmers, as the mills cannot own land themselves according to the Indian land ceiling
act. Therefore, the average size of farm prosperities are less than one ha and only one fourth
are more than four ha (Gopinathan and Sudhakaran 2009). This fact implies that a mill of
3,000 tons crushes/d must procure cane from 18,000 farmers (KPMG 2007). Another issue to
be taken into consideration is the crop cycle, which is limited to two to three years due to
extreme climate conditions in most parts of India, in comparison to six- to seven-year cycles
in other countries. Hence, there must be flexibility among farmers to convert to other crops in
case of profit losses (Gopinathan and Sudhakaran 2009). In addition, the value chain of the
sugar industry has noteworthy variations from region to region regarding the profitability of
cane, cost structures, sugar recovery, and complex taxes and levies on sugar and its by-
products (KPMG 2007) (ISMA 2008).
The land areas under cane cultivation, cane production, productivity, and sugar production
have increased intensely since independence (Gopinathan and Sudhakaran 2009) (Figure 2,
Figure 3).
The economics of ethanol production from molasses is highly dependent on the cost of
molasses in India. The cost of molasses varies across different states in India. A decent
amount of the cost goes to central excise duties, sale taxes, transportation costs, and the
statutory-controlled sugarcane and sugar prices (Gonsalves 2006). Moreover, the Indian sugar
and ethanol industries are not competitive in international markets in comparison with Brazil
and the United States, which are the major producers and exporters. Despite the fact that
India is the second largest sugar producer in the world after Brazil, the following causes can
be attributed (Gonsalves 2006):
(i) Low cane yield per acre as a result of archaic farming practices and a lack of
irrigation and fertilizers;
(ii) Depletion of ground water resources;
(iii) Extreme dependence on monsoons, which can be inconsistent and unreliable; and
(iv) Absence of utilization of advanced technologies in ethanol production.
4.2.2.2. Social
Price and Supply of a National Food Basket (GBEP: 10)
46
Biofuel production is expected to have direct and indirect impacts on food security, with
more land in developing countries being converted to biofuel production as a result of the
lower costs of production, especially for labor (Worldwatch 2007). Several studies argue that
the growing demand for biofuels feedstock has already contributed to increasing worldwide
food prices (FAO, FAOSTAT 2008) (Pena 2008) (Bates, et al. 2008). The rise in demand of
biofuel from 2000-2007 accounted for 30% of the rise in weighted average grain prices. The
largest influence was on maize prices, with the increased biofuel demand accounting for 39%
of the rise in prices. India could face a similar situation in the future concerning food prices
related to the growing demand for biofuels as a central target of the Indian government
(Ravindranath, Sita Lakshmi, et al. 2010). Figure 5 shows this trend. The area under food
cultivation in India has stabilized over the past two to three decades, despite constant
population growth (of 1.8% since the 1990s). Moreover, the area projected to be under food
production in 2020 is expected to be 130 to 10 Mha (Ravindranath, Sita Lakshmi, et al.
2010).
Figure 5. Trends in Area under Food Production (in million hectares) and the Food Grain Production and Demand
( in million tons) along with Population Growth for the Period 1950-1951 to 2020-2021. Source: TERI (2008)
Since biofuel production has been accused of raising the food prices specifically with regard
to sugar prices, it is worthwhile to consider the causes of sugar price fluctuations. The
production of sugarcane and sugar fluctuations have been notable over the past few years
47
(Gopinathan and Sudhakaran 2009) (Figure 2). Multiple natural factors including the
distribution of rainfall, flood and drought conditions, pests and diseases, fluctuations in prices
of gur and khandasari (traditional Indian sugar products), and changes in returns from
competing crops can be asserted. Moreover, man-made factors include government policies
concerning sugarcane prices, release mechanisms, taxes, and export and import controls.
Sugarcane prices are determined independently from sugar market prices and have been
rising each year (Gopinathan and Sudhakaran 2009).
The constant rising trends in the sugar cycle start with timely cane payments by millers,
which come from the increased profits for sugar produced and sold on the markets. This leads
to greater cane planting by farmers, boosts in cane production and factories to crush it,
increased sugar production, subsequent decline in profitability for mills, and delayed
payments to farmers. Wide disparities occur as a result of high sugarcane prices and low
sugar prices in markets. When millers are then unable to make payments on time, debts to
farmers start rising. Thus, the farmers are forced to cultivate other crops, which results in the
fall of sugar production. This cycle is intensified in a deficit situation, leading to an increased
diversion of cane production to gur and khandsari, resulting in less availability of cane for
white sugar manufacturing (Figure 4). All these factors feed again into the reduction of sugar
production, higher sugar prices, a faster turnaround of industry and timely cane payments,
and thus the vicious cycle continues (Gopinathan and Sudhakaran 2009).
Formerly, these cycles rose every four to five years (Figure 6). Recently, these deficit/surplus
gaps are becoming wider regardless of stock positions, various control regimes, and policy
interventions.
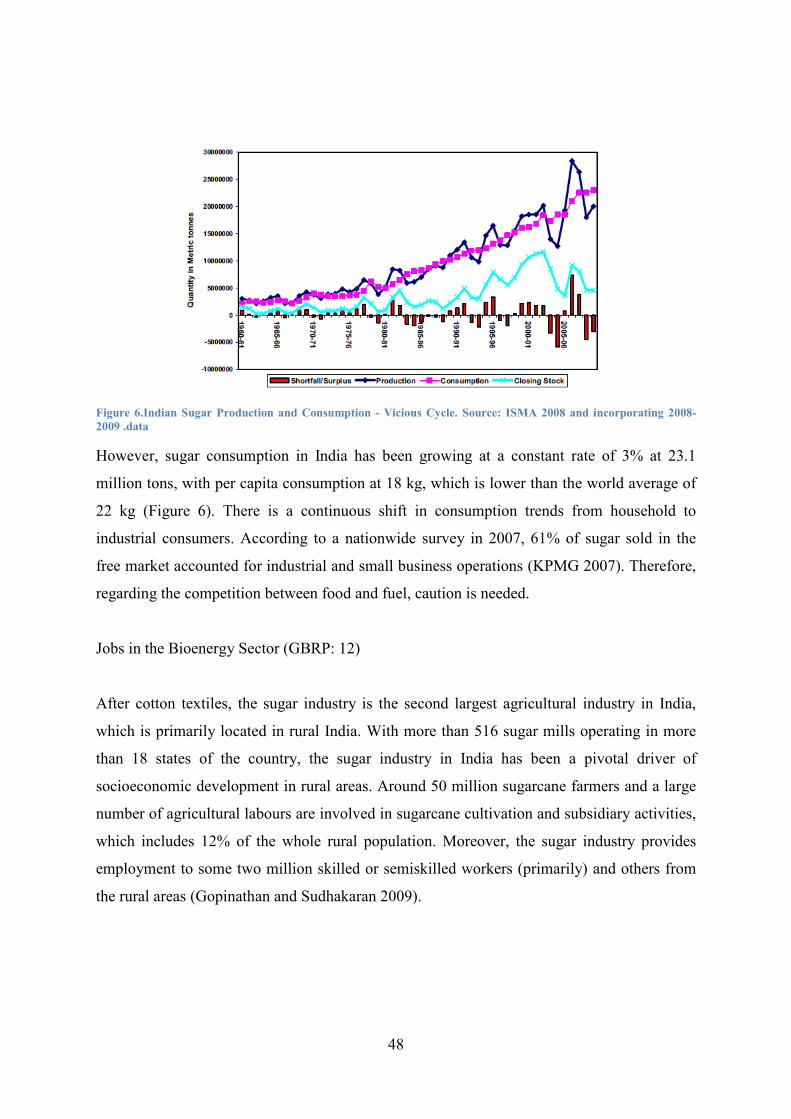
48
Figure 6.Indian Sugar Production and Consumption - Vicious Cycle. Source: ISMA 2008 and incorporating 2008-
2009 .data
However, sugar consumption in India has been growing at a constant rate of 3% at 23.1
million tons, with per capita consumption at 18 kg, which is lower than the world average of
22 kg (Figure 6). There is a continuous shift in consumption trends from household to
industrial consumers. According to a nationwide survey in 2007, 61% of sugar sold in the
free market accounted for industrial and small business operations (KPMG 2007). Therefore,
regarding the competition between food and fuel, caution is needed.
Jobs in the Bioenergy Sector (GBRP: 12)
After cotton textiles, the sugar industry is the second largest agricultural industry in India,
which is primarily located in rural India. With more than 516 sugar mills operating in more
than 18 states of the country, the sugar industry in India has been a pivotal driver of
socioeconomic development in rural areas. Around 50 million sugarcane farmers and a large
number of agricultural labours are involved in sugarcane cultivation and subsidiary activities,
which includes 12% of the whole rural population. Moreover, the sugar industry provides
employment to some two million skilled or semiskilled workers (primarily) and others from
the rural areas (Gopinathan and Sudhakaran 2009).

49
4.2.2.3. Environmental
Land Use and Land-Use Changes related to Bioenergy Feedstock Production (GBEP: 8)
Land demands for food, animal husbandry, and biofuel is increasing, which leads to
additional pressures on land and other resources. In a study by Ravindranath and Sital
Lakshmi, the calculation of the required land for first generation biofuels for 2020 is
projected by the taking the biofuel demand estimated for two scenarios and dividing them by
indicative biofuel crop yields per hectare (Ravindranath, Sita Lakshmi, et al. 2010). It is
essential to bear in mind that sugarcane in India is a vital food crop; this fact should
demonstrate the limited potential for meeting biofuel demands. At the moment, ethanol
production in India is largely based on sugar molasses. Another feasible option would be
growing sweet sorghum in marginal lands, although the yields are likely to be low
(Ravindranath, Sita Lakshmi, et al. 2010). The projected land area required for bioethanol
and biodiesel production for different crop types are demonstrated in the table below. If
sugarcane is selected for producing ethanol, then land areas required could be as low as 0.70
Mha and as high as 4.01 Mha for a 2020. If sweet sorghum is adopted, the projections would
be 4.56 and 26.28 for the low and high scenarios for 2020 (Ravindranath, Sita Lakshmi, et al.
2010).
Table 4.Land Required (Mha) for Meeting the Projected Biofuel Demand for 2020. Source: FAO (2008). Mielke
(2007), Jongschapp et al. (2007), Fresco (2006), Thow and Warhurst (2007).
Water Use and Efficiency (GBEP: 5)
In many tropical regions, particularly in India, food production is subjected to water stress
and decreasing groundwater levels. More importantly, food scarcity is highly linked to water
scarcity in most parts of developing countries (Ravindranath, Sita Lakshmi, et al. 2010).
Scarcity of water, rather than land, may prove to be a dominant limiting factor for biofuel
production in many regions. Many of the current first generation biofuel crops such as

50
sugarcane, palm oil, and maize have relatively higher water requirements (FAO, FAOSTAT
2008) (Table 5). Therefore, these crops only can be cultivated under irrigated conditions or in
regions with high rainfall to achieve high yields. Extensive cultivation of biofuel crops for
commercial purposes might end in competition for water between biofuel production and
survival food production (Pena 2008). However, in India, crops such as sweet sorghum or
maize can be grown under rain-fed conditions. Presently, sugarcane is cultivated mainly for
sugar production and it is only the molasses which is used in ethanol production. Therefore, it
does not seem that in India, competition for water for food or fuel production would be a
serious issue (Ravindranath, Sita Lakshmi, et al. 2010).
Table 5.Water Requirements for Different Biofuel Crops. Source: Wetland International Annual Review (2008).
Water Quality (EISD: ENV4; GBEP: 6)
Biofuel production on a commercial scale would require the use of nitrogenous fertilizers,
pesticides, and even herbicides, all of which result in pollution of the soil and down-stream
water bodies. Run-off nutrients, especially nitrogen and phosphorus, cause eutrophication of
water bodies, negatively influencing aquatic biodiversity. In India, however, sweet sorghum
will be grown mainly in rain-fed crop lands which are not suitable for irrigation. Therefore,
the pollution of water bodies is unlikely (Ravindranath, Sita Lakshmi, et al. 2010).
4.3. Biodiesel
4.3.1. Policy/ Targets India has a massive untouched potential of nonedible oil-bearing plant species distributed
throughout the country; 300 species of trees have been reported to produce oil-bearing seeds
(Subramanian, et al. 2005). However, in April 2003, the government of India’s biofuels
committee submitted a report on biofuels, which found that Jatrophacurcas is the most

51
suitable for biodiesel production in India based on the following advantages (Gopinathan and
Sudhakaran 2009):
(i) The estimation of oil yield per hectare for Jatropha is the highest among tree-
borne oil seeds. The average seed production is 3.75 tons/ha, with an oil content
of 30-35% and oil yield of 1,200 kg/ha estimated in comparison with 375 kg/ha
per for soybeans in the USA and 1,000 kg/ha for rapeseed in Europe;
(ii) Possibility of cultivation in area of low rainfall (200 mm/yr), low fertility, and
marginal, degraded, or fallow wastelands;
(iii) The collection, planting and growing of these trees are relatively easy, without
specific requirements;
(iv) Possible use of by-products for manure and biogas generation;
(v) Opportunity to intercrop and incorporate into existing social forestry and poverty
mitigation programs that deal with land improvement;
(vi) Conformation with clean energy fuel requirements from experimental studies for
automotives in India and other parts of world.
The estimates show that a plant density of 2,500 trees/ha and average seed yield of 1.5 kg/tree
is perfectly feasible A 1-ha plantation is capable of an average of 3.75 toms/ha of seed
production, with a corresponding yield of 1.2 tons of oil/ha and 2.5 tons of cake. It is
projected that by the end of the 11th plan (2011-2012) period, 13.38 million tons of biodiesel
for 20% blending will be required, which corresponds to about 11.2 million hectares of land
for jatropha. Cultivation of jatrohpa is expected to create employment for the rural population
(Gopinathan and Sudhakaran 2009).
Many states have launched biodiesel programs based on central of self-designed policy
instructions. 200 districts in 19 potential states have been recognized as suitable for jatropha
cultivation over a period of three years on the basis of availability of wasteland, rural poverty
ratio, census analysis of peoples below the poverty line, and agro-climatic conditions. For
every district, there is a plan to divide the area into blocks, with each block hosting a 15,000-
ha jatropha plantation (Planning Commission, Government of India 2003). Detailed
information on the progress of each district has been summarized in Table 6.
Massive amounts of small and medium private enterprises also invested in cultivated as well
as commercial production of biodiesel, though the market for biodiesel has not yet developed

52
on a commercial scale. The current status of their performances is summarized in Table 7
(Gopinathan and Sudhakaran 2009). In October 2005, the Ministry of Petroleum and Natural
Gas launched a biodiesel purchase policy to take effect from January 2006. Thanks to this
policy, oil marketing companies purchased biodiesel from 20 purchase centers in 12 states
(altenburg, et al. 2008). According to government missives, biodiesel has been completely
exempted from excise duties (Gopinathan and Sudhakaran 2009).

53
Table 6.Details of Progress on Biofuel Initiatives in Various States of India. Source: (Gopinathan and Sudhakaran 2009)
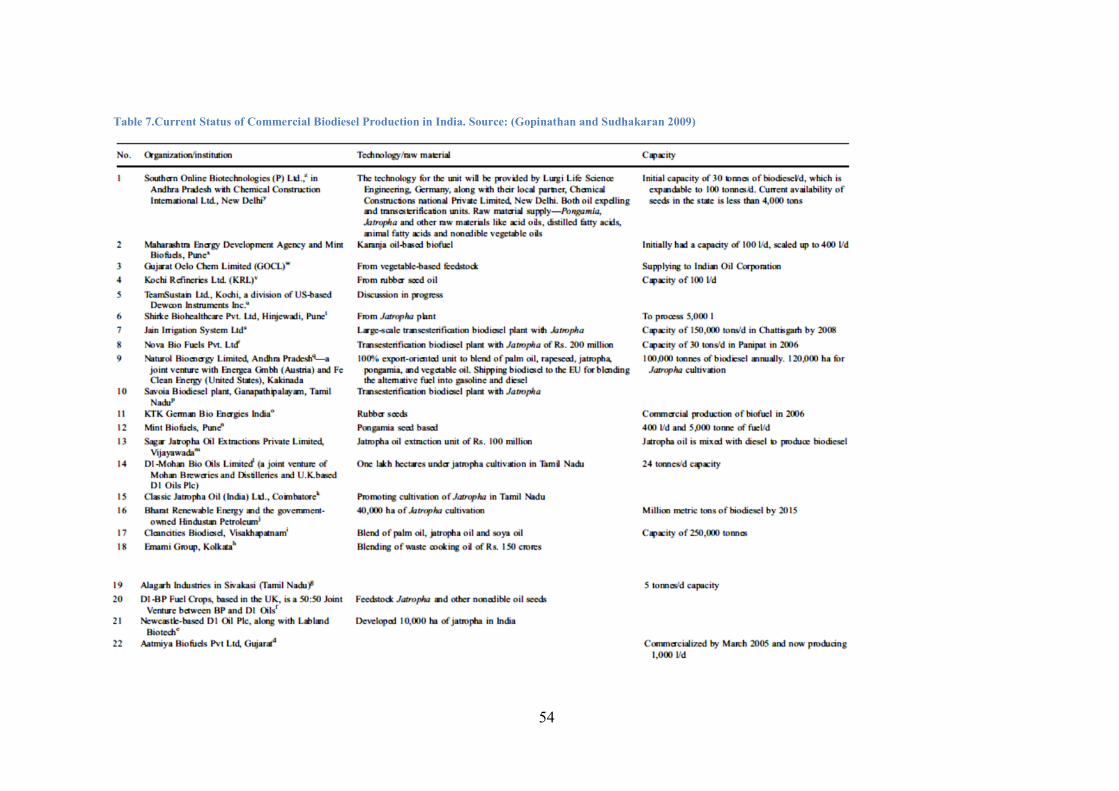
54
Table 7.Current Status of Commercial Biodiesel Production in India. Source: (Gopinathan and Sudhakaran 2009)
55
56
4.3.2. Impacts
4.3.2.1. Economic
Productivity (EISD: E���, GBEP: 17)
Even though jatropha has some advantages, such as high yields even on marginal and dry
lands without inputs like irrigation, fertilizers, and pesticide, the cultivation of this non-native
plant has yet materialized. Lack of research data concerning the amenability of jatropha for
large scale commercial plantation and its consistent yield are among the main reasons.
Therefore, the productivity and economic feasibility of this crop in India is still under debate
and most farmers do not consider jatropha cultivation rewarding unless they are supported by
government subsidies. What’s more, since the focus and incentives have centered mostly on
jatropha, the potential oil of other native, seed-bearing trees has been neglected both for
research purposes and commercial exploitation (Gopinathan and Sudhakaran 2009).
The delicate point in jatropha plantation is wastelands. While wastelands represents a vast
untouched land resource, there is little reason to believe that more than 10% of the total
wasteland resources (about one third of the land designated degraded pastures/grazing land;
underutilised/degraded notified forest land; or degraded land under plantation crops) could be
commercially feasible as jatropha plantations. Moreover, as a result of poor soil quality,
marginal lands cannot bear high plantation density without adversely affecting output per
plant. Hence, yield per hectares from such lands is likely to be lower in comparison to yield
from lands of higher quality (Rajagopal 2007). Furthermore, high plantation densities of
2,500 plants per hectare are possible only under good soil and water quality conditions,
whereas on the available rain-fed plantations on marginal soils, the optimum density is only
approximately 1,600 plants per hectares. The production per hectare is expected to be lower
on wastelands (Rajagopal 2007).
More importantly, the current price of biodiesel produced from jatropha is not competitive
with conventional diesel at present market prices. Conventional diesel is largely subsidized
and the present production costs of jatropha oil are higher than the market price. Moreover,
committed subsidies, minimum support prices, and exemptions from taxes are yet to be
57
applied (Gopinathan and Sudhakaran 2009). There is furthermore a wide variation in key
economic parameters and a lack of standardized seed materials or cultivation practices. This
requires more attention and research to be focused on large-scale planting in the future
(Rajagopal 2007).
4.3.2.2. Social
Allocation and Tenure of Land for New Bioenergy Production (GBEP: 9)
The Global Exchange for Social Investment (GEXI 2008) published a detailed survey on the
status of Indian jatropha plantations. According to their report, jatropha plantations can be
categorized into three types of ownership trends: private, public, and public-private
partnerships with 31%, 31% and 38% respectively. In total, the area under plantation is
estimated to be 497,881 ha, of which 84,000 ha is in Chhattisgarh, 33,000 ha is in Rajasthan,
20,277 ha is in Uttaranchal, and 328 ha is in Haryana. Large amounts of these crops are
grown in non-irrigated lands and 60% are planted in wastelands.
11.2 million hectares of land with specific categories for plantation have been identified in
the project document, though the quality and ownership of the land projected for cultivation
continues to be debated. Many of the lands described in the plan are held by state
governments and managed by collaborative groups or owned by selective communities, such
as panchayats. However, Indian’s experience suggests that collective ownership has been
very difficult to manage for large-scale commercial production. Even on private lands, the
present land-holding and tenancy laws act as stumbling blocks for large-scale plantations
(Gopinathan and Sudhakaran 2009).
Moreover, there is a concern that large-scale commercial biofuel production may adversely
influence access by the poor to the wastelands, which are used for cattle grazing and fuel-
wood collection (Ravindranath, Sita Lakshmi, et al. 2010). A majority of wastelands
allocated to the jatropha plantations are classified as common property resources (CPR). This
means that a group such as a village collectively owns such resources and membership in the
group confers upon an individual the right to access the resource. Such resources can play an
important role in the lives of its users by supplying a wide variety of commodities like food,
fuel wood, fodder, timber, thatching materials for home roofing, etc. (Gundimeda 2005)
(Ravindranath and Hall, Energy and Environemnt-a Developing Country Perspective from

58
India 1995). In a study of Gundimeda, evidence (Beck and Ghosh n.d.) (Iyengar and Shukla
2002) (Jodha 2005) from CPRs in arid and semi-arid regions of India shows that: (i) CPRs
contribute between 12 percent and 25 percent of poor household income; (ii) the poorer the
household, the more vital the influence of CPRs; (iii) CPRs contribute to rural equity since
they are accessed more by the poor than the rich. Hence, the composition of tree species
cultivated on wastelands is essential, as disrespect for rural needs by building up wastelands
can cause adversity for the poor and conflicts with growers of biodiesel or other plantations
on such lands (Rajagopal 2007).
Jatropha has several disadvantages in this sense. First, jatropha’s leaves are not proper for
livestock or for fodder, which can be considered another food crisis (Narain 2005). In this
context, cultivation of jatropha on common lands, which are often grazing lands, could
possibly make the food crisis worse. Second, jatropha yields minor amounts of wood per tree.
A case study in Gujarat village demonstrates that the poor collect 70 percent of their fuel and
55 percent of their food requirements from CPRs (Chen 1991). Building up these resources
for biofuel, then, could be seriously detrimental to rural livelihoods, as wood is used for
cooking, cleaning, certain jobs, construction, and other daily needs.
Change in Income (GBEP: 11)
There are some major barriers for adoption of jatropha, especially for small farmers. One
such issue is that as a long perennial, jatropha needs up to 4 years to grow, having a long
maturation phase. There are also various uncertainties concerning cultivation and marketing.
A study conducted by the Employment Gaurantee Scheme in Maharashtra indicated that
subsidies primarily benefiting the large farmers who adopt this crop (PRAYAS n.d.)
Moreover, this study claimed that the total subsidies exceeded the costs of cultivation.
However, small and marginal farmers might indirectly benefit if e they could access new
employment opportunities in plantations or if there were an increase in the price of crops
displaced by jatropha. In addition, it is expected that small farmers are more sceptical of buy-
back contracts being offered by biodiesel companies with scant track records from farmers in
given regions (Rajagopal 2007).

59
Jobs in the Bioenergy Sector (GBEP: 12)
Biofuel production in India is viewed as an option for generating rural employment and
improving rural development. Biofuel production has high potential for creating of large
number of jobs at multiple stages of the supply-chain, such as production (cultivation
practices), harvesting, transportation, processing, and marketing (Worldwatch 2007); still,
this generation of employment depends on the chosen biofuel crop and the former use of the
land cultivating it. Under some conditions, biofuel production using mechanization that
displaces traditional agriculture can lead to loss of employment. Therefore, employment
creation can be expected only when more labor-intensive production techniques are used for
biofuel production in comparison to the production practices of other land use. Since, in
India, biofuel production will be mostly in wastelands, new jobs would be created in biofuel
production, transportation and processing (Global Subsidies Initiative 2008). The planning
commission is aiming to develop biofuel production in wastelands as an employment
generation tactic in rural areas (Planning Commission, Government of India 2003).
4.3.2.3. Environmental
Life-Cycle GHG Emissions (EISD: ENV 1; GBEP: 1)
One of the combative issues in biofuel production is the estimates of GHG emissions from
biofuel crops and thus the effectiveness of using biofuels for mitigation of climate change.
There is a decent amount of available literature focused on the potential emissions from
biofuels in developed countries, though very few studies are available for developing
countries. Most studies concluded that the first generation biofuel production could result in a
net GHG emission reduction in the range of 20-60% in comparison with fossil fuels,
excluding GHG emissions from land-use conversion (Ravindranath, et al. 2009) Most studies
do not include GHG emissions from land conversion, the chief source of ��� emissions in
biofuel production. The constant rising demand for biofuel production and extensive policies
adopted by nations to meet them will further require new land cropping technologies
involving direct and indirect land-use changes (LUC), which will have significant impacts on
the net climate benefits of biofuel production (Fargione, et al. 2008) (Gibbs, et al. 2008)
(Leemans, et al. 1996) (schlamadinger, et al. 2001) (Searchinger, et al. 2008). The concept of
60
a “Carbon Debt” from biofuel production indicates how many tons of ��� resulting from
land conversion can be offset by biofuel-substituting fossil fuels. Carbon debt can also be
used to determine the number of years of biofuel production needed to offset total ���
emissions resulting from land conversion. Land-use conversion from native land uses to
biofuel crops constantly results in noteworthy ��� emissions and carbon debts ranging from
one to several hundred years (Fargione, et al. 2008). Other studies have highlighted that land-
use conversion and cultivation of biofuel crops could have notable, both positive and
negative, consequences for food security, biodiversity and water (IEA, The outlook for
biofuels 2006) (IPCC 2007) (RFA 2008) (Thow and Warhurst 2007). Moreover, a better
understanding of the life-cycle of GHG emissions, particularly including land-use and land
conversion actions, has been recommended by the United Nations (UN, Sustainable
Bioenergy: A Framework for Decision Makers 2008).
In India, the conversion of forest land into cropland is prohibited under the National Forest
Policy. Moreover, cropland utilization has stabilized for over 20 years, since the Indian
government supports biodiesel crops only on wastelands. Hence, meeting land demands for
biofuel production is expected to be provided from degraded grassland or wastelands, which
have become degraded as a result of overgrazing, fire, and soil erosion. These facts mean a
reduction in carbon emissions from biofuel production to a relatively low level in comparison
with global scenarios that would include a conversion of forest and productive grasslands
(Ravindranath, Sita Lakshmi, et al. 2010). One study in India shows that if the yield of
biofuel crops decreases by 50%, emissions will automatically rise as a result of higher
transportation distances to collect the requisite raw materials to produce the same amount of
biofuel. In better words, there are other vital factors determining the quantity of emissions
associated with biofuel, such as the yield of biofuel crops, the distance of biofuel
manufacturing units from the source of biomass, and the mode of transportation used to move
raw materials (Leduc, et al. 2009).
Ravindranath et. al. estimated ��� emissions in 2010 from land conversion by considering
eight types of land conversions and using the total area needed for each biofuel crop (Table
8).
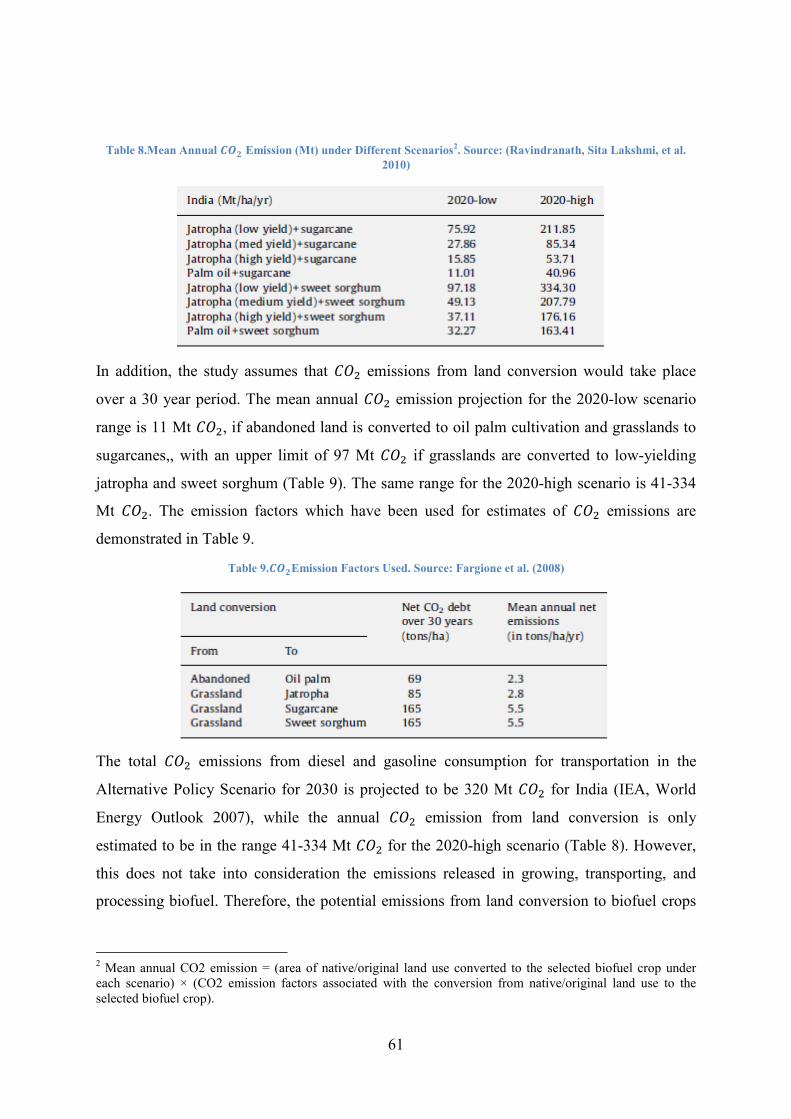
61
Table 8.Mean Annual ��� Emission (Mt) under Different Scenarios2. Source: (Ravindranath, Sita Lakshmi, et al.
2010)
In addition, the study assumes that ��� emissions from land conversion would take place
over a 30 year period. The mean annual ��� emission projection for the 2020-low scenario
range is 11 Mt ���, if abandoned land is converted to oil palm cultivation and grasslands to
sugarcanes,, with an upper limit of 97 Mt ��� if grasslands are converted to low-yielding
jatropha and sweet sorghum (Table 9). The same range for the 2020-high scenario is 41-334
Mt ���. The emission factors which have been used for estimates of ��� emissions are
demonstrated in Table 9.
Table 9.���Emission Factors Used. Source: Fargione et al. (2008)
The total ��� emissions from diesel and gasoline consumption for transportation in the
Alternative Policy Scenario for 2030 is projected to be 320 Mt ��� for India (IEA, World
Energy Outlook 2007), while the annual ��� emission from land conversion is only
estimated to be in the range 41-334 Mt ��� for the 2020-high scenario (Table 8). However,
this does not take into consideration the emissions released in growing, transporting, and
processing biofuel. Therefore, the potential emissions from land conversion to biofuel crops
2 Mean annual CO2 emission = (area of native/original land use converted to the selected biofuel crop under each scenario) × (CO2 emission factors associated with the conversion from native/original land use to the selected biofuel crop).
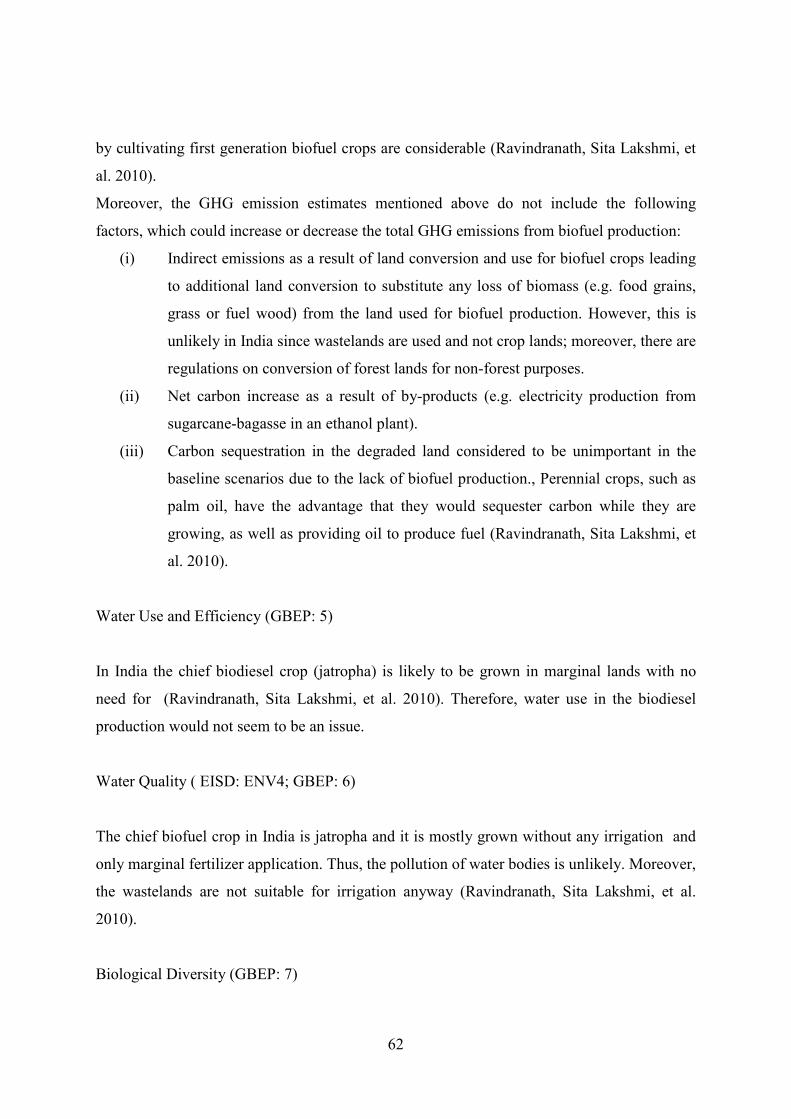
62
by cultivating first generation biofuel crops are considerable (Ravindranath, Sita Lakshmi, et
al. 2010).
Moreover, the GHG emission estimates mentioned above do not include the following
factors, which could increase or decrease the total GHG emissions from biofuel production:
(i) Indirect emissions as a result of land conversion and use for biofuel crops leading
to additional land conversion to substitute any loss of biomass (e.g. food grains,
grass or fuel wood) from the land used for biofuel production. However, this is
unlikely in India since wastelands are used and not crop lands; moreover, there are
regulations on conversion of forest lands for non-forest purposes.
(ii) Net carbon increase as a result of by-products (e.g. electricity production from
sugarcane-bagasse in an ethanol plant).
(iii) Carbon sequestration in the degraded land considered to be unimportant in the
baseline scenarios due to the lack of biofuel production., Perennial crops, such as
palm oil, have the advantage that they would sequester carbon while they are
growing, as well as providing oil to produce fuel (Ravindranath, Sita Lakshmi, et
al. 2010).
Water Use and Efficiency (GBEP: 5)
In India the chief biodiesel crop (jatropha) is likely to be grown in marginal lands with no
need for (Ravindranath, Sita Lakshmi, et al. 2010). Therefore, water use in the biodiesel
production would not seem to be an issue.
Water Quality ( EISD: ENV4; GBEP: 6)
The chief biofuel crop in India is jatropha and it is mostly grown without any irrigation and
only marginal fertilizer application. Thus, the pollution of water bodies is unlikely. Moreover,
the wastelands are not suitable for irrigation anyway (Ravindranath, Sita Lakshmi, et al.
2010).
Biological Diversity (GBEP: 7)
63
As discussed in the preceding chapter, the implications of biofuel production for biodiversity
are one of the most important environmental concerns. Biofuel production on a large scale
could have negative as well as positive implications for biodiversity. Which type it has
depends on the land category converted for biofuel production, biodiversity status of the land
before conversion, the biofuel crop, and the cultivation practices. Expanded biofuel
production would have large consequences for biodiversity, with biodiversity is defined as
species richness and is estimated as the number of species of plants, animals and
microorganisms per unit area (Ravindranath, Sita Lakshmi, et al. 2010). Negative impacts on
biodiversity caused by increased biofuel production are as follows: (i) habitat conversion and
loss; (ii) agricultural intensification; (iii) introduction of invasive species; and (iv) pollution
(Sala, Sax and Lesloe 2009) (FAO, FAOSTAT 2008).At the moment, a sufficient
understanding of the consequences of biofuel production from first generation and next
generation crops is lacking and needs further research.
In India, biofuel crop production is mainly intended for marginal areas or wastelands. Due to
overgrazing, soil erosion, and lack of vegetation cover, these land categories are subject to
degradation. Therefore, the threat of biodiversity loss caused by biofuel production is
doubtful in the India scenario. Sustainable biofuel production conducted in marginal lands
could, in contrast, possibly lead to biodiversity conservation (Ravindranath, Sita Lakshmi, et
al. 2010).
Harvest Levels of Wood Resources (EISD: ENV6; GBEP: 3)
In India, there is a legal ban on conversion of forest land to non-forest purposes, which
includes biofuel production. Figure 7 shows that the forested area in India has stabilized since
1990 (Ravindranath, Sita Lakshmi, et al. 2010).
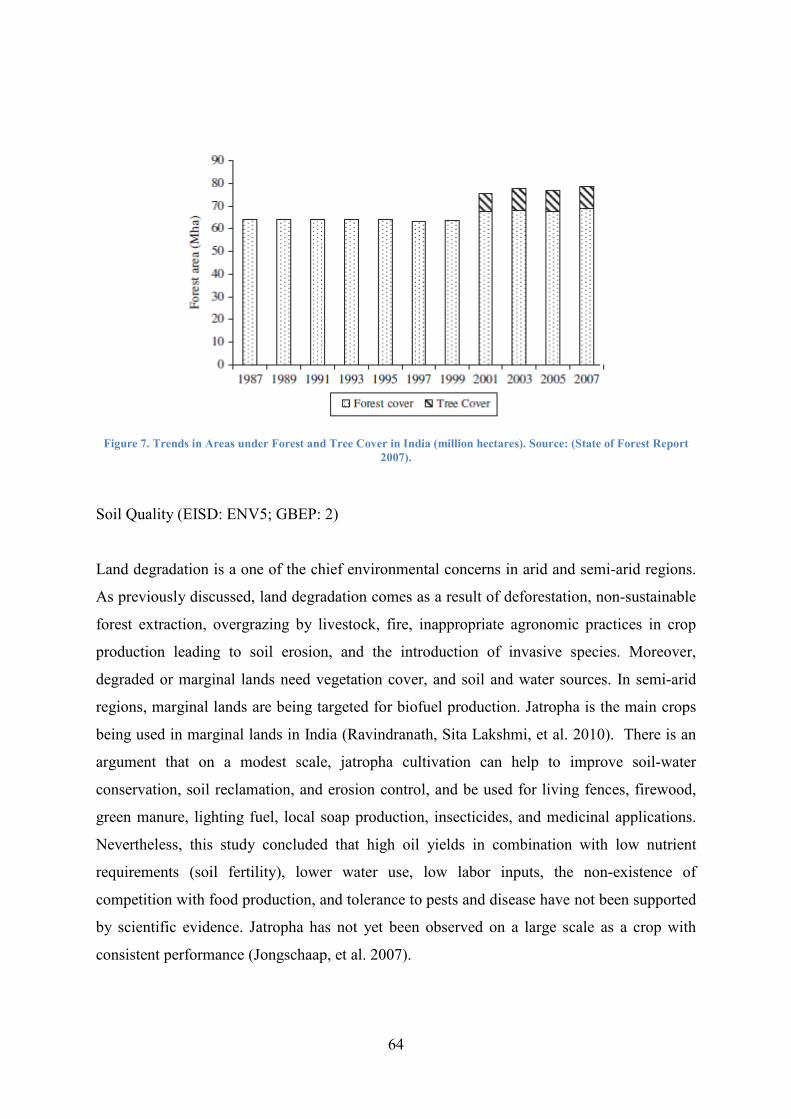
64
Figure 7. Trends in Areas under Forest and Tree Cover in India (million hectares). Source: (State of Forest Report
2007).
Soil Quality (EISD: ENV5; GBEP: 2)
Land degradation is a one of the chief environmental concerns in arid and semi-arid regions.
As previously discussed, land degradation comes as a result of deforestation, non-sustainable
forest extraction, overgrazing by livestock, fire, inappropriate agronomic practices in crop
production leading to soil erosion, and the introduction of invasive species. Moreover,
degraded or marginal lands need vegetation cover, and soil and water sources. In semi-arid
regions, marginal lands are being targeted for biofuel production. Jatropha is the main crops
being used in marginal lands in India (Ravindranath, Sita Lakshmi, et al. 2010). There is an
argument that on a modest scale, jatropha cultivation can help to improve soil-water
conservation, soil reclamation, and erosion control, and be used for living fences, firewood,
green manure, lighting fuel, local soap production, insecticides, and medicinal applications.
Nevertheless, this study concluded that high oil yields in combination with low nutrient
requirements (soil fertility), lower water use, low labor inputs, the non-existence of
competition with food production, and tolerance to pests and disease have not been supported
by scientific evidence. Jatropha has not yet been observed on a large scale as a crop with
consistent performance (Jongschaap, et al. 2007).
65
5. Conclusion Due to the constantly growing population, climate change issues, and depletion of finite
resources, there is an inevitable need to search for alternative energy sources. Therefore,
countries are experimenting with different kinds of renewable energies. Among these
renewable energies, biofuel is one that is generating global interest in expanding its
production. This study focuses on the biofuel production in a developing country based on
the fact that most of the share of current and future population growth belongs to developing
countries. Hence, providing safe, adequate, and accessible energy for the current population
and future generations is one of the critical policy issues in developing countries. This
research attempts to evaluate biofuel production based on a proper index of sustainable
development. It aims to find an answer for whether biofuel production would be able to fulfil
sustainable development goals.
In order to reach the aim of the study, the first chapter was allocated to the introduction of
biofuel and more importantly to observe the advantages and disadvantages of the biofuel
production. Further, there was a discussion of sustainable development to clarify its definition
and identifying its most important factors The evaluation section needed to be done based on
reliable indicators. Therefore, the subsequent discussion was devoted to describing the two
most relevant packages of indicators (EISD and GBEP). The comparison between them and
combination of them formed a set of indicators which have been used in the final chapters.
India was selected as a case study in this research since it has a concrete plan for biofuel
production. Moreover, because India has both a high economic growth rate and population
growth, it makes an interesting case study. Besides, one of the main critiques of biofuel
production is the competition between food and fuel, and this country is tangibly dealing with
food security issues.
Among the long list of indicators that have been explored in the third chapter, the following
indicators within the three economic, environmental and social dimensions were the subject
of the study in India, based on their relevance and importance:
productivity, jobs in the bioenergy sector, changes in income, allocation and tenure of land
for new bioenergy production, price and supply of national food basket, soil quality,
biological diversity in the landscape, water use and efficiency, life-cycle of GHG emissions,

66
water quality, and land use and land-use changes related to bioenergy feedstock
production.The analysis was divided into two different sections, ethanol and biodiesel. The
result of the examination of biofuel production in India based on the aforementioned
indicators can be summarized as follows:
India’s selection of feedstock for biofuel differs from the rest of the world. Sugarcane-
molasses-based biofuel and nonedible oil seed-based biodiesel provide suitable conditions for
economic development, poverty alleviation, and carbon dioxide mitigation with lesser
impacts on food supply. Since the sugarcane industry is one of the largest rural industries, the
bioethanol program is likely to improve rural agricultural income and create extra
employment for people collaborating directly or indirectly with the sugar industry. There is
also an opportunity to overcome the cyclicality of sugarcane, sugar, molasses, and alcohol
production. Sustainable production supports market prices of sugar, molasses, and ethanol to
steady and even decrease drastic instability experienced in past. In addition, the wide
volatility in molasses prices, the chief determining element in the cost of ethanol, can be
brought under control. In case sugar prices are occasionally depressed, factories can divert
some of the sugarcane juice to ethanol production, thus bringing in extra income and ensuring
better and appropriate payments to farmers (Gopinathan and Sudhakaran 2009).
It seems that the land required can be feasibly attained, assuming the extent of available
wasteland was correctly estimated for India. The annual GHG emissions from land
conversion, the likely source of GHG emissions, are predicted to range from 11 to 334 Mt
��� once more depending on the type of scenarios selected and the crop types used. The area
under food production is likely to be stabilized in India, thus the expansion of biofuel crops in
wastelands would not be likely to have a notable impact on food production. Moreover,
biofuel policies encourages production solely on wastelands or marginal lands. Likewise, the
application of degraded land is subjected to continuous degradation is not projected to have
any significant adverse influence on biodiversity. More importantly, there is an actual ban in
India on conversion of forest land to non-forest purposes, including for biofuel production.
Perhaps most importantly, biofuel production in India through the cultivation of jatropha on
wastelands under rain-fed conditions does not seem to have any negative consequences on
availability of water for food production. However, interpretation of the environmental and
socio-economic consequences demands caution, due to the limited field experience of
67
analysts along with the absence of evidence from field studies on the adverse influences of
biofuel production (Ravindranath, Sita Lakshmi, et al. 2010).
However, there are some concerns that undeniably require constraint. The reliance on only
one or two crops presents a higher risk of scarcity in the biofuel supply as a result of drought
or pest attacks that might result in crop failure, particularly where cultivation has to be
undertaken on marginal lands with little or no adjustable inputs. More research is needed on
the development of a wide variety of crops and technologies that are appropriate for diverse
socio-economic and environmental conditions in rural areas in India. Further research should
be able to answer these questions: (i) would focusing on private farmlands deliver higher net
benefits than common property lands? And (ii) whether recreation of common lands or rural
development is the aim, are there any alternative single-purpose crops besides jatropha that
can supply modern biofuel along with food, fodder, and fuel wood for cooking and/or
electricity production (Rajagopal 2007)?Additionally, inconsistent government policies,
accessibility of land, choice of crops, yields, and market prices are critical barriers that will
be encountered during the implementation of this program (Gopinathan and Sudhakaran
2009).
Suggestions:
Ethanol supply and price vulnerability can be reduced if the government, the private sector
and other stakeholders utilize alternative feedstock sources, such as sweet sorghum and
tropical sugar beet. Applying energy-efficient methods for anhydrous alcohol, like pressure-
swing absorption or membrane separation, can greatly reduce the manufacturing costs of
ethanol. Distilleries closed as a result of the low demand for alcohol-based chemicals should
be revitalized. Cross-state movements of molasses and ethanol manufacturing from sugar
juices (at least secondary juice) instead of molasses alone would also help the reduction of
ethanol cost production. Above all, a consistent policy in which the central and state
governments work toward common goals should be taken into consideration for successful
implementation of the program (Rajagopal 2007).

68
The study will conclude with a well-worded sentence from Righelato and Sparcklen that both
suggests additional research and implies the issues that countries face in the future (Righelato
and Sparcklen 2007):
Sustainable biofuel production systems could play a highly positive role in mitigating
climate change, enhancing environmental quality and strengthening global economy but
it will take sound, science-based policy and additional research.

69
Appendix 1
Comparison of Indicators
In common IAEA FAO
Aspect Indicator Definition Indicator Definition
Economic
1.Use and
Production
Patterns
Productivity:
Energy use per
unit of GDP
ECO2
Ratio of total primary
energy supply (TPES),
total final consumption
(TFC), and electricity use
to gross domestic product
(GDP)
1.Gross
Value
Added
19
Gross value added per unit of
bioenergy produced and as a
percentage of gross domestic
product
2. Use and
Production
Patterns
Diversificatio
n (fuel mix)
2.1.Non-
carbon energy
share in energy
and electricity
2.2.Fuel shares
in energy and
electricity
2.3.Renewable
energy share in
energy and
electricity
ECO11,12,13
2.1.The share of non-
carbon energy sources in
primary energy supply
(TPES) and in electricity
generation and generation
capacity
2.2.The structure of
energy supply in terms of
shares of energy fuels in
the total primary energy
supply (TPES), total final
consumption (TFC) and
electricity generation and
generating capacity
2.3.The share of
renewable energy in the
total primary energy
supply (TPES), total final
consumption (TFC) and
electricity generation and
generating capacity
(excluding non-
commercial energy)
2.Change
in the
Consumpti
on of Fossil
Fuels and
Traditional
Uses of
Biomass
20
Energy
Diversity
22
20.1-Substitution of fossil fuels
with domestic bioenergy
measured by energy content and
in annual savings of convertible
currency from reduced
purchases of fossil fuels
20.2-Substitution of traditional
uses of biomass with modern
domestic bioenergy measured
by energy content
22.Change in diversity of total
primary energy supply due to
bioenergy
2. Use and
Producti
on
Patterns
and
Prices
Actual prices paid by final
consumer for energy with
and without taxes and
subsidies
Net Energy
Balance
18
Energy ratio of the bioenergy
value chain in comparison with
other energy sources, including
energy ratios of feedstock
production; processing of
feedstock into bioenergy;
bioenergy use; and/ or lifecycle
analysis
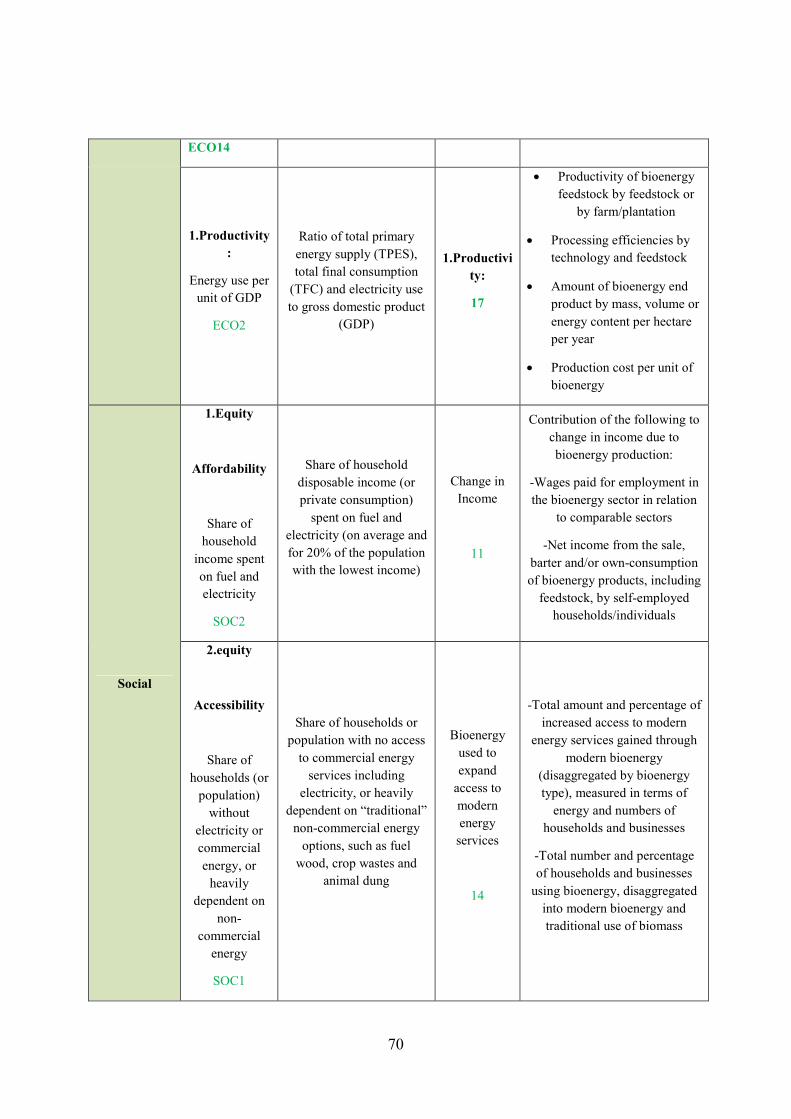
70
ECO14
1.Productivity
:
Energy use per
unit of GDP
ECO2
Ratio of total primary
energy supply (TPES),
total final consumption
(TFC) and electricity use
to gross domestic product
(GDP)
1.Productivi
ty:
17
• Productivity of bioenergy
feedstock by feedstock or
by farm/plantation
• Processing efficiencies by
technology and feedstock
• Amount of bioenergy end
product by mass, volume or
energy content per hectare
per year
• Production cost per unit of
bioenergy
Social
1.Equity
Affordability
Share of
household
income spent
on fuel and
electricity
SOC2
Share of household
disposable income (or
private consumption)
spent on fuel and
electricity (on average and
for 20% of the population
with the lowest income)
Change in
Income
11
Contribution of the following to
change in income due to
bioenergy production:
-Wages paid for employment in
the bioenergy sector in relation
to comparable sectors
-Net income from the sale,
barter and/or own-consumption
of bioenergy products, including
feedstock, by self-employed
households/individuals
2.equity
Accessibility
Share of
households (or
population)
without
electricity or
commercial
energy, or
heavily
dependent on
non-
commercial
energy
SOC1
Share of households or
population with no access
to commercial energy
services including
electricity, or heavily
dependent on “traditional”
non-commercial energy
options, such as fuel
wood, crop wastes and
animal dung
Bioenergy
used to
expand
access to
modern
energy
services
14
-Total amount and percentage of
increased access to modern
energy services gained through
modern bioenergy
(disaggregated by bioenergy
type), measured in terms of
energy and numbers of
households and businesses
-Total number and percentage
of households and businesses
using bioenergy, disaggregated
into modern bioenergy and
traditional use of biomass
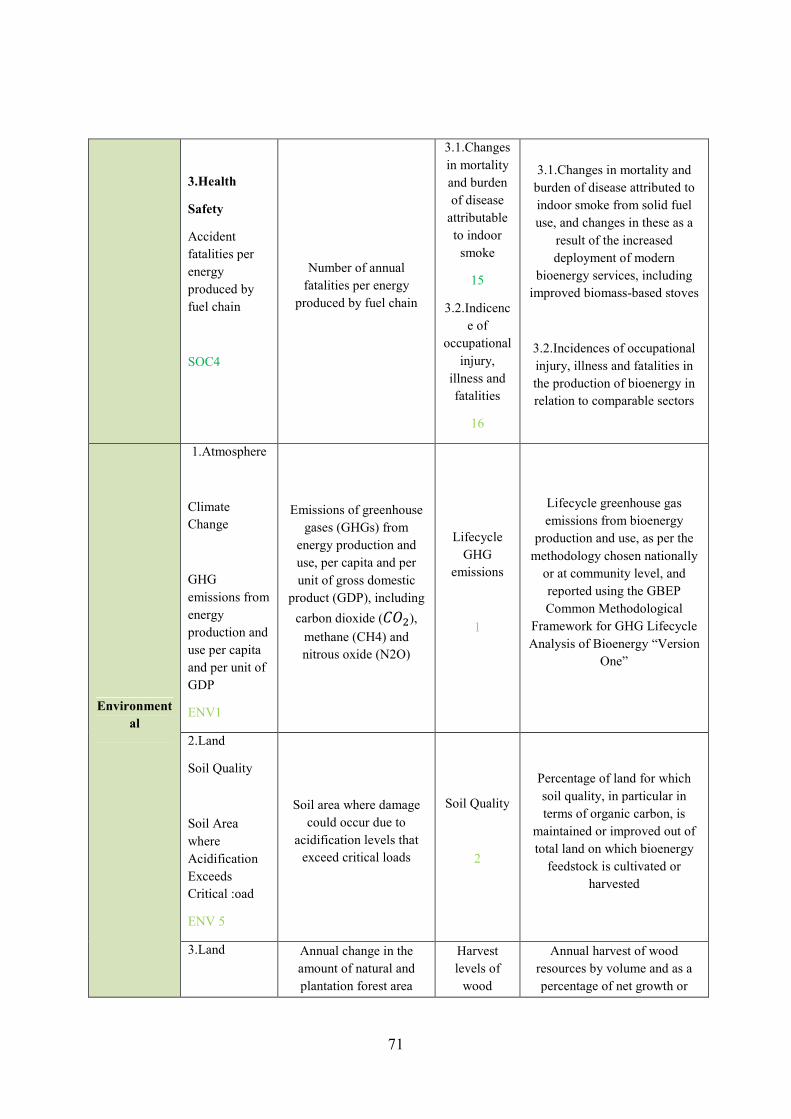
71
3.Health
Safety
Accident
fatalities per
energy
produced by
fuel chain
SOC4
Number of annual
fatalities per energy
produced by fuel chain
3.1.Changes
in mortality
and burden
of disease
attributable
to indoor
smoke
15
3.2.Indicenc
e of
occupational
injury,
illness and
fatalities
16
3.1.Changes in mortality and
burden of disease attributed to
indoor smoke from solid fuel
use, and changes in these as a
result of the increased
deployment of modern
bioenergy services, including
improved biomass-based stoves
3.2.Incidences of occupational
injury, illness and fatalities in
the production of bioenergy in
relation to comparable sectors
Environment
al
1.Atmosphere
Climate
Change
GHG
emissions from
energy
production and
use per capita
and per unit of
GDP
ENV1
Emissions of greenhouse
gases (GHGs) from
energy production and
use, per capita and per
unit of gross domestic
product (GDP), including
carbon dioxide (���),
methane (CH4) and
nitrous oxide (N2O)
Lifecycle
GHG
emissions
1
Lifecycle greenhouse gas
emissions from bioenergy
production and use, as per the
methodology chosen nationally
or at community level, and
reported using the GBEP
Common Methodological
Framework for GHG Lifecycle
Analysis of Bioenergy “Version
One”
2.Land
Soil Quality
Soil Area
where
Acidification
Exceeds
Critical :oad
ENV 5
Soil area where damage
could occur due to
acidification levels that
exceed critical loads
Soil Quality
2
Percentage of land for which
soil quality, in particular in
terms of organic carbon, is
maintained or improved out of
total land on which bioenergy
feedstock is cultivated or
harvested
3.Land
Annual change in the
amount of natural and
plantation forest area
Harvest
levels of
wood
Annual harvest of wood
resources by volume and as a
percentage of net growth or
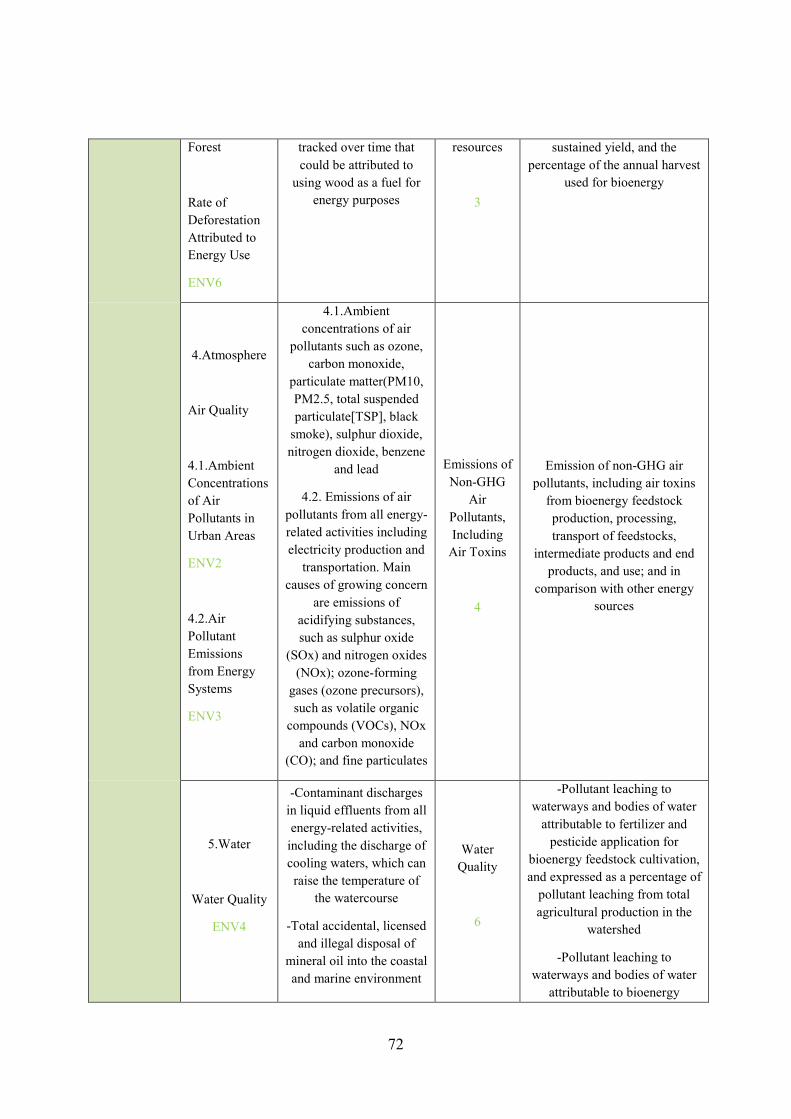
72
Forest
Rate of
Deforestation
Attributed to
Energy Use
ENV6
tracked over time that
could be attributed to
using wood as a fuel for
energy purposes
resources
3
sustained yield, and the
percentage of the annual harvest
used for bioenergy
4.Atmosphere
Air Quality
4.1.Ambient
Concentrations
of Air
Pollutants in
Urban Areas
ENV2
4.2.Air
Pollutant
Emissions
from Energy
Systems
ENV3
4.1.Ambient
concentrations of air
pollutants such as ozone,
carbon monoxide,
particulate matter(PM10,
PM2.5, total suspended
particulate[TSP], black
smoke), sulphur dioxide,
nitrogen dioxide, benzene
and lead
4.2. Emissions of air
pollutants from all energy-
related activities including
electricity production and
transportation. Main
causes of growing concern
are emissions of
acidifying substances,
such as sulphur oxide
(SOx) and nitrogen oxides
(NOx); ozone-forming
gases (ozone precursors),
such as volatile organic
compounds (VOCs), NOx
and carbon monoxide
(CO); and fine particulates
Emissions of
Non-GHG
Air
Pollutants,
Including
Air Toxins
4
Emission of non-GHG air
pollutants, including air toxins
from bioenergy feedstock
production, processing,
transport of feedstocks,
intermediate products and end
products, and use; and in
comparison with other energy
sources
5.Water
Water Quality
ENV4
-Contaminant discharges
in liquid effluents from all
energy-related activities,
including the discharge of
cooling waters, which can
raise the temperature of
the watercourse
-Total accidental, licensed
and illegal disposal of
mineral oil into the coastal
and marine environment
Water
Quality
6
-Pollutant leaching to
waterways and bodies of water
attributable to fertilizer and
pesticide application for
bioenergy feedstock cultivation,
and expressed as a percentage of
pollutant leaching from total
agricultural production in the
watershed
-Pollutant leaching to
waterways and bodies of water
attributable to bioenergy

73
processing effluents, and
expressed as a percentage of
pollutant loadings from total
agricultural processing effluents
in the watershed
6.Land
Solid Waste
Generation and
Management
6.1.Ratio of
Solid Waste
Generation to
Units of
Energy
Produced
ENV7
6.2.Ratio of
Solid Properly
Disposed-of
Waste to Total
Generated
Solid Waste
ENV8
6.1.Amount of solid
waste(excluding
radioactive waste)
produced manually from
activities related to the
extraction and
conditioning of primary
fuels, and waste produced
in thermal power plants,
expressed as weight of
waste per unit of energy
produced
6.2.Amount of waste
generated by the energy
sector that has been
properly disposed of,
expressed as a percentage
of the volume of total
solid waste produced by
the energy sector
Land Use
and Land-
Use Changes
Related to
Bioenergy
Feedstock
Production
8
-Total area of land for bioenergy
feedstock production, as
compared to total national
surface and agricultural and
managed forest land area
-Percentages of bioenergy from
yield increases, residues, wastes
and degraded or contaminated
land
-net annual rates conversation
between land-use types caused
directly by bioenergy feedstock
production, including the
following(amongst others):
-Arable land and permanent
crops, permanent meadows and
pastures, and managed forests;
-Natural forests and
grasslands(including savannah,
excluding natural permanent
meadow and pastures), peat
lands, and wetlands
2-
New items in FAO indicators Definition
Economic
Training and Requalification of
the Workforce
21
Percentage of trained workers in the
bioenergy sector out of total bioenergy
workforce, and percentage of re-
qualified workers out of the total
number of jobs lost in the bioenergy
sector
Infrastructure and Logistics for
the Distribution of Bioenergy
23
Number and capacity of routes for
critical distribution systems, along with
an assessment of the proportion of the
bioenergy associated with each
Capacity and Flexibility of the
Use of Bioenergy
24
-Ratio of capacity for using bioenergy
compared with actual use for each
significant utilization route
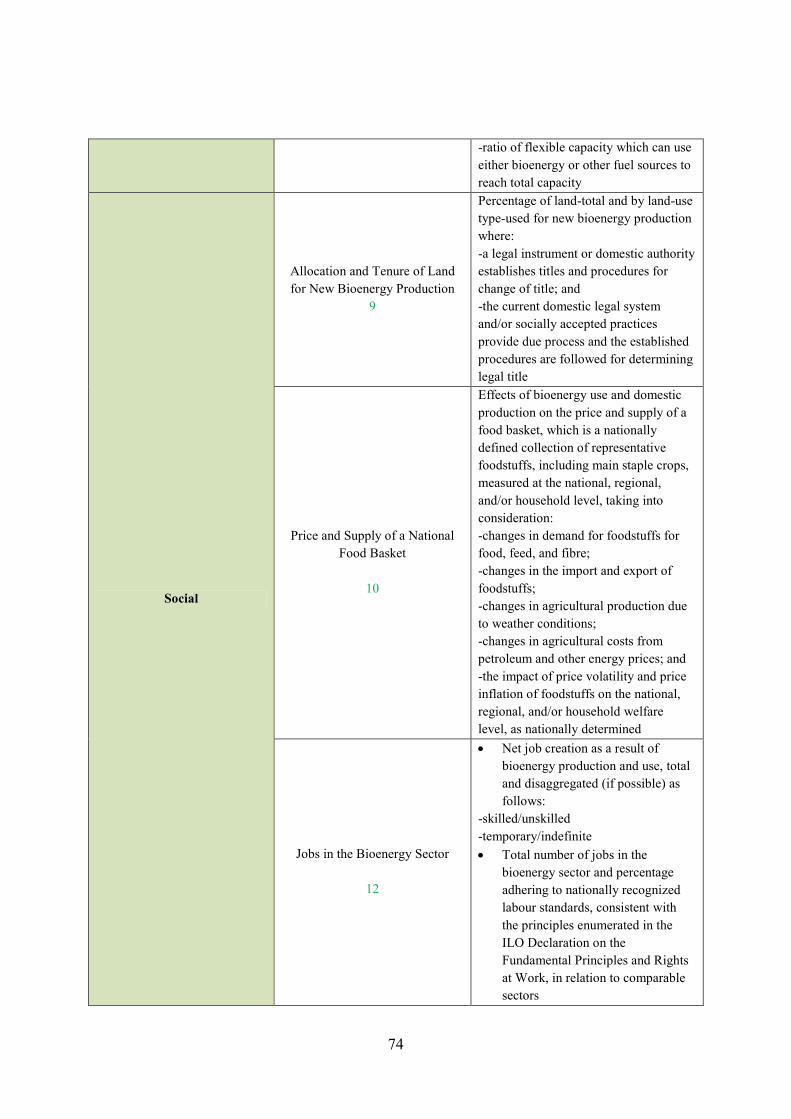
74
-ratio of flexible capacity which can use
either bioenergy or other fuel sources to
reach total capacity
Social
Allocation and Tenure of Land
for New Bioenergy Production
9
Percentage of land-total and by land-use
type-used for new bioenergy production
where:
-a legal instrument or domestic authority
establishes titles and procedures for
change of title; and
-the current domestic legal system
and/or socially accepted practices
provide due process and the established
procedures are followed for determining
legal title
Price and Supply of a National
Food Basket
10
Effects of bioenergy use and domestic
production on the price and supply of a
food basket, which is a nationally
defined collection of representative
foodstuffs, including main staple crops,
measured at the national, regional,
and/or household level, taking into
consideration:
-changes in demand for foodstuffs for
food, feed, and fibre;
-changes in the import and export of
foodstuffs;
-changes in agricultural production due
to weather conditions;
-changes in agricultural costs from
petroleum and other energy prices; and
-the impact of price volatility and price
inflation of foodstuffs on the national,
regional, and/or household welfare
level, as nationally determined
Jobs in the Bioenergy Sector
12
• Net job creation as a result of
bioenergy production and use, total
and disaggregated (if possible) as
follows:
-skilled/unskilled
-temporary/indefinite
• Total number of jobs in the
bioenergy sector and percentage
adhering to nationally recognized
labour standards, consistent with
the principles enumerated in the
ILO Declaration on the
Fundamental Principles and Rights
at Work, in relation to comparable
sectors
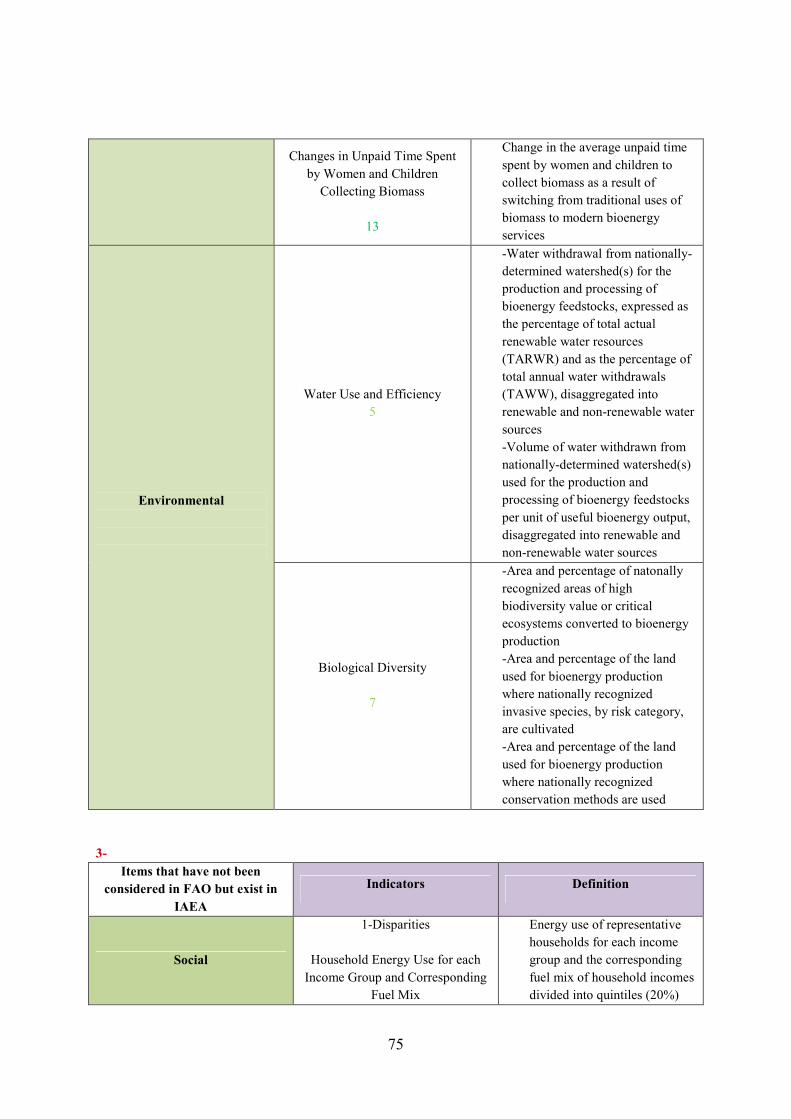
75
Changes in Unpaid Time Spent
by Women and Children
Collecting Biomass
13
Change in the average unpaid time
spent by women and children to
collect biomass as a result of
switching from traditional uses of
biomass to modern bioenergy
services
Environmental
Water Use and Efficiency
5
-Water withdrawal from nationally-
determined watershed(s) for the
production and processing of
bioenergy feedstocks, expressed as
the percentage of total actual
renewable water resources
(TARWR) and as the percentage of
total annual water withdrawals
(TAWW), disaggregated into
renewable and non-renewable water
sources
-Volume of water withdrawn from
nationally-determined watershed(s)
used for the production and
processing of bioenergy feedstocks
per unit of useful bioenergy output,
disaggregated into renewable and
non-renewable water sources
Biological Diversity
7
-Area and percentage of natonally
recognized areas of high
biodiversity value or critical
ecosystems converted to bioenergy
production
-Area and percentage of the land
used for bioenergy production
where nationally recognized
invasive species, by risk category,
are cultivated
-Area and percentage of the land
used for bioenergy production
where nationally recognized
conservation methods are used
3-
Items that have not been
considered in FAO but exist in
IAEA
Indicators Definition
Social
1-Disparities
Household Energy Use for each
Income Group and Corresponding
Fuel Mix
Energy use of representative
households for each income
group and the corresponding
fuel mix of household incomes
divided into quintiles (20%)
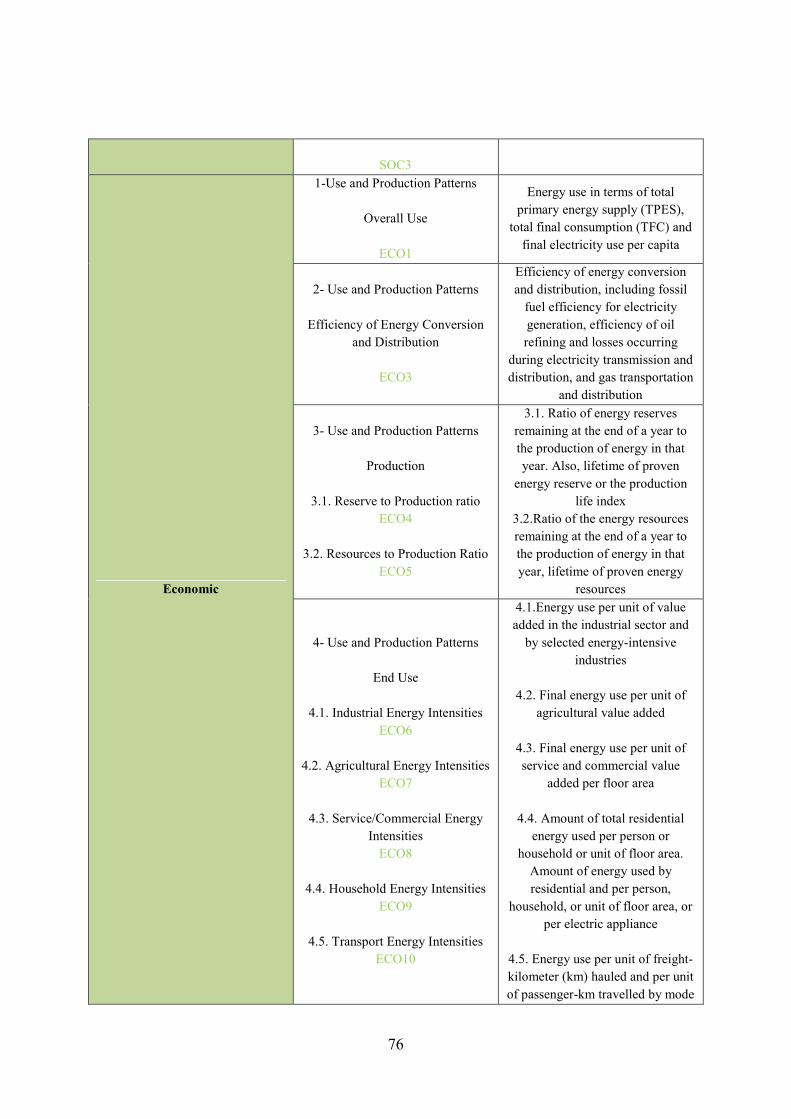
76
SOC3
Economic
1-Use and Production Patterns
Overall Use
ECO1
Energy use in terms of total
primary energy supply (TPES),
total final consumption (TFC) and
final electricity use per capita
2- Use and Production Patterns
Efficiency of Energy Conversion
and Distribution
ECO3
Efficiency of energy conversion
and distribution, including fossil
fuel efficiency for electricity
generation, efficiency of oil
refining and losses occurring
during electricity transmission and
distribution, and gas transportation
and distribution
3- Use and Production Patterns
Production
3.1. Reserve to Production ratio
ECO4
3.2. Resources to Production Ratio
ECO5
3.1. Ratio of energy reserves
remaining at the end of a year to
the production of energy in that
year. Also, lifetime of proven
energy reserve or the production
life index
3.2.Ratio of the energy resources
remaining at the end of a year to
the production of energy in that
year, lifetime of proven energy
resources
4- Use and Production Patterns
End Use
4.1. Industrial Energy Intensities
ECO6
4.2. Agricultural Energy Intensities
ECO7
4.3. Service/Commercial Energy
Intensities
ECO8
4.4. Household Energy Intensities
ECO9
4.5. Transport Energy Intensities
ECO10
4.1.Energy use per unit of value
added in the industrial sector and
by selected energy-intensive
industries
4.2. Final energy use per unit of
agricultural value added
4.3. Final energy use per unit of
service and commercial value
added per floor area
4.4. Amount of total residential
energy used per person or
household or unit of floor area.
Amount of energy used by
residential and per person,
household, or unit of floor area, or
per electric appliance
4.5. Energy use per unit of freight-
kilometer (km) hauled and per unit
of passenger-km travelled by mode
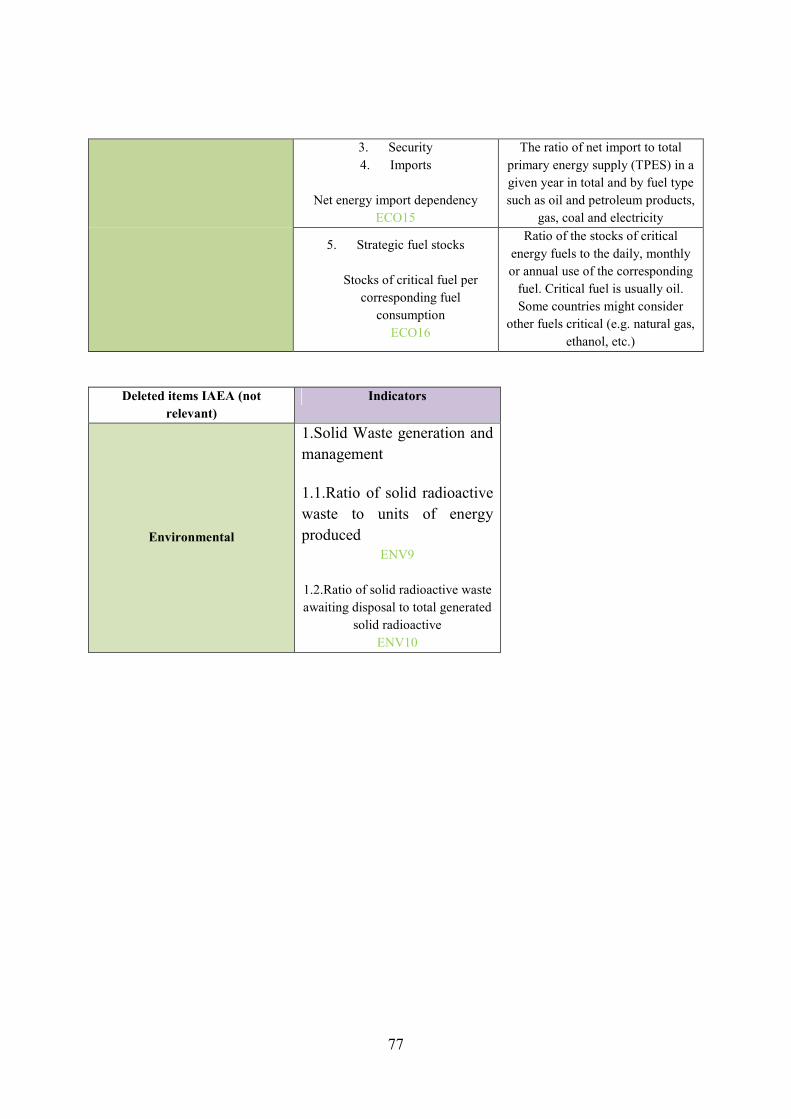
77
3. Security
4. Imports
Net energy import dependency
ECO15
The ratio of net import to total
primary energy supply (TPES) in a
given year in total and by fuel type
such as oil and petroleum products,
gas, coal and electricity
5. Strategic fuel stocks
Stocks of critical fuel per
corresponding fuel
consumption
ECO16
Ratio of the stocks of critical
energy fuels to the daily, monthly
or annual use of the corresponding
fuel. Critical fuel is usually oil.
Some countries might consider
other fuels critical (e.g. natural gas,
ethanol, etc.)
Deleted items IAEA (not
relevant)
Indicators
Environmental
1.Solid Waste generation and
management
1.1.Ratio of solid radioactive
waste to units of energy
produced
ENV9
1.2.Ratio of solid radioactive waste
awaiting disposal to total generated
solid radioactive
ENV10
78
Bibliography Altenburg, T, H Dietz, M Hahl, N Nikolidakis, C Rosendahl, and K Seelinge. “Bio-diesel
policies for rural development in India.” German Development Institute. Bonn, 2008. APEC Energy Working Group. “Energy for Sustainable Development: The Contribution and
Role of the APEC Energy working Group.” 2002: 1. Baier, Scott, Marks Clements, Charles Griffiths, and Jane Ihrig. “Biofuelss impact on crop
and food prices: using an interactive spreadsheet.” International Finance discussion (Board of Governors of the Federal Reserve System papers) 967 (2009).
Bates, J, P Howes, C Dent, A Brown, and D Rapson. Review of Indirect Effects of Biofuels. Report to The Renewable Fuels, Oxfordshire : Renewable Fuel Agency, 2008.
Beck, T, and M Ghosh. “Common Property Resources and the Poor: finding frm West Bengal.” Economic and Political Weekly, n.d.: 147-53.
BNDES, CGEE. Sugarcane-based bioethanol: energy for sustainable development. Rio de Janeiro: BNDES, 2008.
Bustamante, MMC, J Melillo, DJ Connor, Y Hardy, E Lambin, and H Lotze-Campen. “What are the final land limits?” Edited by Rw Howarth and S Bringezu. Proceeding of the
scientific committee on problems of the environment (SCOPE); International biofuels
project rapid assessment (Cornell University), September 2009: 271-91. Chen, M. Coping with Seasonality and Drought. New Delhi: Sage, 1991. Doornbosch, R, and R Streenblik. “biofuels: is the cure worse than the disease?” OECD
roundtable on sustainable development. Paris, 2007. Durbin, Thomas. Final Report: Effect of Ethanol and Volatility Parameters on Exhaust
Emissions. CRC Project No E-67, Prepared for Coordinating Research Council, Inc,, Center for Environemental Research and Technology, College of Engineering, , Alpharetta, GA, Riverside, CA: University of California, 2006, 47-48.
Engel, Marcel, and Filippo Veglio. “the challenge on our doorstep: a business view of development.” Making it, industry for development 4 (2010).
Ethanol India. A SUGAR INDUSTRY PERSPECTIVE & ETHANOL PRODUCTION. 2009. http://www.ethanolindia.net/sugarind.html.
F.O.Licht. “World Ethanol and Biofuels Report.” 2005k. F.O.Licht. World Ethanol and Biofuels Report. Licht Interactive Data, 2008. FAO. Bioenergy. 2011. http://www.fao.org/bioenergy/en/. —. FAOSTAT. 2008. www.fao.org/metadata. FAO, The state of food and agriculture. Biofuel: prospects, risks, and opportunitite. Rome:
Food and Agriculture Organization of the United Nations(FAO), 2008. Fargione, J, J Hill, D Tilman, S Polasky, P Hawthron, and Jason. “Land clearing and the
biofuel carbon debt.” Science 319 (5867), 2008: 1235-1238. Ge, H, J Scharffbillig, C Ahlberg, and E Clark. A biodiesel blend handling guide. Minnesota:
Minnesota biodiesel Technical Cold weather Issues Team Handling Suncommittee, Minnesota Department of Agriculture, 2009.
German Federal Institute for Geosciences and Natural Resources. 2006. GEXI. Global market study on Jatropha. London: The Global Exchange for social
Investment, 2008.
79
Gibbs, H K, et al. “Carbon payback times fro crop-based biofuel expansion in the tropics: the effects of changing yield and technology.” Environmental Research Letters 3, 2008: 10.
Global Subsidies Initiative, Government Support for Ethanol and Biodiesel in China. Biofuel-
AT What Cost? Geneva: International Institute for Sustainable Development, 2008. Goldemberg J, Hohansson AK, Reddy Ak, Williams RH. Energy for a sustainable world.
New Delhi: Wiley Eastern, 1988. Gonsalves, Joseph B. “An Assessment of the Biofuels Industry in India.” United Nations
Conference on Trade and Development. 2006. Gopinathan, Mambully Chandrasekharan, and Rajasekaran Sudhakaran. “Biofuels:
opportunities and challenges in India.” Edited by P Lakshamanan and D Songstad. The Society for In Vitro Biology 2009, 2009.
Government of India, Planning Commission. Integrated Energy Policy. Report of the Expert Committee, New Delhi: Government of India, Planning Commission, 2006.
Groom MJ, Gray EM, Townsend PA. “Biofuels and biodiversity: principles for creating better policies for biofuel production.” Conservation Biology 22, no. 3 (2008): 602-9.
Gundimeda, H. “Can CPRs Generate Carbonn Credits without Hurting the Poor?” Economic
and Political weekly, 5 March 2005. Guo, LB, and RM Gifford. “Soil carbon stocks and land use change: a meta-analysis.” Global
Cahgne Biology 8, no. 4 (2002): 345-60. Gurgel, Angleo, John M Reilly, and Sergey Paltsev. “Potentail land use implications of a
global biofuels industry.” Journal of Agricultural & Food Industrial Organization 5, no. 2 (2007).
Hill, J, Erik Nelson, David Tilman, Stephan Polasky, and Douglas Tifany. “Environmental, economic, and energic costs and benefits of biodiesel and ethanol biofuels.” Proceedings of the national Academy of Science 103, no. 30 (2006): 11206-10.
Hunt, S, J Sawin, and P Stair. cultivating renewable alternatives to oil. New York: Worldwatch Institute, 2006.
IAEA, IEA, UNDESA, EEA, and EISD. Energy Indicators for Sustainable Development:
Guidelines and Methodologies. Vienna: International Atomic Energy agency, 2005. IEA. Key workd energy statistics. Paris: The International Energy Agency, 2007. IEA. Key World Energy Statistics. PAris: International Energy Agency, 2010. IEA. “The outlook for biofuels.” In World energy outlook, by OECD IEA, Cahpter14. Paris:
OECD,IEA, 2006. IEA. World Energy Outlook . Paris: International Energy Agency, 2010. IEA. World Energy Outlook. Paris: International energy agency, 2007. IIASA, Gunther Fischer, Eva Hizsnyik, Sylvia Prieler, Mahendra Shah, and Harrij van
Velthuizen. Biofuels and food security. Vienna: OFID study prepared by IIASA, 2009.
IPCC. Mitigation of Climate Change: Technical Summary. Geneva: Intergovernmental Panel on climate Change, 2007.
ipcc. Special Report on Renewable Energy Sources and Climate Change Mitigation. Summary for Policy Makers, Abu Dubai: ipcc, 2011.
ISMA. Hand book of Sugar Statistics. New Delhi: Indian Sugar Mills association, 2008. IWMI. “Water implications of biofuel crops: understanding trades and identifying options.”
Water Policy Brief, no. 30 (2008).
80
Iyengar, S, and N Shukla. “Common Property Land Resources in India: Some Issues in Regeneration and Management.” In Institutionalizing Common Pool Resources, section 14. Ahmedabad: Gujarat Institute of development Research, 2002.
Jodha, N. “Rural Commmon Property Resources and Rural Poor in Dry Regions of India.” Economic and Political Weekly, June 2005: A65-A78.
Jongschaap, R.E E, W J Corre, P S Bindraban, and W A Bandenburg. “Claims and facts on Jatropha curcas.” Global Jatropha curcus Evaluation, Breeding and Propogation
Programme., 2007. Jovanovic, Marina, Naim Afghan, and Vukman Bakic. “An analytical method for the
measurment of energy system sustainability in urban areas.” Energy 35, no. 9 (2010): 3909-3920.
KPMG. “The Indian Sugar Industry: Sector Roadmap 2017.” KPMG Iternational, 2007. Lal, R, N Uphpff, B A Stewart, and O D Hansen. Climate Chagne and Global food Security.
2005. Leduc, S, K Natarajan, E Dotzauer, I McCallum, and M Obersteiner. “Optimizing biodiesel
production in India.” Applied energy 86 (1), 2009: 125-131. Leemans, R, A van Amstel, C Battjes, E Kreilman, and S Toet. Global Environemnet Cahnge
6, 1996: 335. Licht FO. World Ethanol and Biofuels Report. F.O.Licht, 2006i. Lora, electo E.Silva, Palacia C.Escobar Jose, Mateus H Rocha, Maria L.Grillo Reno, Osvaldo
J Venturini, and Oscar Almazan del Olmo. “Issues to consider, existing tolls and constraints in biofuels sustainability assessments.” energy, 2010.
Masami, Kjima, Mitchell Donald, and Ward William. “Considering trade policies for liquid biofuels.” The International Bank for Reconstruction and Development (The world bank), 2007.
Mayes, A L. “strenghts and weaknesses of common sustainability indices for multimensional systems.” environemntal International 34, no. 2 (2008): 277-91.
Melillo, J M, J M Reilly, D W Kicklighter, A C Grurgel , T W Cronin, and S Paltsev. “Indirect emission from biofuels: how important?” Scinece 326, no. 5958 (2009): 1397-9.
Minisrty of Petroluem and Natural Gas. Petroleum Statistics. Ministry of Petroluem and Natural Gas, 2007.
Ministry of Petroluem and Natural Gas. 2004. http://petroleum.nic.in/. Murty, D, MUF Kirschbaum, MacMurtrie, RE, and H McGilvray. “does conversion of forets
to agricultural land change soil Carbon and Nitrogen? A review of the litrature.” Global Change Biology 8, no. 2 (2002): 105-23.
Narain, Sunita. “The "Other" foor Crisis.” Down to Earth. 15 Dec 2005. http://www.downtoearth.org.in/node/10580.
ODI. Review of the indirect effects of biofuels, economic effects and food insecurity. a report to the renewable fules agency, Overseas Development Institute(ODI), 2008.
OECD_FAO. Agriculltural Outlook2008-2017. Paris: Organisation for Economic Cooperation and Development-Food and Agriculture Organization of the United Nations(OECD_FAO), 2008.
Pena, N. “Biofuels for Transportation: A climate Prespective.” (Pew Center) 2008. Philippe, Girard, and Fallot Abigail. “Review of existing and emerging technologies for the
production of biofuels in developing countries.” Energy for sustainable development X, no. 2 June (2006): 92-108.
81
Planning Commission, Government of India. Report of the Committee on Development of
Biofuel. New Delhi: Palnning Commission, Government of India, 2003. PRAYAS. Jatropha in Horticulture Program of employment Gaurantee Scheme- An
Assessment from the Smal Farmer's Perspective. n.d. http://prayaspune.org/. Pstel, Sandra. Safeguarding freshwater ecosystems. New York: Worldwatch Institute, W.W.
Norton and Company, 2006. Rajagopal, Deepak. Rethinking Current Strategies for Biofuel Production in India. Thesis,
Berkely: Energy and Resources Group, University of California, 2007. Ravindranath, N H, and D O Hall. “Energy and Environemnt-a Developing Country
Perspective from India.” Oxford University Press, 1995: 391. Ravindranath, N H, C Sita Lakshmi, Ritumbra Manuvie, and p Balachandra. “Biofuel
Production and implications for land use, food production and environemnt in India.” 2010.
Ravindranath, n H, et al. Green hous gas implications of land use and land conversion to
biofuel crops. SCOPE Report, 2009. REN21. Renewable 2007 global status report. Paris, Washington D.C: Worldwatch Institute:
REN21 Secretariat, 2008. Renewable Fuels Association. Changing the climate: ethanol industry outook2008.
Washington D.C: Renewable Fuel Assocuation, 2008. Renner, Michael. “The Anatomy of Resource Wars.” Worldwatch Paper, 2002: 162. Resources, German Federal Institute for Geosciences and Natural. 2006. RFA. Changing the climate: Ethanol Industry Outlook. Renewable Fuels Association, 2008. Righelato, R, and D V Sparcklen. “Carbon mitigation by biofuels or by saving and restoring
forests?” Science 317 (5840), 2007: 902. Rutz, D, and R Janssen. “Biofuel technology handbook.” WIP Renewable Energies, 2007. Sala, O E, D Sax, and h Lesloe. Biodiversity Consequences of increased Biofuel Production.
Germany: SOPE Report, 2009. Scharlemann, J.P.W, and W F Laurance. “Environmental science.” science 319, no. 5859
(2008): 43-44. Schlamadinger, B, M Grubb, C Azar, A Bauen, and G Berndes. Carbon sinks and biomadd
energy production: a study of linkages, options and implications. Climate startegies: International networl for Climate Policy analysis., 2001.
Schmidhuber, J. “Impact of an increased biomass use on agriculture markets, prices and food security: a longer term perspective.” International symposium of Notre Europe, 2006.
Schneph, Randy. “High agricultural commodity prices: Waht are the issues?” CRS Report for
Congress (Congressional Research Service) RL34474 (May 2008). Searchinger, T, et al. “Use of US croplands for biofuel increases greenhouse gases through
emissions from land-use change.” Science 319, 2008: 1238-1240. State of Forest Report. Forest Survey of India. New Delhi: Ministry of environemnt and
Forest, Governmnet of india, 2007. Subramanian, K A, S K Singal, M Saxena, and S Singhal. “Utilization of liquid biofuels in
automative diesel engines: AN Indian perspective.” Biomass Bionenergy 29, 2005: 65-72.
Thow, A, and A Warhurst. biofuels ans sustainable development . Maplecroft Report, 2007. Timilsina, Govinda R, and Ashish Shrestha. “How much hope should we have for biofuels?”
Environemnt and energy, development research group (the world Bank), 2010.
82
Trostle, R. “Global agricultural supply and demand: factors contributing to the recent increase in food comodity prices.” Economic Research Service (US Departmnet of Agriculture(USDA)) WRS-0801 (2008).
U.S Energy Department. World Biofuel Production Potential. U.S. Energy Department, 2008. Ulgiati, S A. “Comprehensive energy and economic assessment of biofuels: when "green" is
not enough.” Plant Science 20, no. 1 (2001): 71-106. UN. Energy and sustainable development: options and strategies for action on key issues.
Report of the Secretary General, United Nations Economic and Socail Council, 2001. —. Sustainable Bioenergy: A Framework for Decision Makers. United Nations, 2008. —. United Nations, Department of Economics & social Affairs; Population Division,
Population Estimates and Projections Section. 31 October 2011. http://esa.un.org/wpp/Other-Information/faq.htm.
UNDESA. Indicators of sustainable development: Guideline and methodogies, 2nd edition. New York: United NAtions Departemnt of Economic and Socail Affairs., 2001.
UNDP. Energy for sustainable Development. 2011. http://www.undp.org/energy/. UNEP. Global Environmnet Outlook, GEO-2000. Nairobi: United Nations Environemnt
Programme, 2000. United Nations. Indicators for sustainable development. 2007. WCED. Our Common Future. Oxford, UK: World Commission on environment and
Development, 1987. WEO. World Energy outlook. World Energy Outlook, 2007. Wirtenberg, Jeana, William G Russell, and David Lipsky. The sustainable enteprise
fieldbook: When it all comes tohether. NewYork, Atlanta, Brussels, Chicago, Mexico City, San Franisco, Shanghai, Tokyo, toronto, Washington D.C: American Management Association, 2008.
Worldwatch. Biofuel for transportation: global potential and implications for sustainable
agriculture and energy in the 21st century. Washington.D.C: worldwatch Institute, 2007.
Ziegler, Jean. “Biofuels: a right to food respective.” Makint it, industry for development 2 (2010).
Zilberman, D, T Sproul, D Rajagopal, S Sexton, and P Hellegers. “Rising energy prices and the economics od water in agriculture.” Water Policy 10, no. suppl.1 (2008): 11-21.
Mohebinejad, Shadi
PERSONAL INFORMATION
Name Shadi Mohebinejad
Address (House number, street
name, postcode, city, country) Helblinggasse 1-3/28
Vienna 1170
Austria
Telephone +436604834284
E-mail [email protected]/[email protected]
Nationality Iranian
Date of birth (Day, month, year) 23/08/1982
EDUCATION
• Date 2009-2011
• Name and type of organization Erasmus Mundus Master Program of Global Studies-offered by a consortium of five
European universities: Roskilde Universitet, London School of Economics and Political
Science, Universität Leipzig, Universität Wien, Uniwersytet Wrocławski
• Principal subjects Interdisciplinary research-based Master, includes: History, Political science, Economics,
Social Science
• Research Projects Title of Master Thesis:” Biofuel Production on Developing country: A Key to Sustainable
Development? Case Study: India “
• Level in national classification M.A
• Date 2004-2007
• Name and type of organization University of Tehran-Iran
• Principal subjects Energy Economics and Marketing
• Research Projects Thesis topic: “The effect of Macroeconomics Conditions on Banks' Credit risk" which the
article with the same title was published in "Economic Research and Reviews".
• Level in national classification M.A
• Date 2000-2004
• Name and type of organization University of Tehran
• Principal subjects Theoretical Economics
• Level in national classification B.A
Training and Certification
• Dates 2008
• Name and type of organization Central Bank of Iran
• Principal subjects Risk Management
• Title of qualification awarded Credit Risk Management
• Dates 2008
• Name and type of organization Institute for Development & Economic Research
• Principal subjects Finance
• Title of qualification awarded Advanced Financial Management
• Dates 2008
• Name and type of organization Institute for Development & Economic Research
• Principal subjects Finance
• Title of qualification awarded Investment Management
• Dates 2007-2008
• Name and type of organization Export Development Bank of Iran
• Principal subjects Banking
• Title of qualification awarded International Banking
Mohebinejad, Shadi
Publication and Awards
Article “The Effect of Macroeconomics Conditions on Banks' Credit risk" in "Economic
Research and Reviews"/Iran
“Women’s rights in Iran” INTERFER (International Reportage Festival/Serbia)
Grant Tuition Fee waiver grant from Erasmus Mundus Consortium ,due to the excellent
result of the first year of study
Personal skills
Personality communicative, high skilled in group working, strong analytical, independent,
determined, good time manager, curious and enthusiasm, energetic and hardworking
Mother tongue Persian
Other languages English(Excellent) – Germany (Intermediate)_ Spanish(Basic)_Arabic(Basic)
Technical skills
Microsoft Office( Word, excel, Power point, Access)
Eviews , SPSS, MATLAB
• Dates 2007
• Name and type of organization Export Development Bank of Iran
• Principal subjects Banking
• Title of qualification awarded Islamic Banking
Work experience
• Dates July 2011- Present
• Name and address of
employer
International Atomic Energy Agency (IAEA)
• Occupation or position held Project Assistant
• Main activities and
responsibilities
1. Working on a project about the renewable energies and sustainable development.
Combine the IAEA "Energy indicators for sustainable development (EISD)" with the
FAO indicators for agriculture and forestry using as guiding principle their relevance
for analyzing bio-fuel production in the context of sustainable development 2. Develop
brief description of data requirements, application and pitfalls in using any new
indicators (template: EISD) 3. Collect and evaluate data for three distinct regions,
identify gaps and develop strategies to cope with data gaps
• Dates April 2011- July 2011
• Name and address of
employer
United Nations Office on Drugs and Crimes (UNODC)
• Occupation or position held Project Assistant
• Main activities and
responsibilities
Collecting the data from different countries to analyze the result of treatment programs
which have been done by UNODC training package, Assistant in event organizing,
designing and preparing poster.
• Dates 2006-2009
• Name and address of
employer
Risk Management Department - Export Development Bank of Iran
• Position held Expert
• Main activities and
responsibilities
Working on identifying and measuring operational risk- Identifying and measuring
Credit Risk- Rating customers and their credit's limits- Banks' Rating- Evaluating
different banks’ risk and companies’ risk- Evaluating the countries’ risk- Monitoring
and adjusting bank’s financial statement items to Basel II standards- Preparing the
reports for international bank rating agency(Fitch)-Editing the bank’s annual report-
Regular reporting on portfolio analysis- Updating the in used models of risk evaluating
• Dates 2004-2006
• Name and address of
employer
Developing & Planning Department - Export Development Bank of Iran
• Occupation or position held Expert
• Main activities and
responsibilities
Writing and editing different structures for different department of bank- Developing
the ways of supplying facilities for customers -