Embed Size (px)
Citation preview
Nr. 90 · Februrary 1999
ISSN 0949-5266
Hartmut Stiller
Material Intensity ofAdvanced Composite Materials
Results of a study for theVerbundwerkstofflabor Bremen e.V.
Wu
pp
erta
l Pap
ers
KulturwissenschaftlichesInstitut
WissenschaftszentrumNordrhein-Westfalen
Institut Arbeitund Technik
Wuppertal Institut fürKlima, Umwelt, EnergieGmbH
This Wuppertal Paper summarises the main results of a study of the Wuppertal Institute for the
Verbundwerkstofflabor Bremen. Nowever, research on material intensity is never finished as
industry is continuously changing. Thus, results and conclusions presented here are open to
discussion and shall be treated as an invitation for further research in this area.
Abstract
In this paper the results of an analysis of the material intensity of advanced composite materials
are presented. The analysis is based on the MIPS-concept of the Wuppertal Institute which
allows the calculation of the overall material intensity of products and services. It can be shown
that the production of one kg of E-Glass fibers is connected with the consumption of 6.2 kg
materials, 95 kg water and 2.1 kg oxygen which is of similar size compared to the inputs
required in steel production. Material inputs required to produce one kg of p-aramid are 37 kg of
materials and 19.6 kg air. Values for carbon fibers are even higher yielding to 61.1 kg of abiotic
materials and 33.1 kg of air. Similarly, the production of epoxy resins is connected with larger
material flows than the production of polyester resins. Of core materials, inputs per kg for PVC-
foam exceed those in PUR-foam production by a factor of 1.4 in water to 2.3 in abiotic material
consumption.
However, ecologically decisive are not the inputs per kg but the material input per service unit.
Therefore, the material input per service unit computed for the body of a passenger ship and a
robot arm are compared with alternative steel and aluminium versions. Both examples show that
in the case of significant inputs during the user phase of products, even a more material
intensive investment in the production phase can yield significant ecological benefits over the
whole life-cycle compared to metal versions. Improvements can easily reach a factor of two
albeit significant potential for engine optimizations have still been neglected.
Results already include the actual recycling quota of metals whereas for composites only virgin
material has been calculated as any form of real recycling does not actually exist but only certain
types of downrecycling. Of those treatment options, first material recycling and second the use
in blast furnaces would lead to better results in resource productivity than incineration and
landfills.
The paper finally draws some conclusions about the potential advantages of material substitution
in the automotive industry. Due to the rather short real operation time of cars during their user
phase - around six months - an investment in advanced composite materials in car production
only results in a significant improvement of the overall eco-efficiency of cars if it allows a
substantial weight reduction of the overall vehicle.
Content
1. Introduction 4
2. Measuring resource productivity - the MIPS-concept 4
3. Specific methodology in this study 6
4. Material intensity analysis of different fiber materials 7
4.1. Glass Fibers 8
4.2. Aramid fibers 11
4.3. Carbon fibers 12
4.4. Textile production 14
5. Matrices 15
5.1. Epoxy resins 15
5.2. Polyester resins 17
6. Core materials 18
6.1. Semi-rigid PVC-foam 18
6.2. Rigid PUR-foam 21
7. Material intensity of competing materials 22
7.1. Material intensity of steel 22
7.2. Material intensity of aluminum 23
8. Applications 24
8.1. Catamaran 24
8.2. Robot arm 27
9. Disposal and recycling of composite materials 28
9.1. Re-use of material 29
9.2. Low temperature catalytic pyrolysis 30
9.3. Inverse gasification 31
9.4. Methanolysis 31
9.5. Incineration 32
9.6. Steel-making processes 32
9.7. Comparision of the various options for disposal 33
10. Conclusions 34
___________________________________________________________________________
1. Introduction
Today eco-efficiency is broadly accepted as one of the most promising strategies towards
sustainable development. Science, governments1, international organisations2 but also business3
see eco-efficiency as being essential to answering the global ecological challenge. Whereas less
unanimity exists when it comes to the detailed definition of eco-efficiency, all concepts call for a
more efficient use of natural resources. This means that not only energy but all natural resources
have to be taken into account. Among others, the Wuppertal Institute calls for a reduction in the
use of material, energy and space4.
Sustainable development calls for respecting the limited carrying capacity of our planet.
Actually, however, the total volume of material flows (except water and air) moved by mankind
exceeds even the total material flows by nature on a global scale. Obviously such human
interference changes natural equilibria in an unknown direction. Thus, not limited supply but the
inevitable impact on the environment which is related to the extraction and use of natural
resources is the principle constraint we are facing today. Therefore, a 50% reduction in global
material flows seems to be necessary as a first step to re-stabilize the ecosphere. Together with a
further increase in wealth and a more equal use of those limited capacities, an increase in
material productivity by a factor of 4 to 10 of our economy has to be achieved over the next
decades5.
One strategy to meet this ambitious goal is the development and use of new materials.
Therefore, the Wuppertal Institute has been asked by the Verbundwerkstofflabor Bremen to
analyse whether an extended use of advanced composite materials offers one option to meet this
ecologicial challenge.
2. Measuring resource productivity - the MIPS-concept
If the extend of our consumption of natural resources is to be reduced, an appropriate measure
has to be found. Otherwise eco-efficiency remains a catchword without any chance of it being
implemented in business and politics. Eco-efficiency requires an indicator which does not
require specific modifications but can be applied globally. Moreover, general considerations for
1 see: Deutscher Bundestag, Enquete-Kommission zum Schutz des Menschen und der Umwelt, Endbericht 1998.2 see: OECD: A strategy for further OECD work on sustainable development, C(98)46, Paris 1998.3 see: World Business Council for Sustainable Development (WBCSD), Annual Report 1997.4see: Schmidt-Bleek, F.: Wieviel Umwelt braucht der Mensch ? mips - Das Maß für ökologisches Wirtschaften,Basel 1994.5Carnoules Declaration, Factor 10 Club, 1997. Weizsäcker, E.U. von, Lovins, A.B., Lovins, A.H.: Faktor vier.Doppelter Wohlstand - halbierter Naturverbrauch, München 1995.
___________________________________________________________________________
indicators like the ability to be communicated favour simple, easily calculable proxies instead of
very sophisticated and complicated measures. Nevertheless, such simple measures have to be of
high ecological relevance6.
The MIPS indicator developed at the Wuppertal Institute meets all these criteria. MIPS stands
for „material input per service unit“. It serves as a proxy for the quantitative dimension of the
ecological impact potential of human activities. MIPS is calculated over the whole life-cycle of
goods and adds up the overall material input which humans move or extract for the production
of products and the delivery of services. The dimension of MIPS is kg per service unit. The
inverse of MIPS is resource productivity.
The material input is accounted in five categories7: abiotic raw materials, biotic raw materials,
water, erosion and air. The category abiotic raw materials covers all minerals and ores extracted
in mining operations, but also the total overburden and other earth movements. For the
environment it does not matter whether gravel is shifted away only as overburden during lignite
mining or if it is extracted for construction purposes. Moreover, and very important, all fossil
fuels like coal, crude oil, etc., are included in this category. As it is not the energy itself but the
related material flows which change ecological equilibria, those inputs are determined in mass
units.
Biotic raw materials are not only all products of modern agriculture and forestry but also all
biomass which is cut but not used during processing. Domestic animals are considered as being
part of the technosphere. Here all feeding inputs are analysed. Additionally, directly harvested
products like fish or mushrooms fall within this category.
Third, the quantitative dimension of the change of nature due to human agriculture and forestry
has to be taken into account. Schmidt-Bleek stresses the impact potential of ploughing on large
parts of this planet. However, for practical reasons, human induced erosion is taken as the
material flow of highest ecological relevance in this category.
Beside these flows of solids mankind also intervenes in the flows of (sweet) water on Earth. In
the MIPS concept all actively extracted or diverted water flows are accounted. This includes the
extraction of ground and surface water, cooling water in power generation and industries, water
for irrigation in agriculture, but also rivers diverted to other places and water running off from
sealed areas. Thus, it is not water pollution but rather the influence on eco- systems due to
changes in water flows which is indicated by this category.
6 see: Schmidt-Bleek, F., loc. cit.7 see: Schmidt-Bleek et al.: Handbuch der Materialintensitätsanalyse, Basel 1998.
___________________________________________________________________________
Finally, all air chemically processed or converted into another physical state is measured in the
category air. This figure is strongly correlated with the CO2-emissions as principal gaseous
output of processes. However, also oxygen reacting with other molecules, such as for example
hydrogen, is included. Thus, this category reflects rather the potential mobilisation of atoms
which are up to now bound in the litosphere when processing transforms the whole volume of
the material handled. Fossil fuels are only one but, of course, the most important one among
other materials in this respect.
Those material flows which are not forming part of the product itself but which are „hidden“
flows are called the „ecological rucksack“. If there are two or more products produced in one
process, the ecological rucksack generally is distributed to these products according to the mass
of each product. Besides this, as in the case of energetic outputs and services, other parameters
like energy content or even prices might serve as the basis for the allocation. Waste or by-
products are not assigned an ecological rucksack. They only bear the inputs for their further
processing. This implies that - if an efficient recycling technology exists - secondary materials
have a rather small ecological rucksack which makes them favorable as alternative inputs
compared to virgin ones.
In principle, MIPS can be reduced - or equally the resource productivity increased - by two
strategies: first, reducing the „MI“ (material input) - either by advanced production processes,
closing of material cycles, substitution towards materials with a reduced ecological rucksack;
second, enhancing „PS“ by a given material input. Here, options range from higher user
frequency and longevity, to a better organisation increasing the services delivered by a product.
To reach a factor 4 or even 10 both strategies will have to be combined. Therefore, besides
analysing the improvement potential on the input side, in this study the service delivered during
the user phase is included in the analysis.
3. Specific methodology in this study
An isolated national market for composite materials does not exist. Sourcing occurs globally or
at least on a European scale. Consequently, this study tries to reflect the west European
situation. In cases where only German data from older studies are available, rucksacks have
been adjusted as far as electricity is concerned.
The treatment of electricity is a crucial point in each material intensity analysis - as in each life-
cycle-analysis. Depending on the energy carrier and the technology, the ecological rucksack of
one unit of electricity can vary by up to a factor of 10 and more. Thus, as electricity is used in
nearly all production processes, results are hardly influenced by the choice of the methodology
___________________________________________________________________________
for their calculation. In this study for all electricity used the average material input in the
European OECD-countries has been used. As long as not all or at least the majority of all
production sites are analysed, the comparison of different kinds of materials should not depend
on the place from where the specific data have been obtained.
This implies that materials produced in countries with a rather less material intensive electricity
production, like Sweden which uses a huge amount of hydropower, or France with its -
compared to lignite - less material intensive nuclear power, are treated equally to products
coming from plants located in Germany.
Best would be to know every input for all processes. Of course, this is not the case. Instead,
analysts are lucky to know the bulk inputs, notwithstanding all catalysator and trace materials.
Fortunately, these substances are only of minor importance for the results of a material intensity
analysis.
Determining an average can be done in two ways: either at each step of production or just at the
final stage. The problem with the last is that it requires complete information on all production
sites. This approach has been applied in the publications of the Association of the Plastic
Manufacturers in Europe (APME) based on input data of nearly all large manufacturers. If data
of the APME have been used - for chlorine and PVC - these averages have not be adjusted. For
all other processes, such an approach was lacking the required information basis. Thus, average
data on the ecological rucksack for the inputs in each production step has been used in the
calculations, even when other specific information for one plant was available.
Advanced composite materials are rather new materials. Thus, recycling technology is still
under development. Consequently, in the calculations of the applications using composite
materials always virgin inputs have been considered as no real recycling of those materials
actually exists. Future options are discussed separately in chapter 8.
4. Material intensity analysis of different fiber materials
As opposed to common metal materials, fibers have anisotropic properties. High modulus and
strength in one direction is accompanied by only limited strength in the lateral dimension. But in
a lot of applications, just one direction is in fact hardly strained. Moreover, combining different
fibers and cores with an appropriate matrix allows the design of specific material properties. In
the following, some of the most common basic materials for advanced composite materials will
be analysed.
___________________________________________________________________________
4.1. Glass Fibers
E-glass fibers are the most common basic material for reinforced plastics. They are also used in
a lot of other applications, ranging from telecommunications to insulation materials. Of the
various types of glass fibers, E-glass is by far the most important with a market share of about
99%. For special applications R-glass or S-glass are used which have a higher modulus and are
also applicable in an alkaline environment.
The production chain of glass fibers starts with mining of the raw materials used for glass
melting. The most important ones are glass sand, china clay, borate or colemanite, limestone,
fluor and sulfates. Whereas the broad chemical composition of glass fibers is harmonized in
certain ranges, specific batch composition is part of the know-how of the manufacturers and
depends largely on the deposits of raw materials. The raw materials are milled, sometimes
pelletized to reduce energy consumption and then molten in glass furnaces.
In general, those furnaces are heated with natural gas. However, heating with electricity can
reduce final energy demand significantly but for the overall resource productivity material flows
for electricity production also have to be accounted.
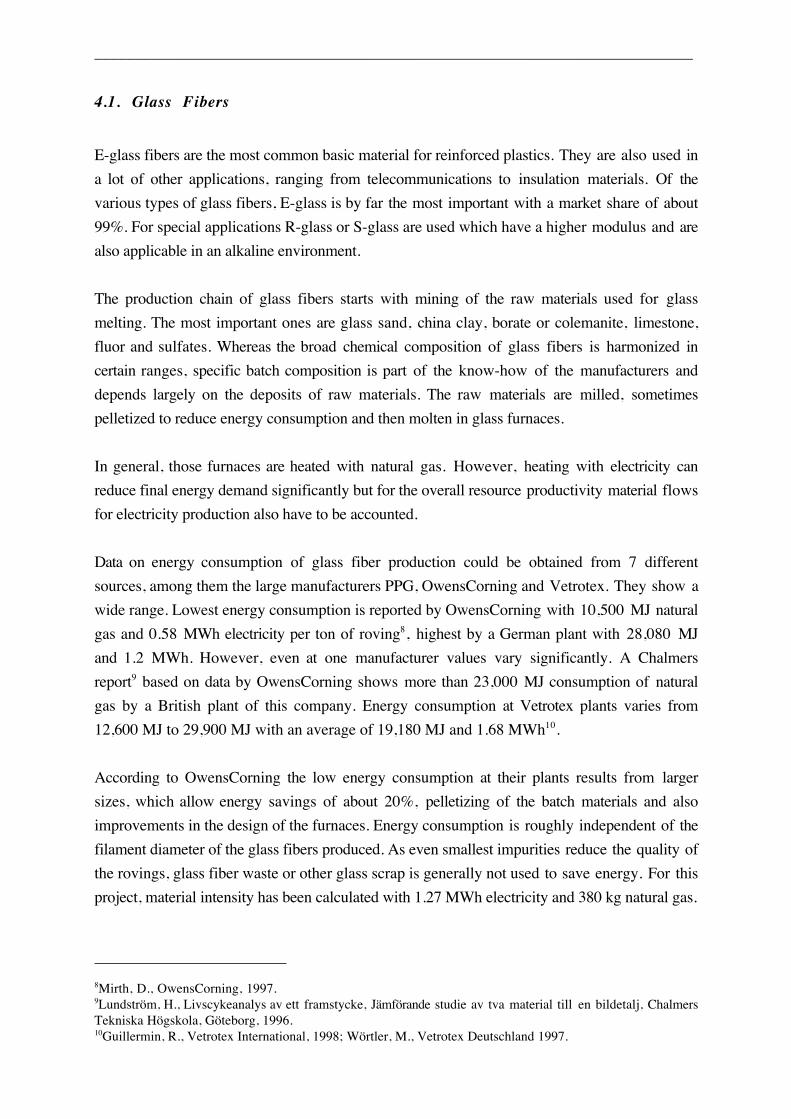
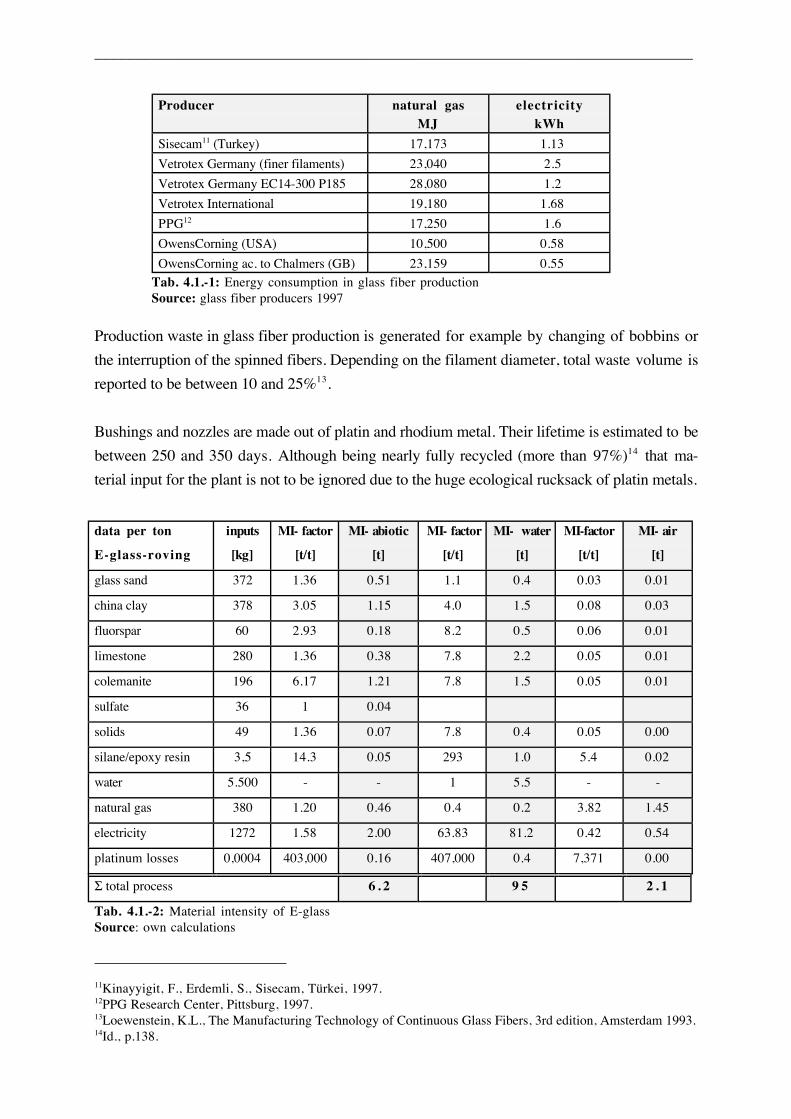
Data on energy consumption of glass fiber production could be obtained from 7 different
sources, among them the large manufacturers PPG, OwensCorning and Vetrotex. They show a
wide range. Lowest energy consumption is reported by OwensCorning with 10,500 MJ natural
gas and 0.58 MWh electricity per ton of roving8, highest by a German plant with 28,080 MJ
and 1.2 MWh. However, even at one manufacturer values vary significantly. A Chalmers
report9 based on data by OwensCorning shows more than 23,000 MJ consumption of natural
gas by a British plant of this company. Energy consumption at Vetrotex plants varies from
12,600 MJ to 29,900 MJ with an average of 19,180 MJ and 1.68 MWh10.
According to OwensCorning the low energy consumption at their plants results from larger
sizes, which allow energy savings of about 20%, pelletizing of the batch materials and also
improvements in the design of the furnaces. Energy consumption is roughly independent of the
filament diameter of the glass fibers produced. As even smallest impurities reduce the quality of
the rovings, glass fiber waste or other glass scrap is generally not used to save energy. For this
project, material intensity has been calculated with 1.27 MWh electricity and 380 kg natural gas.
8Mirth, D., OwensCorning, 1997.9Lundström, H., Livscykeanalys av ett framstycke, Jämförande studie av tva material till en bildetalj, Chalmers Tekniska Högskola, Göteborg, 1996.10Guillermin, R., Vetrotex International, 1998; Wörtler, M., Vetrotex Deutschland 1997.
___________________________________________________________________________
Producer natural gasMJ
electricitykWh
Sisecam11 (Turkey) 17,173 1.13
Vetrotex Germany (finer filaments) 23,040 2.5
Vetrotex Germany EC14-300 P185 28,080 1.2
Vetrotex International 19,180 1.68
PPG12 17,250 1.6
OwensCorning (USA) 10,500 0.58
OwensCorning ac. to Chalmers (GB) 23,159 0.55
Tab. 4.1.-1: Energy consumption in glass fiber productionSource: glass fiber producers 1997
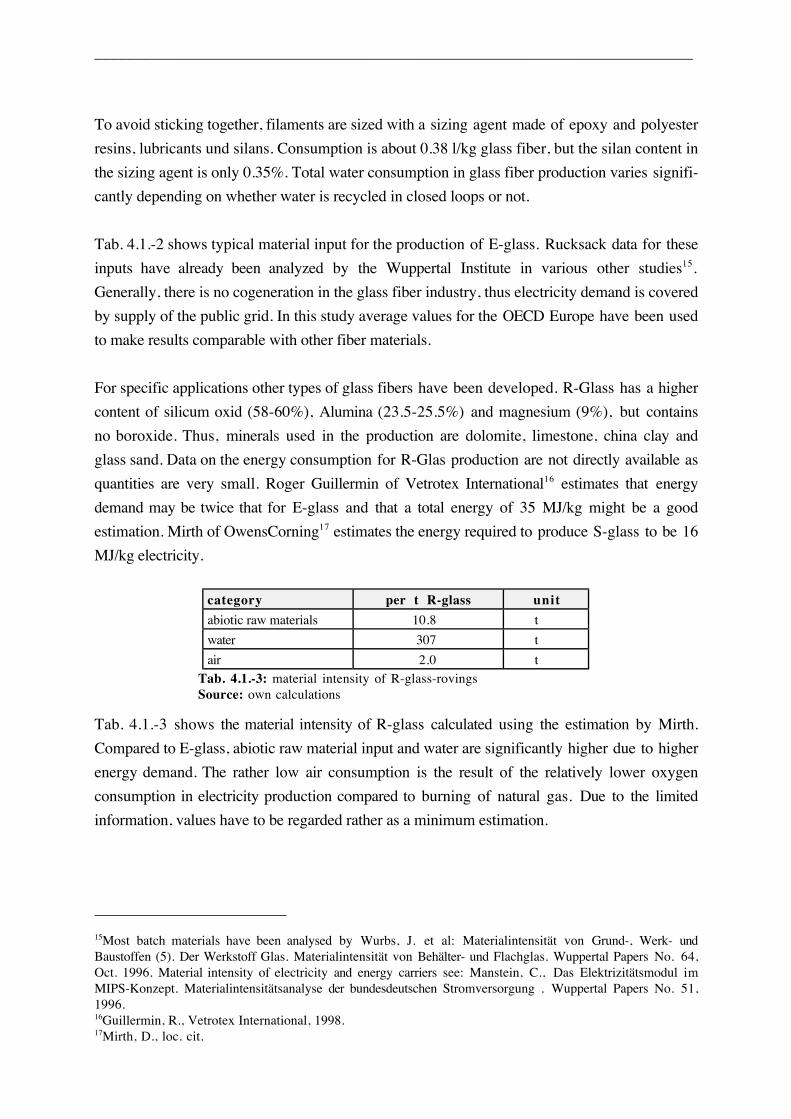
Production waste in glass fiber production is generated for example by changing of bobbins or
the interruption of the spinned fibers. Depending on the filament diameter, total waste volume is
reported to be between 10 and 25%13.
Bushings and nozzles are made out of platin and rhodium metal. Their lifetime is estimated to be
between 250 and 350 days. Although being nearly fully recycled (more than 97%)14 that ma-
terial input for the plant is not to be ignored due to the huge ecological rucksack of platin metals.
data per ton
E-glass-roving
inputs
[kg]
MI- factor
[t/t]
MI- abiotic
[t]
MI- factor
[t/t]
MI- water
[t]
MI-factor
[t/t]
MI- air
[t]
glass sand 372 1.36 0.51 1.1 0.4 0.03 0.01
china clay 378 3.05 1.15 4.0 1.5 0.08 0.03
fluorspar 60 2.93 0.18 8.2 0.5 0.06 0.01
limestone 280 1.36 0.38 7.8 2.2 0.05 0.01
colemanite 196 6.17 1.21 7.8 1.5 0.05 0.01
sulfate 36 1 0.04
solids 49 1.36 0.07 7.8 0.4 0.05 0.00
silane/epoxy resin 3,5 14.3 0.05 293 1.0 5.4 0.02
water 5.500 - - 1 5.5 - -
natural gas 380 1.20 0.46 0.4 0.2 3.82 1.45
electricity 1272 1.58 2.00 63.83 81.2 0.42 0.54
platinum losses 0,0004 403,000 0.16 407,000 0.4 7,371 0.00
Σ total process 6 . 2 9 5 2 . 1
Tab. 4.1.-2: Material intensity of E-glassSource: own calculations
11Kinayyigit, F., Erdemli, S., Sisecam, Türkei, 1997.12PPG Research Center, Pittsburg, 1997.13Loewenstein, K.L., The Manufacturing Technology of Continuous Glass Fibers, 3rd edition, Amsterdam 1993.14Id., p.138.
___________________________________________________________________________
To avoid sticking together, filaments are sized with a sizing agent made of epoxy and polyester
resins, lubricants und silans. Consumption is about 0.38 l/kg glass fiber, but the silan content in
the sizing agent is only 0.35%. Total water consumption in glass fiber production varies signifi-
cantly depending on whether water is recycled in closed loops or not.
Tab. 4.1.-2 shows typical material input for the production of E-glass. Rucksack data for these
inputs have already been analyzed by the Wuppertal Institute in various other studies15.
Generally, there is no cogeneration in the glass fiber industry, thus electricity demand is covered
by supply of the public grid. In this study average values for the OECD Europe have been used
to make results comparable with other fiber materials.
For specific applications other types of glass fibers have been developed. R-Glass has a higher
content of silicum oxid (58-60%), Alumina (23.5-25.5%) and magnesium (9%), but contains
no boroxide. Thus, minerals used in the production are dolomite, limestone, china clay and
glass sand. Data on the energy consumption for R-Glas production are not directly available as
quantities are very small. Roger Guillermin of Vetrotex International16 estimates that energy
demand may be twice that for E-glass and that a total energy of 35 MJ/kg might be a good
estimation. Mirth of OwensCorning17 estimates the energy required to produce S-glass to be 16
MJ/kg electricity.
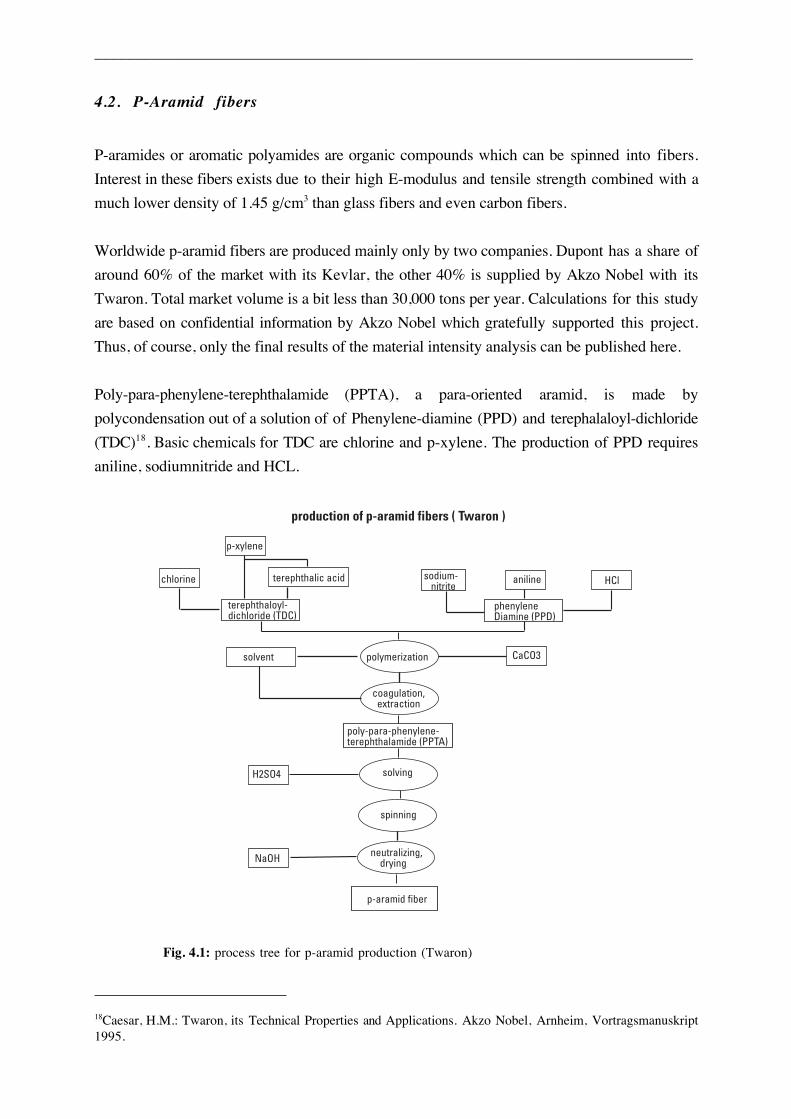
category per t R-glass unit
abiotic raw materials 10.8 t
water 307 t
air 2.0 t
Tab. 4.1.-3: material intensity of R-glass-rovingsSource: own calculations
Tab. 4.1.-3 shows the material intensity of R-glass calculated using the estimation by Mirth.
Compared to E-glass, abiotic raw material input and water are significantly higher due to higher
energy demand. The rather low air consumption is the result of the relatively lower oxygen
consumption in electricity production compared to burning of natural gas. Due to the limited
information, values have to be regarded rather as a minimum estimation.
15Most batch materials have been analysed by Wurbs, J. et al: Materialintensität von Grund-, Werk- undBaustoffen (5). Der Werkstoff Glas. Materialintensität von Behälter- und Flachglas. Wuppertal Papers No. 64,Oct. 1996. Material intensity of electricity and energy carriers see: Manstein, C., Das Elektrizitätsmodul imMIPS-Konzept. Materialintensitätsanalyse der bundesdeutschen Stromversorgung . Wuppertal Papers No. 51,1996.16Guillermin, R., Vetrotex International, 1998.17Mirth, D., loc. cit.
___________________________________________________________________________
4.2. P-Aramid fibers
P-aramides or aromatic polyamides are organic compounds which can be spinned into fibers.
Interest in these fibers exists due to their high E-modulus and tensile strength combined with a
much lower density of 1.45 g/cm3 than glass fibers and even carbon fibers.
Worldwide p-aramid fibers are produced mainly only by two companies. Dupont has a share of
around 60% of the market with its Kevlar, the other 40% is supplied by Akzo Nobel with its
Twaron. Total market volume is a bit less than 30,000 tons per year. Calculations for this study
are based on confidential information by Akzo Nobel which gratefully supported this project.
Thus, of course, only the final results of the material intensity analysis can be published here.
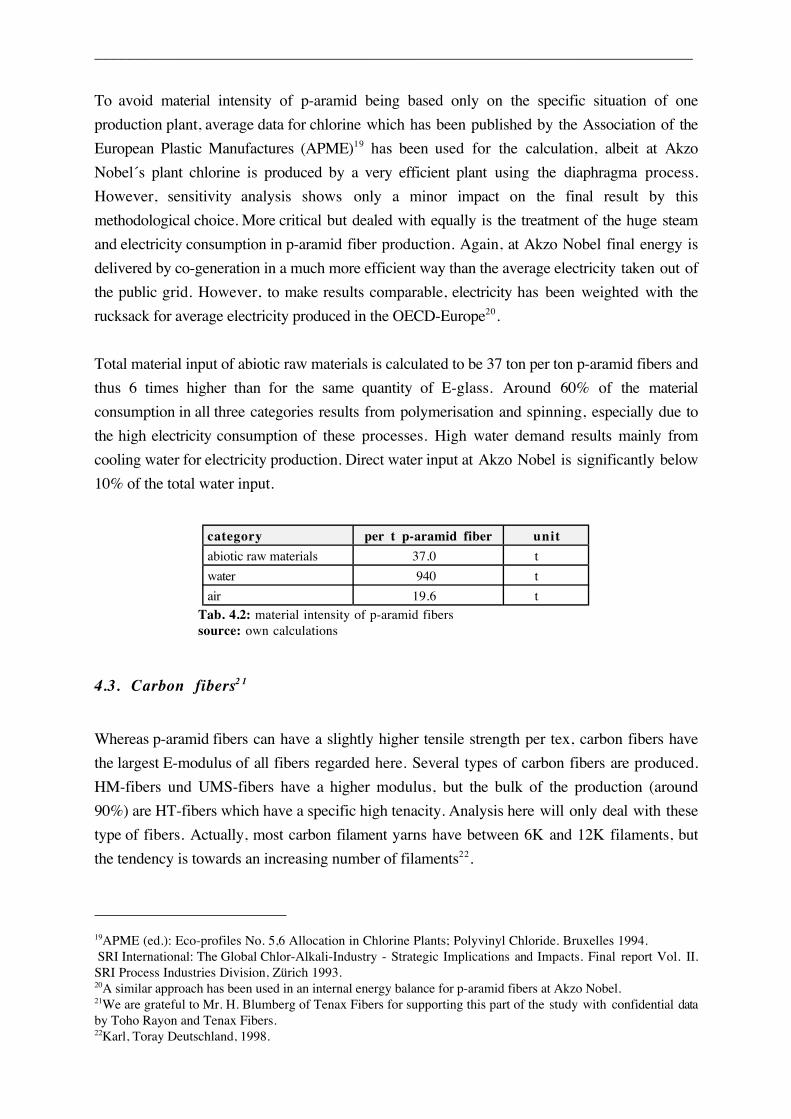
Poly-para-phenylene-terephthalamide (PPTA), a para-oriented aramid, is made by
polycondensation out of a solution of of Phenylene-diamine (PPD) and terephalaloyl-dichloride
(TDC)18. Basic chemicals for TDC are chlorine and p-xylene. The production of PPD requires
aniline, sodiumnitride and HCL.
terephthalic acid
production of p-aramid fibers ( Twaron )
solving
spinning
coagulation, extraction
p-aramid fiber
sodium- nitrite
aniline HCl
phenyleneDiamine (PPD)
terephthaloyl-dichloride (TDC)
polymerization
H2SO4
NaOH neutralizing, drying
solvent
p-xylene
CaCO3
chlorine
poly-para-phenylene-terephthalamide (PPTA)
Fig. 4.1: process tree for p-aramid production (Twaron)
18Caesar, H.M.: Twaron, its Technical Properties and Applications. Akzo Nobel, Arnheim, Vortragsmanuskript1995.
___________________________________________________________________________
To avoid material intensity of p-aramid being based only on the specific situation of one
production plant, average data for chlorine which has been published by the Association of the
European Plastic Manufactures (APME)19 has been used for the calculation, albeit at Akzo
Nobel´s plant chlorine is produced by a very efficient plant using the diaphragma process.
However, sensitivity analysis shows only a minor impact on the final result by this
methodological choice. More critical but dealed with equally is the treatment of the huge steam
and electricity consumption in p-aramid fiber production. Again, at Akzo Nobel final energy is
delivered by co-generation in a much more efficient way than the average electricity taken out of
the public grid. However, to make results comparable, electricity has been weighted with the
rucksack for average electricity produced in the OECD-Europe20.
Total material input of abiotic raw materials is calculated to be 37 ton per ton p-aramid fibers and
thus 6 times higher than for the same quantity of E-glass. Around 60% of the material
consumption in all three categories results from polymerisation and spinning, especially due to
the high electricity consumption of these processes. High water demand results mainly from
cooling water for electricity production. Direct water input at Akzo Nobel is significantly below
10% of the total water input.
category per t p-aramid fiber unit
abiotic raw materials 37.0 t
water 940 t
air 19.6 t
Tab. 4.2: material intensity of p-aramid fiberssource: own calculations
4.3. Carbon fibers2 1
Whereas p-aramid fibers can have a slightly higher tensile strength per tex, carbon fibers have
the largest E-modulus of all fibers regarded here. Several types of carbon fibers are produced.
HM-fibers und UMS-fibers have a higher modulus, but the bulk of the production (around
90%) are HT-fibers which have a specific high tenacity. Analysis here will only deal with these
type of fibers. Actually, most carbon filament yarns have between 6K and 12K filaments, but
the tendency is towards an increasing number of filaments22.
19APME (ed.): Eco-profiles No. 5,6 Allocation in Chlorine Plants; Polyvinyl Chloride. Bruxelles 1994. SRI International: The Global Chlor-Alkali-Industry - Strategic Implications and Impacts. Final report Vol. II.SRI Process Industries Division, Zürich 1993.20A similar approach has been used in an internal energy balance for p-aramid fibers at Akzo Nobel.21We are grateful to Mr. H. Blumberg of Tenax Fibers for supporting this part of the study with confidential databy Toho Rayon and Tenax Fibers.22Karl, Toray Deutschland, 1998.
___________________________________________________________________________
World production capacity of carbon fibers is only a tiny fraction compared to glass fibers. It is
estimated to be 18,050 tons in 199823. Demand has been growing steadily in recent years due to
the increasing use of carbon fibers by industry. Other major markets are sports equipment
producers and the civil aircraft industry.
The process chain of carbon fibers starts with acrylnitrile production which is produced mainly
by oxidation of ammonium and propylen in the so called SOHIO-process. By-products such as
cyancali acid and CO can be sold. In the next step the acrylnitrile is polymerized mostly by
dissolving it in dimethylformamide. However, other solvents such as ZnCl2 are also used which
are said to yield fibers with better material properties but require huge inputs of steam in the
production of the precursor. As the polymerization has an impact on the performance of the final
fibers, each (independent) manufacturer has its own specific polymerization process.
Afterwards the polyacrilnitrile is dissolved again for the spinning of PAN-yarn. The PAN-
precursor then undergoes a high temperature treatment for stabilisation, carbonisation and - for
specific applications - also further graphitisation. Finally, the fibers are sized with sizing agent
to improve the later reactions with the matrices.
Production of carbon fibers is a resource intensive process. Of each kg polyacrylnitrile only
about 450 to 500 gs are transferred into the final product24. The rest is lost due to changing
chemical composition in the stabilisation and the carbonisation process. Thus, increasing yields
would reduce cost and improve resource productivity. However, up to now yields significantly
higher than 50% have not been reported. Pitch as basic material would allow a much higher
transformation rate of up to 85%, but shows other disadvantages and is therefore used today
only in negligible quantities.
Publicly available information on energy and material inputs of carbon fiber production are
scarce. In Zogg25 an energy equivalent of 286 MJ/kg is reported, more than 10 times the energy
required for the production of one kg of steel. A Toray specialist has estimated total energy
consumption roughly to be 280 - 340 MJ/kg26. Of this input, around 160 MJ are required just
for the production of the two kg of acrylnitrile. In this study the calculation of the material
intensity is based on data submitted confidentially by Tenax Fibers and Toho Rayon27. Thanks
to detailed information even equipment like the furnaces could be included in the analysis. The
total energy requirement in this study cannot be reported here, but is influenced by the fact that
23Karl, loc. cit.24Blumberg, H.: Fibers for composites - status quo and trends. In: Chemical Fibers International, Vol. 47, Feb.1997, p. 36-41.25Zogg, M., Neue Wege zum Recycling von faserverstärkten Kunststoffen, IKB-Zürich 1996.26According to Karl, Toray Deutschland, 1997.27Blumberg, H., Tenax Fibers, Wuppertal 1997.
___________________________________________________________________________
the precursor used is produced by using ZnCl2 whereas the above mentioned figures are based
on precursors made by using dimethylformamide as a solvent.
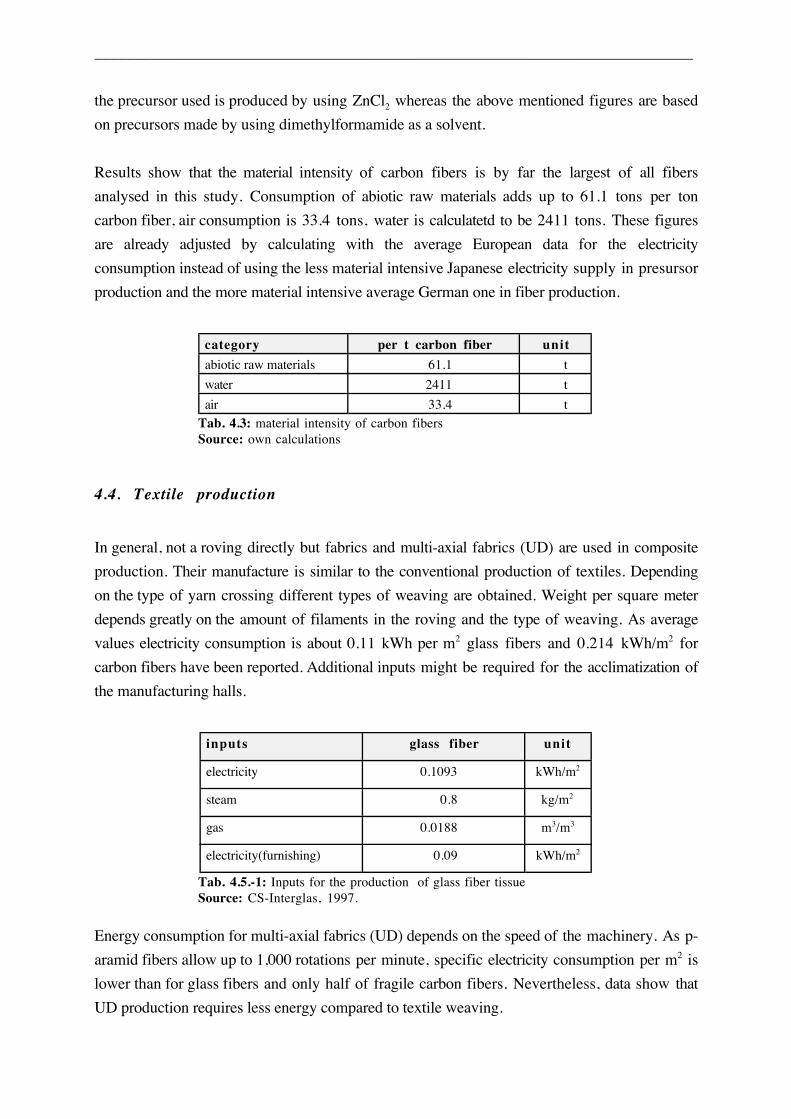
Results show that the material intensity of carbon fibers is by far the largest of all fibers
analysed in this study. Consumption of abiotic raw materials adds up to 61.1 tons per ton
carbon fiber, air consumption is 33.4 tons, water is calculatetd to be 2411 tons. These figures
are already adjusted by calculating with the average European data for the electricity
consumption instead of using the less material intensive Japanese electricity supply in presursor
production and the more material intensive average German one in fiber production.
category per t carbon fiber unit
abiotic raw materials 61.1 t
water 2411 t
air 33.4 t
Tab. 4.3: material intensity of carbon fibersSource: own calculations
4.4. Textile production
In general, not a roving directly but fabrics and multi-axial fabrics (UD) are used in composite
production. Their manufacture is similar to the conventional production of textiles. Depending
on the type of yarn crossing different types of weaving are obtained. Weight per square meter
depends greatly on the amount of filaments in the roving and the type of weaving. As average
values electricity consumption is about 0.11 kWh per m2 glass fibers and 0.214 kWh/m2 for
carbon fibers have been reported. Additional inputs might be required for the acclimatization of
the manufacturing halls.
inputs glass fiber unit
electricity 0.1093 kWh/m2
steam 0.8 kg/m2
gas 0.0188 m3/m3
electricity(furnishing) 0.09 kWh/m2
Tab. 4.5.-1: Inputs for the production of glass fiber tissueSource: CS-Interglas, 1997.
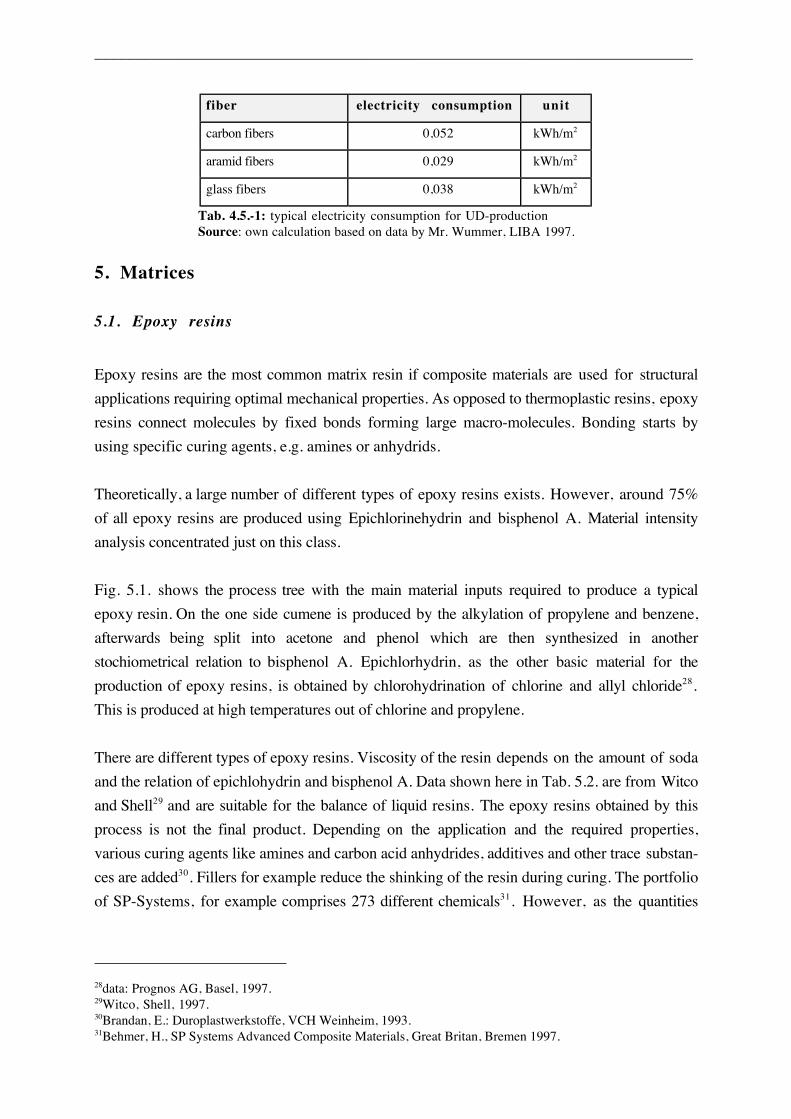
Energy consumption for multi-axial fabrics (UD) depends on the speed of the machinery. As p-
aramid fibers allow up to 1,000 rotations per minute, specific electricity consumption per m2 is
lower than for glass fibers and only half of fragile carbon fibers. Nevertheless, data show that
UD production requires less energy compared to textile weaving.
___________________________________________________________________________
fiber electricity consumption unit
carbon fibers 0,052 kWh/m2
aramid fibers 0,029 kWh/m2
glass fibers 0,038 kWh/m2
Tab. 4.5.-1: typical electricity consumption for UD-productionSource: own calculation based on data by Mr. Wummer, LIBA 1997.
5. Matrices
5.1. Epoxy resins
Epoxy resins are the most common matrix resin if composite materials are used for structural
applications requiring optimal mechanical properties. As opposed to thermoplastic resins, epoxy
resins connect molecules by fixed bonds forming large macro-molecules. Bonding starts by
using specific curing agents, e.g. amines or anhydrids.
Theoretically, a large number of different types of epoxy resins exists. However, around 75%
of all epoxy resins are produced using Epichlorinehydrin and bisphenol A. Material intensity
analysis concentrated just on this class.
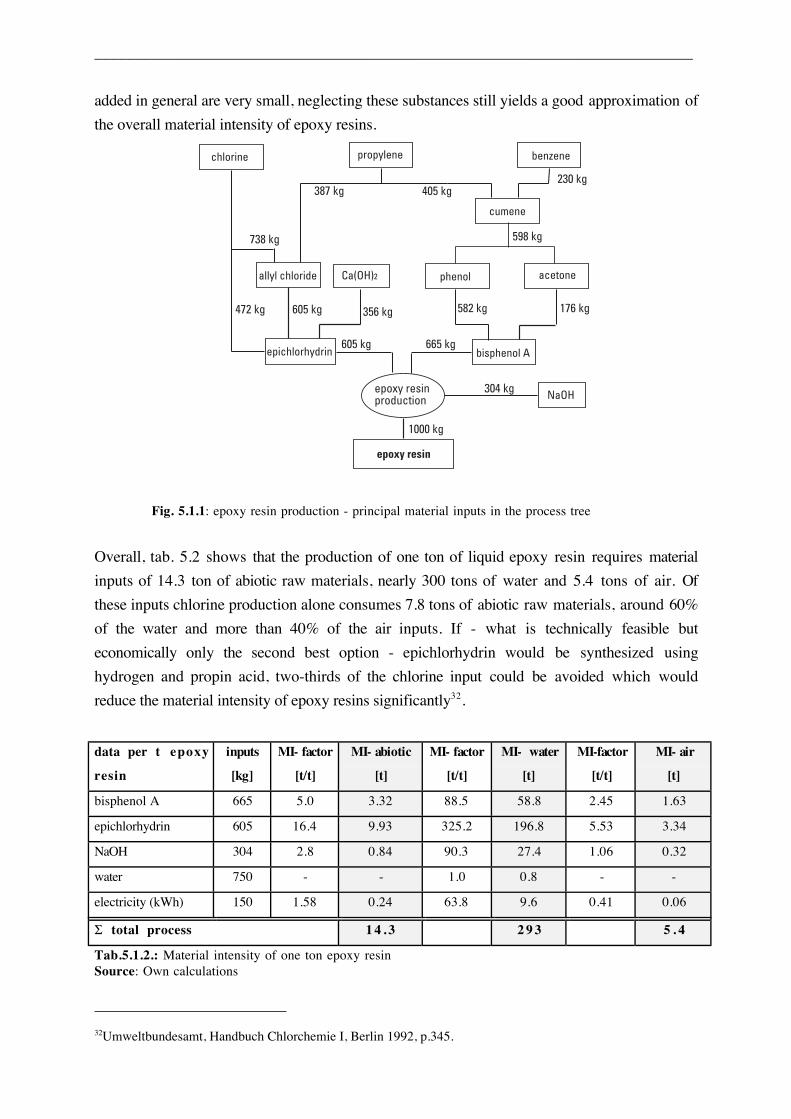
Fig. 5.1. shows the process tree with the main material inputs required to produce a typical
epoxy resin. On the one side cumene is produced by the alkylation of propylene and benzene,
afterwards being split into acetone and phenol which are then synthesized in another
stochiometrical relation to bisphenol A. Epichlorhydrin, as the other basic material for the
production of epoxy resins, is obtained by chlorohydrination of chlorine and allyl chloride28.
This is produced at high temperatures out of chlorine and propylene.
There are different types of epoxy resins. Viscosity of the resin depends on the amount of soda
and the relation of epichlohydrin and bisphenol A. Data shown here in Tab. 5.2. are from Witco
and Shell29 and are suitable for the balance of liquid resins. The epoxy resins obtained by this
process is not the final product. Depending on the application and the required properties,
various curing agents like amines and carbon acid anhydrides, additives and other trace substan-
ces are added30. Fillers for example reduce the shinking of the resin during curing. The portfolio
of SP-Systems, for example comprises 273 different chemicals31. However, as the quantities
28data: Prognos AG, Basel, 1997.29Witco, Shell, 1997.30Brandan, E.: Duroplastwerkstoffe, VCH Weinheim, 1993.31Behmer, H., SP Systems Advanced Composite Materials, Great Britan, Bremen 1997.
___________________________________________________________________________
added in general are very small, neglecting these substances still yields a good approximation of
the overall material intensity of epoxy resins.
chlorine
epoxy resinproduction
allyl chloride acetonephenol
cumene
benzene
NaOH
epichlorhydrin bisphenol A
Ca(OH)2
propylene
epoxy resin
405 kg230 kg
387 kg
738 kg
472 kg
598 kg
176 kg582 kg
665 kg605 kg
304 kg
356 kg605 kg
1000 kg
Fig. 5.1.1: epoxy resin production - principal material inputs in the process tree
Overall, tab. 5.2 shows that the production of one ton of liquid epoxy resin requires material
inputs of 14.3 ton of abiotic raw materials, nearly 300 tons of water and 5.4 tons of air. Of
these inputs chlorine production alone consumes 7.8 tons of abiotic raw materials, around 60%
of the water and more than 40% of the air inputs. If - what is technically feasible but
economically only the second best option - epichlorhydrin would be synthesized using
hydrogen and propin acid, two-thirds of the chlorine input could be avoided which would
reduce the material intensity of epoxy resins significantly32.
data per t epoxy
resin
inputs
[kg]
MI- factor
[t/t]
MI- abiotic
[t]
MI- factor
[t/t]
MI- water
[t]
MI-factor
[t/t]
MI- air
[t]
bisphenol A 665 5.0 3.32 88.5 58.8 2.45 1.63
epichlorhydrin 605 16.4 9.93 325.2 196.8 5.53 3.34
NaOH 304 2.8 0.84 90.3 27.4 1.06 0.32
water 750 - - 1.0 0.8 - -
electricity (kWh) 150 1.58 0.24 63.8 9.6 0.41 0.06
Σ total process 1 4 . 3 2 9 3 5 . 4
Tab.5.1.2.: Material intensity of one ton epoxy resinSource: Own calculations
32Umweltbundesamt, Handbuch Chlorchemie I, Berlin 1992, p.345.
___________________________________________________________________________
5.2. Polyester resins
Polyester resins have been used for a long time used for reinforced plastics. They are much
cheaper than their epoxy competitors. Unfortunately, polyester resins do not reach the same
performance as epoxy resins. Thus, they are used in applications where less critical properties
are required.
Of the huge family of polyester resins, two specific types of resins have been analysed here: a
resin based on Iso-neopentylglycol (NPG) which shows good water resistance and is used in
ship building, and a cheaper resin based on orthophthalic acid.
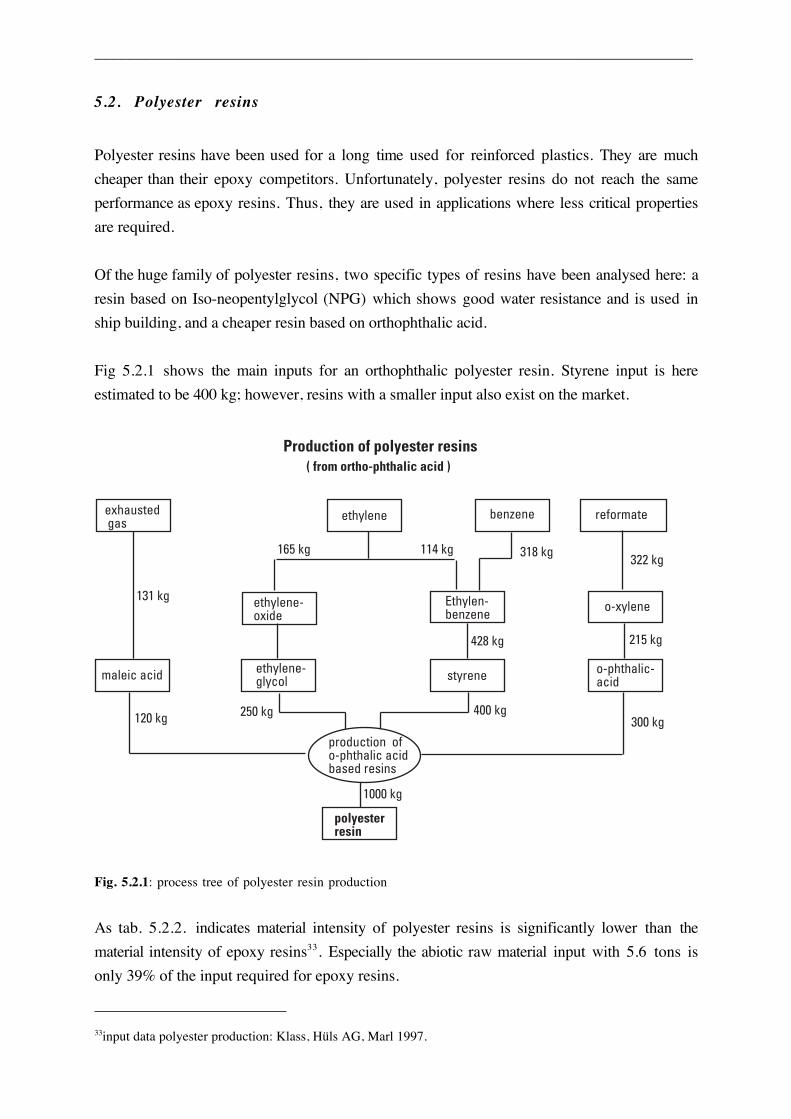
Fig 5.2.1 shows the main inputs for an orthophthalic polyester resin. Styrene input is here
estimated to be 400 kg; however, resins with a smaller input also exist on the market.
styrene o-phthalic-acid
ethylene-glycolmaleic acid
o-xylene
reformateexhausted gas
benzeneethylene
Ethylen-benzene
polyesterresin
production ofo-phthalic acidbased resins
ethylene-oxide
300 kg400 kg120 kg 250 kg
165 kg 114 kg
428 kg
318 kg
215 kg
322 kg
1000 kg
131 kg
Production of polyester resins( from ortho-phthalic acid )
Fig. 5.2.1: process tree of polyester resin production
As tab. 5.2.2. indicates material intensity of polyester resins is significantly lower than the
material intensity of epoxy resins33. Especially the abiotic raw material input with 5.6 tons is
only 39% of the input required for epoxy resins.
33input data polyester production: Klass, Hüls AG, Marl 1997.
___________________________________________________________________________
The production chain for Iso-NPG is a little bit more complicated as neopentyl-glycol is pro-
duced by formaldehyde and isobutylaldeyde. Instead of o-xylene, m-xylene is used to produce
iso-phathalic acid. Malein acid is replaced by fumaric acid. Material intensity analysis yields
inputs of 5.4 tons of abiotic raw materials, 209 tons of water and 3.2 tons of air. However, it
has to be mentioned that for some process steps - the production of neopentylglycol, isobutylal-
dehyde and m-xylene no specific process data could be obtained. If those processes were fully
balanced, material intensity of Iso-NPG would probably be higher than the value calculated for
orthophthalic based resins.
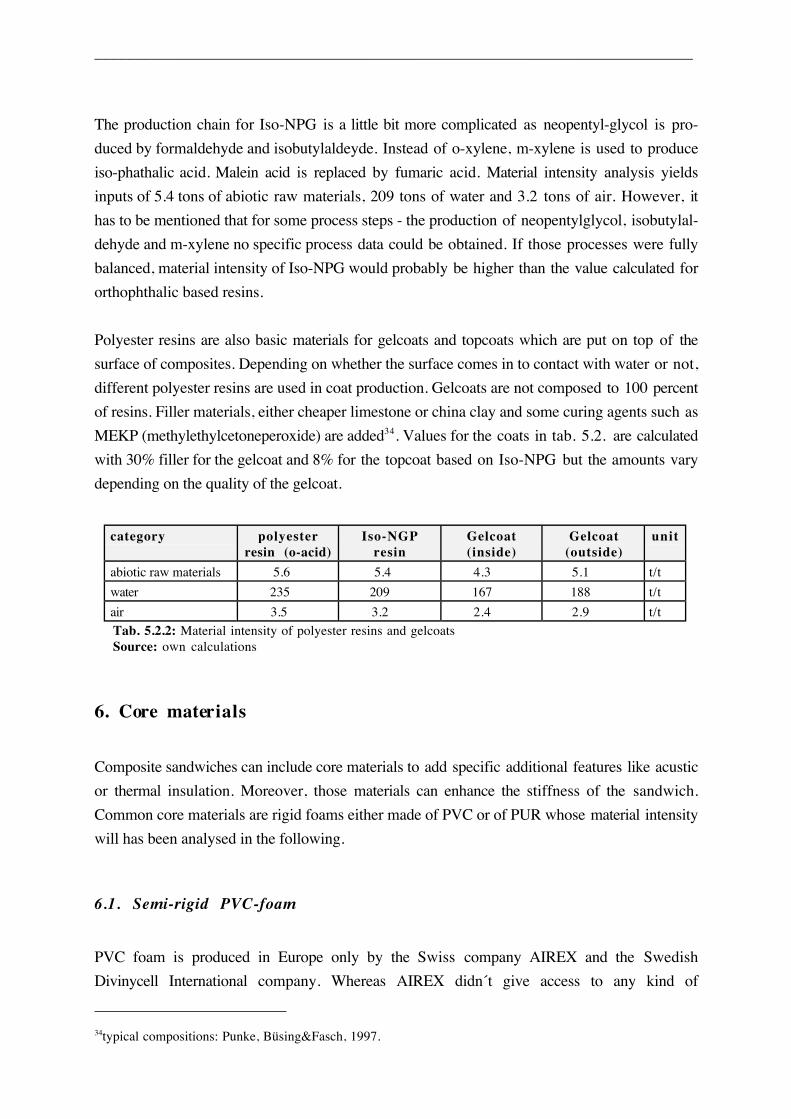
Polyester resins are also basic materials for gelcoats and topcoats which are put on top of the
surface of composites. Depending on whether the surface comes in to contact with water or not,
different polyester resins are used in coat production. Gelcoats are not composed to 100 percent
of resins. Filler materials, either cheaper limestone or china clay and some curing agents such as
MEKP (methylethylcetoneperoxide) are added34. Values for the coats in tab. 5.2. are calculated
with 30% filler for the gelcoat and 8% for the topcoat based on Iso-NPG but the amounts vary
depending on the quality of the gelcoat.
category polyesterresin (o-acid)
Iso-NGPresin
Gelcoat(inside)
Gelcoat(outside)
unit
abiotic raw materials 5.6 5.4 4.3 5.1 t/t
water 235 209 167 188 t/t
air 3.5 3.2 2.4 2.9 t/t
Tab. 5.2.2: Material intensity of polyester resins and gelcoatsSource: own calculations
6. Core materials
Composite sandwiches can include core materials to add specific additional features like acustic
or thermal insulation. Moreover, those materials can enhance the stiffness of the sandwich.
Common core materials are rigid foams either made of PVC or of PUR whose material intensity
will has been analysed in the following.
6.1. Semi-rigid PVC-foam
PVC foam is produced in Europe only by the Swiss company AIREX and the Swedish
Divinycell International company. Whereas AIREX didn´t give access to any kind of
34typical compositions: Punke, Büsing&Fasch, 1997.
___________________________________________________________________________
information on their production process, we are grateful that Divinycell International supported
this study by submitting the required process relevant information for the calculation of the
material intensity35. Thus calculations for PVC-foam are based on these data, but as for fiber
materials, rucksacks of inputs and especially electricity consumption have been balanced with
the inputs required for the production of one kWh in OECD-Europe. As production takes place
partly in Sweden, the ecological rucksack of products sold from this plant might be
overestimated as the average Swedish electricity supply is less resource consuming due to a
high percentage of hydropower. Nevertheless, PVC-foam is also produced in plants in Italy and
the U.S. As mentioned above, comparison of core materials should not depend on specific
locations of production plants but more on the average material input to be calculated.
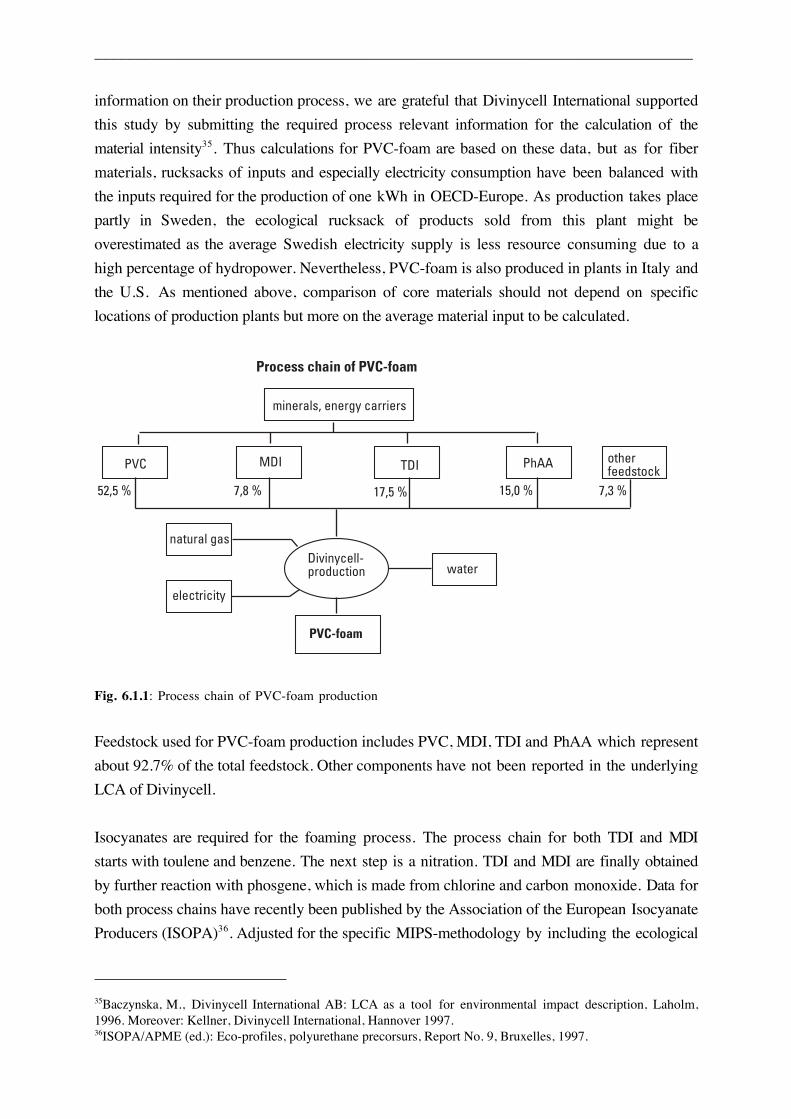
Process chain of PVC-foam
PVC-foam
Divinycell-production
PVC MDI TDI PhAA otherfeedstock
minerals, energy carriers
52,5 % 17,5 % 15,0 %7,8 % 7,3 %
natural gas
electricity
water
Fig. 6.1.1: Process chain of PVC-foam production
Feedstock used for PVC-foam production includes PVC, MDI, TDI and PhAA which represent
about 92.7% of the total feedstock. Other components have not been reported in the underlying
LCA of Divinycell.
Isocyanates are required for the foaming process. The process chain for both TDI and MDI
starts with toulene and benzene. The next step is a nitration. TDI and MDI are finally obtained
by further reaction with phosgene, which is made from chlorine and carbon monoxide. Data for
both process chains have recently been published by the Association of the European Isocyanate
Producers (ISOPA)36. Adjusted for the specific MIPS-methodology by including the ecological
35Baczynska, M., Divinycell International AB: LCA as a tool for environmental impact description, Laholm,1996. Moreover: Kellner, Divinycell International, Hannover 1997.36ISOPA/APME (ed.): Eco-profiles, polyurethane precorsurs, Report No. 9, Bruxelles, 1997.
___________________________________________________________________________
rucksack of mining activities which is neglected in the data-base of the APME studies, those
data have been used also for calculation of the material intensity of Isocyanate.
PhAA (Phthalic acid anhydide) is produced by mixing hot air with o-xylene. One of the outputs
of the exotherme reaction is PhAA which is separated. Direct data for PhAA production have
been not available. However, the LCA of Divinycell allowed a reconstruction of the principal
inputs. Total energy consumption has been reported to be 72.04 GJ/t including a feedstock of
58.2 GJ.
Largest feedstock material for Divinycell production is PVC. Due to the controversial discussion
about the ecological impact of this material, several extensive studies exist which also
investigate the material flows in PVC-production. Comparing the data from different sources
does not result in large differences in the overall resource consumption for PVC production. In
this study data of the APME have been used, equally adjusted as those for TDI and MDI. Of the
three different production processes of PVC, material consumption for average PVC has been
calculated.
Other inputs for PVC-foam production are reported to be other anhydrides, filler, softener,
pigments, stabilizer, expanding agents. These inputs are part of the specific production know-
how and are neglected in the calculations.
Production of PVC foam starts by gelatinization of PVC in an aqueous environment and the
forming of the cell structure by thermal decomposition of the blowing agent. In the second
phase, the foam is expanded, mainly through the reaction between the isocyanates and water
forming CO2. Finally, the PVC-foam is cured by completion of all chemical reactions. Output of
this direct production process is a plate which has to be cleaned by removing the moulded skin
and which is further processed into customer-oriented sizes by cutting and sawing. These
operations together result in a high waste volume of more than 700 kg per ton of final product.
Production also requires a surprisingly high amount of electricity and natural gas. They account
for 52% of the total input of abiotic raw materials and even 58% of the air inputs. Direct water
consumption contributes to less than one percent to the total water inputs. The bulk of the water
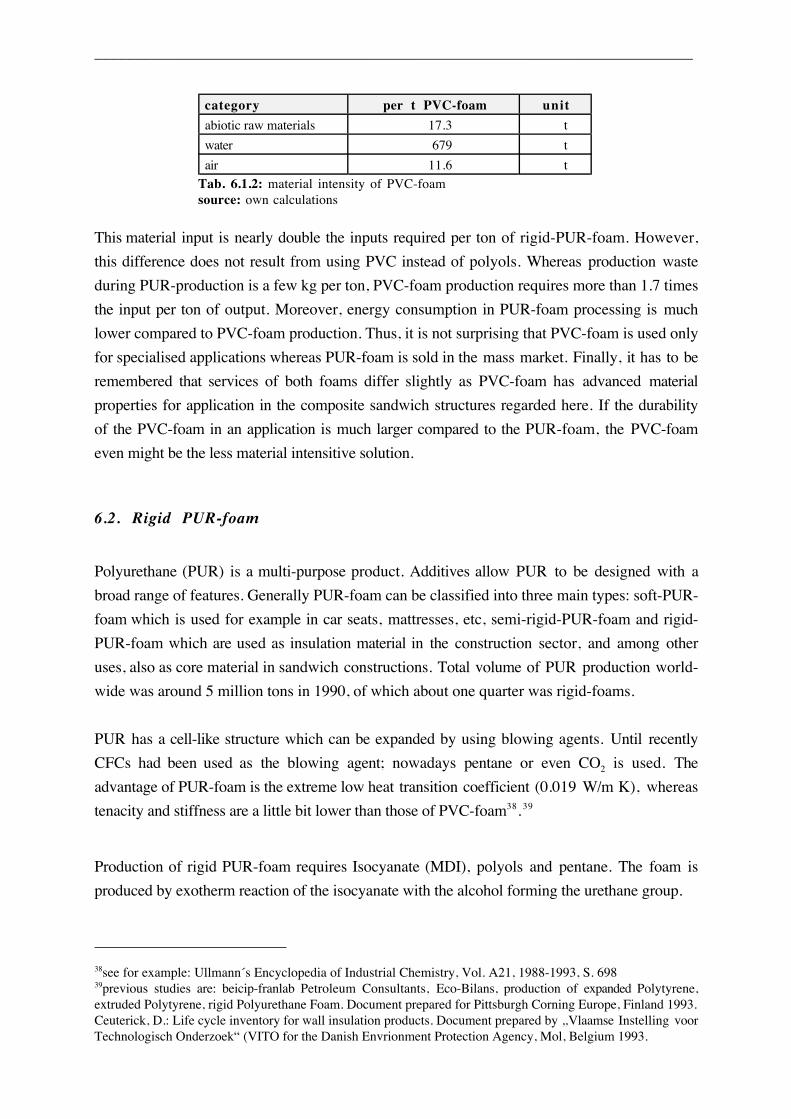
is consumed by feedstock and electricity production37. Overall, total input of abiotic raw
materials for the production of one ton of final semi-rigid PVC-foam is calculated to be 17.3
tons. Additionally, some 679 tons of water are used and 11.6 tons of air are required for the
production.
37Divinycell has requested not to report the exact figure on direct inputs for competition reasons.
___________________________________________________________________________
category per t PVC-foam unit
abiotic raw materials 17.3 t
water 679 t
air 11.6 t
Tab. 6.1.2: material intensity of PVC-foamsource: own calculations
This material input is nearly double the inputs required per ton of rigid-PUR-foam. However,
this difference does not result from using PVC instead of polyols. Whereas production waste
during PUR-production is a few kg per ton, PVC-foam production requires more than 1.7 times
the input per ton of output. Moreover, energy consumption in PUR-foam processing is much
lower compared to PVC-foam production. Thus, it is not surprising that PVC-foam is used only
for specialised applications whereas PUR-foam is sold in the mass market. Finally, it has to be
remembered that services of both foams differ slightly as PVC-foam has advanced material
properties for application in the composite sandwich structures regarded here. If the durability
of the PVC-foam in an application is much larger compared to the PUR-foam, the PVC-foam
even might be the less material intensitive solution.
6.2. Rigid PUR-foam
Polyurethane (PUR) is a multi-purpose product. Additives allow PUR to be designed with a
broad range of features. Generally PUR-foam can be classified into three main types: soft-PUR-
foam which is used for example in car seats, mattresses, etc, semi-rigid-PUR-foam and rigid-
PUR-foam which are used as insulation material in the construction sector, and among other
uses, also as core material in sandwich constructions. Total volume of PUR production world-
wide was around 5 million tons in 1990, of which about one quarter was rigid-foams.
PUR has a cell-like structure which can be expanded by using blowing agents. Until recently
CFCs had been used as the blowing agent; nowadays pentane or even CO2 is used. The
advantage of PUR-foam is the extreme low heat transition coefficient (0.019 W/m K), whereas
tenacity and stiffness are a little bit lower than those of PVC-foam38.39
Production of rigid PUR-foam requires Isocyanate (MDI), polyols and pentane. The foam is
produced by exotherm reaction of the isocyanate with the alcohol forming the urethane group.
38see for example: Ullmann´s Encyclopedia of Industrial Chemistry, Vol. A21, 1988-1993, S. 69839previous studies are: beicip-franlab Petroleum Consultants, Eco-Bilans, production of expanded Polytyrene,extruded Polytyrene, rigid Polyurethane Foam. Document prepared for Pittsburgh Corning Europe, Finland 1993.Ceuterick, D.: Life cycle inventory for wall insulation products. Document prepared by „Vlaamse Instelling voorTechnologisch Onderzoek“ (VITO for the Danish Envrionment Protection Agency, Mol, Belgium 1993.
___________________________________________________________________________
-NCO + HO- --> -NH-CO-O-
Isocyanate + alcohol --> urethane group
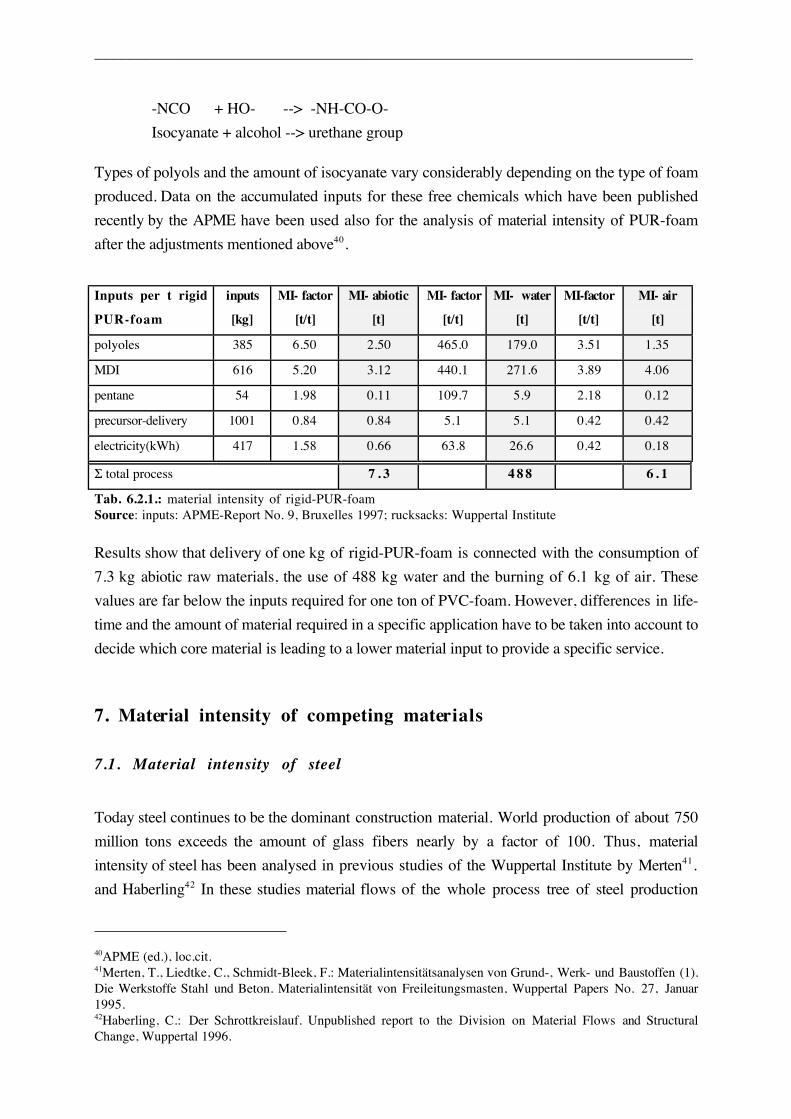
Types of polyols and the amount of isocyanate vary considerably depending on the type of foam
produced. Data on the accumulated inputs for these free chemicals which have been published
recently by the APME have been used also for the analysis of material intensity of PUR-foam
after the adjustments mentioned above40.
Inputs per t rigid
PUR-foam
inputs
[kg]
MI- factor
[t/t]
MI- abiotic
[t]
MI- factor
[t/t]
MI- water
[t]
MI-factor
[t/t]
MI- air
[t]
polyoles 385 6.50 2.50 465.0 179.0 3.51 1.35
MDI 616 5.20 3.12 440.1 271.6 3.89 4.06
pentane 54 1.98 0.11 109.7 5.9 2.18 0.12
precursor-delivery 1001 0.84 0.84 5.1 5.1 0.42 0.42
electricity(kWh) 417 1.58 0.66 63.8 26.6 0.42 0.18
Σ total process 7 . 3 4 8 8 6 . 1
Tab. 6.2.1.: material intensity of rigid-PUR-foamSource: inputs: APME-Report No. 9, Bruxelles 1997; rucksacks: Wuppertal Institute
Results show that delivery of one kg of rigid-PUR-foam is connected with the consumption of
7.3 kg abiotic raw materials, the use of 488 kg water and the burning of 6.1 kg of air. These
values are far below the inputs required for one ton of PVC-foam. However, differences in life-
time and the amount of material required in a specific application have to be taken into account to
decide which core material is leading to a lower material input to provide a specific service.
7. Material intensity of competing materials
7.1. Material intensity of steel
Today steel continues to be the dominant construction material. World production of about 750
million tons exceeds the amount of glass fibers nearly by a factor of 100. Thus, material
intensity of steel has been analysed in previous studies of the Wuppertal Institute by Merten41.
and Haberling42 In these studies material flows of the whole process tree of steel production
40APME (ed.), loc.cit.41Merten, T., Liedtke, C., Schmidt-Bleek, F.: Materialintensitätsanalysen von Grund-, Werk- und Baustoffen (1).Die Werkstoffe Stahl und Beton. Materialintensität von Freileitungsmasten, Wuppertal Papers No. 27, Januar1995.42Haberling, C.: Der Schrottkreislauf. Unpublished report to the Division on Material Flows and StructuralChange, Wuppertal 1996.
___________________________________________________________________________
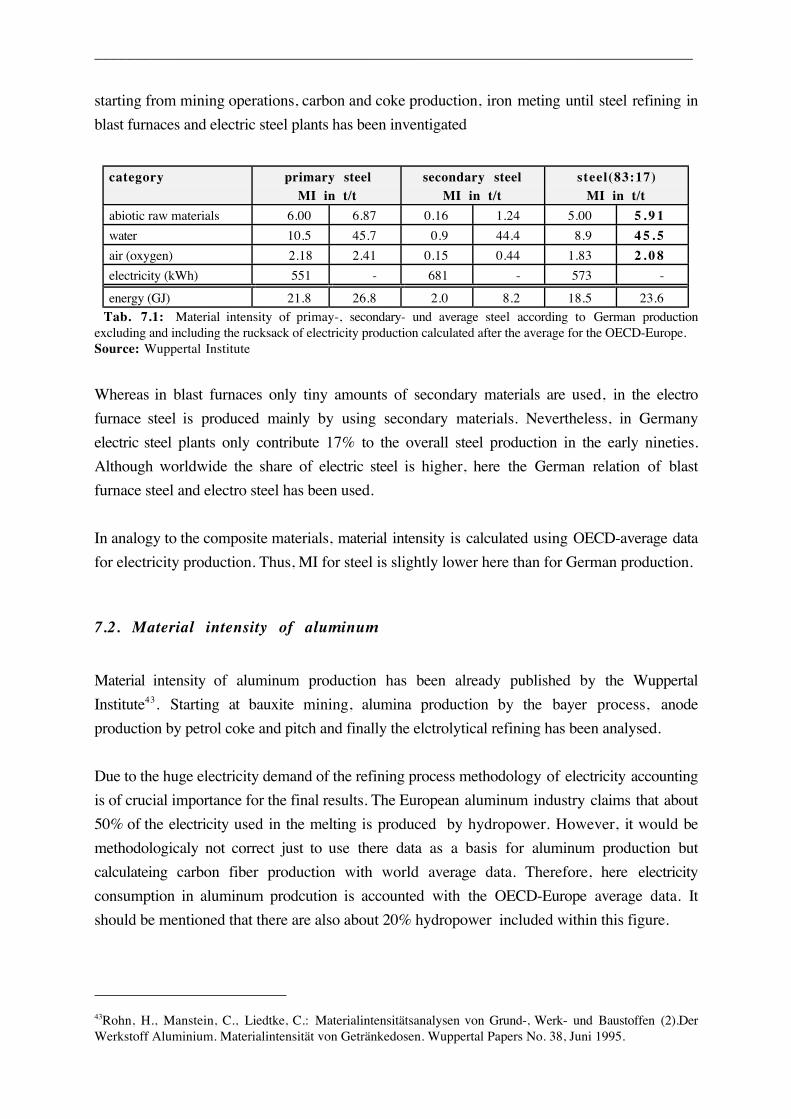
starting from mining operations, carbon and coke production, iron meting until steel refining in
blast furnaces and electric steel plants has been inventigated
category primary steelMI in t/t
secondary steelMI in t/t
steel(83:17)MI in t/t
abiotic raw materials 6.00 6.87 0.16 1.24 5.00 5 . 9 1
water 10.5 45.7 0.9 44.4 8.9 4 5 . 5
air (oxygen) 2.18 2.41 0.15 0.44 1.83 2 . 0 8
electricity (kWh) 551 - 681 - 573 -
energy (GJ) 21.8 26.8 2.0 8.2 18.5 23.6
Tab. 7.1: Material intensity of primay-, secondary- und average steel according to German productionexcluding and including the rucksack of electricity production calculated after the average for the OECD-Europe.Source: Wuppertal Institute
Whereas in blast furnaces only tiny amounts of secondary materials are used, in the electro
furnace steel is produced mainly by using secondary materials. Nevertheless, in Germany
electric steel plants only contribute 17% to the overall steel production in the early nineties.
Although worldwide the share of electric steel is higher, here the German relation of blast
furnace steel and electro steel has been used.
In analogy to the composite materials, material intensity is calculated using OECD-average data
for electricity production. Thus, MI for steel is slightly lower here than for German production.
7.2. Material intensity of aluminum
Material intensity of aluminum production has been already published by the Wuppertal
Institute43. Starting at bauxite mining, alumina production by the bayer process, anode
production by petrol coke and pitch and finally the elctrolytical refining has been analysed.
Due to the huge electricity demand of the refining process methodology of electricity accounting
is of crucial importance for the final results. The European aluminum industry claims that about
50% of the electricity used in the melting is produced by hydropower. However, it would be
methodologicaly not correct just to use there data as a basis for aluminum production but
calculateing carbon fiber production with world average data. Therefore, here electricity
consumption in aluminum prodcution is accounted with the OECD-Europe average data. It
should be mentioned that there are also about 20% hydropower included within this figure.
43Rohn, H., Manstein, C., Liedtke, C.: Materialintensitätsanalysen von Grund-, Werk- und Baustoffen (2).DerWerkstoff Aluminium. Materialintensität von Getränkedosen. Wuppertal Papers No. 38, Juni 1995.
___________________________________________________________________________
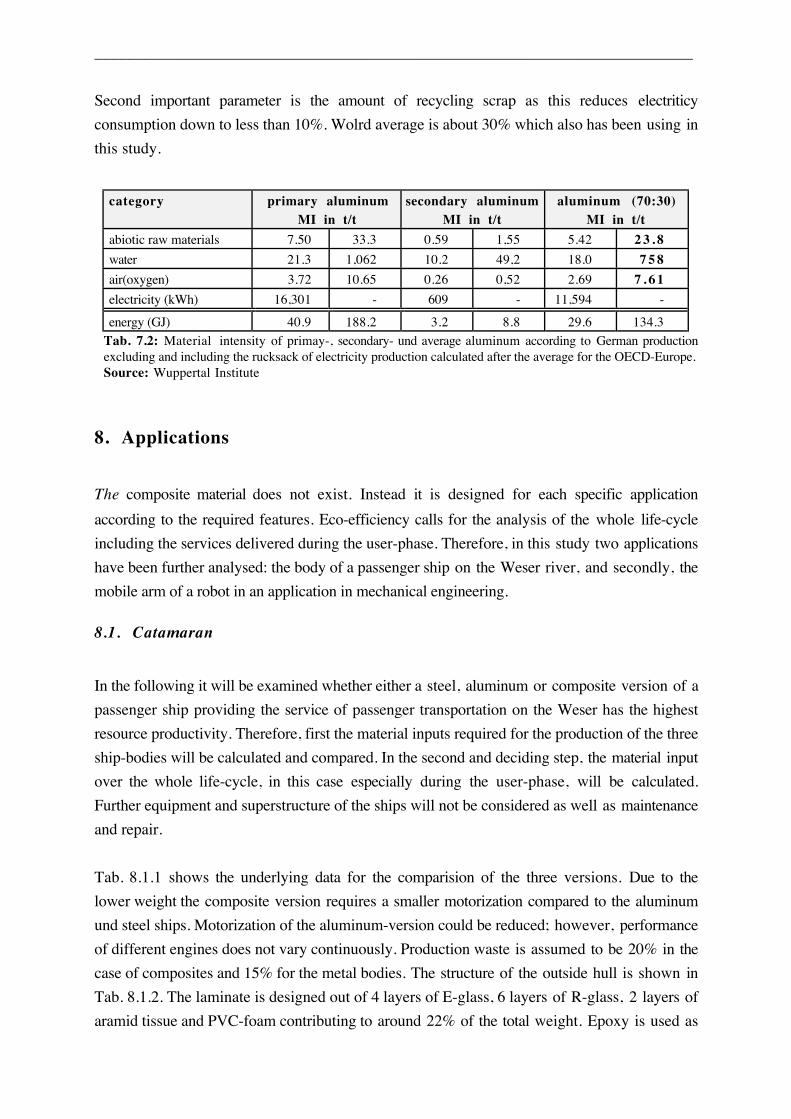
Second important parameter is the amount of recycling scrap as this reduces electriticy
consumption down to less than 10%. Wolrd average is about 30% which also has been using in
this study.
category primary aluminumMI in t/t
secondary aluminumMI in t/t
aluminum (70:30)MI in t/t
abiotic raw materials 7.50 33.3 0.59 1,55 5.42 2 3 . 8
water 21.3 1,062 10.2 49,2 18.0 7 5 8
air(oxygen) 3.72 10.65 0.26 0,52 2.69 7 . 6 1
electricity (kWh) 16,301 - 609 - 11,594 -
energy (GJ) 40.9 188.2 3.2 8.8 29.6 134.3
Tab. 7.2: Material intensity of primay-, secondary- und average aluminum according to German productionexcluding and including the rucksack of electricity production calculated after the average for the OECD-Europe.Source: Wuppertal Institute
8. Applications
The composite material does not exist. Instead it is designed for each specific application
according to the required features. Eco-efficiency calls for the analysis of the whole life-cycle
including the services delivered during the user-phase. Therefore, in this study two applications
have been further analysed: the body of a passenger ship on the Weser river, and secondly, the
mobile arm of a robot in an application in mechanical engineering.
8.1. Catamaran
In the following it will be examined whether either a steel, aluminum or composite version of a
passenger ship providing the service of passenger transportation on the Weser has the highest
resource productivity. Therefore, first the material inputs required for the production of the three
ship-bodies will be calculated and compared. In the second and deciding step, the material input
over the whole life-cycle, in this case especially during the user-phase, will be calculated.
Further equipment and superstructure of the ships will not be considered as well as maintenance
and repair.
Tab. 8.1.1 shows the underlying data for the comparision of the three versions. Due to the
lower weight the composite version requires a smaller motorization compared to the aluminum
und steel ships. Motorization of the aluminum-version could be reduced; however, performance
of different engines does not vary continuously. Production waste is assumed to be 20% in the
case of composites and 15% for the metal bodies. The structure of the outside hull is shown in
Tab. 8.1.2. The laminate is designed out of 4 layers of E-glass, 6 layers of R-glass, 2 layers of
aramid tissue and PVC-foam contributing to around 22% of the total weight. Epoxy is used as
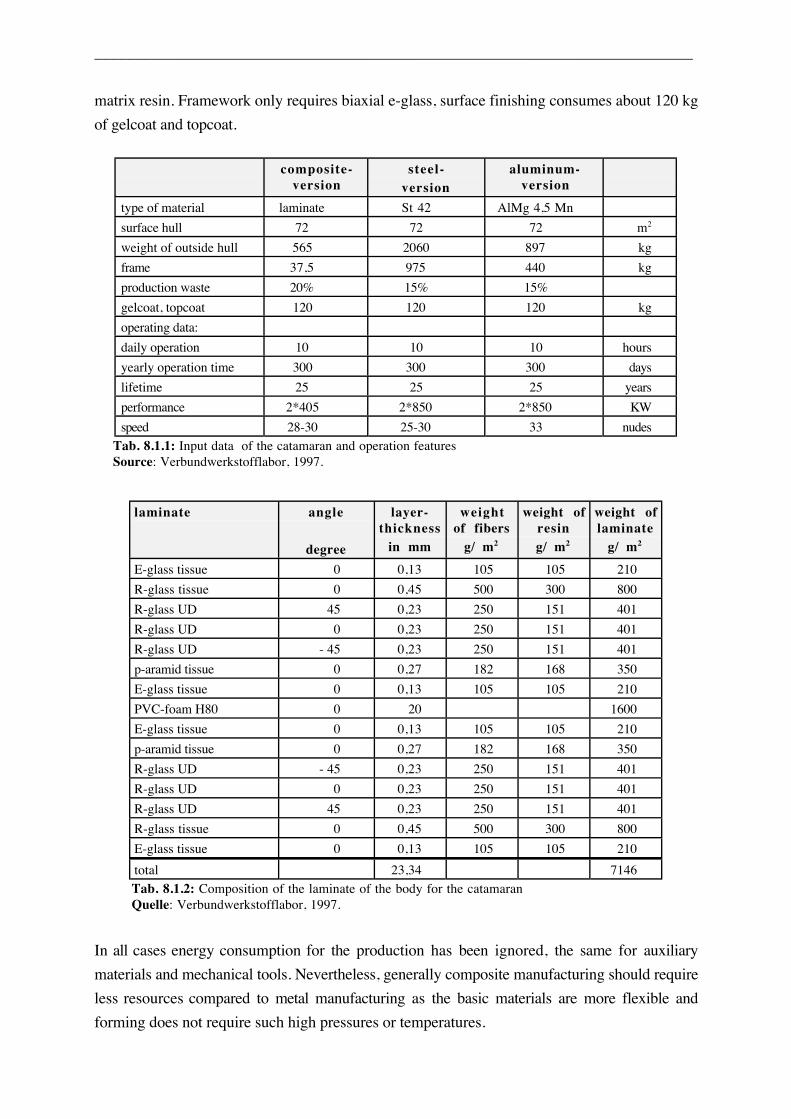
___________________________________________________________________________
matrix resin. Framework only requires biaxial e-glass, surface finishing consumes about 120 kg
of gelcoat and topcoat.
composite-version
steel-version
aluminum-version
type of material laminate St 42 AlMg 4,5 Mn
surface hull 72 72 72 m2
weight of outside hull 565 2060 897 kg
frame 37,5 975 440 kg
production waste 20% 15% 15%
gelcoat, topcoat 120 120 120 kg
operating data:
daily operation 10 10 10 hours
yearly operation time 300 300 300 days
lifetime 25 25 25 years
performance 2*405 2*850 2*850 KW
speed 28-30 25-30 33 nudes
Tab. 8.1.1: Input data of the catamaran and operation featuresSource: Verbundwerkstofflabor, 1997.
laminate angle
degree
layer-thickness
in mm
weightof fibers
g/ m2
weight ofresing/ m2
weight oflaminate
g/ m2
E-glass tissue 0 0,13 105 105 210
R-glass tissue 0 0,45 500 300 800
R-glass UD 45 0,23 250 151 401
R-glass UD 0 0,23 250 151 401
R-glass UD - 45 0,23 250 151 401
p-aramid tissue 0 0,27 182 168 350
E-glass tissue 0 0,13 105 105 210
PVC-foam H80 0 20 1600
E-glass tissue 0 0,13 105 105 210
p-aramid tissue 0 0,27 182 168 350
R-glass UD - 45 0,23 250 151 401
R-glass UD 0 0,23 250 151 401
R-glass UD 45 0,23 250 151 401
R-glass tissue 0 0,45 500 300 800
E-glass tissue 0 0,13 105 105 210
total 23,34 7146
Tab. 8.1.2: Composition of the laminate of the body for the catamaranQuelle: Verbundwerkstofflabor, 1997.
In all cases energy consumption for the production has been ignored, the same for auxiliary
materials and mechanical tools. Nevertheless, generally composite manufacturing should require
less resources compared to metal manufacturing as the basic materials are more flexible and
forming does not require such high pressures or temperatures.
___________________________________________________________________________
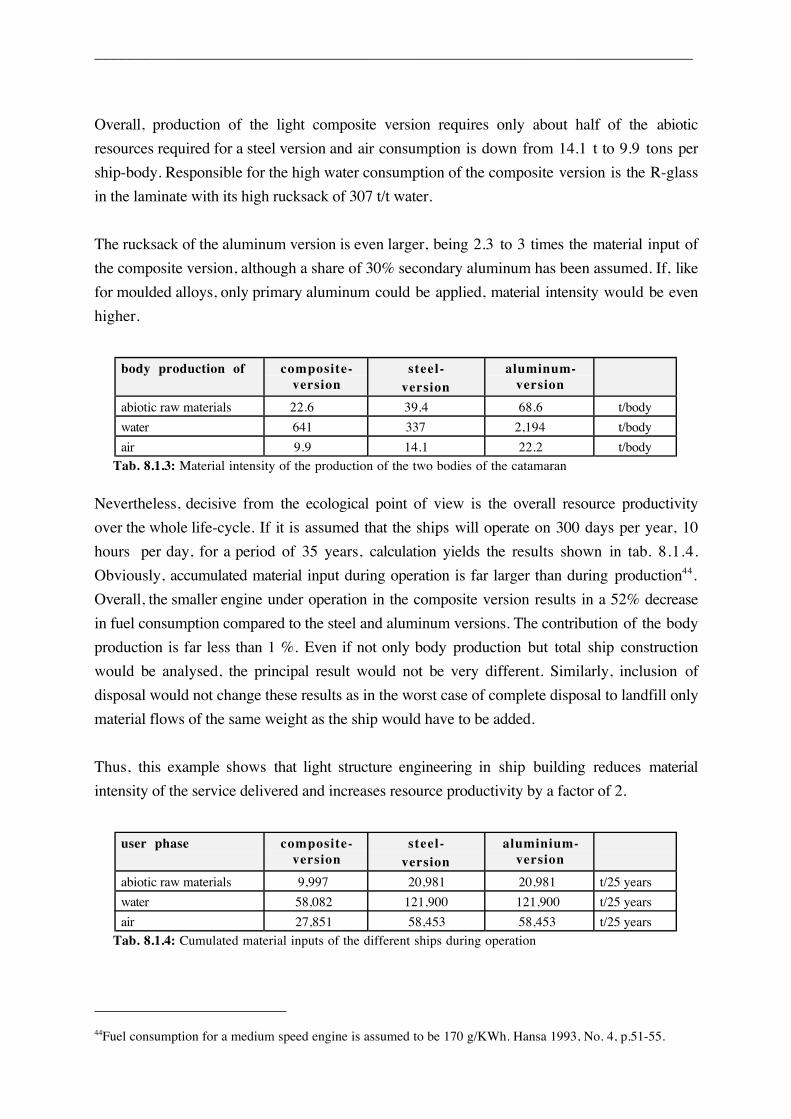
Overall, production of the light composite version requires only about half of the abiotic
resources required for a steel version and air consumption is down from 14.1 t to 9.9 tons per
ship-body. Responsible for the high water consumption of the composite version is the R-glass
in the laminate with its high rucksack of 307 t/t water.
The rucksack of the aluminum version is even larger, being 2.3 to 3 times the material input of
the composite version, although a share of 30% secondary aluminum has been assumed. If, like
for moulded alloys, only primary aluminum could be applied, material intensity would be even
higher.
body production of composite-version
steel-version
aluminum-version
abiotic raw materials 22.6 39.4 68.6 t/body
water 641 337 2,194 t/body
air 9.9 14.1 22.2 t/body
Tab. 8.1.3: Material intensity of the production of the two bodies of the catamaran
Nevertheless, decisive from the ecological point of view is the overall resource productivity
over the whole life-cycle. If it is assumed that the ships will operate on 300 days per year, 10
hours per day, for a period of 35 years, calculation yields the results shown in tab. 8.1.4.
Obviously, accumulated material input during operation is far larger than during production44.
Overall, the smaller engine under operation in the composite version results in a 52% decrease
in fuel consumption compared to the steel and aluminum versions. The contribution of the body
production is far less than 1 %. Even if not only body production but total ship construction
would be analysed, the principal result would not be very different. Similarly, inclusion of
disposal would not change these results as in the worst case of complete disposal to landfill only
material flows of the same weight as the ship would have to be added.
Thus, this example shows that light structure engineering in ship building reduces material
intensity of the service delivered and increases resource productivity by a factor of 2.
user phase composite-version
steel-version
aluminium-version
abiotic raw materials 9,997 20,981 20,981 t/25 years
water 58,082 121,900 121,900 t/25 years
air 27,851 58,453 58,453 t/25 years
Tab. 8.1.4: Cumulated material inputs of the different ships during operation
44Fuel consumption for a medium speed engine is assumed to be 170 g/KWh. Hansa 1993, No. 4, p.51-55.
___________________________________________________________________________
8.2. Robot arm
The second example deals with the replacement of a conventional steel robot arm in a spraying-
machine by a carbon fiber slab. As the mobility of the arms is decisive for the performance of
the machinery, performance could be doubled by substituting the steel arm allowing
accelerations up to 13 m/s2 by a much lighter carbon fiber version reaching up to 32 m/ s2.
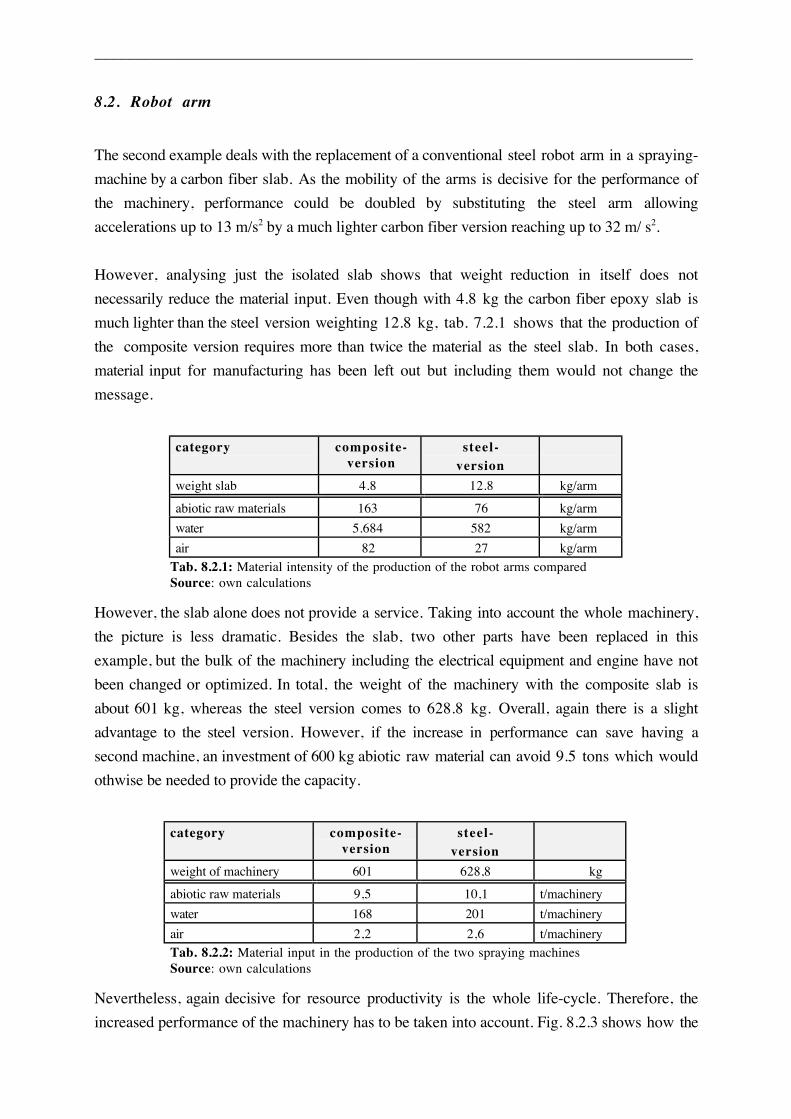
However, analysing just the isolated slab shows that weight reduction in itself does not
necessarily reduce the material input. Even though with 4.8 kg the carbon fiber epoxy slab is
much lighter than the steel version weighting 12.8 kg, tab. 7.2.1 shows that the production of
the composite version requires more than twice the material as the steel slab. In both cases,
material input for manufacturing has been left out but including them would not change the
message.
category composite-version
steel-version
weight slab 4.8 12.8 kg/arm
abiotic raw materials 163 76 kg/arm
water 5.684 582 kg/arm
air 82 27 kg/arm
Tab. 8.2.1: Material intensity of the production of the robot arms comparedSource: own calculations
However, the slab alone does not provide a service. Taking into account the whole machinery,
the picture is less dramatic. Besides the slab, two other parts have been replaced in this
example, but the bulk of the machinery including the electrical equipment and engine have not
been changed or optimized. In total, the weight of the machinery with the composite slab is
about 601 kg, whereas the steel version comes to 628.8 kg. Overall, again there is a slight
advantage to the steel version. However, if the increase in performance can save having a
second machine, an investment of 600 kg abiotic raw material can avoid 9.5 tons which would
othwise be needed to provide the capacity.
category composite-version
steel-version
weight of machinery 601 628,8 kg
abiotic raw materials 9,5 10,1 t/machinery
water 168 201 t/machinery
air 2,2 2,6 t/machinery
Tab. 8.2.2: Material input in the production of the two spraying machinesSource: own calculations
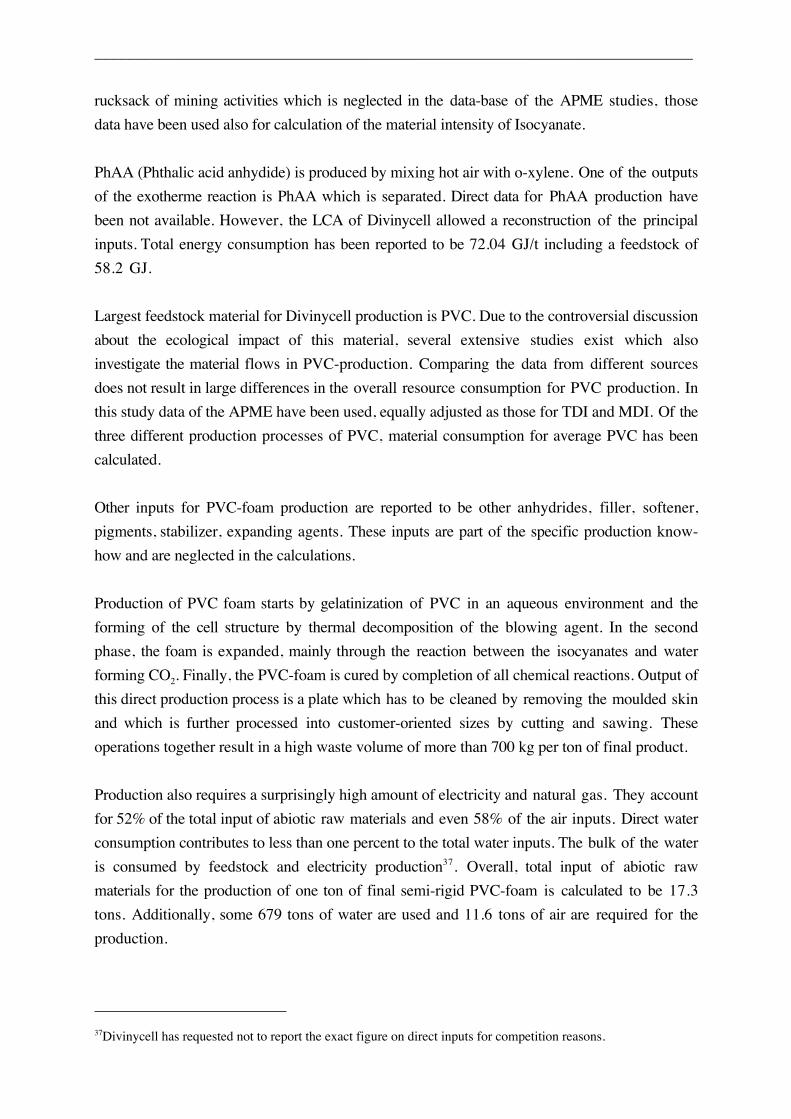
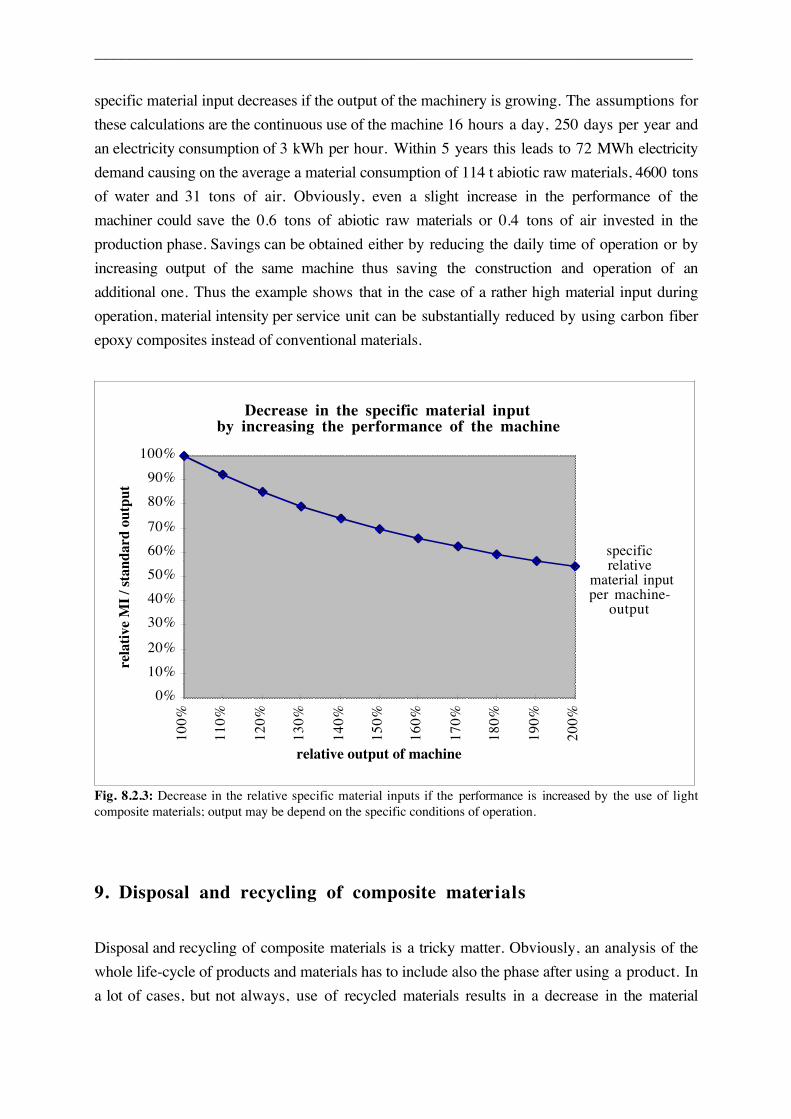
Nevertheless, again decisive for resource productivity is the whole life-cycle. Therefore, the
increased performance of the machinery has to be taken into account. Fig. 8.2.3 shows how the
___________________________________________________________________________
specific material input decreases if the output of the machinery is growing. The assumptions for
these calculations are the continuous use of the machine 16 hours a day, 250 days per year and
an electricity consumption of 3 kWh per hour. Within 5 years this leads to 72 MWh electricity
demand causing on the average a material consumption of 114 t abiotic raw materials, 4600 tons
of water and 31 tons of air. Obviously, even a slight increase in the performance of the
machiner could save the 0.6 tons of abiotic raw materials or 0.4 tons of air invested in the
production phase. Savings can be obtained either by reducing the daily time of operation or by
increasing output of the same machine thus saving the construction and operation of an
additional one. Thus the example shows that in the case of a rather high material input during
operation, material intensity per service unit can be substantially reduced by using carbon fiber
epoxy composites instead of conventional materials.
Decrease in the specific material input by increasing the performance of the machine
0%
10%
20%
30%
40%
50%
60%
70%
80%
90%
100%
100%
110%
120%
130%
140%
150%
160%
170%
180%
190%
200%
relative output of machine
rela
tive
MI
/ sta
ndar
d ou
tput
specific relative
material input per machine-
output
Fig. 8.2.3: Decrease in the relative specific material inputs if the performance is increased by the use of lightcomposite materials; output may be depend on the specific conditions of operation.
9. Disposal and recycling of composite materials
Disposal and recycling of composite materials is a tricky matter. Obviously, an analysis of the
whole life-cycle of products and materials has to include also the phase after using a product. In
a lot of cases, but not always, use of recycled materials results in a decrease in the material
___________________________________________________________________________
intenisity thus being one strategy to increase resource productivity45. However, in a lot of cases
recycling does not in fact result in a material of the same quality. Instead it has to be seen as a
down-cycling leading to a new kind of material which is able to substitute other virgin material
but which in general is of reduced economic value compared to the original product.
The MIPS concept calculates the real inputs in the production process of the materials. Thus,
using waste materials as inputs is of advantage to the product made out of these secondary
materials. On the other hand there are no credits granted for the original products being recycled
at the end of their life-cycle, other than the material consumption for disposal in landfills being
saved. Such an approach is of special advantage in the case of long-life-materials and products
because otherwise knowledge about future waste treatment facilities would be required which
would be highly speculative. In the MIPS concept the only assumption made relates to the
percentage of waste which is created after the use of the product. Therefore, potential
uncertainties due to the future method of disposal are rather small.
Regarding composite materials, today a real recycling technology does not exist which allows
the re-use of the fiber-tissues46. Thus, all conclusions of the other chapters concerning the actual
resource productivity of those materials remain unaffected. However, in the following the
various options for further treatment of the disposal will be examined and some possible future
solutions discussed.
The principal aspect limiting the recycling of composites analysed in this study is the use of a
thermoplast resin as matrix. Once cured, such materials can not be transferred back to the
original materials. Thus each real recycling technology has to deal with the question how to
separate fibers and matrix which allows the re-use of the structural fibers and tissues and not
only of short fiber pieces. Thermoset resins could be an alternative in the future but up to now
such recoverable resins do not have the same quality material features as thermoplastic resins.
9.1. Re-use of material
Public discussion on waste volume has put pressure on composite manufacturers and users to
develop recycling strategies. As a result of this concern the ERCOM company, which is part of
the BASF group, has developed a technology to recycle SMC/BMC (sheet mould compound/
bulk mould compound) which are used, among other areas, in the automotive industry.
45see: Bringezu, S., Stiller, H., Schmidt-Bleek, F.: Material Intensity Analysis - A screening step for LCA. In:Proceedings of the Second International Conference on EcoBalance, Tsukuba 1996, p.147.152.46Allred, R. E.: Recycling Process for Scrap Composites and Prepregs. SAMPE Journal, Vol. 32, No. 5,1996,p. 46.
___________________________________________________________________________
The ERCOM technology allows the mechanical separation of the short-fibers and matrix
resins47. After a preliminary cutting the material is transported to the ERCOM recycling plant
where metalic parts are separated by magnetic separators. There follows a further breakup of the
material, drying and separation into different material fractions. This mechanical technology
allows a separation of short-fibers and matrix particles which can be reused either as filler added
to the compound or partly even as substitute for virgin short-fibers. In effect, the ERCOM
products show slightly different features compared to conventional fillers and fibers as the
material has a lower density. Re-use in SMC by 30% volume leads to an increase in resin
consumption by around 2%, a reduction of fiber glass requirement by 5% and a substitution of
75% of the filler used in this example48.
However, when it comes to carbon fibers, no experience with such a material exists. According
to ERCOM there is no evident obstacle why a similar treatment with CF-epoxies should not be
possible. In the case of the laminate, there is a politically motivated resistance to products
containing PVC but no technical obstacle.
Overall, the principle disadvantage of the ERCOM process is the fact that there is no real
recycling of the long-fibers and not even potential for technical improvement in this direction.
Thus, if it comes to high value carbon and p-aramid fibers the ERCOM process can save only a
tiny amount of the invested resources.
9.2. Low temperature catalytic pyrolysis
Low temperature catalytic pyrolysis is a technology developed by the Adherent Technologies
Company at Albuquerque, New Mexico designed for the recycling of carbon fibers49. The
principal idea of the process is to decompose the matrix at rather low temperatures below 200 °C
into short chain hydrocarbons which can be re-used in the chemical industry or serve as fuel,
thus allowing the re-use of the remaining fiber materials. According to the company the quality
of the recycled carbon fibers is nearly the same as of virgin fibers due to the low temperature
during the pyrolysis. Actually, the incoming material is cut mechanically but the company
claims that in principle the process technology also allows principally the recycling of long-
fibers. As the technology is still under development there is not sufficient information available
whether this technology really can serve as recycling technology to recycle carbon fibers for
47Schaefer, P.: ERCOM Composite Recycling GmbH, 1997.48Schaefer, P.: Eigenschaften und Anwendungen von Rezyklaten aus faserverstärkten, gehärteten Kunststoffen(GFK), in: Brandrup, J. et al: Die Wiederverwertung von Kunststoffen, München, Wien, 1995, p 766-681.49see: Unser, F. J., Stadely, T., Larsen, D.: Advanced Composites Recycling. „Society of Plastics IndustryComposite Institute“, 1996, p.52.
___________________________________________________________________________
structural applications. Also, at the current stage an estimate of the resource intensity is not
possible.
Compared to these rather promising results, experiences with the conventional pyrolysis of
glass-fiber reinforced pureurethane-foam at Hamburg University have been less positive.
Problems with the clogging of cooling equipment by tar could only be avoided by using larger
portions of xylene. Moreover, fibers were found to form clusters. PVC from laminates could
additionally increase corrosion and form toxic substances. Therefore, at the current stage of
investigation conventional pyrolysis can not be regarded as an option for the recycling of
structural composite materials.
9.3. Inverse gasification
Inverse gasification is a process which decomposes the matrix into short-chain hydrocarbons
and synthesis gas. Thus there is some similarity to pyrolysis. However, whereas a pyrolysis
requires additional energy inputs, inverse gasification is an exothermic process. Final products
are fibers and filler materials which remain in the reactor. The technology is still under
development by Environmental Technical Services (ETS) in Missouri. Whereas the recycled
short-fibers show good mechanical properties, inverse gasification does not allow the recycling
of long-fibers50. Data about the efficiency of the process are not available.
9.4. Methanolysis
Methanolysis is a well established process for the recycling of PET to regain the basic materials
of PET production, dimetyltherephthalate and ethylen glycol. At temperatures higher than 200°
C and pressures above 20 bar, PET decomposes if catalysts are used51. Although the process
was up to now only used for thermoplastics, according to Cornell52 it should also be applicable
to advanced composite materials. However, the principal problem to solve is again the question
of how to regain the long-fibers and fiber-tissues. One idea is the use of specific „fixing“-resins
which would not be dissolved during methanolysis. As methanolysis is actually not applied for
composite recycling, no data on the resource productivity are available.
50see: Unser et al., cit loc.51see: Klein, P.: Solvolytische Verfahren für spezielle Kunststoffe in: Brandrup, J. (Ed.): Wiederverwertung vonKunststoffen, Wien 1995, p.509.52Cornell, D.: Estaman Chemical Company, pers. com. to A.Lovins, 1995.
___________________________________________________________________________
9.5. Incineration
Strictly defined incineration of composites is not a recycling option but a method of disposal. In
fact, a specific plant for the incineration of composite material does not exist. Volumes are far
too small, also such a method of disposal is not enforced by state regulation. Thus, composites
as one fraction in conventional waste incineration have to be discussed. Here, the principal
objective is rather the treatment and volume reduction of waste. Cogeneration of energy and
electricity is only a secondary aim. Consequently, efficiency of electricity generation at most
incineration plants is only at 20-25%53, compared to more than 50% in modern gas-fired power
plants, partly due to extensive cleaning of the exhaust gases. Heating value of epoxy resins is
about 30 MJ/kg. Fillers and fibers reduce the heating value of composite materials as SMC
down to 12 MJ/kg. Whereas glass fibers end in slags heating value of carbon fiber composites
is slightly higher as the fibers can be incinerated, too.
9.6. Steel-making processes
In steel-making carbon atoms are used to supply the energy required for the process and serve
as reduction agent. Conventionally carbon is supplied by coke coal. However, advanced steel
making technology has substituted and thereby reduced coke input by pulverised coal and heavy
fuel oil. Therefore, in principle, composite waste should also be able to serve as carbon source
and fuel.
Experimental use of plastic packaging waste of the German DSD at Klöckner Steel Company,
Bremen in the early nineties showed that although inputs supplied didn´t meet the official
criteria, steel making hadn´t been negatively affected54. Control of exhausted gases didn´t show
any enhanced concentration of dioxine due to the high temperature in the oven and the highly
reductive environment. Nevertheless, mainly for political reasons the amount of chlorine in the
input materials was not alowed to exceed 0.5%. Niemöller55 points out that only political
arguments can justify such a figure. But he also mentioned that high chlorine concentration
might speed up corrosion processes in the blast furnace and exhaust gas treatment equipment.
An important positive side-effect of the use of plastics in steel-making is the rather low capital
investment required56. Thus, such structures are more flexible if the waste volume decreases.
Krupp Hoesch is more sceptical about composite waste as carbon supplier not because of
53Umweltbundesamt: Energieaspekte bei der rohstofflichen Verwertung von Altkunststoffen aus DSD-Samm-lungen, Berlin, 1994, nach: Lahl, U.: cit loc.54Janz, J.: Recycling von Mischkuststoffen im Reduktionsprozeß - Das ökologische und ökonomische Potentialdes Hochofens, in: Breuer, H., Dolfen, E. (Ed.), Kunststoff-Recycling Kolloquium 1996, p.17-34.55Niemöller, B.: Reduktion im Hochofen, in: Brnadrup, J. et al. , a.a.O.
___________________________________________________________________________
technological reasons but rather because they fear that a fixed amount of composites could not
be supplied57.
As no experiences exist on using composite waste in blast furnaces, conclusions on resource
efficiency can only be obtained by crude estimates using analogies. Experience with heavy fuel
oil and plastics shows that there is a substituion rate of 1:1 because of a similar heating value.
Thus blowing in 1 kg of GF/EP with a heating value of 12 MJ/kg would save some 280 g
heavy fuel oil. As the glass fiber is composed of minerals which might reduce furnace efficiency
to some extent, energy demand could slightly increase. On the other hand, some minerals like
limestone are added anyway to improve slag composition. For carbon fiber composites such
problems do not occur as the fiber is burnt in the furnace, too. In general, slag is not put onto a
landfill but used as construction material, for example in road or waterway construction.
Therefore, use of composites in blast furnaces would avoid material inputs for landfills. Over-
all, calculations show saving to be 1,4 t/t abiotic raw material input and 0,4 t/t water input com-
pared to putting reinforced plastics on landfills, whereas air consumption increases by 0,3 t/t.
9.7. Comparision of the various options for disposal
In the previous paragraphs serveral options for a future recycling of disposed composite
materials has been presented. However, none of them up to now allows a full recycling. How
far a real recycling can be achieved at all remains an open question as the high quality of the
fibers made out of very sophisticated production processes and surface treatment requires very
tricky solutions. Thus, the material intensity of advanced composite materials, which is
calculated according to the real inputs in the production process, is nearly not affected by this
open question because for high performance composites production will continue to be based on
primary materials in the near future.
Smaller changes only might occur due to the avoidance of landfill disposal which would add the
use of about 1 ton abiotic raw materials per ton disposed material, 0.4 tons of water and an
insignificant amount of oxygen (0.015 tons)58.
Nevertheless, recovery of fibers at reduced quality seems to be possible. Best results can be
expected if, on the one hand, the fibers are re-used thus increasing the resource productivity of
another product and, on the other hand, if the energy content or the basic chemical components
56Lahl, U.: Der Einsatz von Kunststoffen im Hochofen - Ein Rückblick, in: Müll und Abfall, Heft 5, Vol. 27,May 1996, p.309-313.57Erdmann, Krupp-Hoesch AG 1997.58calculated using data of: Schaefer, H., Mauch, W.: Energiebilanz und Entsorgungspolitik im Widerspruch ?: in:VDI-Berichte No. 100, 1994, p.101-116.
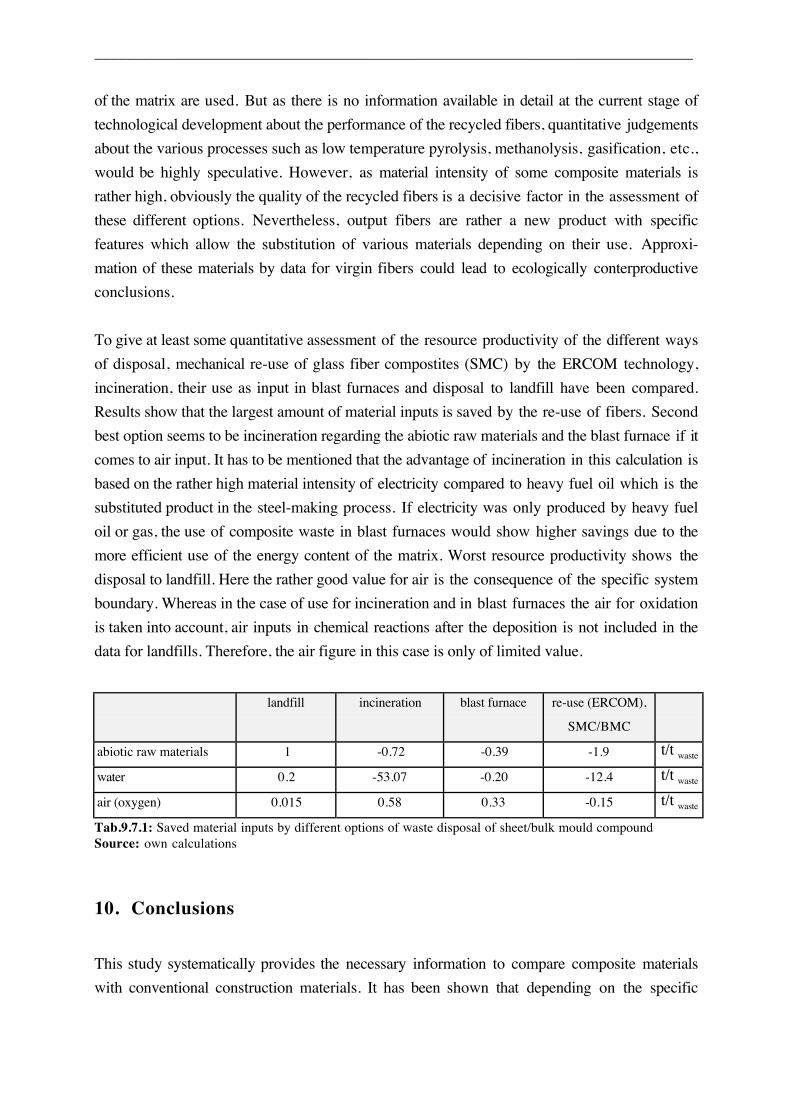
___________________________________________________________________________
of the matrix are used. But as there is no information available in detail at the current stage of
technological development about the performance of the recycled fibers, quantitative judgements
about the various processes such as low temperature pyrolysis, methanolysis, gasification, etc.,
would be highly speculative. However, as material intensity of some composite materials is
rather high, obviously the quality of the recycled fibers is a decisive factor in the assessment of
these different options. Nevertheless, output fibers are rather a new product with specific
features which allow the substitution of various materials depending on their use. Approxi-
mation of these materials by data for virgin fibers could lead to ecologically conterproductive
conclusions.
To give at least some quantitative assessment of the resource productivity of the different ways
of disposal, mechanical re-use of glass fiber compostites (SMC) by the ERCOM technology,
incineration, their use as input in blast furnaces and disposal to landfill have been compared.
Results show that the largest amount of material inputs is saved by the re-use of fibers. Second
best option seems to be incineration regarding the abiotic raw materials and the blast furnace if it
comes to air input. It has to be mentioned that the advantage of incineration in this calculation is
based on the rather high material intensity of electricity compared to heavy fuel oil which is the
substituted product in the steel-making process. If electricity was only produced by heavy fuel
oil or gas, the use of composite waste in blast furnaces would show higher savings due to the
more efficient use of the energy content of the matrix. Worst resource productivity shows the
disposal to landfill. Here the rather good value for air is the consequence of the specific system
boundary. Whereas in the case of use for incineration and in blast furnaces the air for oxidation
is taken into account, air inputs in chemical reactions after the deposition is not included in the
data for landfills. Therefore, the air figure in this case is only of limited value.
landfill incineration blast furnace re-use (ERCOM),
SMC/BMC
abiotic raw materials 1 -0.72 -0.39 -1.9 t/t waste
water 0.2 -53.07 -0.20 -12.4 t/t waste
air (oxygen) 0.015 0.58 0.33 -0.15 t/t waste
Tab.9.7.1: Saved material inputs by different options of waste disposal of sheet/bulk mould compoundSource: own calculations
10. Conclusions
This study systematically provides the necessary information to compare composite materials
with conventional construction materials. It has been shown that depending on the specific
___________________________________________________________________________
boundary conditions composite materials can enhance resource productity and thus reduce
ecological impact potentials.
Whereas the example of the catamaran showed that light composite materials can already reduce
the material input during construction, the use of carbon fibers epoxy composite does not result
in a direct dematerialisation in the second example. This leads to the conclusion that in the case
of products which require no or only a small material input during their use, the use of
composite materials might but not necessarily increases the resource productivity.
Nevertheless, the larger the material inputs during operation, the higher the chances will be for
an overall improvement in resoure productivity by weight reduction. Similarly, an increase in
resource productivity is more likely if the use of composite materials increases the number of
services delivered of the product during its life-time.
Both examples in this study show the tremendous importance of the user-phase. In the case of
the catamaran, more than 99% of the life-cycle wide material intensity is contributed by the user
phase ignoring the inputs for equipment and maintenance. In the case of the robot arm higher
inputs during the construction are by far outweighed by the reduced material input per service
unit as the performance of the machinery has been increased. Of course, in a more detailed
analysis inputs for material processing and parameters like breakdown records have to be
included. Thus, potential ecological benefits of the use of composite materials depend on the
user-characteristics.
These results, for example, allow a first estimate whether weight reduction by using composite
materials in the automotive industry will improve the resource productivity as Amory Lovins
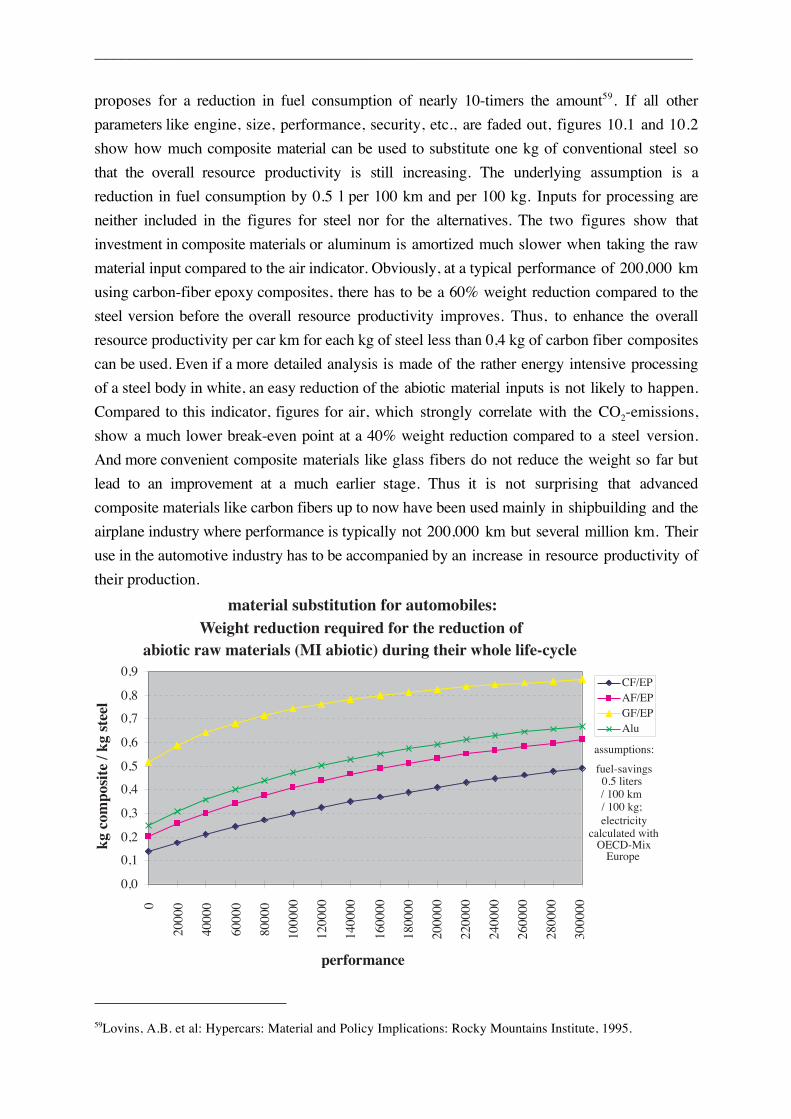
___________________________________________________________________________
proposes for a reduction in fuel consumption of nearly 10-timers the amount59. If all other
parameters like engine, size, performance, security, etc., are faded out, figures 10.1 and 10.2
show how much composite material can be used to substitute one kg of conventional steel so
that the overall resource productivity is still increasing. The underlying assumption is a
reduction in fuel consumption by 0.5 l per 100 km and per 100 kg. Inputs for processing are
neither included in the figures for steel nor for the alternatives. The two figures show that
investment in composite materials or aluminum is amortized much slower when taking the raw
material input compared to the air indicator. Obviously, at a typical performance of 200,000 km
using carbon-fiber epoxy composites, there has to be a 60% weight reduction compared to the
steel version before the overall resource productivity improves. Thus, to enhance the overall
resource productivity per car km for each kg of steel less than 0,4 kg of carbon fiber composites
can be used. Even if a more detailed analysis is made of the rather energy intensive processing
of a steel body in white, an easy reduction of the abiotic material inputs is not likely to happen.
Compared to this indicator, figures for air, which strongly correlate with the CO2-emissions,
show a much lower break-even point at a 40% weight reduction compared to a steel version.
And more convenient composite materials like glass fibers do not reduce the weight so far but
lead to an improvement at a much earlier stage. Thus it is not surprising that advanced
composite materials like carbon fibers up to now have been used mainly in shipbuilding and the
airplane industry where performance is typically not 200,000 km but several million km. Their
use in the automotive industry has to be accompanied by an increase in resource productivity of
their production.
material substitution for automobiles:Weight reduction required for the reduction of
abiotic raw materials (MI abiotic) during their whole life-cycle
0,0
0,1
0,2
0,3
0,4
0,5
0,6
0,7
0,8
0,9
2000
0
4000
0
6000
0
8000
0
1000
00
1200
00
1400
00
1600
00
1800
00
2000
00
2200
00
2400
00
2600
00
2800
00
3000
00
performance
kg c
ompo
site
/ kg
ste
el
0
CF/EPAF/EPGF/EPAlu
calculated with
assumptions:
electricity
OECD-MixEurope
fuel-savings0.5 liters/ 100 km / 100 kg;
59Lovins, A.B. et al: Hypercars: Material and Policy Implications: Rocky Mountains Institute, 1995.
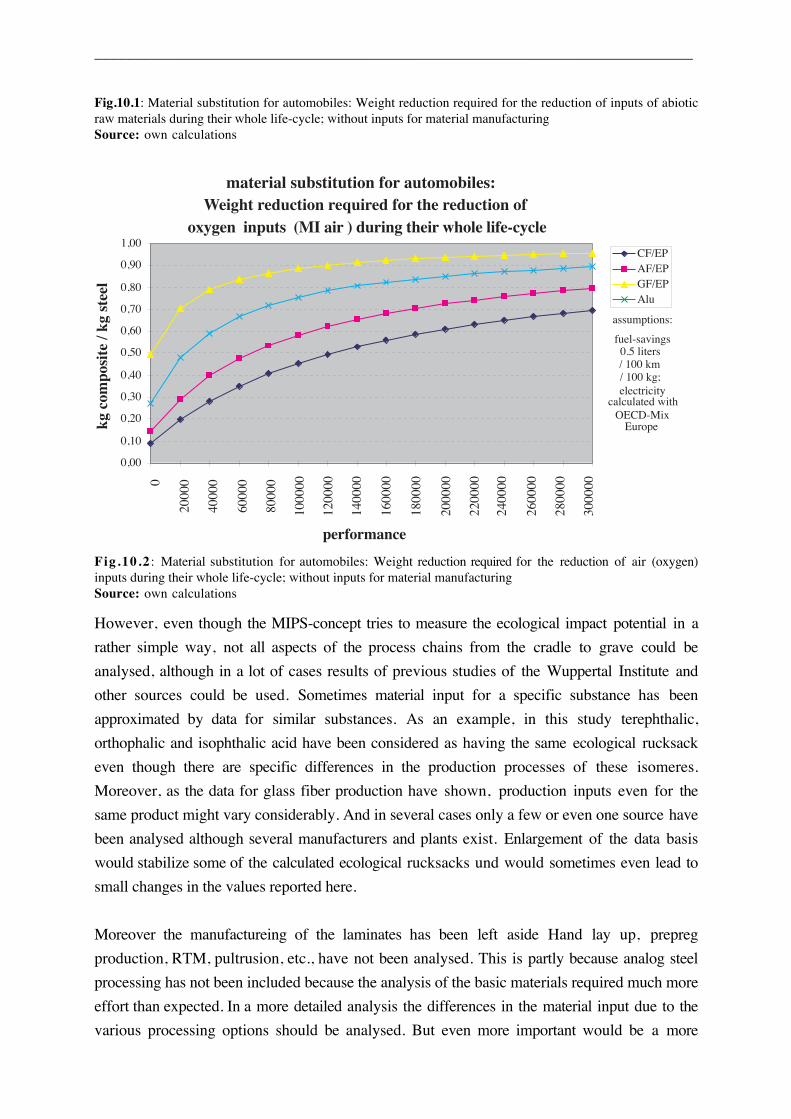
___________________________________________________________________________
Fig.10.1: Material substitution for automobiles: Weight reduction required for the reduction of inputs of abioticraw materials during their whole life-cycle; without inputs for material manufacturingSource: own calculations
0,00
0,10
0,20
0,30
0,40
0,50
0,60
0,70
0,80
0,90
1,00
2000
0
4000
0
6000
0
8000
0
1000
00
1200
00
1400
00
1600
00
1800
00
2000
00
2200
00
2400
00
2600
00
2800
00
3000
000
CF/EPAF/EPGF/EPAlu
material substitution for automobiles:Weight reduction required for the reduction of
oxygen inputs (MI air ) during their whole life-cycle
kg c
ompo
site
/ kg
ste
el
assumptions:
electricity
OECD-MixEurope
fuel-savings0.5 liters/ 100 km / 100 kg;
calculated with
performance
Fig.10.2 : Material substitution for automobiles: Weight reduction required for the reduction of air (oxygen)inputs during their whole life-cycle; without inputs for material manufacturingSource: own calculations
However, even though the MIPS-concept tries to measure the ecological impact potential in a
rather simple way, not all aspects of the process chains from the cradle to grave could be
analysed, although in a lot of cases results of previous studies of the Wuppertal Institute and
other sources could be used. Sometimes material input for a specific substance has been
approximated by data for similar substances. As an example, in this study terephthalic,
orthophalic and isophthalic acid have been considered as having the same ecological rucksack
even though there are specific differences in the production processes of these isomeres.
Moreover, as the data for glass fiber production have shown, production inputs even for the
same product might vary considerably. And in several cases only a few or even one source have
been analysed although several manufacturers and plants exist. Enlargement of the data basis
would stabilize some of the calculated ecological rucksacks und would sometimes even lead to
small changes in the values reported here.
Moreover the manufactureing of the laminates has been left aside Hand lay up, prepreg
production, RTM, pultrusion, etc., have not been analysed. This is partly because analog steel
processing has not been included because the analysis of the basic materials required much more
effort than expected. In a more detailed analysis the differences in the material input due to the
various processing options should be analysed. But even more important would be a more
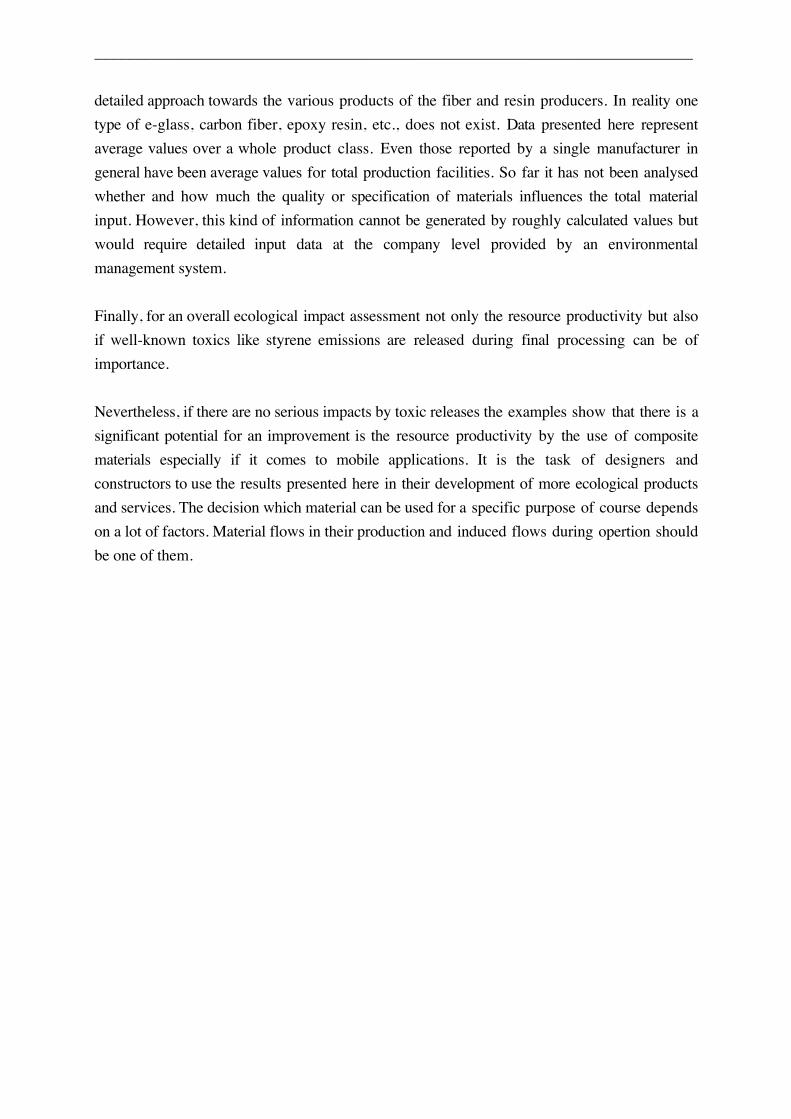
___________________________________________________________________________
detailed approach towards the various products of the fiber and resin producers. In reality one
type of e-glass, carbon fiber, epoxy resin, etc., does not exist. Data presented here represent
average values over a whole product class. Even those reported by a single manufacturer in
general have been average values for total production facilities. So far it has not been analysed
whether and how much the quality or specification of materials influences the total material
input. However, this kind of information cannot be generated by roughly calculated values but
would require detailed input data at the company level provided by an environmental
management system.
Finally, for an overall ecological impact assessment not only the resource productivity but also
if well-known toxics like styrene emissions are released during final processing can be of
importance.
Nevertheless, if there are no serious impacts by toxic releases the examples show that there is a
significant potential for an improvement is the resource productivity by the use of composite
materials especially if it comes to mobile applications. It is the task of designers and
constructors to use the results presented here in their development of more ecological products
and services. The decision which material can be used for a specific purpose of course depends
on a lot of factors. Material flows in their production and induced flows during opertion should
be one of them.