Embed Size (px)
Citation preview
TECHNISCHE UNIVERSITÄT MÜNCHEN
Lehrstuhl für Allgemeine Lebensmitteltechnologie
Metabolite profiling of sprouting mung beans (Vigna radiata)
Kriskamol Na Jom
Vollständiger Abdruck der von der Fakultät Wissenschaftszentrum Weihenstephan
für Ernährung, Landnutzung und Umwelt der Technischen Universität München zur
Erlangung des akademischen Grades eines
Doktors der Naturwissenschaften
genehmigten Dissertation.
Vorsitzender: Univ.-Prof. Dr. P. Schieberle
Prüfer der Dissertation: 1. Univ.-Prof. Dr. K.-H. Engel
2. Univ.-Prof. Dr. W. Schwab
Die Dissertation wurde am 03.07.2012 bei der Technischen Universität München
eingereicht und durch die Fakultät Wissenschaftszentrum Weihenstephan für
Ernährung, Landnutzung und Umwelt am 20.09.2012 angenommen.

Acknowledgements
This dissertation would not have been possible without the guidance and the help of
several individuals who in one way or another contributed and extended their
valuable assistance in the preparation and completion of this study.
First and foremost, my utmost gratitude to my supervisor Univ.-Prof. Dr. Karl-Heinz
Engel, the full professor at the Chair of General Food Technology, Center of Life and
Food Sciences-Weihenstepan, Technische Universität München, for his valuable
guidance, encouragement, kindness and support throughout this work.
Also, I would like to convey my gratitude to Dr. Thomas Frank, not only for his helpful
advice to improve my dissertation, but also in his kindness, tolerance and care about
me, my work and life in Germany.
The financial support under the program “Strategic Scholarship for Frontier Research
Network” by the Royal Thai Government, the Ministry of Education, Thailand’s
Commission on Higher Education and German Academic Exchange Service (DAAD)
is gratefully acknowledged.
Special thanks to Prof. Dr. Peerasak Srinives at Kasetsart University, Nakorn
Pathom, Thailand, Mrs. Sumana Ngampongsai, Chai Nat Crop Research Center,
Ministry of Agriculture and Co-operatives, Thailand and the company Deiters & Florin
GmbH, Hamburg, Germany for their valuable samples.
Moreover, I wish to thank all of my colleagues and friends for their helps and support
especially the members of the Chair of General Food Technology for their friendship
and encouragement through 4 years of my wonderful life in Germany.
Last but not least, I am pleased to have such a lovely family, always being my
inspiration and supporting me in every way and several best friends being on my side
every time. Their understanding and encouragement through the work of this thesis
are sincerely appreciated.
TABLE OF CONTENTS
1 INTRODUCTION AND OBJECTIVES ......................................... 1 2 BACKGROUND .......................................................................... 3 2.1 MUNG BEANS ............................................................................................. 3
2.1.1 Agriculture ................................................................................................ 3
2.1.2 Properties and utilization .......................................................................... 5
2.1.3 Mung bean sprouts .................................................................................. 6
2.1.3.1 Sprouting process ............................................................................. 6
2.1.3.2 Properties and utilization ................................................................... 8
2.1.3.3 Contamination hazards ................................................................... 10
2.1.3.4 Economics ....................................................................................... 10
2.2 PLANT METABOLOMICS .......................................................................... 12
2.2.1 Historical overview ................................................................................. 12
2.2.2 Definitions .............................................................................................. 13
2.2.3 Techniques ............................................................................................ 14
2.2.4 Metabolite Profiling Workflow ................................................................. 16
2.2.5 Metabolite profiling of plant-derived foods ............................................. 18
2.2.5.1 Crop quality ..................................................................................... 19
2.2.5.2 Crop safety ...................................................................................... 19
2.2.5.3 Food processing .............................................................................. 20
3 MATERIALS AND METHODS .................................................. 21 3.1 MATERIALS ............................................................................................... 21
3.1.1 Chemicals .............................................................................................. 21
3.1.2 Mung bean materials ............................................................................. 22
3.1.3 Equipment .............................................................................................. 22
3.2 METHODS ................................................................................................. 24
3.2.1 Metabolite profiling of mung beans ........................................................ 24
3.2.1.1 Sample processing .......................................................................... 24
3.2.1.2 Sample extraction ............................................................................ 25
3.2.1.3 Preparation of standard solutions .................................................... 25
3.2.1.4 Fractionation and analysis of lipids.................................................. 26
3.2.1.5 Fractionation and analysis of polar extract ...................................... 27
3.2.2 Gas chromatography ............................................................................. 28
3.2.3 Gas chromatography – mass spectrometry ........................................... 28
3.2.4 Identification of metabolites ................................................................... 29
3.2.5 Recovery rates ....................................................................................... 29
3.2.6 Preparation of standard compounds for recovery rate ........................... 30
3.2.7 Repeatability .......................................................................................... 31
3.2.8 Statistical assessment ........................................................................... 31
4 RESULTS AND DISCUSSION .................................................. 32 4.1 METABOLITE PROFILING OF INTACT MUNG BEANS ........................... 32
4.1.1 Detection and Identification of Metabolites ............................................ 33
4.1.2 Recovery and repeatability .................................................................... 37
4.2 METABOLITE PROFILING OF SPROUTING MUNG BEANS ................... 38
4.2.1 Introduction ............................................................................................ 38
4.2.2 Seed sprouting ....................................................................................... 39
4.2.3 Analysis of sprouts ................................................................................. 40
4.2.3.1 Methodology .................................................................................... 40
4.2.3.2 Multivariate data assessment .......................................................... 40
4.2.3.3 Univariate data assessment ............................................................ 46
4.2.4 Conclusions ........................................................................................... 51
4.3 SPROUTING IMPACT FACTORS ............................................................. 52
4.3.1 Introduction ............................................................................................ 52
4.3.2 Impact of genotype ................................................................................ 53
4.3.3 Impact of environment ........................................................................... 56
4.3.4 Influence of temperature ........................................................................ 60
4.3.4.1 Fraction I ......................................................................................... 62
4.3.4.2 Fraction II ........................................................................................ 63
4.3.4.3 Fraction III ....................................................................................... 65
4.3.4.4 Fraction IV ....................................................................................... 68
4.3.4.5 Conclusions ..................................................................................... 70
4.3.5 Influence of illumination ......................................................................... 71
4.3.5.1 Illumination conditions during sprouting .......................................... 71
4.3.5.2 Fractions I-IV ................................................................................... 72
4.3.5.3 Fraction I ......................................................................................... 73
4.3.5.4 Fraction II ........................................................................................ 75
4.3.5.5 Fraction III ....................................................................................... 76
4.3.5.6 Fraction IV ....................................................................................... 78
4.3.6 Impact of washing .................................................................................. 80
4.3.6.1 Laboratory-produced sprouts .......................................................... 80
4.3.6.2 Commercially produced sprouts ...................................................... 85
4.3.6.3 Conclusions ..................................................................................... 91
4.3.7 Conclusions ........................................................................................... 91
4.4 STORAGE OF MUNG BEAN SPROUTS ................................................... 93
4.4.1 Storage of sprouts at different temperatures .......................................... 93
4.4.2 Multivariate analysis ............................................................................... 94
4.4.3 Univariate analysis ................................................................................. 96
5 SUMMARY ............................................................................... 99 6 REFERENCES ....................................................................... 101
Abbreviations
CI Confidence interval
CV Column volume
DW Dry weight
EI Electron impact ionization
FAME Fatty acid methyl ester
FAO Food and Agriculture Organization of the United Nations
FID Flame ionization detection
g Gram
GC Gas chromatography
GM Genetically modified
h Hour
ha Hectare
HPLC High performance liquid chromatography
I.D. Inner diameter
InsP Inositol phosphate
min Minute
ml Milliliter
mm Millimeter
MS Mass spectrometry
MSTFA N-methyl-N-trimethylsilyltrifluoroacteamide
MTBE Methyl-tert-butylether
mu Mass units
NMR Nuclear magnetic resonance
OECD Organization for Economic Co-operation and Development
PC Principal component
PCA Principal component analysis
RI Refraction index
RT Retention time
s Second
SD Standard deviation
SPE Solid phase extraction

TIC Total ion count
TMS Trimethylsilyl-
TMSIM Trimethylsilylimidazole
UPLC Ultra performance liquid chromatography
WHO World Health Organization
Introduction and objectives 1
1 INTRODUCTION AND OBJECTIVES
The plant kingdom is estimated to contain 200 000 compounds (Fiehn, 2002; Dixon
and Strack, 2003) with up to 20 000 metabolites present in a single plant (Bino et al.,
2004; Fernie et al., 2004). Metabolomics, an unbiased profiling approach, has been
shown to be a powerful analytical platform for the investigation of plant and crop
metabolomes. The metabolic phenotype in a biological system is mainly defined by
the genetic background (e.g. different species), breeding strategies (e.g. genetic
engineering), environmental conditions (e.g. growing location, season), induced
stress (e.g. drought, salinity, pathogens), farming practices (e.g. low input system)
and the developmental stage. During the past decade, numerous metabolomics-
based investigations have been conducted in plants in order to assist in functional
genomics, to analyze metabolic pathway interactions of primary and secondary plant
constituents and to elucidate nutrition and health-related quality traits which enabled
the breeding-driven metabolic engineering of important nutrients. Capillary gas
chromatography-based metabolite profiling approaches in combination with powerful
statistical tools have been proven to provide suitable platforms for comprehensive
investigations of plant-derived foods. As examples, GC-based metabolite profiling (i)
assisted in the elucidation of mutation events in rice (Frank et al., 2007) and soybean
(Frank et al., 2009), (ii) allowed comparative analyses of Bt- and Roundup Ready-
maize with the respective isogenic lines in the light of environmental influences
(Frank et al., 2012a) and (iii) enabled the time-dependent following of metabolic
changes during naturally occurring developmental stages of plants and crops, e.g. for
Arabidopsis (Fait et al., 2006), strawberries (Fait et al., 2008) and potatoes (Davies,
2007).
The germination of crops represents an important stage in the course of plant
development. It is characterized by a combination of various catabolic and anabolic
processes. Distinct and germination time-dependent alterations in metabolite levels
are to be expected and GC-based metabolite profiling was shown to be a suitable
tool to provide a comprehensive picture of these changes. Studies on crops have
been conducted to follow the dynamic changing metabolic phenotype during the
germination of rice (Shu et al., 2008) and the process-related germination of barley,
i.g. in the course of the malting process (Frank et al., 2011).
Introduction and objectives 2
The aim of the present work was to investigate the suitability of GC-based metabolite
profiling for an unbiased analysis of sprouting mung beans. Mung beans (Vigna
radiata) belong to the legume family and represent an excellent source of protein (El-
Adawy, 1996; Fan and Sosulski, 1974; Thompson et al., 1976). Seeds and sprouts of
mung beans are widespread foodstuffs in China, India, Bangladesh and South East
Asia (Fery, 2002). In the recent years, mung bean sprouts also gained increased
popularity in the Western countries.
Sprouting of mung beans is considered to improve their nutritional quality (El-Adawy
et al., 2003). Targeted analyses have demonstrated that the germination of mung
beans is accompanied by a spectrum of significant changes in metabolite contents
(Savage, 1990; Mubarak, 2005; Abdel-Rahman et al., 2007). However, no metabolite
profiling-based investigation in mung beans has been described yet. Therefore, a
GC-based metabolite profiling approach should be developed for the extraction,
detection and identification of a broad spectrum of polar and non-polar low molecular
weight compounds in mung beans. The time-dependent metabolic changes during
the sprouting process should be followed considering different impact factors on the
metabolic phenotype of the final sprouts. Multivariate and univariate statistical tools
should be applied for the investigations of the influence of genotype, growing
environment, incubation temperature, illumination and industrial germination
conditions on the metabolite profiles of sprouting mung beans. Finally, metabolic
changes during the storage of mung bean sprouts at different temperatures should
be assessed.
Background 3
2 BACKGROUND
2.1 MUNG BEANS
2.1.1 Agriculture
The mung bean (Vigna radiata (L.) Wilczek) is one of the most important grain
legumes in Asia. Mung beans are also known as “mung”, “moong” “greengram” (in
India) and “mungo” (at the Philippines). They have a close genetic relationship to the
Indian urdbean (also known as blackgram) (Poehlman, 1991) which is similar in
growth behaviour and utilization as food and food ingredient.
Mung beans are cultivated most extensively in the India-Burma-Thailand region of
Asia. In addition, they are also grown in South America, Africa, Iran, Pakistan,
Vietnam, China, the Philippines, Korea, Indonesia, Sri Lanka and adjacent countries
and islands in the South Pacific region (Sangsiri et al., 2005). There is no major
mungbean production area above 40° North latitude (Morton et al., 1982). The
worldwide production amount accounts for approximately 3.1 million tons / year, and
the world´s major producers and exporters of mung beans are India, China, Vietnam,
Myanmar and Thailand (AVRDC, 2010). In Thailand, 50,000 – 100,000 tons are
annually produced on areas of more than 300,000 ha. (AVRDC, 2010).
The mung bean is a short-day, warm-season crop, grown mainly in semiarid to
subhumid lowland tropics and subtropics with 600 to 1,000 mm annual rainfall, 20 to
40 °C mean temperature during the period of planting, and elevations not exceeding
1,800 to 2,000 m (Morton et al., 1982). Farming management practices for mung
beans are similar to those for soybeans (Piara Singh et al., 2006). Mung beans can
be planted during three seasons of the year, i.e. the early rainy season, the late rainy
season and the dry season. The latter period is preferred because of lower pest
pollution and a higher production quantity (Titapiwatanakun, 1990). Major climatic
factors affecting the cultivation of mung beans are solar radiation, temperature,
photoperiod and precipitation. Conditions such as windstroms and hail can be locally
destructive, and high humidity may foster development of foliage diseases (Morton et
al., 1982).
Background 4
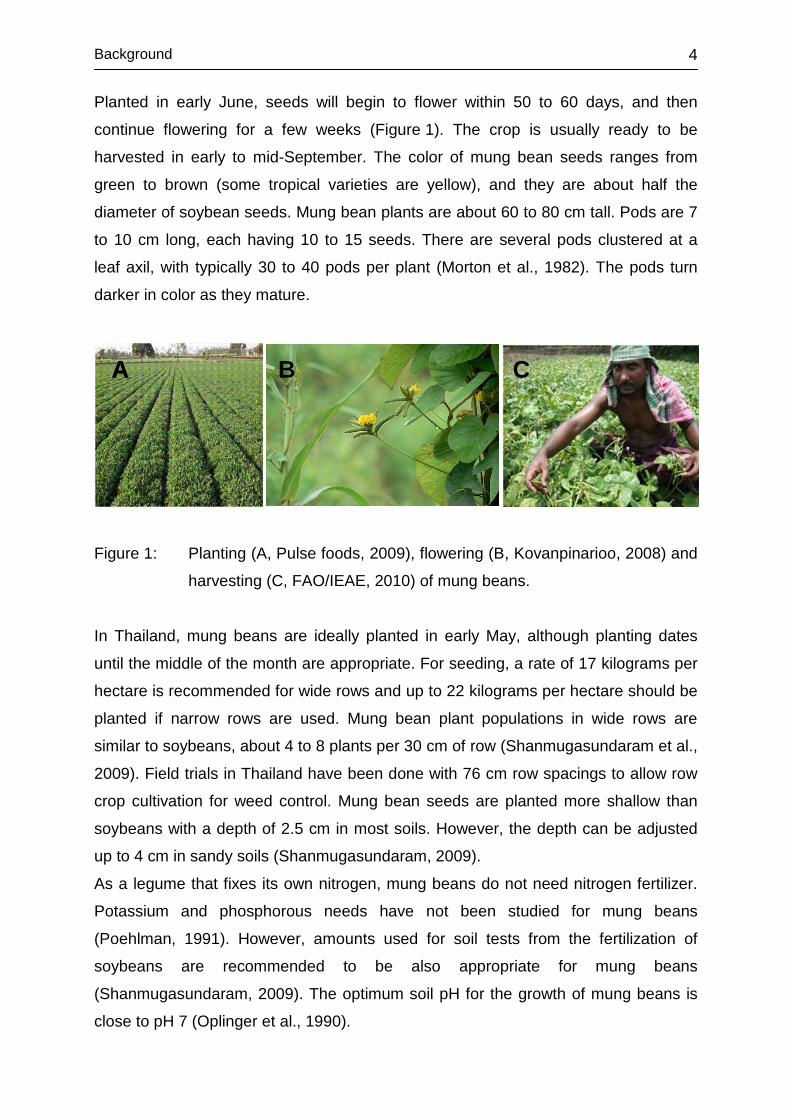
Planted in early June, seeds will begin to flower within 50 to 60 days, and then
continue flowering for a few weeks (Figure 1). The crop is usually ready to be
harvested in early to mid-September. The color of mung bean seeds ranges from
green to brown (some tropical varieties are yellow), and they are about half the
diameter of soybean seeds. Mung bean plants are about 60 to 80 cm tall. Pods are 7
to 10 cm long, each having 10 to 15 seeds. There are several pods clustered at a
leaf axil, with typically 30 to 40 pods per plant (Morton et al., 1982). The pods turn
darker in color as they mature.
A B CA B C
Figure 1: Planting (A, Pulse foods, 2009), flowering (B, Kovanpinarioo, 2008) and
harvesting (C, FAO/IEAE, 2010) of mung beans.
In Thailand, mung beans are ideally planted in early May, although planting dates
until the middle of the month are appropriate. For seeding, a rate of 17 kilograms per
hectare is recommended for wide rows and up to 22 kilograms per hectare should be
planted if narrow rows are used. Mung bean plant populations in wide rows are
similar to soybeans, about 4 to 8 plants per 30 cm of row (Shanmugasundaram et al.,
2009). Field trials in Thailand have been done with 76 cm row spacings to allow row
crop cultivation for weed control. Mung bean seeds are planted more shallow than
soybeans with a depth of 2.5 cm in most soils. However, the depth can be adjusted
up to 4 cm in sandy soils (Shanmugasundaram, 2009).
As a legume that fixes its own nitrogen, mung beans do not need nitrogen fertilizer.
Potassium and phosphorous needs have not been studied for mung beans
(Poehlman, 1991). However, amounts used for soil tests from the fertilization of
soybeans are recommended to be also appropriate for mung beans
(Shanmugasundaram, 2009). The optimum soil pH for the growth of mung beans is
close to pH 7 (Oplinger et al., 1990).
Background 5
Within the last 10 years, efforts have been made to develop new mung bean cultivars
by means of conventional, biotechnological and mutation breeding (Ngampongsai et
al., 2008). Induced mutation breeding using physical and chemical mutagens
represents a method to create genetic variation resulting in new varieties with
enhanced characteristics. The application of radiation and chemical mutation in mung
bean breeding for various aspects were undertaken. The selection and development
of mutants into recommended varieties for the farmers have been successfully made
in many countries (Wongpiyasatid et al., 1998 and 1999). Sandhu and Saxena
(2003) studied different mung bean mutant lines and found high variations in yield
per plant and nutritional quality, especially for contents of protein, methionine,
tryptophan, sulphur, phenol and total sugars. In Thailand, mutation breeding is being
used to improve mung bean varieties regarding a higher yield and an improved
resistance to diseases compared to previously used varieties. A comparison of
different lines in 1997 revealed that most mung beans had agronomic characteristics
not statistically different from each other. To date, some lines gave higher yields with
less powdery mildew infections than the comparators (Ngampongsai et al., 2008).
2.1.2 Properties and utilization
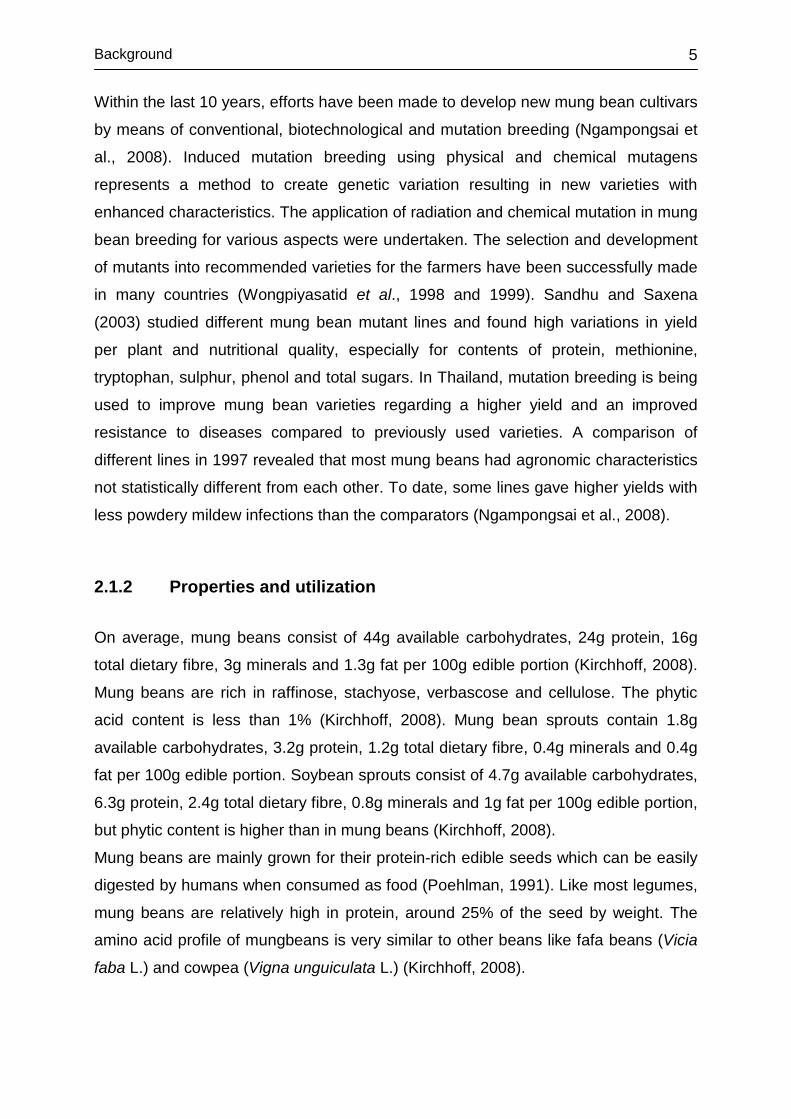
On average, mung beans consist of 44g available carbohydrates, 24g protein, 16g
total dietary fibre, 3g minerals and 1.3g fat per 100g edible portion (Kirchhoff, 2008).
Mung beans are rich in raffinose, stachyose, verbascose and cellulose. The phytic
acid content is less than 1% (Kirchhoff, 2008). Mung bean sprouts contain 1.8g
available carbohydrates, 3.2g protein, 1.2g total dietary fibre, 0.4g minerals and 0.4g
fat per 100g edible portion. Soybean sprouts consist of 4.7g available carbohydrates,
6.3g protein, 2.4g total dietary fibre, 0.8g minerals and 1g fat per 100g edible portion,
but phytic content is higher than in mung beans (Kirchhoff, 2008).
Mung beans are mainly grown for their protein-rich edible seeds which can be easily
digested by humans when consumed as food (Poehlman, 1991). Like most legumes,
mung beans are relatively high in protein, around 25% of the seed by weight. The
amino acid profile of mungbeans is very similar to other beans like fafa beans (Vicia
faba L.) and cowpea (Vigna unguiculata L.) (Kirchhoff, 2008).
Background 6
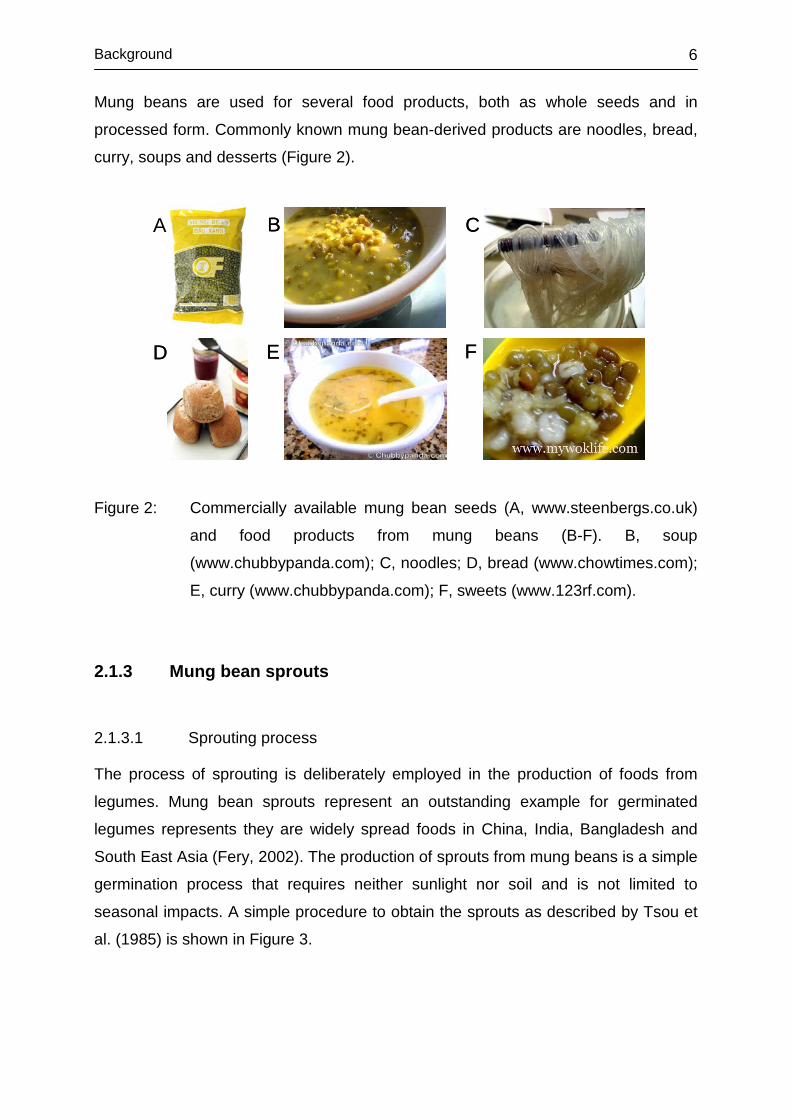
Mung beans are used for several food products, both as whole seeds and in
processed form. Commonly known mung bean-derived products are noodles, bread,
curry, soups and desserts (Figure 2).
A B C
D E F
A B C
D E F
Figure 2: Commercially available mung bean seeds (A, www.steenbergs.co.uk)
and food products from mung beans (B-F). B, soup
(www.chubbypanda.com); C, noodles; D, bread (www.chowtimes.com);
E, curry (www.chubbypanda.com); F, sweets (www.123rf.com).
2.1.3 Mung bean sprouts
2.1.3.1 Sprouting process
The process of sprouting is deliberately employed in the production of foods from
legumes. Mung bean sprouts represent an outstanding example for germinated
legumes represents they are widely spread foods in China, India, Bangladesh and
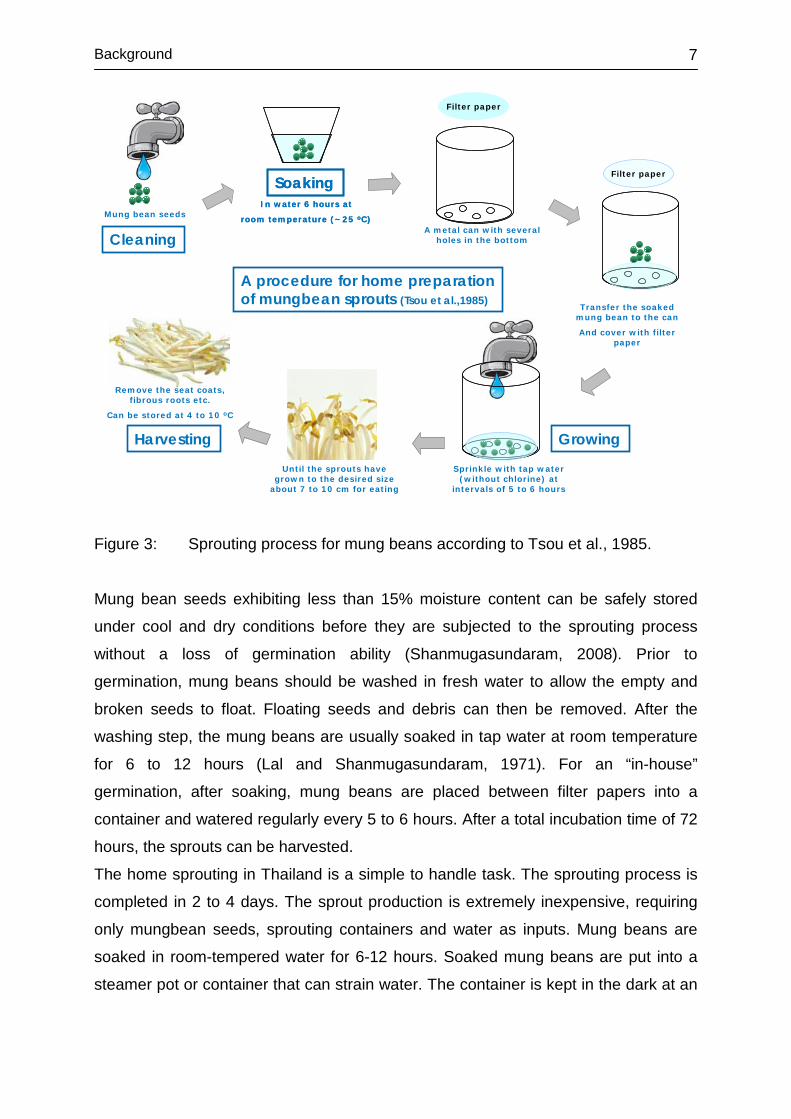
South East Asia (Fery, 2002). The production of sprouts from mung beans is a simple
germination process that requires neither sunlight nor soil and is not limited to
seasonal impacts. A simple procedure to obtain the sprouts as described by Tsou et
al. (1985) is shown in Figure 3.
Background 7
Cleaning
SoakingIn water 6 hours at
room temperature (~25 oC)
SoakingIn water 6 hours at
room temperature (~25 oC)Mung bean seeds
Filter paper
A metal can with severalholes in the bottom
Filter paper
Transfer the soakedmung bean to the can
And cover with filterpaper
Sprinkle with tap water(without chlorine) at
intervals of 5 to 6 hours
Until the sprouts havegrown to the desired size
about 7 to 10 cm for eating
Remove the seat coats, fibrous roots etc.
Can be stored at 4 to 10 oC
GrowingHarvesting
A procedure for home preparationof mungbean sprouts (Tsou et al.,1985)
Figure 3: Sprouting process for mung beans according to Tsou et al., 1985.
Mung bean seeds exhibiting less than 15% moisture content can be safely stored
under cool and dry conditions before they are subjected to the sprouting process
without a loss of germination ability (Shanmugasundaram, 2008). Prior to
germination, mung beans should be washed in fresh water to allow the empty and
broken seeds to float. Floating seeds and debris can then be removed. After the
washing step, the mung beans are usually soaked in tap water at room temperature
for 6 to 12 hours (Lal and Shanmugasundaram, 1971). For an “in-house”
germination, after soaking, mung beans are placed between filter papers into a
container and watered regularly every 5 to 6 hours. After a total incubation time of 72
hours, the sprouts can be harvested.
The home sprouting in Thailand is a simple to handle task. The sprouting process is
completed in 2 to 4 days. The sprout production is extremely inexpensive, requiring
only mungbean seeds, sprouting containers and water as inputs. Mung beans are
soaked in room-tempered water for 6-12 hours. Soaked mung beans are put into a
steamer pot or container that can strain water. The container is kept in the dark at an
Background 8
ambient room temperature and watered and rinsed two times a day (morning and
evening).
The procedure takes about 3-5 days before the sprouts are ready to eat (depends on
summer or winter climate). After obtaining the mature sprouts, the sprouts are
cleaned with running water. Green beans which were not sprouted are manually
removed. In addition, the roots are also removed before consumption. After the
sprouting procedure, sprouts are washed about 10-times in water mixed with a few
table spoons white vinegar to keep sprouts white and fresh. The sprouts can be
stored in an air-tight container in a refrigerator for up to one week.
For the commercial sprout production of mung beans, after soaking process all
sprouting operations are performed in a sheltered place to protect the sprouts from
light. Darkness ensures bright white and long mung bean sprouts. Moderate
temperatures (25-30ºC) and high humidity (85-90%) in the sprouting room help to
produce good quality crispy sprouts (Shanmugasundaram, 2008).
Sprouting mung beans increase to a length of 2 to 3 cm after 1 to 2 days (mini-
mungbean) and reach a length of 8 to 9 cm after 3 to 4 days. Consumer preferences
determine the size of sprouts produced.
Sprouts of marketable size are transferred from the sprouting containers to drums,
troughs or buckets for washing. The sprouts are washed and packed during the early
morning to avoid spoilage by high temperatures after sunrise. Broken roots, sprout
pieces and other debris are removed by washing with fresh cold water 3-4 times. In
addition, seed coats still attached to the sprouts can be removed by the washing
step. Sprouts are removed from the drum by using a basket or sieve (Lal and
Shanmugasundaram, 1971).
2.1.3.2 Properties and utilization
Germination is considered to improve the nutritional quality of mung beans (El-Adawy
et al., 2003). Targeted analyses have demonstrated that the germination of mung
beans is accompanied by a spectrum of significant changes in metabolite contents
(Savage, 1990; Mubarak, 2005; Abdel-Rahman et al., 2007). For example,
decreased triglyceride contents (Abdel-Rahman et al., 2007) and increased levels of
free amino acids (Kavas and El, 1991) have been reported in mung bean sprouts.
Background 9
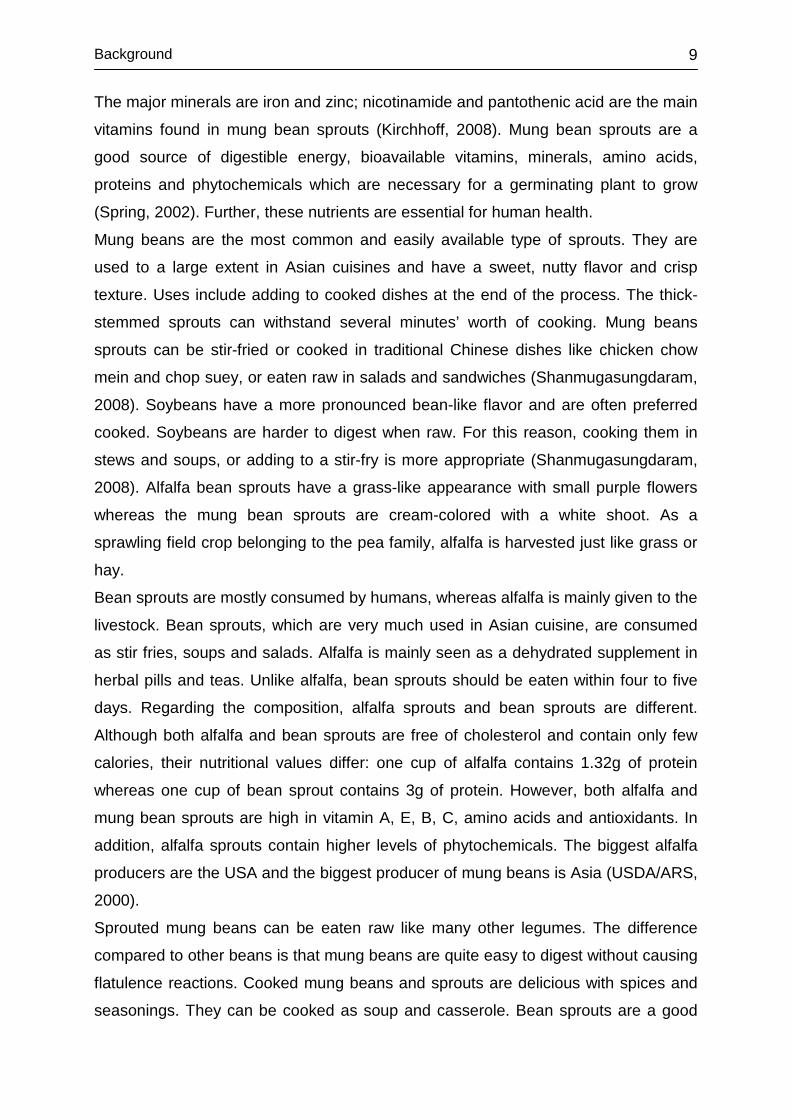
The major minerals are iron and zinc; nicotinamide and pantothenic acid are the main
vitamins found in mung bean sprouts (Kirchhoff, 2008). Mung bean sprouts are a
good source of digestible energy, bioavailable vitamins, minerals, amino acids,
proteins and phytochemicals which are necessary for a germinating plant to grow
(Spring, 2002). Further, these nutrients are essential for human health.
Mung beans are the most common and easily available type of sprouts. They are
used to a large extent in Asian cuisines and have a sweet, nutty flavor and crisp
texture. Uses include adding to cooked dishes at the end of the process. The thick-
stemmed sprouts can withstand several minutes’ worth of cooking. Mung beans
sprouts can be stir-fried or cooked in traditional Chinese dishes like chicken chow
mein and chop suey, or eaten raw in salads and sandwiches (Shanmugasungdaram,
2008). Soybeans have a more pronounced bean-like flavor and are often preferred
cooked. Soybeans are harder to digest when raw. For this reason, cooking them in
stews and soups, or adding to a stir-fry is more appropriate (Shanmugasungdaram,
2008). Alfalfa bean sprouts have a grass-like appearance with small purple flowers
whereas the mung bean sprouts are cream-colored with a white shoot. As a
sprawling field crop belonging to the pea family, alfalfa is harvested just like grass or
hay.
Bean sprouts are mostly consumed by humans, whereas alfalfa is mainly given to the
livestock. Bean sprouts, which are very much used in Asian cuisine, are consumed
as stir fries, soups and salads. Alfalfa is mainly seen as a dehydrated supplement in
herbal pills and teas. Unlike alfalfa, bean sprouts should be eaten within four to five
days. Regarding the composition, alfalfa sprouts and bean sprouts are different.
Although both alfalfa and bean sprouts are free of cholesterol and contain only few
calories, their nutritional values differ: one cup of alfalfa contains 1.32g of protein
whereas one cup of bean sprout contains 3g of protein. However, both alfalfa and
mung bean sprouts are high in vitamin A, E, B, C, amino acids and antioxidants. In
addition, alfalfa sprouts contain higher levels of phytochemicals. The biggest alfalfa
producers are the USA and the biggest producer of mung beans is Asia (USDA/ARS,
2000).
Sprouted mung beans can be eaten raw like many other legumes. The difference
compared to other beans is that mung beans are quite easy to digest without causing
flatulence reactions. Cooked mung beans and sprouts are delicious with spices and
seasonings. They can be cooked as soup and casserole. Bean sprouts are a good
Background 10
source of vitamin C and make a nutritious addition to sandwiches and salads
(www.wisegeek.com).
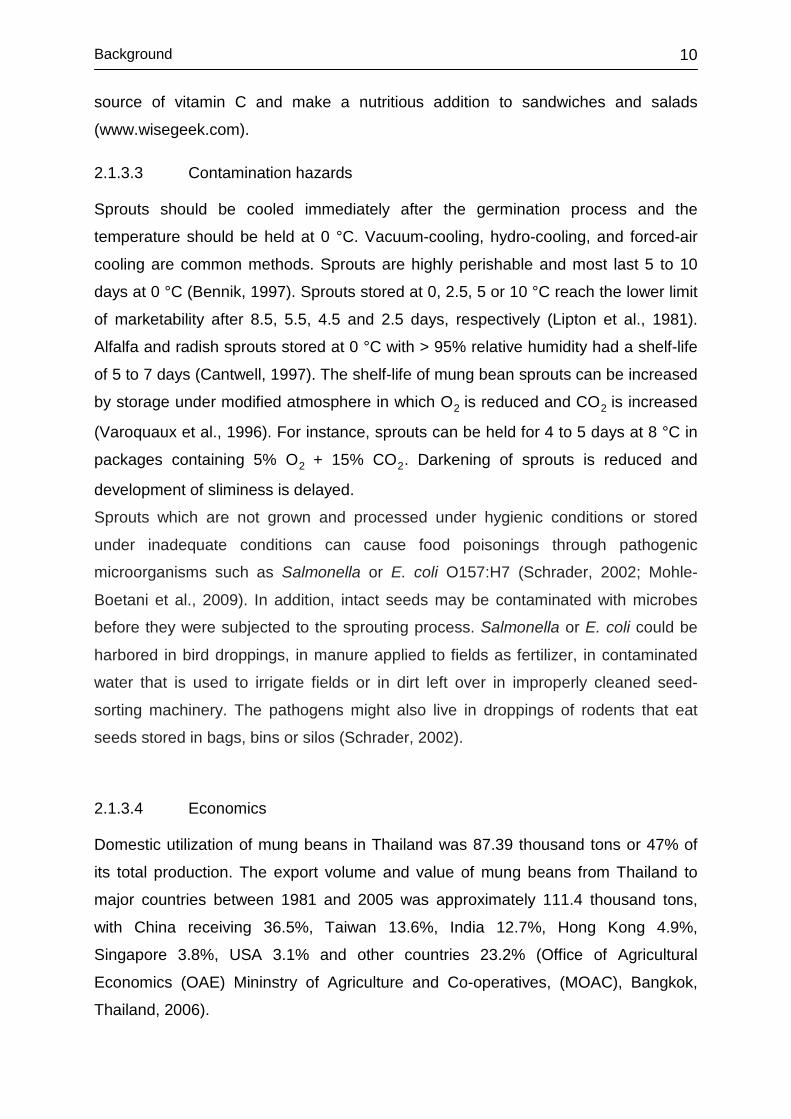
2.1.3.3 Contamination hazards
Sprouts should be cooled immediately after the germination process and the
temperature should be held at 0 °C. Vacuum-cooling, hydro-cooling, and forced-air
cooling are common methods. Sprouts are highly perishable and most last 5 to 10
days at 0 °C (Bennik, 1997). Sprouts stored at 0, 2.5, 5 or 10 °C reach the lower limit
of marketability after 8.5, 5.5, 4.5 and 2.5 days, respectively (Lipton et al., 1981).
Alfalfa and radish sprouts stored at 0 °C with > 95% relative humidity had a shelf-life
of 5 to 7 days (Cantwell, 1997). The shelf-life of mung bean sprouts can be increased
by storage under modified atmosphere in which O2 is reduced and CO2 is increased
(Varoquaux et al., 1996). For instance, sprouts can be held for 4 to 5 days at 8 °C in
packages containing 5% O2 + 15% CO2. Darkening of sprouts is reduced and
development of sliminess is delayed.
Sprouts which are not grown and processed under hygienic conditions or stored
under inadequate conditions can cause food poisonings through pathogenic
microorganisms such as Salmonella or E. coli O157:H7 (Schrader, 2002; Mohle-
Boetani et al., 2009). In addition, intact seeds may be contaminated with microbes
before they were subjected to the sprouting process. Salmonella or E. coli could be
harbored in bird droppings, in manure applied to fields as fertilizer, in contaminated
water that is used to irrigate fields or in dirt left over in improperly cleaned seed-
sorting machinery. The pathogens might also live in droppings of rodents that eat
seeds stored in bags, bins or silos (Schrader, 2002).
2.1.3.4 Economics
Domestic utilization of mung beans in Thailand was 87.39 thousand tons or 47% of
its total production. The export volume and value of mung beans from Thailand to
major countries between 1981 and 2005 was approximately 111.4 thousand tons,
with China receiving 36.5%, Taiwan 13.6%, India 12.7%, Hong Kong 4.9%,
Singapore 3.8%, USA 3.1% and other countries 23.2% (Office of Agricultural
Economics (OAE) Mininstry of Agriculture and Co-operatives, (MOAC), Bangkok,
Thailand, 2006).
Background 11
Most human consumption of mung beans is in the form of bean sprouts, which is
popular in many typical Thai dishes. It was estimated by the traders that the annual
per capita consumption of bean sprouts was about 0.7 to 1.0 kg. This would mean
that in 1987, the total of mung beans consumed in the form of bean sprouts was
about 37.0-52.9 thousand tons. Mung beans are also consumed as a dessert after
either boiling the whole bean or boiling the dehulled half-bean with sugar. Although
figures for the amount of mung beans consumed as a dessert are not available, the
estimation made by the Department of Agricultural Extension on other usage of
mungbean at 10 thousand tons per year, might be regarded as an approximation of
annual mung bean consumption as dessert (Office of Agricultural Economics (OAE)
Ministry of Agriculture and Co-operatives, (MOAC), Bangkok, Thailand, 2006).
Background 12
2.2 PLANT METABOLOMICS
2.2.1 Historical overview
In clinical research, chromatography-based approaches for the investigation of
metabolic patterns and profiles have been developed already in the 1960s and 1970s
(Dalgliesh et al., 1966; Horning and Horning, 1971, Pauling et al., 1971). However, it
took another 20 years until the first milestone was set in the field of plant
metabolomics. Sauter et al. (1991) developed at BASF Ludwigshafen, Germany, an
analytical procedure for the metabolic profiling of barley plants based on extraction,
silylation and capillary gas chromatography. Barley seedlings were treated with
various herbicides at sublethal doses and the profiles from the ethanolic extracts of
the shoots were compared to the untreated plants. This new diagnostic technique in
plant science allowed the detection of 100-200 peaks in a single chromatogram. On
the basis of this approach, scientists from the Max-Planck-Institute for Molecular
Plant Physiology in Golm, Germany, developed around the turn of the millennium a
comprehensive GC-MS-based metabolite profiling methodology for the simultaneous
determination of a broad range of metabolites in Arabidopsis thaliana leaves (Fiehn
et al., 2000a, 2000b) and potato tubers (Roessner et al., 2000; Roessner et al.,
2001). The qualitative and quantitative coverage of more than 150 compounds
enabled the phenotyping of differently expressed plant systems by means of
univariate and multivariate data assessments. Additionally, these studies paved the
way for metabolomics as a tool for plant and crop functional genomics. Following this
pioneer work, in the beginning of the 2000s, several groups / institutions / programs
emerged (Sumner et al., 2003) which developed and applied metabolomics-based
methods for the investigation of plants and plant-derived crops like Medicago
(Huhman and Sumner, 2002), Oryza sativa (Frenzel et al., 2002) and Solanum
lycopersicum (Hall et al., 2002).
The increasing scientific interest in plant profiling techniques led to the first
international congress on plant metabolomics held by Plant Research International in
Wageningen, The Netherlands, in 2002 with the aim “of bringing together those
players who are already active in this field and those who soon plan to be” (Hall et al.,
2002). Only one year later, Harrigan and Goodacre edited the first book on
Background 13
metabolomics entitled “Metabolic profiling: its role in biomarker discovery and gene
function analysis”, in which an overview on the potential of metabolome research was
presented (Harrigan and Goodacre, 2003). Having raised attention, the topic of
metabolomics found its way into several special issues of high-impact scientific
journals and the appreciation of metabolome research culminated in the specific
journal called Metabolomics introduced in 2005 (http://www.springer.com).
Due to progress in technologies and computational advances in the 2000s, plant
metabolomics approaches have been established on various instrumental platforms
and expanded to high throughput and large scale plant systems biology (Weckwerth,
2003; Fernie et al., 2004; Kopka et al., 2004). At the same time, researchers claimed
the suitability of unbiased metabolomics as an additional tool for the safety
assessment of genetically modified plants and crops because of its potential to
increase the probability to detect unintended effects (Kuiper et al., 2003; König et al.,
2004). The origin of those considerations dates back to 2000 when Noteborn et al.
(2000) used liquid chromatography coupled to NMR for a chemical fingerprinting of
transgenic tomatoes. In the meantime, several metabolomics studies have been
conducted for the assessment of genetically modified crops (Shintu et al., 2009;
Ricroch et al., 2011; Frank et al., 2012a).
2.2.2 Definitions
The rapidly growing spectrum of different analytical and instrumental methods used
in the metabolomics community made it necessary to introduce some definitions
regarding the metabolome analysis. A summarizing overview on the different types of
metabolomics-based approaches has been given by Saito and Matsuda (2010). In
analogy to the already established terms genome and proteome, Oliver et al. (1998)
established the term metabolome as the “entity of all metabolites in a biological
system” in the field of yeast functional genomics. Trethewey et al. (1999) gave a first
definition on metabolic profiling as a method that comprises a wide range of
compounds in a single measurement. However, it was also noted that metabolic
profiling is associated with a lower degree of precision compared to targeted
analytical methods. The so-called metabolic or metabolite profiling can be considered
as one of the most pragmatic approaches presently applied. It aims at the detection,
identification and quantification of a broad spectrum of compounds in a single sample
Background 14
in an effective and reproducible way to provide a deeper insight into the complex
biological system (Fiehn et al., 2000b; Fiehn, 2002; Kopka et al., 2004). By definition,
“metabolite profiling” represents the analysis of selected compounds from the same
chemical compound classes or compounds linked by known metabolic relationships
(Allwood et al., 2008). In contrast, “metabolic fingerprinting” represents a rapid
screening method for biological samples without a major pretreatment of the plant
material to be analyzed. In order to screen a large number of these samples, e.g. in
plant breeding programs, it might not be necessary to determine the individual level
of every metabolite. Instead, a rapid classification of samples according to their
biological relevance might be sufficient (Allwood et al., 2008).
2.2.3 Techniques
In recent years, multiple-platform profiling and fingerprinting techniques have been
developed and applied to comprehensive analyses of plant / crop genotypes and
phenotypes. Established platforms are gas chromatography-mass spectrometry (GC-
MS), (high and ultra performance) liquid chromatography-mass spectrometry (HPLC-
MS, UPLC-MS), direct infusion-mass spectrometry (DI-MS), capillary electrophoresis-
mass spectrometry (CE-MS), Fourier transform ion cyclotron resonance mass
spectrometry (FT-ICR-MS), nuclear magnetic resonance spectroscopy (NMR),
Fourier transform infrared-spectroscopy (FT-IR) as well as hyphenated techniques
(Dunn and Ellis, 2005; Allwood et at., 2008, 2009, 2010, 2011; Hagel and Facchini,
2008; Harada and Fukusaki, 2009; Hall, 2011; Ramautar et al., 2011). Coupling of
GC or LC and mass spectrometry have proven to be the most applied methodologies
within the scope of plant metabolite profiling (Trethewey, 2006; Steinhauser and
Kopka, 2007; Moritz and Johansson, 2008; Bedair and Sumner, 2008). Newer GC-
time-of-flight (Tof)-MS systems combine a high separation efficiency and resolution of
capillary GC with the high sensitivity of mass-selective detection making it attractive
in GC-based metabolome analysis. However, owing to inherent features of the
approach, e.g. choice of extraction solvents, derivatization steps or volatilities of
derivatives, it has to be considered that the type of metabolites covered is to some
extent pre-determined and not fully “unbiased”. Therefore, and based on the
assumption that single plants may contain potentially up to 20 000 metabolites
(Fernie et al., 2004), the use of a single GC technique still has its limitations.
Background 15
Therefore, the application of multi-dimensional GC or multiple-platform crossing
techniques can help to improve the detection and identification of plant metabolites
for qualitative and quantitative metabolite profiling of plant systems. A promising
approach is represented by a two-dimensional GC combined with time-of-flight mass
spectrometry (GCxGC-Tof-MS). This strategy allowed, for example, the detection of
more than 1400 peaks in a single chromatogram obtained from a plant leaf extract
(Pierce et al., 2006). In addition to GC, LC-based investigation of metabolites is an
aspiring field in metabolomics (Theodoridis et al., 2008). In contrast to GC analysis,
fewer sample preparation steps (e.g. derivatization) are necessary. Moreover, LC
analyses can be adapted to a wider array of substances, including a range of
secondary plant metabolites such as alkaloids, flavonoids, glucosinolates, isoprenes
and saponins (Fernie et al., 2004). However, this technique has some drawbacks in
the chromatographic performance compared to GC. The use of UPLC might
overcome these drawbacks by increasing the chromatographic resolution and
additionally allowing a more rapid analysis in plant metabolomics studies (Wilson et
al., 2005; Moritz and Johansson, 2008; Grata et al., 2009; Allwood and Goodacre,
2010; Eugster et al., 2011). A comprehensive overview on advantages and
disadvantages of GC and LC-based mass spectrometric methods is given by Hall
(2011).
For plant metabolic fingerprinting, non-destructive spectroscopic approaches like 1H-
NMR and 13C-NMR (Krishnan et al., 2005; Colquhoun, 2007; Schripsema, 2010; Kim
et al. 2010, 2011; Leiss et al., 2011; Palomino-Schätzlein et al., 2011) and FT-IR
(Gidman et al., 2003; Johnson et al., 2004) are being used without a
chromatographic separation of individual compounds. Nevertheless, NMR has
proven to be a suitable instrumental platform for the coverage of both abundant
primary metabolites (e.g. sugars, amino acids) as well as secondary plant
metabolites (e.g. flavonoids, alkaloids) (Leiss et al., 2011). An overview on NMR-
based plant metabolomics studies is given by Verpoorte et al. (2007) and Kim et al.
(2011). An advantage of NMR is that its signals are proportional to the metabolite
molar concentrations which allows the direct comparison of concentrations of all
metabolites without the preparation of calibration curves (Kim et al., 2010). On the
other hand, a major drawback of NMR is its relatively low sensitivity compared to MS-
based methods. Therefore, hyphenated techniques that couple chromatography to
Background 16
mass spectrometry or to NMR are considered as powerful combinations, in particular
with respect to compound identification (Bino et al., 2004).
A method which is coming increasingly in the focus of interest is FT-ICR-MS. It is
characterized by an extreme mass-resolving power, detection sensitivity and mass
accuracy (Hagel and Facchini, 2008). FT-ICR-MS has been applied to metabolomics
by plant biologists and used to investigate developmental changes, stress-
responses, varietal differences, phenotyping and impact of genetic modification. A
good overview of the potential and use of FT-ICR-MS in plant and crop metabolomics
has been given by Daskalchuk et al. (2006) and Ohta et al. (2007). In addition,
capillary electrophoresis mass spectrometry (CE-MS) represents an interesting
method for the metabolite profiling of polar and charged compounds. It rapidly
separates such compounds on the basis of their m/z ratio without a major sample
pretreatment. A good overview on CE-MS applications in plant metabolomics is given
by Ramautar et al. (2011).
In addition to the mentioned platforms, there is an increasing demand to link
metabolomics to other omics-techniques, i.e. genomics, transcriptomics and
proteomics in order to strengthen the power of plant functional genomics.
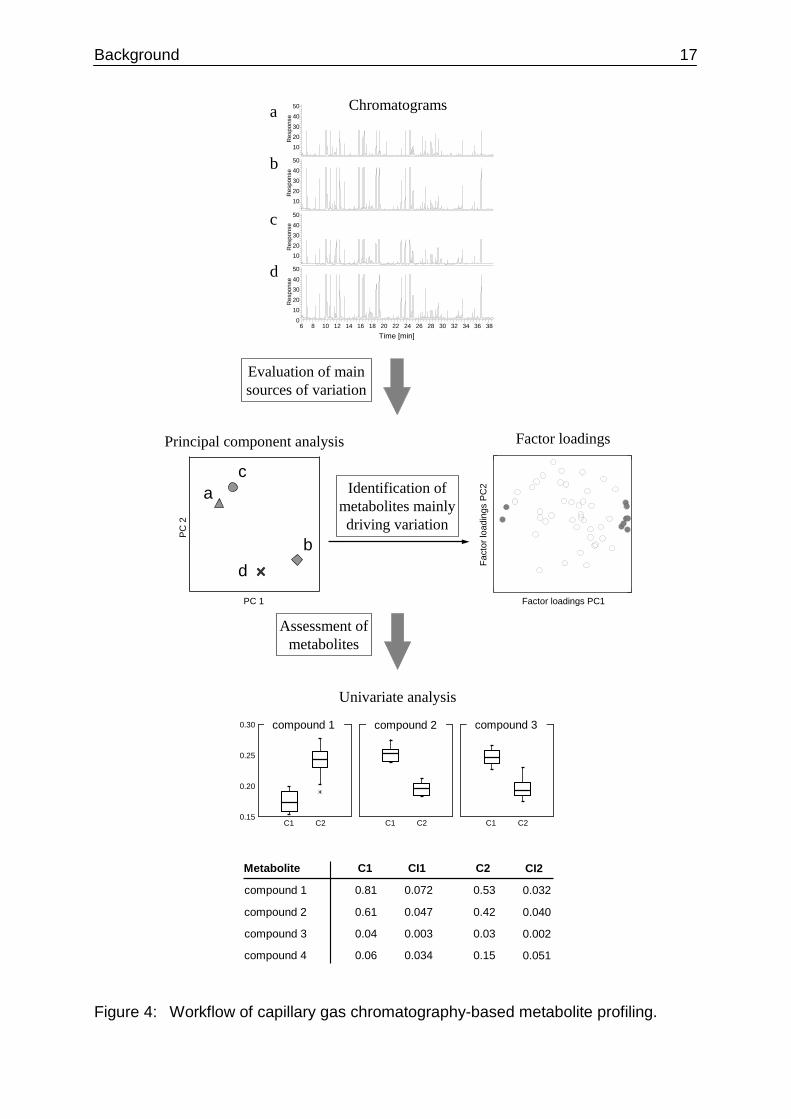
2.2.4 Metabolite Profiling Workflow
The application of metabolite profiling to broad arrays of samples results in a huge
amount of metabolite-related data. Therefore, the traditional data analysis based on
“value-by-value” comparisons is not satisfactory. For metabolite profiling data it is
more appropriate to start with a multivariate analysis approach for the overall
determination of variation in a dataset followed by univariate analysis of metabolites
shown to be relevant in the foregoing multivariate approach.
Multivariate statistical analytical methods such as principal component analysis
(PCA), hierarchical cluster analysis (HCA) and self-organizing maps (SOMs) proved
to be useful tools in the analysis and evaluation of metabolite profiling data (Sumner
et al., 2003; Roessner et al., 2001; Pierce et al., 2006). Principal component analysis
enables the rapid differentiation of samples based on their metabolite profiles by
visualizing the data as dots in a two-dimensional plot (Figure 4).
Background 17
6 8 10 12 14 16 18 20 22 24 26 28 30 32 34 36 38
Time [min]
0
10
20
3040
50
1020
3040
50
1020
30
4050
10
2030
40
50 Chromatograms
Res
pons
eR
espo
nse
Res
pons
eR
espo
nse
PC 1
PC
2
Principal component analysis
Factor loadings PC1
Fact
orlo
adin
gsP
C2
Factor loadings
Evaluation of mainsources of variation
Identification of metabolites mainlydriving variation
Assessment of metabolites
Univariate analysis
a
b
c
d
ac
bd
C2C1C2C1C2C10.15
0.20
0.25
0.30
0.034 0.150.06compound 4
0.003 0.030.04compound 3
0.047 0.420.61compound 2
0.072 0.530.81compound 1
CI1 C2C1Metabolite
compound 1 compound 2 compound 3
0.051
0.002
0.040
0.032
CI2
Figure 4: Workflow of capillary gas chromatography-based metabolite profiling.
Background 18
The investigation of the major sources of variation is followed by a substantiation of
differences. An efficient way to identify the drivers of variation is to examine the factor
loadings as determined by PCA. For example, if a clear separation of samples is
revealed on the first principal component, the main contributors to this effect will
exhibit high absolute loading factors in PC1 (Figure 4). In a subsequent step, the
signals of target compounds can be evaluated using univariate statistical approaches
such as Student´s t-test, analysis of variance (ANOVA) or in form of box plots.
A major future challenge for metabolomics will be the implementation of reporting
standards as suggested by the Metabolomics Standards Initiative (Fiehn et al., 2007).
This would ensure the comparability of metabolite profiling data to be used for crop
metabolite databases.
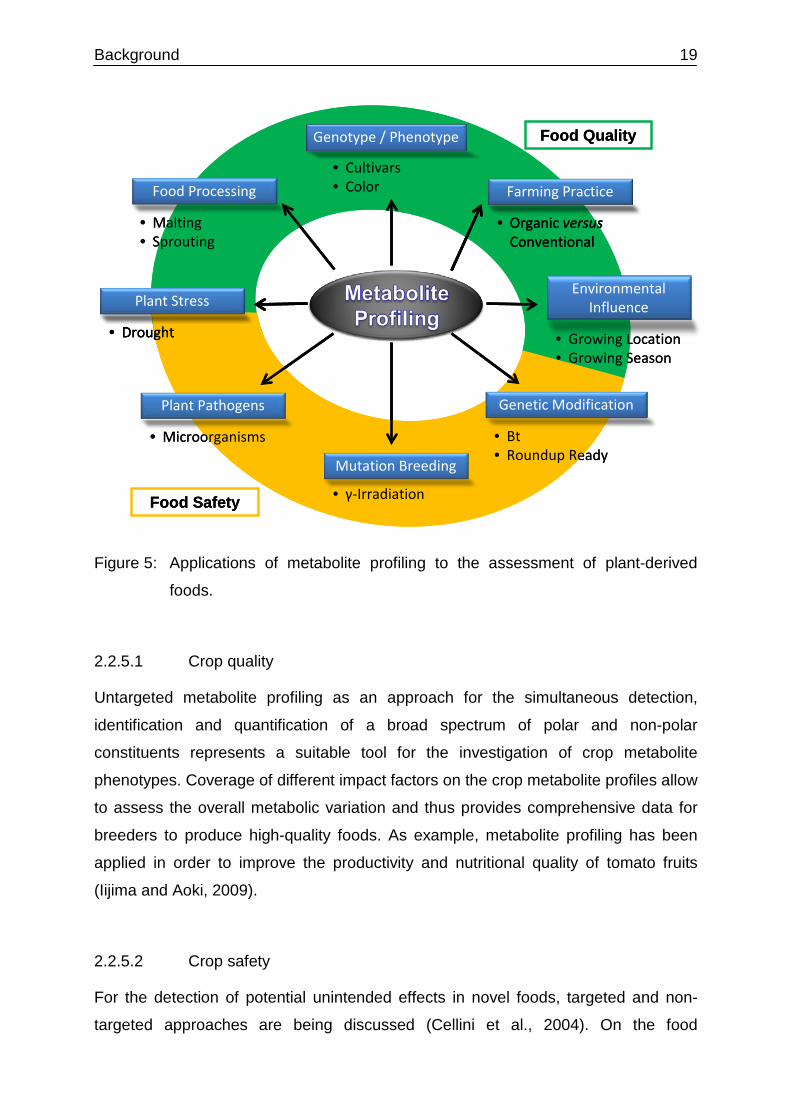
2.2.5 Metabolite profiling of plant-derived foods
During the past years, numerous studies have been conducted to the investigation of
quality and safety of plants and crops from various families of the plant kingdom. An
overview on potential applications of metabolite profiling to plant-derived foods is
given in Figure 5.
Unbiased profiling methods using numerous instrumental platforms have been
applied amongst others to assess the naturally occurring metabolic diversity and
genetic variation in crops (Harrigan et al., 2007; Davies et al., 2010; Maltese and
Verpoorte, 2010), to investigate the plant metabolic response to stress induction, e.g.
through microbial inoculation, heavy metals or drought (Shulaev et al., 2008), to
follow metabolic changes in the course of plant developmental stages (Shu et al.,
2008), to discover plant metabolic biomarkers for phenotype prediction (Steinfath et
al., 2010), to annotate plant gene functions (Tohge and Fernie, 2010), to elucidate
plant metabolic pathways (Dixon et al., 2006), to improve the nutritional quality of
plant-derived crops (Fernie and Schauer, 2009; Hall et al., 2008) and to assess
potential unintended effects in genetically modified foods (Hoekenga, 2008; García-
Canas et al., 2011; Ricroch et al., 2011) even in the light of environmental influences
(Shintu et al., 2009; Frank et al., 2012a).
Background 19
Plant Pathogens
• Microorganisms
Mutation Breeding
• γ-Irradiation
Genotype / Phenotype
• Cultivars• Color
Genetic Modification
• Bt• Roundup Ready
Plant Stress
• Drought
EnvironmentalInfluence
• Growing Location• Growing Season
Food Processing
• Malting• Sprouting
Farming Practice
• Organic versusConventional
Food Safety
Food Quality
Plant PathogensPlant Pathogens
• Microorganisms
Mutation BreedingMutation Breeding
• γ-Irradiation
Genotype / PhenotypeGenotype / Phenotype
• Cultivars• Color
Genetic ModificationGenetic Modification
• Bt• Roundup Ready
Plant Stress
• Drought
Plant StressPlant Stress
• Drought
EnvironmentalInfluence
EnvironmentalInfluence
• Growing Location• Growing Season
Food ProcessingFood Processing
• Malting• Sprouting
Farming Practice
• Organic versusConventional
Farming PracticeFarming Practice
• Organic versusConventional
Food Safety
Food Quality
Figure 5: Applications of metabolite profiling to the assessment of plant-derived
foods.
2.2.5.1 Crop quality
Untargeted metabolite profiling as an approach for the simultaneous detection,
identification and quantification of a broad spectrum of polar and non-polar
constituents represents a suitable tool for the investigation of crop metabolite
phenotypes. Coverage of different impact factors on the crop metabolite profiles allow
to assess the overall metabolic variation and thus provides comprehensive data for
breeders to produce high-quality foods. As example, metabolite profiling has been
applied in order to improve the productivity and nutritional quality of tomato fruits
(Iijima and Aoki, 2009).
2.2.5.2 Crop safety
For the detection of potential unintended effects in novel foods, targeted and non-
targeted approaches are being discussed (Cellini et al., 2004). On the food
Background 20
composition level, targeted methods are used for the analysis of specific compounds,
e.g. macronutrients, micronutrients and toxins (EFSA, 2011). However, those
targeted approaches have limitations owing to their biased character. That means,
only known compounds can be analyzed with respect to these methods. Therefore,
unbiased metabolite profiling approaches are considered as additional tools for the
safety assessment of GM-derived crops (Kuiper et al., 2003; Davies, 2009; Shintu et
al., 2009). Metabolite profiling-based comparative investigations of crops grown
under different environmental conditions enable consistent differences to be
searched for in order to distinguish between natural variability and changes induced
by different treatments such as genetic modification. In combination with an
appropriate statistical data analysis, metabolite profiling therefore increases the
probability of detecting effects not intended by the genetic modification and thus
contributes to the safety assessment of such crops. Comprehensive overviews on
metabolite profiling-based comparative studies of genetically modified and non-GM
crops including barley, rice, wheat and maize are given in literature (Harrigan et al.,
2010; Ricroch et al., 2011).
2.2.5.3 Food processing
Metabolomics approaches are being employed to follow developmental changes in
crops. An important stage in plant biology is represented by germination. Metabolic
changes within this stage have been investigated by means of metabolite profiling in
various crops including rice (Shu et al., 2008) and potatoes (Roessner et al., 2001).
In addition to the investigations of solely “natural” biological changes in crops during
their life-cycle, metabolomics has become a rapidly emerging analytical approach in
food science including food processing (Cevallos-Cevallos et al., 2009). As example,
malting - a process-related germination - of barley as one of the most important
applications in food technology has been investigated by a GC-MS-based metabolite
profiling (Frank et al., 2011). Due to the simultaneous coverage of a comprehensive
set of metabolic data, metabolite profiling may assist in providing valuable information
for further improvements of the quality of processed foods.
Materials and methods 21
3 MATERIALS AND METHODS
3.1 MATERIALS
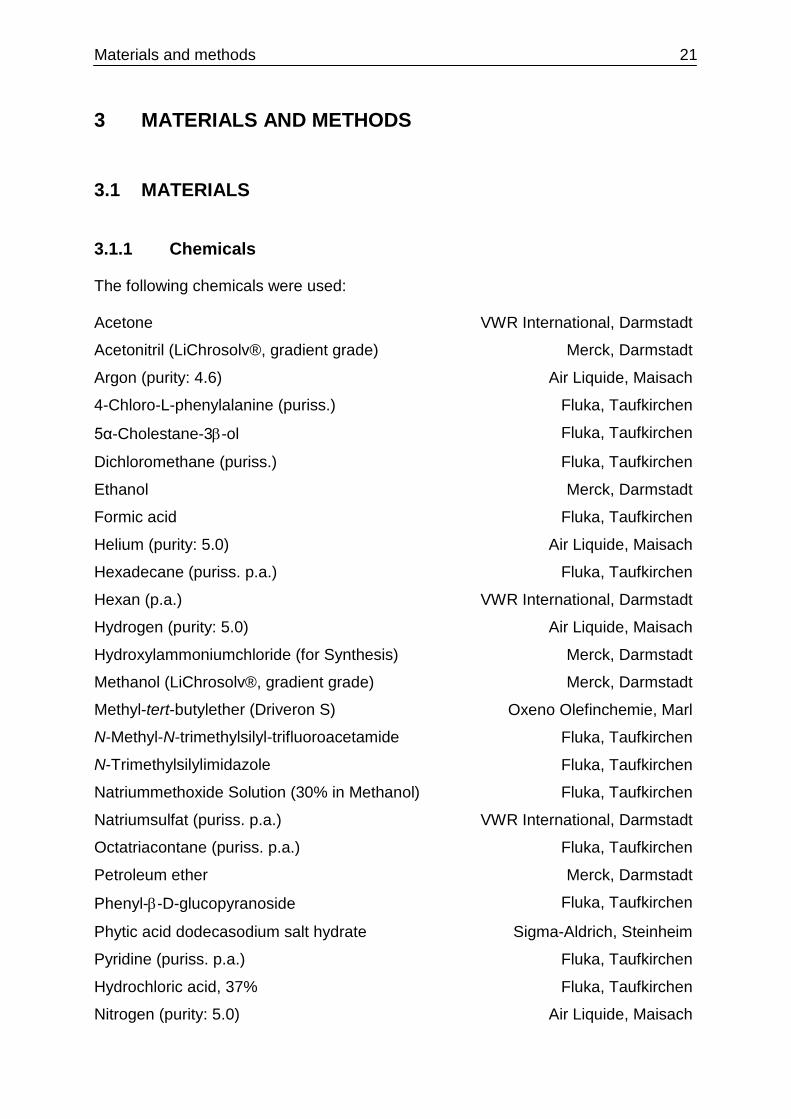
3.1.1 Chemicals
The following chemicals were used:
Acetone VWR International, Darmstadt
Acetonitril (LiChrosolv®, gradient grade) Merck, Darmstadt
Argon (purity: 4.6) Air Liquide, Maisach
4-Chloro-L-phenylalanine (puriss.) Fluka, Taufkirchen
5α-Cholestane-3β-ol Fluka, Taufkirchen
Dichloromethane (puriss.) Fluka, Taufkirchen
Ethanol Merck, Darmstadt
Formic acid Fluka, Taufkirchen
Helium (purity: 5.0) Air Liquide, Maisach
Hexadecane (puriss. p.a.) Fluka, Taufkirchen
Hexan (p.a.) VWR International, Darmstadt
Hydrogen (purity: 5.0) Air Liquide, Maisach
Hydroxylammoniumchloride (for Synthesis) Merck, Darmstadt
Methanol (LiChrosolv®, gradient grade) Merck, Darmstadt
Methyl-tert-butylether (Driveron S) Oxeno Olefinchemie, Marl
N-Methyl-N-trimethylsilyl-trifluoroacetamide Fluka, Taufkirchen
N-Trimethylsilylimidazole Fluka, Taufkirchen
Natriummethoxide Solution (30% in Methanol) Fluka, Taufkirchen
Natriumsulfat (puriss. p.a.) VWR International, Darmstadt
Octatriacontane (puriss. p.a.) Fluka, Taufkirchen
Petroleum ether Merck, Darmstadt
Phenyl-β-D-glucopyranoside Fluka, Taufkirchen
Phytic acid dodecasodium salt hydrate Sigma-Aldrich, Steinheim
Pyridine (puriss. p.a.) Fluka, Taufkirchen
Hydrochloric acid, 37% Fluka, Taufkirchen
Nitrogen (purity: 5.0) Air Liquide, Maisach
Materials and methods 22
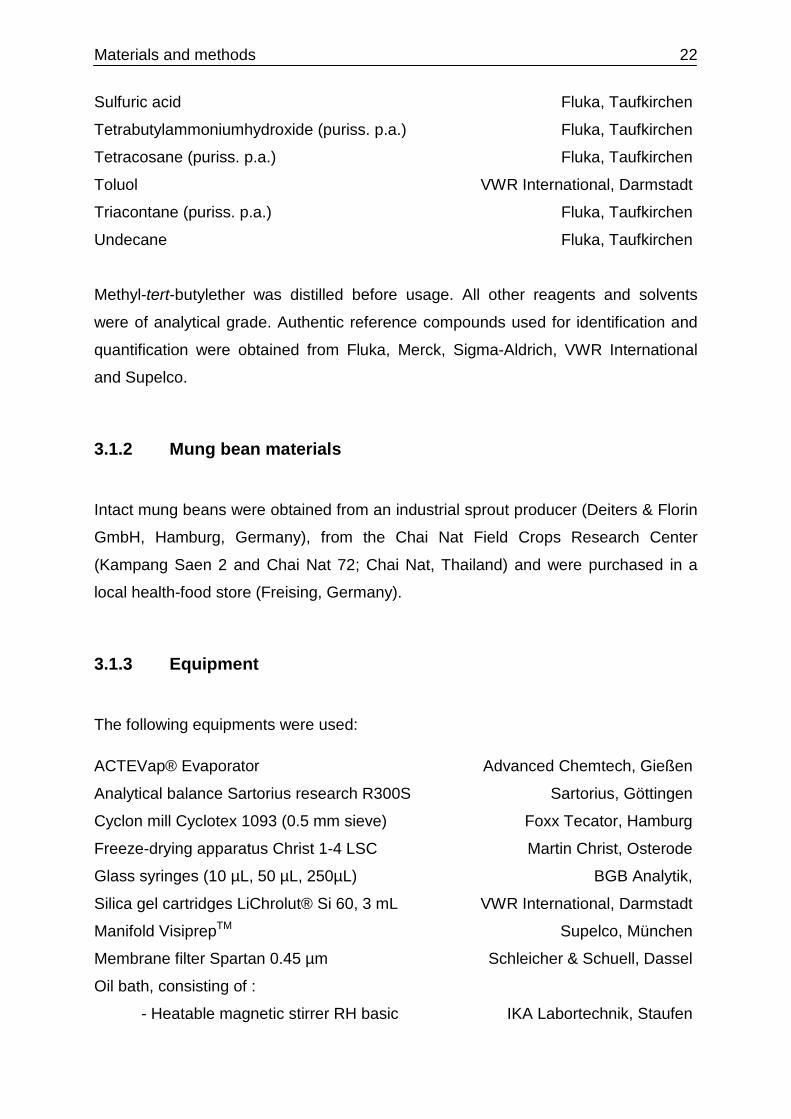
Sulfuric acid Fluka, Taufkirchen
Tetrabutylammoniumhydroxide (puriss. p.a.) Fluka, Taufkirchen
Tetracosane (puriss. p.a.) Fluka, Taufkirchen
Toluol VWR International, Darmstadt
Triacontane (puriss. p.a.) Fluka, Taufkirchen
Undecane Fluka, Taufkirchen
Methyl-tert-butylether was distilled before usage. All other reagents and solvents
were of analytical grade. Authentic reference compounds used for identification and
quantification were obtained from Fluka, Merck, Sigma-Aldrich, VWR International
and Supelco.
3.1.2 Mung bean materials
Intact mung beans were obtained from an industrial sprout producer (Deiters & Florin
GmbH, Hamburg, Germany), from the Chai Nat Field Crops Research Center
(Kampang Saen 2 and Chai Nat 72; Chai Nat, Thailand) and were purchased in a
local health-food store (Freising, Germany).
3.1.3 Equipment
The following equipments were used:
ACTEVap® Evaporator Advanced Chemtech, Gießen
Analytical balance Sartorius research R300S Sartorius, Göttingen
Cyclon mill Cyclotex 1093 (0.5 mm sieve) Foxx Tecator, Hamburg
Freeze-drying apparatus Christ 1-4 LSC Martin Christ, Osterode
Glass syringes (10 µL, 50 µL, 250µL) BGB Analytik,
Silica gel cartridges LiChrolut® Si 60, 3 mL VWR International, Darmstadt
Manifold VisiprepTM Supelco, München
Membrane filter Spartan 0.45 µm Schleicher & Schuell, Dassel
Oil bath, consisting of :
- Heatable magnetic stirrer RH basic IKA Labortechnik, Staufen

Materials and methods 23
- Thermo stable fluid Labothermol® S neoLab, Heidelberg
- Glass dish Zefa Laborservice, Harhausen
- Thermometer ETS-D4 IKA Labortechnik, Staufen
- Magnetic stirring staff VWR International, Darmstadt
Vacuum rotary evaporator VV2001 Heidolph, Schwabach
Supersonic bath Sonorex RK 100H Bandelin Electronic, Berlin
Vortexer VF2 IKA Labortechnik, Staufen
Water treatment apparatus Milli-Q plus Millipore, Eschborn
Materials and methods 24
3.2 METHODS
3.2.1 Metabolite profiling of mung beans
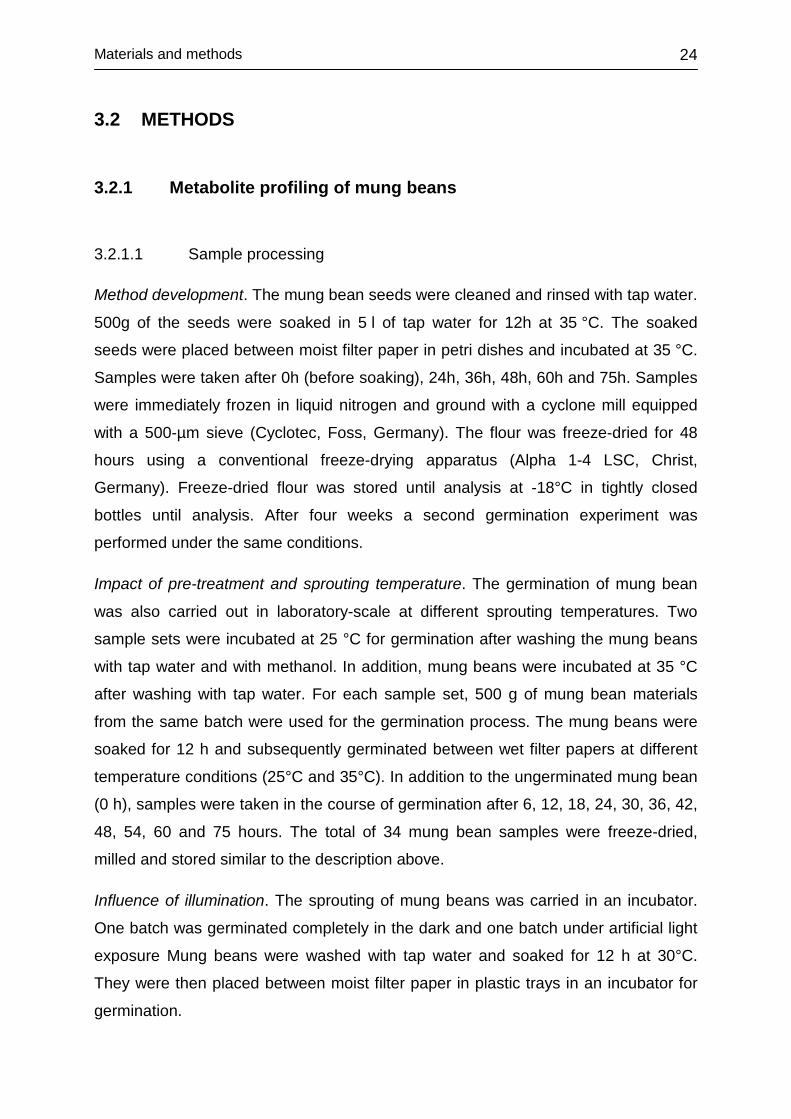
3.2.1.1 Sample processing Method development. The mung bean seeds were cleaned and rinsed with tap water.
500g of the seeds were soaked in 5 l of tap water for 12h at 35 °C. The soaked
seeds were placed between moist filter paper in petri dishes and incubated at 35 °C.
Samples were taken after 0h (before soaking), 24h, 36h, 48h, 60h and 75h. Samples
were immediately frozen in liquid nitrogen and ground with a cyclone mill equipped
with a 500-µm sieve (Cyclotec, Foss, Germany). The flour was freeze-dried for 48
hours using a conventional freeze-drying apparatus (Alpha 1-4 LSC, Christ,
Germany). Freeze-dried flour was stored until analysis at -18°C in tightly closed
bottles until analysis. After four weeks a second germination experiment was
performed under the same conditions.
Impact of pre-treatment and sprouting temperature. The germination of mung bean
was also carried out in laboratory-scale at different sprouting temperatures. Two
sample sets were incubated at 25 °C for germination after washing the mung beans
with tap water and with methanol. In addition, mung beans were incubated at 35 °C
after washing with tap water. For each sample set, 500 g of mung bean materials
from the same batch were used for the germination process. The mung beans were
soaked for 12 h and subsequently germinated between wet filter papers at different
temperature conditions (25°C and 35°C). In addition to the ungerminated mung bean
(0 h), samples were taken in the course of germination after 6, 12, 18, 24, 30, 36, 42,
48, 54, 60 and 75 hours. The total of 34 mung bean samples were freeze-dried,
milled and stored similar to the description above.
Influence of illumination. The sprouting of mung beans was carried in an incubator.
One batch was germinated completely in the dark and one batch under artificial light
exposure Mung beans were washed with tap water and soaked for 12 h at 30°C.
They were then placed between moist filter paper in plastic trays in an incubator for
germination.
Materials and methods 25
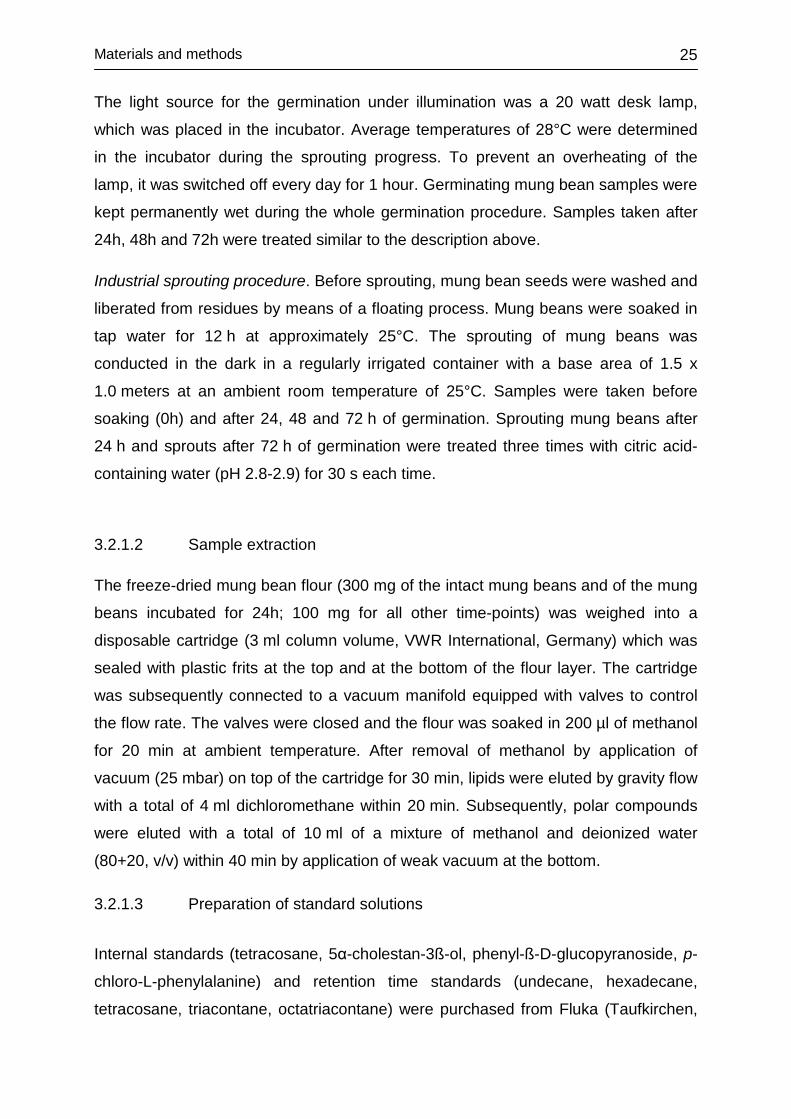
The light source for the germination under illumination was a 20 watt desk lamp,
which was placed in the incubator. Average temperatures of 28°C were determined
in the incubator during the sprouting progress. To prevent an overheating of the
lamp, it was switched off every day for 1 hour. Germinating mung bean samples were
kept permanently wet during the whole germination procedure. Samples taken after
24h, 48h and 72h were treated similar to the description above.
Industrial sprouting procedure. Before sprouting, mung bean seeds were washed and
liberated from residues by means of a floating process. Mung beans were soaked in
tap water for 12 h at approximately 25°C. The sprouting of mung beans was
conducted in the dark in a regularly irrigated container with a base area of 1.5 x
1.0 meters at an ambient room temperature of 25°C. Samples were taken before
soaking (0h) and after 24, 48 and 72 h of germination. Sprouting mung beans after
24 h and sprouts after 72 h of germination were treated three times with citric acid-
containing water (pH 2.8-2.9) for 30 s each time.
3.2.1.2 Sample extraction The freeze-dried mung bean flour (300 mg of the intact mung beans and of the mung
beans incubated for 24h; 100 mg for all other time-points) was weighed into a
disposable cartridge (3 ml column volume, VWR International, Germany) which was
sealed with plastic frits at the top and at the bottom of the flour layer. The cartridge
was subsequently connected to a vacuum manifold equipped with valves to control
the flow rate. The valves were closed and the flour was soaked in 200 µl of methanol
for 20 min at ambient temperature. After removal of methanol by application of
vacuum (25 mbar) on top of the cartridge for 30 min, lipids were eluted by gravity flow
with a total of 4 ml dichloromethane within 20 min. Subsequently, polar compounds
were eluted with a total of 10 ml of a mixture of methanol and deionized water
(80+20, v/v) within 40 min by application of weak vacuum at the bottom.
3.2.1.3 Preparation of standard solutions
Internal standards (tetracosane, 5α-cholestan-3ß-ol, phenyl-ß-D-glucopyranoside, p-
chloro-L-phenylalanine) and retention time standards (undecane, hexadecane,
tetracosane, triacontane, octatriacontane) were purchased from Fluka (Taufkirchen,
Materials and methods 26
Germany). Acetonitrile was obtained from VWR International (Darmstadt, Germany).
Other solvents and chemicals used were purchased from Merck (Darmstadt,
Germany) and Sigma-Aldrich (Taufkirchen, Germany).
Retention time standard 1 was prepared by adding n-hexane solutions of undecane
(1.5 ml, 2 mg/ml), hexadecane (2.5 ml, 1.5 mg/ml), tetracosane (4 ml, 1.5 mg/ml),
and triacontane (4 ml, 1.5 mg/ml) to 15 mg of octatriacontane. Retention time
standard 2 was prepared by adding 1.5 ml of n-hexane and n-hexane solutions of
hexadecane (2.5 ml, 1.5 mg/ml), tetracosane (4 ml, 1.5 mg/ml), and triacontane (4
ml, 1.5 mg/ml) to 15 mg of octatriacontane.
Internal standard solution for fraction I was identical to the retention time standard 1
(tetracosane was used as internal standard). For fraction II a solution of 5α-
cholestan-3ß-ol in dichloromethane (0.3 mg/ml) was used as internal standard
solution. The internal standard solution for fraction III was obtained by dissolving 40
mg of phenyl-ß-D-glucopyranoside in 50 ml of deionized water. A solution of p-chloro-
L-phenylalanine in deionized water (0.3 mg/ml) was used as internal standard
solution for fraction IV.
3.2.1.4 Fractionation and analysis of lipids 100 µl of internal standard solution I and 100 µl of internal standard solution II were
added to 4 ml of the lipid extract. After evaporation to dryness under vacuum by
means of an ACTEVap evaporator (40°C), the residue was redissolved in 500 µl of
methyl-tert-butylether (MTBE), 300 µl of dry methanol and 50 µl of sodium methylate
(5.4 M in methanol). After reaction for 90 min at room temperature, 1 ml of
dichloromethane and 2 ml of aqueous 0.35 M hydrochloric acid were added and the
mixture vigorously shaken. The upper phase was discarded and the lower phase
containing the transmethylated lipids was evaporated to dryness under vacuum.
A small amount of anhydrous sodium sulfate was placed on top of a 500 mg silica gel
SPE cartridge (LiChrolut, VWR International, Germany) conditioned with 2.5 ml of n-
hexane. Transmethylated lipids were redissolved in 250 µl of dichloromethane and
transferred to the SPE cartridge. The fatty acid methyl ester fraction (fraction I) was
eluted with hexane/MTBE (100+2, v/v, 2 x 3 ml). Subsequently, the fraction of polar
lipids (fraction II) was eluted with hexane/MTBE (70+30, v/v, 2 x 3 ml). After addition
of 100 µl retention time standard 1 to fraction II, both fractions were evaporated to
Materials and methods 27
dryness under vacuum (40°C). The residue of fraction I was redissolved in 300 µl of
hexane, and 1 µl was injected into the gas chromatograph. After flushing the flask
with argon, the residue of fraction II was redissolved in 250 µl of dry pyridine and 50
µl of N-methyl-N-trimethylsilyl-trifuoroacetamide were added. Silylation was
performed in an oil bath for 15 min at 70°C. The sample was cooled to room
temperature and 1 µl was analyzed by gas chromatography.
3.2.1.5 Fractionation and analysis of polar extract After addition of internal standard solutions III (250 µl) and IV (250 µl) to the total of
polar extract, 1 ml of the polar extract was evaporated to dryness under vacuum
(50°C). The flask was flushed with argon and the residue redissolved in 300 µl of dry
pyridine and 100 µl of trimethylsilylimidazole. Silylation was performed in an oil bath
for 15 min at 70°C. The silylated sample was diluted with 300 µl of n-hexane and 300
µl of deionized water were added for selective hydrolysis of organic acids and amino
acids. After shaking and phase separation, 100 µl of the upper phase containing
silylated sugars and sugar alcohols (fraction III) were mixed with 50 µl of retention
time standard 1 and 1 µl was injected into the gas chromatograph.
In order to obtain fraction IV (amino acids, organic acids), 2 ml of the polar extract
were evaporated to dryness under vacuum (50°C). The residue was redissolved in
300 µl of a solution of hydroxylammoniumchloride in pyridine (2 mg/ml). After heating
for 30 min at 70°C in an oil bath, 100 µl of N-methyl-N-trimethylsilyl-trifuoroacetamide
were added while flushing the flask with argon. The sample was allowed to stand for
another 15 min at 70°C. The silylated sample was diluted with 500 µl of n-hexane
and 300 µl of deionized water were added. After vortexing, the upper phase
containing oximated and silylated sugars was discarded. Extraction with n-hexane
was repeated two times. The aqueous phase containing free organic acids and
amino acids was evaporated to dryness under vacuum (50°C). The residue was
redissolved in 200 µl of acetonitrile and 50 µl of N-methyl-N-trimethylsilyl-
trifuoroacetamide were added. The sample was allowed to stand for 60 min at 70°C
in an oil bath for silylation. It was then cooled to room temperature, mixed with 50 µl
retention time standard 2 and 1 µl was analyzed by gas chromatography.
Materials and methods 28
3.2.2 Gas chromatography Gas chromatography (GC) was performed on a Focus GC (Thermo, Austin, TX)
equipped with a flame ionization detector (FID).
GC conditions:
Injection volume: 1 µL
Column: DB1, J & W Scientific, Folsom, CA
60 m x 0.32 mm i.d. fused silica capillary coated with a
0.25 µm film of polydimethylsiloxane
Injector type: Split / Splitless
Split flow: 25 mL/min
Carrier gas: Hydrogen
Flow modus: 1.8 mL, constant flow
Injector temperature: 250 °C
Detector temperature: 320 °C
Temperature program: 100 °C to 320 °C at 4 °C/min, 25 min hold
GC-FID data were acquired using the commercially available software Chrom-Card
2.3 (Thermo Electron). The sampling rate was set to 600 data points/min. Automated
peak integration within the retention time range between 5 min and 50 min was
performed using a peak width of 5 sec and a peak threshold of 5. For integration of
peaks eluting at retention times higher than 50 min, peak threshold was set to 9 and
peak width was adjusted to 15 sec. Peaks exhibiting an area lower than 3000 µV*min
were not taken into account.
3.2.3 Gas chromatography – mass spectrometry Gas chromatography – mass spectrometry (GC-MS) analysis was performed on a
Finnigan TraceGC ultra coupled to a quadrupole mass selective detector Finnigan
Trace DSQ (Thermo, Austin, TX).
GC conditions:
Injection volume: 1 µL
Column: FactorFOUR VF-1ms, Varian
Materials and methods 29
60 m x 0.32 mm i.d. fused silica capillary coated with a
0.25 µm film of polydimethylsiloxane
Injector type: Split / Splitless
Split flow: 15 mL/min
Carrier gas: Helium
Flow modus: 1.0 mL, constant flow
Injector temperature: 280 °C
Detector temperature: 320 °C
Temperature program: 100 °C to 320 °C at 4 °C/min, 10 min hold
MS conditions:
Interface temperature: 320 °C
Ionization method: EI+, 70 eV
Source temperature: 250 °C
Scan range: 40 – 700 Da (full scan mode)
Scan interval: 0.4 s
GC-MS data were acquired using the commercially available software Xcalibur 1.4
SR1 (Thermo, Austin, TX).
3.2.4 Identification of metabolites Identification of mung bean constituents was achieved by comparison of retention
times and mass spectra with those of silylated and methylated reference compounds,
by comparison with mass spectral data and retention time indices of the GOLM
metabolome data base (Kopka et al., 2005) and by comparison of mass spectra with
entries of mass spectra library NIST02 and from literature (Xu and Godber 1999,
Kamal-Eldin et al. 1992).
3.2.5 Recovery rates
Materials and methods 30
Recoveries were determined by spiking the starting material (0h) and mung beans
germinated for 75h with known amounts of reference standards. The samples were
analyzed as described above. In addition, samples of the same mung bean flour
were analyzed without spiking. There are 3 sets of aliquot. The first aliquot of the
extract was spiked with the standard compounds at the beginning of the analytical
procedure. The second aliquot was spiked at the end of the work up prior to GC/MS
investigation. The third aliquot of the extract was analyzed to calculate peak heights
of the standard compounds naturally observed in the unspiked flour. Peak heights of
the first extract aliquot were compared to peak heights of the second sample, taking
the peak heights of extract aliquot three into account. Recoveries were calculated
according equation 1.
%100*32
31
PP
PP
HHHHW
−−
=
Equation 1: Calculation of recovery rates: W recovery rate, HP1 peak height in the
aliquot of the extract spiked in the beginning of the analytical procedure,
HP2 peak height in the aliquot of the extract spiked prior to GC/MS
investigation, HP3 peak height in the un-spiked aliquot of the extract.
3.2.6 Preparation of standard compounds for recovery rate Fraction I: 20 µL of n-hexane solution containing 9.5 mg/ml tripalmitin, 5.0 mg/ml
trimargarin, 5.0 mg/ml tristearin, 1.5 mg/ml triarachin and 0.85 mg/ml squalene was
added to the flour at the start of analysis. 20 µl of n-hexane solution containing 9.5
mg/mL methyl palmitate, 5.0 mg/ml methyl margarate, 5.0 mg/ml methyl stearate, 1.5
mg/ml methyl arachidonate and 0.85 mg/ml squalene was added to the sample prior
to GC/FID analysis.
Fraction II: 20 µL of dichloromethane solution containing 0.85 mg/ml palmitic acid,
0.85 mg/ml stearic acid, 0.90 mg/ml phytol, 1.5 mg/ml cholesterol, 1.0 mg/ml
stigmasterol and 0.85 mg/ml α-tocopherol was added to the mung bean flour and to
fraction II prior to silylation, respectively.
Fraction III: 20 mg sucrose and 100 µl of hexane solution containing 1.0 mg/ml
fructose, 1.0 mg/ml glucose, 1.0 mg/ml raffinose, 1.5 mg/ml stachyose, 1.0 mg/ml
Materials and methods 31
galactitol and 1.0 mg/ml myo-inositol (standard stock solution for fraction III) were
added to the flour at the start of analysis. At the end of analysis, 75 µL of a
pyridine/TMSIM (50+25, v+v) solution of 6 mg sucrose was added to 150 µl of upper
phase of fraction III.
Fraction IV: 50 µL of an aqueous solution containing 0.8 mg/ml glycine, 0.5 mg/ml
aspartic acid, 0.8 mg/ml glutamine, 0.1 mg/ml lactic acid, 0.8 mg/ml fumaric acid and
0.8 mg/ml malic acid was added to 2 ml of polar extract and to fraction IV prior to
silylation, respectively.
3.2.7 Repeatability Repeatability was determined by triplicate analysis of the mung bean samples.
Relative standard deviations (RSD) of peak heights normalized to the internal
standard of the respective fraction were calculated.
3.2.8 Statistical assessment
Mung bean samples were analyzed in triplicate. Repeatability was determined by
triplicate analysis of a mung bean sample. Relative standard deviations (RSD) of
peak heights were calculated using normalized peak heights to the internal standard
of the respective fraction. GC-FID data were acquired and integrated using Chrom-
Card 2.3 (Thermo Electron, Italy). Peak heights and retention times were exported to
Chrompare 1.1 (http://www.chrompare.com) (Frenzel et al., 2003) for standardization
for peak heights on the basis of internal standards added prior to the fractionation
process and for correction of peak retention time shifts on the basis of retention time
standards. Principal component analysis (PCA) was performed using XLSTAT 7.5.2
(Addinsoft, France).
Metabolite profiling of intact mung beans
32
4 RESULTS AND DISCUSSION
4.1 METABOLITE PROFILING OF INTACT MUNG BEANS
Metabolite profiling represents the analysis of selected compounds from the same
chemical compound classes or compounds linked by known metabolic relationships.
It aims at the detection, identification and quantification of a broad spectrum of
compounds in a single sample. The metabolite profiling procedure developed for the
analysis mung beans can be subdivided into the following principle steps:
- Sample preparation
- Extraction and fractionation of metabolites
- GC analysis of metabolites
- Data processing and statistical analysis.
Prior to extraction of the metabolites, it has to be made sure that all metabolic
processes in the mung beans are stopped. Freezing the material in liquid nitrogen
and subsequent freeze-drying was applied within the metabolite profiling sample
preparation. For the extraction of metabolites, pure organic solvents or mixtures of
solvents are added to the milled plant samples. Polar metabolites are usually
extracted with methanol, ethanol and water, whereas chloroform, chloroform /
methanol mixtures or dichloromethane are used for the extraction of lipophilic
compounds from the biological matrix. The extraction and fractionation scheme
applied for the metabolite profiling of mung beans and mung bean sprouts is shown
in Figure 6. Originally, it was developed for the metabolite profiling of rice (Frenzel et
al., 2002) and has since been adopted for unbiased analyses of maize (Röhlig et al.,
2009), barley (Frank et al., 2011) and soybean (Frank et al., 2009). The approach,
based on consecutive extraction of lipids and polar compounds, is comparable to
other profiling strategies with respect to the extraction of metabolites with solvents
differing in polarity. However, additional transesterification-solid phase extraction
(lipids) and selective hydrolysis of silylated derivatives (polar compounds) were
applied to separate major from minor constituents. This procedure results in four
fractions containing fatty acid methyl esters and hydrocarbons (fraction I), free fatty
acids, alcohols and sterols (fraction II), sugars and sugar alcohols (fraction III), acids,
amino acids and amines (fraction IV).
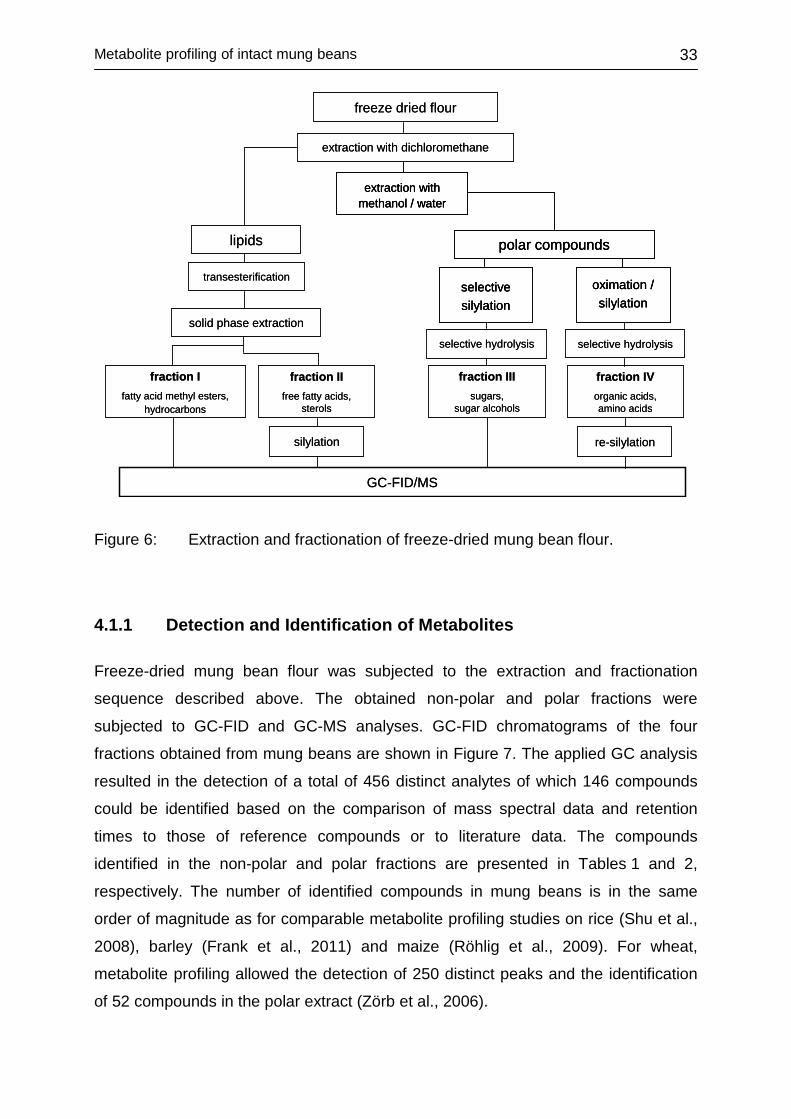
Metabolite profiling of intact mung beans
33
freeze dried flour
polar compounds
extraction withmethanol / water
lipids
extraction with dichloromethane
GC-FID/MS
transesterification
solid phase extraction
silylation
fraction IIfree fatty acids,
sterols
fraction Ifatty acid methyl esters,
hydrocarbons
selectivesilylation
oximation /silylation
selective hydrolysis selective hydrolysis
re-silylation
fraction IIIsugars,
sugar alcohols
fraction IVorganic acids, amino acids
freeze dried flour
polar compounds
extraction withmethanol / water
polar compounds
extraction withmethanol / water
lipids
extraction with dichloromethane
GC-FID/MS
transesterification
solid phase extraction
silylation
fraction IIfree fatty acids,
sterols
fraction Ifatty acid methyl esters,
hydrocarbons
selectivesilylation
oximation /silylation
selectivesilylation
oximation /silylation
selective hydrolysis selective hydrolysis
re-silylation
fraction IIIsugars,
sugar alcohols
fraction IVorganic acids, amino acids
Figure 6: Extraction and fractionation of freeze-dried mung bean flour.
4.1.1 Detection and Identification of Metabolites
Freeze-dried mung bean flour was subjected to the extraction and fractionation
sequence described above. The obtained non-polar and polar fractions were
subjected to GC-FID and GC-MS analyses. GC-FID chromatograms of the four
fractions obtained from mung beans are shown in Figure 7. The applied GC analysis
resulted in the detection of a total of 456 distinct analytes of which 146 compounds
could be identified based on the comparison of mass spectral data and retention
times to those of reference compounds or to literature data. The compounds
identified in the non-polar and polar fractions are presented in Tables 1 and 2,
respectively. The number of identified compounds in mung beans is in the same
order of magnitude as for comparable metabolite profiling studies on rice (Shu et al.,
2008), barley (Frank et al., 2011) and maize (Röhlig et al., 2009). For wheat,
metabolite profiling allowed the detection of 250 distinct peaks and the identification
of 52 compounds in the polar extract (Zörb et al., 2006).
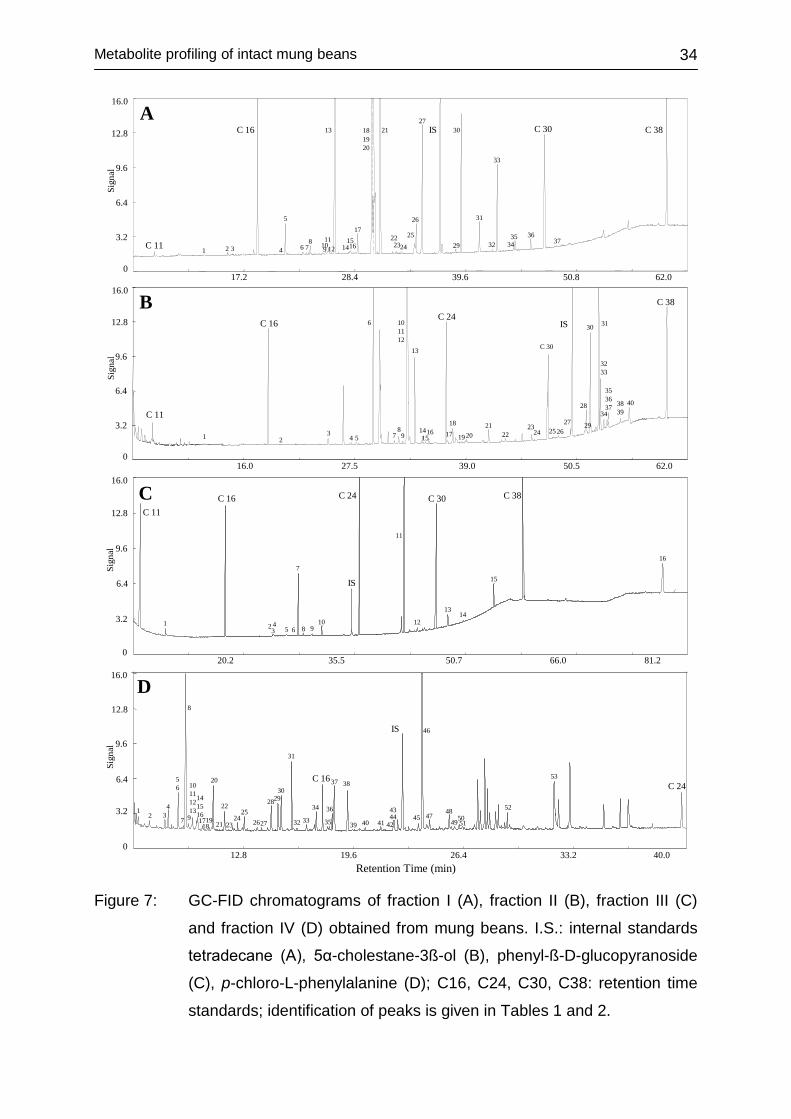
Metabolite profiling of intact mung beans
34
34
17.2 28.4 39.6 50.8 62.00
3.2
6.4
9.6
12.8
16.0
A
C 111 2 3
C 16
5
6 78 11
13
141516
17
18 19 20
21
222324
25
26
27IS
29
30
31
32
33
35 36
C 30
37
C 38
Sign
al
4 91012
3.2
6.4
9.6
12.8
16.0B
C 11
C 16C 24
C 30
C 38
1 23
4 5
6
78
9
10 11 12
13
1418 21 23
2427
IS
28
30 31
32 33
34
35 36 37 38
3940
016.0 27.5 39.0 50.5 62.0
Sign
al
1516 17 19 20 22 25 26
29
Sign
al
0
3.2
6.4
9.6
12.8
16.0
20.2 35.5 50.7 66.0 81.2
C 11
1
C 16
234
5
7
98
IS
C 24
11
12
C 30
15
C 38C
16
610
0
3.2
6.4
9.6
12.8
16.0
12.8 19.6 26.4 33.2 40.0
12 3
4
5 6
7
8
10 11 12 13
14 15 1617
20
22
2324
252627
282930
31
32 33
34
C 16
35
36
37 38
39 40 41 42
43 44
IS
45
46
4748
495051
52
53C 24
1918
D
921
Sign
al
Retention Time (min)
1314
Figure 7: GC-FID chromatograms of fraction I (A), fraction II (B), fraction III (C)
and fraction IV (D) obtained from mung beans. I.S.: internal standards
tetradecane (A), 5α-cholestane-3ß-ol (B), phenyl-ß-D-glucopyranoside
(C), p-chloro-L-phenylalanine (D); C16, C24, C30, C38: retention time
standards; identification of peaks is given in Tables 1 and 2.
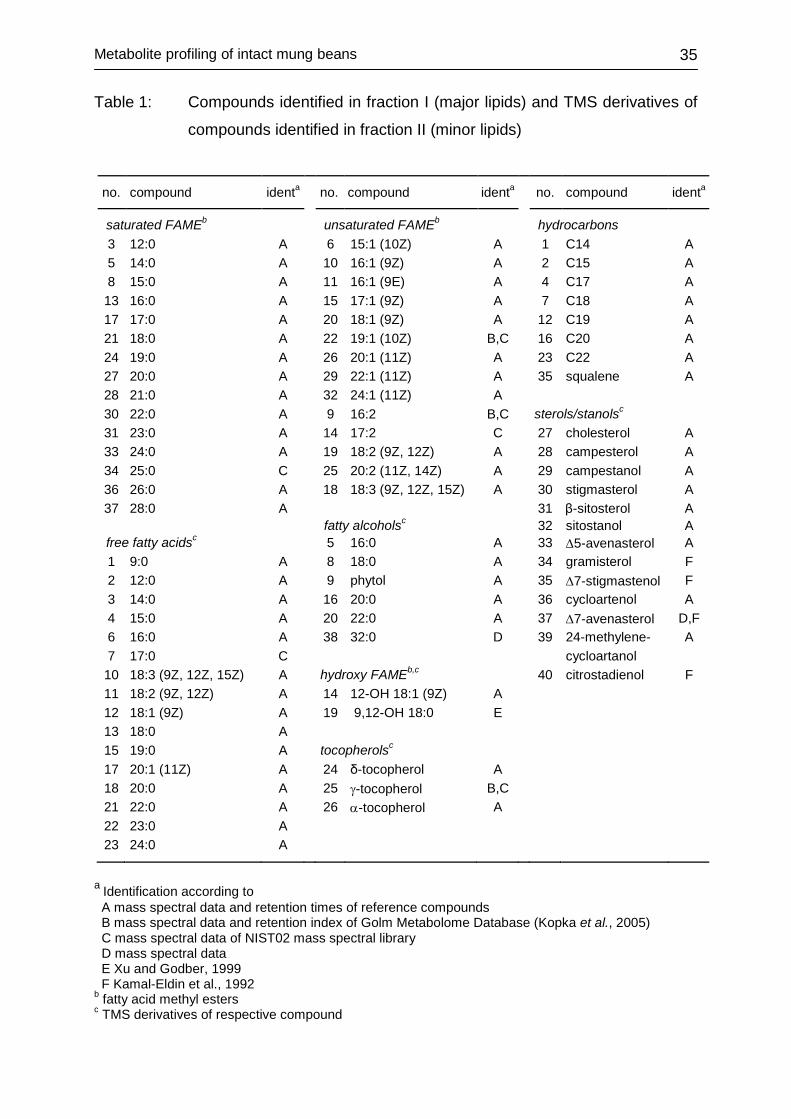
Metabolite profiling of intact mung beans
35
Table 1: Compounds identified in fraction I (major lipids) and TMS derivatives of
compounds identified in fraction II (minor lipids)
no. compound identa no. compound identa no. compound identa
saturated FAMEb unsaturated FAMEb hydrocarbons 3 12:0 A 6 15:1 (10Z) A 1 C14 A 5 14:0 A 10 16:1 (9Z) A 2 C15 A 8 15:0 A 11 16:1 (9E) A 4 C17 A 13 16:0 A 15 17:1 (9Z) A 7 C18 A 17 17:0 A 20 18:1 (9Z) A 12 C19 A 21 18:0 A 22 19:1 (10Z) B,C 16 C20 A 24 19:0 A 26 20:1 (11Z) A 23 C22 A 27 20:0 A 29 22:1 (11Z) A 35 squalene A 28 21:0 A 32 24:1 (11Z) A 30 22:0 A 9 16:2 B,C sterols/stanolsc 31 23:0 A 14 17:2 C 27 cholesterol A 33 24:0 A 19 18:2 (9Z, 12Z) A 28 campesterol A 34 25:0 C 25 20:2 (11Z, 14Z) A 29 campestanol A 36 26:0 A 18 18:3 (9Z, 12Z, 15Z) A 30 stigmasterol A 37 28:0 A 31 β-sitosterol A fatty alcoholsc 32 sitostanol A free fatty acidsc 5 16:0 A 33 ∆5-avenasterol A 1 9:0 A 8 18:0 A 34 gramisterol F 2 12:0 A 9 phytol A 35 ∆7-stigmastenol F 3 14:0 A 16 20:0 A 36 cycloartenol A 4 15:0 A 20 22:0 A 37 ∆7-avenasterol D,F 6 16:0 A 38 32:0 D 39 24-methylene- A 7 17:0 C cycloartanol 10 18:3 (9Z, 12Z, 15Z) A hydroxy FAMEb,c 40 citrostadienol F 11 18:2 (9Z, 12Z) A 14 12-OH 18:1 (9Z) A 12 18:1 (9Z) A 19 9,12-OH 18:0 E 13 18:0 A 15 19:0 A tocopherolsc 17 20:1 (11Z) A 24 δ-tocopherol A 18 20:0 A 25 γ-tocopherol B,C 21 22:0 A 26 α-tocopherol A 22 23:0 A 23 24:0 A
a Identification according to A mass spectral data and retention times of reference compounds B mass spectral data and retention index of Golm Metabolome Database (Kopka et al., 2005) C mass spectral data of NIST02 mass spectral library D mass spectral data E Xu and Godber, 1999 F Kamal-Eldin et al., 1992 b fatty acid methyl esters c TMS derivatives of respective compound
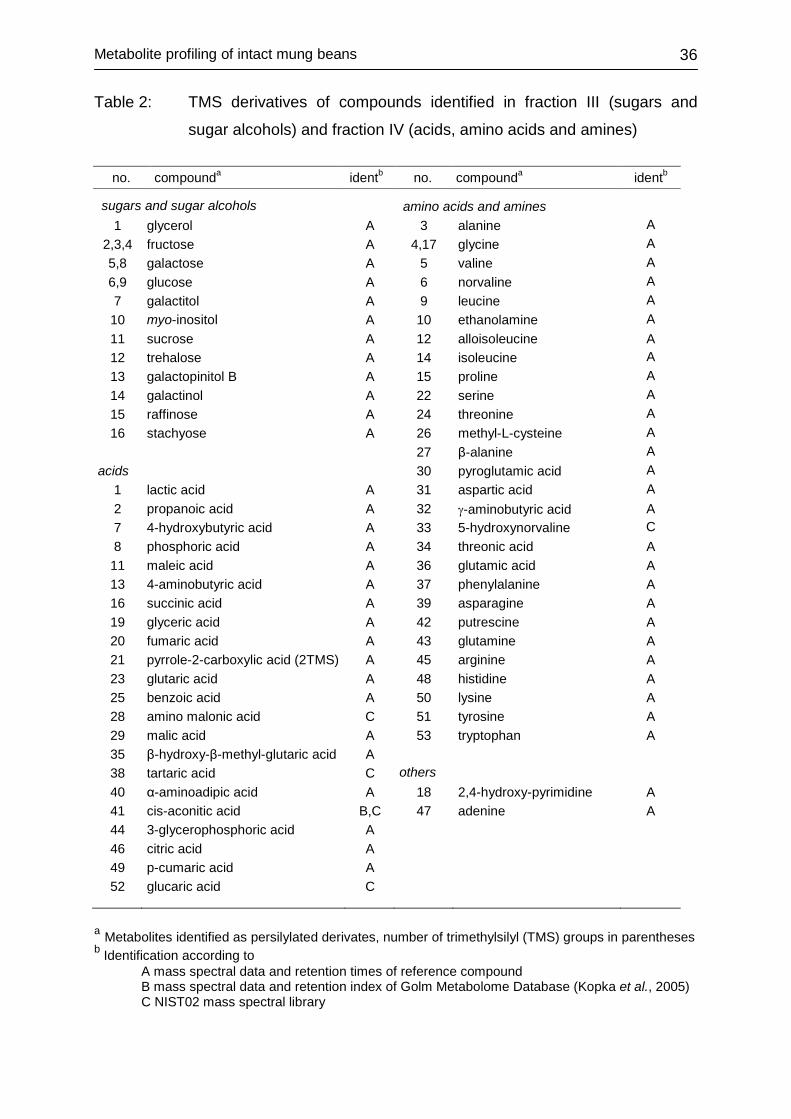
Metabolite profiling of intact mung beans
36
Table 2: TMS derivatives of compounds identified in fraction III (sugars and
sugar alcohols) and fraction IV (acids, amino acids and amines)
no. compounda identb no. compounda identb
sugars and sugar alcohols
amino acids and amines 1 glycerol A 3 alanine A
2,3,4 fructose A 4,17 glycine A 5,8 galactose A 5 valine A 6,9 glucose A 6 norvaline A 7 galactitol A 9 leucine A 10 myo-inositol A 10 ethanolamine A 11 sucrose A 12 alloisoleucine A 12 trehalose A 14 isoleucine A 13 galactopinitol B A 15 proline A 14 galactinol A 22 serine A 15 raffinose A 24 threonine A 16 stachyose A 26 methyl-L-cysteine A
27 β-alanine A acids 30 pyroglutamic acid A
1 lactic acid A 31 aspartic acid A 2 propanoic acid A 32 γ-aminobutyric acid A 7 4-hydroxybutyric acid A 33 5-hydroxynorvaline C 8 phosphoric acid A 34 threonic acid A 11 maleic acid A 36 glutamic acid A 13 4-aminobutyric acid A 37 phenylalanine A 16 succinic acid A 39 asparagine A 19 glyceric acid A 42 putrescine A 20 fumaric acid A 43 glutamine A 21 pyrrole-2-carboxylic acid (2TMS) A 45 arginine A 23 glutaric acid A 48 histidine A 25 benzoic acid A 50 lysine A 28 amino malonic acid C 51 tyrosine A 29 malic acid A 53 tryptophan A 35 β-hydroxy-β-methyl-glutaric acid A 38 tartaric acid C others
40 α-aminoadipic acid A 18 2,4-hydroxy-pyrimidine A 41 cis-aconitic acid B,C 47 adenine A 44 3-glycerophosphoric acid A 46 citric acid A 49 p-cumaric acid A 52 glucaric acid C
a Metabolites identified as persilylated derivates, number of trimethylsilyl (TMS) groups in parentheses b Identification according to
A mass spectral data and retention times of reference compound B mass spectral data and retention index of Golm Metabolome Database (Kopka et al., 2005) C NIST02 mass spectral library
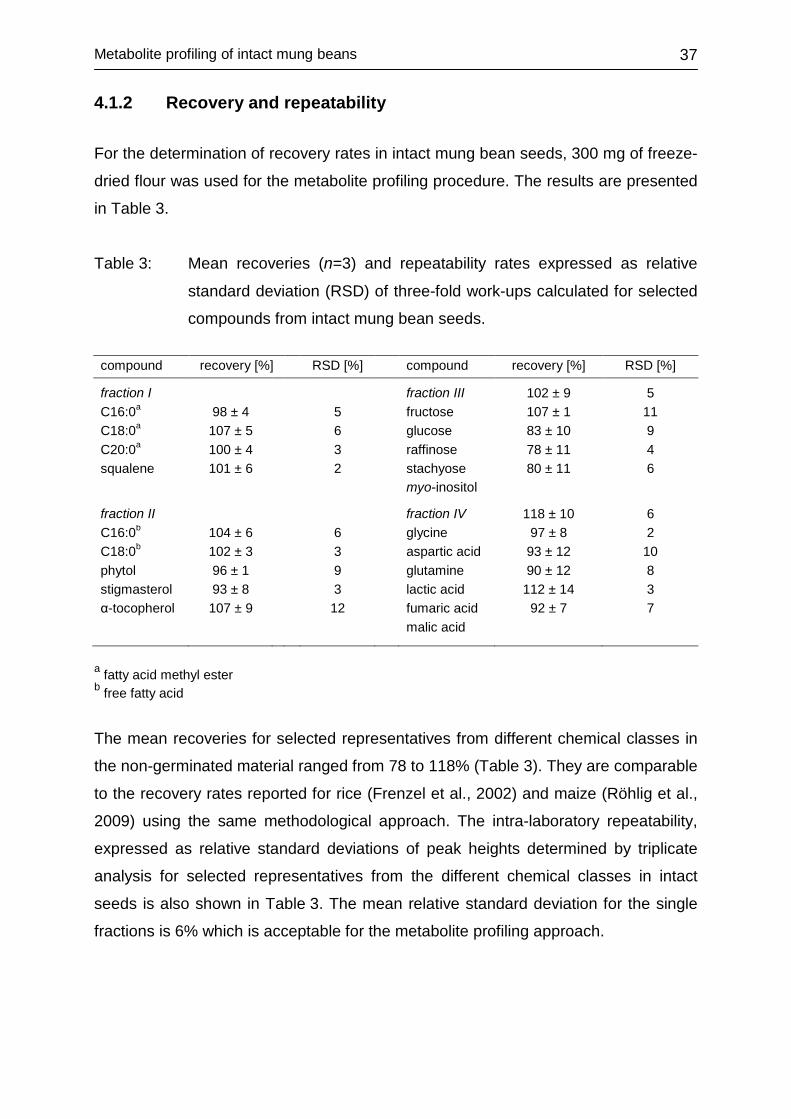
Metabolite profiling of intact mung beans
37
4.1.2 Recovery and repeatability
For the determination of recovery rates in intact mung bean seeds, 300 mg of freeze-
dried flour was used for the metabolite profiling procedure. The results are presented
in Table 3.
Table 3: Mean recoveries (n=3) and repeatability rates expressed as relative
standard deviation (RSD) of three-fold work-ups calculated for selected
compounds from intact mung bean seeds.
compound recovery [%] RSD [%] compound recovery [%] RSD [%] fraction I fraction III 102 ± 9 5 C16:0a 98 ± 4 5 fructose 107 ± 1 11 C18:0a 107 ± 5 6 glucose 83 ± 10 9 C20:0a 100 ± 4 3 raffinose 78 ± 11 4 squalene 101 ± 6 2 stachyose 80 ± 11 6 myo-inositol fraction II fraction IV 118 ± 10 6 C16:0b 104 ± 6 6 glycine 97 ± 8 2 C18:0b 102 ± 3 3 aspartic acid 93 ± 12 10 phytol 96 ± 1 9 glutamine 90 ± 12 8 stigmasterol 93 ± 8 3 lactic acid 112 ± 14 3 α-tocopherol 107 ± 9 12 fumaric acid 92 ± 7 7 malic acid
a fatty acid methyl ester b free fatty acid
The mean recoveries for selected representatives from different chemical classes in
the non-germinated material ranged from 78 to 118% (Table 3). They are comparable
to the recovery rates reported for rice (Frenzel et al., 2002) and maize (Röhlig et al.,
2009) using the same methodological approach. The intra-laboratory repeatability,
expressed as relative standard deviations of peak heights determined by triplicate
analysis for selected representatives from the different chemical classes in intact
seeds is also shown in Table 3. The mean relative standard deviation for the single
fractions is 6% which is acceptable for the metabolite profiling approach.
Metabolite profiling of sprouting mung beans
38
4.2 METABOLITE PROFILING OF SPROUTING MUNG BEANS
4.2.1 Introduction
During the past years, metabolomics has evolved into an important analytical
approach for the assessment of genotypic and phenotypic diversity in plants (Davies,
2007; Saito and Matsuda, 2010). It aims at the simultaneous detection, identification
and quantification of a broad spectrum of compounds from different chemical classes
to provide a comprehensive picture of the metabolic profiles in complex biological
systems. Various techniques including GC/MS, LC/MS and NMR have been
employed for metabolomics-based investigations of foods (Cevallos-Cevallos et al.,
2009). Among the different metabolomics approaches, GC-based metabolite profiling
represents a relatively inexpensive, robust and mature technology (Wishart, 2008). In
the field of plant metabolomics, the influence of different breeding systems (Frank et
al., 2009), farming practices (Röhlig and Engel, 2010) and environmental factors
(Röhlig et al., 2009) on crop metabolic profiles was investigated by comparative GC-
based metabolite profiling demonstrating its potential to provide valuable information
regarding crop composition and metabolic interactions. Understanding these
metabolic interactions is a major goal in systems biology (Saito and Matsuda, 2010)
and is suggested to assist in the elucidation of plant functional genomics (Fiehn et
al., 2000b). Metabolite profiling is also considered to provide valuable data for
breeding-driven metabolic engineering of nutritionally important metabolites in crops
(Hall et al., 2008) and thus as a tool to improve their agronomic and nutritional
characteristics (Dixon et al., 2006; Harrigan, et al., 2007).
In addition to the analysis of physiologically mature crops, metabolite profiling of plant
developmental systems has gained increasing attention. Metabolite profiling has
been employed to follow naturally occurring germination processes in rice (Shu et al.,
2008) and in potatoes (Shepherd et al., 2010). In addition, malting of barley, as an
example of processing-related germination has been followed via metabolite profiling
(Frank et al., 2011).
To date, only few GC-based metabolite profiling studies on legumes have been
carried out (Thompson et al., 2009). For example, studies on Lotus japonicus
(Desbrosses et al., 2005) and soybeans (Frank et al., 2009) have been conducted. A
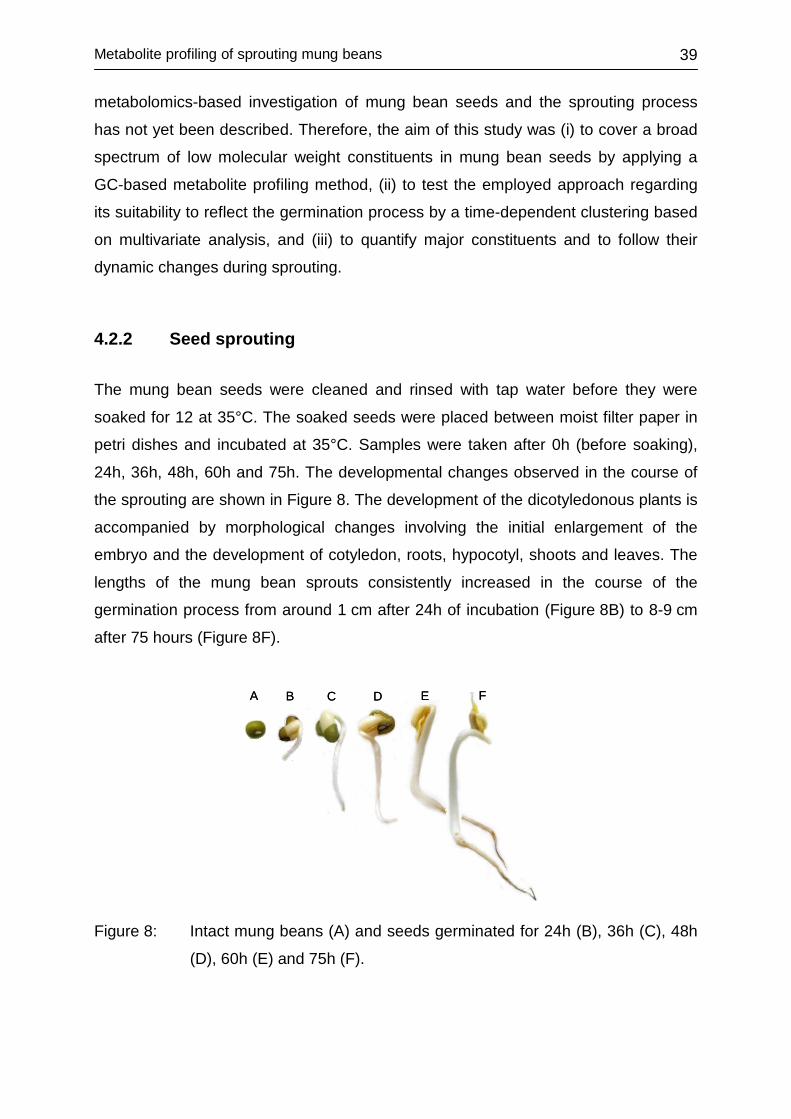
Metabolite profiling of sprouting mung beans
39
metabolomics-based investigation of mung bean seeds and the sprouting process
has not yet been described. Therefore, the aim of this study was (i) to cover a broad
spectrum of low molecular weight constituents in mung bean seeds by applying a
GC-based metabolite profiling method, (ii) to test the employed approach regarding
its suitability to reflect the germination process by a time-dependent clustering based
on multivariate analysis, and (iii) to quantify major constituents and to follow their
dynamic changes during sprouting.
4.2.2 Seed sprouting
The mung bean seeds were cleaned and rinsed with tap water before they were
soaked for 12 at 35°C. The soaked seeds were placed between moist filter paper in
petri dishes and incubated at 35°C. Samples were taken after 0h (before soaking),
24h, 36h, 48h, 60h and 75h. The developmental changes observed in the course of
the sprouting are shown in Figure 8. The development of the dicotyledonous plants is
accompanied by morphological changes involving the initial enlargement of the
embryo and the development of cotyledon, roots, hypocotyl, shoots and leaves. The
lengths of the mung bean sprouts consistently increased in the course of the
germination process from around 1 cm after 24h of incubation (Figure 8B) to 8-9 cm
after 75 hours (Figure 8F).
A B C D E FA B C D E F
Figure 8: Intact mung beans (A) and seeds germinated for 24h (B), 36h (C), 48h
(D), 60h (E) and 75h (F).
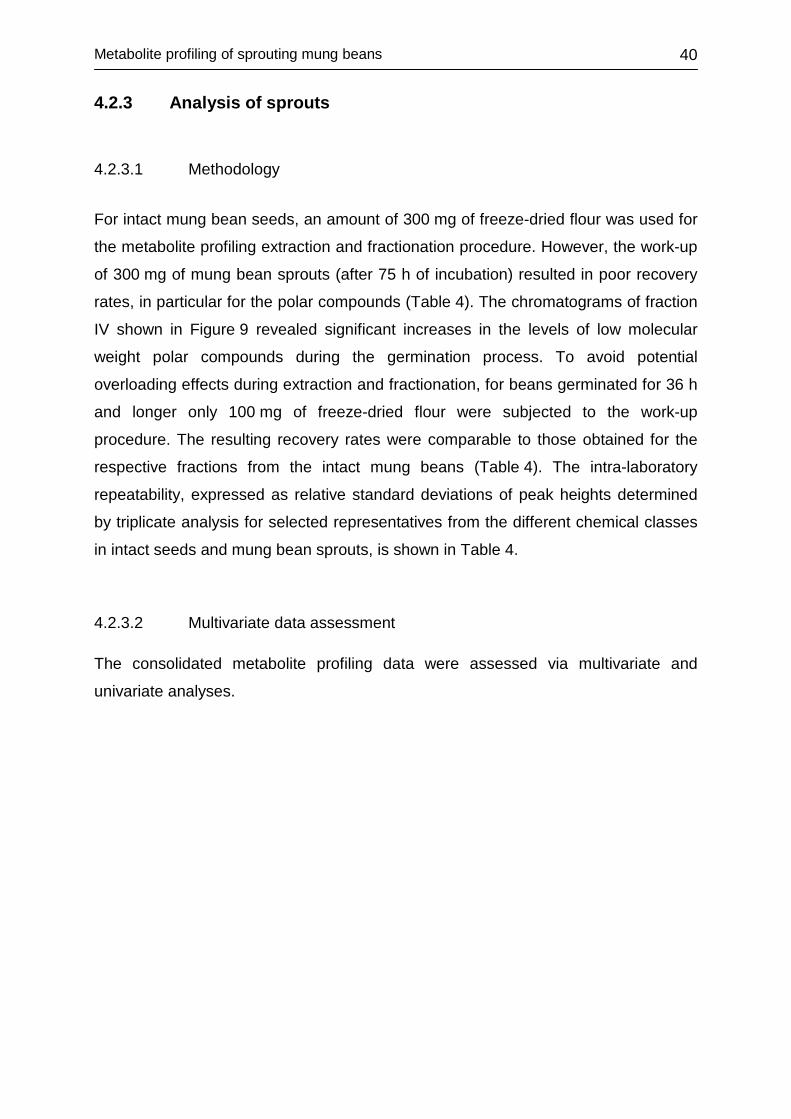
Metabolite profiling of sprouting mung beans
40
4.2.3 Analysis of sprouts
4.2.3.1 Methodology
For intact mung bean seeds, an amount of 300 mg of freeze-dried flour was used for
the metabolite profiling extraction and fractionation procedure. However, the work-up
of 300 mg of mung bean sprouts (after 75 h of incubation) resulted in poor recovery
rates, in particular for the polar compounds (Table 4). The chromatograms of fraction
IV shown in Figure 9 revealed significant increases in the levels of low molecular
weight polar compounds during the germination process. To avoid potential
overloading effects during extraction and fractionation, for beans germinated for 36 h
and longer only 100 mg of freeze-dried flour were subjected to the work-up
procedure. The resulting recovery rates were comparable to those obtained for the
respective fractions from the intact mung beans (Table 4). The intra-laboratory
repeatability, expressed as relative standard deviations of peak heights determined
by triplicate analysis for selected representatives from the different chemical classes
in intact seeds and mung bean sprouts, is shown in Table 4.
4.2.3.2 Multivariate data assessment
The consolidated metabolite profiling data were assessed via multivariate and
univariate analyses.
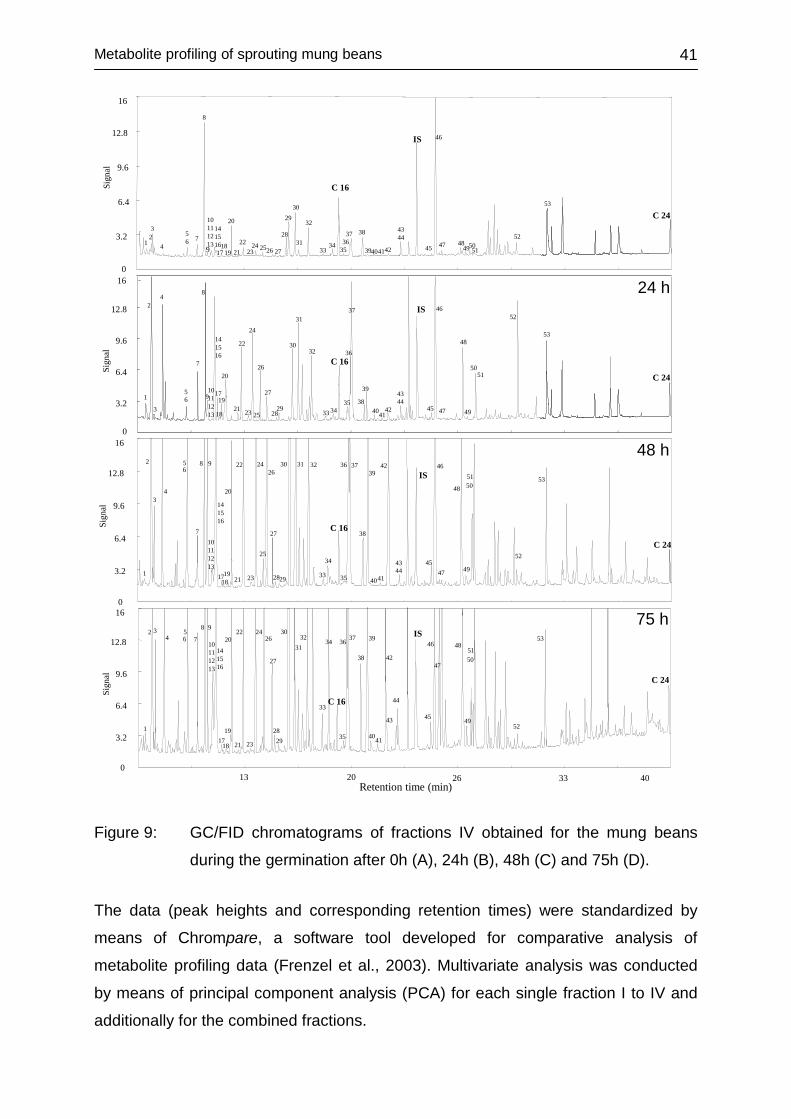
Metabolite profiling of sprouting mung beans
41
0
25
10 11
52
53
C 24
3.2
6.4
9.6
12.8
16
Sign
al
6
7
8
9 1719
20
24
26
27
37 IS 46
47
48
49
51
1
2
3
5
31
28
36
39
50
22 3032
3335 38
404142
43 44
45
4
C 16
0
12 13
14 15 16
1821 23 29 34
24 h
41 4526314
3
1
Sign
al
3.2
6.4
9.6
12.8
16
2 5 6 7
8
9
20
22 24
2930
37 38 43 44
IS 46
47 4849 51
C 16
50
10 11 12 13
14 15 1617 19
1821 23 25 27
28
32
3334 36
35 3940 42
52
53
C 24
0
3.2
6.4
9.6
12.8
16 48 h
1
2
34
56
7
8 9
1719
20
22 24
25
30 31
28 33
34
38
39
41
42
43 44
IS
45
46
47
48
49
51
52
5350
C 16Sign
al
10 11 12 13
14 15 16
18 21 23
32 36 37
40
C 24
26
27
29 35
0
3.2
6.4
9.6
12.8
16
13 20 26 33 40
Sign
al
Retention time (min)
75 h
1
2 34
56 7
8 9
1719
2022 24 30
28
33
34 39
38 42
43
44
IS
45
46
47
48
49
51
52
53
50
C 16
10 11 12 13
14 15 16
18 21 23
26
27
29
3231
35
36 37
4140
C 24
Figure 9: GC/FID chromatograms of fractions IV obtained for the mung beans
during the germination after 0h (A), 24h (B), 48h (C) and 75h (D).
The data (peak heights and corresponding retention times) were standardized by
means of Chrompare, a software tool developed for comparative analysis of
metabolite profiling data (Frenzel et al., 2003). Multivariate analysis was conducted
by means of principal component analysis (PCA) for each single fraction I to IV and
additionally for the combined fractions.
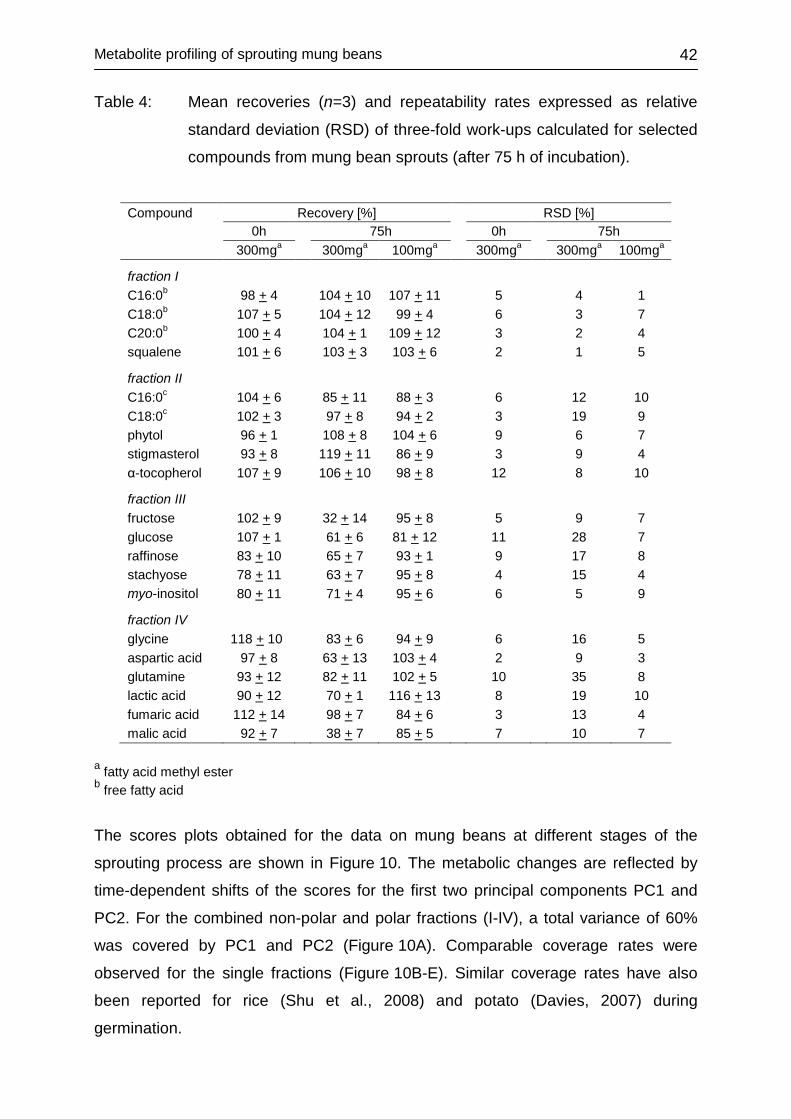
Metabolite profiling of sprouting mung beans
42
Table 4: Mean recoveries (n=3) and repeatability rates expressed as relative
standard deviation (RSD) of three-fold work-ups calculated for selected
compounds from mung bean sprouts (after 75 h of incubation).
Compound Recovery [%] RSD [%] 0h 75h 0h 75h 300mga 300mga 100mga 300mga 300mga 100mga
fraction I C16:0b 98 + 4 104 + 10 107 + 11 5 4 1 C18:0b 107 + 5 104 + 12 99 + 4 6 3 7 C20:0b 100 + 4 104 + 1 109 + 12 3 2 4 squalene 101 + 6 103 + 3 103 + 6 2 1 5 fraction II C16:0c 104 + 6 85 + 11 88 + 3 6 12 10 C18:0c 102 + 3 97 + 8 94 + 2 3 19 9 phytol 96 + 1 108 + 8 104 + 6 9 6 7 stigmasterol 93 + 8 119 + 11 86 + 9 3 9 4 α-tocopherol 107 + 9 106 + 10 98 + 8 12 8 10 fraction III fructose 102 + 9 32 + 14 95 + 8 5 9 7 glucose 107 + 1 61 + 6 81 + 12 11 28 7 raffinose 83 + 10 65 + 7 93 + 1 9 17 8 stachyose 78 + 11 63 + 7 95 + 8 4 15 4 myo-inositol 80 + 11 71 + 4 95 + 6 6 5 9 fraction IV glycine 118 + 10 83 + 6 94 + 9 6 16 5 aspartic acid 97 + 8 63 + 13 103 + 4 2 9 3 glutamine 93 + 12 82 + 11 102 + 5 10 35 8 lactic acid 90 + 12 70 + 1 116 + 13 8 19 10 fumaric acid 112 + 14 98 + 7 84 + 6 3 13 4 malic acid 92 + 7 38 + 7 85 + 5 7 10 7
a fatty acid methyl ester b free fatty acid
The scores plots obtained for the data on mung beans at different stages of the
sprouting process are shown in Figure 10. The metabolic changes are reflected by
time-dependent shifts of the scores for the first two principal components PC1 and
PC2. For the combined non-polar and polar fractions (I-IV), a total variance of 60%
was covered by PC1 and PC2 (Figure 10A). Comparable coverage rates were
observed for the single fractions (Figure 10B-E). Similar coverage rates have also
been reported for rice (Shu et al., 2008) and potato (Davies, 2007) during
germination.
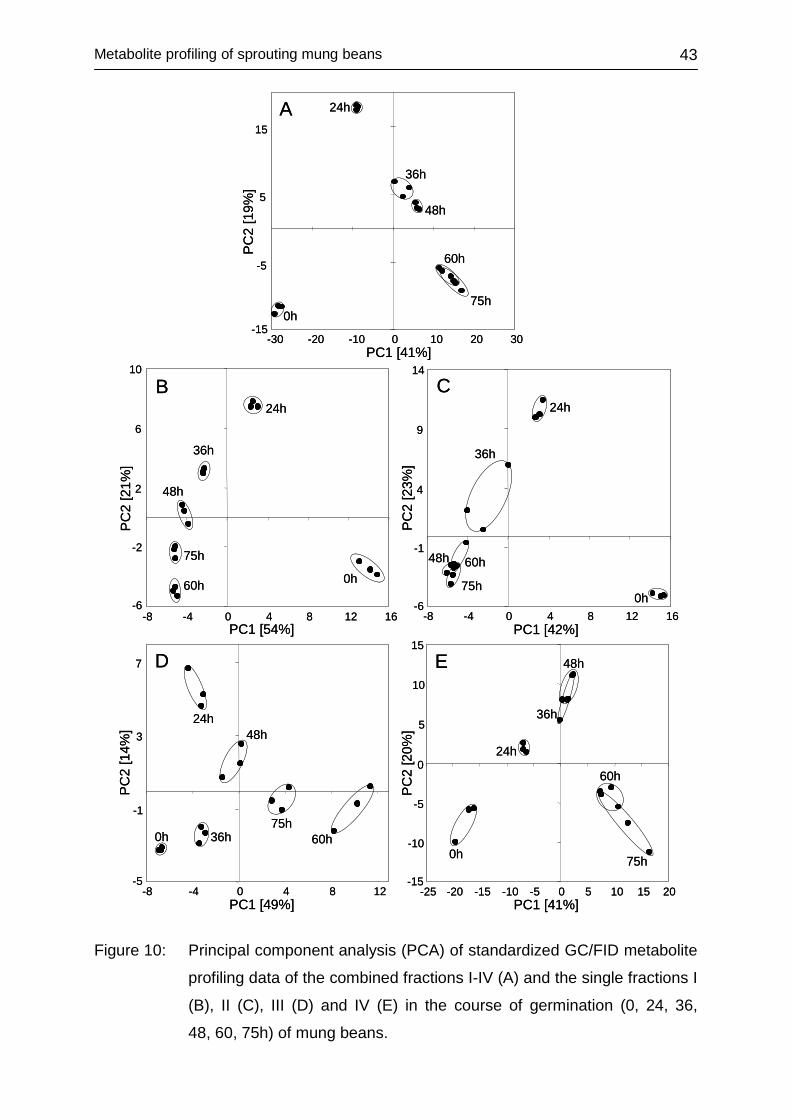
Metabolite profiling of sprouting mung beans
43
-6
-2
2
6
10
-8 -4 0 4 8 12 16
0h
PC1 [54%]
PC
2 [2
1%]
24h
36h
48h
60h
75h
B
-6
-1
4
9
14
-8 -4 0 4 8 12 16PC1 [42%]
PC
2 [2
3%]
C
0h
24h
36h
60h
75h
48h
-5
-1
3
7
-8 -4 0 4 8 12
PC
2 [1
4%]
PC1 [49%]
0h
24h48h
36h75h
60h
-15
-10
-5
0
5
10
15
-25 -20 -15 -10 -5 0 5 10 15 20PC1 [41%]
PC
2 [2
0%]
D E
0h
24h
36h
48h
60h
75h
-15
-5
5
15
-30 -20 -10 0 10 20 30
PC
2 [1
9%]
PC1 [41%]
0h
24h
36h
48h
60h
75h
A
-6
-2
2
6
10
-8 -4 0 4 8 12 16
0h
PC1 [54%]
PC
2 [2
1%]
24h
36h
48h
60h
75h
B
-6
-1
4
9
14
-8 -4 0 4 8 12 16PC1 [42%]
PC
2 [2
3%]
C
0h
24h
36h
60h
75h
48h
-5
-1
3
7
-8 -4 0 4 8 12
PC
2 [1
4%]
PC1 [49%]
0h
24h48h
36h75h
60h
-15
-10
-5
0
5
10
15
-25 -20 -15 -10 -5 0 5 10 15 20PC1 [41%]
PC
2 [2
0%]
D E
0h
24h
36h
48h
60h
75h
-15
-5
5
15
-30 -20 -10 0 10 20 30
PC
2 [1
9%]
PC1 [41%]
0h
24h
36h
48h
60h
75h
A
Figure 10: Principal component analysis (PCA) of standardized GC/FID metabolite
profiling data of the combined fractions I-IV (A) and the single fractions I
(B), II (C), III (D) and IV (E) in the course of germination (0, 24, 36,
48, 60, 75h) of mung beans.
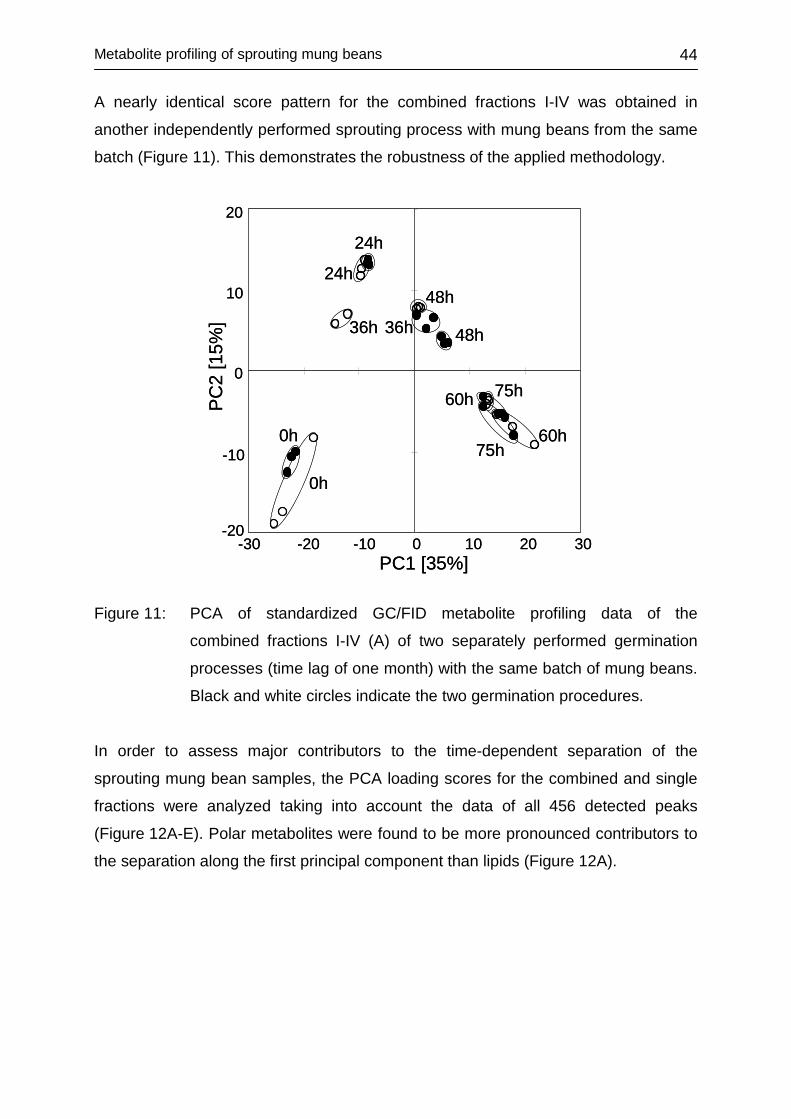
Metabolite profiling of sprouting mung beans
44
A nearly identical score pattern for the combined fractions I-IV was obtained in
another independently performed sprouting process with mung beans from the same
batch (Figure 11). This demonstrates the robustness of the applied methodology.
-20
-10
0
10
20
-30 -20 -10 0 10 20 30
24h
0h
36h 36h
48h
48h
60h
60h
75h
75h
PC1 [35%]
PC
2 [1
5%]
0h
24h
-20
-10
0
10
20
-30 -20 -10 0 10 20 30
24h
0h
36h 36h
48h
48h
60h
60h
75h
75h
PC1 [35%]
PC
2 [1
5%]
0h
24h
Figure 11: PCA of standardized GC/FID metabolite profiling data of the
combined fractions I-IV (A) of two separately performed germination
processes (time lag of one month) with the same batch of mung beans.
Black and white circles indicate the two germination procedures.
In order to assess major contributors to the time-dependent separation of the
sprouting mung bean samples, the PCA loading scores for the combined and single
fractions were analyzed taking into account the data of all 456 detected peaks
(Figure 12A-E). Polar metabolites were found to be more pronounced contributors to
the separation along the first principal component than lipids (Figure 12A).
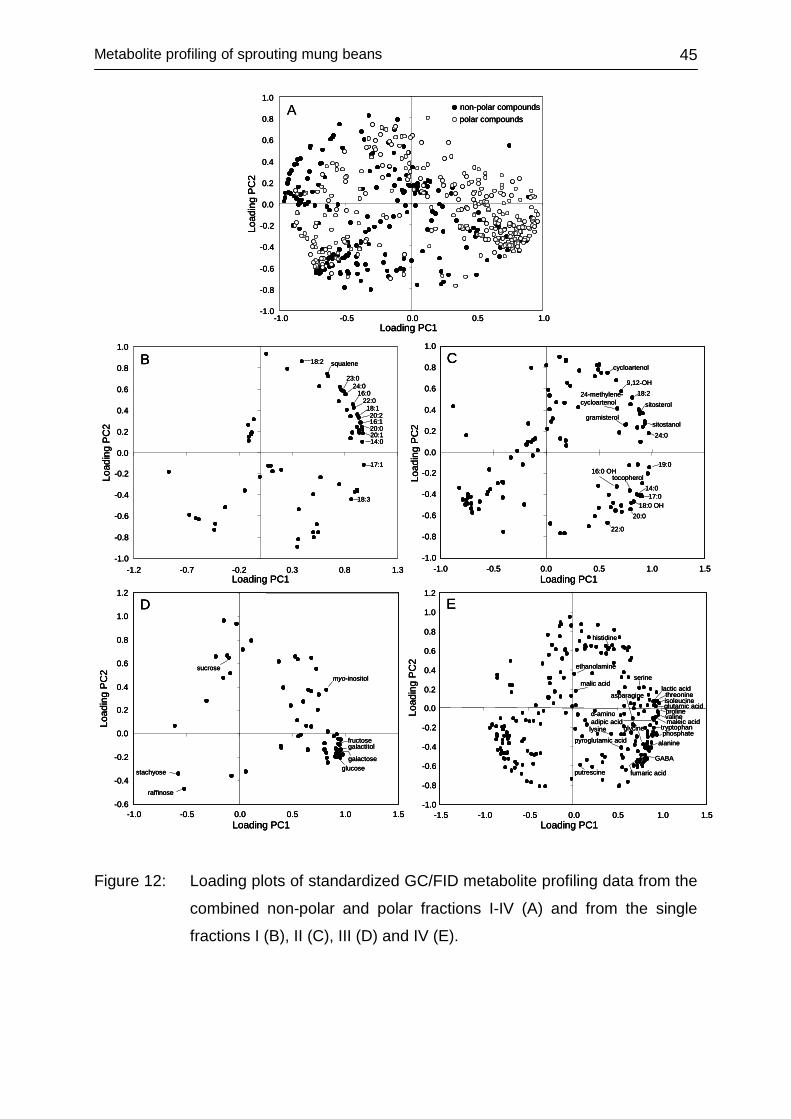
Metabolite profiling of sprouting mung beans
45
-1.0
-0.8
-0.6
-0.4
-0.2
0.0
0.2
0.4
0.6
0.8
1.0
-1.0 -0.5 0.0 0.5 1.0
non-polar compoundspolar compounds
Loading PC1
Load
ing
PC
2
-1.0
-0.8
-0.6
-0.4
-0.2
0.0
0.2
0.4
0.6
0.8
1.0
-1.2 -0.7 -0.2 0.3 0.8 1.3
B 18:2 squalene
23:024:0
16:022:018:120:216:120:020:114:0
17:1
18:3
Loading PC1
Load
ing
PC
2
-1.0
-0.8
-0.6
-0.4
-0.2
0.0
0.2
0.4
0.6
0.8
1.0
-1.0 -0.5 0.0 0.5 1.0 1.5
Ccycloartenol
9,12-OH18:2
sitosterol
sitostanol24:0
19:0
14:0tocopherol
17:018:0 OH
20:0
22:0
gramisterol
24-methylene-cycloartenol
16:0 OH
Loading PC1
Load
ing
PC
2
fructosegalactitol
-0.6
-0.4
-0.2
0.0
0.2
0.4
0.6
0.8
1.0
1.2
-1.0 -0.5 0.0 0.5 1.0 1.5
D
myo-inositol
galactoseglucose
raffinose
stachyose
sucrose
Load
ing
PC
2
Loading PC1
-1.0
-0.8
-0.6
-0.4
-0.2
0.0
0.2
0.4
0.6
0.8
1.0
1.2
-1.5 -1.0 -0.5 0.0 0.5 1.0 1.5
E
histidine
serinelactic acid
threonineisoleucineglutamic acidprolinevalinemaleic acid
α-aminoadipic acid
tryptophanphosphate
alanine
GABA
fumaric acidputrescine
glycine
pyroglutamic acid
lysine
malic acid
asparagine
ethanolamine
Load
ing
PC
2
Loading PC1
A
-1.0
-0.8
-0.6
-0.4
-0.2
0.0
0.2
0.4
0.6
0.8
1.0
-1.0 -0.5 0.0 0.5 1.0
non-polar compoundspolar compounds
Loading PC1
Load
ing
PC
2
-1.0
-0.8
-0.6
-0.4
-0.2
0.0
0.2
0.4
0.6
0.8
1.0
-1.0 -0.5 0.0 0.5 1.0
non-polar compoundspolar compounds
Loading PC1
Load
ing
PC
2
-1.0
-0.8
-0.6
-0.4
-0.2
0.0
0.2
0.4
0.6
0.8
1.0
-1.2 -0.7 -0.2 0.3 0.8 1.3
B 18:2 squalene
23:024:0
16:022:018:120:216:120:020:114:0
17:1
18:3
Loading PC1
Load
ing
PC
2
-1.0
-0.8
-0.6
-0.4
-0.2
0.0
0.2
0.4
0.6
0.8
1.0
-1.2 -0.7 -0.2 0.3 0.8 1.3
B 18:2 squalene
23:024:0
16:022:018:120:216:120:020:114:0
17:1
18:3
Loading PC1
Load
ing
PC
2
-1.0
-0.8
-0.6
-0.4
-0.2
0.0
0.2
0.4
0.6
0.8
1.0
-1.0 -0.5 0.0 0.5 1.0 1.5
Ccycloartenol
9,12-OH18:2
sitosterol
sitostanol24:0
19:0
14:0tocopherol
17:018:0 OH
20:0
22:0
gramisterol
24-methylene-cycloartenol
16:0 OH
Loading PC1
Load
ing
PC
2
-1.0
-0.8
-0.6
-0.4
-0.2
0.0
0.2
0.4
0.6
0.8
1.0
-1.0 -0.5 0.0 0.5 1.0 1.5
Ccycloartenol
9,12-OH18:2
sitosterol
sitostanol24:0
19:0
14:0tocopherol
17:018:0 OH
20:0
22:0
gramisterol
24-methylene-cycloartenol
16:0 OH
Loading PC1
Load
ing
PC
2
fructosegalactitol
-0.6
-0.4
-0.2
0.0
0.2
0.4
0.6
0.8
1.0
1.2
-1.0 -0.5 0.0 0.5 1.0 1.5
D
myo-inositol
galactoseglucose
raffinose
stachyose
sucrose
Load
ing
PC
2
Loading PC1
fructosegalactitol
-0.6
-0.4
-0.2
0.0
0.2
0.4
0.6
0.8
1.0
1.2
-1.0 -0.5 0.0 0.5 1.0 1.5
D
myo-inositol
galactoseglucose
raffinose
stachyose
sucrose
Load
ing
PC
2
Loading PC1
-1.0
-0.8
-0.6
-0.4
-0.2
0.0
0.2
0.4
0.6
0.8
1.0
1.2
-1.5 -1.0 -0.5 0.0 0.5 1.0 1.5
E
histidine
serinelactic acid
threonineisoleucineglutamic acidprolinevalinemaleic acid
α-aminoadipic acid
tryptophanphosphate
alanine
GABA
fumaric acidputrescine
glycine
pyroglutamic acid
lysine
malic acid
asparagine
ethanolamine
Load
ing
PC
2
Loading PC1
A
Figure 12: Loading plots of standardized GC/FID metabolite profiling data from the
combined non-polar and polar fractions I-IV (A) and from the single
fractions I (B), II (C), III (D) and IV (E).
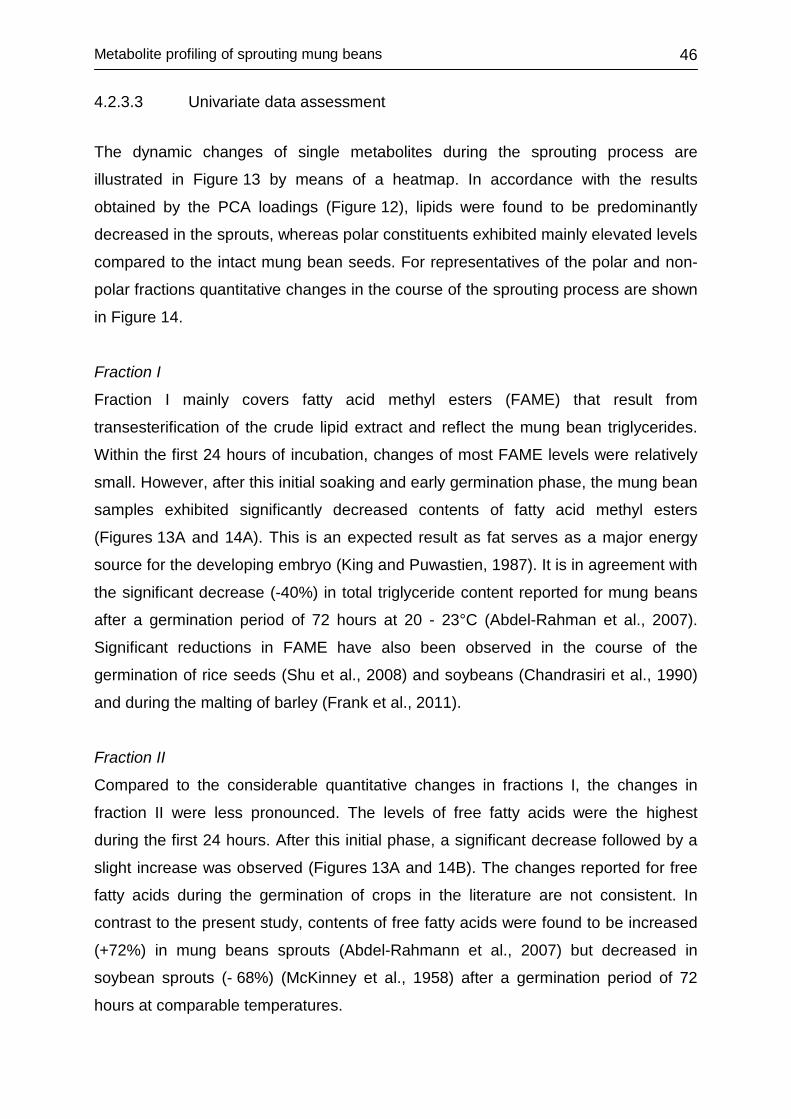
Metabolite profiling of sprouting mung beans
46
4.2.3.3 Univariate data assessment
The dynamic changes of single metabolites during the sprouting process are
illustrated in Figure 13 by means of a heatmap. In accordance with the results
obtained by the PCA loadings (Figure 12), lipids were found to be predominantly
decreased in the sprouts, whereas polar constituents exhibited mainly elevated levels
compared to the intact mung bean seeds. For representatives of the polar and non-
polar fractions quantitative changes in the course of the sprouting process are shown
in Figure 14.
Fraction I
Fraction I mainly covers fatty acid methyl esters (FAME) that result from
transesterification of the crude lipid extract and reflect the mung bean triglycerides.
Within the first 24 hours of incubation, changes of most FAME levels were relatively
small. However, after this initial soaking and early germination phase, the mung bean
samples exhibited significantly decreased contents of fatty acid methyl esters
(Figures 13A and 14A). This is an expected result as fat serves as a major energy
source for the developing embryo (King and Puwastien, 1987). It is in agreement with
the significant decrease (-40%) in total triglyceride content reported for mung beans
after a germination period of 72 hours at 20 - 23°C (Abdel-Rahman et al., 2007).
Significant reductions in FAME have also been observed in the course of the
germination of rice seeds (Shu et al., 2008) and soybeans (Chandrasiri et al., 1990)
and during the malting of barley (Frank et al., 2011).
Fraction II
Compared to the considerable quantitative changes in fractions I, the changes in
fraction II were less pronounced. The levels of free fatty acids were the highest
during the first 24 hours. After this initial phase, a significant decrease followed by a
slight increase was observed (Figures 13A and 14B). The changes reported for free
fatty acids during the germination of crops in the literature are not consistent. In
contrast to the present study, contents of free fatty acids were found to be increased
(+72%) in mung beans sprouts (Abdel-Rahmann et al., 2007) but decreased in
soybean sprouts (- 68%) (McKinney et al., 1958) after a germination period of 72
hours at comparable temperatures.
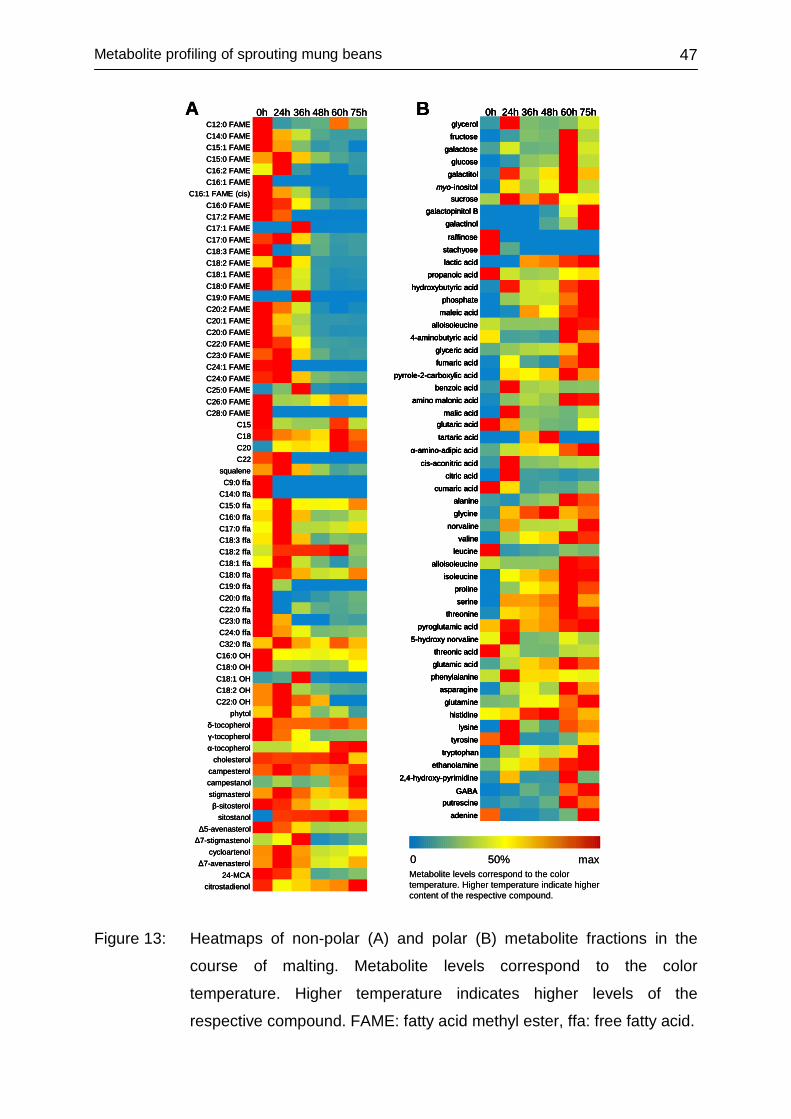
Metabolite profiling of sprouting mung beans
47
B 0h 24h 36h 48h 60h 75hglycerolfructose
galactoseglucose
galactitol
myo-inositolsucrose
galactopinitol Bgalactinol
raffinosestachyoselactic acid
propanoic acidhydroxybutyric acid
phosphatemaleic acid
alloisoleucine4-aminobutyric acid
glyceric acidfumaric acid
pyrrole-2-carboxylic acidbenzoic acid
amino malonic acidmalic acid
glutaric acid
tartaric acid
α-amino-adipic acid
cis-aconitric acidcitric acid
cumaric acidalanineglycine
norvalinevaline
leucinealloisoleucine
isoleucineprolineserine
threoninepyroglutamic acid
5-hydroxy norvalinethreonic acidglutamic acidphenylalanine
asparagineglutamine
histidinelysine
tyrosinetryptophan
2,4-hydroxy-pyrimidine
adenine
GABA
ethanolamine
putrescine
A 0h 24h 36h 48h 60h 75hC12:0 FAMEC14:0 FAMEC15:1 FAMEC15:0 FAMEC16:2 FAMEC16:1 FAME
C16:1 FAME (cis)C16:0 FAMEC17:2 FAMEC17:1 FAMEC17:0 FAMEC18:3 FAMEC18:2 FAMEC18:1 FAMEC18:0 FAMEC19:0 FAMEC20:2 FAMEC20:1 FAMEC20:0 FAMEC22:0 FAMEC23:0 FAMEC24:1 FAMEC24:0 FAMEC25:0 FAMEC26:0 FAMEC28:0 FAME
C15C18C20C22
squaleneC9:0 ffa
C14:0 ffaC15:0 ffaC16:0 ffaC17:0 ffaC18:3 ffaC18:2 ffaC18:1 ffaC18:0 ffaC19:0 ffaC20:0 ffaC22:0 ffaC23:0 ffaC24:0 ffaC32:0 ffa
C16:0 OHC18:0 OHC18:1 OHC18:2 OHC22:0 OH
phytolδ-tocopherolγ-tocopherolα-tocopherol
cholesterolcampesterolcampestanolstigmasterolβ-sitosterol
sitostanolΔ5-avenasterol
Δ7-stigmastenolcycloartenol
Δ7-avenasterol24-MCA
citrostadienol
0 50% maxMetabolite levels correspond to the colortemperature. Higher temperature indicate highercontent of the respective compound.
B 0h 24h 36h 48h 60h 75hglycerolfructose
galactoseglucose
galactitol
myo-inositolsucrose
galactopinitol Bgalactinol
raffinosestachyoselactic acid
propanoic acidhydroxybutyric acid
phosphatemaleic acid
alloisoleucine4-aminobutyric acid
glyceric acidfumaric acid
pyrrole-2-carboxylic acidbenzoic acid
amino malonic acidmalic acid
glutaric acid
tartaric acid
α-amino-adipic acid
cis-aconitric acidcitric acid
cumaric acidalanineglycine
norvalinevaline
leucinealloisoleucine
isoleucineprolineserine
threoninepyroglutamic acid
5-hydroxy norvalinethreonic acidglutamic acidphenylalanine
asparagineglutamine
histidinelysine
tyrosinetryptophan
2,4-hydroxy-pyrimidine
adenine
GABA
ethanolamine
putrescine
0h 24h 36h 48h 60h 75hglycerolfructose
galactoseglucose
galactitol
myo-inositolsucrose
galactopinitol Bgalactinol
raffinosestachyoselactic acid
propanoic acidhydroxybutyric acid
phosphatemaleic acid
alloisoleucine4-aminobutyric acid
glyceric acidfumaric acid
pyrrole-2-carboxylic acidbenzoic acid
amino malonic acidmalic acid
glutaric acid
tartaric acid
α-amino-adipic acid
cis-aconitric acidcitric acid
cumaric acidalanineglycine
norvalinevaline
leucinealloisoleucine
isoleucineprolineserine
threoninepyroglutamic acid
5-hydroxy norvalinethreonic acidglutamic acidphenylalanine
asparagineglutamine
histidinelysine
tyrosinetryptophan
2,4-hydroxy-pyrimidine
adenine
GABA
ethanolamine
putrescine
glycerolfructose
galactoseglucose
galactitol
myo-inositolsucrose
galactopinitol Bgalactinol
raffinosestachyoselactic acid
propanoic acidhydroxybutyric acid
phosphatemaleic acid
alloisoleucine4-aminobutyric acid
glyceric acidfumaric acid
pyrrole-2-carboxylic acidbenzoic acid
amino malonic acidmalic acid
glutaric acid
tartaric acid
α-amino-adipic acid
cis-aconitric acidcitric acid
cumaric acidalanineglycine
norvalinevaline
leucinealloisoleucine
isoleucineprolineserine
threoninepyroglutamic acid
5-hydroxy norvalinethreonic acidglutamic acidphenylalanine
asparagineglutamine
histidinelysine
tyrosinetryptophan
2,4-hydroxy-pyrimidine
adenine
GABA
ethanolamine
putrescine
A 0h 24h 36h 48h 60h 75hC12:0 FAMEC14:0 FAMEC15:1 FAMEC15:0 FAMEC16:2 FAMEC16:1 FAME
C16:1 FAME (cis)C16:0 FAMEC17:2 FAMEC17:1 FAMEC17:0 FAMEC18:3 FAMEC18:2 FAMEC18:1 FAMEC18:0 FAMEC19:0 FAMEC20:2 FAMEC20:1 FAMEC20:0 FAMEC22:0 FAMEC23:0 FAMEC24:1 FAMEC24:0 FAMEC25:0 FAMEC26:0 FAMEC28:0 FAME
C15C18C20C22
squaleneC9:0 ffa
C14:0 ffaC15:0 ffaC16:0 ffaC17:0 ffaC18:3 ffaC18:2 ffaC18:1 ffaC18:0 ffaC19:0 ffaC20:0 ffaC22:0 ffaC23:0 ffaC24:0 ffaC32:0 ffa
C16:0 OHC18:0 OHC18:1 OHC18:2 OHC22:0 OH
phytolδ-tocopherolγ-tocopherolα-tocopherol
cholesterolcampesterolcampestanolstigmasterolβ-sitosterol
sitostanolΔ5-avenasterol
Δ7-stigmastenolcycloartenol
Δ7-avenasterol24-MCA
citrostadienol
0 50% maxMetabolite levels correspond to the colortemperature. Higher temperature indicate highercontent of the respective compound.
Figure 13: Heatmaps of non-polar (A) and polar (B) metabolite fractions in the
course of malting. Metabolite levels correspond to the color
temperature. Higher temperature indicates higher levels of the
respective compound. FAME: fatty acid methyl ester, ffa: free fatty acid.
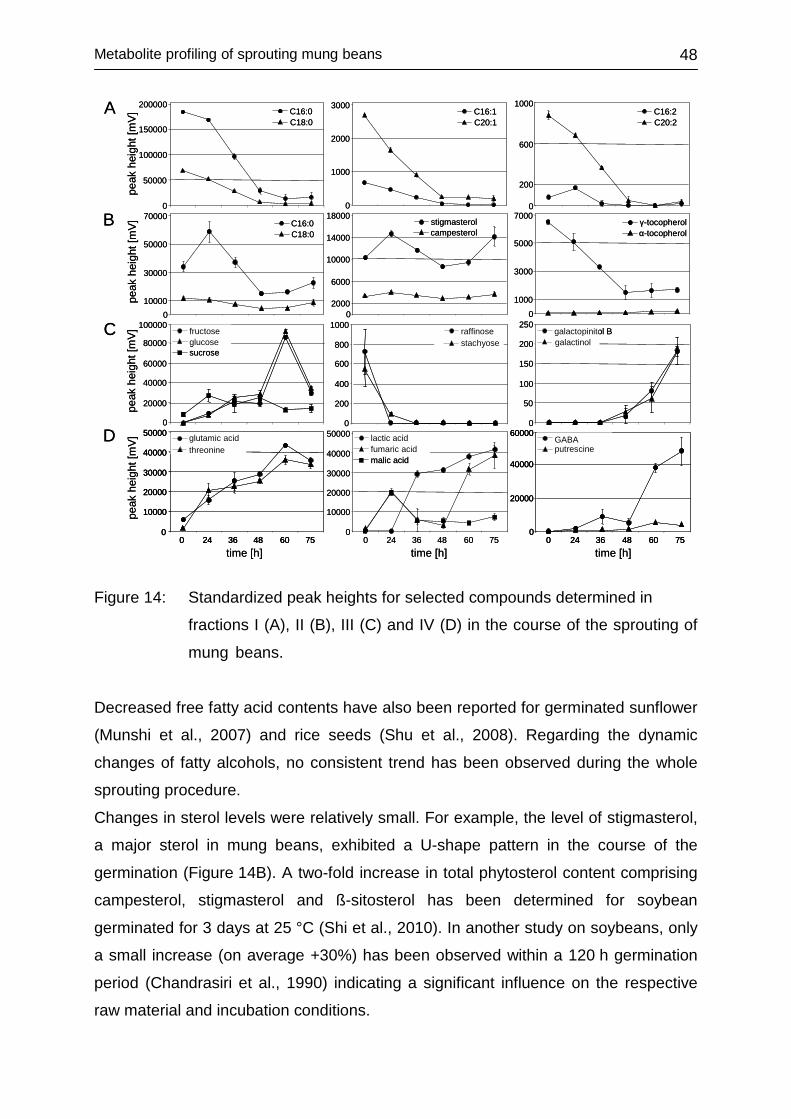
Metabolite profiling of sprouting mung beans
48
010000
30000
50000
70000
campesterol
0
1000
2000
3000
0
20000
40000
60000
80000
100000
100000
150000
200000
2000
6000
10000
14000
18000
0
1000
3000
5000
7000
0
0
200
400
600
800
1000
0
50
100
150
200
250
time [h] time [h] time [h]
peak
heig
ht[m
V]pe
akhe
ight
[mV]
peak
heig
ht[m
V]pe
akhe
ight
[mV]
A
B
C
D
C16:0C18:0
0
50000
fructoseglucosesucrose
γ-tocopherolα-tocopherol
stigmasterol
raffinosestachyose
galactopinitol Bgalactinol
C16:1C20:1
0
200
600
1000C16:2C20:2
C16:0C18:0
0
10000
20000
30000
40000
50000
0 24 36 48 60 75
threonineglutamic acid
0
10000
20000
30000
40000
50000
0 24 36 48 60 75
lactic acidfumaric acidmalic acid
00 24 36 48 60 75
putrescineGABA
20000
40000
60000
010000
30000
50000
70000
campesterol
0
1000
2000
3000
0
20000
40000
60000
80000
100000
100000
150000
200000
2000
6000
10000
14000
18000
0
1000
3000
5000
7000
0
0
200
400
600
800
1000
0
50
100
150
200
250
time [h] time [h] time [h]
peak
heig
ht[m
V]pe
akhe
ight
[mV]
peak
heig
ht[m
V]pe
akhe
ight
[mV]
A
B
C
D
C16:0C18:0
0
50000
fructoseglucosesucrose
γ-tocopherolα-tocopherol
stigmasterol
raffinosestachyose
galactopinitol Bgalactinol
C16:1C20:1
0
200
600
1000C16:2C20:2
C16:0C18:0
0
10000
20000
30000
40000
50000
0 24 36 48 60 75
threonineglutamic acid
0
10000
20000
30000
40000
50000
0 24 36 48 60 75
threonineglutamic acid
0
10000
20000
30000
40000
50000
0 24 36 48 60 75
lactic acidfumaric acidmalic acid
00 24 36 48 60 75
putrescineGABA
20000
40000
60000
00 24 36 48 60 75
putrescineGABA
20000
40000
60000
Figure 14: Standardized peak heights for selected compounds determined in
fractions I (A), II (B), III (C) and IV (D) in the course of the sprouting of
mung beans.
Decreased free fatty acid contents have also been reported for germinated sunflower
(Munshi et al., 2007) and rice seeds (Shu et al., 2008). Regarding the dynamic
changes of fatty alcohols, no consistent trend has been observed during the whole
sprouting procedure.
Changes in sterol levels were relatively small. For example, the level of stigmasterol,
a major sterol in mung beans, exhibited a U-shape pattern in the course of the
germination (Figure 14B). A two-fold increase in total phytosterol content comprising
campesterol, stigmasterol and ß-sitosterol has been determined for soybean
germinated for 3 days at 25 °C (Shi et al., 2010). In another study on soybeans, only
a small increase (on average +30%) has been observed within a 120 h germination
period (Chandrasiri et al., 1990) indicating a significant influence on the respective
raw material and incubation conditions.
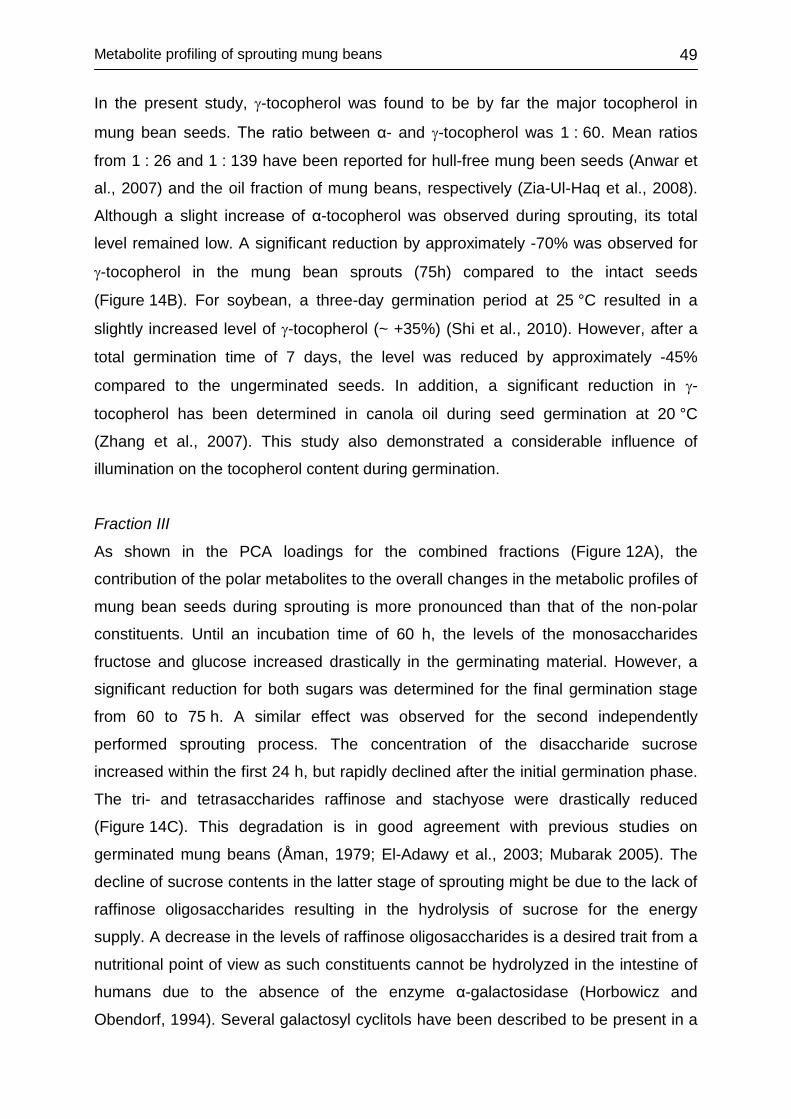
Metabolite profiling of sprouting mung beans
49
In the present study, γ-tocopherol was found to be by far the major tocopherol in
mung bean seeds. The ratio between α- and γ-tocopherol was 1 : 60. Mean ratios
from 1 : 26 and 1 : 139 have been reported for hull-free mung been seeds (Anwar et
al., 2007) and the oil fraction of mung beans, respectively (Zia-Ul-Haq et al., 2008).
Although a slight increase of α-tocopherol was observed during sprouting, its total
level remained low. A significant reduction by approximately -70% was observed for
γ-tocopherol in the mung bean sprouts (75h) compared to the intact seeds
(Figure 14B). For soybean, a three-day germination period at 25 °C resulted in a
slightly increased level of γ-tocopherol (~ +35%) (Shi et al., 2010). However, after a
total germination time of 7 days, the level was reduced by approximately -45%
compared to the ungerminated seeds. In addition, a significant reduction in γ-
tocopherol has been determined in canola oil during seed germination at 20 °C
(Zhang et al., 2007). This study also demonstrated a considerable influence of
illumination on the tocopherol content during germination.
Fraction III
As shown in the PCA loadings for the combined fractions (Figure 12A), the
contribution of the polar metabolites to the overall changes in the metabolic profiles of
mung bean seeds during sprouting is more pronounced than that of the non-polar
constituents. Until an incubation time of 60 h, the levels of the monosaccharides
fructose and glucose increased drastically in the germinating material. However, a
significant reduction for both sugars was determined for the final germination stage
from 60 to 75 h. A similar effect was observed for the second independently
performed sprouting process. The concentration of the disaccharide sucrose
increased within the first 24 h, but rapidly declined after the initial germination phase.
The tri- and tetrasaccharides raffinose and stachyose were drastically reduced
(Figure 14C). This degradation is in good agreement with previous studies on
germinated mung beans (Åman, 1979; El-Adawy et al., 2003; Mubarak 2005). The
decline of sucrose contents in the latter stage of sprouting might be due to the lack of
raffinose oligosaccharides resulting in the hydrolysis of sucrose for the energy
supply. A decrease in the levels of raffinose oligosaccharides is a desired trait from a
nutritional point of view as such constituents cannot be hydrolyzed in the intestine of
humans due to the absence of the enzyme α-galactosidase (Horbowicz and
Obendorf, 1994). Several galactosyl cyclitols have been described to be present in a
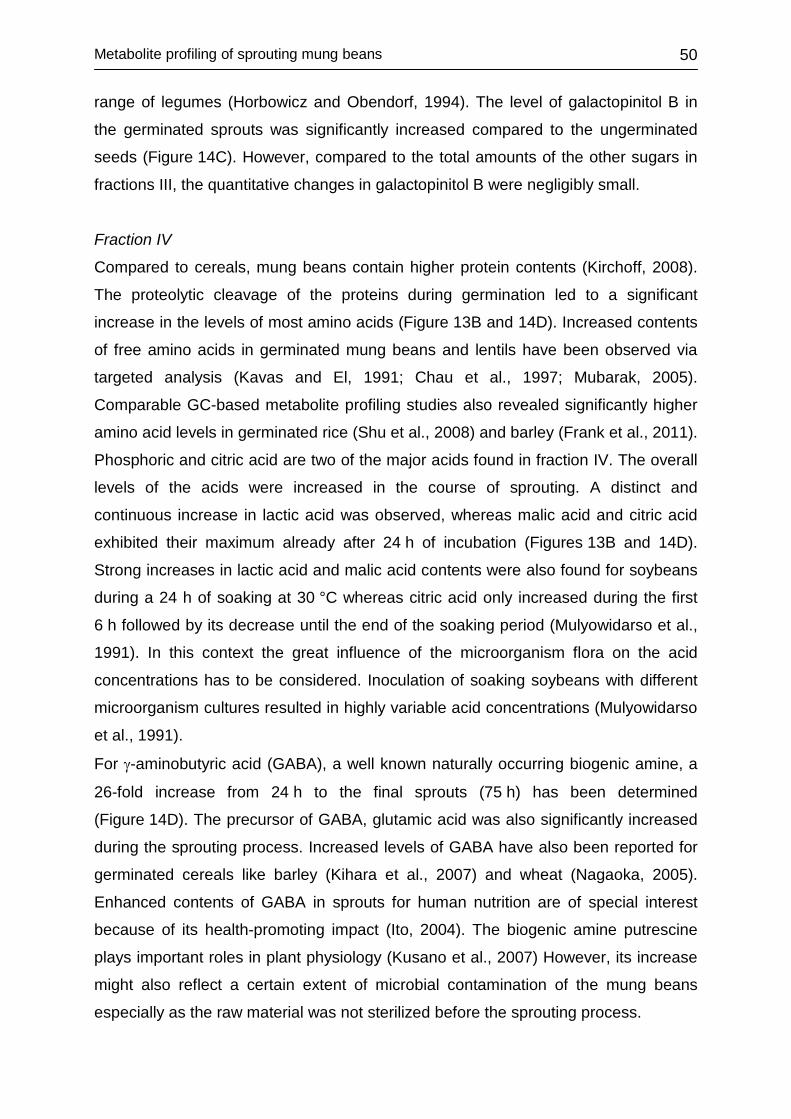
Metabolite profiling of sprouting mung beans
50
range of legumes (Horbowicz and Obendorf, 1994). The level of galactopinitol B in
the germinated sprouts was significantly increased compared to the ungerminated
seeds (Figure 14C). However, compared to the total amounts of the other sugars in
fractions III, the quantitative changes in galactopinitol B were negligibly small.
Fraction IV
Compared to cereals, mung beans contain higher protein contents (Kirchoff, 2008).
The proteolytic cleavage of the proteins during germination led to a significant
increase in the levels of most amino acids (Figure 13B and 14D). Increased contents
of free amino acids in germinated mung beans and lentils have been observed via
targeted analysis (Kavas and El, 1991; Chau et al., 1997; Mubarak, 2005).
Comparable GC-based metabolite profiling studies also revealed significantly higher
amino acid levels in germinated rice (Shu et al., 2008) and barley (Frank et al., 2011).
Phosphoric and citric acid are two of the major acids found in fraction IV. The overall
levels of the acids were increased in the course of sprouting. A distinct and
continuous increase in lactic acid was observed, whereas malic acid and citric acid
exhibited their maximum already after 24 h of incubation (Figures 13B and 14D).
Strong increases in lactic acid and malic acid contents were also found for soybeans
during a 24 h of soaking at 30 °C whereas citric acid only increased during the first
6 h followed by its decrease until the end of the soaking period (Mulyowidarso et al.,
1991). In this context the great influence of the microorganism flora on the acid
concentrations has to be considered. Inoculation of soaking soybeans with different
microorganism cultures resulted in highly variable acid concentrations (Mulyowidarso
et al., 1991).
For γ-aminobutyric acid (GABA), a well known naturally occurring biogenic amine, a
26-fold increase from 24 h to the final sprouts (75 h) has been determined
(Figure 14D). The precursor of GABA, glutamic acid was also significantly increased
during the sprouting process. Increased levels of GABA have also been reported for
germinated cereals like barley (Kihara et al., 2007) and wheat (Nagaoka, 2005).
Enhanced contents of GABA in sprouts for human nutrition are of special interest
because of its health-promoting impact (Ito, 2004). The biogenic amine putrescine
plays important roles in plant physiology (Kusano et al., 2007) However, its increase
might also reflect a certain extent of microbial contamination of the mung beans
especially as the raw material was not sterilized before the sprouting process.
Metabolite profiling of sprouting mung beans
51
4.2.4 Conclusions
The data obtained demonstrate the suitability of the described metabolite profiling
technique to follow metabolic changes in a complex plant matrix. Owing to inherent
features of the approach, e.g. choice of extraction solvents, derivatization steps or
volatilities of derivatives, the type of metabolites covered is to some extent pre-
determined and not fully “unbiased”. However, the metabolites stem from a wide
range of chemical classes and the number of compounds detected and identified is in
an order of magnitude comparable to those reported for other GC-MS based
metabolite profiling studies (Schauer et al., 2005; Tarpley et al., 2005). In addition to
representatives of primary plant metabolism, nutritionally relevant metabolites are
covered. They range from the lipophilic sterols to the polar amino compounds γ-
aminobutyric acid and putrescine. The applied methodology is suitable to cover those
metabolites shown to form a basis for metabolic investigation of sprouting mung
beans by means of a GC-based approach. The metabolic changes observed during
the sprouting of mung beans also confirm the potential of metabolite profiling
techniques to reveal distinct metabolic switches in the developmental stages of mung
bean seeds.
Sprouting impact factors
52
4.3 SPROUTING IMPACT FACTORS
4.3.1 Introduction
The metabolic phenotype of mature crop seeds is mainly defined by the genetic
background (e.g. different genotypes), the breeding strategy (e.g. conventional
breeding and genetic engineering), the environmental growth conditions (e.g. climatic
differences during the growing seasons) and the crop management system used
(e.g. conventional and organic practices). In the recent years, metabolite profiling
was shown to be a suitable tool for the investigation of these impact factors on the
metabolic phenotypes of mature crops (Harrigan et al., 2009; Röhlig et al., 2009;
Frank et al., 2012b). In addition, metabolite profiling has been demonstrated to be a
powerful tool to follow metabolic changes in plant developmental systems (Shu et al.,
2008; Shepherd et al., 2010; Frank et al., 2011). The applied metabolite profiling
procedure to sprouting mung beans revealed significant dynamic changes in the
metabolic phenotype during germination (see Chapter 4.2).
The aim of the present chapter was to investigate the influence of genotype, growing
environment, temperature, illumination and washing treatment on the metabolite
profiles of sprouting mung beans. Two mung bean materials obtained from industry
and from a local health-food shop, respectively, were subjected together to three
sprouting processes to investigate the genetic influence on the metabolite profiles. In
addition, two mung bean varieties, both grown at dry and rainy seasons in Thailand
were sprouted under constant incubation conditions to analyze the impact of
environment and growth condition on the metabolite profiles during the sprouting
process. Further, mung beans were sprouted at different incubation temperatures.
For germinating crops, the incubation temperature is known to be a major driver for
the time-dependent progress. To follow the metabolic changes in the present study,
mung bean materials from the same batch were sprouted at 25°C and 35°C and the
metabolite profiles were assessed by means of multivariate and univariate analyses.
For the investigation of the influence of illumination on the metabolite profiles of
sprouting mung beans, samples were germinated under artificial light exposure and
comparatively analyzed to the respectively mung beans sprouted in the dark. To
investigate the impact of a washing treatment, intact mung beans were washed with
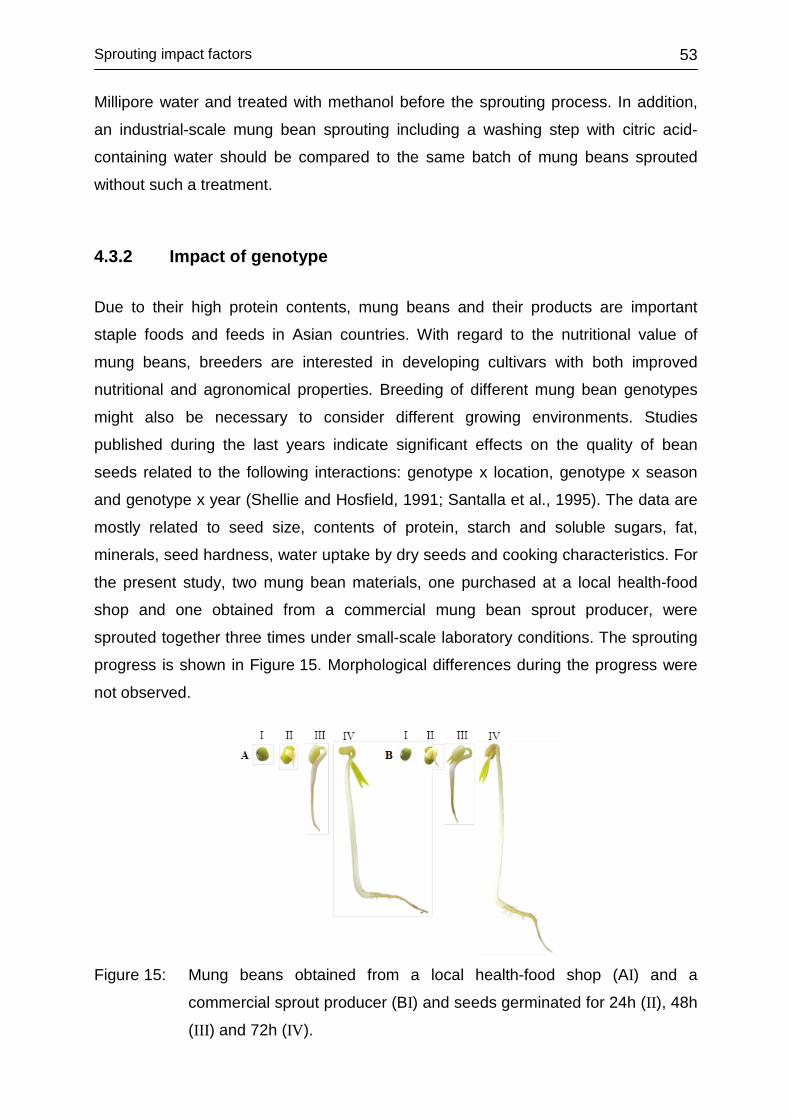
Sprouting impact factors
53
Millipore water and treated with methanol before the sprouting process. In addition,
an industrial-scale mung bean sprouting including a washing step with citric acid-
containing water should be compared to the same batch of mung beans sprouted
without such a treatment.
4.3.2 Impact of genotype
Due to their high protein contents, mung beans and their products are important
staple foods and feeds in Asian countries. With regard to the nutritional value of
mung beans, breeders are interested in developing cultivars with both improved
nutritional and agronomical properties. Breeding of different mung bean genotypes
might also be necessary to consider different growing environments. Studies
published during the last years indicate significant effects on the quality of bean
seeds related to the following interactions: genotype x location, genotype x season
and genotype x year (Shellie and Hosfield, 1991; Santalla et al., 1995). The data are
mostly related to seed size, contents of protein, starch and soluble sugars, fat,
minerals, seed hardness, water uptake by dry seeds and cooking characteristics. For
the present study, two mung bean materials, one purchased at a local health-food
shop and one obtained from a commercial mung bean sprout producer, were
sprouted together three times under small-scale laboratory conditions. The sprouting
progress is shown in Figure 15. Morphological differences during the progress were
not observed.
Figure 15: Mung beans obtained from a local health-food shop (AI) and a
commercial sprout producer (BI) and seeds germinated for 24h (II), 48h
(III) and 72h (IV).
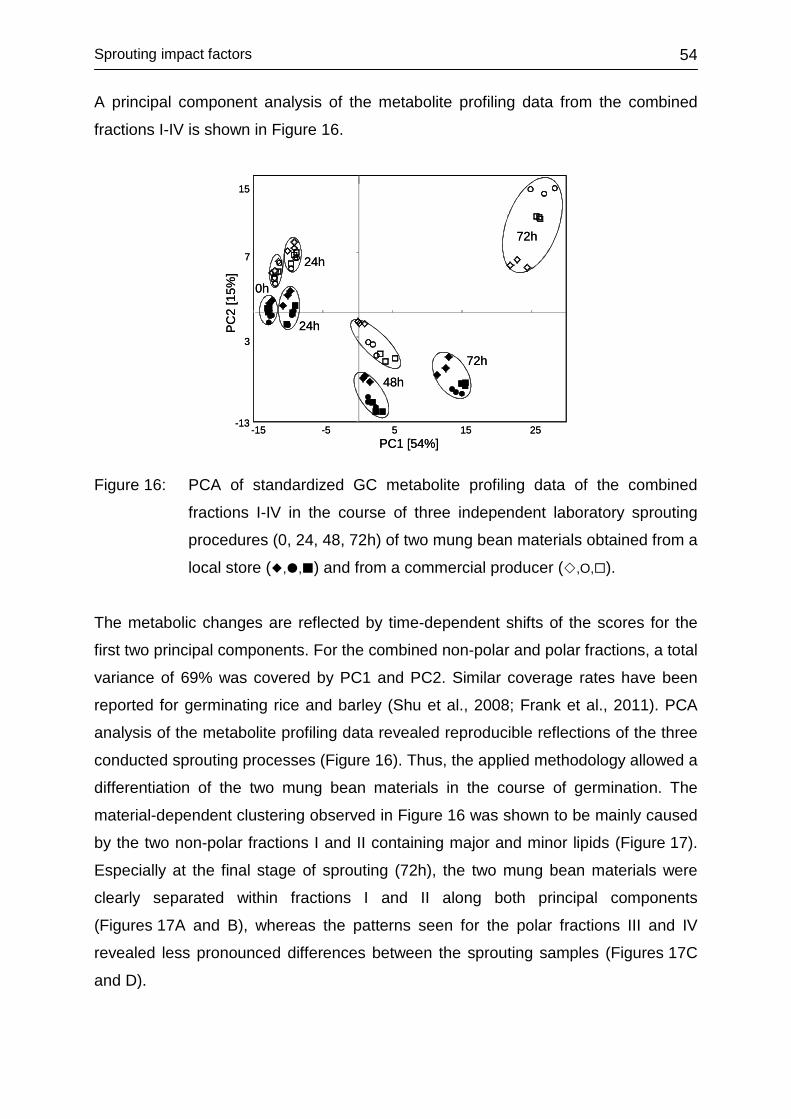
Sprouting impact factors
54
A principal component analysis of the metabolite profiling data from the combined
fractions I-IV is shown in Figure 16.
PC1 [54%]
-13
3
7
-15 -5 5 15 25
72h
48h
24h
72h
24h
0h
PC2
[15%
]
15
PC1 [54%]
-13
3
7
-15 -5 5 15 25
72h
48h
24h
72h
24h
0h
PC2
[15%
]
15
Figure 16: PCA of standardized GC metabolite profiling data of the combined
fractions I-IV in the course of three independent laboratory sprouting
procedures (0, 24, 48, 72h) of two mung bean materials obtained from a
local store (,,) and from a commercial producer (,O,).
The metabolic changes are reflected by time-dependent shifts of the scores for the
first two principal components. For the combined non-polar and polar fractions, a total
variance of 69% was covered by PC1 and PC2. Similar coverage rates have been
reported for germinating rice and barley (Shu et al., 2008; Frank et al., 2011). PCA
analysis of the metabolite profiling data revealed reproducible reflections of the three
conducted sprouting processes (Figure 16). Thus, the applied methodology allowed a
differentiation of the two mung bean materials in the course of germination. The
material-dependent clustering observed in Figure 16 was shown to be mainly caused
by the two non-polar fractions I and II containing major and minor lipids (Figure 17).
Especially at the final stage of sprouting (72h), the two mung bean materials were
clearly separated within fractions I and II along both principal components
(Figures 17A and B), whereas the patterns seen for the polar fractions III and IV
revealed less pronounced differences between the sprouting samples (Figures 17C
and D).
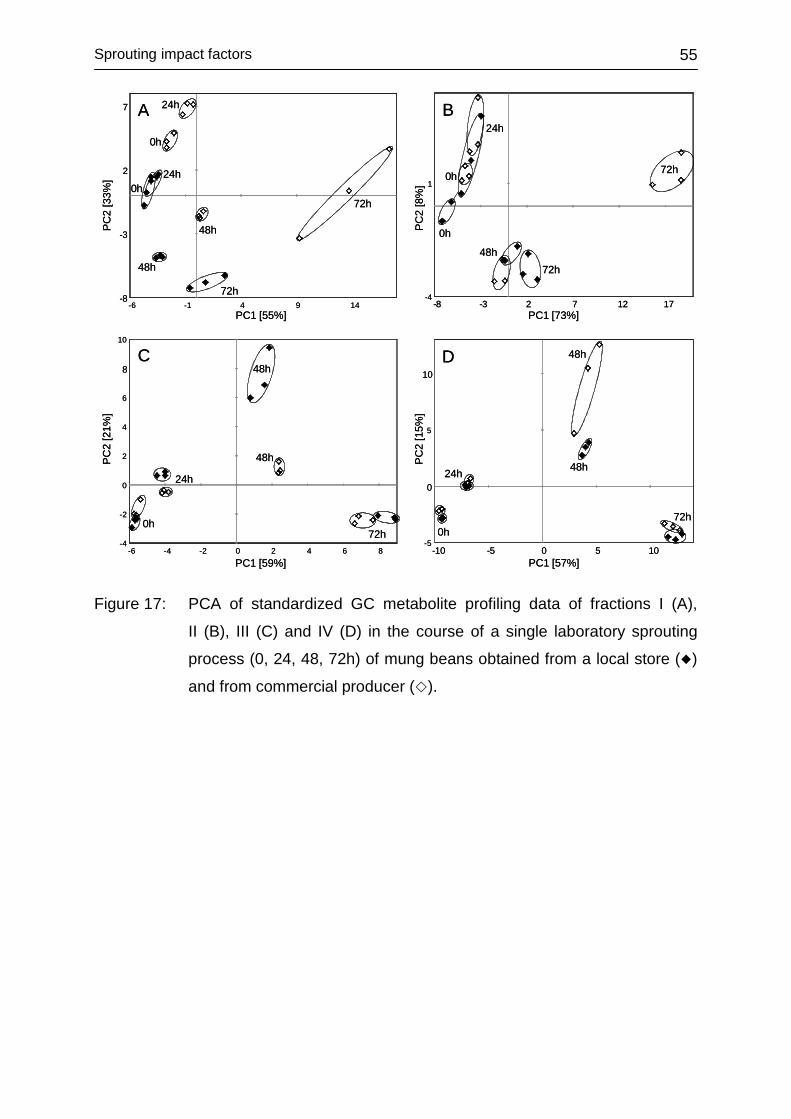
Sprouting impact factors
55
-8
-3
2
7
-6 -1 4 9 14PC1 [55%]
PC2
[33%]
72h
A
48h
24h
0h
24h0h
72h
48h
-4
1
-8 -3 2 7 12 17PC1 [73%]
PC2
[8%]
48h
B
72h
72h
24h
0h
0h
-5
0
5
10
-10 -5 0 5 10PC1 [57%]
PC2 [
15%]
D
48h
72h
48h
24h
0h-4
-2
0
2
4
6
8
10
-6 -4 -2 0 2 4 6 8PC1 [59%]
PC2
[21%]
C
48h
72h
48h
24h
0h
PC
2 [3
3%]
PC
2 [2
1%]
PC
2 [8
%]
PC
2 [1
5%]
Figure 17: PCA of standardized GC metabolite profiling data of fractions I (A),
II (B), III (C) and IV (D) in the course of a single laboratory sprouting
process (0, 24, 48, 72h) of mung beans obtained from a local store ()
and from commercial producer ().
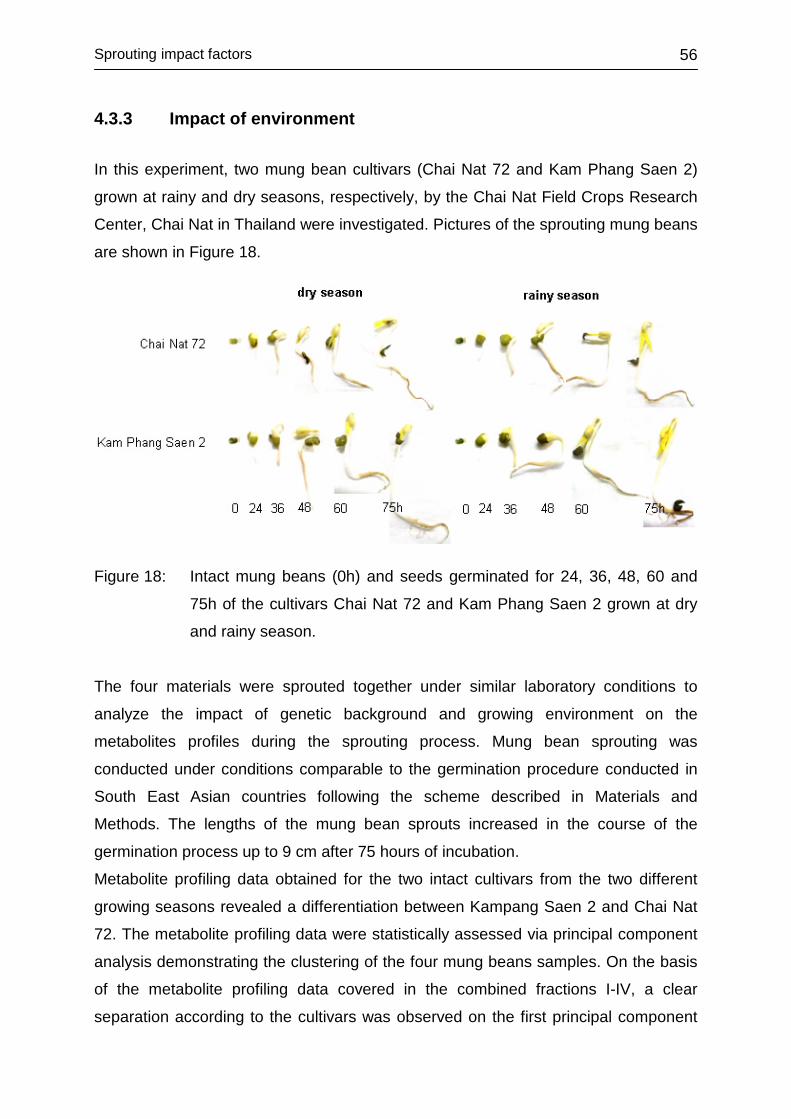
Sprouting impact factors
56
4.3.3 Impact of environment
In this experiment, two mung bean cultivars (Chai Nat 72 and Kam Phang Saen 2)
grown at rainy and dry seasons, respectively, by the Chai Nat Field Crops Research
Center, Chai Nat in Thailand were investigated. Pictures of the sprouting mung beans
are shown in Figure 18.
Figure 18: Intact mung beans (0h) and seeds germinated for 24, 36, 48, 60 and
75h of the cultivars Chai Nat 72 and Kam Phang Saen 2 grown at dry
and rainy season.
The four materials were sprouted together under similar laboratory conditions to
analyze the impact of genetic background and growing environment on the
metabolites profiles during the sprouting process. Mung bean sprouting was
conducted under conditions comparable to the germination procedure conducted in
South East Asian countries following the scheme described in Materials and
Methods. The lengths of the mung bean sprouts increased in the course of the
germination process up to 9 cm after 75 hours of incubation.
Metabolite profiling data obtained for the two intact cultivars from the two different
growing seasons revealed a differentiation between Kampang Saen 2 and Chai Nat
72. The metabolite profiling data were statistically assessed via principal component
analysis demonstrating the clustering of the four mung beans samples. On the basis
of the metabolite profiling data covered in the combined fractions I-IV, a clear
separation according to the cultivars was observed on the first principal component
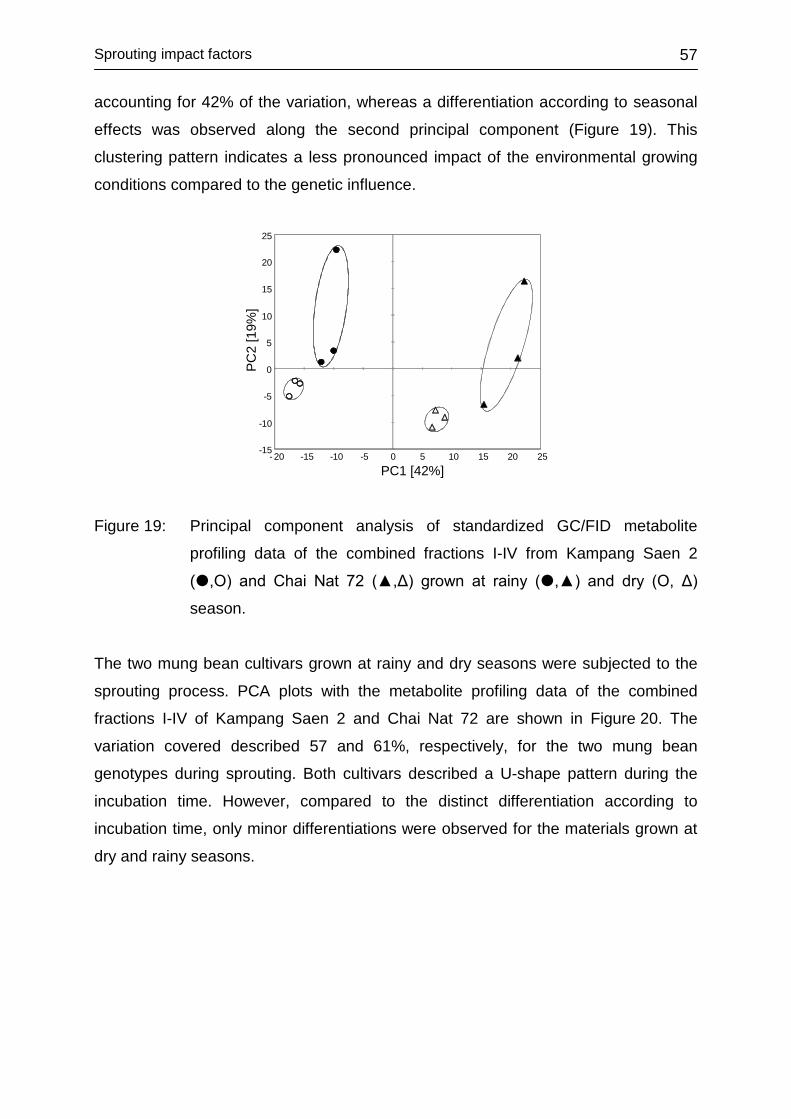
Sprouting impact factors
57
accounting for 42% of the variation, whereas a differentiation according to seasonal
effects was observed along the second principal component (Figure 19). This
clustering pattern indicates a less pronounced impact of the environmental growing
conditions compared to the genetic influence.
-15
-10
-5
0
5
10
15
20
25
- 20 -15 -10 -5 0 5 10 15 20 25
PC1 [42%]
PC2 [19%]
PC2
[19%
]
Figure 19: Principal component analysis of standardized GC/FID metabolite
profiling data of the combined fractions I-IV from Kampang Saen 2
(,O) and Chai Nat 72 (▲,Δ) grown at rainy (,▲) and dry (O, Δ)
season.
The two mung bean cultivars grown at rainy and dry seasons were subjected to the
sprouting process. PCA plots with the metabolite profiling data of the combined
fractions I-IV of Kampang Saen 2 and Chai Nat 72 are shown in Figure 20. The
variation covered described 57 and 61%, respectively, for the two mung bean
genotypes during sprouting. Both cultivars described a U-shape pattern during the
incubation time. However, compared to the distinct differentiation according to
incubation time, only minor differentiations were observed for the materials grown at
dry and rainy seasons.
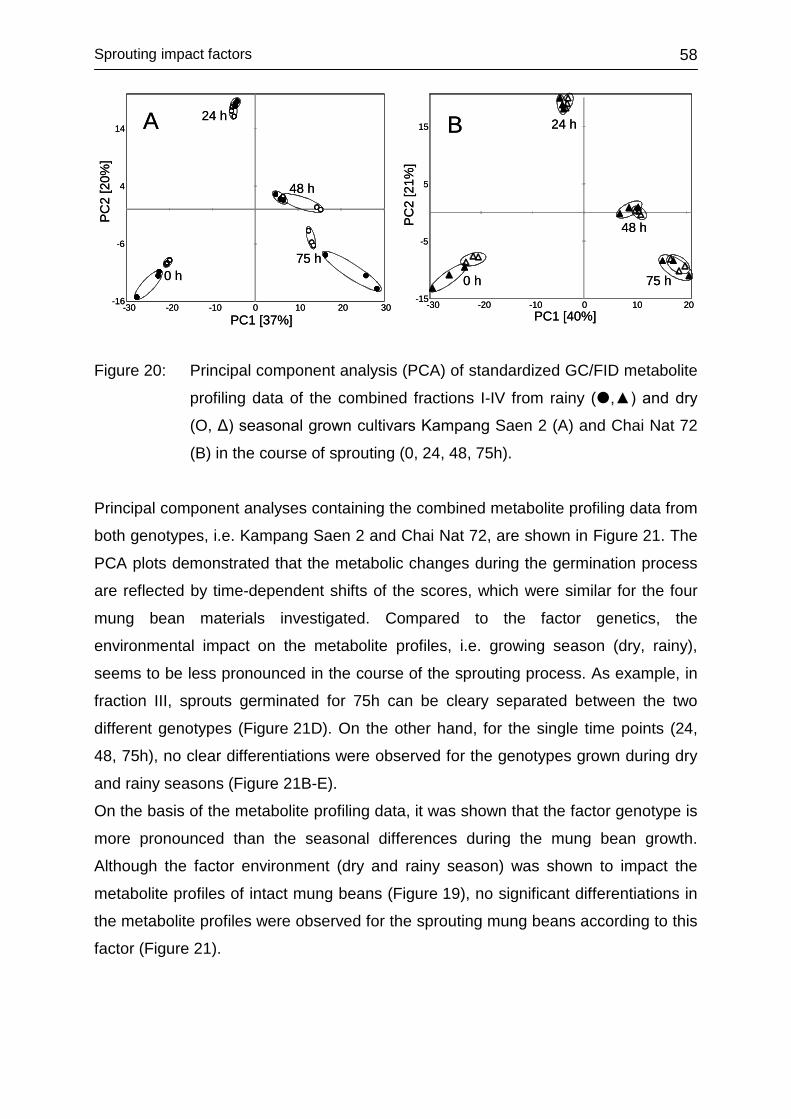
Sprouting impact factors
58
-16
-6
4
14
-30 -20 -10 0 10 20 30PC1 [37%]
PC2 [20%]
0 h
24 h
48 h
75 h
PC2
[20%
]A
-15
-5
5
15
-30 -20 -10 0 10 20PC1 [40%]
PC1 [21%]
24 h
0 h
48 h
75 h
PC2
[21%
]
B
-16
-6
4
14
-30 -20 -10 0 10 20 30PC1 [37%]
PC2 [20%]
0 h
24 h
48 h
75 h
PC2
[20%
]A
-15
-5
5
15
-30 -20 -10 0 10 20PC1 [40%]
PC1 [21%]
24 h
0 h
48 h
75 h
PC2
[21%
]
B
Figure 20: Principal component analysis (PCA) of standardized GC/FID metabolite
profiling data of the combined fractions I-IV from rainy (,▲) and dry
(O, Δ) seasonal grown cultivars Kampang Saen 2 (A) and Chai Nat 72
(B) in the course of sprouting (0, 24, 48, 75h).
Principal component analyses containing the combined metabolite profiling data from
both genotypes, i.e. Kampang Saen 2 and Chai Nat 72, are shown in Figure 21. The
PCA plots demonstrated that the metabolic changes during the germination process
are reflected by time-dependent shifts of the scores, which were similar for the four
mung bean materials investigated. Compared to the factor genetics, the
environmental impact on the metabolite profiles, i.e. growing season (dry, rainy),
seems to be less pronounced in the course of the sprouting process. As example, in
fraction III, sprouts germinated for 75h can be cleary separated between the two
different genotypes (Figure 21D). On the other hand, for the single time points (24,
48, 75h), no clear differentiations were observed for the genotypes grown during dry
and rainy seasons (Figure 21B-E).
On the basis of the metabolite profiling data, it was shown that the factor genotype is
more pronounced than the seasonal differences during the mung bean growth.
Although the factor environment (dry and rainy season) was shown to impact the
metabolite profiles of intact mung beans (Figure 19), no significant differentiations in
the metabolite profiles were observed for the sprouting mung beans according to this
factor (Figure 21).
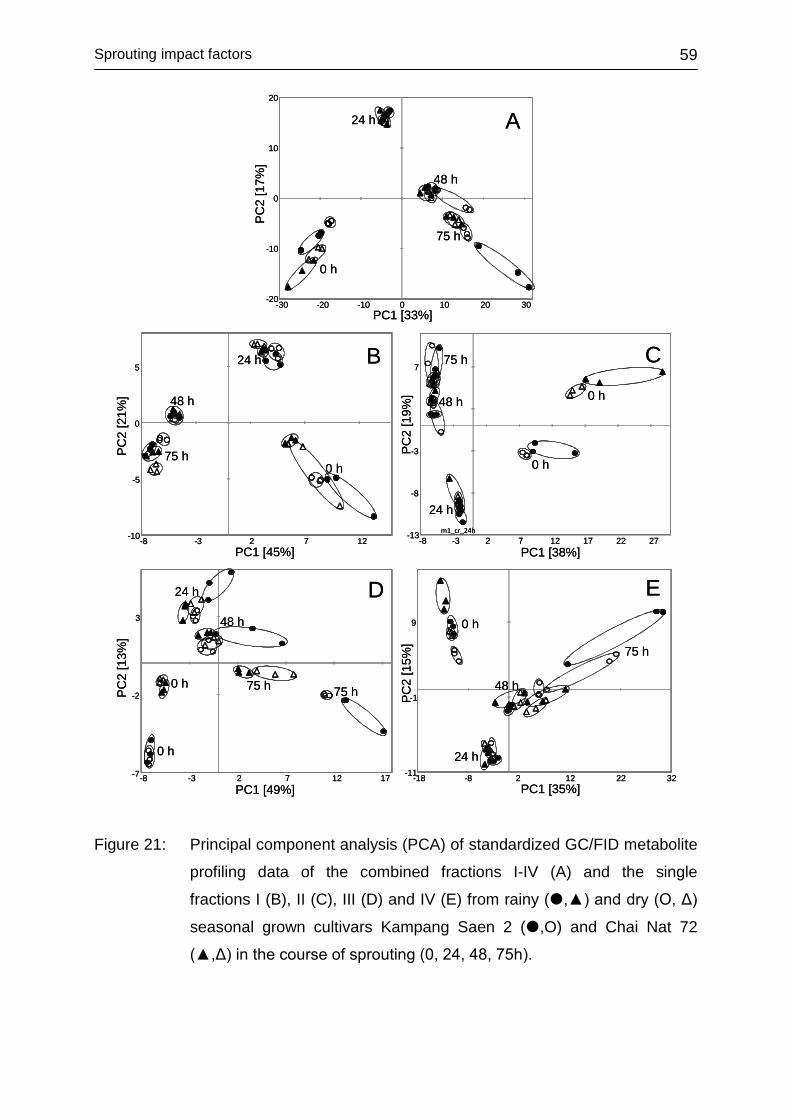
Sprouting impact factors
59
-20
-10
0
10
20
-30 -20 -10 0 10 20 30
-10
-5
0
5
-8 -3 2 7 12m1_cr_24h-13
-8
-3
7
-8 -3 2 7 12 17 22 27
-7
-2
3
-8 -3 2 7 12 17
PC1 [33%]
PC2 [17%]
0 h
PC1 [45%]
PC2 [21%]
PC1 [38%]
PC2 [19%]
PC1 [49%]
PC2 [13%]
PC1 [35%]
PC2 [15%]
-11
-1
9
-18 -8 2 12 22 32
24 h
48 h
75 h
0 h
24 h
48 h
75 h
0 h
0 h
24 h
48 h
75 h
0 h
0 h
24 h
48 h
75 h 75 h
0 h
24 h
48 h
75 h
PC2
[17%
]
PC2
[21%
]PC
2 [1
3%]
PC2
[19%
]PC
2 [1
5%]
A
B C
D E
Figure 21: Principal component analysis (PCA) of standardized GC/FID metabolite
profiling data of the combined fractions I-IV (A) and the single
fractions I (B), II (C), III (D) and IV (E) from rainy (,▲) and dry (O, Δ)
seasonal grown cultivars Kampang Saen 2 (,O) and Chai Nat 72
(▲,Δ) in the course of sprouting (0, 24, 48, 75h).
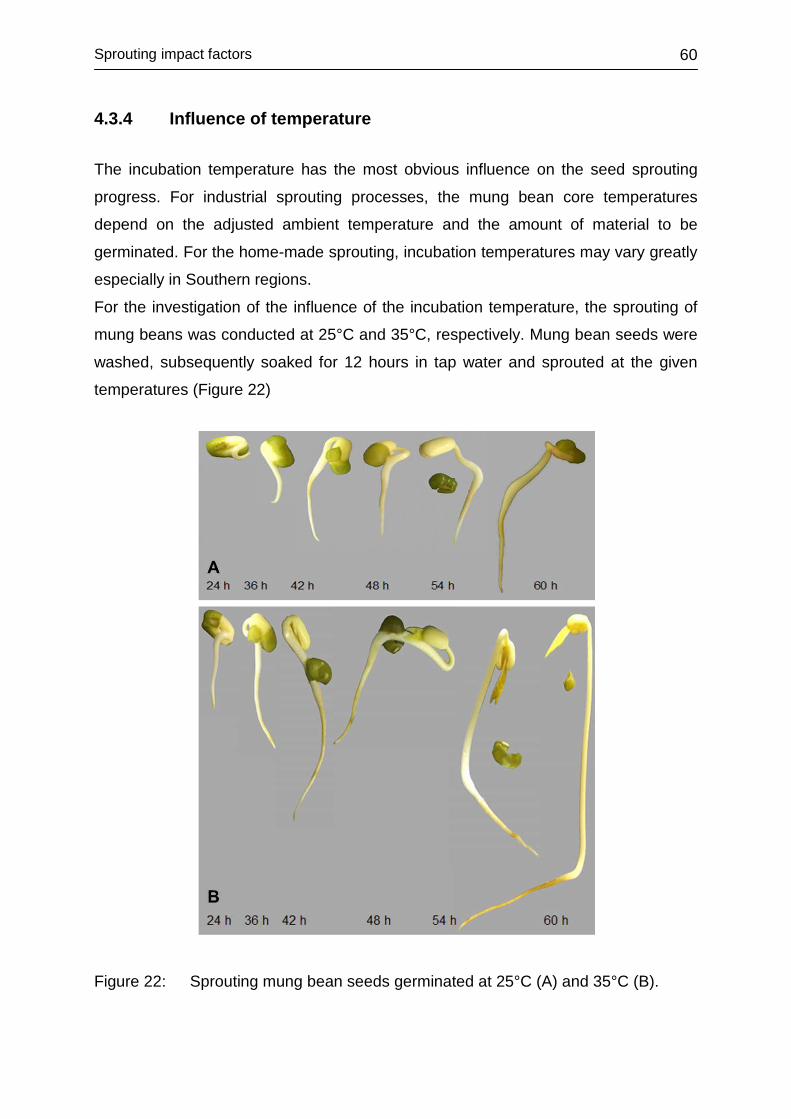
Sprouting impact factors
60
4.3.4 Influence of temperature
The incubation temperature has the most obvious influence on the seed sprouting
progress. For industrial sprouting processes, the mung bean core temperatures
depend on the adjusted ambient temperature and the amount of material to be
germinated. For the home-made sprouting, incubation temperatures may vary greatly
especially in Southern regions.
For the investigation of the influence of the incubation temperature, the sprouting of
mung beans was conducted at 25°C and 35°C, respectively. Mung bean seeds were
washed, subsequently soaked for 12 hours in tap water and sprouted at the given
temperatures (Figure 22)
Figure 22: Sprouting mung bean seeds germinated at 25°C (A) and 35°C (B).
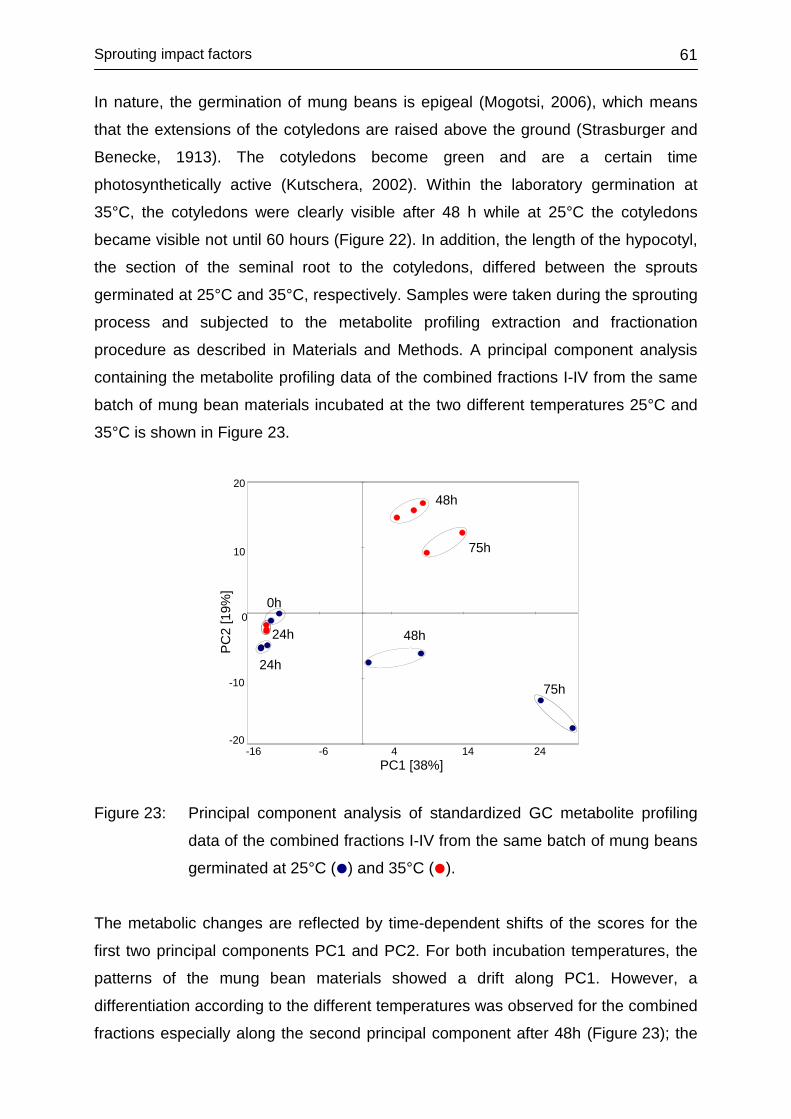
Sprouting impact factors
61
In nature, the germination of mung beans is epigeal (Mogotsi, 2006), which means
that the extensions of the cotyledons are raised above the ground (Strasburger and
Benecke, 1913). The cotyledons become green and are a certain time
photosynthetically active (Kutschera, 2002). Within the laboratory germination at
35°C, the cotyledons were clearly visible after 48 h while at 25°C the cotyledons
became visible not until 60 hours (Figure 22). In addition, the length of the hypocotyl,
the section of the seminal root to the cotyledons, differed between the sprouts
germinated at 25°C and 35°C, respectively. Samples were taken during the sprouting
process and subjected to the metabolite profiling extraction and fractionation
procedure as described in Materials and Methods. A principal component analysis
containing the metabolite profiling data of the combined fractions I-IV from the same
batch of mung bean materials incubated at the two different temperatures 25°C and
35°C is shown in Figure 23.
-20
-10
0
10
20
-16 -6 4 14 24PC1 [38%]
PC2
[19%
]
75h
48h
48h
75h
0h
24h
24h
Figure 23: Principal component analysis of standardized GC metabolite profiling
data of the combined fractions I-IV from the same batch of mung beans
germinated at 25°C () and 35°C ().
The metabolic changes are reflected by time-dependent shifts of the scores for the
first two principal components PC1 and PC2. For both incubation temperatures, the
patterns of the mung bean materials showed a drift along PC1. However, a
differentiation according to the different temperatures was observed for the combined
fractions especially along the second principal component after 48h (Figure 23); the
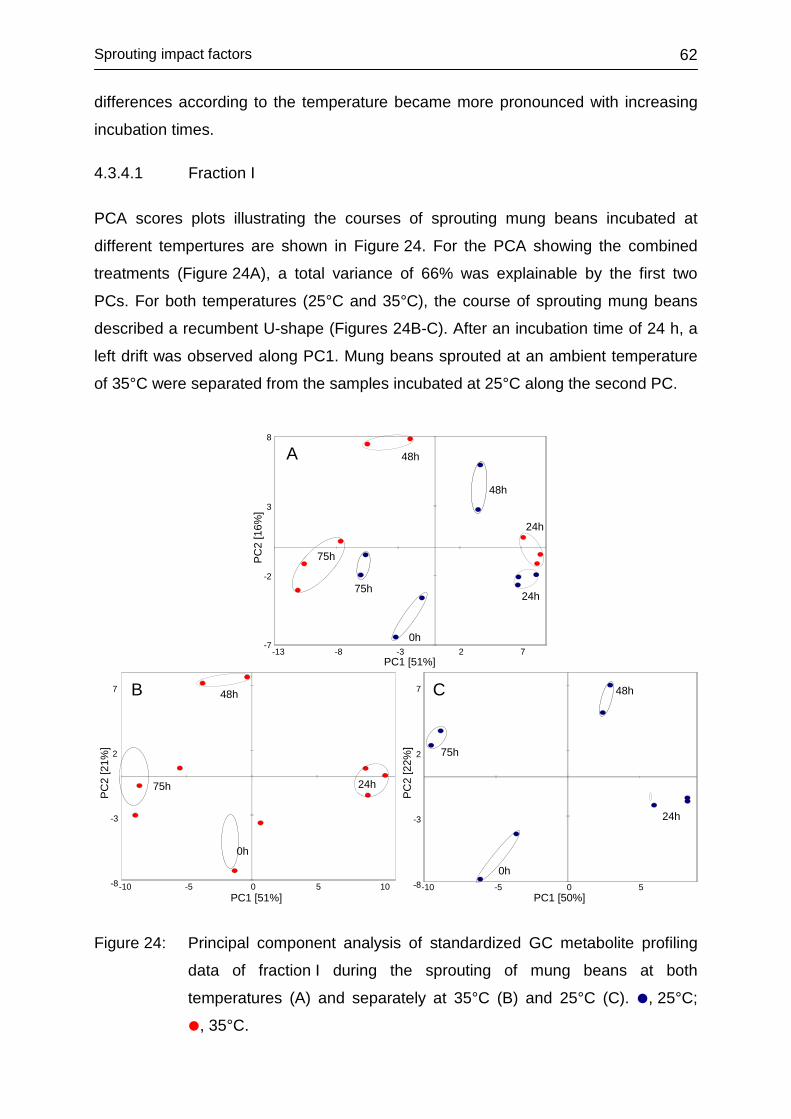
Sprouting impact factors
62
differences according to the temperature became more pronounced with increasing
incubation times.
4.3.4.1 Fraction I
PCA scores plots illustrating the courses of sprouting mung beans incubated at
different tempertures are shown in Figure 24. For the PCA showing the combined
treatments (Figure 24A), a total variance of 66% was explainable by the first two
PCs. For both temperatures (25°C and 35°C), the course of sprouting mung beans
described a recumbent U-shape (Figures 24B-C). After an incubation time of 24 h, a
left drift was observed along PC1. Mung beans sprouted at an ambient temperature
of 35°C were separated from the samples incubated at 25°C along the second PC.
-7
-2
3
8
-13 -8 -3 2 7
PC2
[16%
]
PC1 [51%]
75h
48h
48h
75h
0h
24h
24h
-8
-3
2
7
-10 -5 0 5 10PC1 [51%]
PC2
[21%
]
24h
0h
48h
75h
-8
-3
2
7
-10 -5 0 5PC1 [50%]
PC2
[22%
]
48h
0h
24h
75h
A
B C
Figure 24: Principal component analysis of standardized GC metabolite profiling
data of fraction I during the sprouting of mung beans at both
temperatures (A) and separately at 35°C (B) and 25°C (C). , 25°C;
, 35°C.
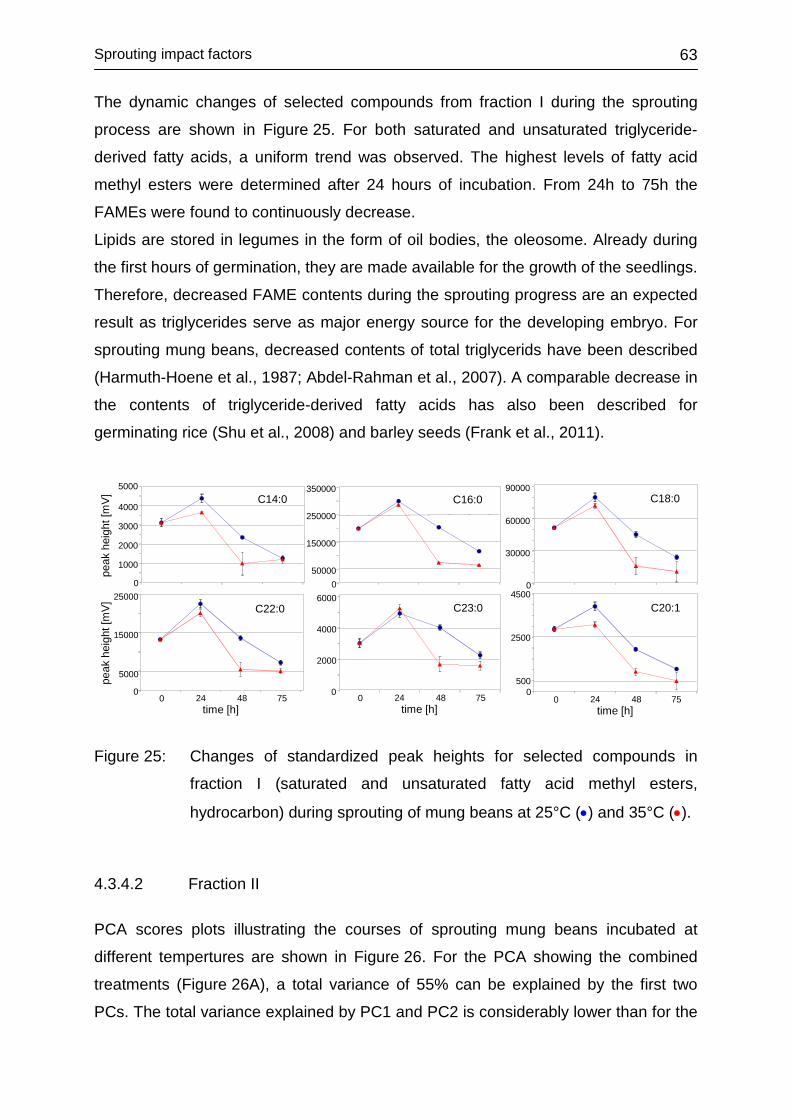
Sprouting impact factors
63
The dynamic changes of selected compounds from fraction I during the sprouting
process are shown in Figure 25. For both saturated and unsaturated triglyceride-
derived fatty acids, a uniform trend was observed. The highest levels of fatty acid
methyl esters were determined after 24 hours of incubation. From 24h to 75h the
FAMEs were found to continuously decrease.
Lipids are stored in legumes in the form of oil bodies, the oleosome. Already during
the first hours of germination, they are made available for the growth of the seedlings.
Therefore, decreased FAME contents during the sprouting progress are an expected
result as triglycerides serve as major energy source for the developing embryo. For
sprouting mung beans, decreased contents of total triglycerids have been described
(Harmuth-Hoene et al., 1987; Abdel-Rahman et al., 2007). A comparable decrease in
the contents of triglyceride-derived fatty acids has also been described for
germinating rice (Shu et al., 2008) and barley seeds (Frank et al., 2011).
C14:0
0
1000
2000
3000
4000
5000C16:0
050000
150000
250000
350000C18:0
0
30000
60000
90000
C22:0
0
5000
15000
25000
0 24 48 75time [h]
C23:0
0
2000
4000
6000
0 24 48 75time [h]
C20:1
0500
2500
4500
0 24 48 75time [h]
peak
heig
ht[m
V]pe
akhe
ight
[mV]
Figure 25: Changes of standardized peak heights for selected compounds in
fraction I (saturated and unsaturated fatty acid methyl esters,
hydrocarbon) during sprouting of mung beans at 25°C (•) and 35°C (•).
4.3.4.2 Fraction II
PCA scores plots illustrating the courses of sprouting mung beans incubated at
different tempertures are shown in Figure 26. For the PCA showing the combined
treatments (Figure 26A), a total variance of 55% can be explained by the first two
PCs. The total variance explained by PC1 and PC2 is considerably lower than for the
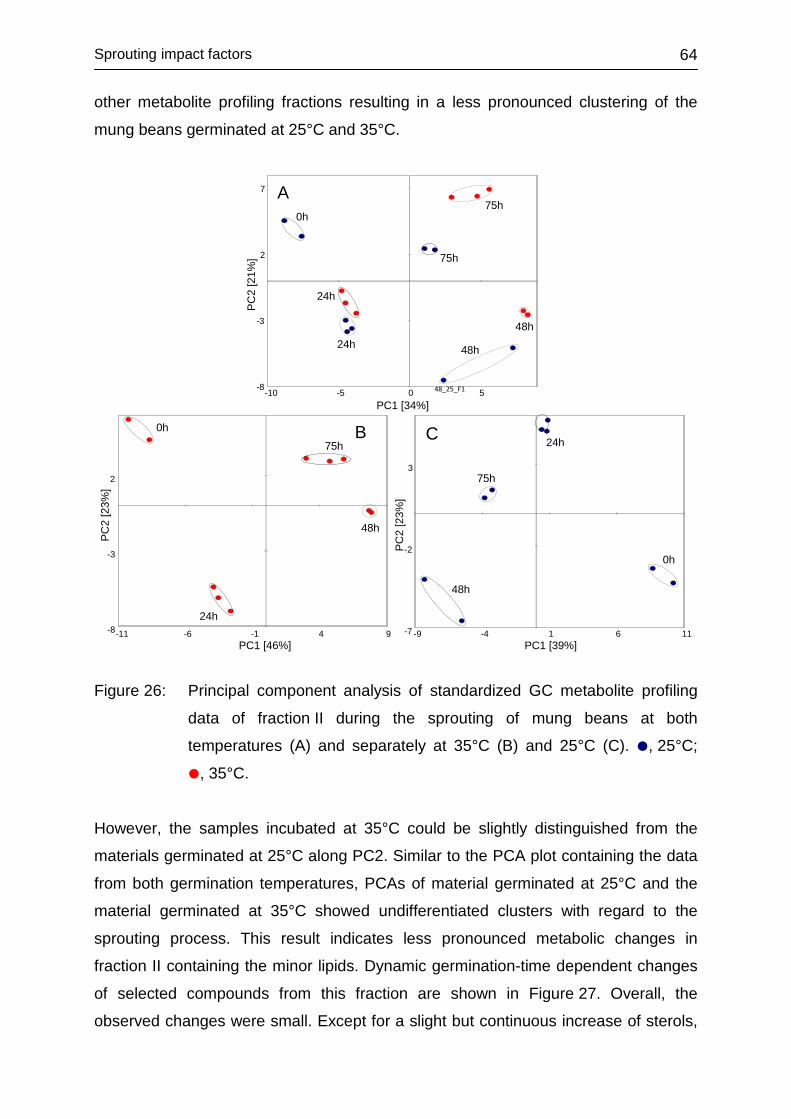
Sprouting impact factors
64
other metabolite profiling fractions resulting in a less pronounced clustering of the
mung beans germinated at 25°C and 35°C.
-8
-3
2
-11 -6 -1 4 9PC1 [46%]
PC2
[23%
]
24h
0h
48h
75h
48_25_F1-8
-3
2
7
-10 -5 0 5PC1 [34%]
PC2
[21%
]
75h
48h
48h
75h
0h
24h
24h
-7
-2
3
-9 -4 1 6 11PC1 [39%]
PC2
[23%
]
48h
0h
24h
75h
A
B C
Figure 26: Principal component analysis of standardized GC metabolite profiling
data of fraction II during the sprouting of mung beans at both
temperatures (A) and separately at 35°C (B) and 25°C (C). , 25°C;
, 35°C.
However, the samples incubated at 35°C could be slightly distinguished from the
materials germinated at 25°C along PC2. Similar to the PCA plot containing the data
from both germination temperatures, PCAs of material germinated at 25°C and the
material germinated at 35°C showed undifferentiated clusters with regard to the
sprouting process. This result indicates less pronounced metabolic changes in
fraction II containing the minor lipids. Dynamic germination-time dependent changes
of selected compounds from this fraction are shown in Figure 27. Overall, the
observed changes were small. Except for a slight but continuous increase of sterols,
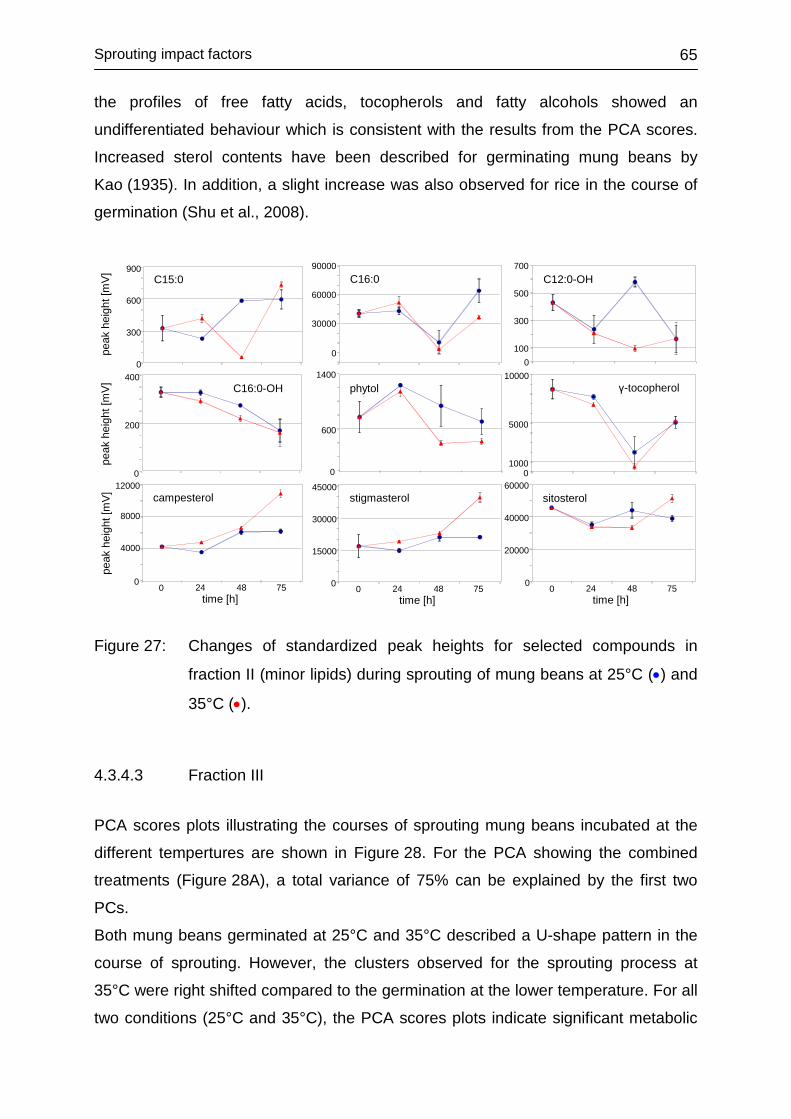
Sprouting impact factors
65
the profiles of free fatty acids, tocopherols and fatty alcohols showed an
undifferentiated behaviour which is consistent with the results from the PCA scores.
Increased sterol contents have been described for germinating mung beans by
Kao (1935). In addition, a slight increase was also observed for rice in the course of
germination (Shu et al., 2008).
C15:0
0
300
600
900C16:0
0
30000
60000
90000C12:0-OH
0100
300
500
700
C16:0-OH
0
200
400phytol
0
600
1400
01000
5000
10000γ-tocopherol
campesterol
0
4000
8000
12000
0 24 48 75time [h]
stigmasterol
0
15000
30000
45000
0 24 48 75time [h]
sitosterol
0
20000
40000
60000
0 24 48 75time [h]
peak
heig
ht[m
V]pe
akhe
ight
[mV]
peak
heig
ht[m
V]
Figure 27: Changes of standardized peak heights for selected compounds in
fraction II (minor lipids) during sprouting of mung beans at 25°C (•) and
35°C (•).
4.3.4.3 Fraction III
PCA scores plots illustrating the courses of sprouting mung beans incubated at the
different tempertures are shown in Figure 28. For the PCA showing the combined
treatments (Figure 28A), a total variance of 75% can be explained by the first two
PCs.
Both mung beans germinated at 25°C and 35°C described a U-shape pattern in the
course of sprouting. However, the clusters observed for the sprouting process at
35°C were right shifted compared to the germination at the lower temperature. For all
two conditions (25°C and 35°C), the PCA scores plots indicate significant metabolic
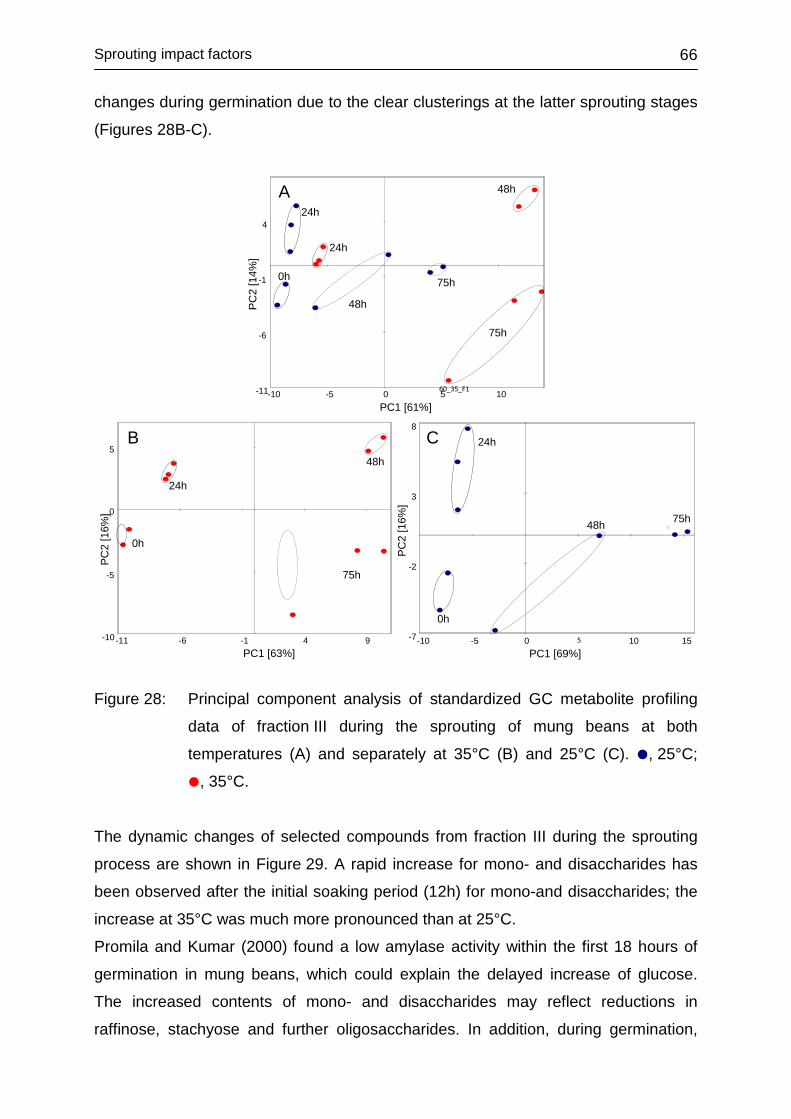
Sprouting impact factors
66
changes during germination due to the clear clusterings at the latter sprouting stages
(Figures 28B-C).
-7
-2
3
8
-10 -5 0 5 10 15
PC2
[16%
]
PC1 [69%]
48h
0h
24h
75h
-10
-5
0
5
-11 -6 -1 4 9
PC2
[16%
]
PC1 [63%]
24h
0h
48h
75h
60_35_F1-11
-6
-1
4
-10 -5 0 5 10PC1 [61%]
PC2
[14%
]
75h
48h
48h
75h
0h
24h
24h
A
B C
Figure 28: Principal component analysis of standardized GC metabolite profiling
data of fraction III during the sprouting of mung beans at both
temperatures (A) and separately at 35°C (B) and 25°C (C). , 25°C;
, 35°C.
The dynamic changes of selected compounds from fraction III during the sprouting
process are shown in Figure 29. A rapid increase for mono- and disaccharides has
been observed after the initial soaking period (12h) for mono-and disaccharides; the
increase at 35°C was much more pronounced than at 25°C.
Promila and Kumar (2000) found a low amylase activity within the first 18 hours of
germination in mung beans, which could explain the delayed increase of glucose.
The increased contents of mono- and disaccharides may reflect reductions in
raffinose, stachyose and further oligosaccharides. In addition, during germination,
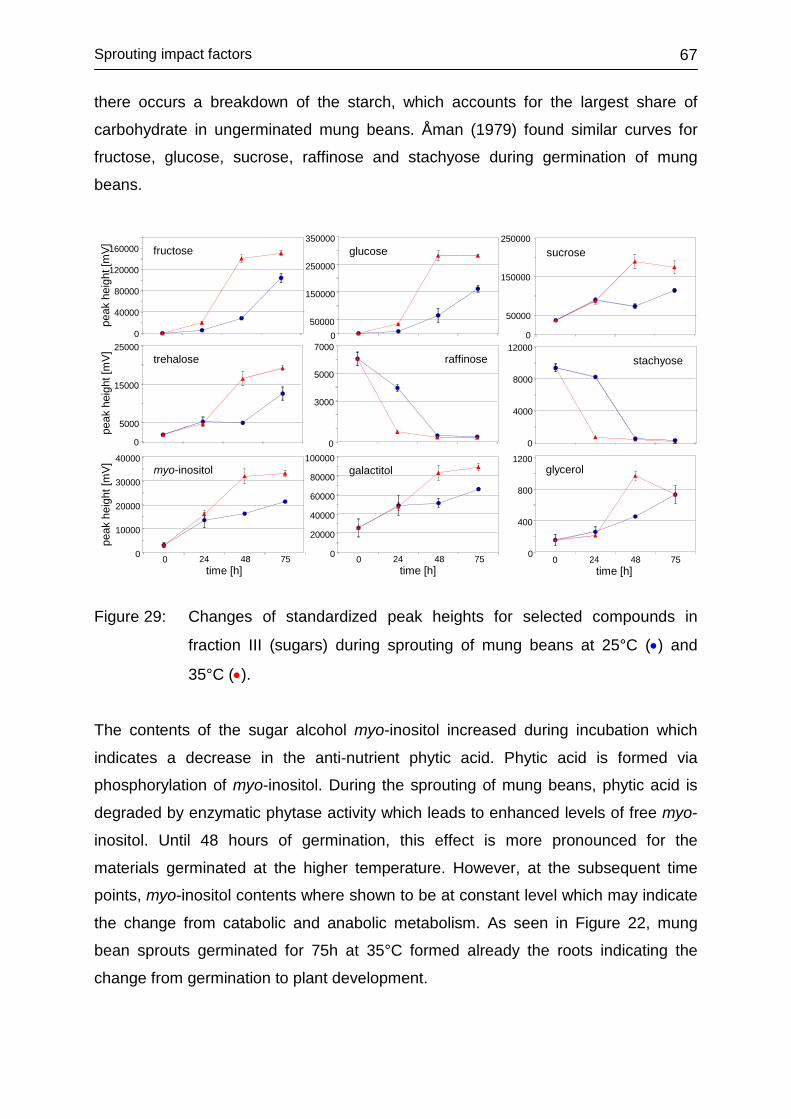
Sprouting impact factors
67
there occurs a breakdown of the starch, which accounts for the largest share of
carbohydrate in ungerminated mung beans. Åman (1979) found similar curves for
fructose, glucose, sucrose, raffinose and stachyose during germination of mung
beans.
fructose
0
40000
80000
120000
160000 glucose
050000
150000
250000
350000sucrose
0
50000
150000
250000
trehalose
0
5000
15000
25000raffinose
0
3000
5000
7000stachyose
0
4000
8000
12000
myo-inositol
0
10000
20000
30000
40000
0 24 48 75time [h]
galactitol
0
20000
40000
60000
80000
100000
0 24 48 75time [h]
glycerol
0
400
800
1200
0 24 48 75time [h]
peak
heig
ht[m
V]pe
ak h
eigh
t [m
V]pe
akhe
ight
[mV]
Figure 29: Changes of standardized peak heights for selected compounds in
fraction III (sugars) during sprouting of mung beans at 25°C (•) and
35°C (•).
The contents of the sugar alcohol myo-inositol increased during incubation which
indicates a decrease in the anti-nutrient phytic acid. Phytic acid is formed via
phosphorylation of myo-inositol. During the sprouting of mung beans, phytic acid is
degraded by enzymatic phytase activity which leads to enhanced levels of free myo-
inositol. Until 48 hours of germination, this effect is more pronounced for the
materials germinated at the higher temperature. However, at the subsequent time
points, myo-inositol contents where shown to be at constant level which may indicate
the change from catabolic and anabolic metabolism. As seen in Figure 22, mung
bean sprouts germinated for 75h at 35°C formed already the roots indicating the
change from germination to plant development.
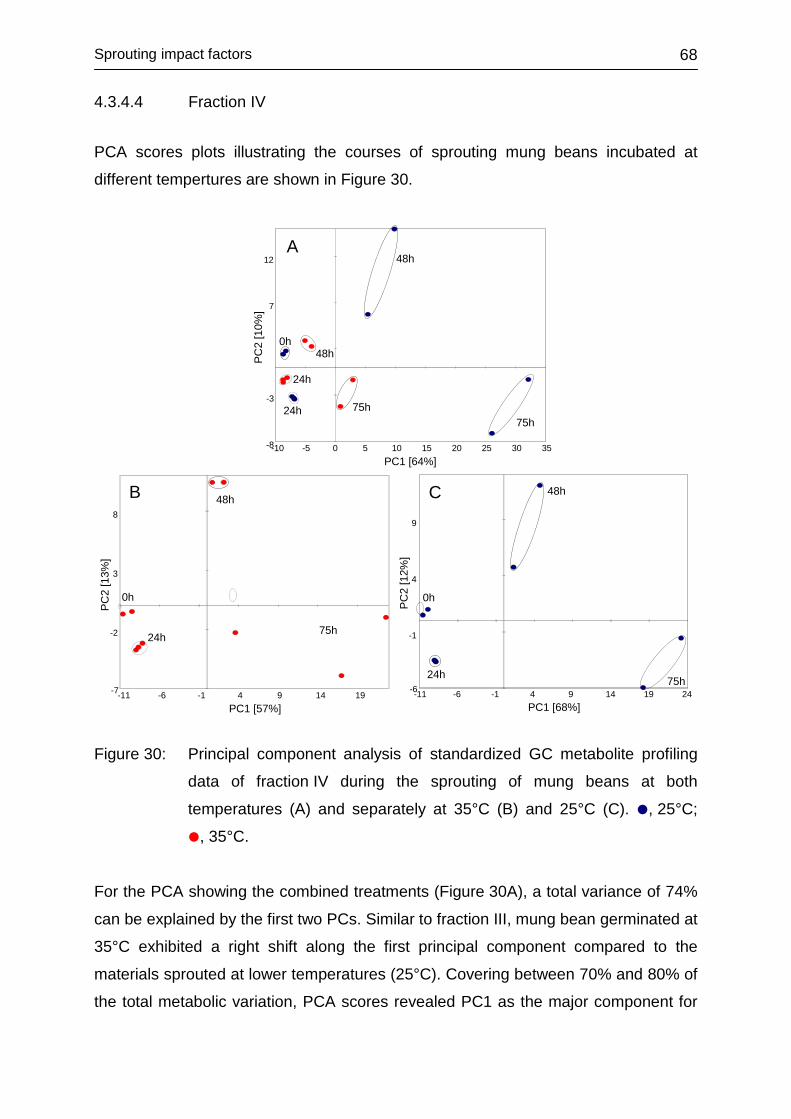
Sprouting impact factors
68
4.3.4.4 Fraction IV
PCA scores plots illustrating the courses of sprouting mung beans incubated at
different tempertures are shown in Figure 30.
-6
-1
4
9
-11 -6 -1 4 9 14 19 24PC1 [68%]
PC2
[12%
]
48h
0h
24h 75h-7
-2
3
8
-11 -6 -1 4 9 14 19PC1 [57%]
PC2
[13%
]
24h
0h
48h
75h
A
B C
-8
-3
7
12
-10 -5 0 5 10 15 20 25 30 35PC1 [64%]
PC2
[10%
]
75h
48h
48h
75h
0h
24h
24h
Figure 30: Principal component analysis of standardized GC metabolite profiling
data of fraction IV during the sprouting of mung beans at both
temperatures (A) and separately at 35°C (B) and 25°C (C). , 25°C;
, 35°C.
For the PCA showing the combined treatments (Figure 30A), a total variance of 74%
can be explained by the first two PCs. Similar to fraction III, mung bean germinated at
35°C exhibited a right shift along the first principal component compared to the
materials sprouted at lower temperatures (25°C). Covering between 70% and 80% of
the total metabolic variation, PCA scores revealed PC1 as the major component for
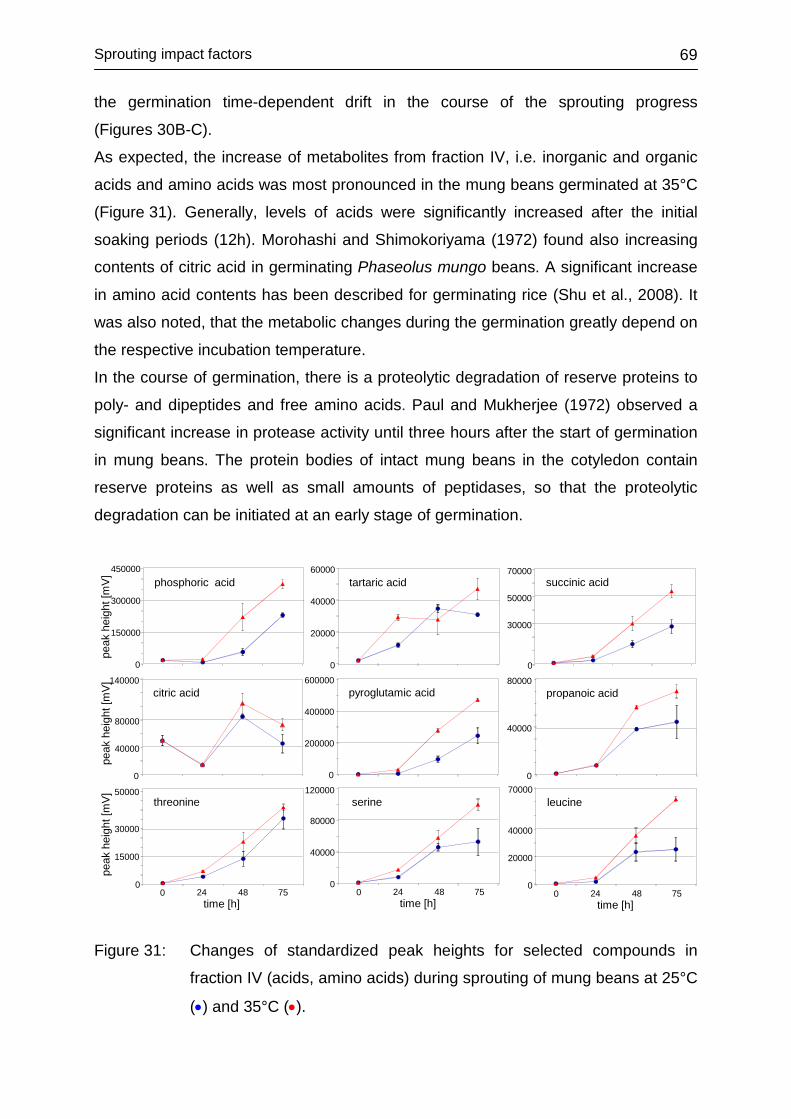
Sprouting impact factors
69
the germination time-dependent drift in the course of the sprouting progress
(Figures 30B-C).
As expected, the increase of metabolites from fraction IV, i.e. inorganic and organic
acids and amino acids was most pronounced in the mung beans germinated at 35°C
(Figure 31). Generally, levels of acids were significantly increased after the initial
soaking periods (12h). Morohashi and Shimokoriyama (1972) found also increasing
contents of citric acid in germinating Phaseolus mungo beans. A significant increase
in amino acid contents has been described for germinating rice (Shu et al., 2008). It
was also noted, that the metabolic changes during the germination greatly depend on
the respective incubation temperature.
In the course of germination, there is a proteolytic degradation of reserve proteins to
poly- and dipeptides and free amino acids. Paul and Mukherjee (1972) observed a
significant increase in protease activity until three hours after the start of germination
in mung beans. The protein bodies of intact mung beans in the cotyledon contain
reserve proteins as well as small amounts of peptidases, so that the proteolytic
degradation can be initiated at an early stage of germination.
phosphoric acid
0
150000
300000
450000tartaric acid
0
20000
40000
60000succinic acid
0
30000
50000
70000
citric acid
0
40000
80000
140000pyroglutamic acid
0
200000
400000
600000propanoic acid
0
40000
80000
leucine
0
20000
40000
70000
0 24 48 75time [h]
threonine
0
15000
30000
50000
0 24 48 75time [h]
serine
0
40000
80000
120000
0 24 48 75time [h]
peak
heig
ht[m
V]pe
akhe
ight
[mV]
peak
hei
ght [
mV]
Figure 31: Changes of standardized peak heights for selected compounds in
fraction IV (acids, amino acids) during sprouting of mung beans at 25°C
(•) and 35°C (•).

Sprouting impact factors
70
4.3.4.5 Conclusions
The results obtained by the sprouting of mung beans at 25°C and 35°C confirm the
considerable influence of the incubation temperature on the time-dependent
metabolic changes. The mung beans sprouted at the higher temperature exhibited an
accelerated metabolism resulting in metabolic changes at a very early stage of the
sprouting process. The fast sprouting progress led to an early increase of nutritionally
relevant metabolites, such as monosaccharides and free amino acids; whereas the
levels of less desired tri- and tetrasaccharides were quickly reduced.
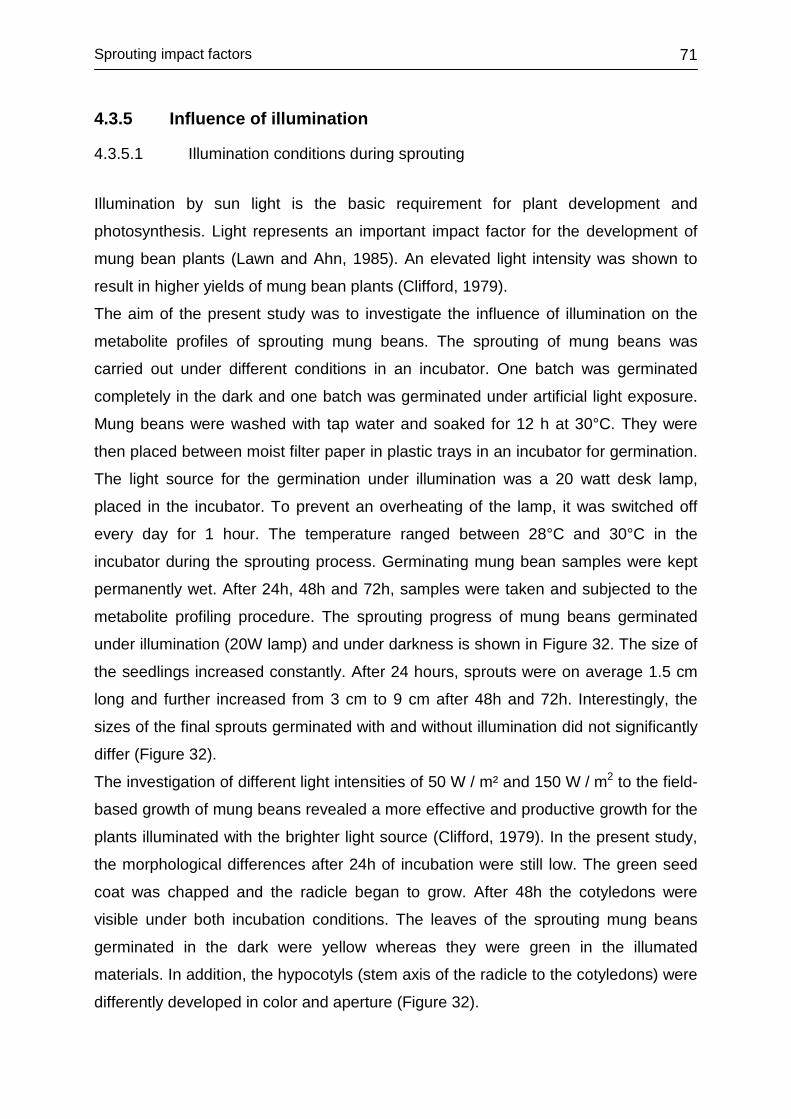
Sprouting impact factors
71
4.3.5 Influence of illumination
4.3.5.1 Illumination conditions during sprouting
Illumination by sun light is the basic requirement for plant development and
photosynthesis. Light represents an important impact factor for the development of
mung bean plants (Lawn and Ahn, 1985). An elevated light intensity was shown to
result in higher yields of mung bean plants (Clifford, 1979).
The aim of the present study was to investigate the influence of illumination on the
metabolite profiles of sprouting mung beans. The sprouting of mung beans was
carried out under different conditions in an incubator. One batch was germinated
completely in the dark and one batch was germinated under artificial light exposure.
Mung beans were washed with tap water and soaked for 12 h at 30°C. They were
then placed between moist filter paper in plastic trays in an incubator for germination.
The light source for the germination under illumination was a 20 watt desk lamp,
placed in the incubator. To prevent an overheating of the lamp, it was switched off
every day for 1 hour. The temperature ranged between 28°C and 30°C in the
incubator during the sprouting process. Germinating mung bean samples were kept
permanently wet. After 24h, 48h and 72h, samples were taken and subjected to the
metabolite profiling procedure. The sprouting progress of mung beans germinated
under illumination (20W lamp) and under darkness is shown in Figure 32. The size of
the seedlings increased constantly. After 24 hours, sprouts were on average 1.5 cm
long and further increased from 3 cm to 9 cm after 48h and 72h. Interestingly, the
sizes of the final sprouts germinated with and without illumination did not significantly
differ (Figure 32).
The investigation of different light intensities of 50 W / m² and 150 W / m2 to the field-
based growth of mung beans revealed a more effective and productive growth for the
plants illuminated with the brighter light source (Clifford, 1979). In the present study,
the morphological differences after 24h of incubation were still low. The green seed
coat was chapped and the radicle began to grow. After 48h the cotyledons were
visible under both incubation conditions. The leaves of the sprouting mung beans
germinated in the dark were yellow whereas they were green in the illumated
materials. In addition, the hypocotyls (stem axis of the radicle to the cotyledons) were
differently developed in color and aperture (Figure 32).
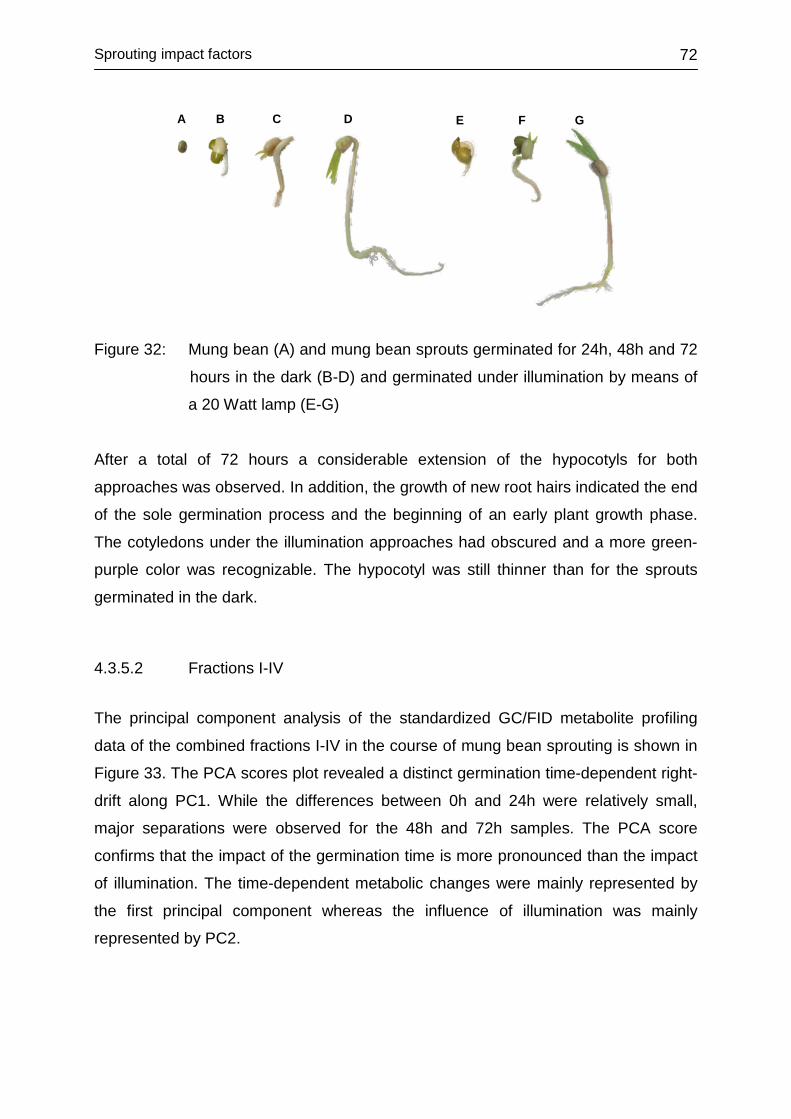
Sprouting impact factors
72
A B C D E F G
Figure 32: Mung bean (A) and mung bean sprouts germinated for 24h, 48h and 72
hours in the dark (B-D) and germinated under illumination by means of
a 20 Watt lamp (E-G)
After a total of 72 hours a considerable extension of the hypocotyls for both
approaches was observed. In addition, the growth of new root hairs indicated the end
of the sole germination process and the beginning of an early plant growth phase.
The cotyledons under the illumination approaches had obscured and a more green-
purple color was recognizable. The hypocotyl was still thinner than for the sprouts
germinated in the dark.
4.3.5.2 Fractions I-IV
The principal component analysis of the standardized GC/FID metabolite profiling
data of the combined fractions I-IV in the course of mung bean sprouting is shown in
Figure 33. The PCA scores plot revealed a distinct germination time-dependent right-
drift along PC1. While the differences between 0h and 24h were relatively small,
major separations were observed for the 48h and 72h samples. The PCA score
confirms that the impact of the germination time is more pronounced than the impact
of illumination. The time-dependent metabolic changes were mainly represented by
the first principal component whereas the influence of illumination was mainly
represented by PC2.
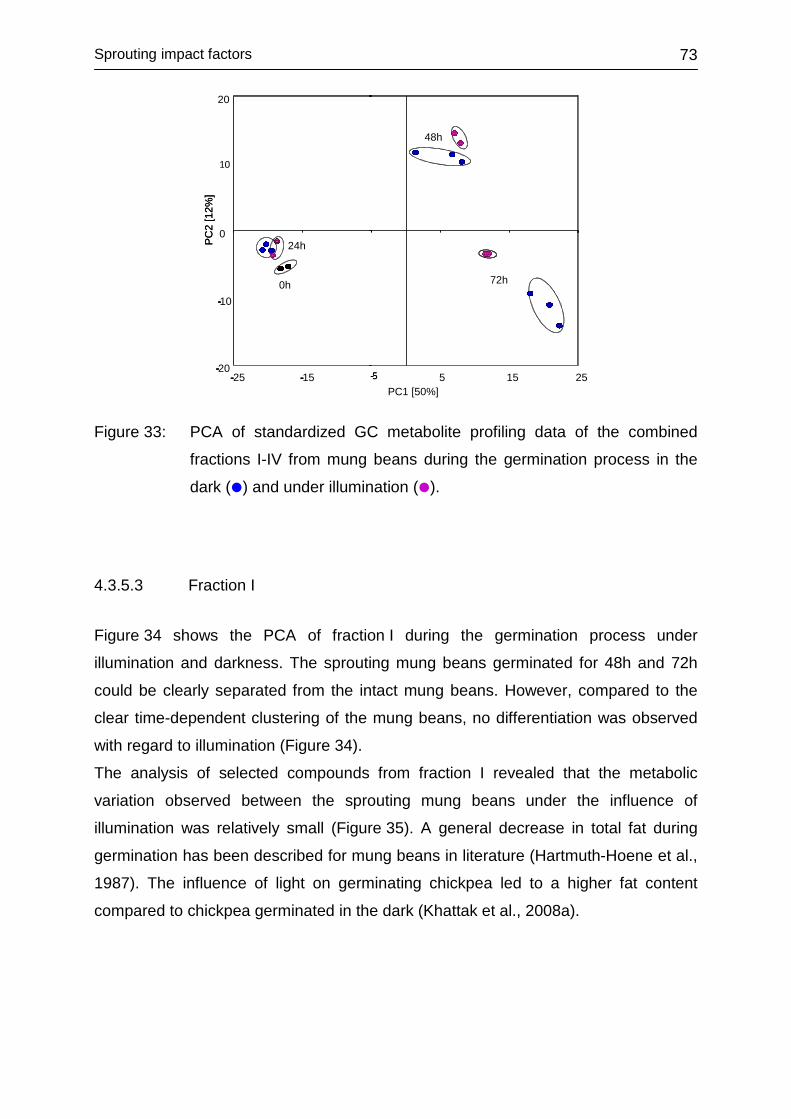
Sprouting impact factors
73
-20
-10
0
10
20
-25 -15 -5 5 15 25PC1 [50%]
0h
48h
24h
72h
PC2
[12%
]
-
-
- - -5-
-
- - -
PC2
[12%
]
-
-
- -
Figure 33: PCA of standardized GC metabolite profiling data of the combined
fractions I-IV from mung beans during the germination process in the
dark () and under illumination ().
4.3.5.3 Fraction I
Figure 34 shows the PCA of fraction I during the germination process under
illumination and darkness. The sprouting mung beans germinated for 48h and 72h
could be clearly separated from the intact mung beans. However, compared to the
clear time-dependent clustering of the mung beans, no differentiation was observed
with regard to illumination (Figure 34).
The analysis of selected compounds from fraction I revealed that the metabolic
variation observed between the sprouting mung beans under the influence of
illumination was relatively small (Figure 35). A general decrease in total fat during
germination has been described for mung beans in literature (Hartmuth-Hoene et al.,
1987). The influence of light on germinating chickpea led to a higher fat content
compared to chickpea germinated in the dark (Khattak et al., 2008a).
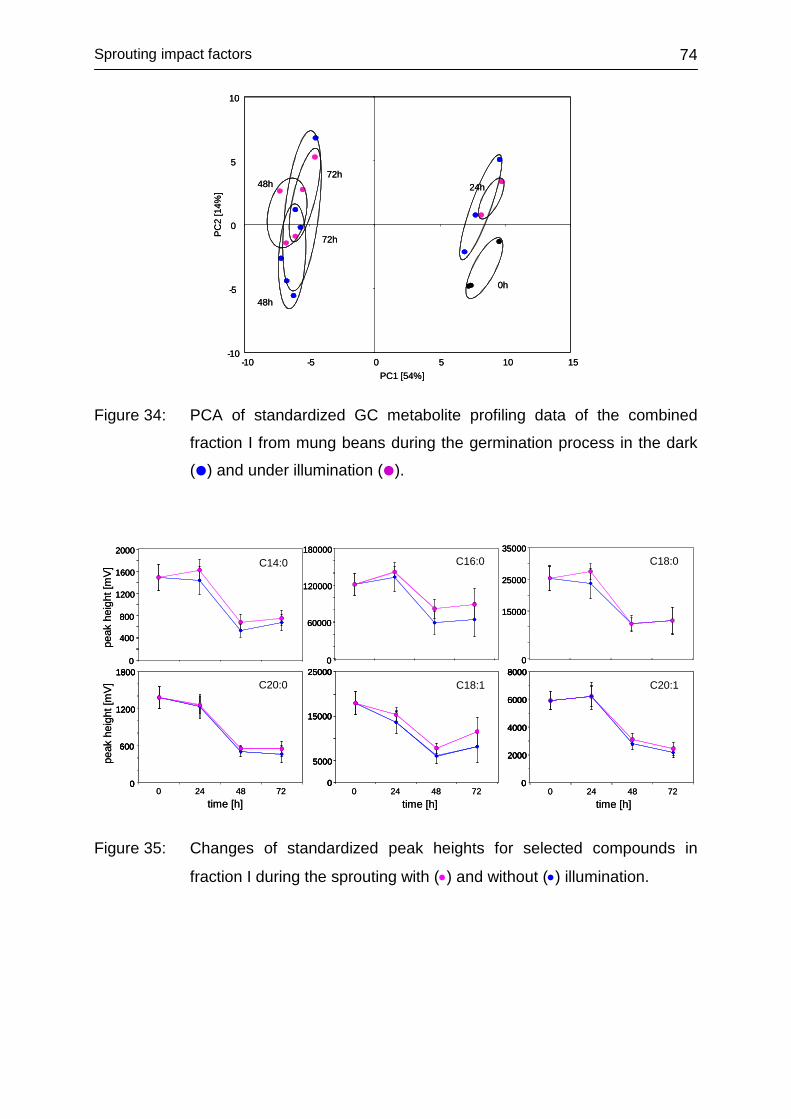
Sprouting impact factors
74
-10
-5
0
5
10
-10 -5 0 5 10 15PC1 [54%]
PC
2 [1
4%]
0h
48h 24h72h
48h
72h
-10
-5
0
5
10
-10 -5 0 5 10 15PC1 [54%]
PC
2 [1
4%]
0h
48h 24h72h
48h
72h
Figure 34: PCA of standardized GC metabolite profiling data of the combined
fraction I from mung beans during the germination process in the dark
() and under illumination ().
peak
heig
ht[m
V]pe
akhe
ight
[mV]
0
400
800
1200
1600
2000C14:0
0
60000
120000
180000C16:0
0
15000
25000
35000C18:0
0
600
1200
1800C20:0
0 24 48 72time [h]
0
5000
15000
25000C18:1
0 24 48 72time [h]
0
2000
4000
6000
8000C20:1
0 24 48 72time [h]
peak
heig
ht[m
V]pe
akhe
ight
[mV]
0
400
800
1200
1600
2000
0
400
800
1200
1600
2000C14:0
0
60000
120000
180000
0
60000
120000
180000C16:0
0
15000
25000
35000
0
15000
25000
35000C18:0
0
600
1200
1800C20:0
0
600
1200
1800
0
600
1200
1800C20:0
0 24 48 72time [h]
0
5000
15000
25000C18:1
0
5000
15000
25000
0
5000
15000
25000C18:1
0 24 48 72time [h]
0
2000
4000
6000
8000C20:1
0
2000
4000
6000
8000
0
2000
4000
6000
8000C20:1
0 24 48 72time [h]
Figure 35: Changes of standardized peak heights for selected compounds in
fraction I during the sprouting with (•) and without (•) illumination.
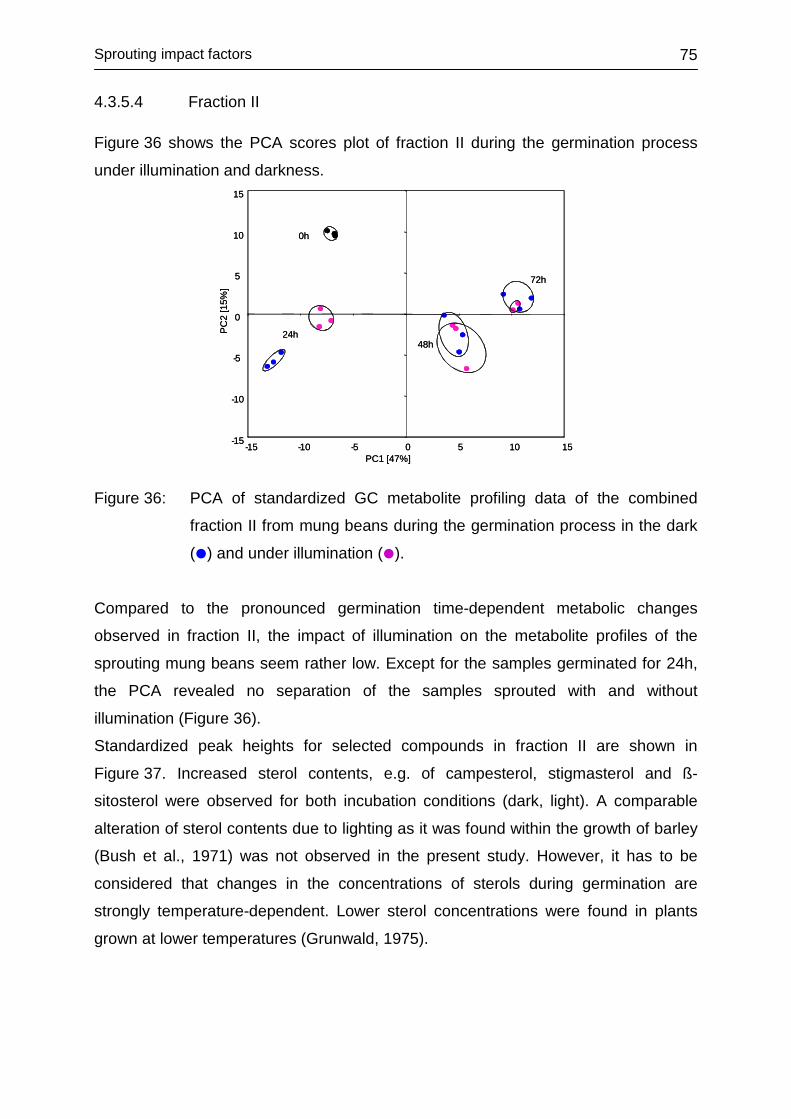
Sprouting impact factors
75
4.3.5.4 Fraction II Figure 36 shows the PCA scores plot of fraction II during the germination process
under illumination and darkness.
-15
-10
-5
0
5
10
15
-15 -10 -5 0 5 10 15PC1 [47%]
PC
2 [1
5%]
48h24h
0h
72h
-15
-10
-5
0
5
10
15
-15 -10 -5 0 5 10 15PC1 [47%]
PC
2 [1
5%]
48h24h
0h
72h
Figure 36: PCA of standardized GC metabolite profiling data of the combined
fraction II from mung beans during the germination process in the dark
() and under illumination ().
Compared to the pronounced germination time-dependent metabolic changes
observed in fraction II, the impact of illumination on the metabolite profiles of the
sprouting mung beans seem rather low. Except for the samples germinated for 24h,
the PCA revealed no separation of the samples sprouted with and without
illumination (Figure 36).
Standardized peak heights for selected compounds in fraction II are shown in
Figure 37. Increased sterol contents, e.g. of campesterol, stigmasterol and ß-
sitosterol were observed for both incubation conditions (dark, light). A comparable
alteration of sterol contents due to lighting as it was found within the growth of barley
(Bush et al., 1971) was not observed in the present study. However, it has to be
considered that changes in the concentrations of sterols during germination are
strongly temperature-dependent. Lower sterol concentrations were found in plants
grown at lower temperatures (Grunwald, 1975).
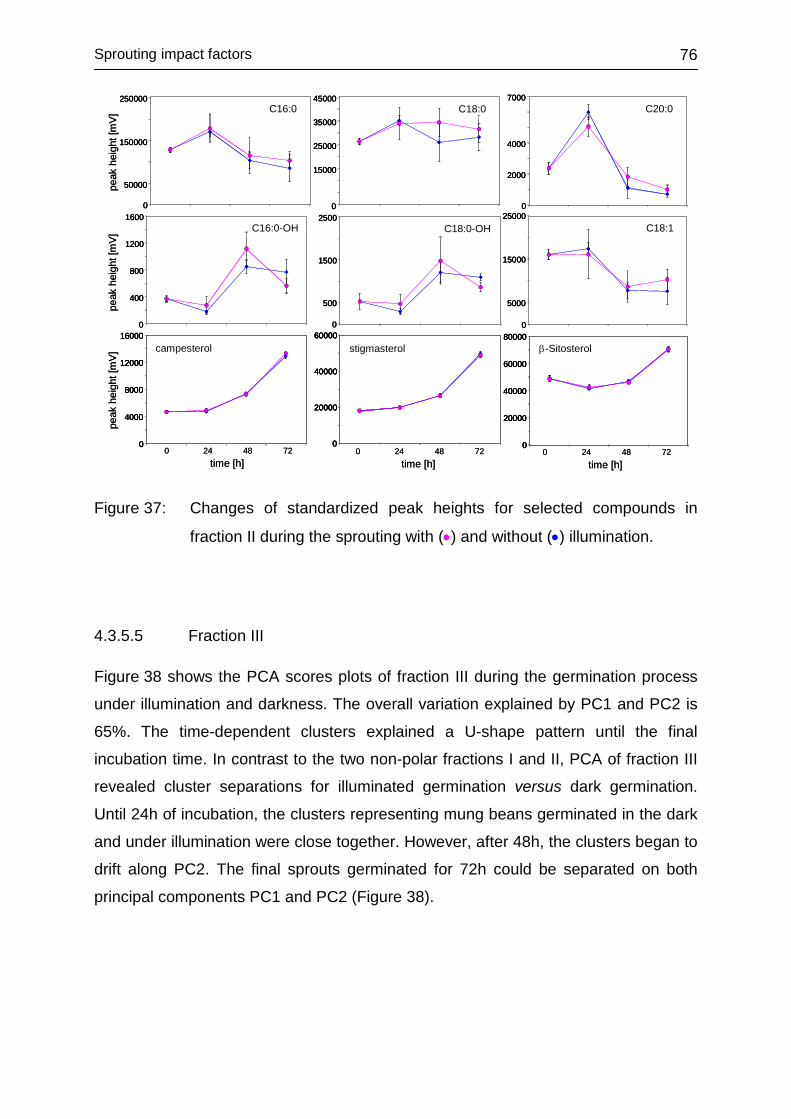
Sprouting impact factors
76
peak
heig
ht[m
V]pe
akhe
ight
[mV]
peak
heig
ht[m
V]
0
50000
150000
250000C16:0 C18:0
0
15000
25000
35000
45000
0
2000
4000
7000C20:0
C16:0-OH
0
400
800
1200
1600C18:0-OH
0
500
1500
2500
0
5000
15000
25000C18:1
0
4000
8000
12000
16000campesterol
0 24 48 72time [h]
0
20000
40000
60000stigmasterol
0 24 48 72time [h]
0
20000
40000
60000
80000β-Sitosterol
0 24 48 72time [h]
peak
heig
ht[m
V]pe
akhe
ight
[mV]
peak
heig
ht[m
V]
0
50000
150000
250000
0
50000
150000
250000C16:0 C18:0
0
15000
25000
35000
45000
0
15000
25000
35000
45000
0
2000
4000
7000
0
2000
4000
7000C20:0
C16:0-OH
0
400
800
1200
1600
0
400
800
1200
1600C18:0-OH
0
500
1500
2500
0
500
1500
2500
0
5000
15000
25000
0
5000
15000
25000C18:1
0
4000
8000
12000
16000campesterol
0
4000
8000
12000
16000
0
4000
8000
12000
16000campesterol
0 24 48 72time [h]
0
20000
40000
60000stigmasterol
0
20000
40000
60000
0
20000
40000
60000stigmasterol
0 24 48 72time [h]
0
20000
40000
60000
80000β-Sitosterol
0
20000
40000
60000
80000
0
20000
40000
60000
80000β-Sitosterol
0 24 48 72time [h]
Figure 37: Changes of standardized peak heights for selected compounds in
fraction II during the sprouting with (•) and without (•) illumination.
4.3.5.5 Fraction III Figure 38 shows the PCA scores plots of fraction III during the germination process
under illumination and darkness. The overall variation explained by PC1 and PC2 is
65%. The time-dependent clusters explained a U-shape pattern until the final
incubation time. In contrast to the two non-polar fractions I and II, PCA of fraction III
revealed cluster separations for illuminated germination versus dark germination.
Until 24h of incubation, the clusters representing mung beans germinated in the dark
and under illumination were close together. However, after 48h, the clusters began to
drift along PC2. The final sprouts germinated for 72h could be separated on both
principal components PC1 and PC2 (Figure 38).
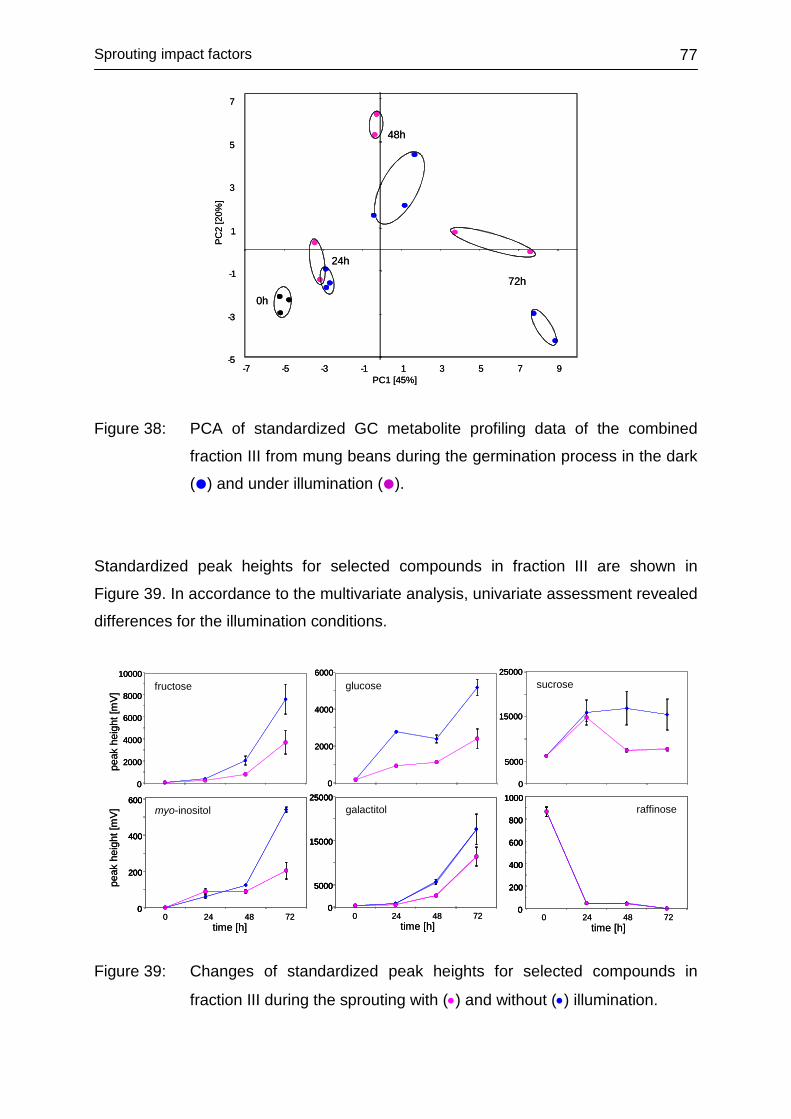
Sprouting impact factors
77
-5
-3
-1
1
3
5
7
-7 -5 -3 -1 1 3 5 7 9PC1 [45%]
PC
2 [2
0%]
24h
0h
48h
72h
-5
-3
-1
1
3
5
7
-7 -5 -3 -1 1 3 5 7 9PC1 [45%]
PC
2 [2
0%]
24h
0h
48h
72h
Figure 38: PCA of standardized GC metabolite profiling data of the combined
fraction III from mung beans during the germination process in the dark
() and under illumination ().
Standardized peak heights for selected compounds in fraction III are shown in
Figure 39. In accordance to the multivariate analysis, univariate assessment revealed
differences for the illumination conditions.
peak
heig
ht[m
V]pe
akhe
ight
[mV]
0
2000
4000
6000
8000
10000fructose
0
2000
4000
6000glucose
0
5000
15000
25000sucrose
0
200
400
600
800
1000raffinose
0 24 48 72time [h]
0
200
400
600myo-inositol
0 24 48 72time [h]
0
5000
15000
25000galactitol
0 24 48 72time [h]
peak
heig
ht[m
V]pe
akhe
ight
[mV]
0
2000
4000
6000
8000
10000
0
2000
4000
6000
8000
10000fructose
0
2000
4000
6000
0
2000
4000
6000glucose
0
5000
15000
25000
0
5000
15000
25000sucrose
0
200
400
600
800
1000raffinose
0
200
400
600
800
1000
0
200
400
600
800
1000raffinose
0 24 48 72time [h]
0
200
400
600myo-inositol
0
200
400
600
0
200
400
600myo-inositol
0 24 48 72time [h]
0
5000
15000
25000galactitol
0
5000
15000
25000
0
5000
15000
25000galactitol
0 24 48 72time [h]
Figure 39: Changes of standardized peak heights for selected compounds in
fraction III during the sprouting with (•) and without (•) illumination.
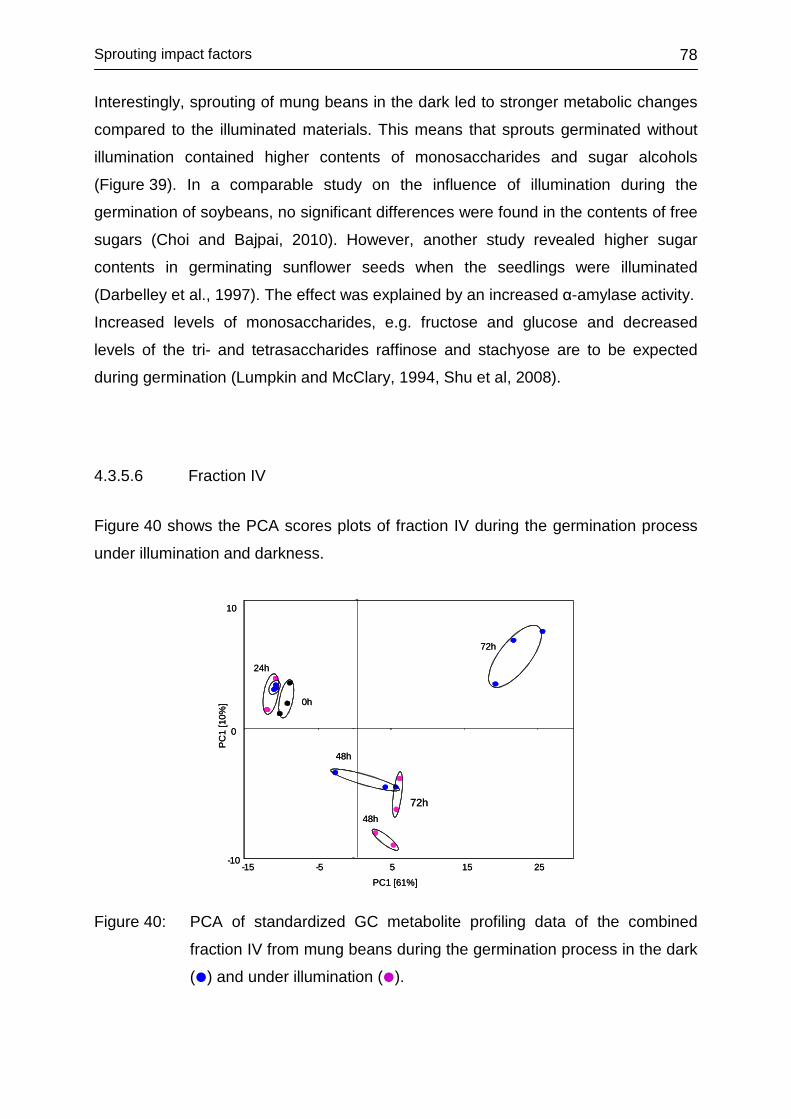
Sprouting impact factors
78
Interestingly, sprouting of mung beans in the dark led to stronger metabolic changes
compared to the illuminated materials. This means that sprouts germinated without
illumination contained higher contents of monosaccharides and sugar alcohols
(Figure 39). In a comparable study on the influence of illumination during the
germination of soybeans, no significant differences were found in the contents of free
sugars (Choi and Bajpai, 2010). However, another study revealed higher sugar
contents in germinating sunflower seeds when the seedlings were illuminated
(Darbelley et al., 1997). The effect was explained by an increased α-amylase activity.
Increased levels of monosaccharides, e.g. fructose and glucose and decreased
levels of the tri- and tetrasaccharides raffinose and stachyose are to be expected
during germination (Lumpkin and McClary, 1994, Shu et al, 2008).
4.3.5.6 Fraction IV
Figure 40 shows the PCA scores plots of fraction IV during the germination process
under illumination and darkness.
PC
1 [1
0%]
10
-10
0
-15 -5 5 15 25PC1 [61%]
72h
72h
48h
0h
24h
48h
PC
1 [1
0%]
10
-10
0
-15 -5 5 15 25PC1 [61%]
72h
72h
48h
0h
24h
48h
Figure 40: PCA of standardized GC metabolite profiling data of the combined
fraction IV from mung beans during the germination process in the dark
() and under illumination ().
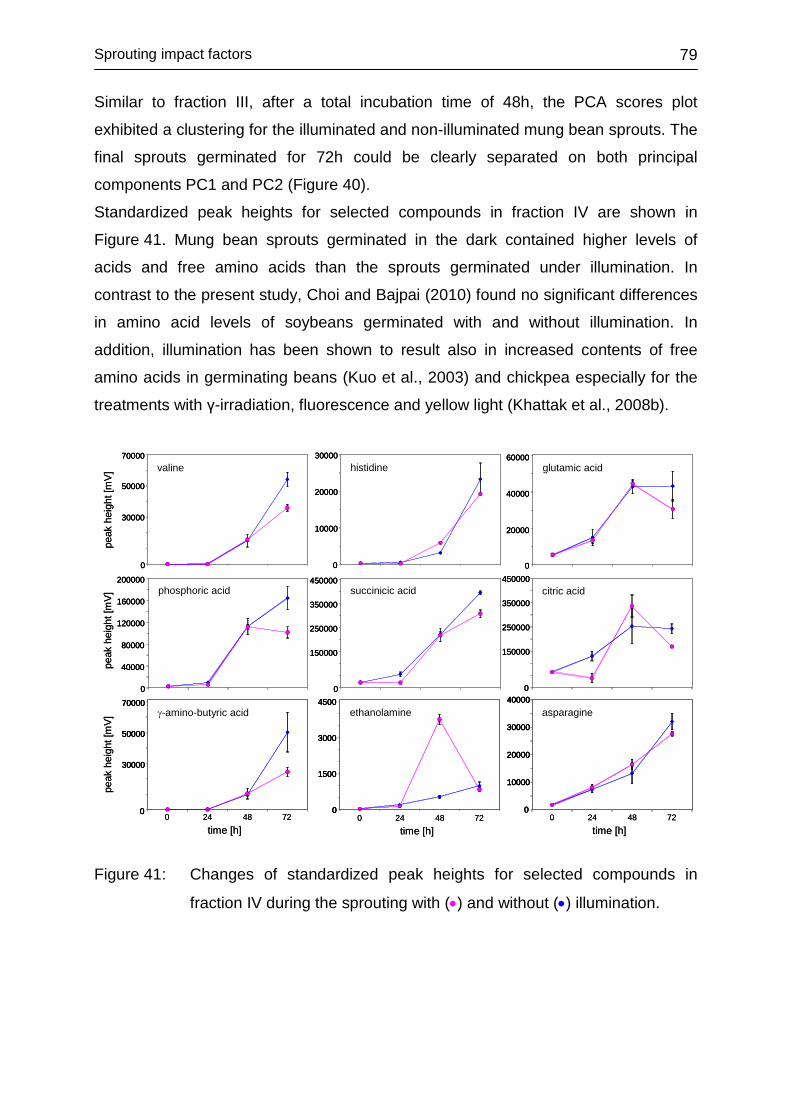
Sprouting impact factors
79
Similar to fraction III, after a total incubation time of 48h, the PCA scores plot
exhibited a clustering for the illuminated and non-illuminated mung bean sprouts. The
final sprouts germinated for 72h could be clearly separated on both principal
components PC1 and PC2 (Figure 40).
Standardized peak heights for selected compounds in fraction IV are shown in
Figure 41. Mung bean sprouts germinated in the dark contained higher levels of
acids and free amino acids than the sprouts germinated under illumination. In
contrast to the present study, Choi and Bajpai (2010) found no significant differences
in amino acid levels of soybeans germinated with and without illumination. In
addition, illumination has been shown to result also in increased contents of free
amino acids in germinating beans (Kuo et al., 2003) and chickpea especially for the
treatments with γ-irradiation, fluorescence and yellow light (Khattak et al., 2008b).
peak
heig
ht[m
V]pe
akhe
ight
[mV]
peak
heig
ht[m
V]
0
30000
50000
70000valine
0
10000
20000
30000histidine
0
20000
40000
60000glutamic acid
0
40000
80000
120000
160000
200000phosphoric acid
0
150000
250000
350000
450000succinicic acid
0
150000
250000
350000
450000citric acid
0
30000
50000
70000γ-amino-butyric acid
0 24 48 72
time [h]
0
1500
3000
4500ethanolamine
0 24 48 72time [h]
0
10000
20000
30000
40000asparagine
0 24 48 72
time [h]
peak
heig
ht[m
V]pe
akhe
ight
[mV]
peak
heig
ht[m
V]
0
30000
50000
70000
0
30000
50000
70000valine
0
10000
20000
30000
0
10000
20000
30000histidine
0
20000
40000
60000
0
20000
40000
60000glutamic acid
0
40000
80000
120000
160000
200000
0
40000
80000
120000
160000
200000phosphoric acid
0
150000
250000
350000
450000
0
150000
250000
350000
450000succinicic acid
0
150000
250000
350000
450000
0
150000
250000
350000
450000citric acid
0
30000
50000
70000γ-amino-butyric acid
0
30000
50000
70000
0
30000
50000
70000γ-amino-butyric acid
0 24 48 72
time [h]
0
1500
3000
4500ethanolamine
0
1500
3000
4500
0
1500
3000
4500ethanolamine
0 24 48 72time [h]
0
10000
20000
30000
40000asparagine
0
10000
20000
30000
40000
0
10000
20000
30000
40000asparagine
0 24 48 72
time [h]
Figure 41: Changes of standardized peak heights for selected compounds in
fraction IV during the sprouting with (•) and without (•) illumination.
Sprouting impact factors
80
4.3.6 Impact of washing
Mung bean sprouts are a widely available food which can be purchased as “ready-to-
eat” product or may be consumed after germinating the mung beans at home (Fery,
2002). Consumable raw sprouts obtained from legumes and cereals may constitute a
potential hazard with respect to microbial contaminations. For mung beans, several
microbial infections have been reported in conjunction with the consumption of raw
sprouts (Mohle-Boetani et al., 2009). Different disinfection procedures, e.g. chemical
sanitation (Munoz et al., 2006), dry heat and irradiation (Bari et al., 2009) have been
tested for their suitability for seed treatments before and after sprouting. However, it
has to be kept in mind that the practical application of most preservation treatments is
restricted by regulations. For example, only few organic acids including citric acid are
allowed in the EU to be used for preservation treatments of organically grown and
produced raw ready-to-eat sprouts (EG 2092/91; EG 834/2007; EG 889/2008).
The aim of the present study was to investigate the influence of washing steps of
mung bean seeds prior and during the sprouting process. Millipore water and
methanol were used as washing agents on a laboratory scale. In addition, the impact
of a industrial-scale mung bean sprouting washing step with citric acid-containing
water was investigated.
4.3.6.1 Laboratory-produced sprouts Mung bean seeds obtained from a local health-food shop were washed and
subsequently soaked for 12 hours in tap water prior to germination at an ambient
temperature of 25°C. In addition, seeds from the same batch were washed with
Millipore water instead of tap water and treated with methanol before soaking and
incubation. Both mung bean seeds were subjected together to the sprouting
procedure. Figure 42 shows the morphological changes in the course of germination
of the differently treated mung beans incubated at 25°C.
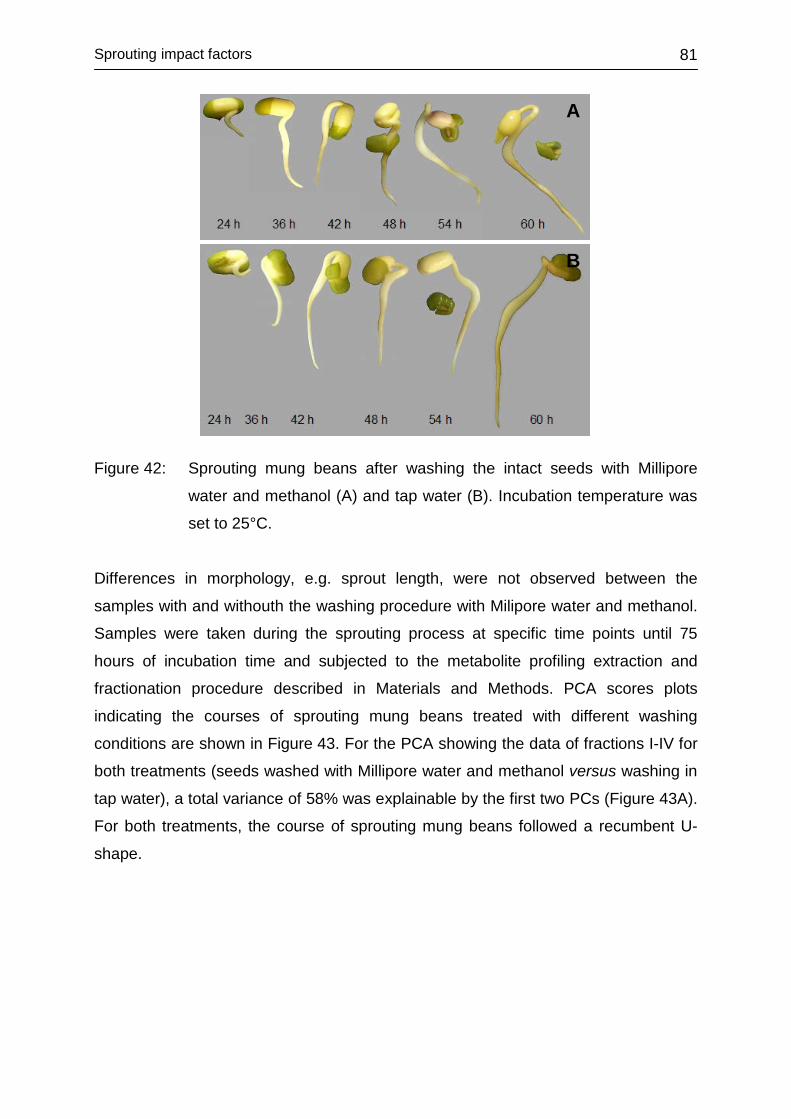
Sprouting impact factors
81
A
B
Figure 42: Sprouting mung beans after washing the intact seeds with Millipore
water and methanol (A) and tap water (B). Incubation temperature was
set to 25°C.
Differences in morphology, e.g. sprout length, were not observed between the
samples with and withouth the washing procedure with Milipore water and methanol.
Samples were taken during the sprouting process at specific time points until 75
hours of incubation time and subjected to the metabolite profiling extraction and
fractionation procedure described in Materials and Methods. PCA scores plots
indicating the courses of sprouting mung beans treated with different washing
conditions are shown in Figure 43. For the PCA showing the data of fractions I-IV for
both treatments (seeds washed with Millipore water and methanol versus washing in
tap water), a total variance of 58% was explainable by the first two PCs (Figure 43A).
For both treatments, the course of sprouting mung beans followed a recumbent U-
shape.
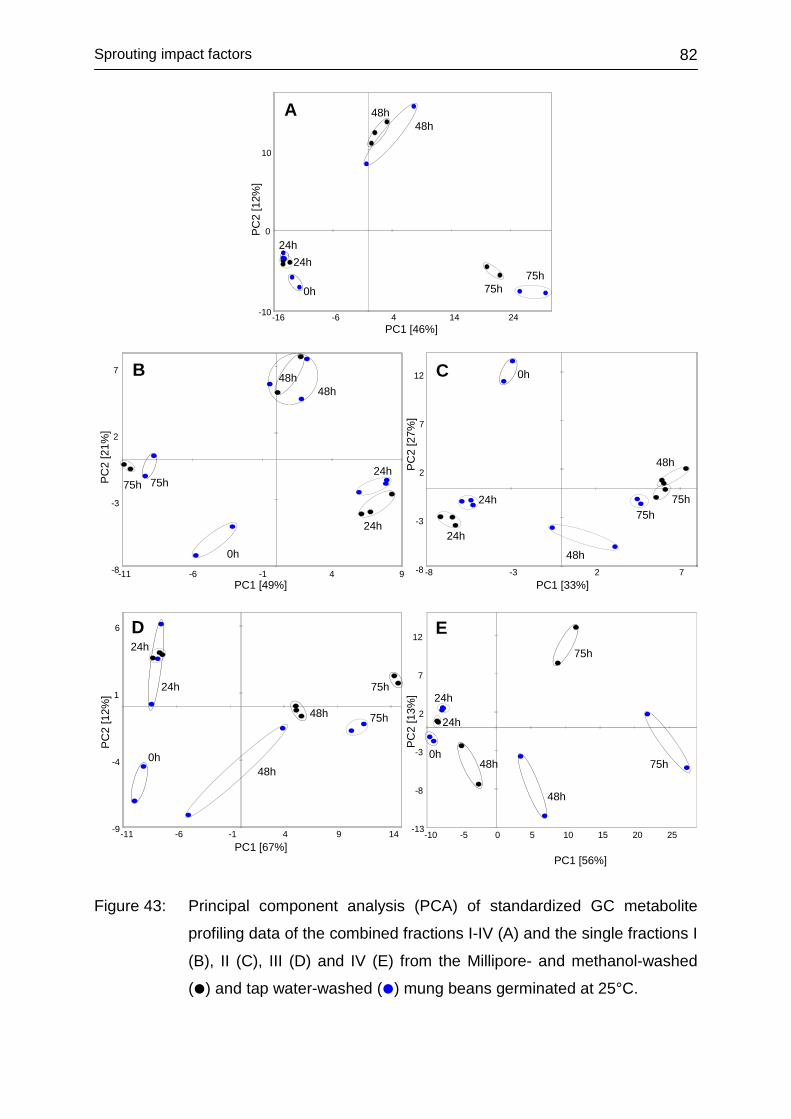
Sprouting impact factors
82
-10
0
10
-16 -6 4 14 24PC1 [46%]
PC2
[12%
]
75h
48h48h
0h
24h
75h
24h
-8
-3
2
7
-11 -6 -1 4 9PC1 [49%]
PC2
[21%
]
75h
0h
48h48h
24h
24h
75h
-9
-4
1
6
-11 -6 -1 4 9 14PC1 [67%]
PC2
[12%
]
24h
0h
24h
48h
48h 75h
75h
-8
-3
2
7
12
-8 -3 2 7PC1 [33%]
PC2
[27%
]
24h
24h
75h75h
48h
0h
48h
-13
-8
-3
2
7
12
-10 -5 0 5 10 15 20 25
PC1 [56%]
PC2
[13%
]
0h48h 75h
48h
75h
24h
24h
A
B C
D E
Figure 43: Principal component analysis (PCA) of standardized GC metabolite
profiling data of the combined fractions I-IV (A) and the single fractions I
(B), II (C), III (D) and IV (E) from the Millipore- and methanol-washed
() and tap water-washed () mung beans germinated at 25°C.
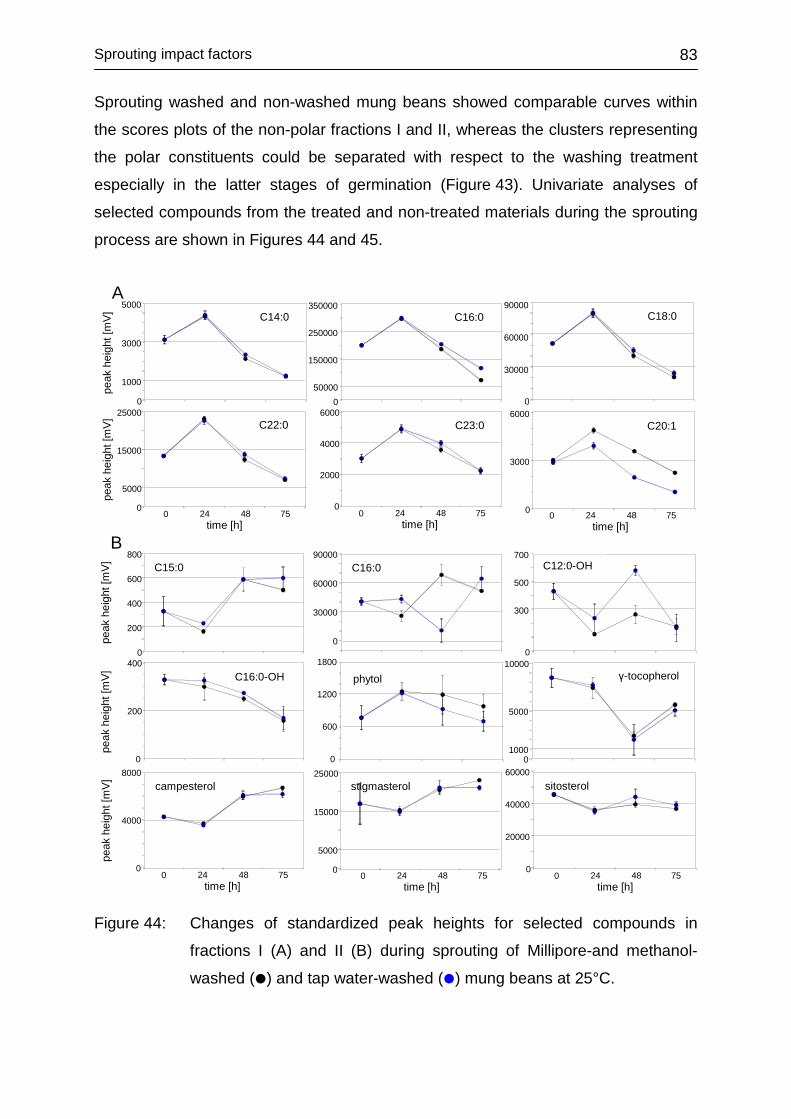
Sprouting impact factors
83
Sprouting washed and non-washed mung beans showed comparable curves within
the scores plots of the non-polar fractions I and II, whereas the clusters representing
the polar constituents could be separated with respect to the washing treatment
especially in the latter stages of germination (Figure 43). Univariate analyses of
selected compounds from the treated and non-treated materials during the sprouting
process are shown in Figures 44 and 45.
peak
heig
ht[m
V]pe
akhe
ight
[mV]
peak
heig
ht[m
V]
C15:0
0
200
400
600
800C16:0
0
30000
60000
90000C12:0-OH
0
300
500
700
C16:0-OH
0
200
400
phytol
0
600
1200
1800γ-tocopherol
01000
5000
10000
campesterol
0
4000
8000
0 24 48 75time [h]
stigmasterol
0
5000
15000
25000
0 24 48 75time [h]
sitosterol
0
20000
40000
60000
0 24 48 75time [h]
B
peak
heig
ht[m
V]pe
akhe
ight
[mV] C14:0
0
1000
3000
5000C16:0
050000
150000
250000
350000C18:0
0
30000
60000
90000
C22:0
0
5000
15000
25000
0 24 48 75time [h]
C23:0
0
2000
4000
6000
0 24 48 75time [h]
C20:1
0
3000
6000
0 24 48 75time [h]
A
Figure 44: Changes of standardized peak heights for selected compounds in
fractions I (A) and II (B) during sprouting of Millipore-and methanol-
washed () and tap water-washed () mung beans at 25°C.
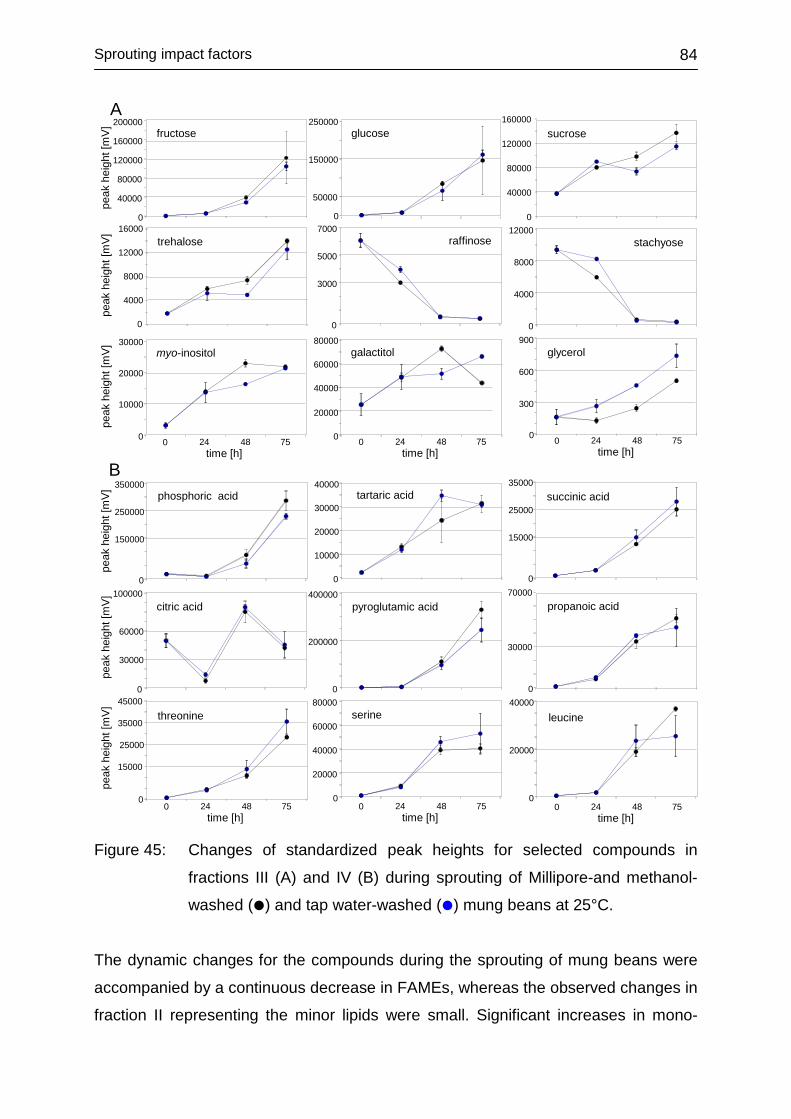
Sprouting impact factors
84
peak
heig
ht[m
V]pe
akhe
ight
[mV]
peak
hei
ght [
mV]
phosphoric acid
0
150000
250000
350000tartaric acid
0
10000
20000
30000
40000succinic acid
0
15000
25000
35000
citric acid
0
30000
60000
100000pyroglutamic acid
0
200000
400000propanoic acid
0
30000
70000
threonine
0
15000
25000
35000
45000
0 24 48 75time [h]
serine
0
20000
40000
60000
80000
0 24 48 75time [h]
leucine
0
20000
40000
0 24 48 75time [h]
B
peak
heig
ht[m
V]pe
ak h
eigh
t [m
V]pe
akhe
ight
[mV]
fructose
0
40000
80000
120000
160000
200000glucose
0
50000
150000
250000sucrose
0
40000
80000
120000
160000
trehalose
0
4000
8000
12000
16000raffinose
0
3000
5000
7000stachyose
0
4000
8000
12000
myo-inositol
0
10000
20000
30000
0 24 48 75time [h]
galactitol
0
20000
40000
60000
80000
0 24 48 75time [h]
glycerol
0
300
600
900
0 24 48 75time [h]
A
Figure 45: Changes of standardized peak heights for selected compounds in
fractions III (A) and IV (B) during sprouting of Millipore-and methanol-
washed () and tap water-washed () mung beans at 25°C.
The dynamic changes for the compounds during the sprouting of mung beans were
accompanied by a continuous decrease in FAMEs, whereas the observed changes in
fraction II representing the minor lipids were small. Significant increases in mono-
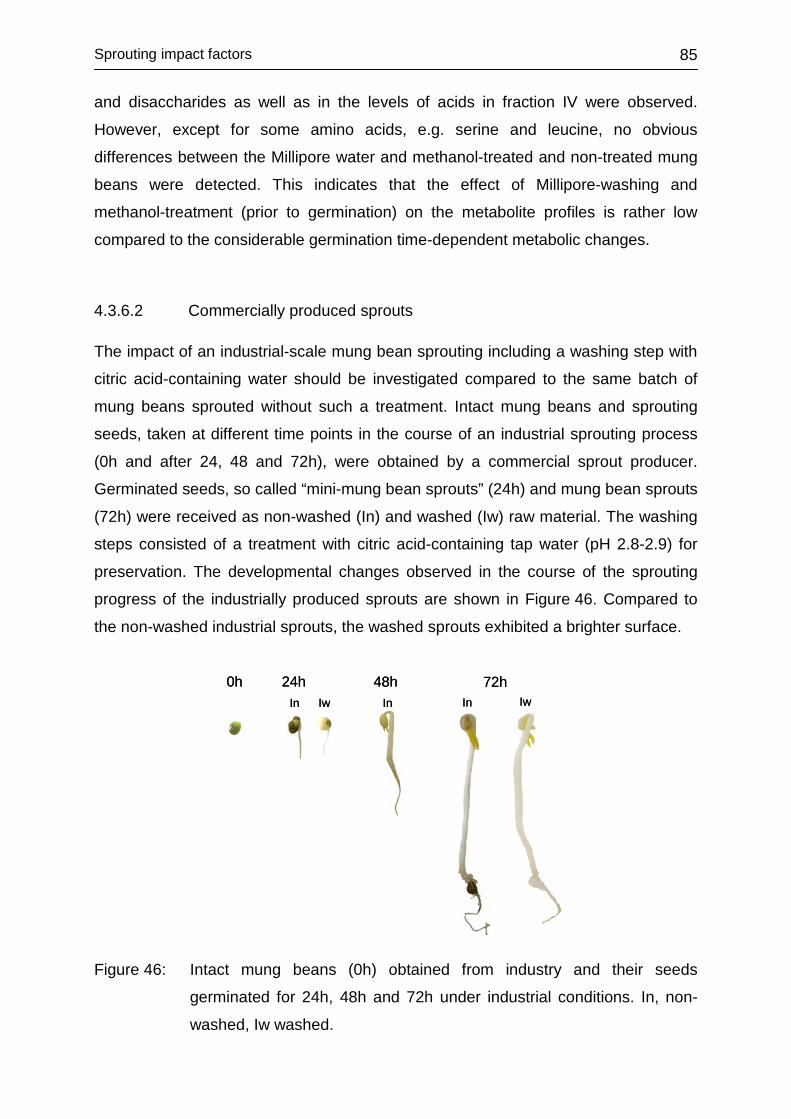
Sprouting impact factors
85
and disaccharides as well as in the levels of acids in fraction IV were observed.
However, except for some amino acids, e.g. serine and leucine, no obvious
differences between the Millipore water and methanol-treated and non-treated mung
beans were detected. This indicates that the effect of Millipore-washing and
methanol-treatment (prior to germination) on the metabolite profiles is rather low
compared to the considerable germination time-dependent metabolic changes.
4.3.6.2 Commercially produced sprouts The impact of an industrial-scale mung bean sprouting including a washing step with
citric acid-containing water should be investigated compared to the same batch of
mung beans sprouted without such a treatment. Intact mung beans and sprouting
seeds, taken at different time points in the course of an industrial sprouting process
(0h and after 24, 48 and 72h), were obtained by a commercial sprout producer.
Germinated seeds, so called “mini-mung bean sprouts” (24h) and mung bean sprouts
(72h) were received as non-washed (In) and washed (Iw) raw material. The washing
steps consisted of a treatment with citric acid-containing tap water (pH 2.8-2.9) for
preservation. The developmental changes observed in the course of the sprouting
progress of the industrially produced sprouts are shown in Figure 46. Compared to
the non-washed industrial sprouts, the washed sprouts exhibited a brighter surface.
0h 24hIn Iw In IwIn
48h 72h0h 24hIn Iw In IwIn
48h 72h
Figure 46: Intact mung beans (0h) obtained from industry and their seeds
germinated for 24h, 48h and 72h under industrial conditions. In, non-
washed, Iw washed.
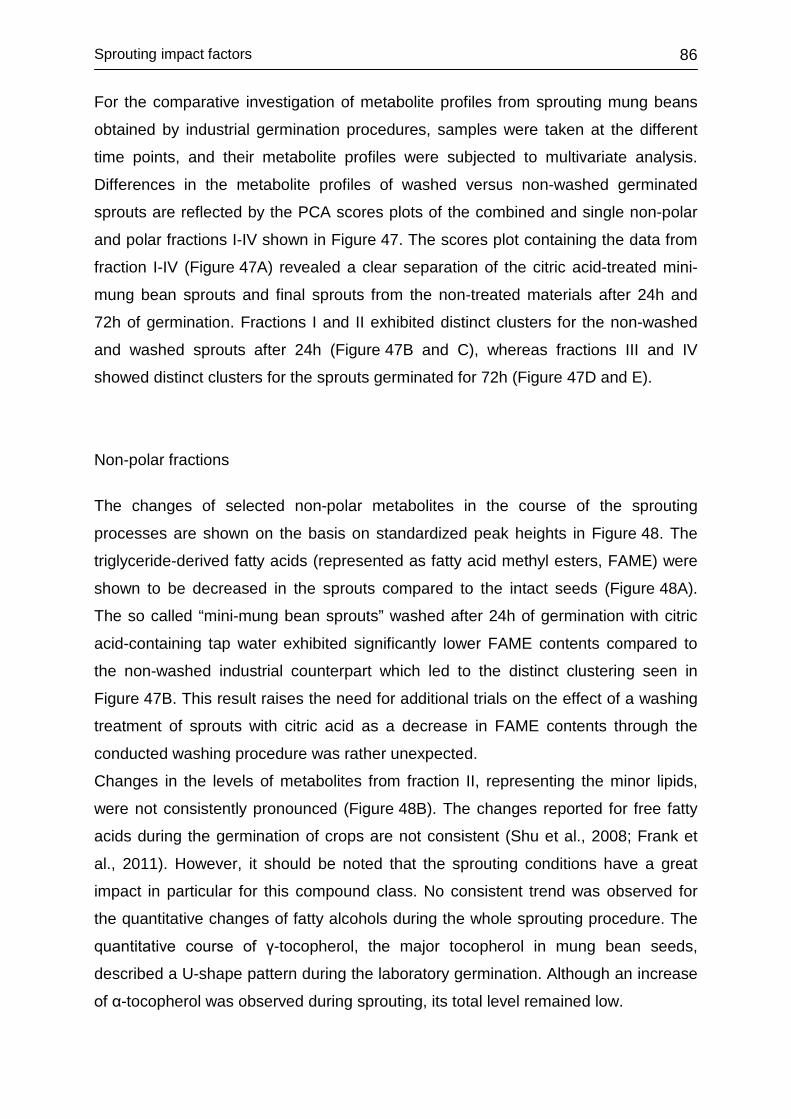
Sprouting impact factors
86
For the comparative investigation of metabolite profiles from sprouting mung beans
obtained by industrial germination procedures, samples were taken at the different
time points, and their metabolite profiles were subjected to multivariate analysis.
Differences in the metabolite profiles of washed versus non-washed germinated
sprouts are reflected by the PCA scores plots of the combined and single non-polar
and polar fractions I-IV shown in Figure 47. The scores plot containing the data from
fraction I-IV (Figure 47A) revealed a clear separation of the citric acid-treated mini-
mung bean sprouts and final sprouts from the non-treated materials after 24h and
72h of germination. Fractions I and II exhibited distinct clusters for the non-washed
and washed sprouts after 24h (Figure 47B and C), whereas fractions III and IV
showed distinct clusters for the sprouts germinated for 72h (Figure 47D and E).
Non-polar fractions
The changes of selected non-polar metabolites in the course of the sprouting
processes are shown on the basis on standardized peak heights in Figure 48. The
triglyceride-derived fatty acids (represented as fatty acid methyl esters, FAME) were
shown to be decreased in the sprouts compared to the intact seeds (Figure 48A).
The so called “mini-mung bean sprouts” washed after 24h of germination with citric
acid-containing tap water exhibited significantly lower FAME contents compared to
the non-washed industrial counterpart which led to the distinct clustering seen in
Figure 47B. This result raises the need for additional trials on the effect of a washing
treatment of sprouts with citric acid as a decrease in FAME contents through the
conducted washing procedure was rather unexpected.
Changes in the levels of metabolites from fraction II, representing the minor lipids,
were not consistently pronounced (Figure 48B). The changes reported for free fatty
acids during the germination of crops are not consistent (Shu et al., 2008; Frank et
al., 2011). However, it should be noted that the sprouting conditions have a great
impact in particular for this compound class. No consistent trend was observed for
the quantitative changes of fatty alcohols during the whole sprouting procedure. The
quantitative course of γ-tocopherol, the major tocopherol in mung bean seeds,
described a U-shape pattern during the laboratory germination. Although an increase
of α-tocopherol was observed during sprouting, its total level remained low.
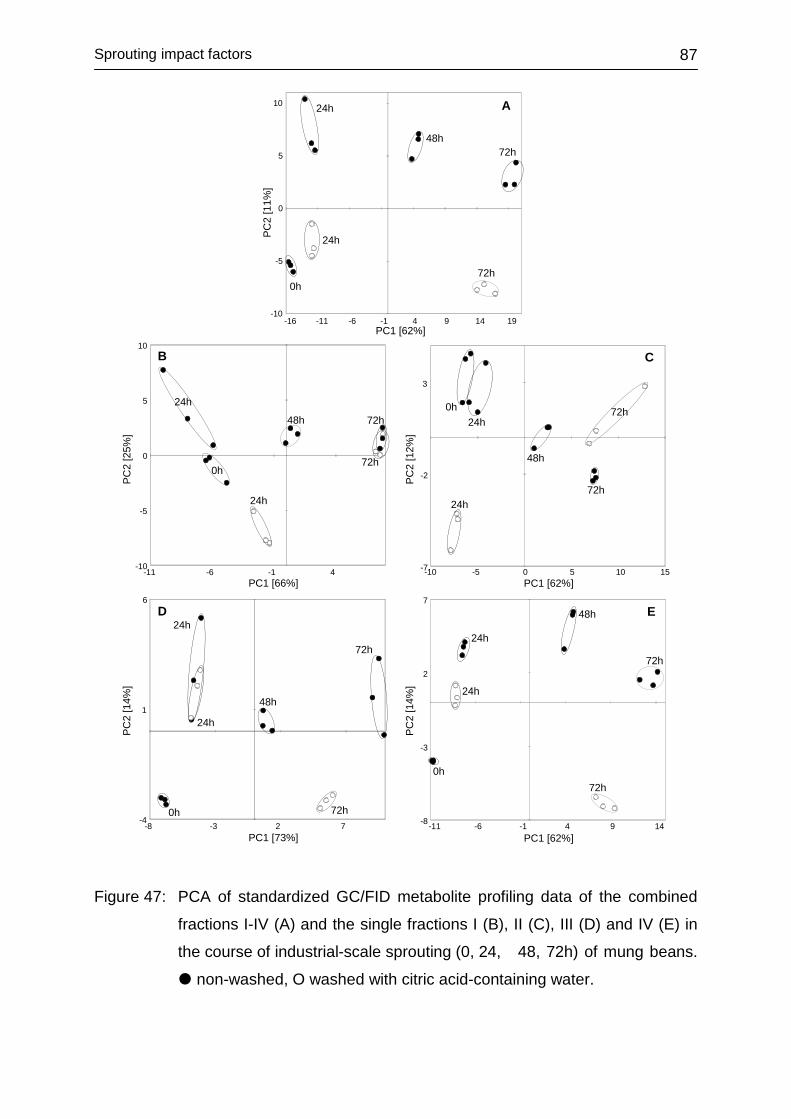
Sprouting impact factors
87
-10
-5
0
5
10
-16 -11 -6 -1 4 9 14 19
PC2
[11%
]
PC1 [62%]
72h48h
24h
0h
24h
72h
A
-7
-2
3
-10 -5 0 5 10 15PC1 [62%]
PC2
[12%
]
C
72h
24h72h
48h
24h0h
B
-10
-5
0
5
10
-11 -6 -1 4PC1 [66%]
PC2
[25%
]
72h
72h
48h
24h
0h
24h
PC1 [62%]
PC2
[14%
]
E
-8
-3
2
7
-11 -6 -1 4 9 14
24h
48h
72h
0h72h
24h
D
-4
1
6
-8 -3 2 7PC1 [73%]
PC2
[14%
]
24h
72h
24h
48h
72h
0h
Figure 47: PCA of standardized GC/FID metabolite profiling data of the combined
fractions I-IV (A) and the single fractions I (B), II (C), III (D) and IV (E) in
the course of industrial-scale sprouting (0, 24, 48, 72h) of mung beans.
non-washed, O washed with citric acid-containing water.
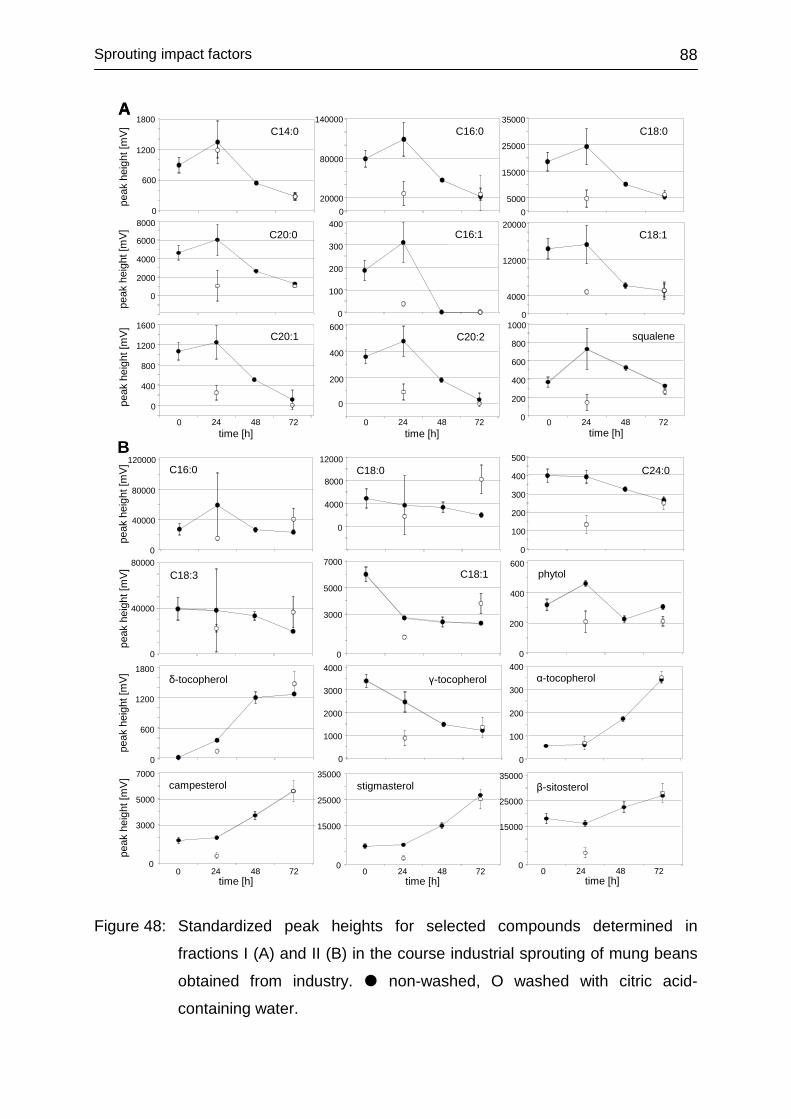
Sprouting impact factors
88
peak
heig
ht[m
V]pe
akhe
ight
[mV]
peak
heig
ht[m
V]A
0
600
1200
1800C14:0
020000
80000
140000C16:0
05000
15000
25000
35000C18:0
C20:0
2000
4000
6000
8000
0
0
100
200
300
400C16:1
0
4000
12000
20000C18:1
C20:1
0
400
800
1200
1600
0 24 48 72time [h]
0
200
400
600
0 24 48 72
C20:2
time [h]
squalene
0
200
400
600
800
1000
0 24 48 72time [h]
A
C18:0
0
4000
8000
12000
campesterol
0
3000
5000
7000
0 24 48 72time [h]
stigmasterol
0
15000
25000
35000
0 24 48 72time [h]
δ-tocopherol
0
600
1200
1800γ-tocopherol
0
1000
2000
3000
4000
C18:1
0
3000
5000
7000C18:3
0
40000
80000phytol
0
200
400
600
C24:0
0
100
200
300
400
500
peak
heig
ht[m
V]pe
akhe
ight
[mV]
peak
heig
ht[m
V]pe
akhe
ight
[mV]
B
0
40000
80000
120000C16:0
0
100
200
300
400α-tocopherol
β-sitosterol
0
15000
25000
35000
0 24 48 72time [h]
Figure 48: Standardized peak heights for selected compounds determined in
fractions I (A) and II (B) in the course industrial sprouting of mung beans
obtained from industry. non-washed, O washed with citric acid-
containing water.
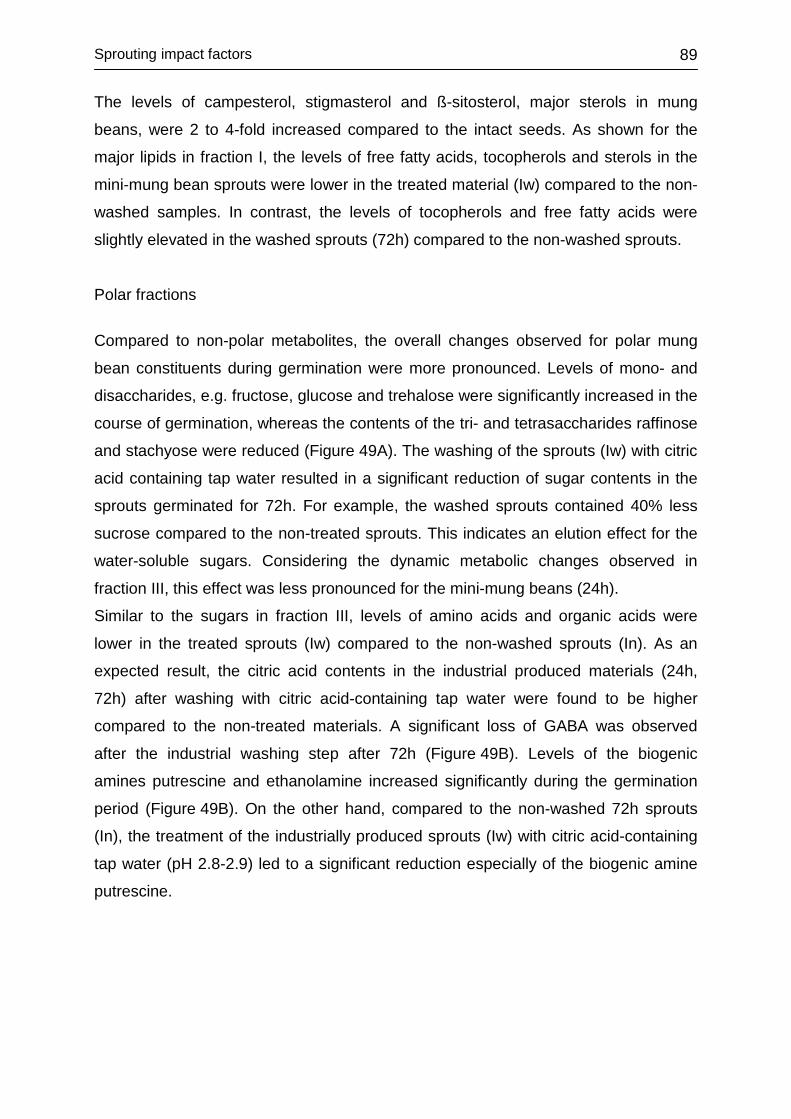
Sprouting impact factors
89
The levels of campesterol, stigmasterol and ß-sitosterol, major sterols in mung
beans, were 2 to 4-fold increased compared to the intact seeds. As shown for the
major lipids in fraction I, the levels of free fatty acids, tocopherols and sterols in the
mini-mung bean sprouts were lower in the treated material (Iw) compared to the non-
washed samples. In contrast, the levels of tocopherols and free fatty acids were
slightly elevated in the washed sprouts (72h) compared to the non-washed sprouts.
Polar fractions
Compared to non-polar metabolites, the overall changes observed for polar mung
bean constituents during germination were more pronounced. Levels of mono- and
disaccharides, e.g. fructose, glucose and trehalose were significantly increased in the
course of germination, whereas the contents of the tri- and tetrasaccharides raffinose
and stachyose were reduced (Figure 49A). The washing of the sprouts (Iw) with citric
acid containing tap water resulted in a significant reduction of sugar contents in the
sprouts germinated for 72h. For example, the washed sprouts contained 40% less
sucrose compared to the non-treated sprouts. This indicates an elution effect for the
water-soluble sugars. Considering the dynamic metabolic changes observed in
fraction III, this effect was less pronounced for the mini-mung beans (24h).
Similar to the sugars in fraction III, levels of amino acids and organic acids were
lower in the treated sprouts (Iw) compared to the non-washed sprouts (In). As an
expected result, the citric acid contents in the industrial produced materials (24h,
72h) after washing with citric acid-containing tap water were found to be higher
compared to the non-treated materials. A significant loss of GABA was observed
after the industrial washing step after 72h (Figure 49B). Levels of the biogenic
amines putrescine and ethanolamine increased significantly during the germination
period (Figure 49B). On the other hand, compared to the non-washed 72h sprouts
(In), the treatment of the industrially produced sprouts (Iw) with citric acid-containing
tap water (pH 2.8-2.9) led to a significant reduction especially of the biogenic amine
putrescine.
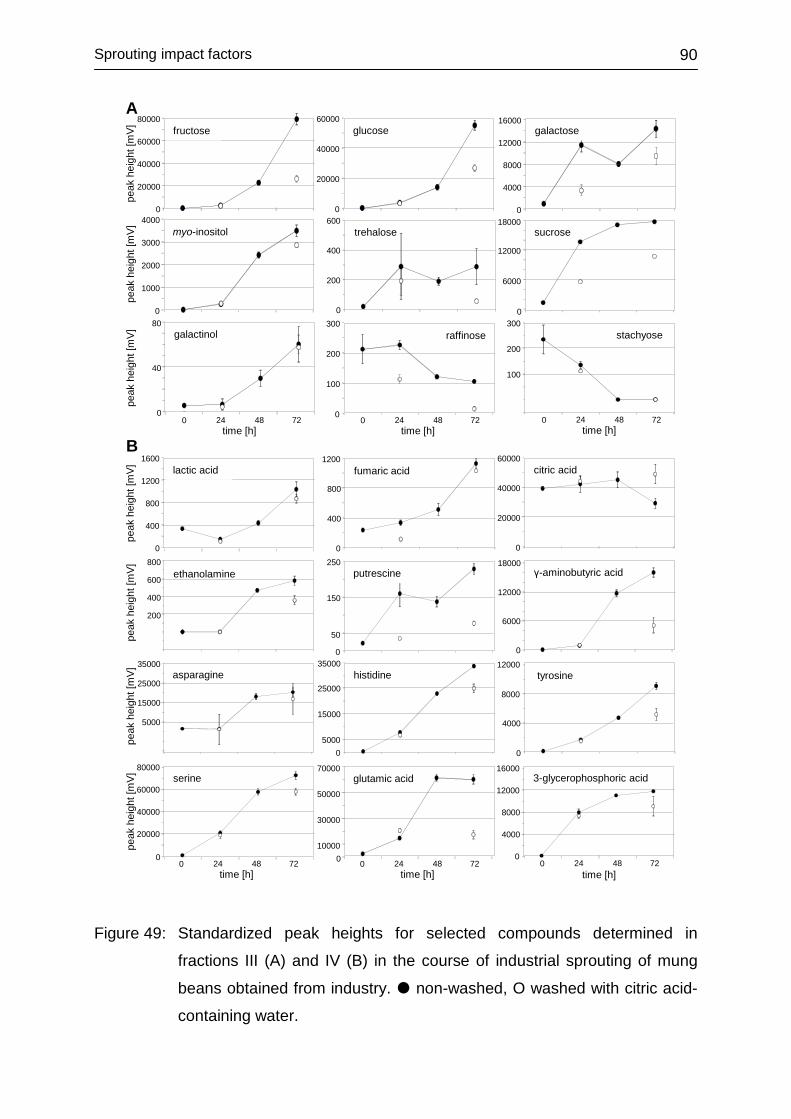
Sprouting impact factors
90
trehalose
0
200
400
600
peak
hei
ght [
mV]
peak
hei
ght [
mV]
peak
heig
ht[m
V]
A
0
20000
40000
60000
80000fructose
0
20000
40000
60000glucose
0
4000
8000
12000
16000galactose
0
1000
2000
3000
4000myo-inositol sucrose
0
6000
12000
18000
0
40
80galactinol
0 24 48 72time [h]
0
100
200
300raffinose
0 24 48 72time [h]
100
200
300stachyose
0 24 48 72time [h]
tyrosine
0
4000
8000
12000
ethanolamine
200
400
600
800
peak
heig
ht[m
V]pe
akhe
ight
[mV]
peak
heig
ht[m
V]pe
ak h
eigh
t [m
V]
B
0
400
800
1200
1600lactic acid
0
400
800
1200fumaric acid citric acid
0
20000
40000
60000
0
50
150
250putrescine
0
6000
12000
18000γ-aminobutyric acid
15000
25000
35000
5000
asparagine
05000
15000
25000
35000histidine
0
20000
40000
60000
80000
0
serine
24 48 72time [h]
010000
30000
50000
70000glutamic acid
0 24 48 72time [h]
0time [h]
0
4000
8000
12000
16000
24 48 72
3-glycerophosphoric acid
Figure 49: Standardized peak heights for selected compounds determined in
fractions III (A) and IV (B) in the course of industrial sprouting of mung
beans obtained from industry. non-washed, O washed with citric acid-
containing water.

Sprouting impact factors
91
4.3.6.3 Conclusions
The washing of intact mung beans with Millipore water and methanol prior to the
laboratory-scale sprouting process led to negligible alterations in the metabolite
profiles of the final sprouts compared to the non-washed sprouts. The industrially
produced sprouts washed with citric acid (Iw) could be clearly distinguished from the
non-washed material with regard to both the appearance and metabolite profiles.
In view of the microbial status of sprouted mung beans (Weiss et al., 2007; Mohle-
Boetani et al., 2009; Peñas et al., 2010), metabolite profiling can assist in the safety
assessment of sprouted foods. By establishing correlations between metabolite
profiles of mung bean sprouts and their microflora, valuable indicators helping to
predict the sprouting process and the quality of the final food may be elaborated.
However, further metabolite profiling studies are required to determine the influence
of different treatments on the respective metabolite profiles of the mung bean
sprouts. Ideally, a set of biomarkers could be developed representing the course of
the sprouting process especially regarding product quality and safety.
4.3.7 Conclusions
Several factors, e.g. incubation temperature and washing treatment, have a
considerable impact on the germination process of mung beans. The data obtained
demonstrated the suitability of the applied metabolite profiling procedure to assess
the tested impact factors on the metabolite profiles of sprouting mung beans. For the
factors genotype, temperature and illumination, metabolite profiling revealed
differently pronounced influences on the metabolic phenotypes of sprouted mung
beans. Although multivariate analysis allowed a clear separation of the two intact
mung bean varieties, these differences became less obvious compared to the
significant germination time-dependent metabolic changes in the course of sprouting.
However, a broad metabolite profiling-based screening of various mung bean
genotypes grown at different environmental conditions may help to identify marker
metabolites which could be used to predict the germination progress. As expected,
higher germination temperatures led to a more rapid sprouting process. On the other
hand, it has to be considered that higher incubation temperatures may also
potentiate the activity of microorganisms. Therefore, microbiological studies on

Sprouting impact factors
92
sprouting mung beans are necessary to be able to correlate potential spoilage
indicators with bacterial counts. Germination of mung beans under the influence of
illumination was shown to result in a change of both color and metabolite profiles
compared to sprouts produced in the dark. Consumers might prefer sprouts
germinated in the dark as their white color apparently implicates a fresher status than
sprouts exposed to illumination. From a nutritional point of view, it has to be
assessed whether the metabolic differences observed, e.g. the consistently
decreased sugar contents in the illuminated mung bean sprouts, are desirable traits.
Storage of mung bean sprouts
93
4.4 STORAGE OF MUNG BEAN SPROUTS
4.4.1 Storage of sprouts at different temperatures
Commercially available raw mung bean sprouts should be consumed preferably at
the same day of purchase. Although fresh mung bean sprouts are cooled during
distribution and storage in the supermarkets, the shelf life of the sprouts is limited to a
few days. In the present study, metabolite profiling was applied to investigate the
influence of the storage temperature on the metabolite profiles of mung bean sprouts.
Therefore, mung bean sprouts were purchased at a local supermarket at the day of
the sprout expiration date specified on the package. The sprouts were stored in a
refrigerator (10°C) and at room temperature (24°C), respectively. Samples were
taken after 48h and 96h for the sprouts stored at 10°C and after 24h and 48h for the
sprouts stored at 24°C. After freeze-drying and milling, the flours were subjected to
the metabolite profiling procedure.
For both storage conditions the morphological changes were recorded and
compared. Figure 50 illustrates the mung bean sprouts over the storage period at
room temperature and at refrigerator temperature. The sampling at each time point
revealed significant changes in the shoots. At room temperature, a clear change in
morphology and color occurred (Figure 50B). In the fresh state, the shoots were still
completely white and the green-yellow cotyledons were visible. After a storage time
of 24h, the color of the shoots was dark green to brown. After 48h, a change in the
form was recognizable. The shoots and leaves showed a brown color and the scion
stem was no longer standing in front, but was contracted and curved. In addition, the
consistency of crunchy fresh sprouts has been negatively affected. Sprouts began to
become softer and slimy. The observable water efflux indicated an advanced cell wall
degradation progress and the slimy surface was suggested to be a result from
microbial activity. In contrast to the storage at room temperature, sprouts stored in
the refrigerator did not alter their appearance during the first 48h. However, sprouts
stored for 96h showed first changes of consistency (Figure 50A).
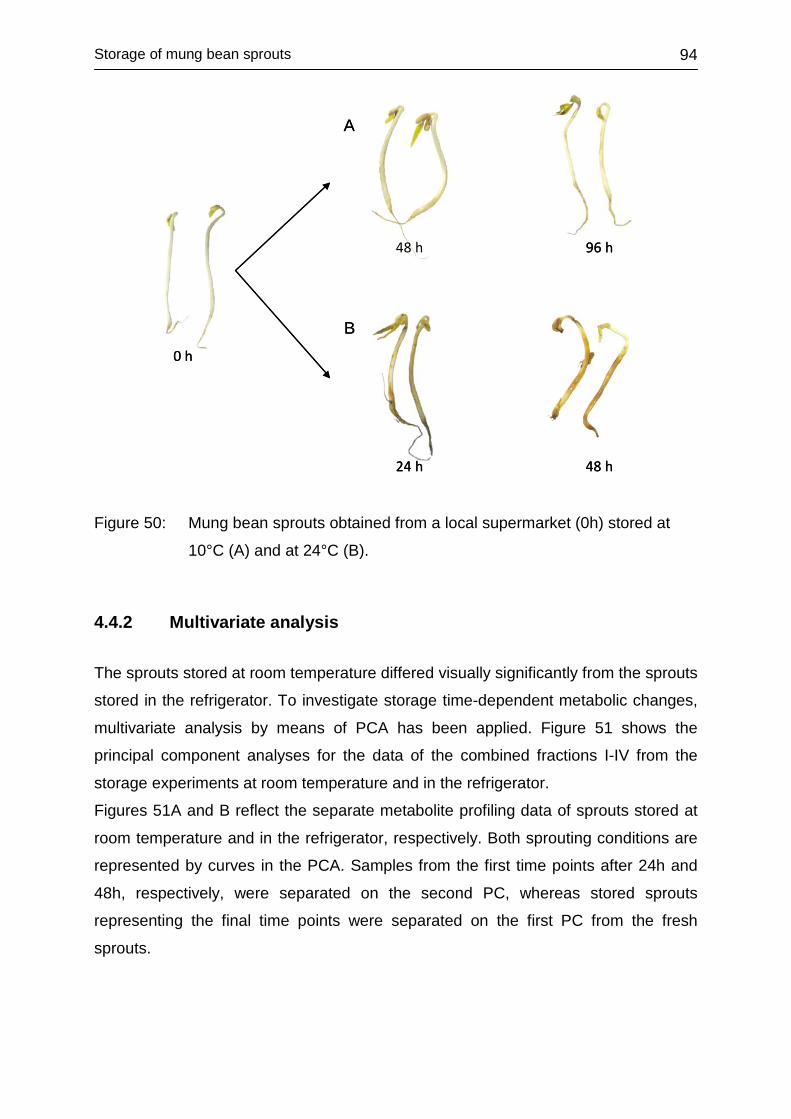
Storage of mung bean sprouts
94
A
B0 h
48 h 96 h
24 h 48 h
A
B0 h
48 h 96 h
24 h 48 h
Figure 50: Mung bean sprouts obtained from a local supermarket (0h) stored at
10°C (A) and at 24°C (B).
4.4.2 Multivariate analysis
The sprouts stored at room temperature differed visually significantly from the sprouts
stored in the refrigerator. To investigate storage time-dependent metabolic changes,
multivariate analysis by means of PCA has been applied. Figure 51 shows the
principal component analyses for the data of the combined fractions I-IV from the
storage experiments at room temperature and in the refrigerator.
Figures 51A and B reflect the separate metabolite profiling data of sprouts stored at
room temperature and in the refrigerator, respectively. Both sprouting conditions are
represented by curves in the PCA. Samples from the first time points after 24h and
48h, respectively, were separated on the second PC, whereas stored sprouts
representing the final time points were separated on the first PC from the fresh
sprouts.
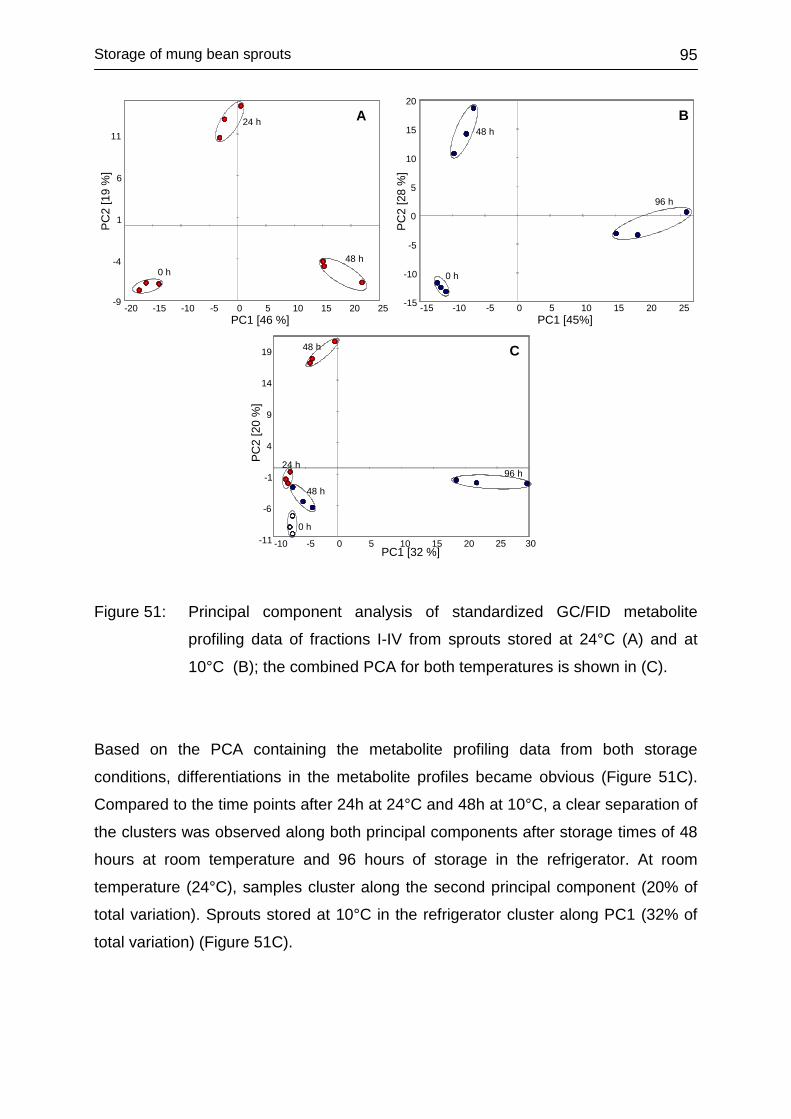
Storage of mung bean sprouts
95
-11
-6
-1
4
9
14
19
-10 -5 0 5 10 15 20 25 30PC1 [32 %]
96 h
48 h
24 h
48 h
0 h
PC2
[20
%]
-9
-4
1
6
11
-20 -15 -10 -5 0 5 10 15 20 25PC1 [46 %]
48 h
24 h
0 h
PC2
[19
%]
-15
-10
-5
0
5
10
15
20
-15 -10 -5 0 5 10 15 20 25PC1 [45%]
96 h
48 h
0 h
PC2
[28
%]
A B
C
Figure 51: Principal component analysis of standardized GC/FID metabolite
profiling data of fractions I-IV from sprouts stored at 24°C (A) and at
10°C (B); the combined PCA for both temperatures is shown in (C).
Based on the PCA containing the metabolite profiling data from both storage
conditions, differentiations in the metabolite profiles became obvious (Figure 51C).
Compared to the time points after 24h at 24°C and 48h at 10°C, a clear separation of
the clusters was observed along both principal components after storage times of 48
hours at room temperature and 96 hours of storage in the refrigerator. At room
temperature (24°C), samples cluster along the second principal component (20% of
total variation). Sprouts stored at 10°C in the refrigerator cluster along PC1 (32% of
total variation) (Figure 51C).
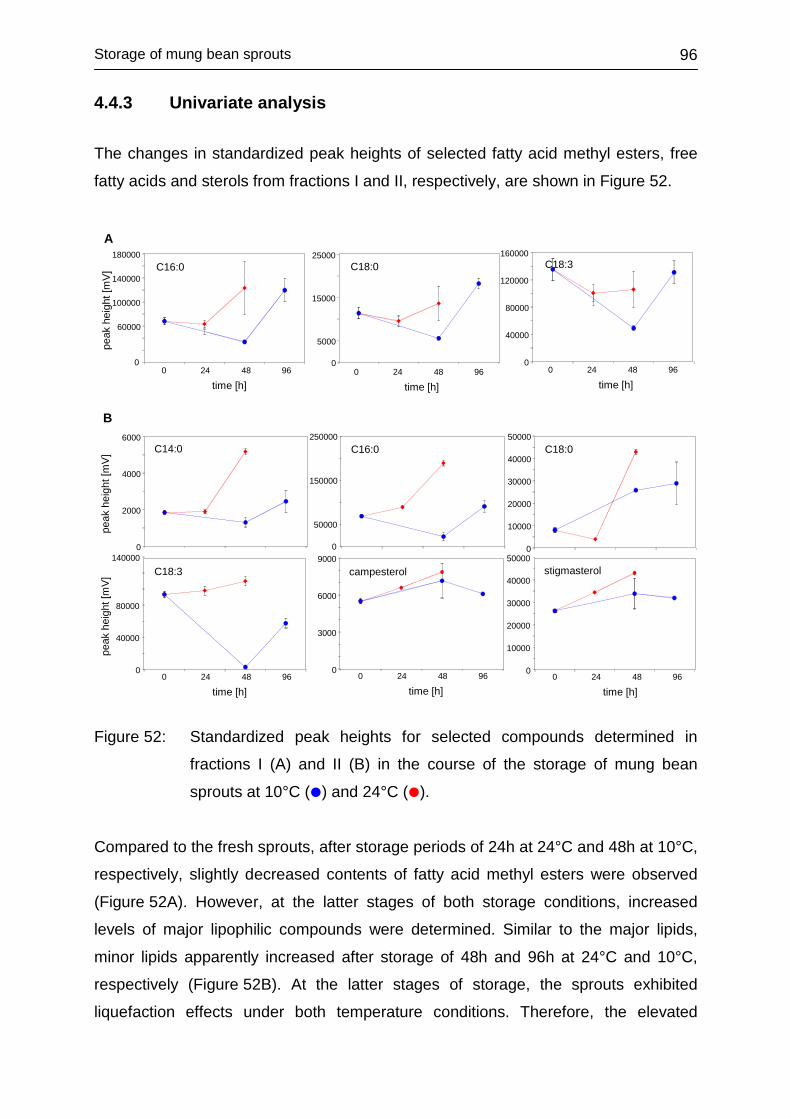
Storage of mung bean sprouts
96
4.4.3 Univariate analysis
The changes in standardized peak heights of selected fatty acid methyl esters, free
fatty acids and sterols from fractions I and II, respectively, are shown in Figure 52.
peak
heig
ht[m
V]
0
5000
15000
25000C18:0
0 24 48 96
time [h]
C16:0
0
60000
100000
140000
180000
0 24 48 96
time [h]
C18:3
0
40000
80000
120000
160000
0 24 48 96
time [h]
A
B
0
10000
20000
30000
40000
50000stigmasterol
0 24 48 96
time [h]
0
10000
20000
30000
40000
50000C18:0
0
2000
4000
6000C14:0
0
50000
150000
250000C16:0
peak
heig
ht[m
V]pe
akhe
ight
[mV]
0
3000
6000
9000campesterol
0 24 48 96
time [h]
0
40000
80000
140000
C18:3
0 24 48 96
time [h]
Figure 52: Standardized peak heights for selected compounds determined in
fractions I (A) and II (B) in the course of the storage of mung bean
sprouts at 10°C () and 24°C ().
Compared to the fresh sprouts, after storage periods of 24h at 24°C and 48h at 10°C,
respectively, slightly decreased contents of fatty acid methyl esters were observed
(Figure 52A). However, at the latter stages of both storage conditions, increased
levels of major lipophilic compounds were determined. Similar to the major lipids,
minor lipids apparently increased after storage of 48h and 96h at 24°C and 10°C,
respectively (Figure 52B). At the latter stages of storage, the sprouts exhibited
liquefaction effects under both temperature conditions. Therefore, the elevated
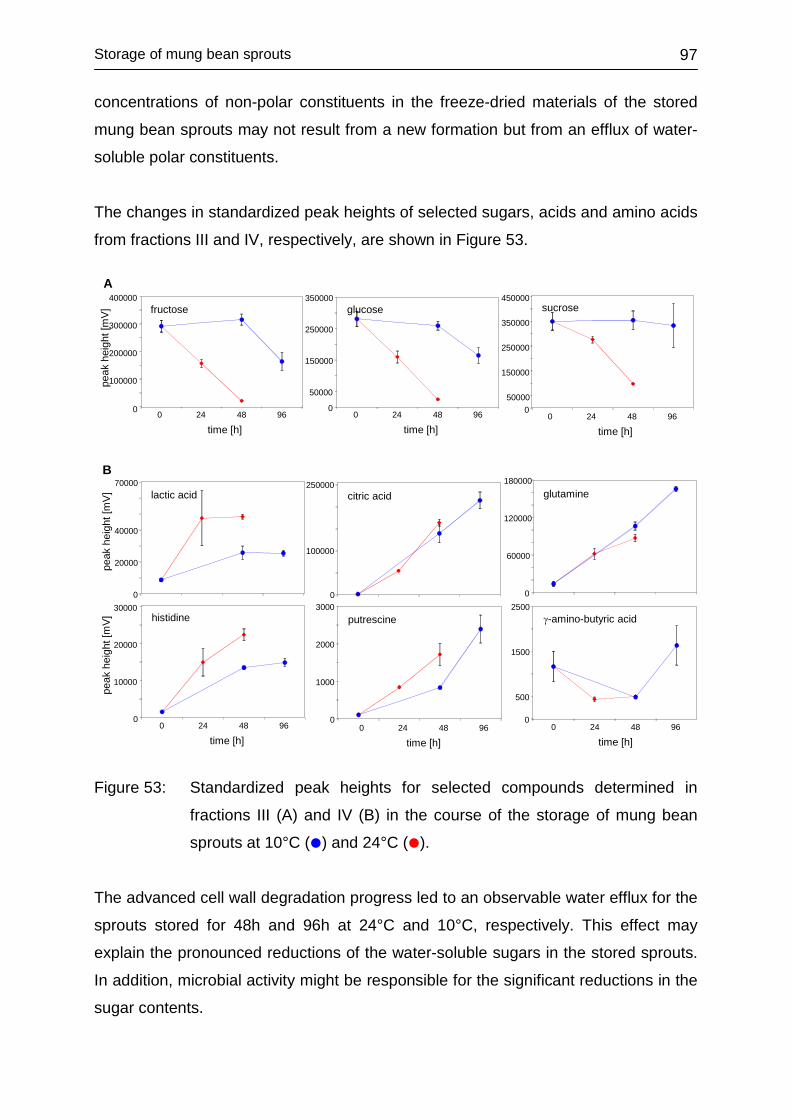
Storage of mung bean sprouts
97
concentrations of non-polar constituents in the freeze-dried materials of the stored
mung bean sprouts may not result from a new formation but from an efflux of water-
soluble polar constituents.
The changes in standardized peak heights of selected sugars, acids and amino acids
from fractions III and IV, respectively, are shown in Figure 53.
fructose
0
100000
200000
300000
400000
0 24 48 96
time [h]
glucose
0
50000
150000
250000
350000
0 24 48 96
time [h]
sucrose
050000
150000
250000
350000
450000
0 24 48 96
time [h]
peak
heig
ht[m
V]
0
10000
20000
30000histidine
0 24 48 96
time [h]
0
60000
120000
180000glutamine
0
1000
2000
3000putrescine
0 24 48 96
time [h]
0
500
1500
2500γ-amino-butyric acid
0 24 48 96
time [h]
0
100000
250000citric acid
peak
heig
ht[m
V]pe
akhe
ight
[mV]
lactic acid
0
20000
40000
70000
A
B
Figure 53: Standardized peak heights for selected compounds determined in
fractions III (A) and IV (B) in the course of the storage of mung bean
sprouts at 10°C () and 24°C ().
The advanced cell wall degradation progress led to an observable water efflux for the
sprouts stored for 48h and 96h at 24°C and 10°C, respectively. This effect may
explain the pronounced reductions of the water-soluble sugars in the stored sprouts.
In addition, microbial activity might be responsible for the significant reductions in the
sugar contents.

Storage of mung bean sprouts
98
The strong increase of citric acid after the second sampling is suggested to be a
result from the carbohydrate degradation. Increased disposal of glucose leads to an
increased citric acid formation. The rapid increase in lactic acid content after a total of
96h at refrigerated storage may also be attributed to microbial activities.
Summary
99
5 SUMMARY
A metabolite profiling methodology based on capillary gas chromatography was
applied to investigate time-dependent metabolic changes in the course of the
sprouting of mung beans (Vigna radiata). Intact mung beans and sprouting samples
taken during the germination process were subjected to an extraction and
fractionation procedure covering a broad spectrum of lipophilic (e.g. fatty acid methyl
esters, hydrocarbons, fatty alcohols, sterols) and hydrophilic (e.g. sugars, acids,
amino acids, amines) low molecular weight constituents. Investigation of the obtained
polar and non-polar fractions by GC resulted in the detection of more than 450
distinct peaks of which 146 were identified by means of MS. Statistical assessment
by means of multivariate (e.g. principal component analysis) and univariate data
analyses demonstrated the suitability of the applied approach to follow the metabolic
changes in the course of sprouting processes in a reproducible way. The dynamic
changes of single metabolites revealed significantly increased levels of
monosaccharides, organic acids and amino acids and a decrease in the levels of
triglyceride-derived fatty acids during germination.
Various factors, i.e. genotype and growing environment of intact mung beans, as well
as temperature, illumination and washing treatments in the course of the incubation
process, were shown to impact the metabolite profiles of sprouting mung beans. Two
different mung bean materials were subjected to three independent sprouting
procedures under similar conditions to investigate the genetic influence on the
metabolite profiles. PCA analysis of the metabolite profiling data revealed
reproducible reflections of the three conducted sprouting processes. Thus, the
applied methodology allowed consistent differentiations of the two mung bean
materials in the course of germinations demonstrating the robustness of the applied
methodology. In addition to the factor genotype, the growing-related environmental
influence on the mung bean metabolite profiles was assessed by investigating two
mung bean genotypes grown at dry and rainy seasons in Thailand. Differences in the
metabolite profiles of intact mung beans were observed for the two mung bean
materials as well as for the respective growing environments. However, considering
the metabolic changes during the sprouting process, the influence of the factor
genotype was shown to be more pronounced than the impact of the dry and rainy
growing seasons.
Summary
100
In order to test the impact of incubation temperature on the metabolite profiles of
sprouting mung beans, one batch of material was germinated at two different
temperatures. The results obtained by the sprouting of mung beans at 25°C and
35°C confirm the considerable influence of the incubation temperature on the time-
dependent metabolic changes. The mung beans sprouted at the higher temperature
exhibited an accelerated metabolism resulting in metabolic changes at a very early
stage of the sprouting process. The fast sprouting progress led to an early increase
of nutritionally relevant metabolites, such as monosaccharides and free amino acids,
whereas the levels of less desired tri- and tetrasaccharides were quickly reduced.
For the investigation of the influence of illumination on the metabolite profiles of
sprouting mung beans, samples were germinated under artificial light exposure and
comparatively analyzed to mung beans sprouted in the dark. Sprouting of mung
beans with and without illumination did not lead to significant differences in the
spectrum of low molecular weight components covered by the applied approach.
Metabolite profiling was also applied to investigate the impact of washing steps of
mung bean seeds prior and during the sprouting process. Millipore water and
methanol were used as washing agents prior to germination at a laboratory scale.
Except for some amino acids, no obvious differences between metabolite profiles of
the Millipore water and methanol-treated and non-treated mung beans were
detected. In addition, the impact of an industrial-scale mung bean sprouting including
a washing step with citric acid-containing water was investigated. In contrast to the
washing procedures conducted prior to germination, the washing procedure of
already sprouted mung beans led to significant changes in the levels of both non-
polar and polar metabolites, including biogenic amines as potential indicators for
microbial activities.
Finally, metabolite profiling was applied to investigate the metabolite profiles of mung
bean sprouts stored beyond the given expiration date. Significant changes in both
appearance and metabolite profiles were observed for the sprouts stored at
temperatures of 10°C and 24°C; levels of carbohydrates were shown to decrease,
whereas contents of acids were shown to increase.
References
101
6 REFERENCES
Abdel-Rahman, E-S. A., El-Fishawy, F. A., El-Geddawy, M. A., Kurz, T. and El-Rify, M. N. (2007) The changes in the lipid composition of mung bean seeds as affected by processing methods. Int. J. Food Eng., 3, 1-10. Allwood, J. W., De Vos, R. C. H., Moing, A., Deborde, C., Erban, A., Kopka, J., Goodacre, R. and Hall, R. D. (2011) Plant metabolomics and its potential for systems biology research background concepts, technology, and methodology. Met. in Enz., 500, 299-336. Allwood, J. W., Ellis, D. I. and Goodacre, R. (2008) Metabolomic technologies and their application to the study of plants and plant-host interactions. Physiol. Plantarum., 132, 117-135. Allwood, J. W., Erban, A., de Koning, S., Dunn, W. B., Luedemann, A., Lommen, A., Kay, L., Loscher, R., Kopka, J. and Goodacre, R. (2009) Inter-laboratory reproducibility of fast gas chromatography-electrom impact-time of flight mass spectrometry (GC-EI-TOF/MS) based plant metabolomics. Metabolomics, 5, 479-496. Allwood, J. W. and Goodacre, R. (2010) An introduction to liquid chromatography-mass spectrometry instrumentation applied in plant metabolomic analyses. Phytochem. Anal., 21, 33-47. Åman, P. (1979) Carbohydrates in raw and germinated seeds from mung bean and chick pea. J. Sci. Food Agric., 30, 869-875. Anwar, F., Latif, S., Przybylski, R., Sultana, B. and Ashraf, M. (2007) Chemical composition and antioxidant activity of seeds of different cultivars of mungbean. Sensory Nutr. Qual. Food, 72, S503-S510. AVRDC (Asian Vegetable Research and Development Center). (2010) Counting on beans: mung bean improvement in Asia. Shanhua, Taiwan, AVRDC publication. Bari, M. L.., Nei, D., Enomoto, K., Todoriki, S. and Kawamoto, S. (2009) Combination treatments for killing Escherichica coli O157:H7 on alfalfa, radish, broccoli, and mung bean seeds. J. Food Prot., 72, 631-636. Bedair, M. and Sumner, L. W. (2008) Current and emerging mass-spectrometry technologies for metabolomics. Trends Anal. Chem., 27, 238-250. Bennik, M. H. J. (1997) Biopreservation in modified atmosphere packaged vegetables. Ph.D. Thesis, Wageningen Agricultural University. Bino, R. J., Hall, R. H., Fiehn, O., Kopka, J., Saito, K., Draper, J., Nikolau, B., Mendes, P., Roessner-Tunali, U., Beale, M., Trethewey, R. N., Lange, B. M., Syrkin Wurtele, E. and Sumner, L. (2004) Potential of metabolomics as a functional genomics tool. Trends Plant Sci., 9, 418-425.
References
102
Bush, P. B., Grunwald, C. and Davis, D. L. (1971) Changes in sterol composition during greening of etiolated barley shoots. Plant Physiol., 47, 745 - 749. Cantwell, M. (1997) Properties and recommended conditions for storage of fresh fruits and vegetables. http://postharvest.ucdavis.edu/produce/storage/prop_qs.html; last accessed: June 2012. Cellini, F., Chesson, A., Colquhoun, I., Constable, A., Davies, H. V., Engel, K.-H., Gatehouse, A. M. R., Kärenlampi, S., Kok, E. J., Leguay, J.-J., Lehesranta, S., Noteborn, H. P. J. M., Pedersen, J. and Smith, M. (2004) Unintended effects and their detection in genetically modified crops. Food Chem. Toxicol., 42, 1089-1125. Cevallos-Cevallos, J. M., Reyes-De-Corcuera, J. I., Etxeberria, E., Danyluk, M. D. and Rodrick, G. E. (2009) Metabolomics analysis in food science: a review. Trends Food Sci. Technol., 20, 557-566. Chandrasiri, V., Bau, H. M., Villaume, C., Giannangeli, F. and Méjean, L. (1990) Effect of germinated and heated soybean meals on plasma cholesterol and triglycerides in rats. Reprod. Nutr. Dev., 30, 611-618. Chau, C. F., Cheung, P. C. and Wong, Y. S. (1997) Effect of cooking on content of amino acids and antinutrients in three Chinese indigenous legume seeds. J. Sci. Food Agric., 75, 447-452. Choi, U. K. and Bajpai, V. K. (2010) Comparative study of quality characteristics of meju, a Korean soybean fermentation starter, made by soybeans germinated under dark and light conditions. Food and Chem. Toxicol., 48, 365-362. Clifford, P. E. (1979) Source limitation of sink yield in mungbean. Ann. Bot., 43, 397-399. Colquhoun, I. J. (2007) Use of NMR for metabolic profiling in plant systems, J. Pestic. Sci., 32, 200-212. Dalgliesh, C. E., Horning, E. C., Horning, M. G., Knox, K. L. and Yarger, K. (1966) A gas-liquid-chromatographic procedure for separating a wide range of metabolites occurring in urine or tissue extracts. Biochem. J., 101, 792-810. Darbelley, N., Razafindramboa, N., Chambost, J.-P. and Pavia, A. (1997) Light effects on α-amylase activity and carbohydrate content in relation to lipid mobilization during the seedling growth of sunflower. J. Plant. Res., 3, 347-356. Daskalchuk, T., Ahiahonu, P., Heath, D. and Yamazaki, Y. (2006) The use of non-targeted metabolomics in plant science, in Saito, K., Dixon, R. A. and Willmitzer, L. (Eds.), Biotechnology in agriculture and forestry, Vol. 57, Plant metabolomics, Springer, 311-325. Davies, H. V. (2007) Metabolomics: Applications in functional biodiversity analysis in potato, in Spooner, D. M., Bohs, L., Giovannoni, J., Olmstead, R. G. and Shibata, D. ISHS Acta Horticulturae 745, VI International Solanaceae Conference, Genomics Meets Biodiversity, Madison, ISHS, 471-483.
References
103
Davies, H. V. (2009) A role for “omics” technologies in food safety assessment. Food Control, 21, 1601-1610. Davies, H. V., Shepherd, L. V. T., Stewart, D., Frank, T., Röhlig, R. M. and Engel, K.-H. (2010) Metabolome variability in crop plant species – when, where, how much and so what?. Regul. Toxicol. Pharmacol., 58, S54-S61. Desbrosses, G. G., Kopka, J. and Udvardi, M. K. (2005) Lotus japonicus metabolic profiling: development of gas chromatography-mass spectrometry resources for the study of plant-microbe interactions. Plant. Physiol., 137, 1302-1318. Dixon, R. A., Gang, D. R., Charlton, A. J., Fiehn, O., Kuiper, H. A., Reynolds, T. L., Tjeerdema, R. S., Jeffery, E. H., German, J. B., Ridley, W. P. and Seiber, J. N. (2006) Applications of metabolomics in agriculture. J. Agric. Food Chem., 54, 8984-8994. Dixon, R. A. and Strack, D. (2003) Phytochemistry meets genome analysis, and beyond. Phytochemistry, 62, 815-816. Dunn, W. B. and Ellis, D. I. (2005) Metabolomics: current analytical platforms and methodologies. Trends Anal. Chem., 24, 285-294. EFSA (2011) EFSA Panel on genetically modified organisms (GMO), Guidance document on selection of comparators for the risk assessment of GM plants. EFSA Journal. EG2092/91, Verordnung des Rates vom 24.06.1991 über den ökologischen Landbau und die entsprechende Kennzeichnung der landwirtschaftlichen Erzeugnisse und Lebensmittel. EG834/2007, Verordnung des Rates vom 28.06.2007 über die ökologische / biologische Produktion und die Kennzeichnung von ökologischen / biologischen Erzeugnissen und zur Aufhebung der Verordnung (EWG) Nr. 2092/91. EG889/2008, Verordnung der Kommission vom 05.09.2008 mit Durchführungsvorschriften zur Verordnung (EG) Nr. 834/2007 des Rates über die ökologische / biologische Produktion und die Kennzeichnung von ökologischen / biologischen Produktion, Kennzeichnung und Kontrolle. El-Adawy (1996) Chemical, nutritional and functional properties of mung bean protein isolate and concentrate. Menufiya J. Agric. Res., 21, 657-672. El-Adawy, T. A., Rahma, E. H., El-Bedawey, A. A. and El-Beltagy, A. E. (2003) Nutritional potential and functional properties of germinated mung bean, pea and lentil seeds. Plant Foods Human Nutrition, 58, 1-13. Eugster, P. J., Guilarme, D., Rudaz, S., Veuthey, J. L., Carrupt, P. A. and Wolfender, J. L. (2011) Ultra high pressure liquid chromatography for crude plant extract profiling. J. AOAC International, 94, 51-70.
References
104
Fait, A., Angelovici, R., Less, H., Ohad, I., Urbanczyk-Wochniak, E., Fernie, A. R. and Galili, G. (2006) Arabidopsis seed development and germination is associated with temporally distinct metabolic switches. Plant Physiol., 142, 839-854. Fait, A., Hanhineva, K., Beleggia, R., Dai, N., Rogachev, I., Nikiforova, V. J., Fernie, A. R. and Aharoni, A. (2008) Reconfiguration of the achene and receptacle metabolic networks during strawberry fruit development. Plant Physiol., 148, 730-750. Fan, T. Y. and F. W. Sosulski, (1974) Dispersibility and isolation of proteins from legume flours. Can. Inst. Food Sci. Technol. J., 7, 256-258. FAO/IAEA (2010) Food and Agriculture Organization/International Atomic Energy Agency. Turning Adversity into Opportunity: Farmers reaping the benefits from year-round production of income generating crops in Coastal Saline Lands of Bangladesh. Joint FAO/IAEA programme. FDA (1999) Food and Drag Administration. FDA’s proposed new guidelines for the sprout industry. Docket Nos. 99D - 4488 and 99D – 4489. Fernie, A. R. and Schauer, N. (2009) Metabolomics-assisted breeding: a viable option for crop improvement?. Trends in Genetics, 25, 39-48. Fernie, A. R., Trethewey, R. N., Krotzky, A. J. and Willmitzer, L. (2004) Metabolite profiling: from diagnostics to systems biology. Nat. Rev. Mol. Cell Biol., 5, 763-769. Fery, F. L. (2002) New opportunities in Vigna, In Janick, J. and Whipkey, A. Trends in new crops and new uses. Alexandria, ASHS Press, 424-428. Fiehn, O. (2002) Metabolomics – the link between genotypes and phenotypes. Plant Mol. Biol., 48, 155-171. Fiehn, O., Kopka, J., Trethewey, R. N. and Willmitzer, L. (2000a) Identification of uncommon plant metabolites based on calculation of elemental compositions using gas chromatography and quadrupole mass spectrometry. Anal. Chem., 72, 3573-3580. Fiehn, O., Kopka, J., Dörmann, P., Altmann, T., Trethewey, R. N. and Willmitzer, L. (2000b) Metabolite profiling for plant functional genomics. Nature Biotechnol., 18, 1157-1161. Fiehn, O., Robertson, D., Griffin, J., van der Werf, M., Nikolau, B., Morrison, N., Sumner, L. W., Goodacre, R., Hardy, N. W., Taylor, C., Fostel, J., Kristal, B., Kaddurah-Daouk, R., Mendes, P., van Ommen, B., Lindon, J. C. and Sansone, S.-A. (2007) The metabolomics standards initiative (MSI). Metabolomics, 3, 175-178. Frank, T., Nörenberg, S. and Engel, K.-H. (2009) Metabolite profiling of two novel low phytic acid (lpa) soybean mutants. J. Agric Food Chem., 57, 6408-6416. Frank, T., Reichardt, B., Shu, Q. and Engel, K.-H. (2012b) Metabolite profiling of colored rice (Oryza sativa L.) grains. J. Cereal Sci., 55, 112-119.
References
105
Frank, T., Röhlig, R. M., Davies, H. V., Barros, E. and Engel, K.-H. (2012a) Metabolite profiling of maize kernels – genetic modification versus environmental influence. J. Agric. Food Chem., 60, 3005-3012. Frank, T., Scholz, B., Peter, S. and Engel, K.-H. (2011) Metabolite profiling of barley: Influence of the malting process. Food Chem., 124, 948-957. Frank, T., Seumo Meuleye, B., Miller, A., Shu, Q.-Y. and Engel, K.-H. (2007) Metabolite profiling of two low phytic acid (lpa) rice mutants. J. Agric. Food Chem., 55, 11011-11019. Frenzel, T., Miller, A. and Engel, K.-H. (2002) Metabolite profiling – a fractionation method for analysis of major and minor compounds in rice grains. Cereal Chem., 79, 215-221. Frenzel, T., Miller, A. and Engel, K.-H. (2003) A methodology for automated comparative analysis of metabolite profiling data. Eur. Food Res. Technol., 216, 335-342. Garcia-Canas, V., Simo, C., Leon, C., Ibanez, E. and Cifuentes, A. (2011) MS-based analytical methodologies to characterize genetically modified crops. Mass Spectrometry Reviews, 30, 396-416. Gidman, E., Goodacre, R., Emmett, B., Smith, A. R. and Gwynn-Jones, D. (2003) Investigating plant-plant interference by metabolic fingerprinting. Phytochemistry, 63, 705-710. Grata, E., Guillarme, D., Glauser, G., Boccard, J., Carrupt, P. A., Veuthey, J. L., Rudaz, S. and Wolfender, J. L. (2009) Metabolite profiling of plant extracts by ultra-high-pressure liquid chromatography at elevated temperature coupled to time-of-flight mass spectrometry. J. Chromatography A, 1216, 5660-5668. Grunwald, C. (1975) Plant Sterols, Ann. Rev. Plant Physiol., 26, 209-236. Hagel, J. M. and Facchini, P. J. (2008) Plant metabolomics: analytical platforms and integration with functional genomics. Phytochem. Reviews, 7, 479-497. Hall, R. D. (2011) Plant metabolomics in a nutshell: potential and future challenges, In Hall. R. (Ed.), Annual plant reviews, Blackwell Publishing Ltd., 1-24. Hall, R. D., Beale, M., Fiehn, O., Hardy, N., Sumner, L. and Bino, R. (2002) Plant metabolomics: the missing link in functional genomics strategies. Plant Cell, 14, 1437-1440. Hall, R. D., Brouwer, I. D. and Fitzgerald, M. A. (2008) Plant metabolomics and its potential application for human nutrition. Physiologia Plantarum, 132, 162-175. Harada, K. and Fukusaki, E. (2009) Profiling of primary metabolite by means of capillary electrophoresis-mass spectrometry and its application for plant science. Plant Biotechnol., 26, 47-52.
References
106
Harmuth-Hoene, A.-E., Bogner, A. E., Kornemann, U. und Diehl, J. F. (1987) Der Einfluß der Keimung auf den Nährwert von Weizen, Mungbohnen und Kichererbsen. Z. Lebensm. Unters. Forsch., Springer Verlag, 185, 386-393. Harrigan, G. G. and Goodacre, R. (2003) Metabolic profiling: its role in biomarker discovery and gene function analysis. Boston, Kluwer Academic Publishers. Harrigan, G. G., Martino-Catt, S. and Glenn, K. C. (2007) Metabolomics, metabolic diversity and genetic variation in crops. Metabolomics, 3, 259-272. Harrigan, G. G., Stork, L.G., Riordan, S. G., Reynolds, T. L., Taylor, J. P., Masucci, J. D., Cao, Y., LeDeaux, J. R., Pandravada, A. and Glenn, K. C. (2009) Impact of environmental and genetic factors on expression of maize gene classes: relevance to grain composition. J. Food Comp. Anal., 22, 158–164. Harrigan, G. G., Lundry, D., Drury, S., Berman, K., Riordan, S. G., Nemeth, M. A., Ridley, W. P. and Glenn, K. C. (2010) Natural variation in crop composition and the impact of transgenesis. Nat. Biotechnol., 28, 402-404. Heldt, H. W. (2005) Pflanzenbiochemie. Spektrum Akademischer Verlag, Heidelberg. Hoekenga, O. A. (2008) Using metabolites to estimate unintended effects in transgenic crops plants: problems, promises and opportunities. J. Biomol. Tech., 19, 159-166. Horbowicz, M. and Obendorf, R. L. (1994) Seed desiccation tolerance and storability: dependence on flatulence-producing oligosaccharides and cyclitols – review and survey. Seed Sci. Res. 4, 385-405. Horning, M. C. and Horning, M. G. (1971) Metabolic profiles: gas-phase methods for analysis of metabolites. Clin. Chem., 17, 802-809. Huhman, D. V. and Sumner, L. W. (2002) Metabolic profiling of saponins in Medicago sativa and Medicago truncatula using HPLC coupled to an electrospray ion-trap mass spectrometer. Phytochemistry, 59, 347-360. Iijima, Y. and Aoki, K. (2009) Application of metabolomics to improve tomato fruit productivity and quality. J. Japanese Soc. Horticult. Sci., 78, 14-22. Ito, S. (2004) Marketing of value-added rice products in Japan: germinated brown rice and rice bread. Food and Agricultural Organization FAO rice conference, Rome, Italy. Johnson, H. E., Broadhurst, D., Kell, D. B., Theodorou, M. K., Merry, R. J. and Griffith, G. W. (2004) High-througphut metabolic fingerprinting of legume silage fermentations via Fourier transform infrared spectroscopy and chemometrics. Appl. Environ. Microbiol., 70, 1583-1592. Kamal-Eldin, A., Appelqvist, L. A., Yousif, G. and Iskander, G. M. (1992) Seed lipids of Sesamum indicum and related wild species in Sudan. The sterols. J. Sci. Food Agric., 59, 327-334.
References
107
Kao, H.-C. (1935) XXXI. Lipoid Metabolism In Mung Bean During Germination. Department of Chemistry, Yenching University, Peiping, China. Kavas, A. and El, S. N. (1991) Nutritive value of germinated mung beans and lentils. J. Consumer Stud. Home Econ., 15, 357-366. Khattak, A. B., Zeb, A., Bibi, N. and Khattak, M. S. (2008a) Effect of Germination Time and Type of Illumination on Proximate Compositions of Chickpea Seed (Cicer arietinum L.). Am. J. Food Tech., 3, 24-32. Khattak, A. B., Zeb, A. and Bibi, N. (2008b) Impact of germination time and type of illumination on carotenoid content, protein solubility and in vitro protein digestibility of chickpea (Cicer arietinum L.) sprouts. Food Chem., 109, 797-801. Kihara, M., Okada, Y., Iimure, T. and Ito, K. (2007) Accumulation and degradation of two functional constituents, GABA and ß-glucan, and their varietal differences in germinated barley grains. Breeding Sci., 57, 85-89. Kim, H. K., Choi, Y. H. and Verpoorte, R. (2010) NMR-based metabolomic analysis of plants. Nature Protocols, 5, 536-549. Kim, H. K., Choi, Y. H. and Verpoorte, R. (2011) NMR-based plant metabolomics: where do we stand, where do we go? Trends Biotechnol., 29, 267-275. King, R. D. and Puwastien, P. (1987) Effects of germination on the proximate composition and nutritional quality of winged bean (Psophocarpus tetragonolobus) seeds. J. Food Sci., 52, 106-108. Kirchhoff, E. (2008) Souci-Fachmann-Kraut, Food Composition and Nutrition Tables (7th ed.). MedPharm Scientific Publication, 2008, Stuttgart, Germany. Kopka, J., Fernie, A., Weckwerth, W., Gibon, Y. and Stitt, M. (2004) Metabolite profiling in plant biology: platforms and destinations. Genome Biology, 5, 109. Kopka, J., Schauer, N., Krueger, S., Birkemeyer, C., Usadel, B., Bergmüller, E., Dörmann, P., Gibon, Y., Stitt, M., Willmitzer, L., Fernie, A. R. and Steinhauser, D. (2005) GMD@CSBDB: The Golm Metabolome Database. Bioinformatics, 21, 1635–1638. Kovanpinarioo. (2008) The effect of sugar water on mung bean plants. http://www.kovanpinarioo.com/health/the_effects_of_sugar_water_on_mung_bean_plants/ :last accessed: June 2012. König, A., Cockburn, A., Crevel, R. W. R., Debruyne, E., Grafstroem, R., Hammerling, U., Kimbe, I., Knudsen, I., Kuiper, H. A., Peijnenburg, A. A. C. M., Penninks, A. H., Poulsen, M., Schauzu, M. and Wal, J. M. (2004) Assessment of the safety of foods derived from genetically modified (GM) crops. Food Chem. Toxicol., 42, 1047-1088. Krishnan, P., Kruger, N. J. and Ratcliffe, R. G. (2005) Metabolite fingerprinting and profiling in plants using NMR. J. Exp. Bot., 56, 255-265.
References
108
Kuiper, H. A., Kok, E. J. and Engel, K.-H. (2003) Exploitation of molecular profiling techniques for GM food safety assessment. Curr. Opin. Biotech., 14, 238-243. Kuo, Y.-H., Rozan, P., Lambein, F., Frias, J. and Vidal-Valverde, C. (2003) Effects of different germination conditions on the contents of free protein and non-protein amino acids of commercial legumes, Food Chem., 86, 537-545. Kusano, M., Fukushima, A., Kobayashi, M., Hayashi, N., Jonsson, P., Moritz, T., Ebana, K. and Saito, K. (2007) Application of metabolomic method combining one-dimensional and two-dimensional gas chromatography-time-of-flight/mass spectrometry to metabolic phenotyping of natural variants in rice. J. Chromatography B, 855, 71-79. Kutschera, U. (2002) Prinzipien der Pflanzenphysiologie. 2. Aufl. Spektrum Akademischer Verlag, Heidelberg, Berlin. Lal, G. and Shanmugasundaram, S. (1971) Mung bean sprout production. AVRDC Training Guide. Lawn, R.J. and Ahn, C.S. (1985) Mung bean (Vigna radiata (L.) Wilczek/ Vigna mungo (L.) in Roberts, R. J., Collins, E. H. (Eds.), Hepper in grain legume crops, Summerfield, 13, 584-624. Leiss, K. A., Choi, Y. H., Verpoorte, R. and Klinkhamer, P. G. L. (2011) An overview of NMR-based metabolomics to identify secondary plant compounds involved in host plant resistance. Phytochem. Rev., 10, 205-216. Lipton, W.J., Asai, W. K. and Fouse, D. C. (1981) Deterioration and CO2 and ethylene production of stored Mung bean sprouts. J. Amer. Soc. Hort. Sci., 106, 817-820. Lumpkin, T.A. and McClary, D.C. (1994) Azuki Bean Botany, Production and Uses. Cab Int. Maltese, F. and Verpoorte, R. (2010) Metabolomics: novel tool for studying complex biological systems, In Jain, S. M. and Brar, D. S. (Eds.), Molecular techniques in crop improvement, Springer, 493-510. McKinney, L. L., Weakley, F. B., Campbell, R. E. and Cowan, J. C. (1958) Changes in the composition of soybeans on sprouting. J. Am. Oil Chem. Society, 35, 364-366. Mogotsi, K.K. (2006) Vigna radiata (L.) R.Wilczek. [Internet] Record from Protabase. Brink, M. & Belay, G. (Editors). PROTA (Plant Resources of Tropical Africa/ Ressources végétales de l’Afrique tropicale), Wageningen, Netherlands. http://database.prota.org/search.htm; last accessed: June 2012. Mohle-Boetani, J. C., Farrar, J., Bradley, P., Barak, J. D., Miller, M., Mandrell, R., Mead, P., Keene, W. E., Cummings, K., Abbott, S. and Werner, S. B. (2009) Salmonella infections associated with mung bean sprouts: epidemiological and environmental investigations. Epidemiol. Infect., 137, 357-366.
References
109
Moritz, T. and Johansson, A. I. (2008) Plant metabolomics, In Griffiths, W. J. (Ed.), Metabolomics, Metabonomics and Metabolite Profiling. RSC Publishing, 254-272. Morohashi, Y. and Shimokoriyama, M. (1972) Physiological Studie on Germination of Phaseolus mungo seeds. J. Exp. Botany, 23, 45-53. Morton, F., Smith, R. E. and Poelman, J. M. (1982) The mungbean. Special publication of the college of agricultural sciences, department of agronomy and soils, Mayaguez, Puertorico. Mubarak, A. E. (2005) Nutritional composition and antinutritional factors of mung bean seeds (Phaseolus aureus) as affected by some home traditional processes. Food Chem., 89, 489-495. Mulyowidarso, R. K., Fleet, G. H. and Buckle, K. A. (1991) Changes in the concentration of organic acids during the soaking of soybeans for tempe production. Int. J. Food Sci. & Technol., 26, 607-614. Munoz, M., De Ancos, B., Sánchez-Moreno, C. and Pilar Cano, M. (2006) Evaluation of chemical and physical (high-pressure and temperature) treatmetns to improve the safety of minimally processed mung bean sprouts during refrigerated storage. J. Food Prot., 69, 2395-2402. Munshi, S. K., Sandhu, S. and Sharma, S. (2007) Lipid composition in fast and slow germinating sunflower (Helianthus Annuus L.) seeds. Gen. Appl. Plant Physiol., 33, 235-246. Nagaoka, H. (2005) Treatment of germinated wheat to increase levels of GABA and IP6 catalyzed by endogenous enzymes. Biotechnol. Progress, 21, 405-410. Ngampongsai, S., Watanasit, A., Srisombun, S., Srinives, P. and Masaria, A., (2008) Current Status of Mungbean and the Use of Mutation Breeding in Thailand. International Symposium on Induced Mutations in Plants, Aug 12-15, Vienna, Austria. Noteborn, H. P., Lommen, A., van der Jagt, R. C. and Weseman, J. M. (2000) Chemical fingerprinting for the evaluation of unintended secondary metabolic changes in transgenic food crops. J. Biotechnol., 28, 77, 103-114. Office of Agricultural Economics, Ministry of Agriculture and Co-operatives. (2006), Agricultural Statistics of Thailand Crop Year 2004/2005. Agricultural Statistics. Bangkok, Thailand. Ohta, D., Shibata, D. and Kanaya, S. (2007) Metabolic profiling using Fourier-transform ion-cyclotron-resonance mass spectrometry. Anal. Bioanal. Chem., 389, 1469-1475. Oliver, S. G., Winson, M. K., Kell, D. B. and Baganz, F. (1998) Systematic functional analysis of the yeast genome. Trends Biotechnol., 16, 373-378.
References
110
Oplinger, E.S., Hardman, L.L., Kaminski, A.R., Combs S.M. and Doll J.B. (1990) Mungbean, In Alternative Field Crops Manual, Univ. Winsconsin, Cooperative Extension Services, Madison. Palomino-Schätzlein, M., Escrig, P. V., Boira, H., Primo, J., Pineda-Lucena, A. and Cabedo, N. (2011) Evaluation of nonpolar metabolites in plant extracts by 13C NMR spectroscopy. J. Agric. Food Chem., 59, 11407-11416. Paul, A. K. and Mukherjee, S. (1972) Change in respiration rate of rice seedlings as affected by storage and viability and its possible relation with catalase and peroxidase activities during germination. Biol. Plantarum, 14, 114-419. Pauling, L., Robinson, A. B., Teranishi, R. and Cary, P. (1971) Quantitative analysis of urine vapour and breath by gas-liquid partition chromatography. Proc. Natl. Acad. Sci. USA, 68, 2374-2376. Peňas, E., Gómez, R., Frías, J. and Vidal-Valverde, C. (2010) Effects of combined treatments of high pressure, temperature and antimicrobial products on germination of mung bean seeds and microbial quality of sprouts. Food Control, 21, 82-88. Piara Singh, V. D., Chinh, N.T., Pongkanjana, A., Prasad, K.S., Srinivas, K., and Wani, S. P. (2006) Potential productivity and yield gap of selected crops in the rainfed regions of India, Thailand, and Vietnam. SAT eJournal, 2, 1-33. Pierce, K. M., Hope, J. L., Hoggard, J. C. and Synovec, R. E. (2006) A principal component analysis based method to discover chemical differences in comprehensive two-dimensional gas chromatography with time-of-flight mass spectrometry (GCxGC-TOFMS) separations of metabolites in plant samples. Talanta, 70, 797-804. Poehlman, J. M. (1991) The Mungbean. Westview Press, Colerado. Promila, K., and Kumar, S. (2000) Vigna radiata seed germination under salinity. Biol. Plantarum, 43, 423–426. Pulse foods (2009) Processing, quality and nutraceutical applications. http://www.pulsefood.com.au/ :last accessed: June 2012. Ramautar, R., Mayboroda, O. A., Somsen, G. W. and de Jong, G. J. (2011) CE-MS for metabolomics: developments and applications in the period 2008-2010. Electrophoresis, 32, 52-65. Ricroch, A. E., Bergé, J. B. and Kuntz, M. (2011) Evaluation of genetically engineered crops using transcriptomics, proteomic and metabolomic profiling techniques. Plant Physiol., 155, 1752-1761. Roessner, U., Wagner, C., Kopka, J., Trethewey, R. N., and Willmitzer, L. (2000) Simultaneous analysis of metabolites in potato tuber by gas chromatography-mass spectrometry. Plant J., 23, 131-142.
References
111
Roessner, U., Luedemann, A., Brust, D., Fiehn, O., Linke, T., Willmitzer, L. and Fernie, A. R. (2001) Metabolic profiling allows comprehensive phenotyping of genetically or environmentally modified plant systems. Plant Cell, 13, 11-29. Röhlig, R. M., Eder, J. and Engel, K.-H. (2009) Metabolite profiling of maize grain: differentiation due to genetics and environment. Metabolomics, 5, 459-477. Röhlig, R. M. and Engel, K.-H. (2010) Influence of the input system (conventional versus organic farming) on metabolite profiles of maize (Zea mays) kernels. J. Agric. Food Chem., 58, 3022-3030. Saito, K. and Matsuda, F. (2010) Metabolomics for functional genomics, systems biology, and biotechnology. Annu. Rev. Plant Biol., 61, 463-489. Sandhu, J. S. and Saxena, A. K. (2003) Variability and association of nutritional quality traits of mungbean mutants. Indian J. Pulses Res. 16, 54-55. Sangsiri, C., Sorajjapinun, W. and Srinives, P. (2005) Gamma radiation Iiduced mutations in mungbean. Sci. Asia., 31, 251-255. Santalla, M., Deron, A. M. and Casquero, P. A. (1995) Nutritional and culinary quality of bush bean populations intercropped with maize. Euphytica, 84, 57-65. Saito, K. and Matsuda, F. (2010) Metabolomics for functional genomics, systems biology, and biotechnology. Annu. Rev. Plant Biol., 61, 463-489. Sauter, H., Lauer, M. and Fritsch, H. (1991) Metabolic profiling of plants – a new diagnostic technique, In Baker, D. R., Fenyes, J. G., Moberg, M. K. (Eds.), Synthesis and chemistry of agrochemicals II. ACS Symposium Series 443, Washington. Savage, G. P. (1990) Nutritional value of sprouted mung beans. Nutrition Today, May/June, 21-24. Schauer, N., Zamir, D. and Fernie, A. R. (2005) Metabolic profiling of leaves and fruit of wild species tomato: a survey of the Solanum lycopersicum complex. J. Exp. Bot., 410, 297-307. Schrader, W. L. (2002) Sprout production in California. Publication 8060, University of California. Schripsema, J. (2010) Application of NMR in plant metabolomics: techniques, problems and prospects. Phytochem Anal., 21, 14-21. Shanmugasundaram, S. (2008) Exploit mungbean with value added products. Acta Hort. 752, 99-102. Shanmugasundaram, S., Keatinge, J. D. H. and Hughes, J. (2009) Counting on beans:Mungbean improvement in Asia, in Spielman, D. J. and Pandya ‐Lorch, R. (Eds.), Millionsfed: Proven successes in agricultural development. IFPRI, Washington DC.
References
112
Shellie, K. C. and Hosfield, G. L. (1991) Genotype x environmental effects on food quality of common bean: resource-efficient testing procedures. J. Am. Soc. Hort. Sci. 116, 732-736. Shepherd, L. V. T., Alexander, C. A., Sungurtas, J., A., McNicol, J. W., Stewart, D. and Davies, H. V. (2010) Metabolomic analysis of the potato tuber life cycle. Metabolomics, 6, 274-291. Shi, H., Nam, P. K. and Ma, Y. (2010) Comprehensive profiling of isoflavones, phytosterols, tocopherols, minerals, crude protein, lipid, and sugar during soybean (Glycine max) germination. J. Agric. Food Chem., 58, 4970-4976. Shintu, L., Le Gall, G. and Colquhoun, I. J. (2009) Metabolomics and the detection of unintended effects in genetically modified crops, In Osbourn, A. E. and Lanzotti, V. (Eds.), Plant-derived Natural Products, Part 4, Springer, 505-531. Shu, X.-L., Frank, T., Shu, Q.-Y. and Engel, K.-H. (2008) Metabolite profiling of germinating rice seeds. J. Agric. Food Chem., 56, 11612-11620. Shulaev, V., Cortes, D., Miller, G. and Mittler, R. (2008) Metabolomics for plant stress response. Physiol. Plantarum, 132, 199-208. Spring. (2002) Plant-based nutrition. Newsletter, 2, Institute for Plant-Based Nutrition, Pensylvania, USA. Steinfath, M., Strehmel, N., Peters, R., Schauer, N., Groth, D., Hummel, J., Steup, M., Selbig, J., Kopka, J., Geigenberger, P. and van Dongen, J. T. (2010) Discovering plant metabolic biomarkers for phenotype prediction using an untargeted approach. Plant Biotechnol. J., 8, 900-911. Steinhauser, D. and Kopka, J. (2007) Methods, applications and concepts of metabolite profiling: primary metabolism, In Baginsky, S. and Fernie, A. R. (Eds.), Plant systems biology, Birkhäuser Verlag, 171-194. Strasburger E. and Benecke, W. (1913) Zellen- und Gewebelehre. Morphologie und Entwicklungsgeschichte. I: Botanischer Teil. Verlag von Teubner B., Leipzig, Berlin. Sumner, L. W., Mendes, P. and Dixon, R. A. (2003) Plant metabolomics: large-scale phytochemistry in the functional genomics era. Phytochemistry, 62, 817-836. Taormina, P. J., Beuchat, L. R. and Slutsker, L. (1999) Infections associated with eating seed sprouts: an international concern. Emerg. Infect. Dis., 5, 626-634. Tarpley, L., Duran, A. L., Kebrom, T. H. and Sumner, L. W. (2005) Biomarker metabolites capturing the metabolite variance present in a rice plant developmental period. BMC Plant Biol., 5, 8. Theodoridis, G., Gika, H. and Wilson, I. (2008) LC-MS-based methodology for global metabolite profiling metabonomics / metabolomics. Trends Anal. Chem., 27, 251-260.
References
113
Thompson, I. U., Hung, L., Wang, N., Rapser, V., and Gade, H. (1976) Preparation of mung bean flour and its application in bread making. Can. Ins. Food Sci. Tech. J., 9, 1–7. Thompson, R., Burstin, J. and Gallardo, K. (2009) Post-genomics studies of developmental processes in legume seeds. Plant Physiol., 151, 1023-1029. Titapiwatanakun, B. (1990) Production and marketing of mung beans in Thailand: the role of private sector. The CGPRT Centre, Working Paper Series. Tohge, T. and Fernie, A. R. (2010) Combining genetic diversity, informatics and metabolomics to facilitate annotation of plant gene function. Nature Protocols, 5, 1210-1227. Trethewey, R. N. (2006) Plant metabolite profiling for industrial applications, In Saito, K., Dixon, R. A. and Willmitzer, L. (Eds.), Biotechnology in agriculture and forestry, Vol. 57, Plant metabolomics, Springer, 327-339. Trethewey, R. N., Krotzky, A. J. and Willmitzer, L. (1999) Metabolic profiling: a rosetta stone for genomics. Curr. Opin. Plant Biol., 2, 83-85. Tsou, S. C. S., Kan, K. K., and Lee, Y. H. (1985) Introduction of soybean processing products and preparation of mungbean sprouts. TVIS New, 1, 2-3. USDA/ARS Food Safety and Health Research Unit. (2000) Safety sprouts. Agricultural Research. Varoquaux, P., Albagnac, G., Nguyen-The, C. and Varoquaux, F. (1996) Modified atmosphere packaging of fresh bean sprouts. J. Sci. Food. Agr. 70, 224-230. Verpoorte, R., Choi, Y. H. and Kim, H. K. (2007) NMR-based metabolomics at work in phytochemistry. Phytochem Rev., 6, 3-14. Weckwerth, W. (2003) Metabolomics in systems biology. Ann. Rev. Plant Biol., 54, 669-689. Weiss, A., Hertel, C., Grothe, S., Diep, H., and Hammes, W. P. (2007) Characterization of the cultivable microbiota of sprouts and their potential for application as protective cultures. Syst. Appl. Microbiol. 30, 483-493. Wilson, I. D., Nicholson, J. K., Castro-Perez, J., Granger, J. H., Johnson, K. A., Smith, B. W. and Plumb, R. S. (2005) High-resolution “ultra performance” liquid chromatography coupled to oa-TOF mass spectrometry as a tool for differential metabolic pathway profiling in functional genomic studies. J. Proteome Res., 4, 591-598. Wishart, D. S. (2008) Metabolomics: applications to food science and nutrition research. Trends in Food Sci. Tech., 19, 482–493.
References
114
Wongpiyasatid, A., Chotchuen S., Hormchan P., Ngampongsai S., Lamsrijan S., and Pichitporn S. (1998) Mutant Mungbean Lines from Radiation and Chemical Induction, Kasetsart J. Nat. Sci., 32, 203-212. Wongpiyasatid, A., Chotchuen S., Hormchan P. and Srihattagum, M. (1999) Evaluation of Yield and Resistance to Powdery Mildew, Cercospora Leaf Spot and Cowpea Weevil in Mungbean Mutant Lines, Kasersart J. Nat. Sci., 33, 204-215. Xu, Z., and Godber, J. S. (1999) Purification and identification of components of Ɣ-oryzanol in rice bran oil. J. Agri. Food Chem., 47, 2724–2728. Zhang, H., Vasanthan, T., and Wettasinghe, M. (2007) Enrichment of tocopherols and phytosterols in canola oil during seed germination. J. Agri. Food Chem., 55, 355–359. Zia-Ul-Haq, M., Ahmad, M. and Iqbal, S. (2008) Characteristics of oil from seeds of 4 mungbean [Vigna radiata (L.) Wilczek] cultivars grown in Pakistan. J. Am. Oil Chem. Soc., 85, 851-856. Zörb, C., Langenkämper, G., Betsche, T., Niehaus, K. and Barsch, A. (2006) Metabolite profiling of wheat grains (Triticum aestivum L.) from organic and conventional agriculture. J. Agric. Food Chem., 54, 8301-8306.

CURRICULUM VITAE
Personal information Name: Kriskamol Na Jom
Place of birth: Ratchaburi, Thailand
Date of birth: 23. November 1981
Marital status: Single
Education 1988-1994 Primary school, Bangkok, Thailand
1994-1997 Secondary school, Bangkok, Thailand
1997-2000 High school, Bangkok, Thailand
Academic studies 2000-2004 Kasetsart University, Bachelor of Science (General Science)
2004-2007 Mahidol University, Master of Science (Biotechnology)
Working Experience 2002 Internship, Unilever Thai Holding Ltd., Bangkok, Thailand
2003 Internship, Faculty of Civil Engineering, University of Strathclyde,
Glasgow, United Kingdom
2007/2008 Research assistant, Department of Biotechnology, Faculty of
Science, Mahidol University, Bangkok, Thailand
Scientific activity since 10/2008 Ph.D. student at the Chair of General Food Technology, Univ.-
Prof. Dr. K.-H. Engel, Technische Universität München


![Vigna subterranea (L.) Verdc.] using novel high-throughput ...hypogaea L.) (Howell et al., 1994). In more arid parts of sub-Saharan Africa like Namibia, it is second only to cowpea](https://img.pdfslide.org/doc/110x75/607560887c40ab757a376301/vigna-subterranea-l-verdc-using-novel-high-throughput-hypogaea-l-howell.jpg)