Embed Size (px)
Citation preview
Sehr geehrte Damen und Herren,
für Rückfragen zu der beigefügten Publikation „IPO Watch Europe Q4 2015“ stehen Ihnen folgende Ansprechpartner gerne zur Verfügung:
Nadja [email protected]. +49 211 981-2978
Christoph [email protected]. +49 69 9585-3415
Dirk [email protected]. +49 89 5790-5806
Dr. Rüdiger [email protected]. +49 211 981-2839
PwC IPO CentreQ4 2015 Equity Capital Markets Briefing
PwC provides independent guidance to companies in the process of going public and to already listed companies in assessing their position in the equity capital markets.
Edition: 2015, the year in review
Martin [email protected]
Clifford [email protected]
Nadja [email protected]
Jan-Willem de [email protected]
PwC
Q4 2015
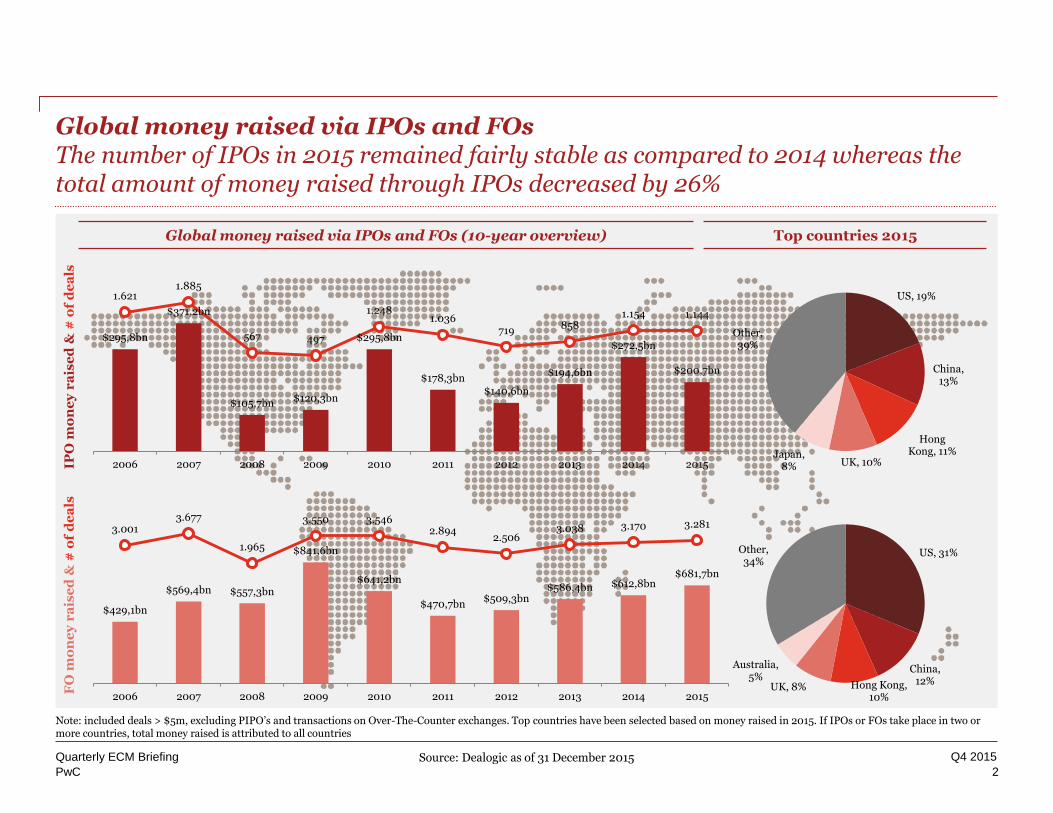
Global money raised via IPOs and FOsThe number of IPOs in 2015 remained fairly stable as compared to 2014 whereas the total amount of money raised through IPOs decreased by 26%
2
Quarterly ECM Briefing
Global money raised via IPOs and FOs (10-year overview)
IPO
mo
ne
y r
ais
ed
& #
of
de
als
FO
mo
ne
y r
ais
ed
& #
of
de
als
Top countries 2015
Source: Dealogic as of 31 December 2015
Note: included deals > $5m, excluding PIPO’s and transactions on Over-The-Counter exchanges. Top countries have been selected based on money raised in 2015. If IPOs or FOs take place in two or more countries, total money raised is attributed to all countries
$429,1bn
$569,4bn $557,3bn
$841,6bn
$641,2bn
$470,7bn$509,3bn
$586,4bn $612,8bn$681,7bn
3.0013.677
1.965
3.550 3.5462.894
2.5063.038 3.170 3.281
2006 2007 2008 2009 2010 2011 2012 2013 2014 2015
$295,8bn
$371,2bn
$105,7bn $120,3bn
$295,8bn
$178,3bn
$140,6bn
$194,6bn
$272,5bn
$200,7bn
1.6211.885
567 497
1.2481.036
719858
1.154 1.144
2006 2007 2008 2009 2010 2011 2012 2013 2014 2015
US, 31%
China, 12%Hong Kong,
10%UK, 8%
Australia, 5%
Other, 34%
US, 19%
China, 13%
Hong Kong, 11%
UK, 10%Japan,
8%
Other, 39%
PwC
Q4 2015
3
Quarterly ECM Briefing Source: Dealogic, Bloomberg as of 31 2015
Note: included deals > $5m, excluding PIPO’s and transactions on Over-The-Counter exchanges. IPOs are classified as ‘In Range’ if the IPO is priced in the middle 50% of the price range. The top and bottom 25% are classified as ‘Top of Range’ and ‘Bottom of Range’
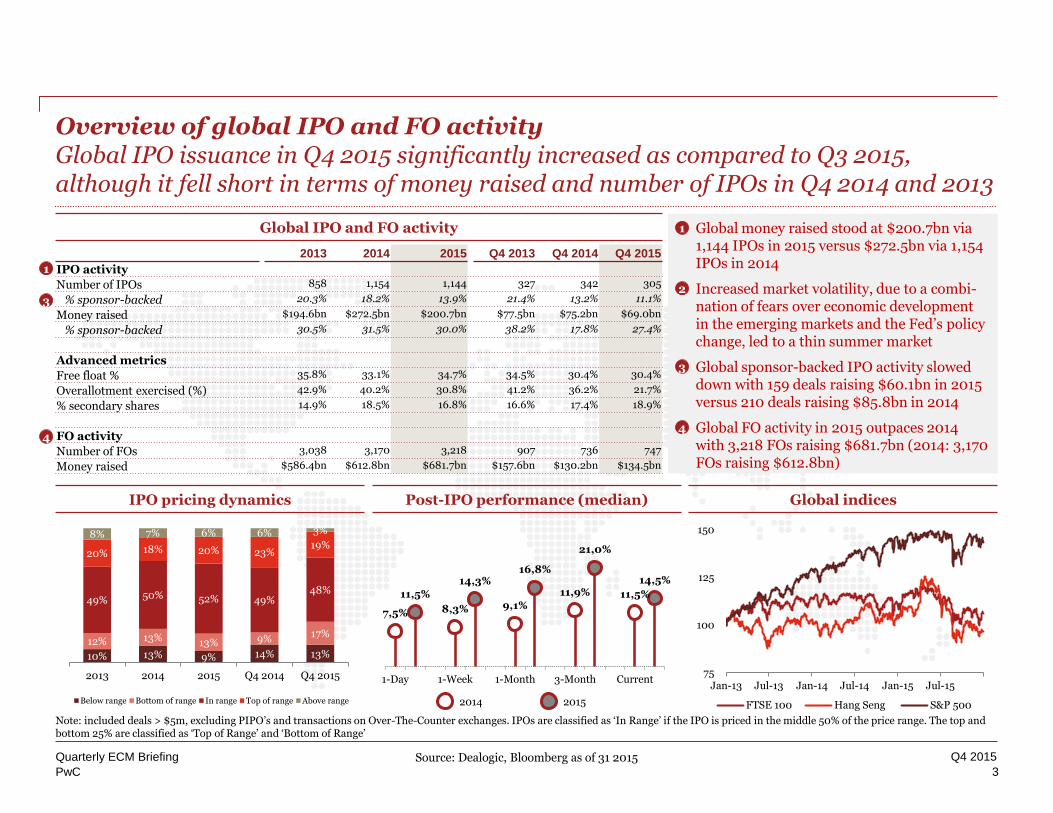
Overview of global IPO and FO activityGlobal IPO issuance in Q4 2015 significantly increased as compared to Q3 2015, although it fell short in terms of money raised and number of IPOs in Q4 2014 and 2013
Global IPO and FO activity
2013 2014 2015 Q4 2013 Q4 2014 Q4 2015
IPO activity
Number of IPOs 858 1,154 1,144 327 342 305
% sponsor-backed 20.3% 18.2% 13.9% 21.4% 13.2% 11.1%
Money raised $194.6bn $272.5bn $200.7bn $77.5bn $75.2bn $69.0bn
% sponsor-backed 30.5% 31.5% 30.0% 38.2% 17.8% 27.4%
Advanced metrics
Free float % 35.8% 33.1% 34.7% 34.5% 30.4% 30.4%
Overallotment exercised (%) 42.9% 40.2% 30.8% 41.2% 36.2% 21.7%
% secondary shares 14.9% 18.5% 16.8% 16.6% 17.4% 18.9%
FO activity
Number of FOs 3,038 3,170 3,218 907 736 747
Money raised $586.4bn $612.8bn $681.7bn $157.6bn $130.2bn $134.5bn
• Global money raised stood at $200.7bn via 1,144 IPOs in 2015 versus $272.5bn via 1,154 IPOs in 2014
• Increased market volatility, due to a combi-nation of fears over economic development in the emerging markets and the Fed’s policy change, led to a thin summer market
• Global sponsor-backed IPO activity slowed down with 159 deals raising $60.1bn in 2015 versus 210 deals raising $85.8bn in 2014
• Global FO activity in 2015 outpaces 2014 with 3,218 FOs raising $681.7bn (2014: 3,170 FOs raising $612.8bn)
1
2
3
4
3
4
Global indicesIPO pricing dynamics Post-IPO performance (median)
1
2014YTD 2015YTD
10% 13% 9% 14% 13%12% 13% 13% 9% 17%
49% 50% 52% 49%48%
20% 18% 20% 23%19%
8% 7% 6% 6% 3%
2013 2014 2015 Q4 2014 Q4 2015
Below range Bottom of range In range Top of range Above range
75
100
125
150
Jan-13 Jul-13 Jan-14 Jul-14 Jan-15 Jul-15
FTSE 100 Hang Seng S&P 500
7,5%
11,5%
8,3%
14,3%
9,1%
16,8%
11,9%
21,0%
11,5%
14,5%
1-Day 1-Week 1-Month 3-Month Current
PwC
Q4 2015
Note: included deals > $5m, excluding PIPO’s and transactions on Over-The-Counter exchanges. Country indicates the company’s Country of domicile. Sector classification is based on the Industry Classification Benchmark (ICB).
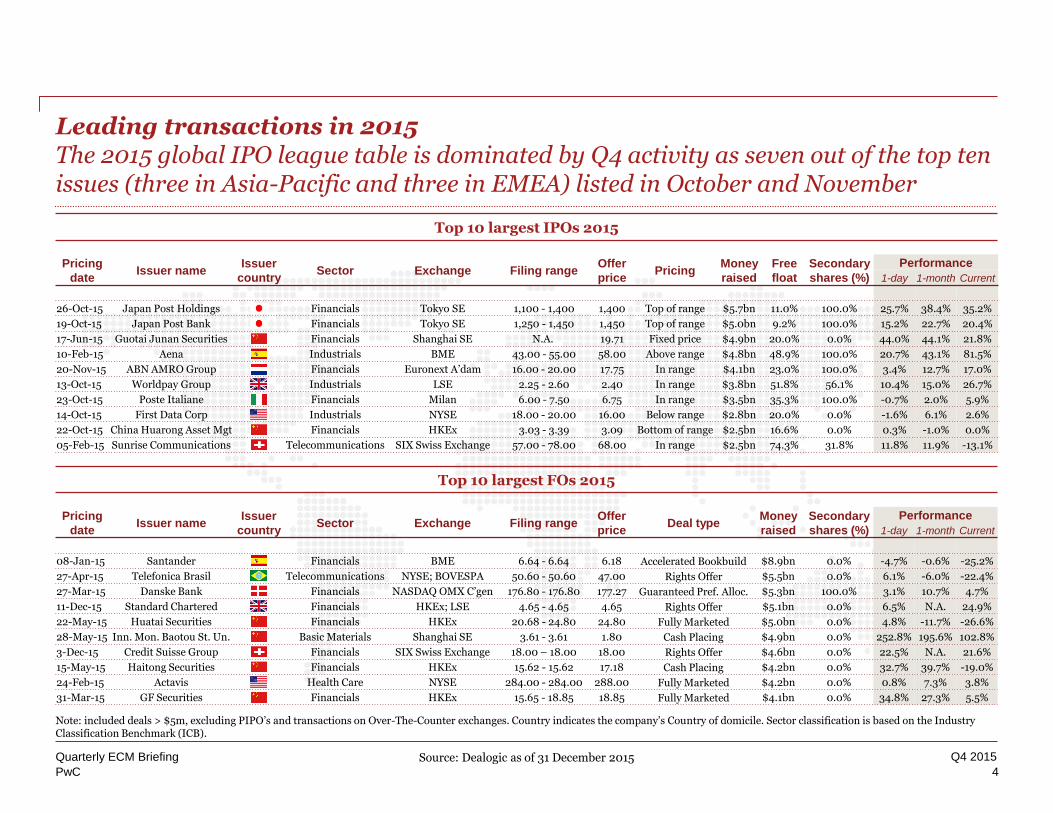
Leading transactions in 2015The 2015 global IPO league table is dominated by Q4 activity as seven out of the top ten issues (three in Asia-Pacific and three in EMEA) listed in October and November
4
Quarterly ECM Briefing
Top 10 largest IPOs 2015
Pricing
dateIssuer name
Issuer
countrySector Exchange Filing range
Offer
pricePricing
Money
raised
Free
float
Secondary
shares (%)
Performance
1-day 1-month Current
26-Oct-15 Japan Post Holdings Financials Tokyo SE 1,100 - 1,400 1,400 Top of range $5.7bn 11.0% 100.0% 25.7% 38.4% 35.2%
19-Oct-15 Japan Post Bank Financials Tokyo SE 1,250 - 1,450 1,450 Top of range $5.0bn 9.2% 100.0% 15.2% 22.7% 20.4%
17-Jun-15 Guotai Junan Securities Financials Shanghai SE N.A. 19.71 Fixed price $4.9bn 20.0% 0.0% 44.0% 44.1% 21.8%
10-Feb-15 Aena Industrials BME 43.00 - 55.00 58.00 Above range $4.8bn 48.9% 100.0% 20.7% 43.1% 81.5%
20-Nov-15 ABN AMRO Group Financials Euronext A’dam 16.00 - 20.00 17.75 In range $4.1bn 23.0% 100.0% 3.4% 12.7% 17.0%
13-Oct-15 Worldpay Group Industrials LSE 2.25 - 2.60 2.40 In range $3.8bn 51.8% 56.1% 10.4% 15.0% 26.7%
23-Oct-15 Poste Italiane Financials Milan 6.00 - 7.50 6.75 In range $3.5bn 35.3% 100.0% -0.7% 2.0% 5.9%
14-Oct-15 First Data Corp Industrials NYSE 18.00 - 20.00 16.00 Below range $2.8bn 20.0% 0.0% -1.6% 6.1% 2.6%
22-Oct-15 China Huarong Asset Mgt Financials HKEx 3.03 - 3.39 3.09 Bottom of range $2.5bn 16.6% 0.0% 0.3% -1.0% 0.0%
05-Feb-15 Sunrise Communications Telecommunications SIX Swiss Exchange 57.00 - 78.00 68.00 In range $2.5bn 74.3% 31.8% 11.8% 11.9% -13.1%
Top 10 largest FOs 2015
Pricing
dateIssuer name
Issuer
countrySector Exchange Filing range
Offer
priceDeal type
Money
raised
Secondary
shares (%)
Performance
1-day 1-month Current
08-Jan-15 Santander Financials BME 6.64 - 6.64 6.18 Accelerated Bookbuild $8.9bn 0.0% -4.7% -0.6% -25.2%
27-Apr-15 Telefonica Brasil Telecommunications NYSE; BOVESPA 50.60 - 50.60 47.00 Rights Offer $5.5bn 0.0% 6.1% -6.0% -22.4%
27-Mar-15 Danske Bank Financials NASDAQ OMX C’gen 176.80 - 176.80 177.27 Guaranteed Pref. Alloc. $5.3bn 100.0% 3.1% 10.7% 4.7%
11-Dec-15 Standard Chartered Financials HKEx; LSE 4.65 - 4.65 4.65 Rights Offer $5.1bn 0.0% 6.5% N.A. 24.9%
22-May-15 Huatai Securities Financials HKEx 20.68 - 24.80 24.80 Fully Marketed $5.0bn 0.0% 4.8% -11.7% -26.6%
28-May-15 Inn. Mon. Baotou St. Un. Basic Materials Shanghai SE 3.61 - 3.61 1.80 Cash Placing $4.9bn 0.0% 252.8% 195.6% 102.8%
3-Dec-15 Credit Suisse Group Financials SIX Swiss Exchange 18.00 – 18.00 18.00 Rights Offer $4.6bn 0.0% 22.5% N.A. 21.6%
15-May-15 Haitong Securities Financials HKEx 15.62 - 15.62 17.18 Cash Placing $4.2bn 0.0% 32.7% 39.7% -19.0%
24-Feb-15 Actavis Health Care NYSE 284.00 - 284.00 288.00 Fully Marketed $4.2bn 0.0% 0.8% 7.3% 3.8%
31-Mar-15 GF Securities Financials HKEx 15.65 - 18.85 18.85 Fully Marketed $4.1bn 0.0% 34.8% 27.3% 5.5%
Source: Dealogic as of 31 December 2015
PwC
Q4 2015
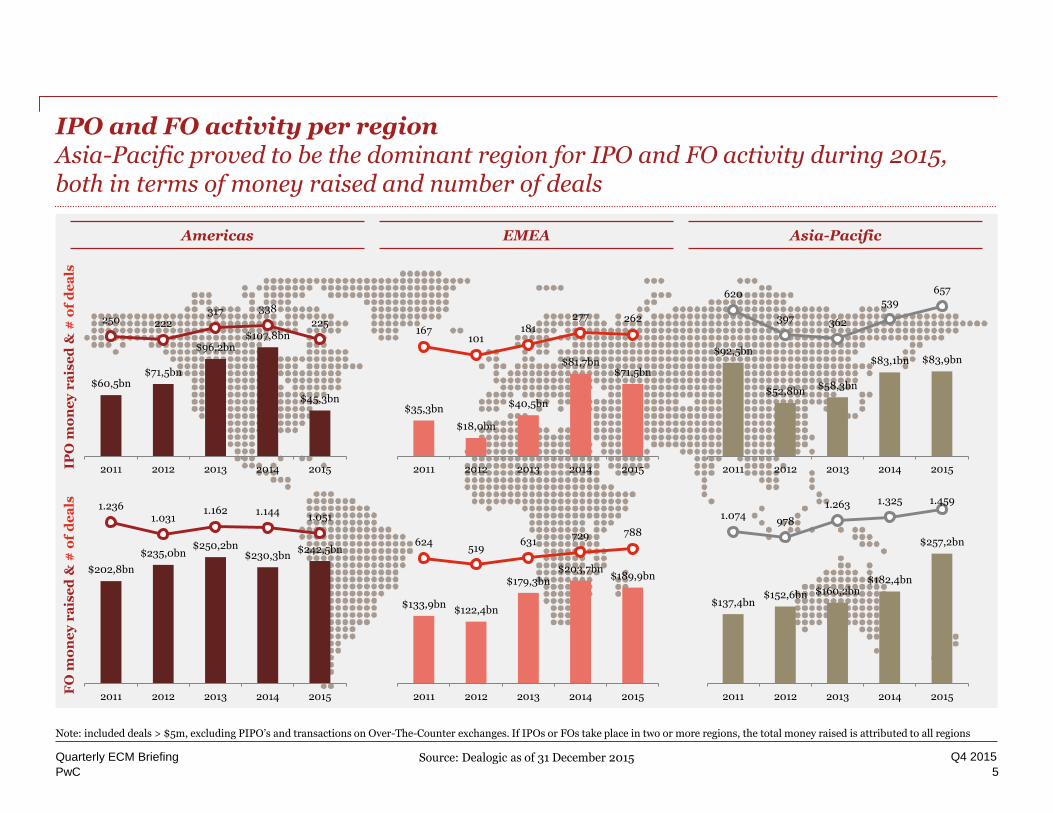
IPO and FO activity per regionAsia-Pacific proved to be the dominant region for IPO and FO activity during 2015, both in terms of money raised and number of deals
5
Quarterly ECM Briefing
Americas EMEA Asia-Pacific
IPO
mo
ne
y r
ais
ed
& #
of
de
als
FO
mo
ne
y r
ais
ed
& #
of
de
als
Note: included deals > $5m, excluding PIPO’s and transactions on Over-The-Counter exchanges. If IPOs or FOs take place in two or more regions, the total money raised is attributed to all regions
Source: Dealogic as of 31 December 2015
$60,5bn$71,5bn
$96,2bn$107,8bn
$45,3bn
250 222317 338
225
2011 2012 2013 2014 2015
$202,8bn
$235,0bn$250,2bn
$230,3bn$242,5bn
1.2361.031
1.162 1.1441.051
2011 2012 2013 2014 2015
$92,5bn
$52,8bn$58,3bn
$83,1bn $83,9bn
620
397 362
539
657
2011 2012 2013 2014 2015
$137,4bn$152,6bn $160,2bn
$182,4bn
$257,2bn
1.074978
1.263 1.325 1.459
2011 2012 2013 2014 2015
$35,3bn
$18,0bn
$40,5bn
$81,7bn$71,5bn
167101
181277 262
2011 2012 2013 2014 2015
$133,9bn$122,4bn
$179,3bn$203,7bn
$189,9bn
624519
631729 788
2011 2012 2013 2014 2015
PwC
Q4 2015
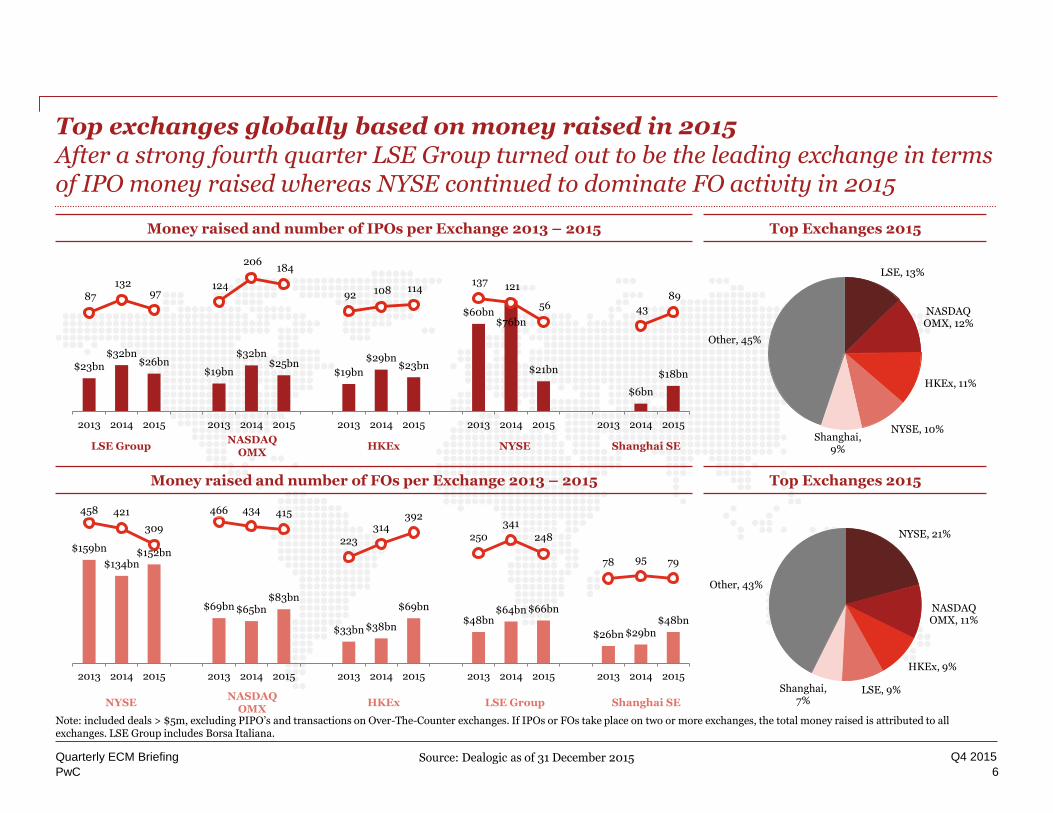
Top exchanges globally based on money raised in 2015After a strong fourth quarter LSE Group turned out to be the leading exchange in terms of IPO money raised whereas NYSE continued to dominate FO activity in 2015
6
Quarterly ECM Briefing
Note: included deals > $5m, excluding PIPO’s and transactions on Over-The-Counter exchanges. If IPOs or FOs take place on two or more exchanges, the total money raised is attributed to all exchanges. LSE Group includes Borsa Italiana.
Money raised and number of FOs per Exchange 2013 – 2015
Money raised and number of IPOs per Exchange 2013 – 2015 Top Exchanges 2015
Top Exchanges 2015
NASDAQ OMX
HKEx NYSELSE Group Shanghai SE
NYSE Shanghai SENASDAQ
OMXLSE GroupHKEx
LSE, 13%
NASDAQ OMX, 12%
HKEx, 11%
NYSE, 10%Shanghai,
9%
Other, 45%
$23bn
$32bn$26bn
$19bn
$32bn$25bn
$19bn
$29bn$23bn
$60bn$76bn
$21bn
$6bn
$18bn
87
132 97
124
206 184
92 108 114 137 121
56 43
89
2013 2014 2015 2013 2014 2015 2013 2014 2015 2013 2014 2015 2013 2014 2015
$159bn
$134bn$152bn
$69bn $65bn$83bn
$33bn $38bn
$69bn
$48bn$64bn $66bn
$26bn $29bn$48bn
458 421
309
466 434 415
223
314392
250
341
248
78 95 79
2013 2014 2015 2013 2014 2015 2013 2014 2015 2013 2014 2015 2013 2014 2015
NYSE, 21%
NASDAQ OMX, 11%
HKEx, 9%
LSE, 9%Shanghai, 7%
Other, 43%
Source: Dealogic as of 31 December 2015
PwC
Q4 2015
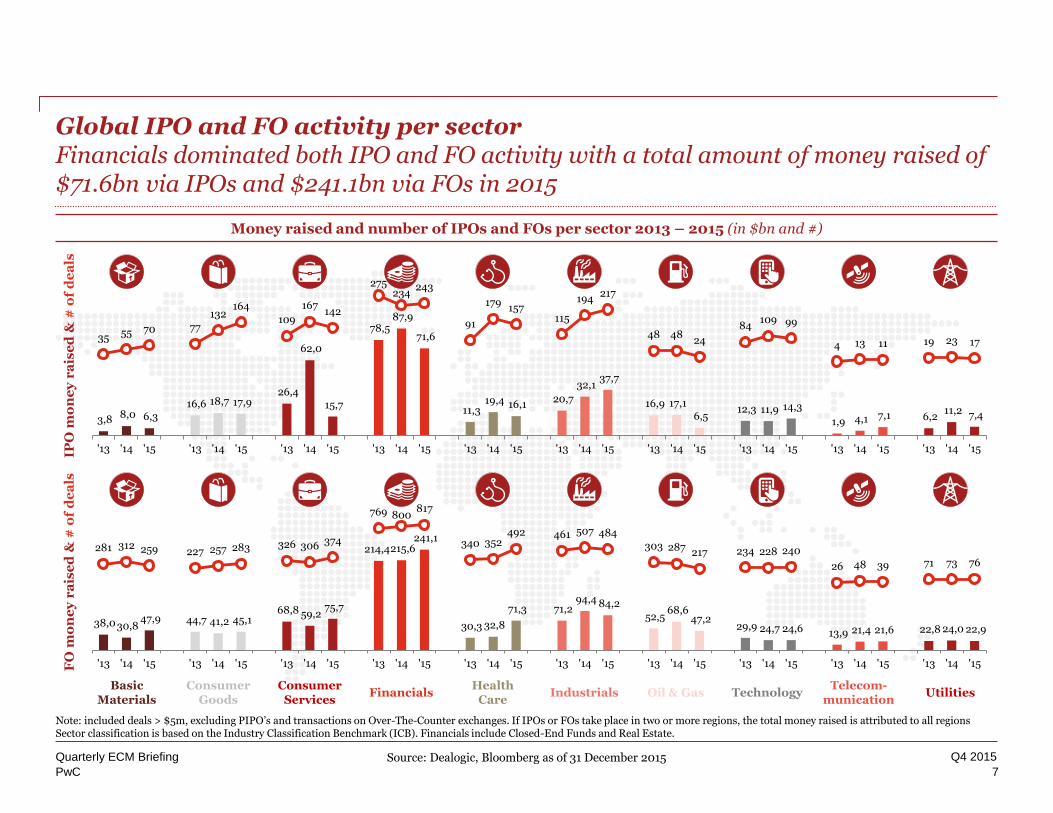
Global IPO and FO activity per sectorFinancials dominated both IPO and FO activity with a total amount of money raised of $71.6bn via IPOs and $241.1bn via FOs in 2015
7
Quarterly ECM Briefing
Money raised and number of IPOs and FOs per sector 2013 – 2015 (in $bn and #)
IPO
mo
ne
y r
ais
ed
& #
of
de
als
FO
mo
ne
y r
ais
ed
& #
of
de
als
Note: included deals > $5m, excluding PIPO’s and transactions on Over-The-Counter exchanges. If IPOs or FOs take place in two or more regions, the total money raised is attributed to all regionsSector classification is based on the Industry Classification Benchmark (ICB). Financials include Closed-End Funds and Real Estate.
IndustrialsBasic
MaterialsHealth
CareTechnology
Consumer Goods
Financials Oil & GasConsumer
ServicesTelecom-
municationUtilities
Source: Dealogic, Bloomberg as of 31 December 2015
38,0 30,8 47,9 44,7 41,2 45,1
68,8 59,2 75,7
214,4 215,6 241,1
30,3 32,8
71,3 71,2 94,4 84,2
52,5 68,6
47,2 29,9 24,7 24,6 13,9 21,4 21,6 22,8 24,0 22,9
281 312 259 227 257 283 326 306 374
769 800817
340 352492 461 507 484
303 287 217 234 228 240
26 48 39 71 73 76
'13 '14 '15 '13 '14 '15 '13 '14 '15 '13 '14 '15 '13 '14 '15 '13 '14 '15 '13 '14 '15 '13 '14 '15 '13 '14 '15 '13 '14 '15
3,8 8,0 6,3 16,6 18,7 17,9
26,4
62,0
15,7
78,5 87,9
71,6
11,3 19,4 16,1
20,7
32,1 37,7
16,9 17,1 6,5
12,3 11,9 14,3
1,9 4,1 7,1 6,2 11,2 7,4
35 55 70 77
132164
109
167142
275234
243
91
179157
115
194217
48 4824
84109 99
4 13 11 19 23 17
'13 '14 '15 '13 '14 '15 '13 '14 '15 '13 '14 '15 '13 '14 '15 '13 '14 '15 '13 '14 '15 '13 '14 '15 '13 '14 '15 '13 '14 '15
PwC
Q4 2015
Note: included deals > $5m; Country indicates the company’s Country of domicile; Financial sponsor-backed has been abbreviated to FS-backed for practical sake. IPOs are classified as ‘In Range’ if the IPO is priced in the middle 50% of the price range. The top and bottom 25% are classified as ‘Top of Range’ and ‘Bottom of Range’. If IPOs or FOs take place in two or more regions, the total money raised is attributed to all regions.
Sponsor-backed;
31%
Not Sponsor-backed;
69%
Sponsor-backed;
30%
Not Sponsor-backed;
70%
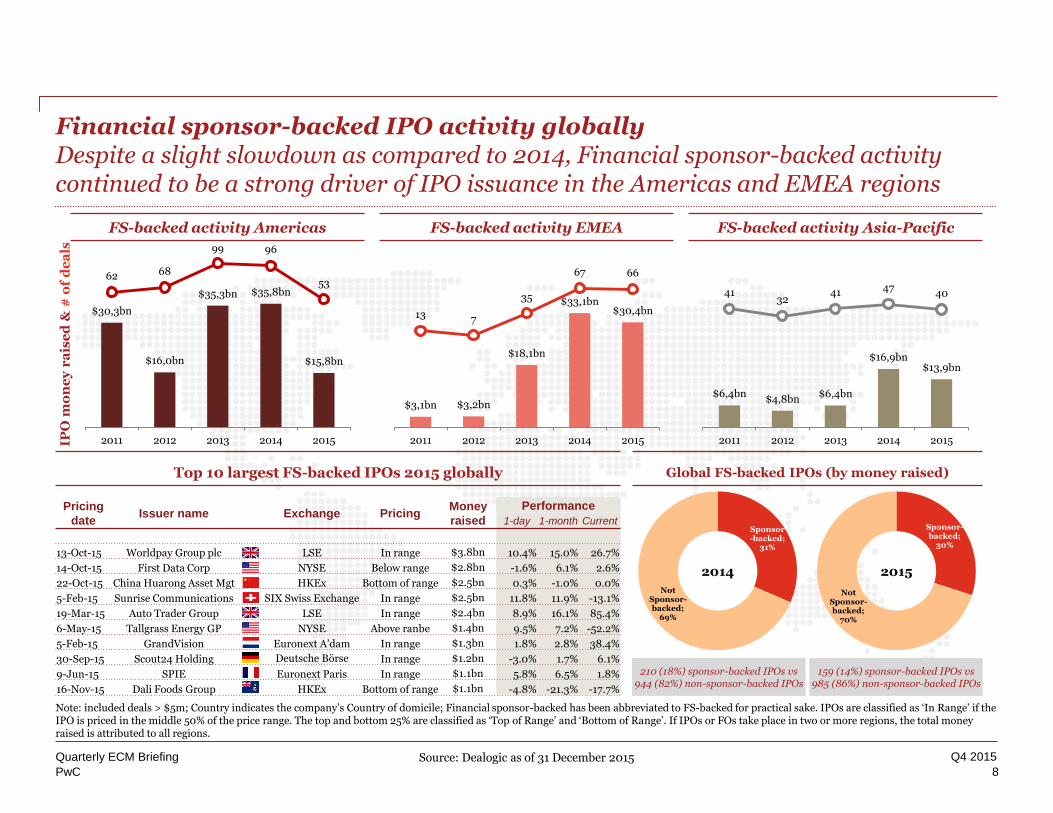
Financial sponsor-backed IPO activity globallyDespite a slight slowdown as compared to 2014, Financial sponsor-backed activity continued to be a strong driver of IPO issuance in the Americas and EMEA regions
8
Quarterly ECM Briefing
Pricing
dateIssuer name Exchange Pricing
Money
raised
Performance
1-day 1-month Current
13-Oct-15 Worldpay Group plc LSE In range $3.8bn 10.4% 15.0% 26.7%
14-Oct-15 First Data Corp NYSE Below range $2.8bn -1.6% 6.1% 2.6%
22-Oct-15 China Huarong Asset Mgt HKEx Bottom of range $2.5bn 0.3% -1.0% 0.0%
5-Feb-15 Sunrise Communications SIX Swiss Exchange In range $2.5bn 11.8% 11.9% -13.1%
19-Mar-15 Auto Trader Group LSE In range $2.4bn 8.9% 16.1% 85.4%
6-May-15 Tallgrass Energy GP NYSE Above ranbe $1.4bn 9.5% 7.2% -52.2%
5-Feb-15 GrandVision Euronext A’dam In range $1.3bn 1.8% 2.8% 38.4%
30-Sep-15 Scout24 Holding Deutsche Börse In range $1.2bn -3.0% 1.7% 6.1%
9-Jun-15 SPIE Euronext Paris In range $1.1bn 5.8% 6.5% 1.8%
16-Nov-15 Dali Foods Group HKEx Bottom of range $1.1bn -4.8% -21.3% -17.7%
Top 10 largest FS-backed IPOs 2015 globally
FS-backed activity Americas FS-backed activity EMEA FS-backed activity Asia-Pacific
IPO
mo
ne
y r
ais
ed
& #
of
de
als
2014 2015
159 (14%) sponsor-backed IPOs vs 985 (86%) non-sponsor-backed IPOs
210 (18%) sponsor-backed IPOs vs 944 (82%) non-sponsor-backed IPOs
Global FS-backed IPOs (by money raised)
$30,3bn
$16,0bn
$35,3bn $35,8bn
$15,8bn
62 68
99 96
53
2011 2012 2013 2014 2015
$3,1bn $3,2bn
$18,1bn
$33,1bn$30,4bn13 7
35
67 66
2011 2012 2013 2014 2015
$6,4bn$4,8bn
$6,4bn
$16,9bn$13,9bn
4132
41 4740
2011 2012 2013 2014 2015
Source: Dealogic as of 31 December 2015
PwC
Q4 2015
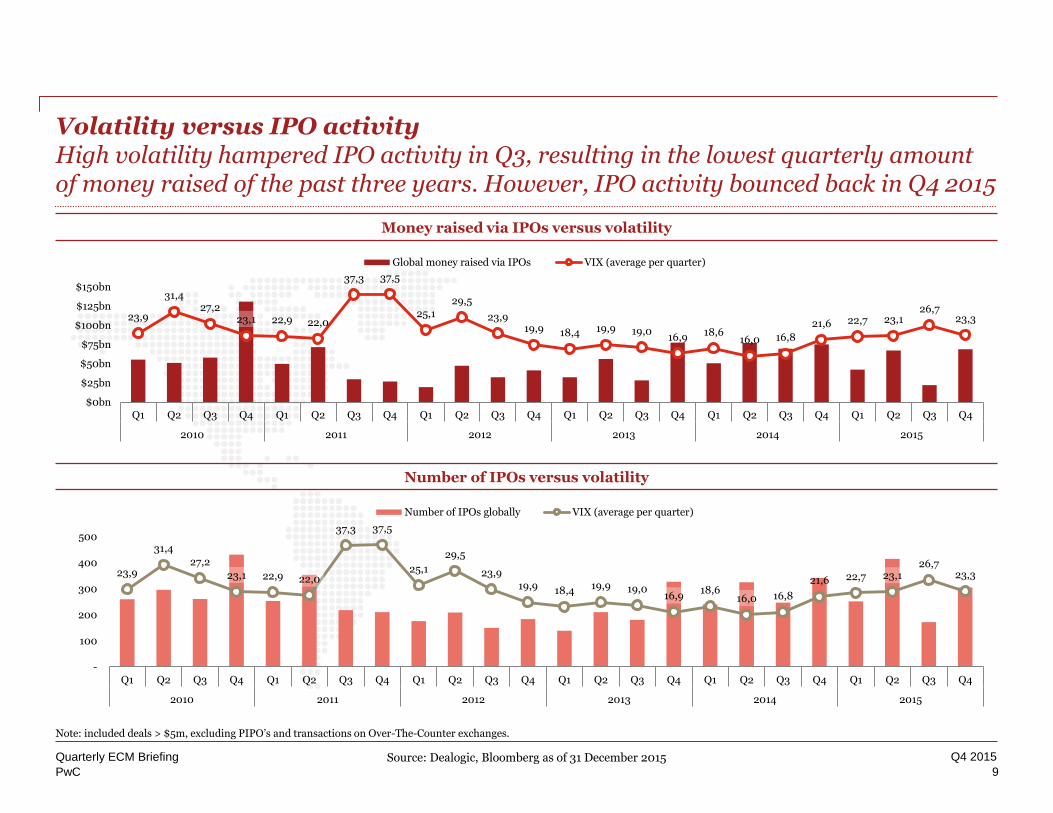
Volatility versus IPO activityHigh volatility hampered IPO activity in Q3, resulting in the lowest quarterly amount of money raised of the past three years. However, IPO activity bounced back in Q4 2015
9
Quarterly ECM Briefing
Money raised via IPOs versus volatility
Number of IPOs versus volatility
Note: included deals > $5m, excluding PIPO’s and transactions on Over-The-Counter exchanges.
Source: Dealogic, Bloomberg as of 31 December 2015
23,9
31,427,2
23,1 22,9 22,0
37,3 37,5
25,129,5
23,919,9 18,4 19,9 19,0
16,9 18,616,0 16,8
21,6 22,7 23,126,7
23,3
$0bn
$25bn
$50bn
$75bn
$100bn
$125bn
$150bn
Q1 Q2 Q3 Q4 Q1 Q2 Q3 Q4 Q1 Q2 Q3 Q4 Q1 Q2 Q3 Q4 Q1 Q2 Q3 Q4 Q1 Q2 Q3 Q4
2010 2011 2012 2013 2014 2015
Global money raised via IPOs VIX (average per quarter)
23,9
31,4
27,2
23,1 22,9 22,0
37,3 37,5
25,1
29,5
23,919,9 18,4 19,9 19,0
16,918,6
16,0 16,8
21,6 22,7 23,126,7
23,3
-
100
200
300
400
500
Q1 Q2 Q3 Q4 Q1 Q2 Q3 Q4 Q1 Q2 Q3 Q4 Q1 Q2 Q3 Q4 Q1 Q2 Q3 Q4 Q1 Q2 Q3 Q4
2010 2011 2012 2013 2014 2015
Number of IPOs globally VIX (average per quarter)
PwC
Q4 2015
Americas
10
Quarterly ECM Briefing
PwC
Q4 2015
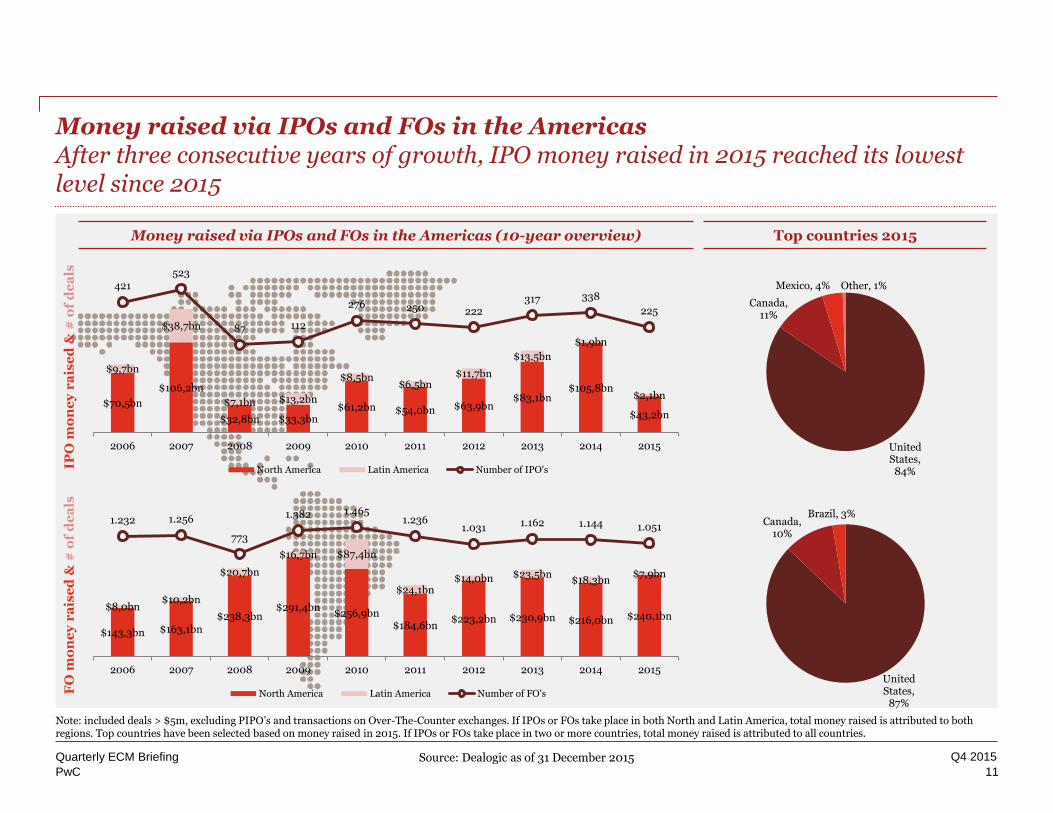
Money raised via IPOs and FOs in the AmericasAfter three consecutive years of growth, IPO money raised in 2015 reached its lowest level since 2015
11
Quarterly ECM Briefing
Money raised via IPOs and FOs in the Americas (10-year overview)
IPO
mo
ne
y r
ais
ed
& #
of
de
als
FO
mo
ne
y r
ais
ed
& #
of
de
als
Top countries 2015
Note: included deals > $5m, excluding PIPO’s and transactions on Over-The-Counter exchanges. If IPOs or FOs take place in both North and Latin America, total money raised is attributed to both regions. Top countries have been selected based on money raised in 2015. If IPOs or FOs take place in two or more countries, total money raised is attributed to all countries.
Source: Dealogic as of 31 December 2015
$70,5bn
$106,2bn
$32,8bn $33,3bn$61,2bn $54,0bn $63,9bn
$83,1bn$105,8bn
$43,2bn
$9,7bn
$38,7bn
$7,1bn $13,2bn
$8,5bn$6,5bn
$11,7bn
$13,5bn
$1,9bn
$2,1bn
421523
87 112
276 250 222317 338
225
2006 2007 2008 2009 2010 2011 2012 2013 2014 2015
North America Latin America Number of IPO's
$143,3bn $163,1bn$238,3bn
$291,4bn$256,9bn
$184,6bn$223,2bn $230,9bn $216,0bn $240,1bn
$8,0bn$10,2bn
$20,7bn
$16,7bn $87,4bn
$24,1bn$14,0bn $23,5bn
$18,3bn$7,9bn
1.232 1.256
773
1.382 1.4651.236
1.031 1.162 1.144 1.051
2006 2007 2008 2009 2010 2011 2012 2013 2014 2015
North America Latin America Number of FO's
United States,
87%
Canada, 10%
Brazil, 3%
United States, 84%
Canada, 11%
Mexico, 4% Other, 1%
PwC
Q4 2015
Main indices in the Americas
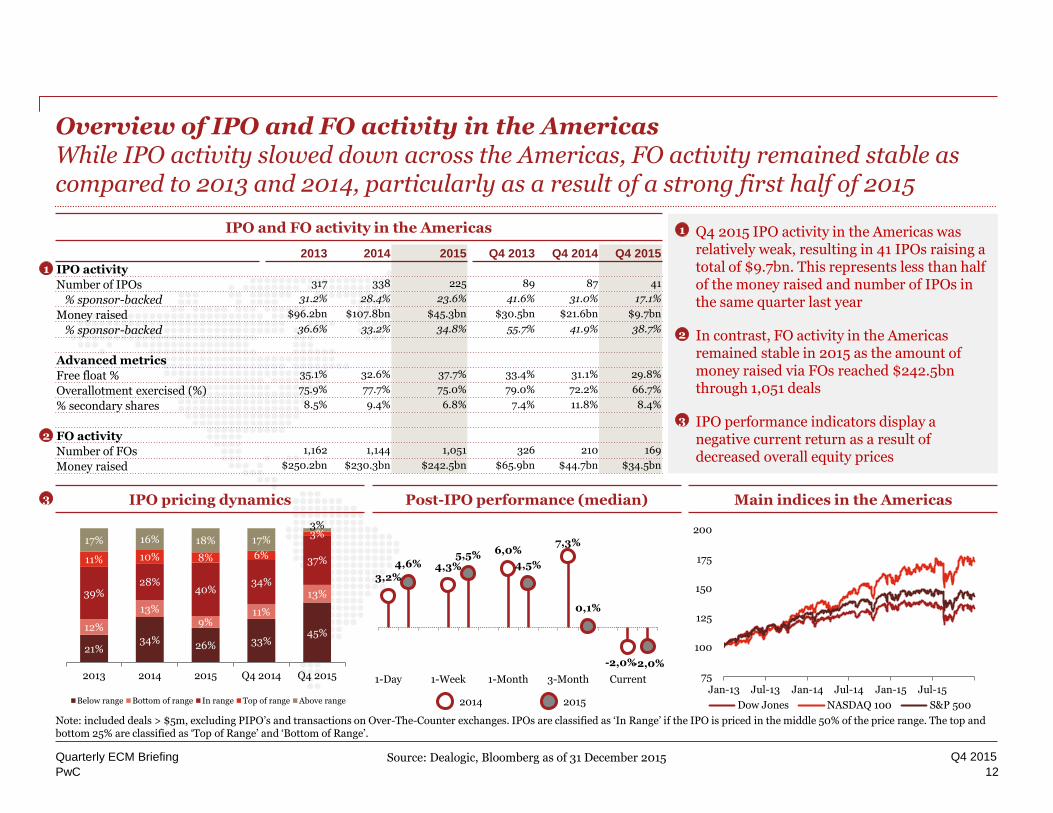
IPO and FO activity in the Americas
2013 2014 2015 Q4 2013 Q4 2014 Q4 2015
IPO activity
Number of IPOs 317 338 225 89 87 41
% sponsor-backed 31.2% 28.4% 23.6% 41.6% 31.0% 17.1%
Money raised $96.2bn $107.8bn $45.3bn $30.5bn $21.6bn $9.7bn
% sponsor-backed 36.6% 33.2% 34.8% 55.7% 41.9% 38.7%
Advanced metrics
Free float % 35.1% 32.6% 37.7% 33.4% 31.1% 29.8%
Overallotment exercised (%) 75.9% 77.7% 75.0% 79.0% 72.2% 66.7%
% secondary shares 8.5% 9.4% 6.8% 7.4% 11.8% 8.4%
FO activity
Number of FOs 1,162 1,144 1,051 326 210 169
Money raised $250.2bn $230.3bn $242.5bn $65.9bn $44.7bn $34.5bn
• Q4 2015 IPO activity in the Americas was relatively weak, resulting in 41 IPOs raising a total of $9.7bn. This represents less than half of the money raised and number of IPOs in the same quarter last year
• In contrast, FO activity in the Americas remained stable in 2015 as the amount of money raised via FOs reached $242.5bn through 1,051 deals
• IPO performance indicators display a negative current return as a result of decreased overall equity prices
1
1
2
3 IPO pricing dynamics Post-IPO performance (median)
2014YTD 2015YTD
Overview of IPO and FO activity in the AmericasWhile IPO activity slowed down across the Americas, FO activity remained stable as compared to 2013 and 2014, particularly as a result of a strong first half of 2015
12
Quarterly ECM Briefing
Note: included deals > $5m, excluding PIPO’s and transactions on Over-The-Counter exchanges. IPOs are classified as ‘In Range’ if the IPO is priced in the middle 50% of the price range. The top and bottom 25% are classified as ‘Top of Range’ and ‘Bottom of Range’.
2
3
Source: Dealogic, Bloomberg as of 31 December 2015
3,2%
4,6% 4,3%5,5% 6,0%
4,5%
7,3%
0,1%
-2,0%-2,0%
1-Day 1-Week 1-Month 3-Month Current 75
100
125
150
175
200
Jan-13 Jul-13 Jan-14 Jul-14 Jan-15 Jul-15
Dow Jones NASDAQ 100 S&P 500
21%34%
26% 33%45%
12%
13%
9%11%
13%39%28%
40%34%
37%11% 10% 8% 6%
3%17% 16% 18% 17%
3%
2013 2014 2015 Q4 2014 Q4 2015
Below range Bottom of range In range Top of range Above range
PwC
Q4 2015
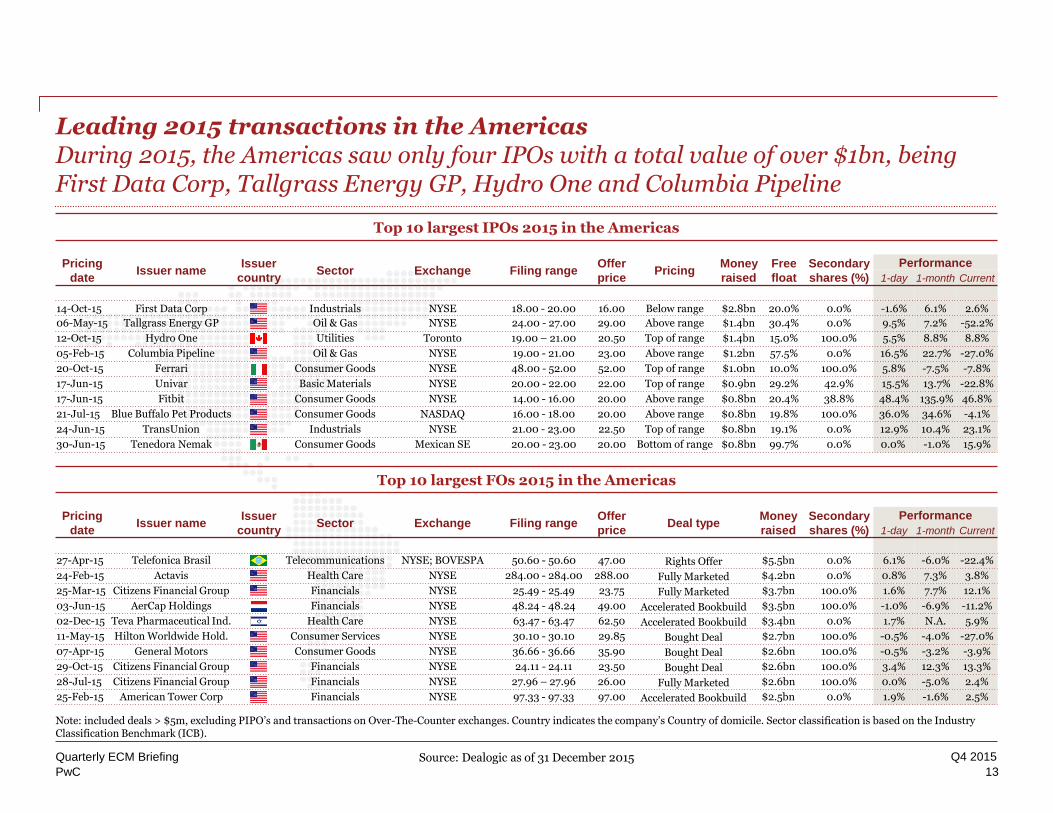
Leading 2015 transactions in the AmericasDuring 2015, the Americas saw only four IPOs with a total value of over $1bn, being First Data Corp, Tallgrass Energy GP, Hydro One and Columbia Pipeline
13
Quarterly ECM Briefing
Top 10 largest IPOs 2015 in the Americas
Top 10 largest FOs 2015 in the Americas
Pricing
dateIssuer name
Issuer
countrySector Exchange Filing range
Offer
pricePricing
Money
raised
Free
float
Secondary
shares (%)
Performance
1-day 1-month Current
14-Oct-15 First Data Corp Industrials NYSE 18.00 - 20.00 16.00 Below range $2.8bn 20.0% 0.0% -1.6% 6.1% 2.6%
06-May-15 Tallgrass Energy GP Oil & Gas NYSE 24.00 - 27.00 29.00 Above range $1.4bn 30.4% 0.0% 9.5% 7.2% -52.2%
12-Oct-15 Hydro One Utilities Toronto 19.00 – 21.00 20.50 Top of range $1.4bn 15.0% 100.0% 5.5% 8.8% 8.8%
05-Feb-15 Columbia Pipeline Oil & Gas NYSE 19.00 - 21.00 23.00 Above range $1.2bn 57.5% 0.0% 16.5% 22.7% -27.0%
20-Oct-15 Ferrari Consumer Goods NYSE 48.00 - 52.00 52.00 Top of range $1.0bn 10.0% 100.0% 5.8% -7.5% -7.8%
17-Jun-15 Univar Basic Materials NYSE 20.00 - 22.00 22.00 Top of range $0.9bn 29.2% 42.9% 15.5% 13.7% -22.8%
17-Jun-15 Fitbit Consumer Goods NYSE 14.00 - 16.00 20.00 Above range $0.8bn 20.4% 38.8% 48.4% 135.9% 46.8%
21-Jul-15 Blue Buffalo Pet Products Consumer Goods NASDAQ 16.00 - 18.00 20.00 Above range $0.8bn 19.8% 100.0% 36.0% 34.6% -4.1%
24-Jun-15 TransUnion Industrials NYSE 21.00 - 23.00 22.50 Top of range $0.8bn 19.1% 0.0% 12.9% 10.4% 23.1%
30-Jun-15 Tenedora Nemak Consumer Goods Mexican SE 20.00 - 23.00 20.00 Bottom of range $0.8bn 99.7% 0.0% 0.0% -1.0% 15.9%
Pricing
dateIssuer name
Issuer
countrySector Exchange Filing range
Offer
priceDeal type
Money
raised
Secondary
shares (%)
Performance
1-day 1-month Current
27-Apr-15 Telefonica Brasil Telecommunications NYSE; BOVESPA 50.60 - 50.60 47.00 Rights Offer $5.5bn 0.0% 6.1% -6.0% -22.4%
24-Feb-15 Actavis Health Care NYSE 284.00 - 284.00 288.00 Fully Marketed $4.2bn 0.0% 0.8% 7.3% 3.8%
25-Mar-15 Citizens Financial Group Financials NYSE 25.49 - 25.49 23.75 Fully Marketed $3.7bn 100.0% 1.6% 7.7% 12.1%
03-Jun-15 AerCap Holdings Financials NYSE 48.24 - 48.24 49.00 Accelerated Bookbuild $3.5bn 100.0% -1.0% -6.9% -11.2%
02-Dec-15 Teva Pharmaceutical Ind. Health Care NYSE 63.47 - 63.47 62.50 Accelerated Bookbuild $3.4bn 0.0% 1.7% N.A. 5.9%
11-May-15 Hilton Worldwide Hold. Consumer Services NYSE 30.10 - 30.10 29.85 Bought Deal $2.7bn 100.0% -0.5% -4.0% -27.0%
07-Apr-15 General Motors Consumer Goods NYSE 36.66 - 36.66 35.90 Bought Deal $2.6bn 100.0% -0.5% -3.2% -3.9%
29-Oct-15 Citizens Financial Group Financials NYSE 24.11 - 24.11 23.50 Bought Deal $2.6bn 100.0% 3.4% 12.3% 13.3%
28-Jul-15 Citizens Financial Group Financials NYSE 27.96 – 27.96 26.00 Fully Marketed $2.6bn 100.0% 0.0% -5.0% 2.4%
25-Feb-15 American Tower Corp Financials NYSE 97.33 - 97.33 97.00 Accelerated Bookbuild $2.5bn 0.0% 1.9% -1.6% 2.5%
Note: included deals > $5m, excluding PIPO’s and transactions on Over-The-Counter exchanges. Country indicates the company’s Country of domicile. Sector classification is based on the Industry Classification Benchmark (ICB).
Source: Dealogic as of 31 December 2015
PwC
Q4 2015
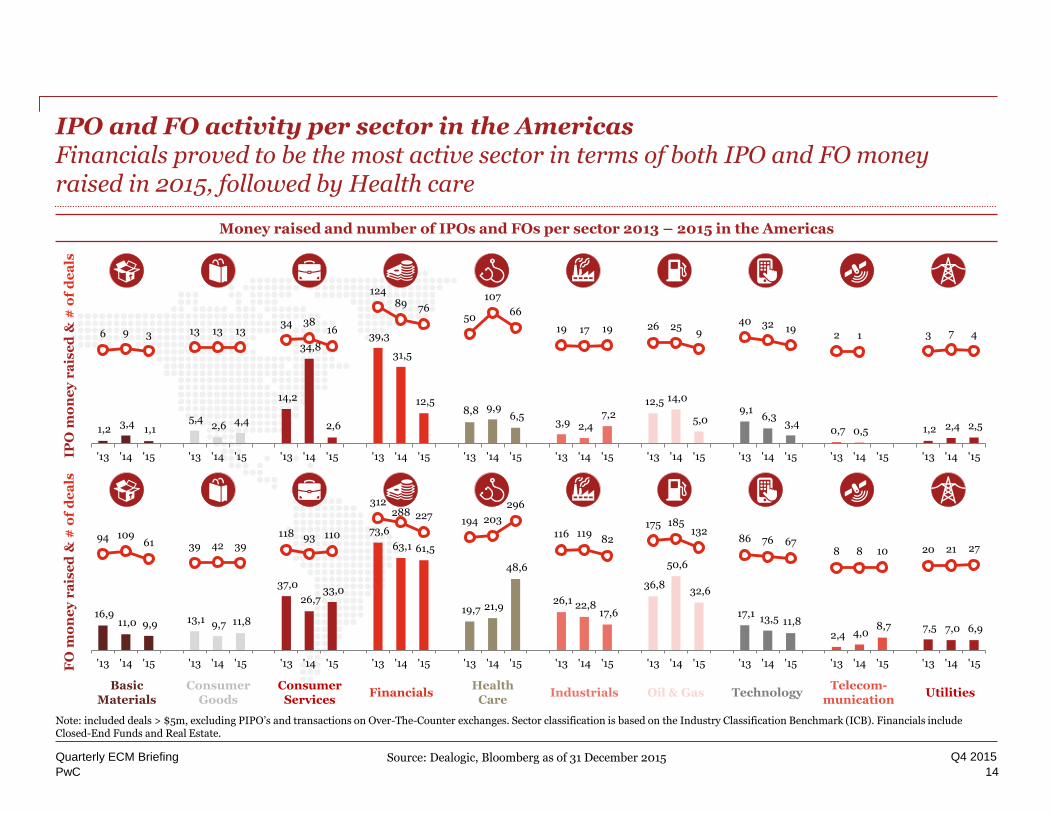
IPO and FO activity per sector in the AmericasFinancials proved to be the most active sector in terms of both IPO and FO money raised in 2015, followed by Health care
14
Quarterly ECM Briefing
Money raised and number of IPOs and FOs per sector 2013 – 2015 in the Americas
IPO
mo
ne
y r
ais
ed
& #
of
de
als
FO
mo
ne
y r
ais
ed
& #
of
de
als
Note: included deals > $5m, excluding PIPO’s and transactions on Over-The-Counter exchanges. Sector classification is based on the Industry Classification Benchmark (ICB). Financials include Closed-End Funds and Real Estate.
IndustrialsBasic
MaterialsHealth
CareTechnology
Consumer Goods
Financials Oil & GasConsumer
ServicesTelecom-
municationUtilities
Source: Dealogic, Bloomberg as of 31 December 2015
1,2 3,4
1,1 5,4
2,6 4,4
14,2
34,8
2,6
39,3
31,5
12,5 8,8 9,9
6,5 3,9 2,4
7,2 12,5 14,0
5,0 9,1
6,3 3,4
0,7 0,5 1,2 2,4 2,5
6 9 3 13 13 1334 38
16
12489 76
50
107
66
19 17 19 26 259
40 32 192 1 3 7 4
'13 '14 '15 '13 '14 '15 '13 '14 '15 '13 '14 '15 '13 '14 '15 '13 '14 '15 '13 '14 '15 '13 '14 '15 '13 '14 '15 '13 '14 '15
16,9 11,0 9,9 13,1 9,7 11,8
37,0
26,7 33,0
73,6
63,1 61,5
19,7 21,9
48,6
26,1 22,8 17,6
36,8
50,6
32,6
17,1 13,5 11,8
2,4 4,0 8,7 7,5 7,0 6,9
94 10961 39 42 39
118 93 110
312288 227
194 203
296
116 11982
175 185132
86 76 678 8 10 20 21 27
'13 '14 '15 '13 '14 '15 '13 '14 '15 '13 '14 '15 '13 '14 '15 '13 '14 '15 '13 '14 '15 '13 '14 '15 '13 '14 '15 '13 '14 '15
PwC
Q4 2015
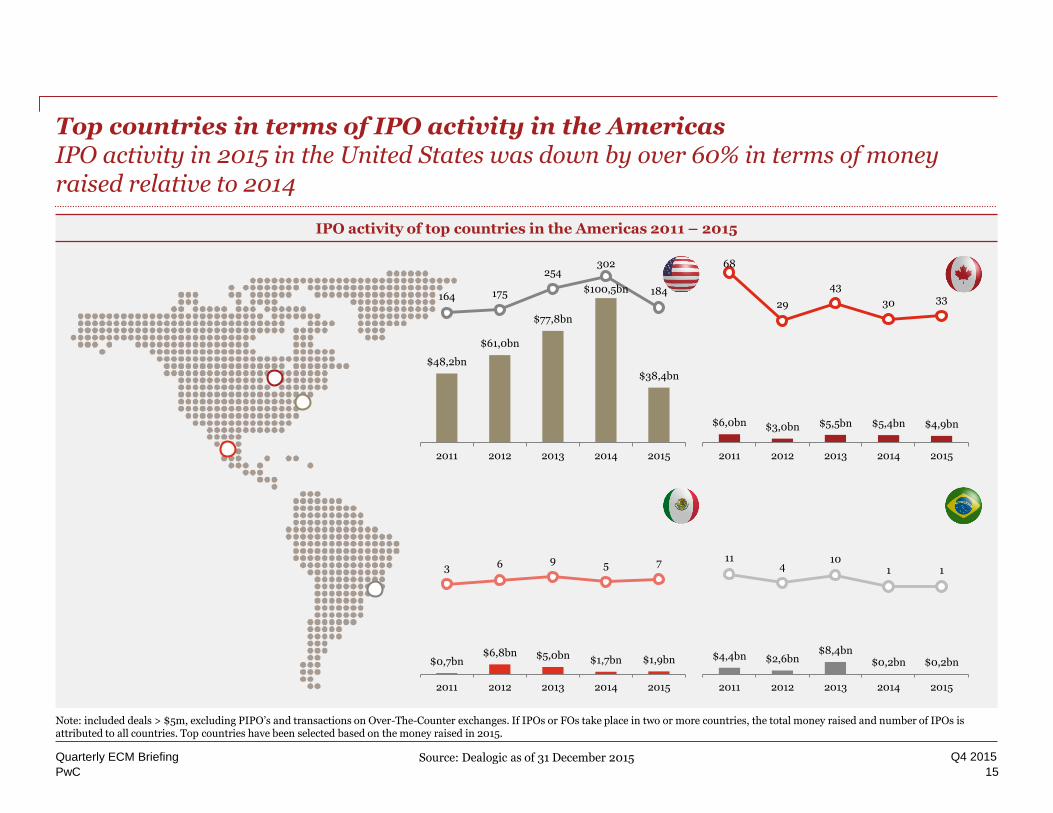
Top countries in terms of IPO activity in the AmericasIPO activity in 2015 in the United States was down by over 60% in terms of money raised relative to 2014
15
Quarterly ECM Briefing
IPO activity of top countries in the Americas 2011 – 2015
Note: included deals > $5m, excluding PIPO’s and transactions on Over-The-Counter exchanges. If IPOs or FOs take place in two or more countries, the total money raised and number of IPOs is attributed to all countries. Top countries have been selected based on the money raised in 2015.
Source: Dealogic as of 31 December 2015
$48,2bn
$61,0bn
$77,8bn
$100,5bn
$38,4bn
164 175
254302
184
2011 2012 2013 2014 2015
$6,0bn $3,0bn $5,5bn $5,4bn $4,9bn
68
29
43
30 33
2011 2012 2013 2014 2015
$4,4bn $2,6bn$8,4bn
$0,2bn $0,2bn
114
101 1
2011 2012 2013 2014 2015
$0,7bn$6,8bn $5,0bn $1,7bn $1,9bn
3 6 9 5 7
2011 2012 2013 2014 2015
PwC
Q4 2015
EMEA
16
Quarterly ECM Briefing
PwC
Q4 2015
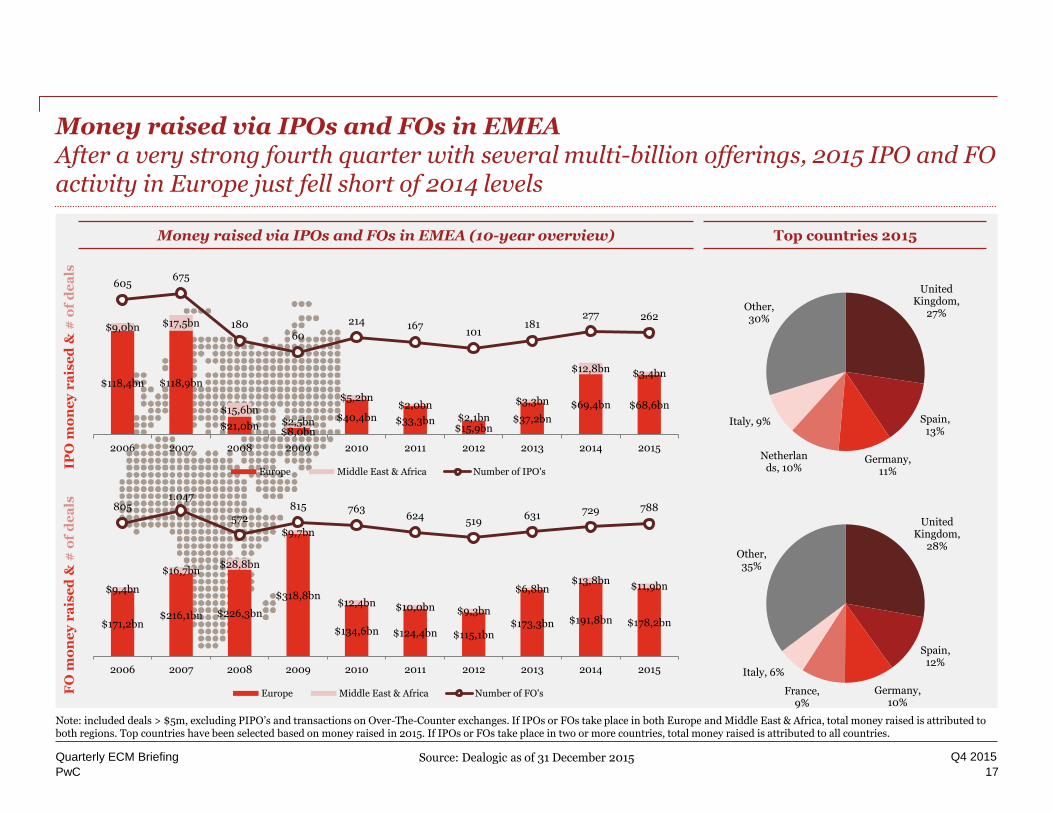
Money raised via IPOs and FOs in EMEAAfter a very strong fourth quarter with several multi-billion offerings, 2015 IPO and FO activity in Europe just fell short of 2014 levels
17
Quarterly ECM Briefing
Money raised via IPOs and FOs in EMEA (10-year overview) Top countries 2015
IPO
mo
ne
y r
ais
ed
& #
of
de
als
FO
mo
ne
y r
ais
ed
& #
of
de
als
Note: included deals > $5m, excluding PIPO’s and transactions on Over-The-Counter exchanges. If IPOs or FOs take place in both Europe and Middle East & Africa, total money raised is attributed to both regions. Top countries have been selected based on money raised in 2015. If IPOs or FOs take place in two or more countries, total money raised is attributed to all countries.
Source: Dealogic as of 31 December 2015
United Kingdom,
28%
Spain, 12%
Germany, 10%
France, 9%
Italy, 6%
Other, 35%
United Kingdom,
27%
Spain, 13%
Germany, 11%
Netherlands, 10%
Italy, 9%
Other, 30%
$118,4bn $118,9bn
$21,0bn$8,0bn
$40,4bn $33,3bn$15,9bn
$37,2bn
$69,4bn $68,6bn
$9,0bn $17,5bn
$15,6bn$2,5bn
$5,2bn$2,0bn
$2,1bn
$3,3bn
$12,8bn $3,4bn
605675
18060
214 167101
181277 262
2006 2007 2008 2009 2010 2011 2012 2013 2014 2015
Europe Middle East & Africa Number of IPO's
$171,2bn$216,1bn $226,3bn
$318,8bn
$134,6bn $124,4bn $115,1bn$173,3bn $191,8bn $178,2bn
$9,4bn
$16,7bn$28,8bn
$9,7bn
$12,4bn $10,0bn $9,3bn
$6,8bn$13,8bn
$11,9bn
8051.047
572815 763
624519
631 729 788
2006 2007 2008 2009 2010 2011 2012 2013 2014 2015
Europe Middle East & Africa Number of FO's
PwC
Q4 2015
Note: included deals > $5m, excluding PIPO’s and transactions on Over-The-Counter exchanges. IPOs are classified as ‘In Range’ if the IPO is priced in the middle 50% of the price range. The top and bottom 25% are classified as ‘Top of Range’ and ‘Bottom of Range’.
Main indices in the EMEA
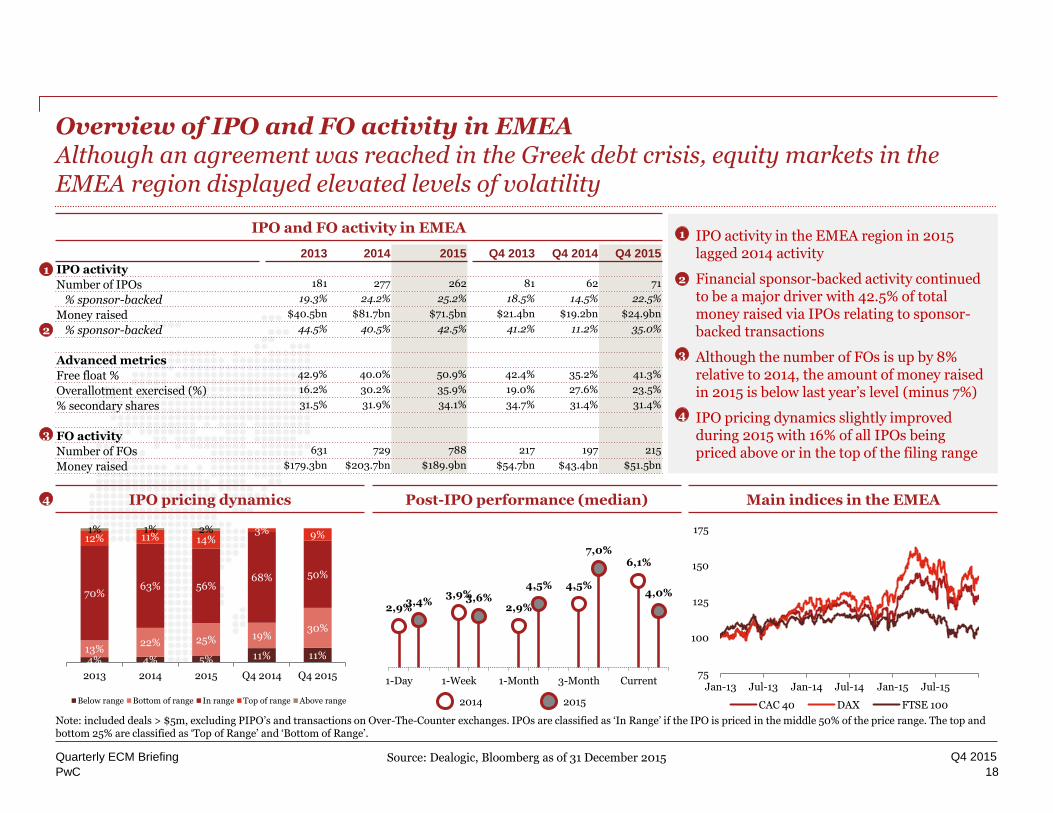
IPO and FO activity in EMEA
2013 2014 2015 Q4 2013 Q4 2014 Q4 2015
IPO activity
Number of IPOs 181 277 262 81 62 71
% sponsor-backed 19.3% 24.2% 25.2% 18.5% 14.5% 22.5%
Money raised $40.5bn $81.7bn $71.5bn $21.4bn $19.2bn $24.9bn
% sponsor-backed 44.5% 40.5% 42.5% 41.2% 11.2% 35.0%
Advanced metrics
Free float % 42.9% 40.0% 50.9% 42.4% 35.2% 41.3%
Overallotment exercised (%) 16.2% 30.2% 35.9% 19.0% 27.6% 23.5%
% secondary shares 31.5% 31.9% 34.1% 34.7% 31.4% 31.4%
FO activity
Number of FOs 631 729 788 217 197 215
Money raised $179.3bn $203.7bn $189.9bn $54.7bn $43.4bn $51.5bn
• IPO activity in the EMEA region in 2015 lagged 2014 activity
• Financial sponsor-backed activity continued to be a major driver with 42.5% of total money raised via IPOs relating to sponsor-backed transactions
• Although the number of FOs is up by 8% relative to 2014, the amount of money raised in 2015 is below last year’s level (minus 7%)
• IPO pricing dynamics slightly improved during 2015 with 16% of all IPOs being priced above or in the top of the filing range
1
1
2
3
4 IPO pricing dynamics Post-IPO performance (median)
Overview of IPO and FO activity in EMEAAlthough an agreement was reached in the Greek debt crisis, equity markets in the EMEA region displayed elevated levels of volatility
18
Quarterly ECM Briefing
2
3
4
2014YTD 2015YTD
Source: Dealogic, Bloomberg as of 31 December 2015
2,9%3,4%
3,9%3,6%2,9%
4,5% 4,5%
7,0%6,1%
4,0%
1-Day 1-Week 1-Month 3-Month Current 75
100
125
150
175
Jan-13 Jul-13 Jan-14 Jul-14 Jan-15 Jul-15
CAC 40 DAX FTSE 100
4% 4% 5% 11% 11%13%
22% 25% 19%30%
70%63% 56%
68% 50%
12% 11% 14%3% 9%
1% 1% 2%
2013 2014 2015 Q4 2014 Q4 2015
Below range Bottom of range In range Top of range Above range
PwC
Q4 2015
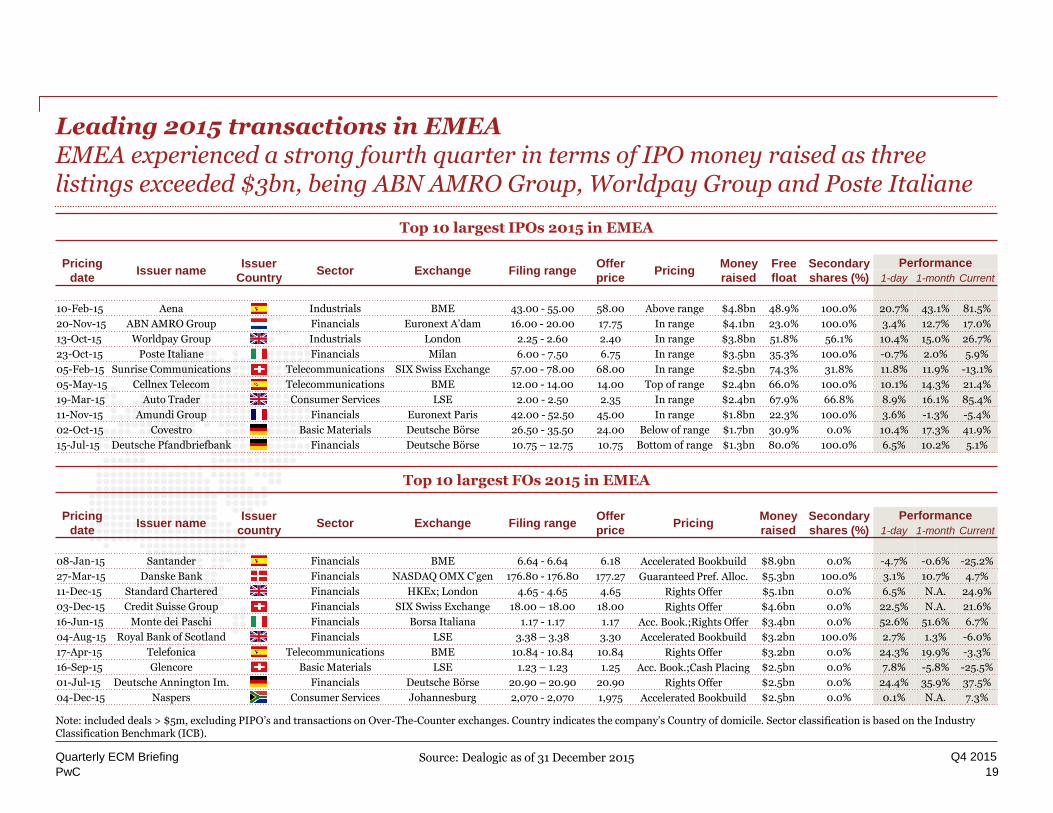
Leading 2015 transactions in EMEAEMEA experienced a strong fourth quarter in terms of IPO money raised as three listings exceeded $3bn, being ABN AMRO Group, Worldpay Group and Poste Italiane
19
Quarterly ECM Briefing
Top 10 largest IPOs 2015 in EMEA
Top 10 largest FOs 2015 in EMEA
Pricing
dateIssuer name
Issuer
CountrySector Exchange Filing range
Offer
pricePricing
Money
raised
Free
float
Secondary
shares (%)
Performance
1-day 1-month Current
10-Feb-15 Aena Industrials BME 43.00 - 55.00 58.00 Above range $4.8bn 48.9% 100.0% 20.7% 43.1% 81.5%
20-Nov-15 ABN AMRO Group Financials Euronext A’dam 16.00 - 20.00 17.75 In range $4.1bn 23.0% 100.0% 3.4% 12.7% 17.0%
13-Oct-15 Worldpay Group Industrials London 2.25 - 2.60 2.40 In range $3.8bn 51.8% 56.1% 10.4% 15.0% 26.7%
23-Oct-15 Poste Italiane Financials Milan 6.00 - 7.50 6.75 In range $3.5bn 35.3% 100.0% -0.7% 2.0% 5.9%
05-Feb-15 Sunrise Communications Telecommunications SIX Swiss Exchange 57.00 - 78.00 68.00 In range $2.5bn 74.3% 31.8% 11.8% 11.9% -13.1%
05-May-15 Cellnex Telecom Telecommunications BME 12.00 - 14.00 14.00 Top of range $2.4bn 66.0% 100.0% 10.1% 14.3% 21.4%
19-Mar-15 Auto Trader Consumer Services LSE 2.00 - 2.50 2.35 In range $2.4bn 67.9% 66.8% 8.9% 16.1% 85.4%
11-Nov-15 Amundi Group Financials Euronext Paris 42.00 - 52.50 45.00 In range $1.8bn 22.3% 100.0% 3.6% -1.3% -5.4%
02-Oct-15 Covestro Basic Materials Deutsche Börse 26.50 - 35.50 24.00 Below of range $1.7bn 30.9% 0.0% 10.4% 17.3% 41.9%
15-Jul-15 Deutsche Pfandbriefbank Financials Deutsche Börse 10.75 – 12.75 10.75 Bottom of range $1.3bn 80.0% 100.0% 6.5% 10.2% 5.1%
Pricing
dateIssuer name
Issuer
countrySector Exchange Filing range
Offer
pricePricing
Money
raised
Secondary
shares (%)
Performance
1-day 1-month Current
08-Jan-15 Santander Financials BME 6.64 - 6.64 6.18 Accelerated Bookbuild $8.9bn 0.0% -4.7% -0.6% -25.2%
27-Mar-15 Danske Bank Financials NASDAQ OMX C’gen 176.80 - 176.80 177.27 Guaranteed Pref. Alloc. $5.3bn 100.0% 3.1% 10.7% 4.7%
11-Dec-15 Standard Chartered Financials HKEx; London 4.65 - 4.65 4.65 Rights Offer $5.1bn 0.0% 6.5% N.A. 24.9%
03-Dec-15 Credit Suisse Group Financials SIX Swiss Exchange 18.00 – 18.00 18.00 Rights Offer $4.6bn 0.0% 22.5% N.A. 21.6%
16-Jun-15 Monte dei Paschi Financials Borsa Italiana 1.17 - 1.17 1.17 Acc. Book.;Rights Offer $3.4bn 0.0% 52.6% 51.6% 6.7%
04-Aug-15 Royal Bank of Scotland Financials LSE 3.38 – 3.38 3.30 Accelerated Bookbuild $3.2bn 100.0% 2.7% 1.3% -6.0%
17-Apr-15 Telefonica Telecommunications BME 10.84 - 10.84 10.84 Rights Offer $3.2bn 0.0% 24.3% 19.9% -3.3%
16-Sep-15 Glencore Basic Materials LSE 1.23 – 1.23 1.25 Acc. Book.;Cash Placing $2.5bn 0.0% 7.8% -5.8% -25.5%
01-Jul-15 Deutsche Annington Im. Financials Deutsche Börse 20.90 – 20.90 20.90 Rights Offer $2.5bn 0.0% 24.4% 35.9% 37.5%
04-Dec-15 Naspers Consumer Services Johannesburg 2,070 - 2,070 1,975 Accelerated Bookbuild $2.5bn 0.0% 0.1% N.A. 7.3%
Note: included deals > $5m, excluding PIPO’s and transactions on Over-The-Counter exchanges. Country indicates the company’s Country of domicile. Sector classification is based on the Industry Classification Benchmark (ICB).
Source: Dealogic as of 31 December 2015
PwC
Q4 2015
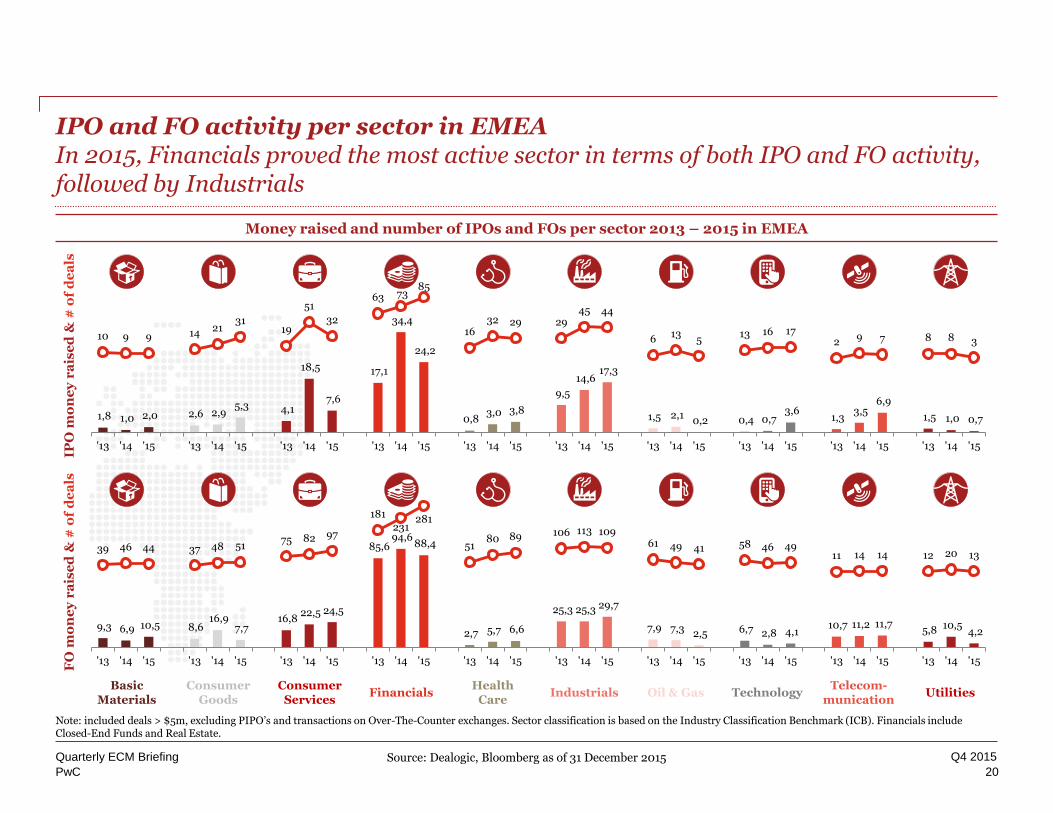
IPO and FO activity per sector in EMEAIn 2015, Financials proved the most active sector in terms of both IPO and FO activity, followed by Industrials
20
Quarterly ECM Briefing
Money raised and number of IPOs and FOs per sector 2013 – 2015 in EMEA
IPO
mo
ne
y r
ais
ed
& #
of
de
als
FO
mo
ne
y r
ais
ed
& #
of
de
als
Note: included deals > $5m, excluding PIPO’s and transactions on Over-The-Counter exchanges. Sector classification is based on the Industry Classification Benchmark (ICB). Financials include Closed-End Funds and Real Estate.
IndustrialsBasic
MaterialsHealth
CareTechnology
Consumer Goods
Financials Oil & GasConsumer
ServicesTelecom-
municationUtilities
Source: Dealogic, Bloomberg as of 31 December 2015
1,8 1,0 2,0 2,6 2,9 5,3 4,1
18,5
7,6
17,1
34,4
24,2
0,8 3,0 3,8
9,5
14,6 17,3
1,5 2,1 0,2 0,4 0,7
3,6 1,3
3,5 6,9
1,5 1,0 0,7
10 9 9 14 2131
19
51
32
63 7385
1632 29 29
45 44
6 135
13 16 172 9 7 8 8 3
'13 '14 '15 '13 '14 '15 '13 '14 '15 '13 '14 '15 '13 '14 '15 '13 '14 '15 '13 '14 '15 '13 '14 '15 '13 '14 '15 '13 '14 '15
9,3 6,9 10,5 8,6 16,9
7,7 16,8
22,5 24,5
85,6 94,6
88,4
2,7 5,7 6,6
25,3 25,3 29,7
7,9 7,3 2,5 6,7 2,8 4,1 10,7 11,2 11,7
5,8 10,5 4,2
39 46 44 37 48 5175 82 97
181
231281
5180 89 106 113 109
61 49 41 58 46 4911 14 14 12 20 13
'13 '14 '15 '13 '14 '15 '13 '14 '15 '13 '14 '15 '13 '14 '15 '13 '14 '15 '13 '14 '15 '13 '14 '15 '13 '14 '15 '13 '14 '15
PwC
Q4 2015
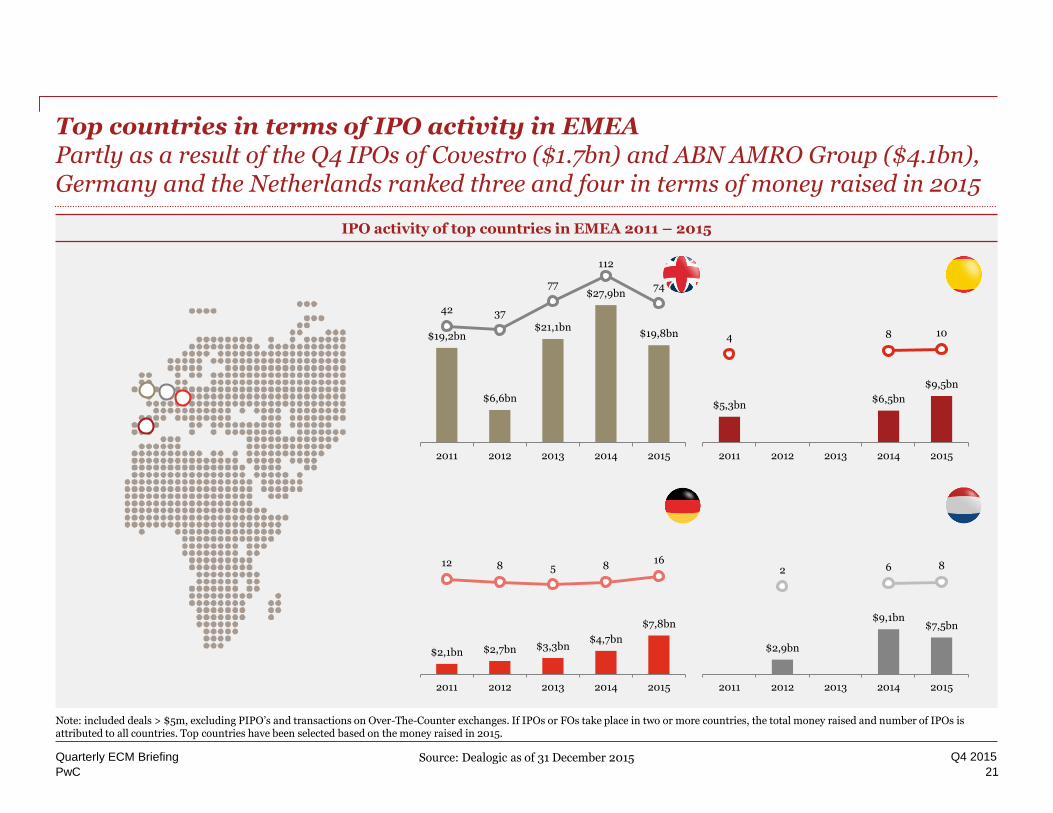
$5,3bn$6,5bn
$9,5bn
4 8 10
2011 2012 2013 2014 2015
$2,1bn $2,7bn $3,3bn$4,7bn
$7,8bn
12 8 5 816
2011 2012 2013 2014 2015
$2,9bn
$9,1bn$7,5bn
2 6 8
2011 2012 2013 2014 2015
Top countries in terms of IPO activity in EMEAPartly as a result of the Q4 IPOs of Covestro ($1.7bn) and ABN AMRO Group ($4.1bn), Germany and the Netherlands ranked three and four in terms of money raised in 2015
21
Quarterly ECM Briefing
IPO activity of top countries in EMEA 2011 – 2015
Note: included deals > $5m, excluding PIPO’s and transactions on Over-The-Counter exchanges. If IPOs or FOs take place in two or more countries, the total money raised and number of IPOs is attributed to all countries. Top countries have been selected based on the money raised in 2015.
Source: Dealogic as of 31 December 2015
$19,2bn
$6,6bn
$21,1bn
$27,9bn
$19,8bn
42 37
77
112
74
2011 2012 2013 2014 2015
PwC
Q4 2015
Asia-Pacific
22
Quarterly ECM Briefing
PwC
Q4 2015
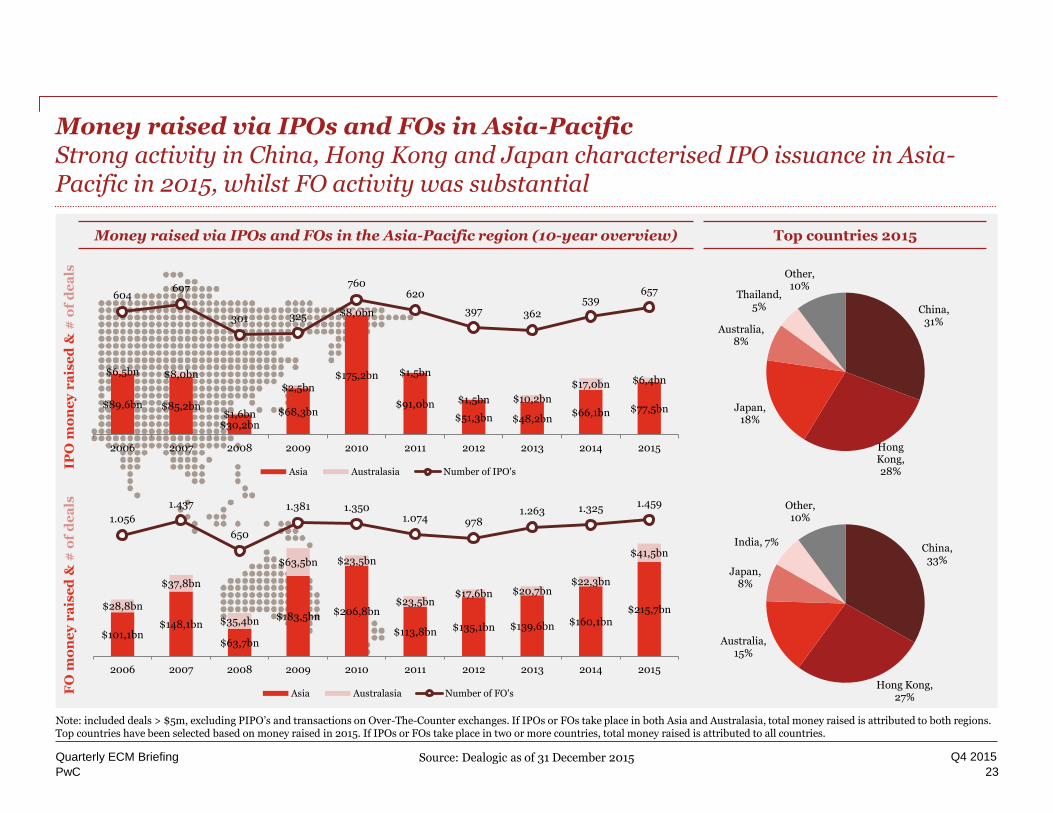
Money raised via IPOs and FOs in Asia-PacificStrong activity in China, Hong Kong and Japan characterised IPO issuance in Asia-Pacific in 2015, whilst FO activity was substantial
23
Quarterly ECM Briefing
Money raised via IPOs and FOs in the Asia-Pacific region (10-year overview) Top countries 2015
IPO
mo
ne
y r
ais
ed
& #
of
de
als
FO
mo
ne
y r
ais
ed
& #
of
de
als
Note: included deals > $5m, excluding PIPO’s and transactions on Over-The-Counter exchanges. If IPOs or FOs take place in both Asia and Australasia, total money raised is attributed to both regions. Top countries have been selected based on money raised in 2015. If IPOs or FOs take place in two or more countries, total money raised is attributed to all countries.
Source: Dealogic as of 31 December 2015
$89,6bn $85,2bn
$30,2bn
$68,3bn
$175,2bn
$91,0bn
$51,3bn $48,2bn$66,1bn $77,5bn
$6,5bn $8,0bn
$1,6bn
$2,5bn
$8,0bn
$1,5bn
$1,5bn $10,2bn
$17,0bn $6,4bn
604697
301 325
760620
397 362
539657
2006 2007 2008 2009 2010 2011 2012 2013 2014 2015
Asia Australasia Number of IPO's
$101,1bn$148,1bn
$63,7bn
$183,5bn $206,8bn
$113,8bn $135,1bn $139,6bn $160,1bn$215,7bn$28,8bn
$37,8bn
$35,4bn
$63,5bn $23,5bn
$23,5bn$17,6bn $20,7bn
$22,3bn
$41,5bn
1.056
1.437
650
1.381 1.3501.074 978
1.263 1.325 1.459
2006 2007 2008 2009 2010 2011 2012 2013 2014 2015
Asia Australasia Number of FO's
China, 33%
Hong Kong, 27%
Australia, 15%
Japan, 8%
India, 7%
Other, 10%
China, 31%
Hong Kong, 28%
Japan, 18%
Australia, 8%
Thailand, 5%
Other, 10%
PwC
Q4 2015
Main indices in the APAC
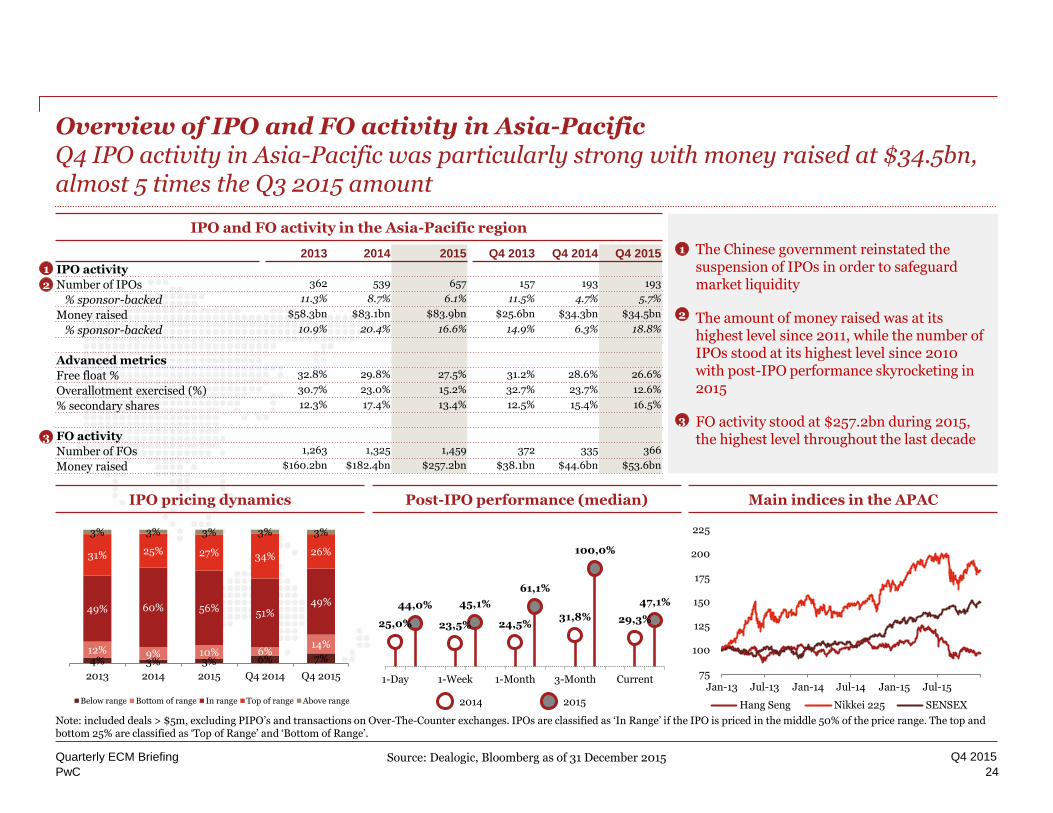
IPO and FO activity in the Asia-Pacific region
2013 2014 2015 Q4 2013 Q4 2014 Q4 2015
IPO activity
Number of IPOs 362 539 657 157 193 193
% sponsor-backed 11.3% 8.7% 6.1% 11.5% 4.7% 5.7%
Money raised $58.3bn $83.1bn $83.9bn $25.6bn $34.3bn $34.5bn
% sponsor-backed 10.9% 20.4% 16.6% 14.9% 6.3% 18.8%
Advanced metrics
Free float % 32.8% 29.8% 27.5% 31.2% 28.6% 26.6%
Overallotment exercised (%) 30.7% 23.0% 15.2% 32.7% 23.7% 12.6%
% secondary shares 12.3% 17.4% 13.4% 12.5% 15.4% 16.5%
FO activity
Number of FOs 1,263 1,325 1,459 372 335 366
Money raised $160.2bn $182.4bn $257.2bn $38.1bn $44.6bn $53.6bn
• The Chinese government reinstated the suspension of IPOs in order to safeguard market liquidity
• The amount of money raised was at its highest level since 2011, while the number of IPOs stood at its highest level since 2010 with post-IPO performance skyrocketing in 2015
• FO activity stood at $257.2bn during 2015, the highest level throughout the last decade
1
1
2
3
IPO pricing dynamics Post-IPO performance (median)
Overview of IPO and FO activity in Asia-PacificQ4 IPO activity in Asia-Pacific was particularly strong with money raised at $34.5bn, almost 5 times the Q3 2015 amount
24
Quarterly ECM Briefing
Note: included deals > $5m, excluding PIPO’s and transactions on Over-The-Counter exchanges. IPOs are classified as ‘In Range’ if the IPO is priced in the middle 50% of the price range. The top and bottom 25% are classified as ‘Top of Range’ and ‘Bottom of Range’.
2
3
2014YTD 2015YTD
Source: Dealogic, Bloomberg as of 31 December 2015
75
100
125
150
175
200
225
Jan-13 Jul-13 Jan-14 Jul-14 Jan-15 Jul-15
Hang Seng Nikkei 225 SENSEX
4% 3% 3% 6% 7%12% 9% 10% 6%
14%
49% 60% 56% 51%49%
31% 25% 27% 34% 26%
3% 3% 3% 3% 3%
2013 2014 2015 Q4 2014 Q4 2015
Below range Bottom of range In range Top of range Above range
25,0%
44,0%
23,5%
45,1%
24,5%
61,1%
31,8%
100,0%
29,3%
47,1%
1-Day 1-Week 1-Month 3-Month Current
PwC
Q4 2015
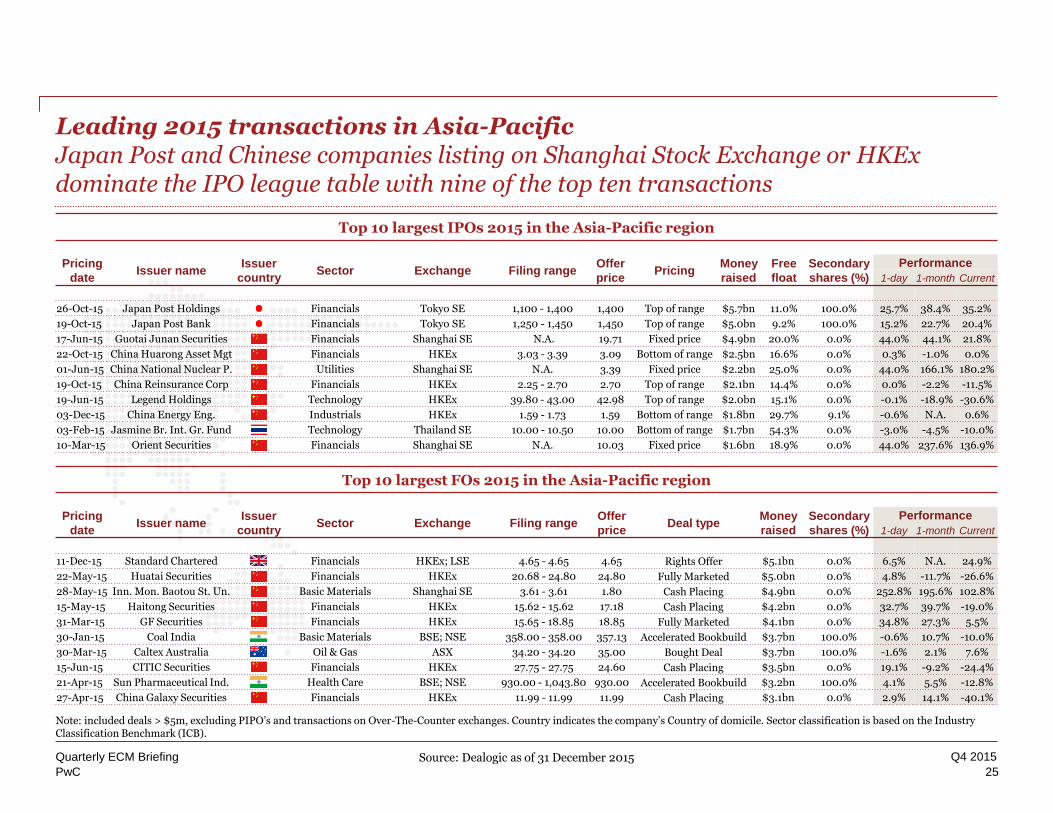
Leading 2015 transactions in Asia-PacificJapan Post and Chinese companies listing on Shanghai Stock Exchange or HKExdominate the IPO league table with nine of the top ten transactions
25
Quarterly ECM Briefing
Top 10 largest IPOs 2015 in the Asia-Pacific region
Top 10 largest FOs 2015 in the Asia-Pacific region
Pricing
dateIssuer name
Issuer
countrySector Exchange Filing range
Offer
pricePricing
Money
raised
Free
float
Secondary
shares (%)
Performance
1-day 1-month Current
26-Oct-15 Japan Post Holdings Financials Tokyo SE 1,100 - 1,400 1,400 Top of range $5.7bn 11.0% 100.0% 25.7% 38.4% 35.2%
19-Oct-15 Japan Post Bank Financials Tokyo SE 1,250 - 1,450 1,450 Top of range $5.0bn 9.2% 100.0% 15.2% 22.7% 20.4%
17-Jun-15 Guotai Junan Securities Financials Shanghai SE N.A. 19.71 Fixed price $4.9bn 20.0% 0.0% 44.0% 44.1% 21.8%
22-Oct-15 China Huarong Asset Mgt Financials HKEx 3.03 - 3.39 3.09 Bottom of range $2.5bn 16.6% 0.0% 0.3% -1.0% 0.0%
01-Jun-15 China National Nuclear P. Utilities Shanghai SE N.A. 3.39 Fixed price $2.2bn 25.0% 0.0% 44.0% 166.1% 180.2%
19-Oct-15 China Reinsurance Corp Financials HKEx 2.25 - 2.70 2.70 Top of range $2.1bn 14.4% 0.0% 0.0% -2.2% -11.5%
19-Jun-15 Legend Holdings Technology HKEx 39.80 - 43.00 42.98 Top of range $2.0bn 15.1% 0.0% -0.1% -18.9% -30.6%
03-Dec-15 China Energy Eng. Industrials HKEx 1.59 - 1.73 1.59 Bottom of range $1.8bn 29.7% 9.1% -0.6% N.A. 0.6%
03-Feb-15 Jasmine Br. Int. Gr. Fund Technology Thailand SE 10.00 - 10.50 10.00 Bottom of range $1.7bn 54.3% 0.0% -3.0% -4.5% -10.0%
10-Mar-15 Orient Securities Financials Shanghai SE N.A. 10.03 Fixed price $1.6bn 18.9% 0.0% 44.0% 237.6% 136.9%
Pricing
dateIssuer name
Issuer
countrySector Exchange Filing range
Offer
priceDeal type
Money
raised
Secondary
shares (%)
Performance
1-day 1-month Current
11-Dec-15 Standard Chartered Financials HKEx; LSE 4.65 - 4.65 4.65 Rights Offer $5.1bn 0.0% 6.5% N.A. 24.9%
22-May-15 Huatai Securities Financials HKEx 20.68 - 24.80 24.80 Fully Marketed $5.0bn 0.0% 4.8% -11.7% -26.6%
28-May-15 Inn. Mon. Baotou St. Un. Basic Materials Shanghai SE 3.61 - 3.61 1.80 Cash Placing $4.9bn 0.0% 252.8% 195.6% 102.8%
15-May-15 Haitong Securities Financials HKEx 15.62 - 15.62 17.18 Cash Placing $4.2bn 0.0% 32.7% 39.7% -19.0%
31-Mar-15 GF Securities Financials HKEx 15.65 - 18.85 18.85 Fully Marketed $4.1bn 0.0% 34.8% 27.3% 5.5%
30-Jan-15 Coal India Basic Materials BSE; NSE 358.00 - 358.00 357.13 Accelerated Bookbuild $3.7bn 100.0% -0.6% 10.7% -10.0%
30-Mar-15 Caltex Australia Oil & Gas ASX 34.20 - 34.20 35.00 Bought Deal $3.7bn 100.0% -1.6% 2.1% 7.6%
15-Jun-15 CITIC Securities Financials HKEx 27.75 - 27.75 24.60 Cash Placing $3.5bn 0.0% 19.1% -9.2% -24.4%
21-Apr-15 Sun Pharmaceutical Ind. Health Care BSE; NSE 930.00 - 1,043.80 930.00 Accelerated Bookbuild $3.2bn 100.0% 4.1% 5.5% -12.8%
27-Apr-15 China Galaxy Securities Financials HKEx 11.99 - 11.99 11.99 Cash Placing $3.1bn 0.0% 2.9% 14.1% -40.1%
Note: included deals > $5m, excluding PIPO’s and transactions on Over-The-Counter exchanges. Country indicates the company’s Country of domicile. Sector classification is based on the Industry Classification Benchmark (ICB).
Source: Dealogic as of 31 December 2015
PwC
Q4 2015
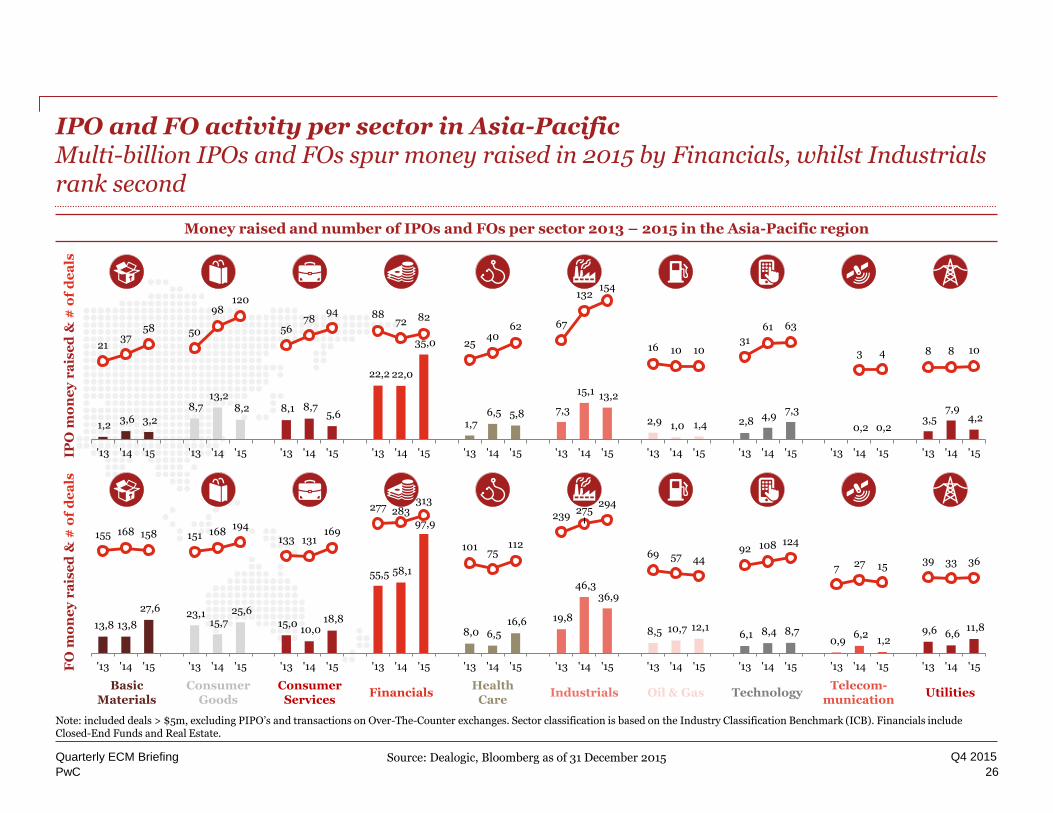
IPO and FO activity per sector in Asia-PacificMulti-billion IPOs and FOs spur money raised in 2015 by Financials, whilst Industrials rank second
26
Quarterly ECM Briefing
Money raised and number of IPOs and FOs per sector 2013 – 2015 in the Asia-Pacific region
IPO
mo
ne
y r
ais
ed
& #
of
de
als
FO
mo
ne
y r
ais
ed
& #
of
de
als
Note: included deals > $5m, excluding PIPO’s and transactions on Over-The-Counter exchanges. Sector classification is based on the Industry Classification Benchmark (ICB). Financials include Closed-End Funds and Real Estate.
IndustrialsBasic
MaterialsHealth
CareTechnology
Consumer Goods
Financials Oil & GasConsumer
ServicesTelecom-
municationUtilities
Source: Dealogic, Bloomberg as of 31 December 2015
13,8 13,8
27,6 23,1
15,7 25,6
15,0 10,0
18,8
55,5 58,1
97,9
8,0 6,5 16,6 19,8
46,3 36,9
8,5 10,7 12,1 6,1 8,4 8,7
0,9 6,2
1,2 9,6 6,6
11,8
155 168 158 151 168194
133 131169
277 283313
10175
112
239275
294
69 57 4492 108 124
7 27 1539 33 36
'13 '14 '15 '13 '14 '15 '13 '14 '15 '13 '14 '15 '13 '14 '15 '13 '14 '15 '13 '14 '15 '13 '14 '15 '13 '14 '15 '13 '14 '15
1,2 3,6 3,2
8,7 13,2
8,2 8,1 8,7 5,6
22,2 22,0
35,0
1,7 6,5 5,8 7,3
15,1 13,2
2,9 1,0 1,4 2,8 4,9
7,3
0,2 0,2 3,5
7,9 4,2
2137
58 50
98120
5678
94 8872 82
2540
62 67
132154
16 10 1031
61 63
3 4 8 8 10
'13 '14 '15 '13 '14 '15 '13 '14 '15 '13 '14 '15 '13 '14 '15 '13 '14 '15 '13 '14 '15 '13 '14 '15 '13 '14 '15 '13 '14 '15
PwC
Q4 2015
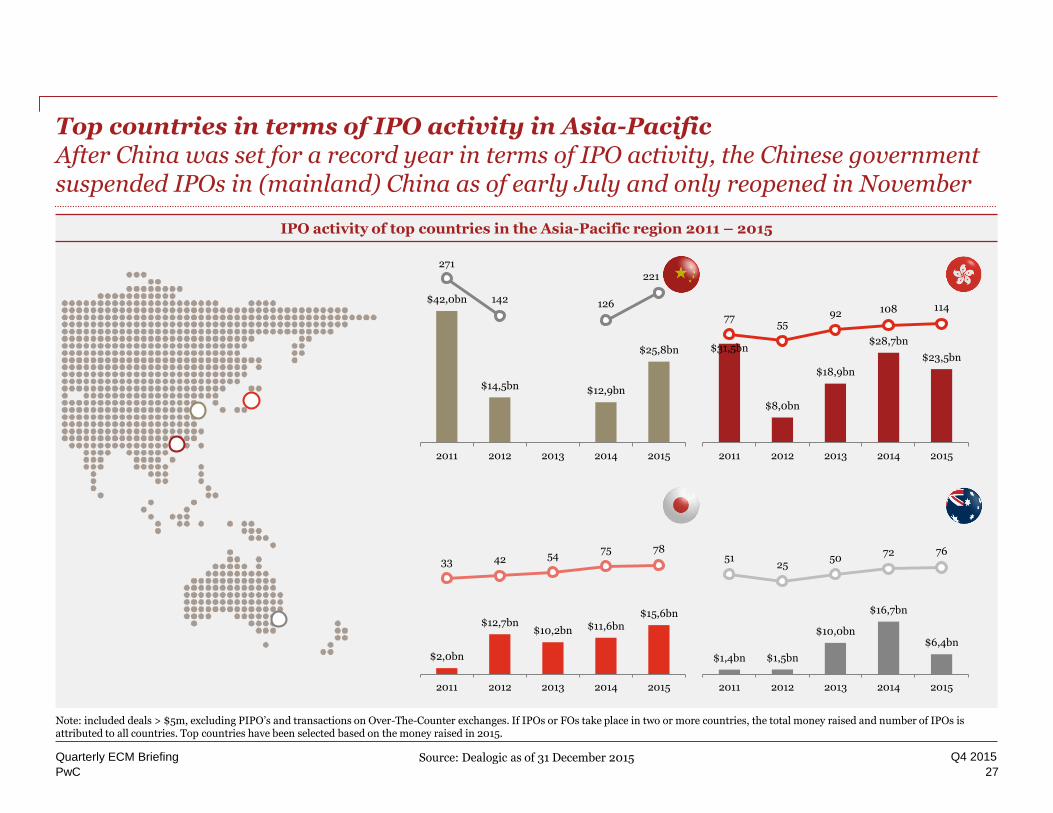
$42,0bn
$14,5bn $12,9bn
$25,8bn
271
142 126
221
2011 2012 2013 2014 2015
$31,5bn
$8,0bn
$18,9bn
$28,7bn
$23,5bn
7755
92 108 114
2011 2012 2013 2014 2015
$1,4bn $1,5bn
$10,0bn
$16,7bn
$6,4bn
5125
5072 76
2011 2012 2013 2014 2015
$2,0bn
$12,7bn$10,2bn $11,6bn
$15,6bn
33 42 5475 78
2011 2012 2013 2014 2015
Top countries in terms of IPO activity in Asia-PacificAfter China was set for a record year in terms of IPO activity, the Chinese government suspended IPOs in (mainland) China as of early July and only reopened in November
27
Quarterly ECM Briefing
IPO activity of top countries in the Asia-Pacific region 2011 – 2015
Note: included deals > $5m, excluding PIPO’s and transactions on Over-The-Counter exchanges. If IPOs or FOs take place in two or more countries, the total money raised and number of IPOs is attributed to all countries. Top countries have been selected based on the money raised in 2015.
Source: Dealogic as of 31 December 2015
Disclaimer
© 2016 PricewaterhouseCoopers Accountants N.V. (34180285) (hereinafter referred to as 'PwC'). All rights reserved. Not for further distribution without the permission of PwC. “PwC” refers to the network of member firms of PricewaterhouseCoopers International Limited (PwCIL), or, as the context requires, individual member firms of the PwC network. Each member firm is a separate legal entity and does not act as agent of PwCIL or any other member firm. PwCIL does not provide any services to clients. PwCIL is not responsible or liable for the acts or omissions of any of its member firms nor can it control the exercise of their professional judgment or bind them in any way. No member firm is responsible or liable for the acts or omissions of any other member firm nor can it control the exercise of another member firm’s professional judgment or bind another member firm or PwCIL in any way.
PricewaterhouseCoopers Accountants N.V. is the author of this publication and has got the copyrights. Without written permission of PwC this publication may not be duplicated, copied, distributed or published. This publication has been prepared for information purposes and general guidance on matters of interest only, and does not constitute, or may not be interpreted as, professional advice or as a sale, buying or trading advice. You should not act upon the information contained in this publication without obtaining specific professional advice. No representation or warranty (express or implied) is given as to the accuracy or completeness of the information contained in this publication, and, to the extent permitted by law, PwC does not accept or assume any liability, responsibility or duty of care for any consequences of you or anyone else acting, or refraining to act, in reliance on the information contained in this publication or for any decision based on it.