Embed Size (px)
Citation preview
OPEN ACCESS
Properties of metal–water interfaces studied fromfirst principlesTo cite this article: Sebastian Schnur and Axel Groß 2009 New J. Phys. 11 125003
View the article online for updates and enhancements.
You may also likeThe Piezoelectric PZT Thin FilmsDeposited on Metal SubstratesT Ito, T Nishi, T Umegaki et al.
-
Scalably manufactured textured surfacesfor controlling wettability in oil-watersystemsManojkumar Lokanathan, EnakshiWikramanayake and Vaibhav Bahadur
-
Silicene Anodes for Lithium-Ion Batterieson Metal SubstratesAlexander Y. Galashev and Ksenia A.Ivanichkina
-
Recent citationsThe nanoscale structure of the Pt-waterdouble layer under bias revealedRémi Khatib et al
-
Molecular modeling of organic corrosioninhibitors: calculations, pitfalls, andconceptualization of molecule–surfacebondingAnton Kokalj
-
Bias-dependent diffusion of a H2Omolecule on metal surfaces by the first-principles method under the grand-canonical ensembleSatoshi Hagiwara et al
-
This content was downloaded from IP address 118.232.117.242 on 12/11/2021 at 00:58
T h e o p e n – a c c e s s j o u r n a l f o r p h y s i c s
New Journal of Physics
Properties of metal–water interfaces studied fromfirst principles
Sebastian Schnur and Axel GroßInstitut für Theoretische Chemie, Universität Ulm, D-89069 Ulm, GermanyE-mail: axel.gross@uni-ulm-de
New Journal of Physics 11 (2009) 125003 (25pp)Received 2 April 2009Published 11 December 2009Online at http://www.njp.org/doi:10.1088/1367-2630/11/12/125003
Abstract. Properties of the metal–water interface have been addressed byperiodic density functional theory calculations, in particular with respect tothe electronic and geometric structures of water bilayers on several transitionmetal surfaces. It will be demonstrated that the presence of the metal substrateleads to a significant polarization of the water bilayer. This causes a substantialwater-induced reduction of the work function in spite of the weak water–metalinteraction, but it is not associated with a significant change of the electronicstructure of the metal substrates. The structure and the vibrational spectra ofwater bilayers at room temperatures have been studied performing ab initiomolecular dynamics simulations. The simulations suggest that the water bilayerstructure on noble metals is not stable at room temperature, whereas on morestrongly interacting metal surfaces some ordering of the water layer persists.In addition, metal–water interfaces under electrochemical conditions, i.e. forcharged metal substrates, are addressed. Our simulations show that the chargingof the surface leads to characteristic changes in the wall–oxygen distribution andthe vibrational spectra.
New Journal of Physics 11 (2009) 1250031367-2630/09/125003+25$30.00 © IOP Publishing Ltd and Deutsche Physikalische Gesellschaft
2
Contents
1. Introduction 22. Computational details 43. Structure of water bilayers on transition metal surfaces 44. Water–metal interface at room temperature 95. Water–metal interface in the presence of electric fields 166. Conclusions 22Acknowledgments 23References 23
1. Introduction
The water–metal interface is of significant interest not only from a fundamental but also froman applied point of view in the context of corrosion and catalysis. This is particularly true inelectrochemistry that has attracted a lot of attraction recently due to its relevance for hydrogenproduction and energy storage and conversion, as realized, e.g. in fuel cells. This importancehas motivated a huge number of experimental [1]–[3] and theoretical [4]–[9] surface sciencestudies as well as more electrochemically oriented research efforts [10, 11].
In spite of the numerous studies, there is still a rather large number of questions left open.For example, it is not clear whether at room temperature the water at a metal surface hasa crystalline ice-like structure or whether it is liquid-like. On late transition metal surfaces,in particular with hexagonal symmetry, it has been traditionally assumed that water adsorbsin a bilayer structure [9] whose structure is similar to that of the densest layer of ice [1]. Inthis structure, every second water molecule is oriented parallel to the surface bound with itsoxygen atom to a top site of the metal surface. For the other water molecules, there are infact two different possible orientations, namely the so-called H-down and H-up structures withone hydrogen atom either pointing toward or away from the surface. Typically, the adsorptionenergies of both types of bilayers are similar. However, on the less noble metals Ru, Rh and Nithat exhibit a stronger interaction with the water molecules, a half-dissociated overlayer is morestable [8, 9, 12] in which every second water molecule is dissociated to OH.
While it is of course important to determine the energetically most stable structure of waterbilayers on metal substrates, in most applications the metal–water interface under ambientconditions is of interest, i.e. at temperatures around room temperature. There have beennumerous molecular dynamics studies addressing the structure of the metal–water interfaceat finite temperatures using parameterized interaction potentials [13]–[16]. While classicalpotentials might reproduce structural properties of the water quite satisfactorily [17]–[19], theinteraction between the metal and the water molecules is usually not described reliably due tothe inability to reproduce many-body effects in the metal–molecule interaction. This situationcan be significantly improved by ab initio molecular dynamics (AIMD) simulations, in whichthe forces necessary to integrate the classical equations of motion are determined ‘on the fly’by first-principles electronic structure calculations, in particular based on density functionaltheory (DFT). Although there are still concerns with respect to the adequacy of current DFTfunctionals [20], DFT calculations correspond to an electronic structure methodology that
New Journal of Physics 11 (2009) 125003 (http://www.njp.org/)
3
combines numerical efficiency with sufficient accuracy. Recently there have been first AIMDstudies addressing the metal–water interface [4]–[7], but because of the high computationaleffort these simulations were restricted to rather short simulation times or small unit cellsthat limited the validity of the conclusions. Yet, the ever-increasing computer power allowsus to extend the parameters of the AIMD simulations to conditions that allow statistically morerelevant conclusions.
A further complication for the theoretical treatment of the water–metal interface arises fromthe fact that in electrochemistry where these interfaces are of particular importance the electrodepotential is varied leading to charged surfaces. In fact, there have already been several attemptsto model external fields or varying electrode potentials at the solid–liquid interface withinperiodic DFT calculations [21]–[27]. These studies provided valuable insights into fundamentalprocesses at the electrochemical solid–liquid interface. There has already been an AIMD studyaddressing the structure of water under acidic conditions for different electrode potentials[28, 29]. Still there is no commonly accepted method to describe varying electrode potentials inperiodic DFT calculations.
Recently, it has been noted that the presence of a water bilayer on a close-packed metalsurface hardly influences the electronic structure of the metal due to the weak interactionbetween the metal and water [30]. At the same time, the presence of water changes the workfunction of metal electrodes quite significantly [31]. It is not surprising that the effect of H-downand H-up water bilayers on the work function of metal surfaces depends strongly on the typeof the bilayer because of the opposite sign of their dipole moment normal to the surface. Thedifferences in the work function change induced by the two types of bilayers can be more than2 eV, and it has already been pointed out that this large difference might lead to a charge controlof the water monolayer/metal interface, i.e. the stable water bilayer structure can be tuned bychanging the surface charge [31]. However, it is quite surprising that on Pd(111) both types ofbilayers lower the work function in spite of the small influence on the electronic structure of themetal [31]. The reason for this phenomenon, however, has to the best of our knowledge not yetbeen addressed. Furthermore, it is still debated how ambient conditions influence the geometricand electronic structures of metal–water interfaces.
In this paper, we focus on structural and electronic properties of the first layer of water onmetal–water interfaces. We will first briefly review the current understanding of the structureof the water–metal interface based on first-principles studies. We concentrate on close-packedmetal surfaces and on hexagonal ice-like bilayer structures that have been experimentallyidentified as the prevailing structures of water on these close-packed surfaces [1, 2]. Wewill then address the surprising change of the work function upon the adsorption of waterbilayers in particular focusing on the polarization of the water bilayers on Au(111), Ag(111),Pt(111), Pd/Au(111) and Ru(0001). The Pd/Au(111) overlayer system that consists of a Pdmonolayer deposited pseudomorphically on Au(111) has been chosen since it interacts withwater almost as strongly as Pt(111) [22], but has a lattice constant that is larger by 5%. Nextwe present AIMD studies of water layers on these metal substrates addressing the questionof whether the hexagonal ice-like water bilayers are stable at room temperature. Finally, afterdiscussing different approaches to include varying electrode potentials in DFT calculations, wewill estimate the effect of external electric fields on the stability of the water bilayer by usingcharged electrodes in the AIMD simulations.
New Journal of Physics 11 (2009) 125003 (http://www.njp.org/)
4
2. Computational details
All calculations were carried out using the periodic DFT package VASP [32], employingthe generalized gradient approximation (GGA) to describe the exchange–correlation effectswithin the exchange–correlation functional by Perdew, Burke and Ernzerhof (PBE) [33].It has been shown that this functional gives a reasonable description of the properties of water[20, 34, 35]. The ionic cores were represented by projector augmented wave (PAW) potentials[36] as constructed by Kresse and Joubert [37]. The electronic one-particle wave functionwere expanded in a plane-wave basis set up to an energy cutoff of 400 eV. The metal substrateswere represented by four-layer slabs.
The energy minimum structures of the water bilayers were determined within a√
3 ×√3R30◦ surface unit cell using 9 × 9 × 1 k-points until the energies were converged to within
10−4 eV. AIMD simulations were performed using the Verlet algorithm with a time step of 1 fsat a temperature of 300 K within the microcanonical ensemble in a larger 2
√3 × 2
√3R30◦ unit
cell to reduce the constraints on the lateral geometry of the water structures. A second waterlayer was placed on top of the first one in order to model a surrounding water environment. Toprevent desorption of this second, weakly bound water layer, the height of two oxygen atoms ofthe eight water molecules of the second layer in the unit cell was fixed. The AIMD runs werestarted with an initial ideal bilayer configuration and random velocities. The first 1 ps weconsidered as the thermalization period. For the AIMD simulations, the energy cutoff wasreduced to 350 eV and 2 × 2 × 1 k-points were used to get a compromise between sufficientaccuracy and manageable simulation time. The total energy in the AIMD runs was typicallyconserved within 50 meV for the long runs extending to more than 10 ps.
3. Structure of water bilayers on transition metal surfaces
In general, the interaction of water molecules with metal surfaces is relatively weak. Accordingto DFT calculations, the adsorption energies for single water molecules on (111) metal surfacesrange from −0.1 to −0.4 eV with the binding strength ordered according to Au < Ag < Cu <
Pd < Pt < Ru < Rh [9] for some typical late transition metals. Single water molecules bind tometal surfaces via their oxygen atom at top sites at distances between 2.25 Å (Cu) and 3.02 Å(Au) from the uppermost metal layer which is much larger than typical distances of chemisorbedspecies.
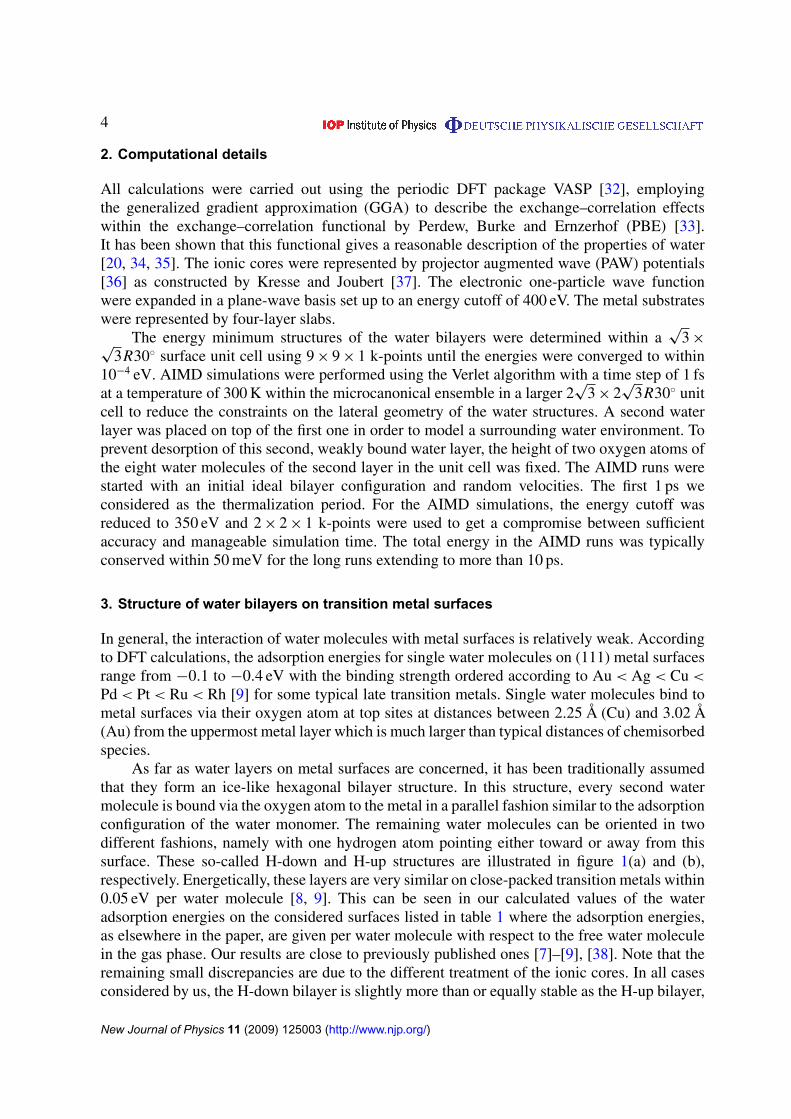
As far as water layers on metal surfaces are concerned, it has been traditionally assumedthat they form an ice-like hexagonal bilayer structure. In this structure, every second watermolecule is bound via the oxygen atom to the metal in a parallel fashion similar to the adsorptionconfiguration of the water monomer. The remaining water molecules can be oriented in twodifferent fashions, namely with one hydrogen atom pointing either toward or away from thissurface. These so-called H-down and H-up structures are illustrated in figure 1(a) and (b),respectively. Energetically, these layers are very similar on close-packed transition metals within0.05 eV per water molecule [8, 9]. This can be seen in our calculated values of the wateradsorption energies on the considered surfaces listed in table 1 where the adsorption energies,as elsewhere in the paper, are given per water molecule with respect to the free water moleculein the gas phase. Our results are close to previously published ones [7]–[9], [38]. Note that theremaining small discrepancies are due to the different treatment of the ionic cores. In all casesconsidered by us, the H-down bilayer is slightly more than or equally stable as the H-up bilayer,
New Journal of Physics 11 (2009) 125003 (http://www.njp.org/)
5
Table 1. Adsorption energies of the H-up and the H-down water bilayers onAu(111), Ag(111), Pt(111), Pd/Au(111) and Ru(0001) in eV per water moleculewith respect to the free water molecule.
Ea (eV) Au(111) Ag(111) Pt(111) Pd/Au(111) Ru(0001)
H-up −0.41 −0.41 −0.45 −0.44 −0.49H-down −0.43 −0.43 −0.48 −0.48 −0.49
Figure 1. Side and top view of the water bilayer structures: (a) H-down bilayer,(b) H-up water bilayer, (c) half dissociated water-OH-bilayer with the additionalhydrogen atoms at the center of the hexagonal rings.
but in fact on Ni(111) and Cu(111) the H-up geometry is favored [8, 9]. It is also important torealize that the largest fraction of the energy gain upon the water bilayer formation on the metalsubstrates stems from the water–water interaction with only a minor portion of about 20–30%being due to the water–metal interaction [9].
However, for metals such as Ru, Rh or Ni that interact more strongly with water, thewater bilayers are energetically not stable with respect to dissociation. According to DFTcalculations [9], they instead form a half-dissociated overlayer with every second watermolecule dissociated to OH (see figure 1(c)), as first suggested for water on Ru(0001) [12, 39].We also find that on Ru(0001) the half-dissociated water layer (Ea = 0.71 eV, assuming thatthe additional hydrogen atoms are located at the center of the hexagonal rings, as depictedin figure 1(c)) is significantly more stable than the bilayer structures. It is, however, stilldebated whether the half-dissociated water bilayer indeed is formed since its formation mightbe hindered by large barriers [39, 40].
Of particular importance is the Pt–water interface since Pt is an important electrodematerial, for example, in fuel cells. On Pt, the water bilayer should still stay intact. It wasrecently shown that the electronic structure of the Pt surfaces is hardly influenced by thepresence of water [30] because of the weak water–metal interaction. As a consequence,adsorption energies of chemisorbed species are not significantly altered by the presence of awater bilayer [22].
New Journal of Physics 11 (2009) 125003 (http://www.njp.org/)
6
Au Ag Pt Pd/Au Ru–3.5
–3.0
–2.5
–2.0
–1.5
–1.0
–0.5
0.0
0.5
1.0
Wor
k fu
nctio
n ch
ange
(eV
)
H-down water bilayer
H-up water bilayer
Half-dissociated water layer
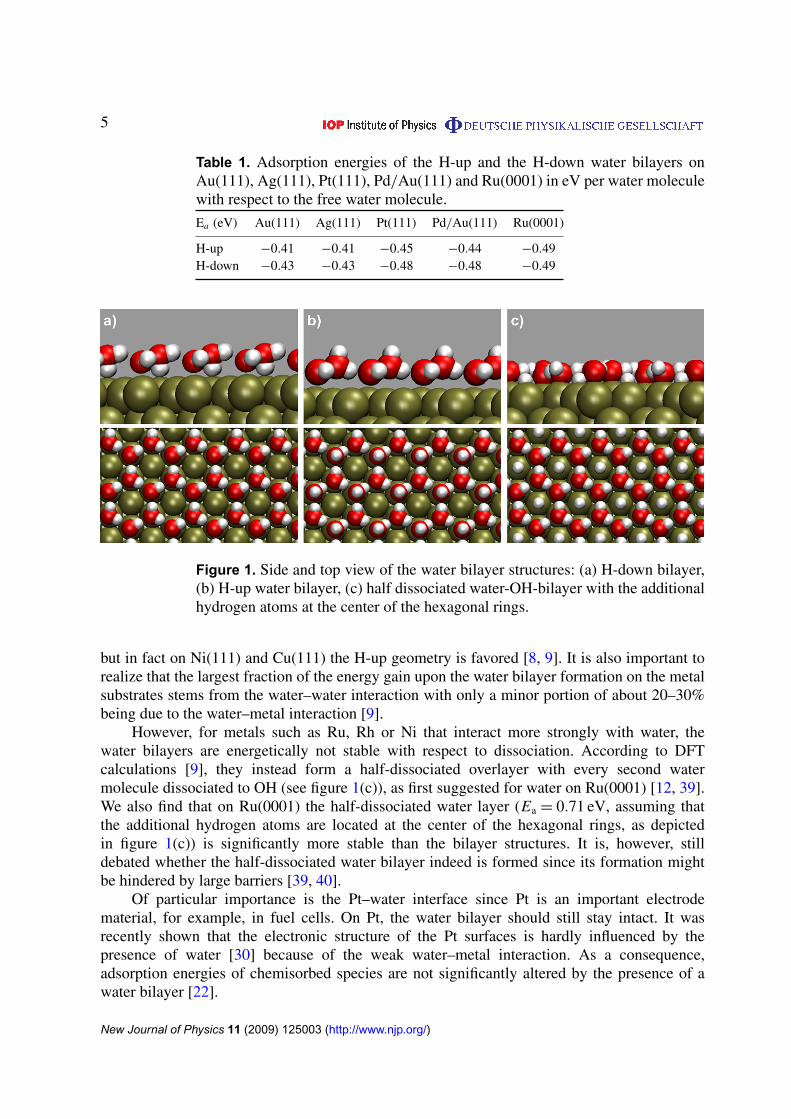
Figure 2. Calculated work function change induced by the presence of H-upand H-down water bilayers on Au(111), Ag(111), Pt(111), Pd/Au(111) andRu(0001). For Ru, also the work function change induced by the half-dissociatedwater layer is included.
Yet it is known that the work function of many metal surfaces is significantly reduced uponthe adsorption of water bilayers [1, 41]. In figure 2, we have plotted the calculated work functionchanges for H-down and H-up water bilayers on Au(111), Ag(111), Pt(111), one Pd monolayeron Au(111) and Ru(0001). For Ru, we also determined the work function change induced bythe half-dissociated water layer.
First of all it is obvious that the water-induced work function change sensitively depends onthe orientation of the water bilayer. The difference in the induced work function change betweenthe H-up and the H-down configuration is about 2 eV for all considered metal substrates.A similar result has recently been obtained in periodic DFT calculations for water bilayerson Pd(111) [31]. These findings are not surprising considering the fact that the two types ofwater bilayers should have opposite dipole moments normal to the surface.
What is indeed surprising is the fact that there is a strong asymmetry in the inducedwork function change for both orientations of the water bilayers. For Pt(111), Pd/Au(111)and Ru(0001), the work function is even lowered due to the presence of the water bilayersirrespective of their orientation. Naively one would expect that the H-down bilayer increasesand the H-up bilayer lowers the work function by the same amount because of their oppositedipole moments. Instead, there is an overall tendency to lower the work function that riseswith increasing interaction strength between water and the metal (note that the overlayer systemPd/Au(111) binds water as strongly as Pt(111) [22] due to a combination of strain and electronicinteraction effects [42]–[44]).
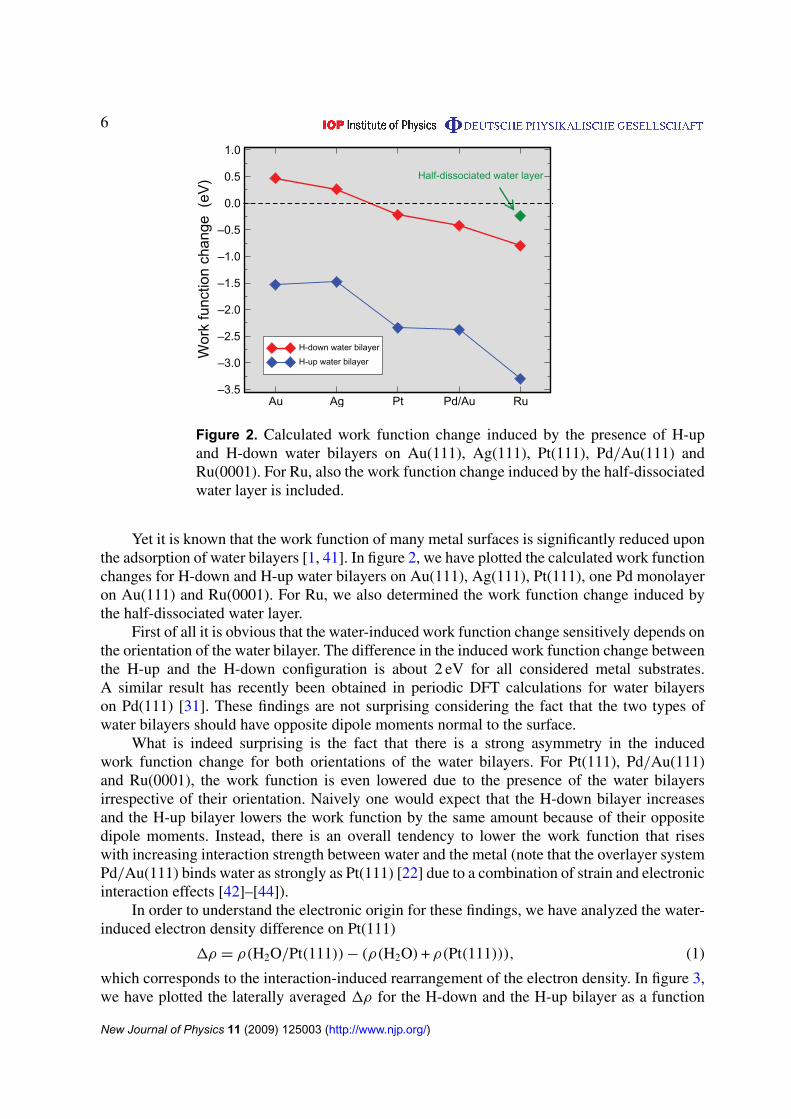
In order to understand the electronic origin for these findings, we have analyzed the water-induced electron density difference on Pt(111)
1ρ = ρ(H2O/Pt(111)) − (ρ(H2O) + ρ(Pt(111))), (1)
which corresponds to the interaction-induced rearrangement of the electron density. In figure 3,we have plotted the laterally averaged 1ρ for the H-down and the H-up bilayer as a function
New Journal of Physics 11 (2009) 125003 (http://www.njp.org/)
7
–6 –4 –2 0 2 4 6 8 10z - coordinate (Å)
–2
–1
0
1
Cha
rge
dens
ity d
iffer
ence
(arb
. uni
ts)
Charge density differenceIntegrated density diff.
UppermostPt layer
H O
(a) H-down
∆Φ = –0.22 eV
–6 –4 –2 0 2 4 6 8 10z - coordinate (Å)
–2
–1
0
1
Cha
rge
dens
ity d
iffer
ence
(arb
. uni
ts)
Charge density differenceIntegrated density diff.
UppermostPt layer
HO
(b) H-up
∆Φ = –2.34 eV
Figure 3. Laterally averaged electron density difference upon the adsorption ofan H-down (a) and an H-up (b) water bilayer on Pt(111) as a function of thevertical height. The heights of the uppermost Pt layer and the hydrogen andoxygen atom of the oppositely oriented water molecules are indicated by verticallines. In addition, the integrated charge density difference is plotted. Note thesame scale for the charge density difference in both figures.
of the vertical height. Note that for both orientations of the water bilayer there is a significantelectronic charge transfer from the region of the water bilayer toward the space between theuppermost metal layer and the water molecules, as has in fact also been found before for waterlayers on Ru(0001) [39]. In the case of the H-down water bilayer, this charge transfer is morepronounced than for the H-up bilayer. Note that this transfer leads to the creation of an additionaldipole layer with a dipole moment that reduces the work function. For the H-down bilayer, thisovercompensates the effect of the intrinsic dipole moment of the water bilayer leading to a network function reduction on Pt(111), whereas for the H-up bilayer, these two dipole momentsadd up.
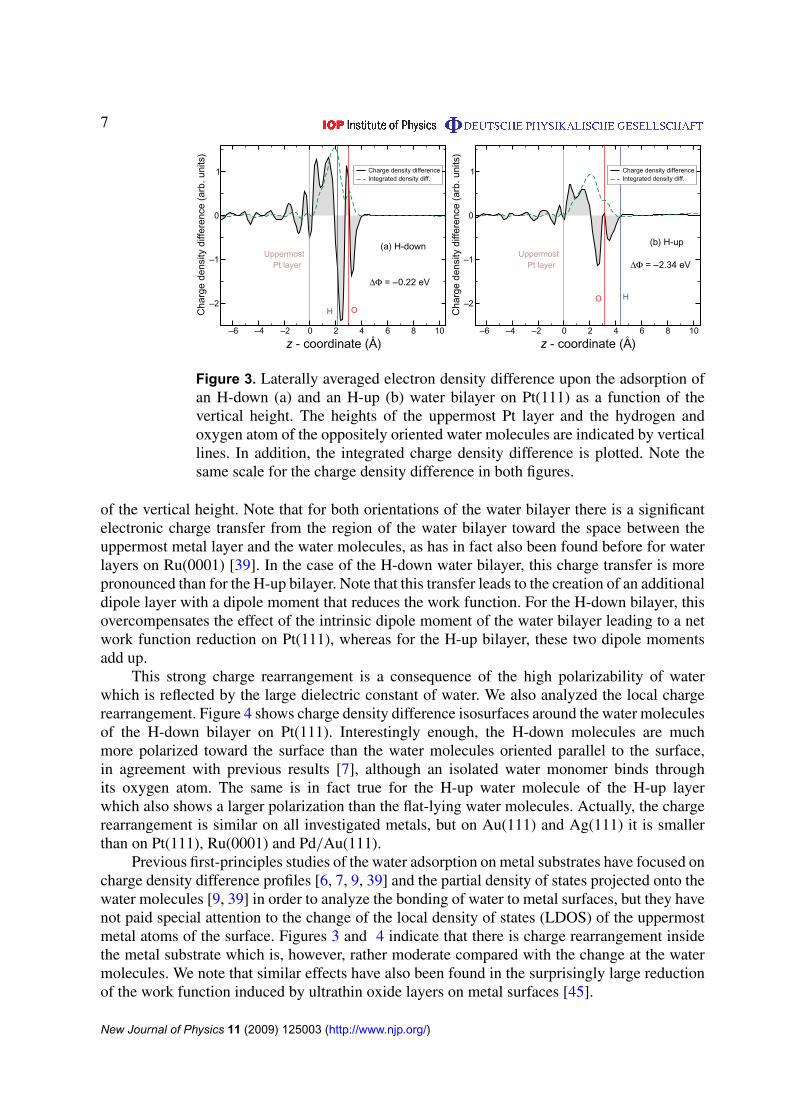
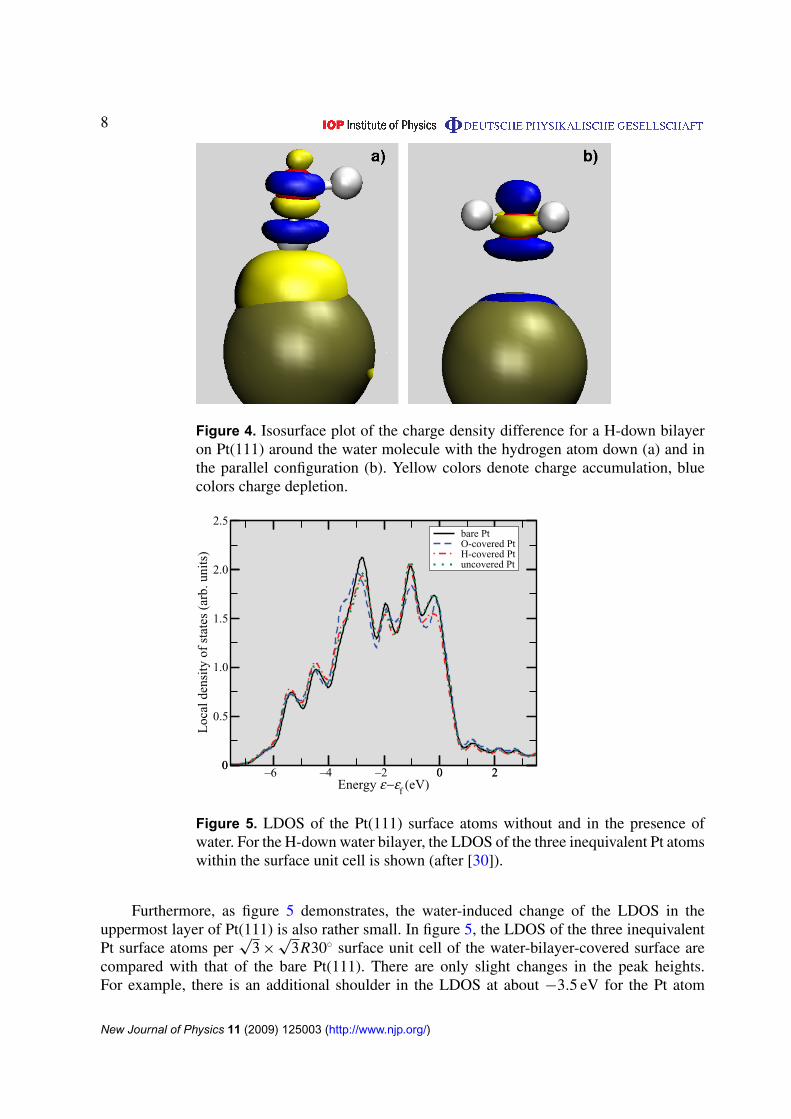
This strong charge rearrangement is a consequence of the high polarizability of waterwhich is reflected by the large dielectric constant of water. We also analyzed the local chargerearrangement. Figure 4 shows charge density difference isosurfaces around the water moleculesof the H-down bilayer on Pt(111). Interestingly enough, the H-down molecules are muchmore polarized toward the surface than the water molecules oriented parallel to the surface,in agreement with previous results [7], although an isolated water monomer binds throughits oxygen atom. The same is in fact true for the H-up water molecule of the H-up layerwhich also shows a larger polarization than the flat-lying water molecules. Actually, the chargerearrangement is similar on all investigated metals, but on Au(111) and Ag(111) it is smallerthan on Pt(111), Ru(0001) and Pd/Au(111).
Previous first-principles studies of the water adsorption on metal substrates have focused oncharge density difference profiles [6, 7, 9, 39] and the partial density of states projected onto thewater molecules [9, 39] in order to analyze the bonding of water to metal surfaces, but they havenot paid special attention to the change of the local density of states (LDOS) of the uppermostmetal atoms of the surface. Figures 3 and 4 indicate that there is charge rearrangement insidethe metal substrate which is, however, rather moderate compared with the change at the watermolecules. We note that similar effects have also been found in the surprisingly large reductionof the work function induced by ultrathin oxide layers on metal surfaces [45].
New Journal of Physics 11 (2009) 125003 (http://www.njp.org/)
8
Figure 4. Isosurface plot of the charge density difference for a H-down bilayeron Pt(111) around the water molecule with the hydrogen atom down (a) and inthe parallel configuration (b). Yellow colors denote charge accumulation, bluecolors charge depletion.
–6 –4 –2 0 2Energy ε−ε
f(eV)
0
0.5
1.5
1.0
2.5
Loc
al d
ensi
ty o
f st
ates
(ar
b. u
nits
)
0 20
2.0
bare PtO-covered PtH-covered Ptuncovered Pt
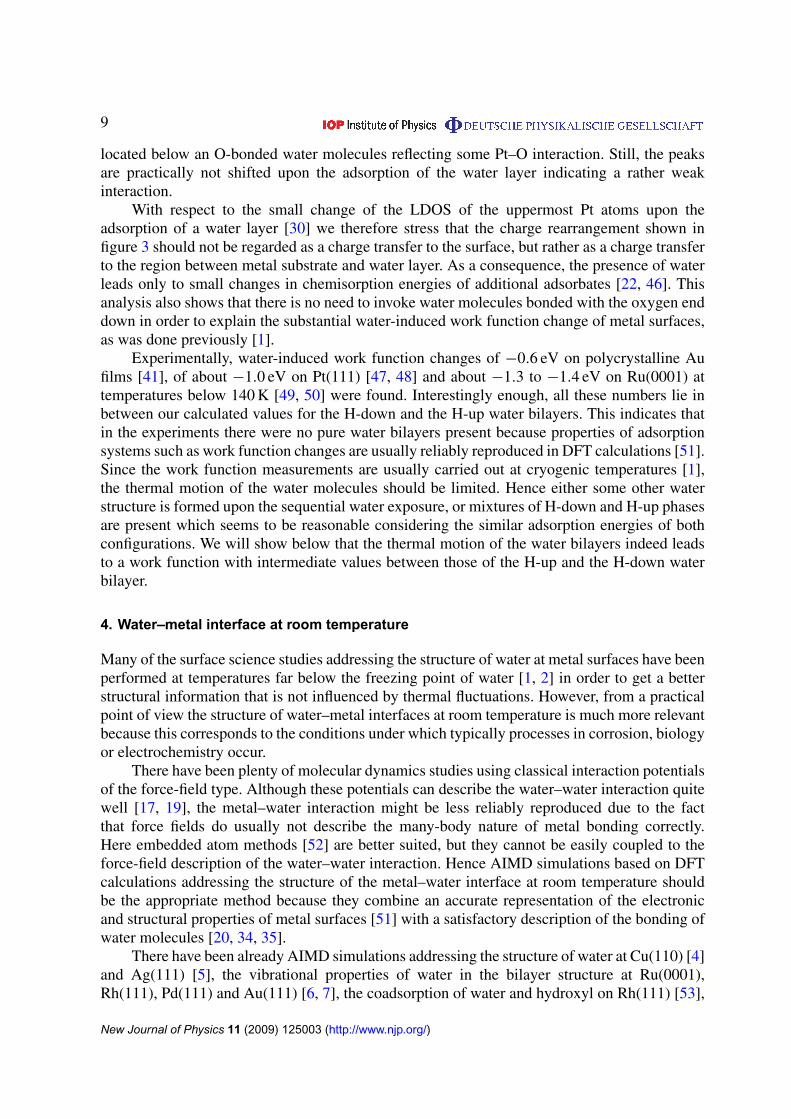
Figure 5. LDOS of the Pt(111) surface atoms without and in the presence ofwater. For the H-down water bilayer, the LDOS of the three inequivalent Pt atomswithin the surface unit cell is shown (after [30]).
Furthermore, as figure 5 demonstrates, the water-induced change of the LDOS in theuppermost layer of Pt(111) is also rather small. In figure 5, the LDOS of the three inequivalentPt surface atoms per
√3 ×
√3R30◦ surface unit cell of the water-bilayer-covered surface are
compared with that of the bare Pt(111). There are only slight changes in the peak heights.For example, there is an additional shoulder in the LDOS at about −3.5 eV for the Pt atom
New Journal of Physics 11 (2009) 125003 (http://www.njp.org/)
9
located below an O-bonded water molecules reflecting some Pt–O interaction. Still, the peaksare practically not shifted upon the adsorption of the water layer indicating a rather weakinteraction.
With respect to the small change of the LDOS of the uppermost Pt atoms upon theadsorption of a water layer [30] we therefore stress that the charge rearrangement shown infigure 3 should not be regarded as a charge transfer to the surface, but rather as a charge transferto the region between metal substrate and water layer. As a consequence, the presence of waterleads only to small changes in chemisorption energies of additional adsorbates [22, 46]. Thisanalysis also shows that there is no need to invoke water molecules bonded with the oxygen enddown in order to explain the substantial water-induced work function change of metal surfaces,as was done previously [1].
Experimentally, water-induced work function changes of −0.6 eV on polycrystalline Aufilms [41], of about −1.0 eV on Pt(111) [47, 48] and about −1.3 to −1.4 eV on Ru(0001) attemperatures below 140 K [49, 50] were found. Interestingly enough, all these numbers lie inbetween our calculated values for the H-down and the H-up water bilayers. This indicates thatin the experiments there were no pure water bilayers present because properties of adsorptionsystems such as work function changes are usually reliably reproduced in DFT calculations [51].Since the work function measurements are usually carried out at cryogenic temperatures [1],the thermal motion of the water molecules should be limited. Hence either some other waterstructure is formed upon the sequential water exposure, or mixtures of H-down and H-up phasesare present which seems to be reasonable considering the similar adsorption energies of bothconfigurations. We will show below that the thermal motion of the water bilayers indeed leadsto a work function with intermediate values between those of the H-up and the H-down waterbilayer.
4. Water–metal interface at room temperature
Many of the surface science studies addressing the structure of water at metal surfaces have beenperformed at temperatures far below the freezing point of water [1, 2] in order to get a betterstructural information that is not influenced by thermal fluctuations. However, from a practicalpoint of view the structure of water–metal interfaces at room temperature is much more relevantbecause this corresponds to the conditions under which typically processes in corrosion, biologyor electrochemistry occur.
There have been plenty of molecular dynamics studies using classical interaction potentialsof the force-field type. Although these potentials can describe the water–water interaction quitewell [17, 19], the metal–water interaction might be less reliably reproduced due to the factthat force fields do usually not describe the many-body nature of metal bonding correctly.Here embedded atom methods [52] are better suited, but they cannot be easily coupled to theforce-field description of the water–water interaction. Hence AIMD simulations based on DFTcalculations addressing the structure of the metal–water interface at room temperature shouldbe the appropriate method because they combine an accurate representation of the electronicand structural properties of metal surfaces [51] with a satisfactory description of the bonding ofwater molecules [20, 34, 35].
There have been already AIMD simulations addressing the structure of water at Cu(110) [4]and Ag(111) [5], the vibrational properties of water in the bilayer structure at Ru(0001),Rh(111), Pd(111) and Au(111) [6, 7], the coadsorption of water and hydroxyl on Rh(111) [53],
New Journal of Physics 11 (2009) 125003 (http://www.njp.org/)
10
or oxidation reactions in the presence of water [54]. However, these studies were hampered bythe high computational costs of AIMD simulations resulting in relatively short simulation timesand/or small simulation cells.
In detail, the Cu(110)–water interface [4] and the Ag(111)–water interface [5] wereaddressed by Car–Parrinello molecular dynamics simulations with the metal atoms being fixedat their unrelaxed surface geometries. More than one layer of water atoms was used in thesimulations, and the starting geometry of the Car–Parrinello simulations was determined usinga classical water–metal model potential [17]. After a thermalization period of about 1 ps, theab initio production runs were carried out for about 2 ps at a temperature of 300 K. No hexagonalice-like water layer was observed. However, for the Ag(111)-water simulations, a rectangularc(8 × 4) surface unit cell was chosen, which does not allow the formation of a hexagonal waterlayer.
Further AIMD studies focusing on the structure and vibrational spectra of water atRu(0001), Rh(111), Pd(111) and Au(111) were performed within a
√3 ×
√3R30◦ geometry at
temperatures of 90–140 K for a run time of 2 ps after an equilibration time of about 1 ps [6, 7].These simulations allowed an assignment of vibrational modes in agreement with experimentalobservations at low temperatures [55]. However, the small unit cell and the low temperaturesdid not allow any significant restructuring of the water layer.
Yet, due to the improvement in computer power and the development of more efficientelectronic structure algorithms AIMD simulations can nowadays yield statistically significantresults [56]. We have therefore performed AIMD simulations of water bilayers at close-packedmetal surfaces within a larger 2
√3 × 2
√3R30◦ surface unit cell and longer simulation times
of at least 8 ps at room temperature. The simulations were started with the energy minimumstructure and random initial velocities. A second water layer was placed on top of the firstone in order to model a surrounding water environment. To prevent desorption of this second,weakly bound water layer, two oxygen atoms of the eight water molecules of the second layer inthe unit cell were fixed vertically. In the results discussed below, however, we will solely focuson properties of the first water layer.
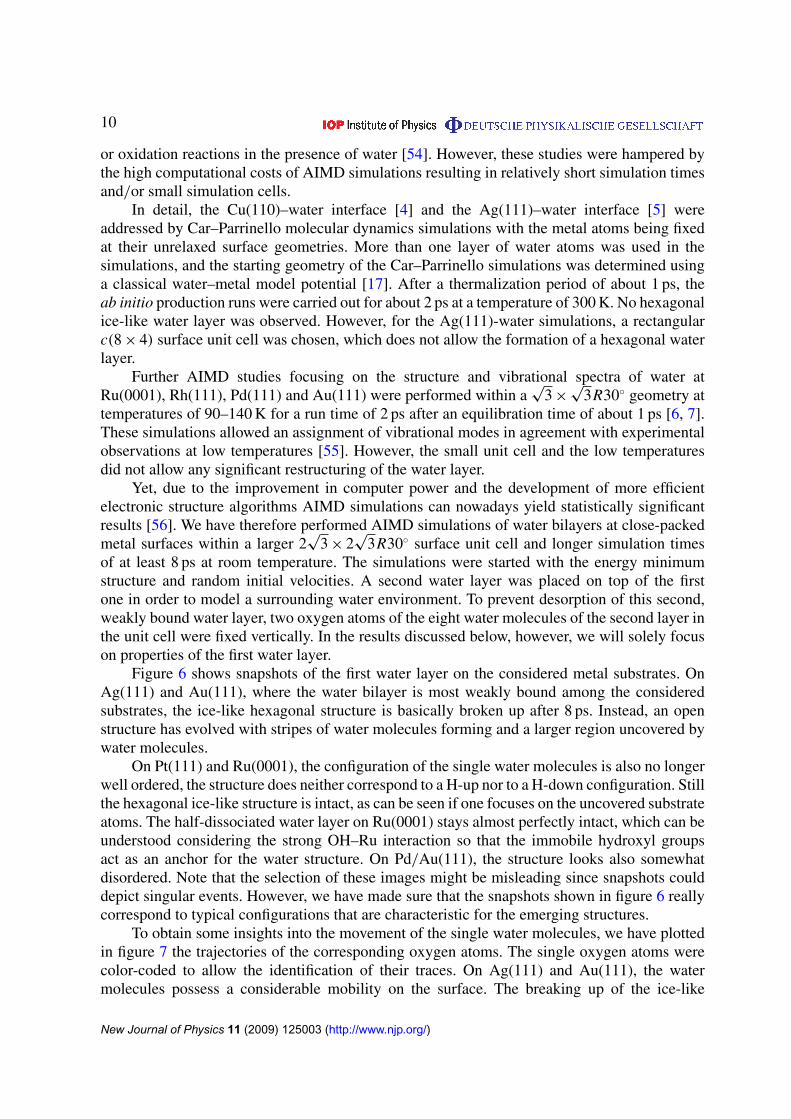
Figure 6 shows snapshots of the first water layer on the considered metal substrates. OnAg(111) and Au(111), where the water bilayer is most weakly bound among the consideredsubstrates, the ice-like hexagonal structure is basically broken up after 8 ps. Instead, an openstructure has evolved with stripes of water molecules forming and a larger region uncovered bywater molecules.
On Pt(111) and Ru(0001), the configuration of the single water molecules is also no longerwell ordered, the structure does neither correspond to a H-up nor to a H-down configuration. Stillthe hexagonal ice-like structure is intact, as can be seen if one focuses on the uncovered substrateatoms. The half-dissociated water layer on Ru(0001) stays almost perfectly intact, which can beunderstood considering the strong OH–Ru interaction so that the immobile hydroxyl groupsact as an anchor for the water structure. On Pd/Au(111), the structure looks also somewhatdisordered. Note that the selection of these images might be misleading since snapshots coulddepict singular events. However, we have made sure that the snapshots shown in figure 6 reallycorrespond to typical configurations that are characteristic for the emerging structures.
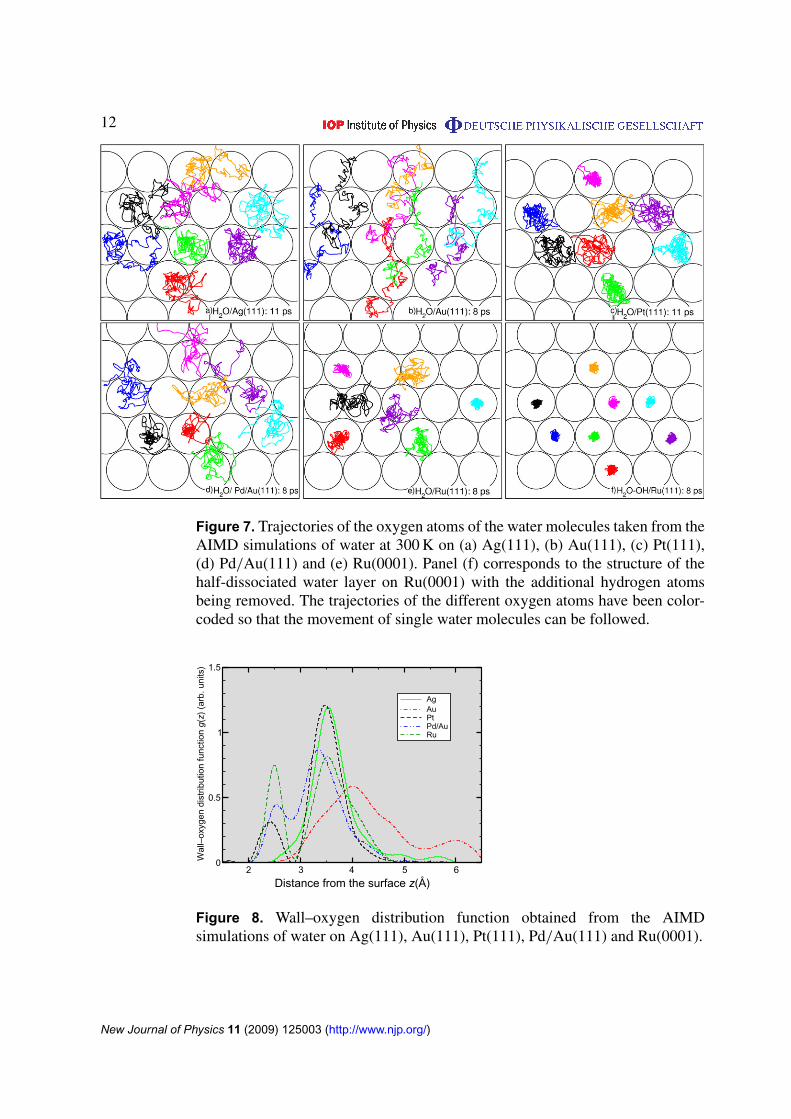
To obtain some insights into the movement of the single water molecules, we have plottedin figure 7 the trajectories of the corresponding oxygen atoms. The single oxygen atoms werecolor-coded to allow the identification of their traces. On Ag(111) and Au(111), the watermolecules possess a considerable mobility on the surface. The breaking up of the ice-like
New Journal of Physics 11 (2009) 125003 (http://www.njp.org/)
11
Figure 6. Snapshots of the structure of the water bilayer taken from theAIMD simulations of water at 300 K on (a) Ag(111), (b) Au(111), (c) Pt(111),(d) Pd/Au(111) and (e) Ru(0001). Panel (f) shows the structure of the half-dissociated water layer on Ru(0001) with the additional hydrogen atoms beingremoved. The snapshots were taken after 8 ps. In panel (c), the surface unit cellis indicated.
structure is reflected by the fact that some of the water molecules leave their original adsorptionsites. On the three other surfaces where the water layer is more strongly bound, the watermolecules stay relatively localized and remain close to their initial positions, although theyexhibit some quite strong fluctuations. Now it also becomes obvious that on Pd/Au(111) thehexagonal water structure is more or less preserved in spite of the disordered impression ofthe AIMD snapshot after 8 ps.
Note that the chosen unit cell imposes constraints on the possible structures that can evolve.A surface unit cell compatible with the hexagonal ice-like structure might always artificiallyfavor the bilayer structure. Hence, the result that the hexagonal water structure stays intact onPt(111), Pd/Au(111) and Ru(0001) in the simulations might still be an artefact of the chosenperiodicity. However, the fact that on Ag(111) and Au(111) this structure does not stay intact isa strong indication that the ice-like bilayer structure is indeed thermodynamically not stable atroom temperature.
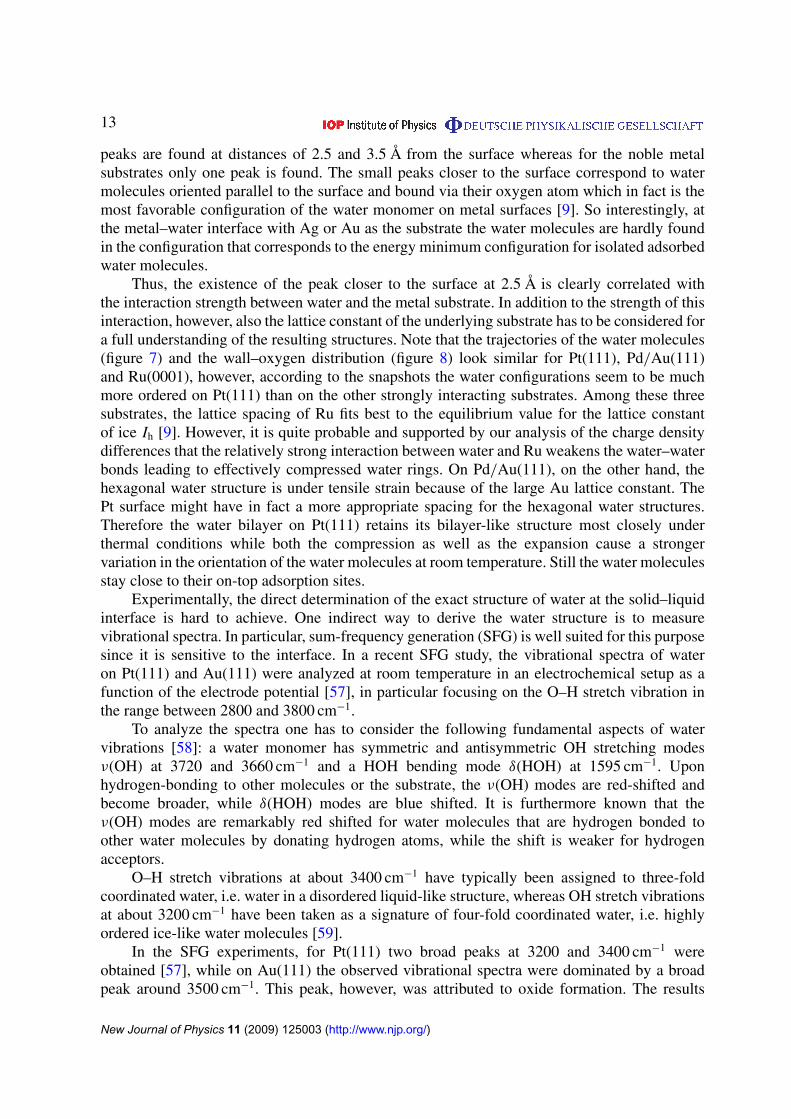
The difference between the water structures on the inert surfaces and the more reactivesurfaces is also reflected in the wall–oxygen distribution functions gγ (z) plotted in figure 8.For the more strongly interaction substrates Pt(111), Pd/Au(111) and Ru(0001) two distinct
New Journal of Physics 11 (2009) 125003 (http://www.njp.org/)
12
Figure 7. Trajectories of the oxygen atoms of the water molecules taken from theAIMD simulations of water at 300 K on (a) Ag(111), (b) Au(111), (c) Pt(111),(d) Pd/Au(111) and (e) Ru(0001). Panel (f) corresponds to the structure of thehalf-dissociated water layer on Ru(0001) with the additional hydrogen atomsbeing removed. The trajectories of the different oxygen atoms have been color-coded so that the movement of single water molecules can be followed.
2 3 4 5 6Distance from the surface z(Å)
0
0.5
1
1.5
Wal
l–ox
ygen
dis
tribu
tion
func
tion
g(z)
(arb
. uni
ts)
AgAuPtPd/AuRu
Figure 8. Wall–oxygen distribution function obtained from the AIMDsimulations of water on Ag(111), Au(111), Pt(111), Pd/Au(111) and Ru(0001).
New Journal of Physics 11 (2009) 125003 (http://www.njp.org/)
13
peaks are found at distances of 2.5 and 3.5 Å from the surface whereas for the noble metalsubstrates only one peak is found. The small peaks closer to the surface correspond to watermolecules oriented parallel to the surface and bound via their oxygen atom which in fact is themost favorable configuration of the water monomer on metal surfaces [9]. So interestingly, atthe metal–water interface with Ag or Au as the substrate the water molecules are hardly foundin the configuration that corresponds to the energy minimum configuration for isolated adsorbedwater molecules.
Thus, the existence of the peak closer to the surface at 2.5 Å is clearly correlated withthe interaction strength between water and the metal substrate. In addition to the strength of thisinteraction, however, also the lattice constant of the underlying substrate has to be considered fora full understanding of the resulting structures. Note that the trajectories of the water molecules(figure 7) and the wall–oxygen distribution (figure 8) look similar for Pt(111), Pd/Au(111)and Ru(0001), however, according to the snapshots the water configurations seem to be muchmore ordered on Pt(111) than on the other strongly interacting substrates. Among these threesubstrates, the lattice spacing of Ru fits best to the equilibrium value for the lattice constantof ice Ih [9]. However, it is quite probable and supported by our analysis of the charge densitydifferences that the relatively strong interaction between water and Ru weakens the water–waterbonds leading to effectively compressed water rings. On Pd/Au(111), on the other hand, thehexagonal water structure is under tensile strain because of the large Au lattice constant. ThePt surface might have in fact a more appropriate spacing for the hexagonal water structures.Therefore the water bilayer on Pt(111) retains its bilayer-like structure most closely underthermal conditions while both the compression as well as the expansion cause a strongervariation in the orientation of the water molecules at room temperature. Still the water moleculesstay close to their on-top adsorption sites.
Experimentally, the direct determination of the exact structure of water at the solid–liquidinterface is hard to achieve. One indirect way to derive the water structure is to measurevibrational spectra. In particular, sum-frequency generation (SFG) is well suited for this purposesince it is sensitive to the interface. In a recent SFG study, the vibrational spectra of wateron Pt(111) and Au(111) were analyzed at room temperature in an electrochemical setup as afunction of the electrode potential [57], in particular focusing on the O–H stretch vibration inthe range between 2800 and 3800 cm−1.
To analyze the spectra one has to consider the following fundamental aspects of watervibrations [58]: a water monomer has symmetric and antisymmetric OH stretching modesν(OH) at 3720 and 3660 cm−1 and a HOH bending mode δ(HOH) at 1595 cm−1. Uponhydrogen-bonding to other molecules or the substrate, the ν(OH) modes are red-shifted andbecome broader, while δ(HOH) modes are blue shifted. It is furthermore known that theν(OH) modes are remarkably red shifted for water molecules that are hydrogen bonded toother water molecules by donating hydrogen atoms, while the shift is weaker for hydrogenacceptors.
O–H stretch vibrations at about 3400 cm−1 have typically been assigned to three-foldcoordinated water, i.e. water in a disordered liquid-like structure, whereas OH stretch vibrationsat about 3200 cm−1 have been taken as a signature of four-fold coordinated water, i.e. highlyordered ice-like water molecules [59].
In the SFG experiments, for Pt(111) two broad peaks at 3200 and 3400 cm−1 wereobtained [57], while on Au(111) the observed vibrational spectra were dominated by a broadpeak around 3500 cm−1. This peak, however, was attributed to oxide formation. The results
New Journal of Physics 11 (2009) 125003 (http://www.njp.org/)
14
1500 2000 2500 3000 3500 4000Vibrational frequency (cm–1)
0
0.1
0.2
0.3
0.4
0.5
0.6
Inte
nsity
(arb
. uni
ts)
Ag(111)Au(111)Pt(111)Pd/Au(111)Ru(0001)OH/Ru(0001)
O–H stretch vibrations
OH bending vibrations
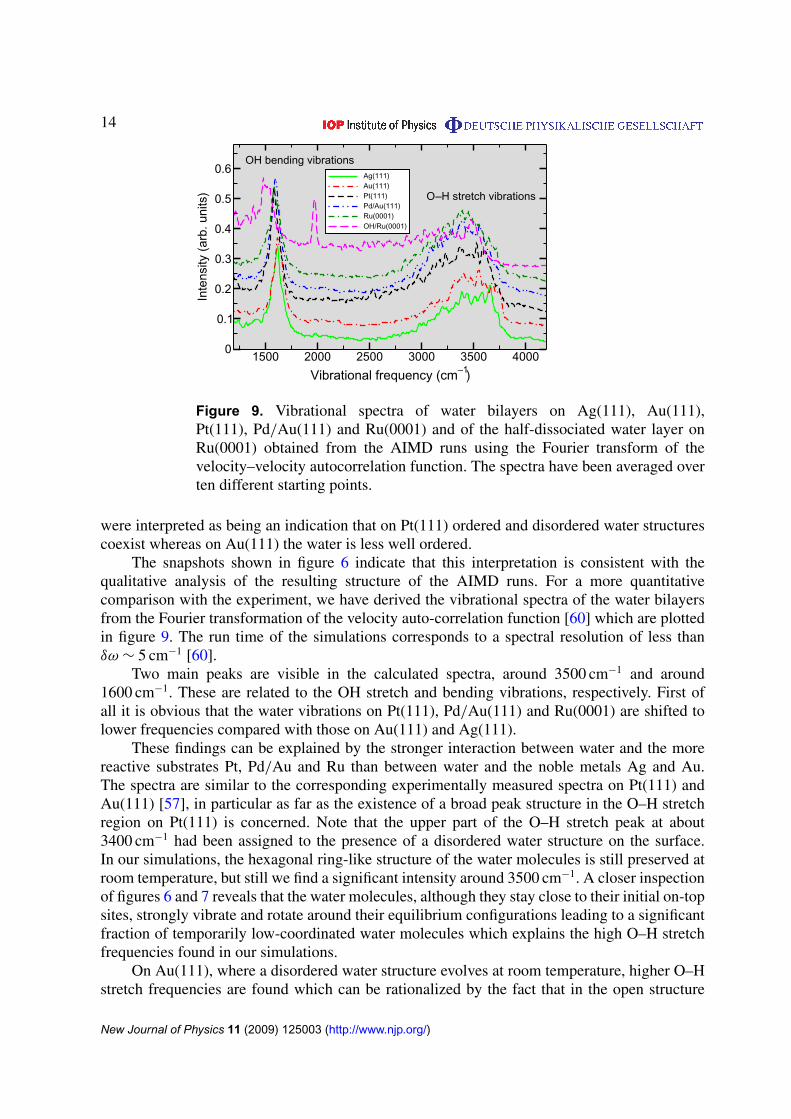
Figure 9. Vibrational spectra of water bilayers on Ag(111), Au(111),Pt(111), Pd/Au(111) and Ru(0001) and of the half-dissociated water layer onRu(0001) obtained from the AIMD runs using the Fourier transform of thevelocity–velocity autocorrelation function. The spectra have been averaged overten different starting points.
were interpreted as being an indication that on Pt(111) ordered and disordered water structurescoexist whereas on Au(111) the water is less well ordered.
The snapshots shown in figure 6 indicate that this interpretation is consistent with thequalitative analysis of the resulting structure of the AIMD runs. For a more quantitativecomparison with the experiment, we have derived the vibrational spectra of the water bilayersfrom the Fourier transformation of the velocity auto-correlation function [60] which are plottedin figure 9. The run time of the simulations corresponds to a spectral resolution of less thanδω ∼ 5 cm−1 [60].
Two main peaks are visible in the calculated spectra, around 3500 cm−1 and around1600 cm−1. These are related to the OH stretch and bending vibrations, respectively. First ofall it is obvious that the water vibrations on Pt(111), Pd/Au(111) and Ru(0001) are shifted tolower frequencies compared with those on Au(111) and Ag(111).
These findings can be explained by the stronger interaction between water and the morereactive substrates Pt, Pd/Au and Ru than between water and the noble metals Ag and Au.The spectra are similar to the corresponding experimentally measured spectra on Pt(111) andAu(111) [57], in particular as far as the existence of a broad peak structure in the O–H stretchregion on Pt(111) is concerned. Note that the upper part of the O–H stretch peak at about3400 cm−1 had been assigned to the presence of a disordered water structure on the surface.In our simulations, the hexagonal ring-like structure of the water molecules is still preserved atroom temperature, but still we find a significant intensity around 3500 cm−1. A closer inspectionof figures 6 and 7 reveals that the water molecules, although they stay close to their initial on-topsites, strongly vibrate and rotate around their equilibrium configurations leading to a significantfraction of temporarily low-coordinated water molecules which explains the high O–H stretchfrequencies found in our simulations.
On Au(111), where a disordered water structure evolves at room temperature, higher O–Hstretch frequencies are found which can be rationalized by the fact that in the open structure
New Journal of Physics 11 (2009) 125003 (http://www.njp.org/)
15
many water molecules tend to be low coordinated with hydrogen atoms pointing into emptyspace as seen in figure 6.
The vibrational spectrum of water on Pd/Au(111) is similar to the spectra on Pt(111)and Ru(0001). This seems to be surprising since in the analysis of the trajectories clearlya disordered open character of the water layer like on Ag(111) and Au(111) is found.However, as already discussed above and shown in figure 7, the water molecules stay closeto their equilibrium on-top sites on Pd/Au(111), and the disordered look is due to significantfluctuations in the molecular orientation because of the large lattice constant of the underlyingAu substrate. Hence, it is not necessarily right to conclude a strictly ordered water arrangementfrom a broad peak in the vibrational spectrum around 3200 cm−1. It is still debated whether theOH vibration modes at 2700–3000 cm−1 can be assigned to the vibration of a water moleculehydrogen bonded to the metal surface or to a distorted OH · · · O bond [61]–[63]. We are notable to definitely clarify this question from our calculations but from analyzing explicit OHvibrational amplitudes we suppose that both effects are present.
As far as the vibrational spectrum of the half-dissociated water bilayer is concerned, itis obvious that it is distinctly different from the spectra of the intact bilayers: both the OHbending and the O–H stretch vibrations are significantly red shifted, there is a broad featurelessbackground between the peaks for the bending and the stretch vibrations, and there is anadditional sharp peak at 2000 cm−1. Such an additional mode has already been predicted ina DFT study in which the vibrational modes were derived from the dynamical matrix [64].Based on a Fourier analysis of the H–Ru distances, we assign this mode to the H–Ru vibrationsof the isolated hydrogen atoms at the top site. This assignment is also consistent with theresults of a recent DFT study on hydrogen adsorption on Ru(0001) [65]. In the experiment,however, the hydrogen atoms might not stay at the top sites since this mode has not beenobserved at conditions at which the half-dissociated water layer should be formed. In fact, underthese conditions only a single OH bending mode has been measured [66]. The absence of theOH stretch and bending modes in the experiment, however, is not surprising considering thefact that the molecules in the half-dissociated bilayer are no longer adsorbed in an upright,dipole active geometry on the surface [66] but oriented parallel to the surface, as figure 1(c)demonstrates.
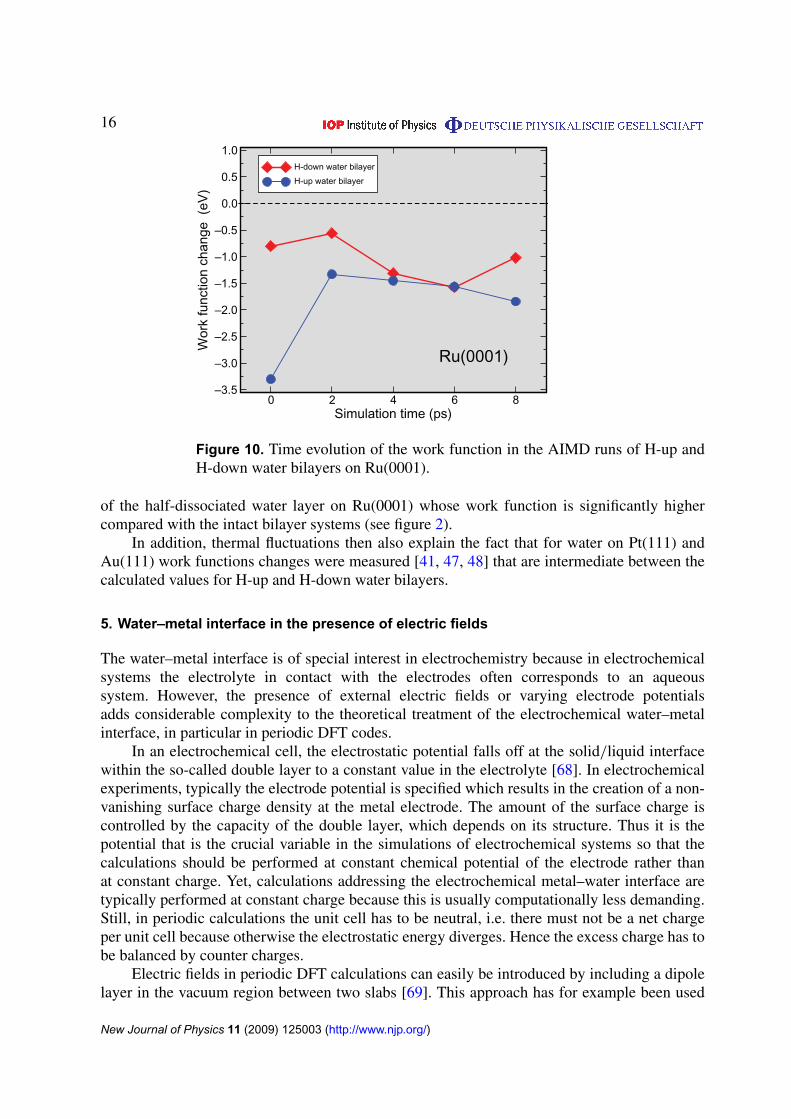
Finally, we like to address the work function of the thermalized water layers. In figure 10,we have plotted the time evolution of the calculated work function change for water-coveredRu(0001) derived from the AIMD runs starting initially with the H-up and H-down waterbilayer configurations on Ru(0001). Due to the thermal reorientation of the water molecules, thework functions become very similar in both AIMD runs. This shows that at thermal conditionsthe distinction between H-up and H-down bilayers is hardly possible. Recent experimentsdemonstrated that water on Ru(0001) becomes partially dissociated only at temperatures above140 K [67]. The measured work function changes at temperatures below 140 K [49, 50] arereasonably close to our calculated mean value of the work function change in figure 10 ofabout −1.5 eV whereas the half-dissociated layer on Ru(0001) leads to a much smaller workfunction change (see figure 2). This indicates that the work function changes measured below140 K were obtained from intact water bilayers on Ru(0001) which do neither correspond to anH-up nor to an H-down structure but to a orientationally disordered hexagonal structure. Ourcalculated vibrational spectrum for the intact water bilayers on Ru(0001) also agrees nicelywith the measured one for a water bilayer deposited at 145 K [66]. Furthermore, the observedincrease in the work function upon heating the system [49] is consistent with the formation
New Journal of Physics 11 (2009) 125003 (http://www.njp.org/)
16
0 2 4 6 8Simulation time (ps)
–3.5
–3.0
–2.5
–2.0
–1.5
–1.0
–0.5
0.0
0.5
1.0
Wor
k fu
nctio
n ch
ange
(eV
)
H-down water bilayer
H-up water bilayer
Ru(0001)
Figure 10. Time evolution of the work function in the AIMD runs of H-up andH-down water bilayers on Ru(0001).
of the half-dissociated water layer on Ru(0001) whose work function is significantly highercompared with the intact bilayer systems (see figure 2).
In addition, thermal fluctuations then also explain the fact that for water on Pt(111) andAu(111) work functions changes were measured [41, 47, 48] that are intermediate between thecalculated values for H-up and H-down water bilayers.
5. Water–metal interface in the presence of electric fields
The water–metal interface is of special interest in electrochemistry because in electrochemicalsystems the electrolyte in contact with the electrodes often corresponds to an aqueoussystem. However, the presence of external electric fields or varying electrode potentialsadds considerable complexity to the theoretical treatment of the electrochemical water–metalinterface, in particular in periodic DFT codes.
In an electrochemical cell, the electrostatic potential falls off at the solid/liquid interfacewithin the so-called double layer to a constant value in the electrolyte [68]. In electrochemicalexperiments, typically the electrode potential is specified which results in the creation of a non-vanishing surface charge density at the metal electrode. The amount of the surface charge iscontrolled by the capacity of the double layer, which depends on its structure. Thus it is thepotential that is the crucial variable in the simulations of electrochemical systems so that thecalculations should be performed at constant chemical potential of the electrode rather thanat constant charge. Yet, calculations addressing the electrochemical metal–water interface aretypically performed at constant charge because this is usually computationally less demanding.Still, in periodic calculations the unit cell has to be neutral, i.e. there must not be a net chargeper unit cell because otherwise the electrostatic energy diverges. Hence the excess charge has tobe balanced by counter charges.
Electric fields in periodic DFT calculations can easily be introduced by including a dipolelayer in the vacuum region between two slabs [69]. This approach has for example been used
New Journal of Physics 11 (2009) 125003 (http://www.njp.org/)
17
to study the electric field induced flip of water molecules from the H-down configuration to theH-up geometry [22] which has been observed experimentally [70, 71]. This approach does notintroduce any excess charges so that charge neutrality is maintained, but it is not straightforwardto relate the applied dipole field to the corresponding electrode potential.
Instead of including a dipole layer, a counter electrode may be explicitly considered, forexample as a localized planar charge distribution with a Gaussian profile perpendicular to thesurface [25], [72]–[75] or by putting a perfect conducting continuum with a non-vanishingsurface charge above the slab in a two-dimensional periodic approach [25, 28, 29]. Thusthe reconstruction of charged surfaces [72, 73, 75] or the structure of water under acidicconditions [28, 29] was addressed. In order to determine the electrode potential in this approach,the charge can be related to the potential via experimentally derived capacities [73] or in thepresence of several water layers from the potential profile inside of the water bulk region [29].
In periodic DFT codes, it is typically a default procedure to introduce a homogeneouscharge background when charged systems are considered in order to avoid the divergence ofthe electrostatic energy. This approach does usually not require any substantial programmingefforts. However, there are certain issues to be considered when a homogeneous background isadded to a system. First of all, a homogeneous charge background might introduce artefacts tothe one-electron potential. Naively one could think that a uniform charge background cannotlead to additional variations in the potential equivalent to introducing an additional electric fieldbecause it is translationally invariant. However, one has to take into account that the constantcharge background is superimposed on the varying charge density of the water–metal system,and the resulting electrostatic potential as a solution of the Poisson equation is a consequenceof the whole charge distribution subject to the appropriate boundary conditions. In particular,in vacuum regions where the charge distribution is entirely given by the uniform backgroundcharge, this can lead to a quadratically varying potential [24] since the solution of the Poissonequation for a region with a constant charge background
∇2φ(x) = 4πρo (2)
has the general solution in Cartesian coordinates
φ(x) = 2πρo
3∑i, j=1
Ci j xi x j +∑
i
Ci xi + C0
(3)
with∑
Ci i = 1. The influence of this artefact is strongly reduced in regions where polarizableatoms and molecules are present due to screening effects. This can indeed be the case atthe metal–water interface [24], which makes this approach applicable for the description ofelectrochemical interfaces.
Secondly, the uniform charge background interacts with the system under consideration.Therefore the total energy EDFT resulting from the periodic DFT calculations has to be corrected.It can be shown [23, 24] that this correction involves an integration over the charge accordingto
E = EDFT +∫ q
0
[∫Vtot
�d3x
]dQ, (4)
where Vtot is the total electrostatic potential of the charged water/electrode system including theuniform charge background, and � is the size of the unit cell.
New Journal of Physics 11 (2009) 125003 (http://www.njp.org/)
18
One
–ele
ctro
n po
tent
ial (
eV)
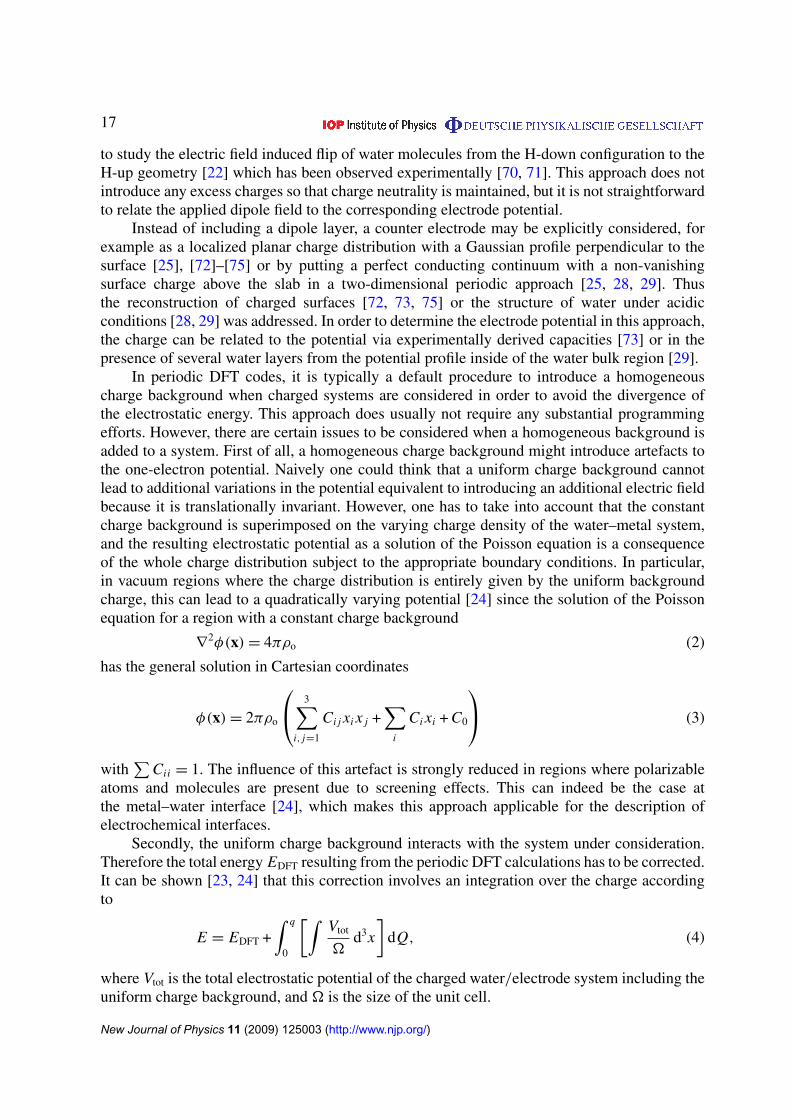
Figure 11. Schematic illustration of the electrostatic energy profile across theunit cell in a periodic slab calculation for solvated metal slabs. µe is the chemicalpotential of the electrons which corresponds to the Fermi energy at T = 0 K.φ0(m) is a bulk metal potential that can be used as a reference for the otherpotentials (after [24]).
As already mentioned, in electrochemical experiments typically the electrode potential iscontrolled and not the charge. As far as the calculations for a given charge are concerned,it is therefore crucial to specify a well-defined reference potential that allows a meaningfulcomparison with electrochemical experiments performed under potential control.
If the whole supercell is filled with the metal slabs and the water molecules, then it is hardto define an absolute value for the one-electron potential, for example with respect to the vacuumlevel. Taylor et al have suggested a so-called ‘double-reference method’ [24] for the situationin which the charge of the slab is compensated by a uniform background. In a first step, a DFTcalculation is performed for a solvated slab with a vacuum region introduced in the middle ofthe unit cell between the slabs. The water layer should be thick enough that the vacuum levelis converged with respect to the number of included water layers. For such a setup, the vacuumlevel φ∞ and the work function of the metal–water interface are computationally well defined,as in periodic calculations for the metal–gas interface.
Then a point in the interior of the metal slab is selected where the potential variation doesnot depend on the presence of the vacuum region and its potential and its value φ0(m) is specifiedwith respect to the vacuum level. Further calculations are performed with the region betweenthe metal slabs filled with water, as illustrated in figure 11, and all other potentials are takenwith respect to φ0(m).
For a charged slab, however, the variation in the electronic charge q leads to the existenceof electric fields throughout the whole supercell. Consequently, a vacuum reference point cannotbe established because there is no region where the potential is flat. The following procedurewas suggested to handle this problem [24]: a region far from the electrode is fixed at itsposition in the q = 0 calculation and its potential φ0(w) (see figure 11) is used as the second
New Journal of Physics 11 (2009) 125003 (http://www.njp.org/)
19
Adsorbed O atomsAdsorbed O molecule2
Transition state
−0.5 0 0.5
Tota
l ene
rgy
(eV
)
Potential versus NHE (eV)−1
−504
−505
−5061 1.5 2
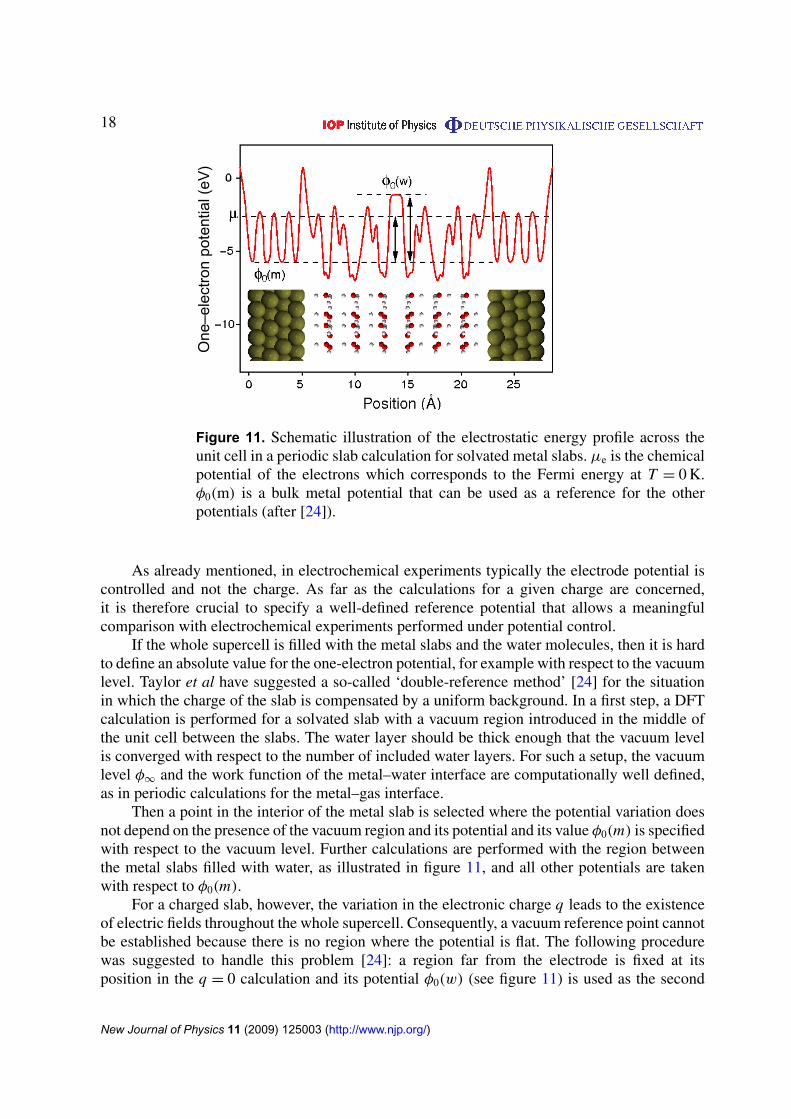
Figure 12. Total energies versus potential for the initial, transition and final stateof O2 dissociation on solvated Pt(111). The symbols correspond to the resultsobtained for different charge states of the Pt electrode with a charge of −1, −0.5,0, 0.5 and 1e−, respectively, added to the supercell and compensated by a uniformcharge background. The solids curves are quadratic fits to the results (after [76]).
reference point. The rest of the system is then relaxed under the influence of the appliedcharge, and the potential at all other positions is shifted with respect to the second referencepoint.
It is important to realize that there is a difference between calculations at constant chargeand at constant potential. Along a certain reaction path the geometry of the reactants changes.This modifies the electron distribution and the corresponding dipole moments and thus ingeneral also alters the work function of the electrode that is directly related to the electrodepotential. Thus the different configurations along a reaction path calculated for a constant valueof the charge do not necessarily correspond to the same electrode potential.
This is illustrated in figure 12 using the dissociation of O2 on a solvated Pt(111) slab asan example [76]. As already mentioned, it is more convenient to perform periodic electronicstructure calculations for a specified charge of the system. The symbols in figure 12 correspondto the energies of the initial, transition and final state of the O2 dissociation obtained with acharge of −1, −0.5, 0, 0.5 and 1e, respectively, added to the supercell and compensated by auniform charge background. The respective potentials were obtained using the double-referencemethod, and the solid lines are quadratic fits to the results. For symbols aligned verticallyabove each other, the dissociation barrier would be the same in the constant charge and inthe constant potential mode. However, as figure 12 reveals, this is in general not the case,in particular at positive potentials, due to the rearrangement of the atoms along the reactionpath.
Instead of charging the system, neutral atoms or molecules that act as electron donors oracceptors might be explicitly added to the water layer. This can for example been achievedby introducing additional hydrogen atoms to the water–metal interface [26, 77]. The addedhydrogen atoms become solvated as protons whereas the electrons move to the metal electrode.By changing the hydrogen concentration, the surface charge and hence the electrode potentialcan be varied. In this approach, the whole supercell remains neutral so that no counterchargesare needed.
New Journal of Physics 11 (2009) 125003 (http://www.njp.org/)
20
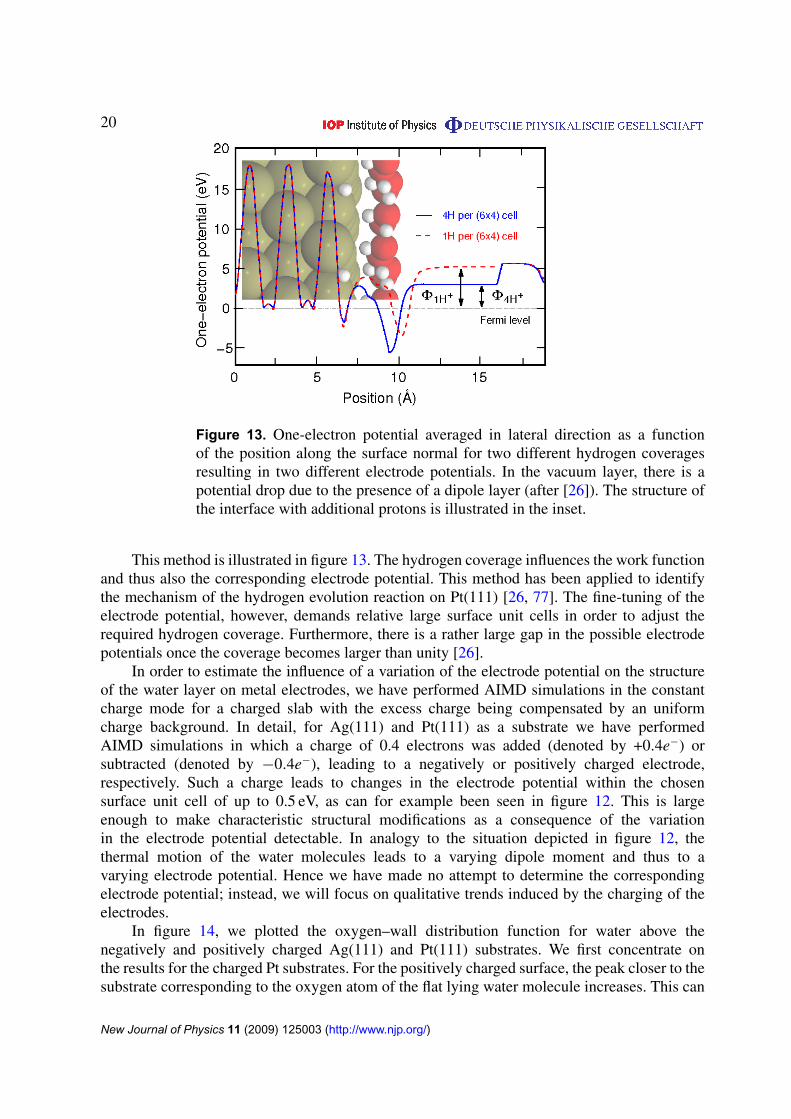
Figure 13. One-electron potential averaged in lateral direction as a functionof the position along the surface normal for two different hydrogen coveragesresulting in two different electrode potentials. In the vacuum layer, there is apotential drop due to the presence of a dipole layer (after [26]). The structure ofthe interface with additional protons is illustrated in the inset.
This method is illustrated in figure 13. The hydrogen coverage influences the work functionand thus also the corresponding electrode potential. This method has been applied to identifythe mechanism of the hydrogen evolution reaction on Pt(111) [26, 77]. The fine-tuning of theelectrode potential, however, demands relative large surface unit cells in order to adjust therequired hydrogen coverage. Furthermore, there is a rather large gap in the possible electrodepotentials once the coverage becomes larger than unity [26].
In order to estimate the influence of a variation of the electrode potential on the structureof the water layer on metal electrodes, we have performed AIMD simulations in the constantcharge mode for a charged slab with the excess charge being compensated by an uniformcharge background. In detail, for Ag(111) and Pt(111) as a substrate we have performedAIMD simulations in which a charge of 0.4 electrons was added (denoted by +0.4e−) orsubtracted (denoted by −0.4e−), leading to a negatively or positively charged electrode,respectively. Such a charge leads to changes in the electrode potential within the chosensurface unit cell of up to 0.5 eV, as can for example been seen in figure 12. This is largeenough to make characteristic structural modifications as a consequence of the variationin the electrode potential detectable. In analogy to the situation depicted in figure 12, thethermal motion of the water molecules leads to a varying dipole moment and thus to avarying electrode potential. Hence we have made no attempt to determine the correspondingelectrode potential; instead, we will focus on qualitative trends induced by the charging of theelectrodes.
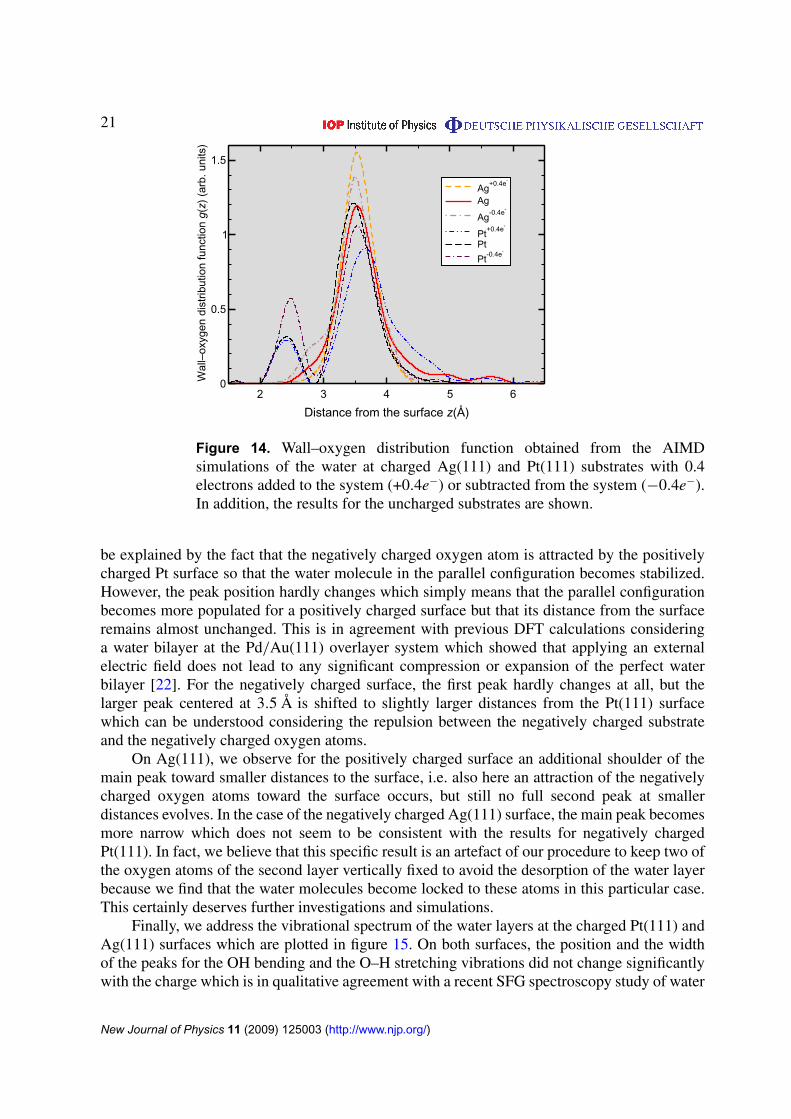
In figure 14, we plotted the oxygen–wall distribution function for water above thenegatively and positively charged Ag(111) and Pt(111) substrates. We first concentrate onthe results for the charged Pt substrates. For the positively charged surface, the peak closer to thesubstrate corresponding to the oxygen atom of the flat lying water molecule increases. This can
New Journal of Physics 11 (2009) 125003 (http://www.njp.org/)
21
2 3 4 5 6
Distance from the surface z(Å)
0
0.5
1
1.5
Wal
l–ox
ygen
dis
tribu
tion
func
tion
g(z)
(arb
. uni
ts)
Ag+0.4e-
Ag
Ag-0.4e-
Pt+0.4e-
PtPt-0.4e-
Figure 14. Wall–oxygen distribution function obtained from the AIMDsimulations of the water at charged Ag(111) and Pt(111) substrates with 0.4electrons added to the system (+0.4e−) or subtracted from the system (−0.4e−).In addition, the results for the uncharged substrates are shown.
be explained by the fact that the negatively charged oxygen atom is attracted by the positivelycharged Pt surface so that the water molecule in the parallel configuration becomes stabilized.However, the peak position hardly changes which simply means that the parallel configurationbecomes more populated for a positively charged surface but that its distance from the surfaceremains almost unchanged. This is in agreement with previous DFT calculations consideringa water bilayer at the Pd/Au(111) overlayer system which showed that applying an externalelectric field does not lead to any significant compression or expansion of the perfect waterbilayer [22]. For the negatively charged surface, the first peak hardly changes at all, but thelarger peak centered at 3.5 Å is shifted to slightly larger distances from the Pt(111) surfacewhich can be understood considering the repulsion between the negatively charged substrateand the negatively charged oxygen atoms.
On Ag(111), we observe for the positively charged surface an additional shoulder of themain peak toward smaller distances to the surface, i.e. also here an attraction of the negativelycharged oxygen atoms toward the surface occurs, but still no full second peak at smallerdistances evolves. In the case of the negatively charged Ag(111) surface, the main peak becomesmore narrow which does not seem to be consistent with the results for negatively chargedPt(111). In fact, we believe that this specific result is an artefact of our procedure to keep two ofthe oxygen atoms of the second layer vertically fixed to avoid the desorption of the water layerbecause we find that the water molecules become locked to these atoms in this particular case.This certainly deserves further investigations and simulations.
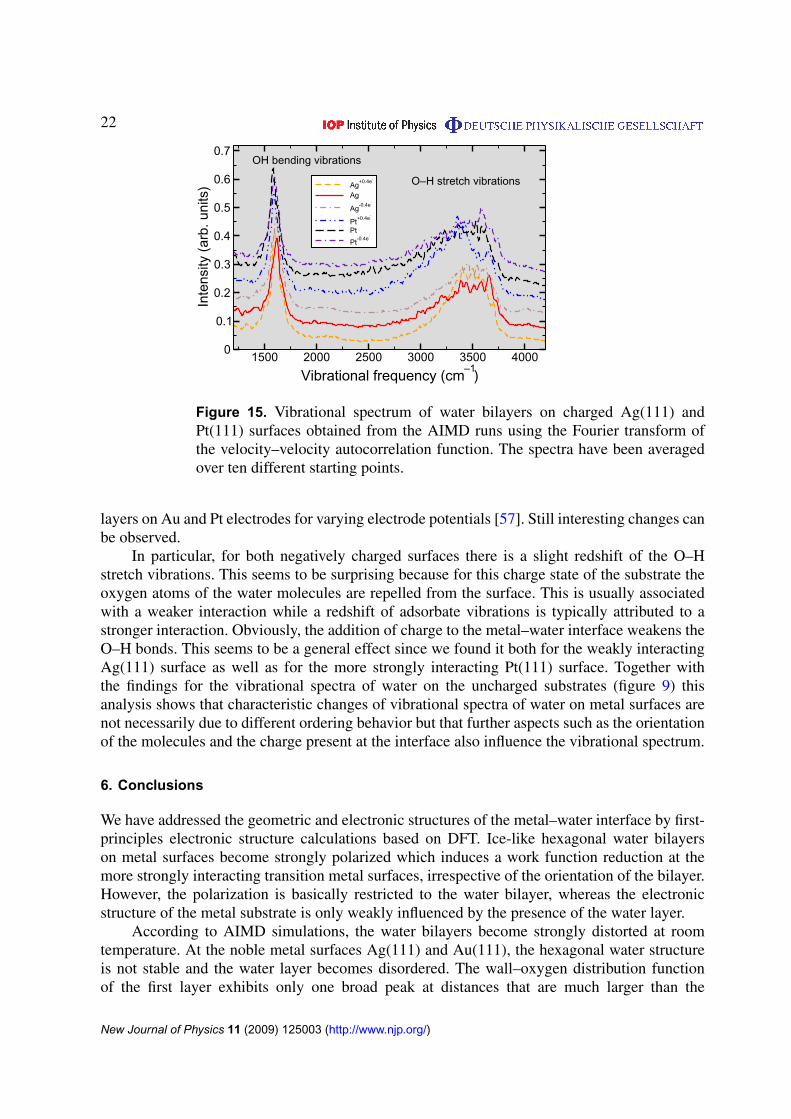
Finally, we address the vibrational spectrum of the water layers at the charged Pt(111) andAg(111) surfaces which are plotted in figure 15. On both surfaces, the position and the widthof the peaks for the OH bending and the O–H stretching vibrations did not change significantlywith the charge which is in qualitative agreement with a recent SFG spectroscopy study of water
New Journal of Physics 11 (2009) 125003 (http://www.njp.org/)
22
1500 2000 2500 3000 3500 4000Vibrational frequency (cm–1)
0
0.1
0.2
0.3
0.4
0.5
0.6
0.7
Inte
nsity
(arb
. uni
ts) Ag+0.4e-
Ag
Ag-0.4e-
Pt+0.4e-
PtPt-0.4e-
O–H stretch vibrations
OH bending vibrations
Figure 15. Vibrational spectrum of water bilayers on charged Ag(111) andPt(111) surfaces obtained from the AIMD runs using the Fourier transform ofthe velocity–velocity autocorrelation function. The spectra have been averagedover ten different starting points.
layers on Au and Pt electrodes for varying electrode potentials [57]. Still interesting changes canbe observed.
In particular, for both negatively charged surfaces there is a slight redshift of the O–Hstretch vibrations. This seems to be surprising because for this charge state of the substrate theoxygen atoms of the water molecules are repelled from the surface. This is usually associatedwith a weaker interaction while a redshift of adsorbate vibrations is typically attributed to astronger interaction. Obviously, the addition of charge to the metal–water interface weakens theO–H bonds. This seems to be a general effect since we found it both for the weakly interactingAg(111) surface as well as for the more strongly interacting Pt(111) surface. Together withthe findings for the vibrational spectra of water on the uncharged substrates (figure 9) thisanalysis shows that characteristic changes of vibrational spectra of water on metal surfaces arenot necessarily due to different ordering behavior but that further aspects such as the orientationof the molecules and the charge present at the interface also influence the vibrational spectrum.
6. Conclusions
We have addressed the geometric and electronic structures of the metal–water interface by first-principles electronic structure calculations based on DFT. Ice-like hexagonal water bilayerson metal surfaces become strongly polarized which induces a work function reduction at themore strongly interacting transition metal surfaces, irrespective of the orientation of the bilayer.However, the polarization is basically restricted to the water bilayer, whereas the electronicstructure of the metal substrate is only weakly influenced by the presence of the water layer.
According to AIMD simulations, the water bilayers become strongly distorted at roomtemperature. At the noble metal surfaces Ag(111) and Au(111), the hexagonal water structureis not stable and the water layer becomes disordered. The wall–oxygen distribution functionof the first layer exhibits only one broad peak at distances that are much larger than the
New Journal of Physics 11 (2009) 125003 (http://www.njp.org/)
23
equilibrium distance of an adsorbed water monomer from the surface. At the more stronglyinteracting transition metal surfaces Pt(111), Pd/Au(111) and Ru(0001), the simulations suggestthat the hexagonal ordered structure might persist at room temperature, however, the orientationof the single water molecules is strongly fluctuating. Transitions between H-up and H-downconfigurations are well possible and occur frequently so that no distinction between an orderedH-up or an H-down structure can be made. This is also reflected in the work function changesinduced by the thermalized water layers that lie between the corresponding values for ice-like H-up and H-down water bilayers. The stronger interaction also results in a redshift ofthe frequencies of the OH bending and the O–H stretch vibrations indicating the weakeningof the water bonds.
Charging the metal substrates leads to small but characteristic changes. The change in thedistance from the charged electrodes can be understood invoking electrostatics. The redshiftof the O–H stretch vibrations at the negatively charged electrodes indicates that the additionof electronic charge to the metal–water interface weakens the intramolecular bonds. This alsosuggests that shifts in the vibrational spectra are not solely related to changes in the structureand order of the water bilayers.
Acknowledgments
This research was supported by the Konrad-Adenauer-Stiftung. Computer time on the BW-Gridof the federal state of Baden-Württemberg is gratefully acknowledged. Useful discussions withDavid Benoit, Wolfgang Schmickler and Eckhard Spohr are gratefully acknowledged.
References
[1] Thiel P A and Madey T E 1987 Surf. Sci. Rep. 7 211[2] Henderson M A 2002 Surf. Sci. Rep. 46 1[3] Verdaguer A, Sacha G M, Bluhm H and Salmeron M 2006 Chem. Rev. 106 1478[4] Izvekov S, Mazzolo A, Van Opdorp K and Voth G A 2001 J. Chem. Phys. 114 3284[5] Izvekov S and Voth G A 2001 J. Chem. Phys. 115 7196[6] Meng S, Xu L F, Wang E G and Gao S W 2002 Phys. Rev. Lett. 89 176104[7] Meng S, Wang E G and Gao S 2004 Phys. Rev. B 69 195404[8] Michaelides A, Alavi A and King D A 2004 Phys. Rev. B 69 113404[9] Michaelides A 2006 Appl. Phys. A 85 415
[10] Toney M F, Howard J N, Richer J, Borges G L, Gordon J G, Melroy O R, Wiesler D G, Yee D and SorensenL B 1994 Nature 368 444
[11] Ito M 2008 Surf. Sci. Rep. 63 329[12] Feibelman P J 2002 Science 295 99[13] Spohr E 1989 J. Phys. Chem. 93 6171[14] Spohr E 1997 J. Chem. Phys. 107 6342[15] Raghavan K, Foster K, Motakabbir K and Berkowitz M 1991 J. Chem. Phys. 94 2110[16] Xia X and Berkowitz M L 1995 Phys. Rev. Lett. 74 3193[17] Siepmann J I and Sprik M 1995 J. Chem. Phys. 102 511[18] Crozier P S, Rowley R L and Henderson D 2000 J. Chem. Phys. 113 9202[19] Bukowski R, Szalewicz K, Groenenboom G C and van der Avoird A 2007 Science 315 1249[20] Santra B, Michaelides A, Fuchs M, Tkatchenko A, Filippi C and Scheffler M 2008 J. Chem. Phys. 129 194111[21] Lozovoi A Y, Alavi A, Kohanoff J and Lynden-Bell R M 2001 J. Chem. Phys. 115 1661
New Journal of Physics 11 (2009) 125003 (http://www.njp.org/)
24
[22] Roudgar A and Groß A 2005 Chem. Phys. Lett. 409 157[23] Filhol J S and Neurock M 2006 Angew. Chem. Int. Ed. Engl. 45 402[24] Taylor C D, Wasileski S A, Filhol J-S and Neurock M 2006 Phys. Rev. B 73 165402[25] Otani M and Sugino O 2006 Phys. Rev. B 73 115407[26] Skúlason E, Karlberg G S, Rossmeisl J, Bligaard T, Greeley J, Jónsson H and Nørskov J K 2007 Phys. Chem.
Chem. Phys. 9 3241[27] Zhao J, Chan C T and Che J G 2007 Phys. Rev. B 75 085435[28] Sugino O, Hamada I, Otani M, Morikawa Y, Ikeshoji T and Okamoto Y 2007 Surf. Sci. 601 5237[29] Otani M, Hamada I, Sugino O, Morikawa Y, Okamoto Y and Ikeshoji T 2008 Phys. Chem. Chem. Phys. 10
3609[30] Gohda Y, Schnur S and Groß A 2009 Faraday Discuss. 140 233[31] Filhol J S and Bocquet M-L 2007 Chem. Phys. Lett. 438 203[32] Kresse G and Furthmüller J 1996 Phys. Rev. B 54 11169[33] Perdew J P, Burke K and Ernzerhof M 1996 Phys. Rev. Lett. 77 3865[34] Vassilev P, Hartnig C, Koper M T M, Frechard F and van Santen R A 2001 J. Chem. Phys. 115 9815[35] VandeVondele J, Mohamed F, Krack M, Hutter J, Sprik M and Parrinello M 2005 J. Chem. Phys. 122 014515[36] Blöchl P E 1994 Phys. Rev. B 50 17953[37] Kresse G and Joubert D 1999 Phys. Rev. B 59 1758[38] Vassilev P, van Santen R A and Koper M T M 2005 J. Chem. Phys. 122 054701[39] Materzanini G, Tantardini G F, Lindan P J D and Saalfrank P 2005 Phys. Rev. B 71 155414[40] Menzel D 2002 Science 295 58[41] Heras J M and Viscido L 1980 Appl. Surf. Sci. 4 238[42] Roudgar A and Groß A 2003 Phys. Rev. B 67 033409[43] Roudgar A and Groß A 2003 J. Electroanal. Chem. 548 121[44] Groß A 2006 Top. Catal. 37 29[45] Prada S, Martinez U and Pacchioni G 2008 Phys. Rev. B 78 235423[46] Roudgar A and Groß A 2005 Surf. Sci. 597 42[47] Langenbach E, Spitzer A and Lüth H 1984 Surf. Sci. 147 179[48] Kiskinova M, Pirug G and Bonzel H 1985 Surf. Sci. 150 319[49] Hoffmann W and Benndorf C 1997 Surf. Sci. 377–379 681[50] Lilach Y, Romm L, Livneh T and Asscher M 2001 J. Phys. Chem. B 105 2736[51] Groß A 2002 Surf. Sci. 500 347[52] Daw M S and Baskes M I 1984 Phys. Rev. B 29 6443[53] Vassilev P, Koper M T M and van Santen R A 2002 Chem. Phys. Lett. 359 337[54] Hartnig C and Spohr E 2005 Chem. Phys. 319 185[55] Jacobi K, Bedürftig K, Wang Y and Ertl G 2001 Surf. Sci. 472 9[56] Groß A and Dianat A 2007 Phys. Rev. Lett. 98 206107[57] Noguchi H, Okada T and Uosaki K 2009 Faraday Discuss. 140 125[58] Osawa M, Tsushima M, Mogami H, Samjeske G and Yamakata A 2008 J. Phys. Chem. C 112 4248[59] Ye S, Nihonyanagi S and Uosaki K 2001 Phys. Chem. Chem. Phys. 3 3463[60] Schmitz M and Tavan P 2004 J. Chem. Phys. 121 12247[61] Ibach H and Lehwald S 1980 Surf. Sci. 91 187[62] Thiel P A, DePaola R A and Hoffmann F M 1984 J. Chem. Phys. 80 5326[63] Ogasawara H, Yoshinobu J and Kawai M 1999 J. Chem. Phys. 111 7003[64] Feibelman P J 2003 Phys. Rev. B 67 035420[65] Xu L, Xiao H and Zu X 2005 Chem. Phys. 315 155[66] Clay C, Haq S and Hodgson A 2004 Chem. Phys. Lett. 388 89[67] Tatarkhanov M, Fomin E, Salmeron M, Andersson K, Ogasawara H, Pettersson L G M, Nilsson A and
Cerdá J I 2008 J. Chem. Phys. 129 154109
New Journal of Physics 11 (2009) 125003 (http://www.njp.org/)

25
[68] Schmickler W 1996 Chem. Rev. 96 3177[69] Neugebauer J and Scheffler M 1992 Phys. Rev. B 46 16067[70] Toney M F, Howard J N, Richer J, Borges G L, Gordon J G, Melroy O R, Wiesler D G, Yee D and Sorensen
L B 1995 Surf. Sci. 335 326[71] Morgenstern K and Nieminen J 2004 J. Chem. Phys. 120 10786[72] Fu C L and Ho K M 1989 Phys. Rev. Lett. 63 1617[73] Bohnen K P and Kolb D M 1998 Surf. Sci. 407 L629[74] Lozovoi A Y and Alavi A 2003 Phys. Rev. B 68 245416[75] Che J G and Chan C T 2003 Phys. Rev. B 67 125411[76] Wasileski S A and Janik M J 2008 Phys. Chem. Chem. Phys. 10 3613[77] Rossmeisl J, Skúlason E, Björketun M J, Tripkovic V and Nørskov J K 2008 Chem. Phys. Lett. 466 68
New Journal of Physics 11 (2009) 125003 (http://www.njp.org/)