Embed Size (px)
Citation preview
Reservoir Properties Modeling Using Multi-Attribute Seismic Analysis: Case Study South Sumatra Basin
F S Parameswari1, N Hikmah2, B S Mulyatno1, Alimuddin1, O Dewanto1 and R C Wibowo1,*
1 Department of Geophysical Engineering, Faculty of Engineering, Universitas Lampung, Jalan Prof. Dr. Soemantri Brodjonegoro No. 1 Bandar Lampung 35145, Indonesia
2 PT Pertamina EP Asset 2 Prabumulih, South Sumatera *Email: [email protected]
Abstract. Seismic inversion and multi-attribute analysis method are used in this research to characterizes the reservoir properties. Where both of these methods will be resulted an acoustic impedance volume and log property volumes. The property log volumes were created from density, porosity, Gamma-Ray (GR) and Water Saturation (Sw) log. There are 4 wells that is used in this research, they are EM-31, EM-32, EM-33 and EM-34 and a 3D seismic data post- stack time migration. Based on a map of acoustic impedance distribution, the reservoir target has an acoustic impedance value of 6.000 ((m/s)*(g/cc)) to 8.000 ((m/s)*(g/cc)). Furthermore, based on the map of the distribution of the log property, reservoir has a density value with a range of 2.3 g/cc up to 2.4 g/cc, porosity value > 10%, GR value of less than 100 API and Sw 50% to 55%. Thus, it can be concluded that reservoir has a lithology of sandstones, has a fairly good porosity and contains oil fluids.
Keywords: multi-attribute seismic, reservoir, south sumatra basin, modeling
1. Introduction The high demand for oil and gas needs is to encourage gas companies to take an exploration stage in discovering new reserves. Many studies and research have been conducted in recognizing the reservoir character. To perform characteristic reservoir there are several methods that can be used. They are seismic inversion method and Multiattribute analysis method. According to (Sukmono, 2000) seismic inversion method is an inversion technique in the form of a geological condition to the back (Invers modeling), this method provides the results of the underground geological appearance, so as to identify the character and distribution of the reservoir on the target area in the form of the interpretation of geological, lithology, and fluid. Multiattribute analysis is a method of analyzing the relationship between well data and seismic data at the location of wells in performing the volume estimation of log properties on the overall seismic

volume. This method is a method which uses many attributes to predict some of the log properties of which are porosity (Ilkhchi, et al., 2014). In this research, the characteristic analysis of reservoir is done based on acoustic impedance distribution map and the map of the log properties that will be conducted analysis on the location of lead zone reservoir. The Data generated in this study which was obtained from the acoustic impedance inversion process and multiattribute analysis can be used to create a log property distribution in the research area that will be able to be known characteristic of the location indicated as reservoir containing hydrocarbons in it. 2. Regional Geology The basin of South Sumatra is a basin bordered by the thirty mountains to the northwest separating the South Sumatra basin and the central Sumatran Basin, the Sunda display is in the northeast, Barisan and the Sumatran Fault in the southwest, and Highest Lampung is in the southeast. Figure 1 shows the column stratigraphy of the southern Sumatran basin, it appears that the Baturaja formation above from the Talang Akar formation, the Baturaja formation itself consists of limestone and has a varying thickness of about 60 – 75 mm, while the Talang Akar formation itself is above the Lahat formation and Baturaja formation, consisting of sandstone that comes from the plain Delta, flakes, Lanau, quartz batteries with coal carbonated Batulempung inserts and in some places there is a conglomerate. The thickness of the Talang Akar formation around 460-610m. 3. Method
3.1 Location and research time This research was in November 2019 to January 2020 in function Prabumulih & Limau Exploitation PT Pertamina EP Asset 2 Prabumulih and January to July 2020 in the Exploration Laboratory of building L Geophysical Engineering, Lampung University
3.2 Tools and materials 1. Seismic 3D PSTM (Post-Stack Time Migration ) Data. 2. Log Data
Log Data are gamma ray log, resistivity log, NPHI log, density log, Sw log. 3. Well top data. 4. Checkshot data 5. Software Humpson-Russel. 6. Software Petrel. 7. Software Microsoft Excel.
3.3 Research Prosedur 1. Well to Seismic Tie Well to seismic tie is the initial stage to be done in conducting seismic data processing and well data. Where seismic data has a domain of time and well data has a depth domain, so both of these data cannot be used simultaneously. The Wavelet used in this study was statistical Wavelet using zero phase. 2. Interpretation Log Data and Seismic Data The interpretation of the well data is done qualitatively with the intention to know which layers have indications of hydrocarbons. The coating indicated that hydrocarbons must have a permeable coating that means the coating can pass through the fluid, has a good porosity and has a slight water bladder. On the interpretation of the seismic reflection of horizon data is a reflector that is pick up on the profile of the rocks along the boundary between the two layers of rocks, in the cross-section of the seismic fault will be indicated with a discontinuous reflector.

3. Acoustic Impedance Inversion The AI inversion is done by analyzing the data senstivity of the well, where this stage serves to determine the value of the acoustic impedance as to what indicates the hydrocarbon lead zone in the research area. This analysis of senstivity is done by creating a crossplot between the log AI and other logs. Therefore, the Crossplot results will be known as the AI value range that shows the lead zone of the Reservoir. Next create the initials model (initial model). Then after the initials model is obtained, then perform a pre-inversion analysis. Pre-inversion analysis is done for simulation or control to perform inversion stage, Agara know good or less good inversion results to be obtained. Once considered pre-inversion results are already good. Next, apply the inverse result of all well at the seismic volume as a whole by applying the parameters at the pre-inversion stage. 4. Multiattribute analysis Multiattribute analysis is an analysis of the relationship between seismic data and well data that will be used to perform a volume estimation of log properties on the overall seismic data volume. Multiattribute analysis uses multiple attributes in predicting multiple log properties from the log data used, in conducting multiattribute analysis of used seismic data, the log data being targeted, internal seismic attribute data as well as seismic external attribute data. In this study, the log target is density log, porosity log, Gamma Ray log, and Log Sw. The initial stage is to perform a single attribute analysis, which will be crossplot next to each attribute with the target log property. Then, perform multi-attribute analysis by using the step-wise regression method, in this step channeled the determination of many good attributes are used based on the validation error values. 5. Reservoir Characterization The process of reservoir characterization of the map of acoustic impedance spread, and the map of the target Log property distribution in a zone containing hydrocarbons. This process is useful in knowing the position and spread of the area indicating hydrocarbons in the research field. 4. Results and Discussion 4.1 Well to Seismic Tie The stage of well to seismic tie is carried out with the intention of obtaining the time and depth relationship data on the well data and the seismic data to be used when conducting research. The Wavelet used in the study was Wavelet statistical Using Zero phase. WAvelet obtained after trial and error is Wavelet with wavelength of 158 ms, taper length of 25 MS, and has a sample rate of 2 Ms. In table 1. The result of a Well-done stage of Seismic Tie has been deemed to be good because the value of the correlation coefficient in each well has a strong quality (according to Schober, et al. (2018), where the correlation value gained 0776 to 0853 with a time shift of 0 Ms. 4.2 Interpretation Of Well And Seismic Data This stage is performed to obtain a well top or an indication of a layer containing hydrocarbons, which is indicated as the lead zone. As such, it is known that the prospect Zone of hydrocarbons in the well data has a low gamma ray value, and there are crosses or separations between low density (RHOB) and low NPHI. If viewed from table 2. It can be concluded that the coating with a good indication of hydrocarbon is the layer of BRF, A0 and A and A2. However, due to the layers of A0 and A2 is a thin layer, the research is focused on the layers of BRF and A.

The seismic Data used has a zero phase, which has the maximum energy at the peak of the wave, so the picking Horizon is done precisely at the negative amplitude (trough /blue) or positive amplitude (peak /red). The Horizon is picking up as many as 2 Horizons, consisting of Horizon 1 as the upper limit and Horizon 2 as the lower limit. Shown in Figure 2 and Figure 3, that the island area is in the north of the map and the lowland area is on the south of the map. On the map of the subsurface geological structure that there are 1 fault which is the fault. Where the fault orientation is visible in the south 4.3 Acoustic Impedance Inversion This Sensitivity analysis is done before doing an inversion of the inverse, which from the analysis result of the data logs This will provide an information about the relationship log AI data with other data logs . After the crossplot between the log AI and the density in Figure 4, Figure 5, figure 6 shows a good relationship. Where Crossplot can be said either by looking at the resulting crossplot form. From the sensitivity analysis results that have been done before, it is noted that the target zone has an acoustic impedance value of 6000 (m/s) * (g/cc) to 800 (m/s) * (g/cc), density value 2.4 g/CC to 2.3 g/cc, porosity value > 10%, gamma ray value < 100 flame as well as Sw value < 70%. This Research, using only one inversion method is model based. According to Febridon, et al., (2018) the advantage of using a model-based inversion method is the method of versioning its geological model, not to an immediate version of the seismic. The Initial stage of the inversion process is to perform the initial model creation or initial model, in which the initial model is used as an initial prediction in creating an acoustic impedance model. After that, performed the initial model, performed in advance of the pre-inversion stage, where the stage is done to predict the resulting acoustic impedance model will be good or not.
Good inversions can be seen quantitatively by looking at the parameters of the RMS error, the correlation coefficient as well as the relatively minor errors . According to table 3 that the correlation value that has been produced has a strong quality according to Schober, dkk (2018) which is above 0.9 which is followed BY an RMS error value of 400 to 480 and has a relative error value less than 0.5. Where this indicates that the pre-inversion analysis performed is reasonably good, which further applies the pre-inversion results to inversion the overall seismic data volume. Then, the slicing is done ON THE BRF and A layers, and the OUTPUT is an AI-spread map.
4.4 Multiattribute Analysis Multriattribute analysis carried out as many as 4 log targets, namely density, porosity, Gamma Ray, and Sw. This multiattribute analysis uses the step wise regression and probabilistic neural networkmethods. The step Wise regression method is a method that includes both internal and external attributes that serve to produce a model capable of matching the target log . While THE PNN method is a method that performs analyses with non-linear methods.
The parameter that should be observed in conducting Multiattribute analysis is the number of attributes to be used, the error validation value and the resulting correlation value. As for the research the initial attributes are used as much as 10 attributes. After, obtaining the attribute to be used, the Crossplot stage is performed to find out the relationship of the original density log and the predicted density log of the results from the Multiattribute analysis. Then, subsequent results are multiattributes by using the about regression method and the PNN method compared to each other.

From the results of the analysis process generated Multiattribute log prediction of density logs, porosity, gamma ray, and Sw. Further, applied to the seismic data volume. Then, the slicing is done ON THE BRF and A layers. and generating a spread of property log. 4.5 The characteristic analysis of Reservoirs
The characteristic analysis of Reservoirs is performed to determine the nature and distribution and character of reservoir in seismic data relating to logdata. In conducting analysis the characteristic reservoirs are carried out based on a map of the log AI distribution, the map of the density log distribution, the map of gamma ray log distribution, and the map of the Sw log spread on the zone considered as the lead zone Based on a log sensitivity analysis that has been done that the target zone has an Akutstik impedance value of 6000 (m/s)*(g/cc) to 8000 (m/s)*(g/cc). Where the wells of EM-31, EM-32, EM-33 and EM-34 showed an acoustic impedance value of 6000 (m/s)*(g/cc) on the BRF layer. And on layer A indicates that the EM-32 well has an acoustic impedance value of 8000 (m/s) * (g/cc), for the wells of EM-31, EM-33, and EM-34 has an acoustic impedance value of 7250 (M/s) * (g/cc). So that it can be concluded based on the acoustic impedance value map that the lead zone has an acoustic impedance value of 6000 (m/s) * (g/cc) to 8000 (m/s) * (g/cc). on the map of the BRF layer that the density value of the lead zone consists of the EM-31, EM-32, EM-33 and EM-34 amounted to 2.3 g/CC. Whereas, on A map of the layer A density value in the lead zone of 2.4 g/CC. As noted that Telford (1990) The density value in the range 1.61-2.76 g/CC is a sandstonelitology, and is reinforced by Rider (1996) that the density of 1.9 – So it can be concluded that density held in the lead zone of 2.3 – 2.4 G/CC has the litology of sandstones. On The map Of the porosity Of the Wells OF em-31, EM-32, EM-33 AND em-34 that porosity value is above 0.1 m3/M3 or 10%. Hence, it can be concluded that the porosity owned by the lead zone has a quality that is according to that Yang (2017). Based on the gamma ray distribution map that the prospect Zone is a zone that has a moderate to moderate radioactive value according to Harsono (1997), which is correlated with the density value that the litology in the lead zone is the litology of sandstones or batteries. Based on a map of the SW range, That the SW value in the lead zone on the BRF layer for the EM-31 wells, the EM-33, the EM-34 indicates a sw value of 0.55 or 55% while the Em-32 well indicates a SW value of 0.5 or 50%. At layer A Sw value at THE well em-31, em-32, em-33, and em-34 show a value of 0.5 or 50%. As it is known according to Irawan (2009), that the value of Sw < 0.25 is oil and gas Fluid, sw 0.25 – 0.75 is oil fluid, and > 0.75 is water fluid. And reinforced according to Dewanto (2018) that the value of Sw < 50% is Gas, SW 50%-75% is oil fluid, and > 70%-75% is water fluid. It can be concluded that the Sw value in the lead zone is a zone that has fluid in the form of oil. However, judging from each map, the zone that will be used as the target zone has not been clearly visible, making it difficult to determine the location of the lead zones. Thus, a method can be demonstrated that the location of the lead zone is targeted in accordance with the value of acoustic impedance, density, porosity, gamma ray and Sw, where the method is spatial analysis method, which combines five maps into one. Spatial Analysis method is conducted by classifying acoustic impedance distribution map, density map, porosity map, gamma ray map and Sw map which are classified as 0 and 1. Where 0 is declared as an area that is not a prospect and 1 is declared as the lead area. A zone declared as the hydrocarbon

prospect Zone is an eligible zone having an acoustic impedance value of 6000 (m/s) * (g/cc) to 8000 (m/s) * (g/cc), the density value is 2.3 g/CC,-2.4 g/CC The value of porosity > 10%, gamma ray value < 100 Of the flame and the average Sw value – average 50%-55%. From the analysis that has been done on the lead zone distribution map of the area BRF that indicates hydrocarbons are located in the north to the east of the map and on layer a area that indicates hydrocarbons are located in the north to the northeast of the map.
5. Conclusions And Suggestions 5.1 Conclusions From the results of the research, it is obtained the following conclusions: 1. The result of THE volume of AI inversion and the volume of the Log property that has been made
have good quality, indicated by the average correlation value in THE output of AI of 0959, multiattribute analysis of density log of 0744, Multiattribute analysis of the logs of 0797, a multiattribute analysis of the gamma ray log of 0732 and a multiattribute analysis 0.74 of Sw.
2. It is known that the spread of property logs is performed on the BRF and a layers which are the target zones in this study. Based on acoustic impedance distribution map and log property distribution map, that in the lead zone has an acoustic impedance value of 6000 (m/s) * (g/cc) to 8000 (m/s) * (g/cc), density of 2.3 g/CC to 2.4 G/cc, porosity > 10%, gamma ray < 100API and Sw average – average 50% to 55%.
3. Analysis that has been done on the layer of BRF area that indicates hydrocarbons are in the north to east of the map and on layer a area that indicates hydrocarbons are in the north to the northeast of the map.
5.2. Suggestions The research done overall is good enough, but the author recommends increasing the number of well to improve data validation and processing results, so that it can produce excellent correlation so that the spread of the log property can be seen clearly. In addition, advanced studies need to be conducted by AVO analysis to determine the fluid character contained in hydrocarbons. 6. References [1]Barber, A J; Crow, M J; Milsom, J S. 2005. Sumatera : Geology, Resources amd Tectonic
Evolution. London: Geological Society.Dhewanto, O. 2018. Welloging Edisi-1. Lampung: Pusaka Media.
[2]Febridon, M N., Mulyatno, S B., Wijaksono, E. 2018. Analisis Sifat Fisis Pada Reservoar Batupasir Menggunakan Metode Seismik Inversi Impedansi Akustik (AI) dan Multiatribut Pada Lapangan "MNF" Cekungan Bonaparte. Jurnal Geofisika Eksplorasi, 4, 118-128.
[3]Harsono, A. 1997. Evaluasi Formasi dan Aplikasi Log. Jakarta: Schlumberger Oilfield Service. [4]Ilkhchi, dkk,. 2014. Seismic Inversion and Attribute Analysis for Porosity Evaluation of The Tight
Gas Sandstones of The Whicher Range Field in The Perth Basin. Western Australia. Journal of Natural Gas Science and Engineering 21. 1073 - 1083.
[5]Irawan, D., & Utama, W. 2009. Analisis Data Well Log (Porositas, Saturasi Air, dan Permeabilitas) untuk menentukan Zona Hidrokarbon, Studi Kasus: Lapangan "ITS" Daerah Cekungan Jawa Barat Utara. Jurnal Fisika dan Aplikasinya, 1-7.
[6]Rider, M. 1996. The Geological Interpretation of Well Logs : Second Edition. Malta: Interprint Ltd. [7]Sukmono. 2000. Seismik Inversi untuk Karakterisasi Reservoar. Departement Teknik Geofisika.
Bandung: Insitut Teknologi Bandung. [8]Telford, W. M., Geldart, L. P., & Sheriff, R. E. 1990. Applied Geophysics second edition. London:
Cambridge University Press. [9]Yang, S. 2017. Fundamental of Petrophysics. German: Springer.

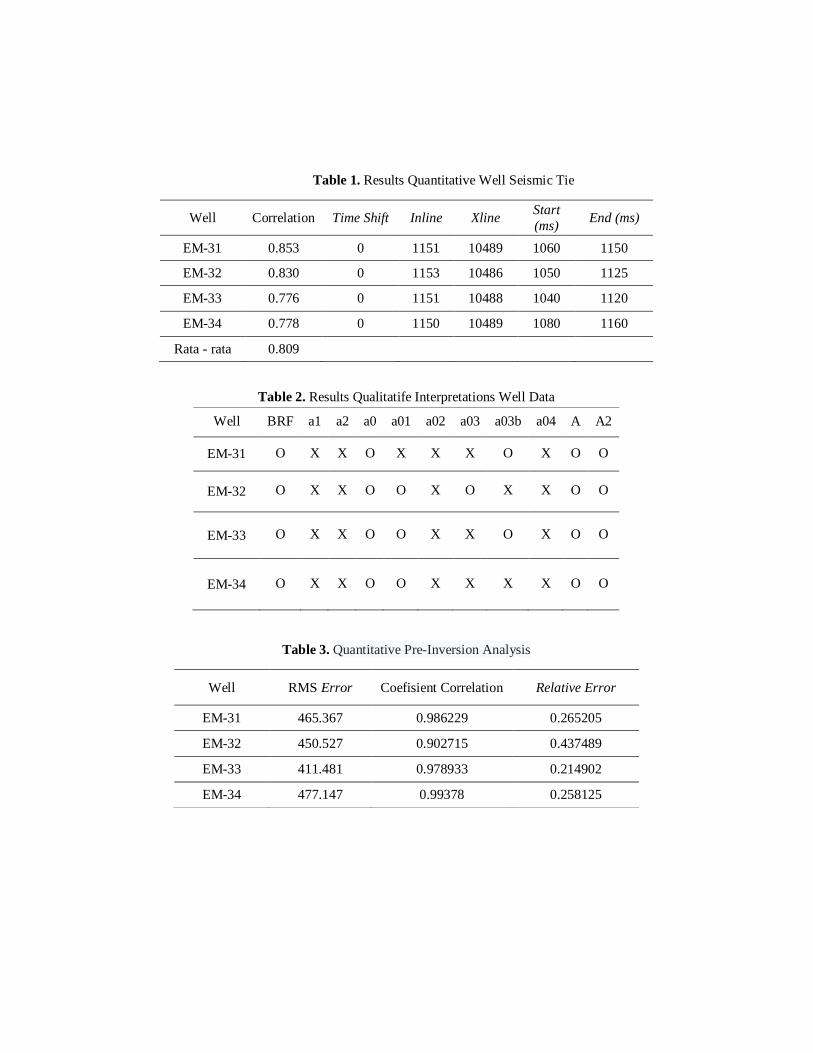
Table 1. Results Quantitative Well Seismic Tie
Table 2. Results Qualitatife Interpretations Well Data
Table 3. Quantitative Pre-Inversion Analysis
Well Correlation Time Shift Inline Xline Start (ms) End (ms)
EM-31 0.853 0 1151 10489 1060 1150
EM-32 0.830 0 1153 10486 1050 1125
EM-33 0.776 0 1151 10488 1040 1120
EM-34 0.778 0 1150 10489 1080 1160
Rata - rata 0.809
Well BRF a1 a2 a0 a01 a02 a03 a03b a04 A A2
EM-31 O X X O X X X O X O O
EM-32 O X X O O X O X X O O
EM-33 O X X O O X X O X O O
EM-34 O X X O O X X X X O O
Well RMS Error Coefisient Correlation Relative Error
EM-31 465.367 0.986229 0.265205
EM-32 450.527 0.902715 0.437489
EM-33 411.481 0.978933 0.214902
EM-34 477.147 0.99378 0.258125
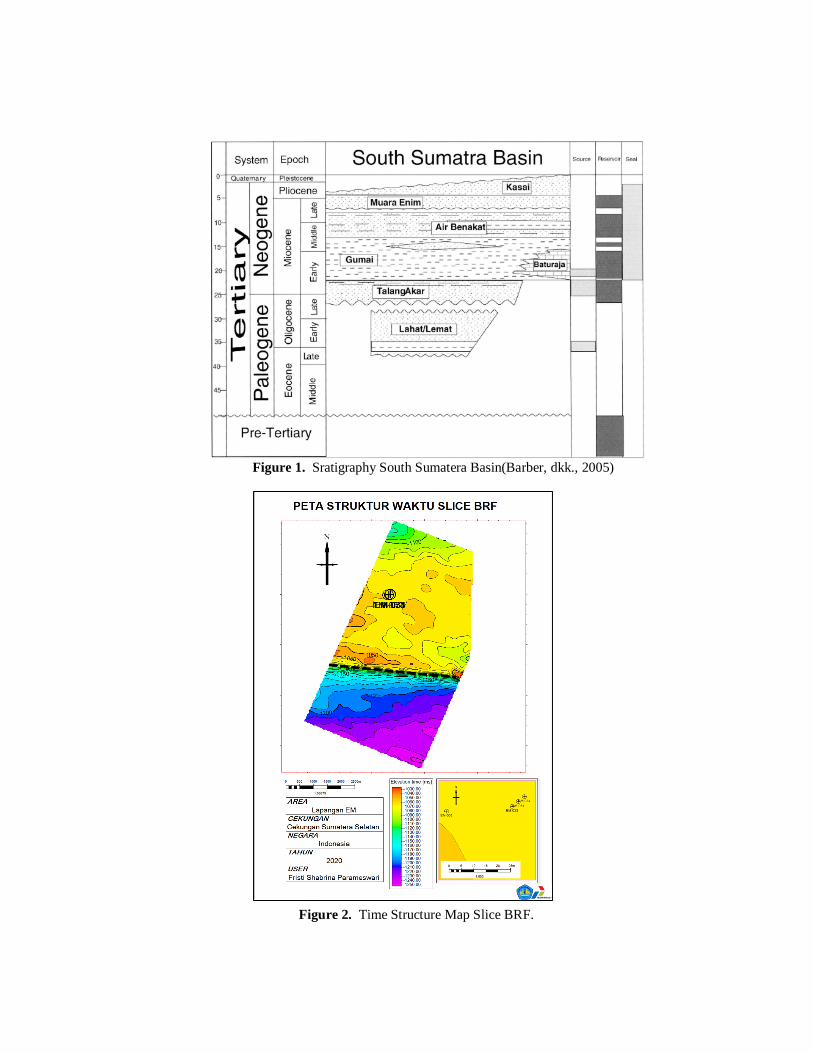
Figure 1. Sratigraphy South Sumatera Basin(Barber, dkk., 2005)
Figure 2. Time Structure Map Slice BRF.
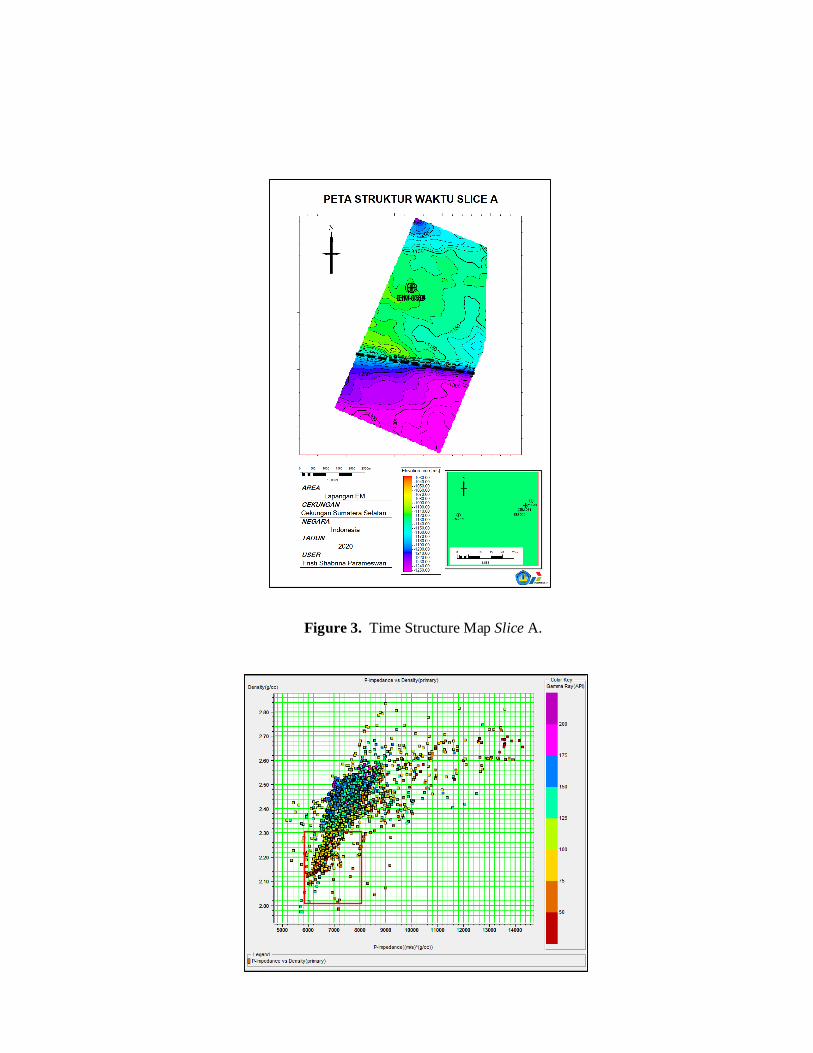
Figure 3. Time Structure Map Slice A.
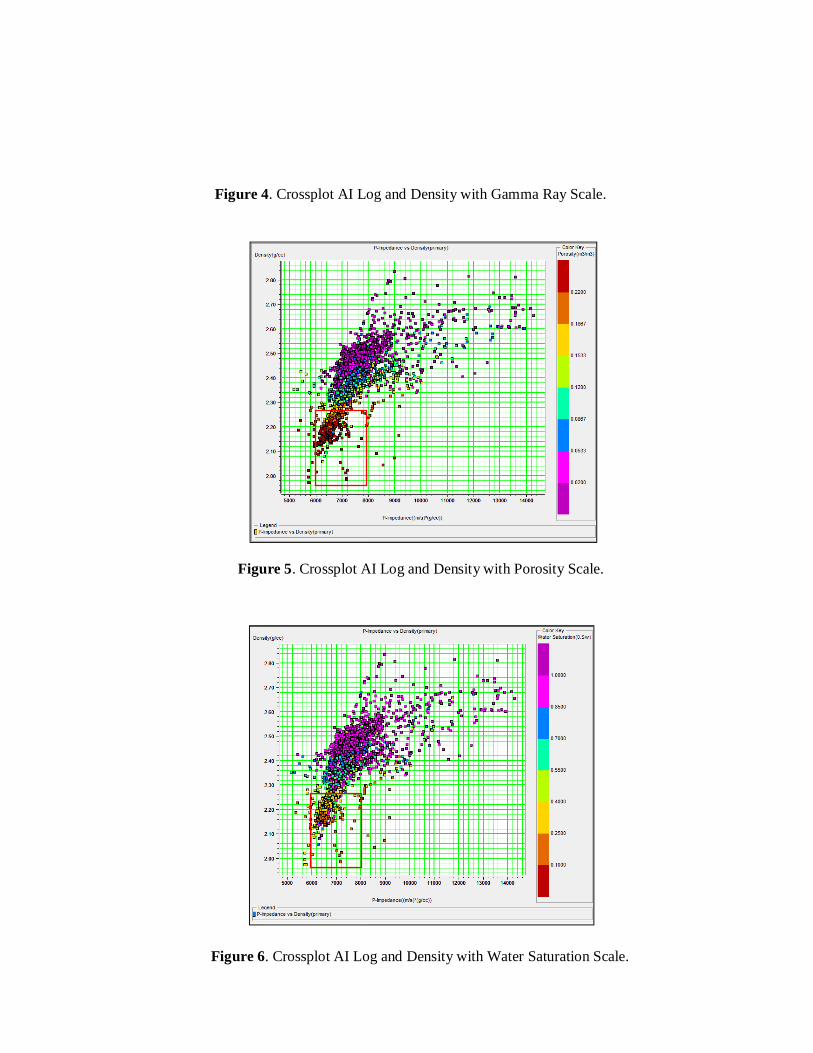
Figure 4. Crossplot AI Log and Density with Gamma Ray Scale.
Figure 5. Crossplot AI Log and Density with Porosity Scale.
Figure 6. Crossplot AI Log and Density with Water Saturation Scale.
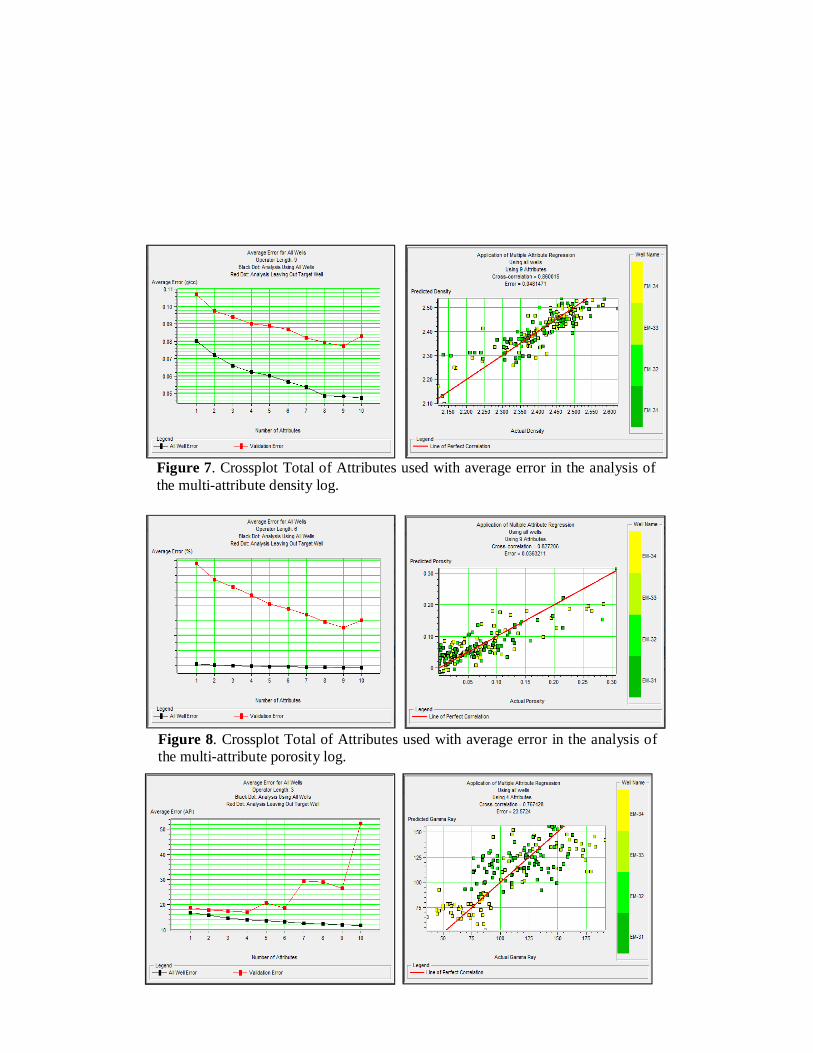
Figure 7. Crossplot Total of Attributes used with average error in the analysis of the multi-attribute density log.
Figure 8. Crossplot Total of Attributes used with average error in the analysis of the multi-attribute porosity log.
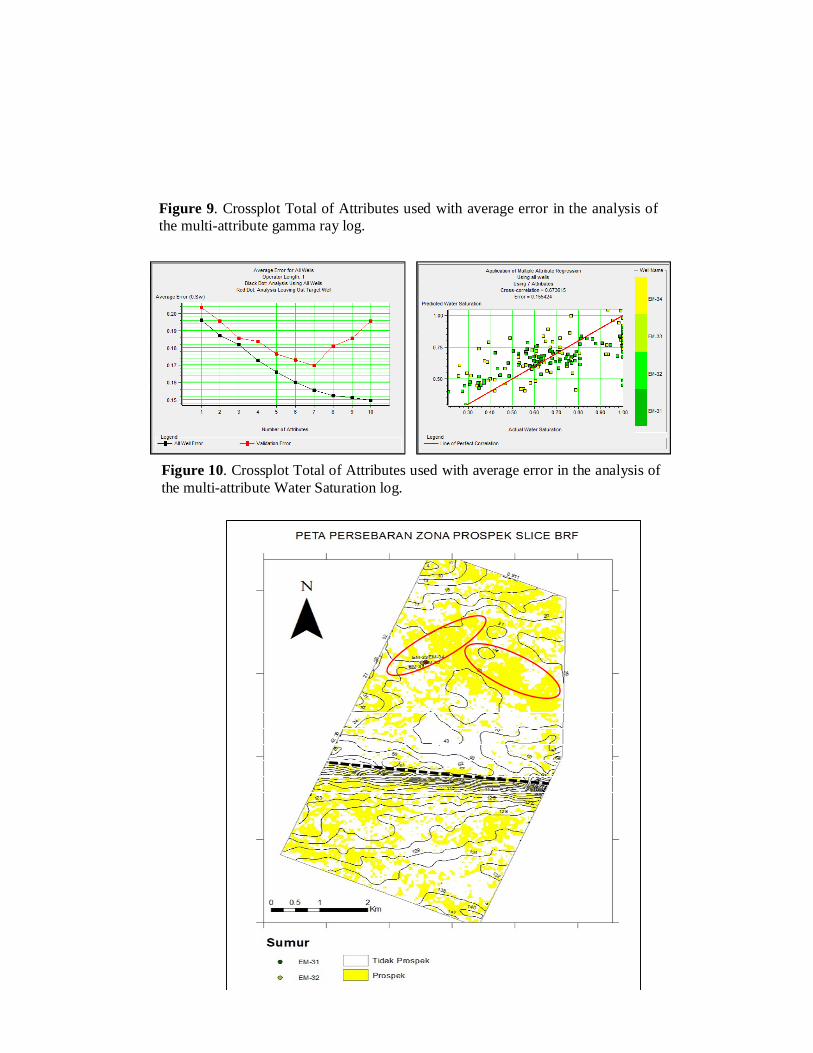
Figure 9. Crossplot Total of Attributes used with average error in the analysis of the multi-attribute gamma ray log.
Figure 10. Crossplot Total of Attributes used with average error in the analysis of the multi-attribute Water Saturation log.
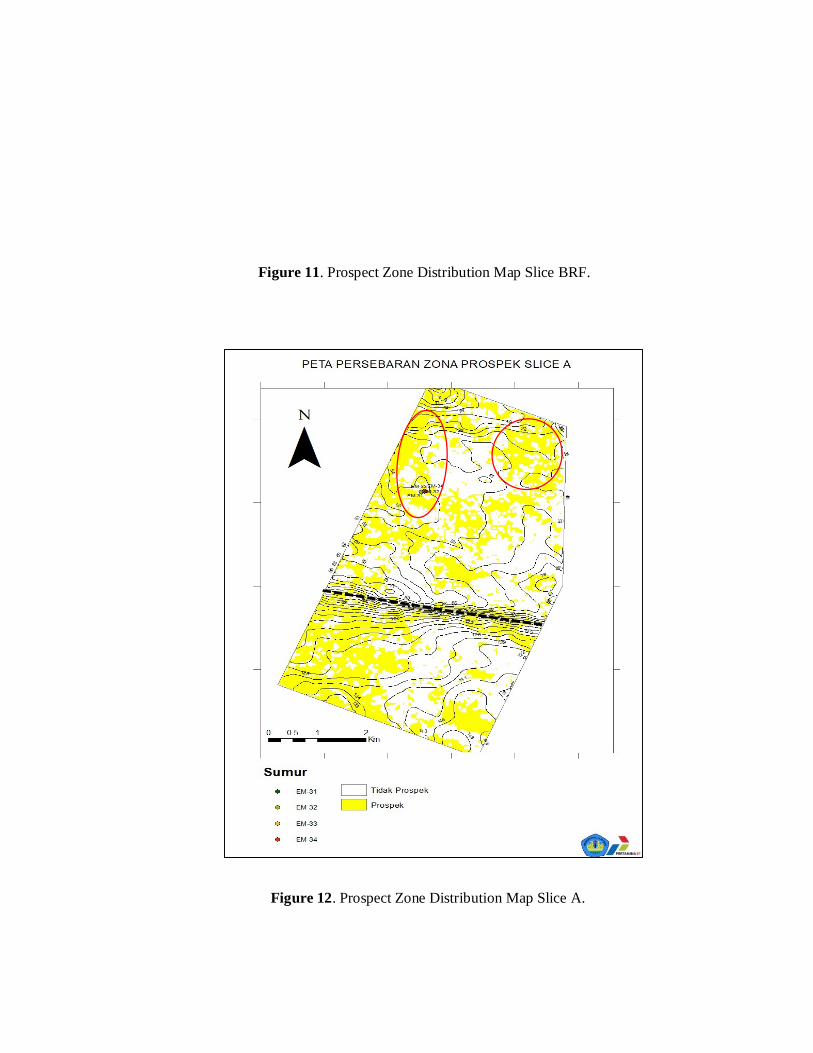
Figure 11. Prospect Zone Distribution Map Slice BRF.
Figure 12. Prospect Zone Distribution Map Slice A.