Embed Size (px)
Citation preview
Aus der Landessaatzuchtanstalt
der Universität Hohenheim
apl. Prof. Dr. Jochen C. Reif
Quantitative trait loci (QTL)
mapping in multi-line crosses of European maize
Dissertation
zur Erlangung des Grades eines Doktors
der Agrarwissenschaften
vorgelegt
der Fakultät Agrarwissenschaften
von
Diplom Agrar-Biologin
Jana Steinhoff
aus
Lennestadt
Stuttgart-Hohenheim
2012
ii
Die vorliegende Arbeit wurde am 23. Januar 2013 von der Fakultät
Agrarwissenschaften der Universität Hohenheim als „Dissertation zur
Erlangung des Grades eines Doktors der Agrarwissenschaften“
angenommen.
Tag der mündlichen Prüfung: 26.April 2013
1. Prodekan Prof. Dr. H. Grethe
Berichterstatter, 1. Prüfer apl. Prof. Dr. J. C. Reif
Mitberichterstatter, 2. Prüfer Prof. Dr. J. Bennewitz
3. Prüfer Prof. Dr. H.-P. Piepho
Contents
iii
Contents
General Introduction ................................................................................... 1
References .................................................................................................. 5
Multiple-Line Cross Quantitative Trait Locus Mapping in
European Elite Maize1.................................................................................8
Exploitation of Elite Maize (Zea mays L.) Germplasm across
Maturity Zones2..........................................................................................10
Detection of QTL for Flowering Time in Multiple Families of
Elite Maize3................................................................................................12
General Discussion ................................................................................... 14
References ................................................................................................ 22
Summary ................................................................................................... 26
Zusammenfassung ................................................................................... 28
Acknowledgements ................................................................................... 31
Curriculum Vitae ....................................................................................... 32
Erklärung ................................................................................................... 33
1Steinhoff J, Liu W, Maurer HP, Würschum T, Longin FH, Ranc N, Reif JC (2011) Multiple-Line Cross
QTL-Mapping in European Elite Maize. Crop Sci 51:2505-2516 2 Steinhoff J, Liu W, Maurer HP, Würschum T, Longin FH, Ranc N, Reif JC (2012a) Exploitation of
Elite Maize (Zea mays L.) Germplasm Across Maturity Zones. Crop Sci 52:1534-1542 3 Steinhoff J, Liu W, Reif JC, Della Porta G, Ranc N, Würschum T (2012b) Detection of QTL for
Flowering Time in Multiple Families of Elite Maize. Theor Appl Genet 125:1539-1551

1
General Introduction
1
General Introduction
Maize (Zea mays L.) was domesticated in Central America and its
adaptation to different climatic conditions was facilitated by tremendous
natural variation (Camus-Kulandaivelu et al. 2006). Maize is worldwide a
major staple crop for human nutrition and animal feed: 20 % of the calories
produced worldwide are provided by maize (FAOSTAT 2012), which is the
highest supply followed by wheat and rice. Agronomic important traits in
maize breeding are grain yield, grain moisture, adaptation to climatic
conditions and flowering time (Veldboom and Lee 1996; Mechin et al.
2001). Selection gain for these traits can be increased by profound
knowledge of their genetic architecture. Abundance of molecular markers
allows investigating the genomic regions underlying quantitative traits so
called Quantitative Trait Loci (QTL) (Geldermann 1975) in detail.
Multiple-line cross QTL studies
The genetic architecture of complex traits in maize has been studied using
classical QTL mapping approaches (Melchinger et al. 1998; Utz et al.
2000). These are based on single segregating biparental populations and
were accepted as a promising approach for crop improvement in maize
(Stuber et al. 1999; Tuberosa et al. 2003). The use of single biparental
populations in QTL studies is constricted due to a non-compliance of the
respective germplasm (Crepieux et al. 2004). This implies a deficient
applicability of single biparental populations in routine plant breeding
programs.
The use of biparental populations for QTL detection shows limitations
in statistical power, resolution of estimated QTL positions and a decreased
transferability of QTL between populations (Mihaljevic et al. 2004). In
single populations, the sample size is mostly too small and therefore QTL
are not detectable due to different genetic subsets per population (Holland
2007).
General Introduction
2
These problems can be overcome by using designs based on several
segregating populations (Rebai and Goffinet 1993; Muranty 1996). In
these populations, the number of tested progeny is sufficiently high to
overcome the problem of limited sample size. The additional advantage of
multiple-line cross (MC) QTL mapping approaches is that the underlying
population structure reflects the data routinely produced in applied plant
breeding programs. Such routinely generated data of breeding programs
can therefore be used to study the genetic architecture of complex traits.
First studies based on MC-designs have been published in maize,
investigating the genetic basis of grain yield (Blanc et al. 2006), dry matter
content (Blanc et al. 2006), flowering time (Blanc et al. 2006; Coles et al.
2010), and the genetics of heterosis of these traits (Larièpe et al. 2012).
All the above-mentioned studies were either based on genetic resources
or crosses among lines of public breeding programs. To our knowledge,
no study has been published based on elite germplasm of commercial
maize breeding programs yet.
Following the proposal of Rebaï and Goffinet (2000), Blanc et al.
(2006) suggested two biometrical models to analyze multiple-line cross
QTL mapping experiments. The disconnected model assumes QTL
substitution effects being specific for every single segregating population
and therefore fits QTL effects as nested effects within populations. The
genetic assumption underlying the connected model is that allele
substitution effects are specific for every parental line. Until now, in a very
limited number of studies the power to map QTL with both approaches has
been empirically compared
Reliability of the genetic consensus map
The reliability of MC-QTL mapping depends on the quality of the
underlying consensus map (Beavis and Grant 1991). Several experimental
studies reported high colinearity between different genetic maps across
different maize populations (Blanc et al. 2006; Coles et al. 2010). These
General Introduction
3
findings are in contrast to the results based on sequencing reported by Fu
and Dooner (2002) who observed that genes present in the maize line B73
in several instances had no allelic counterpart in line McC. Therefore,
colinearity among genetic maps has to be investigated to assess the
reliability of results from multiple-line cross QTL mapping studies.
Variation in allelic substitution effect
One disadvantage of biparental QTL mapping experiments is the difficulty
to transfer QTL to other populations, even when the populations have one
parent in common (Mihaljevic et al. 2004). Until now, little is known about
the proportion of variation caused by a QTL that is unique for a certain
cross and how much of the variation is transferable across crosses. MC-
QTL mapping based on diallel crosses among parents allow the analysis
of this question in more detail.
Epistasis
Epistasis refers to interactions between two or more loci in the genome
(Carlborg and Haley 2004) and is a popular explanation for the
background dependency of QTL (Jannink and Jansen 2001). Comparing
the lack of fit of the disconnected versus the connected model was
suggested as a one-dimensional scan for QTL x genetic background
epistasis (Jannink and Jansen 2001). Applying this test for QTL with
significant main effects, Blanc et al. (2006) observed the presence of
significant QTL × background epistasis for grain yield, grain moisture, and
silking date in maize. For flowering time, epistatic interactions have been
detected in the self-pollinating plants Arabidopsis and rice (El-Lithy et al.
2006; Uwatoko et al. 2008), whereas in the outbreeding species maize
epistasis for flowering time appears to be less prominent (Buckler et al.
2009; Coles et al. 2010).
General Introduction
4
A constraint for the one-dimensional scan for epistasis is the fact that
positive and negative epistatic effects can compensate each other
(Mihaljevic et al. 2004). As a consequence one-dimensional scans for
epistasis can fail to detect significant effects. Two-dimensional scans for
epistasis allow exploring the interactions between single markers. Due to
non-significant QTL × background epistatic interactions of flowering time
reported in literature (Coles et al. 2010), the application of two-dimensional
scans for epistasis was conducted in this study.
Objectives
In this thesis multiple-line cross QTL mapping was applied based on six
commercial maize breeding populations based on a diallel mating design.
In particular, the objectives were to
(i) assess the reliability of the maize genetic consensus map by
comparing it to its six single population linkage maps,
(ii) exploit the benefits of a combined analysis by applying two MC-QTL
mapping models and to compare the results to single-population
analyses, and
(iii) investigate the genetic architecture for grain yield, grain moisture,
adaptation and flowering time in elite maize.
References
5
References
Beavis WD, Grant D (1991) A linkage map based on information from four
F2 populations of maize (Zea mays L.). Theor Appl Genet 82:636–
644
Blanc G, Charcosset A, Mangin B, Gallais A, Moreau L (2006) Connected
populations for detecting quantitative trait loci and testing for
epistasis: an application in maize. Theor Appl Genet 113:206-224
Buckler ES, Holland JB, Bradbury PJ, Acharya CB, Brown PJ et al. (2009)
The genetic architecture of maize flowering time. Science 325:714-
718
Camus-Kulandaivelu L, Veyrieras JB, Madur D, Combes V, Fourmann M,
et al. (2006) Maize adaptation to temperate climate: relationship
between population structure and polymorphism in the Dwarf8 gene.
Genetics 172:2449-2463
Carlborg Ö, Haley CS (2004) Epistasis: too often neglected in complex
trait studies? Nat Rev Genet 5:618-625
Coles ND, McMullen MD, Balint-Kurti PJ, Pratt RC, Holland JB (2010)
Genetic control of photoperiod sensitivity in maize revealed by joint
multiple population analysis. Genetics 184:799-822
Crepieux S, Lebreton C, Servin B, Charmet B (2004) Quantitative trait loci
(QTL) detection in multicross inbred designs: Recovering QTL
identical-by-descent status information by marker data. Genetics
168:1737–1749
El-Lithy ME, Bentsink L, Hanhart CJ, Ruys GJ, Rovito D, Broekhof JLM,
van der Poel HJA, van Eijk MJT (2006) New Arabidopsis
recombinant inbred line populations genotyped using SNP Wave
and their use for mapping flowering-time quantitative trait loci.
Genetics 172:1867-1876
References
6
FAOSTAT (2012)
http://faostat.fao.org/site/567/DesktopDefault.aspx?PageID=567#an
cor accessed august 2012
Fu H, Dooner HK (2002) Intraspecific violation of genetic colinearity and its
implications in maize. Proc Natl Acad Sci USA 99:9573–9578
Geldermann, H. (1975) Investigations on Inheritance of Quantitative
Characters in Animals by Gene Markers I. Methods. Theor Appl
Genet 46:319-330
Goodman MM (1988) The history and evolution of maize. CRC Crit Rev
Plant Sci 7:197-220
Hallauer AR, Miranda JB (1981) Quantitative genetics in maize breeding.
2nd ed. Iowa State Univ. Press, Ames, IA.
Holland JB (2007) Genetic architecture of complex traits in plants. Curr
Opin Plant Biol 10:156-161
Jannink JL, Jansen RC (2001) Mapping epistatic quantitative trait loci with
one-dimensional genome searches. Genetics 157:445-454
Larièpe A, Mangin B, Jasson S, Combes V, Dumas F, Jamin P, Lariagon C,
Jolivot D, Madur D, Fiévet J, Gallais A, Dubreuil P, Charcosset A,
Moreau L (2012) The Genetic Basis of Heterosis: Multiparental
Quantitative Trait Loci Mapping Reveals Contrasted Levels of
Apparent Overdominance Among Traits of Agronomical Interest in
Maize (Zea mays L.) Genetics 190:795–811
Mechin V, Argillier O, Hébert Y, Guingo E, Moreau L, et al. (2001) Genetic
analysis and QTL mapping of cell wall digestibility and lignifications in
silage maize. Crop Sci 41:690-697
Melchinger AE, Utz HF, Schön CC (1998) Quantitative trait locus (QTL)
mapping using different testers and independent population samples
in maize reveals low power of QTL detection and large bias in
estimates of QTL effects. Genetics 149: 383–403
References
7
Mihaljevic R, Utz HF, Melchinger AE (2004) Congruency of quantitative trait
loci detected for agronomic traits in testcrosses of five populations of
European maize. Crop Sci 44:114–124
Muranty H (1996) Power of tests for quantitative trait loci detection using
full-sib families in different schemes. Heredity 76:156–165
Rebaï A, Goffinet B (2000) More about quantitative trait locus mapping
with diallel designs. Genet Res 75:243–247
Rebaï A, Goffinet B (1993) Power of tests for QTL detection using
replicated progenies derived from a diallel cross. Theor Appl Genet
86:1014-1022
Stuber CW, Polacco M, Senior ML (1999) Synergy of empirical breeding,
marker-assisted selection, and genomics to increase crop yield
potential. Crop Sci 39:1571 - 1583
Tuberosa RS, Salvi S, Sanguineti MC, Maccaferri M, Guiliani S, Landi P
(2003) Searching for quantitative trait loci controlling root traits in
maize: A critical appraisal. Plant Soil 255:35 – 54
Utz HF, Melchinger AE, Schön CC (2000) Bias and sampling error of the
estimated proportion of genotypic variance explained by quantitative
trait loci determined from experimental data in maize using cross
validation and validation with independent samples. Genetics
154:1839–1849
Uwatoko N, Onishi A, Ikeda Y, Manabu K, Sasaki A Matsubata K, Itoh Y,
Sano Y (2008) Epistasis among the three major flowering time
genes in rice: coordinate changes of photoperiod basic vegetative
growth and optimum photoperiod. Euphytica 163:167-175
Veldboom LR, Lee M (1996) Genetic mapping of quantitative trait loci in
maize in stress and nonstress environments: II. Plant height and
flowering. Crop Sci 36:1320-132
Publication 1: Steinhoff et al. 2011
8
Publication 1:
Multiple-Line Cross Quantitative Trait Locus Mapping in European Elite Maize
Jana Steinhoff*, Wenxin Liu*, Hans Peter Maurer, Tobias Würschum, C.
Friedrich Longin, Nicolas Ranc, and Jochen C. Reif†
Jana Steinhoff, Wenxin Liu, Hans Peter Maurer, Tobias Würschum, C.
Friedrich H. Longin, and Jochen C. Reif State Plant Breeding Institute,
University of Hohenheim, 70593 Stuttgart, Germany
Nicolas Ranc Syngenta Seeds SAS, 12, chemin de l'Hobit, B.P. 27, 31790
Saint- Sauveur, France
*Both authors contributed equally to this work
†Corresponding author: State Plant Breeding Institute, University of
Hohenheim, 70593 Stuttgart, Germany.
E-mail: [email protected]
Crop Science (2011) 51:2502 - 2516
DOI: 10.2135/cropsci2011.03.0181 The original publication is available at http://www.crops.org/cs
Publication 1: Steinhoff et al. 2011
9
Abstract
Multiple-line cross QTL mapping is proposed as a promising tool to detect
QTL with high power and substantial accuracy. The main aim of this study
was to assess the benefits of combined QTL analysis by applying two
biometrical models compared to single-population analyses. For the
combined QTL analysis we used a biometrical model which assumes
allele substitution effects specific for every biparental population
(disconnected model). Moreover, we applied a biometrical model which
assumes allele substitution effects specific for every parent (connected
model). Six testcross populations of maize derived from a diallel cross of
four parents were tested in 10 environments for grain yield and grain
moisture. The 788 genotypes were genotyped with 857 SNP markers. Our
findings clearly underline the potential to improve the power to detect QTL
and the resolution to localize the QTL in the genome switching from single
population QTL mapping towards joint QTL analysis across populations.
The disconnected model outperformed the connected model with regard to
the power to detect QTL. Consequently, our results suggest that the
disconnected model is the model of choice for multiple-line cross QTL
mapping in elite maize germplasm.
Publication 2: Steinhoff et al. 2012 a
10
Publication 2:
Exploitation of elite maize (Zea mays L.) germplasm across maturity zones
Jana Steinhoff*, Wenxin Liu*, Hans Peter Maurer, Tobias Würschum, C.
Friedrich Longin, Nicolas Ranc, and Jochen C. Reif†
Jana Steinhoff, Wenxin Liu, Hans Peter Maurer, Tobias Würschum, C.
Friedrich H. Longin, and Jochen C. Reif State Plant Breeding Institute,
University of Hohenheim, 70593 Stuttgart, Germany
Nicolas Ranc Syngenta Seeds SAS, 12, chemin de l'Hobit, B.P. 27, 31790
Saint- Sauveur, France
*Both authors contributed equally to this work
†Corresponding author: State Plant Breeding Institute, University of
Hohenheim, 70593 Stuttgart, Germany.
E-mail: [email protected]
Crop Sci (2012) 52:1534-1542
DOI: 10.2135/cropsci2011.10.0533
The original publication is available at http://www.crops.org/cs
Publication 2: Steinhoff et al. 2012 a
11
Abstract
Transfer of elite lines across maturity zones is of crucial interest because it
facilitates the exploitation of indirect selection gain. The main goal of this
study was to investigate strategies to guide the transfer of elite lines from
Southern Europe to the U.S. Corn Belt. Testcrosses of progenies of six bi-
parental populations derived from a diallel cross of four Southern
European elite lines were evaluated together with adapted commercial
checks in 10 Southern European and six U.S. Corn Belt environments in
2007 for grain yield and grain moisture when mated to adapted testers.
Moreover, the 788 genotypes were genotyped with 857 single nucleotide
polymorphism (SNP) markers and multiple-line cross QTL mapping was
performed. Some testcross progenies in the U.S. Corn Belt reached grain
yield performance comparable to the best check, which suggests that
direct use of Southern European lines is promising. The success of using
grain yield or grain moisture data determined in Southern Europe to pre-
select Southern European lines for use in the U.S. Corn Belt is limited.
Moreover, we observed a complex genetic architecture of adaptation with
absence of major QTL and strong QTL by background interactions. We
found evidence that epistasis influences adaptation, additionally
hampering the success of marker guided transfer of germplasm from
Southern Europe to the U.S. Corn Belt.
Publication 3: Steinhoff et al. 2012 b
12
Publication 3:
Detection of QTL for flowering time in multiple families of elite maize
Jana Steinhoff*, Wenxin Liu*, Jochen C. Reif, Giovanni Della Porta,
Nicolas Ranc, and Tobias Würschum
Jana Steinhoff, Wenxin Liu, Jochen C. Reif, Tobias Würschum (), State
Plant Breeding Institute, University of Hohenheim, 70593 Stuttgart,
Germany, email: [email protected]
Wenxin Liu, Crop Genetics and Breeding Department, China Agricultural
University, 100193 Beijing, China
Giovanni Della Porta, Syngenta Seeds S.p.A., Via per Soresina, 26020
Casalmorano (CR), Italy
Nicolas Ranc, Syngenta Seeds SAS, 12, chemin de l'Hobit, B.P. 27,
31790 Saint-Sauveur, France
*Both authors contributed equally to this work
Theor Appl Genet (2012) 125:1539-1551
DOI: 10.1007/s00122-012-1933-4
The original publication is available at: http://www.springer.com/life+sciences/plant+sciences/journal/122
Publication 3: Steinhoff et al. 2012 b
13
Abstract
Flowering time is a fundamental quantitative trait in maize that has played
a key role in the postdomestication process and the adaptation to a wide
range of climatic conditions. Flowering time has been broadly studied and
recent QTL mapping results based on diverse ancestors suggest that the
genetic architecture underlying this trait is mainly based on numerous
minor QTL. Here, we used a population of 684 progenies from five
connected families to investigate the genetic architecture of flowering time
in elite maize. We used a joint analysis and identified 9 main effect QTL
explaining approximately 50% of the genotypic variation of the trait. The
QTL effects were small compared to the observed phenotypic variation
and showed strong differences between families. We detected no
epistasis with the genetic background but four digenic epistatic
interactions in a full 2-dimensional genome scan. Our results suggest that
flowering time in elite maize is mainly controlled by main effect QTL with
rather small effects but that epistasis may also contribute to the genetic
architecture of the trait.
General Discussion
14
General Discussion
Multiple-line crosses have been proposed as a promising method for QTL
detection to unravel the genetic architecture of quantitative traits in maize
(Blanc et al. 2006; Coles et al. 2010). In commercial plant breeding
programs, breeders generate many segregating biparental populations of
elite material which are phenotyped and mostly genotyped with molecular
markers. Especially in crosses of elite x elite lines, population sizes of
more than 100 individuals are reached (Longin, pers. comm.). The present
work was conducted within a project funded by the German Federal
Ministry of Education and Research (BMBF) with the goal to use data
routinely generated in breeding programs for multiple-line cross QTL
mapping studies.
Experimental design of the study
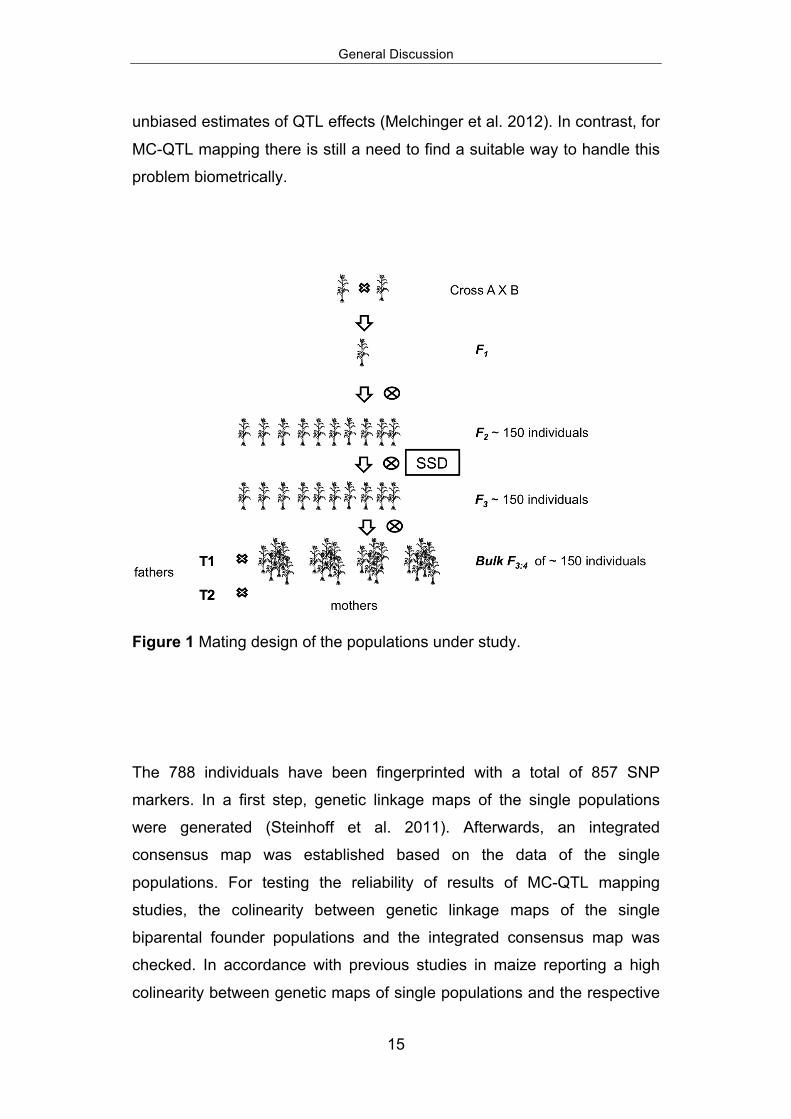
In the present work, six F3 populations, with a total of 788 individuals (for
flowering time five F3 populations, with a total of 684 individuals) were
obtained from a diallel cross between four dent inbred lines (A, B, C, and
D) (Figure 1). Lines C and D were related by pedigree. This relationship
also became apparent in the molecular analyses of the parental lines
(Steinhoff et al. 2011). The underlying genetic pattern is typical for elite
lines of the first GCA tests. The phenotyping intensity was high because it
was based on field evaluation in up to ten locations. The number of
locations is double as high as commonly applied in maize breeding
programs at this stage of the first GCA tests.
Progenies of the six crosses were unselected with regard to their
testcross-performance for the target traits. This is relevant for the MC-QTL
mapping study, because even a moderate selection can reduce the QTL
detection power and result in biased estimates of the QTL effects
(Melchinger et al. 2012). For biparental populations, biometrical
approaches have been developed to overcome the problem of selection of
General Discussion
15
unbiased estimates of QTL effects (Melchinger et al. 2012). In contrast, for
MC-QTL mapping there is still a need to find a suitable way to handle this
problem biometrically.
Figure 1 Mating design of the populations under study.
The 788 individuals have been fingerprinted with a total of 857 SNP
markers. In a first step, genetic linkage maps of the single populations
were generated (Steinhoff et al. 2011). Afterwards, an integrated
consensus map was established based on the data of the single
populations. For testing the reliability of results of MC-QTL mapping
studies, the colinearity between genetic linkage maps of the single
biparental founder populations and the integrated consensus map was
checked. In accordance with previous studies in maize reporting a high
colinearity between genetic maps of single populations and the respective
General Discussion
16
consensus maps (Blanc et al. 2006; Coles et al. 2010), we detected a high
colinearity between single population genetic maps and the consensus
map (Steinhoff et al. 2011). This clearly indicates that QTL mapping
across single populations is not hampered by a large variation of
recombination frequencies across populations (Steinhoff et al. 2011).
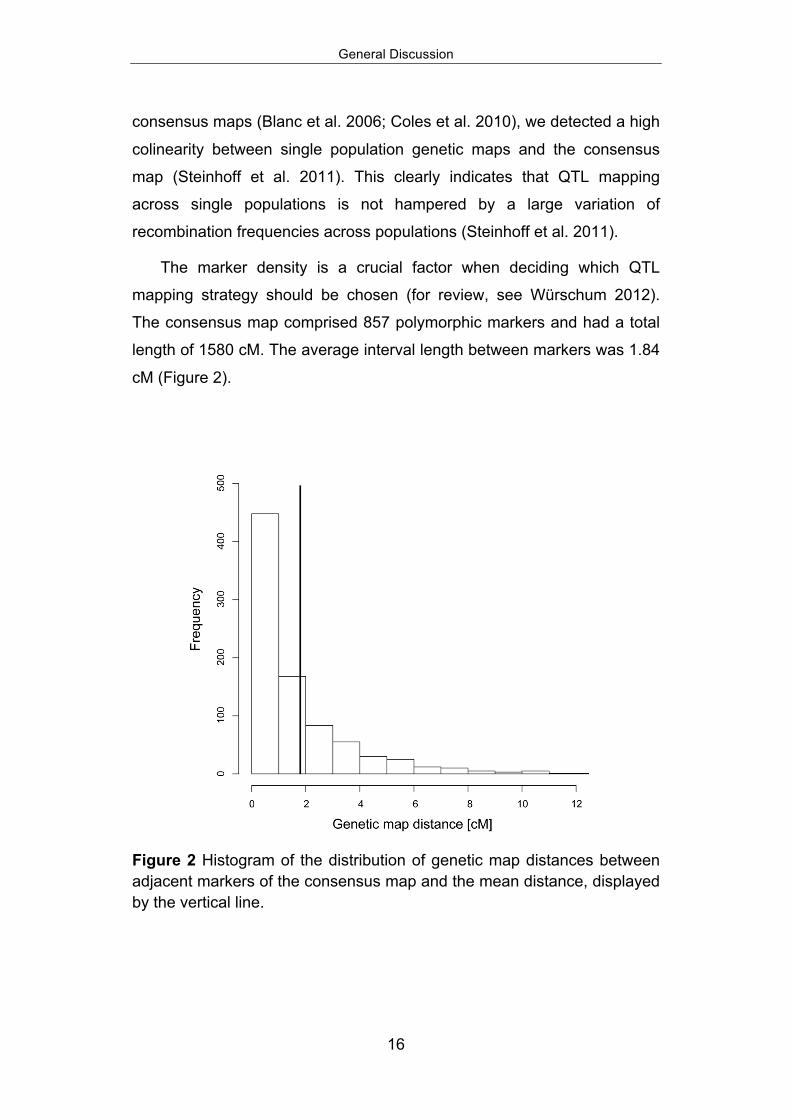
The marker density is a crucial factor when deciding which QTL
mapping strategy should be chosen (for review, see Würschum 2012).
The consensus map comprised 857 polymorphic markers and had a total
length of 1580 cM. The average interval length between markers was 1.84
cM (Figure 2).
Figure 2 Histogram of the distribution of genetic map distances between adjacent markers of the consensus map and the mean distance, displayed by the vertical line.
General Discussion
17
As the four parents are related by pedigree, the application of
association mapping approaches would be of interest. Dense genetic
linkage maps would alternatively enable mapping strategies estimating
identical by descent relationships among the parental lines (e.g. Van
Eeuwijk et al. 2010; Meuwissen et al. 2001) with the potential to increase
QTL detection power (Jansen et al. 2003; Jannink et al. 2009). For our
data set, the observed marker density was at the lower limit and,
consequently, association mapping and identical by descent approaches
have not been applied in this thesis.
For linkage mapping approaches, the required marker density is
substantially lower compared to that of association mapping. Results of
theoretical studies suggested that the power of QTL detection for linkage
mapping does not considerably increase if the distance between adjacent
markers decreases below 10 cM (Davarsi 1993; Piepho 2000). For the six
populations used in the underlying study, more than 90 % of the genetic
map distances between adjacent polymorphic markers were smaller than
10 cM. This fact suggests that marker density is no major limiting factor for
QTL detection applying linkage mapping approaches. Nevertheless, for
some of the six populations we also observed few large gaps of up to 30
cM (Steinhoff et al. 2011). These, however, may rather point to identity by
descent than to a too low number of markers. Consequently, owing to the
marker density underlying this study, we applied linkage mapping
approaches, in which we assumed that the parents are unrelated.
Choice of a biometrical approach for MC-QTL
Several biometrical models have been suggested for MC-QTL mapping.
They can be grouped into fixed and random allele effect models (for
review see Jannink and Wu 2003). Random allele effect models are very
powerful for a large number of segregating families, because the number
of QTL parameter is independent of the number of families (Wu and
Jannink 2004). In contrast, power of QTL detection is higher for fixed
General Discussion
18
compared to random allele effect models if the number of segregating
families is low (Xu 1998). Therefore, two alternative fixed allele effect
models described in detail by Blanc et al. (2006) were used in our studies.
For the disconnected model, QTL allele substitution effects are
assumed to be specific for every single segregating population (Blanc et
al. 2006). This model is equivalent to the full model introduced by Jannink
and Jansen (2001). In the connected model, allele substitution effects are
assumed to be specific for every parental line (Blanc et al. 2006). For the
diallel mating design, this assumption leads to a higher number of degrees
of freedom for QTL detection based on the connected model in
comparison to the disconnected model.
Blanc et al. (2006) compared the disconnected and the connected
model empirically. They found that the connected model led to a
substantial increased QTL detection power owing to a reduced number of
estimated allele substitution effects. In contrast, we observed uniformly
across traits that the disconnected model outperformed the connected
model in terms of number of QTL and confidence intervals (Steinhoff et al.
2011; 2012a). This superiority of the disconnected versus the connected
model can be explained by high background dependencies of QTL effects
(Steinhoff et al. 2011).
The use of a diallel mating design facilitates a one-dimensional scan
for epistasis. In this test, described in detail by Blanc et al. (2006), a model
with QTL as defined in the disconnected analysis and cofactors as defined
in the connected analysis, and a model with QTL and cofactors as defined
in the connected analysis are compared to each other. A first version of
this test was described in a theoretical study by Jannink and Jansen
(2001). The one-dimensional scan does not detect epistatic effects if
negative and positive effects cancel each other out (Mihaljevic et al. 2004).
Therefore, the disconnected model was extended and a full two-
dimensional test for epistasis was applied.
General Discussion
19
Genetic architecture of grain yield
For grain yield, seven QTL explaining a total of 43.6 % of the genotypic
variance were detected using the disconnected model (Steinhoff et al.
2011). None of these QTL was a major QTL explaining more than 10 % of
the genotypic variation of the trait. This finding is in accordance with
results of Huang et al. (2010), who reported only small effect QTL
contributing to grain yield. Applying cross-validation revealed that only
10% of the variance can be reliably explained for grain yield based on the
QTL detected in the MC-QTL mapping approach (Liu et al. 2012). Using a
genomic selection approach as applied in a companion study shows that
the inheritance of grain yield is closer to the infinity model (Zhao et al.
2011). Therefore, grain yield cannot appropriately be tackled with
conventional QTL mapping approaches.
One- and two-dimensional tests for epistasis did not reveal any
significant interaction. The results show, however, that peaks are very
close to the significance threshold and in some of these cases, the peaks
occurred in the same regions where main QTL had been detected. In
addition, the modified diallel analysis based on estimated QTL effects
within populations revealed a strong dependency on the genetic
background (Steinhoff et al. 2011). Consequently, epistasis as one
explanation of this background dependency cannot be ruled out for grain
yield.
Genetic architecture of grain moisture
For grain moisture, nine QTL explaining a total of 63.2 % of the genotypic
variance were found by applying the MC-QTL approach (Steinhoff et al.
2011). The result is comparable to that of grain yield, showing no major
QTL for this trait in the adapted environments (Steinhoff et al. 2012a).
After a cross-validation step, the explained genotypic variance of the trait
dropped down to 15 % (Liu et al. 2012). In accordance with grain yield,
one- and two-dimensional scans suggested that epistasis plays only a
General Discussion
20
minor role. The small QTL x background interaction, however, can be
interpreted as an indicator for presence of epistasis.
Genetic architecture of adaptation
The immediate use of non-adapted inbred lines without selection, serving
as parents in hybrid combinations with adapted lines, is a promising
strategy to exploit the genetic diversity of elite breeding pools (Hallauer
and Miranda 1988). Although phenotypic correlations revealed a low
association between the European and US-Cornbelt maturity zone, some
testcrosses reached the yield level of the best check (Steinhoff et al.
2012a). Due to the low correlations between genotypic values determined
in the European and US-Cornbelt maturity zone, we investigated whether
adaptation is influenced by major QTL (Steinhoff et al. 2012a). Adaptation
was also not influenced by major QTL and, thus, marker-assisted transfer
of germplasm across maturity zones is not feasible.
Genetic architecture of flowering time
A previous study in maize showed that flowering time is a complex trait
with no major QTL being expected (Buckler et al. 2009). In the underlying
study, nine QTL were identified using the disconnected model, explaining
48.4% of the genotypic variation of the trait in total (Steinhoff et al. 2012b).
In accordance to Buckler et al. (2009), it has been shown that flowering
time is inherited rather by several QTL with minor effects than by a few
major QTL.
Interestingly, our QTL study indicate a significant impact of digenic
epistasis on female flowering time (Steinhoff et al. 2012b), which is
divergent to Bucker et al. (2009) who reported no or little impact of
epistasis on the trait. This discrepancy can be explained by the difference
in the genetic material in the studies. As Bucker et al. (2009) reported their
General Discussion
21
results on the basis of a diverse panel of maize, there is evidence that in
elite maize, epistatic interactions may have been conserved.
Conclusions and outlook
The results of this thesis showed that grain yield, grain moisture,
adaptation to different climatic zones and flowering time have a complex
genetic architecture with an absence of major QTL. As a consequence,
the application of marker assisted selection is not promising and more
appropriated strategies such as genomic selection should be applied. The
joint analyses across populations result in higher QTL detection power and
resolution compared to single population analyses. Consequently, the
tested QTL mapping approaches are well suited to identify diagnostic
markers for more simply inherited traits such as southern corn leaf blight
(Negeri et al. 2011). Nevertheless, conducting joint analyses, the reliability
of the results should be validated by a cross validation process.
References
22
References
Blanc G, Charcosset A, Mangin B, Gallais A, Moreau L (2006) Connected
populations for detecting quantitative trait loci and testing for
epistasis: an application in maize. Theor Appl Genet 113:206-224
Buckler ES, Holland JB, Bradbury PJ, Acharya CB, Brown PJ et al. (2009)
The genetic architecture of maize flowering time. Science 325:714-
718
Coles ND, McMullen MD, Balint-Kurti PJ, Pratt RC, Holland JB (2010)
Genetic control of photoperiod sensitivity in maize revealed by joint
multiple population analysis. Genetics 184:799-822
Darvasi A, Weinreb A, Minke V, Wellert JI, Soller M (1993) Detecting
Marker-QTL Linkage and Estimating QTL Gene Effect and Map
Location Using a Saturated Genetic Map. Genetics 134: 943-951
Hallauer AR, Miranda Filho JB (1988) Quantitative genetics in maize
breeding. 2nd ed. Iowa State Univ. Press, Ames, IA.
Huang YF, Madur D, Combes V, Ky CL, Coubriche D. Jamin P, Jouanne
S, Dumas F, Bouty E, Bertin P, Charcosset A, Moreau L (2010) The
genetic architecture of grain yield and related traits in Zea maize L.
Revealed by Comparing Intermated and Conventional Populations.
Genetics 186: 395–404
Jannink JL, Moreau L, Charmet G, Charcosset A (2009) Overview of QTL
detection in plants and tests for synergistic epistatic interactions.
Genetica 136:225-236
Jannink JL, Wu XL (2003) Estimating allelic number and identity in state of
QTLs in interconnected families. Genet Res 81:133–144
Jannink JL, Jansen RC (2001) Mapping epistatic quantitative trait loci with
one-dimensional genome searches. Genetics 157:445-454
References
23
Jansen R, Jannink JL, Beavis WD (2003) Mapping Quantitative Trait Loci
in Plant Breeding Populations: Use of Parental Haplotype Sharing.
Crop Sci 43:829-834
Liu W, Reif JC, Ranc N, Della Porta G, Würschum T (2012) Comparison of
biometrical approaches for QTL detection in multiple segregating
families. Theor Appl Genet doi: 10.1007/s00122-012-1889-4
Melchinger AE, Orsini E, Schön CC (2012) QTL mapping under truncation
selection in homozygous lines derived from biparental crosses.
Theor Appl Genet 124:543–553
Meuwissen THE, Hayes BJ, Goddard ME (2001) Prediction of total genetic
value using dense marker maps. Genetics 157:1819-1829
Mihaljevic R, Utz HF, Melchinger AE (2004) Congruency of quantitative
trait loci detected for agronomic traits in testcrosses of five
populations of European maize. Crop Sci 44:114–124
Negeri AT, Coles ND, Holland JB, Balint-Kurti PJ (2011) Mapping QTL
controlling southern leaf blight resistance by hoint analysis of three
related recombinant inbred line populations. Crop Sci 51:1571-1579
Piepho HP (2000) Optimal marker density for interval mapping in a
backcross population. Heredity 84:437–440
Steinhoff J, Liu W, Maurer HP, Würschum T, Longin FH, Ranc N, Reif JC
(2011) Multiple-Line Cross QTL-Mapping in European Elite Maize.
Crop Sci 51:2505-2516
Steinhoff J, Liu W, Maurer HP, Würschum T, Longin FH, Ranc N, Reif JC
(2012a) Exploitation of Elite Maize (Zea mays L.) Germplasm Across
Maturity Zones. Crop Sci 52:1534-1542
Steinhoff J, Liu W, Reif JC, Della Porta G, Ranc N, Würschum T (2012b)
Detection of QTL for Flowering Time in Multiple Families of Elite
Maize. Theor Appl Genet doi: 10.1007/s00122-012-1933-4
References
24
Van Eeuwijk FA, Boer M, Totir LR, Blink M, Wright D, Winkler CR, Podlich
D, Boldmann K, Baumgarten A, Smalley M, Arbelbide M, ter Braak
CJF, Cooper M (2010) Mixed model approaches for the identification
of QTLs within a maize hybrid breeding program. Theor Appl Genet
120:429-440
Wu XL, Jannink JL (2004) Optimal sampling of a population to determine
QTL location, variance, and allelic number. Theor Appl Genet
108:1434–1442
Würschum T (2012) Mapping QTL for agronomic traits in breeding
populations. Theor Appl Genet 125:201-210
Xu S (1998) Mapping quantitative trait loci using multiple families of line
crosses. Genetics 148:517-524
Zhao Y, Gowda M, Liu W, Würschum T, Maurer HP, Longin F, Ranc N,
Reif JC (2012) Accuracy of genomic selection in European maize
elite breeding populations. Theor Appl Genet 124:769–77

25
Summary
26
Summary
Multiple-line crosses (MC) have been proposed as promising mapping
resource for quantitative trait loci (QTL) detection for agronomic important
traits. In contrast to mapping populations derived from a single biparental
population, MC can increase the statistical power of QTL detection, the
accuracy of QTL location and of QTL effect estimates. Additionally, MC-
QTL mapping has the advantage of using data routinely collected in plant
breeding programs.
The objectives of this study were to (i) assess the reliability of the
maize genetic consensus map by comparing it to its six single population
linkage maps, (ii) exploit the benefits of a combined analysis by applying
two MC-QTL mapping models and to compare the results to single-
population analyses, and (iii) investigate the genetic architecture of grain
yield, grain moisture, adaptation, and flowering time in elite maize.
The experiment comprised six populations with 109 to 150 individuals,
resulting from crosses of elite maize breeding material. The germplasm
was provided by Syngenta Seeds, Bad Salzuflen, Germany. The 788
genotypes were genotyped with 857 SNP markers. After constructing
genetic linkage maps of the six single populations, the genotypic
information of the single populations was integrated in a consensus map
and its reliability was tested for QTL studies. The average distance
between adjacent markers was 1.84 cM suggesting that the marker
density is not a limiting factor for QTL analyses. Moreover, we observed
medium to high heritabilities for all traits. Consequently, the quality of both
genotypic and phenotypic data should allow QTL detection with substantial
power.
We applied two different MC-QTL mapping models on the data
assuming fixed allele effects. The disconnected model estimates QTL
effects nested within populations, whereas the connected model takes into
account the relationship between the populations. Both models
outperformed the single population analyses with regard to QTL detection
Summary
27
rate, variance explained by the detected QTL, and the size of the
confidence intervals. In all analyses, the disconnected model
outperformed the connected model in terms of number of QTL and size of
confidence intervals. This superiority seems to be caused by the high
background dependencies of QTL effects in connected crosses, which
was revealed by a modified diallel analysis of the QTL effects.
We investigated the genetic architecture of grain yield, grain moisture,
adaptation to maturity zones, and flowering time. Our findings suggest that
all traits exhibit a complex genetic architecture with an absence of large
QTL effects. Some of the studied traits appear to be influenced by
epistasis, interactions between loci. In particular, for flowering time, the
two-dimensional scan for epistatic interactions suggested the presence of
digenic epistasis.
The absence of QTL with large effects suggests that marker-assisted
selection is not an appropriate tool to breed for adapted maize hybrids with
improved grain yield. Consequently, more suitable approaches for
complex traits such as genomic selection should be applied. The joint
analyses across populations resulted in higher QTL detection power and
resolution compared to single population analyses. Thus, for traits with a
less complex genetic architecture, MC-QTL mapping is a powerful tool for
the identification of robust diagnostic markers.
Zusammenfassung
28
Zusammenfassung
Mehrlinien-Kreuzungen (MK) wurden in der Literatur als vielversprechende
Ausgangspopulation zur Kartierung von quantitative trait loci (QTL) für
agronomisch wichtige Merkmale vorgeschlagen. Im Unterschied zu
Kartierungspopulationen, die auf einzelne biparentale Populationen
zurückgehen, lässt sich durch die Verwendung von MK die statistische
Güte der QTL-Detektion erhöhen, sowie die Lage der QTL und deren
Effektgröße präziser bestimmen. Zusätzlich ist es möglich, die in
Pflanzenzüchtungsprogrammen routinemäßig gesammelten Daten zu
verwenden.
Die Ziele der vorliegenden Arbeit waren (i) die Verlässlichkeit der
integrierten genetischen Karte im Vergleich zu den sechs genetischen
Kopplungskarten der Einzelpopulationen einzuschätzen, (ii) die Vorteile
der kombinierten QTL-Analyse durch die Anwendung von zwei MK-QTL
Kartierungs-Modellen, auch im Vergleich der Ergebnisse mit der
Einzelpopulationsanalyse, zu analysieren und (iii) die genetische
Architektur der Merkmale Kornertrag, Kornfeuchte, klimatische Anpassung
und Blühzeitpunkt zu untersuchen.
Der Versuch bestand aus sechs Populationen mit jeweiligen Größen
zwischen 109 und 150 Individuen. Das genetische Material entstammt
einem Mais-Elitepool, den die Firma Syngenta in Bad Salzuflen
bereitstellte. Die 788 Genotypen wurden mit 857 SNP Markern
genotypisiert und anhand dieser Ergebnisse wurde für jede Population
eine genetische Karte berechnet. Auf den genetischen Informationen der
Einzelpopulationen basierend wurde eine genetische Konsensuskarte
erstellt und deren Güte für die Verwendung in der QTL Studie getestet.
Die durchschnittliche Entfernung zwischen benachbarten Markern betrug
1.84 cM. Diese Markerdichte ist ausreichend und stellt keinen
limitierenden Faktor für die QTL-Analyse dar. Die berechneten
Heritabilitäten wurden für alle Merkmale als mittel bis hoch geschätzt.
Demzufolge sollte die Qualität der genotypischen sowie der
Zusammenfassung
29
phänotypischen Daten eine QTL-Analyse von ausreichender statistischer
Güte erlauben.
Es wurden zwei verschiedene Kartierungs-Modelle mit fixen
Alleleffekten verwendet. Während im nicht-verbundenen Modell QTL-
Effekte hierarchisch für jede spaltende Population anpasst werden,
werden im verbundenen Modell die Beziehungen zwischen den
Populationen berücksichtigt. In Bezug auf die QTL Detektionsrate, die
durch den QTL erklärte Varianz und die Größe der Vertrauensintervalle
zeigten beide Modelle bessere Ergebnisse im Vergleich zu den Analysen
der Einzelpopulationen. Im direkten Vergleich zwischen beiden Modellen
erzielte das nicht-verbundene Modell im Bezug auf die QTL Detektionsrate
und die Größe der Vertrauensintervalle die besten Ergebnisse. Die
bessere Leistung des nicht-verbundenen Modells kann durch die hohe
Abhängigkeit der QTL vom genetischen Hintergrund erklärt werden. Dies
wurde in einer veränderten Diallel-Analyse der QTL-Effekte offensichtlich.
In der vorliegenden Studie wurde die genetische Architektur der
Merkmale Kornertrag, Kornfeuchte, Anpassung an Reifezonen und
Blühzeitpunkt analysiert. Unsere Ergebnisse zeigen, dass alle der
untersuchten Merkmale eine sehr komplexe genetische Struktur
aufweisen. Bei keinem der Merkmale konnte ein großer QTL-Effekt
detektiert werden. Einige Merkmale scheinen von Epistasie, der
Interaktion zwischen Loci, beeinflusst zu sein. Insbesondere für den
Blühzeitpunkt deuten die Ergebnisse des zwei-dimensionalen Epistasie-
Tests auf signifikante digenische Interaktionen hin.
Das Fehlen von QTL mit großen Effekten weist darauf hin, dass die
marker-gestützte Selektion für die Züchtung von angepassten
Maishybriden mit verbessertem Kornertrag kein geeigneter Ansatz ist. Für
komplexe Merkmale sollten folglich passendere Ansätze wie die
genomische Selektion benutzt werden. Im Vergleich zur Analyse der
Einzelpopulationen erzielte die verbundene Analyse über Populationen
hinweg eine höhere Güte, QTL aufzufinden und eine präzisere

Zusammenfassung
30
Lagebestimmung der QTL. Demnach ist die MK-QTL Kartierung ein
leistungsfähiges Werkzeug für die Entwicklung robuster diagnostischer
Marker bei Merkmalen mit einer einfachen genetischen Architektur.

Acknowledgements
31
Acknowledgements
Foremost, I want to thank my advisor apl. Prof. Dr. Jochen C. Reif for
giving me the opportunity to work on this topic. I highly acknowledge his
strong support, helpful suggestions and advice during the time of my
studies and my thesis.
I am very grateful to Prof. Dr. Jörn Bennewitz and Prof. Dr. Hans-Peter
Piepho for serving on my graduate committee.
My sincere thanks go to Dr. Tobias Würschum, Dr. Hans Peter Maurer, Dr.
Wenxin Liu, Dr. Yusheng Zhao, Dr. Fritz Longin and Dr. Manje Gowda for
their help in many issues, professional support and valuable discussions.
Due to the pleasant working atmosphere, I had the possibility to learn a
lot.
I want to thank the team of Syngenta, represented by Dr. Denis
Lespinasse and Dr. Nicolas Ranc, for their support in any question about
the datasets and their fast handling of publications, posters and talks.
I highly appreciate many valuable discussions on the topic and the
datasets with the members of the Gabi Gain project. Special thanks go to
Prof. Dr. Utz for his time in dealing with many questions concerning QTL
mapping and statistics.
Many thanks to all my PhD colleagues in the institute and neighboring
institutes, I enjoyed working together with you. My sincere thanks go to all
the colleagues of the State Plant Breeding Institute - especially I want to
thank Beate Kurka and Susanne Meyer for their great help in
organizational matters.
I am very grateful to German Federal Ministry of Education and Research
(BMBF) for the financial support of this study.
Finally, I want to express my gratitude to my family, Gerrit and all my
friends for their unconditional support over the years of this thesis. Without
you, this thesis could have never been finished. Thank you!
Curriculum Vitae
32
Curriculum Vitae
Name Jana Steinhoff
Date and place of birth 08.02.1985 in Lennestadt, Germany
Education
March 2009 – June 2012 Doctorate candidate at the State Plant Breeding Institute, University of Hohenheim
October 2004 – March 2009 Studies of Agro-Biology, University of Hohenheim
August 2007 – December 2007 Erasmus semester at the University of Wageningen, The Netherlands
June 2004 High school degree (Abitur), Städtisches Gymnasium Lennestadt, Germany
Practical experience
January 2008 – April 2008 Research Assistant, CIMMYT, El Batan, Mexico
October 2006 – November 2008 Research Assistant, Institute of Plant Breeding, Seed Science and Populations Genetics, University of Hohenheim, Stuttgart, Germany
July 2006 – October 2006 Farm work on Demeter-Farm Gut Ostler, Bonn, Germany

33
Erklärung
Hiermit erkläre ich an Eides statt, dass die vorliegende Arbeit von mir
selbst verfasst und nur unter Zuhilfenahme der angegebenen Quellen und
Hilfsmittel angefertigt wurde. Dementsprechend wurden wörtlich oder
inhaltlich übernommene Stellen als solche gekennzeichnet.
Die vorliegende Arbeit wurde in gleicher oder ähnlicher Form noch keiner
anderen Institution oder Prüfungsbehörde vorgelegt.
Insbesondere erkläre ich, dass nicht zu einem früheren Zeitpunkt oder
gleichzeitig ein Antrag auf Eröffnung eines Promotionsverfahrens unter
Vorlage der hier eingereichten Dissertation gestellt wurde.
Stuttgart, im Oktober 2012
Jana Steinhoff