Embed Size (px)
Citation preview
298
The Journal of Phytopharmacology 2021; 10(5):298-315
Online at: www.phytopharmajournal.com
Research Article
ISSN 2320-480X
JPHYTO 2021; 10(5): 298-315
September- October
Received: 16-07-2021
Accepted: 09-08-2021
©2021, All rights reserved
doi: 10.31254/phyto.2021.10505
Kunjan Shah
Department of Toxicology, Jai Research
Foundation, Vapi, Gujarat, India
Sudhakar Jadhav
Department of Toxicology, Jai Research
Foundation, Vapi, Gujarat, India
Manish Patel
Department of Toxicology, Jai Research
Foundation, Vapi, Gujarat, India
Jaydip Mistry
Department of Toxicology, Jai Research
Foundation, Vapi, Gujarat, India
Akashrao Shinde
Department of Toxicology, Jai Research
Foundation, Vapi, Gujarat, India
Liliya Mito
The Mitomasa SDN BHD, Selangor
D.E., Malaysia
Kanchan Khare
Department of Toxicology, Jai Research
Foundation, Vapi, Gujarat, India
Correspondence: Kunjan Shah
Department of Toxicology, Jai Research
Foundation, Vapi, Gujarat, India
Email: [email protected]
Safety Assessment of TGT Primaage using Wistar Rats
through Oral Gavage Administration
Kunjan Shah, Sudhakar Jadhav, Manish Patel, Jaydip Mistry, Akashrao Shinde, Liliya Mito, Kanchan
Khare
ABSTRACT
TGT Primaage is one of the astonishing extracts, obtained from a combination of Moringa oleifera and
Centella asiatica. At present, there is no finding reported regardin g the repeated exposure of this extract.
This study investigates the No Observed Adverse Effect Level (NOAEL) and effects of repeated-dose
administration of Astragalin and Isoquercetin (components of interest) present in TGT Primaage on
Wistar rats. Rats were divided into 3 treatment and a control group (10 rats/sex/group). To assess
reversibility, persistence, or delayed effect, additional control and high dose groups were treated
similarly and observed further without any treatment. TGT Primaage was administered orally, through
gavage for 90 days, at 0, 250, 500, and 1000 mg/kg body weight/day. No mortality, morbidity, and
clinical sign of toxicity was observed. Abnormality related to neurological and functional parameters
was not seen. No change in body weight and food consumption was observed. Treatment did not lead to
any adverse effect in clinical pathology parameters and organ weights. TGT Primaage did not alter
morphological and histopathological characteristics of organs. From these results, it is evident that TGT
Primaage appears to be safe and devoid of any toxicity. The No Observed Adverse Effect Level
(NOAEL) of TGT Primaage for both sexes were found to be 1000 mg/kg body weight/day.
Keywords: TGT Primaage, Wistar rats, Sub-acute toxicity, Sub-chronic toxicity, Astragalin, Isoquercitrin.
INTRODUCTION
Natural products are infinite treasures of bioactive chemicals which persist as an inexhaustible resource
for the discovery of drugs and exploration of their undefined activities. It is estimated that herbal
medicines have been traditionally used for the treatment purpose by more than a quarter of the world
population as a basis for primary health care. Performing herbal toxicity is a need to dissect favourable
from adverse effects, to identify active principles in medicinal plants and to ban poisonous or toxic
contents from herbal mixtures. TGT Primaage is a combination of Moringa oleifera and Centella
asiatica leaves extracts [1]. This abstract has been claimed to have high antioxidant and antiaging activity
apart from a broad range of biological functions including anti-inflammatory, anti-cancer,
hepatoprotective, and neuroprotective function [2]. Besides, many studies have revealed its therapeutic
value including anti-diabetes, anti-rheumatoid arthritis, anti-atherosclerosis, anti-infertility, pain relief,
anti-depression, diuretic, and thyroid regulation [2].
Moringa oleifera is referred to as the ‘drumstick tree’, ‘miracle tree’, ‘horseradish tree’, and ‘kelor tree’ [3]. This plant belongs to the family of Moringaceae and is widely cultivated in Asian and African
countries [4]. The leaves of this plant have been used traditionally in the treatment of constipation,
headache, arthritis, diabetes, hypertension, and typhoid fever [3]. Phytochemical screening of this plant
contains many constituents such as flavonoid, terpenoids, saponin, and tannins [3].
Centella asiatica also known as ‘Pegaga’ in Malaysian, belongs to the Apiaceae family. It grows widely
in Asia (mainly in India, Pakistan), Madagascar, Africa, Central America, and in the tropical region of
Oceania [5]. This herb is recommended for the treatment of various skin conditions such as leprosy,
lupus, varicose ulcers, eczema, and psoriasis. It is also used in diarrhoea, fever, amenorrhea, anxiety,
cognition, and female genitourinary tract diseases [6]. Considering the broad use of these herbs either as a
stand alone or in combination, evaluation of safety is the prime force to perform the toxicological study.
Here, the study investigates the systemic toxicity and adverse effects of Astragalin and Isoquercetin
(components of interest) present in TGT Primaage after repeated-dose administration in Wistar rats
according to the criteria mentioned in the EMA guideline [7].
Ethical Consideration: Project proposal for the experimentation was approved by the “Institutional
Animal Ethics Committee (IAEC)”, Jai Research Foundation. The study was undertaken in compliance
with the guidelines of the “Association for Assessment and Accreditation of Laboratory Rat Care
The Journal of Phytopharmacology
299
(AAALAC), USA” and “Guidelines for Laboratory Rats Facility”
issued by the Committee for the Purpose of Control and Supervision
of Experiments on Rats (CPCSEA), India. All the studies were
performed in accordance with OECD Principles on Good Laboratory
Practice (GLP) and EMA guideline [8].
MATERIALS AND METHODS
TGT Primage details:
Batch Number MOR/EXT/260216
Analysed Purity Isoquercetin: 2.06%; Astragalin: 0.74%
Manufactured by The Mitomasa SDN BHD, Malaysia
Supplied by The Mitomasa SDN BHD, Malaysia
Date of Manufacture February 26, 2016
Date of Expiry February 25, 2019
Appearance Dark golden-red powder
Storage Condition In original container as supplied at ambient
condition
The phytochemical analysis of leaves extract of Moringa oleifera
plant signifies the presence of alkaloids, steroids and flavonoids in
adequate quantity according to preliminary phytochemical analysis [9]
while Phenols and flavonoids are present in hydroalcoholic extract of
Centella asiatica [5].
Animals
Healthy, young adult male and female rats (Rattus norvegicus) of
Wistar (RccHan: WIST) strain (5 to 8 weeks of age) were obtained
from the Animal Breeding Facility (ABF), JRF, India. Nulliparous
and non-pregnant female rats were used for the experiment. Rats were
acclimatised for 7 days before randomisation. The body weight
variation among the rats was within ±20% of the mean body weight
for each sex.
Housing
Rats were maintained in temperature (22 ± 3 °C) and humidity (30 to
70%) controlled room, with the photoperiod of 12 h light/dark cycle
(light hours were 06.00 - 18.00 h). Light intensity was maintained
between 130 and 325 LUX and air changes were minimum 15 per
hour. Rats were housed in groups of 2 rats/cage/sex in sterile
prolypropylene cages with bedding material. Feed and water were
provided ad libitum to rats. Environmental enrichment material was
also provided to rats in each cage. Cages were placed on 5 tier racks
and cage rotation was performed at weekly intervals to ensure almost
similar environmental conditions to different groups.
Experimental design
The dose formulation of test item in vehicle (RO water) was
administered through oral gavage at three graduated dose levels (G2,
G3, and G4) to male and female Wistar rats for a period of 28 and 90
consecutive days in 28 day and 90 days study, respectively. Rats from
a concurrent vehicle control groups (G1) received RO water only.
To assess reversibility, persistence or delayed occurrence of toxic
effects, an additional group (G6) was treated at the high dose level for
28 and 90 days and then observed further for a period of 14 and 28
days without any treatment in 28 day and 90 days study, respectively.
For comparison purposes, a vehicle control recovery group (G5) was
treated with vehicle alone over the equivalent period (28 and 90 days)
and observed further for 14 and 28 days. Each group consisted of 10
male and 10 female rats. Rats were treated with three dose levels (low
dose at 250, mid dose at 500 and high dose at 1000 mg/kg b. wt./day)
in both study (Table 1). A constant dose volume of 10 mL/kg b. wt.
was used and individual dose was adjusted according to the most
recently recorded body weight of each rat.
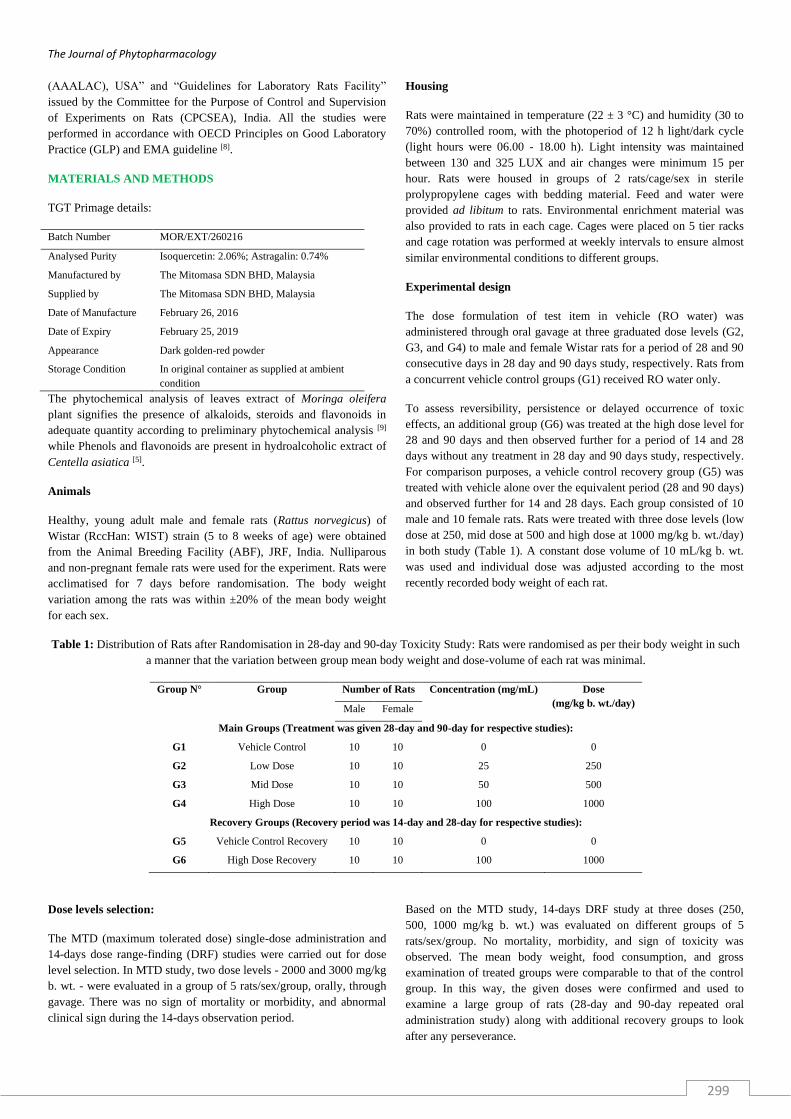
Table 1: Distribution of Rats after Randomisation in 28-day and 90-day Toxicity Study: Rats were randomised as per their body weight in such
a manner that the variation between group mean body weight and dose-volume of each rat was minimal.
Group N° Group Number of Rats Concentration (mg/mL) Dose
(mg/kg b. wt./day) Male Female
Main Groups (Treatment was given 28-day and 90-day for respective studies):
G1 Vehicle Control 10 10 0 0
G2 Low Dose 10 10 25 250
G3 Mid Dose 10 10 50 500
G4 High Dose 10 10 100 1000
Recovery Groups (Recovery period was 14-day and 28-day for respective studies):
G5 Vehicle Control Recovery 10 10 0 0
G6 High Dose Recovery 10 10 100 1000
Dose levels selection:
The MTD (maximum tolerated dose) single-dose administration and
14-days dose range-finding (DRF) studies were carried out for dose
level selection. In MTD study, two dose levels - 2000 and 3000 mg/kg
b. wt. - were evaluated in a group of 5 rats/sex/group, orally, through
gavage. There was no sign of mortality or morbidity, and abnormal
clinical sign during the 14-days observation period.
Based on the MTD study, 14-days DRF study at three doses (250,
500, 1000 mg/kg b. wt.) was evaluated on different groups of 5
rats/sex/group. No mortality, morbidity, and sign of toxicity was
observed. The mean body weight, food consumption, and gross
examination of treated groups were comparable to that of the control
group. In this way, the given doses were confirmed and used to
examine a large group of rats (28-day and 90-day repeated oral
administration study) along with additional recovery groups to look
after any perseverance.
The Journal of Phytopharmacology
300
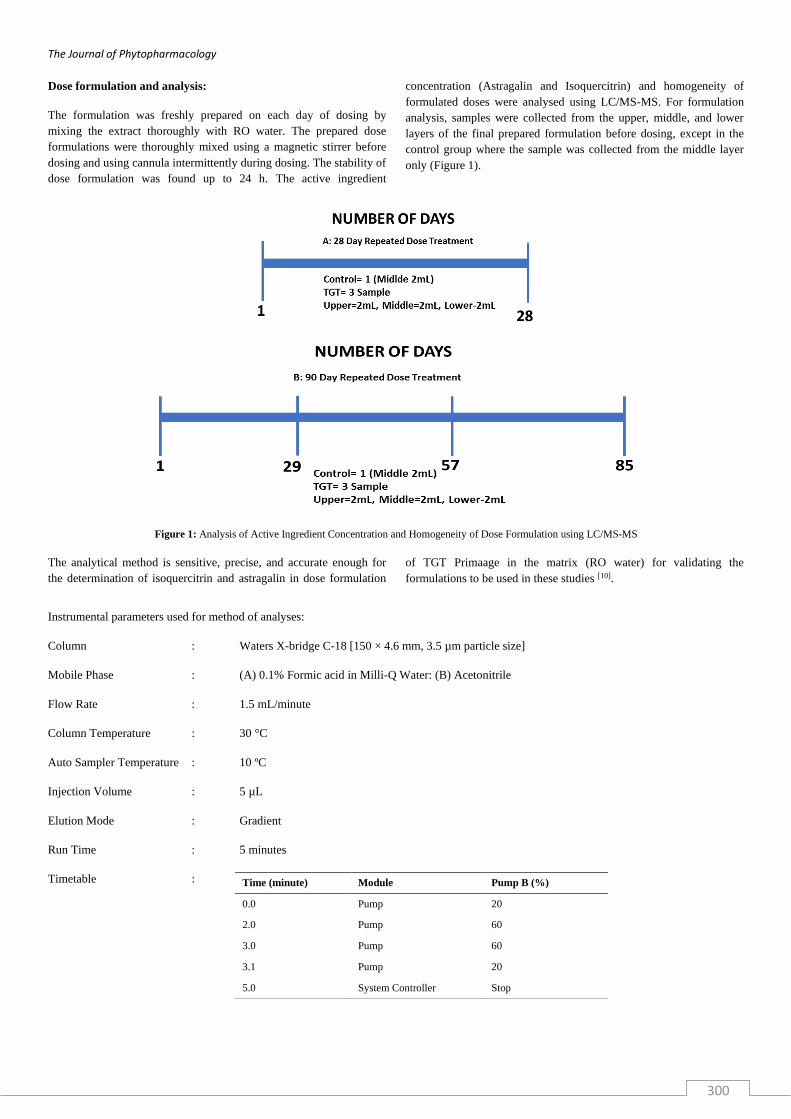
Dose formulation and analysis:
The formulation was freshly prepared on each day of dosing by
mixing the extract thoroughly with RO water. The prepared dose
formulations were thoroughly mixed using a magnetic stirrer before
dosing and using cannula intermittently during dosing. The stability of
dose formulation was found up to 24 h. The active ingredient
concentration (Astragalin and Isoquercitrin) and homogeneity of
formulated doses were analysed using LC/MS-MS. For formulation
analysis, samples were collected from the upper, middle, and lower
layers of the final prepared formulation before dosing, except in the
control group where the sample was collected from the middle layer
only (Figure 1).
Figure 1: Analysis of Active Ingredient Concentration and Homogeneity of Dose Formulation using LC/MS-MS
The analytical method is sensitive, precise, and accurate enough for
the determination of isoquercitrin and astragalin in dose formulation
of TGT Primaage in the matrix (RO water) for validating the
formulations to be used in these studies [10].
Instrumental parameters used for method of analyses:
Column : Waters X-bridge C-18 [150 × 4.6 mm, 3.5 µm particle size]
Mobile Phase : (A) 0.1% Formic acid in Milli-Q Water: (B) Acetonitrile
Flow Rate : 1.5 mL/minute
Column Temperature : 30 °C
Auto Sampler Temperature : 10 ºC
Injection Volume : 5 µL
Elution Mode : Gradient
Run Time : 5 minutes
Timetable :
Time (minute) Module Pump B (%)
0.0 Pump 20
2.0 Pump 60
3.0 Pump 60
3.1 Pump 20
5.0 System Controller Stop
The Journal of Phytopharmacology
301
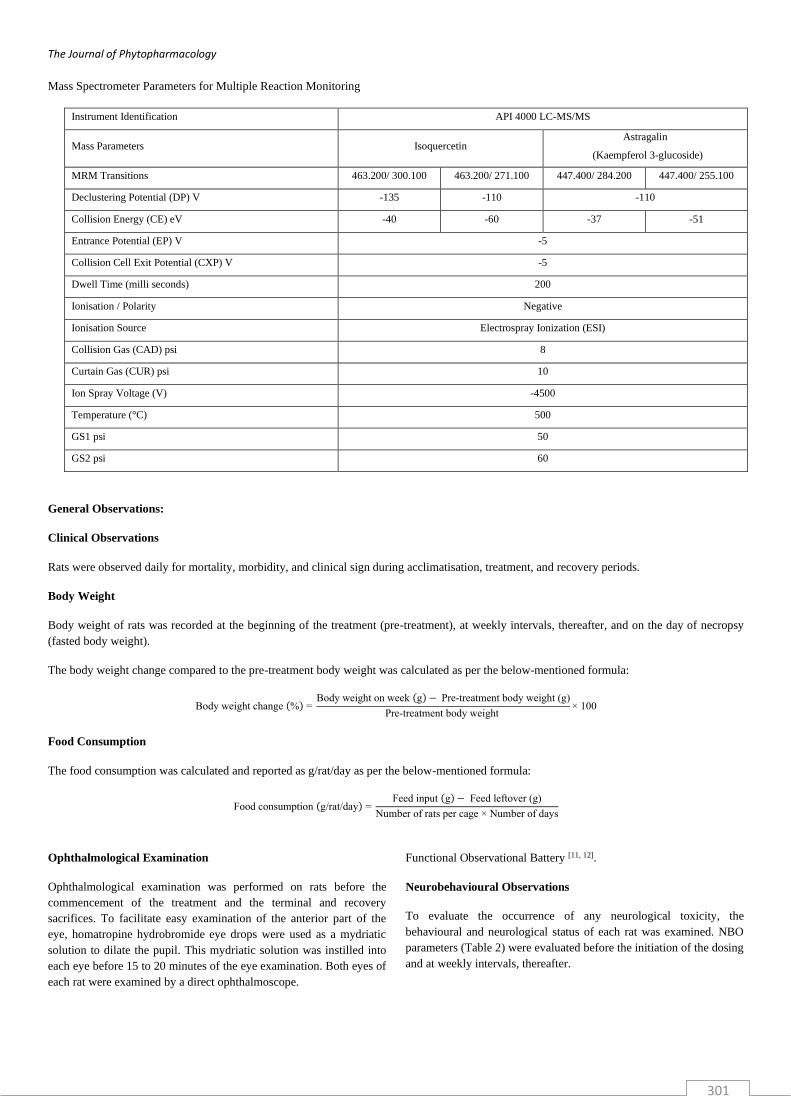
Mass Spectrometer Parameters for Multiple Reaction Monitoring
Instrument Identification API 4000 LC-MS/MS
Mass Parameters Isoquercetin Astragalin
(Kaempferol 3-glucoside)
MRM Transitions 463.200/ 300.100 463.200/ 271.100 447.400/ 284.200 447.400/ 255.100
Declustering Potential (DP) V -135 -110 -110
Collision Energy (CE) eV -40 -60 -37 -51
Entrance Potential (EP) V -5
Collision Cell Exit Potential (CXP) V -5
Dwell Time (milli seconds) 200
Ionisation / Polarity Negative
Ionisation Source Electrospray Ionization (ESI)
Collision Gas (CAD) psi 8
Curtain Gas (CUR) psi 10
Ion Spray Voltage (V) -4500
Temperature (°C) 500
GS1 psi 50
GS2 psi 60
General Observations:
Clinical Observations
Rats were observed daily for mortality, morbidity, and clinical sign during acclimatisation, treatment, and recovery periods.
Body Weight
Body weight of rats was recorded at the beginning of the treatment (pre-treatment), at weekly intervals, thereafter, and on the day of necropsy
(fasted body weight).
The body weight change compared to the pre-treatment body weight was calculated as per the below-mentioned formula:
Body weight change (%) = Body weight on week (g) − Pre-treatment body weight (g)
Pre-treatment body weight × 100
Food Consumption
The food consumption was calculated and reported as g/rat/day as per the below-mentioned formula:
Food consumption (g/rat/day) = Feed input (g) − Feed leftover (g)
Number of rats per cage × Number of days
Ophthalmological Examination
Ophthalmological examination was performed on rats before the
commencement of the treatment and the terminal and recovery
sacrifices. To facilitate easy examination of the anterior part of the
eye, homatropine hydrobromide eye drops were used as a mydriatic
solution to dilate the pupil. This mydriatic solution was instilled into
each eye before 15 to 20 minutes of the eye examination. Both eyes of
each rat were examined by a direct ophthalmoscope.
Functional Observational Battery [11, 12].
Neurobehavioural Observations
To evaluate the occurrence of any neurological toxicity, the
behavioural and neurological status of each rat was examined. NBO
parameters (Table 2) were evaluated before the initiation of the dosing
and at weekly intervals, thereafter.
The Journal of Phytopharmacology
302
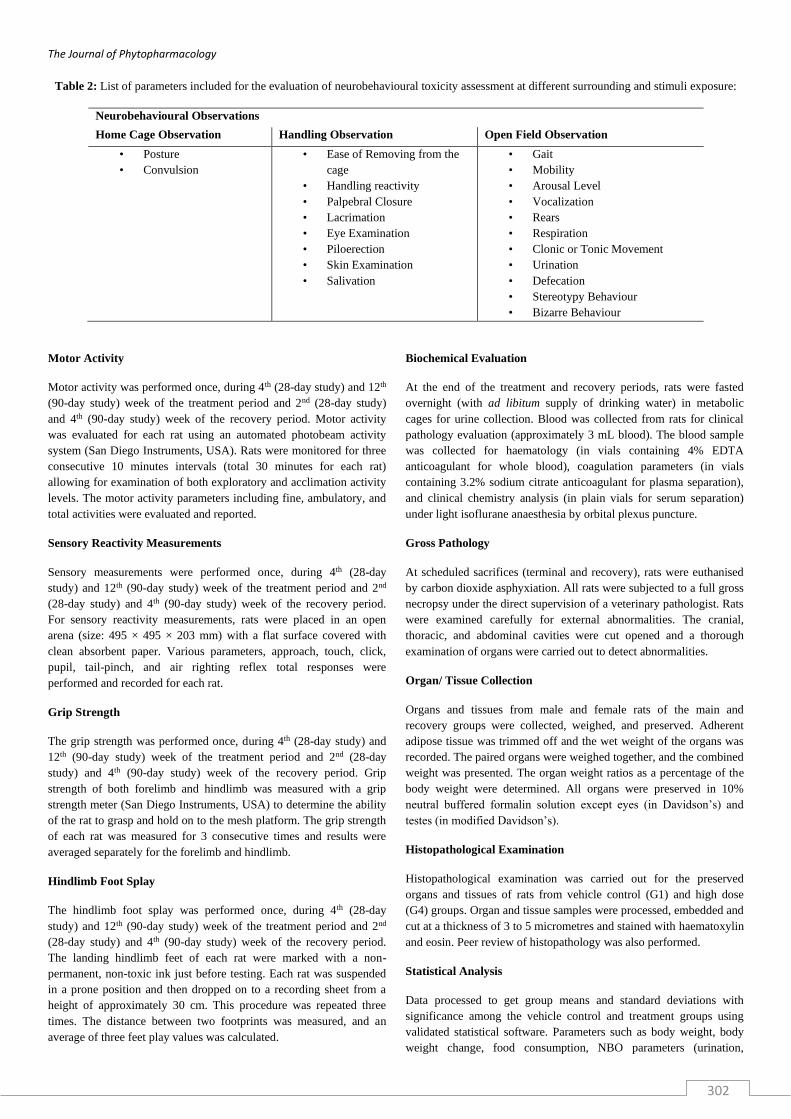
Table 2: List of parameters included for the evaluation of neurobehavioural toxicity assessment at different surrounding and stimuli exposure:
Neurobehavioural Observations
Home Cage Observation Handling Observation Open Field Observation
• Posture
• Convulsion
• Ease of Removing from the
cage
• Handling reactivity
• Palpebral Closure
• Lacrimation
• Eye Examination
• Piloerection
• Skin Examination
• Salivation
• Gait
• Mobility
• Arousal Level
• Vocalization
• Rears
• Respiration
• Clonic or Tonic Movement
• Urination
• Defecation
• Stereotypy Behaviour
• Bizarre Behaviour
Motor Activity
Motor activity was performed once, during 4th (28-day study) and 12th
(90-day study) week of the treatment period and 2nd (28-day study)
and 4th (90-day study) week of the recovery period. Motor activity
was evaluated for each rat using an automated photobeam activity
system (San Diego Instruments, USA). Rats were monitored for three
consecutive 10 minutes intervals (total 30 minutes for each rat)
allowing for examination of both exploratory and acclimation activity
levels. The motor activity parameters including fine, ambulatory, and
total activities were evaluated and reported.
Sensory Reactivity Measurements
Sensory measurements were performed once, during 4th (28-day
study) and 12th (90-day study) week of the treatment period and 2nd
(28-day study) and 4th (90-day study) week of the recovery period.
For sensory reactivity measurements, rats were placed in an open
arena (size: 495 × 495 × 203 mm) with a flat surface covered with
clean absorbent paper. Various parameters, approach, touch, click,
pupil, tail-pinch, and air righting reflex total responses were
performed and recorded for each rat.
Grip Strength
The grip strength was performed once, during 4th (28-day study) and
12th (90-day study) week of the treatment period and 2nd (28-day
study) and 4th (90-day study) week of the recovery period. Grip
strength of both forelimb and hindlimb was measured with a grip
strength meter (San Diego Instruments, USA) to determine the ability
of the rat to grasp and hold on to the mesh platform. The grip strength
of each rat was measured for 3 consecutive times and results were
averaged separately for the forelimb and hindlimb.
Hindlimb Foot Splay
The hindlimb foot splay was performed once, during 4th (28-day
study) and 12th (90-day study) week of the treatment period and 2nd
(28-day study) and 4th (90-day study) week of the recovery period.
The landing hindlimb feet of each rat were marked with a non-
permanent, non-toxic ink just before testing. Each rat was suspended
in a prone position and then dropped on to a recording sheet from a
height of approximately 30 cm. This procedure was repeated three
times. The distance between two footprints was measured, and an
average of three feet play values was calculated.
Biochemical Evaluation
At the end of the treatment and recovery periods, rats were fasted
overnight (with ad libitum supply of drinking water) in metabolic
cages for urine collection. Blood was collected from rats for clinical
pathology evaluation (approximately 3 mL blood). The blood sample
was collected for haematology (in vials containing 4% EDTA
anticoagulant for whole blood), coagulation parameters (in vials
containing 3.2% sodium citrate anticoagulant for plasma separation),
and clinical chemistry analysis (in plain vials for serum separation)
under light isoflurane anaesthesia by orbital plexus puncture.
Gross Pathology
At scheduled sacrifices (terminal and recovery), rats were euthanised
by carbon dioxide asphyxiation. All rats were subjected to a full gross
necropsy under the direct supervision of a veterinary pathologist. Rats
were examined carefully for external abnormalities. The cranial,
thoracic, and abdominal cavities were cut opened and a thorough
examination of organs were carried out to detect abnormalities.
Organ/ Tissue Collection
Organs and tissues from male and female rats of the main and
recovery groups were collected, weighed, and preserved. Adherent
adipose tissue was trimmed off and the wet weight of the organs was
recorded. The paired organs were weighed together, and the combined
weight was presented. The organ weight ratios as a percentage of the
body weight were determined. All organs were preserved in 10%
neutral buffered formalin solution except eyes (in Davidson’s) and
testes (in modified Davidson’s).
Histopathological Examination
Histopathological examination was carried out for the preserved
organs and tissues of rats from vehicle control (G1) and high dose
(G4) groups. Organ and tissue samples were processed, embedded and
cut at a thickness of 3 to 5 micrometres and stained with haematoxylin
and eosin. Peer review of histopathology was also performed.
Statistical Analysis
Data processed to get group means and standard deviations with
significance among the vehicle control and treatment groups using
validated statistical software. Parameters such as body weight, body
weight change, food consumption, NBO parameters (urination,
The Journal of Phytopharmacology
303
defecation, and rearing), FOB parameters (motor activity, grip
strength, and foot splay), organ weight, relative organ weight, and
clinical pathology (haematology, clinical chemistry, and some
urinalysis) were subjected to Bartlett’s test to meet the homogeneity
of variance before conducting Analysis of Variance (ANOVA) and
Dunnett’s test. Where data do not meet the homogeneity of variance,
F-test was performed before conducting t-tests to calculate
significance [13]. The motor activity counts were subjected to square
root transformation to homogenise the data for statistical
implementation. All analyses and comparisons were evaluated at the
5% (P≤0.05) and 1% (P≤0.01) levels.
RESULTS
The active ingredients (isoquercetin and astragalin) concentration and
homogeneity analysis in 28-day and 90-day studies were within an
acceptable range of ±15% of the nominal concentration and %CV <
10.
Rats were healthy throughout the study period from the vehicle
control and treatment groups. There was no change in body weight
and food consumption until the termination of both studies.
Ophthalmological examination conducted during the pre-treatment
period and towards sacrifices (main and recovery groups) in both
studies did not reveal any abnormality in rats.
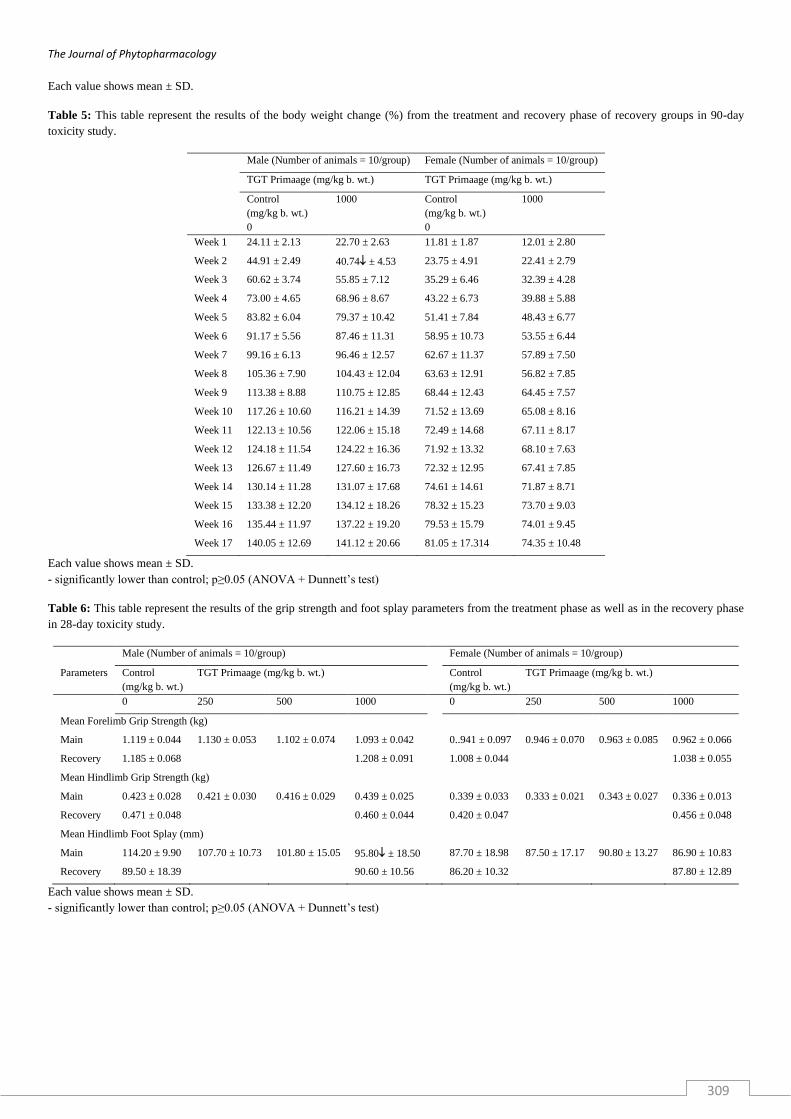
Profound functional observation battery was conducted, with manual
handling and different surrounding stimuli exposure from less
stressful to high traumatic parametric analysis to identify any
treatment-related anomaly on behaviour. In a 28-day study,
statistically, a significant decrease was observed in foot splay of male
rats from high dose group when compared with that of the vehicle
control group which could not be considered as a treatment-related
effect in the absence of other supporting findings of neuromuscular
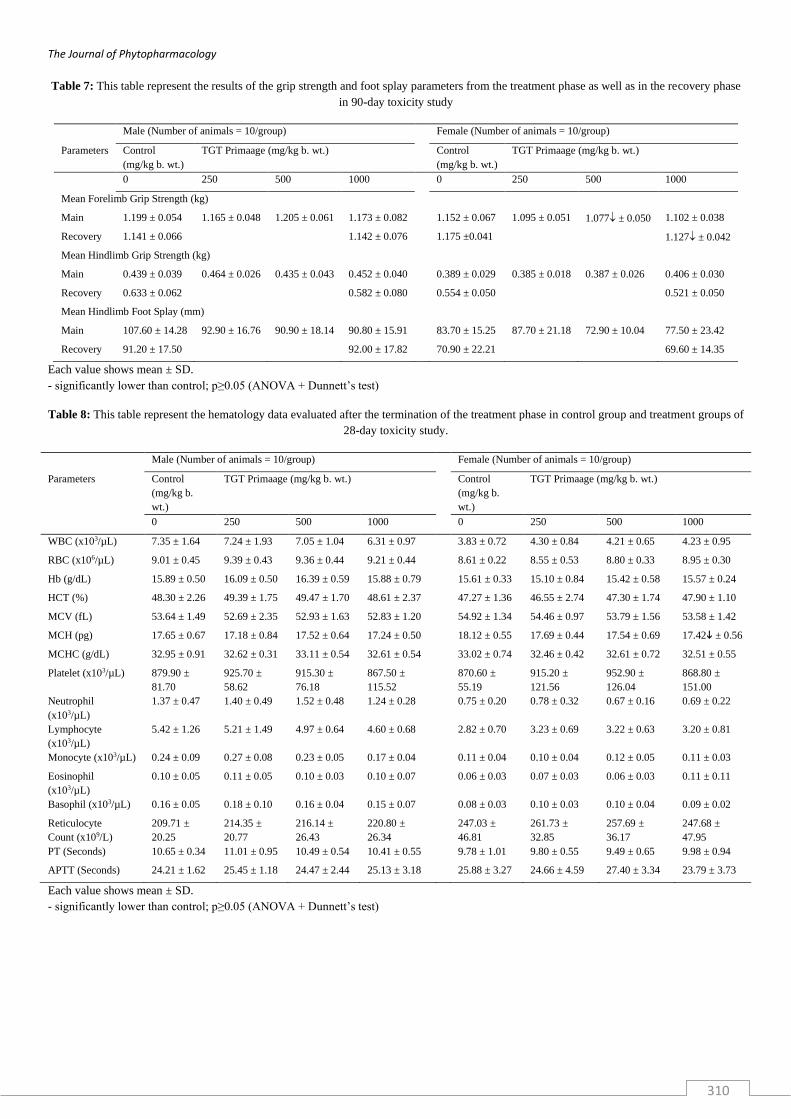
parameters (grip strength and motor activity). In a 90-day study,
forelimb grip strength values of female rats were statistically
decreased. These changes could not be considered as the test item
related effect due to either lack of dose-dependency or lack of similar
effect in main groups.
TGT Primaage treatment did not lead to any significant alteration in
haematology, coagulation, clinical chemistry, and urinalysis
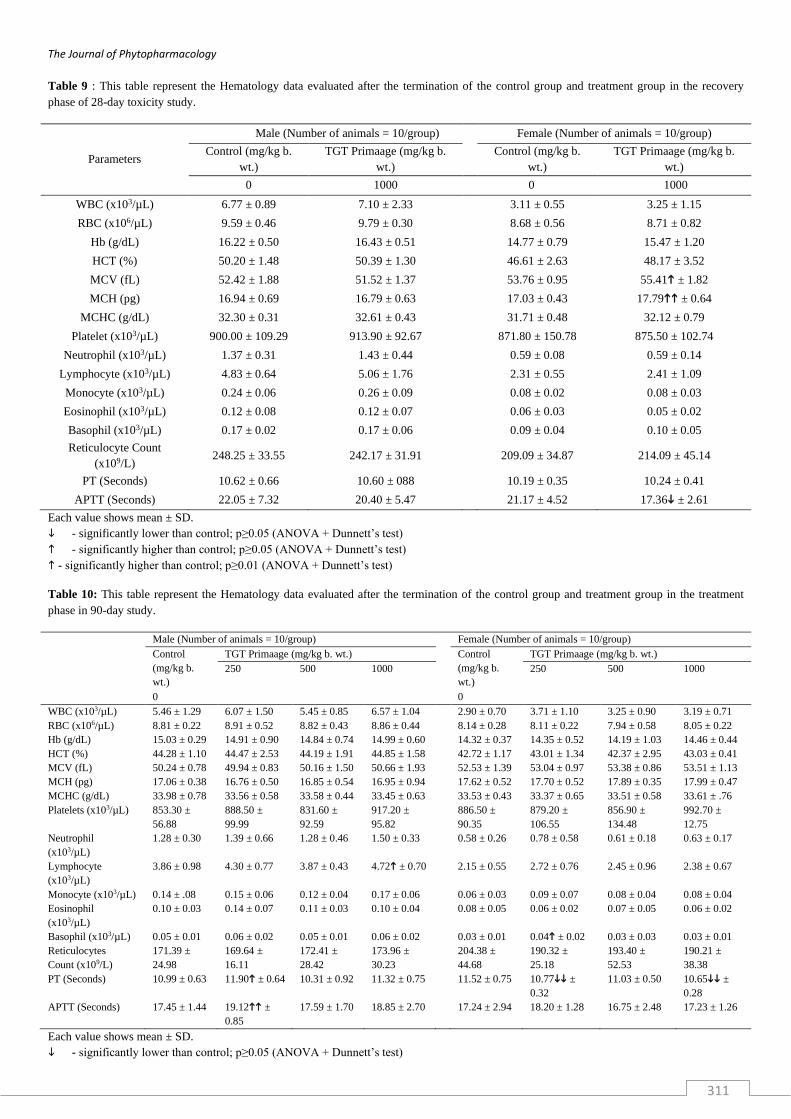
parameters. In a 28-day study, noted statistically significant alterations
[decrease in MCH values in high dose group (1000 mg/kg b. wt.)
female rats and increase in MCV and MCH in high dose recovery
group (1000 mg/kg b. wt.) female rats] were not treatment related due
to an absence of consistency between sexes and lack of effects in
other related parameters (haemoglobin, haematocrit, and RBC count).
Similarly, significant decrease noted in APTT in high dose recovery
group female rats was not related to treatment due to absence of the
effect in high dose (at the end of treatment period) and lack of
consistency between sexes.
In a 90-day study, a statistically significant increase was observed in
lymphocytes of G4 male rats which was not considered related to the
test item treatment due to lack of consistency between sexes.
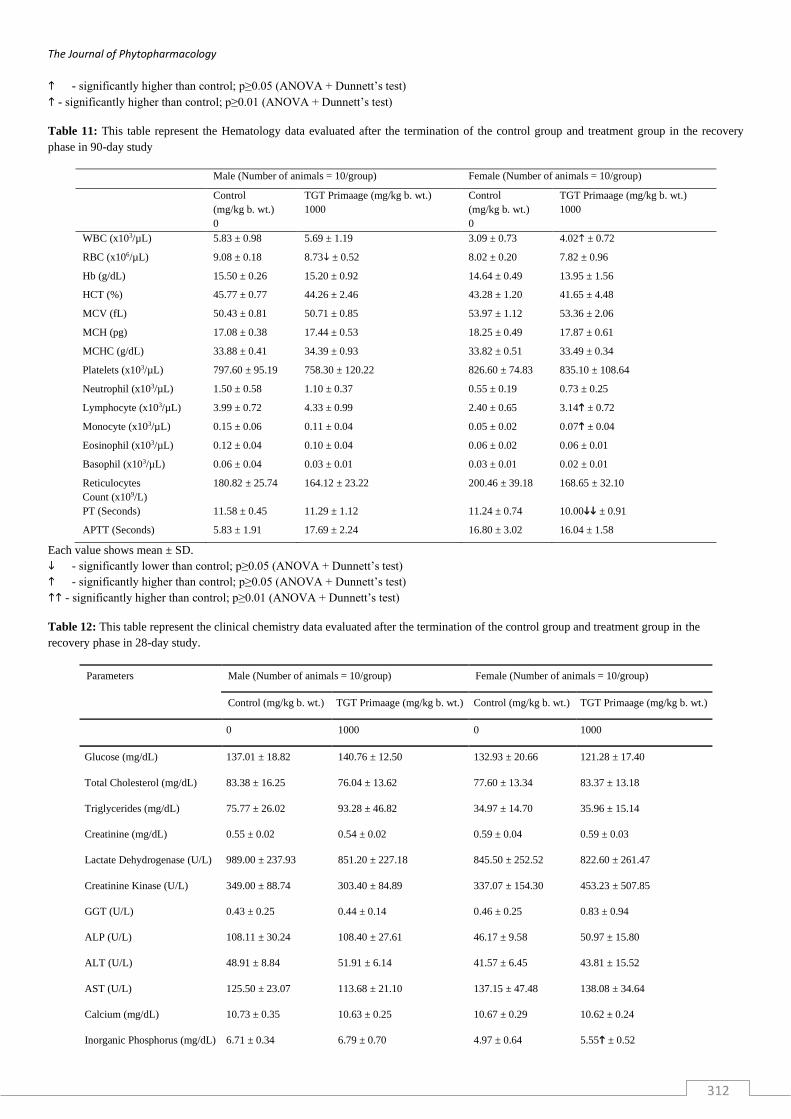
Statistically significant increases were observed in PT and APTT (G2
male rats), and basophil (G2 female rats). Statistically, significant
decreases were observed in PT of G2 and G4 female rats. These
alterations were considered unrelated to the test item treatment due to
lack of dose-dependency and inconsistency between sexes. In high
dose recovery group, a statistically significant decrease was observed
in RBC in males, PT in female rats and a statistically significant
increase was observed in monocyte, WBC and lymphocytes in female
rats. These alterations were not considered related to the test item
treatment due to the absence of effects at the end of treatment and/or
consistency between sexes.
In a 28-day study, the statistically significant increase observed in
inorganic phosphorus in high dose recovery group (1000 mg/kg b.
wt.) in female rats was considered as unrelated to treatment, due to
lack of consistency between sexes and absence of similar findings in
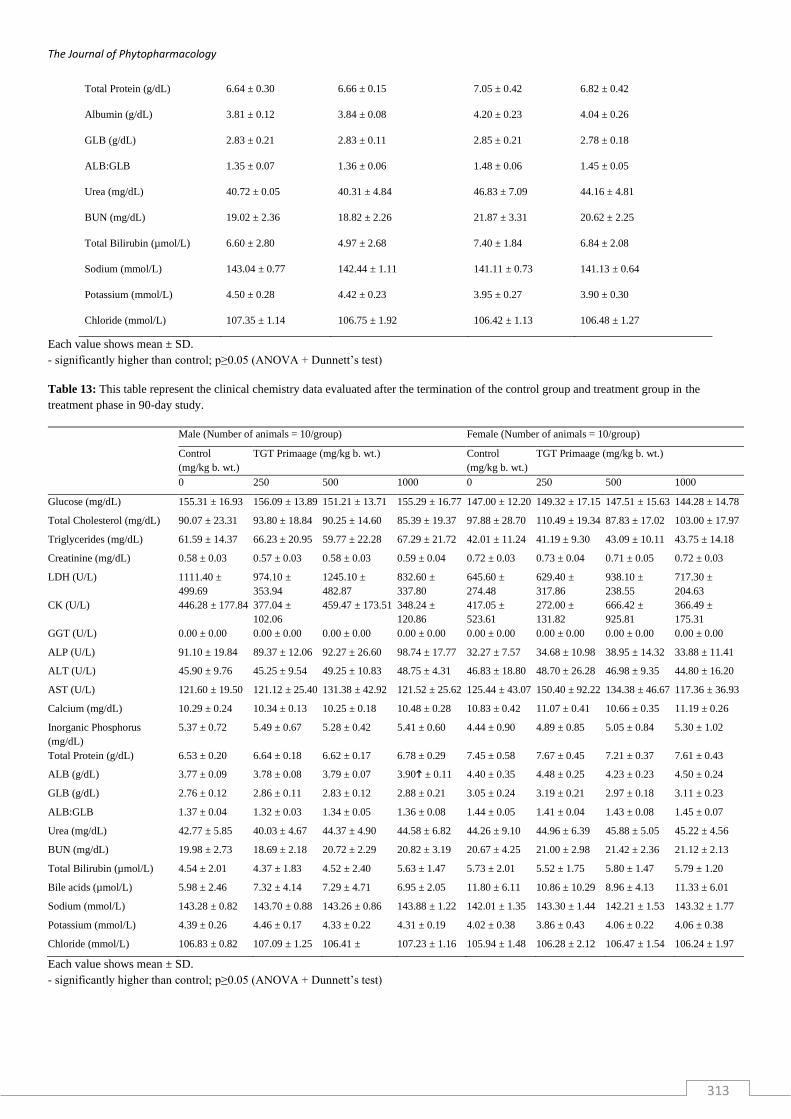
high dose (at the end of the treatment period. In a 90-day study, a
statistically significant increase was observed in albumin in male rats
(G4) which was considered unrelated to the test item treatment, due to
the lack of consistency between sexes. Statistically, a significant
increase was observed in ALT in male rats (G6), which was
considered unrelated to test item treatment due to lack of effect at the
end of treatment and lack of consistency between sexes.
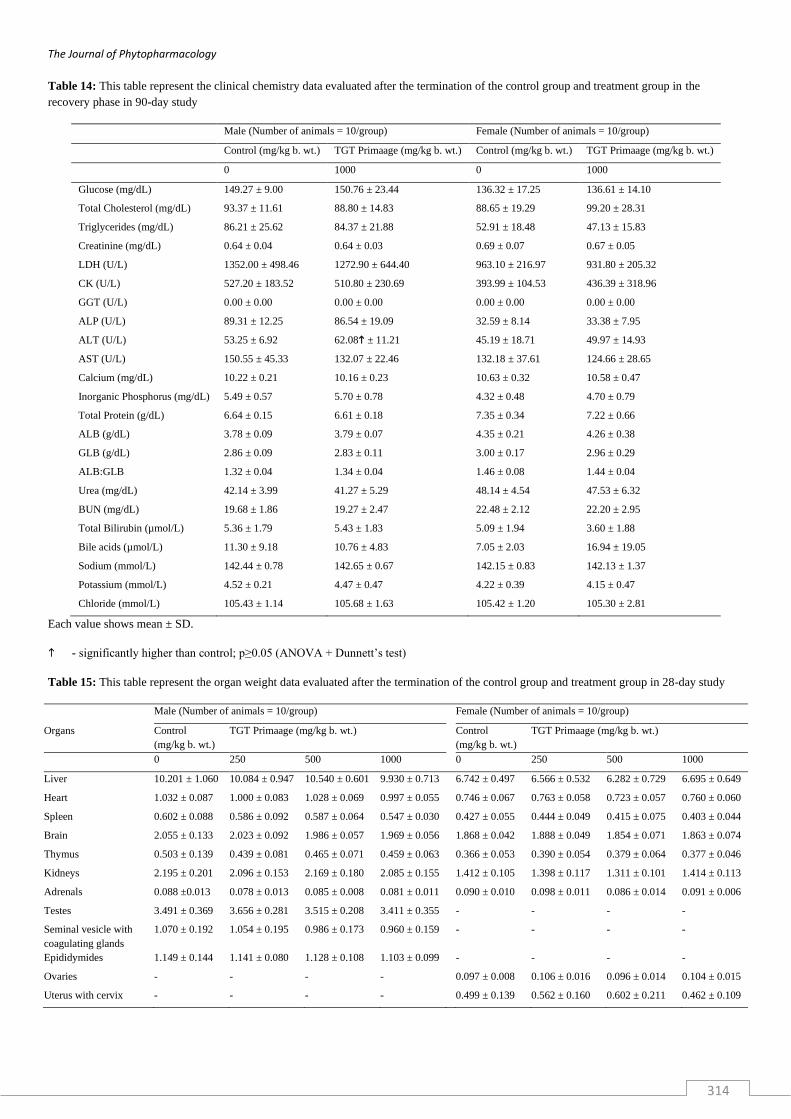
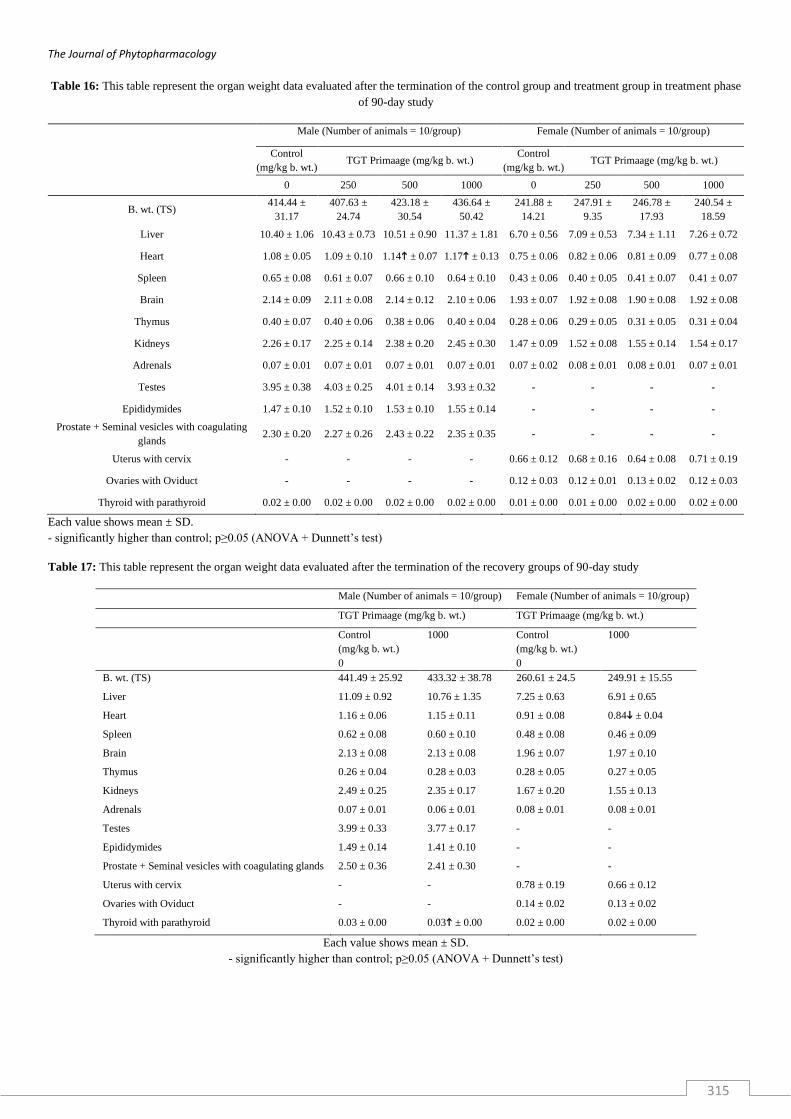
TGT Primaage did not show any treatment-related variation in the
terminal body weight. The absolute and relative weight of different
organs measured during sacrifices did not show any significant
findings or consequence.
An external and internal examination of rats from either sex across
various groups did not show any treatment-related abnormality.
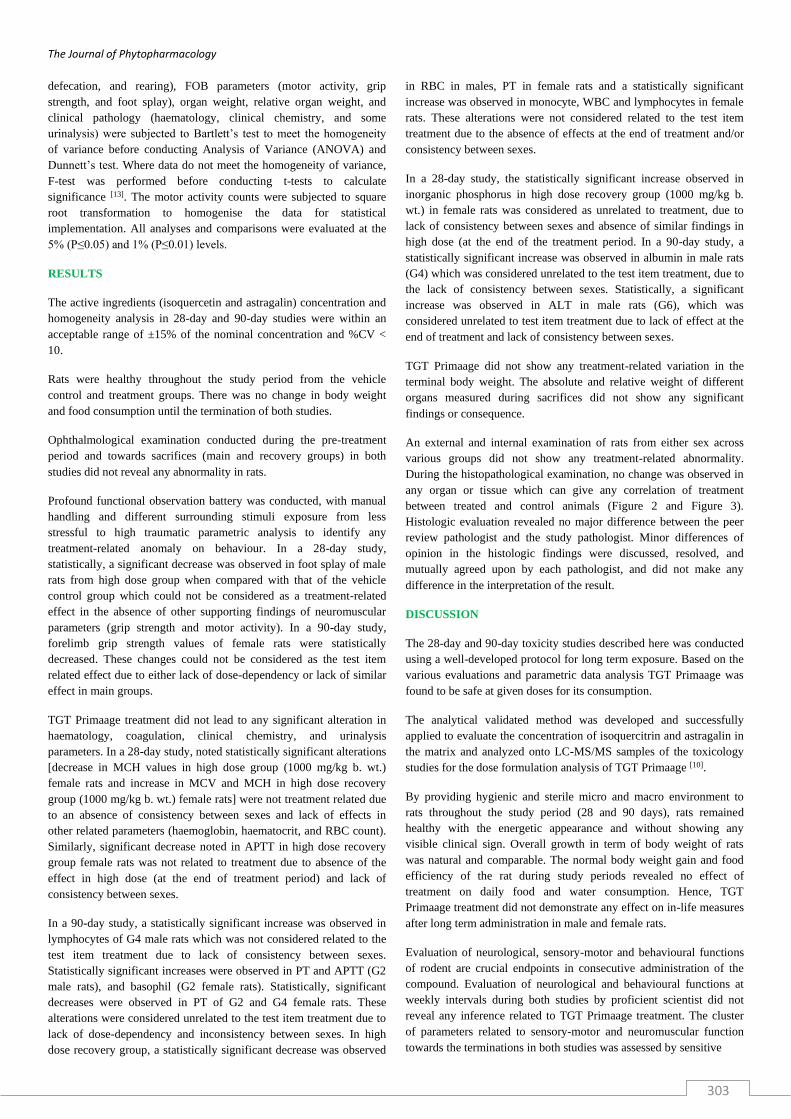
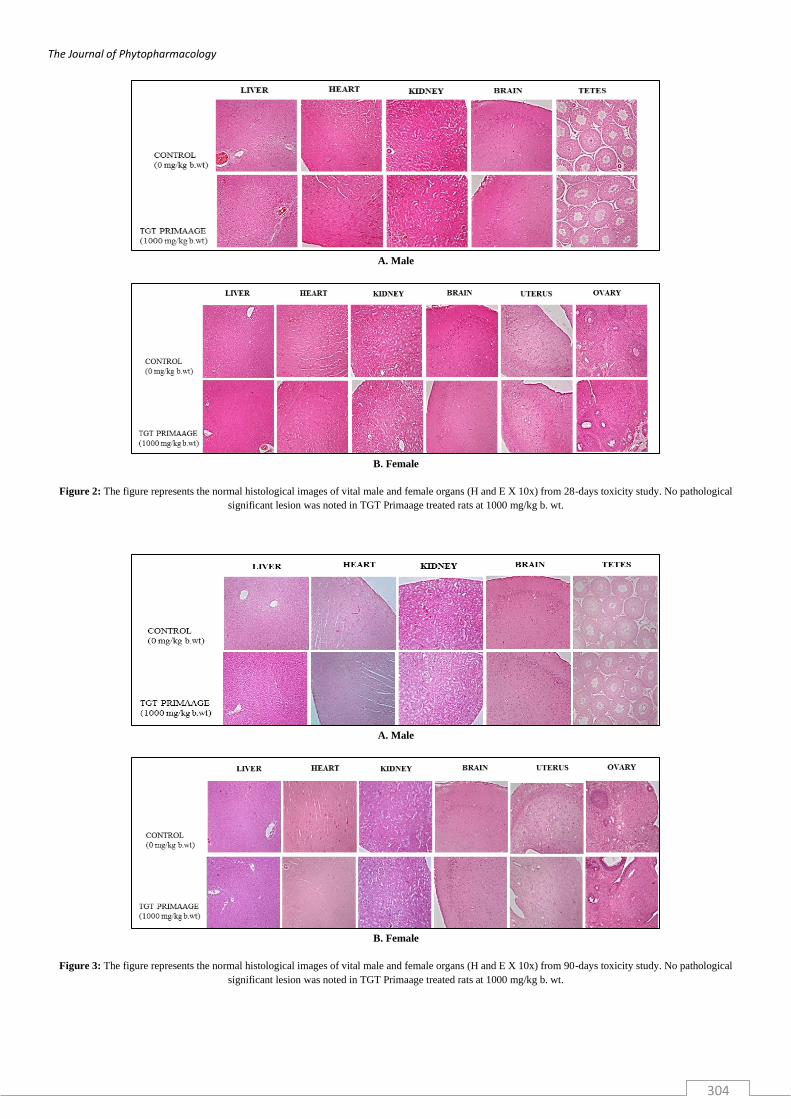
During the histopathological examination, no change was observed in
any organ or tissue which can give any correlation of treatment
between treated and control animals (Figure 2 and Figure 3).
Histologic evaluation revealed no major difference between the peer
review pathologist and the study pathologist. Minor differences of
opinion in the histologic findings were discussed, resolved, and
mutually agreed upon by each pathologist, and did not make any
difference in the interpretation of the result.
DISCUSSION
The 28-day and 90-day toxicity studies described here was conducted
using a well-developed protocol for long term exposure. Based on the
various evaluations and parametric data analysis TGT Primaage was
found to be safe at given doses for its consumption.
The analytical validated method was developed and successfully
applied to evaluate the concentration of isoquercitrin and astragalin in
the matrix and analyzed onto LC-MS/MS samples of the toxicology
studies for the dose formulation analysis of TGT Primaage [10].
By providing hygienic and sterile micro and macro environment to
rats throughout the study period (28 and 90 days), rats remained
healthy with the energetic appearance and without showing any
visible clinical sign. Overall growth in term of body weight of rats
was natural and comparable. The normal body weight gain and food
efficiency of the rat during study periods revealed no effect of
treatment on daily food and water consumption. Hence, TGT
Primaage treatment did not demonstrate any effect on in-life measures
after long term administration in male and female rats.
Evaluation of neurological, sensory-motor and behavioural functions
of rodent are crucial endpoints in consecutive administration of the
compound. Evaluation of neurological and behavioural functions at
weekly intervals during both studies by proficient scientist did not
reveal any inference related to TGT Primaage treatment. The cluster
of parameters related to sensory-motor and neuromuscular function
towards the terminations in both studies was assessed by sensitive
The Journal of Phytopharmacology
304
A. Male
B. Female
Figure 2: The figure represents the normal histological images of vital male and female organs (H and E X 10x) from 28-days toxicity study. No pathological
significant lesion was noted in TGT Primaage treated rats at 1000 mg/kg b. wt.
A. Male
B. Female
Figure 3: The figure represents the normal histological images of vital male and female organs (H and E X 10x) from 90-days toxicity study. No pathological
significant lesion was noted in TGT Primaage treated rats at 1000 mg/kg b. wt.
The Journal of Phytopharmacology
305
instruments with tactic handling shown comparable outcomes of TGT
Primaage treatment with control treatment. Hence, TGT Primaage did
not alter the CNS related functions after a consecutive period of
administration in both sexes.
Numerous parameters, related to the haematological, coagulation
functions, and the electrolyte levels, as well as enzyme levels, were
evaluated with accuracy, precision, and calibration standards on
biological fluid. Urinalysis was also quantified for its
physicochemical properties and qualified for various type of cells and
molecules. This extensive evaluation of clinical pathology parameters
did not reveal any change when compared statistically between the
control and treatment group.
The absolute and relative (compared to the terminal body weight)
weight of sex-specific and communal organs of rats from the treated
groups were neither biologically nor statistically significant, when
compared with the control group. Gross and histopathological
examinations, with the addition of peer review, were conducted, and
no abnormality was detected for any morphological change under the
microscopic examination.
In the recovery groups, no sign of toxicity was observed. Rats were
normal and healthy, throughout the recovery phase. In-life measures
and various sacrifice endpoints were also evaluated in the same
manner as for the main groups which had given similar results as that
of the main groups in both sexes, in the 28-day and 90-day studies.
In this way, there was no sign of systemic and local toxicity observed
in the long-term exposure of TGT Primaage, which included a vast
number of parameters with appropriate sample size to evaluate the
toxicity from behavioural to microscopical level and, also using both
male and female rats to understand any gender variation.
CONCLUSION
These studies conclude that TGT Primaage did not produce any
significant toxicity or adverse effect up to the highest dose level of
1000 mg/kg b. wt./day, after the repeated dose (28-day and 90-day),
oral administration in Wistar rats. The NOAEL (No Observed
Adverse Effect Level) for TGT Primaage of both sexes (male and
female rats) was found to be 1000 mg/kg b. wt./day, under conditions
and procedures, followed in these studies.
Conflict of Interest
We wish to confirm that there are no known conflicts of interest
associated with this publication and there has been no significant
financial support for this work that could have influenced its outcome.
Acknowledgement
This study was conducted by Jai Research Foundation, Valvada,
Gujarat, India and funded by The Mitomasa Sdn Bhd N° 13, Jalan L J
3, Taman Industri Lembah Jaya, 68000 Ampang, Selangor D.E.,
Malaysia.
Kunjan Shah conducted all studies, reviewing data, and contributed to
manuscript writing and reviewing. Sudhakar Jadhav conducted and
contributed to the live phase of studies and manuscript reviewing. Dr.
Manish Patel aided resource management. Jaydip Mistry contributed
to the analysis of clinical pathology. Dr. Akashrao Shinde contributed
to the post sacrifice phase of the studies and histopathology
examination. Liliya Mito funded all studies and provided the
compound of the subject. Kanchan Khare contributed to the literature
search and manuscript writing.
List of Abbreviations
% - Percentage
°C - Degree centigrade
b. wt. - Body weight
CPMP - Committee for Proprietary Medicinal Products
CV - Coefficient of Variance
FOB - Functional Observational Battery
G - Gram
G1 - Group 1 treated with vehicle (0 mg/kg b. wt./day)
G2 - Group 2 treated with low dose of test item (250 mg/kg b. wt./day)
G3 - Group 3 treated with mid dose of test item (500 mg/kg b. wt./day)
G4 - Group 4 treated with high dose of test item (1000 mg/kg b. wt./day)
G5 - Group 5 treated with vehicle - recovery group (0 mg/kg b. wt./day)
G6 - Group 6 treated with high dose of test item - recovery group (1000 mg/kg b. wt./day)
H - Hour
JRF - Jai Research Foundation
Kg - Kilogram
L - Liter
LC-MS/MS - Liquid Chromatography-Mass Spectrometry/Mass Spectrometry
Mg - Milligram
mL - Milliliter
N° - Numbe
NBO - Neurobehavioural Observations
OECD - Organisation for Economic Co-operation and Development
RO Water - Reverse Osmosis Water
REFERENCES
1. Hisam EEA, Rofiee MS, Khalid AM, Jalaluddin AF, Yusof
MIM, Idris MH Ramli, S., James, R.J., Yoeng, W.J., Kek, T.L.,
Salleh, M.Z., Combined Extract of Moringa Oleifera and
Centella Asiatica Modulates Oxidative Stress and Senescence in
Hydrogen Peroxide-Induced Human Dermal Fibroblasts. Turk J.
Biol 2018;42:33-44. https://doi.org/10.3906/biy-1708-23.
2. Kou X, Biao L, Julia BO, Justin MD, Ning C. Nutraceutical or
Pharmacological Potential of Moringa oleifera Lam. Nutrients.
2018;10(3):343. https://doi.org/10.3390/nu10030343.
3. Anwar F, Latif S, Ashraf M, Gilani AH. Moringa oleifera: A
Food Plant with Multiple Medicinal Uses. Phytother. Res.
2007;21:17-25 https://doi.org/10.1002/ptr.2023.
4. Gopalakrishnan L, Doriya K, Kumar DS. Moringa oleifera: A
review on nutritive importance and its medicinal application.
Food Science and Human Wellness 2016;5:49-56.
https://doi.org/10.1016/j.fshw.2016.04.001.
5. Brinkhaus B, Lindner M, Schuppan D, Hahn DE. Chemical,
pharmacological and clinical profile of the East Asian medical
plant Centella asiatica. Phytomedicine 2000;7(5):427-448.
https://doi.org/10.1016/S0944-7113(00)80065-3.
6. EMA, The European Agency for the Evaluation of Medicinal
Products, CPMP/SWP/1042/99 Rev 1 corr. Evaluation of
Medicine for Human Use: Note for Guidance on Repeated Dose
Toxicity 2010.
7. OECD, OECD Series on Principles of Good Laboratory Practice
and Compliance Monitoring, Number 1, OECD Principles on
Good Laboratory Practice, ENV/MC/CHEM 1998;(98)17.
8. Gohil K, Gajjar A, Patel A. Pharmacological Review on Centella
asiatica: A Potential Herbal Cure-all. Indian Journal of
Pharmaceutical Sciences 2010;72(5):546-556. https://doi:
10.4103/0250-474X.78519.
9. Goswami S, Singhai R. Antioxidant Activity of Moringa oleifera
using Successive Solvent Extraction Technique. International
Journal of Theoretical and Applied Sciences. Special Issue-
NCRTAST 2016;8(1):23-27(2016).
The Journal of Phytopharmacology
306
10. Patel M, Prabhu P, Patel A, Trivedi P. Simultaneous
Determination of Isoquercitrin and Astragalin in Plant (Leaf)
Extract Using Liquid Chromatography with Tandem Mass
Spectrometry Method for the Application of Toxicology Studies
in Matrix 2020.
11. Irwin S. Comprehensive Observational Assessment: Ia. A
Systematic, Quantitative Procedure for Assessing the Behavioral
and Physiologic State of the Mouse 1966.
https://doi.org/10.1007/bf00401402.
12. Mathiasen J, Moser V. The Irwin Test and Functional
Observational Battery (FOB) for Assessing the Effects of
Compounds on Behavior, Physiology, and Safety Pharmacology
in Rodents 2018. https://doi.org/10.1002/cpph.43.
13. Gad SC, Weil CS. Statistics for Toxicologists In: Principles and
Methods of Toxicology, 5th Edition, Hayes, A.W. ed. Raven
Press Ltd., New York 2007, 369-452.
HOW TO CITE THIS ARTICLE
Shah K, Jadhav S, Patel M, Mistry J, Shinde A, Mito L, Khare K. Safety
Assessment of TGT Primaage using Wistar Rats through Oral Gavage
Administration. J Phytopharmacol 2021; 10(5):298-315. doi:
10.31254/phyto.2021.10505
Creative Commons (CC) License-
This article is an open access article distributed under the terms and conditions of the
Creative Commons Attribution (CC BY 4.0) license. This license permits
unrestricted use, distribution, and reproduction in any medium, provided the original
author and source are credited. (http://creativecommons.org/licenses/by/4.0/).
The Journal of Phytopharmacology
307
Supplementary data:
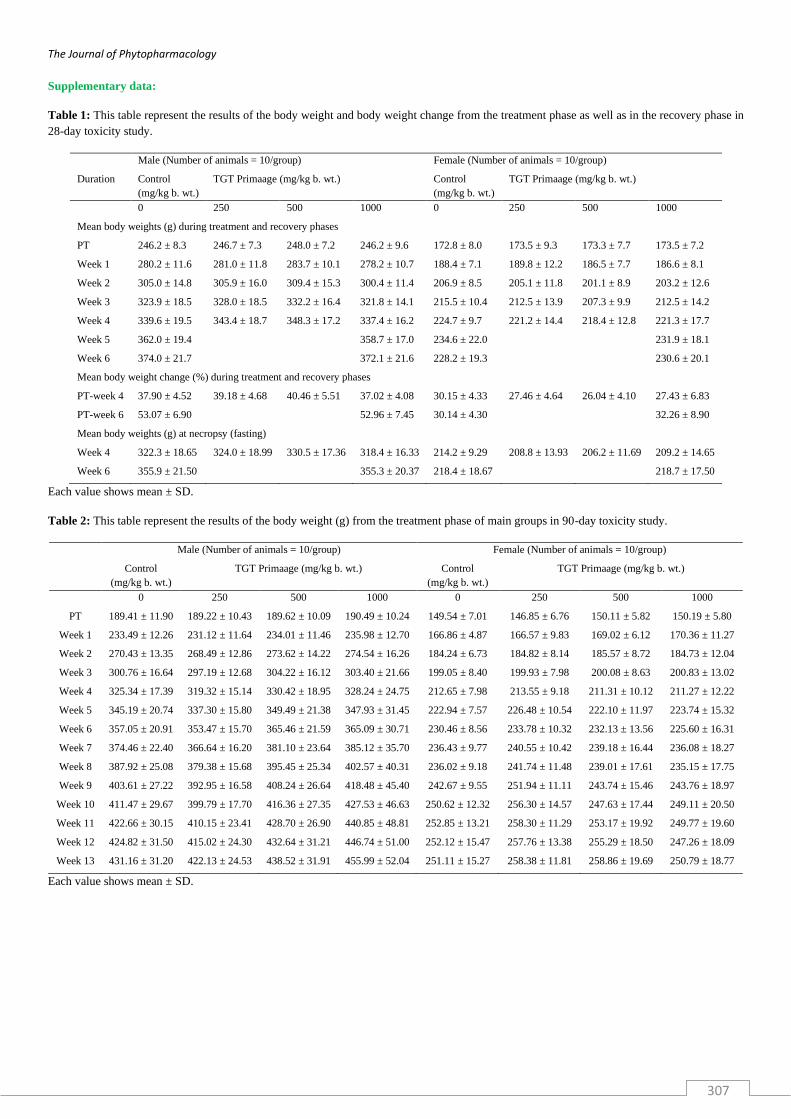
Table 1: This table represent the results of the body weight and body weight change from the treatment phase as well as in the recovery phase in
28-day toxicity study.
Male (Number of animals = 10/group) Female (Number of animals = 10/group)
Duration Control
(mg/kg b. wt.)
TGT Primaage (mg/kg b. wt.) Control
(mg/kg b. wt.)
TGT Primaage (mg/kg b. wt.)
0 250 500 1000 0 250 500 1000
Mean body weights (g) during treatment and recovery phases
PT 246.2 ± 8.3 246.7 ± 7.3 248.0 ± 7.2 246.2 ± 9.6 172.8 ± 8.0 173.5 ± 9.3 173.3 ± 7.7 173.5 ± 7.2
Week 1 280.2 ± 11.6 281.0 ± 11.8 283.7 ± 10.1 278.2 ± 10.7 188.4 ± 7.1 189.8 ± 12.2 186.5 ± 7.7 186.6 ± 8.1
Week 2 305.0 ± 14.8 305.9 ± 16.0 309.4 ± 15.3 300.4 ± 11.4 206.9 ± 8.5 205.1 ± 11.8 201.1 ± 8.9 203.2 ± 12.6
Week 3 323.9 ± 18.5 328.0 ± 18.5 332.2 ± 16.4 321.8 ± 14.1 215.5 ± 10.4 212.5 ± 13.9 207.3 ± 9.9 212.5 ± 14.2
Week 4 339.6 ± 19.5 343.4 ± 18.7 348.3 ± 17.2 337.4 ± 16.2 224.7 ± 9.7 221.2 ± 14.4 218.4 ± 12.8 221.3 ± 17.7
Week 5 362.0 ± 19.4 358.7 ± 17.0 234.6 ± 22.0 231.9 ± 18.1
Week 6 374.0 ± 21.7 372.1 ± 21.6 228.2 ± 19.3 230.6 ± 20.1
Mean body weight change (%) during treatment and recovery phases
PT-week 4 37.90 ± 4.52 39.18 ± 4.68 40.46 ± 5.51 37.02 ± 4.08 30.15 ± 4.33 27.46 ± 4.64 26.04 ± 4.10 27.43 ± 6.83
PT-week 6 53.07 ± 6.90 52.96 ± 7.45 30.14 ± 4.30 32.26 ± 8.90
Mean body weights (g) at necropsy (fasting)
Week 4 322.3 ± 18.65 324.0 ± 18.99 330.5 ± 17.36 318.4 ± 16.33 214.2 ± 9.29 208.8 ± 13.93 206.2 ± 11.69 209.2 ± 14.65
Week 6 355.9 ± 21.50 355.3 ± 20.37 218.4 ± 18.67 218.7 ± 17.50
Each value shows mean ± SD.
Table 2: This table represent the results of the body weight (g) from the treatment phase of main groups in 90-day toxicity study.
Male (Number of animals = 10/group) Female (Number of animals = 10/group)
Control
(mg/kg b. wt.)
TGT Primaage (mg/kg b. wt.) Control
(mg/kg b. wt.)
TGT Primaage (mg/kg b. wt.)
0 250 500 1000 0 250 500 1000
PT 189.41 ± 11.90 189.22 ± 10.43 189.62 ± 10.09 190.49 ± 10.24 149.54 ± 7.01 146.85 ± 6.76 150.11 ± 5.82 150.19 ± 5.80
Week 1 233.49 ± 12.26 231.12 ± 11.64 234.01 ± 11.46 235.98 ± 12.70 166.86 ± 4.87 166.57 ± 9.83 169.02 ± 6.12 170.36 ± 11.27
Week 2 270.43 ± 13.35 268.49 ± 12.86 273.62 ± 14.22 274.54 ± 16.26 184.24 ± 6.73 184.82 ± 8.14 185.57 ± 8.72 184.73 ± 12.04
Week 3 300.76 ± 16.64 297.19 ± 12.68 304.22 ± 16.12 303.40 ± 21.66 199.05 ± 8.40 199.93 ± 7.98 200.08 ± 8.63 200.83 ± 13.02
Week 4 325.34 ± 17.39 319.32 ± 15.14 330.42 ± 18.95 328.24 ± 24.75 212.65 ± 7.98 213.55 ± 9.18 211.31 ± 10.12 211.27 ± 12.22
Week 5 345.19 ± 20.74 337.30 ± 15.80 349.49 ± 21.38 347.93 ± 31.45 222.94 ± 7.57 226.48 ± 10.54 222.10 ± 11.97 223.74 ± 15.32
Week 6 357.05 ± 20.91 353.47 ± 15.70 365.46 ± 21.59 365.09 ± 30.71 230.46 ± 8.56 233.78 ± 10.32 232.13 ± 13.56 225.60 ± 16.31
Week 7 374.46 ± 22.40 366.64 ± 16.20 381.10 ± 23.64 385.12 ± 35.70 236.43 ± 9.77 240.55 ± 10.42 239.18 ± 16.44 236.08 ± 18.27
Week 8 387.92 ± 25.08 379.38 ± 15.68 395.45 ± 25.34 402.57 ± 40.31 236.02 ± 9.18 241.74 ± 11.48 239.01 ± 17.61 235.15 ± 17.75
Week 9 403.61 ± 27.22 392.95 ± 16.58 408.24 ± 26.64 418.48 ± 45.40 242.67 ± 9.55 251.94 ± 11.11 243.74 ± 15.46 243.76 ± 18.97
Week 10 411.47 ± 29.67 399.79 ± 17.70 416.36 ± 27.35 427.53 ± 46.63 250.62 ± 12.32 256.30 ± 14.57 247.63 ± 17.44 249.11 ± 20.50
Week 11 422.66 ± 30.15 410.15 ± 23.41 428.70 ± 26.90 440.85 ± 48.81 252.85 ± 13.21 258.30 ± 11.29 253.17 ± 19.92 249.77 ± 19.60
Week 12 424.82 ± 31.50 415.02 ± 24.30 432.64 ± 31.21 446.74 ± 51.00 252.12 ± 15.47 257.76 ± 13.38 255.29 ± 18.50 247.26 ± 18.09
Week 13 431.16 ± 31.20 422.13 ± 24.53 438.52 ± 31.91 455.99 ± 52.04 251.11 ± 15.27 258.38 ± 11.81 258.86 ± 19.69 250.79 ± 18.77
Each value shows mean ± SD.
The Journal of Phytopharmacology
308
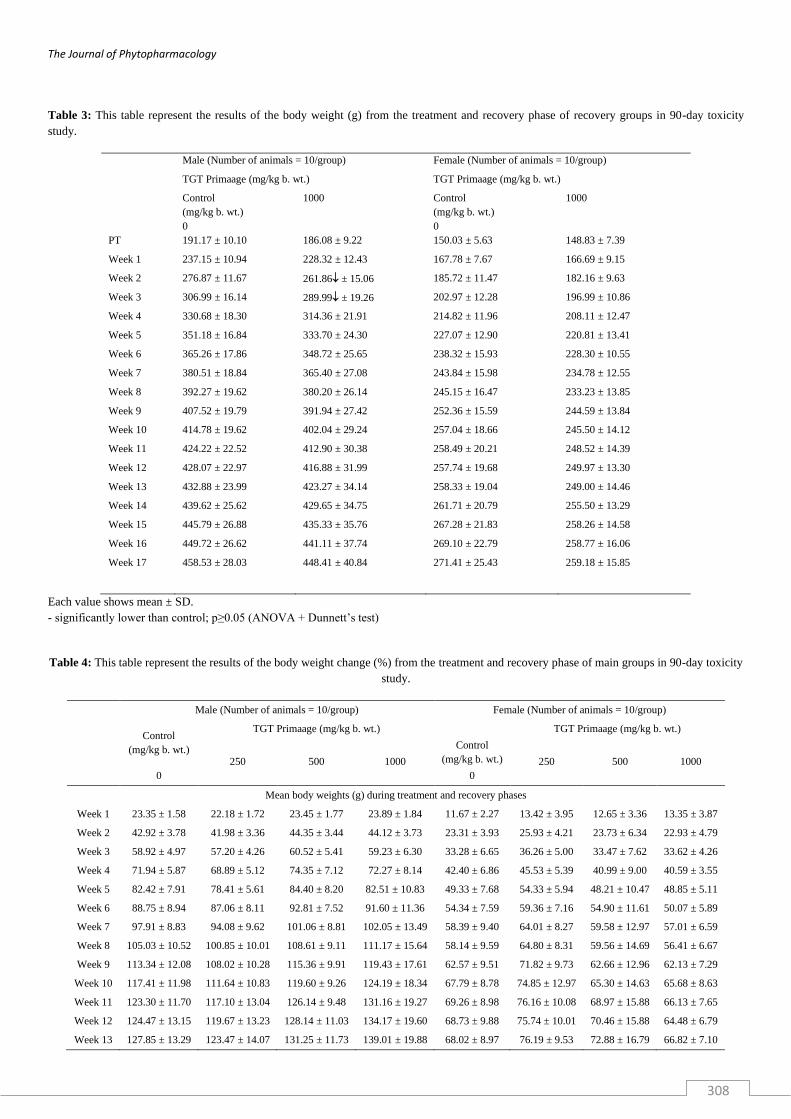
Table 3: This table represent the results of the body weight (g) from the treatment and recovery phase of recovery groups in 90-day toxicity
study.
Male (Number of animals = 10/group) Female (Number of animals = 10/group)
TGT Primaage (mg/kg b. wt.) TGT Primaage (mg/kg b. wt.)
Control
(mg/kg b. wt.)
0
1000 Control
(mg/kg b. wt.)
0
1000
PT 191.17 ± 10.10 186.08 ± 9.22 150.03 ± 5.63 148.83 ± 7.39
Week 1 237.15 ± 10.94 228.32 ± 12.43 167.78 ± 7.67 166.69 ± 9.15
Week 2 276.87 ± 11.67 261.86 ± 15.06 185.72 ± 11.47 182.16 ± 9.63
Week 3 306.99 ± 16.14 289.99 ± 19.26 202.97 ± 12.28 196.99 ± 10.86
Week 4 330.68 ± 18.30 314.36 ± 21.91 214.82 ± 11.96 208.11 ± 12.47
Week 5 351.18 ± 16.84 333.70 ± 24.30 227.07 ± 12.90 220.81 ± 13.41
Week 6 365.26 ± 17.86 348.72 ± 25.65 238.32 ± 15.93 228.30 ± 10.55
Week 7 380.51 ± 18.84 365.40 ± 27.08 243.84 ± 15.98 234.78 ± 12.55
Week 8 392.27 ± 19.62 380.20 ± 26.14 245.15 ± 16.47 233.23 ± 13.85
Week 9 407.52 ± 19.79 391.94 ± 27.42 252.36 ± 15.59 244.59 ± 13.84
Week 10 414.78 ± 19.62 402.04 ± 29.24 257.04 ± 18.66 245.50 ± 14.12
Week 11 424.22 ± 22.52 412.90 ± 30.38 258.49 ± 20.21 248.52 ± 14.39
Week 12 428.07 ± 22.97 416.88 ± 31.99 257.74 ± 19.68 249.97 ± 13.30
Week 13 432.88 ± 23.99 423.27 ± 34.14 258.33 ± 19.04 249.00 ± 14.46
Week 14 439.62 ± 25.62 429.65 ± 34.75 261.71 ± 20.79 255.50 ± 13.29
Week 15 445.79 ± 26.88 435.33 ± 35.76 267.28 ± 21.83 258.26 ± 14.58
Week 16 449.72 ± 26.62 441.11 ± 37.74 269.10 ± 22.79 258.77 ± 16.06
Week 17 458.53 ± 28.03 448.41 ± 40.84 271.41 ± 25.43 259.18 ± 15.85
Each value shows mean ± SD.
- significantly lower than control; p≥0.05 (ANOVA + Dunnett’s test)
Table 4: This table represent the results of the body weight change (%) from the treatment and recovery phase of main groups in 90-day toxicity
study.
Male (Number of animals = 10/group) Female (Number of animals = 10/group)
Control
(mg/kg b. wt.)
TGT Primaage (mg/kg b. wt.) TGT Primaage (mg/kg b. wt.)
250 500 1000
Control
(mg/kg b. wt.) 250 500 1000
0 0
Mean body weights (g) during treatment and recovery phases
Week 1 23.35 ± 1.58 22.18 ± 1.72 23.45 ± 1.77 23.89 ± 1.84 11.67 ± 2.27 13.42 ± 3.95 12.65 ± 3.36 13.35 ± 3.87
Week 2 42.92 ± 3.78 41.98 ± 3.36 44.35 ± 3.44 44.12 ± 3.73 23.31 ± 3.93 25.93 ± 4.21 23.73 ± 6.34 22.93 ± 4.79
Week 3 58.92 ± 4.97 57.20 ± 4.26 60.52 ± 5.41 59.23 ± 6.30 33.28 ± 6.65 36.26 ± 5.00 33.47 ± 7.62 33.62 ± 4.26
Week 4 71.94 ± 5.87 68.89 ± 5.12 74.35 ± 7.12 72.27 ± 8.14 42.40 ± 6.86 45.53 ± 5.39 40.99 ± 9.00 40.59 ± 3.55
Week 5 82.42 ± 7.91 78.41 ± 5.61 84.40 ± 8.20 82.51 ± 10.83 49.33 ± 7.68 54.33 ± 5.94 48.21 ± 10.47 48.85 ± 5.11
Week 6 88.75 ± 8.94 87.06 ± 8.11 92.81 ± 7.52 91.60 ± 11.36 54.34 ± 7.59 59.36 ± 7.16 54.90 ± 11.61 50.07 ± 5.89
Week 7 97.91 ± 8.83 94.08 ± 9.62 101.06 ± 8.81 102.05 ± 13.49 58.39 ± 9.40 64.01 ± 8.27 59.58 ± 12.97 57.01 ± 6.59
Week 8 105.03 ± 10.52 100.85 ± 10.01 108.61 ± 9.11 111.17 ± 15.64 58.14 ± 9.59 64.80 ± 8.31 59.56 ± 14.69 56.41 ± 6.67
Week 9 113.34 ± 12.08 108.02 ± 10.28 115.36 ± 9.91 119.43 ± 17.61 62.57 ± 9.51 71.82 ± 9.73 62.66 ± 12.96 62.13 ± 7.29
Week 10 117.41 ± 11.98 111.64 ± 10.83 119.60 ± 9.26 124.19 ± 18.34 67.79 ± 8.78 74.85 ± 12.97 65.30 ± 14.63 65.68 ± 8.63
Week 11 123.30 ± 11.70 117.10 ± 13.04 126.14 ± 9.48 131.16 ± 19.27 69.26 ± 8.98 76.16 ± 10.08 68.97 ± 15.88 66.13 ± 7.65
Week 12 124.47 ± 13.15 119.67 ± 13.23 128.14 ± 11.03 134.17 ± 19.60 68.73 ± 9.88 75.74 ± 10.01 70.46 ± 15.88 64.48 ± 6.79
Week 13 127.85 ± 13.29 123.47 ± 14.07 131.25 ± 11.73 139.01 ± 19.88 68.02 ± 8.97 76.19 ± 9.53 72.88 ± 16.79 66.82 ± 7.10
The Journal of Phytopharmacology
309
Each value shows mean ± SD.
Table 5: This table represent the results of the body weight change (%) from the treatment and recovery phase of recovery groups in 90-day
toxicity study.
Male (Number of animals = 10/group) Female (Number of animals = 10/group)
TGT Primaage (mg/kg b. wt.) TGT Primaage (mg/kg b. wt.)
Control
(mg/kg b. wt.)
0
1000 Control
(mg/kg b. wt.)
0
1000
Week 1 24.11 ± 2.13 22.70 ± 2.63 11.81 ± 1.87 12.01 ± 2.80
Week 2 44.91 ± 2.49 40.74 ± 4.53 23.75 ± 4.91 22.41 ± 2.79
Week 3 60.62 ± 3.74 55.85 ± 7.12 35.29 ± 6.46 32.39 ± 4.28
Week 4 73.00 ± 4.65 68.96 ± 8.67 43.22 ± 6.73 39.88 ± 5.88
Week 5 83.82 ± 6.04 79.37 ± 10.42 51.41 ± 7.84 48.43 ± 6.77
Week 6 91.17 ± 5.56 87.46 ± 11.31 58.95 ± 10.73 53.55 ± 6.44
Week 7 99.16 ± 6.13 96.46 ± 12.57 62.67 ± 11.37 57.89 ± 7.50
Week 8 105.36 ± 7.90 104.43 ± 12.04 63.63 ± 12.91 56.82 ± 7.85
Week 9 113.38 ± 8.88 110.75 ± 12.85 68.44 ± 12.43 64.45 ± 7.57
Week 10 117.26 ± 10.60 116.21 ± 14.39 71.52 ± 13.69 65.08 ± 8.16
Week 11 122.13 ± 10.56 122.06 ± 15.18 72.49 ± 14.68 67.11 ± 8.17
Week 12 124.18 ± 11.54 124.22 ± 16.36 71.92 ± 13.32 68.10 ± 7.63
Week 13 126.67 ± 11.49 127.60 ± 16.73 72.32 ± 12.95 67.41 ± 7.85
Week 14 130.14 ± 11.28 131.07 ± 17.68 74.61 ± 14.61 71.87 ± 8.71
Week 15 133.38 ± 12.20 134.12 ± 18.26 78.32 ± 15.23 73.70 ± 9.03
Week 16 135.44 ± 11.97 137.22 ± 19.20 79.53 ± 15.79 74.01 ± 9.45
Week 17 140.05 ± 12.69 141.12 ± 20.66 81.05 ± 17.314 74.35 ± 10.48
Each value shows mean ± SD.
- significantly lower than control; p≥0.05 (ANOVA + Dunnett’s test)
Table 6: This table represent the results of the grip strength and foot splay parameters from the treatment phase as well as in the recovery phase
in 28-day toxicity study.
Male (Number of animals = 10/group) Female (Number of animals = 10/group)
Parameters Control
(mg/kg b. wt.)
TGT Primaage (mg/kg b. wt.) Control
(mg/kg b. wt.)
TGT Primaage (mg/kg b. wt.)
0 250 500 1000 0 250 500 1000
Mean Forelimb Grip Strength (kg)
Main 1.119 ± 0.044 1.130 ± 0.053 1.102 ± 0.074 1.093 ± 0.042 0..941 ± 0.097 0.946 ± 0.070 0.963 ± 0.085 0.962 ± 0.066
Recovery 1.185 ± 0.068 1.208 ± 0.091 1.008 ± 0.044 1.038 ± 0.055
Mean Hindlimb Grip Strength (kg)
Main 0.423 ± 0.028 0.421 ± 0.030 0.416 ± 0.029 0.439 ± 0.025 0.339 ± 0.033 0.333 ± 0.021 0.343 ± 0.027 0.336 ± 0.013
Recovery 0.471 ± 0.048 0.460 ± 0.044 0.420 ± 0.047 0.456 ± 0.048
Mean Hindlimb Foot Splay (mm)
Main 114.20 ± 9.90 107.70 ± 10.73 101.80 ± 15.05 95.80 ± 18.50 87.70 ± 18.98 87.50 ± 17.17 90.80 ± 13.27 86.90 ± 10.83
Recovery 89.50 ± 18.39 90.60 ± 10.56 86.20 ± 10.32 87.80 ± 12.89
Each value shows mean ± SD.
- significantly lower than control; p≥0.05 (ANOVA + Dunnett’s test)
The Journal of Phytopharmacology
310
Table 7: This table represent the results of the grip strength and foot splay parameters from the treatment phase as well as in the recovery phase
in 90-day toxicity study
Male (Number of animals = 10/group) Female (Number of animals = 10/group)
Parameters Control
(mg/kg b. wt.)
TGT Primaage (mg/kg b. wt.) Control
(mg/kg b. wt.)
TGT Primaage (mg/kg b. wt.)
0 250 500 1000 0 250 500 1000
Mean Forelimb Grip Strength (kg)
Main 1.199 ± 0.054 1.165 ± 0.048 1.205 ± 0.061 1.173 ± 0.082 1.152 ± 0.067 1.095 ± 0.051 1.077 ± 0.050 1.102 ± 0.038
Recovery 1.141 ± 0.066 1.142 ± 0.076 1.175 ±0.041 1.127 ± 0.042
Mean Hindlimb Grip Strength (kg)
Main 0.439 ± 0.039 0.464 ± 0.026 0.435 ± 0.043 0.452 ± 0.040 0.389 ± 0.029 0.385 ± 0.018 0.387 ± 0.026 0.406 ± 0.030
Recovery 0.633 ± 0.062 0.582 ± 0.080 0.554 ± 0.050 0.521 ± 0.050
Mean Hindlimb Foot Splay (mm)
Main 107.60 ± 14.28 92.90 ± 16.76 90.90 ± 18.14 90.80 ± 15.91 83.70 ± 15.25 87.70 ± 21.18 72.90 ± 10.04 77.50 ± 23.42
Recovery 91.20 ± 17.50 92.00 ± 17.82 70.90 ± 22.21 69.60 ± 14.35
Each value shows mean ± SD.
- significantly lower than control; p≥0.05 (ANOVA + Dunnett’s test)
Table 8: This table represent the hematology data evaluated after the termination of the treatment phase in control group and treatment groups of
28-day toxicity study.
Male (Number of animals = 10/group) Female (Number of animals = 10/group)
Parameters Control
(mg/kg b.
wt.)
TGT Primaage (mg/kg b. wt.) Control
(mg/kg b.
wt.)
TGT Primaage (mg/kg b. wt.)
0 250 500 1000 0 250 500 1000
WBC (x103/µL) 7.35 ± 1.64 7.24 ± 1.93 7.05 ± 1.04 6.31 ± 0.97 3.83 ± 0.72 4.30 ± 0.84 4.21 ± 0.65 4.23 ± 0.95
RBC (x106/µL) 9.01 ± 0.45 9.39 ± 0.43 9.36 ± 0.44 9.21 ± 0.44 8.61 ± 0.22 8.55 ± 0.53 8.80 ± 0.33 8.95 ± 0.30
Hb (g/dL) 15.89 ± 0.50 16.09 ± 0.50 16.39 ± 0.59 15.88 ± 0.79 15.61 ± 0.33 15.10 ± 0.84 15.42 ± 0.58 15.57 ± 0.24
HCT (%) 48.30 ± 2.26 49.39 ± 1.75 49.47 ± 1.70 48.61 ± 2.37 47.27 ± 1.36 46.55 ± 2.74 47.30 ± 1.74 47.90 ± 1.10
MCV (fL) 53.64 ± 1.49 52.69 ± 2.35 52.93 ± 1.63 52.83 ± 1.20 54.92 ± 1.34 54.46 ± 0.97 53.79 ± 1.56 53.58 ± 1.42
MCH (pg) 17.65 ± 0.67 17.18 ± 0.84 17.52 ± 0.64 17.24 ± 0.50 18.12 ± 0.55 17.69 ± 0.44 17.54 ± 0.69 17.42 ± 0.56
MCHC (g/dL) 32.95 ± 0.91 32.62 ± 0.31 33.11 ± 0.54 32.61 ± 0.54 33.02 ± 0.74 32.46 ± 0.42 32.61 ± 0.72 32.51 ± 0.55
Platelet (x103/µL) 879.90 ±
81.70
925.70 ±
58.62
915.30 ±
76.18
867.50 ±
115.52
870.60 ±
55.19
915.20 ±
121.56
952.90 ±
126.04
868.80 ±
151.00
Neutrophil
(x103/µL)
1.37 ± 0.47 1.40 ± 0.49 1.52 ± 0.48 1.24 ± 0.28 0.75 ± 0.20 0.78 ± 0.32 0.67 ± 0.16 0.69 ± 0.22
Lymphocyte
(x103/µL)
5.42 ± 1.26 5.21 ± 1.49 4.97 ± 0.64 4.60 ± 0.68 2.82 ± 0.70 3.23 ± 0.69 3.22 ± 0.63 3.20 ± 0.81
Monocyte (x103/µL) 0.24 ± 0.09 0.27 ± 0.08 0.23 ± 0.05 0.17 ± 0.04 0.11 ± 0.04 0.10 ± 0.04 0.12 ± 0.05 0.11 ± 0.03
Eosinophil
(x103/µL)
0.10 ± 0.05 0.11 ± 0.05 0.10 ± 0.03 0.10 ± 0.07 0.06 ± 0.03 0.07 ± 0.03 0.06 ± 0.03 0.11 ± 0.11
Basophil (x103/µL) 0.16 ± 0.05 0.18 ± 0.10 0.16 ± 0.04 0.15 ± 0.07 0.08 ± 0.03 0.10 ± 0.03 0.10 ± 0.04 0.09 ± 0.02
Reticulocyte
Count (x109/L)
209.71 ±
20.25
214.35 ±
20.77
216.14 ±
26.43
220.80 ±
26.34
247.03 ±
46.81
261.73 ±
32.85
257.69 ±
36.17
247.68 ±
47.95
PT (Seconds) 10.65 ± 0.34 11.01 ± 0.95 10.49 ± 0.54 10.41 ± 0.55 9.78 ± 1.01 9.80 ± 0.55 9.49 ± 0.65 9.98 ± 0.94
APTT (Seconds) 24.21 ± 1.62 25.45 ± 1.18 24.47 ± 2.44 25.13 ± 3.18 25.88 ± 3.27 24.66 ± 4.59 27.40 ± 3.34 23.79 ± 3.73
Each value shows mean ± SD.
- significantly lower than control; p≥0.05 (ANOVA + Dunnett’s test)
The Journal of Phytopharmacology
311
Table 9 : This table represent the Hematology data evaluated after the termination of the control group and treatment group in the recovery
phase of 28-day toxicity study.
Male (Number of animals = 10/group) Female (Number of animals = 10/group)
Parameters Control (mg/kg b.
wt.)
TGT Primaage (mg/kg b.
wt.)
Control (mg/kg b.
wt.)
TGT Primaage (mg/kg b.
wt.)
0 1000 0 1000
WBC (x103/µL) 6.77 ± 0.89 7.10 ± 2.33 3.11 ± 0.55 3.25 ± 1.15
RBC (x106/µL) 9.59 ± 0.46 9.79 ± 0.30 8.68 ± 0.56 8.71 ± 0.82
Hb (g/dL) 16.22 ± 0.50 16.43 ± 0.51 14.77 ± 0.79 15.47 ± 1.20
HCT (%) 50.20 ± 1.48 50.39 ± 1.30 46.61 ± 2.63 48.17 ± 3.52
MCV (fL) 52.42 ± 1.88 51.52 ± 1.37 53.76 ± 0.95 55.41 ± 1.82
MCH (pg) 16.94 ± 0.69 16.79 ± 0.63 17.03 ± 0.43 17.79 ± 0.64
MCHC (g/dL) 32.30 ± 0.31 32.61 ± 0.43 31.71 ± 0.48 32.12 ± 0.79
Platelet (x103/µL) 900.00 ± 109.29 913.90 ± 92.67 871.80 ± 150.78 875.50 ± 102.74
Neutrophil (x103/µL) 1.37 ± 0.31 1.43 ± 0.44 0.59 ± 0.08 0.59 ± 0.14
Lymphocyte (x103/µL) 4.83 ± 0.64 5.06 ± 1.76 2.31 ± 0.55 2.41 ± 1.09
Monocyte (x103/µL) 0.24 ± 0.06 0.26 ± 0.09 0.08 ± 0.02 0.08 ± 0.03
Eosinophil (x103/µL) 0.12 ± 0.08 0.12 ± 0.07 0.06 ± 0.03 0.05 ± 0.02
Basophil (x103/µL) 0.17 ± 0.02 0.17 ± 0.06 0.09 ± 0.04 0.10 ± 0.05
Reticulocyte Count
(x109/L) 248.25 ± 33.55 242.17 ± 31.91 209.09 ± 34.87 214.09 ± 45.14
PT (Seconds) 10.62 ± 0.66 10.60 ± 088 10.19 ± 0.35 10.24 ± 0.41
APTT (Seconds) 22.05 ± 7.32 20.40 ± 5.47 21.17 ± 4.52 17.36 ± 2.61
Each value shows mean ± SD.
- significantly lower than control; p≥0.05 (ANOVA + Dunnett’s test)
- significantly higher than control; p≥0.05 (ANOVA + Dunnett’s test)
- significantly higher than control; p≥0.01 (ANOVA + Dunnett’s test)
Table 10: This table represent the Hematology data evaluated after the termination of the control group and treatment group in the treatment
phase in 90-day study.
Male (Number of animals = 10/group) Female (Number of animals = 10/group)
Control
(mg/kg b.
wt.)
TGT Primaage (mg/kg b. wt.) Control
(mg/kg b.
wt.)
TGT Primaage (mg/kg b. wt.)
250 500 1000 250 500 1000
0 0
WBC (x103/µL) 5.46 ± 1.29 6.07 ± 1.50 5.45 ± 0.85 6.57 ± 1.04 2.90 ± 0.70 3.71 ± 1.10 3.25 ± 0.90 3.19 ± 0.71
RBC (x106/µL) 8.81 ± 0.22 8.91 ± 0.52 8.82 ± 0.43 8.86 ± 0.44 8.14 ± 0.28 8.11 ± 0.22 7.94 ± 0.58 8.05 ± 0.22
Hb (g/dL) 15.03 ± 0.29 14.91 ± 0.90 14.84 ± 0.74 14.99 ± 0.60 14.32 ± 0.37 14.35 ± 0.52 14.19 ± 1.03 14.46 ± 0.44
HCT (%) 44.28 ± 1.10 44.47 ± 2.53 44.19 ± 1.91 44.85 ± 1.58 42.72 ± 1.17 43.01 ± 1.34 42.37 ± 2.95 43.03 ± 0.41
MCV (fL) 50.24 ± 0.78 49.94 ± 0.83 50.16 ± 1.50 50.66 ± 1.93 52.53 ± 1.39 53.04 ± 0.97 53.38 ± 0.86 53.51 ± 1.13
MCH (pg) 17.06 ± 0.38 16.76 ± 0.50 16.85 ± 0.54 16.95 ± 0.94 17.62 ± 0.52 17.70 ± 0.52 17.89 ± 0.35 17.99 ± 0.47
MCHC (g/dL) 33.98 ± 0.78 33.56 ± 0.58 33.58 ± 0.44 33.45 ± 0.63 33.53 ± 0.43 33.37 ± 0.65 33.51 ± 0.58 33.61 ± .76
Platelets (x103/µL) 853.30 ±
56.88
888.50 ±
99.99
831.60 ±
92.59
917.20 ±
95.82
886.50 ±
90.35
879.20 ±
106.55
856.90 ±
134.48
992.70 ±
12.75
Neutrophil
(x103/µL)
1.28 ± 0.30 1.39 ± 0.66 1.28 ± 0.46 1.50 ± 0.33 0.58 ± 0.26 0.78 ± 0.58 0.61 ± 0.18 0.63 ± 0.17
Lymphocyte
(x103/µL)
3.86 ± 0.98 4.30 ± 0.77 3.87 ± 0.43 4.72 ± 0.70 2.15 ± 0.55 2.72 ± 0.76 2.45 ± 0.96 2.38 ± 0.67
Monocyte (x103/µL) 0.14 ± .08 0.15 ± 0.06 0.12 ± 0.04 0.17 ± 0.06 0.06 ± 0.03 0.09 ± 0.07 0.08 ± 0.04 0.08 ± 0.04
Eosinophil
(x103/µL)
0.10 ± 0.03 0.14 ± 0.07 0.11 ± 0.03 0.10 ± 0.04 0.08 ± 0.05 0.06 ± 0.02 0.07 ± 0.05 0.06 ± 0.02
Basophil (x103/µL) 0.05 ± 0.01 0.06 ± 0.02 0.05 ± 0.01 0.06 ± 0.02 0.03 ± 0.01 0.04 ± 0.02 0.03 ± 0.03 0.03 ± 0.01
Reticulocytes
Count (x109/L)
171.39 ±
24.98
169.64 ±
16.11
172.41 ±
28.42
173.96 ±
30.23
204.38 ±
44.68
190.32 ±
25.18
193.40 ±
52.53
190.21 ±
38.38
PT (Seconds) 10.99 ± 0.63 11.90 ± 0.64 10.31 ± 0.92 11.32 ± 0.75 11.52 ± 0.75 10.77 ±
0.32
11.03 ± 0.50 10.65 ±
0.28
APTT (Seconds) 17.45 ± 1.44 19.12 ±
0.85
17.59 ± 1.70 18.85 ± 2.70 17.24 ± 2.94 18.20 ± 1.28 16.75 ± 2.48 17.23 ± 1.26
Each value shows mean ± SD.
- significantly lower than control; p≥0.05 (ANOVA + Dunnett’s test)
The Journal of Phytopharmacology
312
- significantly higher than control; p≥0.05 (ANOVA + Dunnett’s test)
- significantly higher than control; p≥0.01 (ANOVA + Dunnett’s test)
Table 11: This table represent the Hematology data evaluated after the termination of the control group and treatment group in the recovery
phase in 90-day study
Male (Number of animals = 10/group) Female (Number of animals = 10/group)
Control
(mg/kg b. wt.)
0
TGT Primaage (mg/kg b. wt.)
1000
Control
(mg/kg b. wt.)
0
TGT Primaage (mg/kg b. wt.)
1000
WBC (x103/µL) 5.83 ± 0.98 5.69 ± 1.19 3.09 ± 0.73 4.02 ± 0.72
RBC (x106/µL) 9.08 ± 0.18 8.73 ± 0.52 8.02 ± 0.20 7.82 ± 0.96
Hb (g/dL) 15.50 ± 0.26 15.20 ± 0.92 14.64 ± 0.49 13.95 ± 1.56
HCT (%) 45.77 ± 0.77 44.26 ± 2.46 43.28 ± 1.20 41.65 ± 4.48
MCV (fL) 50.43 ± 0.81 50.71 ± 0.85 53.97 ± 1.12 53.36 ± 2.06
MCH (pg) 17.08 ± 0.38 17.44 ± 0.53 18.25 ± 0.49 17.87 ± 0.61
MCHC (g/dL) 33.88 ± 0.41 34.39 ± 0.93 33.82 ± 0.51 33.49 ± 0.34
Platelets (x103/µL) 797.60 ± 95.19 758.30 ± 120.22 826.60 ± 74.83 835.10 ± 108.64
Neutrophil (x103/µL) 1.50 ± 0.58 1.10 ± 0.37 0.55 ± 0.19 0.73 ± 0.25
Lymphocyte (x103/µL) 3.99 ± 0.72 4.33 ± 0.99 2.40 ± 0.65 3.14 ± 0.72
Monocyte (x103/µL) 0.15 ± 0.06 0.11 ± 0.04 0.05 ± 0.02 0.07 ± 0.04
Eosinophil (x103/µL) 0.12 ± 0.04 0.10 ± 0.04 0.06 ± 0.02 0.06 ± 0.01
Basophil (x103/µL) 0.06 ± 0.04 0.03 ± 0.01 0.03 ± 0.01 0.02 ± 0.01
Reticulocytes
Count (x109/L)
180.82 ± 25.74 164.12 ± 23.22 200.46 ± 39.18 168.65 ± 32.10
PT (Seconds) 11.58 ± 0.45 11.29 ± 1.12 11.24 ± 0.74 10.00 ± 0.91
APTT (Seconds) 5.83 ± 1.91 17.69 ± 2.24 16.80 ± 3.02 16.04 ± 1.58
Each value shows mean ± SD.
- significantly lower than control; p≥0.05 (ANOVA + Dunnett’s test)
- significantly higher than control; p≥0.05 (ANOVA + Dunnett’s test)
- significantly higher than control; p≥0.01 (ANOVA + Dunnett’s test)
Table 12: This table represent the clinical chemistry data evaluated after the termination of the control group and treatment group in the
recovery phase in 28-day study.
Parameters Male (Number of animals = 10/group) Female (Number of animals = 10/group)
Control (mg/kg b. wt.) TGT Primaage (mg/kg b. wt.) Control (mg/kg b. wt.) TGT Primaage (mg/kg b. wt.)
0 1000 0 1000
Glucose (mg/dL) 137.01 ± 18.82 140.76 ± 12.50 132.93 ± 20.66 121.28 ± 17.40
Total Cholesterol (mg/dL) 83.38 ± 16.25 76.04 ± 13.62 77.60 ± 13.34 83.37 ± 13.18
Triglycerides (mg/dL) 75.77 ± 26.02 93.28 ± 46.82 34.97 ± 14.70 35.96 ± 15.14
Creatinine (mg/dL) 0.55 ± 0.02 0.54 ± 0.02 0.59 ± 0.04 0.59 ± 0.03
Lactate Dehydrogenase (U/L) 989.00 ± 237.93 851.20 ± 227.18 845.50 ± 252.52 822.60 ± 261.47
Creatinine Kinase (U/L) 349.00 ± 88.74 303.40 ± 84.89 337.07 ± 154.30 453.23 ± 507.85
GGT (U/L) 0.43 ± 0.25 0.44 ± 0.14 0.46 ± 0.25 0.83 ± 0.94
ALP (U/L) 108.11 ± 30.24 108.40 ± 27.61 46.17 ± 9.58 50.97 ± 15.80
ALT (U/L) 48.91 ± 8.84 51.91 ± 6.14 41.57 ± 6.45 43.81 ± 15.52
AST (U/L) 125.50 ± 23.07 113.68 ± 21.10 137.15 ± 47.48 138.08 ± 34.64
Calcium (mg/dL) 10.73 ± 0.35 10.63 ± 0.25 10.67 ± 0.29 10.62 ± 0.24
Inorganic Phosphorus (mg/dL) 6.71 ± 0.34 6.79 ± 0.70 4.97 ± 0.64 5.55 ± 0.52
The Journal of Phytopharmacology
313
Total Protein (g/dL) 6.64 ± 0.30 6.66 ± 0.15 7.05 ± 0.42 6.82 ± 0.42
Albumin (g/dL) 3.81 ± 0.12 3.84 ± 0.08 4.20 ± 0.23 4.04 ± 0.26
GLB (g/dL) 2.83 ± 0.21 2.83 ± 0.11 2.85 ± 0.21 2.78 ± 0.18
ALB:GLB 1.35 ± 0.07 1.36 ± 0.06 1.48 ± 0.06 1.45 ± 0.05
Urea (mg/dL) 40.72 ± 0.05 40.31 ± 4.84 46.83 ± 7.09 44.16 ± 4.81
BUN (mg/dL) 19.02 ± 2.36 18.82 ± 2.26 21.87 ± 3.31 20.62 ± 2.25
Total Bilirubin (µmol/L) 6.60 ± 2.80 4.97 ± 2.68 7.40 ± 1.84 6.84 ± 2.08
Sodium (mmol/L) 143.04 ± 0.77 142.44 ± 1.11 141.11 ± 0.73 141.13 ± 0.64
Potassium (mmol/L) 4.50 ± 0.28 4.42 ± 0.23 3.95 ± 0.27 3.90 ± 0.30
Chloride (mmol/L) 107.35 ± 1.14 106.75 ± 1.92 106.42 ± 1.13 106.48 ± 1.27
Each value shows mean ± SD.
- significantly higher than control; p≥0.05 (ANOVA + Dunnett’s test)
Table 13: This table represent the clinical chemistry data evaluated after the termination of the control group and treatment group in the
treatment phase in 90-day study.
Male (Number of animals = 10/group) Female (Number of animals = 10/group)
Control
(mg/kg b. wt.)
TGT Primaage (mg/kg b. wt.) Control
(mg/kg b. wt.)
TGT Primaage (mg/kg b. wt.)
0 250 500 1000 0 250 500 1000
Glucose (mg/dL) 155.31 ± 16.93 156.09 ± 13.89 151.21 ± 13.71 155.29 ± 16.77 147.00 ± 12.20 149.32 ± 17.15 147.51 ± 15.63 144.28 ± 14.78
Total Cholesterol (mg/dL) 90.07 ± 23.31 93.80 ± 18.84 90.25 ± 14.60 85.39 ± 19.37 97.88 ± 28.70 110.49 ± 19.34 87.83 ± 17.02 103.00 ± 17.97
Triglycerides (mg/dL) 61.59 ± 14.37 66.23 ± 20.95 59.77 ± 22.28 67.29 ± 21.72 42.01 ± 11.24 41.19 ± 9.30 43.09 ± 10.11 43.75 ± 14.18
Creatinine (mg/dL) 0.58 ± 0.03 0.57 ± 0.03 0.58 ± 0.03 0.59 ± 0.04 0.72 ± 0.03 0.73 ± 0.04 0.71 ± 0.05 0.72 ± 0.03
LDH (U/L) 1111.40 ±
499.69
974.10 ±
353.94
1245.10 ±
482.87
832.60 ±
337.80
645.60 ±
274.48
629.40 ±
317.86
938.10 ±
238.55
717.30 ±
204.63
CK (U/L) 446.28 ± 177.84 377.04 ±
102.06
459.47 ± 173.51 348.24 ±
120.86
417.05 ±
523.61
272.00 ±
131.82
666.42 ±
925.81
366.49 ±
175.31
GGT (U/L) 0.00 ± 0.00 0.00 ± 0.00 0.00 ± 0.00 0.00 ± 0.00 0.00 ± 0.00 0.00 ± 0.00 0.00 ± 0.00 0.00 ± 0.00
ALP (U/L) 91.10 ± 19.84 89.37 ± 12.06 92.27 ± 26.60 98.74 ± 17.77 32.27 ± 7.57 34.68 ± 10.98 38.95 ± 14.32 33.88 ± 11.41
ALT (U/L) 45.90 ± 9.76 45.25 ± 9.54 49.25 ± 10.83 48.75 ± 4.31 46.83 ± 18.80 48.70 ± 26.28 46.98 ± 9.35 44.80 ± 16.20
AST (U/L) 121.60 ± 19.50 121.12 ± 25.40 131.38 ± 42.92 121.52 ± 25.62 125.44 ± 43.07 150.40 ± 92.22 134.38 ± 46.67 117.36 ± 36.93
Calcium (mg/dL) 10.29 ± 0.24 10.34 ± 0.13 10.25 ± 0.18 10.48 ± 0.28 10.83 ± 0.42 11.07 ± 0.41 10.66 ± 0.35 11.19 ± 0.26
Inorganic Phosphorus
(mg/dL)
5.37 ± 0.72 5.49 ± 0.67 5.28 ± 0.42 5.41 ± 0.60 4.44 ± 0.90 4.89 ± 0.85 5.05 ± 0.84 5.30 ± 1.02
Total Protein (g/dL) 6.53 ± 0.20 6.64 ± 0.18 6.62 ± 0.17 6.78 ± 0.29 7.45 ± 0.58 7.67 ± 0.45 7.21 ± 0.37 7.61 ± 0.43
ALB (g/dL) 3.77 ± 0.09 3.78 ± 0.08 3.79 ± 0.07 3.90 ± 0.11 4.40 ± 0.35 4.48 ± 0.25 4.23 ± 0.23 4.50 ± 0.24
GLB (g/dL) 2.76 ± 0.12 2.86 ± 0.11 2.83 ± 0.12 2.88 ± 0.21 3.05 ± 0.24 3.19 ± 0.21 2.97 ± 0.18 3.11 ± 0.23
ALB:GLB 1.37 ± 0.04 1.32 ± 0.03 1.34 ± 0.05 1.36 ± 0.08 1.44 ± 0.05 1.41 ± 0.04 1.43 ± 0.08 1.45 ± 0.07
Urea (mg/dL) 42.77 ± 5.85 40.03 ± 4.67 44.37 ± 4.90 44.58 ± 6.82 44.26 ± 9.10 44.96 ± 6.39 45.88 ± 5.05 45.22 ± 4.56
BUN (mg/dL) 19.98 ± 2.73 18.69 ± 2.18 20.72 ± 2.29 20.82 ± 3.19 20.67 ± 4.25 21.00 ± 2.98 21.42 ± 2.36 21.12 ± 2.13
Total Bilirubin (µmol/L) 4.54 ± 2.01 4.37 ± 1.83 4.52 ± 2.40 5.63 ± 1.47 5.73 ± 2.01 5.52 ± 1.75 5.80 ± 1.47 5.79 ± 1.20
Bile acids (µmol/L) 5.98 ± 2.46 7.32 ± 4.14 7.29 ± 4.71 6.95 ± 2.05 11.80 ± 6.11 10.86 ± 10.29 8.96 ± 4.13 11.33 ± 6.01
Sodium (mmol/L) 143.28 ± 0.82 143.70 ± 0.88 143.26 ± 0.86 143.88 ± 1.22 142.01 ± 1.35 143.30 ± 1.44 142.21 ± 1.53 143.32 ± 1.77
Potassium (mmol/L) 4.39 ± 0.26 4.46 ± 0.17 4.33 ± 0.22 4.31 ± 0.19 4.02 ± 0.38 3.86 ± 0.43 4.06 ± 0.22 4.06 ± 0.38
Chloride (mmol/L) 106.83 ± 0.82 107.09 ± 1.25 106.41 ± 107.23 ± 1.16 105.94 ± 1.48 106.28 ± 2.12 106.47 ± 1.54 106.24 ± 1.97
Each value shows mean ± SD.
- significantly higher than control; p≥0.05 (ANOVA + Dunnett’s test)
The Journal of Phytopharmacology
314
Table 14: This table represent the clinical chemistry data evaluated after the termination of the control group and treatment group in the
recovery phase in 90-day study
Male (Number of animals = 10/group) Female (Number of animals = 10/group)
Control (mg/kg b. wt.) TGT Primaage (mg/kg b. wt.) Control (mg/kg b. wt.) TGT Primaage (mg/kg b. wt.)
0 1000 0 1000
Glucose (mg/dL) 149.27 ± 9.00 150.76 ± 23.44 136.32 ± 17.25 136.61 ± 14.10
Total Cholesterol (mg/dL) 93.37 ± 11.61 88.80 ± 14.83 88.65 ± 19.29 99.20 ± 28.31
Triglycerides (mg/dL) 86.21 ± 25.62 84.37 ± 21.88 52.91 ± 18.48 47.13 ± 15.83
Creatinine (mg/dL) 0.64 ± 0.04 0.64 ± 0.03 0.69 ± 0.07 0.67 ± 0.05
LDH (U/L) 1352.00 ± 498.46 1272.90 ± 644.40 963.10 ± 216.97 931.80 ± 205.32
CK (U/L) 527.20 ± 183.52 510.80 ± 230.69 393.99 ± 104.53 436.39 ± 318.96
GGT (U/L) 0.00 ± 0.00 0.00 ± 0.00 0.00 ± 0.00 0.00 ± 0.00
ALP (U/L) 89.31 ± 12.25 86.54 ± 19.09 32.59 ± 8.14 33.38 ± 7.95
ALT (U/L) 53.25 ± 6.92 62.08 ± 11.21 45.19 ± 18.71 49.97 ± 14.93
AST (U/L) 150.55 ± 45.33 132.07 ± 22.46 132.18 ± 37.61 124.66 ± 28.65
Calcium (mg/dL) 10.22 ± 0.21 10.16 ± 0.23 10.63 ± 0.32 10.58 ± 0.47
Inorganic Phosphorus (mg/dL) 5.49 ± 0.57 5.70 ± 0.78 4.32 ± 0.48 4.70 ± 0.79
Total Protein (g/dL) 6.64 ± 0.15 6.61 ± 0.18 7.35 ± 0.34 7.22 ± 0.66
ALB (g/dL) 3.78 ± 0.09 3.79 ± 0.07 4.35 ± 0.21 4.26 ± 0.38
GLB (g/dL) 2.86 ± 0.09 2.83 ± 0.11 3.00 ± 0.17 2.96 ± 0.29
ALB:GLB 1.32 ± 0.04 1.34 ± 0.04 1.46 ± 0.08 1.44 ± 0.04
Urea (mg/dL) 42.14 ± 3.99 41.27 ± 5.29 48.14 ± 4.54 47.53 ± 6.32
BUN (mg/dL) 19.68 ± 1.86 19.27 ± 2.47 22.48 ± 2.12 22.20 ± 2.95
Total Bilirubin (µmol/L) 5.36 ± 1.79 5.43 ± 1.83 5.09 ± 1.94 3.60 ± 1.88
Bile acids (µmol/L) 11.30 ± 9.18 10.76 ± 4.83 7.05 ± 2.03 16.94 ± 19.05
Sodium (mmol/L) 142.44 ± 0.78 142.65 ± 0.67 142.15 ± 0.83 142.13 ± 1.37
Potassium (mmol/L) 4.52 ± 0.21 4.47 ± 0.47 4.22 ± 0.39 4.15 ± 0.47
Chloride (mmol/L) 105.43 ± 1.14 105.68 ± 1.63 105.42 ± 1.20 105.30 ± 2.81
Each value shows mean ± SD.
- significantly higher than control; p≥0.05 (ANOVA + Dunnett’s test)
Table 15: This table represent the organ weight data evaluated after the termination of the control group and treatment group in 28-day study
Male (Number of animals = 10/group) Female (Number of animals = 10/group)
Organs Control
(mg/kg b. wt.)
TGT Primaage (mg/kg b. wt.) Control
(mg/kg b. wt.)
TGT Primaage (mg/kg b. wt.)
0 250 500 1000 0 250 500 1000
Liver 10.201 ± 1.060 10.084 ± 0.947 10.540 ± 0.601 9.930 ± 0.713 6.742 ± 0.497 6.566 ± 0.532 6.282 ± 0.729 6.695 ± 0.649
Heart 1.032 ± 0.087 1.000 ± 0.083 1.028 ± 0.069 0.997 ± 0.055 0.746 ± 0.067 0.763 ± 0.058 0.723 ± 0.057 0.760 ± 0.060
Spleen 0.602 ± 0.088 0.586 ± 0.092 0.587 ± 0.064 0.547 ± 0.030 0.427 ± 0.055 0.444 ± 0.049 0.415 ± 0.075 0.403 ± 0.044
Brain 2.055 ± 0.133 2.023 ± 0.092 1.986 ± 0.057 1.969 ± 0.056 1.868 ± 0.042 1.888 ± 0.049 1.854 ± 0.071 1.863 ± 0.074
Thymus 0.503 ± 0.139 0.439 ± 0.081 0.465 ± 0.071 0.459 ± 0.063 0.366 ± 0.053 0.390 ± 0.054 0.379 ± 0.064 0.377 ± 0.046
Kidneys 2.195 ± 0.201 2.096 ± 0.153 2.169 ± 0.180 2.085 ± 0.155 1.412 ± 0.105 1.398 ± 0.117 1.311 ± 0.101 1.414 ± 0.113
Adrenals 0.088 ±0.013 0.078 ± 0.013 0.085 ± 0.008 0.081 ± 0.011 0.090 ± 0.010 0.098 ± 0.011 0.086 ± 0.014 0.091 ± 0.006
Testes 3.491 ± 0.369 3.656 ± 0.281 3.515 ± 0.208 3.411 ± 0.355 - - - -
Seminal vesicle with
coagulating glands
1.070 ± 0.192 1.054 ± 0.195 0.986 ± 0.173 0.960 ± 0.159 - - - -
Epididymides 1.149 ± 0.144 1.141 ± 0.080 1.128 ± 0.108 1.103 ± 0.099 - - - -
Ovaries - - - - 0.097 ± 0.008 0.106 ± 0.016 0.096 ± 0.014 0.104 ± 0.015
Uterus with cervix - - - - 0.499 ± 0.139 0.562 ± 0.160 0.602 ± 0.211 0.462 ± 0.109
The Journal of Phytopharmacology
315
Table 16: This table represent the organ weight data evaluated after the termination of the control group and treatment group in treatment phase
of 90-day study
Male (Number of animals = 10/group) Female (Number of animals = 10/group)
Control
(mg/kg b. wt.) TGT Primaage (mg/kg b. wt.)
Control
(mg/kg b. wt.) TGT Primaage (mg/kg b. wt.)
0 250 500 1000 0 250 500 1000
B. wt. (TS) 414.44 ±
31.17
407.63 ±
24.74
423.18 ±
30.54
436.64 ±
50.42
241.88 ±
14.21
247.91 ±
9.35
246.78 ±
17.93
240.54 ±
18.59
Liver 10.40 ± 1.06 10.43 ± 0.73 10.51 ± 0.90 11.37 ± 1.81 6.70 ± 0.56 7.09 ± 0.53 7.34 ± 1.11 7.26 ± 0.72
Heart 1.08 ± 0.05 1.09 ± 0.10 1.14 ± 0.07 1.17 ± 0.13 0.75 ± 0.06 0.82 ± 0.06 0.81 ± 0.09 0.77 ± 0.08
Spleen 0.65 ± 0.08 0.61 ± 0.07 0.66 ± 0.10 0.64 ± 0.10 0.43 ± 0.06 0.40 ± 0.05 0.41 ± 0.07 0.41 ± 0.07
Brain 2.14 ± 0.09 2.11 ± 0.08 2.14 ± 0.12 2.10 ± 0.06 1.93 ± 0.07 1.92 ± 0.08 1.90 ± 0.08 1.92 ± 0.08
Thymus 0.40 ± 0.07 0.40 ± 0.06 0.38 ± 0.06 0.40 ± 0.04 0.28 ± 0.06 0.29 ± 0.05 0.31 ± 0.05 0.31 ± 0.04
Kidneys 2.26 ± 0.17 2.25 ± 0.14 2.38 ± 0.20 2.45 ± 0.30 1.47 ± 0.09 1.52 ± 0.08 1.55 ± 0.14 1.54 ± 0.17
Adrenals 0.07 ± 0.01 0.07 ± 0.01 0.07 ± 0.01 0.07 ± 0.01 0.07 ± 0.02 0.08 ± 0.01 0.08 ± 0.01 0.07 ± 0.01
Testes 3.95 ± 0.38 4.03 ± 0.25 4.01 ± 0.14 3.93 ± 0.32 - - - -
Epididymides 1.47 ± 0.10 1.52 ± 0.10 1.53 ± 0.10 1.55 ± 0.14 - - - -
Prostate + Seminal vesicles with coagulating
glands 2.30 ± 0.20 2.27 ± 0.26 2.43 ± 0.22 2.35 ± 0.35 - - - -
Uterus with cervix - - - - 0.66 ± 0.12 0.68 ± 0.16 0.64 ± 0.08 0.71 ± 0.19
Ovaries with Oviduct - - - - 0.12 ± 0.03 0.12 ± 0.01 0.13 ± 0.02 0.12 ± 0.03
Thyroid with parathyroid 0.02 ± 0.00 0.02 ± 0.00 0.02 ± 0.00 0.02 ± 0.00 0.01 ± 0.00 0.01 ± 0.00 0.02 ± 0.00 0.02 ± 0.00
Each value shows mean ± SD.
- significantly higher than control; p≥0.05 (ANOVA + Dunnett’s test)
Table 17: This table represent the organ weight data evaluated after the termination of the recovery groups of 90-day study
Male (Number of animals = 10/group) Female (Number of animals = 10/group)
TGT Primaage (mg/kg b. wt.) TGT Primaage (mg/kg b. wt.)
Control
(mg/kg b. wt.)
0
1000 Control
(mg/kg b. wt.)
0
1000
B. wt. (TS) 441.49 ± 25.92 433.32 ± 38.78 260.61 ± 24.5 249.91 ± 15.55
Liver 11.09 ± 0.92 10.76 ± 1.35 7.25 ± 0.63 6.91 ± 0.65
Heart 1.16 ± 0.06 1.15 ± 0.11 0.91 ± 0.08 0.84 ± 0.04
Spleen 0.62 ± 0.08 0.60 ± 0.10 0.48 ± 0.08 0.46 ± 0.09
Brain 2.13 ± 0.08 2.13 ± 0.08 1.96 ± 0.07 1.97 ± 0.10
Thymus 0.26 ± 0.04 0.28 ± 0.03 0.28 ± 0.05 0.27 ± 0.05
Kidneys 2.49 ± 0.25 2.35 ± 0.17 1.67 ± 0.20 1.55 ± 0.13
Adrenals 0.07 ± 0.01 0.06 ± 0.01 0.08 ± 0.01 0.08 ± 0.01
Testes 3.99 ± 0.33 3.77 ± 0.17 - -
Epididymides 1.49 ± 0.14 1.41 ± 0.10 - -
Prostate + Seminal vesicles with coagulating glands 2.50 ± 0.36 2.41 ± 0.30 - -
Uterus with cervix - - 0.78 ± 0.19 0.66 ± 0.12
Ovaries with Oviduct - - 0.14 ± 0.02 0.13 ± 0.02
Thyroid with parathyroid 0.03 ± 0.00 0.03 ± 0.00 0.02 ± 0.00 0.02 ± 0.00
Each value shows mean ± SD.
- significantly higher than control; p≥0.05 (ANOVA + Dunnett’s test)