Embed Size (px)
Citation preview
TECHNISCHE UNIVERSITÄT MÜNCHEN
Lehrstuhl für Technische Chemie II
Selective Oxidation of Propane to Acrylic Acid over
MoVTe(Sb)NbOx Catalysts
Frederik Nikolaus Naraschewski
Vollständiger Abdruck der von der Fakultät für Chemie
der Technischen Universität München zur Erlangung des akademischen Grades eines
Doktors der Naturwissenschaften (Dr. rer. nat.)
genehmigten Dissertation.
Vorsitzender: Univ.-Prof. Dr. K.-O. Hinrichsen
Prüfer der Dissertation: 1. Univ.-Prof. Dr. J. A. Lercher
2. Univ.-Prof. Dr. K. Köhler
Die Dissertation wurde am 07.03.2011 bei der Technischen Universität München
eingereicht und durch die Fakultät für Chemie am 11.05.2011 angenommen.


Das große Ziel der Bildung ist nicht Wissen,
sondern Handeln.
Herbert Spencer

Die vorliegende Arbeit entstand in der Zeit von Januar 2006 bis März 2011 unter
der Leitung von Prof. Dr. J. A. Lercher am Lehrstuhl für Technische Chemie II
der Technischen Universität München.

Acknowledgements
First, I would like to thank Johannes (Prof. J. A. Lercher) for giving me the chance to work in
his team on this very exciting project. Thank you for your trust in me to design my own set-
up, your support with my publications and your help, guidance and also criticism in all
discussions. This time was really an exciting period, I learned very much and enjoyed it
(almost) the whole time. Thank you also for giving me the chance to visit and present my
results at several national and international conferences.
I would like to thank Andy (PD Dr. A. Jentys) for his advice during the operational work on
my thesis, many very helpful discussions and for his support in correcting my paper drafts.
I want to thank the “EliteNetzwerk Bayern” for the possibility to participate in the NanoCat
Program and the financial support during my time at TC-II. The meetings and discussions
were always helpful and the after-meeting programs were even better. Thanks to Dr. Drees for
doing the coordination of this program.
The experimental work would have been very difficult without the help of Xaver. Thank you
for your support with handling set-up problems and to ensure the gas supply. Furthermore, I
like to thank Martin and Andreas for their help with analytics and electronic stuff.
I would like to thank my diploma student Dani who did a great job in synthesizing the perfect
pure Antimony catalysts.
The everyday work would have been much harder without my friends at TC-II. Thank you
Jürgen, Matteo, Flo, Stephan and Carsten for being my friends and for many really funny
moments. I hope that “Kicker will never be forbidden again”. Thanks to Michael for never
ending “Ching-Chang-Chong” playing in various styles (regular, fast, long distance, etc…). I
also like to thank Sarah, Dani, Sabine, Sonja, Oliver, Anna, Richard, Manu, Ana and Claudia
for many funny evening events, Wies’n - including rollercoaster - and challenging tequila
parties. Thank you Manuel for your support with set-up construction and lab-maintenance,
countless discussions about the economy, especially the employment market, and optimized

strategies in Travian. Also thanks to Aon, Elvira, Andi, Dechao, Herui, Ben and Virgina for
the good atmosphere in our working group.
Very special thanks to Martina, who supported me in various ways at and after work.
Finally I would like to thank my parents for their outsized support during my time at
university. Without your help I wouldn’t have had the chance to study chemistry in Munich
and to write this doctoral thesis. Thank you for everything!
Frederik
March, 2011
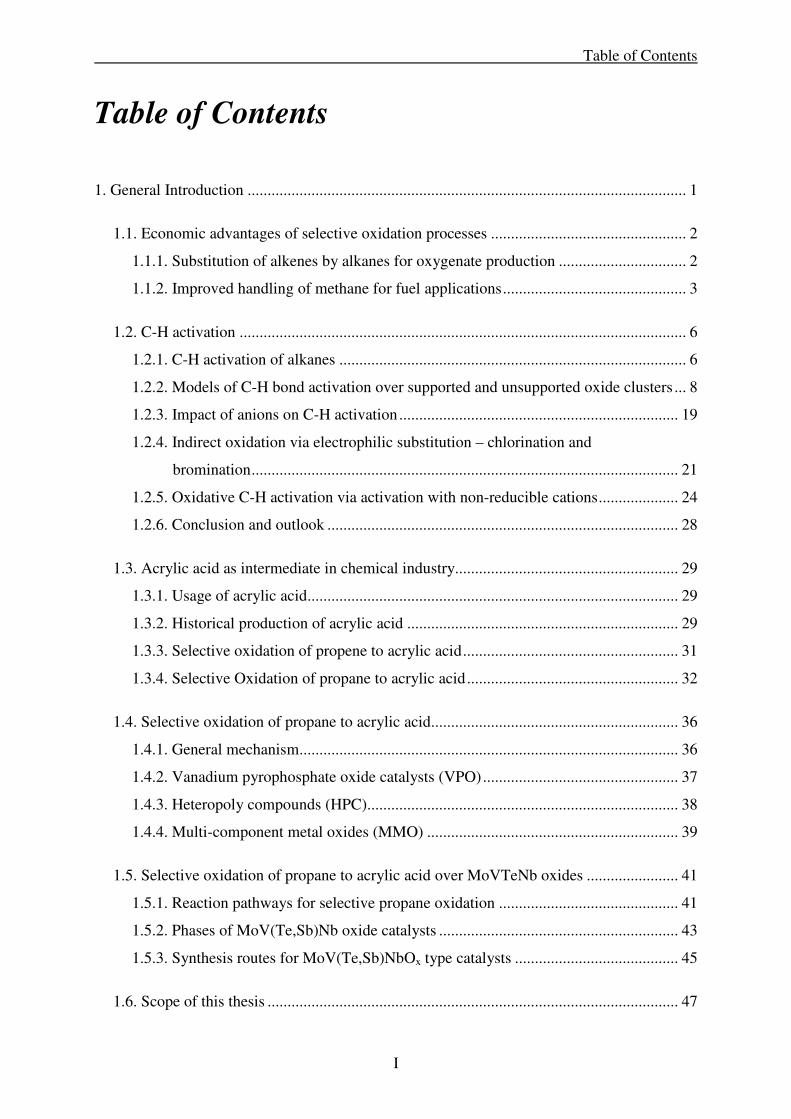
Table of Contents
I
Table of Contents
1. General Introduction .............................................................................................................. 1
1.1. Economic advantages of selective oxidation processes ................................................. 2
1.1.1. Substitution of alkenes by alkanes for oxygenate production ................................ 2
1.1.2. Improved handling of methane for fuel applications .............................................. 3
1.2. C-H activation ................................................................................................................ 6
1.2.1. C-H activation of alkanes ....................................................................................... 6
1.2.2. Models of C-H bond activation over supported and unsupported oxide clusters ... 8
1.2.3. Impact of anions on C-H activation ...................................................................... 19
1.2.4. Indirect oxidation via electrophilic substitution – chlorination and
bromination ........................................................................................................... 21
1.2.5. Oxidative C-H activation via activation with non-reducible cations .................... 24
1.2.6. Conclusion and outlook ........................................................................................ 28
1.3. Acrylic acid as intermediate in chemical industry........................................................ 29
1.3.1. Usage of acrylic acid ............................................................................................. 29
1.3.2. Historical production of acrylic acid .................................................................... 29
1.3.3. Selective oxidation of propene to acrylic acid ...................................................... 31
1.3.4. Selective Oxidation of propane to acrylic acid ..................................................... 32
1.4. Selective oxidation of propane to acrylic acid.............................................................. 36
1.4.1. General mechanism ............................................................................................... 36
1.4.2. Vanadium pyrophosphate oxide catalysts (VPO) ................................................. 37
1.4.3. Heteropoly compounds (HPC) .............................................................................. 38
1.4.4. Multi-component metal oxides (MMO) ............................................................... 39
1.5. Selective oxidation of propane to acrylic acid over MoVTeNb oxides ....................... 41
1.5.1. Reaction pathways for selective propane oxidation ............................................. 41
1.5.2. Phases of MoV(Te,Sb)Nb oxide catalysts ............................................................ 43
1.5.3. Synthesis routes for MoV(Te,Sb)NbOx type catalysts ......................................... 45
1.6. Scope of this thesis ....................................................................................................... 47

Table of Contents
II
1.7. References .................................................................................................................... 49
2. Experimental Section ........................................................................................................... 55
2.1. Standard preparation of MoV(Te,Sb)Nb oxides .......................................................... 56
2.2. Catalytic testing ............................................................................................................ 57
2.2.1. Experimental reactor set-up .................................................................................. 57
2.2.2. Evaluation of kinetic data ..................................................................................... 60
2.3. Characterization of catalysts ......................................................................................... 63
3. Phase Formation and selective Oxidation of Propane over MoVTeNbOx
Catalysts with varying Compositions ................................................................................... 65
3.1. Introduction .................................................................................................................. 66
3.2. Experimental ................................................................................................................. 69
3.2.1. Catalyst preparation .............................................................................................. 69
3.2.2. Catalyst characterization ....................................................................................... 69
3.2.3. Catalytic activity ................................................................................................... 71
3.3. Results .......................................................................................................................... 72
3.3.1. Variation of tellurium content in the synthesis gel ............................................... 72
3.3.2. Variation of the vanadium content in the synthesis gel ........................................ 74
3.3.3. Variation of niobium-content in the synthesis gel ................................................ 75
3.4. Discussion ..................................................................................................................... 76
3.4.1. Influence of chemical composition upon phase concentrations ........................... 76
3.4.2. Catalytic activity, phase composition and chemical composition ........................ 78
3.5. Conclusions .................................................................................................................. 81
3.6. Acknowledgements ...................................................................................................... 82
3.7. References .................................................................................................................... 83
3.8. Supplementary material ................................................................................................ 84

Table of Contents
III
4. On the Role of the Vanadium Distribution in MoVTeNbOx mixed Oxides for the
selective catalytic Oxidation of Propane .............................................................................. 89
4.1. Introduction .................................................................................................................. 90
4.2. Experimental ................................................................................................................. 93
4.2.1. Catalyst preparation .............................................................................................. 93
4.2.2. Catalyst characterization ....................................................................................... 94
4.2.3. Catalytic activity ................................................................................................... 95
4.3. Results .......................................................................................................................... 97
4.4. Discussion ................................................................................................................... 102
4.5. Conclusions ................................................................................................................ 109
4.6. Acknowledgments ...................................................................................................... 110
4.7. References .................................................................................................................. 111
5. Synthesis and Acid Properties of MoVSb and MoVTeNb Oxides for the
selective Oxidation of Propane to Acrylic Acid ................................................................. 113
5.1. Introduction ................................................................................................................ 114
5.2. Experimental ............................................................................................................... 116
5.2.1. Catalyst preparation ............................................................................................ 116
5.2.2. Catalyst characterization ..................................................................................... 117
5.2.3. Catalytic activity ................................................................................................. 118
5.3. Results ........................................................................................................................ 119
5.4. Discussion ................................................................................................................... 126
5.5. Conclusions ................................................................................................................ 129
5.6. Acknowledgments ...................................................................................................... 130
5.7. References .................................................................................................................. 131

Table of Contents
IV
6. Summary ............................................................................................................................ 133
6.1 Summary ...................................................................................................................... 134
6.2 Zusammenfassung ....................................................................................................... 136
Curriculum vitae ..................................................................................................................... 139
List of publications ................................................................................................................. 141
List of Abbreviations
V
List of Abbreviations
As Arsenic
at. % atomic per cent
B Boron
BET Brunauer-Emmett-Teller adsorption isotherm
c Concentration
C Carbon
°C Degree Celsius
CNG Compressed natural gas
d Day
DFT Density functional theory
E Lone electron pair
FID Flame ionization detector
g Gram
G Gibbs energy
Gbbl Giga Barrel
GC Gas chromatography
Ge Germanium
GWP Global warming potential
h Hour
H Hydrogen
HPC Heteropoly compound
K Kelvin
kJ Kilo joule
kx Kinetic constants
l Liter
LNG Liquefied natural gas
mg Milligram
min Minute
ml Milliliter
mln Normal milliliter (defined at 0 °C and 1013.25 mbar)
mm Millimeter

List of Abbreviations
VI
µm Micrometer
MMO Multi-component metal oxide
Mo Molybdenum
Nb Niobium
O Oxygen
P Phosphorus
PE Polyethylene
PET Polyethylene terephthalate
PO Polypropylene oxide
PP Polypropylene
PVC Polyvinylchloride
s Second
Sb Antimony
Si Silicon
T Temperature
TCD Thermal conductivity detector
Te Tellurium
TPD Temperature Programmed Desorption
THF Tetrahydrofuran
UCC Union Carbide Corporation
USD US-Dollar
V Vanadium
VPO Vanadium pyrophosphate oxide
wt. % weight per cent
XRD X-ray diffraction
Chapter 1
1
Chapter 1
General Introduction
Abstract
This chapter introduces the general background of selective oxidation processes and in
particular in C-H activation over solid oxide catalysts. The industrial usage of acrylic acid is
described and historical, common and selective oxidation production processes with
MoV(Te,Sb,Nb) oxide catalysts are discussed.

Chapter 1
2
1.1. Economic advantages of selective oxidation processes
1.1.1. Substitution of alkenes by alkanes for oxygenate production
In modern chemical industry polymers, solvents, lacquers and fine chemicals are synthesized
starting from small molecules like methanol, formaldehyde, or ethene. These building blocks
usually contain between one and four carbon atoms and need a suitable functionality to enable
reactions to target molecules. A list of the most important starting materials is shown in Table
1.1. Production of these building blocks starts from carbon sources like crude oil or natural
gas that are further processed by steam reforming or steam cracking.[1]
The major drawbacks of these processes are the high energy consumption of reforming or
cracking steps. Process temperatures between 950 and 1200 K require a high amount of fossil
fuel for heat production and the complex product distributions obtained under these
conditions demand additional energy intensive separation steps. As a result, theses processes
are of high costs and therefore reaction routes starting from alkenes are more expensive than
the corresponding routes using alkanes that are directly available from natural gas sources.
Hence direct oxidations of alkanes to desired oxygenates is one of the „Holy Grails“ of the
petro chemistry and would have enormous economic advantage in comparison to the
conventional process starting with alkenes.[2]

Chapter 1
3
Table 1.1: Important intermediates of the chemical industry.[1]
Building block Production Usage
Methanol Steam reforming of CH4,
synthesis from syngas
Acetic acid (Monsanto-process),
Methyl ester, Methyl ether,
Methylamines, fuel
Formaldehyde Oxidation of methanol fine chemicals, polymers
Ethene Steam cracking of naphtha Polyethylene (PE), PVC,
Acetaldehyde (Wacker-process)
Ethylene oxide Oxidation of ethene Ethylene glycol, PET
Propene Steam cracking of naphtha Polypropylene (PP), Acrolein,
Acrylic acid, Acrylonitril, PO
Acrylic acid Oxidation of propene Polymers
Propylene oxide
(PO) Oxidation of propene Propylene glycol
Maleic anhydride n-Butane oxidation Unsaturated Polyester, 1,4-
Butanol, THF
1.1.2. Improved handling of methane for fuel applications
One of the biggest challenges for the next decades is the supply with energy for heating and
transportation purposes. Nowadays crude oil is used for both applications. Although newer
technologies improve exploration and lead to an increase of proven reserves
(1987: 910.2 Gbbl; 1997: 1069.3 Gbbl; 2007: 1237.9 Gbbl), the reserves are still limited and
new energy sources are needed for the future.
A possible alternative is to cover the demand with natural gas. Natural gas is a mixture of
light hydrocarbons consisting mainly of methane. The proven reserves of natural gas are
177.36 trillion cubic meters for 2007,[3] whereof 170 cubic meters are the energy equivalent to
one barrel of oil (159 liters). Therefore, the reserves of natural gas are equal to 1037 Gbbl of
crude oil and are comparable to the oil reserves of 1238 Gbbl. The worldwide distribution of
crude oil and natural gas reserves in crude oil equivalents is shown in Figure 1.1.

Chapter 1
4
Figure 1.1: Proved reserves of crude oil and natural gas.[3]
Natural gas is still underutilized for the applications described above. The main problem is
that methane is a gaseous compound and therefore pipeline systems are needed for
transportation. Also, gas fields are spread over large areas, making pipeline constructions
uneconomic. Transport of compressed methane is not a favorable method either. The energy
density of CNG of 1344 kJ/l (at 50 bar and 298 K) is low.[4] Furthermore, handling of
compressed gas is costly. Another possibility is the liquidation of the gas. The energy density
of LNG is with 16.128 kJ/l much higher than for CNG, but the low boiling point of methane
(111 K) leads to costs of cooling of approximately one quarter of the transported energy. The
construction of chiller/condenser units is only practiced for very large gas fields, whereas
small fields of methane are not used and the gas is simply burnt off, because methane is also a
strong greenhouse gas that has a global warming potential of 21. This means that 1 g methane
have the same warming potential as 21 g carbon dioxide. The GWP is calculated respecting
efficiency of radiation adsorption over the complete lifetime of the compound. So burning of
unused methane makes sense, but usage of the gas would be preferable.[5]
Proven reserves at end 2007 oil in Gbbl (left), natural gas in Gbbl oil equivalents (right)
North America
Asia Pacific
S. & Cent. America
Africa Europe & Eurasia
Middle East

Chapter 1
5
An alternative to pipeline construction or liquidation is transformation to methanol. The
energy density of methanol of 15.834 kJ/l is comparable to LNG, and with a boiling point of
338 K methanol is liquid at standard conditions and no special cooling dispositions have to be
taken. The only inconveniences of methanol are the toxicity and the flammability, which exist
also for gasoline and crude oil. Therefore methanol is a perfect form for an energy carrier
based on methane.[4]
Unfortunately, up to now no direct processes to convert methane into methanol with high
yields are available. Methanol is currently produced from methane by a detour over carbon
monoxide. In this process methane is reformed with water to carbon monoxide and hydrogen
(syngas). In a second reaction step carbon monoxide is hydrogenated to methanol. This
conventional process needs large equipment and is therefore immobile. Also, this route over
carbon mono oxide leads to high energy demand, so that this process is not economic for
large methanol production, used as a gasoline substitute.[1]
The most economic solution for converting methane to more convenient methanol is selective
methane oxidation. This process is therefore of high economic interest for the usage of natural
gas resources.
Chapter 1
6
1.2. C-H activation
1.2.1. C-H activation of alkanes
Activation of C-H bonds coupled to the functionalization of the carbon atom is one of the
most important and challenging elementary reaction steps in organic synthesis. The challenge
does not only lie in the homolytic or heterolytic cleavage of the bond itself, in most cases it
has to occur under as mild as possible conditions to allow the subsequent reactions to proceed
under very controlled conditions. As a result, highly active catalysts are needed and the
elementary steps in these reactions are dominated by single electron processes and homolytic
C-C bond cleavage, when oxygen is involved, while heterolytic C-H bond breaking is
observed only in the minority of cases.
The C-H bond activation and conversion of alkanes in refining processes are somewhat more
facile to realize, as the more robust target molecules allow for higher reaction temperatures.
Two activation principles dominate, i.e., homolytic cleavage of C-H bonds on metals leading
to elimination of hydrogen, a reaction, which is mostly equilibrated under reaction conditions
and the acid catalyzed addition of a proton to an alkane leading to a carbonium ion, which
decomposes spontaneously to smaller fragments and a carbenium ion as well as the
abstraction of a hydride leading directly to the formation of a carbenium ion. Thus, the
kinetically dominating C-H activation steps in refining are dominated by processes in which
the C-H activation occurs via an ionic bond separation.[6, 7]
While it is hardly used for the synthesis of energy carriers, selective oxidation is one of the
key reactions in chemical industry. Rough estimated, the worth of chemicals produced by
catalytic oxidation processes lies between 20 and 40 billion USD in 1991.[8] Especially for the
synthesis of intermediates and fine chemicals the pressure to change the feedstock in the
chemical industry over the last decade arising from a combination of the limited availability
of conventional starting molecules and the pressure to shift to less expensive ones forced the
use of alkanes rather than alkenes in many of the selective oxidation routes to functionalized
chemicals. This has led in turn to an intense interest in selective oxidation, but has only
materialized in few heterogeneously catalyzed reactions among which butane to maleic
anhydride [9-11] or the oxidation of propane to acrylic acid and the ammoxidation of propane to
acrylonitrile [12-14] being the most prominent ones.

Chapter 1
7
Understanding the complexity of the catalysts and the multi-step multi-electron processes
during selective oxidation at an atomistic and molecular level poses a formidable challenge.
More than with any other type of catalytic reaction, it requires that the catalysts are
characterized chemically and structurally under realistic reaction conditions in order to be
able to draw meaningful conclusions with respect to the surface chemistry (operando
investigations). This is related to the fact that the sites active for catalysis are only present in
small concentrations and that the catalysts change their oxidation state and surface structure in
dependence of exogenic influences such as atmosphere, pressure or temperature. In addition,
especially alkanes are rather inactive interacting mostly through dispersion forces with oxide
surfaces.[15]
The reason for the inertness of alkanes is related to the situation that for carbon and hydrogen
the number of valence electrons is equal to the number of valence orbitals and only σ-bonds
are present. Reactive modification of these energetically low lying highest occupied
molecular orbitals or energetically high lying lowest unoccupied molecular orbitals requires
very reactive moieties such as radicals or high temperatures. Additionally, the tetrahedral
coordination of the carbons in sp3-hybridization efficiently shields the carbon atoms and
complicates possible attacks together with the low polarity of the C-H bond. The primary
products after activation contain functional groups or hetero atoms and, however, are by far
more reactive and susceptible for further chemical reactions.
In consequence, the activation of the first C-H bond is the rate determining step and after
addition of the more electronegative substituent to the desired extent the reaction needs to be
kinetically stabilized to prevent total oxidation. Thus, achievable yields in these reactions are
strictly depending on the ratio of the rate constants for activation to (unwanted) further
oxidation (k1:k2). Maximum yields in a selective oxidation reaction for a model of two
consecutive first order reactions are shown as example in Figure 1.2. To reach yields above
70% k1 needs to be at least one magnitude larger than k2, posing a major challenge for the
design of catalysts and the process environment.

Chapter 1
8
Figure 1.2: Maximum achievable yield versus
ratio of activation to (unwanted) further oxidation.
For this chapter we will limit ourselves to the discussion of the oxidative activation of the C-
H bond in alkanes. Model experiments, kinetic analysis of complex reactions and theoretical
studies will be combined to provide an overview on the current state of insight into the
processes as well as their potential and limitations. We will first discuss processes on oxide
clusters, followed by the influence of anions and cations on the activation mechanism and
finally cover bifunctional catalysts used to achieve oxidative functionalization.
1.2.2. Models of C-H bond activation over supported and unsupported
oxide clusters
We will first discuss the chemistry of small alkanes such as ethane, propane and butane
because of the easier C-H activation in these molecules and will treat methane activation as a
special point. This is done so as with all these molecules the activated alkanes are able to
eliminate hydrogen and may desorb, while this is not possible with methane. It should be
emphasized that except for the higher bond strength of the C-H bond of primary carbon
atoms, the other principal chemistry will be the same in the initial C-H bond breaking or
polarizing step.
Vanadium based clusters
C-H activation on catalysts containing vanadium oxide species is certainly the most widely
studied elementary reaction related to the wide variety of catalysts based on vanadia. The
0.0
0.2
0.4
0.6
0.8
1.0
0.01 0.1 1 10 100Ratio k1:k2
Ma
x.
yie
ld i
nte
rme
dia
te

Chapter 1
9
catalytic properties of the vanadium moieties are affiliated with the redox properties of
vanadium which changes its oxidation states between +III, +IV and +V.[10, 11, 16-21] The initial
step of the C-H activation is so difficult to assess, because the precursor to the homolytic
cleavage does not necessarily involve polarization of the C-H or the V-O bonds. Thus, only
the final states of the first reaction would be accessible to the spectroscopic characterization.
Most of the experimental studies initially addressed were focused on supported monolayers of
vanadia clusters on oxide surfaces. Pioneering systematic studies came from the groups of
Wachs [22] and Iglesia and Bell.[23] The surface geometry of these clusters was determined
with a multitude of indirect spectroscopic characterizations. Overall, it was suggested that
monomers, dimers and oligomers are present on the surface (see Figure 1.3) and that the
catalytic reactivity and the oxidation state
depends critically on the size of the
surface cluster.[24] With increasing cluster
size of the surface bound vanadia the
reactivity towards alkanes increased. The
same trend was observed with decreasing
electronegativity of the support
(according to Sanderson) indicating that a
lower charge at the terminal oxygen
facilitates C-H bond breaking in the
activation of propane.[25] It is interesting
to note that the selective oxidation of
methanol exhibits the reverse influence
of the support oxide, i.e., the catalysts
were more active as the charge at the lattice oxygen increased.[26]
One of the central issues in these experimental studies concerned questions with respect to the
nature of the active oxygen species or more specific the functional group involved in breaking
the first C-H bond. In principle three V-O bonds can be distinguished, the terminal V=O
bond, the bridging V-O-V bond and the bridging V-O-support bond. For activation of ethane
and propane [27-29] the V-O-V bond was concluded to be catalytically irrelevant as the turnover
frequency did not change with the coverage of the support by vanadia species, which should
increase the relative concentration of this species. Also the concentration of the V=O groups
V
O
OO O
SS
S
V
O O
O V O V
O O O
O OO
S S S S S
Low Surface Coverage High Surface Coverage
Isolated Surface VO4 Species Polymeric Surface VO4 Species
V
O O
O V O V
O O O
O OO
Oxide Support
V2O5 Crystallites
Crystalline V2O5 Nanoparticles Above Monolayer Surface Coverage
Figure 1.3: Supported vanadium
oxide catalysts.
Chapter 1
10
did not influence the observed rate of alkane activation leaving the V-O-support bond to be
the only remaining oxygen, which was then also concluded to be catalytically active.
However, as this rationale is based on an indirect elimination following more plausibility than
rigorous proof, let us turn to model studies using well defined clusters in the gas phase
combined with modeling of the structures and barriers between the intermediates. These
clusters may be charged in order to increase their reactivity without changing the relative
reactivity of the oxygen atoms in the cluster. The first well defined case of such an approach
was a study of the oxidation of propane on a [V3O7]+ cluster by the groups of Schwarz and
Sauer.[30, 31] The cluster was chosen, as it is the smallest polynuclearentity that formally
contains only V in +5 oxidation state. The oxidative dehydrogenation of propane involves the
reduction of the metal center, brought about by the addition of two hydrogen atoms.
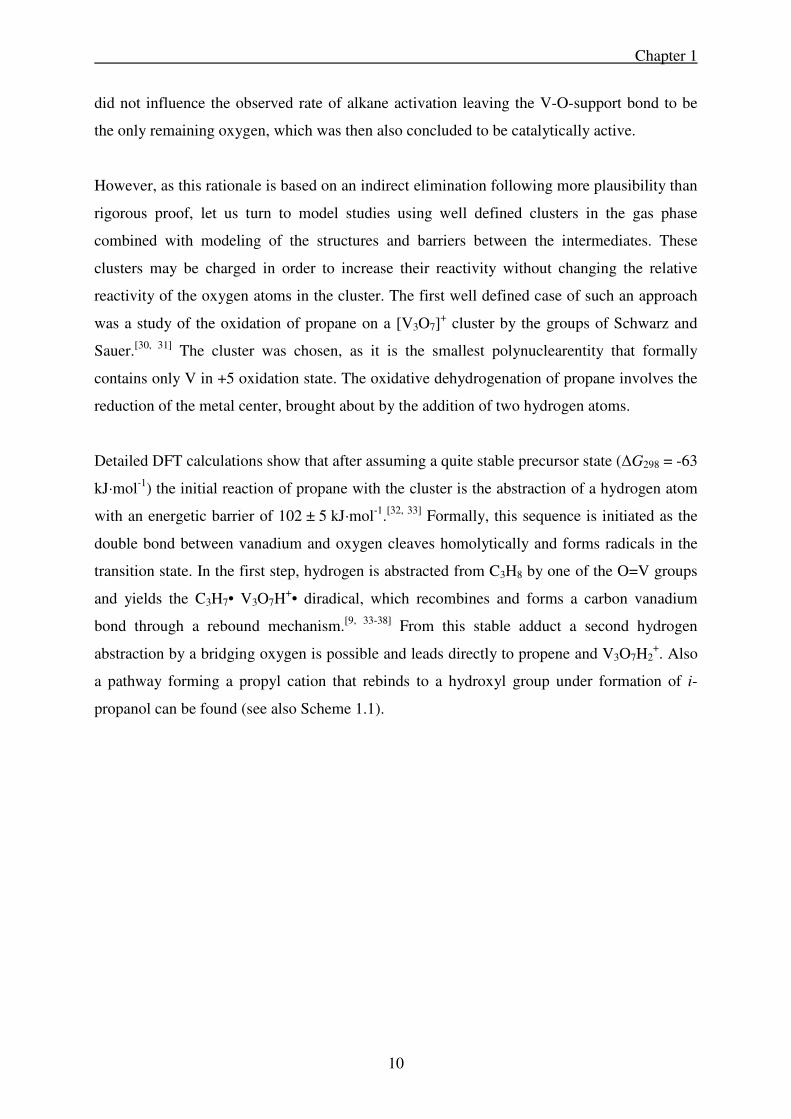
Detailed DFT calculations show that after assuming a quite stable precursor state (∆G298 = -63
kJ·mol-1) the initial reaction of propane with the cluster is the abstraction of a hydrogen atom
with an energetic barrier of 102 ± 5 kJ·mol-1.[32, 33] Formally, this sequence is initiated as the
double bond between vanadium and oxygen cleaves homolytically and forms radicals in the
transition state. In the first step, hydrogen is abstracted from C3H8 by one of the O=V groups
and yields the C3H7• V3O7H+• diradical, which recombines and forms a carbon vanadium
bond through a rebound mechanism.[9, 33-38] From this stable adduct a second hydrogen
abstraction by a bridging oxygen is possible and leads directly to propene and V3O7H2+. Also
a pathway forming a propyl cation that rebinds to a hydroxyl group under formation of i-
propanol can be found (see also Scheme 1.1).

Chapter 1
11
Scheme 1.1: Reaction pathways of propane with V3O7+.
These experiments demonstrate unequivocally and in
agreement with the conclusions by Wachs et al. that V-O-V
oxygen does not participate in the initial C-H bond activation.
The vanadyl group, however, is indicated in these studies as the
decisive reactive oxygen containing group. However, this
cluster does not contain bridging oxygen to another oxide,
which has been concluded to be the active site. In order to
mimic such bridging oxygen between V and a support cation,
vanadium substituted silsequioxane cluster has been used
(Figure 1.4).[35]
The calculations show that also in this case the first hydrogen abstraction at the vanadyl group
is the rate determining step. This practically rules out the involvement of the oxygen link to
the surface as the oxygen initiating the overall reaction sequence. In passing it is interesting to
note that in a recent contribution also the generation of a peroxovanadate has been proposed
that could explain the much higher reactivity of oxygen compared to N2O (which cannot form
a peroxovanadate) in pulse experiments.[39]
Si O V
O
Si O Si
OO
Si
O
Si O
O
Si
O
Si O
OO H
HH
H
HH
H O
Figure 1.4: Vanadium
substituted silsequioxane.
Chapter 1
12
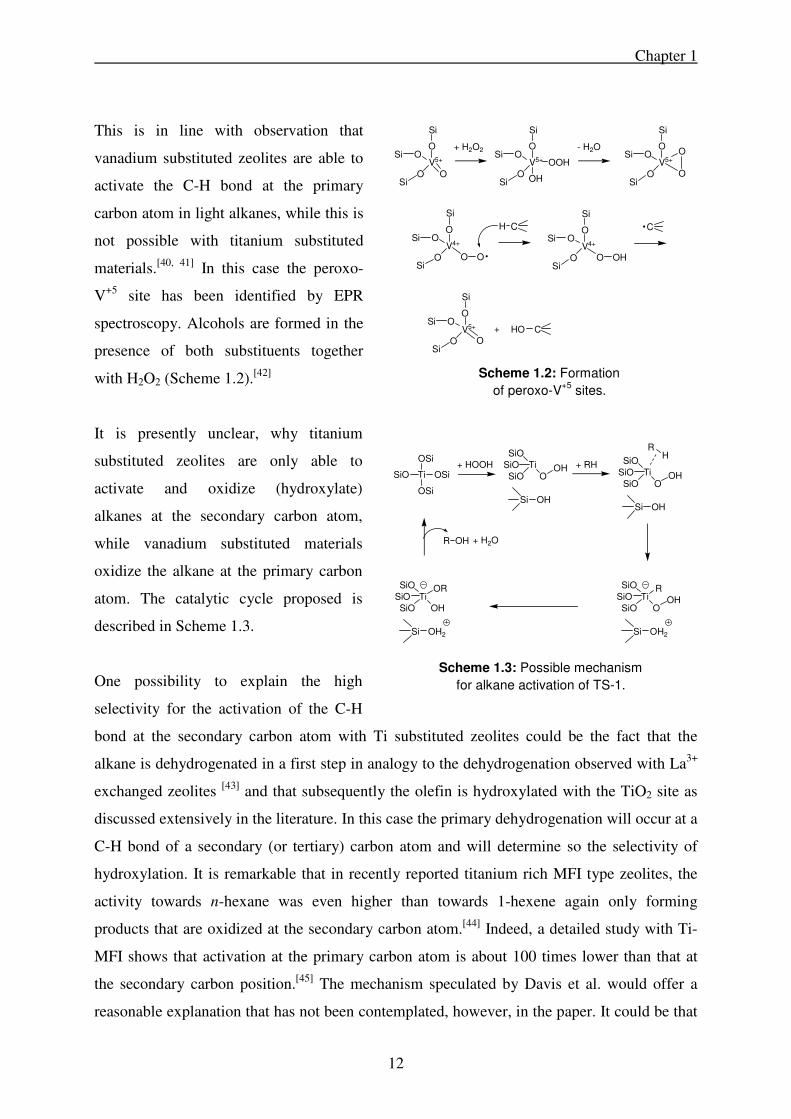
This is in line with observation that
vanadium substituted zeolites are able to
activate the C-H bond at the primary
carbon atom in light alkanes, while this is
not possible with titanium substituted
materials.[40, 41] In this case the peroxo-
V+5 site has been identified by EPR
spectroscopy. Alcohols are formed in the
presence of both substituents together
with H2O2 (Scheme 1.2).[42]
It is presently unclear, why titanium
substituted zeolites are only able to
activate and oxidize (hydroxylate)
alkanes at the secondary carbon atom,
while vanadium substituted materials
oxidize the alkane at the primary carbon
atom. The catalytic cycle proposed is
described in Scheme 1.3.
One possibility to explain the high
selectivity for the activation of the C-H
bond at the secondary carbon atom with Ti substituted zeolites could be the fact that the
alkane is dehydrogenated in a first step in analogy to the dehydrogenation observed with La3+
exchanged zeolites [43] and that subsequently the olefin is hydroxylated with the TiO2 site as
discussed extensively in the literature. In this case the primary dehydrogenation will occur at a
C-H bond of a secondary (or tertiary) carbon atom and will determine so the selectivity of
hydroxylation. It is remarkable that in recently reported titanium rich MFI type zeolites, the
activity towards n-hexane was even higher than towards 1-hexene again only forming
products that are oxidized at the secondary carbon atom.[44] Indeed, a detailed study with Ti-
MFI shows that activation at the primary carbon atom is about 100 times lower than that at
the secondary carbon position.[45] The mechanism speculated by Davis et al. would offer a
reasonable explanation that has not been contemplated, however, in the paper. It could be that
V5+
OO
O O
Si
Si
Si
+ H2O2
V5+
OO
O
Si
Si
Si
OOH
OH
- H2O
V5+
OO
O
Si
Si
SiO
O
V4+
OO
O
Si
Si
SiO O
H C
V4+
OO
O
Si
Si
SiO OH
C
V5+
OO
O
Si
Si
SiO
CHO+
Ti
OSi
SiO
OSi
OSiSiO Ti
SiO
SiO OOH
Si OH
+ HOOHSiO Ti
SiO
SiO OOH
Si OH
RH
+ RH
SiO Ti
SiO
SiO OOH
Si OH2
RSiO Ti
SiO
SiO OH
Si OH2
OR
R OH + H2O
Scheme 1.2: Formation
of peroxo-V+5
sites.
Scheme 1.3: Possible mechanism
for alkane activation of TS-1.

Chapter 1
13
the synergetic interaction between the (basic) oxygen at the SiOH group and the accessible Ti
leads to a heterolytic cleavage of the C-H bond (which is significantly easier at the secondary
carbon atom) and the formation of a Ti-C bond as postulated. The subsequent ß-hydride
elimination leads to the formation of an olefin, which in turn is rapidly hydroxylated on the
titanium sites.[46]
Molybdenum and Tungsten oxide clusters
While vanadium based transition metal oxide clusters are the most studied, other transition
metal oxides and in particular those based on molybdenum and tungsten also show
remarkable catalytic activity. It interesting to compare in this case the differences in the
particular surface chemistry induced by the metal cation and by the surface structure.
Similar to vanadium, molybdenum based oxides activate the C-H bond also via a homolytic
cleavage at a molybdenyl group. This is concluded from experimental and computational
studies linking the presence of the Mo=O group to the activity of the catalytic material.[47, 48]
As much as these results seem to emphasize the similarities to the supported vanadia
catalysts, important differences between the two systems exist. The rate normalized to the
accessible Mo at the surface increases drastically as the surface concentration of Mo increases
(note the contrast to the equal catalytic activity in a similar relation for vanadia clusters).
However, what is even more striking is the fact that the ratio of the rate constants between the
initial oxidative elimination of hydrogen from propane increases, while that of total oxidation
either from propane or from propene decreases. This suggests that the sites for the unselective
reactions have to be related to sites at the interface between the support (Al2O3 in the study
cited [47]) and the molybdenum oxide species on the surface. The molybdenum oxide species
show overall a higher reducibility in H2 with increasing
surface concentration. The rate of the supported
molybdenum oxide species reducibility (at 673 K) is directly
proportional to the rate of oxidative dehydrogenation and
hence to the rate of C-H activation, which constitutes the rate
determining step in oxidative dehydrogenation. DFT
calculations of the C-H activation in propane on trimeric Mo
oxide clusters indicate that the lowest barrier exists for the
hydrogen abstraction from the secondary carbon atom of propane by one of the terminal
oxygen atoms in a one electron process (Figure 1.5).
Figure 1.5: Hydrogen
abstraction on Mo oxide cluster.

Chapter 1
14
Reaction steps involving two electrons and acid-base type interactions have energetic barriers,
which are more than 50 kJ·mol-1 higher emphasizing the unlikeliness of such reaction
pathways.[48] Also pathways involving the simultaneous cleavage of two C-H bonds are
highly unlikely. Comparing the C-H activation of propane with that in methane one notes that
again the one electron process has the lowest energetic barrier, but that this barrier (according
to experiments and DFT calculations) is at least 60 kJ·mol-1 higher than in case of propane
emphasizing the difficulty to break the C-H bond of methane on these catalysts.[49]
These experiments suggest that the cleavage of the C-H bond is a one electron process also
for Mo oxides and is the more facile the weaker the C-H bond is. Given the weaker C-H bond
in propene (compared to propane) one might ask if propene formed will not be immediately
consumed in a sequential activation/oxidation leading to very low selectivities. Let us analyze
the situation in this respect by comparing the simplest oxidative activation, the oxidative
dehydrogenation of propane with the further reaction of propene, the dominating primary
product. For the former reaction, the relative activities for between ZrO2 supported vanadium,
molybdenum and tungsten oxides decrease in the order VOx/ZrO2 < MoOx/ZrO2 < WOx/ZrO2,
while the corresponding apparent energies of activation increase in that order.[50] This
indicates that the activities are inversely proportional to the C-H bond cleavage energies. The
activation energies of propane oxidative dehydrogenation are higher than for further total
oxidation of propene. The difference in the activation energies (48-61 kJ·mol-1) is larger than
between bond dissociation enthalpies for the weakest C-H bond in propane and propene (40
kJ·mol-1). It increases in the sequence VOx/ZrO2 < MoOx/ZrO2 < WOx/ZrO2 suggesting that
relative rates also depend on the differences in the heat of sorption between propane and
propene, which will increase as the Lewis acidity (V5+ < Mo6+ < W6+) increases.
Complex mixed oxides
So far the impact of different oxides and supports on the activity for C-H bond activation has
been discussed. In this context it has been noted that the primary activity for the one electron
cleavage depends on the ability of the oxide to be reduced and the strength of the C-H bond
involved. Any component of a complex oxide that would enhance the strength of the metal
oxygen bond is expected to decrease the activity of the reducible species.

Chapter 1
15
This has been shown for zirconia supported molybdenum oxide clusters upon addition of
alkali metals.[51] The presence of alkali cations (Cs, K, Li) did not affect the structure of MoOx
domains, but influenced their electronic and catalytic properties. Propane C-H activation
decreased monotonically with increasing concentration of the alkali cation and for a given
concentration with increasing base strength of the corresponding alkali oxide. Also in this
case the subsequent oxidation of propene was slightly suppressed by weakening the acid
strength of Mo6+ though the formation of a mixed oxide.[52]
The positive influence of the presence of a bridging oxygen between the active vanadium
cluster and the support on the selectivity of the oxidative dehydrogenation and the observation
that two vanadium atoms form an active site leads to the question whether it is possible to
positively influence the catalytic properties by combining two cations in the active phase.
The simplest conceptual scenario is given by the deposition of a vanadium oxide cluster on a
polymolybdate monolayer surface supported on alumina.[53] Without changing the mechanism
of the C-H bond activation, the combination enhances the rate of C-H bond activation, by
increasing the reducibility of the vanadium oxide clusters. The initial rate of oxidative
dehydrogenation (equivalent to the rate of C-H activation) increased proportional nearly up to
a monolayer of vanadium indicating a low sensitivity to the particular structure of the vanadia,
but was significantly higher if vanadia was supported on alumina. Most remarkably the ratio
of the rate constant for the further oxidation and of the primary formation of propene
decreased with increasing concentration of vanadia and was for the best catalyst drastically
lower than the corresponding ratio in the case of VOx/Al2O3. In line with the arguments used
above the presence of molybdenum are speculated to have reduced the interactions of propene
with the accessible cations. The retention of propene is concluded to be critical for the further
oxidation.
This effect is not confined to the system vanadia/molybdena though. A positive effect was
also observed for chromia decorated surfaces although the surface chemistry is more
complex.[54] In a similar strategy it was reported recently that the addition of oxides of varying
acid base properties could tune the selectivity and activity of a NiO catalyst for oxidative
dehydrogenation. The reasons for his positive effects were explained by a modification of the
reducibility of NiO, but neither the site of activity nor the detailed kinetics are currently
understood in the same detail as with the vanadia and molybdena systems.[55]

Very complex oxides based on MoVTeNbO
used for more demanding reactions such as the conversion
of propane to acrylic acid.[18, 56, 57]
materials is a complex structure consisting of octahedra with
Mo and V oxides building up five, six and seven membered
channels in which Nb and Te
(0 0 1) surface of such a mater
In these oxides the substitution of V for Mo leads to a
situation similar to the one described by the layered material
described above, i.e., single or paired vanadia units are embedded in a molybdenum matrix.
These vanadia octahedra have been identified a
sites [18, 58-60] and the catalytic activity
concentration of vanadium. However, the dependence is not
straightforward and substanti
activity of the vanadia units seem to exist depending on the
location of the substitution. Using the oxidative
dehydrogenation of ethane one notes a unique and
unparalleled selectivity to ethene with very low rate constants
of the oxidation of ethane.[61]
to be confined to this particular structure, although a related structure the so called M2 phase
is not active for C-H bond activation (see Figure 1.7
It is interesting to note that in this structure vanadium is only present in isolated sites, which
would be in line with the experimental and theoretical observation that pairs of vanadium
oxide units are needed for the initial C
been reported to very active and selective for the oxidative dehydrogenation of pro
Alternatively, the distortion of the V
high activity.[59, 63] It should be noted that the intense discussion on the site for the multi
electron oxidation process of propane to acrylic acid is not decisive for the current
contribution, as almost all authors agree that solely the vanadia unit is responsible for the
oxidative dehydrogenation of propane, which constitutes the first and in many cases also the
rate determining step.[64]
16
Very complex oxides based on MoVTeNbOx are currently
used for more demanding reactions such as the conversion [18, 56, 57] The active phase in these
materials is a complex structure consisting of octahedra with
Mo and V oxides building up five, six and seven membered
channels in which Nb and Te oxides are coordinated. A
(0 0 1) surface of such a material is displayed in Figure 1.6.
In these oxides the substitution of V for Mo leads to a
situation similar to the one described by the layered material
described above, i.e., single or paired vanadia units are embedded in a molybdenum matrix.
These vanadia octahedra have been identified as the active
and the catalytic activity is proportional to the
concentration of vanadium. However, the dependence is not
straightforward and substantial differences in catalytic
activity of the vanadia units seem to exist depending on the
location of the substitution. Using the oxidative
dehydrogenation of ethane one notes a unique and
unparalleled selectivity to ethene with very low rate constants
Also in this case the specific catalytic chemistry does not seem
nfined to this particular structure, although a related structure the so called M2 phase
ond activation (see Figure 1.7).
It is interesting to note that in this structure vanadium is only present in isolated sites, which
n line with the experimental and theoretical observation that pairs of vanadium
oxide units are needed for the initial C-H activation. Indeed several of such materials have
been reported to very active and selective for the oxidative dehydrogenation of pro
Alternatively, the distortion of the V-O octahedron has been claimed to be responsible for its
It should be noted that the intense discussion on the site for the multi
electron oxidation process of propane to acrylic acid is not decisive for the current
contribution, as almost all authors agree that solely the vanadia unit is responsible for the
idative dehydrogenation of propane, which constitutes the first and in many cases also the
Figure 1.6:
of MoVTeNbO
Figure 1.7:
of MoVTeNbO
Chapter 1
described above, i.e., single or paired vanadia units are embedded in a molybdenum matrix.
Also in this case the specific catalytic chemistry does not seem
nfined to this particular structure, although a related structure the so called M2 phase
It is interesting to note that in this structure vanadium is only present in isolated sites, which
n line with the experimental and theoretical observation that pairs of vanadium
H activation. Indeed several of such materials have
been reported to very active and selective for the oxidative dehydrogenation of propane.[62]
O octahedron has been claimed to be responsible for its
It should be noted that the intense discussion on the site for the multi
electron oxidation process of propane to acrylic acid is not decisive for the current
contribution, as almost all authors agree that solely the vanadia unit is responsible for the
idative dehydrogenation of propane, which constitutes the first and in many cases also the
Figure 1.6: Structural model
of MoVTeNbOx M1 phase.
Figure 1.7: Structural model
of MoVTeNbOx M2 phase.

Chapter 1
17
Transition metal species in zeolites
The catalytic sites activating the C-H bond in the oxides discussed so far were primarily
terminal oxygen atoms (such as vanadyl groups), which are ideally suited for one electron
oxidation steps. Enzymes,[65, 66] but also designed catalytic sites such as reducible cation pairs
at ion exchange sites in zeolites are able to activate alkanes via a bridging oxygen groups.[67]
Only few cations, such as Fe, Cu and Co show catalytic activity in such environment for
oxidation reactions. The reason for the existence of only few cations is related to the steric
limitations by the size of the hydrated metal cations (hindering larger cations to be
exchanged) during the ion exchange procedure and the probability that at least two aluminum
cations must be substituted in the zeolites structure at such close distances that the di- or
trivalent cation can bridge that distance forming e.g., a Cu-O-Cu moiety.[68]
There is a quite intense debate on the nature of these complexes involving Fe+3 and Cu+2
cations which ended quite indecisive as seen in the recent example for Cu exchanged ZSM-
5.[69] The site depicted in Figure 1.8 has been deduced from evidence using primarily
spectroscopy. Diffraction results that would allow for a
complete structural analysis are not available and will
be very difficult to obtain as all as faults in the zeolite
structure impede a precise structure determination. This
situation brings attention to the point that the structural
information on Cu monooxygenase begins only now to
reach a level that would permit to start to address the
mechanism of the oxygen activation. The current
understanding is that a single Cu cation site is located about 2 nm away from a Cu ion pair.
The oxidation state of the three cations is not unequivocally settled yet.[65]
Recent DFT calculations on the mechanism of the oxidative C-H activation in Cu-ZSM5
suggest a possible way in which methane and higher alkanes can be activated.[69] Via this
route even methane can be converted at around 200 °C forming methoxy and hydroxy groups
with the simultaneous reduction from Cu+2 to Cu+. The constraints in the zeolite and the
strong bonding hinder, however, desorption of the formed methoxy groups or methanol.
Similar to the surface chemistry described above the hydrogen of, e.g., methane is being
cleaved from methane in a one electron oxidation step. The resulting diradical will bind at the
newly formed bridging hydroxy group forming methanol. With respect to the inability to
Figure 1.8: Bridging oxygen
between two divalent metal cations
at exchange sites in zeolites.
Chapter 1
18
desorb this species one needs to emphasize that supported CuO oxide is an excellent steam
reforming catalyst that most likely decomposes the desorbing methanol.[70] Interestingly, Fe
exchanged zeolites need N2O to generate the active oxygen, while Cu and Co exchanged can
be activated in oxygen.

Chapter 1
19
1.2.3. Impact of anions on C-H activation
Vanadium pyrophosphate as catalyst for butane activation
Vanadium phosphates are currently the only large scale catalyst employed for the selective
oxidative process of alkanes, in specific for the oxidation of butane to maleic anhydride.[9]
With vanadium as the main redox active element in the catalyst, it is critical to ask whether or
not the surface chemistry proceeds analogous to the activation discussed so far for supported
vanadia and complex mixed oxide catalysts.
Two interesting facts have been established early on. The
catalysts develop readily the (1 0 0) surface in the process of
drying and conditioning for the reaction.[71] This specific surface
has been claimed to be responsible for catalytic action. While
such a complex reaction involves a wide variety of sites,
promoters and variants of catalysts (see e.g., [72, 73]), the
principal chemistry of the C-H activation from n-butane seems
to be closely related to the vanadyl groups as discussed
above.[74, 75] Scheme 1.4 shows the proposed mechanism for the
formation of 2-butene in this first step. One notes the schematic
nature of the proposed transition state along this route (a second
pathway involving alkoxy groups has also been proposed in ref. [75] above), but formally two vanadyl groups are involved, as discussed also later as the
probably dominating active site. It is striking that a kinetic analysis does not indicate butene
as an intermediate with marked concentration in the gas phase. This indicates that at least the
interaction between butene and the surface must be very strong.
If one explores the (1 0 0) surface of vanadium pyrophosphate using DFT calculations, the
termination by P=O and V=O groups, but also the existence of P-O-V bonds is notable.[76] In
line with the arguments used above to explain the effect of metal cations on the catalytic
activity and selectivity of V=O groups we would like to speculate that the presence of the
highly electronegative phosphorus enhances the reducibility of vanadium. Moreover the top
view in Figure 1.9 shows that neighboring V=O groups exist, well separated by P=O groups
indicating that the surface site that has been identified as required for the alkane activation is
also present on this material. As a word of caution though it should be mentioned, however,
H C C C C H
H H H H
H H H H
V4+ V5+
O O
V4+ V5+
H C C C C H
H H H H
H H
V4+ V5+
O O
V5+ V4+
H H
Scheme 1.4:
Proposed mechanism
for the formation of 2-
butene.

Chapter 1
20
that the surface structure may quite disordered and may form over a much longer period
during operation as it had been thought originally.[77] This is indeed reflected in the marked
influence the relative concentrations of vanadium and phosphorus have on the catalytic
activity.[78] A dynamic equilibrium between several phases exists on the surface of the
vanadium pyrophosphates making it very difficult to identify more than the principal features
of the atoms involved. There has been, however, a recent elegant in situ study by 31P and 51V
solid state NMR spectroscopy to probe the phosphorus and vanadium species involved in the
oxidation reactions. δ-VOPO4 has been identified to be the phase most important for the
overall conversion of n-butane to maleic anhydride. Cycling though oxidation and reduction it
could be shown that P/V5+were pairs which were active for the overall reaction. Note that this,
unfortunately, does not provide the insight with respect to the initial C-H bond activation.
Figure 1.9: Model of (VO)2P2O7 (1 0 0) surface.
Supported LiCl as catalyst for oxidative dehydrogenation of ethane to ethene
So far anions and cations were used and discussed as promoting species changing the
properties of the redox element to activate the C-H bond. In principle, however the anion
itself can undergo the redox step and is able to catalyze the oxidative dehydrogenation of
ethene (e.g. [79-81]).
The most remarkable catalysts in this respect are MgO supported alkali chlorides, which form
at reaction temperatures a melt covering the support surface. Dy2O3 has been found to be an
excellent promoter that is not interfering with the chemistry, but helps to maintain a
reasonably large specific surface area. The active sites are speculated to be hypochlorite
anions, which are formed only transiently in the presence of oxygen at the surface of the
liquid layer or dissolved in the catalysts. The catalyst is regenerated by eliminating water (see
Scheme 1.5).

Chapter 1
21
Mechanistic details are not evaluated, because of
the transient nature of the catalytically active sites.
The presence of oxygen leads to the formation of
positively charged chlorine. It is speculated that
the reaction proceeds via the electrophilic
substitution of hydrogen for chlorine followed by
an immediate elimination of HCl. Concerted
elimination of HCl would be very rapid under
these conditions, as the reaction temperature is
typically above 823 K. Elimination of water would complete the catalytic reaction cycle and
restitute LiCl as catalyst. The catalytic reactivity is not limited to LiCl. Several pure and
mixed alkali and alkali earth chlorides showed promising catalytic properties. It should be
noted that the selectivity of the catalysts increased with decreasing melting point indicating
that the mobility at the surface leads to a dynamically restructuring material that avoids in this
way the formation of undercoordinated metal cations. Such accessible metal cations had been
identified as the key sites to adsorb olefins and to provide the required sorption locations for
total oxidation.
1.2.4. Indirect oxidation via electrophilic substitution – chlorination and
bromination
In the surface chemistry described so far, the C-H bond was activated by a homolytic
cleavage leading to a diradical species that can rebind. In case in which the cation may
polarize the C-H bond so far that the C-H bond is cleaved the hydrocarbon moiety will bind to
the metal cation and eventually form a carbon-metal bond (vide infra). The oxidative
elimination of the alkene via ß-hydride elimination will then lead to the olefin. Here we will
describe an alternative approach using polarization and electrophilic substitution. Once
substituted the highly electronegative substituent will rearrange the electron distribution at the
carbon atom and lead so to oxidation. This is usually achieved via halogenation (chlorination
or bromination) of alkanes.
FeOxCly/Al2O3, TaOF3, NbOF3/Al2O3, ZrOF2/Al2O3, SbOF3/Al2O3, SbF5/graphite and Nafion-
H/TaF5 are known as catalysts for selective chlorination and bromination of methane.[82] The
[LiCl]
[LiCl•H2O] [LiOCl]
[LiOH•HCl]
H2O ½ O2
C2H4
C2H6
[LiCl]
[LiCl•H2O] [LiOCl]
[LiOH•HCl]
H2O ½ O2
C2H4
C2H6
Scheme 1.5: Catalytic cycle of oxidative
dehydrogenation over LiCl catalysts.

Chapter 1
22
activation of methane is achieved under relatively mild conditions (543 K). The mechanism is
shown in Scheme 1.6. In the first step a Lewis acid site of the catalyst polarizes chlorine
leading to Cl- and Cl+ bound to the catalyst. In the next step Cl+ is transferred into methane by
an electrophilic insertion. In the transition state carbon is five-coordinated by four methane-
hydrogen and one Cl+ in a cationic complex and finally Cl+ replaces hydrogen to form methyl
chloride together with hydrogen chloride from the negative polarized chloride. This is also the
rate determining step and the energy barrier and also the rate of the reaction is dependent on
the stability of the five-coordinated transition state.
Scheme 1.6: Mechanism of selective methane chlorination over solid acids and Cl2.
In the direct radical chlorination the
chlorinated products react as readily
as methane leading to unwanted
multiple chlorination steps. In the
electrophilic insertion the already chlorinated products pass also over a multi-chlorinated
transition state. In case of reaction with methyl chlorine two chlorine will be incorporated in
the five-coordinated transition state and due to the electron drawing effect of chlorine, the
stability of this cationic complex is lower than the corresponding transition state of the mono-
chlorinated reactant. In consequence, the energy barrier is higher for the second chlorine
insertion compared to the first insertion and the rate will be slower. The decreasing stability of
multiply chlorinated products (compare Scheme 1.7) leads to an order of reaction rates, in
which rate of formation decreases in parallel to the degree of substitution. If only one
equivalent of the chlorine is used, the mono chlorination is in this reaction strongly preferred.
Conversions of 34% and 96% selectivity to mono chlorinated product were realized in that
way. Thus, the role of the catalyst in the electrophilic substitution is to polarize chlorine and
stabilize the formed electrophilic chlorine. Indirectly the lower reactivity towards electrophilic
substitution leads to the decreased rates for higher substituted products.
X2 + catalyst [X+][catalyst-X-] (X=Cl,Br)
[X+][catalyst-X-] + CH4H3C
H
X
[catalyst-X-]
CH3-X + catalyst + HX
H3CH
X
> H2XCH
X
>> HX2CH
X
>>> X3CH
X
Scheme 1.7: Stability of transition states
of selective methane chlorination.

Chapter 1
23
Catalytic activity for C-H activation reactions has also been reported for Lanthanum oxides
(La2O3) and chlorides (LaOCl, LaCl3), if HCl is used for the chlorination under oxidizing
conditions at 400 – 500 °C. This would be a dramatic commercial benefit, as one mol of HCl
is generated for each Cl inserted, which has to be reoxidized to Cl2 in a separate process.[83-85]
It is interesting to note that the catalytic materials, La2O3 and LaOCl, have been reported as
active catalysts for oxidative methane coupling,[86-89] and for ethane oxidative
dehydrogenation.[90, 91] LaCl3 is known as a promoter in catalysts for the
oxydehydrochlorination and ethane conversion to vinyl chloride [92] and is also used in
selective chlorination of methane.
Figure 1.10: Mechanism of selective methane chlorination over LaOCl.
The active sites are hypochlorite OCl- surface species having a formal oxidation state of
+1.[83-85] The active site is formed from LaCl3 by the reaction with molecular oxygen (see
Figure 1.10). In the next step methane forms a five-coordinated transition state with the
positive charged chlorine, which decomposes and leaves a surface hydroxyl group and methyl
chloride after decomposition. To close the catalytic cycle the catalyst hydrogen chloride forms

Chapter 1
24
water and a surface chloride that is oxidized with molecular oxygen to the original active
hypochloride species.[83]
Similarities of the two reaction mechanisms are obvious. Also in the latter case the rate
determining step proceeds over a five-coordinated carbon and the stability of this transitions
state should also decreasing with higher number of chlorine bound to carbon, increasing the
selectivity of the mono chlorinated product, but catalytic tests with stoichiometric mixtures of
CH4 : HCl : O2 2:2:1 at 475 °C showing 65% methyl chloride and 25% methylene dichloride
(rest are oxidation products CO and CO2) at 27% conversion. Thus, this reaction is not as
selective as the previous describe catalysts and reasons for this are still under discussion. Even
changes in temperature between 450 – 550 °C showed no significant influence on the
selectivity of the methyl chloride, but it should also be noted that these temperatures are still
much higher than the temperature of the selective FeOxCly/Al2O3 catalysts (270 °C).
1.2.5. Oxidative C-H activation via activation with non-reducible cations
C-H Activation of alkanes by Li promoted MgO
Li2O/MgO is one of the most prominent examples for oxidative C-H activation relying on
defect sites at surfaces, well exemplified by the pioneering work of Lunsford et al..[93, 94] The
active sites have been originally proposed to be [Li+O-] sites, which are generated in an MgO
host lattice by substitution of divalent magnesium cation by Li+. This oxygen radical site [79, 95,
96] catalyzes the abstraction of hydrogen from, e.g., ethane with formation of [Li+OH-] and an
ethyl radical (Equation 1.1) in the rate determining step.
C2H5 + [Li+OH-]sC2H6 + [Li+O-]s (Equation 1.1)
The initially formed ethyl radical is desorbed into gas phase, where free radical reactions
proceed. In the gas phase molecular oxygen abstracts a second hydrogen leading to ethane and
a hydroperoxy radical (Equation 1.2)
C2H5 + O2 C2H4 + HO2 (Equation 1.2)

Chapter 1
25
This hydroperoxy radical can again remove a hydrogen atom from ethane under recreation of
an ethyl radical, forming a separate catalytic cycle in the gas phase. The formed hydrogen
peroxide decomposes to water and oxygen (Equation 1.3), but formation of two hydroxyl
radical by homolytic cleavage is also possible, also enabling the start of a new chain reaction.
HO2 + C2H6 H2O2 + C2H5 C2H5 + H2O + ½ O2 (Equation 1.3)
Overall, ethane is oxidized to ethene by molecular oxygen. The role of the catalysts is to
catalytically supply of ethyl radicals needed in the radical cycle of the gas phase reaction
(Scheme 1.8).
Scheme 1.8: Catalytic cycle in gas-phase after activation by [Li+O
-].
After initiation of the catalytic gas phase reaction, the active center on the surface of the
catalysts needs to be regenerated by reaction with oxygen. At high temperatures (700 °C),
regeneration of the surface [Li+OH-] occurs under removal of lattice oxygen. At lower
temperature gas phase oxygen is needed for the regeneration, forming a hydroperoxy radical
under recreation of the active center [Li+O-]. The hydroperoxy radical can react to hydrogen
peroxide under regeneration of a second active center and finally after scission to two
hydroxyl radical regenerate two more active centers (Equation 1.4). Overall one oxygen
molecule is able to regenerate four active centers.
[Li+OH-]s + O2 [Li+O-]s + HO2
[Li+OH-]s + HO2 [Li+O-]s + H2O2 (Equation 1.4)
HO2•C2H5•
H2O2 C2H6 H2O + 0.5 O2
C2H4O2
Gas-phase
Initiated bycatalytic surface
reactionHO2•C2H5•
H2O2 C2H6 H2O + 0.5 O2
C2H4O2
Gas-phase
Initiated bycatalytic surface
reaction

Chapter 1
26
In contrast to the original proposal, surface science studies by the group of Goodman showed
that the concentration of [Li+O-] sites does not correlate with the activity for methane
activation.[97] Instead, F0 centers (oxygen vacancies containing two electrons) at or near the
surface of MgO have been established to be the sites inducing the C-H bond breaking. One
should note that such sites would correspond to such surface sites of low coordination, which
are in equilibrium with the near surface F centers. The presence of Li+ substituted into the
MgO lattice induces a higher concentration of such sites. It is interesting to note also that the
[Li+O-] sites are mostly found in the bulk and not at the surface. A recent study of F0 centers
on MgO (0 0 1) showed for the first time the quantitative measure of the high strength of
interaction between the tip of an AFM microscope and these sites giving reference to their
unusual reactivity.[98]
It should be noted at this point that C-H activation can be also achieved on a wide variety of
non-reducible oxides (for an excellent review see ref. [99]). Most notable, C-H bond cleavage
can also be achieved over non-reducible oxides such as alumina on highly defect sites. In
contrast to the chemistry discussed above, the C-H bond cleavage involves the heterolytic
cleavage into a proton coordinating in the final state to oxygen at the site and a carbanion
which interacts with the metal cation.[100] Also several cases of cations in zeolites, such Ga3+,
La3+ and Zn2+ exchanged zeolites have been found to activate C-H bonds in an analogous
way. In these cases a very high strength of interaction of the exposed cations [101] with the C-
H bonds leads to the heterolytic dissociation.[43, 102] While the final product, i.e., olefins in the
simplest case, represent an oxidation step with respect to the starting molecule, we will not
discuss this chemistry in detail here, as the C-H activation step is not typical for C-H
activation involving oxygen.
Bifunctional oxidative catalysis with main group cations at zeolite exchange sites
So far, we have discussed the role of specific catalytic sites involving also the metal oxygen
bonds and anionic species catalyzing the C-H bond separation. However, surprisingly only the
coordinating effect of a cation in a large electrostatic field is sufficient to induce C-H bond
transfer. This requires the confined space of, e.g., a zeolite that enforces the proximity
between an alkane and molecular oxygen. Exchangeable cations provide the high local field
apparently necessary to reduce the energy needed to excite the hydrocarbon oxygen charge-
transfer.[103] It is remarkable, that for reactions in the gas phase the energy to perform such
charge transfer lies energetically much higher [104] than when both reaction partners are
Chapter 1
27
confined to a zeolite cage. The source of the energy to stimulate seems not to be critical, i.e.,
the reaction can be induced by visible light [105] as well as by thermal energy.[106]
It appears, however, that the local geometry of the arrangement between oxygen the alkane
and the cation is critical and is strongly determined by the size and equilibration of ion
exchange of the cation.
This is best seen in the comparison between Ca2+ and Mg2+ and their interactions with the
alkane. The direct importance and accessibility of the alkaline earth metal cations has been
established by a series of ion exchange experiments which in essence showed that the catalyst
activity drastically increased, once the ion exchange level led to cations accessible by the
reacting molecules.[107] A more subtle local arrangement is important for the type of
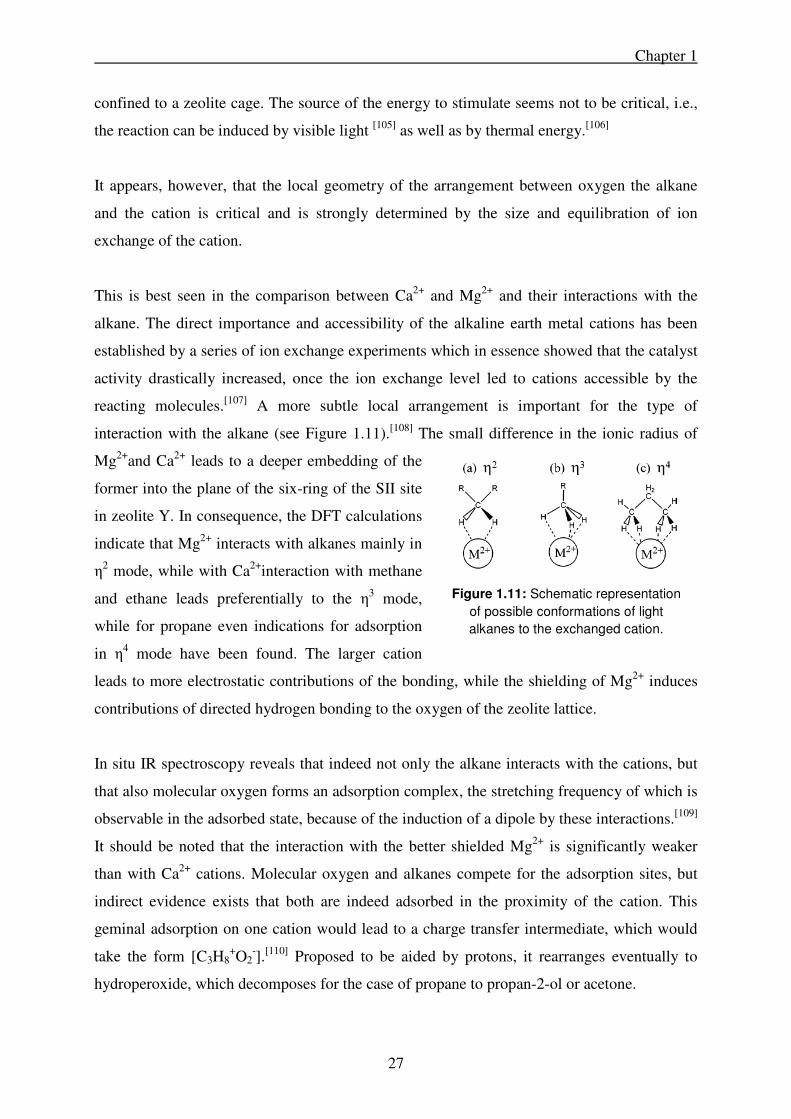
interaction with the alkane (see Figure 1.11).[108] The small difference in the ionic radius of
Mg2+and Ca2+ leads to a deeper embedding of the
former into the plane of the six-ring of the SII site
in zeolite Y. In consequence, the DFT calculations
indicate that Mg2+ interacts with alkanes mainly in
η2 mode, while with Ca2+interaction with methane
and ethane leads preferentially to the η3 mode,
while for propane even indications for adsorption
in η4 mode have been found. The larger cation
leads to more electrostatic contributions of the bonding, while the shielding of Mg2+ induces
contributions of directed hydrogen bonding to the oxygen of the zeolite lattice.
In situ IR spectroscopy reveals that indeed not only the alkane interacts with the cations, but
that also molecular oxygen forms an adsorption complex, the stretching frequency of which is
observable in the adsorbed state, because of the induction of a dipole by these interactions.[109]
It should be noted that the interaction with the better shielded Mg2+ is significantly weaker
than with Ca2+ cations. Molecular oxygen and alkanes compete for the adsorption sites, but
indirect evidence exists that both are indeed adsorbed in the proximity of the cation. This
geminal adsorption on one cation would lead to a charge transfer intermediate, which would
take the form [C3H8+O2
-].[110] Proposed to be aided by protons, it rearranges eventually to
hydroperoxide, which decomposes for the case of propane to propan-2-ol or acetone.
Figure 1.11: Schematic representation
of possible conformations of light
alkanes to the exchanged cation.

Chapter 1
28
1.2.6 Conclusion and outlook
The discussed examples show that the catalyzed oxidative C-H activation proceeds in the
dominant number of cases via single electron processes induced, however, by a surprisingly
wide variety of catalytically active sites. These span from classic transition metal terminal or
bridging oxygen groups, exemplified best by vanadia, over transiently formed terminal
oxygen, such as in the Cu exchanged zeolite based catalysts, to the F0 centers in MgO type
catalysts and the facilitation of the formation of charge transfer complexes in zeolites by
exposed cations. Despite the homolytic cleavage of the C-H bond, the lability of the metal
oxygen bond and the polarizability of the C-H bond facilitate the reaction and appear to lower
the energies involved in the reaction pathways. The achievable selectivity remains a great
challenge, because most of the materials contain accessible metal cations and labile oxygen
providing also polar pathways to the subsequent oxidation of the intermediate once the C-H
bond has been cleaved in the first (rate determining) activation step. Certainly, less defects
and undercoordinated cations would help to improve the selectivity for a particular catalyst.
While impressive progress has been made in the characterization of such catalysts, the sites
active in the C-H bond cleavage are frequently minority sites constituting only a very small
fraction of the surface. Together with the fact that the surface of the oxides and the active sites
in zeolites are very sensitive to the reactive environment, this poses a formidable challenge to
characterize the sites. Such insight together with well-targeted synthesis approaches are,
however, the key to the next generation of catalysts for C-H activation and selective
functionalization.
Chapter 1
29
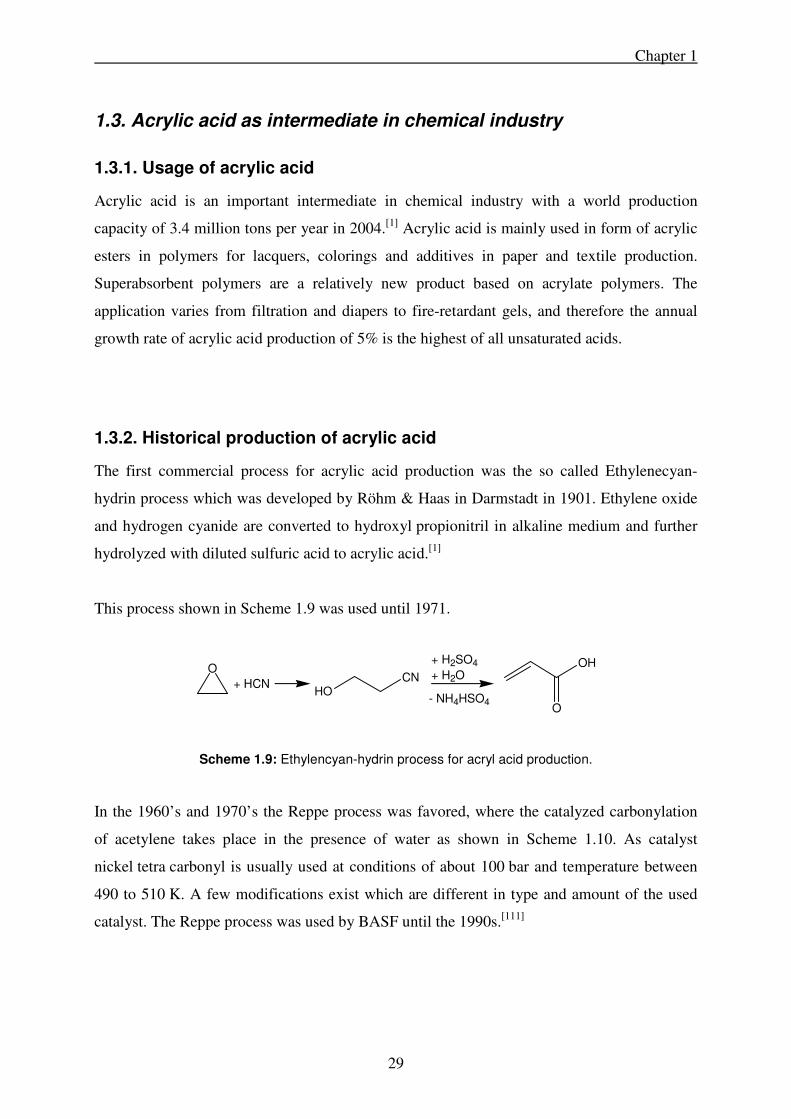
1.3. Acrylic acid as intermediate in chemical industry
1.3.1. Usage of acrylic acid
Acrylic acid is an important intermediate in chemical industry with a world production
capacity of 3.4 million tons per year in 2004.[1] Acrylic acid is mainly used in form of acrylic
esters in polymers for lacquers, colorings and additives in paper and textile production.
Superabsorbent polymers are a relatively new product based on acrylate polymers. The
application varies from filtration and diapers to fire-retardant gels, and therefore the annual
growth rate of acrylic acid production of 5% is the highest of all unsaturated acids.
1.3.2. Historical production of acrylic acid
The first commercial process for acrylic acid production was the so called Ethylenecyan-
hydrin process which was developed by Röhm & Haas in Darmstadt in 1901. Ethylene oxide
and hydrogen cyanide are converted to hydroxyl propionitril in alkaline medium and further
hydrolyzed with diluted sulfuric acid to acrylic acid.[1]
This process shown in Scheme 1.9 was used until 1971.
O
+ HCNOH
CN
+ H2SO4
+ H2O
- NH4HSO4O
OH
Scheme 1.9: Ethylencyan-hydrin process for acryl acid production.
In the 1960’s and 1970’s the Reppe process was favored, where the catalyzed carbonylation
of acetylene takes place in the presence of water as shown in Scheme 1.10. As catalyst
nickel tetra carbonyl is usually used at conditions of about 100 bar and temperature between
490 to 510 K. A few modifications exist which are different in type and amount of the used
catalyst. The Reppe process was used by BASF until the 1990s.[111]
HO

Chapter 1
30
O
OH
+ CO + H2ONi(CO)4
Scheme 1.10: Reppe process for acrylic acid production.
The third commercial process starts with formaldehyde that is reacted with ketene in the
presence of a lewis acid (AlCl3, ZnCl2, BF3) to β-propion lactone. In a second step β-
propion lactone is decomposed at 410 – 450 K and 25 – 250 bar with phosphoric acid and
copper as catalyst (Scheme 1.11).[1]
O
OHH3PO4/Cu
C
O
H H
+
C
C
O
H H
O
O
L.A.
Scheme 1.11: Acrylic acid production from formaldehyde and ketene.
The last historical process that was used for industrial acrylic acid production based on the
hydrolysis of acrylonitrile with sulfuric acid and water. It is possible to gain directly an acryl
ester by using an alcohol instead of water in the second step. In this process stoichiometric
amounts of ammonium bisulfate are formed (Scheme 1.12).[1]
C
N
+ H2SO4 + H2O
O
NH2 H2SO4
O
OR+ ROH
- NH4HSO4
Scheme 1.12: Acrylonitrile hydrolysis for acrylic acid production.
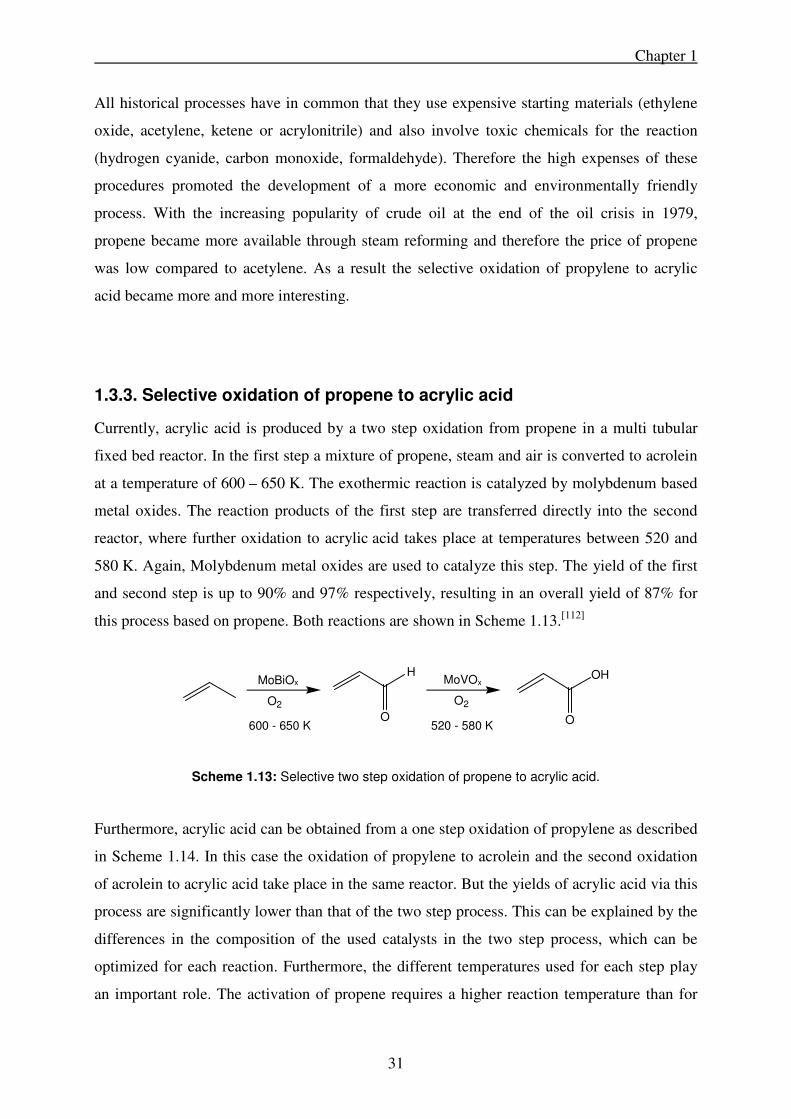
Chapter 1
31
All historical processes have in common that they use expensive starting materials (ethylene
oxide, acetylene, ketene or acrylonitrile) and also involve toxic chemicals for the reaction
(hydrogen cyanide, carbon monoxide, formaldehyde). Therefore the high expenses of these
procedures promoted the development of a more economic and environmentally friendly
process. With the increasing popularity of crude oil at the end of the oil crisis in 1979,
propene became more available through steam reforming and therefore the price of propene
was low compared to acetylene. As a result the selective oxidation of propylene to acrylic
acid became more and more interesting.
1.3.3. Selective oxidation of propene to acrylic acid
Currently, acrylic acid is produced by a two step oxidation from propene in a multi tubular
fixed bed reactor. In the first step a mixture of propene, steam and air is converted to acrolein
at a temperature of 600 – 650 K. The exothermic reaction is catalyzed by molybdenum based
metal oxides. The reaction products of the first step are transferred directly into the second
reactor, where further oxidation to acrylic acid takes place at temperatures between 520 and
580 K. Again, Molybdenum metal oxides are used to catalyze this step. The yield of the first
and second step is up to 90% and 97% respectively, resulting in an overall yield of 87% for
this process based on propene. Both reactions are shown in Scheme 1.13.[112]
O
OH
O
HMoBiO
O2
600 - 650 K
MoVO
O2
520 - 580 K
Scheme 1.13: Selective two step oxidation of propene to acrylic acid.
Furthermore, acrylic acid can be obtained from a one step oxidation of propylene as described
in Scheme 1.14. In this case the oxidation of propylene to acrolein and the second oxidation
of acrolein to acrylic acid take place in the same reactor. But the yields of acrylic acid via this
process are significantly lower than that of the two step process. This can be explained by the
differences in the composition of the used catalysts in the two step process, which can be
optimized for each reaction. Furthermore, the different temperatures used for each step play
an important role. The activation of propene requires a higher reaction temperature than for
x x

Chapter 1
32
acrolein. 600 – 630 K are necessary to obtain a sufficient propene conversion. At this
temperature acrolein is not only oxidized to acrylic acid. Total oxidation of acrolein and
acrylic acid takes place, leading to lower yields of the desired product and following to a large
amount of carbon oxides.[113]
O
OH
O2
Catalyst
Scheme 1.14: One step oxidation of propene to acrylic acid.
1.3.4. Selective oxidation of propane to acrylic acid
Propane is a component of natural gas with an up to 10% fraction (compare chapter 1.1.1.).
Therefore it would be an economical preferred raw material based on its availability for the
oxidation to acrylic acid (Scheme 1.15).
O
OH
O2
Catalyst
Scheme 1.15: Selective oxidation of propane to acrylic acid.
In Figure 1.12 the development of propane and propene prices are shown between January
2007 and December 2008. The prices for the second term of 2008 are not representative due
to massive distortions of the financial markets and commodities prices. Therefore average
prices for propane and propene were calculated between January 2007 and July 2008. In this
period the average price per ton of propane and propene are 567 USD and 1093 USD,
resulting in a price difference of 526 USD per ton. From this data it is possible to estimate
minimum yields required for the selective oxidation of propane to acrylic acid, to be
competitive within the selective oxidation of propene on an economic level.
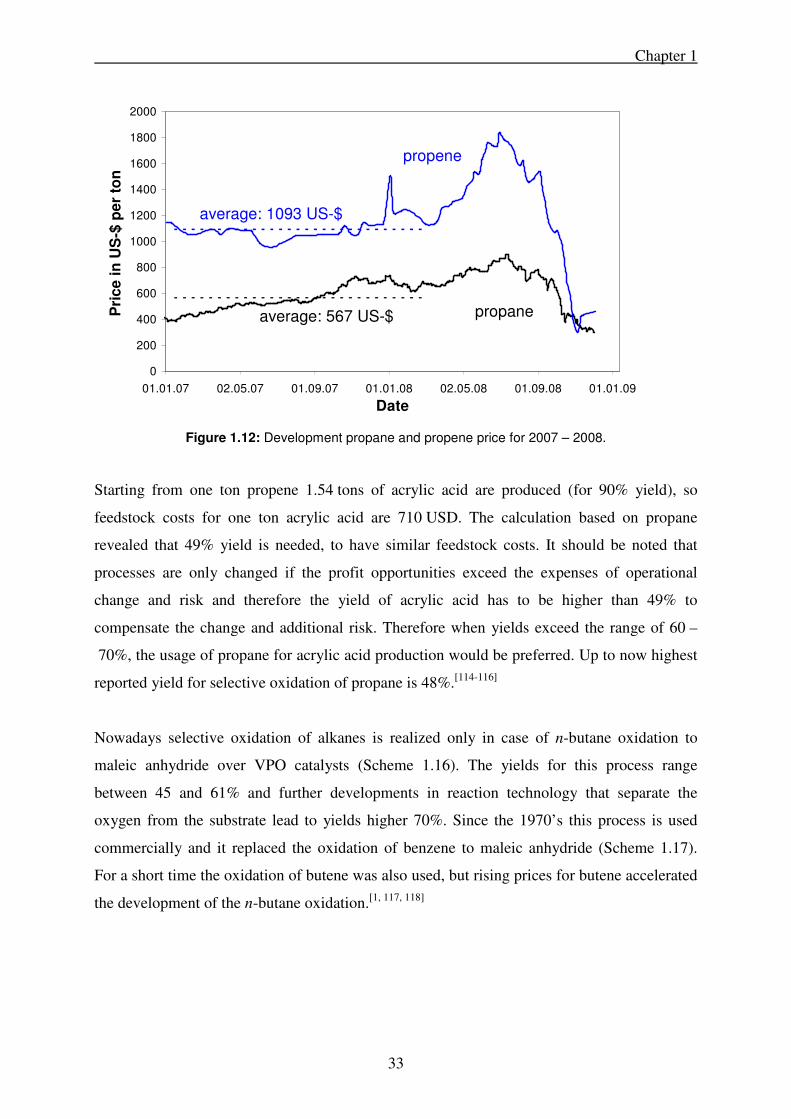
Chapter 1
33
Figure 1.12: Development propane and propene price for 2007 – 2008.
Starting from one ton propene 1.54 tons of acrylic acid are produced (for 90% yield), so
feedstock costs for one ton acrylic acid are 710 USD. The calculation based on propane
revealed that 49% yield is needed, to have similar feedstock costs. It should be noted that
processes are only changed if the profit opportunities exceed the expenses of operational
change and risk and therefore the yield of acrylic acid has to be higher than 49% to
compensate the change and additional risk. Therefore when yields exceed the range of 60 –
70%, the usage of propane for acrylic acid production would be preferred. Up to now highest
reported yield for selective oxidation of propane is 48%.[114-116]
Nowadays selective oxidation of alkanes is realized only in case of n-butane oxidation to
maleic anhydride over VPO catalysts (Scheme 1.16). The yields for this process range
between 45 and 61% and further developments in reaction technology that separate the
oxygen from the substrate lead to yields higher 70%. Since the 1970’s this process is used
commercially and it replaced the oxidation of benzene to maleic anhydride (Scheme 1.17).
For a short time the oxidation of butene was also used, but rising prices for butene accelerated
the development of the n-butane oxidation.[1, 117, 118]
0
200
400
600
800
1000
1200
1400
1600
1800
2000
01.01.07 02.05.07 01.09.07 01.01.08 02.05.08 01.09.08 01.01.09
Date
Pri
ce
in
US
-$ p
er
ton
propene
propane
average: 1093 US-$
average: 567 US-$

Chapter 1
34
VPOO
O
O
O2
Scheme 1.16: Selective oxidation of n-butane to maleic anhydride.[1]
+ 4.5 O2V2O5
670 - 730 K
O
O
O
+ 2 CO2 + 2 H2O
Scheme 1.17: Oxidation of benzene to maleic anhydride.[1]
Yields reachable in selective oxidation reactions can be estimated, based on a concept upon
the stability of the desired product. If the product is in relation to the reactant a very stable
molecule high selectivity is easy to reach, whereas for a very instable product high selectivity
is impossible, due to decomposition and further oxidation (compare also chapter 1.2.1). For
stability quantification the difference of the bond strength between the weakest C-H bond in
the reactant and the weakest C-H or C-C bond in the product molecule (∆0HC-H reactant - ∆0HC-H
or C-C product) is calculated.[119]
A plot of the bond energy difference and observed selectivity for 23 selective oxidation
reactions shows a clear correlation (Figure 1.13). Reactions with highly stable products like
ethylbenzene to styrene or 1-butene to butadiene are in Figure 1.13 in the upper left corner,
indicating high selectivities, whereas reactions with instable products like methane to
formaldehyde or isobutene to methacrolein are in the lower right corner.
If the bond energy difference is less than 30 kJ·mol-1 very high product selectivity is possible,
whereas higher energy difference leads to a fast decrease of the selectivity. For differences
greater than 70 kJ·mol-1 near zero product selectivity is observed.

Chapter 1
35
Figure 1.13: Correlation between bond energies and selectivity in oxidation reactions.
The selective oxidations of n-butane to maleic anhydride and propane to acrylic acid both
possess the fabulous situation that all bonds in the product molecule are stronger than the
weakest C-H bond of n-butane or propane. In this situation high selectivity should be
possible. The potential of the n-butane oxidation (green dot in Figure 1.13) is already
developed, indicated by the position near to the trend line, whereas for propane oxidation the
observed selectivity is heavily below the trend line. From this model further improvements for
the selective oxidation of propane to acrylic acid should be possible and might lead to a
catalyst that is capable for industrial usage.
Sele
ctiv
ity [
%] at
30%
convers
ion
D0HC-H reactant – D
0HC-H or C-C product [kJ mol
-1]
Propane � Acrylic Acid
n-Butane � Maleic anhydride

Chapter 1
36
1.4. Selective oxidation of propane to acrylic acid
1.4.1. General mechanism
Today acrylic acid is prepared by selective oxidation of propene. Since complete oxidation of
organic compounds to CO2 and water is extremely exothermic, deep oxidation is
thermodynamically favored. The production of partially oxidized hydrocarbons requires
precise kinetic control. “Achieving only partial oxidation of hydrocarbons is like toasting
marshmallows on a campfire. The trick is to find the perfect conditions near the red hot coals
and to allow just enough time to reach a nice gold-brown without burning them to a tasteless
black crisp”,[120] such catalyst is needed which activates the inert propane molecule (compare
chapter 1.2.) and still keeps the selectivity of oxygenates high.[121]
Selective oxidation reactions on heterogeneous oxide catalysis proceed usually through a
Mars-van-Krevelen mechanism. In such mechanism, the active sites oxidize the reactant
molecules by creating lattice oxygen vacancies. In a second step the catalyst is re-oxidized by
gas phase oxygen.[122, 123]
The selective oxidation of an alkane through the Mars-van-Krevelen mechanism is given in
Figure 1.14 a-e. In the first step propane is adsorbed on the surface of the catalyst and is
oxidized from lattice oxygen to propene and water (Figure 1.8 b). This C-H activation is the
rate determining step in this reaction (compare also with chapter 1.2.).
CH3CH2CH3
O2- Mn+ O2- Mn+ O2- Mn+ O2-
O2- O2- O2-
O2- Mn+ O2- Mn+ O2- Mn+ O2-
+ H2O
CH3CHCH2
O2- M(n-1)+ M(n-1)+ O2- Mn+ O2-
O2- O2- O2-
O2- Mn+ O2- Mn+ O2- Mn+ O2-
Figure 1.14 a: Adsorption of propane. Figure 1.14 b: Oxidation of propane to
propene and water.

Chapter 1
37
The oxidation product propene desorbs, leaving an oxygen vacancy that can migrate through
the catalysts (Figure 1.14 c). The re-oxidization occurs from oxygen from the gas phase
(Figure 1.14 d) and finally leads to a recovered catalyst (Figure 1.14 e).
1.4.2. Vanadium pyrophosphate oxide catalysts (VPO)
For selective oxidation of propane to acrylic acid three different catalysts systems are
described in literature.[121] One of them are vanadium pyrophosphate type catalysts (VPO),
which have been used successfully in the industrial process of n-butane oxidation to maleic
anhydride. The VPO system shows high activity and selectivity in n-butane oxidation.
Reported yields of maleic anhydride vary from 45 to 61% with
n-butane conversion of about 65% and selectivity to maleic anhydride ranging from 65% to
97%. However, VPO catalysts are not very effective in propane selective oxidation to acrylic
acid. Some examples for VPO catalysts are given in Table 1.2. The low yields of acrylic acid,
contrary to the maleic anhydride yields in n-butane oxidation, may suggest that VPO type
catalysts are rather specific towards the length of hydrocarbon chain. Moreover the stability of
CH3CHCH2
O2- M(n-1)+ O2- M(n-1)+ O2- Mn+ O2-
O2- O2- O2-
O2- Mn+ O2- Mn+ O2- Mn+ O2-
½ O2
O2- M(n-1)+ O2- M(n-1)+ Mn+ O2-
O2- O2- O2-
O2- Mn+ O2- Mn+ O2- Mn+ O2-
O2- M+ O2- M+ O2- Mn+ O2-
O2- O2- O2-
O2- Mn+ O2- Mn+ O2- Mn+ O2-
Figure 1.14 c: Desorption of propene
and migration of oxygen vacancy.
Figure 1.14 d: Reoxidation from
gaseous oxygen.
Figure 1.14 e: Recoverd catalyst.

Chapter 1
38
the partial oxidation products could play a role. Maleic anhydride is more stable than acrolein
and acrylic acid regarding to further oxidation.[124-126]
Table 1.2: Results for selective propane oxidation with VPO catalysts.
Catalyst
composition
T
[K]
Propane
conversion
[%]
Acrylic acid
yield
[%]
Selectivity
[%]
VP1,15Te0,1-0,15Ox 663 30 10.5 30 [124]
VP1,05Ox 658 37 14.4 39 [126]
VP1,1Ox 693 46 14.7 32 [125]
1.4.3. Heteropoly compounds (HPC)
A further system for selective propane oxidation are heteropoly compounds (HPC). HPC refer
to inorganic, heteropoly acids and their corresponding salts. They have well defined cage-like
structures with a central cation and surrounding polyanions. The central cation are
heteroatoms like P, As, Si, Ge or B. The polyanions are often oxoanions of Mo or W. The
best known cage-like structures used as oxidation catalysts are the Keggin type compounds
with the general formula [Xn+M12O40](8-n)-. Here, Xn+ is the central cation surrounded by MO6
octahedral polyanions. The negative charge of the HPC can be neutralized by protons, giving
HPC a strong acidity. Due to this property they have been used as acid catalysts in solution
for dehydration, esterification and alkylation. Table 1.3 shows examples of HPCs and their
conversions, selectivities and yields in propane oxidation to acrylic acid. While the simple
form of the Keggin compound H3PMO12O40 is inactive in propane oxidation, the conversion
can be improved by structural modification, such as treatment with ammonia or pyridine.[127-
130]

Chapter 1
39
Table 1.3: Examples for HPC catalysts for selective oxidation of propane to acrylic acid.
Catalyst
composition
Feed T
[K]
Propane
conversion
[%]
Acrylic
acid yield
[%]
Selectivity
[%]
H3PMO12O40 C3/O2/H2O/N2 613 0 0 0 [127, 129]
H1,26Cs2,5Fe0,08PVMO11O40 C3/O2/N2 653 47 13 28 [128]
(NH4)3PMO12O40 C3/O2/H2O/N2 613 4.5 0 6 [127, 129]
(PyH)3PMO12O40 C3/O2/H2O/N2 613 7.5 2 29 [127, 129]
Note: C3 = propane
1.4.4. Multi-component metal oxides (MMO)
The third class of catalysts for selective oxidation of propane to acrylic acid are multi-
component metal oxides (MMO), also known as complex mixed oxides (compare chapter
1.2.2.). These materials contain a mix of multiple crystal and amorphous phases and do not
have a well-defined primary structure, but MMOs are generally prepared through calcination
methods at high temperatures and thus have excellent thermal stability. MoVNb mixed oxides
were developed in the 1970s [131] and used for the oxidation of ethane to ethene and acetic
acid. These catalysts are also capable to activate propane with acetic acid, acetaldehyde and
carbon oxides as the only products. The application of MMOs in selective propane oxidation
started in the 1990s. All known MMO type catalysts contain molybdenum and the most of
them include also vanadium. The best results were achieved on catalysts which also contain
tellurium and niobium. Well known is the catalyst system of the type MoVTeNbOx which is
most promising regarding to propane conversion and acrylic acid selectivity. Recently studies
are attended to MMOs containing antimony instead of tellurium. The results of some
MoV(Te,Sb,Nb)Ox catalysts are shown in Table 1.4. Further description of the MoVTeNbOx
system is in chapter 1.5..[114, 115, 132-138]
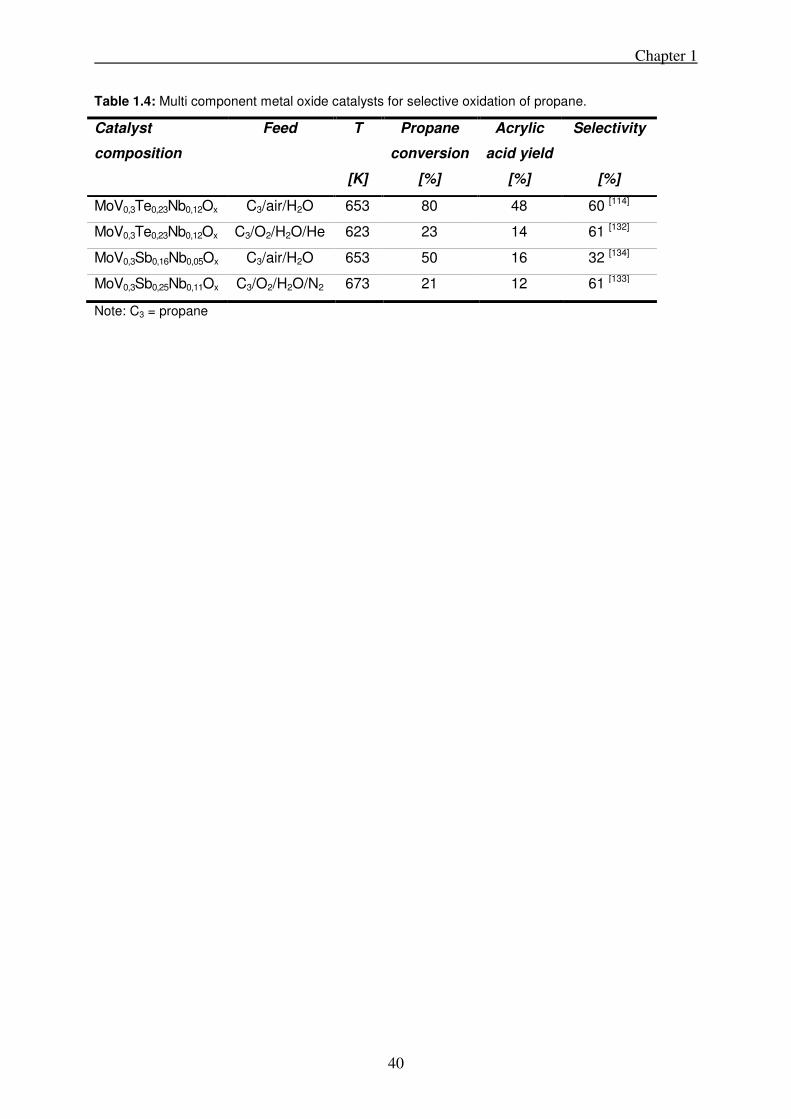
Chapter 1
40
Table 1.4: Multi component metal oxide catalysts for selective oxidation of propane.
Catalyst
composition
Feed T
[K]
Propane
conversion
[%]
Acrylic
acid yield
[%]
Selectivity
[%]
MoV0,3Te0,23Nb0,12Ox C3/air/H2O 653 80 48 60 [114]
MoV0,3Te0,23Nb0,12Ox C3/O2/H2O/He 623 23 14 61 [132]
MoV0,3Sb0,16Nb0,05Ox C3/air/H2O 653 50 16 32 [134]
MoV0,3Sb0,25Nb0,11Ox C3/O2/H2O/N2 673 21 12 61 [133]
Note: C3 = propane

Chapter 1
41
1.5. Selective oxidation of propane to acrylic acid over MoVTeNb
oxides
1.5.1. Reaction pathways for selective propane oxidation
The oxidation of propane can be described by a complex reaction network that starts with
propane and ends with the deep oxidation product carbon dioxide. In the following model and
also in most literature carbon monoxide and carbon dioxide will not be distinguished. For
simplification reasons the sum of both components is described with COx.
The reaction network for the oxidation of propane is shown in Scheme 1.18. The activation of
propane leads to propene or iso-propanol. Elimination of iso-propanol opens a path to
propene, whereas the oxidation forms acetone. Propene can either be oxidized in allylic
position to acrolein or by oxo-insertion to acetone. Oxidation of acrolein leads to the wanted
product acrylic acid. Acetone reacts under C-C bond cleavage to acetic and finally both acids
can be further oxidized to carbon oxides.[139-144]
O
OH
OH
O
H
O
OH
O
COX
Scheme 1.18: Reaction network for the selective oxidation of propane.
A third pathway from propane over 1-propanol, propanal and 1-propionic acid to carbon
oxides is also proposed, but it is only of low relevance and therefore it is in Scheme 1.18
neglected.[121]
This reaction network is proposed for catalysts of the type MoVTeNbOx, but due to the
comparable structure it is postulated that this system is also valid for similar catalyst systems
like MoVSb(Nb)Ox.[145] The development of standard formation enthalpies for the reaction
steps is shown in Figure 1.15. Each reaction step is exothermic. The dehydration of propane
to propene is in this reaction network exothermic (∆HR0 = -117 kJ·mol-1), due to the coupling
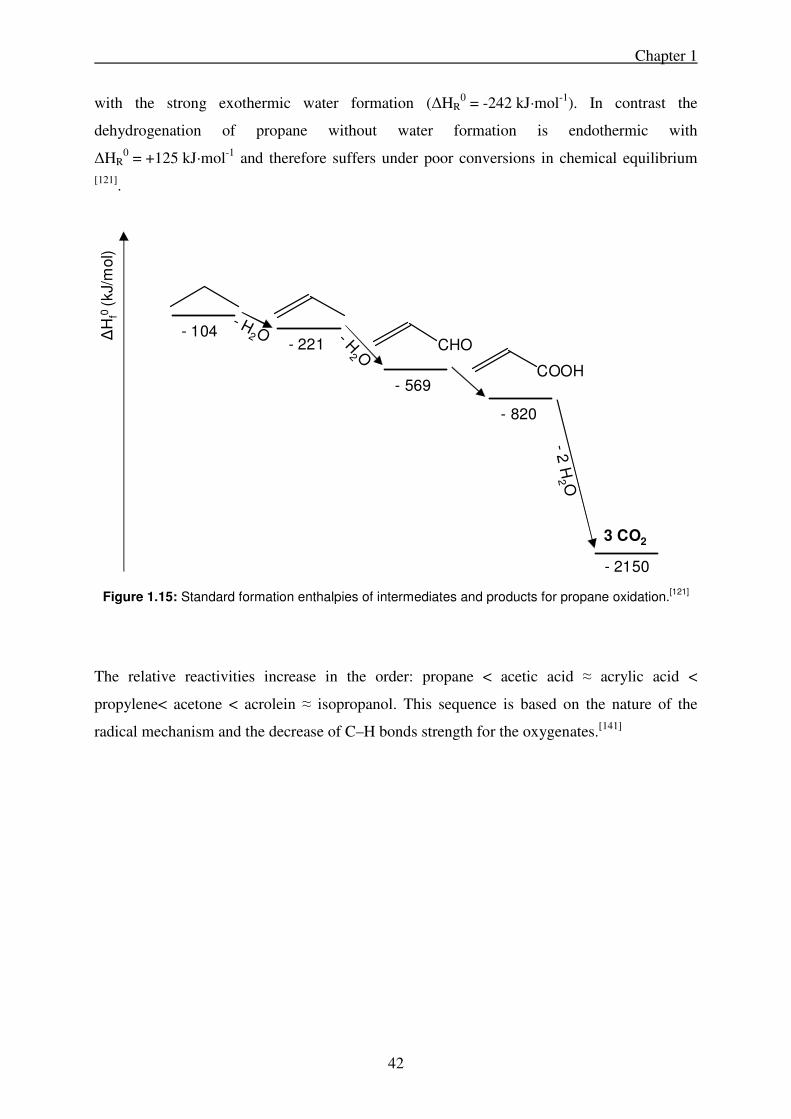
Chapter 1
42
with the strong exothermic water formation (∆HR0 = -242 kJ·mol-1). In contrast the
dehydrogenation of propane without water formation is endothermic with
∆HR0 = +125 kJ·mol-1 and therefore suffers under poor conversions in chemical equilibrium
[121].
Figure 1.15: Standard formation enthalpies of intermediates and products for propane oxidation.[121]
The relative reactivities increase in the order: propane < acetic acid ≈ acrylic acid <
propylene< acetone < acrolein ≈ isopropanol. This sequence is based on the nature of the
radical mechanism and the decrease of C–H bonds strength for the oxygenates.[141]
ΔHf0
(kJ/
mol)
- 221
3 CO2
- 2150
-2 H
2 O
- 104
- 569
- 820
- H2 O - H
2 O
CHO
COOH
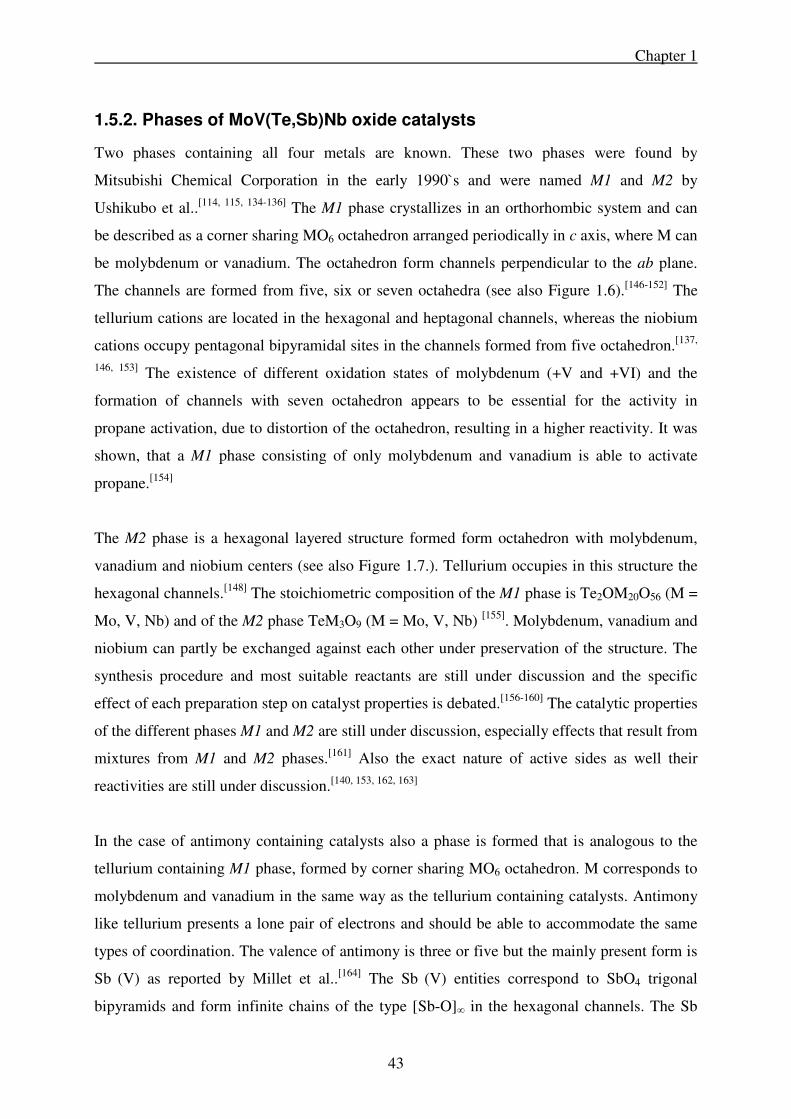
Chapter 1
43
1.5.2. Phases of MoV(Te,Sb)Nb oxide catalysts
Two phases containing all four metals are known. These two phases were found by
Mitsubishi Chemical Corporation in the early 1990`s and were named M1 and M2 by
Ushikubo et al..[114, 115, 134-136] The M1 phase crystallizes in an orthorhombic system and can
be described as a corner sharing MO6 octahedron arranged periodically in c axis, where M can
be molybdenum or vanadium. The octahedron form channels perpendicular to the ab plane.
The channels are formed from five, six or seven octahedra (see also Figure 1.6).[146-152] The
tellurium cations are located in the hexagonal and heptagonal channels, whereas the niobium
cations occupy pentagonal bipyramidal sites in the channels formed from five octahedron.[137,
146, 153] The existence of different oxidation states of molybdenum (+V and +VI) and the
formation of channels with seven octahedron appears to be essential for the activity in
propane activation, due to distortion of the octahedron, resulting in a higher reactivity. It was
shown, that a M1 phase consisting of only molybdenum and vanadium is able to activate
propane.[154]
The M2 phase is a hexagonal layered structure formed form octahedron with molybdenum,
vanadium and niobium centers (see also Figure 1.7.). Tellurium occupies in this structure the
hexagonal channels.[148] The stoichiometric composition of the M1 phase is Te2OM20O56 (M =
Mo, V, Nb) and of the M2 phase TeM3O9 (M = Mo, V, Nb) [155]. Molybdenum, vanadium and
niobium can partly be exchanged against each other under preservation of the structure. The
synthesis procedure and most suitable reactants are still under discussion and the specific
effect of each preparation step on catalyst properties is debated.[156-160] The catalytic properties
of the different phases M1 and M2 are still under discussion, especially effects that result from
mixtures from M1 and M2 phases.[161] Also the exact nature of active sides as well their
reactivities are still under discussion.[140, 153, 162, 163]
In the case of antimony containing catalysts also a phase is formed that is analogous to the
tellurium containing M1 phase, formed by corner sharing MO6 octahedron. M corresponds to
molybdenum and vanadium in the same way as the tellurium containing catalysts. Antimony
like tellurium presents a lone pair of electrons and should be able to accommodate the same
types of coordination. The valence of antimony is three or five but the mainly present form is
Sb (V) as reported by Millet et al..[164] The Sb (V) entities correspond to SbO4 trigonal
bipyramids and form infinite chains of the type [Sb-O]∞ in the hexagonal channels. The Sb

Chapter 1
44
(III) cations in the M1 phase should form SbO3E trigonal pyramid groups which correspond to
[Sb-O-Sb] dimers. The antimony cations and oxygen anions are occupying hexagonal
channels formed by the octahedron. Analogous to the tellurium containing catalysts there are
also pentagonal channels which are occupied by molybdenum and vanadium and heptagonal
channels which are empty. The formal stoichiometries can be written as (SbO)2M20O56. M can
be molybdenum, vanadium and niobium.[164-166]
Also M2 phase can be formed from antimony containing materials. The mainly valence state
of antimony is III and following the Sb (III) cations should form SbO3E trigonal pyramid
groups. This result in [Sb-O-Sb] dimers formed in the hexagonal channels. Additionally Sb
(V) cations are present in the M2 phase, which cannot adopt a three-fold coordination. They
have at least four oxygen neighbours forming SbO4 groups resulting in [Sb-O]∞ entities in the
hexagonal channels.[164]
Chapter 1
45
1.5.3. Synthesis routes for MoV(Te,Sb)NbOx type catalysts
Several methods exist to prepare multi-component metal oxides of the type
MoV(Te,Sb)NbOx. All methods have in common, that a precursor is obtained from metal
salts, which is further calcined to obtain the final catalyst. The most common metal salts for
catalyst preparation are ammonium para molybdate ((NH4)6Mo7O24), telluric acid (H6TeO6),
vanadyl sulfate (VOSO4 · x H2O), ammonium niobate oxalate ((NH4)NbO(C2O4)2) and
antimony (III) sulfate (Sb2(SO4)3).[137, 138, 167-172] Further used metal oxides are
tellurium dioxide (TeO2), vanadium (V) oxide (V2O5) and antimony (III) oxide (Sb2O3) and
metallic tellurium.[158, 159, 173-175]
The different synthesis methods are described in the following:
Dry-up (evaporation) method [157, 160, 176]
For the dry-up method all precursors are dissolved in water followed by the removal of water
by evaporation under decreased pressure (30 - 50 kPa) to obtain a precursor, that is calcined at
873 K in an inert atmosphere. Catalysts produced by this method often have phase impurities
that decrease the catalytic performance.
Freeze drying / Spray drying [177, 178]
The freeze drying and spray drying are synthesis methods similar to the dry-up method. The
water from the metal salt solution is in this case removed by freeze drying or by a spray dryer.
In both cases a solid precursor is obtained that is calcined to the final catalyst. Catalysts
obtained by both methods range from phase pure materials to materials with high fractions of
different phases depending on the exact parameters for the synthesis. Accordingly the
catalysts performances range from very good to no acrylic acid yield observable.

Chapter 1
46
Hydrothermal synthesis [156, 160]
For the hydrothermal synthesis metal salts are dissolved in water and brought into a Teflon
lined autoclave. The autoclave is exposed to hydrothermal conditions (448 K) for a specific
time (1 – 10 days). The residue is separated with a suction filter and dried (353 K). The so
obtained precursor is calcined as described in the previous methods. Catalysts synthesized by
hydrothermal method have the advantage of very good phase purity. The disadvantage is the
effort in preparation and due to material loss in precursor separation is the yield of catalyst
lower than with the other methods.
Solid state synthesis [146, 160, 179]
The solid state synthesis is done by grinding metal salts to a homogeneous mixture that is
calcined. This procedure needs the smallest effort for preparation, but good phase
compositions are rarely obtained.
The hydrothermal reaction method is the best synthesis route to prepare phase pure mixed
metal oxides for selective propane oxidation. Unfortunately it is also the most extensive
method, which is undesirable for industrial production.

Chapter 1
47
1.6. Scope of this thesis
Multi component mixed metal oxides are of great interest for the selective oxidation of
propane to acrylic acid. Up to now the yield for this reaction does not exceed 50% and
therefore this process is not competitive with the today’s used propene oxidation process.
The alkane C-H activation of the catalysts is also very low, complicating the use on an
industrial scale. Also the formations of side products like acetic acid or deep oxidation to
carbon dioxide lower the yields of acrylic acid. Understanding the effects of catalytic activity
of the different phases and the reaction pathways that lead to the observable product
distribution would be of great interest to synthesize catalysts that are competitive the today’s
propene oxidation systems on an economical base.
In this thesis the selective oxidation of propane to acrylic acid was investigated. The focus
was a profound understanding of the macrokinetics of the catalyst. Therefore detailed kinetic
measurements are the bases for developed models. Characterization was supplemented by a
variety of physicochemical techniques. From these results the conclusions were drawn and a
macrokinetic model was developed to describe the different processes on the catalyst. From
this model further conclusions on the nature of active site could be drawn. The experimental
specifications are described in chapter 2.
The phase formation of MoVTeNb oxides depending on the metal composition is described in
chapter 3. Catalysts with variation of the metal composition in the synthesis mixture were
synthesized and tested in the selective oxidation. Further characterization was done by XRD
for phase determination, ICP-AES for metal composition of the final catalysts and nitrogen
sorption for surface area determination.
Chapter 4 deals with the macrokinetics of the selective oxidation of propane over MoVTeNb
oxide catalysts. For this purpose the reaction kinetics of each intermediate in the reaction
network were determined and a macrokinetic model for the propane oxidation was developed
that explains the product distribution at different contact times. This model can also be used to
identify changes of the reaction kinetics caused by variations in synthesis. Together with
further characterization by XRD, ICP-AES and BET and conclusions on the active centers of
MoVTeNb oxides for oxidation reaction could be drawn.
Chapter 1
48
Chapter 5 focuses on the exchange of tellurium by antimony in the multi component metal
oxides. For this purpose catalysts of the composition MoVSbOx were synthesized and tested
for the selective oxidation of propane. In addition to the previous described characterization
NH3-TPD were done to determine acid site concentrations to explain changes of the in the
reaction network of MoVSb oxides in contrast to MoVTeNb oxide catalysts.
Chapter 6 gives a summary of the most important results and conclusions.

Chapter 1
49
1.7. References
[1] H.-J. Arpe, Industrielle Organische Chemie, 6. ed., Wiley-VCH, Weinheim, 2007. [2] M. Baerns, O. Buyevskaya, Catalysis Today 1998, 45, 13. [3] BP Statistical Review of World Energy June 2008, 2008. [4] R. A. Periana, D. J. Taube, E. R. Evitt, D. G. Loffler, P. R. Wentrcek, G. Voss, T.
Masuda, Science 1993, 259, 340. [5] V. Koß, Umweltchemie: Eine Einführung für Studium und Praxis, 1. ed., Springer,
Berlin, 2008. [6] T. F. Narbeshuber, H. Vinek, J. A. Lercher, J. Catal. 1995, 157, 388. [7] J. A. Lercher, R. A. v. Santen, H. Vinek, Catal. Lett. 1994, 27, 91. [8] G. Centi, F. Cavani, F. Trifiro, Selective Oxidation by Heterogeneous Catalysis,
Kluwer Academic / Plenum Publishers, New York, Boston, Dordrecht, London, Moscow, 2001.
[9] J. M. M. Millet, Top. Catal. 2006, 38, 83. [10] F. Cavani, F. Trifiro, Catal. Today 1999, 51, 561. [11] B. Grzybowska-Swierkosz, Top. Catal. 2000, 11, 23. [12] T. Ushikubo, K. Oshima, A. Kayou, M. Vaarkamp, M. Hatano, J. Catal. 1997, 169,
394. [13] J. Holmberg, R. K. Grasselli, A. Andersson, Top. Catal. 2003, 23, 55. [14] R. K. Grasselli, Catal. Today 1999, 49, 141. [15] F. Eder, J. A. Lercher, J. Phys. Chem. 1997, 101, 1273. [16] P. Botella, J. M. L. Nieto, B. Solsona, A. Mifsud, F. Marquez, J. Catal. 2002, 209,
445. [17] J. M. M. Millet, H. Roussel, A. Pigamo, J. L. Dubois, J. C. Jumas, Appl. Catal. A
2002, 232, 77. [18] W. Ueda, D. Vitry, T. Katou, Catal. Today 2005, 99, 43. [19] M. M. Lin, Appl. Catal. A 2003, 250, 305. [20] M. M. Lin, Appl. Catal. A 2003, 250, 287. [21] W. A. Goddard, K. Chenoweth, S. Pudar, A. C. T. v. Duin, M. J. Cheng, Top. Catal.
2008, 50, 2. [22] I. E. Wachs, Catal. Today 2005, 100, 79. [23] M. D. Argyle, K. Chen, E. Iglesia, A. T. Bell, J. Phys. Chem. B 2005, 109, 2414. [24] M. D. Argyle, K. Chen, C. Resini, C. Krebs, E. Iglesia, A. T. Bell, J. Phys. Chem. B
2004, 108, 2345. [25] D. E. Keller, S. M. K. Airaksinen, A. O. Krause, B. M. Weckhuysen, D. C.
Koningsberger, J. Am. Chem. Soc. 2007, 129, 3189. [26] G. Deo, I. E. Wachs, J. Catal. 1994, 146, 323. [27] X. Gao, M. A. Banares, I. E. Wachs, J. Catal. 1999, 188, 325. [28] X. Gao, J.-M. Jehng, I. E. Wachs, J. Catal. 2002, 209, 43. [29] Z. Zhao, X. Gao, I. E. Wachs, J. Phys. Chem. B 2003, 107, 6333. [30] S. Feyel, D. Schröder, X. Rozanska, J. Sauer, H. Schwarz, Angew. Chem., Int. Ed.
2006, 45, 4677. [31] S. Feyel, D. Schröder, H. J. Schwarz, J. Phys. Chem. A 2006, 110, 2647. [32] X. Rozanska, J. Sauer, J. Phys. Chem. A 2009, 113, 11586. [33] X. Rozanska, J. Sauer, Int. J. Quantum Chem. 2008, 108, 2223.

Chapter 1
50
[34] S. Feyel, D. Schröder, X. Rozanska, J. Sauer, H. Schwarz, Angew. Chem. 2006, 118, 4793.
[35] X. Rozanska, R. Fortrie, J. Sauer, J. Phys. Chem. C 2007, 111, 6041. [36] M. J. Cheng, K. Chenoweth, J. Oxgaard, A. v. Duin, W. A. Goddard, J. Phys. Chem. C
2007, 111, 5115. [37] X. Xu, F. Faglioni, W. A. Goddard, J. Phys. Chem. A 2002, 106, 7171. [38] H. Fu, Z. P. Liu, Z. H. Li, W. N. Wang, K. N. Fan, Journal of the American Chemical
Society 2006, 128, 11114. [39] X. Rozanska, E. V. Kondratenko, J. Sauer, J. Catal. 2008, 256, 84. [40] V. N. Shetti, M. J. Rani, D. Srinivas, P. Ratnasamy, J. Phys. Chem. B 2006, 110, 677. [41] D. Srinivas, P. Ratnasamy, Stud. Surf. Sci. Catal. 2007, 170, 1205. [42] A. V. Ramaswamy, S. Sivasanker, P. Ratnasamy, Microporous Mesoporous Mater.
1994, 2, 451. [43] C. Sievers, A. Onda, A. Guzman, K. S. Otillinger, R. Olindo, J. A. Lercher, J. Phys.
Chem. C 2007, 111, 210. [44] W. Fan, R. G. Duan, T. Yokoi, P. Wu, Y. Kubota, T. Tatsumi, J. Am. Chem. Soc.
2008, 130, 10150. [45] G. B. Shul’pin, T. Sooknoi, V. B. Romakh, G. Süss-Fink, L. S. Shul’pina,
Tetrahedron Lett. 2006, 47, 3071. [46] C. B. Kouw, C. B. Dartt, J. A. Labinger, M. E. Davis, J. Catal. 1994, 149, 195. [47] K. Chen, S. Xie, A. T. Bell, E. Iglesia, J. Catal. 2001, 198, 232. [48] G. Fu, X. Xu, X. Lu, H. Wan, J. Phys. Chem. B 2005, 109, 6416. [49] G. Fu, X. Xu, X. Lu, H. Wan, J. Am. Chem. Soc. 2005, 127, 3989. [50] K. D. Chen, A. T. Bell, E. Iglesia, J. Phys. Chem. B 2000, 104, 1292. [51] K. Chen, S. Xie, A. T. Bell, E. Iglesia, J. Catal. 2000, 195, 244. [52] J. A. Lercher, H. Noller, J. Catal. 1982, 77, 152. [53] H. Dai, A. T. Bell, E. Iglesia, J. Catal. 2004, 221, 491. [54] S. Yang, E. Iglesia, A. T. Bell, J. Phys. Chem. B 2006, 110, 2732. [55] E. Heracleous, A. A. Lemonidou, J. Catal. 2010, 270, 67. [56] M. M. Lin, Appl. Catal. A 2001, 207, 1. [57] P. Beato, A. Blume, F. Girgsdies, R. E. Jentoft, R. Schlögl, O. Timpe, A. Trunschke,
G. Weinberg, Q. Basher, F. A. Hamid, S. B. A. Hamid, E. Omar, L. M. Salim, Appl.
Catal. A 2006, 307, 137. [58] J. M. Oliver, J. M. L. Nieto, P. Botella, Catal. Today 2004, 96, 241. [59] P. Botella, E. Garcia-Gonzalez, J. M. L. Nieto, J. M. González-Calbet, Solid State Sci.
2005, 7, 507. [60] R. K. Grasselli, D. J. Buttrey, J. D. Burrington, A. Andersson, J. Holmberg, W. Ueda,
J. Kubo, C. G. Lugmair, A. F. V. Jr, Top. Catal. 2006, 38, 7. [61] P. Botella, E. García-González, A. Dejoz, J. M. L. Nieto, M. I. Vázquez, J. González-
Calbet, J. Catal. 2004, 225, 428. [62] T. Katou, D. Vitry, W. Ueda, Catal. Today 2004, 96, 235. [63] T. Katou, D. Vitry, W. Ueda, Catal. Today 2004, 91-92, 237. [64] R. K. Grasselli, D. J. Buttrey, P. D. Jr., J. D. Burrington, C. G. Lugmair, A. F. V. Jr.,
T. Weingand, Catal. Today 2004, 91-92, 251. [65] R. Balasubramanian, A. C. Rosenzweig, Acc. Chem. Res. 2007, 40, 573. [66] S. I. Chan, V. C.-C. Wang, J. C.-H. Lai, S. S.-F. Yu, P. P.-Y. Chen, K. H.-C. Chen, C.-
L. Chen, M. K. Chan, Angew. Chem., Int. Ed. 2007, 46, 1992. [67] G. I. Panov, A. K. Uriarte, M. A. Rodkin, V. I. Sobolev, Catal. Today 1998, 41, 365. [68] M. J. Rice, A. K. Chakraborty, A. T. Bell, J. Catal. 2000, 194, 278.

Chapter 1
51
[69] J. S. Woertink, P. J. Smeets, M. H. Groothaert, M. A. Vance, B. F. Sels, R. A. Schoonheydt, E. I. Solomon, Proc. Natl. Acad. Sci. U. S. A. 2009, 106, 18909.
[70] M. H. Groothaert, P. J. Smeets, B. F. Sels, P. A. Jacobs, R. A.Schoonheydt, J. Am.
Chem. Soc. 2005, 127, 1394. [71] V. V. Guliants, S. A. Holmes, J. B. Benziger, P. Heaney, D. Yates, I. E. Wachs, J.
Mol. Catal. A: Chem. 2001, 172, 265. [72] B. K. Hodnett, Catal. Rev. Sci. Eng. 1985, 27, 373. [73] G. Centi, F. Trifiro, J. R. Ebner, V. M. Franchetti, Chem. Rev. 1988, 88, 55. [74] Y. Zhang-Lin, M. Froissier, R. P. Sneeden, J. C. Vedrine, J. C. Volta, J. Catal. 1994,
145, 256. [75] Y. Zhang-Lin, M. Froissier, J. C. Vedrine, J. C. Volta, J. Catal. 1994, 145, 267. [76] D. J. Thompson, I. M. Ciobica, B. K. Hodnett, R. A. v. Santen, M. O. Fanning, Catal.
Today 2004, 91-92, 177. [77] M. Hävecker, R. W. Mayer, A. Knop-Gericke, H. Bluhm, E. Kleimenov, A.
Liskowski, D. Su, R. Follath, F. G. Requejo, D. F. Ogletree, M. Salmeron, J. A. Lopez-Sanchez, J. K. Bartley, G. J. Hutchings, R. Schlögl, J. Phys. Chem. B 2003, 107, 4587.
[78] F. Cavani, S. Luciani, E. D. Esposti, C. Cortelli, R. Leanza, Chem. Eur. J. 2010, 16, 1646.
[79] S. Gaab, J. Find, T. E. Müller, J. A. Lercher, Top. Catal. 2007, 46, 101. [80] B. Tope, Y. Zhu, J. A. Lercher, Catal. Today 2007, 123, 113. [81] C. P. Kumar, S. Gaab, T. E. Müller, J. A. Lercher, Top. Catal. 2008, 50, 156. [82] G. A. Olah, B. Gupta, M. Farina, J. D. Felberg, W. M. Ip, A. Husain, R. Karpeles, K.
Lammertsma, A. K. Melhotra, N. J. Trivedi, J. Am. Chem. Soc. 1985, 107, 7097. [83] S. G. Podkolzin, E. E. Stangland, M. E. Jones, E. Peringer, A. A. Lemonidou, J. A.
Lercher, J. Am. Chem. Soc. 2007, 129, 2569. [84] E. Peringer, C. Tejuja, M. Salzinger, A. A. Lemonidou, J. A. Lercher, Appl. Catal. A
2008, 350, 178. [85] E. Peringer, S. G. Podkolzin, M. E. Jones, R. Olindo, J. A. Lercher, Top. Catal. 2006,
38, 211. [86] J. H. Lunsford, Angew. Chem., Int. Ed. 1995, 34, 970. [87] A. H. Kaddouri, N. D. Blasio, R. D. Rosso, React. Kinet. Catal. Lett. 2001, 72, 309. [88] K. D. Campbell, H. Zhang, J. H. Lunsford, J. Phys. Chem. 1988, 92, 750. [89] C. T. Au, H. He, S. Y. Lai, C. F. Ng, Appl. Catal. A 1997, 159, 133. [90] S. Sugiyama, K. Sogabe, T. Miyamoto, H. Hayashi, J. B. Moffat, Catal. Lett. 1996,
42, 127. [91] P. Ciambelli, L. Lisi, R. Pirone, G. Ruoppolo, G. Russo, Catal. Today 2000, 61, 317. [92] A. E. Schweizer, M. E. Jones, D. A. Hickman, WO Pat. 6 452 058, 2002. [93] S. J. Conway, J. H. Lunsford, J. Catal. 1991, 131, 513. [94] S. J. Conway, D. J. Wang, J. H. Lunsford, Appl. Catal. A 1991, 79, L1. [95] S. Fuchs, L. Leveles, K. Seshan, L. Lefferts, A. Lemonidou, J. A. Lercher, Top. Catal.
2001, 15, 169. [96] S. Gaab, M. Machli, J. Find, R. K. Grasselli, J. A. Lercher, Top. Catal. 2003, 23, 151. [97] M. C. Wu, C. M. Truong, K. Coulter, D. W. Goodman, J. Catal. 1993, 140, 344. [98] T. König, G. H. Simon, U. Martinez, L. Giordano, G. Pacchioni, M. Heyde, H.-J.
Freund, ACS Nano 2010, 4, 2150. [99] C. Copéret, Chem. Rev. 2010, 110, 656. [100] J. Joubert, A. Salameh, V. Krakoviack, F. Delbecq, P. Sautet, C. Copéret, J. M.
Basset, J. Phys. Chem. B 2006, 110, 23944.

Chapter 1
52
[101] E. A. Pidko, R. A. v. Santen, E. J. M. Hensen, Phys. Chem. Chem. Phys. 2009, 11, 2893.
[102] E. A. Pidko, E. J. M. Hensen, R. A. v. Santen, J. Phys. Chem. C 2007, 111, 13068. [103] H. Frei, Science 2006, 313, 309. [104] H. Tsubomura, R. S. Mulliken, J. Am. Chem. Soc. 1960, 82, 5966. [105] F. Blatter, H. Frei, J. Am. Chem. Soc. 1993, 115, 7501. [106] J. Xu, B. L. Mojet, J. G. v. Ommen, L. Lefferts, J. Phys. Chem. B 2004, 108, 15728. [107] J. Xu, B. L. Mojet, J. G. v. Ommen, L. Lefferts, J. Catal. 2005, 232, 411. [108] E. A. Pidko, J. Xu, B. L. Mojet, L. Lefferts, I. R. Subbotina, V. B. Kazansky, R. A. v.
Santen, J. Phys. Chem. B 2006, 110, 22618. [109] J. Xu, B. L. Mojet, J. G. v. Ommen, L. Lefferts, J. Phys. Chem. B 2005, 109, 18361. [110] P.Li, Y. Xiang, V. H.Grassian, S. C. J. Larsen, J. Phys. Chem. B 1999, 103, 5058. [111] W. Reppe, Neue Entwicklungen auf dem Gebiet der Chemie des Acetylen und
Kohlendxyds, Springer, Berlin, Göttingen, Heidelberg, 1949. [112] W. Nojiri, Y. Sakai, Y. Watanabe, Catalysis Reviews Science and Engineering 1995,
37, 145. [113] F. Cavani, F. Trifiro, Applied Catalysis A 1992, 88, 115. [114] T. Ushikubo, H. Nakamura, Y. Koyasu, S. Wajiki, US Patent 5,380,933, 1995. [115] T. Ushikubo, H. Nakamura, Y. Koyasu, S. Wajiki, EP Patent 608.838 A2, 1994. [116] J. J. Siegfried, Journal of Political Economy 1970, 78, 1378. [117] G. Landi, L. Lisi, G. Russo, Journal of Molecular Catalysis A 2005, 239, 172. [118] G. Landi, L. Lisi, J. C. Volta, Journal of Molecular Catalysis A 2004, 222, 175. [119] A. Costine, B. K. Hodnett, Applied Catalysis A 2005, 290, 9. [120] C. H. Bartholomew, R. J. Farrauto, Fundamentals of industrial catalytic processes, 2
ed., John Wiley & Sons, 2005. [121] M. M. Lin, Applied Catalysis A 2001, 207, 1. [122] P. Mars, D. W. van Krevelen, Chemical Engineering Science 1954, 3 supp., 41. [123] K. D. Chen, A. Khodakov, J. Yang, A. T. Bell, E. Iglesia, Journal of Catalysis 1999,
186, 325. [124] M. Ai, Journal of Catalysis 1989, 101, 389. [125] Z. Wang, W. Wei, G. Liu, G. Mao, D. Kuang, Acta Petroleum Sinica 1998, 14, 21. [126] R. Zhao, Z. Wu, Z. Wang, Shiyou Huagong 1995, 24, 157. [127] W. Li, K. Oshihara, W. Ueda, Applied Catalysis A 1999, 182, 357. [128] N. Mizuno, M. Tateishi, M. Iwamoto, Applied Catalysis A 1995, 128, L165. [129] W. Ueda, Y. Suzuki, Chemistry Letters 1995, 541. [130] K. Nomiya, T. Takahashi, T. Shirai, M. Miwa, Polyhedron 1987, 6, 213. [131] R. K. Grasselli, Journal of Chemical Education 1986, 63, 216. [132] L. Luo, J. Labinger, M. Davis, in Catalysis and Surface Science, Poster, 219th ACS
Meeting, 2000. [133] M. Takahashi, S. To, S. Hirose, JP Patent 98,118,491, 1998. [134] T. Ushikubo, Y. Koyasu, H. Nakamura, S. Wajiki, JP Patent 98,045,664, 1998. [135] T. Ushikubo, K. Oshima, A. Kayo, T. Umezawa, K. Kiyono, I. Sawaki, EP Patent
529.853 A2, 1992. [136] T. Ushikubo, I. Sawaki, K. Oshima, K. Inumaru, S. Kobayakawa, K. Kiyono, US
Patent 5,422,328, 1995. [137] P. Botella, J. M. L. Nieto, B. Solsona, Catalysis Letters 2002, 78, 383. [138] K. Oshihara, T. Hisano, W. Ueda, Topics in Catalysis 2001, 15, 153. [139] E. Balcells, F. Borgmeier, I. Grisstede, H. G. Lintz, Catalysis Letters 2003, 87, 195. [140] E. Balcells, F. Borgmeier, I. Grisstede, H. G. Lintz, F. Rosowski, Applied Catalysis A
2004, 266, 211.
Chapter 1
53
[141] M. H. Lin, T. B. Desai, F. W. Kaiser, P. D. Klugherz, Catalysis Today 2000, 61, 223. [142] L. Luo, J. A. Labinger, M. E. Davis, Journal of Catalysis 2001, 200, 222. [143] D. L. Stern, R. K. Grasselli, Journal of Catalysis 1997, 167, 560. [144] S. R. Logan, Fundamentals of Chemical Kinetics, Longman, Essex, 1996. [145] E. K. Novakova, J. C. Vedrine, E. G. Derouane, Journal of Catalysis 2002, 211, 226. [146] P. Botella, E. Garcia-Gonzalez, J. M. L. Nieto, J. M. Gonzalez-Calbet, Solid State
Sciences 2005, 7, 507. [147] P. DeSanto, D. J. Buttrey, R. K. Grasselli, C. G. Lugmair, A. F. Volpe, B. H. Toby, T.
Vogt, Topics in Catalysis 2003, 23, 23. [148] P. DeSanto, D. J. Buttrey, R. K. Grasselli, C. G. Lugmair, A. F. Volpe, B. H. Toby, T.
Vogt, Zeitschrift Für Kristallographie 2004, 219, 152. [149] H. Murayama, D. Vitry, W. Ueda, G. Fuchs, M. Anne, J. L. Dubois, Applied Catalysis
A 2007, 318, 137. [150] J. N. Al-Saeedi, V. K. Vasudevan, V. V. Guliants, Catalysis Communications 2003, 4,
537. [151] M. Aouine, J. L. Dubois, J. M. M. Millet, Chemical Communications 2001, 1180. [152] H. Hibst, F. Rosowski, G. Cox, Catalysis Today 2006, 117, 234. [153] R. K. Grasselli, J. D. Burrington, D. J. Buttrey, P. DeSanto, C. G. Lugmair, A. F.
Volpe, T. Weingand, Topics in Catalysis 2003, 23, 5. [154] W. Ueda, D. Vitry, T. Katou, Catalysis Today 2005, 99, 43. [155] J. M. M. Millet, H. Roussel, A. Pigamo, J. L. Dubois, J. C. Jumas, Applied Catalysis A
2002, 232, 77. [156] P. Botella, B. Solsona, A. Martinez-Arias, J. M. L. Nieto, Catalysis Letters 2001, 74,
149. [157] M. M. Lin, Applied Catalysis A 2003, 250, 287. [158] J. M. L. Nieto, P. Botella, B. Solsona, J. M. Oliver, Catalysis Today 2003, 81, 87. [159] X. L. Tu, N. Furuta, Y. Sumida, M. Takahashi, H. Niiduma, Catalysis Today 2006,
117, 259. [160] H. Watanabe, Y. Koyasu, Applied Catalysis A 2000, 194, 479. [161] M. Baca, M. Aouine, J. L. Dubois, J. M. M. Millet, Journal of Catalysis 2005, 233,
234. [162] R. K. Grasselli, Catalysis Today 2005, 99, 23. [163] R. K. Grasselli, D. J. Buttrey, J. D. Burrington, A. Andersson, J. Holmberg, W. Ueda,
J. Kubo, C. G. Lugmair, A. F. Volpe, Topics in Catalysis 2006, 38, 7. [164] J. M. M. Millet, M. Baca, A. Pigamo, D. Vitry, W. Ueda, J. L. Dubois, Applied
Catalysis A 2003, 244, 359. [165] M. Baca, J. M. M. Millet, Applied Catalysis A 2005, 279, 67. [166] O. V. Safonova, B. Deniau, J. M. M. Millet, Journal of Physical Chemistry B 2006,
110, 23962. [167] W. Ueda, D. Vitry, T. Katou, Catalysis Today 2004, 96, 235. [168] V. V. Guliants, R. Bhandari, J. N. Al-Saeedi, V. K. Vasudevan, R. S. Soman, O.
Guerrero-Perez, M. A. Banares, Applied Catalysis A 2004, 274, 123. [169] M. M. Lin, Applied Catalysis A 2003, 250, 305. [170] P. Botella, J. M. L. Nieto, B. Solsona, A. Mifsud, F. Marquez, Journal of Catalysis
2002, 209, 445. [171] E. K. Novakova, J. C. Vedrine, E. G. Derouane, Journal of Catalysis 2002, 211, 235. [172] W. Ueda, K. Oshihara, D. Vitry, T. Hisano, Y. Kayashima, Catalysis Surveys from
Japan 2002, 6, 33. [173] P. Botella, P. Concepcion, J. M. Lopez Nieto, Y. Moreno, Catalysis Today 2005, 99,
51.

Chapter 1
54
[174] F. Ivars, P. Botella, A. Dejoz, J. M. L. Nieto, P. Concepcion, M. I. Vazquez, Topics in
Catalysis 2006, 38, 59. [175] G. Y. Popova, T. V. Andrushkevich, G. I. Aleshina, L. M. Plyasov, M. I. Khramov,
Applied Catalysis A 2007, 328, 195. [176] B. C. Zhu, H. B. Li, W. S. Yang, L. W. Lin, Catalysis Today 2004, 93-95, 229. [177] P. Beato, A. Blume, E. Girgsdies, R. E. Jentoft, R. Schlogel, O. Timpe, A. Trunschke,
G. Weinberg, Q. Basher, F. A. Hamid, S. B. A. Hamid, E. Omar, L. M. Salim, Applied
Catalysis A 2006, 307, 137. [178] A. Celaya Sanfiz, T. W. Hansen, A. Sakthivel, A. Trunschke, R. Schlogel, A.
Knoester, H. H. Brongersma, M. H. Looi, S. B. A. Hamid, Journal of Catalysis 2008, 258, 35.
[179] S. A. Holmes, J. Al-Saeedi, V. V. Guliants, P. Boolchand, D. Georgiev, U. Hackler, E. Sobkow, Catalysis Today 2001, 67, 403.

Chapter 2
55
Chapter 2
Experimental Section

Chapter 2
56
2.1. Standard preparation of MoV(Te,Sb)Nb oxides
MoV(Te,Sb)Nb oxide catalysts were prepared with a hydrothermal method (compare chapter
1.5.3.). Used metal salts were ammonium para molybdate (NH4)6Mo7O24 · 4 H2O, telluric acid
H6TeO6, vanadyl sulfate VOSO4 · x H2O and ammonium niobium oxalat
(NH4)NbO(C2O4)2 · xH2O. All chemicals were from Aldrich or Fluka and were used as
received. For the calculation of stoichiometries the molecular weights of
ammonium para molybdate and telluric acid were used, whereas for vanadyl sulfate and
ammonium niobium oxalate this method was not possible, due to the unknown amount of
water. For calculation of the needed amount of vanadium and niobium salt the information of
the metal content from analysis available from the vendor was used.
The synthesis was done in a Teflon lined tube. In this way decanting of the synthesis gel was
not required. The tube was heated in an oil bath to 353 K. 50 ml ultra pure water was filled
into the teflon tube and the calculated amount of ammonium para molybdate was added under
magnetic stirring. Telluric acid was dissolved in approximately 10 ml water and was added to
the molybdate solution drop wise, resulting in a clear solution. Vanadylsulfate
VOSO4 · x H2O was dissolved in 10 ml water. To improve solubility the solution was heated
on a hotplate to 353 K and then slowly (30 min) added into the teflon tube. In result the color
of the solution becomes black. The ammonium niobium oxalat (NH4)NbO(C2O4)2 · xH2O was
also added as a heated solution (353 K) within 5 minutes followed by 10 minutes stirring. The
solution turned from black over dark purple to olive green during this time. Dissolved oxygen
was removed by bubbling nitrogen for 2 minutes through the solution. Then the Teflon tube
was closed by a teflon cap (the magnetic stir bar was left in the tube during hydrothermal
treatment), mounted into a steel autoclave and heated to 448 K under autogenous pressure.
After a defined time, the autoclave was removed from the oven and cooled with water to room
temperature (approx. 15 min). The residue was filtrated, washed five times with ultra pure
water and dried at 353 K for 16 h. The material was calcined 2 h at 523 K in static air and
then 2 h at 873 K in nitrogen (heating rate 10 K/min).
Before testing the sample in the reaction set-up it was ground to powder and afterwards
pressed with 61 MPa (using a round stainless steel pressing device with a diameter of 2.5 cm
with a hydraulic press at 3 tons) and sieved to a particle size of 150 – 212 µm.

Chapter 2
57
Variations of this standard procedure are described in the particular chapter.
2.2. Catalytic testing
2.2.1. Experimental reactor set-up
Selective oxidation of propane was performed in a six-fold parallel continuous plug flow
reactor at atmospheric pressure. The reactors consist of steel tubes with an inner diameter of
4 mm and 18 cm length and were connected to the set-up by VCR screwings with copper
sealings. The reactors were equipped with a mantle of aluminum to enhance heat transfer
between reactor and oven.
The feed consist of propane, oxygen, steam and nitrogen as balance and were controlled by
Broonkhorst mass flow controllers. The evaporation of water was done with a commercial
available Wagner CEM system (controlled evaporator mixer). The flow in each reactor was
controlled by individual mass flow controllers, operated at elevated temperature. To stabilize
the inlet pressure of the reactor MFCs a buffer of 250 ml volume was mounted between the
feed system and the reactor MFCs. The reactor MFCs were calibrated at elevated temperature
to nitrogen. The flow of feed can be calculated from the density and heat capacity of the
relevant feed composition. Results for a feed composition of 5 / 10 / 65 / 25
(propane / O2 / N2 / H2O) are shown in Table 2.1 (mln are defined at 1013.25 hPa and
273.15 K).
Table 2.1: Conversion of N2 - Feed flow: 5 / 10 / 65 / 25 (propane / O2 / N2 / H2O).
Nitrogen flow
[mln/min]
Feed flow
[mln/min]
20 17.24
15 12.90
10 8.61
5 4.32

Chapter 2
58
The set-up is build within a box of Macrolon® (plexi glas) and PU insulation, heated to 373 K
to prevent condensation of the water in the feed. The outlet of the reactors lead directly in to a
second box heated to 423 K, to prevent condensation of oxidation products like acrylic acid.
A 8-fold Valco valve was used to select the outlet of one reactor stream for GC analysis. The
process flow diagram is shown in Figure 2.1.
Figure 2.1: Process flow diagram of reaction set-up.
The GC sample loops were placed in an oven at 473 K and connected to the set-up by a
heated 1/8 inch tube. The GC system was constructed by Shimadzu and is using two GCs for
analysis. The first GC is equipped with a 25 m FFAP-Column and a flame ionization detector
(FID). The high polarity of the column leads to a good separation of acetone, acrolein, acetic
acid, propionic acid and acrylic acid.
The second GC is equipped with a precolumn with back flush using a 10-fold valve. In
loading position the reactor flow is flushing to sample loop, carrier 1 goes onto the columns in
the GC oven and carrier 2 back-flushes the precolumn (2 m HayeSep Q 60/80 mesh). When
switching to dosing position, carrier 2 transports the sample from the sample loop over the
precolumn to the columns in the GC oven. When oxygen, nitrogen, CO, CO2, propane and
propene have passed the precolumn, the dosing valve is switched back to loading position and
all components remaining on the precolumn are back-flushed. For the separation are used a
1.5 m silica column (800/100 mesh) and a 2 m molesieve column (60/80 mesh) that can be
C3H8
O2
N2
H2O
Evaporator
Buffer
Reactor-MFC Reactors
Waste
to GC
8-portValve
90°C
100°C 150°C
C3H8
O2
N2
H2O
Evaporator
Buffer
Reactor-MFC Reactors
Waste
to GC
8-portValve
90°C
100°C 150°C
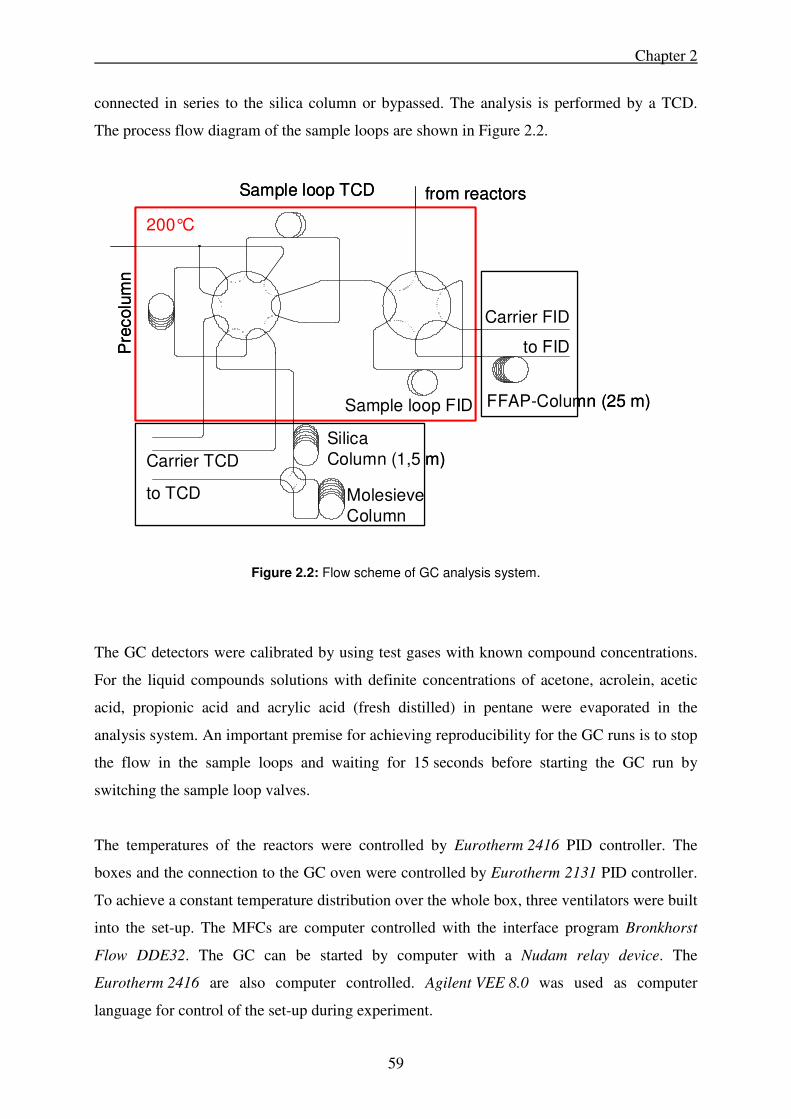
Chapter 2
59
connected in series to the silica column or bypassed. The analysis is performed by a TCD.
The process flow diagram of the sample loops are shown in Figure 2.2.
Figure 2.2: Flow scheme of GC analysis system.
The GC detectors were calibrated by using test gases with known compound concentrations.
For the liquid compounds solutions with definite concentrations of acetone, acrolein, acetic
acid, propionic acid and acrylic acid (fresh distilled) in pentane were evaporated in the
analysis system. An important premise for achieving reproducibility for the GC runs is to stop
the flow in the sample loops and waiting for 15 seconds before starting the GC run by
switching the sample loop valves.
The temperatures of the reactors were controlled by Eurotherm 2416 PID controller. The
boxes and the connection to the GC oven were controlled by Eurotherm 2131 PID controller.
To achieve a constant temperature distribution over the whole box, three ventilators were built
into the set-up. The MFCs are computer controlled with the interface program Bronkhorst
Flow DDE32. The GC can be started by computer with a Nudam relay device. The
Eurotherm 2416 are also computer controlled. Agilent VEE 8.0 was used as computer
language for control of the set-up during experiment.
200°C
from reactorsSample loop TCD
Sample loop FID FFAP-Column (25 m)
SilicaColumn (1,5 m)
MolesieveColumn(2 m)
to TCD
Carrier TCD
Pre
colu
mn
Carrier FID
to FID
200°C
from reactorsSample loop TCD
Sample loop FID FFAP-Column (25 m)
SilicaColumn (1,5 m)
MolesieveColumn(2 m)
to TCD
Carrier TCD
Pre
colu
mn
Carrier FID
to FID

The reactors were filled with the catalysts
following way: The bottom o
with a 1 cm piece of quartz wool. A layer
500 µm silicon carbide was inserted, so that the catalyst
layer starts at the bottom of the aluminum mantle. The
sieved catalyst particles were mixed with a ten
amount of 210 – 355 µm SiC and were covered with a
second layer of 355 – 500 µm SiC to
reactor (Figure 2.3).
For testing of film diffusion all six reactors were filled
with different amounts of catalysts and operated at same
contact time and temperature. The results show that for flow rates higher than 4
significant effects of mass transfer can be observed. Testing
neglected due to the absence of pores in mixed metal oxides.
2.2.2. Evaluation of kinetic data
In the oxidation reactions starting from propane, the mole number changes. Due to the fact
that the sample loops of the GCs have a co
corrected by a normalizing factor. Because nitrogen is not involved in the reaction, the N
concentration can be used as an internal standard to obtain the normalizing factor
(Equation 2.1). Feed concentrations are marked with a subscript index
a reaction are marked with a subscript index
For low conversions and therefore
normalizing factor can also be
stoichiometry for each reaction (Equation
60
with the catalysts in the
following way: The bottom of the steel tube was closed
cm piece of quartz wool. A layer of 355 –
inserted, so that the catalyst
layer starts at the bottom of the aluminum mantle. The
particles were mixed with a ten-fold
µm SiC and were covered with a
µm SiC to the top of the
film diffusion all six reactors were filled
with different amounts of catalysts and operated at same
contact time and temperature. The results show that for flow rates higher than 4
significant effects of mass transfer can be observed. Testing for pore diffusion can be
neglected due to the absence of pores in mixed metal oxides.
Evaluation of kinetic data
In the oxidation reactions starting from propane, the mole number changes. Due to the fact
that the sample loops of the GCs have a constant volume, measured concentrations have to be
corrected by a normalizing factor. Because nitrogen is not involved in the reaction, the N
concentration can be used as an internal standard to obtain the normalizing factor
rations are marked with a subscript index 0, concentrations from
a reaction are marked with a subscript index R.
[ ][ ]
RN
NNF
2
02= (Equation
ow conversions and therefore small changes of the nitrogen concentration
can also be calculated from the amount of products formed, based on the
for each reaction (Equation 2.2).
Figure 2.3: Reactor packing
Chapter 2
contact time and temperature. The results show that for flow rates higher than 4 mln/min no
pore diffusion can be
In the oxidation reactions starting from propane, the mole number changes. Due to the fact
nstant volume, measured concentrations have to be
corrected by a normalizing factor. Because nitrogen is not involved in the reaction, the N2
concentration can be used as an internal standard to obtain the normalizing factor NF
, concentrations from
Equation 2.1)
small changes of the nitrogen concentration, the
formed, based on the
SiC-Layer
VCR-Screwing
VCR-Screwing
Thermocouple Quartz-wool
Catalyst-Layer
SiC-Layer
Reactor packing.

Chapter 2
61
[ ] [ ] [ ] [ ] [ ] [ ] [ ] [ ] [ ] [ ] [ ]
[ ] [ ] [ ] [ ] [ ] [ ] [ ] [ ] [ ] [ ] [ ]1004
5
100
Pr
5
6
1006
5
1001004
3
100100
Pr
7
6
10014
9
100100100
100
PrPr
222
222
RRRRRRRRRRR
RRRRRRRRRRR
AAAAcAAcrAcePeCOCONO
AAAAcAAcrAcePeCOCONO
NF
+⋅+⋅+⋅++⋅++⋅+⋅++
++++++++++
=
(Equation 2.2)
The calculation from the nitrogen concentration is preferred for high conversions, because of
high changes of the volume, whereas the second formula is more suitable for low conversions.
The normalizing factor NF was used for normalizing the concentrations as shown by Equation
2.3. Normalized concentrations are marked with a subscript index N.
[ ] [ ]RN componentNFcomponent ⋅= (Equation 2.3)
To verify the measurement the carbon-, hydrogen- and oxygen balance are calculated
(Equation 2.4 – 2.6)
[ ] [ ] [ ] [ ] [ ] [ ] [ ][ ] [ ] [ ] [ ] [ ] [ ] [ ] [ ] [ ]0000000020
2
3Pr32333Pr3
3Pr3233
AAAAcAAcrAcePeCOCO
AAAAcAAcrAceCOCOBalanceC NNNNNNN
⋅+⋅+⋅+⋅+⋅+⋅+⋅++
⋅+⋅+⋅+⋅+⋅++=−
(Equation 2.4)
[ ] [ ] [ ] [ ] [ ] [ ] [ ] [ ]
[ ] [ ] [ ] [ ] [ ] [ ] [ ] [ ] )100(2Pr2222
)100(2Pr2222
00000002002
22
∑∑
−+⋅+⋅+⋅+++⋅++⋅
−+⋅+⋅+⋅+++⋅++⋅=−
componentsAAAAcAAcrAceCOCOO
componentsAAAAcAAcrAceCOCOOBalanceO
NNNNNNNNN
(Equation 2.5)
[ ] [ ] [ ] [ ] [ ] [ ] [ ]
[ ] [ ] [ ] [ ] [ ] [ ] [ ] )100(24Pr64466Pr8
)100(24Pr64466Pr8
00000000 ∑∑
−⋅+⋅+⋅+⋅+⋅+⋅+⋅+⋅
−⋅+⋅+⋅+⋅+⋅+⋅+⋅+⋅=−
componentsAAAAcAAcrAcePe
componentsAAAAcAAcrAcePeBalanceH
NNNNNNNN
(Equation 2.6)
All balances should be between 97% and 103%. Higher deviations indicate wrong component
calibrations or errors during measurement.
The conversion is defined in the following way (Equation 2.7):
[ ] [ ][ ]00
Pr
PrPr NX−
= (Equation 2.7)
For low conversions the determination of the difference of the propane concentration is
getting difficult and therefore the conversion can also be calculated from the formation of the

Chapter 2
62
formed products that can by measured with a higher accuracy. For this calculation Equation
2.8 is used:
[ ] [ ] [ ] [ ] [ ] [ ] [ ] [ ][ ] [ ] [ ] [ ] [ ] [ ] [ ] [ ] [ ]AAAAcAAcrAcePeCOCO
AAAAcAAcrAcePeCOCOX
N ∆⋅+∆⋅+∆⋅+∆⋅+∆⋅+∆⋅+⋅+∆+∆
∆⋅+∆⋅+∆⋅+∆⋅+∆⋅+∆⋅+∆+∆=
3Pr32333Pr3
3Pr32333
2
2
with [ ] [ ] [ ]0componentcomponentcomponent N −=∆ (Equation 2.8)
The selectivities are defined by Equation 2.9:
[ ] [ ][ ] [ ] 3PrPr 0
0 component
N
N componentcomponentS
ν⋅
−
−=
(Equation 2.9)
with νcomponent is the number of carbon atoms of the component molecule
For low conversions the error of the propane measurement is higher, a calculation of the
selectivity can also be done from the concentrations of formed products (Equation 2.10):
[ ] [ ][ ] [ ]
[ ] [ ] [ ] [ ] [ ] [ ]⋅⋅
∆+∆+∆⋅+∆+∆+∆+∆
+∆
−=
3Pr
3
2
332
0 componentN
AAAAcAAcrAcePeCOCO
componentcomponentS
ν
with [ ] [ ] [ ]0componentcomponentcomponent N −=∆ and (Equation 2.10)
νcomponent is the number of carbon atoms of component
Yields are defined in the following way (Equation 2.11):
[ ] [ ][ ] 3Pr 0
0 componentN componentcomponentY
ν⋅
−=
(Equation 2.11)
with νcomponent is the number of carbon atoms of component molecule
Analog to the calculations of the selectivity for low propane conversions, yields can also be
calculated from product formation (Equation 2.12):
[ ] [ ][ ] [ ]
[ ] [ ] [ ] [ ] [ ] [ ] [ ]⋅⋅
∆+∆+∆⋅+∆+∆+∆++∆
+∆
−=
3Pr
3
2Pr
332
0 componentN
AAAAcAAcrAcePeCOCO
componentcomponentS
ν

Chapter 2
63
with [ ] [ ] [ ]0componentcomponentcomponentN
−=∆ and (Equation 2.12)
νcomponent is the number of carbon atoms of component
2.3. Characterization of catalysts
X-ray diffraction patterns were collected on a Philips X’pert instrument at the energy of the
Cu Kα-line. A Ni-filter was installed to remove the Cu Kβ-line. The XRD were measured
between 2θ angles of 5 and 70 ° with a step size of 0.017 ° and a scan speed of 115 s per step
with a X’Cellerator semiconductor detector.
BET surface areas were determined by N2 adsorption–desorption at 77 K using a Sorptomatic
1990 Series instrument after activation of the sample in vacuum at 523 K.
ICP-AES was measured with a Spectroflame Module. The samples were decomposed by
heating 50 mg catalysts with 250 mg Soda – potash mixture in a ceramic crucible to red heat
for 15 minutes. After cool down the melt is dissolved in water, 1 ml concentrated nitric acid
and 1 ml 15% hydrofluoric acid and stirred for one hour. The solution is transferred to a
100 ml flask filled half with ultra pure water with an addition of 5 ml conc. HNO3. The
crucible is rinsed again with 1 ml conc. HNO3 and the flask is filled up with ultra pure water.
Calibrations were done with commercial available ICP multi-element standard dilutions in
1 N HNO3 with additional 0.15% HF.
Ammonia-TPD was measured with a six-fold vacuum TPD system, with one hour activation
at 523 K, one hour ammonia loading at 1 mbar and two hour outgasing. TPD was carried out
with a heating rate of 7 K/min up to 573 K for tellurium containing materials respectively
773 K for antimony containing materials. The desorbed species were detected by MS. A H-
MFI zeolite with an acid site concentration of 360 µmol/g was used as internal standard.

Chapter 2
64
Chapter 3
65
Chapter 3
Phase Formation and selective Oxidation of
Propane over MoVTeNbOx Catalysts with
varying Compositions
Abstract
The selective oxidation of propane to acrylic acid on MoVTeNbOx catalysts with varying
concentrations of vanadium, tellurium and niobium was investigated. Catalysts containing M1
phase were obtained over the compositional range of MoV0.14-0.22Te0.1-0.2Nb0.1-0.2Ox.
Vanadium containing sites in the M1 phase are drastically more active for propane activation
than in other materials studied. The catalytic activity is directly correlated to its fraction in the
overall material and in particular the M1 phase. High concentrations of tellurium induce the
formation of the M2 phase decreasing so the overall activity of the catalysts. The intrinsic
activity of the M1 phase is, however, independent of the tellurium concentration. Although
the presence of the M1 phase is not a stringent requirement for the oxidative dehydrogenation
of propane to propene, it is required to oxidize the intermediately formed propene with high
selectivity to acrylic acid. The active sites for propane activation and propene oxidation are
structurally coupled, because the ratio between the rates of the two reactions was always
1 : 25. Oxygen defect sites in mixed oxides seem to enhance interaction with acrylic acid and
lead to decarboxylation and total oxidation.

Chapter 3
66
3.1. Introduction
Acrylic acid is widely used as monomer for special application in polymers and its demand
grows steadily at a high rate. A direct route from propane to acrylic acid is, therefore, of
potential economic interest in order to replace the currently used two step oxidation from
propene to acrylic acid.[1-3] The balance between high activity in the activation of the C-H
bond of propane required for the transformation to propene and high selectivity in the
conversion of propene to acrylic acid in order to prevent side product formation or deep
oxidation to COx, are the boundary conditions required for a catalyst in a process that has
sufficient productivity and selectivity to compete with the current technology. In the
conventional oxidation of propene to acrylic acid these demands are addressed by using a
two-step process applying different catalysts and reaction temperatures for the oxidation of
propene (BiMo oxide at 600 K) and the subsequent oxidation of acrolein into acrylic acid
(MoVW oxide at 520 K).[2, 4]
Multi-component mixed metal oxides of the type MoVTeNbOx have been reported to be the
most promising catalysts for the direct oxidation of propane to acrylic acid. Yields up to 48%
at temperatures between 620 and 720 K have been documented in the open literature.[5, 6]
Even considering that the yields could be significantly higher in proprietary industrial
experiments, the productivity and yield are far below the current process. Thus, it is important
to understand the kinetic limitations to envisage a catalyst design able to reach the required
productivity for a single strep process.
Two crystalline phases of MoVTeNbOx catalysts, known as M1 and M2 phases, are
intensively discussed with respect to their rates in the oxidation of propane to acrylic acid.[7-9]
Depending upon preparation conditions, the final catalyst crystallizes in the M1 or M2 phase
or as a phase mixture.[9] The M1 phase consists of octahedra with molybdenum and vanadium
centers connected via corner sharing oxygen atoms that form a structure with periodic layers
and channels perpendicular to the ab plane (see Figure 3.1). Niobium is located inside the
smallest channels, formed from five octahedra, whereas tellurium occupies channels formed
from six or seven octahedra.[10] The existence of metals in a reduced oxidation state (V4+ or
Mo5+) in MoVTeNbOx crystallite appears to be essential for reaching a high activity for the
propane activation.[11] It was shown that a catalyst (Mo-V-O) consisting of crystalline
orthorhombic phase formed by molybdenum and vanadium is also able to activate propane.[12]
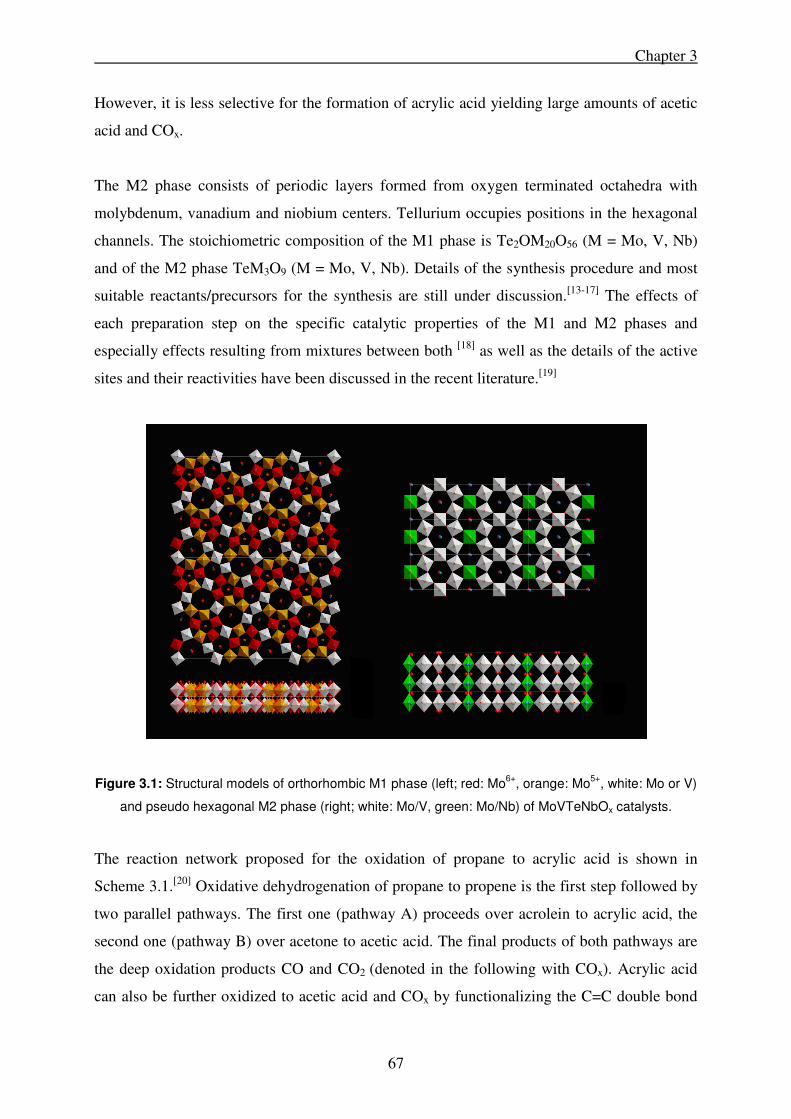
Chapter 3
67
However, it is less selective for the formation of acrylic acid yielding large amounts of acetic
acid and COx.
The M2 phase consists of periodic layers formed from oxygen terminated octahedra with
molybdenum, vanadium and niobium centers. Tellurium occupies positions in the hexagonal
channels. The stoichiometric composition of the M1 phase is Te2OM20O56 (M = Mo, V, Nb)
and of the M2 phase TeM3O9 (M = Mo, V, Nb). Details of the synthesis procedure and most
suitable reactants/precursors for the synthesis are still under discussion.[13-17] The effects of
each preparation step on the specific catalytic properties of the M1 and M2 phases and
especially effects resulting from mixtures between both [18] as well as the details of the active
sites and their reactivities have been discussed in the recent literature.[19]
Figure 3.1: Structural models of orthorhombic M1 phase (left; red: Mo6+
, orange: Mo5+
, white: Mo or V)
and pseudo hexagonal M2 phase (right; white: Mo/V, green: Mo/Nb) of MoVTeNbOx catalysts.
The reaction network proposed for the oxidation of propane to acrylic acid is shown in
Scheme 3.1.[20] Oxidative dehydrogenation of propane to propene is the first step followed by
two parallel pathways. The first one (pathway A) proceeds over acrolein to acrylic acid, the
second one (pathway B) over acetone to acetic acid. The final products of both pathways are
the deep oxidation products CO and CO2 (denoted in the following with COx). Acrylic acid
can also be further oxidized to acetic acid and COx by functionalizing the C=C double bond

Chapter 3
68
followed by elimination of CO or CO2. Note that direct reaction pathways to COx, caused by
the presence of unselective catalytic sites, also exist for propane and all intermediates (not
shown in Scheme 3.1 due to clarity of the figure).
Scheme 3.1: Proposed reaction network in the selective oxidation of
propane over MoVTeNbOx catalysts.
As a first step towards understanding the kinetic limitations of the selective oxidation of
propane to acrylic acid, we explore here the influence of vanadium, niobium and tellurium on
the phase formation and the quantitative and qualitative aspects of the catalytic properties
using a series of catalysts with a controlled variation of the composition.
CHO
O
COOH
CH3COOH
COX
i
ii
i
ii
A
B

Chapter 3
69
3.2. Experimental
3.2.1. Catalyst preparation
Ammonium heptamolybdate, (NH4)6Mo7O24 · 4H2O, was dissolved together with telluric acid,
H6TeO6,in 50 ml bidistilled water and the solution was dried at 353 K for 24 h. The resulting
white molybdotellurate complex was mixed with 50 ml water and heated to 353 K. A solution
of vanadyl sulfate, VOSO4 x H2O, (10 ml) was added drop wise within 30 min resulting in a
black solution. Ammonium niobium oxalate (NH4)NbO(C2O4)2 ·xH2O was added as solution
and after 15 min of stirring the slurry was transferred to a PTFE lined autoclave and heated to
448 K under autogenous pressure. After 72 h the autoclave was removed from the oven and
cooled with water to room temperature. The residue was filtered, washed five times with
bidistilled water and dried at 353 K for 16 h. The material was calcined for 2 h at 523 K in
static air and then for 2 h at 873 K in N2 (heating rate 10 K/min). Before reaction, the sample
was ground and the fraction of particles with a size between 150 and 212 µm was used. All
precursors were obtained from Sigma-Aldrich or Fluka and were used without further
purification.
3.2.2. Catalyst characterization
X-ray diffraction patterns were collected on a Philips X’pert instrument using the Cu Kα-line.
A Ni-filter was installed to remove the Cu Kβ-line. XRD were measured between 2θ angles of
5 and 70 ° with a step size of 0.017 ° and a scan speed of 115 s per step. Phase formations
were determined due to measured 2θ angles reflexes and relative signals. The fraction of M1
phase was calculated by integration of the major M1 reflexes using the concentration of the
M1 phase in entry No. 4 of Table 1 as external standard (the composition in that sample has
been determined by Rietveld analysis).
The BET surface areas were determined by N2 adsorption - desorption at 77 K using a
Sorptomatic 1990 Series instrument after activation of the sample in vacuum at 523 K.
The chemical composition was measured by ICP-AES with a Spectroflame Instrument after
decomposition of the materials by heating with Soda – potash.
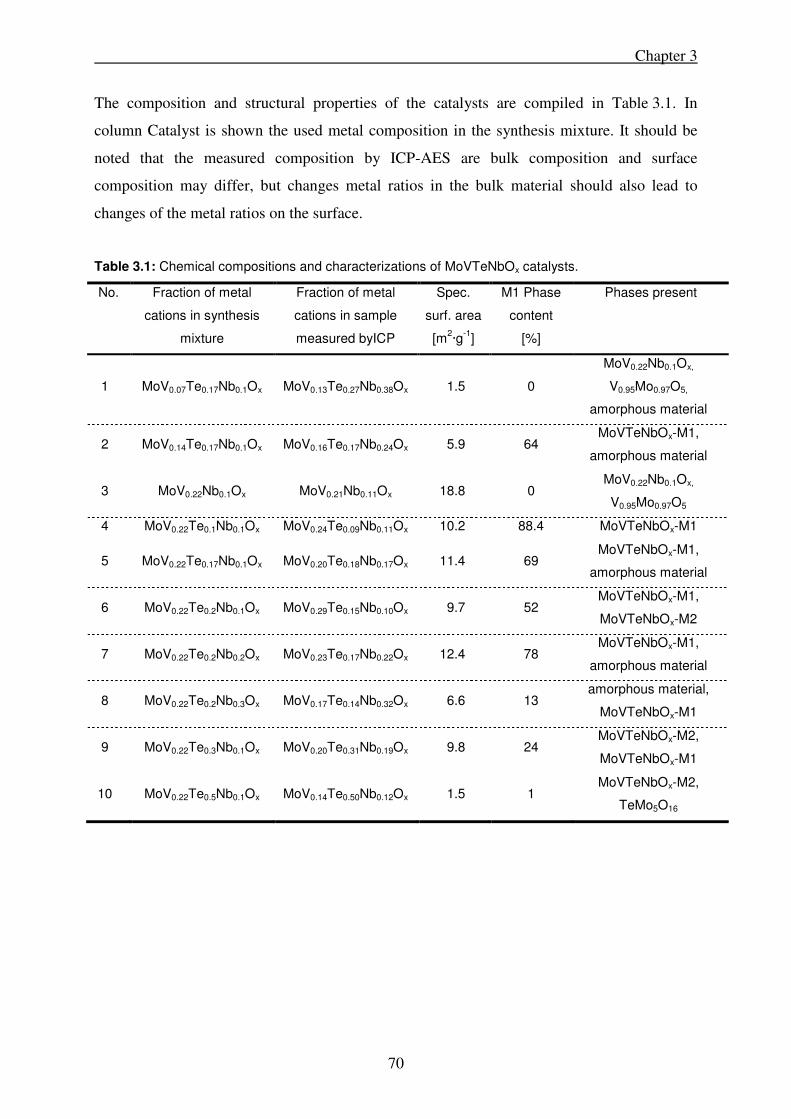
Chapter 3
70
The composition and structural properties of the catalysts are compiled in Table 3.1. In
column Catalyst is shown the used metal composition in the synthesis mixture. It should be
noted that the measured composition by ICP-AES are bulk composition and surface
composition may differ, but changes metal ratios in the bulk material should also lead to
changes of the metal ratios on the surface.
Table 3.1: Chemical compositions and characterizations of MoVTeNbOx catalysts.
No. Fraction of metal
cations in synthesis
mixture
Fraction of metal
cations in sample
measured byICP
Spec.
surf. area
[m2·g
-1]
M1 Phase
content
[%]
Phases present
1 MoV0.07Te0.17Nb0.1Ox MoV0.13Te0.27Nb0.38Ox 1.5 0
MoV0.22Nb0.1Ox,
V0.95Mo0.97O5,
amorphous material
2 MoV0.14Te0.17Nb0.1Ox MoV0.16Te0.17Nb0.24Ox 5.9 64 MoVTeNbOx-M1,
amorphous material
3 MoV0.22Nb0.1Ox MoV0.21Nb0.11Ox 18.8 0 MoV0.22Nb0.1Ox,
V0.95Mo0.97O5
4 MoV0.22Te0.1Nb0.1Ox MoV0.24Te0.09Nb0.11Ox 10.2 88.4 MoVTeNbOx-M1
5 MoV0.22Te0.17Nb0.1Ox MoV0.20Te0.18Nb0.17Ox 11.4 69 MoVTeNbOx-M1,
amorphous material
6 MoV0.22Te0.2Nb0.1Ox MoV0.29Te0.15Nb0.10Ox 9.7 52 MoVTeNbOx-M1,
MoVTeNbOx-M2
7 MoV0.22Te0.2Nb0.2Ox MoV0.23Te0.17Nb0.22Ox 12.4 78 MoVTeNbOx-M1,
amorphous material
8 MoV0.22Te0.2Nb0.3Ox MoV0.17Te0.14Nb0.32Ox 6.6 13 amorphous material,
MoVTeNbOx-M1
9 MoV0.22Te0.3Nb0.1Ox MoV0.20Te0.31Nb0.19Ox 9.8 24 MoVTeNbOx-M2,
MoVTeNbOx-M1
10 MoV0.22Te0.5Nb0.1Ox MoV0.14Te0.50Nb0.12Ox 1.5 1 MoVTeNbOx-M2,
TeMo5O16

Chapter 3
71
3.2.3. Catalytic activity
The catalytic activity was investigated in a six-fold parallel reactor using 100 mg of catalyst in
all experiments. Reaction temperature was 653 K with the feed flow varied between 3.75 and
17.24 ml·min-1 under standard temperature and pressure. Contact times were calculated by the
quotient of catalyst mass to volume flow at reaction conditions. The flow of the gaseous
components of the feed consisting of propane (5%), oxygen (10%) and nitrogen (65%) were
controlled by Bronkhorst mass flow controllers, the fraction of steam (20%) was controlled
with a Bronkhorst liquid water mass flow controller. A Wagner CEM system (controlled
evaporator mixer) was used for the evaporation of the water. The four components were
mixed and fed to the reactors using individual heated mass flow controllers for each reactor.
The reactors were 1/4“ stainless steel tubes. The products were analyzed using two gas
chromatographs (Shimadzu) equipped with TCD (columns: silica/molsieve) and FID
(column: FFAP) detectors. At the beginning of the analysis the silica and molsieve column
were used in consecutive mode for the analysis of oxygen, nitrogen and carbon monoxide. For
the analysis of carbon dioxide, propane and propene the molsieve column was bypassed and
the separation was done on the silica column only. The silica and the molsieve column were
protected from organic acids by a pre-column (HayeSep Q) using a back flush configuration.
Acetic acid and acrylic acid were separated on the FFAP column and analyzed by FID. The
average carbon balance was 99.9% with a deviation of 1% between single measurements.
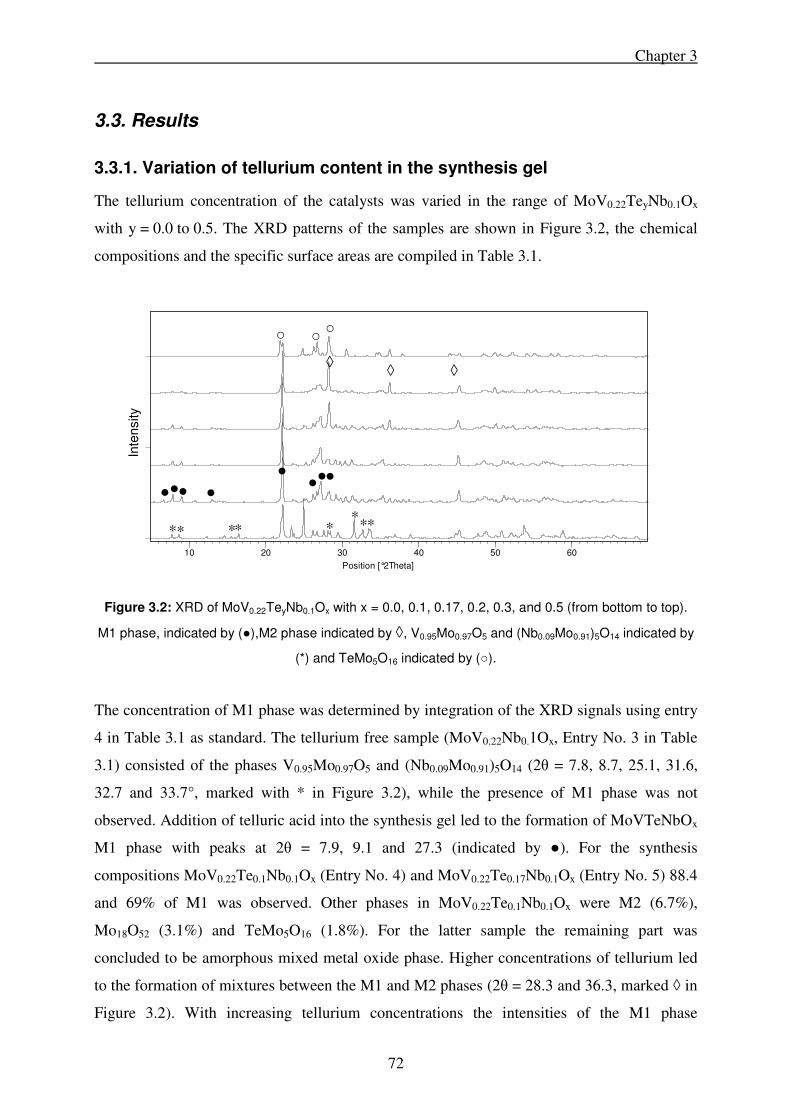
Chapter 3
72
3.3. Results
3.3.1. Variation of tellurium content in the synthesis gel
The tellurium concentration of the catalysts was varied in the range of MoV0.22TeyNb0.1Ox
with y = 0.0 to 0.5. The XRD patterns of the samples are shown in Figure 3.2, the chemical
compositions and the specific surface areas are compiled in Table 3.1.
Figure 3.2: XRD of MoV0.22TeyNb0.1Ox with x = 0.0, 0.1, 0.17, 0.2, 0.3, and 0.5 (from bottom to top).
M1 phase, indicated by (●),M2 phase indicated by ◊, V0.95Mo0.97O5 and (Nb0.09Mo0.91)5O14 indicated by
(*) and TeMo5O16 indicated by (○).
The concentration of M1 phase was determined by integration of the XRD signals using entry
4 in Table 3.1 as standard. The tellurium free sample (MoV0.22Nb0.1Ox, Entry No. 3 in Table
3.1) consisted of the phases V0.95Mo0.97O5 and (Nb0.09Mo0.91)5O14 (2θ = 7.8, 8.7, 25.1, 31.6,
32.7 and 33.7°, marked with * in Figure 3.2), while the presence of M1 phase was not
observed. Addition of telluric acid into the synthesis gel led to the formation of MoVTeNbOx
M1 phase with peaks at 2θ = 7.9, 9.1 and 27.3 (indicated by ●). For the synthesis
compositions MoV0.22Te0.1Nb0.1Ox (Entry No. 4) and MoV0.22Te0.17Nb0.1Ox (Entry No. 5) 88.4
and 69% of M1 was observed. Other phases in MoV0.22Te0.1Nb0.1Ox were M2 (6.7%),
Mo18O52 (3.1%) and TeMo5O16 (1.8%). For the latter sample the remaining part was
concluded to be amorphous mixed metal oxide phase. Higher concentrations of tellurium led
to the formation of mixtures between the M1 and M2 phases (2θ = 28.3 and 36.3, marked ◊ in
Figure 3.2). With increasing tellurium concentrations the intensities of the M1 phase
Position [°2Theta]
10 20 30 40 50 60
●
* *
○
●
◊ ◊
* * * *
○ ○
● ●
Inte
nsity
*
●
*
● ● ●
◊

Chapter 3
73
decreased, until a mixture of the M2 phase and TeMo5O16 (2θ = 22.0, 24.9, 26.4, 26.8,
indicated by ○ in Figure 3.2) was observed for the highest concentration of tellurium in the
synthesis gel (MoV0.22Te0.5Nb0.1Ox, Entry No. 10). The specific surface areas of these
materials were between 2 and 19 m2·g-1 and decreased with increasing tellurium content.
Conversion levels of up to 55% were
observed for the oxidation of propane. Due
to the decrease of the surface areas with
increasing tellurium concentration, the
initial rates were normalized to the surface
areas and plotted versus the tellurium
concentration (Figure 3.3). The presence of
Te leads to a sharp increase in the activity,
which is attributed to the formation of the
M1 phase. A further increase in the
tellurium content results in a decrease of the
activity due to the formation of the M2
phase and of TeMo5O16, which did not
show activity in propane activation.
Propene yields as a function of the propane conversion are shown in Figure 3.4 (black labels)
for MoV0.22TeyNb0.1Ox catalysts with y = 0.0 – 0.5. As expected propene is an intermediate
product, which reacts further in a reaction with a higher rate constant and the yields are
constant over a large range of conversion. At extremely short contact times (0.2% propane
conversion) propene selectivities up to 95% were observed proving that propene is the major
primary product of propane. Interestingly, the propene selectivities did not depend on the
catalyst composition even for the material MoV0.22Nb0.1Ox (Entry No. 3 in Table 3.1), which
does not contain the M1 phase, whereas the yields to acrylic acid show large differences
between the catalysts (Figure 3.4, grey labels). Acrylic acid yields of 15 - 30% were observed
for the catalysts containing M1 phase, whereas the other materials showed poor yields (< 5%).
The decrease of the yields to acrylic acid indicates that it is a secondary, but instable product
that can be further oxidized to COx. The yields of the main products (propene, acrylic acid
and COx) as function of the propane conversion for MoV0.22Te0.17Nb0.1Ox (Entry No. 5 in
Table 3.1) are shown in Figure 3.5.
0.00
0.02
0.04
0.06
0.08
0.10
0.12
0.0 0.1 0.2 0.3 0.4 0.5
Te content
Rate
[µ
mo
l•s
-1•m
-2]
MoV0.22TeyNb0.1Ox
Figure 3.3: Normalized rates of
propane conversion for
MoV0.22TeyNb0.1Ox, y = 0.0 - 0.5.

Chapter 3
74
Figure 3.4 (left): Yield to propene (black labels) and acrylic acid (gray labels) for MoV0.22TeyNb0.1Ox,
y = 0.0-0.5.
Figure 3.5 (right): Yield of propene, acrylic acid andCOx as function of conversion for
MoV0.22Te0.17Nb0.1Ox.
As carbon oxides are the final product of the reaction network (Scheme 3.1), their yield
increased with increasing conversion of propane. Selectivities to acetic acid were between 2 -
12% for the M1 phase containing catalysts and increased with conversion of propane, whereas
MoV0.22Nb0.1Ox (Entry No. 3) showed 18% acetic acid selectivity at low conversion, which
decreased with conversion (Figure sup 3.1f in the Supplementary Material).
3.3.2. Variation of the vanadium content in the synthesis gel
Catalysts of the formulations MoVyTe0.17Nb0.1Ox withy = 0.07, 0.14 and 0.22 were studied for
the effect of the vanadium concentration on the catalytic properties. The chemical
compositions and specific surface areas are compiled in Table 3.1.
For the catalyst with lowest vanadium content (MoV0.07Te0.17Nb0.1Ox, Entry No. 1 in Table
3.1) only weak peaks of (Nb0.09Mo0.91)5O16 (2θ = 7.9, 8.7, 25.1) were observed, while the
catalysts with higher concentration of vanadium (y= 0.14 and 0.22) consisted of M1 phase
(See Figure sup 3.2 in the Supplementary Material). The specific surface areas increased with
0
10
20
30
40
50
60
0 10 20 30 40 50 60
Conversion propane [%]
Yie
ld p
rop
en
e /
ac
ryli
c a
cid
[%
] 0.00
0.10
0.17
0.20
0.30
MoV0.22TeyNb0.1Ox
propene
acrylic acid
0
10
20
30
40
50
0 10 20 30 40 50
Conversion propane [%]Y
ield
pro
pen
e / a
cry
lic a
cid
/ C
OX [
%] MoV0.22Te0.17Nb0.1Ox
COx
acrylic acid
propene
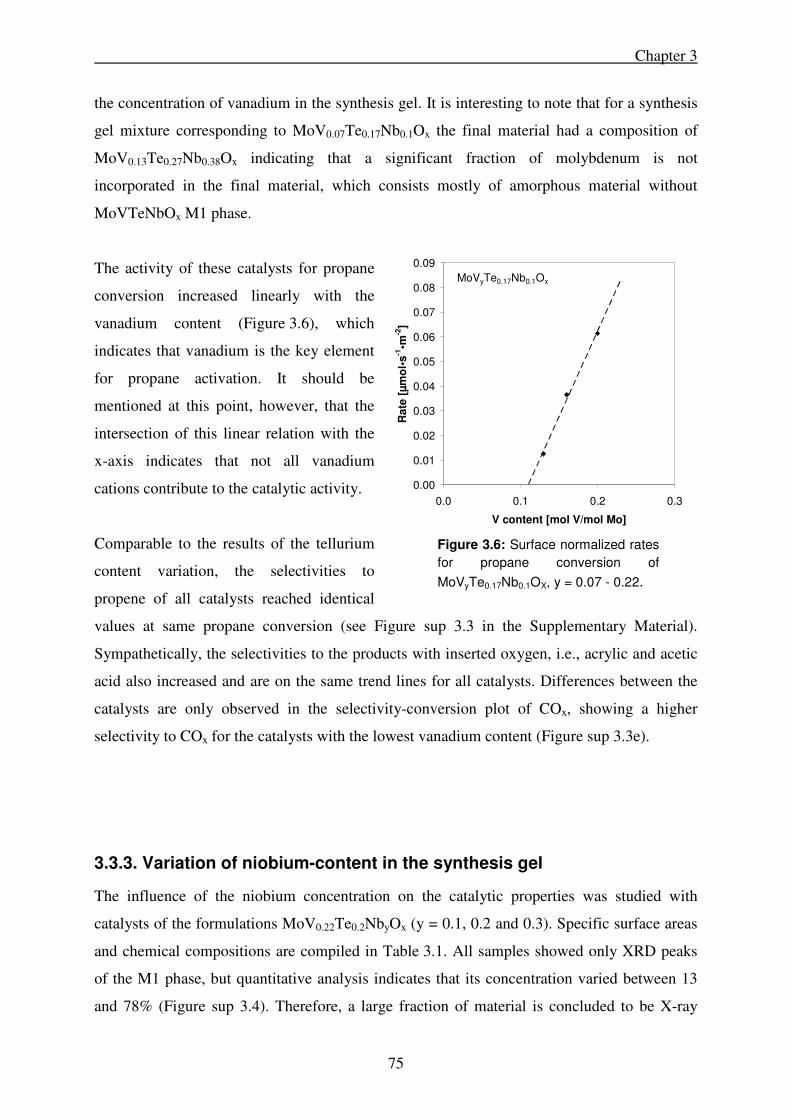
Chapter 3
75
the concentration of vanadium in the synthesis gel. It is interesting to note that for a synthesis
gel mixture corresponding to MoV0.07Te0.17Nb0.1Ox the final material had a composition of
MoV0.13Te0.27Nb0.38Ox indicating that a significant fraction of molybdenum is not
incorporated in the final material, which consists mostly of amorphous material without
MoVTeNbOx M1 phase.
The activity of these catalysts for propane
conversion increased linearly with the
vanadium content (Figure 3.6), which
indicates that vanadium is the key element
for propane activation. It should be
mentioned at this point, however, that the
intersection of this linear relation with the
x-axis indicates that not all vanadium
cations contribute to the catalytic activity.
Comparable to the results of the tellurium
content variation, the selectivities to
propene of all catalysts reached identical
values at same propane conversion (see Figure sup 3.3 in the Supplementary Material).
Sympathetically, the selectivities to the products with inserted oxygen, i.e., acrylic and acetic
acid also increased and are on the same trend lines for all catalysts. Differences between the
catalysts are only observed in the selectivity-conversion plot of COx, showing a higher
selectivity to COx for the catalysts with the lowest vanadium content (Figure sup 3.3e).
3.3.3. Variation of niobium-content in the synthesis gel
The influence of the niobium concentration on the catalytic properties was studied with
catalysts of the formulations MoV0.22Te0.2NbyOx (y = 0.1, 0.2 and 0.3). Specific surface areas
and chemical compositions are compiled in Table 3.1. All samples showed only XRD peaks
of the M1 phase, but quantitative analysis indicates that its concentration varied between 13
and 78% (Figure sup 3.4). Therefore, a large fraction of material is concluded to be X-ray
0.00
0.01
0.02
0.03
0.04
0.05
0.06
0.07
0.08
0.09
0.0 0.1 0.2 0.3
V content [mol V/mol Mo]
Rate
[µ
mo
l•s
-1•m
-2]
MoVyTe0.17Nb0.1Ox
Figure 3.6: Surface normalized rates
for propane conversion of
MoVyTe0.17Nb0.1OX, y = 0.07 - 0.22.

Chapter 3
76
amorphous. For MoV0.22Te0.2Nb0.3Ox (Entry No. 8 in Table 3.1) the concentration of M1
phase is the lowest, (see the weak signals and the peak broadening in the region from 22 -
30 °) indicating the presence of small crystalline domains of the M1 phase. Interestingly, the
specific surface areas were higher for the samples containing a higher fraction of M1 phase,
i.e., 9.7 and 12.4 m2·g-1 compared to the samples with a larger fraction of X-ray diffraction
amorphous material having only 6.6m2·g-1. The chemical compositions of the material with
the highest content of M1 phase agrees best with the composition of the synthesis mixture,
whereas the differences between the compositions of the synthesis mixture and the final
catalysts increased for the materials with lower content of M1 phase. Especially the
concentration of vanadium in the final materials decreased with higher niobium concentration
in the synthesis mixture.
All catalysts showed similar activities and selectivities to propene. The selectivities to acrylic
acid for MoV0.22Te0.2Nb0.1Ox (Entry No. 6) and MoV0.22Te0.2Nb0.2Ox (Entry No. 7) were both
in the range of 50 - 70%, whereas the selectivity to acrylic acid of MoV0.22Te0.2Nb0.3Ox (Entry
No. 8) was much lower (< 40%). In contrast, high selectivities to COx and acetic acid were
observed for the catalysts that showed lower selectivity to acrylic acid (Figure sup 3.5).
3.4. Discussion
3.4.1. Influence of chemical composition upon phase concentrations
The resulting phase composition depends on the concentration of tellurium in the synthesis
mixture. Mainly M1 phase is formed with low concentrations of tellurium, whereas high
concentrations lead to the formation of M2 phase in accordance with the literature.[21] Note
that this is also in line with the composition of the pure phases (M1: Te2OM20O56; M2:
TeM3O9) indicating that excess of tellurium cannot be accommodated in the M1 phase.
Theoretically the M1 phase can contain up to 27 at.% tellurium compared to molybdenum,
assuming that half of the tetrahedral sites (available for V or Mo) are occupied by Mo (see
also Figure 3.1). However M2 phase is formed in samples with a tellurium concentration
higher than 20 at.%, showing that M2 phase formation is initiated before the M1 phase is
saturated with tellurium. A minimum concentration of vanadium is, however, required for the
formation of the M1 phase. The M1 phase was formed with V : Mo ratios higher than 0.14,
while with lower concentrations of vanadium only led to (Nb0.09Mo0.91)5O16. For all niobium

Chapter 3
77
concentrations explored the M1 phase was formed. For the highest concentration of niobium
the concentration of M1 phase is lower, while the concentration of X-ray amorphous materials
higher than in the other materials of the series. Thus, the concentration of niobium in the
synthesis mixture is not relevant for the formation of the M1 phase, as long as a minimum of
niobium is contained in the synthesis mixture (Nb : Mo ratio ≥ 0.1). Synthesis without
niobium did not show M1 phase (results not included here). It is also interesting that too high
or too low concentrations of tellurium and vanadium led to the formation other phases than
M1, whereas in the case of niobium the M1 phase is partly substituted by amorphous material.
Differences in the chemical compositions of the synthesis mixtures and in the final materials
were observed for catalysts with lower content of M1 phase. Therefore, during M1 formation
all metals are incorporated into the solid phase according to their concentration in the
synthesis mixture over the compositional range of MoV0.14-0.22Te0.1-0.2Nb0.1-0.2Ox. For the
synthesis composition MoV0.07Te0.17Nb0.1Ox the final material showed the composition of
MoV0.13Te0.27Nb0.38Ox, with only weak signals of (Nb0.09Mo0.91)5O16 in the XRD indicating
that also a high amount of non-crystalline amorphous material is present with an enriched
concentration of vanadium, tellurium and especially niobium compared to the synthesis
mixture. Even for the synthesis composition MoV0.14Te0.17Nb0.1Ox showing 64% M1 phase
for the final material, the observed composition was MoV0.16Te0.17Nb0.24Ox. The deviation of
the final material from the synthesis composition is much lower, but still the niobium
concentration is higher in the final material. Thus, we conclude that niobium is preferential
incorporated into amorphous material. Also for the synthesis compositions
MoV0.22Te0.2Nb0.3Ox and MoV0.22Te0.3Nb0.1Ox higher concentrations of niobium are found in
the final material supporting the conclusions on preferred niobium incorporation.
The M1 phase is constructed from octahedra with molybdenum or vanadium surrounded by
oxygen. Niobium is located in channels constructed from five octahedra and is not in the
center of the octahedra. The amorphous material should, therefore, consist of octahedra
without sufficient long range order. More sites comparable to the small channels in the M1
phase will be present to host niobium and will lead to higher niobium concentration in the
material. This might also be the reason that high niobium concentrations cause the formation
of a higher fraction of amorphous material, but do not change the relative composition of the
other phases. The high concentrations of niobium favor the formation of such host ensembles
and disrupt formation of the M1 structure.

Chapter 3
78
3.4.2. Catalytic activity, phase composition and chemical composition
For materials containing M1 phase up to five times higher activities were observed than with
other materials. The initial addition of tellurium, for example, leads to the formation of M1
phase causing a strong increase in activity. Further increase of the tellurium concentration,
however, leads to the formation of the less active M2 phase and to TeMo5O16 inducing a
decrease in activity. Note in this context that the activity normalized to the surface area and
the fraction of M1 phase varies only slightly (shown in Figure 3.7), indicating that lower
activities are associated with the dilution of the M1 phase with less active. The rate of propane
conversion increases with increasing concentration of vanadium suggesting that vanadium is a
key element in the active sites of the M1 phase.[22] The reason why vanadium is so efficient in
this phase remains unclear.
Figure 3.7: Rates of propane activation of MoV0.22TeyNb0.1Ox containing mixtures
of M1 and M2 phase corrected to surface area and M1 phase content.
The content of niobium did not affect the catalyst activity (see also ref. [23]), which indicates
that niobium is not part of an active site, but a crucial concentration (MoVTeNbyOx; y ≥ 0.1)
is needed for formation and stabilization of the M1 phase. It has also been suggested that Nb
does not play a significant role in propane activation, but helps stabilizing the acrylic acid
formed on the catalyst surface and/or preventing further oxidation by weakening the
interaction between the oxide surface and the product and reactant molecules.[24]
0.00
0.05
0.10
0.15
0.20
0.25
0.30
0.0 0.1 0.2 0.3
Te content
Ra
te [
µm
ol•
s-1
•m-2
(M1
)]
MoV0.22TeyNb0.1Ox

Chapter 3
79
The yields to propene show a maximum for all catalysts and stay on a constant level at higher
conversions. This is typical for a primary product, which is rapidly converted in a subsequent
reaction. The activation of propane can be described by a first order reaction equation.[25] For
propene also a first order reaction (Equation 3.1) is used, which permits to estimate the
pseudo first order rate constants consisting of the product of the adsorption and the reaction
constant using the variation in the overall rate of formation of propene.
][][
][21 propenekpropanek
dt
propened⋅−⋅= (Equation 3.1)
Remarkably, the concentration of propene in the products varied in an identical way with the
conversion for all catalysts regardless of metal and phase composition (see Figure 3.8). This
agrees will the proposed reaction orders,
because the path in the yield-conversion
plot for a first order reaction only depends
on the ratio of k1 : k2. In the proposed
reaction network propene is formed by
oxidative dehydrogenation (ODH) of
propane, which is followed by oxidation of
the allyl-position to acrolein or by oxo-
insertion to acetone (Scheme 3.1). The
similar propene yields for all catalysts
indicates that the ratio of the kinetic
constant for the first C-H abstraction (k1, in
general assumed to be the rate determining
step of the ODH reaction) and the first
addition of oxygen into the propyl cation (k2, generally assumed to be the rate determining
step in the oxygen addition processes) is constant for all catalysts. The fact that k1 : k2 is
1 : 25 indicates that the oxygen addition to propene is a drastically more facile reaction than
the oxidative dehydrogenation. This is tentatively explained by the fact that the presence of a
double bond leads to weaker C-H bonds in propene than in propane.[26]
It is important to note that also MoV0.22Nb0.1Ox (Entry 3 in Table 3.1), which does not contain
the M1 phase obeys this correlation. Its rate of propane activation was very low, but the ratio
0
1
2
3
4
5
6
7
8
9
10
0 10 20 30 40 50 60
Conversion propane [%]
Yie
ld p
rop
en
e [
%]
No 1
No 2
No 3
No 4
No 5
No 6
No 7
No 8
No 9
No 10
MoVTeNbOx
Calculation 1.order reaction:
Kpropene consumption
Kpropene formation = 25
Figure 3.8: Observed propene yields as a
function of propane conversion on
MoVTeNbOx catalysts. The dashed line
indicates the results of the kinetic fit; all
points are experimental results.

Chapter 3
80
of propene formation and propene consumption was also 1 : 25. This indicates that the
relative concentration of active sites for the oxidative dehydrogenation of propane and
propene oxidation is constant for the catalysts, regardless the selectivity in propene oxidation.
In consequence, we conclude that the active sites for propane activation and oxo-
functionalization are structurally linked to the extent that the concentration of both sites varies
sympathetically. In turn the selectivity depends markedly on different properties of the
catalysts among which the weak interaction between the formed products and the catalyst
surface seems to be the most important one. Note that it also indicates that the sites for
propane activation are not exclusive to the M1 phase, but that the M1 phase has a particularly
high concentration of it.
Only for materials containing the M1 phase yields higher than 40% of acrylic acid were
observed. To understand this, let us discuss the possible reaction pathways after propene is
formed. Acrylic acid is formed from propene with acrolein as intermediate. However, propene
can also be oxidized to acetone, leading to acetic acid. Therefore, the obtained yield of acrylic
acid depends on the ratio of the reaction pathways A : B (Scheme 3.1). With k1 : k2 being
constant, k2 is higher for the M1 phase containing materials. Thus, the increase of the acrylic
acid yield is attributed to the fact that on the M1 phase the rate on pathway A is selectively
more increased than pathway B. It is speculated that it is associated with the lower
stabilization of a propyl carbenium ion on the M1 phase as well as with the enhancement of
the rate of α-H abstraction. The latter reaction step is to be promoted in the presence of
tellurium cations, as the Te4+-O site is suggested to be the active for the α-H abstraction and
acrolein/acrylic acid formation.[27]
The MoV0.22Te0.17Nb0.1Ox catalyst showed a higher yield to acrylic acid than the
MoV0.22Te0.1Nb0.1Ox catalyst although the phase purity is higher for the latter one. This is
attributed to the fact that a full saturation of the M1 phase with tellurium was not achieved for
Mo0.22Te0.1Nb0.1Ox reducing the rate of α-H abstraction and consequently the acrylic acid
formation.
The role of amorphous mixed oxide phases can best be illustrated through the materials with
varying niobium content. The variation of niobium showed the formation of M1 phase for all
catalysts, but also a fraction of material without long range order for the materials with the
highest concentration of niobium in the synthesis mixture (Entry 8, Table 3.1). The catalysts
Chapter 3
81
with higher concentration of M1 phase showed selectivities to acrylic acid between 50 and
60%, whereas the catalyst with the highest fraction of amorphous mixed oxides shows only
selectivity to acrylic acid of 30 to 40%. This indicates that the amorphous phase contains sites
that increase the oxidation of the acrylic acid. We speculate at present that these sites are
Lewis acid sites, which are able to strongly bind propene and the polar products and
intermediates resulting in a higher residence that leads to an unselective conversion of the
polar products.
3.5. Conclusions
The M1 phase possesses by far the most efficient catalytically active surface. Synthesis of
mainly M1 phase was possible in the range of
MoV0.14-0.22Te0.1-0.2Nb0.1-0.2Ox. Without vanadium, tellurium or niobium in the synthesis
mixture formation of M1 phase was not observed, while too high concentration of tellurium
led to the substitution of M1 by inactive M2 phase. High concentrations of niobium in
synthesis still lead to M1 phase, but with an increased amount of amorphous material, because
niobium changes the arrangement of the octahedra in the structure to increase the formation of
small channels for hosting niobium.
The catalytic activity was proportional to the concentration of vanadium incorporated in the
catalysts proving that vanadium is a key element in the activation of propane, but the results
also show that not all vanadium atoms are active in the M1 phase.
Analysis of the kinetic data shows that the cleavage of the first C-H bond is the rate
determining step, i.e., the reaction step has the slowest rate constant in the forward direction.
It should be noted again that we compare here only pseudo rate constants that contain a
contribution of the adsorption constants. A simple model of the reaction network shows that
the ratio between propene formation and the oxygen insertion is 1 : 25. It is important to note
that this ratio holds true for all tested catalysts, i.e., the reaction rate of the first oxygen
insertion was indifferent between selective and unselective catalysts despite the fact that very

Chapter 3
82
different rate determining steps could be involved. In the absence of a fortuitous
compensation, it shows that the ratio of the sites active for C-H cleavage and the oxygen
insertion is constant. We speculate at present that this is achieved as both functions are part of
the same site or the sites are structurally coupled.
In all cases in which a significant fraction of an X-ray amorphous phase is present, the
selectivities to acrylic acid was lower. The lower selectivity is attributed to the presence of
distorted octahedra and higher concentration of metals cations not surrounded by oxygen
(mainly niobium) leading to increased surface residence time with these materials caused by
the strong interactions with the reacting molecules.
3.6. Acknowledgements
The authors are grateful for the financial support from the European Union in the framework
of the Integrated Project TOPCOMBI (NMP2-CT-2005-515792-2) and from the Bayerisches
Staatsministerium für Wissenschaft, Forschung und Kunst within the NanoCat project.
Ch.P.K. is grateful to the Alexander von Humboldt Foundation for a postdoctoral research
fellowship. Discussions within the network of excellence IDECAT are also gratefully
acknowledged.

Chapter 3
83
3.7. References
[1] M. M. Bettahar, G. Costentin, L. Savary, J. C. Lavalley, Applied Catalysis A 1996, 145, 1.
[2] W. Nojiri, Y. Sakai, Y. Watanabe, Catalysis Reviews Science and Engineering 1995, 37, 145.
[3] D. Vitry, J. L. Dubois, W. Ueda, Journal of Molecular Catalysis A 2004, 220, 67. [4] A. Tenten, H. Hibst, F.-G. F.-G. Martin, L. L. Marosi, V. Kohl, DE Patent 4405514,
1994. [5] M. M. Lin, Applied Catalysis A 2001, 207, 1. [6] T. Ushikubo, H. Nakamura, Y. Koyasu, S. Wajiki, US Patent 5,380,933, 1995. [7] P. Botella, E. Garcia-Gonzalez, J. M. L. Nieto, J. M. Gonzalez-Calbet, Solid State
Sciences 2005, 7, 507. [8] P. Botella, J. M. L. Nieto, B. Solsona, Catalysis Letters 2002, 78, 383. [9] R. K. Grasselli, J. D. Burrington, D. J. Buttrey, P. DeSanto, C. G. Lugmair, A. F.
Volpe, T. Weingand, Topics in Catalysis 2003, 23, 5. [10] P. DeSanto, D. J. Buttrey, R. K. Grasselli, C. G. Lugmair, A. F. Volpe, B. H. Toby, T.
Vogt, Zeitschrift Für Kristallographie 2004, 219, 152. [11] P. DeSanto, D. J. Buttrey, R. K. Grasselli, C. G. Lugmair, A. F. Volpe, B. H. Toby, T.
Vogt, Topics in Catalysis 2003, 23, 23. [12] E. M. Thorsteinson, T. P. Wilson, F. G. Young, J. Kasai, Journal of Catalysis 1978,
52, 116. [13] P. Botella, B. Solsona, A. Martinez-Arias, J. M. L. Nieto, Catalysis Letters 2001, 74,
149. [14] M. M. Lin, Applied Catalysis A 2003, 250, 287. [15] J. M. L. Nieto, P. Botella, B. Solsona, J. M. Oliver, Catalysis Today 2003, 81, 87. [16] X. L. Tu, N. Furuta, Y. Sumida, M. Takahashi, H. Niiduma, Catalysis Today 2006,
117, 259. [17] H. Watanabe, Y. Koyasu, Applied Catalysis A 2000, 194, 479. [18] M. Baca, M. Aouine, J. L. Dubois, J. M. M. Millet, Journal of Catalysis 2005, 233,
234. [19] E. Balcells, F. Borgmeier, I. Grisstede, H. G. Lintz, F. Rosowski, Applied Catalysis A
2004, 266, 211. [20] M. H. Lin, T. B. Desai, F. W. Kaiser, P. D. Klugherz, Catalysis Today 2000, 61, 223. [21] M. Baca, A. Pigamo, J. L. Dubois, J. M. M. Millet, Topics in Catalysis 2003, 23, 39. [22] Z. Zhao, X. T. Gao, I. E. Wachs, Journal of Physical Chemistry B 2003, 107, 6333. [23] D. Vitry, Y. Morikawa, J. L. Dubois, W. Ueda, Applied Catalysis A 2003, 251, 411. [24] W. Ueda, D. Vitry, T. Katou, Catalysis Today 2005, 99, 43. [25] D. Vitry, Y. Morikawa, J. L. Dubois, W. Ueda, Topics in Catalysis 2003, 23, 47. [26] A. Costine, B. K. Hodnett, Applied Catalysis A 2005, 290, 9. [27] R. K. Grasselli, Catalysis Today 2005, 99, 23.

Chapter 3
84
3.8. Supplementary material
Figure sup 3.1 a-f: Conversion of propane and product selectivities over MoV0.22TeyNb0.1Ox, y = 0.0 - 0.5.
0
10
20
30
40
50
60
0.0 0.1 0.2 0.3 0.4 0.5 0.6 0.7
Contact time [g•s•ml-1
]
Co
nvers
ion
pro
pa
ne [
%]
0.00
0.10
0.17
0.20
0.30
0.50
MoV0.22TeyNb0.1Ox
0.00
0.02
0.04
0.06
0.08
0.10
0.12
0.0 0.1 0.2 0.3 0.4 0.5
Te content
Rate
[µ
mo
l•s
-1•m
-2]
MoV0.22TeyNb0.1Ox
0
10
20
30
40
50
0 10 20 30 40 50
Conversion propane [%]
Se
lecti
vit
y p
rop
en
e [
%]
0.00
0.10
0.17
0.20
0.30
MoV0.22TeyNb0.1Ox
0
10
20
30
40
50
60
70
80
0 10 20 30 40 50
Conversion propane [%]
Se
lecti
vit
y a
cry
lic a
cid
[%
]
0.000.100.170.200.300.50
MoV0.22TeyNb0.1Ox
0
10
20
30
40
50
60
70
80
90
0 10 20 30 40 50
Conversion propane [%]
Sele
cti
vit
y C
OX
[%
]
0.00
0.10
0.17
0.20
0.30
0.50
MoV0.22TeyNb0.1Ox
0
2
4
6
8
10
12
14
16
18
20
0 10 20 30 40 50
Conversion propane [%]
Sele
cti
vit
y a
ceti
c a
cid
[%
]
0.000.100.170.200.300.50
MoV0.22TeyNb0.1Ox
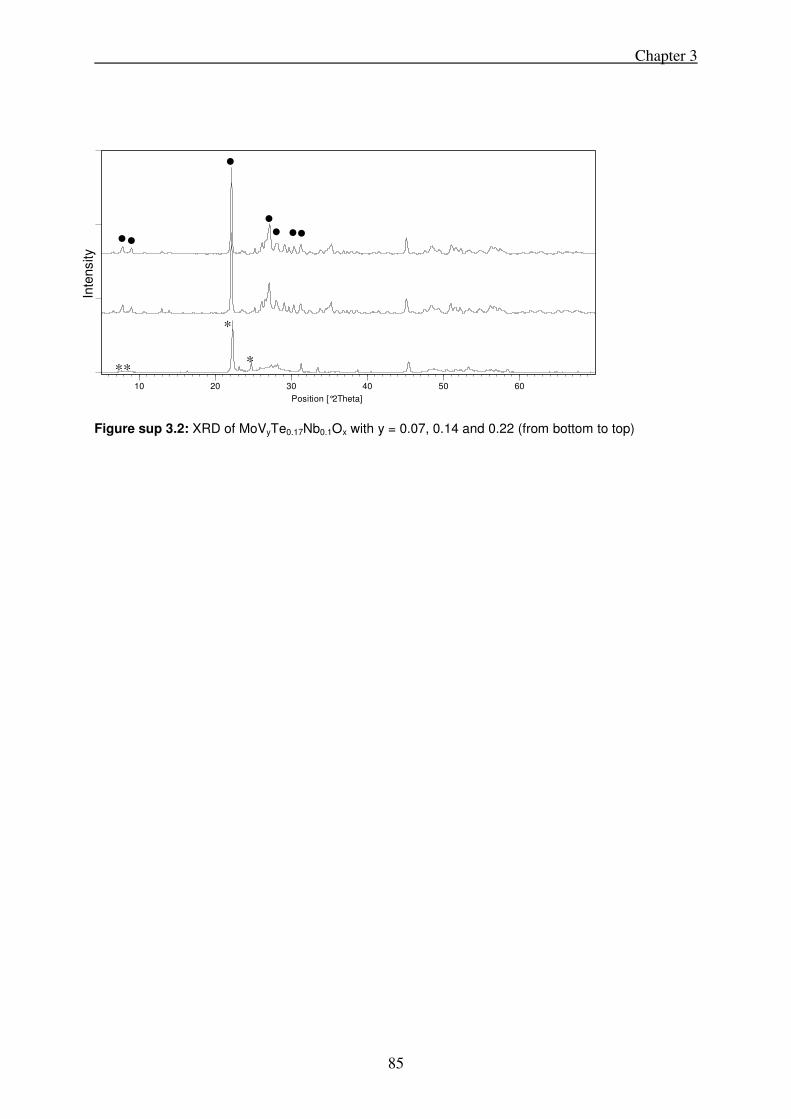
Chapter 3
85
Figure sup 3.2: XRD of MoVyTe0.17Nb0.1Ox with y = 0.07, 0.14 and 0.22 (from bottom to top)
Position [°2Theta]
10 20 30 40 50 60
Inte
nsity
● ●
* * *
● ● ● ●
●
*

Chapter 3
86
Figure sup3.3 a-f: Conversion of propane and product selectivities over MoVyTe0.17Nb0.1Ox, y = 0.07 - 0.22.
0
5
10
15
20
25
30
35
40
0.0 0.1 0.2 0.3 0.4 0.5 0.6 0.7
Contact time [g•s•ml-1
]
Co
nvers
ion
pro
pa
ne [
%]
0.07
0.14
0.22
MoVyTe0.17Nb0.1Ox
0
10
20
30
40
50
60
70
80
0 10 20 30 40 50
Conversion propane [%]
Se
lecti
vit
y p
rop
en
e [
%]
0.07
0.14
0.22
MoVyTe0.17Nb0.1Ox
0
10
20
30
40
50
60
70
80
0 10 20 30 40 50
Conversion propane [%]
Se
lec
tiv
ity
ac
ryli
c a
cid
[%
]
0.07
0.14
0.22
MoVyTe0.17Nb0.1Ox
0
2
4
6
8
10
12
14
16
18
20
0 10 20 30 40 50
Conversion propane [%]
Sele
cti
vit
y C
OX
[%
]
0.07
0.14
0.22MoVyTe0.17Nb0.1Ox
0.0
0.5
1.0
1.5
2.0
2.5
3.0
3.5
4.0
4.5
0 10 20 30 40 50
Conversion propane [%]
Sele
cti
vit
y a
ceti
c a
cid
[%
]
0.07
0.14
0.22MoVyTe0.17Nb0.1Ox
0.00
0.01
0.02
0.03
0.04
0.05
0.06
0.07
0.08
0.09
0.0 0.1 0.2 0.3
V content [mol V/mol Mo]
Rate
[µ
mo
l•s
-1•m
-2]
MoVyTe0.17Nb0.1Ox

Chapter 3
87
Position [°2Theta]
10 20 30 40 50 60
Figure sup 3.4: XRD of MoV0.22Te0.2NbyOx with y = 0.1, 0.2 and 0.3 (from bottom to top).
● ●
● ● ● ●
Inte
nsity
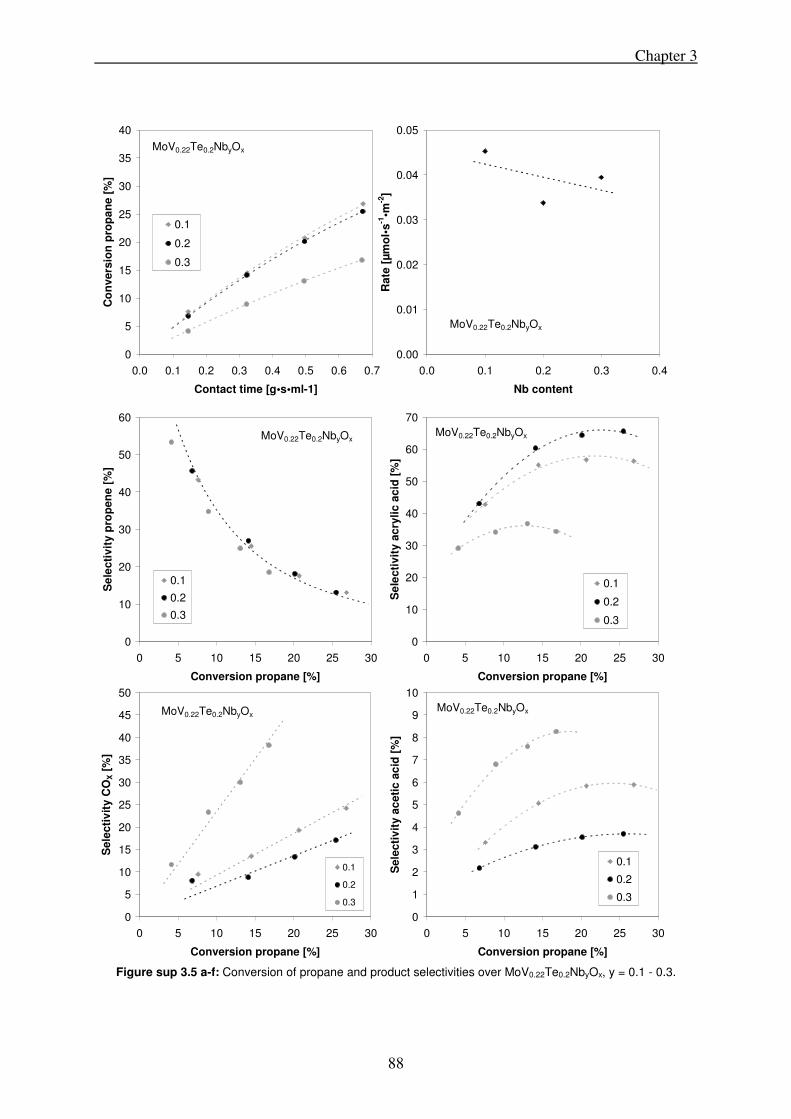
Chapter 3
88
Figure sup 3.5 a-f: Conversion of propane and product selectivities over MoV0.22Te0.2NbyOx, y = 0.1 - 0.3.
0
5
10
15
20
25
30
35
40
0.0 0.1 0.2 0.3 0.4 0.5 0.6 0.7
Contact time [g•s•ml-1]
Co
nvers
ion
pro
pa
ne [
%]
0.1
0.2
0.3
MoV0.22Te0.2NbyOx
0
10
20
30
40
50
60
0 5 10 15 20 25 30
Conversion propane [%]
Se
lecti
vit
y p
rop
en
e [
%]
0.1
0.2
0.3
MoV0.22Te0.2NbyOx
0
10
20
30
40
50
60
70
0 5 10 15 20 25 30
Conversion propane [%]
Se
lecti
vit
y a
cry
lic a
cid
[%
]
0.1
0.2
0.3
MoV0.22Te0.2NbyOx
0
5
10
15
20
25
30
35
40
45
50
0 5 10 15 20 25 30
Conversion propane [%]
Sele
cti
vit
y C
OX [
%]
0.1
0.2
0.3
MoV0.22Te0.2NbyOx
0
1
2
3
4
5
6
7
8
9
10
0 5 10 15 20 25 30
Conversion propane [%]
Sele
cti
vit
y a
ceti
c a
cid
[%
]
0.1
0.2
0.3
MoV0.22Te0.2NbyOx
0.00
0.01
0.02
0.03
0.04
0.05
0.0 0.1 0.2 0.3 0.4
Nb contentR
ate
[µ
mo
l•s
-1•m
-2]
MoV0.22Te0.2NbyOx
Chapter 4
89
Chapter 4
On the Role of the Vanadium Distribution in
MoVTeNbOx mixed Oxides for the selective
catalytic Oxidation of Propane
Abstract
The selective oxidation of propane to acrylic acid is studied over a series of nearly pure M1-
phase MoVTeNbOx catalysts. Quantitative analysis of the reaction network shows that the
ratio of the rate constants for propane oxidative dehydrogenation to propene and for the
further oxidation of propene is constant. The rates towards acrylic acid and acetone, however,
vary subtly with the concentration of vanadium and the location of its substitution. The
reaction of acrylic acid to acetic acid and carbon oxides, associated with accessible metal
cations, contributes two thirds towards the non-selective pathway. The other third is
associated with acetone formation. Vanadium is first substituted selectively at sites that are
inactive for propane activation. Depending on the selectivity of this substitution two groups of
materials have been identified, which show a distinctly different dependence on the
concentration of vanadium. Statistic distribution of vanadium in the M1 phase appears to be
the most promising strategy to improve the performance of MoVTeNbOx catalysts for a given
vanadium concentration.

Chapter 4
90
4.1. Introduction
The selective oxidation of alkanes such as ethane and propane to alkenes or acrylic
components as well as the oxidation of n-butane to maleic anhydride are conceptually
economically favorable routes to oxygenates. Among these reactions only the oxidation of n-
butane is used on an industrial scale, whereas all other processes are still not competitive to
conventional processes, such as the two step oxidation of propene to acrylic acid.[1-4] The two
major challenges are related to the fact that the alkanes are species difficult to activate and
that the target molecules are thermodynamically metastable, while the most stable product is
carbon dioxide.
For the oxidation of propane to acrylic acid multicomponent molybdates of the compositional
type MoVTeNbOx have been introduced by Mitsubishi in the early 90s allowing up to 48%
yield of acrylic acid. Also the ammoxidation is catalyzed by these mixed oxides with yields of
58%.[5, 6] Such materials have the potential to replace the currently used two step oxidation
process using propene as feed material.[7-14] Two crystallographic phases containing all four
metals, named M1 and M2 phase, were reported for these oxides [15, 16] and it is generally
accepted that only the M1 phase is active for the C-H activation of propane.[17, 18] The
stoichiometric composition of the M1 phase is (Te2O)2M20O56 with M = Mo, V, Nb. It
consists of molybdenum and vanadium octahedra with corner sharing oxygen atoms
containing channels of five, six and seven octahedra perpendicular to the ab plane. The
structure is periodically repeated along the c axis. Niobium is located in the pentagonal
channels, whereas tellurium occupies the hexagonal and heptagonal channels. The M2 phase
((TeO)2M6O18) contains only hexagonal channels, formed from octahedra with molybdenum,
vanadium and niobium centers. Tellurium is occupying position in the hexagonal channels.[19-
21]
While the presence of the M1 phase appears to be essential for alkane activation, the effect of
mixtures between the M1 and M2 phase on the catalytic activity is still under discussion. It
was reported that the M2 phase enhances the selectivity to oxygenates, while it is not able to
catalyze the oxidation of propane to propene. The M2 phase was also reported to serve as a
tellurium reservoir for the M1 phase.[22, 23] The effects of different preparation methods,[12-14]
synthesis conditions [24-26] and precursors used [27-29] are also only fragmentary known. Well-
defined synthesis procedures allow the synthesis of materials with reproducible catalytic
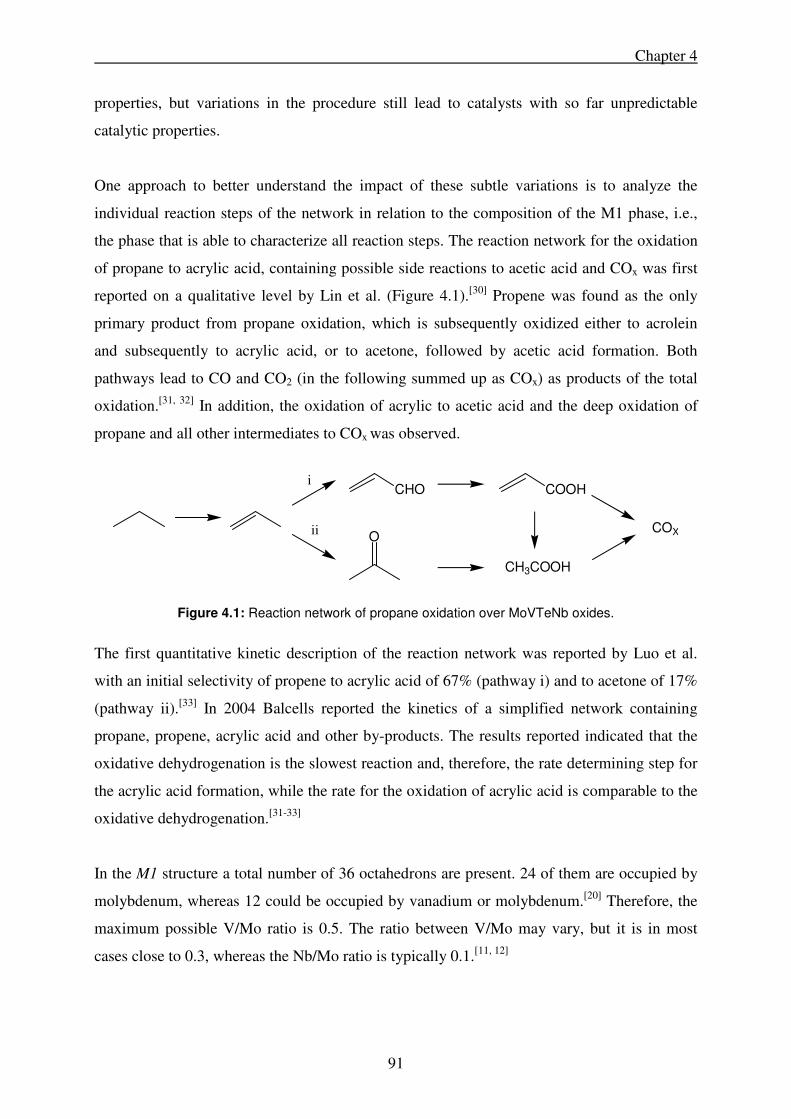
Chapter 4
91
properties, but variations in the procedure still lead to catalysts with so far unpredictable
catalytic properties.
One approach to better understand the impact of these subtle variations is to analyze the
individual reaction steps of the network in relation to the composition of the M1 phase, i.e.,
the phase that is able to characterize all reaction steps. The reaction network for the oxidation
of propane to acrylic acid, containing possible side reactions to acetic acid and COx was first
reported on a qualitative level by Lin et al. (Figure 4.1).[30] Propene was found as the only
primary product from propane oxidation, which is subsequently oxidized either to acrolein
and subsequently to acrylic acid, or to acetone, followed by acetic acid formation. Both
pathways lead to CO and CO2 (in the following summed up as COx) as products of the total
oxidation.[31, 32] In addition, the oxidation of acrylic to acetic acid and the deep oxidation of
propane and all other intermediates to COx was observed.
Figure 4.1: Reaction network of propane oxidation over MoVTeNb oxides.
The first quantitative kinetic description of the reaction network was reported by Luo et al.
with an initial selectivity of propene to acrylic acid of 67% (pathway i) and to acetone of 17%
(pathway ii).[33] In 2004 Balcells reported the kinetics of a simplified network containing
propane, propene, acrylic acid and other by-products. The results reported indicated that the
oxidative dehydrogenation is the slowest reaction and, therefore, the rate determining step for
the acrylic acid formation, while the rate for the oxidation of acrylic acid is comparable to the
oxidative dehydrogenation.[31-33]
In the M1 structure a total number of 36 octahedrons are present. 24 of them are occupied by
molybdenum, whereas 12 could be occupied by vanadium or molybdenum.[20] Therefore, the
maximum possible V/Mo ratio is 0.5. The ratio between V/Mo may vary, but it is in most
cases close to 0.3, whereas the Nb/Mo ratio is typically 0.1.[11, 12]
CHO
O
COOH
CH3COOH
COX
i
ii

Chapter 4
92
Vanadium sites adjacent to heptagonal channels are proposed to be the active sites for the
oxidative dehydrogenation of propane.[34, 35] This is in agreement with the activity of an M1
phase consisting only of MoVOx, which is active for propane conversion. However, it should
also be noted that only the M1 phase contains adjacent vanadium octahedra, which have been
shown to be the site of alkane activation in supported vanadium oxides.[36] DFT calculations
suggest that the activation of propane occurs on vanadyl centers via a radical mechanism.[35,
37] Sequential steps such as the oxo-insertion of propene to acetone, in turn, is proposed to be
catalyzed by Brønsted acid sites, which was confirmed by temperature programmed
desorption of ammonia and sorption of pyridine on MoVTeNbOx and MoVSbNbOx
catalysts.[38]
As described before vanadium is the key element for propane activation,[39] while the effect of
tellurium and niobium is still under discussion.[40-42] It appears that tellurium plays an
important role in the oxidation of propene to acrylic acid and in the stabilization of acrylic
acid against further oxidation, as only for tellurium containing catalysts high selectivities to
acrylic acid were observed, whereas tellurium-free catalysts with M1-phase showed mainly
COx as product. Niobium, on the other hand, stabilizes the formation of the M1-phase,[39] and
in addition, it enhances selectivity to acrylic acid, but the effect is not so strong as for
tellurium.
In this work, we address, therefore, the synthesis of MoVTeNbOx catalysts consisting mainly
of M1 phase with variations of the vanadium to molybdenum ratio and the catalytic properties
of these materials for the oxidation of propane to acrylic acid. We use a detailed kinetic
analysis of the reaction network to identify the reaction pathways and relate them to two
apparent modes of vanadium substitution in the M1 phase.

Chapter 4
93
4.2. Experimental
4.2.1. Catalyst preparation
The catalysts were prepared by hydrothermal synthesis, the composition of the precursor
mixtures and the conditions of the hydrothermal treatment are shown in Table 4.1.
Ammonium para molybdate (NH4)6Mo7O24 · 4 H2O was dissolved in 50 ml bidistilled water
at 353 K in a Teflon tube followed by the addition of telluric acid dissolved in water.
Vanadyl sulfate VOSO4 · x H2O was added as aqueous solution drop wise within 30 min,
resulting in a black solution. Ammonium niobate oxalate (NH4)NbO(C2O4)2 · x H2O was
added as solution and after 10 min further stirring the mixture turned olive green. All
precursors were purchased from Sigma-Aldrich or Fluka and were used without further
purification. Oxygen dissolved in the mixture was removed by bubbling nitrogen through the
liquid for 5 min. The tube was closed with a Teflon cap and mounted into a steel autoclave.
Hydrothermal synthesis was carried out at 448 K under autogenous pressure for the duration
given in Table 4.1. The autoclave was cooled with water to room temperature. The residue
was filtered, washed five times with bidistilled water and dried 16 h at 353 K. The material
was calcined for 2 h at 523 K in static air and then for 2 h at temperatures up to 873 K in
nitrogen (heating rate 10 K/min). Before reaction, the sample was ground and pressed to a
particle size 150 – 212 µm.
Table 4.1: Composition and synthesis time for MoVTeNbOx catalysts.
No. Synthesis
Composition
AHM
[g]
Te(OH)6
[g]
VOSO4
[g]
ANO
[g]
Hydrothermal
time [h]
1 MoV0,14Te0,17Nb0,1Ox 8.63 1.86 1.59 2.24 72
2 MoV0,22Te0,17Nb0,1Ox 8.26 1.78 2.29 2.14 72
3 MoV0,22Te0,2Nb0,2Ox 7.58 1.97 2.10 3.93 72
4 MoV0,3Te0,1Nb0,1Ox 8.74 1.14 3.58 2.27 24
5 MoV0,3Te0,1Nb0,1Ox 8.74 1.14 3.58 2.27 48
6 MoV0,3Te0,1Nb0,1Ox 8.74 1.14 3.58 2.27 120
7 MoV0,3Te0,17Nb0,1Ox 8.26 1.78 3.58 2.14 72
AHM: Ammonium para molybdate (NH4)6Mo7O24 · 4 H2O
ANO: Ammonium niobat oxalat (NH4)NbO(C2O4)2 · x H2O

Chapter 4
94
Table 4.2: Characterization and catalytic activity for the MoVTeNbOx catalysts.
No. Composition BET surface
area
[m2·g
-1]
Phase
composition
(XRD)
Rate
constant
propane
activation
[ml·g-1
·s-1
]
Initial rate of
propane
activation
[µmol·m-2
·s-1
(M1)]
1 MoV0,16Te0,17Nb0,24Ox 5.9 M1 (97.8%)
M2 ( 2.2%)
0.24 0.037
2 MoV0,20Te0,18Nb0,17Ox 11.4 M1 (97.7%)
M2 ( 2.3%)
0.75 0.063
3 MoV0,23Te0,17Nb0,22Ox 12.4 M1 (94.1%)
M2 ( 5.9%)
0.45 0.034
4 MoV0,23Te0,10Nb0,11Ox 16.0 M1 (98.0%)
M2 ( 2.0%)
1.36 0.081
5 MoV0,26Te0,11Nb0,10Ox 18.1 M1 (97.2%)
M2 ( 2.8%)
1.31 0.070
6 MoV0,28Te0,10Nb0,10Ox 17.0 M1 (96.5%)
M2 ( 3.5%)
1.45 0.082
7 MoV0,27Te0,17Nb0,12Ox 11.4 M1 (90%)
M2 (10%)
0.55 0.050
4.2.2. Catalyst characterization
X-ray diffraction patterns were collected on a Philips X’pert instrument using the Cu Kα-line.
(A Ni-filter was installed to remove the Cu Kβ-line). XRD were measured between 2θ angles
of 5 and 70 ° with a step size of 0.017 ° and a scan speed of 115 s per step. The phase
composition was determined by Rietveld analysis using Bruker TOPAS 3.0 software.
The BET surface areas were determined by N2 sorption at 77 K using a Sorptomatic 1990
Series instrument after activation of the sample in vacuum at 523 K. The chemical
composition was measured by ICP-AES with a Spectroflame Instrument after decomposition
of the materials by heating with soda – potash. The composition and structural properties of
the catalysts are compiled in Table 4.2.
Chapter 4
95
4.2.3. Catalytic activity
The catalytic activity was investigated in a six-fold parallel reactor using 100 mg of catalyst
diluted with silicon carbide. The reaction temperature was 653 K at atmospheric pressure. The
total feed flow was varied between 3.75 and 17.24 ml·min-1. The composition of the feed was
5% propane or propene, 10% oxygen and 65% nitrogen (controlled with Bronkhorst mass
flow controller) and of 20% steam (controlled with a Bronkhorst liquid mass flow controller).
A Wagner CEM system (controlled evaporator mixer) was used for evaporating and adding
water. The four components were mixed and fed to the 1/4“ stainless steel tube reactors using
individually heated mass flow controllers for each reactor. The products were analyzed using
two gas chromatographs (Shimadzu) equipped with TCD (columns: silica/molsieve) and FID
(column: FFAP) detectors. At the beginning of the analysis, the silica and molsieve column
were used in consecutive mode for the analysis of oxygen, nitrogen and carbon monoxide. For
the analysis of carbon dioxide, propane, and propene, the molsieve column was bypassed and
the separation was done on the silica column only. The silica and the molsieve columns were
protected from organic acids by a pre-column (HayeSep Q) using a back flush configuration.
Acetic acid and acrylic acid were separated on the FFAP column and analyzed by FID. The
average carbon balance was 99.9% with a deviation of 1% between single measurements.
Reactions with intermediates including acetone, acetic acid, and acrylic acid were carried out
on a single reactor. The organic component was mixed with water and evaporated. The feed
compositions were: acetone (4%); acetic acid (4%) or acrylic acid (0.5%), oxygen (10%),
steam (20%) and nitrogen as balance. The average carbon balance for acetone and acetic acid
were 99% and for acrylic acid 90% with a deviation of 2% for a single measurement.
The rate of propane activation was described by a first order reaction with respect to the
propane concentration cpropane [43] (Equation 4.1) with t being the contact time of the reactant
over the catalyst.
dcpropane = - k1 · cpropane · dt (Equation 4.1)
The contact time was calculated by the quotient of the catalyst weight [in g] and the feed flow
[in ml/s] resulting in a unit for k of ml·g-1
·s-1
. Rate constants for reactions with acetone, acetic
acid and acrylic acid were calculated analogously. For comparison between different

Chapter 4
96
catalysts, the calculated rate constant k was normalized to the surface area and to the fraction
of M1 phase present in the catalysts.
For propene, acrylic acid, acetone, acetic acid and carbon oxides analogous kinetic equations
were used (Equation 4.2 – 4.6):
dcpropene = k1 · cpropane · dt - (k2 + k3) · cpropene · dt (Equation 4.2)
dcacrylic acid = k2 · cpropene · dt - (k4 + k5) · cacrylic acid · dt (Equation 4.3)
dcacetone = k3 · cpropene · dt - (k6 + k7) · cacetone · dt (Equation 4.4)
dcacetic acid = k4 · cacrylic acid · dt + k6 · cacetone · dt - k8 · cacetic acid · dt (Equation 4.5)
dcCOx = (k4 + 3 · k5)· cacrylic acid · dt + (k6 + 3 · k7) · cacetone · dt + 2 · k8 · cacetic acid · dt
(Equation 4.6)
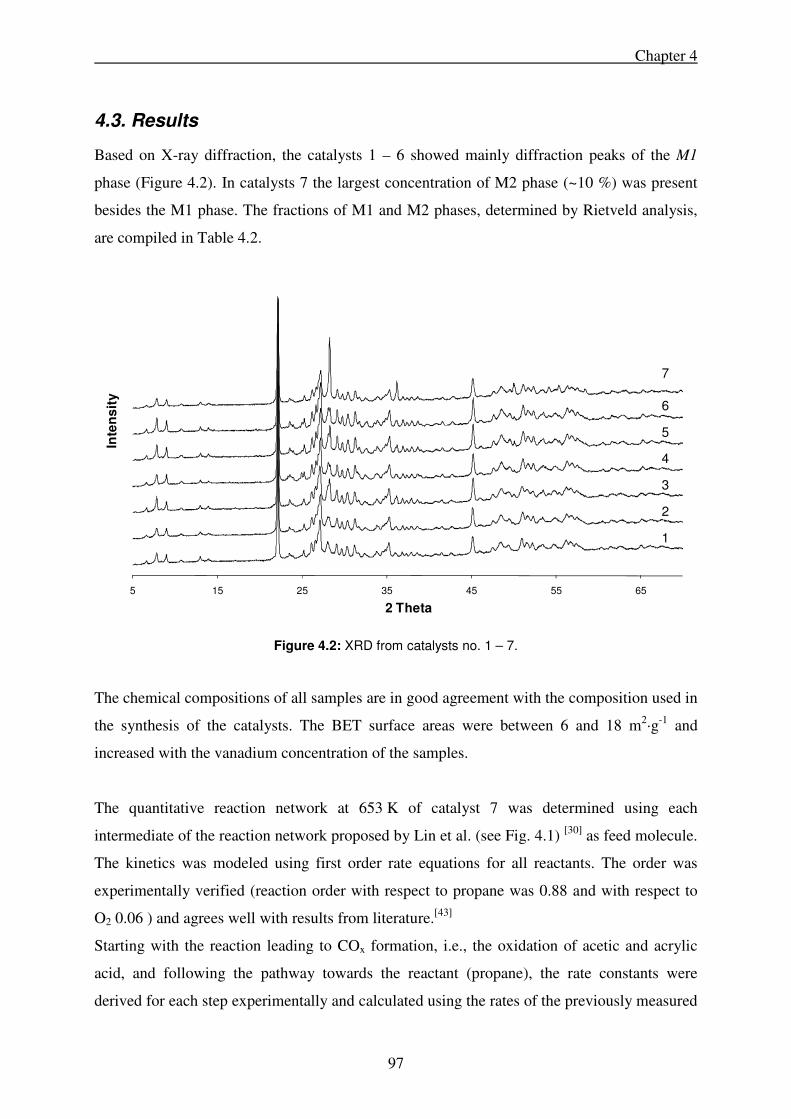
Chapter 4
97
4.3. Results
Based on X-ray diffraction, the catalysts 1 – 6 showed mainly diffraction peaks of the M1
phase (Figure 4.2). In catalysts 7 the largest concentration of M2 phase (~10 %) was present
besides the M1 phase. The fractions of M1 and M2 phases, determined by Rietveld analysis,
are compiled in Table 4.2.
Figure 4.2: XRD from catalysts no. 1 – 7.
The chemical compositions of all samples are in good agreement with the composition used in
the synthesis of the catalysts. The BET surface areas were between 6 and 18 m2·g-1 and
increased with the vanadium concentration of the samples.
The quantitative reaction network at 653 K of catalyst 7 was determined using each
intermediate of the reaction network proposed by Lin et al. (see Fig. 4.1) [30] as feed molecule.
The kinetics was modeled using first order rate equations for all reactants. The order was
experimentally verified (reaction order with respect to propane was 0.88 and with respect to
O2 0.06 ) and agrees well with results from literature.[43]
Starting with the reaction leading to COx formation, i.e., the oxidation of acetic and acrylic
acid, and following the pathway towards the reactant (propane), the rate constants were
derived for each step experimentally and calculated using the rates of the previously measured
5 15 25 35 45 55 65
Inte
ns
ity
2 Theta
1
2
3
4
5
6
7

Chapter 4
98
reaction step for the further reactions of the intermediates formed. The rate constant for the
conversion of acetic acid to COx was determined to be k8 = 3.2 ml·g-1·s-1.
Figure 4.3: Concentration as function of contact time (left) and yield as function of conversion (right) of
the acetone oxidation over MoV0.27Te0.17Nb0.12Ox.
Following the same procedure the rate constants for the oxidation of acetone (Figure 4.3) to
acetic acid (k6 = 19.2 ml·g-1·s-1) and carbon oxides (k8 = 3.6 ml·g-1·s-1) as well as for the
oxidation of propene to acrylic acid (k2= 8.9 ml·g-1·s-1) and to acetone (k3=2.2 ml·g-1·s-1) were
derived. For the initial step, the oxidative dehydrogenation of propane to propene, a rate
constant of k1= 0.57 ml·g-1·s-1 was obtained.
CHO COOH
O
CH3COOH + COX3 COX
Figure 4.4: Reaction network and rate constants for MoV0.27Te0.17Nb0.12Ox at 653 K
derived from experiments with single reactants. (rate constants in ml·g-1
·s-1
).
Using the rate constants derived from the individual reactions with propene and the reaction
intermediates to calculate the kinetic network of parallel and consecutive reactions a fair
0.0
0.1
0.2
0.3
0.4
0.5
0.6
0.7
0.8
0.9
1.0
0.00 0.01 0.02 0.03 0.04 0.05
Contact time [s•g/ml]
Co
nce
ntr
ati
on
ace
ton
e [
mm
ol/
l]
MoV0.27Te0.17Nb0.12Ox
653 K
0%
5%
10%
15%
20%
25%
30%
0% 10% 20% 30% 40% 50% 60%
Conversion acetone
Yie
ld
Acetic acid
COXCOX
k1 = 0.57
k2 = 8.9
k3 = 2.2
k >> 10
k4 = 0.31 k5 = 0.40
k8 = 3.2
k6 = 19.2
k7 = 3.6

Chapter 4
99
agreement between the calculated concentrations (solid lines Fig. 4.5 left) and the measured
concentrations of reactor educts was reached. Using these values to start, a simultaneous fit of
all rate constants was performed in order to better adapt the derived values to the
experimentally determined concentrations. This resulted in a very good agreement of the
experimental and fitted data points (Figure 4.5 right). While the number of constants to be
fitted is large, the deviation from the rate constants determined experimentally with the
individual reactants allows estimating the impact of the reaction conditions for the individual
reaction steps in the sequential reaction. Table 4.3 compiles the comparison of rate constants
from single experiments and from the fitting. The differences are attributed to the variations in
the state of the surface between the situation of a single reactant and the complex reaction
mixture as well as the simultaneous presence of a larger variety of molecules at once.
Figure 4.5: Concentration of products as function of contact time for propane oxidation over
MoV0.27Te0.17Nb0.12Ox (left: rate constants from single experiments; right: simultaneous fit).
0.00
0.02
0.04
0.06
0.08
0.10
0.12
0.14
0 0.2 0.4 0.6
Contact time [s•g/ml]
Co
nc
en
tra
tio
n [
mm
ol/l]
Acrylic acid
Propene
COX
Aceton
Acetic acid
0.00
0.02
0.04
0.06
0.08
0.10
0.12
0.14
0 0.2 0.4 0.6
Contact time [s•g/ml]
Co
nc
en
tra
tio
n [
mm
ol/
l]
Acrylic acid
Propene
COX
Aceton
Acetic acid

Chapter 4
100
Table 4.3: Comparison of rate constants from single experiments and simultaneous fit.
Rate
constant
Rate constants
single experiments
[ml·g-1
·s-1
]
Rate constant
simultaneous fit
[ml·g-1
·s-1
]
Difference
[%]
k1 0.57 0.56 -1.8
k2 8.9 12.6 +57.5
k3 2.2 1.9 -13.6
k4 0.31 0.41 +32.3
k5 0.40 0.25 -37.5
k6 19.2 57.5 +200
k7 3.6 23.6 +555
k8 3.2 3.00 -6.3
While the rate constant for the oxidative dehydrogenation of propane to propene was fairly
constant in both approaches, the rate constant for the oxidation of propene to acrolein (k2) was
markedly higher, whereas the rate constant for the parallel oxidation to acetone (k3) was
lower. The reactions to acetic acid (k4 and k6) were much faster than observed in the
individual reactions indicating that under the chosen reaction conditions the oxidative
decarbonylation is a more substantial reaction than the full oxidation. Notably, however, also
the total oxidation of acetone (k7) is enhanced suggesting that it is bound stronger than in the
case of the reaction with the single components.
On the basis of the kinetic model presented, the maximum yield of acrylic acid and the main
pathways for lowering the acrylic acid yield can be calculated. For the catalyst described the
highest possible yield of acrylic acid is 26% at a conversion of propane of 63%. At this point
yields are as follow: propene: 2%, acetic acid: 3%, COx: 32%. From the yield data only, it is
not possible to determine the loss by each pathway. Integral calculations, however, show that
11% of all molecules are converted along the propene – acetone – acetic acid - COx reaction
path and are, therefore, lost for acrylic acid formation. The same calculation indicates that
22% of all molecules converted to acrylic acid are further oxidized to carbon oxides.
The yields of propene and acrylic acid in the oxidation of propane at 653 K over
MoVTeNbOx-M1 catalysts observed for the series of phase pure catalysts 1 – 6 are shown in
Figure 4.6. Remarkably, the yields of propene show the same trend for all six catalysts,
whereas the yields for acrylic acid differ significantly at high conversions.

Chapter 4
101
Figure 4.6: Propene (black) and acrylic acid yields (gray) of catalysts no. 1 – 6.
The initial rates of propane conversion (normalized to surface area and to the concentration of
M1 phase present) as function of the
vanadium fraction substituted for
catalysts 1-6 are shown in Figure 4.7.
Within each group, the activity
appears to be a linear function of the
vanadium concentration substituted for
molybdenum, but none of the two
functions passes through the origin.
These two subgroups of catalysts seem
also to have distinctively different
catalytic properties. The yields of
acrylic acid at high conversions
obtained for the first group of
catalysts, i.e., catalysts 2 and 4, are
much higher than those of the second group, i.e., 5 and 6. Note that for catalysts 1 and 3 the
relative yield conversion curve cannot be assessed with certainty, because of the low activity
of the material.
0
5
10
15
20
25
30
35
40
45
0 20 40 60 80
Yie
ld p
rop
en
e /
acry
lic
ac
id [
%]
Conversion propane [%]
No. 1
No. 2
No. 3
No. 4
No. 5
No. 6
0,00
0,05
0,10
0,15
0,20
0,25
0 0,1 0,2 0,3
Ra
te [µ
mo
l·s
-1·m
-2 (M
1)]
Vanadium [mol V/(mol Mo + mol V) (ICP)]
Intersection
x = 0.096
Intersection
x = 0.162
Intersection
x = 0.261
Figure 4.7: Initial rates of propane
conversion normalized to surface area
and fraction of M1 phase (same markers
used as in Figure 4.3).

Chapter 4
102
4.4. Discussion
The catalytic conversion of propane to acrylic acid is one of the most complex reactions that
are intended to be implemented on a large scale over one type of catalyst. Neither the type of
active site nor the complete mechanism is currently unequivocally accepted despite 15 years
of intense experimental and theoretical research. This is related to the complex nature of the
catalysts, the not less complex transformations, these catalysts undergo when in operation and
a network of parallel and sequential reaction that inevitably take place, which are markedly
influenced by the local concentrations of reactants and products. This complexity in mind, we
limit the present contribution to establishing a network of kinetic equations and to show how
the concentration of vanadium substituted into positions of molybdenum in the lattice changes
the activity and selectivity of the catalysts.
Let us first discuss the relative rates of the reaction steps in the overall sequence by exploring
the intermediates in the overall network. Using propene, acetone, acrolein, and acrylic acid as
the most abundant reactive intermediates, we have completed the reaction network of Lin et
al. [30] by two additional pathways, i.e., the oxidation of acetone and the conversion of acrylic
acid to acetic acid, which contribute markedly to the overall reaction. All reactions are first
order with respect to the carbon species and zero order with respect to oxygen, which is
typical for a Mars-van-Krevelen mechanism with a fast re-oxidation step of the surface.[44]
In agreement with the literature,[31] the oxidative dehydrogenation of propane is found to be
the slowest step in the reaction path. The yield conversion plot shows that propene (see Fig.
4.5) is the only primary product, while the direct oxidation of propane to carbon oxides is
hardly observed (< 1%). Surprisingly, the overall rate of the propene oxidation via the two
parallel pathways to acrolein and subsequently acrylic acid and to acetone was approximately
19 times higher than the rate for propane conversion to propene, which is slightly lower than
the value of 25 reported by us in ref.,[45] but the ratio increased to 26 for the simultaneous fit
of all reactions. This constant ratio has two kinetic consequences, i.e., it indicates that that the
two reaction channels complement and compensate each other and that also for the second
step the adsorption of propene must be primarily controlled by dispersion forces and is hence
independent of the nature of the specific surface.
The relative rates to acrolein and acetone depend upon the presence of Brønsted acid sites.[46]
The importance of the latter pathway is proportional to the concentration of Brønsted acid

Chapter 4
103
sites, which form a secondary propyl carbenium ion from propene. The ground state of this
carbenium ion, the alkoxy group, is able to donate a proton to another oxygen atom, while
maintaining and strengthening the C-O bond. The required ability to donate a proton
(stabilization of at least the transition state to a carbenium ion) and the ability to accept the
proton suggests that the reaction will occur with the highest rate on a material with modest
Brønsted acid strength. Without being able to determine the concentration of Brønsted acid
sites under reaction conditions, the selectivity to acrolein was higher for materials with lower
concentrations of vanadium or with the vanadium being substituted more selectively into
positions contributing to the alkane activation (see below).
Acetone formed, reacts with the by far highest rate to acetic acid and COx. It is speculated that
this occurs by cleavage of the C-C bond and full oxidation of the surface methoxy group. This
cleavage must be preceded by a strong interaction of the basic surface oxygen with the carbon
atom of the carbonyl group generating a carboxylate precursor. Similar surface species have
been spectroscopically observed in mixed oxides by IR spectroscopy.[47]
Acrolein was clearly identified as intermediate, but even at short contact times, it was not
possible to achieve selectivities to acrolein higher than 17% and the rates and their variations
will not be discussed in detail. Like acetone, acrylic acid reacted in parallel to acetic acid and
COx with comparable rates. Materials that showed an enhanced conversion of propene to
acetone also showed a higher rate from acrylic acid to acetic acid and to full oxidation,
lowering so the overall achievable yield to acrylic acid.
The much higher stability of acrylic acid (and also of acetic acid) points to the pronounced
surface cracking of acetone as one of the major reasons for its high reactivity. In contrast, the
decarboxylation of the acid involves a more demanding oxygen insertion for further
oxidation. It is interesting to note that deep oxidation to COx observed for acrylic acid and for
acetone is associated with a higher polarity of the partly oxidized molecules, which enhances
the interaction with mixed oxide surface. This stronger adsorption also increases the effective
residence time in the reactor, enhancing in this way the probability to react. We would like to
exclude “strongly adsorbing unselective sites” as the reason for total oxidation, because in
such a scenario a pronounced concentration of such sites should also catalyze the total
oxidation of propane and propene.

Chapter 4
104
Because of its higher abundance, the sequential oxidation of acrylic acid to COx is twice as
negative as the formation of acetone for the overall yield. For optimizing the catalyst,
enhancing the rate of propane conversion to acrylic acid relative to the rate of the further
conversion of acrylic acid has, therefore, a higher priority than decreasing the acetone
formation rate. If propene oxidation and the further oxidation of acrylic acid are catalyzed by
the same active site, an improvement of the catalytic properties is very challenging, while
improvements are more feasible, if the reactions are catalyzed by different sites.
It is interesting to note, that the oxygen concentration does not influence the rate, as long as it
does not fall below 1 vol.%. In this case the rate of re-oxidation becomes very low and the
overall rate starts to depend on the oxygen concentration. Under such conditions also the
formation of COx and acetic acid was enhanced indicating that accessible Lewis acid sites
may be the reason for the enhanced adsorption of intermediates and total oxidation. It should
also be noted that under these conditions the concentration of vanadyl groups will be lower
than in the presence of a high partial pressure of oxygen. This should in turn decrease the
oxidative dehydrogenation of propane to propene.
Overall, literature suggests that the presence of vanadium substituted for molybdenum in the
mixed oxide is responsible for the activation of the alkane and for the oxygen insertion. A
comparison of the catalytic activity for materials studied in the present paper shows that this is
not the case despite the fact that all samples consisted predominantly of the M1 phase.
Assuming that the materials contain a surface concentration of vanadium, which is similar to
the concentration of bulk, we rule out that only one active site associated with vanadium
exists. In the present case two groups of mixed oxides appear to be clustered, if the
concentration of vanadium substituted into molybdenum sites of the M1 phase is used as a
basis for comparing the overall activity (see Figure 4.7). For both groups of mixed oxides
separate linear correlations between the overall rate of the catalytic conversion and the
vanadium concentration were found. Both correlations do not pass through the origin
indicating that not all vanadium is part of the catalytically active sites.

Chapter 4
105
In order to better understand the possible nature of active and inactive sites containing
vanadium let us consider the structure of the
MoVTeNbOx-M1 phase (see Figure 4.8), which
consists of metal-oxygen octahedra linked via
oxygen atoms. The octahedra marked in red
contain in their center molybdenum in the
oxidation state +VI and the orange octahedra
molybdenum in the oxidation state +V. Each
unit cell contains 36 octahedra out of which
twelve contain molybdenum or vanadium in
their center (indicated as white octahedra).
These can be further grouped into four types
characterized by their local surrounding. Note
that only these octahedra are located between
the 7 and 6 membered ring channels, while all
other octahedra are part of at least one 5 membered ring channel.
The four different molybdenum/vanadium centers are marked with circles in Figure 4.9. The
sites marked with dashed circles (Type 1) are located between two six ring channels. Each
unit cell contains two centers of this type. Those marked with a dotted line (Type 2) are
located between six and seven ring channels and are in direct proximity to the vanadium
centers of Type 1. Each unit cell contains four centers of this type. The centers marked with a
triple line (Type 3) are also located between a six and a seven ring channel, but these are
isolated from other vanadium centers. The vanadium centers marked with a full line (Type 4)
are also isolated and located between two seven ring channels with two centers per unit cell.
Figure 4.8: Structure of MoVTeNbOx-M1
phase (red octahedra Mo+VI
, orange
octahedra Mo+V
and white octahedra
molybdenum or vanadium).

Chapter 4
106
Figure 4.9: Number of vanadium centers in MoVTeNbOx-M1 phase.
Assuming that the activity of the vanadium sites depends on the surrounding structure, we
speculate that each of these types of sites shows a different activity. Not all potentially
exchangeable sites are occupied with vanadium at the ratio of vanadium to molybdenum
between 0.16 - 0.28 (all sites would be occupied at a V/Mo ratio of 0.5). It is likely that the
substitution energy for vanadium into these sites will vary leading to a preferential occupation
with the different sizes of vanadium and molybdenum ions (Pauling radii are 59 pm vs. 62
pm) should have a significant effect on the substitution energy.
The surface and structural models of Grasselli et al. and Ueda et al. [34, 35] suggest that
vanadium atoms located in octahedra adjacent to a seven-membered channel are active in
propane activation. If the larger ring is more flexible, the larger metal cations (i.e., Mo) will
be preferentially incorporated. Thus, we speculate that the structurally more confined Mo
positions at the six ring channels having low (or no) catalytic activity will be substituted first
by vanadium. This renders a substantial fraction of sites at low vanadium concentrations to be
(nearly) inactive. In case of small differences in substitution energy at the different sites
vanadium will be randomly distributed, which should lead to a linear correlation through the
origin.
The data presented in Fig. 4.7 suggest that two groups of materials exist, which contain
different fractions of vanadium in position leading to low catalytic activity. More specific, the
offset at the x-axis at V/(Mo+V) = 0.096 can be related to the incorporation of the first four
MoV
VMo
MoV
Mo5+
Mo6+
Nb5+
Te4+
O2-
b
a
2 (6/6) Type 1
4 (6/7) isolated Type 3
4 (6/7) Type 2
2 (7/7) isolated Type 4
∑ channels

Chapter 4
107
vanadium atoms per unit cell into sites having no activity for the propane activation (i.e., 4:36
= 0.111) followed by the occupation of active sites. For the other series of catalysts (trend line
crossing the x-axis at V/(Mo+V) = 0.162 ≈ 0.167 = 6:36) six vanadium centers per unit cell
showing no significant activity were occupied first. The two trend lines intersect at V/(Mo+V)
= 0.261, which is close to 0.278 = 10:36, indicating that two sites will not be occupied with
vanadium. It should be noted that within the present accuracy an intersection at 0.33 = 12:36
can also be assumed, which can be related to the maximum concentration of vanadium in the
M1-structure, i.e., a situation in which all potentially substitutable molybdenum sites are
occupied by vanadium.
Combining the classification of vanadium sites on the basal plane of the M1 phase with the
attributions of active sites by Grasselli et al. and the probability to substitute molybdenum
with vanadium, it appears tempting to suggest that first the sites of Type 1 and Type 2 are
occupied first by vanadium. We would like to emphasize at this moment, however, that such
an attribution would be premature.
It is interesting to note however, that the materials with the higher fraction of vanadium
substituted into inactive sites show a higher tendency towards formation of acetone and acetic
acid as well as towards full oxidation. As we have associated this with a higher degree of
accessibility of metal cations, we would like to speculate that substitution into the inactive
locations results also in a tendency to a lower oxidation state (partial reduction).
For a given vanadium concentration the constituents of group A (filled marks in Figure 4.7)
show higher activities in propane oxidative dehydrogenation and selective oxidation than
those of group B. Also the rates for oxygen insertion differ between group A and B type
catalysts (for a comparison of the rate constants between group A and B see Table 4.4). The
formation rate constant towards acetone was higher for group B type catalysts and increased
within a group of catalysts with the concentration of vanadium. Similarly, the formation rate
constant for acetic acid from acrylic acid (oxygen insertion at the acrylic acid double bond)
with subsequent decarboxylation and the total oxidation to COX increased in that order.
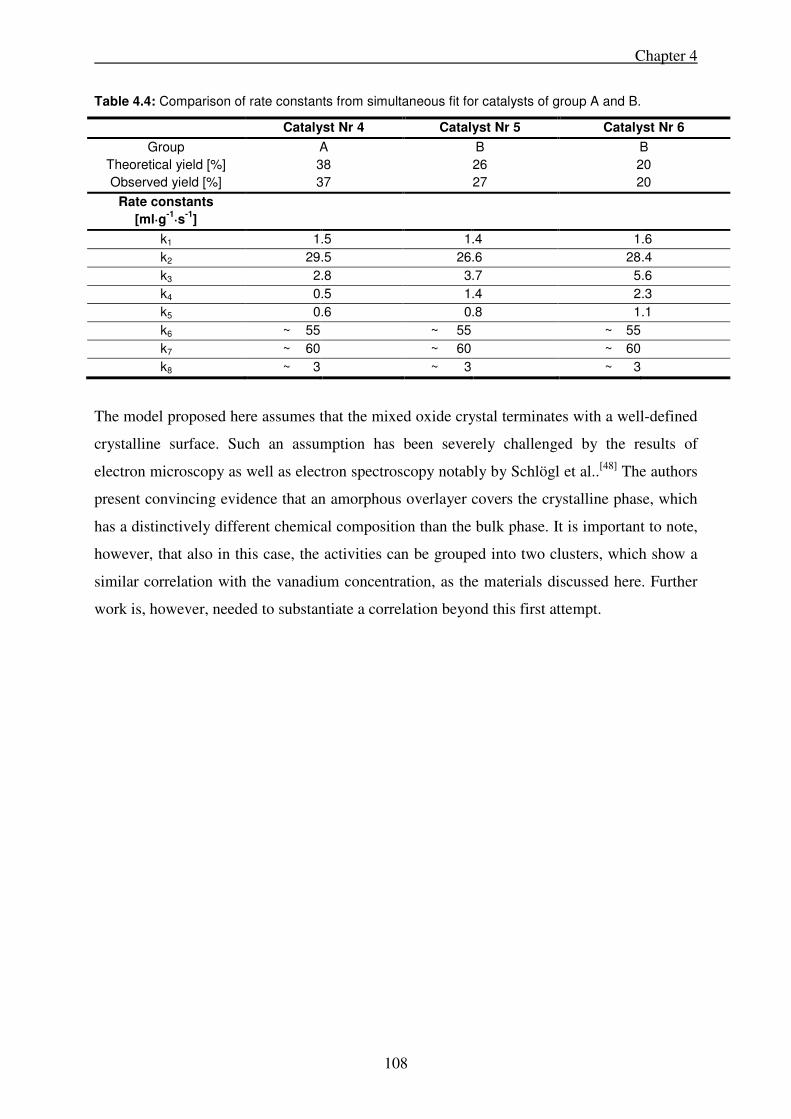
Chapter 4
108
Table 4.4: Comparison of rate constants from simultaneous fit for catalysts of group A and B.
Catalyst Nr 4 Catalyst Nr 5 Catalyst Nr 6
Group A B B
Theoretical yield [%] 38 26 20
Observed yield [%] 37 27 20
Rate constants
[ml·g-1
·s-1
]
k1 1.5 1.4 1 .6
k2 29.5 26.6 28 .4
k3 2.8 3.7 5 .6
k4 0.5 1.4 2 .3
k5 0.6 0.8 1 .1
k6 ~ 55 ~ 55 ~ 55
k7 ~ 60 ~ 60 ~ 60
k8 ~ 3 ~ 3 ~ 3
The model proposed here assumes that the mixed oxide crystal terminates with a well-defined
crystalline surface. Such an assumption has been severely challenged by the results of
electron microscopy as well as electron spectroscopy notably by Schlögl et al..[48] The authors
present convincing evidence that an amorphous overlayer covers the crystalline phase, which
has a distinctively different chemical composition than the bulk phase. It is important to note,
however, that also in this case, the activities can be grouped into two clusters, which show a
similar correlation with the vanadium concentration, as the materials discussed here. Further
work is, however, needed to substantiate a correlation beyond this first attempt.

Chapter 4
109
4.5. Conclusions
The analysis of the overall reaction network suggests that although the first C-H bond
activation appears to be the most important effect determining the activity of the catalysts,
subtle variations in the chemical composition and the location of the substitution of vanadium
are able to exert an important influence on activity and selectivity. Two groups of mixed
oxide catalysts have been identified that show two separate individual linear relations to the
concentration of vanadium substituted for molybdenum. The grouping and the dependence on
vanadium concentration in each group suggest that not only different substitution patterns for
vanadium exist, but also that not all of these sites are catalytically active. We speculate that
the preferential substitution and the inactivity of some substituted vanadium cations are
related to their location at six membered rings on the basal plane of the M1 phase.
The constant ratio of propane oxidative dehydrogenation and the sum of the rates towards
oxygenates suggest that not only propane, but also propene, adsorb mainly via dispersion
forces. The selectivity to acrolein decreases from group A to B. The increased rates of acetone
and acetic acid formation suggest a higher degree of accessibility of metal cations in the latter
group of materials. These sites, not active in alkane activation, may contribute to oxygen
insertion reactions and C-C bond cleavage.
The oxidation of acrylic acid to COx has been identified as the key factor limiting the yield of
the selective oxidation of propane to acrylic acid. Approximately two-thirds of the losses in
acrylic acid yields result from the oxidation and one third from acetone formation. The other
possible side product, acetone, which subsequently oxidizes to acetic acid and finally to COx
contributes only about one third towards lowering the yield of acrylic acid. This second
pathway can be limited by the removal of all Brønsted acid sites in the catalysts.
As the current set of samples suggests that vanadium is first preferentially substituted into
sites not active for the target reaction, statistical distributed of vanadium substitution is
expected not only to lead to more active catalysts, but also to higher yields of acrylic acid.

Chapter 4
110
4.6. Acknowledgments
The authors thank Daniela Hartmann for the Rietveld analysis of the catalysts and are grateful
for the financial support from the European Union in the framework of the Integrated Project
Topcombi (NMP2-CT-2005-515792-2) and from the from the Bayerisches Staatsministerium
für Wissenschaft, Forschung und Kunst within the NanoCat project. Discussions within the
network of excellence IDECAT are also gratefully acknowledged.

Chapter 4
111
4.7. References
[1] F. Cavani, F. Trifiro, Catalysis Today 1999, 51, 561. [2] M. Baerns, O. Buyevskaya, Catalysis Today 1998, 45, 13. [3] R. K. Grasselli, Catalysis Today 1999, 49, 141. [4] J. M. L. Nieto, Topics in Catalysis 2006, 41, 3. [5] T. Ushikubo, I. Sawaki, K. Oshima, K. Inumaru, S. Kobayakawa, K. Kiyono, US
Patent 5,422,328, 1995. [6] T. Ushikubo, K. Oshima, A. Kayo, T. Umezawa, K. Kiyono, I. Sawaki, EP Patent
529.853 A2, 1992. [7] T. Ushikubo, H. Nakamura, Y. Koyasu, S. Wajiki, US Patent 5,380,933, 1995. [8] T. Ushikubo, H. Nakamura, Y. Koyasu, S. Wajiki, EP Patent 608.838 A2, 1994. [9] B. C. Zhu, H. B. Li, W. S. Yang, L. W. Lin, Catalysis Today 2004, 93-95, 229. [10] B. Solsona, J. M. L. Nieto, J. M. Oliver, J. P. Gumbau, Catalysis Today 2004, 91-92,
247. [11] P. Botella, E. Garcia-Gonzalez, J. M. L. Nieto, J. M. Gonzalez-Calbet, Solid State
Sciences 2005, 7, 507. [12] M. M. Lin, Applied Catalysis A 2003, 250, 287. [13] H. Watanabe, Y. Koyasu, Applied Catalysis A 2000, 194, 479. [14] P. Botella, B. Solsona, A. Martinez-Arias, J. M. L. Nieto, Catalysis Letters 2001, 74,
149. [15] W. Ueda, D. Vitry, T. Katou, Catalysis Today 2005, 99, 43. [16] M. M. Lin, Applied Catalysis A 2001, 207, 1. [17] P. Botella, J. M. L. Nieto, B. Solsona, Catalysis Letters 2002, 78, 383. [18] K. Oshihara, T. Hisano, W. Ueda, Topics in Catalysis 2001, 15, 153. [19] M. Baca, J. M. M. Millet, Applied Catalysis A 2005, 279, 67. [20] P. DeSanto, D. J. Buttrey, R. K. Grasselli, C. G. Lugmair, A. F. Volpe, B. H. Toby, T.
Vogt, Zeitschrift Für Kristallographie 2004, 219, 152. [21] P. DeSanto, D. J. Buttrey, R. K. Grasselli, C. G. Lugmair, A. F. Volpe, B. H. Toby, T.
Vogt, Topics in Catalysis 2003, 23, 23. [22] M. Baca, M. Aouine, J. L. Dubois, J. M. M. Millet, Journal of Catalysis 2005, 233,
234. [23] R. K. Grasselli, J. D. Burrington, D. J. Buttrey, P. DeSanto, C. G. Lugmair, A. F.
Volpe, T. Weingand, Topics in Catalysis 2003, 23, 5. [24] F. Ivars, P. Botella, A. Dejoz, J. M. L. Nieto, P. Concepcion, M. I. Vazquez, Topics in
Catalysis 2006, 38, 59. [25] J. M. Oliver, J. M. L. Nieto, P. Botella, A. Mifsud, Applied Catalysis A 2004, 257, 67. [26] G. Y. Popova, T. V. Andrushkevich, G. I. Aleshina, L. M. Plyasov, M. I. Khramov,
Applied Catalysis A 2007, 328, 195. [27] P. Botella, P. Concepcion, J. M. Lopez Nieto, Y. Moreno, Catalysis Today 2005, 99,
51. [28] J. M. L. Nieto, P. Botella, B. Solsona, J. M. Oliver, Catalysis Today 2003, 81, 87. [29] X. L. Tu, N. Furuta, Y. Sumida, M. Takahashi, H. Niiduma, Catalysis Today 2006,
117, 259. [30] M. H. Lin, T. B. Desai, F. W. Kaiser, P. D. Klugherz, Catalysis Today 2000, 61, 223. [31] E. Balcells, F. Borgmeier, I. Grisstede, H. G. Lintz, F. Rosowski, Applied Catalysis A
2004, 266, 211. [32] E. Balcells, F. Borgmeier, I. Grisstede, H. G. Lintz, Catalysis Letters 2003, 87, 195.

Chapter 4
112
[33] L. Luo, J. A. Labinger, M. E. Davis, Journal of Catalysis 2001, 200, 222. [34] T. Katou, D. Vitry, W. Ueda, Catalysis Today 2004, 91-92, 237. [35] R. K. Grasselli, D. J. Buttrey, J. D. Burrington, A. Andersson, J. Holmberg, W. Ueda,
J. Kubo, C. G. Lugmair, A. F. Volpe, Topics in Catalysis 2006, 38, 7. [36] M. D. Argyle, K. Chen, E. Iglesia, A. T. Bell, Journal of Physical Chemistry B 2005,
109, 2414. [37] X. Rozanska, J. Sauer, International Journal of Quantum Chemistry 2008, 108, 2223. [38] P. Concepcion, P. Botella, J. M. L. Nieto, Applied Catalysis A 2004, 278, 45. [39] W. Ueda, D. Vitry, T. Katou, Catalysis Today 2004, 96, 235. [40] M. Baca, A. Pigamo, J. L. Dubois, J. M. M. Millet, Topics in Catalysis 2003, 23, 39. [41] P. Korovchenko, N. R. Shiju, A. K. Dozier, U. M. Graham, M. O. Guerrero-Perez, V.
V. Guliants, Topics In Catalysis 2008, 50, 43. [42] P. Botella, J. M. L. Nieto, B. Solsona, A. Mifsud, F. Marquez, Journal of Catalysis
2002, 209, 445. [43] D. Vitry, Y. Morikawa, J. L. Dubois, W. Ueda, Topics in Catalysis 2003, 23, 47. [44] J. L. Dubois, Catalysis Today 2005, 99, 5. [45] F. N. Naraschewski, C. P. Kumar, A. Jentys, J. A. Lercher, Applied Catalysis A,
doi:10.1016/j.apcata.2010.07.005. [46] A. Zecchina, C. Lamberti, S. Bordiga, Catalysis Today 1998, 41, 169. [47] J. A. Lercher, Z. Phys. Chemie NF 129 1982, 209. [48] A. C. Sanfiz, T. W. Hansen, D. Teschner, P. Schnörch, F. Girgsdies, A. Trunschke, R.
Schlögl, M. H. Looi, S. B. A. Hamid, Journal of Physical Chemistry C 2010, 114, 1912.

Chapter 5
113
Chapter 5
Synthesis and Acid Properties of MoVSb and
MoVTeNb Oxides for the selective Oxidation of
Propane to Acrylic Acid
Abstract
The synthesis of MoVSb oxides with M1 phase and mixture of M1 and M2 phase are
described. Pure M1 phase was obtained with hydrogen peroxide treatment after calcination.
Results in selective oxidation of propane showed highest yield of acrylic acid for the pure M1
phase catalysts. Reactions with propene were used to determine the ratio between acrylic acid
and acetone formation. Mixtures of M1 and M2 phase form a higher fraction of acetone than
the phase pure catalyst. TPD techniques were used to determine the amount of Brønsted and
Lewis acid sites. All MoVSb oxides contain mainly Brønsted acid sites, but the amount of
acid sites is lowest for the pure M1 phase catalysts. As it is already reported in literature,
Brønsted acid sites catalyze the formation of acetone. For comparison the acid sites of a
MoVTeNbOx M1-phase catalyst were also determined, showing besides Brønsted acid sites a
high amount of Lewis acid sites.

Chapter 5
114
5.1. Introduction
The selective oxidation of alkanes to oxygenates has been a topic of high interest for the last
decades, nevertheless only the oxidation of n-butane to maleic anhydride has been developed
into an industrial process.[1-3] For the oxidation of propane to acrylic acid complex multi metal
oxides are promising catalysts. Especially MoVTeNb oxides that were developed in the 90s
by Mitsubishi showed yields up to 48%.[4] On the technical scale, however, acrylic acid is still
produced in a two step process starting from propene with acrolein as intermediate using
molybdenum based catalysts. For both steps the catalysts are optimized and yields exceed
90%, which lead to an overall yield of acrylic acid of 87% based on propene.[5, 6] Economical
estimations reveal that the direct process starting from propane might become favorable in
costs when the yield exceeds 60%.
For MoVTeNb oxides two phases containing all four metals are known, called M1 and M2.
The M1 phase is an orthorhombic structure with periodic layers, consisting of metal-oxygen
octahedrons with molybdenum and vanadium centers. These octahedrons form channels
perpendicular to the ab plane of the unit cell. The smallest channels consist of five
octahedrons and accommodate niobium, whereas the larger channels of six or seven
octahedrons host tellurium. The M2 phase is a hexagonal structure with periodic layers
consisting also of metal-oxygen octahedrons, but forming only channels from six
octahedrons.[7-11] It is generally accepted that the M1 phase contains the active centers for
alkane activation. The proposed centers for alkane activation are vanadium sites located
adjacent to a seven octahedron ring. This structure leads to distortion of the octahedron
causing the activity for alkane activation and due to the missing of such a structural element
the M2 phase shows no activity in alkane activation.[12, 13]
Beside compositions containing molybdenum, vanadium, tellurium and niobium, several
other metal mixtures have been tested for selective oxidation reactions.[14-16] Multi metal
oxides from molybdenum, vanadium and antimony showed high activity in the oxidative
dehydrogenation which is the first and rate determining step in the selective oxidation of
propane.[17] It was reported that in MoVSb oxides the same structures are existent as in
MoVTeNb oxides. The MoVSbOx-M1 structure is analogous to the MoVTeNbOx-M1
structure with Tellurium replaced by Antimony. The stoichiometry is (SbO)2M20O56 (M =
Mo, V). Antimony with an oxidation state of +V forms infinite [Sb-O]∞ chains in the
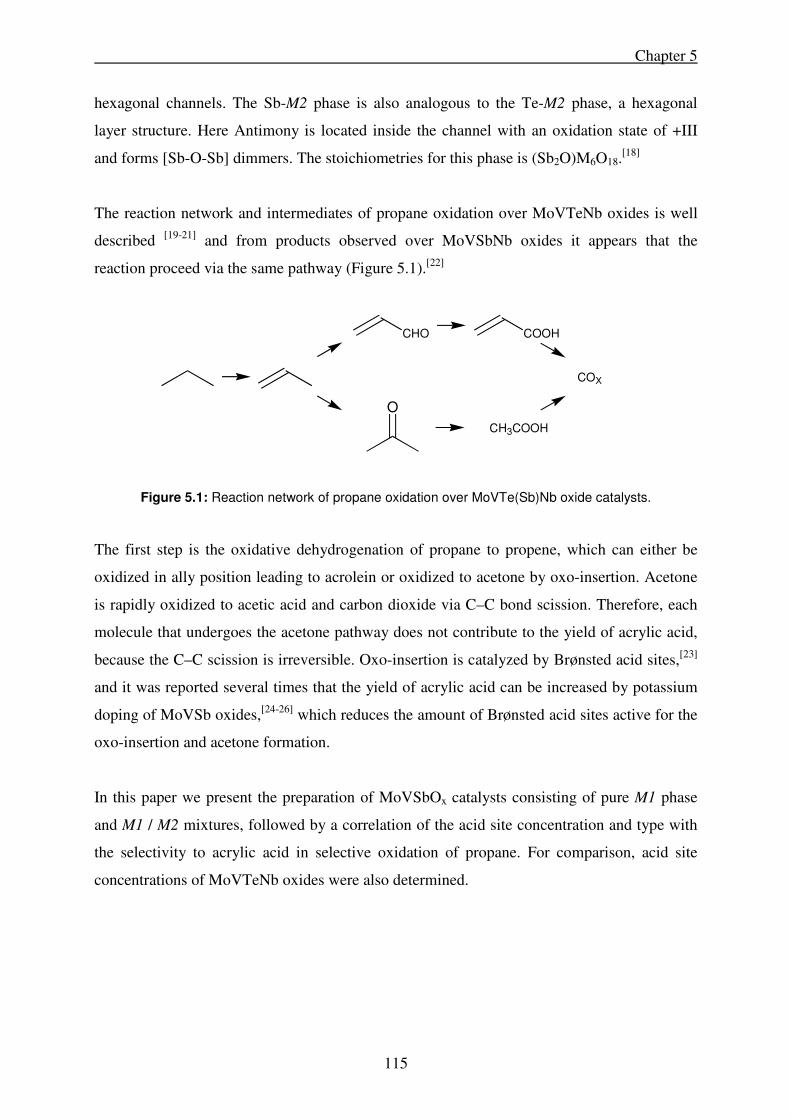
Chapter 5
115
hexagonal channels. The Sb-M2 phase is also analogous to the Te-M2 phase, a hexagonal
layer structure. Here Antimony is located inside the channel with an oxidation state of +III
and forms [Sb-O-Sb] dimmers. The stoichiometries for this phase is (Sb2O)M6O18.[18]
The reaction network and intermediates of propane oxidation over MoVTeNb oxides is well
described [19-21] and from products observed over MoVSbNb oxides it appears that the
reaction proceed via the same pathway (Figure 5.1).[22]
Figure 5.1: Reaction network of propane oxidation over MoVTe(Sb)Nb oxide catalysts.
The first step is the oxidative dehydrogenation of propane to propene, which can either be
oxidized in ally position leading to acrolein or oxidized to acetone by oxo-insertion. Acetone
is rapidly oxidized to acetic acid and carbon dioxide via C–C bond scission. Therefore, each
molecule that undergoes the acetone pathway does not contribute to the yield of acrylic acid,
because the C–C scission is irreversible. Oxo-insertion is catalyzed by Brønsted acid sites,[23]
and it was reported several times that the yield of acrylic acid can be increased by potassium
doping of MoVSb oxides,[24-26] which reduces the amount of Brønsted acid sites active for the
oxo-insertion and acetone formation.
In this paper we present the preparation of MoVSbOx catalysts consisting of pure M1 phase
and M1 / M2 mixtures, followed by a correlation of the acid site concentration and type with
the selectivity to acrylic acid in selective oxidation of propane. For comparison, acid site
concentrations of MoVTeNb oxides were also determined.
CHO COOH
O
CH3COOH
COX

Chapter 5
116
5.2. Experimental
5.2.1. Catalyst preparation
Catalysts of the composition MoV0.26Sb0.14Ox were prepared by dissolving 9.28 g
ammounium para molybdate in 30 ml ultra pure water at a temperature of 353 K in a Teflon
tube. Antimony sulfate (1.06 g) was slowly added to the clear, colorless solution during a time
period of 15 min. The color of the reaction mixture changed to dark green during this step.
Stirring was continued for further 15 min. 3.46 g vanadyl sulfate hydrate was dissolved in
15 ml ultra pure water water at 353 K and added to the reaction mixture within 20 minutes.
During this step the mixture turned to black. After further stirring for 15 min the mixture was
diluted with ultra pure water to 100 ml and the dissolved oxygen was removed by nitrogen
flow through the solution for five minutes. The Teflon tube was closed and placed in a steel
autoclave where the hydrothermal synthesis was carried out for 24 hour at a temperature of
448 K. After cooling, the black slurry was filtered, washed five times with water and dried at
353 K for 16 hours. The catalyst was calcined for 2 hours at 873 K in nitrogen.
To dissolve the M2-phase the catalysts were stirred in 15% hydrogen peroxide solution for
four hours. This treatment was done before (named: MoVSbOx_H2O2_1) and after (named:
MoVSbOx_H2O2_2) the calcination step.
MoVTeNbOx was prepared according to the following procedure. 8.74 g
Ammonium para molybdate (NH4)6Mo7O24 · 4 H2O was dissolved in 50 ml ultra pure water
water at 353 K in a Teflon tube followed by addition of 1.14 g telluric acid dissolved in water.
3.58 g Vanadyl sulfate VOSO4 · x H2O was added as aqueous solution dropwise within
30 min, resulting in a black solution. 2.27 g Ammonium niobat oxalat
(NH4)NbO(C2O4)2 · x H2O was added as solution and after 10 min further stirring the mixture
turned olive green. Dissolved oxygen was removed by bubbling nitrogen through the mixture
for 5 min. The tube was closed with a Teflon cap and mounted into a steel autoclave.
Hydrothermal synthesis was done at 448 K for a duration of 48 hours. The autoclave was
cooled with water to room temperature. The precipitate was filtered off, washed five times
with water and dried 16 h at 353 K. The material was calcined 2 h at 523 K in static air and
then 2 h at 873 K in nitrogen (heating rate 10 K/min).

Chapter 5
117
5.2.2. Catalyst characterization
X-ray diffraction patterns were collected on a Philips X’pert instrument at the energy of the
Cu Kα-line. A Ni-filter was installed for removal of the Cu Kβ-line. The XRD were measured
between 2θ angles of 5 and 70 ° with a step size of 0.017 ° and a scan speed of 115 s per step.
BET surface areas were determined by N2 adsorption–desorption at 77 K using a Sorptomatic
1990 Series instrument after activation of the sample in vacuum at 523 K.
ICP-AES was measured with a Spectroflame Module after decomposition of the materials by
heating with Soda – potash.
Ammonia-TPD was measured with a six-fold vacuum TPD system, with one hour activation
at 573 K, one hour ammonia loading at 1 mbar and two hours outgasing. TPD was carried out
with a heating rate of 7 K/min up to 873 K, using an mass spectrometer to detected the
desorbing species. A H-MFI zeolite with an acid site concentration of 360 µmol/g was used as
standard. Brønsted acid sites were determined with TPD after ion exchange with ammonia
nitrate (NH4NO3). Desorbed ammonia was detected with a mass spectrometer using M = 15.
The chemical compositions determined by ICP-AES, the specific surface areas and the yields
from synthesis are presented in Table 5.1.
Table 5.1: Characterization data of MoV0.26Sb0.14 oxide catalysts.
Catalyst ICP-AES
composition
BET surface area
[m2/g]
Catalysts yield
MoV0.24Sb0.14Ox MoV0.27Sb0.06Ox 8.7 87%
MoV0.24Sb0.14Ox_H2O2_1 MoV0.27Sb0.06Ox 14.0 54%
MoV0.24Sb0.14Ox_H2O2_2 MoV0.26Sb0.03Ox 19.0 39%
MoV0.3Te0.1Nb0.1Ox MoV0.26Te0.11Nb0.10Ox 18.1 78%

Chapter 5
118
5.2.3. Catalytic activity
Catalytic activity of the catalysts for propane and propene conversion was investigated in a
six-fold-parallel reactor. The feed consisted of propane or propene (5%), oxygen (10%),
nitrogen (65%) and steam (20%) and was controlled by Broonkhorst mass flow controllers.
The evaporation of water was done with a Wagner CEM system (controlled evaporator
mixer). The four components were mixed and fed to the reactors using individual heated mass
flow controllers for each reactor. The reactors were 1/4“ stainless steel tubes. Products were
analyzed using two gas chromatographs (Shimatzu) equipped with TCD (columns:
silica/molsieve) and FID (column: FFAP) detectors. The average carbon balance was 99%
with a deviation of 1% for a single measurement.
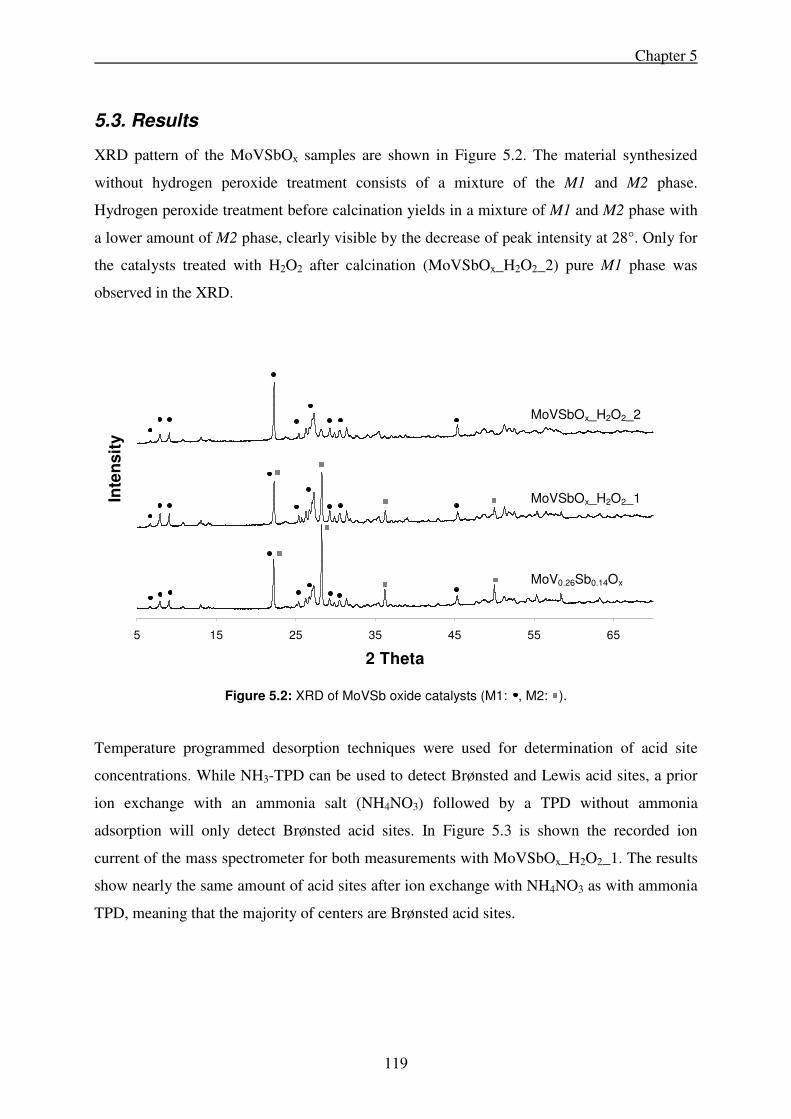
Chapter 5
119
5.3. Results
XRD pattern of the MoVSbOx samples are shown in Figure 5.2. The material synthesized
without hydrogen peroxide treatment consists of a mixture of the M1 and M2 phase.
Hydrogen peroxide treatment before calcination yields in a mixture of M1 and M2 phase with
a lower amount of M2 phase, clearly visible by the decrease of peak intensity at 28°. Only for
the catalysts treated with H2O2 after calcination (MoVSbOx_H2O2_2) pure M1 phase was
observed in the XRD.
Figure 5.2: XRD of MoVSb oxide catalysts (M1: , M2: ).
Temperature programmed desorption techniques were used for determination of acid site
concentrations. While NH3-TPD can be used to detect Brønsted and Lewis acid sites, a prior
ion exchange with an ammonia salt (NH4NO3) followed by a TPD without ammonia
adsorption will only detect Brønsted acid sites. In Figure 5.3 is shown the recorded ion
current of the mass spectrometer for both measurements with MoVSbOx_H2O2_1. The results
show nearly the same amount of acid sites after ion exchange with NH4NO3 as with ammonia
TPD, meaning that the majority of centers are Brønsted acid sites.
5 15 25 35 45 55 65
2 Theta
Inte
ns
ity
MoV0.26Sb0.14Ox
MoVSbOx_H2O2_1
MoVSbOx_H2O2_2
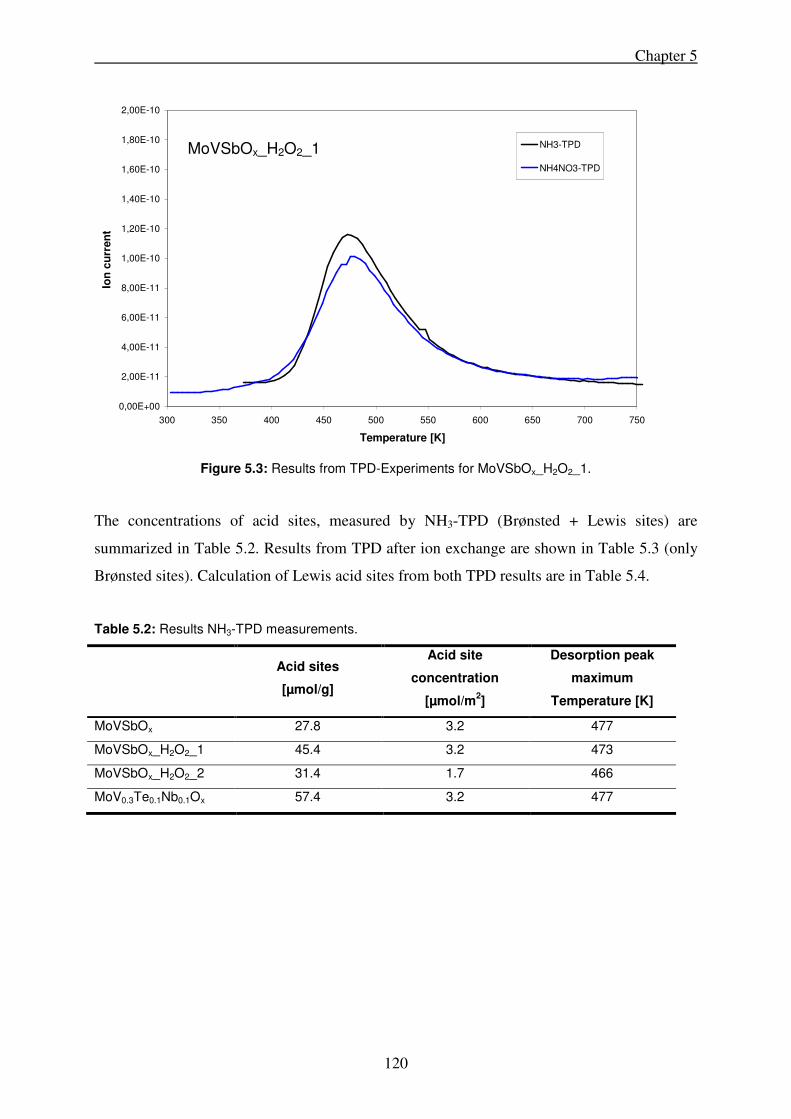
Chapter 5
120
Figure 5.3: Results from TPD-Experiments for MoVSbOx_H2O2_1.
The concentrations of acid sites, measured by NH3-TPD (Brønsted + Lewis sites) are
summarized in Table 5.2. Results from TPD after ion exchange are shown in Table 5.3 (only
Brønsted sites). Calculation of Lewis acid sites from both TPD results are in Table 5.4.
Table 5.2: Results NH3-TPD measurements.
Acid sites
[µmol/g]
Acid site
concentration
[µmol/m2]
Desorption peak
maximum
Temperature [K]
MoVSbOx 27.8 3.2 477
MoVSbOx_H2O2_1 45.4 3.2 473
MoVSbOx_H2O2_2 31.4 1.7 466
MoV0.3Te0.1Nb0.1Ox 57.4 3.2 477
0,00E+00
2,00E-11
4,00E-11
6,00E-11
8,00E-11
1,00E-10
1,20E-10
1,40E-10
1,60E-10
1,80E-10
2,00E-10
300 350 400 450 500 550 600 650 700 750
Temperature [K]
Ion
cu
rren
t
NH3-TPD
NH4NO3-TPD
MoVSbOx_H2O2_1

Chapter 5
121
Table 5.3: Results TPD measurements with (NH4)NO3 exchange (Bronstedt sites).
Acid sites
[µmol/g]
Acid site
concentration
[µmol/m2]
Desorption peak
maximum
Temperature [K]
MoVSbOx 25.5 2.9 484
MoVSbOx_H2O2_1 41.4 3.0 478
MoVSbOx_H2O2_2 22.0 1.2 467
MoV0.3Te0.1Nb0.1Ox 24.2 1.3 478
Table 5.4: Calculated amount of Lewis acid sites.
Acid sites
[µmol/g]
Acid site
concentration
[µmol/m2]
MoVSbOx 2.4 0.3
MoVSbOx_H2O2_1 4.0 0.3
MoVSbOx_H2O2_2 9.4 0.5
MoV0.3Te0.1Nb0.1Ox 33.2 1.8
For all MoVSb oxides mainly Bronstedt acid sites were observed. The total acid site
concentration for mixtures of M1 and M2 phase is 3.2 µmol/m2 for both catalysts, whereas for
pure MoVSbO-M1 phase only 1.7 µmol/m2 is observed. For comparison, acid site
concentrations of a M1-MoVTeNb oxide of the composition MoV0.3Te0.1Nb0.1Ox were
determined, showing 3.2 µmol/m2as total acid site concentration, but with a higher fraction
(58%) of Lewis acid sites (Figure 5.4).

Chapter 5
122
Figure 5.4: Acid site concentrations of MoVSbOx and MoVTeNbOx by TPD techniques.
The product yields for the oxidation of propane are shown in Figure 5.5 a - d. No significant
differences between propene yields were observed among the MoVSb and MoVTeNb oxides,
whereas the yields to acrylic acid, acetic acid and COx dependend on metal composition and
on the catalysts phase composition for the MoVSb oxides. Both hydrogen peroxide treated
catalysts showed higher yields to acrylic acid compared to the untreated catalyst and in
particular, the pure MoVSb-M1 catalyst showed the highest formation of acrylic acid among
all MoVSb oxides. The yield to acrylic acid for MoVTeNbOx-M1 is much higher than for
MoVSbOx-M1, but also at higher conversion. Therefore selectivities to acrylic acid of pure
M1 - MoVSb and MoVTeNb oxides are comparable. For COx and acetic acid, observed yields
are lowest for the pure M1-MoVSbOx catalyst.
0,0
0,5
1,0
1,5
2,0
2,5
3,0
3,5
MoVSbO MoVSbO_H2O2_1 MoVSbO_H2O2_2 MoVTeNbO
Acid
sit
e c
on
cen
trati
on
[µ
mo
l/m
^2
]
Lewis
Bronstedt

Chapter 5
123
Figure 5.5 a-d: Product yields over MoVSb and MoVTeNb oxides in propane oxidation.
In agreement with the described reaction network propene is formed as a primary product,
whereas acrylic acid, acetic acid and COx are secondary products. To study the formation of
these products in detail propene was used as reactant. Yields for propene oxidation are shown
Figure 5.6 a - d. As expected acrylic acid and acetone are primary and acetic acid and carbon
oxides are secondary products. For the pure M1-MoVSbOx (MoVSbOx_H2O2_2) and
MoVTeNbOx selectivities of 70% acrylic acid were observed, whereas the untreated
MoVSbOx catalyst shows only 25% selectivity to acrylic acid, but a higher selectivity to
acetone.
0%
1%
2%
3%
4%
5%
6%
7%
8%
0% 5% 10% 15% 20%
Conversion propane
Yie
ld p
rop
en
e
MoVSbO
MoVSbO_H2O2_1
MoVSbO_H2O2_2
MoVTeNbO
0%
2%
4%
6%
8%
10%
12%
0% 4% 8% 12% 16% 20%
Conversion propane
Yie
ld a
cry
lic
ac
id
MoVSbO
MoVSbO_H2O2_1
MoVSbO_H2O2_2
MoVTeNbO
0%
1%
2%
3%
4%
5%
6%
7%
8%
0% 5% 10% 15% 20%
Conversion propane
Yie
ld C
OX
MoVSbO
MoVSbO_H2O2_1
MoVSbO_H2O2_2
MoVTeNbO
0%
1%
2%
3%
4%
0% 4% 8% 12% 16% 20%
Conversion propane
Yie
ld a
ce
tic
ac
id
MoVSbOMoVSbO_H2O2_1MoVSbO_H2O2_2MoVTeNbO
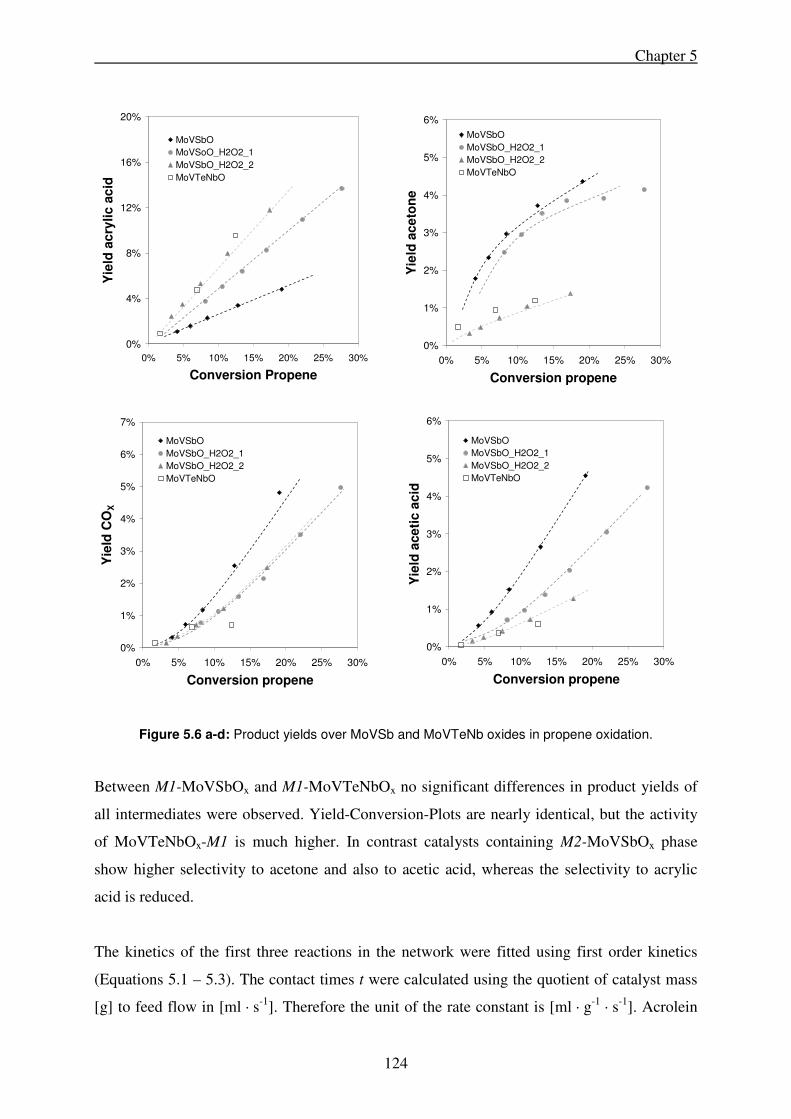
Chapter 5
124
Figure 5.6 a-d: Product yields over MoVSb and MoVTeNb oxides in propene oxidation.
Between M1-MoVSbOx and M1-MoVTeNbOx no significant differences in product yields of
all intermediates were observed. Yield-Conversion-Plots are nearly identical, but the activity
of MoVTeNbOx-M1 is much higher. In contrast catalysts containing M2-MoVSbOx phase
show higher selectivity to acetone and also to acetic acid, whereas the selectivity to acrylic
acid is reduced.
The kinetics of the first three reactions in the network were fitted using first order kinetics
(Equations 5.1 – 5.3). The contact times t were calculated using the quotient of catalyst mass
[g] to feed flow in [ml · s-1]. Therefore the unit of the rate constant is [ml · g-1 · s-1]. Acrolein
0%
4%
8%
12%
16%
20%
0% 5% 10% 15% 20% 25% 30%
Conversion Propene
Yie
ld a
cry
lic
ac
id
MoVSbO
MoVSoO_H2O2_1
MoVSbO_H2O2_2
MoVTeNbO
0%
1%
2%
3%
4%
5%
6%
0% 5% 10% 15% 20% 25% 30%
Conversion propene
Yie
ld a
ce
ton
e
MoVSbO
MoVSbO_H2O2_1
MoVSbO_H2O2_2
MoVTeNbO
0%
1%
2%
3%
4%
5%
6%
7%
0% 5% 10% 15% 20% 25% 30%
Conversion propene
Yie
ld C
OX
MoVSbO
MoVSbO_H2O2_1
MoVSbO_H2O2_2
MoVTeNbO
0%
1%
2%
3%
4%
5%
6%
0% 5% 10% 15% 20% 25% 30%
Conversion propene
Yie
ld a
ce
tic a
cid
MoVSbO
MoVSbO_H2O2_1
MoVSbO_H2O2_2
MoVTeNbO
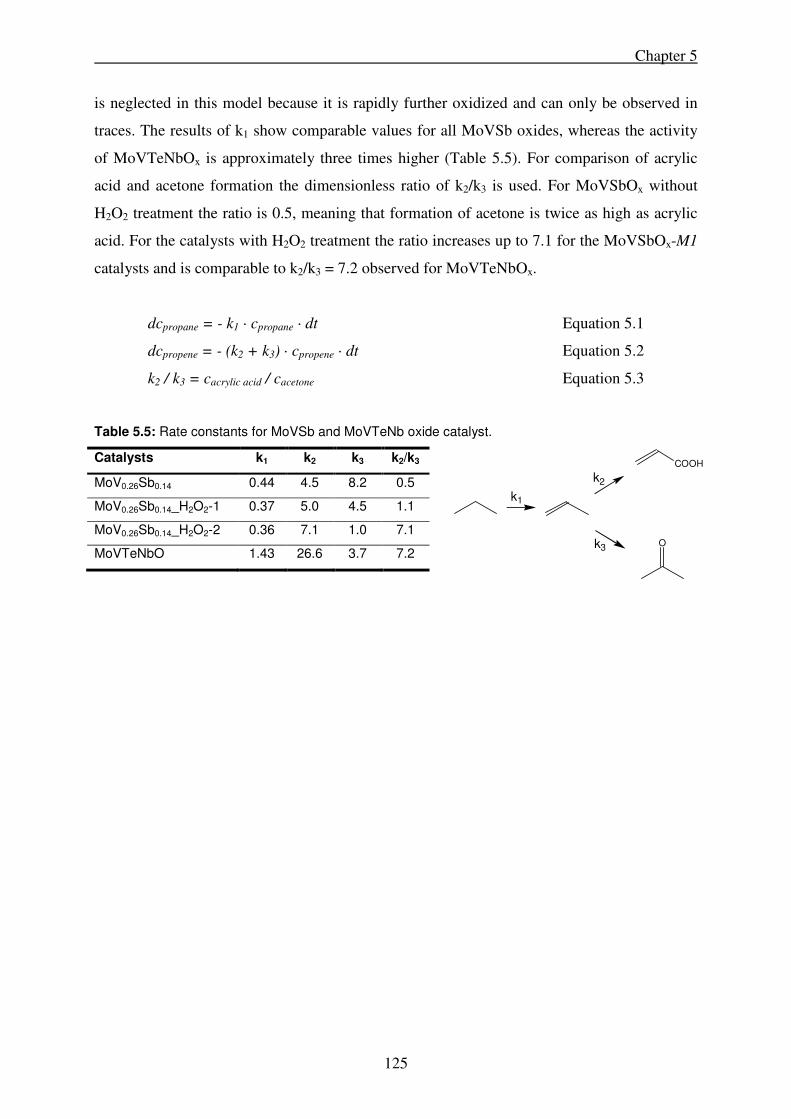
Chapter 5
125
is neglected in this model because it is rapidly further oxidized and can only be observed in
traces. The results of k1 show comparable values for all MoVSb oxides, whereas the activity
of MoVTeNbOx is approximately three times higher (Table 5.5). For comparison of acrylic
acid and acetone formation the dimensionless ratio of k2/k3 is used. For MoVSbOx without
H2O2 treatment the ratio is 0.5, meaning that formation of acetone is twice as high as acrylic
acid. For the catalysts with H2O2 treatment the ratio increases up to 7.1 for the MoVSbOx-M1
catalysts and is comparable to k2/k3 = 7.2 observed for MoVTeNbOx.
dcpropane = - k1 · cpropane · dt Equation 5.1
dcpropene = - (k2 + k3) · cpropene · dt Equation 5.2
k2 / k3 = cacrylic acid / cacetone Equation 5.3
Table 5.5: Rate constants for MoVSb and MoVTeNb oxide catalyst.
Catalysts k1 k2 k3 k2/k3
MoV0.26Sb0.14 0.44 4.5 8.2 0.5
MoV0.26Sb0.14_H2O2-1 0.37 5.0 4.5 1.1
MoV0.26Sb0.14_H2O2-2 0.36 7.1 1.0 7.1
MoVTeNbO 1.43 26.6 3.7 7.2
COOH
O
k1
k2
k3

Chapter 5
126
5.4. Discussion
As already reported in literature, the M1 and M2 phase of MoVTeNbOx can also be
synthesized, with Antimony replacing Tellurium in the structure.[17] The synthesis of mixtures
of M1 and M2 phase was successful with the described method, whereas the synthesis of
phase pure M1-MoVSbOx was not possible, like it can be done for MoVTeNbOx. Phase pure
M1-MoVSbOx can only be obtained by synthesis of a M1/M2 phase mixture and removal of
the M2 phase by hydrogen peroxide treatment.[27] Hydrogen peroxide treatment after
calcinations yields phase pure M1-MoVSbOx. The same treatment of the synthesis product
followed by calcination at 873 K results in a M1/M2 mixture, but with a decreased fraction of
M2 phase. This indicates that M1 phase is partially transformed into M2 phase during
calcination and therefore, a phase pure catalyst can only be obtained by H2O2 treatment after
calcination.
Only the catalyst consisting of pure MoVSbOx-M1 phase showed high selectivity to acrylic
acid, whereas the presence of MoVSbOx-M2 phase rapidly decreased selectivity. This
behavior is different to catalysts of the composition MoVTeNbOx. In this system large M2
fractions does not decrease the selectivity to acrylic acid and it was observed that mixtures of
M1 and M2 phase resulted in higher selectivity than M1 phase alone.[28] Two effects can
decrease the yield of acrylic acid according to the reaction network (Figure 5.1): (1)
Formation of acetone from propene instead acrolein/acrylic acid and (2) further oxidation of
acrylic acid to carbon oxides.
Using propene as feed the ratio of acrolein/acrylic acid and acetone formation can directly be
observed. The calculated rate constants and the ratio of acrylic acid to acetone formation are
shown in Table 5.5. Acrolein is neglected in the fit of the reaction network, due to its high
reactivity it will instantly be further oxidized and only traces can be observed. The rate
constants were calculate assuming a first order reaction with respect to the carbon containing
species as it is also reported in literature.[22]
Results with propene were used as feed confirmed the reaction network. Acrylic acid and
acetone were formed as primary products for all catalysts, however, the initial selectivities (at
0% conversion) varied for the different H2O2 treated catalysts. The reactivity in propane
activation (k1) is similar for all three catalysts, but for the subsequent oxidation of propene
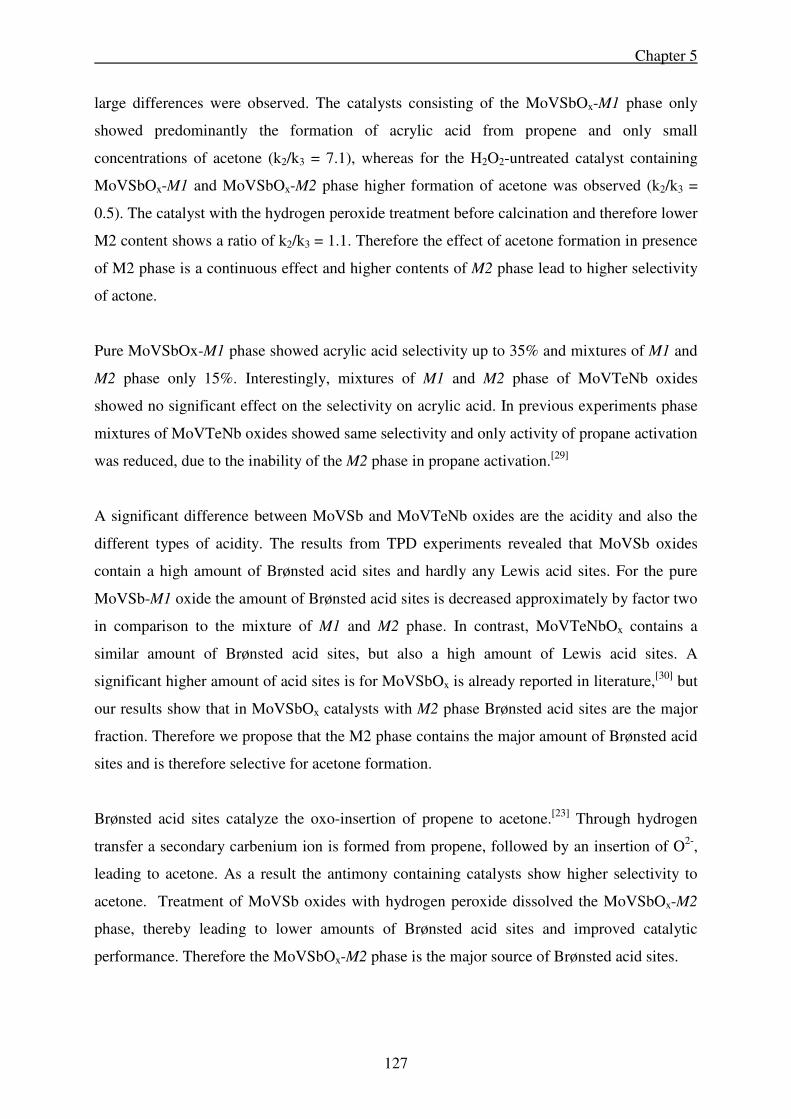
Chapter 5
127
large differences were observed. The catalysts consisting of the MoVSbOx-M1 phase only
showed predominantly the formation of acrylic acid from propene and only small
concentrations of acetone (k2/k3 = 7.1), whereas for the H2O2-untreated catalyst containing
MoVSbOx-M1 and MoVSbOx-M2 phase higher formation of acetone was observed (k2/k3 =
0.5). The catalyst with the hydrogen peroxide treatment before calcination and therefore lower
M2 content shows a ratio of k2/k3 = 1.1. Therefore the effect of acetone formation in presence
of M2 phase is a continuous effect and higher contents of M2 phase lead to higher selectivity
of actone.
Pure MoVSbOx-M1 phase showed acrylic acid selectivity up to 35% and mixtures of M1 and
M2 phase only 15%. Interestingly, mixtures of M1 and M2 phase of MoVTeNb oxides
showed no significant effect on the selectivity on acrylic acid. In previous experiments phase
mixtures of MoVTeNb oxides showed same selectivity and only activity of propane activation
was reduced, due to the inability of the M2 phase in propane activation.[29]
A significant difference between MoVSb and MoVTeNb oxides are the acidity and also the
different types of acidity. The results from TPD experiments revealed that MoVSb oxides
contain a high amount of Brønsted acid sites and hardly any Lewis acid sites. For the pure
MoVSb-M1 oxide the amount of Brønsted acid sites is decreased approximately by factor two
in comparison to the mixture of M1 and M2 phase. In contrast, MoVTeNbOx contains a
similar amount of Brønsted acid sites, but also a high amount of Lewis acid sites. A
significant higher amount of acid sites is for MoVSbOx is already reported in literature,[30] but
our results show that in MoVSbOx catalysts with M2 phase Brønsted acid sites are the major
fraction. Therefore we propose that the M2 phase contains the major amount of Brønsted acid
sites and is therefore selective for acetone formation.
Brønsted acid sites catalyze the oxo-insertion of propene to acetone.[23] Through hydrogen
transfer a secondary carbenium ion is formed from propene, followed by an insertion of O2-,
leading to acetone. As a result the antimony containing catalysts show higher selectivity to
acetone. Treatment of MoVSb oxides with hydrogen peroxide dissolved the MoVSbOx-M2
phase, thereby leading to lower amounts of Brønsted acid sites and improved catalytic
performance. Therefore the MoVSbOx-M2 phase is the major source of Brønsted acid sites.
Chapter 5
128
MoVTeNbOx-M1 phase showed a higher amount of Lewis acid sites and also a higher activity
than MoVSbOx catalysts, but this is not proof that the activity is correlated to the amount of
Lewis acid sites. If the amount of Lewis acid sites were be the key factor for propane activity,
the activity of the MoVSbOx catalysts must be worse, in comparison to the observed results,
due to their low amount of Lewis acid sites. Therefore it seems that Lewis acid sites are not
involved in the C-H activation. This is also in line with DFT calculations of the C-H
activation, showing vanadyl groups as the active center.

Chapter 5
129
5.5. Conclusions
For MoVSb oxide phases with similar structure to M1 and M2 phases of MoVTeNb oxides
can be synthesized, but pure M1 phase for MoVSb oxides were only observed when the M2
phase was dissolved in hydrogen peroxide as the last step of the synthesis. Calcination of a
H2O2 treated material lead to less M2 phase than in the untreated material, but no phase purity
was obtained. Therefore under calcination conditions (873 K in nitrogen) M1 phase
transforms partly to M2 phase.
The catalysts consisting of pure M1-MoVSbOx phase showed up to 37% selectivity to acrylic
acid, whereas for the mixture of M1 and M2 phase only 15% selectivity was observed.
Detailed kinetics of the catalysts showed that the ability for propane activation is for all
MoVSbOx catalysts similar, but the phase composition is important for the further oxidation
of propene. Mixtures of M1 and M2 phase from preferentially acetone form propene, whereas
for pure MoVSbOx-M1 phase acrylic acid is the major product.
Reason for the changed selectivities are the acid sites of the material. MoVSb oxides mainly
contain Brønsted acid sites that catalyze oxo-insertation to acetone, whereas the concentration
of acid sites is lower for pure MoVSbOx-M1 phase compared to the mixture of M1 and M2
phase. In comparison MoVTeNbOx-M1 phase showed a Brønsted acid site concentration
comparable to MoVSbOx-M1 phase, but also a higher amount of Lewis acid sites, which have
no function in the selective oxidation of propane.

Chapter 5
130
5.6. Acknowledgements
The authors thank Xaver Hecht and Florian Schuessler for the support with the BET and TPD
measurements and are grateful for the financial support from the European Union in the
framework of the Integrated Project Topcombi (NMP2-CT-2005-515792-2) and from the
Bayerisches Staatsministerium für Wissenschaft, Forschung und Kunst within the Nanocat
project. Discussions within the network of excellence IDECAT are also gratefully
acknowledged.

Chapter 5
131
5.7. References
[1] F. Cavani, F. Trifiro, Catalysis Today 1999, 51, 561. [2] B. Grzybowska-Swierkosz, Topics in Catalysis 2000, 11, 23. [3] J. M. L. Nieto, Topics in Catalysis 2006, 41, 3. [4] T. Ushikubo, H. Nakamura, Y. Koyasu, S. Wajiki, US Patent 5,380,933, 1995. [5] M. M. Lin, Applied Catalysis A 2001, 207, 1. [6] W. Nojiri, Y. Sakai, Y. Watanabe, Catalysis Reviews Science and Engineering 1995,
37, 145. [7] J. N. Al-Saeedi, V. K. Vasudevan, V. V. Guliants, Catalysis Communications 2003, 4,
537. [8] P. Botella, E. Garcia-Gonzalez, J. M. L. Nieto, J. M. Gonzalez-Calbet, Solid State
Sciences 2005, 7, 507. [9] P. DeSanto, D. J. Buttrey, R. K. Grasselli, C. G. Lugmair, A. F. Volpe, B. H. Toby, T.
Vogt, Zeitschrift Für Kristallographie 2004, 219, 152. [10] P. DeSanto, D. J. Buttrey, R. K. Grasselli, C. G. Lugmair, A. F. Volpe, B. H. Toby, T.
Vogt, Topics in Catalysis 2003, 23, 23. [11] H. Murayama, D. Vitry, W. Ueda, G. Fuchs, M. Anne, J. L. Dubois, Applied Catalysis
A 2007, 318, 137. [12] R. K. Grasselli, D. J. Buttrey, J. D. Burrington, A. Andersson, J. Holmberg, W. Ueda,
J. Kubo, C. G. Lugmair, A. F. Volpe, Topics in Catalysis 2006, 38, 7. [13] T. Katou, D. Vitry, W. Ueda, Catalysis Today 2004, 91-92, 237. [14] S. Bergh, P. J. Cong, B. Ehnebuske, S. H. Guan, A. Hagemeyer, H. Lin, Y. M. Liu, C.
G. Lugmair, H. W. Turner, A. F. Volpe, W. H. Weinberg, L. Woo, J. Zysk, Topics in
Catalysis 2003, 23, 65. [15] V. H. Rane, U. Rodemerck, M. Baerns, Journal of Molecular Catalysis A 2006, 245,
161. [16] W. Ueda, K. Oshihara, Applied Catalysis A 2000, 200, 135. [17] W. Ueda, K. Oshihara, D. Vitry, T. Hisano, Y. Kayashima, Catalysis Surveys from
Japan 2002, 6, 33. [18] J. M. M. Millet, M. Baca, A. Pigamo, D. Vitry, W. Ueda, J. L. Dubois, Applied
Catalysis A 2003, 244, 359. [19] E. Balcells, F. Borgmeier, I. Grisstede, H. G. Lintz, Catalysis Letters 2003, 87, 195. [20] E. Balcells, F. Borgmeier, I. Grisstede, H. G. Lintz, F. Rosowski, Applied Catalysis A
2004, 266, 211. [21] M. H. Lin, T. B. Desai, F. W. Kaiser, P. D. Klugherz, Catalysis Today 2000, 61, 223. [22] E. K. Novakova, J. C. Vedrine, E. G. Derouane, Journal of Catalysis 2002, 211, 226. [23] M. M. Bettahar, G. Costentin, L. Savary, J. C. Lavalley, Applied Catalysis A 1996,
145, 1. [24] T. Blasco, P. Botella, P. Concepcion, J. M. L. Nieto, A. Martinez-Arias, C. Prieto,
Journal of Catalysis 2004, 228, 362. [25] P. Botella, P. Concepcion, J. M. L. Nieto, B. Solsona, Catalysis Letters 2003, 89, 249. [26] W. Ueda, Y. Endo, N. Watanabe, Topics in Catalysis 2006, 38, 261. [27] M. Baca, J. M. M. Millet, Applied Catalysis A 2005, 279, 67. [28] M. Baca, M. Aouine, J. L. Dubois, J. M. M. Millet, Journal of Catalysis 2005, 233,
234. [29] F. N. Naraschewski, C. P. Kumar, A. Jentys, J. A. Lercher, Applied Catalysis A 2011,
391, 63.

Chapter 5
132
[30] M. Baca, A. Pigamo, J. L. Dubois, J. M. M. Millet, Catalysis Communications 2005, 6, 215.

Chapter 6
133
Chapter 6
Summary
Chapter 6
134
6.1. Summary
Selective oxidation of propane to acrylic acid is a promising route to convert an abundantly
available feedstock within a single step into a highly demanded chemical. Multi mixed oxides
of the composition MoVTeNbOx have given up to 48% yield of acrylic acid in this reaction,
but this is still not sufficient to be competitive with the conventional process of propene
oxidation. For this reason there is great interest in understanding the processes and
interactions within the catalytic reactions of the selective oxidation. This knowledge will help
to synthesize improved catalysts that enable the use of propane as feedstock instead of
propene.
The aim of this thesis was to gain detailed insights into the reaction processes and active
center properties of mixed metal oxide catalysts for selective oxidation of propane. In the first
chapter an introduction to acrylic acid production processes and selective oxidation over
MoVTeNbOx catalysts are given. Additionally, a review of C-H activation mechanisms over
oxide catalysts presents details of various catalytic systems. The C-H activation of alkanes is
the rate determining step in selective oxidation reactions and therefore of high importance for
the design of highly active and selective catalysts. Experimental methods and synthesis
procedures are described in detail in chapter 2.
In chapter 3, the phase formation and catalytic activity of MoVTeNb oxides with varying
concentration of vanadium, tellurium and niobium in the synthesis mixture was investigated.
Pure M1 phase catalysts were obtained with hydrothermal synthesis in the range of
MoV0.14-0.22Te0.1-0.2Nb0.1-0.2Ox. The materials were tested in selective oxidation of propane at
653 K in a plug flow reactor. Vanadium containing sites in the M1 phase are drastically more
active for propane activation than in other materials studied. The catalytic activity is directly
correlated to the fraction of vanadium in the overall material and in particular the M1 phase.
High concentrations of tellurium induce the formation of the M2 phase, decreasing the overall
activity of the catalysts. The intrinsic activity of the M1 phase is, however, independent of the
tellurium concentration. Although the presence of the M1 phase is not a stringent requirement
for the oxidative dehydrogenation of propane to propene, it is required to oxidize the
intermediately formed propene with high selectivity to acrylic acid. The active sites for
propane activation and propene oxidation are structurally coupled, because the ratio between

Chapter 6
135
the rates of the two reactions was always 1 : 25. Oxygen defect sites in mixed oxides seem to
enhance interaction with acrylic acid and lead to decarboxylation and total oxidation.
A detailed kinetic study on MoVTeNbOx M1-phase is described in chapter 4. The selective
oxidation of propane to acrylic acid is studied over a series of nearly pure M1-phase
MoVTeNbOx catalysts. Quantitative analysis of the reaction network shows that the ratio of
the rate constants for propane oxidative dehydrogenation to propene and for further oxidation
of propene is constant. The rates towards acrylic acid and acetone, however, vary subtly with
the concentration of vanadium and the location of its substitution. The reaction of acrylic acid
to acetic acid and carbon oxides, associated with accessible metal cations, contributes two
thirds towards the non-selective pathway. The other third is associated with acetone
formation. Vanadium is first substituted selectively at sites that are inactive for propane
activation. Depending on the selectivity of this substitution two groups of materials have been
identified, which show a distinctly different dependence on the concentration of vanadium.
Statistic distribution of vanadium in the M1 phase appears to be the most promising strategy
to improve the performance of MoVTeNbOx catalysts for a given vanadium concentration.
Catalysts of the type MoVSbOx and acid sites properties are discussed in chapter 5. Pure M1
phase of MoVSbOx was obtained by hydrogen peroxide treatment after calcination and
showed higher yields of acrylic acid than mixtures of MoVSbOx M1 / M2 phase. Reactions
with propene were used to determine the ratio between acrylic acid and acetone formation.
Mixtures of M1 and M2 phase form more acetone than the phase pure catalyst. TPD
techniques were used to determine the amount of Brønsted and Lewis acid sites. All MoVSb
oxides contain mainly Brønsted acid sites, but the amount of acid sites is lowest for the pure
M1 phase catalysts, proving that acetone formation is catalyzed by Brønsted acid sites, as it is
already reported in literature.
The presented results show that MoVTeNb and MoVSb oxides are interesting catalysts for the
selective oxidation of propane to acrylic acid. The improved understanding of the kinetic
network, the phase formation and metal distribution are important factors for new synthesis of
high performance catalysts. Especially the distribution of vanadium seems to be one of the
most important factors determining the achievable yield of acrylic acid. Further research in
this area is needed to understand, how the vanadium distribution can be adjusted to control the
Chapter 6
136
activity and selectivity of the material and finally to archive catalysts suitable for industrial
usage.
6.2. Zusammenfassung
Selektive Oxidation von Propan zu Acrylsäure ist ein vielversprechender Weg, um einen
leicht verfügbaren Rohstoff in einem einzigen Prozessschritt zu einem dringend benötigten
Zwischenprodukt der chemischen Industrie umzusetzen. Mischmetalloxide des Typs
MoVTeNbOx haben bereits bis zu 48% Ausbeute von Acrylsäure in dieser Reaktion gezeigt,
jedoch ist diese Ausbeute noch nicht ausreichend, um den konventionellen zwei-stufigen
Prozess der Propenoxidation, der aktuell in chemischen Industrie genutzt wird, zu ersetzen.
Ein tiefgehendes Verständnis der Vorgänge am Katalysator ist daher von größtem Interesse,
um mit diesem Wissen verbesserte Katalysatoren zu entwickeln und schließlich Propen durch
Propan in der Acrylsäureproduktion ersetzen zu können.
Das Ziel dieser Arbeit war es, ein detailliertes Verständnis über die Vorgänge an der
Katalysatoroberfläche und über die Natur der aktiven Zentren von Mischmetalloxiden für die
Selektivoxidation von Propan zu erlangen. Das erste Kapitel gibt eine Einführung in die
Verwendung und Produktion von Acrylsäure. Daneben wird eine Literaturübersicht über C-H
Aktivierungsmechanismen verschiedener heterogerner Katalysatoren gegeben. Die
Aktivierung der C-H Bindung ist in Alkanen bei Selektivoxidationen der
geschwindigkeitsbestimmende Schritt und daher von größter Bedeutung für die Entwicklung
von aktiven und zugleich selektiven Katalysatoren. Genaue Beschreibungen der
experimentallen Aufbauten und Synthesevorschriften sind in Kapitel 2 enthalten.
Chapter 6
137
In Kapitel 3 wurde die Phasenbildung und katalytische Aktivität von MoVTeNb Oxiden mit
variierendem Gehalt an Vanadium, Tellur und Niob untersucht. Reine M1 Phase wurde
mittels Hydrothermalsynthese innerhalb der Komposition MoV0.14-0.22Te0.1-0.2Nb0.1-0.2Ox
erzielt. Die Katalysatoren wurden in der Selektivoxidation von Propan bei 653 K im
Festbettreaktor getestet. Vanadium ist in der M1 Phase deutlich aktiver als in allen anderen
untersuchten Materialen. Die katalytische Aktivität war dabei direkt abhängig vom
Vanadiumgehalt. Hohe Konzentrationen an Tellur führten zur Bildung von M2 Phase,
wodurch die Gesamtaktivität der Katalysatoren verringert wurde. Die intrinsische Aktivität
der M1 Phase ist jedoch unabhängig vom Tellurgehalt. Obwohl die oxidative Dehydrierung
von Propan auch ohne M1 Phase beobachtet wird, ist diese zwingend erforderlich, um das
Zwischenprodukt Propen mit großer Selektivität zu Acrylsäure umzusetzen. Weiterhin zeigte
sich, dass die aktiven Zentren für die Propanaktivierung und die Propenoxidation strukturell
gekoppelt sein müssen, da die Raten beider Reaktionen immer im festen Verhältnis 1 : 25
standen.
Eine detaillierte Kinetik an MoVTeNbOx M1-Phase wird in Kapitel 4 vorgestellt. Die
Selektivoxidation von Propan zu Acrylsäure wurde dafür mit phasenreinen M1-MoVTeNbOx
untersucht. Die quantitative Analyse des Reaktionsnetzwerkes zeigte, dass das Verhältnis von
Propanaktivierung zu Propenoxidation konstant ist. Die Weiteroxidation von Acrylsäure zu
Essigsäure und COx ist verantwortlich für zwei Drittel der Nebenproduktbildung, während das
letzte Drittel durch Acetonbildung aus Propene verursacht wird. Die Verringerung der
Weiterreaktion von Acrylsäure ist daher ein wichtiger Ansatzpunkt für die Verbesserung der
Katalysatorleistung. Bei der Verteilung des Vanadiums im Katalysator zeigt sich, dass zuerst
die für Propanaktivierung inaktiven Zentren besetzt werden. Insgesamt wurden zwei
verschiedenen Materialien identifiziert, die sich durch verschiedene Vanadiumverteilungen im
Katalysator unterscheiden. Eine möglichst statistische Verteilung des Vanadiums scheint die
beste Möglichkeit zu sein, die Aktivität der M1-Phase zu erhöhen.
Katalysatoren des Typs MoVSbOx werden in Kapitel 5 diskutiert. Reine M1 Phase von
MoVSbOx konnte nur durch eine Behandlung der Katalysatoren mit Wasserstoffperoxid nach
dem Calcinieren gewonnen werden. Diese Katalysatoren zeigten deutlich größere Ausbeuten
von Acrylsäure als Mischungen aus MoVSbOx M1 und M2 Phase. Umsetzungen mit Propen
wurden angewendet, um das Verhältnis zwischen Acrylsäure und Aceton Bildung direkt
bestimmen zu können. Dabei zeigten M1 / M2 Mischungen eine deutlich höhere
Chapter 6
138
Acetonbildung als die reine M1 Phase. Die Anzahl Brønsted und Lewissäurezentren wurden
mittels TPD Techniken bestimmen. Alle MoVSbOx Materialen besaßen vor allem Brønsted
Säurezentren, wobei die Konzentration bei M1-MoVSbOx am niedrigsten war. Dies zeigt,
dass Brønsted Säurezentren die Acetonbildung katalysieren, was zu einer Verringerung der
Acrylsäureausbeute führt.
Die gezeigten Resultate belegen, dass MoVTeNb und MoVSb Oxide äußerst interessante
Katalysatoren für die Selektivoxidation von Propan zu Acrylsäure sind. Das Verständnis der
Kinetik, der Phasenbildung bei der Synthese und der Metallverteilung im Katalysator ist
wichtig für die Synthese von verbesserten Materialien. Besonders die Vanadiumverteilung im
Katalysator scheint ein entscheidender Faktor für die Aktivität und damit auch für die
erzielbare Ausbeute an Acrylsäure zu sein. Weitere Forschung ist notwendig, um zu
verstehen, wie die Vanadiumverteilung während der Synthese beeinflusst werden kann, um
auf diese Weise die Aktivität und Selektivität der Materialen einstellen zu können und
schließlich zu kommerziell nutzbaren Katalysator zu gelangen.
Curriculum vitae
139
Curriculum vitae
Frederik Nikolaus Naraschewski was born on August, 27th of 1979 in Wilhelmshaven,
Germany. He attended the Gymnasium am Mühlenweg in Wilhemshaven from 1992 to 1999,
from which he graduated with the general qualification for university entrance (Abitur). After
his military service in the German navy he started studying chemistry at the Technische
Universität München in 2000. Additionally he began to study economics at the
Fernuniversität in Hagen in 2003. During his studies he was working at Degussa AG in
Shakopee, USA and Bain & Company Germany, Inc. in München, Germany.
He wrote his Diploma thesis at the chair of inorganic chemistry of Prof. Hermann in the group
of Dr. Eppinger entitled „NMR-basierte Bestimmung von Enantiomerenüberschüssen in der
asymmetrischen Katalyse am Beispiel von NHC-Komplexen“. After his graduation as
„Diplom-Chemiker“ in 2005 he joined Prof. Lercher’s group (chair of technical chemistry II)
at the Technische Universität München and started to work as a PhD student within the
doctorate program „NanoCat: Nanodesign of High Performance Catalysts“ of the Elite
Network of Bavaria. His work was focused on the selective oxidation of propane to acrylic
acid over mixed metal oxides.
In 2008 he wrote his Diploma thesis in economics at the chair of Prof. Rödder with the title
„IDA* - Vorteile der iterativen Tiefensuche“ and graduated as „Diplom-Kaufmann“. In 2009
he started a position as “process unit engineer” at centrotherm SiTec GmbH in Burghausen.

Curriculum vitae
140

List of Publications
141
List of Publications
Refereed Journals / Book articles:
1. D. Hartmann, F. N. Naraschewski, A. Jentys, J. A. Lercher; Synthesis and acid properties
of MoVSb and MoVTeNb oxides for the selective oxidation of ethane and propane, in
preparation.
2. F. N. Naraschewski, A. Jentys, J. A. Lercher; On the role of the vanadium distribution in
MoVTeNbOx mixed oxides for the selective catalytic oxidation of propane, Topics in
Catalysis, 2011, DOI: 10.1007/s11244-011-9686-x.
3. J. A. Lercher, F. N. Naraschewski; C-H activation over solid oxide catalysts in
Nanostructured Catalysts: Selective Oxidation Reactions, RSC Publishing, submitted.
4. F. N. Naraschewski, C. P. Kumar, A. Jentys, J. A. Lercher; Phase formation and selective
oxidation of propane over MoVTeNbOx catalysts with varying compositions, Applied
Catalysis A, 2011, 391, 63-69.
5. T. Reiner, F. N. Naraschewski, J. Eppinger; 31P NMR assays for rapid determination of
enantiomeric excess in catalytic hydrosilylations and transfer hydrogenations,
Tetrohedron: Asymmetry, 2009, 20, 362-367.
List of Publications
142
Presentations, Poster:
1. F. N. Naraschewski, A. Jentys, J. A. Lercher; Factors limiting acrylic acid yield in the
selective oxidation of propane over MoVTeNb oxides (Talk), 42. Jahrestreffen Deutscher
Katalytiker, 2009, Weimar, Germany.
2. F. N. Naraschewski, D. Hartmann, A. Jentys, J. A. Lercher; Catalytic properties and acid
site concentration of MoVSb oxide catalysts (Poster), 42. Jahrestreffen Deutscher
Katalytiker, 2009, Weimar, Germany.
3. F. N. Naraschewski, A. Jentys, J. A. Lercher; Influence of tellurium on the oxidation of
propane to acrylic acid (Poster), 41. Jahrestreffen Deutscher Katalytiker, 2008, Weimar,
Germany.
4. A. Jentys, F. N. Naraschewski, C. P. Kumar, J. A. Lercher; Direct oxidation routes from
propane to acrylic acid (Talk), 1st International Symposium on Molecular Oxygen in
Catalysis, 2007, Stuttgart, Germany.
5. F. N. Naraschewski, A. Jentys, C. P. Kumar, J. A. Lercher; Direct oxidation routes from
propane to acrylic acid (Talk), EuroCombiCat, 2007, Bari, Italy.
6. F. N. Naraschewski, C. P. Kumar, A. Jentys, J. A. Lercher; Direct routes from propane to
acrylic acid (Poster), 40. Jahrestreffen Deutscher Katalytiker, 2007, Weimar, Germany.