Embed Size (px)
Citation preview

Techno-Economic Analysis and Comparison of
CSP with Hybrid PV-Battery Power Plants
Results from the THERMVOLT Study
Manfred Engelhard1, Stephan Hurler1, Adrian Weigand1, Stefano Giuliano2, Michael Puppe2, Heiko Schenk2, Tobias Hirsch2, Massimo
Moser3, Tobias Fichter3, Jürgen Kern3, Franz Trieb3, Dietmar Brakemeier4, Johannes Kretschmann4, Ursula Haller4, Roland Klingler4,
Christian Breyer5 and Svetlana Afanasyeva5
1 M+W Group GmbH
2 German Aerospace Center, Institute of Solar Research 3 German Aerospace Center, Institute of Engineering Thermodynamic 4 Fichtner GmbH 5 Lappeenranta University of Technology
giz Webinar May 16th 2017
“Dispatchability on RE:
Comparing CSP with PV Battery”

© M+W Group 2 2016_10_11 THERMVOLT_Results - SolarPACES M. Engelhard.pptx / 11.10.2016
Semiconductor Facility Pharmaceutical Campus
M+W Group - Global Leading Engineering and Construction Company
High Tech Research Center
6,000+ dedicated
employees
1912 established
in Germany
€ 3.0 bn order intake
and sales
Leading player with
global reach
Anderes
Bild?
Mehr High-
tech
Engineering and Construction of Technology
Facilities
High Tech Research Center Energy Plant
© M+W Group 3 2016_10_11 THERMVOLT_Results - SolarPACES M. Engelhard.pptx / 11.10.2016
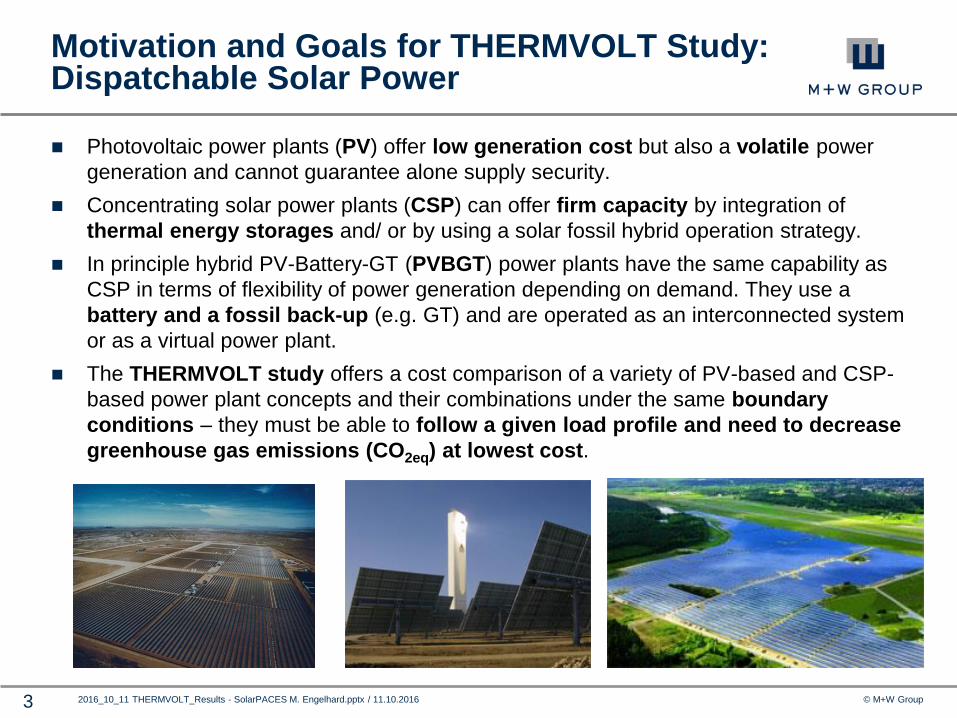
Motivation and Goals for THERMVOLT Study: Dispatchable Solar Power Photovoltaic power plants (PV) offer low generation cost but also a volatile power
generation and cannot guarantee alone supply security.
Concentrating solar power plants (CSP) can offer firm capacity by integration of
thermal energy storages and/ or by using a solar fossil hybrid operation strategy.
In principle hybrid PV-Battery-GT (PVBGT) power plants have the same capability as
CSP in terms of flexibility of power generation depending on demand. They use a
battery and a fossil back-up (e.g. GT) and are operated as an interconnected system
or as a virtual power plant.
The THERMVOLT study offers a cost comparison of a variety of PV-based and CSP-
based power plant concepts and their combinations under the same boundary
conditions – they must be able to follow a given load profile and need to decrease
greenhouse gas emissions (CO2eq) at lowest cost.

© M+W Group 4 2016_10_11 THERMVOLT_Results - SolarPACES M. Engelhard.pptx / 11.10.2016
THERMVOLT – Projekt Data and Partners
Projekt data
Project coordiantion: German Aerospace Centre (DLR)
Project start: 11/2014
Project duration: 20 Month
Budget total: : ~0,7 Mio. Euro
Co-funded by German Federal Ministry for Economic Affairs
and Energy, BMWi (contract no. 0325760).
Project partner industry
M+W Germany GmbH
Fichtner GmbH
Research
German Aerospace Center
Institute of Solar Research
Institute of Engineering Thermodynamic
Lappeenranta University of Technology (subcontracted by DLR)
Gefördert durch:
aufgrund eines Beschlusses
des deutschen Bundestages
© M+W Group 5 2016_10_11 THERMVOLT_Results - SolarPACES M. Engelhard.pptx / 11.10.2016
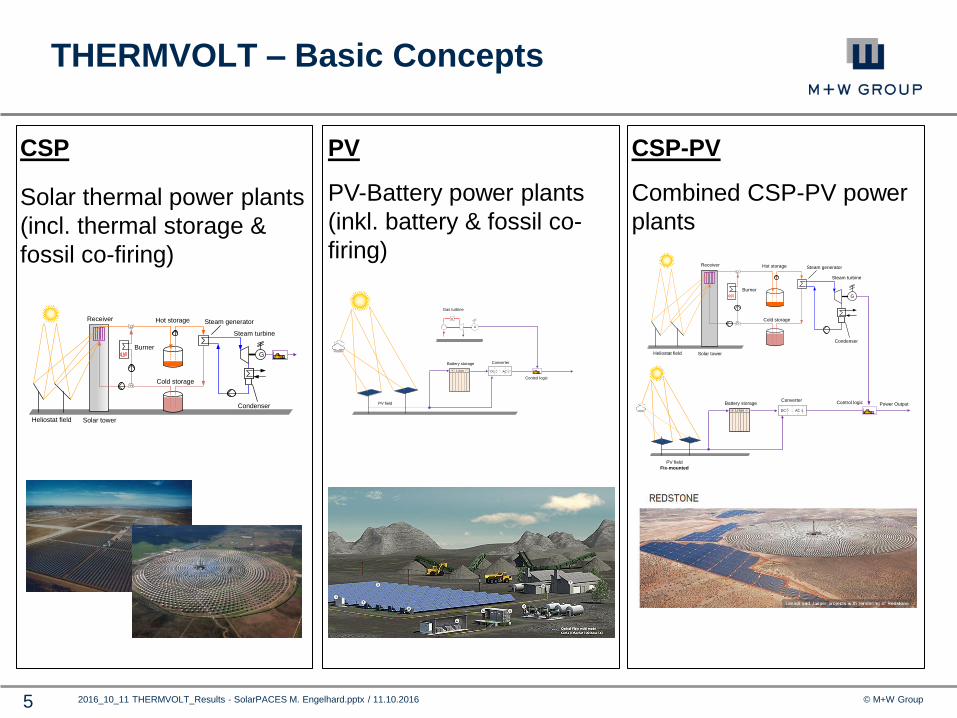
THERMVOLT – Basic Concepts
CSP
Solar thermal power plants
(incl. thermal storage &
fossil co-firing)
PV
PV-Battery power plants
(inkl. battery & fossil co-
firing)
CSP-PV
Combined CSP-PV power
plants
Converter
PV field
Battery storage
Li-Ion+ -
Control logic
Gas turbine
G
DC AC
Solar tower
Receiver Hot storage
G
Steam generator
Condenser
Heliostat field
Steam turbine
Cold storage
BurnerSolar tower
Receiver Hot storage
G
Steam generator
Condenser
Heliostat field
Steam turbine
Cold storage
Burner
Converter
PV field
Fix-mounted
Control logic
DC AC
Power OutputBattery storage
Li-Ion+ -

© M+W Group 6 2016_10_11 THERMVOLT_Results - SolarPACES M. Engelhard.pptx / 11.10.2016
THERMVOLT – Common Boundary Conditions
Location: Morocco, Saudi Arabia
Meteorological data
Plant size: 100 MWe
Storage capacity: optimised
Economic modell (LCOE)
Investment cost (CAPEX)
Operating cost (OPEX)
El. generation defined
by load profiles:
1. Baseload
2. Typical day
3. Solar only
Solar field design: optimised
RE-share and permitted CO2 emissions
Fuel cost
2015, 2020, 2030
Validation of annual yield models

© M+W Group 7 2016_10_11 THERMVOLT_Results - SolarPACES M. Engelhard.pptx / 11.10.2016
Sites
2 sites:
Morocco
Kingdom Saudi
Arabia
Location overview
Location Ouarzazate, Morocco Taiba, KSA
Latitude °N 31.1 24.3
Altitude m 1150 24.33
Annual DNI kWh/m² 2373 2408
Annual GHI kWh/m² 2118 2338
Ambient temperature @DP °C 30 47
Fossil fuel Diesel Natural gas
© M+W Group 8 2016_10_11 THERMVOLT_Results - SolarPACES M. Engelhard.pptx / 11.10.2016
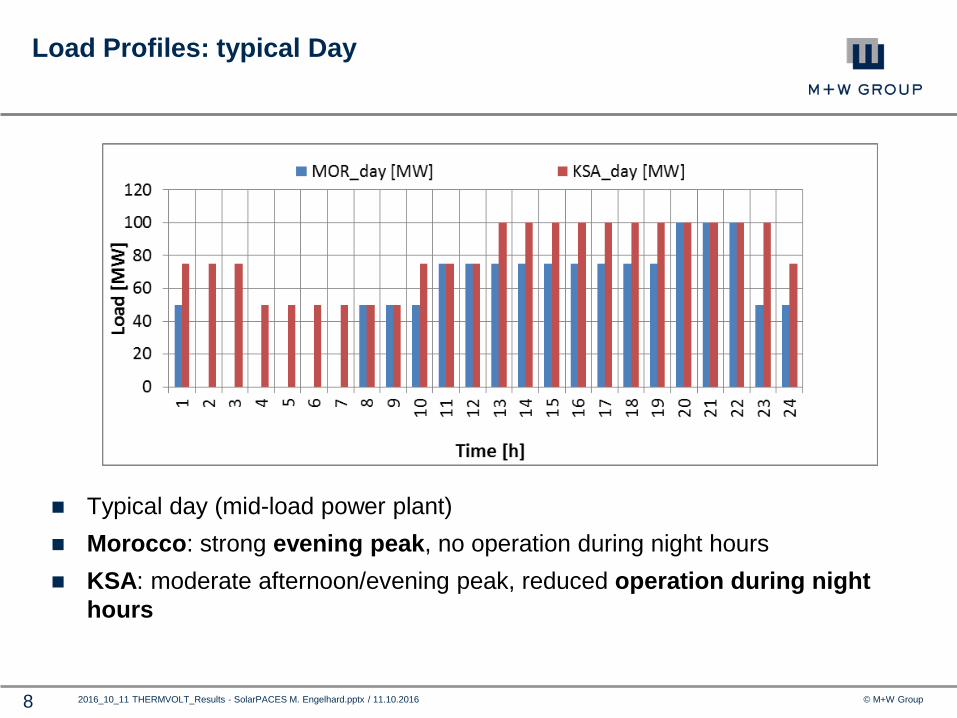
Load Profiles: typical Day
Typical day (mid-load power plant)
Morocco: strong evening peak, no operation during night hours
KSA: moderate afternoon/evening peak, reduced operation during night
hours
© M+W Group 9 2016_10_11 THERMVOLT_Results - SolarPACES M. Engelhard.pptx / 11.10.2016
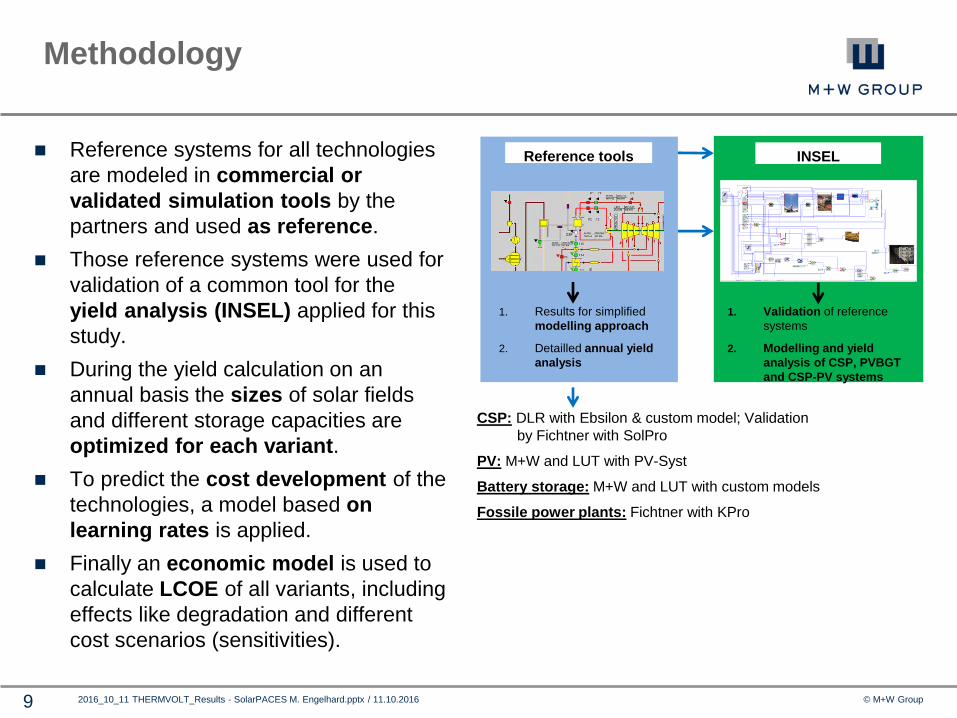
Methodology
Reference systems for all technologies
are modeled in commercial or
validated simulation tools by the
partners and used as reference.
Those reference systems were used for
validation of a common tool for the
yield analysis (INSEL) applied for this
study.
During the yield calculation on an
annual basis the sizes of solar fields
and different storage capacities are
optimized for each variant.
To predict the cost development of the
technologies, a model based on
learning rates is applied.
Finally an economic model is used to
calculate LCOE of all variants, including
effects like degradation and different
cost scenarios (sensitivities).
1. Validation of reference
systems
2. Modelling and yield
analysis of CSP, PVBGT
and CSP-PV systems
INSEL
1. Results for simplified
modelling approach
2. Detailled annual yield
analysis
Reference tools
CSP: DLR with Ebsilon & custom model; Validation
by Fichtner with SolPro
PV: M+W and LUT with PV-Syst
Battery storage: M+W and LUT with custom models
Fossile power plants: Fichtner with KPro
© M+W Group 10 2016_10_11 THERMVOLT_Results - SolarPACES M. Engelhard.pptx / 11.10.2016
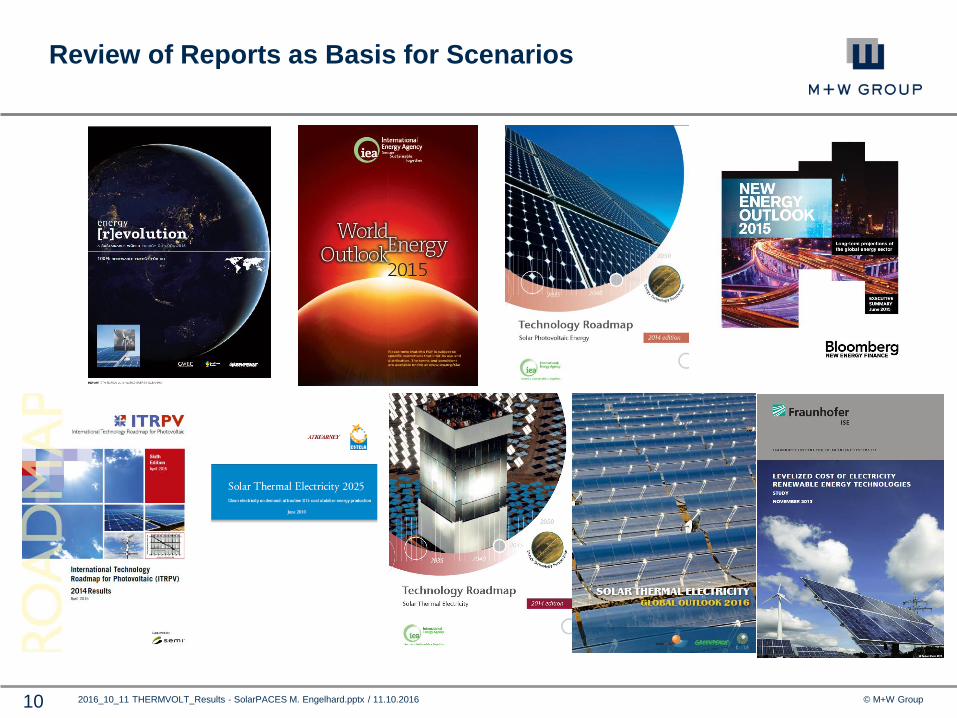
Review of Reports as Basis for Scenarios
© M+W Group 11 2016_10_11 THERMVOLT_Results - SolarPACES M. Engelhard.pptx / 11.10.2016
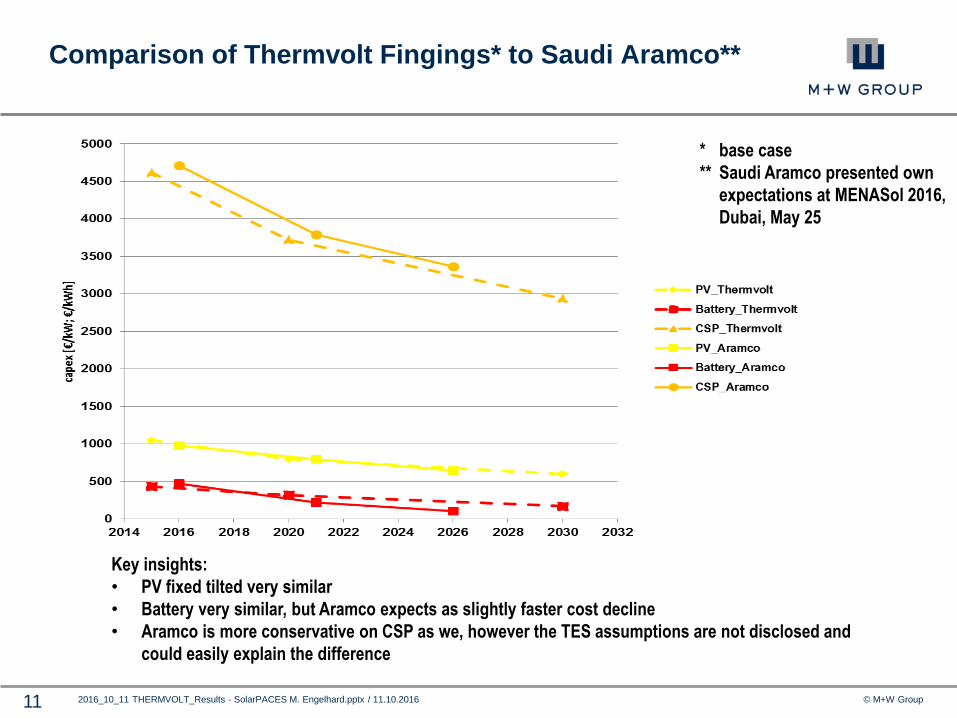
Comparison of Thermvolt Fingings* to Saudi Aramco**
Key insights:
• PV fixed tilted very similar
• Battery very similar, but Aramco expects as slightly faster cost decline
• Aramco is more conservative on CSP as we, however the TES assumptions are not disclosed and
could easily explain the difference
* base case
** Saudi Aramco presented own
expectations at MENASol 2016,
Dubai, May 25

© M+W Group 12 2016_10_11 THERMVOLT_Results - SolarPACES M. Engelhard.pptx / 11.10.2016
Cost Assumptions [1]
Experience curve approach has been chosen for capex projections
Literature review provided the basis for the THERMVOLT scenario assumptions
Three scenarios have been developed and capex numbers for all relevant components have been
derived on the assumed future capacities, market growth and learning rates of CSP, PV and
batteries (and major CSP components)
[1] Breyer C. et al (2016). Assessment of Mid-Term Growth Assumptions and Learning Rates for comparative Studies of
CSP and Hybrid PV-Battery Power Plants, SolarPACES Conference 2016 (to be published)
Plants Learning
Rate
Range
Doublings
2015-2020
Doublings
2020-2030
Capex 2015
[€/kW; €/kWh]
Capex 2020
[€/kW; €/kWh]
Capex 2030
[€/kW; €/kWh]
Cum.
Capacity
2020 [GWe]
Cum.
Capacity
2030 [GWe]
base case
CSP, Tower 10-12% 1.62 2.37 5431 3645 – 3722 - 3798 2826 – 2939 - 3052 15.4 79.5
CSP, Trough 10-12% 1.62 2.37 4618 4222 – 4318 - 4415 3285 – 3425 – 3565
PV plant 15-20% 1.35 1.71 1250 924 - 964 - 1003 631 – 693 – 760 598 1958
Battery Plant 15-20% 1.61 3.22 200;400 147; 294 +/- 5% 80;159 +/- 8% CAGR 25% CAGR 25%
low growth
CSP, Tower 10-12% 0.85 1.64 - 4031 – 4081 - 4131 3298 – 3393 – 3489 9.0 28
CSP, Trough 10-12% 0.85 1.64 - 4624 – 4692 - 4760 3836 – 3954 – 4073
PV plant 15-20% 0.76 0.87 - 1054 – 1079 - 1104 867 - 913 – 958 397 728
Battery Plant 15-20% 0.69 1.38 - 175; 350+/- 5% 135;269 +/- 8% CAGR 10% CAGR 10%
high growth
CSP, Tower 10-12% 2.12 2.59 - 3435 – 3523 - 3612 2643 – 2760 – 2876 21.8 131
CSP, Trough 10-12% 2.12 2.59 - 3990 – 4101 - 4211 3065 – 3211 - 3357
PV plant 15-20% 1.85 2.14 - 827 – 876 - 925 513 – 583 – 653 844 3725
Battery Plant 15-20% 2.43 4.85 - 126; 251+/- 5% 50;101 +/- 8% CAGR 40% CAGR 40%
[Overview of learning rates and growth expectations [1]. CSP: for a 100 MW power plant, SM 2.4 and TES of 10 hours. PV: single axis tracking.
Battery: energy to power ratio variable. The capex are given in a range of minimum – average – maximum values based on the learning rate range.
Cum. Capacity 2015 PV: 230 GWe Cum. Capacity 2015 CSP: 5 GWe

© M+W Group 13 2016_10_11 THERMVOLT_Results - SolarPACES M. Engelhard.pptx / 11.10.2016
Results – Morocco
Cost vs. CO2 emissions in 2015 and 2030 for Baseload and Typical Day load curve in Morocco.
The solar only data point („_so“) does not fulfill the load curve and serves as a reference point.
© M+W Group 14 2016_10_11 THERMVOLT_Results - SolarPACES M. Engelhard.pptx / 11.10.2016
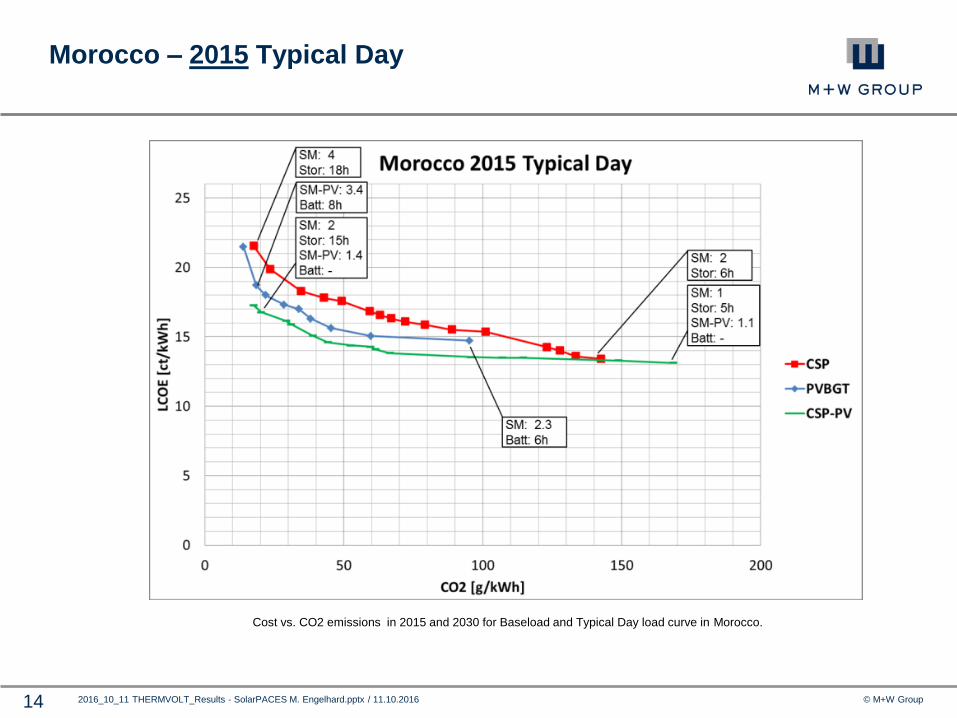
Morocco – 2015 Typical Day
Cost vs. CO2 emissions in 2015 and 2030 for Baseload and Typical Day load curve in Morocco.

© M+W Group 15 2016_10_11 THERMVOLT_Results - SolarPACES M. Engelhard.pptx / 11.10.2016
Morocco – 2030 Typical Day
Cost vs. CO2 emissions in 2015 and 2030 for Baseload and Typical Day load curve in Morocco.
© M+W Group 16 2016_10_11 THERMVOLT_Results - SolarPACES M. Engelhard.pptx / 11.10.2016
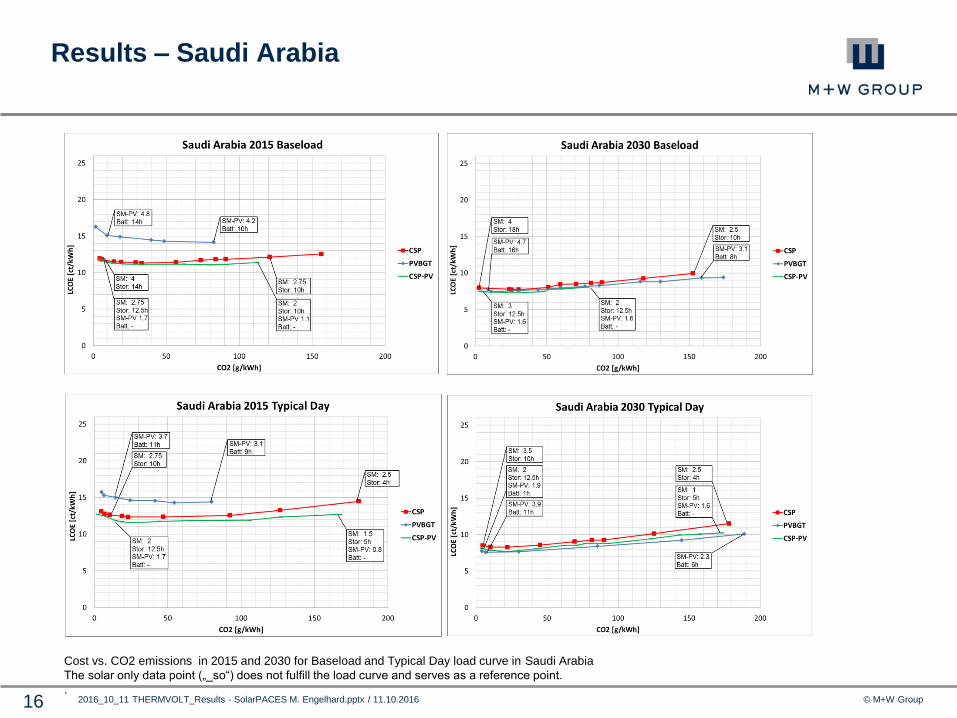
Results – Saudi Arabia
Cost vs. CO2 emissions in 2015 and 2030 for Baseload and Typical Day load curve in Saudi Arabia
The solar only data point („_so“) does not fulfill the load curve and serves as a reference point.
.
© M+W Group 17 2016_10_11 THERMVOLT_Results - SolarPACES M. Engelhard.pptx / 11.10.2016
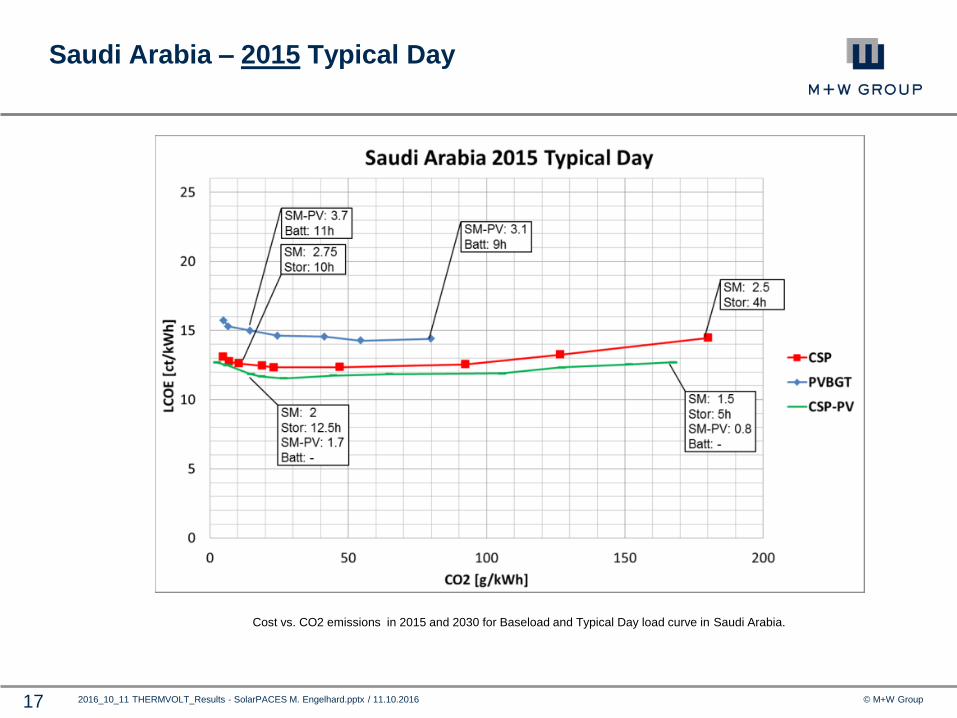
Saudi Arabia – 2015 Typical Day
Cost vs. CO2 emissions in 2015 and 2030 for Baseload and Typical Day load curve in Saudi Arabia.

© M+W Group 18 2016_10_11 THERMVOLT_Results - SolarPACES M. Engelhard.pptx / 11.10.2016
Saudi Arabia – 2030 Typical Day
Cost vs. CO2 emissions in 2015 and 2030 for Baseload and Typical Day load curve in Saudi Arabia.
© M+W Group 19 2016_10_11 THERMVOLT_Results - SolarPACES M. Engelhard.pptx / 11.10.2016
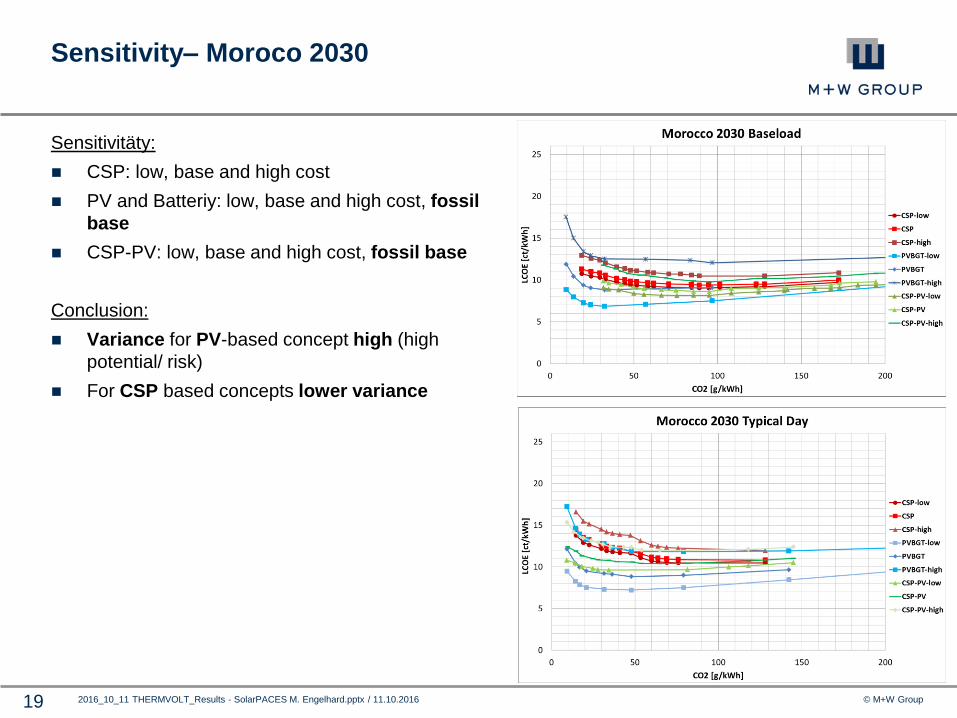
Sensitivity– Moroco 2030
Sensitivitäty:
CSP: low, base and high cost
PV and Batteriy: low, base and high cost, fossil
base
CSP-PV: low, base and high cost, fossil base
Conclusion:
Variance for PV-based concept high (high
potential/ risk)
For CSP based concepts lower variance
© M+W Group 20 2016_10_11 THERMVOLT_Results - SolarPACES M. Engelhard.pptx / 11.10.2016
Conclusions
All 3 base concepts (CSP, Hybrid PV-Battery and their combinations) can contribute
to the supply certainty to the grid depending on the demand curve.
With the used boundary conditions the analysis showed that a combination of CSP
and PV plant is in many cases the most cost effective solution.
(direct PV power delivery during the day, CSP delivers preferred at evening/ night)
While in 2015 the PV-Battery systems are more expensive due to high storage
cost, they can become competitive in 2030. This is strongly depending on the load
conditions and the required need to decrease greenhouse gas emissions (CO2eq).
For load profiles requiring load at night (e.g. KSA) in 2030 the LCOE for all concepts
is nearly the same. For load profiles requiring most of the load during the day (e.g.
Morocco) hybrid PV-Battery power plants can somewhat lower the LCOE.
For all technologies in 2030 the lowest LCOE are achieved with configurations
with very low specific CO2 emissions!
It is important to keep in mind:
the boundary conditions of the analysis – a fixed load curve that has to be
fulfilled at any time.
The assumed market growth of the technologies: CSP and Battery will only
reduce their cost if the assumed capacity is installed by 2030.
© M+W Group 21 2016_10_11 THERMVOLT_Results - SolarPACES M. Engelhard.pptx / 11.10.2016
Quo vadis solar power?
Thank you for your attention!
The authors would like to thank the
German Federal Ministry for Economic
Affairs and Energy for the financial support
of the project THERMVOLT (contract no.
0325760).

© M+W Group 22 2016_10_11 THERMVOLT_Results - SolarPACES M. Engelhard.pptx / 11.10.2016
Contact
Thank You!
Manfred Engelhard
Technology Manager Energy
M+W Central Europe GmbH