Embed Size (px)
Citation preview
DANISH RESEARCH UNIT FOR I NDUSTRIAL DYNAMICS
DRUID Working Paper No 00-6
Technological diffusion patternsand their effects on industrial dynamics
By
Machiel van Dijk and Önder NomalerMarch 2000
CORE Metadata, citation and similar papers at core.ac.uk
Provided by Research Papers in Economics
1
Technological diffusion patterns and their effects on industrialdynamics
Machiel van Dijk†
Önder Nomaler†
Maastricht Economic Research Instituteon Innovation and Technology
P.O. Box 6166200 MD Maastricht
NetherlandsTel: ++ 31 43 388 3870
[email protected]@merit.unimaas.nl
Abstract
By focussing on cumulativeness and spillover effects of technological knowledge,theories on technological regimes are predominantly supply side oriented inexplaining industrial dynamics. This paper introduces demand side considerationsas an additional explanation for industrial dynamics. Given variations in consumerpreferences over quality and network sizes of technologies, and different degreesof compatibility between succeeding technologies, we investigate how theresulting differences in the timing and frequency of new technology adoptionseffect the industrial dynamics. The simulation results of the model indeed suggesta relationship between different patterns of new technology adoptions and thedynamics of the firm population.
Keywords: tecnological knowledge, demand, consumer preferences, industrialdynamics
JEL: O31, O14, C15ISBN(87-7873-090-2)
† We would like to thank Nicolas Jonard, Keld Laursen, Paolo Saviotti, Keith
Smith, Ed Steinmueller and Bart Verspagen for their useful comments andsuggestions.
2
1. Introduction
By focussing on cumulativeness and spillover effects of technological knowledge,theories on technological regimes are predominantly supply side oriented inexplaining industrial dynamics. For instance, low cumulativeness and highspillover conditions facilitate the entry process and impede the persistencemonopolistic advantages (Breschi et al., 1996; Malerba and Orsenigo, 1996). Ifsuch conditions apply to the technological regime of an industry, these theoriespredict a highly dynamic firm population with a low level of concentration.Hence, causality runs from properties of the technological knowledge base ofsuppliers to the demographic characteristics of the population they constitute. Thispaper aims to introduce demand side considerations as a complementaryexplanation for industrial dynamics.
As in Shy (1996), the degree of substitutability between the quality and thenetwork size of a technology and the degree of compatibility of succeedingtechnologies are the key determinants of the simulation model presented here.However, Shy (1996) mainly limits his focus to the demand side, as heinvestigates how varying consumer preferences over technology advance andnetwork size effects the timing and frequency of new technology adoption. Ourfocus is on the relation between the demand side and the supply side. Givenvariations in consumer preferences over quality and network sizes, and differentdegrees of compatibility between succeeding technologies, we investigate how theresulting differences in the timing and frequency of new technology adoptions byconsumers effect the dynamics of the population of supplying firms. Furthermore,we will investigate whether these effects are different under various technologicalregimes.
The structure of the paper is as follows. In the next section the conceptual basisfor the model will be explained, and special attention will be paid to how wemodelled firm growth. Section three formally presents the simulation model, ofwhich the results will be analysed in section four. Section five focuses on howthese results are effected when different technological regimes are considered.Section six concludes this paper.
2. The conceptual basis
As mentioned in the introduction, the primary aim of the present model is toinvestigate how differences in the diffusion of new technologies affect thedynamics of the population of firms in an industry. Shy (1996) explains thedifferences in timing and frequency by differences in consumer preferences. In hismodel, the generation of entering consumers chooses whether to purchase acertain product based on an old technology already used by an older generation ofconsumers or whether to purchase the product based on the new technology with ahigher quality. The young generation chooses the new technology if the utility
3
from the high quality technology combined with the size of the networkassociated with the new technology overtakes the utility from the old technologywith its associated network size. The size of the network of the new technology isthe sum the population size of the young generation and a certain percentage ofthe old generation of users. This percentage is determined by the degree ofcompatibility between the old and new technology. Hence, the higher thecompatibility, the larger the network size associated with the new technology willbe. Shy (1996) then shows that a decrease in the degree of compatibility betweennew and old technologies will increase the duration of each technology. Further,by varying the degree of substitution between the quality and the network size of atechnology, he shows that the duration of each adopted technology is lower andthe frequency of technology adoptions is higher the more consumers value qualityand network size as substitutes rather than complements.
Hence, his focus on consumer preferences helps us understand “…why technologyis replaced more often in some industries than in others…” (Shy, 1996, p.786). Healso asserts that his model is general enough to capture a variety of marketstructures. That is, he shows that both a persistent monopoly, as well as a morecompetitive market structure with the entry of a new firm whenever a newtechnology becomes available1, is consistent with his model. Our aim is to furtherelaborate on the evolution of the supply side of industries experiencing repeatedadoption of new technologies. Although previous models on technological changeand industry evolution have investigated issues such as the evolution of the firmpopulation2, or the diffusion process of (subsequent) innovations3, they have notexplicitly linked these two processes. The model presented in this paper attemptsto fill this hiatus.
A secondary aim, or perhaps more a constraint, is that the model shouldpreferably be consistent with the stylised facts of industrial organisation. Amongthese “facts” are: (i) persistence of market turbulence due to entry and exit, (ii )high infant mortality, negatively correlated with firm age, (iii ) growth rates offirms that fall with age and with size, (iv) persistence of asymmetricperformances, and (v) skewed and stable size distributions.
Besides these stylised facts derived from the empirical literature, two interestingobservations from the Dutch manufacturing sector will be captured as well by themodel. The first one is that relative labour productivity or profitability cannotexplain the growth or decline of firms. There is no evidence that growing firmsare more productive (or profitable) than contracting firms. Hence, there seems tobe no evidence for the existence of some type of replicator dynamics. However,the second observation is that relative productivity seems to be important in 1 Shy (1996) assumes that the new firm is endowed with a one period patent right on the newtechnology, allowing it to (temporarily) charge a monopoly price.2 See, e.g., Nelson and Winter (1982), Winter (1984), and Dosi et al. (1995).3 See, e.g., Iwai (1984a, 1984b), Silverberg and Lehnert (1993), and Silverberg and Verspagen(1994a, 1994b).

4
explaining the probability of survival: low relative productivity practically meansexit, higher productivity significantly reduces the probability of exiting. Still, eventhose firms with higher than average productivity levels have a fairly highprobability of suddenly experiencing falling productivity, often followed by theirexit from the industry.
In order to include these last two issues, we will model firm growth as a randomprocess and therefore abstain from any type of replicator dynamics. Hence, thepresent model will not attempt to predict the growth process of a firm on the basisof past or current performance levels. Of course, the relative performance of afirm will matter in the model, but only in determining the probability of survival.Therefore, in this model it is really a matter of survival of the fittest, as opposed toexpansion of the fittest. We have several reasons to exclude relative performanceas an explanatory variable of firm growth.
The growth or decline of a firm is ultimately a managerial decision: themanagement decides on how much to invest and how many workers to hire or layoff. Many factors may influence the final outcome of this decision. Pastperformance is certainly one of them. Besides creating the necessary funds, highprofits in the past are a signal of a firm’s competitiveness, creating confidenceamong the management and the potential investors. However, high profits mayalso indicate a lag in mobilising effective competition, reflecting a windfall gainfrom being properly positioned to take advantage of a change in level or characterof demand. In this last case the high profits may have resulted from mere chance,and are not likely to be as persistent as profits resulting from having been superiorto competitors.
But probably more important than a firm’s past competitiveness in the growthdecision are the expectations of a firm regarding the state of the economy, thecondition of the industry, a firm’s own performance, et cetera. There are manyreasons why firms may have different expectations. First of all, the prospects maydiffer between industries. When an industry is expected to grow rapidly, a firmwill be more inclined to expand than when prospects are less optimistic for theindustry. Second, firms within the same industry could have different informationsets on which the decision to grow is based. Third, even if firms would have thesame information, still they may perceive and interpret it differently, leading todifferent expectations.
Naturally, different expectations lead to different decisions. Moreover, firms mayhave different ambitions regarding their (ultimate) sizes or market shares. Somefirms may indeed be driven by enormous ambitions and try to capture the totalmarket as much as possible. But other firms may be less ambitious. Their aimcould be to acquire a certain amount of profits, and if this goal is reached at acertain size they may decide to keep the size approximately fixed. Perhaps thedesire to grow is present latently, but if it is not strong enough no serious attemptswill be made to fulfil this desire. Finally, the situation on the markets for labour
5
and capital goods may differ across industries. A shortage of labourers with skillsnecessary for a specific firm probably hinders a firm’s desire to expand.
Combining the potential differences in expectations, ambitions and input marketsmakes anticipating the growth paths of firms very difficult. As Geroski (1998)argues, the growth of a firm may very well be understood, but also be hard todescribe or predict with any precision. Therefore, we will model the evolution ofthe size of a firm as following a random walk, however with a declining positivedrift. This last property is consistent with the stylised fact that growth rates arenegatively correlated to the firm’s age.
After having described the two most distinguishing features of the model, i.e., itsfocus on the repeated adoption of new technologies in relation to the dynamics ofthe firm population, and the modelling of firm growth as an essentially randomprocess, we now turn to the technical details of the model.
3. The model
Consider an industry where in each discrete time period t, t = 0, 1, 2,…, the firmpopulation consists of N (t) firms. All firms in the industry are producing a certainproduct that is defined by its functional characteristics. An essential assumption inthe model is that the function the product performs can be based on differenttechnologies. For instance, both the standard compact cassettes as well as thecompact disc (CD) are sound recording media, however analogue recordingtechnology underlies the compact cassette, whereas a CD is recorded by usingdigital technology. However, our notion of a product also extents to producer orcapital goods. An example here could be industrial lathes, which can be manuallyoperated or operated by using computer numeric control (CNC) technology.
Every period a random number of new firms enter the industry according to aPoisson process4 with arrival rate ρent. At birth, each firm i is endowed with afirm-specific organisational competitiveness level λi, a product technology Ψ, anda size si. The organisational competitiveness level λi is a random genotypevariable5 that sets for each firm a potential limit to its actual competitiveness,creating some (initial) heterogeneity among firms with regard to theirorganisational capabilities. As mentioned, this variable may limit the firm’s actualcompetitiveness, but whether it actually does depends on its technologicalcompetitiveness that is calculated as described below.
4 For practical reasons, we have adopted the Poisson process here and approximated it by fivehundred Bernoulli trials every period. For analytical convenience, the arrival rate is kept constantover the simulation period.5 This variable is generated as follows. Let x ~ N (µλ ,σλ). Then λi = x if x ≤ µλ , and λi =max{0 ;2µλ-x} if x > µλ.
6
Competitiveness of firms
Assume that at every period Κ product technologies are available. At birth, everyfirm is randomly endowed with a technology Ψ (Ψ = 1, 2, Κ), such that theprobability of receiving a given technology is equal to 1 / (Κ). These technologiesare ranked according to their intrinsic quality level QΨ, such that QΚ > QΚ-1 >…>Q1. Also, there is a class of old technologies Ψ = 0 that all have an intrinsicquality level Q0. Every β1 periods a pioneering entrant or incumbent introduces anew, intrinsically better product technology that has become available due toexogenous technological change. This introduction causes all technologies to dropone level in their intrinsic quality. Hence, the newly introduced technologybecomes Κ (the technology with the highest quality level QΚ), and Ψ = 1 becomespart of the class of old technologies Ψ = 0 and degrades to the intrinsic qualitylevel Q0. Although firms can employ more than one product technologysimultaneously, we will first explain the evolution of some essential variables fora single-technology firm.
A firm’s technological competitiveness TCi,Ψ (t) depends on the intrinsic qualityQΨ of the product technology it is applying and the total share ΓΨ of thistechnology in the industry in the following way:
TCi,Ψ (t) = α ΓΨ (t)+ (1-α) QΨ (t), (1)
where 0 ≤ α ≤ 1, and Q0 ≤ QΨ ≤ 1. The parameter α is essential here, as itdetermines the strength of the network externalities on the demand side. Thehigher α, the more the total market share of a technology determines the firm’stechnological competitiveness.
Combining the organisational competitiveness λi with the technologicalcompetitiveness TCi,Ψ (t) gives us the potential competitiveness PCi,Ψ (t) of a firm,which is:
PCi,Ψ (t) = min { TCi,Ψ (t) ; λi }. (2)
Hence, a firm’s potential competitiveness is either bounded by its organisationalor its technological competitiveness. We could have modelled organisational andtechnological competitiveness as (imperfect) substitutes, but this would haveimplied that, e.g., a firm with a very low level of organisational competitivenessmay still survive as long as it has a high level of technological competitiveness.We believe that such a situation is not realistic, as firms will always need a certainlevel of organisational skills in order to manage the manufacturing and selling oftheir products. Furthermore, by modelling organisational and technologicalcompetitiveness as complementary, we exclude in advance the awkwardpossibility that the organisational and technological skills of the firms will be
7
negatively correlated in the simulation results.
Finally, a firm’s actual competitiveness Ci,Ψ (t) evolves according to the followingmoving average process:
Ci,Ψ (t) = θ Ci,Ψ (t-1) + (1-θ) PCi,Ψ (t), (3)
where 0 ≤ θ ≤ 1, and Ci (t) = β2 λi for all firms that enter at period t. The systemparameter β2 puts an entrant at an initially disadvantageous and possibly evendangerous position. To some extent such an entry process corresponds toJovanovic (1982). Even firms with very low competitiveness levels may decide toenter the industry, simply because they do not know their true competitivenessprior to their entry. Only by actually entering they can gather some evidenceregarding their real capabilities, which may subsequently eventuate in a rapidexodus of entrants with low competitiveness levels. It is also consistent with theempirical evidence on the entry process.6
Exit rules
If the actual competitiveness is below a certain fraction ΦL of the industry average
C , or if size drops below the minimum level s , a firm dies with probability one,a higher productivity level reduces the probability of exiting Pexit (t). Survival isguaranteed for the next period if relative competitiveness exceeds an upper levelΦH. Hence, we have
Pexit, i (t) = 0 if Ci,Ψ (t) ≥ ΦH C (t) (4a)
Pexit, i (t) = 3
)()(
)()(
LH
H
β
Φ−Φ−Φ
tctc
tctc i if ΦL C (t) < Ci,Ψ (t) < ΦH C (t) (4b)
Pexit, i (t) = 1 if Ci,Ψ (t) ≤ ΦL C (t), or if si ≤ s . (4c)
These exit rules can be interpreted as a mixture of voluntary and forced exit. Ifrelative competitiveness is lower than ΦL, or if their size drops below theminimum level s , firms go bankrupt and are thus forced to exit. However, forthose firms that observe that their relative competitiveness lies between ΦL andΦH, the exit decision is voluntary. Depending on their aspiration level, some ofthem may decide to continue, whereas others may voluntarily leave the industryand perhaps try their chances elsewhere.
Evolution of firm size
6 See Caves (1998) for an extensive overview.
8
As mentioned before, all firms are initially endowed with a fixed size si. Weinterpret this size as a firm’s sales capacity and assume for convenience that firmsalways operate at full capacity. All surviving firms grow each period according toa random process, however their mean growth rates asymptotically reach zero asthey mature. The process governing firm growth is
( )[ ]6
)()(4
551)(
)1( βχβ ββ +++=+ −− tata
i
i ii eets
ts , (5)
where ai,t denotes the age of firm i at t. The variable χ is randomly drawn from anormal distribution with mean µχ = 0 and variance σχ , β4 sets the average growthrate of firms at the age of zero. This growth rate gradually declines as the firmmatures, a process of which the pace is determined by β5 . Finally, β6 assures thateven at a high age the size of a firm is still subject to random shocks.
Imitation
Until here, the description of the model has only considered firms employing oneproduct technology. But, as mentioned, the model also allows for firms employingseveral technologies simultaneously. Let Ψ = A denote the firm’s intrinsically besttechnology. As long as A < Κ, a firm may have the opportunity to imitate anintrinsically better technology. Every period, firms randomly receive an imitationdraw according to a Poisson process7 with arrival rate ρim. Receiving an imitationdraw means that the firm acquires the knowledge of employing one intrinsicallybetter technology. This process is arranged such that on average a firm with agiven market share8 zi would receive ρim [zi + β7 (1-zi)] imitation draws in every β1
periods, where 0 ≤ β7 ≤ 1. The parameter β7 sets the inequality between firms withdifferent sizes with regard to receiving an imitation draw. If β7 = 1 all firms haveequal probabilities to imitate, if β7 = 0 the probability to imitate is proportional toa firm’s market share.
If an imitation draw is received, the probability of acquiring the knowledge ofgiven other product technology is equal to 1 / (Κ − A).9 Every firm that hasobtained an opportunity reallocates every period a share ωi (t) of its total capacityfrom its worst available technology Ψ = L (i.e., the technology with the lowesttechnological competitiveness) to its best available technology Ψ = H (i.e., the
7 Again approximated by Bernoulli trials.8 By market share we mean the firm’s share in the total capacity of the industry. Hence, we
have ∑=)(
)()()(tN
iii tststz .
9 The randomness of this process essentially reflects a bound to the agents’ rationality, combinedwith some degree of technological uncertainty. Hence, the combination of these elements may leadto erroneous decisions of firms with regard to the allocation of their imitation efforts.
9
technology with the highest technological competitiveness).10 The size of thisreallocation share ωi (t) is determined by:
ωi (t) = β8 [TCi,H (t) − TCi,L (t)] (1 + η ), (6)
where β8 is a system parameter (0 ≤ β8 ≤ 1), and η is a random variable11 drawnfrom a normal distribution with mean µη = 0 and variance ση . Hence, on averagethe share that is reallocated increases with the difference in the technologicalcompetitiveness between the worst and the best available product technology.
Whenever capacity is reallocated, part of it gets lost because of adjustment costs.If we denote si,L as the capacity allocated to the worst product technology, si,H asthe capacity allocated to the best product technology, si as the total capacity of the
firm (i.e., ∑=
H
Lis
ψψ, ), and ∆si ( = si (t + 1) − si (t)) as the capacity growth of the firm,
we have:
si,H (t + 1) = si,H (t) + β9 min {ωi (t) si (t); si,L (t)} + ∆si if ∆si > 0, (7a)
si,H (t + 1) = si,H (t) + β9 max {ωi (t) si (t) ; si,L (t) + ∆si ; 0}
+ min { ∑−
=
1
,
H
Lis
ψψ + ∆si ; 0} if ∆si ≤ 0, (7b)
si,L (t + 1) = max { min { si,L (t) + ∆si − ωi (t) si (t); si,L (t) − ωi (t) si (t)} ; 0},
(8)
where 0 ≤ β9 ≤ 1. This parameter arranges the fraction of the transferred capacitythat gets lost whenever reallocated. Expression (7a) says that if the capacity of thefirm grows, it allocates first of all its growth to the best technology. Second, thefirm reallocates capacity from the worst technology according to the amountdetermined by (6). If this amount is not available, it takes away all the capacitythat remained for the worst technology12, and adds it to the capacity of the besttechnology.
Expression (7b) deals with cases of negative growth of total capacity. In such acase the firm first withdraws the change in capital from the worst technology. Ifthat is not sufficient, it will subsequently take away capacity from the second
10 Please note that what we call here the ‘best’ technology is not necessarily the technology withthe highest intrinsic quality.11 Again, bounded rationality and technological uncertainty justify the randomness of this process.12 For simplicity, we assume that in such a case the firm, only in that period, does not considerreallocation from the second worst to the best technology.
10
worst, the third worst, et cetera. Only if even the capacity of the second besttechnology H −1 is divested, the firm will necessarily have to withdraw theremaining part of its total capacity decline ∆si from its best technology. If,however, si,L (t) is still positive after subtracting (formally adding) ∆si , the firmwill reallocate again capacity from the worst to the best technology, possiblebounded by si,L (t) + ∆si . Expression (8) gives us the amount of capacity availablefor the worst technology after having gone through the process of reallocation.
With regard to the competitiveness and survival probabilities, we in fact regard afirm employing more than one product technology as a ‘mother’ firm consistingof several subfirms, each of them employing one technology. The actualcompetitiveness of each subfirm still evolves according to (3). Hence, theorganisational competitiveness of the mother firm still applies to all the subfirms.Given the reallocation rules, it may happen therefore that a firm shifts part of itscapacity to a certain technology because of its higher technologicalcompetitiveness, whereas the actual competitiveness derived from this technologyis still bounded by the organisational competitiveness. This can be justified in twoways. First, we could argue that in this way a firm protects itself for the long run.Somewhere in the future the technological competitiveness of the worsttechnology may fall below the organisational competitiveness if new technologiesare introduced, in which case the technological competitiveness will be binding.In order to avoid this a firm may decide already now to transfer some capacity tothe best technology. Second, we could assume that a firm only has fuzzyinformation with regard to its competitiveness. For instance, it may erroneouslythink it could perform better by switching to a better product technology.
When a firm is employing several technologies simultaneously, the actualcompetitiveness of the whole firm i is the weighted average of the actualcompetitiveness levels of all subfirms:
∑
=
ψψ
ψ )()(
)()( ,
, tCts
tstC i
i
ii (9)
For the mother firm and all the subfirms the exit conditions expressed in (4)apply. In case of exit the capacity of the subfirm is totally lost, or, in case themother firm dies, all capacity is gone.
It was already mentioned that every β1 periods a pioneering entrant or incumbentintroduces a completely new technology. When this happens, all technologies thata given firm is employing drop one level in their intrinsic quality. Further, thesubfirm employing Ψ = 1 is merged with the subfirm employing the class of oldtechnologies Ψ = 0. Hence, in that period si,1 (t) is added to the capacity allocatedto Ψ = 0. With regard to the actual competitiveness of the subfirm employingΨ = 0 we calculate a size weighted average of the actual competitiveness levels of

11
the merging subfirms for that period. Since it is unlikely that, whenever a firmimitates a product technology, it could immediately fully benefit from the imitatedtechnology, we let Ci,ψ (t) = β10 λi for all firms that imitate technology Ψ at t.
4. Simulation results
Similar to the notion of technological regimes, we introduce the notion oftechnology adoption regimes to classify cases with different levels ofcompatibility between old and new product technologies, and different degrees ofsubstitution between the quality and the network size of a technology. In contrastwith Shy (1996) however, our concept of compatibility between technologies isnot related to the notion of overlapping generations of users. In the interpretationof our model, a consumer, repeatedly buying a given product, is more willing toswitch to a newer product technology if its compatibility with the old technologyis higher. To use again the example of sound recording media, a consumer thatwants to replace his old analogue cassette-player would be more willing to buy adigital compact cassette (DCC) player than a CD-player, simply because hispreviously recorded tapes can also be played on the DCC-player. Of course, inreal life there are many other considerations involved, but purely for the sake ofcompatibility this consumer would switch easier to a DCC player than to a CDplayer. Or let us consider a case in which a firm is considering to switch from amanually operated lathe to a CNC operated one. If the CNC lathe requires workerskills that are very different from the skills necessary for manually operatedlathes, the much more advanced CNC lathe is still lowly compatible with the oldfashioned manually controlled workbench, which could seriously hinder theadoption of this new technology.
In the model, we will simulate different compatibility levels by varying thedifferences in the intrinsic quality levels between succeeding producttechnologies. High compatibility between a new and an old technology thenimplies a high difference in their intrinsic quality levels. For simulating variousdegrees of substitution between the quality and the network size of a technology,we will of course use the parameter α, which sets the relative importance of atechnology’s share in the market.
We will simulate three different adoption regimes, in which the number ofproduct technologies available is equal to three (K = 3). The first one will belabelled ‘quality regime’: in this regime, quality and network size are perfectsubstitutes. This is arranged by setting parameter α equal to zero. Hence,technological competitiveness is only determined by the intrinsic quality of atechnology. Further, in this regime new technologies are highly compatible withold technologies. This situation is obtained by setting the intrinsic quality levels asfollows: Q3 = 1, Q2 = 0.5, and Q1 = 0.25.
The second technology adoption regime, labelled ‘intermediate regime’ is
12
characterised by again perfect substitutability of quality and network size, but herenew technologies are less compatible with old technologies than in the qualityregime. The lower compatibility of succeeding technologies is obtained bydecreasing the differences their intrinsic quality levels: Q3 = 1, Q2 = 0.75, andQ1 = 0.5. Thus, compared to the quality regime, the second best technology ismore competitive vis-à-vis the best technology available.
The settings of the third adoption regime (the ‘network’ regime) are such thatquality and network size are to some extent complementary α = 0.5. Further,Q3 = 1, Q2 = 0.75, and Q1 = 0.5. Under this regime, the market share of atechnology determines technological competitiveness as well. The otherparameters remain constant across the three technology adoption regimes.13
Although the three adoption regimes we analyse here are not perfectly consistentwith the cases described by Shy (1996), we can still base our expectations withregard to the outcomes of the simulations on the predictions of his model.According to Shy (1996), whenever new technologies are perfectly compatiblewith old technologies, the new technologies are adopted each period. Further, adecrease in the degree of compatibility between new and old technologies wouldincrease the duration of each technology. Based on this, we may expect that theduration of a technology is higher in the intermediate regime than in the qualityregime.
Further, Shy (1996) concludes that when newer technologies are not perfectlycompatible with older technologies, new technologies are never adopted ifconsumers treat network size and technological advance as perfect complements,but may be adopted if they are treated as perfect substitutes. Therefore, we mayexpect from our simulations that duration will be highest under the networkregime, although eventually newer technologies will be adopted, given that ourparameters are not consistent with perfect complementarity between network sizeand quality.14 Finally, we may expect to see that not always new technologies areadopted whenever they appear in both the quality and, more likely, in theintermediate regime. In both these regimes there is perfect substitutabilitybetween quality and network size and imperfect compatibility. However, Shy’sresult (of technologies being skipped occasionally under these conditions) verymuch relies on his notion of compatibility. Therefore, some scepticism withregard to this expectation is appropriate.
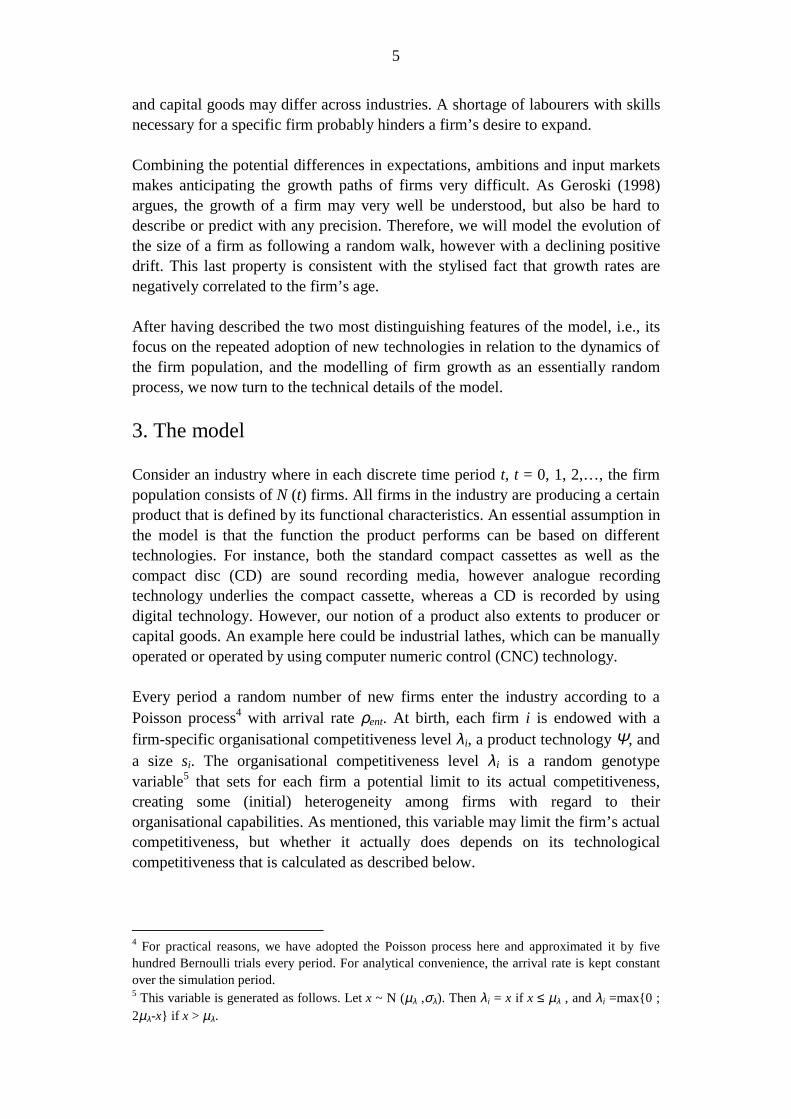
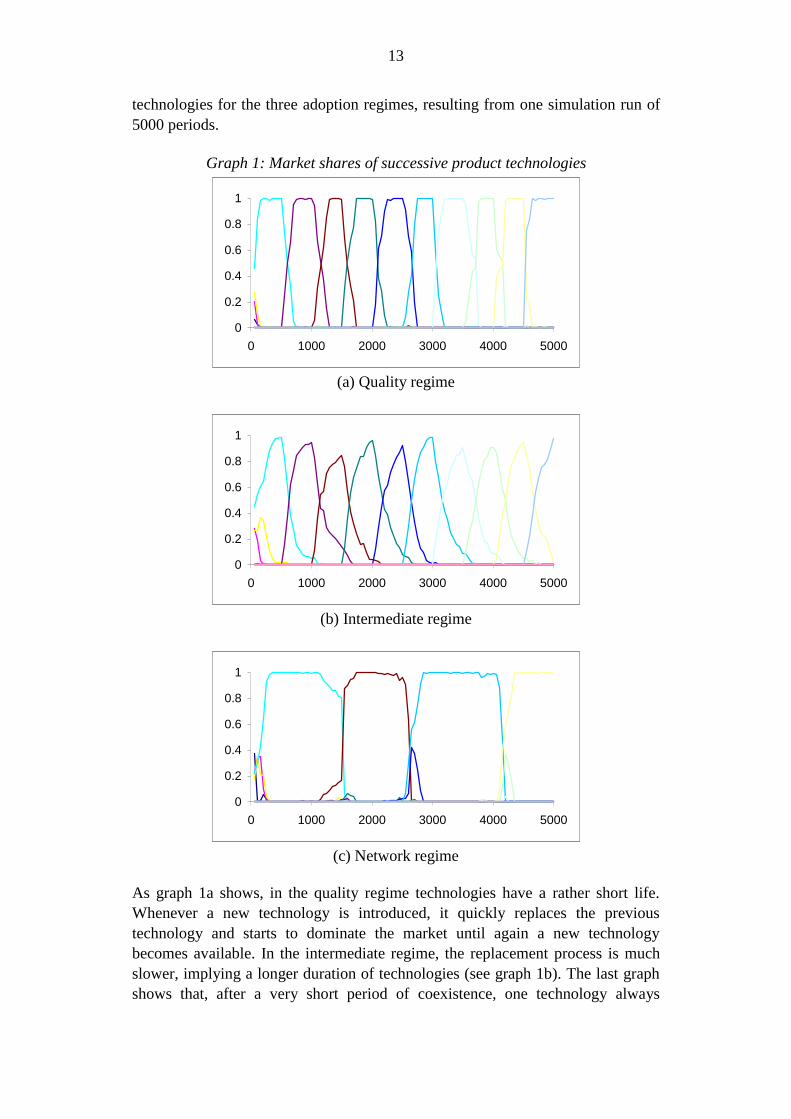
Graphs 1a to 1c show the evolution of the market share of successive product
13 The values of the other parameters are: N (0) = 40, ρE = 0.15, µλ = 1, σλ = 0.1, si = 250, β1 =
500, Q0 = 0, θ = 0.99, β2 = 0.6, ΦL = 0.6 , ΦH = 1, s= 25, β3 = 10, β4 = 0.01, β5 = 0.0069, σχ =
0.1, β6 = 0.01, ρim = 20, β7 = 0.1, β8 = 0.1, ση = 0.5, β9 = 0.05, and β10 = 0.8. The results of thesimulations are robust to small changes in the levels of all parameters.14 However, when α is set equal to one, the simulations of our model indeed show that newtechnologies are never adopted.
13
technologies for the three adoption regimes, resulting from one simulation run of5000 periods.
Graph 1: Market shares of successive product technologies
0
0.2
0.4
0.6
0.8
1
0 1000 2000 3000 4000 5000
(a) Quality regime
0
0.2
0.4
0.6
0.8
1
0 1000 2000 3000 4000 5000
(b) Intermediate regime
0
0.2
0.4
0.6
0.8
1
0 1000 2000 3000 4000 5000
(c) Network regime
As graph 1a shows, in the quality regime technologies have a rather short life.Whenever a new technology is introduced, it quickly replaces the previoustechnology and starts to dominate the market until again a new technologybecomes available. In the intermediate regime, the replacement process is muchslower, implying a longer duration of technologies (see graph 1b). The last graphshows that, after a very short period of coexistence, one technology always
14
dominates the market until it becomes obsolete15, after which it is quicklyreplaced by a new technology that again dominates until its obsolescence. Thus,the outcomes of the simulations are fairly comparable to Shy’s predictions. Theduration of technologies is higher when compatibility between new and oldtechnologies is lower. However, both under the quality regime as well under theintermediate regime, new technologies are always adopted.16 Only under thenetwork regime new technologies are never adopted until the existing dominanttechnology has become obsolete.
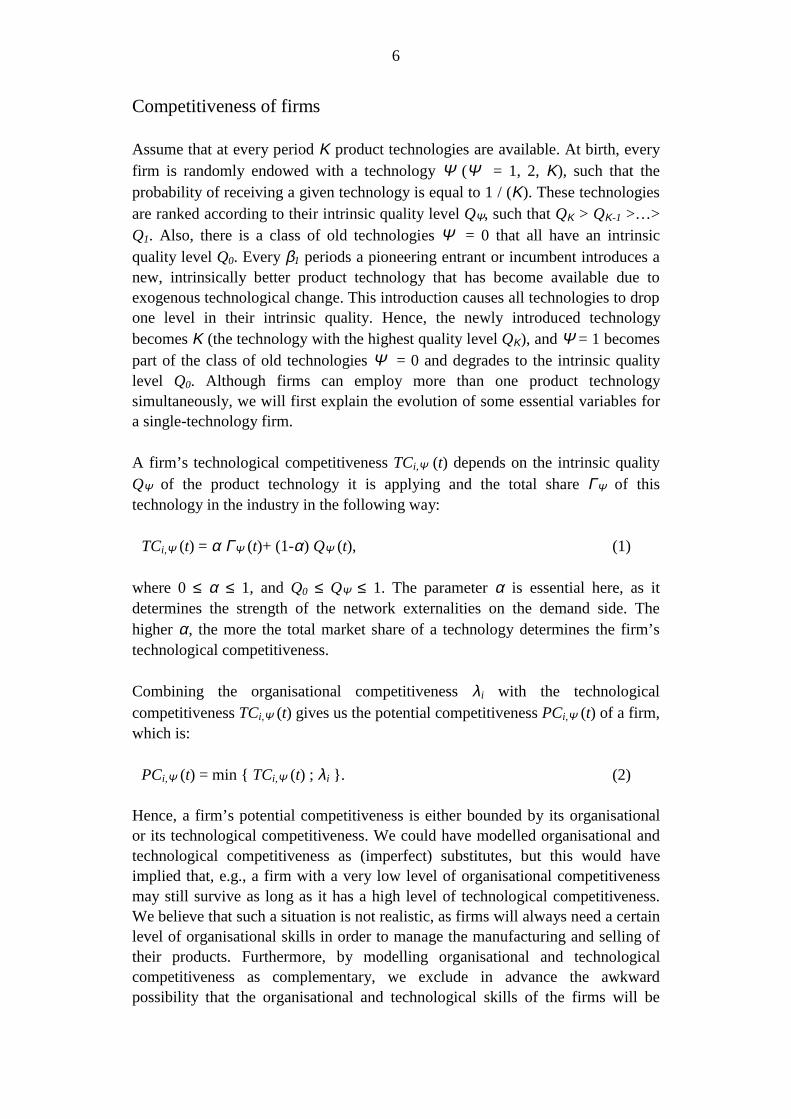
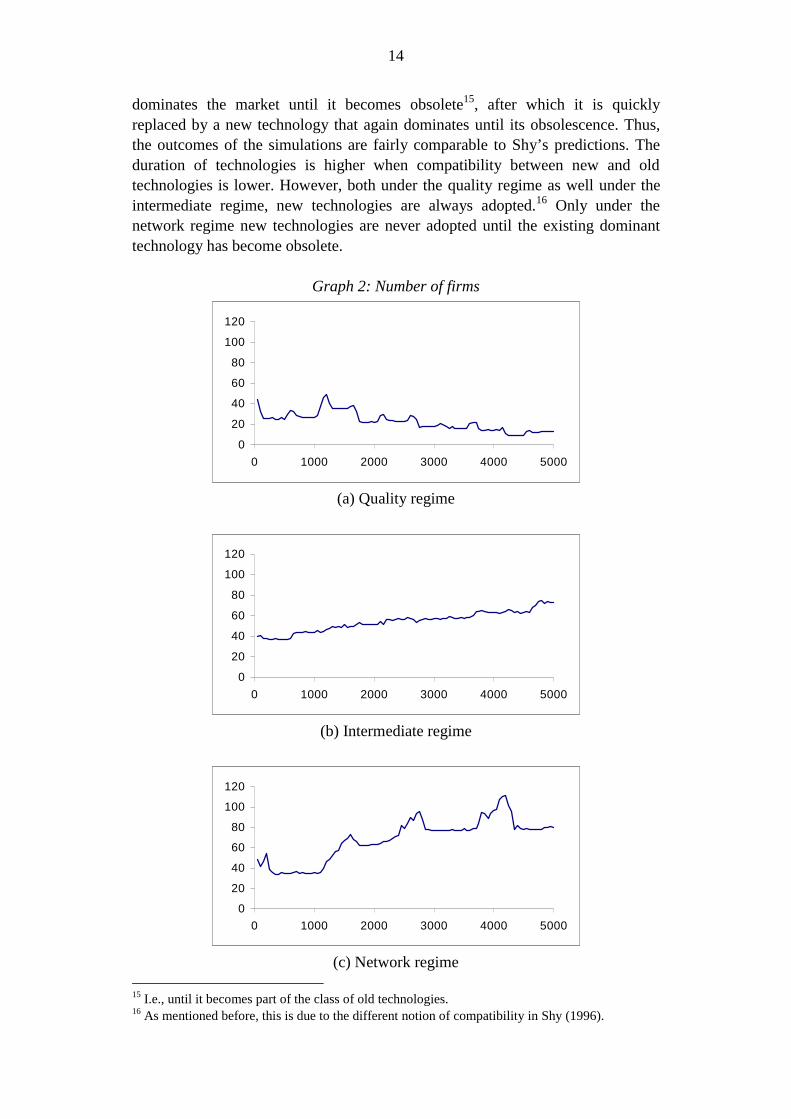
Graph 2: Number of firms
0
20
40
60
80
100
120
0 1000 2000 3000 4000 5000
(a) Quality regime
0
20
40
60
80
100
120
0 1000 2000 3000 4000 5000
(b) Intermediate regime
0
20
40
60
80
100
120
0 1000 2000 3000 4000 5000
(c) Network regime 15 I.e., until it becomes part of the class of old technologies.16 As mentioned before, this is due to the different notion of compatibility in Shy (1996).
15
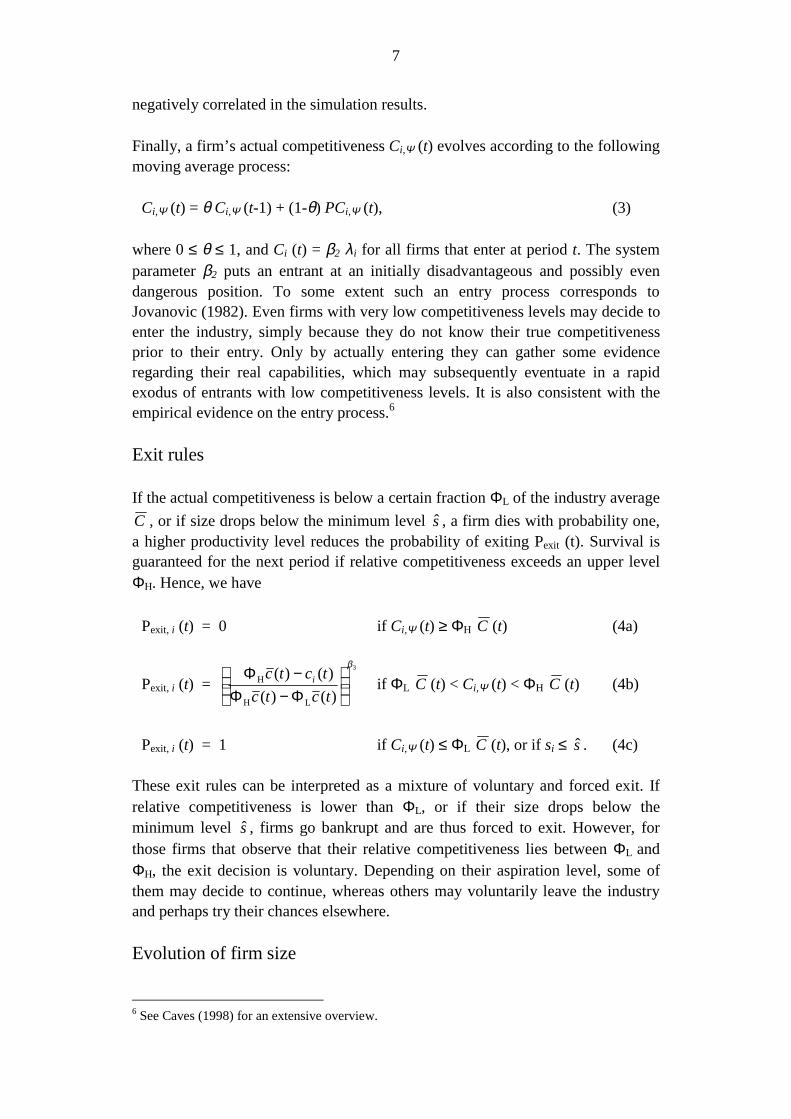
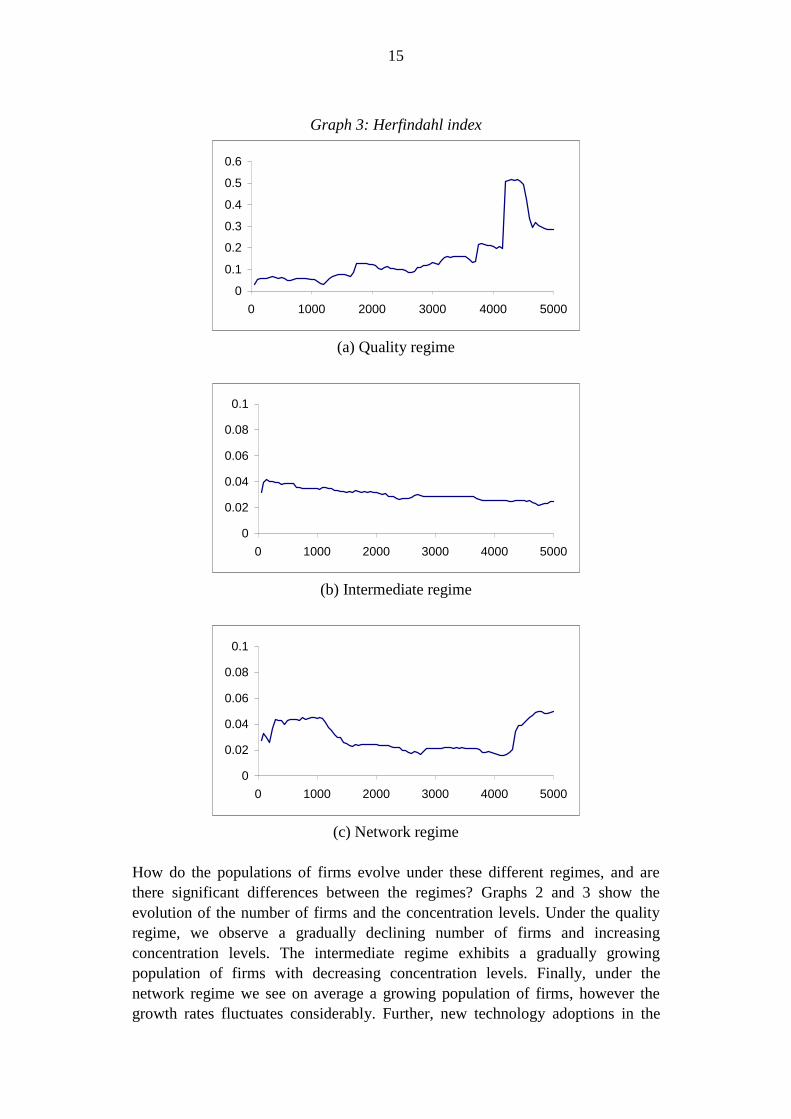
Graph 3: Herfindahl index
0
0.1
0.2
0.3
0.4
0.5
0.6
0 1000 2000 3000 4000 5000
(a) Quality regime
0
0.02
0.04
0.06
0.08
0.1
0 1000 2000 3000 4000 5000
(b) Intermediate regime
0
0.02
0.04
0.06
0.08
0.1
0 1000 2000 3000 4000 5000
(c) Network regime
How do the populations of firms evolve under these different regimes, and arethere significant differences between the regimes? Graphs 2 and 3 show theevolution of the number of firms and the concentration levels. Under the qualityregime, we observe a gradually declining number of firms and increasingconcentration levels. The intermediate regime exhibits a gradually growingpopulation of firms with decreasing concentration levels. Finally, under thenetwork regime we see on average a growing population of firms, however thegrowth rates fluctuates considerably. Further, new technology adoptions in the
16
network regime are associated with a sharp decrease in the number of firms.
These graphs, derived from one simulation run for each regime, indeed show thatthe regimes differ with regard to the population dynamics. But for a betterassessment of the significance of these differences we calculated a number ofstatistics on the basis of the output of ten runs per regime17, shown by table 1.
The first two rows show the average number of firms and the average Herfindahl-index.18 Next, we calculated the average number of entrants over 50 periods.19
Entrants are defined as firms absent at the beginning of a 50-period era, butpresent at the end of the era (vice versa for exiters); incumbents are firms presentthroughout the sample period. Further, we calculated survival rates for entrants,both for the short-run (i.e., the proportion of entrants that survive at least 50periods) as well as for the long run (proportion of entrants surviving at least 500periods). Finally, we calculated the weighted20 average age of all exiting firms attheir year of exit, and the average age of all firms at t = 5000. Table 1 shows theaverages of these variables per regime over all the sample periods of the tensimulations (standard error of the mean in parentheses).
Table 1 Quality regime Intermediate regime Network regime
Number of firms 21.2 (1.27) 56.1 (2.34) 66.3 (1.70)Herfindahl-index 12.5 (1.58) 3.57 (0.25) 3.44 (0.22)
Number of entrants over50 periods 1.24 (0.08) 1.26 (0.06) 2.75 (0.05)
Survival rates-short-run 43.9 (1.62) 52.1 (0.99) 49.8 (1.12)-long-run 31.6 (1.74) 43.9 (0.78) 30.5 (0.63)
Mean age of- all exiters 913 (32.8) 1176 (53.3) 840 (41.3)- all firms at t = 5000 1852 (177) 2937 (67.6) 2374 (118)
On average, the largest number of firms is found in the network regime, whereasthe quality regime exhibits the smallest population. Not surprisingly then, thehighest concentration levels are found under the quality regime, whereas thenetwork regime produces the lowest concentration levels.
The highest number of entrants emerges under the network regime, which is 17 In order to keep the datasets at a reasonable size we have sampled each run only every 50periods.18 The Herfindahl index is calculated as the sum of squared market shares.19 We did not calculate entry and exit rates, because they would not reflect real differences in, e.g.,the ease of entry. If a regime is conducive to entrants the simulation results will show a highernumber of firms in time than for a regime less conducive to entrants. Since the expected number ofentrants in each period is fixed by the arrival rate ρE and identical across the three regimes, theentry conducive regime will show lower entry rates than the regime less conducive to entrants.20 For the weights we use the size of a firm (si in the model).
17
approximately twice as high as under the other regimes.21 Concerning the survivalrates, we see that the intermediate regime produces the highest probability forentrants to survive, both for the short run as well as the long run. The lowestshort-run survival rates emerge under the quality regime. Long-run survival ratesfor the quality and the network regime are virtually similar.
The average age of exiting firms is highest under the intermediate regime, andlowest under the network regime. Further, at the end of the simulation the oldestpopulation is found under the intermediate regime, whereas the youngestpopulation is found under the quality regime.
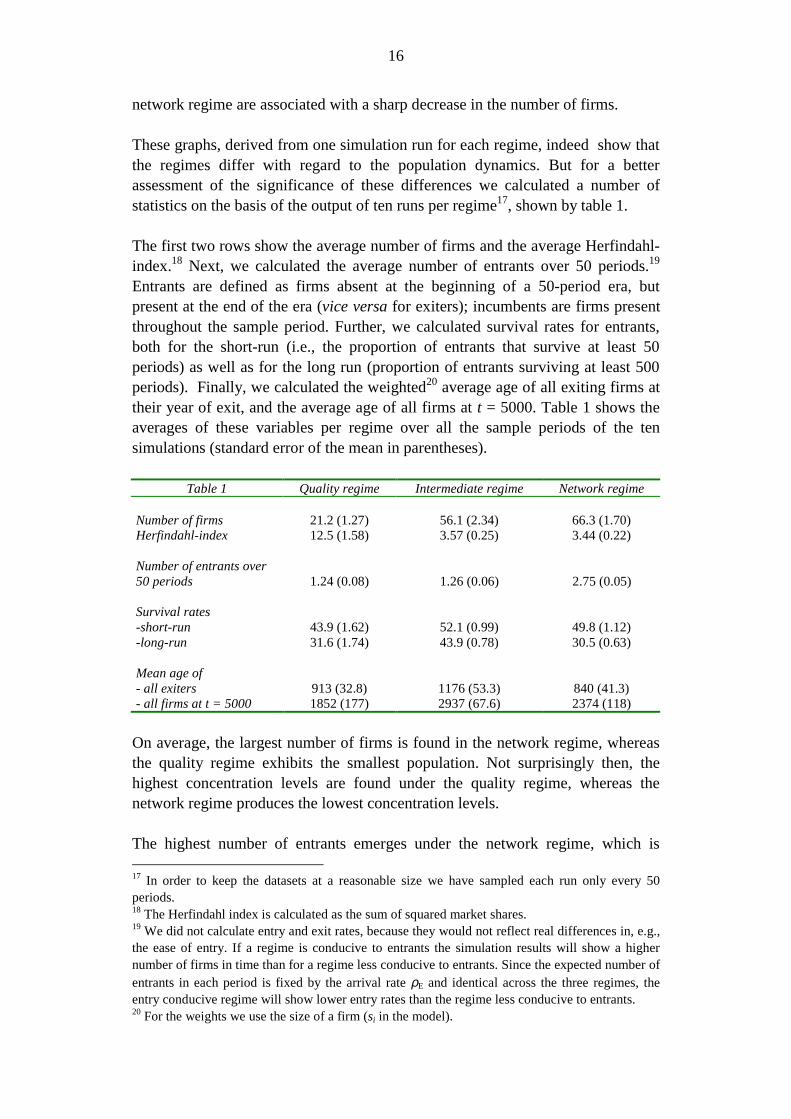
With regard to the consistency of the model with the stylised facts mentioned insection two, it is obvious that the model reproduces the first one. Under allregimes, there is persistent market turbulence due to entry, and exit. The secondstylised fact (high infant mortality, negatively correlated with firm age) alsoemerges, except for the quality regime. Graph 4 shows the probability of exitingover the full simulation period given the age cohort22 of an entrant for eachregime.
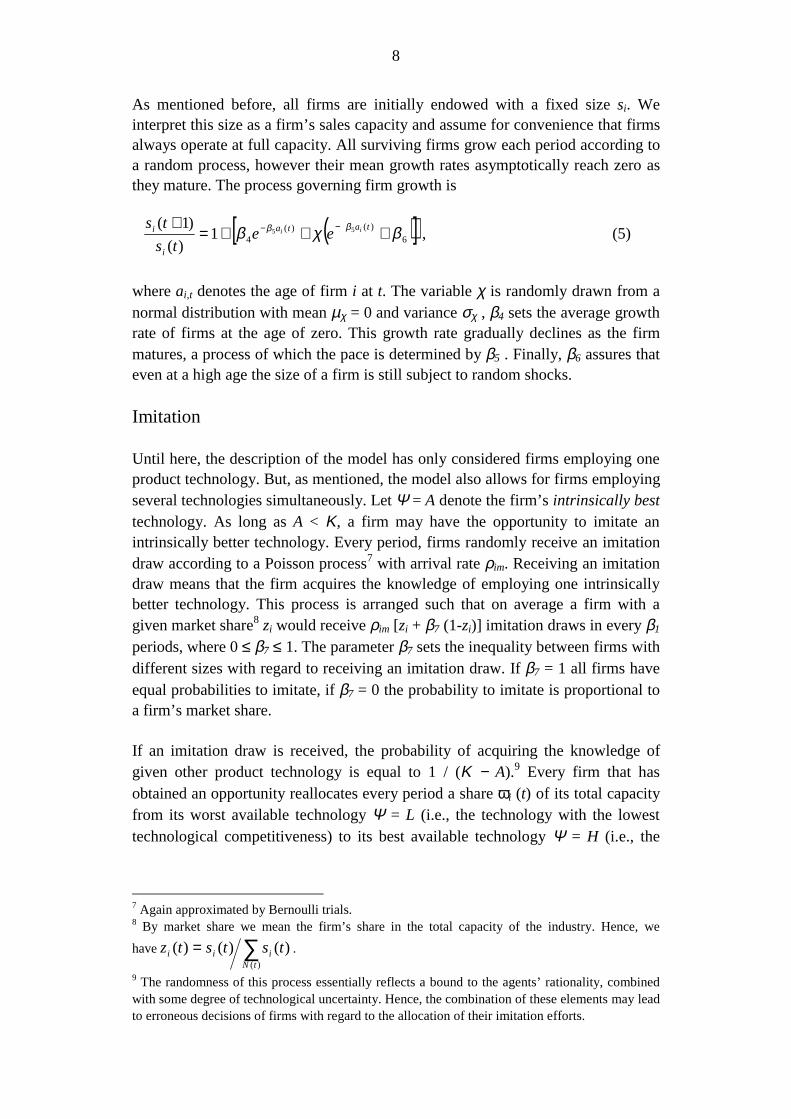
Graph 4: hazard rate as a function of age
0.0
0.2
0.4
0.6
0.8
1.0
0 1000 2000 3000 4000 5000
quality regime intermediate regime network regime
Under the quality regime, infant mortality initially declines with age, however noentrant is able to live for more than approximately 4,500 periods. This leads to arise in hazard rates for entrants with ages exceeding 4,000 periods. The other tworegimes show very similar hazard rates that indeed decline as entrants mature.Hence, both the intermediate regime and the network regime reproduce thissecond stylised fact.
The third stylised fact (growth rates of firms that fall with age and with size) is ofcourse to some extent imposed on the model by equation (5). Still, it might be
21 Note that we only sample every 50 periods. Therefore, despite the identical entry arrival rate of0.15 per period, the three regimes produce different numbers of entrants due to variations in thenumber of firms that die before being observed in the sample. Hence, this number can beinterpreted as a ‘very short run’ survival rate.22 Each age cohort covers 50 simulation periods.
18
interesting to learn about the emerging econometric regularities of the model. Asin Dosi et al. (1995), we therefore run a number of regressions of the followingform:
( ))(ln)(ln)(ln)(ln)(
)(ln 3210 tatsqtaqtsqq
ts
Ttsiiii
i
i +++=
+, (10)
for t = 50, 100, …, 5000 and T = 50 (regression 10a), and for t = 500, 1000, …,5000 and T = 500 (regression 10b). The results are listed in table 2.
Table 2 q0 q1 q2 q3 R2-adjustedQuality regime
10a 0.595 -0.045 -0.085 0.006 0.09810b 1.306 -0.135* -0.202 0.020* 0.036
Intermediate regime10a 0.595 -0.055 -0.077 0.007 0.11910b 1.128 -0.099 -0.151 0.012 0.170
Network regime10a 0.641 -0.058 -0.086 0.008 0.10110b 1.707 -0.146 -0.235 0.020 0.204
Under all regimes this stylised fact is reproduced. All parameter estimates aresignificant at the 1-% level, except for the ones indicated with an asterisk, whichare only significant at the 10-% level. Hence, both over the 50 period interval aswell as over the 500 periods, initial size and initial age exert a negative impact onfirm growth. Surprisingly, the interaction term exhibits in all cases a positivecoefficient. Apparently the negative effect of, for instance, age on firm growth isattenuated for larger firms. Given the specification of equation (5), this emergentproperty is hard to explain. However, this regularity has been observed before inempirical studies on firm growth. Also Evans (1987a, 1987b) found significantpositive estimates for the variable indicating the interaction between age and size.
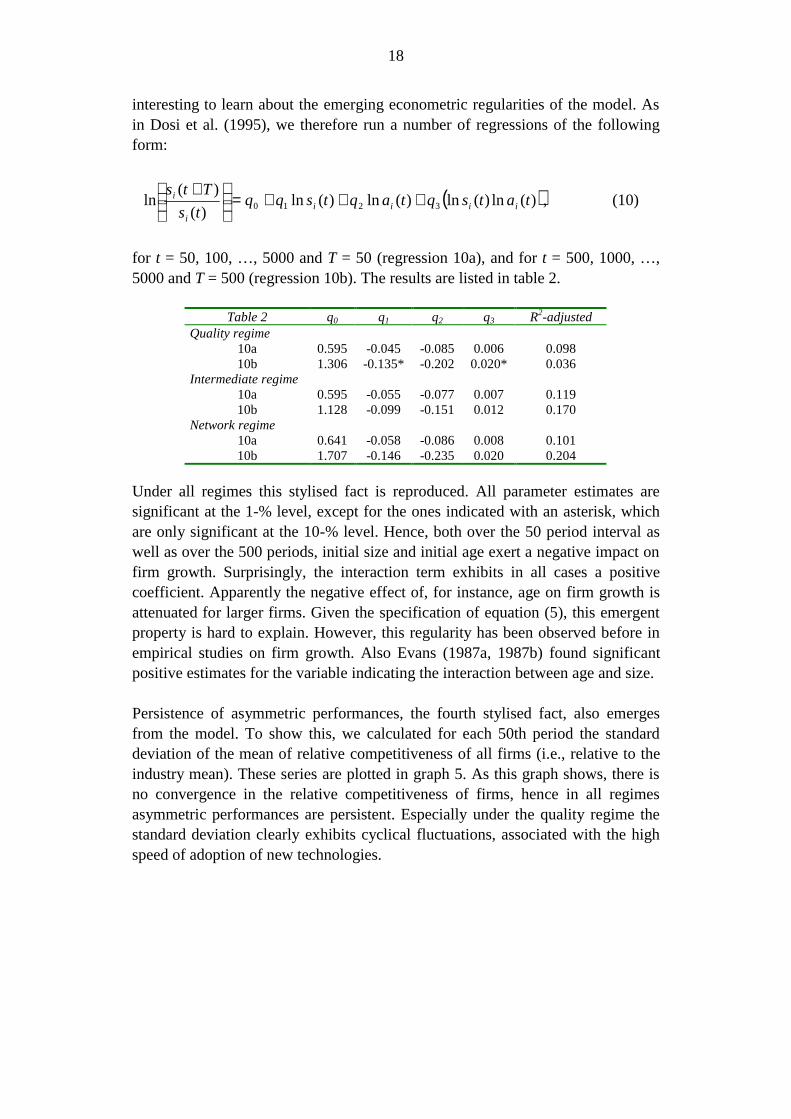
Persistence of asymmetric performances, the fourth stylised fact, also emergesfrom the model. To show this, we calculated for each 50th period the standarddeviation of the mean of relative competitiveness of all firms (i.e., relative to theindustry mean). These series are plotted in graph 5. As this graph shows, there isno convergence in the relative competitiveness of firms, hence in all regimesasymmetric performances are persistent. Especially under the quality regime thestandard deviation clearly exhibits cyclical fluctuations, associated with the highspeed of adoption of new technologies.
19
Graph 5: standard deviation of average relative competitiveness
0.00
0.05
0.10
0.15
0.20
0 1000 2000 3000 4000 5000
quality regime intermediate regime network regime
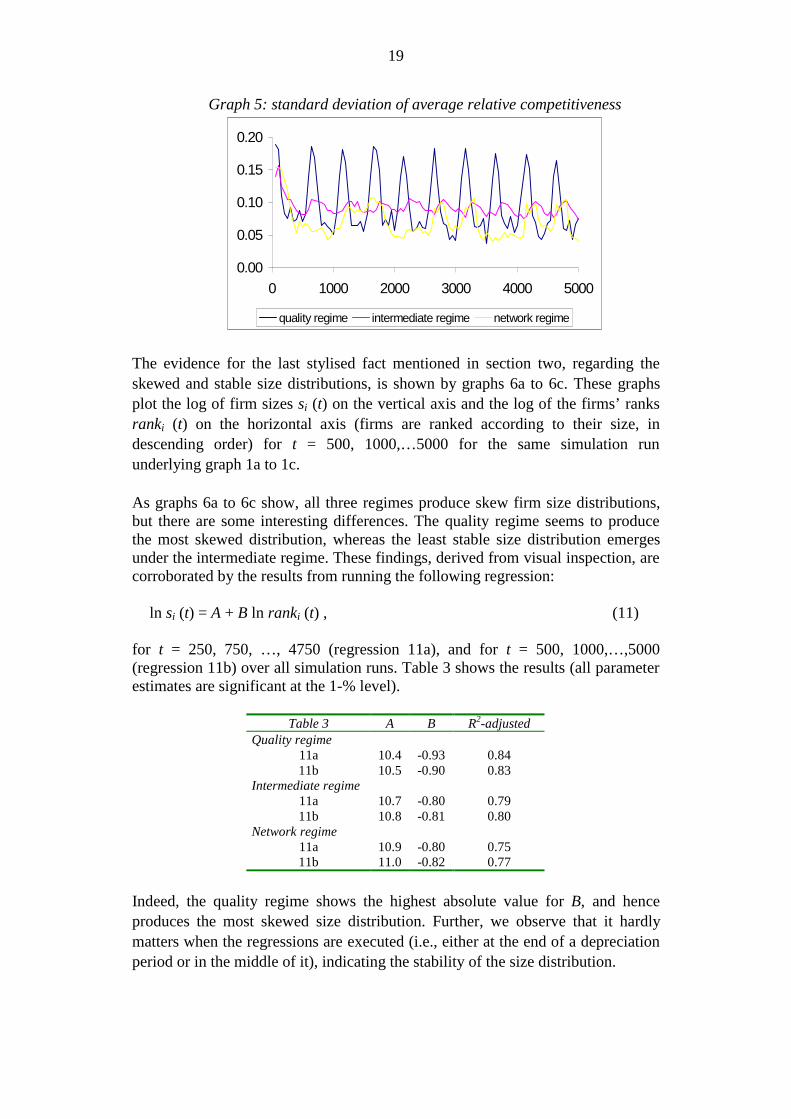
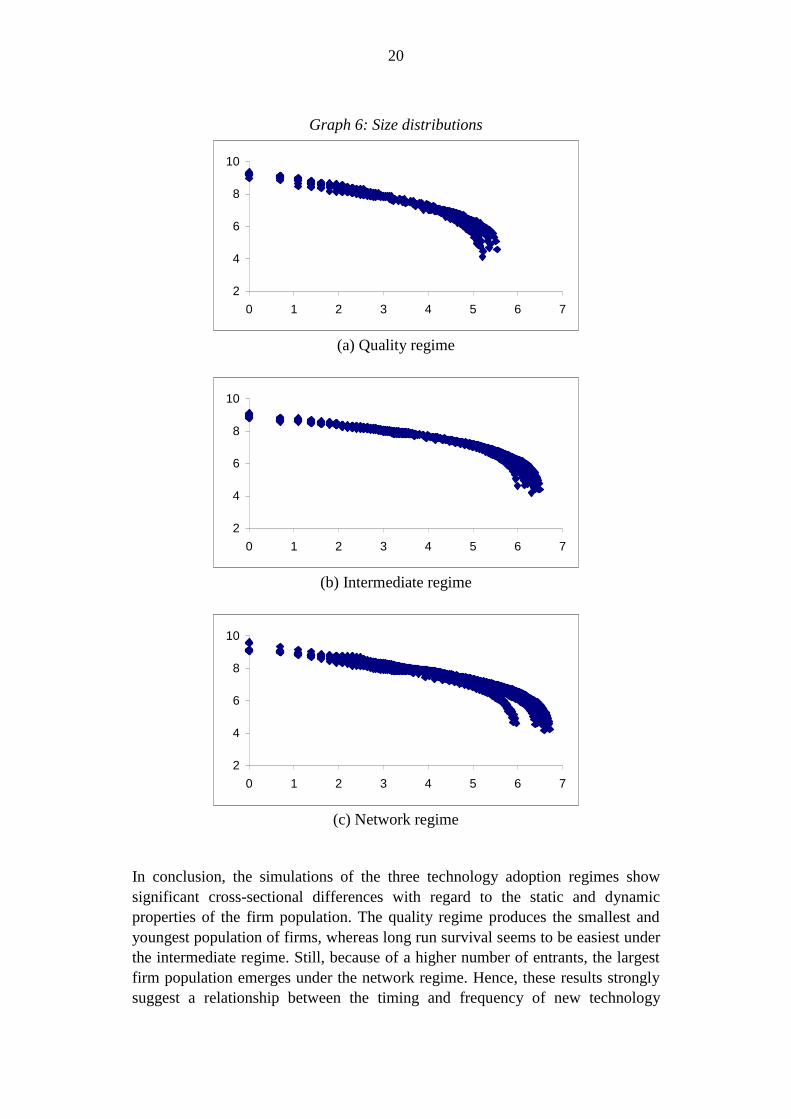
The evidence for the last stylised fact mentioned in section two, regarding theskewed and stable size distributions, is shown by graphs 6a to 6c. These graphsplot the log of firm sizes si (t) on the vertical axis and the log of the firms’ ranksranki (t) on the horizontal axis (firms are ranked according to their size, indescending order) for t = 500, 1000,…5000 for the same simulation rununderlying graph 1a to 1c.
As graphs 6a to 6c show, all three regimes produce skew firm size distributions,but there are some interesting differences. The quality regime seems to producethe most skewed distribution, whereas the least stable size distribution emergesunder the intermediate regime. These findings, derived from visual inspection, arecorroborated by the results from running the following regression:
ln si (t) = A + B ln ranki (t) , (11)
for t = 250, 750, …, 4750 (regression 11a), and for t = 500, 1000,…,5000(regression 11b) over all simulation runs. Table 3 shows the results (all parameterestimates are significant at the 1-% level).
Table 3 A B R2-adjustedQuality regime
11a 10.4 -0.93 0.8411b 10.5 -0.90 0.83
Intermediate regime11a 10.7 -0.80 0.7911b 10.8 -0.81 0.80
Network regime11a 10.9 -0.80 0.7511b 11.0 -0.82 0.77
Indeed, the quality regime shows the highest absolute value for B, and henceproduces the most skewed size distribution. Further, we observe that it hardlymatters when the regressions are executed (i.e., either at the end of a depreciationperiod or in the middle of it), indicating the stability of the size distribution.
20
Graph 6: Size distributions
2
4
6
8
10
0 1 2 3 4 5 6 7
(a) Quality regime
2
4
6
8
10
0 1 2 3 4 5 6 7
(b) Intermediate regime
2
4
6
8
10
0 1 2 3 4 5 6 7
(c) Network regime
In conclusion, the simulations of the three technology adoption regimes showsignificant cross-sectional differences with regard to the static and dynamicproperties of the firm population. The quality regime produces the smallest andyoungest population of firms, whereas long run survival seems to be easiest underthe intermediate regime. Still, because of a higher number of entrants, the largestfirm population emerges under the network regime. Hence, these results stronglysuggest a relationship between the timing and frequency of new technology
21
adoptions and the dynamics of the firm population. Also, the model is consistentwith a number of stylised facts observed in the empirical literature.
5. Interaction between adoption regimes and technologicalregimes
As mentioned in the introduction, the aim of this paper was to introduce demandside considerations as an alternative to more supply side oriented explanations forindustrial dynamics, like the concept of technological regimes. By varying anumber of parameters determining the technological competitiveness of firms, wehave designed three technology adoption regimes and investigated the differencesin the firm population between these regimes. However, to some extent our modelalso allows for investigating the impact of different technological regimes on theindustrial dynamics, and the interaction between adoption regimes andtechnological regimes. The present section will deal with these issues. Byselecting and varying a number of parameters reflecting the level ofcumulativeness and spillovers, we will run and compare several simulations ofdifferent technological regimes under the three technology adoption regimes.
A technological regime can broadly be defined as a particular combination ofcumulativeness and spillover conditions, common to specific activities ofinnovation and production and shared by the population of firms undertakingthose activities. Cumulativeness conditions refer to the extent to which acquiringtechnological knowledge is a cumulative process, whereas spillover conditionsreflect the ease of technological knowledge to flow from innovators to imitators.In the literature on technological regimes, a distinction is usually made betweentwo major patterns on innovative activities. The first one, called Schumpeter MarkI (SM-I), is characterised by a key role played by new firms in innovativeactivities, whereas in the second one, Schumpeter Mark II (SM-II), this key role isfulfilled by the large and established firms.
The differences between the two regimes are mainly related to differences in thecumulativeness and spillover conditions. For instance, the SM-I regime ischaracterised by low levels of cumulativeness and high levels of spillover effects,whereas opposite conditions hold for the SM-II regime. Given these differences,industries with different underlying technological regimes are likely to differ withrespect to their dynamic and structural properties. In SM-I industries, we mayexpect a turbulent and large population of young and small firms, and low entrybarriers. SM-II industries may be characterised by a more stable and smallpopulation of large and old firms, and by high entry barriers.
Obviously, the conditions determining the technological regime have a strongimpact on the patterns of innovative activities of an industry, as well as on theease and the impact of imitation. Since in our model innovation is exogenous, wecannot fully simulate the different conditions underlying technological regimes.
22
Only to the extent that these conditions apply to ease and impact of imitation wecan analyse the effect of different technological regimes in our model.
To investigate whether our model is still able to produce the regularities predictedby the technological regime framework, we first have to identify the parametersreflecting the cumulativeness and spillover conditions. For cumulativeness wehave to find the variable that indicates best to what extent the acquisition ofknowledge is a cumulative process. We propose to vary the parameter governingthe ‘penalty’ rates for continuing firms (β10). This penalty rate can be interpretedas a measure indicating to what extent the knowledge and experiences of a firmwith its existing product technologies carry over to the new technology it adopts.For instance, if β10 is equal to β2 (the penalty rate for entrants), the subfirmadopting the new technology starts at a competitiveness level equal to that of anentrant.23 In this case the subfirm has no direct advantage over entrants withregard to the new technology (the accumulated experience with its existingtechnologies does not carry over to the subfirm with the new technology).However, the higher β10 (relative to β2), the more the knowledge of newtechnology is based on the knowledge of previous technologies, and hence themore a new subfirm benefits from its accumulated experience vis-à-vis new firmsentering with the same technology.24
For varying the spillover effects, it seems natural to vary the parameterdetermining the probability to receive an imitation draw (i.e., ρim). Since we havedefined imitating as acquiring the knowledge of applying a superior technology,this parameter reflects the ease of knowledge of new product technologies to flowto imitators. However, this parameter only reflects spillovers between continuingfirms, not from continuing firms to entrants. Of course, in a strict sense, entrantsare considered as continuing firms in the model from the moment they haveentered. Thus, when the arrival rate of imitations is higher, also the very youngfirms have a higher probability to receive an imitation draw. On the other hand,since more continuing firms will imitate, the average competitiveness level will behigher, which decreases the probability for entrants to survive. Several simulationruns with different imitation arrival rates indeed show that this last effectdominates: higher levels of spillovers generally lead to less entry, ceteris paribus.Since this inconsistency is due to the fact that entrants do not directly benefit fromhigher spillover levels, we consider it appropriate to also increase the arrival rateof entrants (ρent) when spillovers levels are higher. In that case, more entrants
23 I.e., relative to the firms’ genotype organisational competitiveness levels λi.24 Of course, it may happen occasionally that an entrant with a certain technology receives animitation draw quickly after it has entered. If β10 is high, this entrant will also benefit from itsexperience with the inferior technology, despite the short time it has been employing it. This willnot seriously effect the results however, because the overall competitiveness of this entrant is atleast for some time also determined by the competitiveness of the subfirm employing the inferiortechnology for which the entry penalty rate β2 is still effective. Besides that, this firm alreadyemployed the initial technology successfully and therefore must possess some crucial knowledgeabout it.
23
have access to the knowledge necessary to imitate an existing technology. Alsothe entering firms will then benefit directly from high spillover conditions.
In the next experiments we will consider three levels of cumulativeness andspillover conditions (low, medium, high) for each of the technology adoptionregimes of the previous section. The specific parameter settings are as follows.Low cumulativeness means no direct advantage for subfirms relative to entrants(β10 =β2 =0.6). Medium levels correspond to the parameter settings of theprevious section (β10 = 0.8), whereas high cumulativeness levels are set by β10 =1. With regard to spillover effects, low levels of spillovers are set by ρI = 10 and(ρent) = 0.1. Medium levels again correspond to the parameter settings of theprevious section (hence, ρI = 20 and ρent = 0.15). High spillover conditions are setby ρI = 30 and ρent = 0.2.
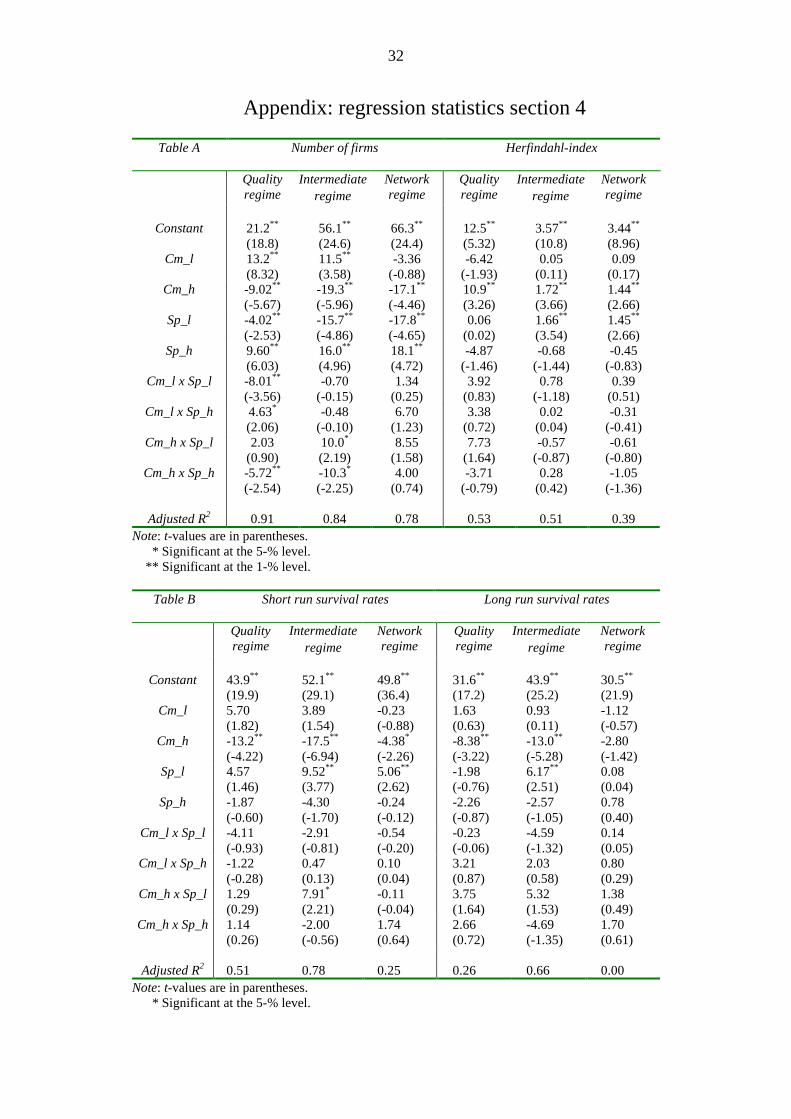
Hence, for each adoption regime we will consider nine different combinations ofcumulativeness and spillover conditions. To get a general impression of the effectof varying the cumulativeness and spillover conditions, tables 4 to 9 will show themeans and their standard errors of the same variables listed in table one underthese various conditions (except for the number of entrants).25 For an assessmentof the significance of the effects of different cumulativeness and spilloverconditions, and to investigate the extent to which these conditions interact, we willadditionally perform the following regression analyses. Each of the six variableswill be regressed on a number of dummy variables, indicating the variouscumulativeness and spillover conditions and the potential interaction betweenthem. More specific, for each adoption regime we will estimate the followingequation:
Y = β1 + β2 Cm_l + β3 Cm_h + β4 Sp_l + β5 Sp_h + β6 (Cm_l x Sp_l) +
β7 (Cm_l x Sp_h) + β8 (Cm_h x Sp_l) + β9 (Cm_h x Sp_h) + ε , (12)
where Y is the dependent variable under consideration, Cm_l equals one ifcumulativeness conditions are low and zero otherwise, Cm_h equals one ifcumulativeness is high and zero otherwise, Sp_l equals one if spillover conditionsare low and zero otherwise, and Sp_h equals one if spillovers are high and zerootherwise. From this configuration of dummy variables it follows that thetechnological regime with medium cumulativeness and spillover conditions willbe the reference regime, implying that the estimates for β1 will be equal to themeans of the variables listed in table 1. The regression statistics can be found intable A to C in the Appendix of this paper.
25 We will not display the evolution of market shares of succeeding technologies for the differenttechnological regime conditions, because these patterns hardly show any differences within eachtechnology adoption regime.
24
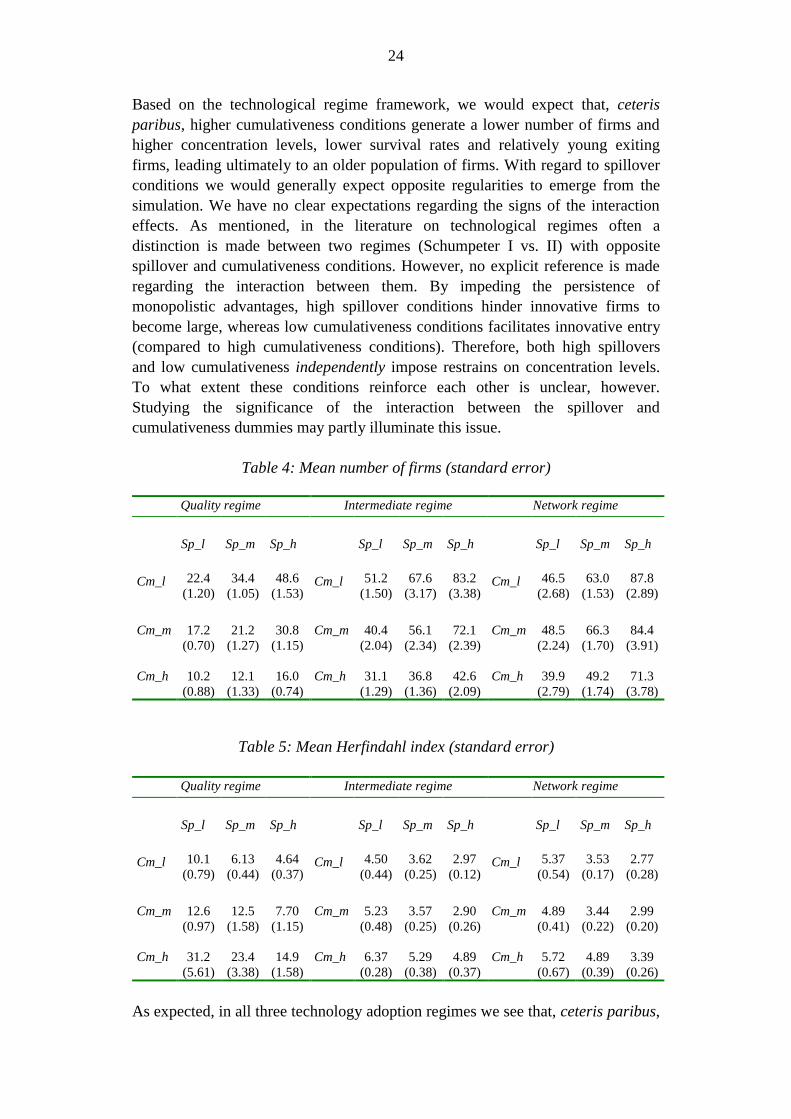
Based on the technological regime framework, we would expect that, ceterisparibus, higher cumulativeness conditions generate a lower number of firms andhigher concentration levels, lower survival rates and relatively young exitingfirms, leading ultimately to an older population of firms. With regard to spilloverconditions we would generally expect opposite regularities to emerge from thesimulation. We have no clear expectations regarding the signs of the interactioneffects. As mentioned, in the literature on technological regimes often adistinction is made between two regimes (Schumpeter I vs. II) with oppositespillover and cumulativeness conditions. However, no explicit reference is maderegarding the interaction between them. By impeding the persistence ofmonopolistic advantages, high spillover conditions hinder innovative firms tobecome large, whereas low cumulativeness conditions facilitates innovative entry(compared to high cumulativeness conditions). Therefore, both high spilloversand low cumulativeness independently impose restrains on concentration levels.To what extent these conditions reinforce each other is unclear, however.Studying the significance of the interaction between the spillover andcumulativeness dummies may partly illuminate this issue.
Table 4: Mean number of firms (standard error)
Quality regime Intermediate regime Network regime
Sp_l Sp_m Sp_h Sp_l Sp_m Sp_h Sp_l Sp_m Sp_h
Cm_l 22.4(1.20)
34.4(1.05)
48.6(1.53)
Cm_l 51.2(1.50)
67.6(3.17)
83.2(3.38)
Cm_l 46.5(2.68)
63.0(1.53)
87.8(2.89)
Cm_m 17.2(0.70)
21.2(1.27)
30.8(1.15)
Cm_m 40.4(2.04)
56.1(2.34)
72.1(2.39)
Cm_m 48.5(2.24)
66.3(1.70)
84.4(3.91)
Cm_h 10.2(0.88)
12.1(1.33)
16.0(0.74)
Cm_h 31.1(1.29)
36.8(1.36)
42.6(2.09)
Cm_h 39.9(2.79)
49.2(1.74)
71.3(3.78)
Table 5: Mean Herfindahl index (standard error)
Quality regime Intermediate regime Network regime
Sp_l Sp_m Sp_h Sp_l Sp_m Sp_h Sp_l Sp_m Sp_h
Cm_l 10.1(0.79)
6.13(0.44)
4.64(0.37)
Cm_l 4.50(0.44)
3.62(0.25)
2.97(0.12)
Cm_l 5.37(0.54)
3.53(0.17)
2.77(0.28)
Cm_m 12.6(0.97)
12.5(1.58)
7.70(1.15)
Cm_m 5.23(0.48)
3.57(0.25)
2.90(0.26)
Cm_m 4.89(0.41)
3.44(0.22)
2.99(0.20)
Cm_h 31.2(5.61)
23.4(3.38)
14.9(1.58)
Cm_h 6.37(0.28)
5.29(0.38)
4.89(0.37)
Cm_h 5.72(0.67)
4.89(0.39)
3.39(0.26)
As expected, in all three technology adoption regimes we see that, ceteris paribus,
25
higher spillover conditions lead to a higher number of firms and to lowerconcentration levels. Also, with regard to cumulativeness conditions, we see thatin general the number of firms decreases and the concentration increases withhigher cumulativeness. Only under the network regime there is no clearrelationship between cumulativeness on the one hand and the number of firms andconcentration levels on the other.
The regression analyses show that with regard to the number of firms thedifferences due to variations in the technological regime parameters aresignificant. Only under the network regime the dummy for lower cumulativenessis not statistically significant. Interesting differences emerge with regard to theinteraction effects. Under the quality regime, the combination of lowcumulativeness and low spillovers significantly decreases the number of firms.Thus the positive effect of lower cumulativeness on the number of firms is almostcompletely offset by the negative effect of lower spillovers under this regime. Inthe opposite case, the negative effect of higher cumulativeness is again offset bythe positive effect of high spillovers, but here the former effect dominates.
In cases with opposite spillover and cumulativeness conditions, we observe thatthe dummy for low cumulativeness and high spillover is significantly positive:low cumulativeness and high spillovers reinforce each other in this case.However, no significant interaction emerges in the opposite scenario, i.e., nosignificant interaction is observed between high cumulativeness and lowspillovers under the quality regime. Under the intermediate regime, this latterinteraction is significantly positive. Here, high spillovers and low cumulativenesstogether result in a higher number of firms than would be expected on the basis ofthese two effects individually. The other significant interaction under theintermediate regime emerges with high spillover and high cumulativeness. Asunder the quality regime, the negative effect of higher cumulativeness is againoffset by the positive effect of high spillovers, where the former effect dominates.Finally, under the network regime no significant interaction is observed betweencumulativeness and spillovers.
With regard to concentration levels the dummies for lower cumulativeness andhigher spillovers are insignificant across all adoption regimes. Further, the dummyfor low spillovers is insignificant under the quality regime, but significant underthe other regimes. Finally, none of the dummies covering the interaction effects isstatistically significant under any of the three adoption regimes. Thus,concentration levels are less affected by varying the cumulativeness and spilloverconditions than the total number of firms, indicating that most of the differencesappear in the lower firm size classes.
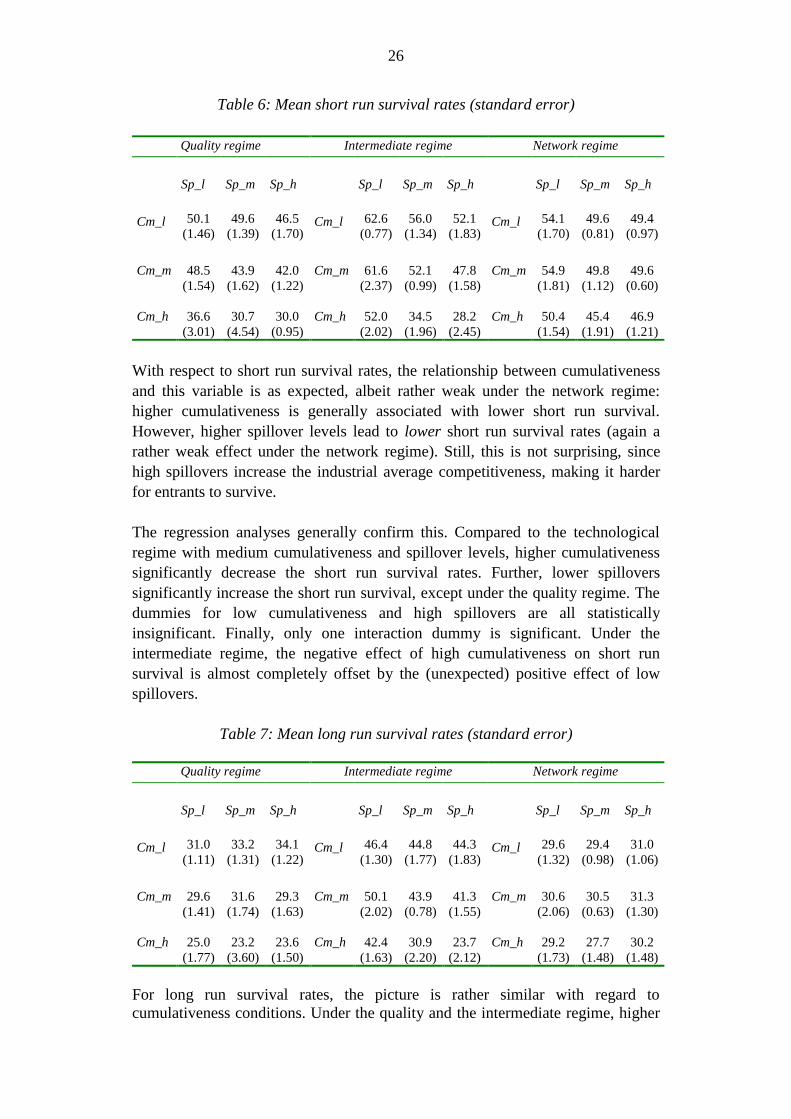
26
Table 6: Mean short run survival rates (standard error)
Quality regime Intermediate regime Network regime
Sp_l Sp_m Sp_h Sp_l Sp_m Sp_h Sp_l Sp_m Sp_h
Cm_l 50.1(1.46)
49.6(1.39)
46.5(1.70)
Cm_l 62.6(0.77)
56.0(1.34)
52.1(1.83)
Cm_l 54.1(1.70)
49.6(0.81)
49.4(0.97)
Cm_m 48.5(1.54)
43.9(1.62)
42.0(1.22)
Cm_m 61.6(2.37)
52.1(0.99)
47.8(1.58)
Cm_m 54.9(1.81)
49.8(1.12)
49.6(0.60)
Cm_h 36.6(3.01)
30.7(4.54)
30.0(0.95)
Cm_h 52.0(2.02)
34.5(1.96)
28.2(2.45)
Cm_h 50.4(1.54)
45.4(1.91)
46.9(1.21)
With respect to short run survival rates, the relationship between cumulativenessand this variable is as expected, albeit rather weak under the network regime:higher cumulativeness is generally associated with lower short run survival.However, higher spillover levels lead to lower short run survival rates (again arather weak effect under the network regime). Still, this is not surprising, sincehigh spillovers increase the industrial average competitiveness, making it harderfor entrants to survive.
The regression analyses generally confirm this. Compared to the technologicalregime with medium cumulativeness and spillover levels, higher cumulativenesssignificantly decrease the short run survival rates. Further, lower spilloverssignificantly increase the short run survival, except under the quality regime. Thedummies for low cumulativeness and high spillovers are all statisticallyinsignificant. Finally, only one interaction dummy is significant. Under theintermediate regime, the negative effect of high cumulativeness on short runsurvival is almost completely offset by the (unexpected) positive effect of lowspillovers.
Table 7: Mean long run survival rates (standard error)
Quality regime Intermediate regime Network regime
Sp_l Sp_m Sp_h Sp_l Sp_m Sp_h Sp_l Sp_m Sp_h
Cm_l 31.0(1.11)
33.2(1.31)
34.1(1.22)
Cm_l 46.4(1.30)
44.8(1.77)
44.3(1.83)
Cm_l 29.6(1.32)
29.4(0.98)
31.0(1.06)
Cm_m 29.6(1.41)
31.6(1.74)
29.3(1.63)
Cm_m 50.1(2.02)
43.9(0.78)
41.3(1.55)
Cm_m 30.6(2.06)
30.5(0.63)
31.3(1.30)
Cm_h 25.0(1.77)
23.2(3.60)
23.6(1.50)
Cm_h 42.4(1.63)
30.9(2.20)
23.7(2.12)
Cm_h 29.2(1.73)
27.7(1.48)
30.2(1.48)
For long run survival rates, the picture is rather similar with regard tocumulativeness conditions. Under the quality and the intermediate regime, higher
27
cumulativeness decreases long run survival, whereas long run survival under thenetwork regime is not effected by different cumulativeness conditions. Higherspillover conditions only seem to have a (negative) effect on long run survivalunder the intermediate regime.
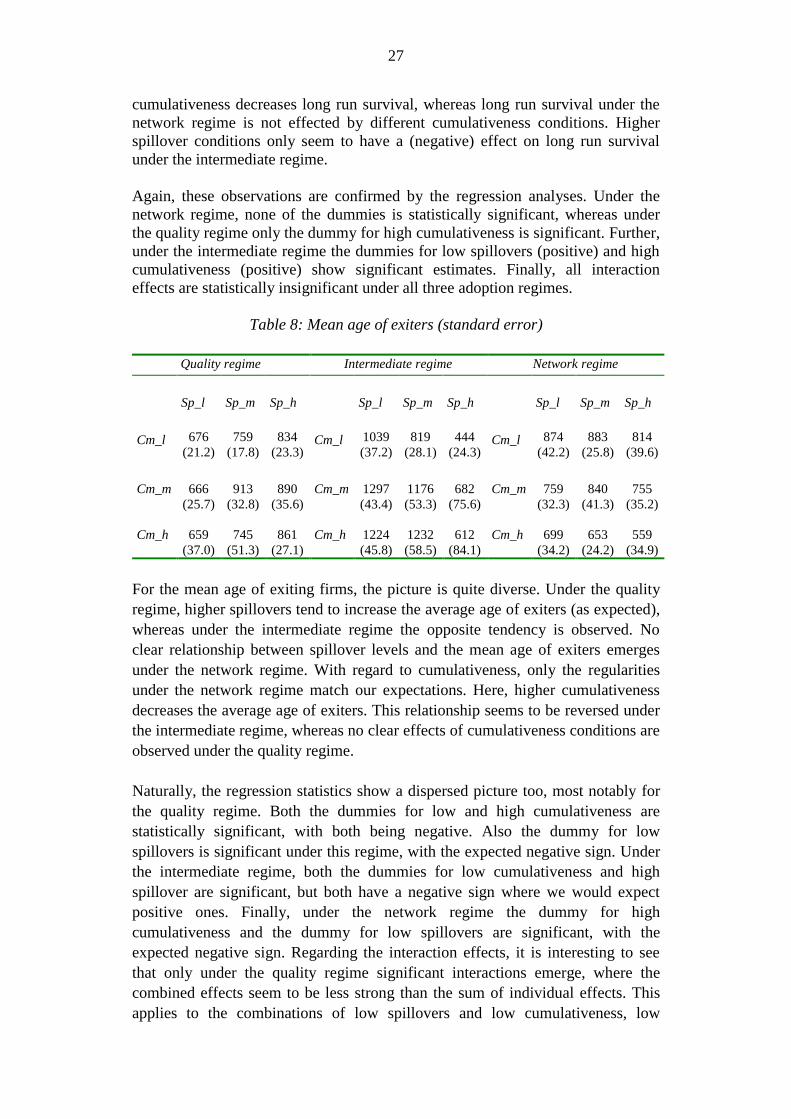
Again, these observations are confirmed by the regression analyses. Under thenetwork regime, none of the dummies is statistically significant, whereas underthe quality regime only the dummy for high cumulativeness is significant. Further,under the intermediate regime the dummies for low spillovers (positive) and highcumulativeness (positive) show significant estimates. Finally, all interactioneffects are statistically insignificant under all three adoption regimes.
Table 8: Mean age of exiters (standard error)
Quality regime Intermediate regime Network regime
Sp_l Sp_m Sp_h Sp_l Sp_m Sp_h Sp_l Sp_m Sp_h
Cm_l 676(21.2)
759(17.8)
834(23.3)
Cm_l 1039(37.2)
819(28.1)
444(24.3)
Cm_l 874(42.2)
883(25.8)
814(39.6)
Cm_m 666(25.7)
913(32.8)
890(35.6)
Cm_m 1297(43.4)
1176(53.3)
682(75.6)
Cm_m 759(32.3)
840(41.3)
755(35.2)
Cm_h 659(37.0)
745(51.3)
861(27.1)
Cm_h 1224(45.8)
1232(58.5)
612(84.1)
Cm_h 699(34.2)
653(24.2)
559(34.9)
For the mean age of exiting firms, the picture is quite diverse. Under the qualityregime, higher spillovers tend to increase the average age of exiters (as expected),whereas under the intermediate regime the opposite tendency is observed. Noclear relationship between spillover levels and the mean age of exiters emergesunder the network regime. With regard to cumulativeness, only the regularitiesunder the network regime match our expectations. Here, higher cumulativenessdecreases the average age of exiters. This relationship seems to be reversed underthe intermediate regime, whereas no clear effects of cumulativeness conditions areobserved under the quality regime.
Naturally, the regression statistics show a dispersed picture too, most notably forthe quality regime. Both the dummies for low and high cumulativeness arestatistically significant, with both being negative. Also the dummy for lowspillovers is significant under this regime, with the expected negative sign. Underthe intermediate regime, both the dummies for low cumulativeness and highspillover are significant, but both have a negative sign where we would expectpositive ones. Finally, under the network regime the dummy for highcumulativeness and the dummy for low spillovers are significant, with theexpected negative sign. Regarding the interaction effects, it is interesting to seethat only under the quality regime significant interactions emerge, where thecombined effects seem to be less strong than the sum of individual effects. Thisapplies to the combinations of low spillovers and low cumulativeness, low

28
spillovers and high cumulativeness, and high spillovers and high cumulativeness.
Table 9: Mean age at t = 5000 (standard error)
Quality regime Intermediate regime Network regime
Sp_l Sp_m Sp_h Sp_l Sp_m Sp_h Sp_l Sp_m Sp_h
Cm_l 1298(82.3)
1444(81.5)
1682(75.5)
Cm_l 1938(59.8)
2029(58.4)
2316(75.6)
Cm_l 2055(109)
2234(68.8)
2359(85.3)
Cm_m 1281(122)
1852(177)
2024(132)
Cm_m 2275(37.3)
2937(67.6)
3294(47.3)
Cm_m 2253(174)
2374(118)
2522(56.4)
Cm_h 2112(424)
2717(390)
2365(183)
Cm_h 2768(157)
3827(129)
4098(120)
Cm_h 2067(72.9)
2438(122)
2385(116)
The average age of the total population at the ultimate period (table 9) generallyincreases with cumulativeness and spillover conditions under the intermediateregime and, to a lesser extent, under the quality regime, whereas no relationshipsemerge under the network regime.Also the regression statistics show no significant dummies for the networkregime. For the quality regime, only the dummy for high cumulativeness isstatistically significant. The dummies for cumulativeness have the expected signand are both significant under the intermediate regime. The dummies for spilloverconditions are also statistically significant, however their signs do not match theexpectations based on the technological regime framework.
Interaction effects are only significant under the intermediate regime this time.The (expected) negative effect of low cumulativeness combined with the(unexpected) negative effect of low spillovers results in an older population thanwe would expect from those two effects individually. The positive effect of highcumulativeness on the average age of the total population is more than offset bythe negative effect of low spillovers when these are combined.
In conclusion, we observe that with regard to the cumulativeness conditions theregularities predicted by the technological regime framework are reproduced bythe model. In general, we see a smaller, more concentrated and eventually olderpopulation of firms when cumulativeness conditions are high. Spillover conditionsare in line with the expectations regarding the number of firms and concentrationlevels. I.e., higher spillovers lead to a higher number of firms and to lowerconcentration levels. However, they do not increase survival rates or decrease theaverage age of the population.
A possible explanation for this is that the benefits of the incumbents from highspillovers are such that they easily imitate and survive, thereby increasing theindustrial average competitiveness. This process leads both to an eventually olderpopulation, as well as to hard survival conditions for entrants. Another reason for
29
this inconsistency with the technological regime framework is that our model doesnot allow for analysing the effect of the technological regime conditions ondifferences between the innovative activities of incumbents and entrants.Innovation is exogenous in our model, and perhaps endogenising the innovationprocess would make our model more consistent with the technological regimeframework.
Finally, we observe that the regularities emerging under the network regime arethe least affected by variations in spillover and cumulativeness conditions. Alsothe interaction effects between spillovers and cumulativeness are never significantunder the network regime. Apparently, the emerging regularities under this regimeare mainly determined by the network externalities among users and the resultingdiffusion patterns of new product technologies. Under the quality andintermediate regime, we have found some significant interaction effects, howeverthey do not appear to systematically affect the results.
6. Conclusions
This paper has shown that sectoral variations in the dynamics of the firmpopulation can be explained by differences in the timing and frequency of newproduct technology adoptions. Assuming that varying consumer preferences overtechnology advance and network size effects, and different degrees ofcompatibility between succeeding technologies explain why in some industriestechnologies are more often replaced than in others (see Shy, 1996), we analysed,by means of a simulation model, how the different replacement patterns wouldeffect the dynamics of the firm population. We designed and investigated threedifferent technology adoption regimes with the following underlying conditions:(i) a quality regime, in which quality and network size are regarded as perfectsubstitutes and new product technologies are highly compatible with oldtechnologies, (ii ) an intermediate regime, in which new product technologies areless compatible with old technologies, but where quality and network size are stillregarded as perfect substitutes, and (iii ) a network regime, in which network sizeand quality are regarded as complementary. By modelling the growth of a firm’scompetitiveness as a function of both the quality level and the market share of theproduct technology it employs, and by tuning the parameters of this function toarrange the adoption regimes, the model produces the following results.
First of all, three rather different replacement patterns of technologies emerge. Inthe quality regime, technologies are continuously and rather quickly replaced bysuperior technologies as soon as they become available. In the intermediateregime, newer technologies still always replace older ones, but the duration of atechnology is higher than under the quality regime. Finally, in the network regimeeventually one technology always dominates the market until it becomes obsolete(despite the presence of superior technologies), after which it is quickly replacedby a new technology that again dominates until its obsolescence.
30
The second result is that the replacement patterns of product technologies clearlyaffect the dynamics of the firm population. The quality regime produces thesmallest, but most dynamic population of firms, whereas the largest firmpopulation emerges under the network regime. The intermediate regime exhibitsthe most stable population of firms, where long run survival is relatively easy.
The third result is that for all three regimes the model is able to reproduce anumber of important stylised facts from industrial organisation. The modelproduces persistence of market turbulence due to entry and exit; high infantmortality, negatively correlated with firm age; growth rates of firms that fall withage and with size; persistence of asymmetric performances; and skewed andrelatively stable size distributions.
The fourth result is that all these outcomes are obtained in the absence ofreplicator dynamics. There is no explicit relationship in our model between afirm’s relative competitiveness and its growth rate. The only selection mechanismin our model is that a minimum level of relative competitiveness is required inorder to survive. This rather simple mechanism turns out to be sufficient toproduce meaningful results, consistent with the previously mentioned stylisedfacts.
The fifth and final result is derived from running the model under differenttechnological regimes, represented by various cumulativeness and spilloverconditions. In general, we see a smaller, more concentrated and eventually olderpopulation of firms when cumulativeness conditions are high. These regularitiesare in line with the technological regime framework. Spillover conditions,however, are only partly consistent with this framework. Higher spillovers indeedlead to a higher number of firms and lower concentration levels. However, theydo not generally increase survival rates or decrease the average age of thepopulation. The explanation for this is found in the trivial effect of high spilloverconditions on the competitiveness of incumbent firms vis-à-vis entrants. Highspillover conditions enable more continuing firms to imitate, which increases theindustrial average competitiveness. This, in turn, deteriorates the generalconditions for entrants and makes it more difficult for them to survive. Finally, weobserved that the regularities emerging under the network regime are the leastaffected by varying cumulativeness and spillover conditions.
Endogenising the innovation process could make our model more consistent withthe technological regime framework. Since innovation is exogenous in our model,we cannot analyse the effect of the technological regime conditions on differencesbetween the innovative activities of incumbents and entrants. Perhaps futureefforts in this direction will enable us to better assess the interaction between thedemand side oriented adoption regimes and the more supply side orientedtechnological regimes.
31
References
Breschi, S., F. Malerba and L. Orsenigo (1996), ‘Technological regimes andSchumpeterian patterns of innovation’. Paper prepared for the Meeting of theJosef A. Schumpeter Society, Stockholm, June 2-5, 1996.
Dosi, G., O Marsili, L. Orsenigo and R. Salvatore (1995): “Learning, MarketSelection and the Evolution of Industrial Structures”. Small Business Economics7: 411-436.
Evans, D. (1987a): “Tests of Alternative Theories of Firm Growth”. Journal ofPolitical Economy 95 (4) 657-674.
Evans, D. (1987b): “The Relationship between Firm Growth, Size, and Age:Estimates for 100 Manufacturing Industries”. The Journal of IndustrialEconomics 35 (4): 567-581.
Geroski, P. (1998): “The growth of firms in theory and in practice”. Paperprepared for the 1998 DRUID Conference on “Competencies, Governance andEntrepreneurship”.
Jovanovic, B. (1982): “Selection and the evolution of industry”. Econometrica 50(3) : 649-670.
Malerba, F., and L. Orsenigo (1996), ‘Schumpeterian patterns of innovation aretechnology specific’. Research Policy 25 (3), 451-478.
Nelson, R. and Winter, S. (1982): ‘An Evolutionary Theory of EconomicChange’. Cambridge: Harvard University Press.
Shy, O. (1996): “Technology revolutions in the presence of networkexternalities”. International Journal of Industrial Organization 14: 785-800.
Silverberg, G., and Lehnert, D. (1993): “Long waves and ‘evolutionary chaos’ ina simple Schumpeterian model of embodied technical change”. Structural Changeand Economic Dynamics 4: 9-37.
Silverberg, G., and Verspagen, B. (1994a): “Collective learning, innovation andgrowth in a boundedly rational, evolutionary world”. Journal of EvolutionaryEconomics 4: 207-226.
Silverberg, G., and Verspagen, B. (1994a): “Learning, innovation and economicgrowth: a long-run model of industrial dynamics”. Industrial and CorporateChange 3: 199-223.
Winter, S. (1984): ‘Schumpeterian Competition in Alternative TechnologicalRegimes’. Journal of Economic Behavior and Organization 5: 287-320.
32
Appendix: regression statistics section 4
Table A Number of firms Herfindahl-index
Qualityregime
Intermediateregime
Networkregime
Qualityregime
Intermediateregime
Networkregime
Constant 21.2**
(18.8)56.1**
(24.6)66.3**
(24.4)12.5**
(5.32)3.57**
(10.8)3.44**
(8.96)Cm_l 13.2**
(8.32)11.5**
(3.58)-3.36
(-0.88)-6.42
(-1.93)0.05
(0.11)0.09
(0.17)Cm_h -9.02**
(-5.67)-19.3**
(-5.96)-17.1**
(-4.46)10.9**
(3.26)1.72**
(3.66)1.44**
(2.66)Sp_l -4.02**
(-2.53)-15.7**
(-4.86)-17.8**
(-4.65)0.06
(0.02)1.66**
(3.54)1.45**
(2.66)Sp_h 9.60**
(6.03)16.0**
(4.96)18.1**
(4.72)-4.87
(-1.46)-0.68
(-1.44)-0.45
(-0.83)Cm_l x Sp_l -8.01**
(-3.56)-0.70
(-0.15)1.34
(0.25)3.92
(0.83)0.78
(-1.18)0.39
(0.51)Cm_l x Sp_h 4.63*
(2.06)-0.48
(-0.10)6.70
(1.23)3.38
(0.72)0.02
(0.04)-0.31
(-0.41)Cm_h x Sp_l 2.03
(0.90)10.0*
(2.19)8.55
(1.58)7.73
(1.64)-0.57
(-0.87)-0.61
(-0.80)Cm_h x Sp_h -5.72**
(-2.54)-10.3*
(-2.25)4.00
(0.74)-3.71
(-0.79)0.28
(0.42)-1.05
(-1.36)
Adjusted R2 0.91 0.84 0.78 0.53 0.51 0.39Note: t-values are in parentheses. * Significant at the 5-% level. ** Significant at the 1-% level.
Table B Short run survival rates Long run survival rates
Qualityregime
Intermediateregime
Networkregime
Qualityregime
Intermediateregime
Networkregime
Constant 43.9**
(19.9)52.1**
(29.1)49.8**
(36.4)31.6**
(17.2)43.9**
(25.2)30.5**
(21.9)Cm_l 5.70
(1.82)3.89(1.54)
-0.23(-0.88)
1.63(0.63)
0.93(0.11)
-1.12(-0.57)
Cm_h -13.2**
(-4.22)-17.5**
(-6.94)-4.38*
(-2.26)-8.38**
(-3.22)-13.0**
(-5.28)-2.80(-1.42)
Sp_l 4.57(1.46)
9.52**
(3.77)5.06**
(2.62)-1.98(-0.76)
6.17**
(2.51)0.08(0.04)
Sp_h -1.87(-0.60)
-4.30(-1.70)
-0.24(-0.12)
-2.26(-0.87)
-2.57(-1.05)
0.78(0.40)
Cm_l x Sp_l -4.11(-0.93)
-2.91(-0.81)
-0.54(-0.20)
-0.23(-0.06)
-4.59(-1.32)
0.14(0.05)
Cm_l x Sp_h -1.22(-0.28)
0.47(0.13)
0.10(0.04)
3.21(0.87)
2.03(0.58)
0.80(0.29)
Cm_h x Sp_l 1.29(0.29)
7.91*
(2.21)-0.11(-0.04)
3.75(1.64)
5.32(1.53)
1.38(0.49)
Cm_h x Sp_h 1.14(0.26)
-2.00(-0.56)
1.74(0.64)
2.66(0.72)
-4.69(-1.35)
1.70(0.61)
Adjusted R2 0.51 0.78 0.25 0.26 0.66 0.00Note: t-values are in parentheses. * Significant at the 5-% level.
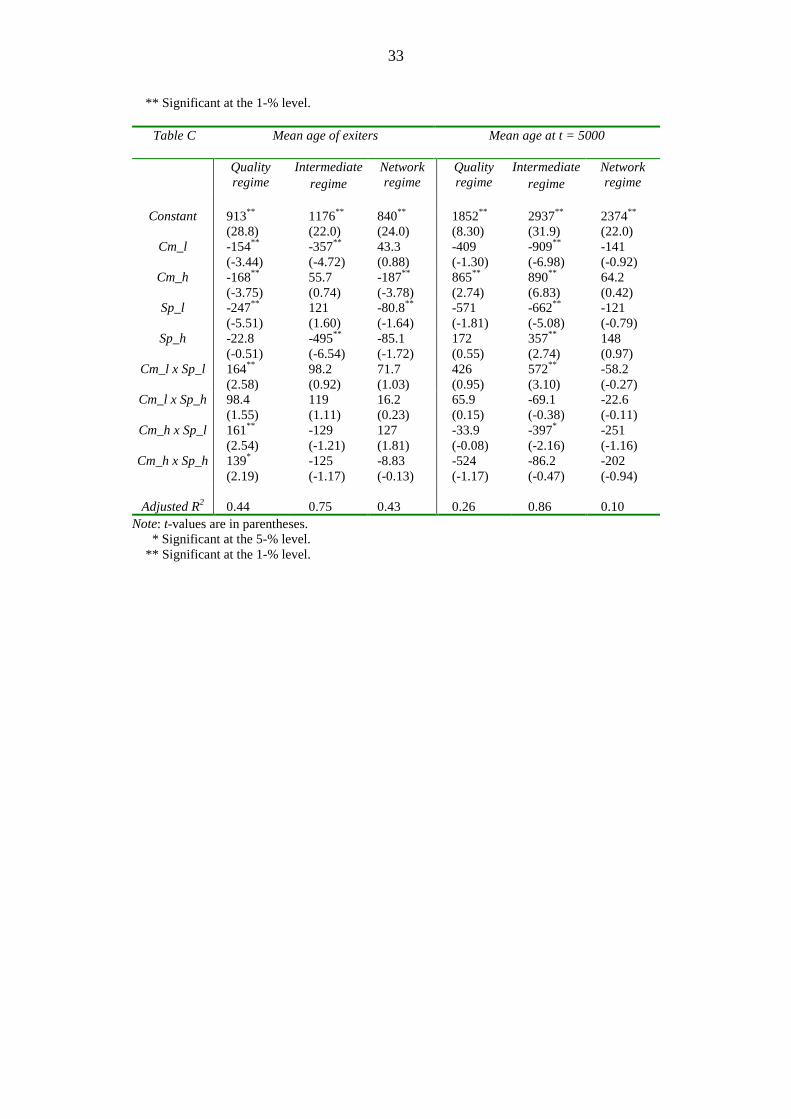
33
** Significant at the 1-% level.
Table C Mean age of exiters Mean age at t = 5000
Qualityregime
Intermediateregime
Networkregime
Qualityregime
Intermediateregime
Networkregime
Constant 913**
(28.8)1176**
(22.0)840**
(24.0)1852**
(8.30)2937**
(31.9)2374**
(22.0)Cm_l -154**
(-3.44)-357**
(-4.72)43.3(0.88)
-409(-1.30)
-909**
(-6.98)-141(-0.92)
Cm_h -168**
(-3.75)55.7(0.74)
-187**
(-3.78)865**
(2.74)890**
(6.83)64.2(0.42)
Sp_l -247**
(-5.51)121(1.60)
-80.8**
(-1.64)-571(-1.81)
-662**
(-5.08)-121(-0.79)
Sp_h -22.8(-0.51)
-495**
(-6.54)-85.1(-1.72)
172(0.55)
357**
(2.74)148(0.97)
Cm_l x Sp_l 164**
(2.58)98.2(0.92)
71.7(1.03)
426(0.95)
572**
(3.10)-58.2(-0.27)
Cm_l x Sp_h 98.4(1.55)
119(1.11)
16.2(0.23)
65.9(0.15)
-69.1(-0.38)
-22.6(-0.11)
Cm_h x Sp_l 161**
(2.54)-129(-1.21)
127(1.81)
-33.9(-0.08)
-397*
(-2.16)-251(-1.16)
Cm_h x Sp_h 139*
(2.19)-125(-1.17)
-8.83(-0.13)
-524(-1.17)
-86.2(-0.47)
-202(-0.94)
Adjusted R2 0.44 0.75 0.43 0.26 0.86 0.10Note: t-values are in parentheses. * Significant at the 5-% level. ** Significant at the 1-% level.

34
Danish Research Unit for I ndustrial DynamicsThe Research Programme
The DRUID-research programme is organised in 3 different research themes:
- The firm as a learning organisation
- Competence building and inter-firm dynamics
- The learning economy and the competitiveness of systems of innovation
In each of the three areas there is one strategic theoretical and onecentral empirical and policy oriented orientation.
Theme A: The firm as a learning organisation
The theoretical perspective confronts and combines the resource-based view (Penrose, 1959)with recent approaches where the focus is on learning and the dynamic capabilities of the firm(Dosi, Teece and Winter, 1992). The aim of this theoretical work is to develop an analyticalunderstanding of the firm as a learning organisation.
The empirical and policy issues relate to the nexus technology, productivity, organisationalchange and human resources. More insight in the dynamic interplay between these factors atthe level of the firm is crucial to understand international differences in performance at themacro level in terms of economic growth and employment.
Theme B: Competence building and inter-firm dynamics
The theoretical perspective relates to the dynamics of the inter-firm division of labour and theformation of network relationships between firms. An attempt will be made to developevolutionary models with Schumpeterian innovations as the motor driving a Marshallianevolution of the division of labour.
The empirical and policy issues relate the formation of knowledge-intensive regional andsectoral networks of firms to competitiveness and structural change. Data on the structure ofproduction will be combined with indicators of knowledge and learning. IO-matrixes whichinclude flows of knowledge and new technologies will be developed and supplemented bydata from case-studies and questionnaires.
Theme C: The learning economy and the competitiveness of systems of innovation.

35
The third theme aims at a stronger conceptual and theoretical base for new concepts such as'systems of innovation' and 'the learning economy' and to link these concepts to the ecologicaldimension. The focus is on the interaction between institutional and technical change in aspecified geographical space. An attempt will be made to synthesise theories of economicdevelopment emphasising the role of science based-sectors with those emphasising learning-by-producing and the growing knowledge-intensity of all economic activities.
The main empirical and policy issues are related to changes in the local dimensions ofinnovation and learning. What remains of the relative autonomy of national systems ofinnovation? Is there a tendency towards convergence or divergence in the specialisation intrade, production, innovation and in the knowledge base itself when we compare regions andnations?
The Ph.D.-programme
There are at present more than 10 Ph.D.-students working in close connection to the DRUIDresearch programme. DRUID organises regularly specific Ph.D-activities such as workshops,seminars and courses, often in a co-operation with other Danish or international institutes.Also important is the role of DRUID as an environment which stimulates the Ph.D.-studentsto become creative and effective. This involves several elements:
- access to the international network in the form of visiting fellows and visits at the sisterinstitutions
- participation in research projects- access to supervision of theses- access to databasesEach year DRUID welcomes a limited number of foreign Ph.D.-students who wants to workon subjects and project close to the core of the DRUID-research programme.
External projects
DRUID-members are involved in projects with external support. One major project whichcovers several of the elements of the research programme is DISKO; a comparative analysisof the Danish Innovation System; and there are several projects involving international co-operation within EU's 4th Framework Programme. DRUID is open to host other projects asfar as they fall within its research profile. Special attention is given to the communication ofresearch results from such projects to a wide set of social actors and policy makers.

36
DRUID Working Papers
96-1 Lundvall, Bengt-Åke: The Social Dimension of the Learning Economy.(ISBN 87-7873-000-7)
96-2 Foss, Nicolai J.: Firms, Incomplete Contracts and Organizational Learning.(ISBN 87-7873-001-5)
96-3 Dalum, Bent and Villumsen, Gert: Are OECD Export Specialisation PatternsSticky?’ Relations to the Convergence-Divergence Debate. (ISBN 87-7873-002-3)
96-4 Foss, Nicolai J: Austrian and Post-Marshallian Economics: The Bridging Work ofGeorge Richardson. (ISBN 87-7873-003-1)
96-5 Andersen, Esben S., Jensen, Anne K., Madsen, Lars and Jørgensen, Martin: TheNelson and Winter Models Revisited: Prototypes for Computer-Based Reconstructionof Schumpeterian Competition. (ISBN 87-7873-005-8)
96-6 Maskell, Peter: Learning in the village economy of Denmark. The role of institutionsand policy in sustaining competitiveness. (ISBN 87-7873-006-6)
96-7 Foss, Nicolai J. & Christensen, Jens Frøslev: A Process Approach to CorporateCoherence. (ISBN 87-7873-007-4)
96-8 Foss, Nicolai J.: Capabilities and the Theory of the Firm. (ISBN 87-7873-008-2)
96-9 Foss, Kirsten: A transaction cost perspective on the influence of standards on productdevelopment: Examples from the fruit and vegetable market. (ISBN 87-7873-009-0)
96-10 Richardson, George B.: Competition, Innovation and Increasing Returns. (ISBN 87-7873-010-4)
96-11 Maskell, Peter: Localised low-tech learning in the furniture industry.(ISBN 87-7873-011-2)
96-12 Laursen, Keld: The Impact of Technological Opportunity on the Dynamics of TradePerformance. (ISBN 87-7873-012-0)
96-13 Andersen, Esben S.: The Evolution of an Industrial Sector with a Varying Degree ofRoundaboutness of Production. (ISBN 87-7873-013-9)
37
96-14 Dalum, Bent, Laursen, Keld & Villumsen, Gert: The Long Term Development ofOECD Export Specialisation Patterns: De-specialisation and “Stickiness”. (ISBN 87-7873-014-7)
96-15 Foss, Nicolai J.: Thorstein B. Veblen: Precursor of the Competence-Based Approachto the Firm. (ISBN 87-7873-015-5)
96-16 Gjerding, Allan Næs: Organisational innovation in the Danish private businesssector. (ISBN 87-7873-016-3)
96-17 Lund, Reinhard & Gjerding, Allan Næs: The flexible company Innovation, workorganisation and human ressource management. (ISBN 87-7873-017-1)
97-1 Foss, Nicolai J.: The Resource-Based Perspective: An Assessment and Diagnosis ofProblems. (ISBN 87-7873-019-8)
97-2 Langlois, Richard N. & Foss, Nicolai J.: Capabilities and Governance: the Rebirthof Production in the Theory of Economic Organization. (ISBN 87-7873-020-1)
97-3 Ernst, Dieter: Partners for the China Circle? The Asian Production Networks ofJapanese Electronics Firms. (ISBN 87-7873-022-8)
97-4 Richardson, George B.: Economic Analysis, Public Policy and the SoftwareIndustry. (ISBN 87-7873-023-6)
97-5 Borrus, Michael & Zysman, John: You Don’t Have to Be A Giant: How TheChanging Terms of Competition in Global Markets are Creating New Possibilities ForDanish Companies. (ISBN 87-7873-024-4)
97-6 Teubal, Morris.: Restructuring and Embeddeness of Business Enterprises-Towardsan Innovation System Perspective on Diffusion Policy. (ISBN 87-7873-025-2)
97-7 Ernst, Dieter & Guerrieri, Paolo: International Production Networks and ChangingTrade Patterns in East Asia: The case of the Electronics Industry. (ISBN 87-7873-026-0)
97-8 Lazaric, Nathalie & Marengo, Luigi: Towards a Characterisation of Assets andKnowledge Created in Technological Agreements: Some evidence from theautomobile-robotics sector. (ISBN 87-7873-027-9)
97-9 Ernst, Dieter.: High-Tech Competition Puzzles. How Globalization Affects FirmBehavior and Market Structure in the Electronics Industry. (ISBN 87-7873-028-7)
97-10 Foss, Nicolai J.: Equilibrium vs Evolution in the Resource-Based Perspective: TheConflicting Legacies of Demsetz and Penrose. (ISBN 87-7873-029-5)
38
97-11 Foss, Nicolai J.: Incomplete Contracts and Economic Organisation: Brian Loasbyand the Theory of the firm. (ISBN 87-7873-030-9)
97-12 Ernst, Dieter & Lundvall, Bengt-Åke: Information Technology in The LearningEconomy – Challenges for Developing Countries. (ISBN 87-7873-031-7)
97-13 Kristensen, Frank Skov (p): A study of four organisations in different competitiveenvironments. (ISBN 87-7873-032-5)
97-14 Drejer, Ina, (p) Kristensen, Frank Skov (p) & Laursen, Keld (p): Studies ofClusters as a Basis for Industrial and Technology Policy in the Danish Economy.(ISBN 87-7873-033-3)
97-15 Laursen, Keld (p) & Drejer, Ina (p): Do Inter-sectoral Linkages Matter forInternational Export Specialisation? (ISBN 87-7873-034-1)
97-16 Lundvall, Bengt-Åke & Kristensen, Frank Skov (p): Organisational change,innovation and human resource Development as a response to increased competition.(ISBN 87-7873-036-8)
98-1 Præst, Mette (p): An Empirical Model of Firm Behaviour: A dynamic Approach toCompetence Accumulation and Strategic Behaviour. (ISBN 87-7873-037-6)
98-2 Ducatel, Ken: Learning and skills in the Knowledge Economy. (ISBN 87-7873-038-4)
98-3 Ernst, Dieter: What Permits Small Firms to Compete in High-Tech Industries?Inter-Organizational Knowledge Creation in the Taiwanese Computer Industry.(ISBN 87-7873-039-2)
98-4 Christensen, Jens Frøslev: The Dynamics of the Diversified Corporation and theRole of Central Management of Technology. (ISBN 87-7873-040-6)
98-5 Valente, Marco (p): Laboratory for Simulation Development. (ISBN 87-7873-041-4)
98-6 Valente, Marco (p): Technological Competition: a Qualitative Product Life Cycle.(ISBN 87-7873-042-2)
98-7 Lam, Alice: The Social Embeddedness of Knowledege: Problems of KnowledgeSharing and Organisational Learning in International High-Technology Ventures.(ISBN 87-7873-043-0)
98-8 Jørgensen, Kenneth M. (p): Information Technology and Change in DanishOrganizations. (ISBN 87-7873-044-9)

39
98-9 Andersen, Esben Sloth: Escaping Satiation in an Evolutionary Model of Structuraleconomic Dynamics. (ISBN 87-7873-045-7)
98-10 Foss, Kirsten: Technological Interdependencies, Specialization and Coordination: AProperty Rights Perspective on The Nature of the Firm. (ISBN 87-7873-046-5)
98-11 Andersen, Poul H: Organizing International Technological Collaboration inSubcontractor Relationships. An Investigation of the Knowledge-StickynessProblem. (ISBN 87-7873-047-3)
98-12 Nymark, Søren (p): Billeder af strategi i forandringsrige organisatoriskeomgivelser: 3 cases fra DISKO studierne. (ISBN 87-7873-048-1)
98-13 Andersen, Esben Sloth: The Evolution of the Organisation of Industry. (ISBN 87-7873-050-3)
98-14 Foss, Kirsten & Foss, Nicolai J.: The Market Process and The Firm: Toward aDynamic Property Rights Perspective. (ISBN 87-7873-051-1)
98-15 Lorenz, Edward: Societal Effects and the Transfer of Business Practices to Britainand France. (ISBN 87-7873-053-8)
98-16 Ernst, Dieter: Catching-Up, Crisis and Industrial Upgrading. Evolutionary Aspectsof Technological Learning in Korea's Electronics Industry. (ISBN 87-7873-054-6)
98-17 Kaisla, Jukka (p): The Market Process and the Emergence of the Firm: SomeIndications of Entrepreneurship Under Genuine Uncertainty. (ISBN 87-7873-055-4)
98-18 Laursen, Keld (p): Do Export and Technological Specialisation Patterns Co-evolvein Terms of Convergence or Divergence?: Evidence from 19 OECD Countries, 1971-1991. (ISBN 87-7873-056-2)
98-19 Foss, Nicolai J.: Firms and the Coordination of Knowledge: Some Austrian Insights.(ISBN 87-7873-057-0)
98-20 Mahnke, Volker (p) & Aadne, John Harald: Process of Strategic Renewal,Competencies, and the Management of Speed. (ISBN 87-7873-058-9)
98-21 Lorenzen, Mark (p): Information, cost learning, and trust. Lessons form co-operation and higher-order capabilities amongst geographically proximate firms.(ISBN 87-7873-059-7)
98-22 Lam, Alice: Tacit Knowledge, Organisational Learning and Innovation: A SocietalPerspective. (ISBN 87-7873-060-0)
98-23 Lund, Reinhard: Organizational and innovative flexibility mechanisms and theirimpact upon organizational effectiveness. (ISBN 87-7873-061-9)
98-24 Christensen, Jesper Lindgaard & Drejer, Ina (p): Finance and Innovation Systemor Chaos. (ISBN 87-7873-062-7)
40
98-25 Laursen, Keld (p): How Structural Change Differs, and Why it Matters (forEconomic Growth) (ISBN 87-7873-063-5)
98-26 Holmén, Magnus & Jacobsson, Staffan: A method for identifying actors in aknowledge based cluser. (ISBN 87-7873-064-3)
98-27 Richardson, G. B.: Production, Planning and Prices. (ISBN 87-7873-065-1)
98-28 Foss, Nicolai J.: Austrian Economics and Game Theory: a PreliminaryMethodological Stocktaking. (ISBN 87-7873-067-8)
98-29 Foss, Nicolai J. & Mahnke, Volker (p): Strategy Research and the Market ProcessPerspective. (ISBN 87-7873-068-6)
98-30 Laursen, Keld (p): Revealed Comparative Advantage and the Alternatives asMeasures of International Specialisation. (ISBN 87-7873-069-4)
99-1 Lorenz, E.: Organisationaal Innovation, Governance Structure and InnovativeCapacity In British and French Industry. (ISBN 87-7873-070-8)
99-2 Ernst, Dieter: Responses to the Crisis: Constraints to a Rapid Trade Adjustment inEast Asia's Electronics Industry. (ISBN 87-7873-071-6)
99-3 Foss, N. J. : Understanding Leadership: A Coordination Theory. (ISBN 87-7873-072-4)
99-4 Foss, K & Foss, N. J: Understanding Ownership: Residual Rights of Control andAppropriable Control Rights. ( ISBN 87-7873-073-2)
99-5 Foss, K & Foss, N. J: Organizing Economic Experiments: The role of Firms. (ISBN87-7873-075-9)
99-6 Jørgensen Kenneth. M. (p) : The Meaning og Local Knowledges. (ISBN 87-7873-076-7)
99-7 Foss, N. J.: Capabilities, Confusion, and the Costs of Coordination: On SomeProblems in Recent Research On Inter-Firm Relations. (ISBN87-7873-077-5)
99-8 Lund, Reinhard: Tillidsrepræsentantsystemet og de fleksiblevirksomhedsformer.Juli 1999. (ISBN887-7873-078-3)
99-9 Nymark, Søren: Organisatorisk læring gennem den værdibaserede organisationsfortællinger. (ISBN 87-7873-079-1)
99-10 Laursen, K. & Meliciani, V.: The importance of technology based inter-sectorallinkages for market share dynamics. (ISBN 87-7873-080-5)
99-11 Laursen, K., Mahnke, V., Vejrup-Hansen, P.: Firm growth from a knowlegdestructure perspective. ( ISBN 87-7873-081-3)
41
99-12 Lundvall, Bengt-Åke, Christensen, Jesper. L.: Extending and Deepening theAnalysis of Innovation Systems - with Emperical Illustrations from the DISCO-project. (ISBN 87-7873-082-1)
00-1 Llerena, Patrick & Oltra, Vanessa: Diversity of innovative strategy as a sourcetechnological performance. (ISBN 87-7873-085-6)
00-2 Llerena, Patrick & Mireille Matt: Technology policy and cooperation:A paradigmatic approach. (ISBN 87-7873-086-4)
00-3 Cusmano, Lucia: Technology Policy and Co-operative R&D: the role of relationalresearch capacity. (ISBN 87-7873-087-2)
00-4 Mikkola, Juliana Hsuan: Modularization assessment of product architecture.
(ISBN87-7873-088-0)
00-5 Yvrande, Anne: The new British railways structure: A transaction cost economicsanalysis. (ISBN87-7873-089-9)
00-6 Dijk, Machiel van, Nomaler Önder: Technological diffusion patterns and theireffects on industrial dynamics. (ISBN 87-7873-090-2)
Information for subscribers.
Subscription price for 1997 is 600 DKr (about 20 papers). The rate for single issues is 40DKr. It is possible to make a commitment to an exchange of papers from related departmentsor research teams. All correspondence concerning the DRUID Working Papers should besend to.
Jonna JacobsenFibigerstræde 4
DK-9220 Aalborg OETel. 45 96 35 82 65Fax. 45 98 15 60 13