Embed Size (px)
Citation preview
Markus Waltl, Dipl.-Ing. Bakk.techn.
THE IMPACT OF SENSORY EFFECTS ON THE
QUALITY OF MULTIMEDIA EXPERIENCE
DISSERTATION
zur Erlangung des akademischen Grades
Doktor der technischen Wissenschaften
Alpen-Adria-Universitat Klagenfurt
Fakultat fur Technische Wissenschaften
1. Begutachter: Univ.-Prof. Dipl.-Ing. Dr. Hermann Hellwagner
Institut fur Informationstechnologie
Alpen-Adria-Universitat Klagenfurt, Austria
2. Begutachter: Prof. Dr. Ian Burnett
School of Electrical and Computer Engineering
Royal Melbourne Institute of Technology, Australia
February 2013

Ehrenwortliche Erklarung
Ich erklare ehrenwortlich, dass ich die vorliegende wissenschaftliche Arbeit selbst-standig angefertigt und die mit ihr unmittelbar verbundenen Tatigkeiten selbst er-bracht habe. Ich erklare weiters, dass ich keine anderen als die angegebenen Hilfs-mittel benutzt habe. Alle aus gedruckten, ungedruckten oder dem Internet im Wort-laut oder im wesentlichen Inhalt ubernommenen Formulierungen und Konzepte sindgemaß den Regeln fur wissenschaftliche Arbeiten zitiert und durch Fußnoten bzw.durch andere genaue Quellenangaben gekennzeichnet.
Die wahrend des Arbeitsvorganges gewahrte Unterstutzung einschließlich signifikanterBetreuungshinweise ist vollstandig angegeben.
Die wissenschaftliche Arbeit ist noch keiner anderen Prufungsbehorde vorgelegt wor-den. Diese Arbeit wurde in gedruckter und elektronischer Form abgegeben. Ichbestatige, dass der Inhalt der digitalen Version vollstandig mit dem der gedrucktenVersion ubereinstimmt.
Ich bin mir bewusst, dass eine falsche Erklarung rechtliche Folgen haben wird.
Declaration of honour
I hereby confirm on my honour that I personally prepared the present academic workand carried out myself the activities directly involved with it. I also confirm thatI have used no resources other than those declared. All formulations and conceptsadopted literally or in their essential content from printed, unprinted or Internetsources have been cited according to the rules for academic work and identified bymeans of footnotes or other precise indications of source.
The support provided during the work, including significant assistance from my su-pervisor has been indicated in full.
The academic work has not been submitted to any other examination authority. Thework is submitted in printed and electronic form. I confirm that the content of thedigital version is completely identical to that of the printed version.
I am aware that a false declaration will have legal consequences.
Unterschrift/Signature:
Klagenfurt, 26. February 2013

CONTENTS Page I
Contents
List of Tables V
List of Figures VIII
Acknowledgements XIII
Abstract XV
Zusammenfassung XVII
1 Introduction 1
1.1 Motivation . . . . . . . . . . . . . . . . . . . . . . . . . . . . . . . . . 1
1.2 Research Questions and Contributions . . . . . . . . . . . . . . . . . 2
1.2.1 Media Player for Sensory Effects . . . . . . . . . . . . . . . . 3
1.2.2 Subjective Quality Evaluations using Sensory Effects . . . . . 4
1.2.3 Sensory Effect Dataset . . . . . . . . . . . . . . . . . . . . . . 4
1.2.4 Recommendations for Sensory Effect Evaluations . . . . . . . 5
1.3 Structure . . . . . . . . . . . . . . . . . . . . . . . . . . . . . . . . . 5
2 Background and Related Work 9
2.1 Quality of Experience vs. Quality of Service . . . . . . . . . . . . . . 9
2.2 Video Quality Assessment Methods . . . . . . . . . . . . . . . . . . . 16
2.2.1 Objective Quality Assessment Methods . . . . . . . . . . . . . 18
2.2.2 Subjective Quality Assessment Methods . . . . . . . . . . . . 22
2.3 Sensory Effect Devices and Research . . . . . . . . . . . . . . . . . . 30
2.3.1 Light-based Devices and Research . . . . . . . . . . . . . . . . 30
2.3.2 Scent-based Devices and Research . . . . . . . . . . . . . . . . 33
2.3.3 Other Devices and Research . . . . . . . . . . . . . . . . . . . 34
2.4 MPEG-V: Media Context and Control . . . . . . . . . . . . . . . . . 35
2.4.1 MPEG-V Architecture . . . . . . . . . . . . . . . . . . . . . . 36
Page II CONTENTS
2.4.2 Sensory Effect Description Language . . . . . . . . . . . . . . 39
2.4.3 Sensory Effect Vocabulary . . . . . . . . . . . . . . . . . . . . 43
2.4.4 Usage Example of SEM . . . . . . . . . . . . . . . . . . . . . 45
2.4.5 Fields of Application and Related Work . . . . . . . . . . . . 47
3 Influence of Sensory Effects on the Viewing Experience 49
3.1 Sensory Effect Media Player . . . . . . . . . . . . . . . . . . . . . . . 50
3.2 Experiment Methodology . . . . . . . . . . . . . . . . . . . . . . . . . 53
3.2.1 Location, Participants and Equipment . . . . . . . . . . . . . 53
3.2.2 Evaluation Procedure . . . . . . . . . . . . . . . . . . . . . . . 54
3.3 Experimental Results . . . . . . . . . . . . . . . . . . . . . . . . . . . 59
3.4 Discussion and Conclusions . . . . . . . . . . . . . . . . . . . . . . . 64
4 Impact of Sensory Effects on the Perceived Video Quality 67
4.1 Experiment Methodology . . . . . . . . . . . . . . . . . . . . . . . . . 68
4.1.1 Location, Participants and Equipment . . . . . . . . . . . . . 68
4.1.2 Procedure and Voting Device . . . . . . . . . . . . . . . . . . 69
4.2 Experimental Results . . . . . . . . . . . . . . . . . . . . . . . . . . . 74
4.2.1 Overall Evaluation Results . . . . . . . . . . . . . . . . . . . . 76
4.2.2 Continuous Voting Results . . . . . . . . . . . . . . . . . . . . 86
4.2.3 Post-Experiment Questionnaire Results . . . . . . . . . . . . . 87
4.3 Discussion and Conclusions . . . . . . . . . . . . . . . . . . . . . . . 89
5 Sensory Effects and the World Wide Web 93
5.1 Architecture of the Web Browser Plug-in . . . . . . . . . . . . . . . . 94
5.2 Experiment Methodology . . . . . . . . . . . . . . . . . . . . . . . . . 96
5.2.1 Participants, Stimuli and Test Environment . . . . . . . . . . 97
5.2.2 Procedure for Evaluation . . . . . . . . . . . . . . . . . . . . . 100
5.3 Experimental Results . . . . . . . . . . . . . . . . . . . . . . . . . . . 104
5.3.1 Benefits of Sensory Effects in the WWW . . . . . . . . . . . . 104
5.3.2 Reduction of Information for the Color Calculation . . . . . . 107
5.4 Discussion and Conclusions . . . . . . . . . . . . . . . . . . . . . . . 113
CONTENTS Page III
6 Sensory Effects and Emotions 117
6.1 Experiment Methodology . . . . . . . . . . . . . . . . . . . . . . . . . 118
6.1.1 Participants, Stimuli and Test Environment . . . . . . . . . . 118
6.1.2 Procedure for Evaluation . . . . . . . . . . . . . . . . . . . . . 122
6.2 Experimental Results . . . . . . . . . . . . . . . . . . . . . . . . . . . 126
6.2.1 Results of the QoE Evaluation . . . . . . . . . . . . . . . . . . 126
6.2.2 Results of the Emotion Evaluation . . . . . . . . . . . . . . . 129
6.2.3 Post-Experiment Questionnaire Results . . . . . . . . . . . . . 141
6.3 Discussion and Conclusions . . . . . . . . . . . . . . . . . . . . . . . 143
7 Sensory Effect Dataset and Evaluation Recommendations 147
7.1 Sensory Effect Dataset . . . . . . . . . . . . . . . . . . . . . . . . . . 148
7.2 Subjective Quality Evaluation Recommendations . . . . . . . . . . . 151
7.2.1 Location . . . . . . . . . . . . . . . . . . . . . . . . . . . . . . 151
7.2.2 Test Setup . . . . . . . . . . . . . . . . . . . . . . . . . . . . . 152
7.2.3 Evaluation Procedure . . . . . . . . . . . . . . . . . . . . . . . 154
7.3 Summary . . . . . . . . . . . . . . . . . . . . . . . . . . . . . . . . . 161
8 Conclusions and Future Work 163
Bibliography 168
List of Publications 183
A Influence of Sensory Effects Material 187
B Perceived Video Quality Material 193
C Sensory Effects and the WWW Material 199
D Sensory Effects and Emotions Material 205
E Dataset Material 227

LIST OF TABLES Page V
List of Tables
2.1 Five-Level Quality Scale. . . . . . . . . . . . . . . . . . . . . . . . . . 25
2.2 Nine-Level Quality Scale. . . . . . . . . . . . . . . . . . . . . . . . . . 25
2.3 Five-Level Impairment Scale. . . . . . . . . . . . . . . . . . . . . . . 28
2.4 Five-Level Continuous Quality Scale. . . . . . . . . . . . . . . . . . . 29
3.1 New Five-Level Enhancement Scale. . . . . . . . . . . . . . . . . . . . 56
3.2 Video Sequences. . . . . . . . . . . . . . . . . . . . . . . . . . . . . . 57
3.3 Video Sequences with Original and Adjusted MOS Scores. . . . . . . 59
3.4 Significant Differences between Video Sequences. . . . . . . . . . . . . 63
4.1 Video Sequences and PSNR/Bit-Rate Versions. . . . . . . . . . . . . 70
4.2 Video Sequences with Original and Adjusted Scores. . . . . . . . . . . 75
4.3 DMOS Results for Babylon A.D. . . . . . . . . . . . . . . . . . . . . 82
4.4 DMOS Results for Earth. . . . . . . . . . . . . . . . . . . . . . . . . 82
4.5 Significant Differences between Perceived Video Qualities for Babylon
A.D. . . . . . . . . . . . . . . . . . . . . . . . . . . . . . . . . . . . . 84
4.6 Significant Differences between Perceived Video Qualities for Earth. . 85
4.7 Significant Differences between Perceived Video Qualities for Both Se-
quences. . . . . . . . . . . . . . . . . . . . . . . . . . . . . . . . . . . 85
5.1 Web Video Sequences. . . . . . . . . . . . . . . . . . . . . . . . . . . 98
5.2 Five-Level Continuous Enhancement Scale. . . . . . . . . . . . . . . . 100
5.3 Parameter Sets for the Automatic Color Calculation of the Web Browser
Plug-in. . . . . . . . . . . . . . . . . . . . . . . . . . . . . . . . . . . 105
6.1 Number of Participants per Age Class. . . . . . . . . . . . . . . . . . 119
6.2 Web Video Sequences. . . . . . . . . . . . . . . . . . . . . . . . . . . 120
6.3 Hardware and Software. . . . . . . . . . . . . . . . . . . . . . . . . . 121
6.4 Table of Emotions, their Scope and Type. . . . . . . . . . . . . . . . 124
Page VI LIST OF TABLES
A.7 Mann-Whitney U Test Results. . . . . . . . . . . . . . . . . . . . . . 191
B.7 Mann-Whitney U Test Results for Babylon A.D. . . . . . . . . . . . . 196
B.8 Mann-Whitney U Test Results for Earth. . . . . . . . . . . . . . . . . 197
B.9 Mann-Whitney U Test Results for Both Sequences. . . . . . . . . . . 198
C.1 ANOVA for the First WWW Study - Genres. . . . . . . . . . . . . . 202
C.2 ANOVA for the Second WWW Study - Action Genre. . . . . . . . . . 202
C.3 ANOVA for the Second WWW Study - Documentary Genre. . . . . . 203
C.4 ANOVA for the Second WWW Study - Action and Documentary Genres.203
D.1 ANOVA for All Locations for the Action Genre. . . . . . . . . . . . . 207
D.2 ANOVA for All Locations for the Documentary Genre. . . . . . . . . 208
D.3 ANOVA for All Locations for the Sports Genre. . . . . . . . . . . . . 208
D.4 ANOVA for AAU and RMIT Locations for the News Genre. . . . . . 208
D.5 ANOVA for the AAU and RMIT Locations for the Action Genre. . . 208
D.6 ANOVA for the RMIT and UoW Locations for the Action Genre. . . 209
D.7 ANOVA for the AAU and UoW Locations for the Action Genre. . . . 209
D.8 ANOVA for the AAU and RMIT Locations for the Sports Genre. . . 209
D.9 ANOVA for the RMIT and UoW Locations for the Sports Genre. . . 209
D.10 ANOVA for the AAU and UoW Locations for the Sports Genre. . . . 210
D.11 t-test Results of Emotions for the Action Genre for AAU. . . . . . . . 211
D.12 t-test Results of Emotions for the Documentary Genre for AAU. . . . 212
D.13 t-test Results of Emotions for the News Genre for AAU. . . . . . . . 213
D.14 t-test Results of Emotions for the Commercial Genre for AAU. . . . . 214
D.15 t-test Results of Emotions for the Sports Genre for AAU. . . . . . . . 215
D.16 t-test Results of Emotions for the Action Genre for RMIT. . . . . . . 216
D.17 t-test Results of Emotions for the Documentary Genre for RMIT. . . 217
D.18 t-test Results of Emotions for the News Genre for RMIT. . . . . . . . 217
D.19 t-test Results of Emotions for the Commercial Genre for RMIT. . . . 218
D.20 t-test Results of Emotions for the Sports Genre for RMIT. . . . . . . 219
D.21 t-test Results of Emotions for the Action Genre for UoW. . . . . . . . 219
D.22 t-test Results of Emotions for the Documentary Genre for UoW. . . . 220
LIST OF TABLES Page VII
D.23 t-test Results of Emotions for the News Genre for UoW. . . . . . . . 220
D.24 t-test Results of Emotions for the Commercial Genre for UoW. . . . . 221
D.25 t-test Results of Emotions for the Sports Genre for UoW. . . . . . . . 221
D.26 t-test Results of Emotions for all Video Sequence for AAU. . . . . . . 223
D.27 t-test Results of Emotions for all Video Sequence for RMIT. . . . . . 224
D.28 t-test Results of Emotions for all Video Sequence for UoW. . . . . . . 225
E.1 Sequences of the Commercial Genre. . . . . . . . . . . . . . . . . . . 227
E.2 Sequences of the Documentary Genre. . . . . . . . . . . . . . . . . . . 228
E.3 Sequences of the Sports Genre. . . . . . . . . . . . . . . . . . . . . . 228
E.4 Sequences of the News Genre. . . . . . . . . . . . . . . . . . . . . . . 228
E.5 Sequences of the Action Genre. . . . . . . . . . . . . . . . . . . . . . 229

LIST OF FIGURES Page IX
List of Figures
2.1 Application Area of QoE and QoS. . . . . . . . . . . . . . . . . . . . 10
2.2 Quality of Experience Impact Factors. . . . . . . . . . . . . . . . . . 11
2.3 Mirrored Image which is Subjectively Similar but Objectively Different. 21
2.4 The Left Image is the Original Image and the Images in the Center
and Right Side are Reconstructions with the Same PSNR. . . . . . . 21
2.5 Stimulus Presentation in the ACR Method. . . . . . . . . . . . . . . . 26
2.6 Stimulus Presentation in the DCR Method. . . . . . . . . . . . . . . 27
2.7 Continuous Quality-Rating Scale. . . . . . . . . . . . . . . . . . . . . 29
2.8 Components of the amBX System. . . . . . . . . . . . . . . . . . . . 32
2.9 Activated Cyborg Gaming Lights. . . . . . . . . . . . . . . . . . . . . 32
2.10 Vortex Activ from Dale Air. . . . . . . . . . . . . . . . . . . . . . . . 33
2.11 Ink Jet Olfactory Display. . . . . . . . . . . . . . . . . . . . . . . . . 34
2.12 Mapping of Author’s Intentions to Sensory Effects and Devices. . . . 37
2.13 MPEG-V Architecture with Focus on Part 3. . . . . . . . . . . . . . . 39
2.14 Example of MPEG-V: Part 3. . . . . . . . . . . . . . . . . . . . . . . 40
3.1 Architecture of the Sensory Effect Media Player. . . . . . . . . . . . . 50
3.2 Vortex Activ Scents controlled by SEMP. . . . . . . . . . . . . . . . . 51
3.3 Test Environment with Control Station (Foreground) and Test Station
(Background). . . . . . . . . . . . . . . . . . . . . . . . . . . . . . . . 55
3.4 Evaluation Results on a Per-Video Sequence Basis. . . . . . . . . . . 60
3.5 Results Grouped in %GOB and %POW. . . . . . . . . . . . . . . . . 61
3.6 Mean Opinion Score and 95% Confidence Intervals. . . . . . . . . . . 62
4.1 Testing Method. . . . . . . . . . . . . . . . . . . . . . . . . . . . . . . 73
4.2 Voting Device and Mapping to Voting Scale. . . . . . . . . . . . . . . 73
4.3 Overall Quality Evaluation Results for Babylon A.D. . . . . . . . . . 76
4.4 Overall Quality Evaluation Results for Earth. . . . . . . . . . . . . . 77
4.5 Results Grouped in %GOE and %POB for Babylon A.D. . . . . . . . 78
Page X LIST OF FIGURES
4.6 Results Grouped in %GOE and %POB for Earth. . . . . . . . . . . . 78
4.7 MOS Results and Confidence Intervals for Babylon A.D. . . . . . . . 79
4.8 MOS Results and Confidence Intervals for Earth. . . . . . . . . . . . 79
4.9 MOS Results vs. PSNR/Bit-Rate Versions for Babylon A.D. . . . . . 81
4.10 MOS Results vs. PSNR/Bit-Rate Versions for Earth. . . . . . . . . . 81
4.11 Continuous MOS Results for Earth at 4 Mbit/s. . . . . . . . . . . . . 87
4.12 Continuous MOS Results for Earth at 6 Mbit/s. . . . . . . . . . . . . 88
4.13 Continuous MOS Results for Babylon A.D. at 6 Mbit/s. . . . . . . . 88
5.1 Architecture of the Web Browser Plug-in. . . . . . . . . . . . . . . . . 95
5.2 Slider for Voting. . . . . . . . . . . . . . . . . . . . . . . . . . . . . . 101
5.3 Test Method for the First Study. . . . . . . . . . . . . . . . . . . . . 102
5.4 Test Method for the Second Study. . . . . . . . . . . . . . . . . . . . 104
5.5 Evaluation Results for Each Genre. . . . . . . . . . . . . . . . . . . . 106
5.6 %GOB and %POW for Each Genre. . . . . . . . . . . . . . . . . . . 107
5.7 MOS Results and Confidence Intervals for Each Genre. . . . . . . . . 108
5.8 Evaluation Results for Each Parameter Set for the Documentary Video. 109
5.9 Evaluation Results for Each Parameter Set for the Action Video. . . . 109
5.10 %GOB and %POW for the Documentary Video. . . . . . . . . . . . . 110
5.11 %GOB and %POW for the Action Video. . . . . . . . . . . . . . . . 111
5.12 MOS Results and Confidence Intervals for Each Parameter Set for the
Documentary Video. . . . . . . . . . . . . . . . . . . . . . . . . . . . 111
5.13 MOS Results and Confidence Intervals for Each Parameter Set for the
Action Video. . . . . . . . . . . . . . . . . . . . . . . . . . . . . . . . 112
6.1 Test Method. . . . . . . . . . . . . . . . . . . . . . . . . . . . . . . . 122
6.2 MOS and Confidence Interval for Each Video for All Locations. . . . 127
6.3 MOS and Confidence Interval for Each Genre for All Locations. . . . 128
6.4 All Emotions for all Video Sequences with their Mean Intensity for
AAU, Austria. . . . . . . . . . . . . . . . . . . . . . . . . . . . . . . . 130
6.5 All Emotions for all Video Sequences with their Mean Intensity for
RMIT, Australia. . . . . . . . . . . . . . . . . . . . . . . . . . . . . . 131
LIST OF FIGURES Page XI
6.6 All Emotions for all Video Sequences with their Mean Intensity for
UoW, Australia. . . . . . . . . . . . . . . . . . . . . . . . . . . . . . . 132
6.7 Emotions with Significant Intensity Changes between Ratings With
and Without Sensory Effects for all Video Sequences for AAU, Austria. 134
6.8 Emotions with Significant Intensity Changes between Ratings With
and Without Sensory Effects for all Video Sequences for RMIT, Australia.135
6.9 Emotions with Significant Intensity Changes between Ratings With
and Without Sensory Effects for all Video Sequences for UoW, Australia.135
6.10 Emotions with Significant Intensity Changes between Ratings With
and Without Sensory Effects for the Action Genre for AAU, Austria. 137
6.11 Emotions with Significant Intensity Changes between Ratings With
and Without Sensory Effects for the Action Genre for RMIT, Australia.137
6.12 Emotions with Significant Intensity Changes between Ratings With
and Without Sensory Effects for the Action Genre for UoW, Australia. 137
6.13 Emotions with Significant Intensity Changes between Ratings With
and Without Sensory Effects for the Documentary Genre for AAU,
Austria. . . . . . . . . . . . . . . . . . . . . . . . . . . . . . . . . . . 138
6.14 Emotions with Significant Intensity Changes between Ratings With
and Without Sensory Effects for the Documentary Genre for UoW,
Australia. . . . . . . . . . . . . . . . . . . . . . . . . . . . . . . . . . 138
6.15 Emotions with Significant Intensity Changes between Ratings With
and Without Sensory Effects for the News Genre for AAU, Austria. . 139
6.16 Emotions with Significant Intensity Changes between Ratings With
and Without Sensory Effects for the News Genre for RMIT, Australia. 139
6.17 Emotions with Significant Intensity Changes between Ratings With
and Without Sensory Effects for the News Genre for UoW, Australia. 139
6.18 Emotions with Significant Intensity Changes between Ratings With
and Without Sensory Effects for the Commercial Genre for AAU, Austria.140
6.19 Emotions with Significant Intensity Changes between Ratings With
and Without Sensory Effects for the Commercial Genre for UoW, Aus-
tralia. . . . . . . . . . . . . . . . . . . . . . . . . . . . . . . . . . . . 141
Page XII LIST OF FIGURES
6.20 Emotions with Significant Intensity Changes between Ratings With
and Without Sensory Effects for the Sports Genre for AAU, Austria. 142
6.21 Emotions with Significant Intensity Changes between Ratings With
and Without Sensory Effects for the Sports Genre for RMIT, Australia. 142
6.22 Emotions with Significant Intensity Changes between Ratings With
and Without Sensory Effects for the Sports Genre for UoW, Australia. 142
7.1 Review Process of the Dataset. . . . . . . . . . . . . . . . . . . . . . 149
7.2 Different Test Setups: (a) One amBX Set; (b) Two amBX Sets; (c)
Two amBX Sets and Two Cyborg Gaming Lights. . . . . . . . . . . . 152
7.3 Test Setup with Two amBX Sets and Two Cyborg Gaming Lights. . 153
C.1 Slider for Voting. . . . . . . . . . . . . . . . . . . . . . . . . . . . . . 200
C.2 Slider for Voting. . . . . . . . . . . . . . . . . . . . . . . . . . . . . . 201
ACKNOWLEDGEMENTS Page XIII
Acknowledgements
I want to thank a lot of people which were helpful during this work.
First of all, I want to thank my family for their support during the course of this
work and for allowing me to study computer science at Alpen-Adria-Universitat Kla-
genfurt.
I also want to thank Univ.-Prof. Dipl.-Ing. Dr. Hermann Hellwagner and Ass.-
Prof. Dipl.-Ing. Dr. Christian Timmerer for their guidance and advices during the
course of this work and for giving me the possibility to work on an interesting topic
a little outside of the usual multimedia communication area.
Moreover, I want to thank Prof. Dr. Ian Burnett for his willingness to review this
work and for giving valuable advices.
I am also very grateful to Dipl.-Ing. Benjamin Rainer for his help on the subjec-
tive quality assessments in the context of the World Wide Web, the evaluation of the
impact of sensory effects on emotions, the annotation of the video sequences for the
dataset, and his support on the mathematical analyses of the results.
And last, I want to thank all my friends and colleagues who accompanied me during
my study and work at the Department of Information Technology (ITEC).
This work was supported in part by the European Commission in the context of
the NoE INTERMEDIA (NoE 038419), ALICANTE (FP7-ICT-248652), and QUA-
LINET (COST IC 1003) projects.

ABSTRACT Page XV
Abstract
Multimedia content is omnipresent in our life. Thus, one can consume content through
various distribution channels such as a DVD, Blu-Ray, or the Internet. Recently, 3D
video gained more and more importance and a lot of movies presented in cinemas
are 3D. Currently, research on additional constituents such as light and scent effects
for further enhancing the viewing experience is conducted. As this research is taken
up by more and more researchers and companies, the Moving Picture Experts Group
(MPEG) ratified the MPEG-V standard, referred to as Media Context and Control,
which allows the annotation of multimedia content with additional effects (e.g., light,
wind, vibration) and render these effects synchronized to the multimedia content. Due
to this fairly new research area, there are only a few subjective quality assessments
evaluating such effects. Moreover, standardized assessment methods cannot be used
as originally developed since they are optimized for audio-visual quality evaluations.
Thus, this work lists and describes existing subjective quality assessment methods
suitable for conducting assessments comprising multimedia content, especially videos,
enriched by sensory effects (i.e., light, wind, and vibration). As there is a lack of suit-
able software for rendering sensory effects, this work introduces a multimedia player
for playing multimedia content accompanied by sensory effects. Moreover, in this
work, we performed four subjective quality assessments answering the following ques-
tions: (1) Do sensory effects enhance the viewing experience for different genres?
(2) Do sensory effects have an influence on the perceived video quality? (3) Do light
effects enhance the viewing experience for Web videos? (4) Do sensory effects have
an impact on the perceived emotions while watching a video? Therefore, this work
presents these subjective quality assessments including a detailed description of the
assessments and their results. Moreover, this work introduces a dataset consisting
of video sequences annotated with sensory effects for conducting subjective quality
assessments. Finally, some recommendations for performing assessments compris-
ing sensory effects which have been extracted from the conducted subjective quality
assessments are given.

ZUSAMMENFASSUNG Page XVII
Zusammenfassung
Uberall findet man heute multimediale Inhalte. Man kann diese Inhalte uber DVDs,
Blu-Rays oder das Internet konsumieren. In letzter Zeit wurde 3D immer wichtiger
und viele Filme in den Kinos werden in 3D gezeigt. Erst kurzlich begann die Forschung
an zusatzlichen Komponenten fur multimediale Inhalte, namlich Licht und Geruch,
welche das Fernseherlebnis bereichern sollen. Da dieser Bereich von immer mehr
Forschern aufgegriffen wurde, ratifizierte die Moving Picture Experts Group (MPEG)
den MPEG-V Standard, welcher auch Media Context and Control genannt wird.
Dieser Standard erlaubt es, multimediale Inhalte mit zusatzlichen Effekten wie Licht,
Wind und Vibration zu annotieren. Diese Effekte werden dann synchronisiert mit
dem Inhalt abgespielt. Da dieses Forschungsgebiet sehr neu ist, existieren nur wenige
subjektive Tests mit solchen Effekten. Zudem ist es nicht moglich, standardisierte
Evaluationsmethoden zu verwenden, da diese nur fur Audio und Video optimiert sind.
Deshalb zeigt und beschreibt diese Arbeit existierende subjektive Testmethoden,
welche man zum Evaluieren von multimedialen Inhalten, im speziellen Video, mit
Effekten (Licht, Wind, und Vibration) verwenden kann. Mangels passender Abspiel-
software fur Videos mit zusatzlichen Effekten, prasentiert die Arbeit einen Multimedia
Player welcher solche annotierten Videos wiedergeben kann. Zusatzlich prasentieren
wir in dieser Arbeit vier Experimente, welche die folgenden Fragen beantworten:
(1) Bereichern zusatzliche Effekte das Fernseherlebnis mit Blick auf verschiedene
Genres? (2) Beeinflussen zusatzliche Effekte die wahrgenommene Videoqualitat?
(3) Bereichern zusatzliche Lichteffekte das Videoerlebnis bei Web Videos? (4) Beein-
flussen zusatzliche Effekte die hervorgerufenen Emotionen beim Schauen von Videos?
Diese Arbeit beschreibt die Experimente inklusive der Ergebnisse im Detail. Außer-
dem stellt die Arbeit einen Datensatz bestehend aus Videos, welche mit zusatzlichen
Effekten annotiert wurden, vor. Abschließend beschreibt die Arbeit einen Leitfaden
zur Durchfuhrung von Experimenten mit zusatzlichen Effekten, welcher mit Hilfe der
durchgefuhrten Experimente erstellt wurde.

CHAPTER
1 Introduction
This chapter presents the motivation for this work. Furthermore, it lists the research
objectives and shortly illustrates the structure of this work.
1.1 Motivation
In recent years, multimedia has gained more and more importance. We can access and
consume multimedia content such as images, text, videos or a combination of them,
through various distribution channels (e.g., DVDs, Blu-Rays, Internet). Moreover,
new technologies like 3D video have emerged in cinemas, television [1] and in the
Internet [2] for providing a more immersive viewing experience [3]. Besides 3D video,
additional so-called sensory effects (e.g., wind, vibration, fog) have already gained
momentum in some cinemas such as those in cinemas in the Universal Studios theme
parks [4].
Recently, research on shifting the context of these additional constituents from
the cinema to the home environment has been started. For example, there is already
research on additional light [5] or scent effects [6] to enhance the viewing experience for
video content. Moreover, there are already television sets such as the Ambilight TV [7]
that provide additional light effects to videos. Furthermore, research shows that
sensory effects are not only suitable for installations, e.g., in the home environment,
but also on mobile devices [8]. One can see that there is intense research in the area
of using sensory effects to enhance either the user or viewing experience. Note that
there is a difference between the terms ”user experience” and ”viewing experience”.
User experience is always linked to the experience achieved while using an interactive
system (e.g., product or service). This means that the user operates a system directly
or observes someone using a system [9]. On the other hand, the viewing experience
is linked to an experience a user has while consuming content (e.g., movies, images
etc.) on a device (e.g., television set, mobile device).
Page 2 Introduction
As all of the previously mentioned multimedia content and new technologies tar-
get enrichment of the user experience, there is a need for a scientific framework for
capturing, measuring, quantifying, judging, and explaining the user experience [10].
This scientific framework focuses on the Quality of Experience (QoE), which is an
assessment of the overall user satisfaction (cf. Section 2.1), instead of the Quality of
Service (QoS). QoE takes the viewer into account, rather than only the capabilities
of the terminal devices and other technical conditions (e.g., the network). Publica-
tions in the area of QoE have already identified a characterization model for video
adaptation [11] and provide a first step towards a theoretical framework for QoE [12].
Based on this development, this work investigates the enhancement of the view-
ing experience using multimedia content accompanied by additional effects such as
light, wind, and vibration. To that end, we use the recently ratified MPEG-V stan-
dard [13] which was developed by the Moving Picture Experts Group (MPEG). This
standard enables us to annotate multimedia content with desired effects and render
them synchronized to the content.
The motivation for this work is the emerging research in the area of sensory
effects and the deployed products on the market. In this work, we conduct a number
of user studies for showing the enhancement of the viewing experience based on
different scenarios and research questions. The arising research questions and a brief
description of this work’s contributions are presented in Section 1.2.
Additionally, this work briefly describes the so-called Ambient Library with a Web
browser plug-in which was developed by Benjamin Rainer [14]. This plug-in allows
the playback of enriched multimedia content in the context of the World Wide Web
and was used during some subjective quality assessments presented in this work.
1.2 Research Questions and Contributions
From the motivation presented in Section 1.1, the following general research questions
arise:
• How can enriched multimedia content be consumed on existing consumer de-
vices?
Introduction Page 3
• How do sensory effects influence the user or the content?
• How can sensory effects be subjectively evaluated?
To answer these questions, several research objectives for this work have been
defined:
• to introduce sensory effects which accompany multimedia content and to provide
an enhanced multimedia player supporting sensory effects to enrich the viewing
experience;
• to demonstrate the benefits of sensory effects and to show their impact on
perceived video quality;
• to look into the usage of sensory effects in a World Wide Web scenario by
providing a Web browser plug-in and to conduct measurements on the automatic
generation of sensory effects (i.e., light effects);
• to evaluate the impact of sensory effects on the perceived emotions while con-
suming enriched multimedia content;
• to offer a dataset consisting of multimedia content from different genres enriched
by sensory effects;
• to present recommendations for conducting subjective quality assessments com-
prising video sequences accompanied by sensory effects;
• to provide a basis for future research in the area of sensory effects and multi-
media.
To achieve these objectives, we briefly describe the major contributions of this
work.
1.2.1 Media Player for Sensory Effects
During first investigations in the area of sensory experience, a lack of suitable software
for rendering and testing sensory effects on consumer devices (e.g., amBX System [15])
Page 4 Introduction
has been detected. Hence, this work introduces the Sensory Effect Media Player
which is a DirectShow-based multimedia player for watching enriched content stored
locally (e.g., on DVD or as video file). Additionally, the player is based on the
ratified MPEG-V: Media Context and Control [13] standard. This media player allows
rendering of a number of sensory effects such as light, wind, and vibration which
are stored in MPEG-V-compliant descriptions. Additionally, this media player was
made open-source to allow others (e.g., researchers, producers) to use the software
for performing evaluations or to adapt and extend it to their needs.
1.2.2 Subjective Quality Evaluations using Sensory Effects
In the literature, some subjective quality assessments in the area of scent (e.g., [16])
and light effects (e.g., [7]) can be found. These subjective quality assessments only
comprise a single sensory effect. In contrast to these assessments, in this work, sub-
jective quality assessments were conducted that comprise a set of sensory effects (i.e.,
light, wind, and vibration). The achieved results provide a first insight into the
influence of sensory effects on different genres and the perceived video quality. Addi-
tionally, the impact of additional effects on the perceived emotions was investigated
and promising results were achieved.
1.2.3 Sensory Effect Dataset
For performing subjective quality assessments in the area of sensory experience, suit-
able test sequences are needed. Currently, available test sequences are not suitable for
performing subjective quality assessments that comprise multimedia content enriched
by sensory effects. The reason for this is that the contents shown in the sequences
are not suitable for sensory effects (e.g., in-door scenes). As a result, this work in-
troduces a dataset consisting of enriched multimedia content annotated with various
sensory effects (i.e., light, wind, and vibration) from different genres and with different
bit-rates.
Introduction Page 5
1.2.4 Recommendations for Sensory Effect Evaluations
While conducting subjective quality assessments comprising multimedia content en-
riched by sensory effects, a number of issues have arisen. Hence, this work provides
recommendations for conducting subjective quality assessments in the area of sensory
experience. These recommendations offer a first step towards a standardized subjec-
tive quality assessment method for evaluating the impact of sensory effects on the
viewing experience.
1.3 Structure
The remainder of this work is structured as follows.
Chapter 2 provides background information necessary for this work. In particu-
lar, in this chapter, Quality of Service (QoS) and Quality of Experience (QoE) are
presented and compared. Furthermore, this chapter lists some objective and sub-
jective video quality assessment methods (e.g., peak signal-to-noise ratio (PSNR)
calculation, absolute category rating (ACR)). Moreover, this chapter continuous with
a presentation of various products and previous research in the area of sensory effects.
Additionally, in Chapter 2, a detailed description of the MPEG-V standard, referred
to as Media Context and Control, is presented. As this work is based on Part 3
”Sensory Information”, this chapter presents a more detailed description of this part
and its usage.
Chapter 3 illustrates our first subjective quality assessment in the area of sensory
experience. In the assessment, we answer the question if sensory effects (i.e., wind,
vibration, and light effects) are well perceived by viewers and if sensory effects have
different impact on various genres. Additionally, in this chapter, we show the Sensory
Effect Media Player (SEMP) used for presenting and evaluating sensory effects. This
media player is able to render MPEG-V-compliant descriptions which accompany
multimedia content (i.e., videos). Furthermore, the chapter describes the procedure
of the evaluation and its results. The results indicate that additional effects enhance
the viewing experience as compared to the same video sequences without effects.
As we detected during our first subjective quality assessment that sensory effects
Page 6 Introduction
influence the QoE of the viewers and, thus, provide a more immersive viewing expe-
rience, we decided to evaluate the impact of sensory effects on the perceived video
quality. The idea behind this evaluation is to find out if a provider can reduce the
visual quality (i.e., bit-rate) of a video (e.g., in case of a poor network connection)
and provide additional effects, without reducing the QoE while watching the video.
Therefore, we selected the highest rated video sequences from our first assessment and
evaluated the impact of sensory effects on the perceived video quality. This assess-
ment, including the evaluation setup and achieved results, is presented in Chapter 4.
The achieved results show that additional effects reduce visible artifacts and, thus,
enhance the perceived video quality.
As more and more content is available on the World Wide Web (WWW) via
various platforms (e.g., YouTube, MySpace), we decided to switch from the local
content presentation (i.e., playback from a locally stored video file) to the WWW
context (i.e., content is streamed from a web site). Due to the new context, a Web
browser plug-in was developed that is able to extract frames from Flash and HTML5
videos and handle MPEG-V-compliant descriptions. Initially, we evaluated only light
effects to determine if the automatic extraction of light effects is feasible within various
Web browsers and if additional effects are perceived similar to our previous studies.
To that end, we conducted a subjective quality assessment evaluating the previously
stated questions. The Web browser plug-in and the evaluation itself are illustrated in
Chapter 5. Moreover, this chapter presents the results gained during the assessment
which show that light effects enhance the viewing experience. Additionally, the results
indicate that if performance issues occur, it is better to not use each frame for the
color calculation than ignoring color information (i.e., pixels columns or entire rows
of pixels) within a frame.
Chapter 6 presents the procedure and results of another subjective quality as-
sessment conducted during the course of this work. The goal of this assessment is
to investigate the influence of sensory effects on the perceived emotions. To that
end, we enhanced content with vibration, wind, and light effects. The evaluation was
conducted, similar to our previous assessment, in the context of the WWW. For this
assessment, we retrieved the QoE and the perceived emotions from each participant
to see, for example, if a participant is more worried with sensory effects than without
Introduction Page 7
them. Moreover, we wanted to know if additional effects have different impact on
different nationalities. Therefore, we conducted the assessment in different locations
in two countries (i.e., Austria and Australia). The results of this assessment show
that emotions like worry, fun, fear, etc. are increased and, therefore, the participants
have a more intense viewing experience.
Last but not least, Chapter 7 presents a dataset developed during the course of
this work. This dataset was developed due to the circumstances that content from
different standardization bodies is not suitable for the evaluation of additional ef-
fects because most video sequences are only available in small resolutions (i.e., below
720p), or the shown video content presents scenes which do not allow the annotation
with sensory effects (e.g., in-door scenes). Therefore, we extracted a number of video
sequences from different genres with varying bit-rates and resolutions, and annotated
them with sensory effects (i.e., wind, vibration, and light effects). Moreover, this
chapter suggests three different test setups that we used during our subjective qual-
ity assessment or we found suitable for evaluating sensory effects. Additionally, in
this chapter, we provide recommendations for preparing and conducting subjective
quality assessments in the area of sensory effects. Therefore, we used the experi-
ence gained from earlier conducted subjective quality assessments and from already
existing evaluation methods.
Finally, Chapter 8 summarizes the contributions achieved with respect to the
specified research objectives. Furthermore, it outlines some future work.
Note that this work contains a number of appendices that present questionnaires,
introductions and tables from statistical analyses which may be of interest for the
reader.

CHAPTER
2 Background and Related
Work
This chapter illustrates research, video quality assessment methods and products/
prototypes that are relevant for this work. Section 2.1 describes Quality of Service
(QoS) and Quality of Experience (QoE ) and compares them. Section 2.2 presents
different video quality assessment methods comprising objective and subjective meth-
ods. Section 2.3 introduces some devices that provide sensory effects. Furthermore,
this section provides an overview of related research conducted in the area of sensory
effects. Additionally, Section 2.4 describes the MPEG-V standard which this work is
based on, especially Part 3 ”Sensory Information”. Note that in this work we mainly
focus on audio/video (A/V) content. Thus, other modalities such as text, image, and
separate audio are omitted but many methods introduced in this chapter can also be
applied to these modalities.
2.1 Quality of Experience vs. Quality of Service
Quality of Service (QoS) is a well-known term in the networking area. QoS is de-
fined in ITU-T E.800 as follows: ”Totality of characteristics of a telecommunica-
tions service that bear on its ability to satisfy stated and implied needs of the user of
the service.” [17] The definition includes technical and perceptual components. The
technical components are sometimes split into Application/Terminal QoS (e.g., codec,
startup delay, framerate etc.) and Network QoS (e.g., bandwidth, jitter, etc.) [18, 19].
Unfortunately, most of the research conducted in the last years focused on these tech-
nical aspects of QoS and, thus, did not take the perceived quality into account [20].
This led to the situation that if someone is talking about QoS, he/she mainly means
the technical aspects of QoS, i.e., jitter, bandwidth, packet loss, reliability, through-
put etc. For completeness, all parameters are measured and evaluated objectively by
using various tools (e.g., network monitoring tools). This circumstance also indicates
that the perceived quality is not considered. As a result, not taking the perceived
Page 10 Background and Related Work
quality into account can lead to a high QoS but to a poor user experience as the
perceived quality can be low.
As a consequence, a shift of research from QoS to the area of perceived quality
(also known under the term Quality of Experience (QoE)) can be noticed. In [20],
different definitions of QoE are listed which all take the end-user into account. In
contrast to QoS which is measured objectively, QoE is inherently subjective. Thus,
the definition provided in ITU-T P.10 defines QoE very well: ”The overall acceptability
of an application or service, as perceived subjectively by the end-user.” [21] Another
definition of QoE is provided by the Qualinet project [22]: ”Quality of Experience
(QoE) is the degree of delight or annoyance of the user of an application or service.
It results from the fulfillment of his or her expectations with respect to the utility
and/or enjoyment of the application or service in the light of the user’s personality
and current state.” [23] Both definitions clearly show the focus of QoE, i.e., to evaluate
or determine the quality of the user’s experience while using a service or application.
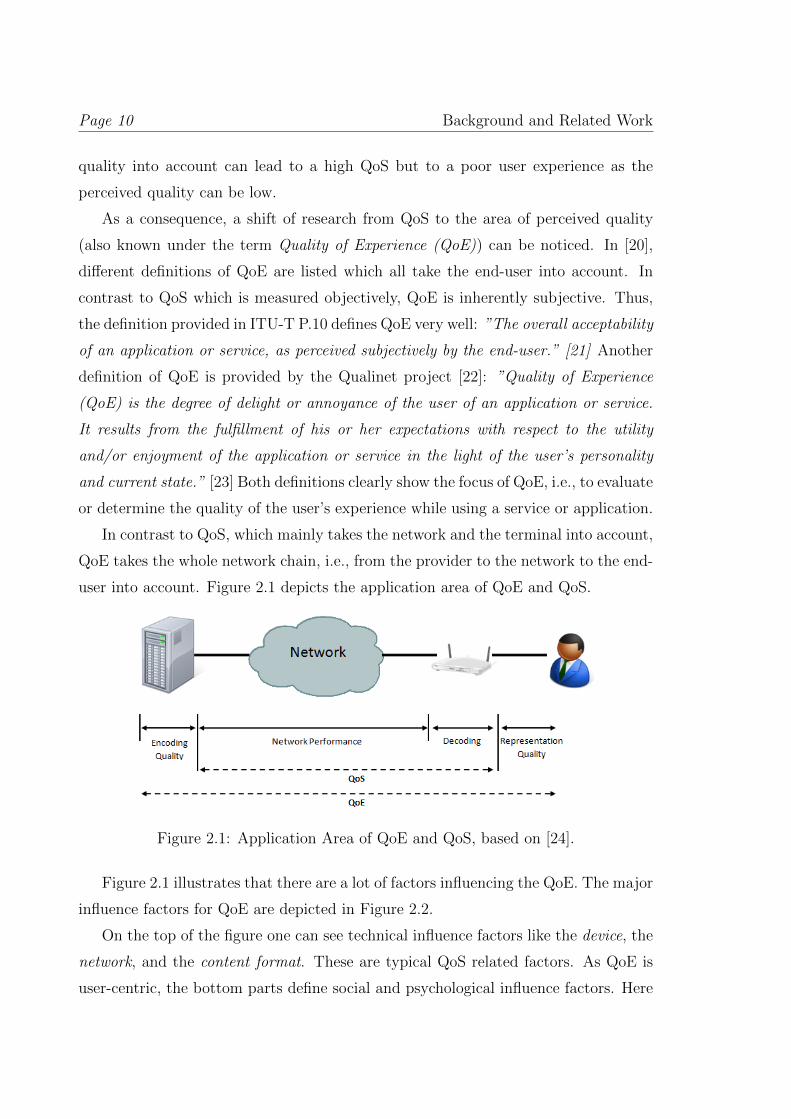
In contrast to QoS, which mainly takes the network and the terminal into account,
QoE takes the whole network chain, i.e., from the provider to the network to the end-
user into account. Figure 2.1 depicts the application area of QoE and QoS.
Figure 2.1: Application Area of QoE and QoS, based on [24].
Figure 2.1 illustrates that there are a lot of factors influencing the QoE. The major
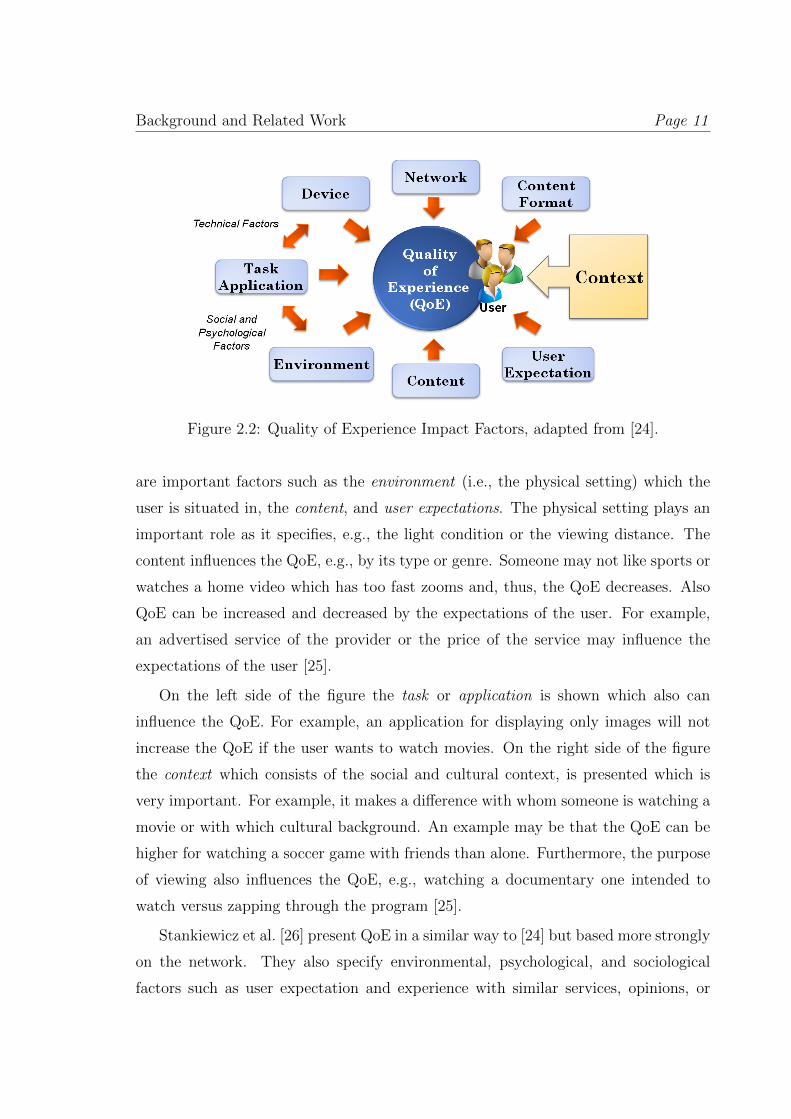
influence factors for QoE are depicted in Figure 2.2.
On the top of the figure one can see technical influence factors like the device, the
network, and the content format. These are typical QoS related factors. As QoE is
user-centric, the bottom parts define social and psychological influence factors. Here
Background and Related Work Page 11
Figure 2.2: Quality of Experience Impact Factors, adapted from [24].
are important factors such as the environment (i.e., the physical setting) which the
user is situated in, the content, and user expectations. The physical setting plays an
important role as it specifies, e.g., the light condition or the viewing distance. The
content influences the QoE, e.g., by its type or genre. Someone may not like sports or
watches a home video which has too fast zooms and, thus, the QoE decreases. Also
QoE can be increased and decreased by the expectations of the user. For example,
an advertised service of the provider or the price of the service may influence the
expectations of the user [25].
On the left side of the figure the task or application is shown which also can
influence the QoE. For example, an application for displaying only images will not
increase the QoE if the user wants to watch movies. On the right side of the figure
the context which consists of the social and cultural context, is presented which is
very important. For example, it makes a difference with whom someone is watching a
movie or with which cultural background. An example may be that the QoE can be
higher for watching a soccer game with friends than alone. Furthermore, the purpose
of viewing also influences the QoE, e.g., watching a documentary one intended to
watch versus zapping through the program [25].
Stankiewicz et al. [26] present QoE in a similar way to [24] but based more strongly
on the network. They also specify environmental, psychological, and sociological
factors such as user expectation and experience with similar services, opinions, or
Page 12 Background and Related Work
pricing. For example, if a service is free, the user can live with a poorer quality
than if he/she pays a fee for the service. The authors further indicate that network
factors like the Quality of Service (QoS), Grade of Service (GoS), and Quality of
Resilience (QoR) influence the QoE. As indicated by [26], GoS mainly applies to
circuit switched networks (i.e., telephone networks) but may also be used in the path
setup for Multiprotocol Label Switching (MPLS) [27]. Parameters of GoS comprise
the connection setup delay, delay in authentication, the probability of breaking an
active connection, or the rejection of requests [26]. An example for GoS can be the
waiting time for getting a connection with a partner. If the connection setup takes
long, the GoS is low and, thus, the user will be annoyed. QoR specifies the reliability of
a service in case of failures. The QoR is traditionally an integrated part of QoS in the
process of service level agreements between provider and consumer [26]. Obviously, in
case a service is not available, fails more often, or a connection to the service cannot
be established, the QoE will decrease and, thus, the user will probably stop using this
service [26]. The work presented by Stankiewicz et al. [26] offers a broad description
of various influence factors on QoE. As the work describes many factors related to the
network (e.g., GoS, QoR), we decided to perform our evaluations on a local computer
or within our local area network to avoid these factors. They would add additional
variable conditions to the evaluations which could manipulate the achieved results.
Furthermore, [26] describes challenges arising from the introduced notions (i.e.,
QoS, QoE, QoR, and GoS). Ongoing research efforts on QoE are taking on these
challenges. In the following, selected research will be presented.
Wu et al. [12] introduce a theoretical framework for QoE in distributed interac-
tive multimedia environments (DIME), especially in the case of a 3D tele-immersive
environment, as current frameworks are very much system-centric. Therefore, the
modeling of the user experience is performed by using the cognitive perceptions and
the resulting behavioral consequences. For the cognitive perception, [12] considers
three dimensions which are: psychological flow (i.e., motivation of a user to perform
a specific task), perceived technology acceptance (i.e., ease of use of a technology or
the actual usage of the technology), and telepresence (i.e., user’s sense of presence
and involvement). These factors result in the behavioral consequences. These con-
sequences comprise performance gains (i.e., the increase of a user’s performance on
Background and Related Work Page 13
certain tasks), technology adoption (i.e., does the user intend to use the technology,
or is he/she actually using it), and exploratory behaviors (i.e., does the user explore
the technology without stated goals). With all previously mentioned parameters and
QoS parameters like vividness (i.e., amount of sensory information presented to the
user), consistency (i.e., the presented information should be the consistent for all
participants) and interactivity (i.e., the ability to manipulate the environment), the
authors performed a QoS-QoE mapping. The mapping is done in three steps [12]:
specifying the metrics for each dimension of QoS and QoE; collecting measurements
of these metrics (either objective or subjective); and computing the correlation be-
tween the measured pairs of QoS and QoE metrics. The results indicate that the
presented framework performs well on the given parameters but also indicate the is-
sue between subjective and objective measurements, i.e., the subjective consistency
correlates stronger with concentration than the objective consistency. This means,
that perceived inconsistency leads to a focus distraction of the viewer [12]. The pre-
sented work offers a first step towards a model for mapping QoS to QoE which may
help to reduce the number of necessary subjective quality assessments in the area
of QoE. One issue with this work is that the authors base their work only on a 3D
tele-immersive environment. Hence, the results may not be representative for other
environments (e.g., sensory effects) which needs more investigation.
In [28], a framework for the evaluation of video transmission and video quality
is presented. This framework offers the possibility to retrieve peak signal-to-noise
ratio (PSNR) values (cf. Section 2.2.1.2). Additionally, the tool provides means for
estimating the mean opinion scores (MOS) of a video and estimating the percentage
of frames that have a MOS lower than the frames of the reference video. To achieve
this, the calculated PSNR values are mapped to MOS values. With this approach, the
impact of a poor network can be made visible in the tool. The presented exemplary
results indicate that the tool is suitable for evaluating the video quality based on
various simulations and measurements with respect to the PSNR-to-MOS mapping.
The presented tool provides researchers another possibility to estimate subjective
measurements. The results illustrate that the tool works very well but there are
some issues remaining. For example, the reference sequence (i.e., without packet loss
etc.) does only achieve around 10% to 20% of excellent ratings and the rest are good
Page 14 Background and Related Work
ratings, whereas someone might expect higher excellent ratings. This issue might
arise due to the used PSNR to MOS mapping. Additionally, the presented mapping
differs from other similar research (e.g., [29]). In [28], an excellent MOS rating is
given starting from a PSNR > 37, whereas in [29], an excellent MOS rating is defined
with a PSNR ≥ 45.
One topic arising in the area of QoE is charging for the provided service. This
means, similar to QoS, if a user wants a high QoE, he/she should pay more for the
service than one who wants to only receive a moderate QoE. In [18], charging for
network services based on MOS is suggested. For achieving this, the Service Level
Agreements (SLAs) between the provider and the consumer are now based on MOS
instead of QoS parameters (e.g., maximum delay, minimum bandwidth etc.). The
authors also suggest a reactive charging approach that allows the user to indicate
his ”willingness-to-pay”. This means, that the user wants to have for a fixed time
frame a higher QoE than best-effort quality (e.g., during an import phone call).
Therefore, the user can indicate (e.g., via a button on the phone) that he/she wants
a high QoE and, therefore, pays an extra fee. The same authors present a prototype
implementation for charging for QoE in an IP Multimedia Subsystem (IMS) [20]. This
paper presents the integration of QoE in the traditional charging stack (i.e., process
of metering, mediation, account, charging, and billing for services). As introduced
in the authors’ earlier paper [18], they use an indicator for the ”willingness-to-pay”.
Using this indicator, the prototype adjusts the QoS parameters and, hence, increases
the quality of the transmission in the IMS. Note that, as the authors themselves
indicate, these papers are a starting point for research on the possibility for charging
for QoE. Charging for different quality levels is an important topic and, thus, needs
to be considered thoroughly. The approach the authors used in their papers offers
a first step towards this charging paradigm. As mentioned earlier, there is still the
issue of mapping QoS to QoE. In case of the authors’ works, they only use Voice over
IP (VoIP) for which already a number of algorithms for measuring QoE exists.
Another research area is the automatic determination of QoE during video deliv-
ery. De Vera et al. [30] present the so-called Pseudo Subjective Quality Assessment
(PSQA) that is a hybrid approach between objective and subjective evaluations.
PSQA uses the results of a small number of participants from a subjective quality
Background and Related Work Page 15
assessment who were evaluating distorted samples (e.g., video sequences). The results
of the subjective assessment are used to train a learning tool that provides the relation
between the parameters causing the distortion and the perceived quality. Further-
more, the paper introduces a framework for using PSQA. The framework comprises
a streaming server that adds additional user data into the streamed content. This
user data comprises information about the number of different frames (i.e., I-, P-, and
B-frames) sent. Within the framework, modified VLC players are placed in specific
locations which are called probes. These probes extract the user data and compare
the data with their own measurements. This allows the probes to detect frame losses.
The information about frame losses is retrieved by a data collection server. The
PSQA tool then calculates for each probe the quality value and, thus, the tool shows
the perceived quality at the end-users. The authors present an interesting approach
for ”objectively” evaluating the perceived quality. There are two major issues with
this approach. First, subjective quality assessments are still needed to train the sys-
tem and, thus, the objective evaluation depends on the subjects’ preferences and
perception. Second, this approach is mainly suitable for video delivery networks and
does not take additional assets (e.g., sensory effects) into account which is crucial for
research in the area of sensory effects.
Besides automatic determination of QoE, there is also research on the relationship
between QoS and QoE. In [31], the authors evaluate the quantitative relationship be-
tween QoS and QoE. For this, they introduce the so-called IQX hypothesis (exponen-
tial interdependency of QoE and QoS). The IQX hypothesis is formulated with QoE
(i.e., level of satisfaction) and QoS (i.e., level of disturbance) parameters, thus, pro-
viding an exponential function. That is, if the level of satisfaction (e.g., MOS values)
decreases, the level of disturbance (e.g., packet loss) increases. The authors defined
this function as an exponential because a small disturbance drastically decreases the
satisfaction. Additionally, if the QoE is already low, additional disturbance does not
have any significant impact anymore. Lastly, in the paper, tests for evaluating the
IQX hypothesis in the case of VoIP and Web browsing are performed. The authors
conclude that the proposed IQX hypothesis approximates the quality better than pre-
viously published fitting algorithms. Additionally, their algorithm can also be used
for extremely high and low QoS parameters. As a result, the IQX hypothesis can
Page 16 Background and Related Work
be used for QoE controlling mechanisms that depend on QoS monitoring [31]. The
presented hypothesis provides suitable results for the tested cases (i.e., VoIP and Web
browsing) but it is questionable if the IQX hypothesis can be mapped to enriched
multimedia due to the additional assets. Furthermore, the authors themselves in-
dicate that there is the necessity to evaluate different QoS disturbances (e.g., loss,
delay).
2.2 Video Quality Assessment Methods
Quality assessment methods are important tools for determining the quality of dif-
ferent multimedia files (i.e., audio, video, images). There are two different types of
quality assessment methods. First, objective quality assessment methods which use
existing information stored within the input data (e.g., pixel information, structures).
Second, subjective quality assessment methods which retrieve information from par-
ticipants of a user study. Both methods have their advantages and disadvantages.
For example, objective quality assessment methods are fast and can be automatic
but they cannot determine the quality perceived by a human being in a satisfac-
tory way. On the other hand, subjective quality assessment methods are well suited
for determining the perceived quality but have the disadvantage of being very time
consuming [32].
Before we present and describe various quality assessment methods, it is important
to know what quality means to the viewer. [32] defines five major factors for enjoying
a video which we will shortly describe and compare with the presented QoE influence
factors (cf. Section 2.1):
Individual interests and expectations: Each person likes and dislikes different
types of content (e.g., horror, comedy) and expects different qualities. For ex-
ample, someone watching intensively a movie expects higher video quality than
someone only watching absentmindedly the movie. Compared to Figure 2.2, the
interests and expectations are located in the ”user expectations”, ”content”, and
”context” influence factors of QoE as the user expects a specific quality and/or
content. Moreover, the context is important as one may consume content alone
Background and Related Work Page 17
or together with other people during an event (e.g., Olympics) and, thus, he/she
has different expectations on the content.
Display type and properties: Depending on the type (e.g., CRT, LCD) and char-
acteristics (e.g., size, resolution) of the display, the perceived quality can vary.
The display type and properties influence the QoE through the ”device” and
”content format” factors. For example, watching low resolution content on a
big LCD display may result in a low QoE because of appearing artifacts.
Viewing conditions: Aside of the viewing distance, the lighting of the room is a
factor that influences the perceived quality. Furthermore, light that is reflected
by the screen is a major factor for reducing the visible luminance and contrast
range and, thus, reducing the viewing experience. The lighting and viewing
conditions have influence on the ”environment” factor of QoE and, hence, can
have positive or negative impact on the QoE of the user.
Fidelity of the reproduction: The fidelity of the reproduction is about reproduc-
ing the video as closely as possible to the original video, i.e., with no or minimum
distortion. Sometimes it is not preferable to provide an original reproduction.
For example, if one watches a movie, he/she may not like the original video
with the original colors. Therefore, the fidelity also includes ”enhanced” repro-
duction which means that the original video is edited to suit the viewer. For
example, the viewer appreciates a scene of green grassland much more if the
color is much more intensive than the original dull color. The fidelity of the re-
production can influence the ”content” and ”user expectation” factors of QoE.
For example, if the content is distorted, the QoE is decreased.
Soundtrack: The quality of a video presentation does not only depend on the images
and display but also on the soundtrack. If someone watches a movie and the
soundtrack is asynchronous to the visual presentation, the perceived quality
is much lower than for the same movie with a synchronous soundtrack. This
factor is located in the ”content” influence factor of QoE because non-existent
or asynchronous sound has a big influence on the QoE. Furthermore, the ”task”
or ”application” needs to be taken into account, as it makes a big difference if
Page 18 Background and Related Work
one sees a video from a surveillance camera or a real movie.
From these factors, Display type and properties and Viewing conditions are often
assumed to be optimal and, thus, they are not especially evaluated. Individual inter-
ests and expectations and Soundtrack can only be assessed by subjective evaluations.
The only factor which can be effectively assessed with objective assessment methods
is the fidelity of the reproduction.
The following subsections present some objective (cf. Section 2.2.1) and subjective
(cf. Section 2.2.2) quality assessment methods. Note that the major focus of this work
is on subjective quality assessment methods.
2.2.1 Objective Quality Assessment Methods
This section describes objective quality assessment methods and metrics such as
mean-squared error (MSE) and peak signal-to-noise ratio (PSNR). These methods
process information stored within the content (i.e., images, videos) as mentioned ear-
lier. The processing is automated and does not need any input from a user. There are
three different approaches for designing metrics for objective quality assessments [32]:
Pixel-based fidelity metrics: As the name indicates, these metrics use informa-
tion from the pixels of an image or video frame to calculate the fidelity of two
images/frames. MSE and PSNR are such pixel-based fidelity metrics. The
major disadvantage of these metrics is that they are not reliable to indicate
perceived quality.
Psychophysical approach: The psychophysical approach is used to design metrics
that take the human visual system (HVS) into account. Such metrics use in-
formation gathered from psychophysical experiments. Using models and data
from these experiments allows to incorporate aspects relevant to the human vi-
sion (e.g., color perception, contrast sensitivity, pattern masking). Examples of
metrics that use the psychophysical approach are: Perceptual Distortion Metric
(PDM) for color video [33], Moving Picture Quality Metric (MPQM) [34], and
Visual Differences Predictor (VDP) [35].
Background and Related Work Page 19
Engineering approach: The engineering approach extracts and analyses informa-
tion from a video. Such information can be features (e.g., contours) or artifacts.
Artifacts are errors which are introduced by compression algorithms or network
transmissions. The engineering approach is mainly based on image analysis
and, thus, it does not focus on the human vision. Examples of the engineer-
ing approach are: DCTune [36, 37] and Perceptual Video Quality Measure
(PVQM) [38].
The quality metrics themselves can be further classified into three different cate-
gories [32, 31]: Full-reference metrics compare the image/video under test with the
reference image/video frame-by-frame to measure the quality. No-reference metrics
use only the image/video under test for measuring the quality. Reduced-reference
metrics extract features from the reference image/video and compare these features
with the image/video under test.
In the following, the most popular objective quality assessment metrics MSE (cf.
Section 2.2.1.1) and PSNR (cf. Section 2.2.1.2) are shortly presented. Furthermore,
in Section 2.2.1.3, the major problem with objective quality assessment methods is
described.
2.2.1.1 Mean-Squared Error
The mean-squared error (MSE) [32] is a pixel-based fidelity metric which indicates
the mean of the squared pixel differences between two images. The MSE is defined
as shown in Equation 2.1. M × N is the dimension of the images. I represents the
original image and K the reconstructed image.
MSE =1
MN
∑m
∑n
[I(m,n)−K(m,n)]2 (2.1)
The rule of MSE is the following: The higher the MSE becomes the worse the
quality of an image.
In the literature, sometimes the root mean-squared error (RMSE =√MSE) is
used which specifies the average difference per pixel [32].

Page 20 Background and Related Work
2.2.1.2 Peak Signal-to-Noise Ratio
The peak signal-to-noise ratio (PSNR) [32] is also a pixel-based fidelity metric which
describes the fidelity of an image by using the difference between two images. Fi-
delity means how similar an image is compared to the original. PSNR is specified by
Equation 2.2 where one can see that it uses the MSE for calculation. MAX indicates
the maximum value a pixel can have, i.e., for an 8-bit image 255. The result of PSNR
is defined in decibels (dB).
PSNR = 10log10MAX2
MSE(2.2)
If two images are identical, Equation 2.2 results in an infinite PSNR. Regarding
the image quality, there is a common rule in the image processing community which
is that an excellent to good image quality is indicated by a PSNR between 30 to 45
dB; a PSNR below 20 dB indicates bad quality [28, 29].
2.2.1.3 Objective Quality Assessment Problems
Objective quality assessment methods are good methods for comparing content but
the major issue with these methods is that they can lead to wrong results from the user
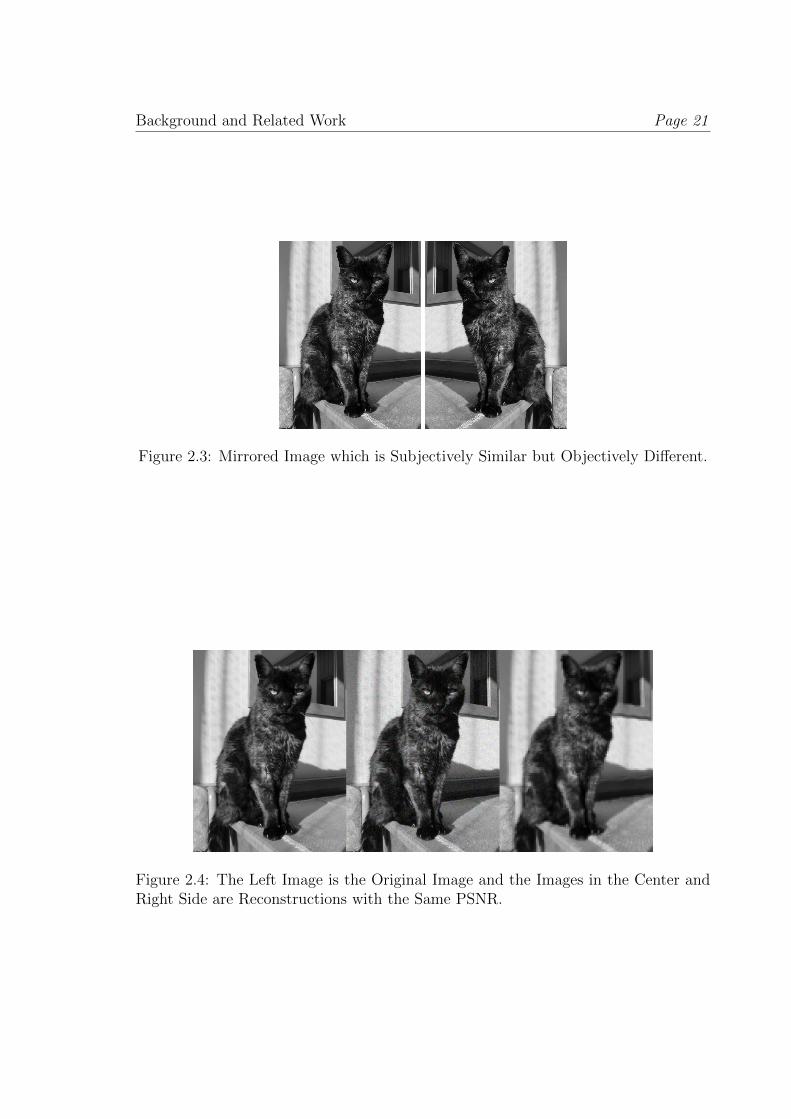
point of view. Figure 2.3 and Figure 2.4 show two examples for misleading objective
quality assessment results. Figure 2.3 presents a mirrored image which looks the same
from the user point of view but w.r.t. the objective comparison they are completely
different. If one compares the two compressed images (i.e., JPEG) to the original
uncompressed image (i.e., BMP), then the left image has a PSNR of around 44 dB
and the right of around 8 dB which indicates an image with bad quality.
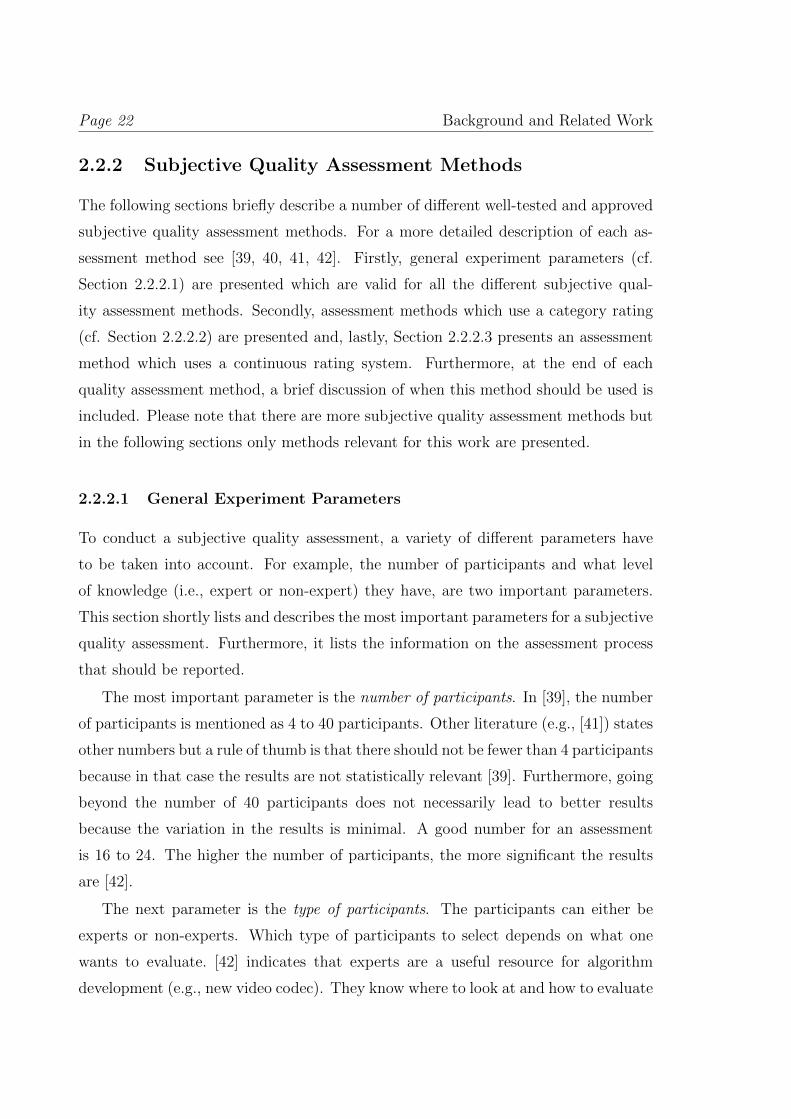
Figure 2.4 shows another example. On the left side one can see the original image.
In the center image some noise is introduced in the whole image and the right image
represents a blurred version of the image. One may say that the right image is much
worse than the center but both images (center and right) have the same PSNR of
around 24 dB.
Thus, there is the need for subjective quality assessment methods which are pre-
sented in Section 2.2.2.
Background and Related Work Page 21
Figure 2.3: Mirrored Image which is Subjectively Similar but Objectively Different.
Figure 2.4: The Left Image is the Original Image and the Images in the Center andRight Side are Reconstructions with the Same PSNR.
Page 22 Background and Related Work
2.2.2 Subjective Quality Assessment Methods
The following sections briefly describe a number of different well-tested and approved
subjective quality assessment methods. For a more detailed description of each as-
sessment method see [39, 40, 41, 42]. Firstly, general experiment parameters (cf.
Section 2.2.2.1) are presented which are valid for all the different subjective qual-
ity assessment methods. Secondly, assessment methods which use a category rating
(cf. Section 2.2.2.2) are presented and, lastly, Section 2.2.2.3 presents an assessment
method which uses a continuous rating system. Furthermore, at the end of each
quality assessment method, a brief discussion of when this method should be used is
included. Please note that there are more subjective quality assessment methods but
in the following sections only methods relevant for this work are presented.
2.2.2.1 General Experiment Parameters
To conduct a subjective quality assessment, a variety of different parameters have
to be taken into account. For example, the number of participants and what level
of knowledge (i.e., expert or non-expert) they have, are two important parameters.
This section shortly lists and describes the most important parameters for a subjective
quality assessment. Furthermore, it lists the information on the assessment process
that should be reported.
The most important parameter is the number of participants. In [39], the number
of participants is mentioned as 4 to 40 participants. Other literature (e.g., [41]) states
other numbers but a rule of thumb is that there should not be fewer than 4 participants
because in that case the results are not statistically relevant [39]. Furthermore, going
beyond the number of 40 participants does not necessarily lead to better results
because the variation in the results is minimal. A good number for an assessment
is 16 to 24. The higher the number of participants, the more significant the results
are [42].
The next parameter is the type of participants. The participants can either be
experts or non-experts. Which type of participants to select depends on what one
wants to evaluate. [42] indicates that experts are a useful resource for algorithm
development (e.g., new video codec). They know where to look at and how to evaluate
Background and Related Work Page 23
the technical aspects of the algorithms. Yet, experts are poor in evaluating the system
from a general perspective. To evaluate a system for the market, non-experts should
be used. Non-experts represent the general public in a subjective quality assessment.
They are able to recognize artifacts or problems that an expert might not be able to
detect because non-experts have no pre-determined way of looking at the content. It
is important to mention that each participant, both expert and non-expert, has to be
screened before the subjective quality assessment. According to [42], the two most
important factors to screen for are: color blindness and visual acuity. For both factors,
standardized methods (i.e., for detecting color blindness the Ishihara test [42, 43] and
for detecting visual acuity the Snellen Eye Chart [42, 44]) should be used.
The third parameter is the viewing conditions under which the assessment should
be conducted. In [39], a number of different viewing condition parameters are defined,
for example, Viewing distance, Peak luminance of the screen, Ratio of luminance of
inactive screen to peak luminance, Background room illumination. Most of these
parameters cannot be easily evaluated, e.g., the evaluation of the luminance needs
special equipment. Thus, at least the following two conditions, mentioned in [39],
have to hold. First, the participants should sit at a distance of 1 to 8 times the height
of the screen (i.e., normally around 90 cm). Second, if the test material (i.e., video,
image) is displayed in a window on the screen, the visible background should be 50%
grey, corresponding to Y = U = V = 128 (U and V unsigned).
The fourth parameter for an assessment is the test material used. The test ma-
terial can either be videos, images, audio, or a combination of them. In our case, the
test material comprises only audio/video sequences. The test material should have
a length of 10 seconds to 30 minutes but not more [39, 41]. The length of the test
material strongly depends on the selected assessment method. The person conducting
the assessment is advised to use test material from standardized sources such as the
Institute of Electrical and Electronics Engineers (IEEE), the Society of Motion Pic-
ture and Television Engineers (SMPTE), the Video Quality Experts Group (VQEG),
or the Moving Picture Experts Group (MPEG) [42]. The standardized test material
allows better comparison between different algorithms. Regarding the number of used
test contents, there is no default number of test stimuli. [42] suggests a number of 8
to 16 different stimuli to achieve good results.
Page 24 Background and Related Work
The last parameter for an assessment is the length of the assessment itself. The
length depends on the selected assessment method and can range from a maximum
duration of 30 minutes to 90 minutes [39, 41]. The 90 minute sequences are only used
for the Single Stimulus Continuous Quality Evaluation (SSCQE) and for the Simulta-
neous Double Stimulus for Continuous Evaluation (SDSCE) assessment methods [41].
More details about various quality assessment methods which were evaluated through-
out this work are presented in Sections 2.2.2.2 and 2.2.2.3.
Besides the different parameters for an assessment, the reporting of the results
is important. The International Telecommunication Union (ITU) specifies in [39]
and [41] the following items that should be reported:
• Details of the test configuration
• Details of the test material
• Type of picture source (e.g., the camera used) and display monitors
• Number and type of assessors
• Reference system used (if any)
• The grand mean score for the experiment
• Original and adjusted mean scores (if one or more outliers were detected ac-
cording to, e.g., [41])
• 95% confidence interval
Usually, only the adjusted mean scores are presented in publications.
Note that it is recommended to include a number of replications of test mate-
rial. [39] suggests at least two, if possible three or four, replications in an assessment.
These replications should be mixed with the other test sequences in the experiment.
Replications are used to test the reliability of the participants. In case of a high vari-
ation between the original and replication, a participant can be discarded from the
result set. The results from subjective test methods are reported as a mean opinion
score (MOS).
2.2.2.2 Category Methods
Category methods provide the participant with a number of test sequences. De-
pending on the used method, the test sequences are rated independently or they are
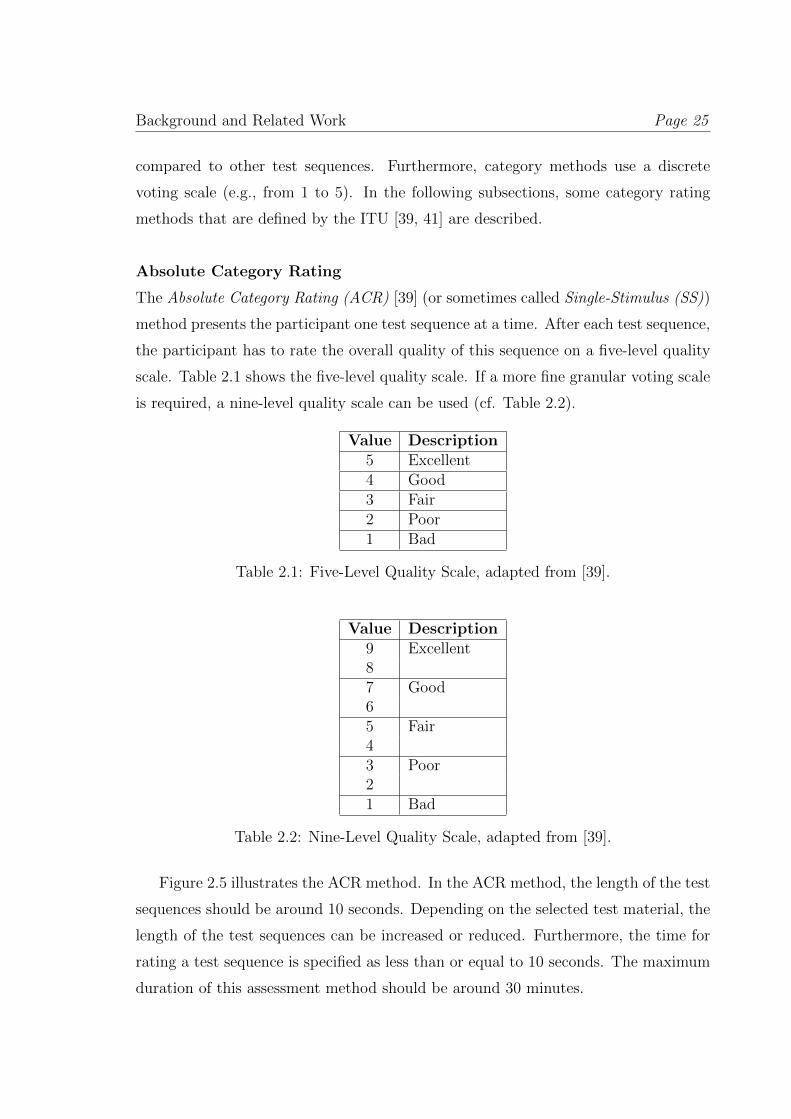
Background and Related Work Page 25
compared to other test sequences. Furthermore, category methods use a discrete
voting scale (e.g., from 1 to 5). In the following subsections, some category rating
methods that are defined by the ITU [39, 41] are described.
Absolute Category Rating
The Absolute Category Rating (ACR) [39] (or sometimes called Single-Stimulus (SS))
method presents the participant one test sequence at a time. After each test sequence,
the participant has to rate the overall quality of this sequence on a five-level quality
scale. Table 2.1 shows the five-level quality scale. If a more fine granular voting scale
is required, a nine-level quality scale can be used (cf. Table 2.2).
Value Description5 Excellent4 Good3 Fair2 Poor1 Bad
Table 2.1: Five-Level Quality Scale, adapted from [39].
Value Description9 Excellent87 Good65 Fair43 Poor21 Bad
Table 2.2: Nine-Level Quality Scale, adapted from [39].
Figure 2.5 illustrates the ACR method. In the ACR method, the length of the test
sequences should be around 10 seconds. Depending on the selected test material, the
length of the test sequences can be increased or reduced. Furthermore, the time for
rating a test sequence is specified as less than or equal to 10 seconds. The maximum
duration of this assessment method should be around 30 minutes.
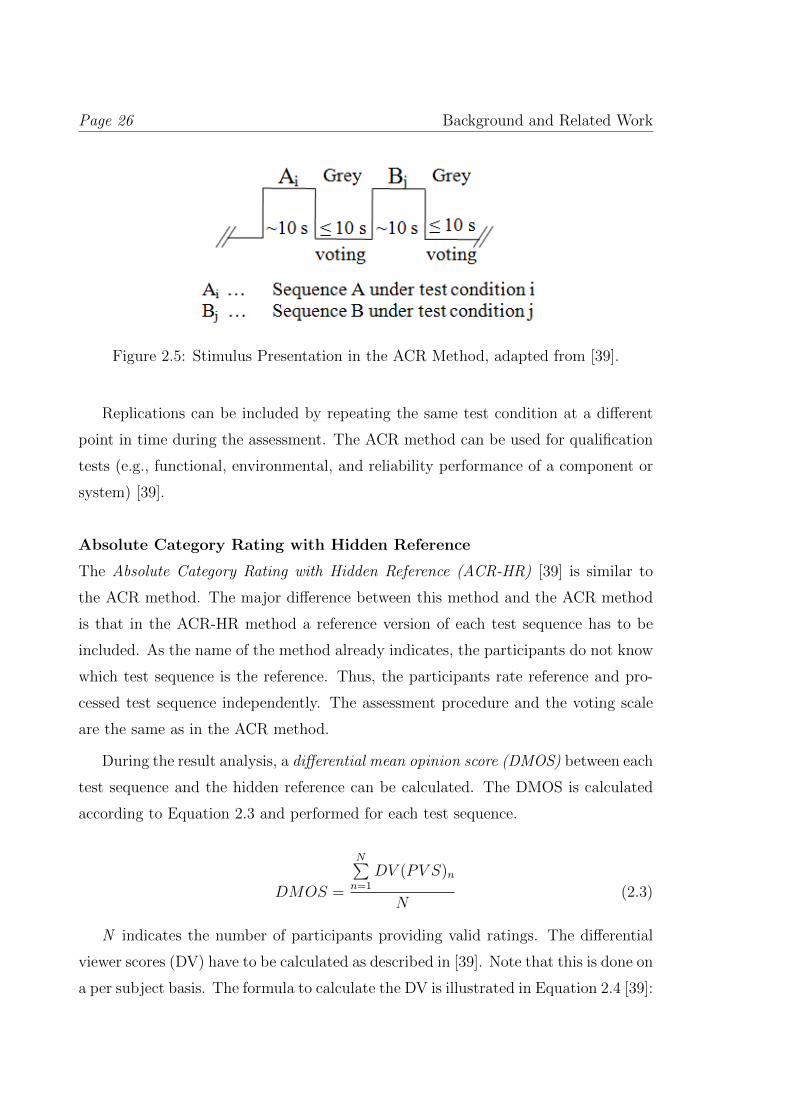
Page 26 Background and Related Work
Figure 2.5: Stimulus Presentation in the ACR Method, adapted from [39].
Replications can be included by repeating the same test condition at a different
point in time during the assessment. The ACR method can be used for qualification
tests (e.g., functional, environmental, and reliability performance of a component or
system) [39].
Absolute Category Rating with Hidden Reference
The Absolute Category Rating with Hidden Reference (ACR-HR) [39] is similar to
the ACR method. The major difference between this method and the ACR method
is that in the ACR-HR method a reference version of each test sequence has to be
included. As the name of the method already indicates, the participants do not know
which test sequence is the reference. Thus, the participants rate reference and pro-
cessed test sequence independently. The assessment procedure and the voting scale
are the same as in the ACR method.
During the result analysis, a differential mean opinion score (DMOS) between each
test sequence and the hidden reference can be calculated. The DMOS is calculated
according to Equation 2.3 and performed for each test sequence.
DMOS =
N∑n=1
DV (PV S)n
N(2.3)
N indicates the number of participants providing valid ratings. The differential
viewer scores (DV) have to be calculated as described in [39]. Note that this is done on
a per subject basis. The formula to calculate the DV is illustrated in Equation 2.4 [39]:
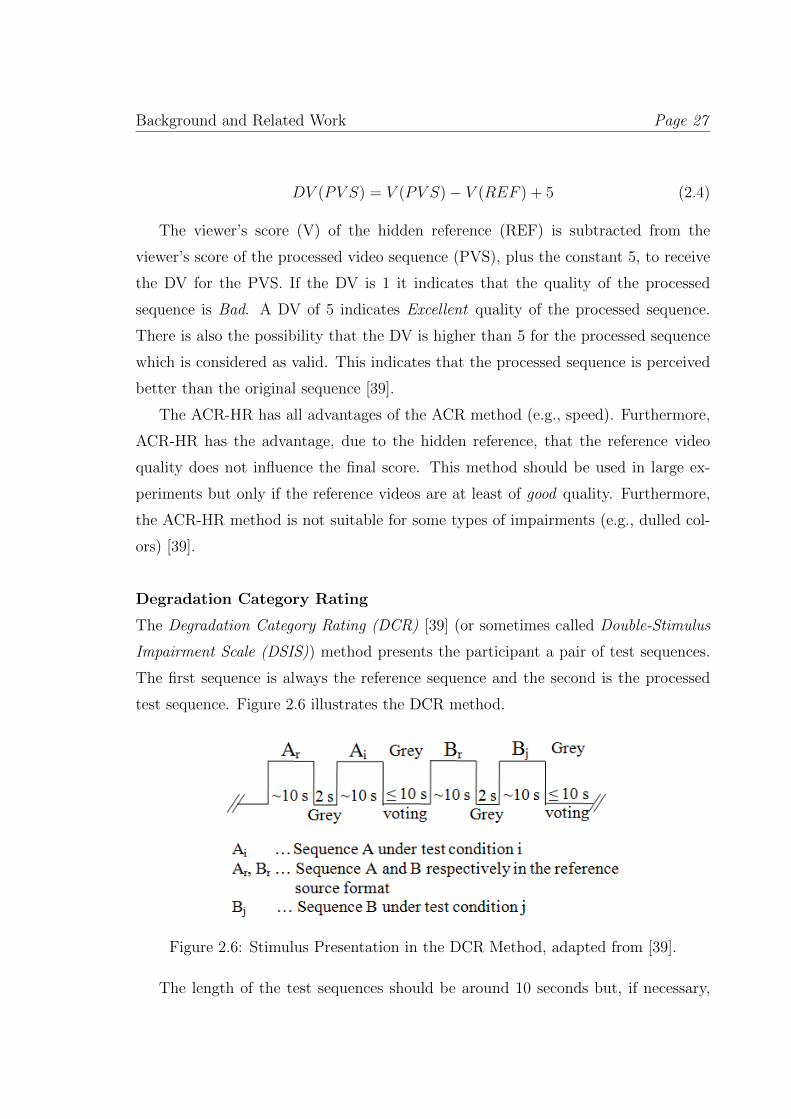
Background and Related Work Page 27
DV (PV S) = V (PV S)− V (REF ) + 5 (2.4)
The viewer’s score (V) of the hidden reference (REF) is subtracted from the
viewer’s score of the processed video sequence (PVS), plus the constant 5, to receive
the DV for the PVS. If the DV is 1 it indicates that the quality of the processed
sequence is Bad. A DV of 5 indicates Excellent quality of the processed sequence.
There is also the possibility that the DV is higher than 5 for the processed sequence
which is considered as valid. This indicates that the processed sequence is perceived
better than the original sequence [39].
The ACR-HR has all advantages of the ACR method (e.g., speed). Furthermore,
ACR-HR has the advantage, due to the hidden reference, that the reference video
quality does not influence the final score. This method should be used in large ex-
periments but only if the reference videos are at least of good quality. Furthermore,
the ACR-HR method is not suitable for some types of impairments (e.g., dulled col-
ors) [39].
Degradation Category Rating
The Degradation Category Rating (DCR) [39] (or sometimes called Double-Stimulus
Impairment Scale (DSIS)) method presents the participant a pair of test sequences.
The first sequence is always the reference sequence and the second is the processed
test sequence. Figure 2.6 illustrates the DCR method.
Figure 2.6: Stimulus Presentation in the DCR Method, adapted from [39].
The length of the test sequences should be around 10 seconds but, if necessary,
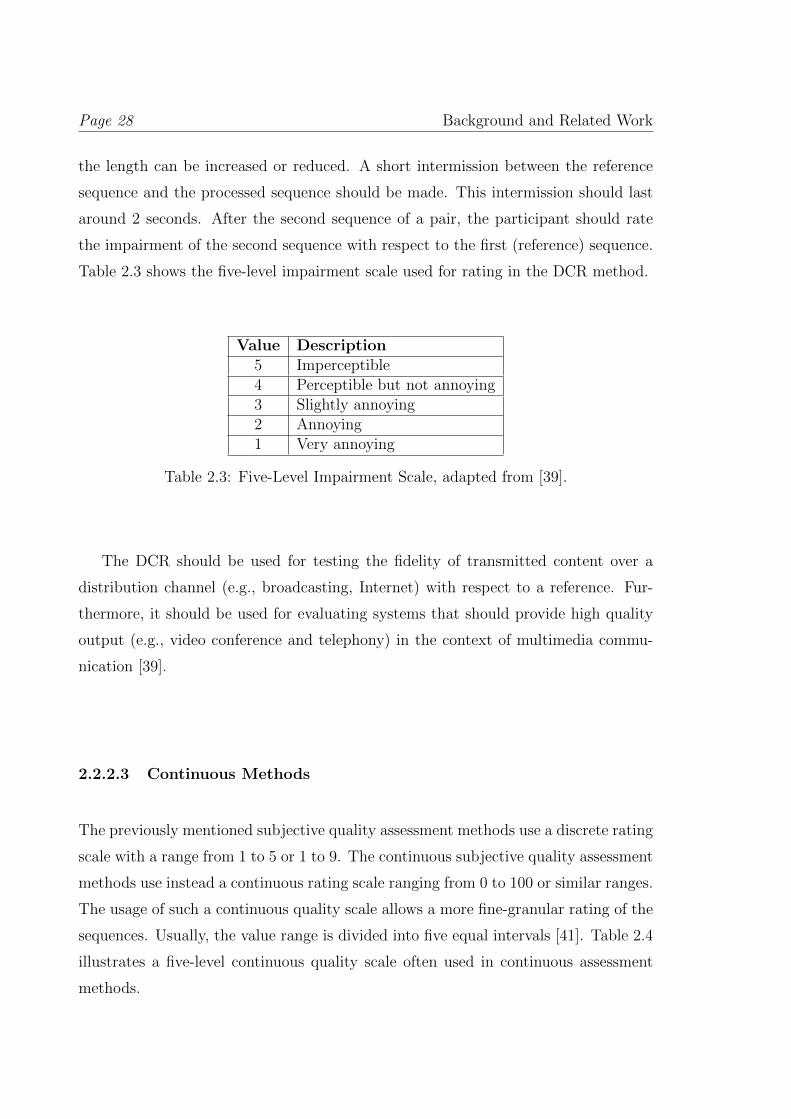
Page 28 Background and Related Work
the length can be increased or reduced. A short intermission between the reference
sequence and the processed sequence should be made. This intermission should last
around 2 seconds. After the second sequence of a pair, the participant should rate
the impairment of the second sequence with respect to the first (reference) sequence.
Table 2.3 shows the five-level impairment scale used for rating in the DCR method.
Value Description5 Imperceptible4 Perceptible but not annoying3 Slightly annoying2 Annoying1 Very annoying
Table 2.3: Five-Level Impairment Scale, adapted from [39].
The DCR should be used for testing the fidelity of transmitted content over a
distribution channel (e.g., broadcasting, Internet) with respect to a reference. Fur-
thermore, it should be used for evaluating systems that should provide high quality
output (e.g., video conference and telephony) in the context of multimedia commu-
nication [39].
2.2.2.3 Continuous Methods
The previously mentioned subjective quality assessment methods use a discrete rating
scale with a range from 1 to 5 or 1 to 9. The continuous subjective quality assessment
methods use instead a continuous rating scale ranging from 0 to 100 or similar ranges.
The usage of such a continuous quality scale allows a more fine-granular rating of the
sequences. Usually, the value range is divided into five equal intervals [41]. Table 2.4
illustrates a five-level continuous quality scale often used in continuous assessment
methods.
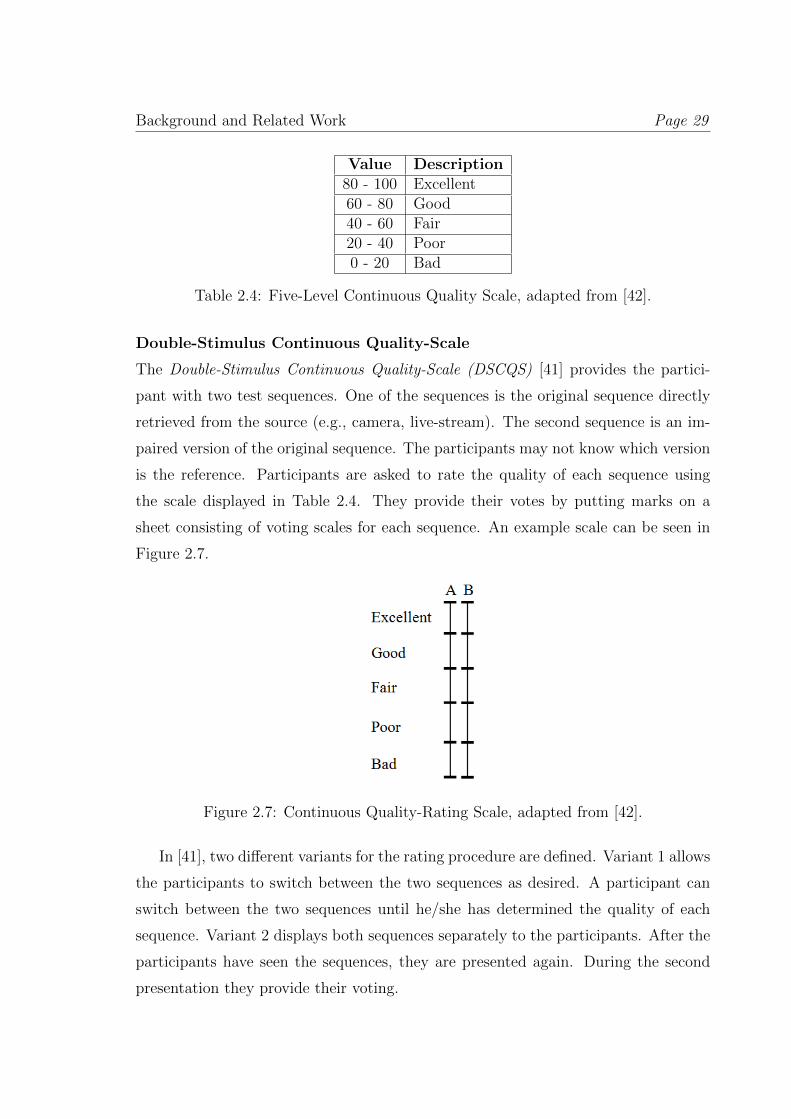
Background and Related Work Page 29
Value Description80 - 100 Excellent60 - 80 Good40 - 60 Fair20 - 40 Poor0 - 20 Bad
Table 2.4: Five-Level Continuous Quality Scale, adapted from [42].
Double-Stimulus Continuous Quality-Scale
The Double-Stimulus Continuous Quality-Scale (DSCQS) [41] provides the partici-
pant with two test sequences. One of the sequences is the original sequence directly
retrieved from the source (e.g., camera, live-stream). The second sequence is an im-
paired version of the original sequence. The participants may not know which version
is the reference. Participants are asked to rate the quality of each sequence using
the scale displayed in Table 2.4. They provide their votes by putting marks on a
sheet consisting of voting scales for each sequence. An example scale can be seen in
Figure 2.7.
Figure 2.7: Continuous Quality-Rating Scale, adapted from [42].
In [41], two different variants for the rating procedure are defined. Variant 1 allows
the participants to switch between the two sequences as desired. A participant can
switch between the two sequences until he/she has determined the quality of each
sequence. Variant 2 displays both sequences separately to the participants. After the
participants have seen the sequences, they are presented again. During the second
presentation they provide their voting.
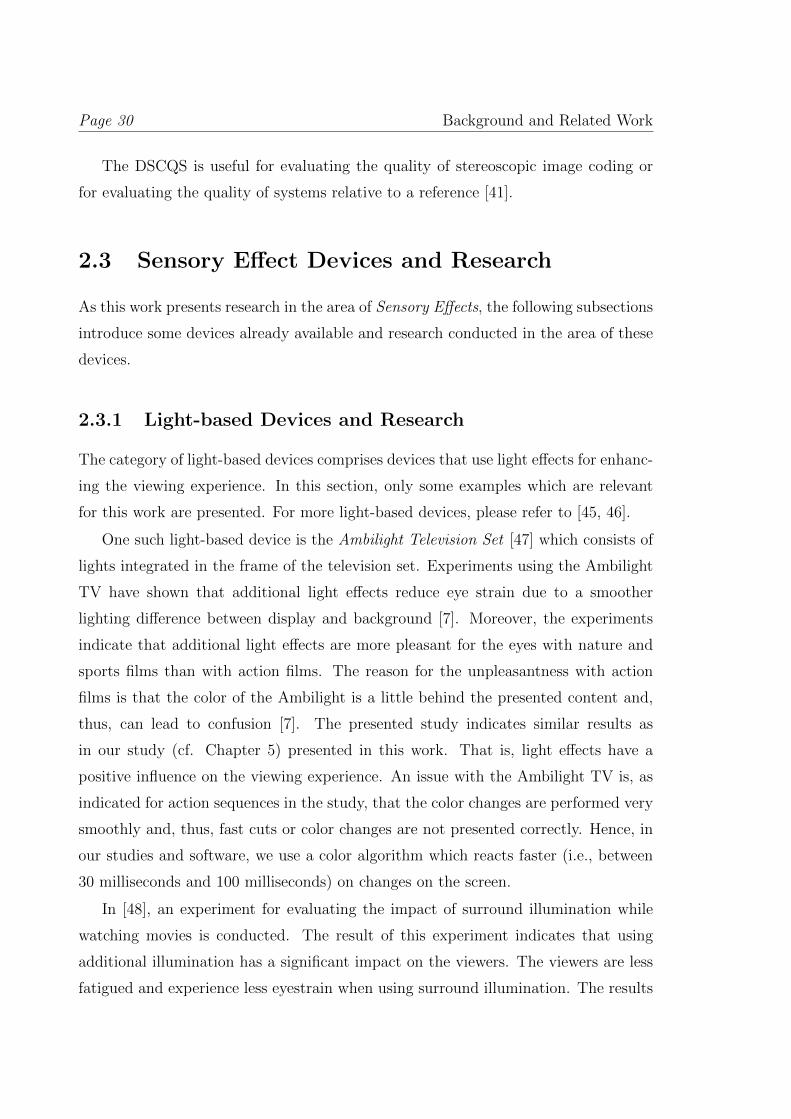
Page 30 Background and Related Work
The DSCQS is useful for evaluating the quality of stereoscopic image coding or
for evaluating the quality of systems relative to a reference [41].
2.3 Sensory Effect Devices and Research
As this work presents research in the area of Sensory Effects, the following subsections
introduce some devices already available and research conducted in the area of these
devices.
2.3.1 Light-based Devices and Research
The category of light-based devices comprises devices that use light effects for enhanc-
ing the viewing experience. In this section, only some examples which are relevant
for this work are presented. For more light-based devices, please refer to [45, 46].
One such light-based device is the Ambilight Television Set [47] which consists of
lights integrated in the frame of the television set. Experiments using the Ambilight
TV have shown that additional light effects reduce eye strain due to a smoother
lighting difference between display and background [7]. Moreover, the experiments
indicate that additional light effects are more pleasant for the eyes with nature and
sports films than with action films. The reason for the unpleasantness with action
films is that the color of the Ambilight is a little behind the presented content and,
thus, can lead to confusion [7]. The presented study indicates similar results as
in our study (cf. Chapter 5) presented in this work. That is, light effects have a
positive influence on the viewing experience. An issue with the Ambilight TV is, as
indicated for action sequences in the study, that the color changes are performed very
smoothly and, thus, fast cuts or color changes are not presented correctly. Hence, in
our studies and software, we use a color algorithm which reacts faster (i.e., between
30 milliseconds and 100 milliseconds) on changes on the screen.
In [48], an experiment for evaluating the impact of surround illumination while
watching movies is conducted. The result of this experiment indicates that using
additional illumination has a significant impact on the viewers. The viewers are less
fatigued and experience less eyestrain when using surround illumination. The results
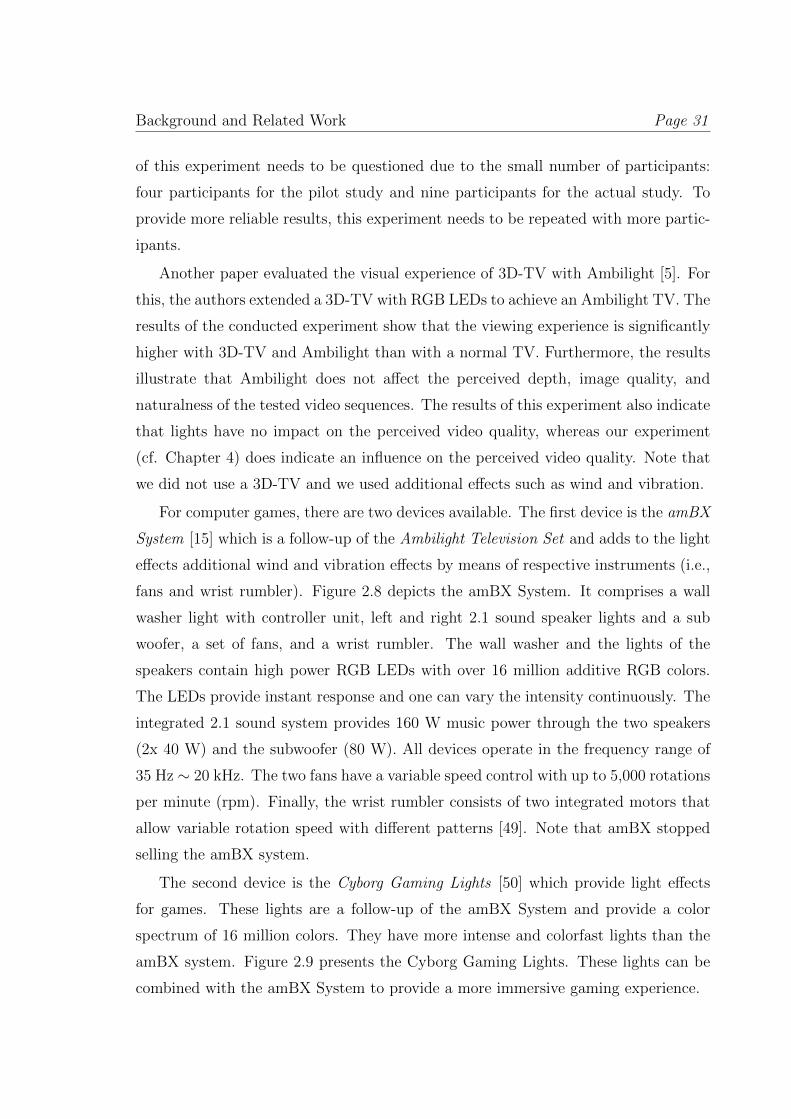
Background and Related Work Page 31
of this experiment needs to be questioned due to the small number of participants:
four participants for the pilot study and nine participants for the actual study. To
provide more reliable results, this experiment needs to be repeated with more partic-
ipants.
Another paper evaluated the visual experience of 3D-TV with Ambilight [5]. For
this, the authors extended a 3D-TV with RGB LEDs to achieve an Ambilight TV. The
results of the conducted experiment show that the viewing experience is significantly
higher with 3D-TV and Ambilight than with a normal TV. Furthermore, the results
illustrate that Ambilight does not affect the perceived depth, image quality, and
naturalness of the tested video sequences. The results of this experiment also indicate
that lights have no impact on the perceived video quality, whereas our experiment
(cf. Chapter 4) does indicate an influence on the perceived video quality. Note that
we did not use a 3D-TV and we used additional effects such as wind and vibration.
For computer games, there are two devices available. The first device is the amBX
System [15] which is a follow-up of the Ambilight Television Set and adds to the light
effects additional wind and vibration effects by means of respective instruments (i.e.,
fans and wrist rumbler). Figure 2.8 depicts the amBX System. It comprises a wall
washer light with controller unit, left and right 2.1 sound speaker lights and a sub
woofer, a set of fans, and a wrist rumbler. The wall washer and the lights of the
speakers contain high power RGB LEDs with over 16 million additive RGB colors.
The LEDs provide instant response and one can vary the intensity continuously. The
integrated 2.1 sound system provides 160 W music power through the two speakers
(2x 40 W) and the subwoofer (80 W). All devices operate in the frequency range of
35 Hz ∼ 20 kHz. The two fans have a variable speed control with up to 5,000 rotations
per minute (rpm). Finally, the wrist rumbler consists of two integrated motors that
allow variable rotation speed with different patterns [49]. Note that amBX stopped
selling the amBX system.
The second device is the Cyborg Gaming Lights [50] which provide light effects
for games. These lights are a follow-up of the amBX System and provide a color
spectrum of 16 million colors. They have more intense and colorfast lights than the
amBX system. Figure 2.9 presents the Cyborg Gaming Lights. These lights can be
combined with the amBX System to provide a more immersive gaming experience.
Page 32 Background and Related Work
Figure 2.8: Components of the amBX System.
Figure 2.9: Activated Cyborg Gaming Lights.
There is also research on offering whole Ambient Light Systems (ALSs) [51]. These
systems are integrated in a room (e.g., living room) and change the ambient lighting
of the room according to a movie or a music video. This is done by using LEDs which
are mounted on boards and positioned in the room. The ALS extracts the informa-
tion from the content (e.g., movie) and renders the color through these LEDs [51].
The system provides an interesting approach to illuminate a room according to the
watched content. There are some questions and issues arising from the paper. First,
according to the paper there are fans mounted on the LED boards to cool them if
necessary. How much these fans add to the ambient noise is not evaluated and, there-
fore, this noise may reduce the QoE. Second, even for a small room, nine such LED
boards are needed which questions the usability of such systems.
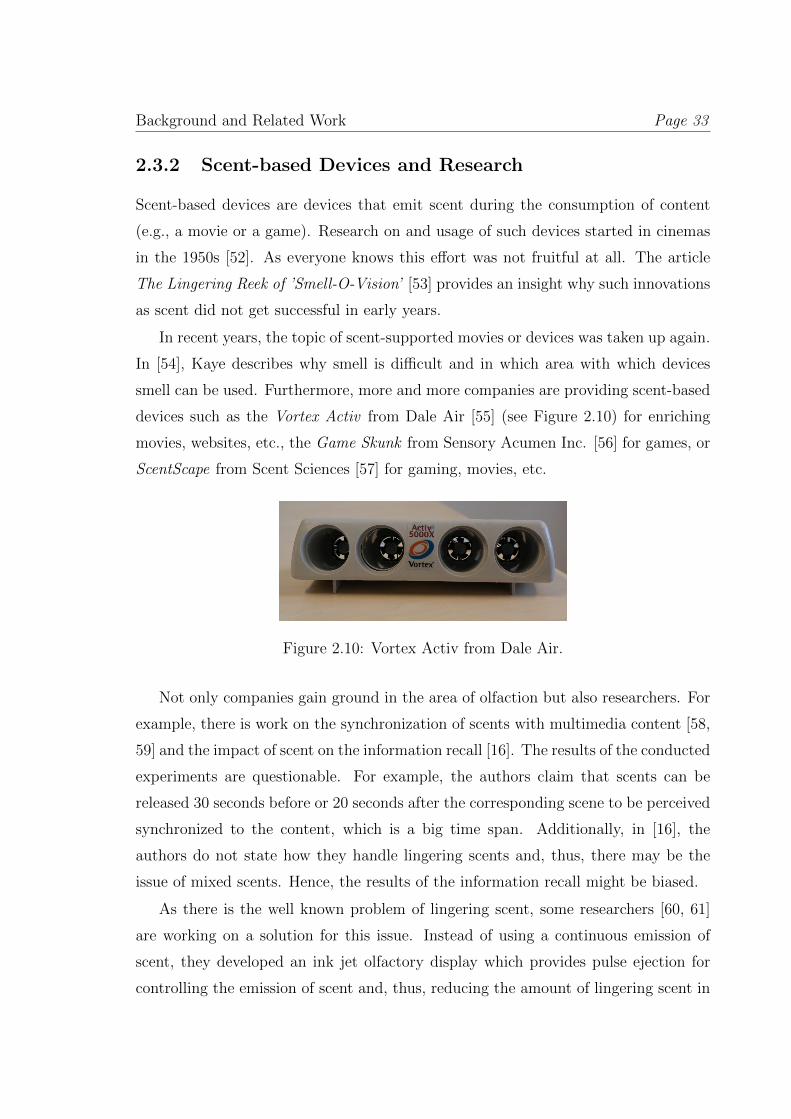
Background and Related Work Page 33
2.3.2 Scent-based Devices and Research
Scent-based devices are devices that emit scent during the consumption of content
(e.g., a movie or a game). Research on and usage of such devices started in cinemas
in the 1950s [52]. As everyone knows this effort was not fruitful at all. The article
The Lingering Reek of ’Smell-O-Vision’ [53] provides an insight why such innovations
as scent did not get successful in early years.
In recent years, the topic of scent-supported movies or devices was taken up again.
In [54], Kaye describes why smell is difficult and in which area with which devices
smell can be used. Furthermore, more and more companies are providing scent-based
devices such as the Vortex Activ from Dale Air [55] (see Figure 2.10) for enriching
movies, websites, etc., the Game Skunk from Sensory Acumen Inc. [56] for games, or
ScentScape from Scent Sciences [57] for gaming, movies, etc.
Figure 2.10: Vortex Activ from Dale Air.
Not only companies gain ground in the area of olfaction but also researchers. For
example, there is work on the synchronization of scents with multimedia content [58,
59] and the impact of scent on the information recall [16]. The results of the conducted
experiments are questionable. For example, the authors claim that scents can be
released 30 seconds before or 20 seconds after the corresponding scene to be perceived
synchronized to the content, which is a big time span. Additionally, in [16], the
authors do not state how they handle lingering scents and, thus, there may be the
issue of mixed scents. Hence, the results of the information recall might be biased.
As there is the well known problem of lingering scent, some researchers [60, 61]
are working on a solution for this issue. Instead of using a continuous emission of
scent, they developed an ink jet olfactory display which provides pulse ejection for
controlling the emission of scent and, thus, reducing the amount of lingering scent in
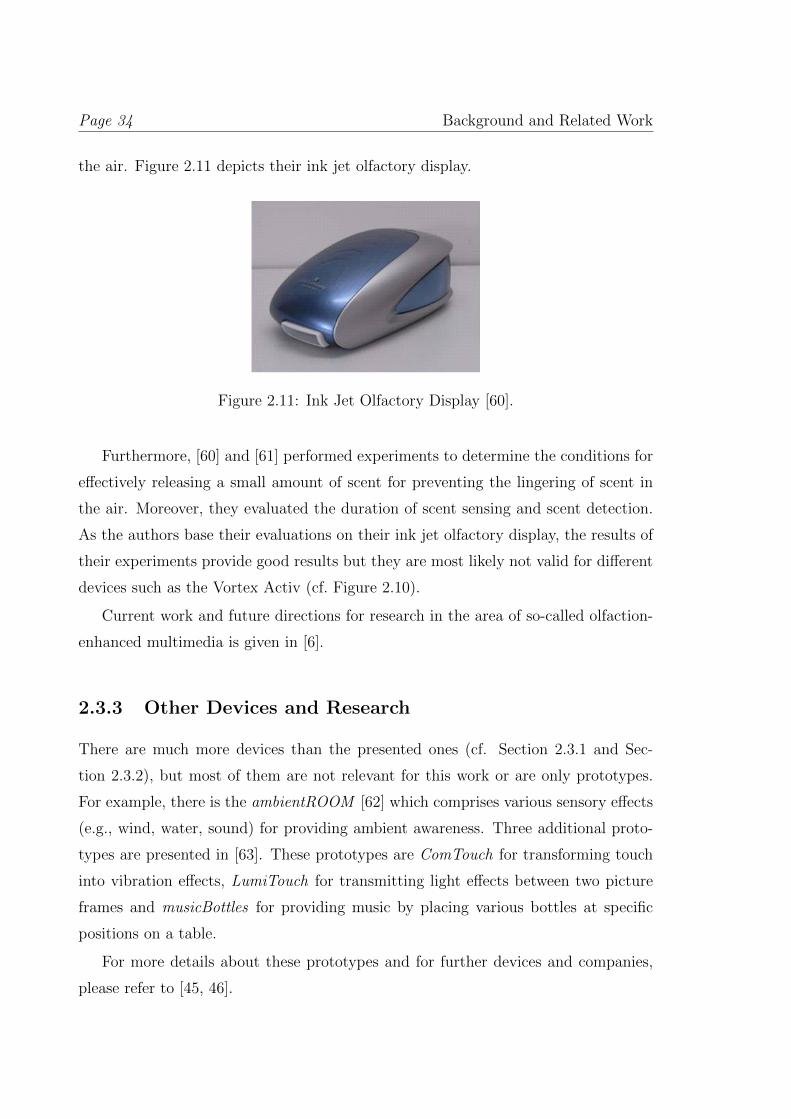
Page 34 Background and Related Work
the air. Figure 2.11 depicts their ink jet olfactory display.
Figure 2.11: Ink Jet Olfactory Display [60].
Furthermore, [60] and [61] performed experiments to determine the conditions for
effectively releasing a small amount of scent for preventing the lingering of scent in
the air. Moreover, they evaluated the duration of scent sensing and scent detection.
As the authors base their evaluations on their ink jet olfactory display, the results of
their experiments provide good results but they are most likely not valid for different
devices such as the Vortex Activ (cf. Figure 2.10).
Current work and future directions for research in the area of so-called olfaction-
enhanced multimedia is given in [6].
2.3.3 Other Devices and Research
There are much more devices than the presented ones (cf. Section 2.3.1 and Sec-
tion 2.3.2), but most of them are not relevant for this work or are only prototypes.
For example, there is the ambientROOM [62] which comprises various sensory effects
(e.g., wind, water, sound) for providing ambient awareness. Three additional proto-
types are presented in [63]. These prototypes are ComTouch for transforming touch
into vibration effects, LumiTouch for transmitting light effects between two picture
frames and musicBottles for providing music by placing various bottles at specific
positions on a table.
For more details about these prototypes and for further devices and companies,
please refer to [45, 46].
Background and Related Work Page 35
2.4 MPEG-V: Media Context and Control
In this work, evaluations on multimedia content enriched by sensory effects are pre-
sented. Therefore, there is the need to describe sensory effects in an appropriate
way. For this, we evaluated different possibilities such as property files (i.e., name/
value pairs in one line), subtitle formats (i.e., SRT1) and XML-based formats (i.e.,
MPEG-V).
The advantages of the property files and the subtitle formats are that they are
simple to edit and generate. Depending on the verbosity of the descriptions, they are
small and can be parsed very fast. The disadvantages of these descriptions are that
they can be defined by each producer individually and, thus, sensory effects can only
be rendered on devices supported by these producers. Additionally, these descriptions
do not allow complex data structures.
The advantages of XML-based formats are that they are human readable, easy
to extend, parse, and generate, and they allow complex data structures. Moreover,
XML-based formats provide error checks by using schema files. Using schema files also
provides the possibility to provide pre-defined structures, for example, a pre-defined
effect with specific parameters. Disadvantages of the XML-based formats are that
they are verbose and, thus, need more space than other kinds of formats. Moreover,
parsing may be slow due to the verbosity of the descriptions.
In our case, we needed a description format that provided us interoperability and
extensibility. Additionally, the format should provide means for easy generation and
parsing and, furthermore, error detection. Hence, we decided to use the XML-based
approach. Luckily, there was an ongoing standardization of an XML-based description
for sensory effects which fulfilled all our requirements and, thus, we based our work
on this standard.
Hence, this section presents the ISO/IEC International Standard 25003 which is
called MPEG-V: Media Context and Control [13]. MPEG-V: Media Context and
Control has been introduced by the ISO/IEC for offering interoperability between
virtual worlds and the real world.
Virtual worlds are specified in Part 1: Architecture [64] as follows: ”Virtual worlds
1http://www.matroska.org/technical/specs/subtitles/srt.html
Page 36 Background and Related Work
(often referred to as 3D3C for 3D visualization & navigation and the 3C’s of Commu-
nity, Creation and Commerce) integrate existing and emerging (media) technologies
(e.g. instant messaging, video, 3D, VR, AI, chat, voice, etc.) that allow for the
support of existing and the development of new kinds of social networks.” [64]
Such virtual worlds can be games like World of Warcraft, DVDs or simulations.
On the other hand, there is the real world which is represented by sensors, actuators,
real estate, banking, etc., to name some examples.
Furthermore, MPEG-V provides means for enriching multimedia content for stim-
ulating additional senses. For example, traditional multimedia content only stimu-
lates vision and audition. By using MPEG-V, further senses can be stimulated such
as olfaction, mechanoreception, equilibrioception or thermoception [65]. For offer-
ing an enhanced multimedia experience, MPEG-V provides a set of tools which are
described in detail in Section 2.4.1. All these tools provide XML-based metadata
for describing so-called Sensory Effects or steering appropriate devices (e.g., lamps,
vibration chairs). A detailed description of the so-called Sensory Effect Description
Language (SEDL) and the Sensory Effect Vocabulary (SEV) can be found in Sec-
tion 2.4.2 and Section 2.4.3, respectively. Lastly, some usage examples for MPEG-V
are given in Section 2.4.4 and some application areas and related work are presented
in Section 2.4.5.
As introduced in [66], the basic intention of the standard is to map the author’s
intention to sensory effects (e.g., wind, vibration, light). Furthermore, the latter
is then mapped to sensory devices (e.g., vibration chairs, lamps, fans). This basic
intention is depicted in Figure 2.12. Note that there is not always a one-to-one
mapping between intentions, sensory effects and/or sensory devices. As one can see
in Figure 2.12, multiple senses can be stimulated through the same sensory effect
and/or sensory device.
2.4.1 MPEG-V Architecture
This section presents an overview of the MPEG-V: Media Context and Control archi-
tecture with focus on Part 3: Sensory Information. The MPEG-V standard consists
of two standardization areas which are Area A: Control Information and Area B:
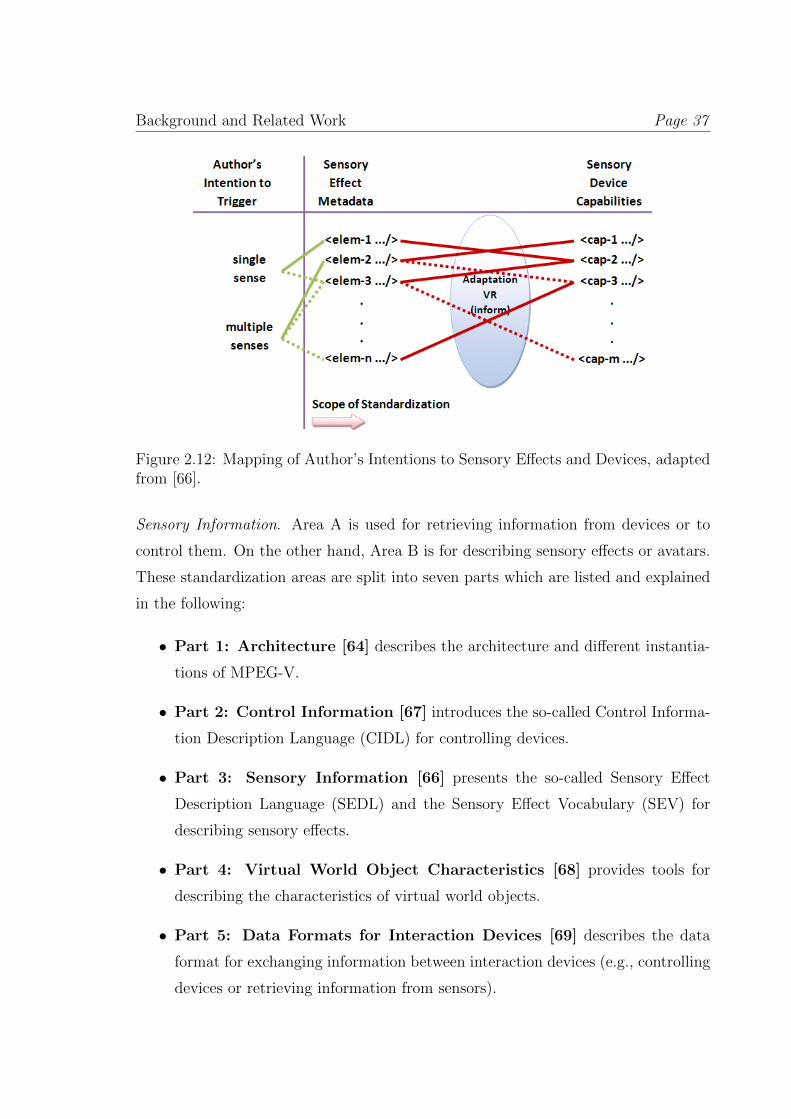
Background and Related Work Page 37
Figure 2.12: Mapping of Author’s Intentions to Sensory Effects and Devices, adaptedfrom [66].
Sensory Information. Area A is used for retrieving information from devices or to
control them. On the other hand, Area B is for describing sensory effects or avatars.
These standardization areas are split into seven parts which are listed and explained
in the following:
• Part 1: Architecture [64] describes the architecture and different instantia-
tions of MPEG-V.
• Part 2: Control Information [67] introduces the so-called Control Informa-
tion Description Language (CIDL) for controlling devices.
• Part 3: Sensory Information [66] presents the so-called Sensory Effect
Description Language (SEDL) and the Sensory Effect Vocabulary (SEV) for
describing sensory effects.
• Part 4: Virtual World Object Characteristics [68] provides tools for
describing the characteristics of virtual world objects.
• Part 5: Data Formats for Interaction Devices [69] describes the data
format for exchanging information between interaction devices (e.g., controlling
devices or retrieving information from sensors).
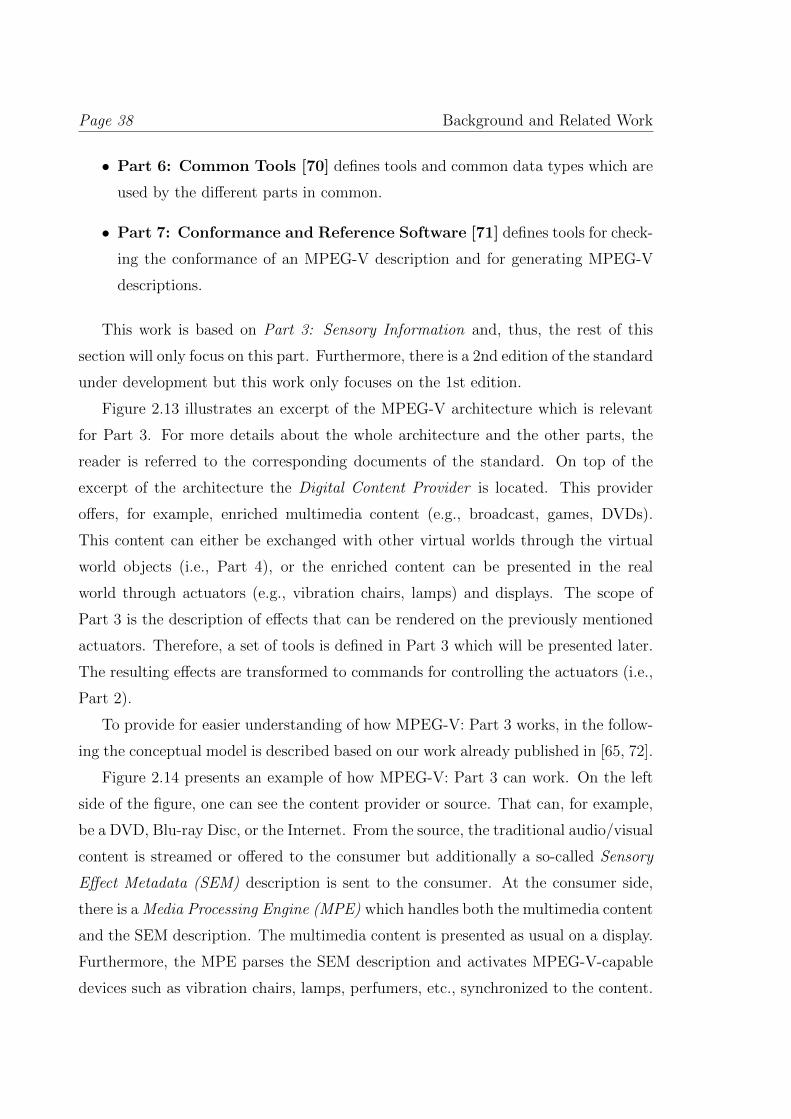
Page 38 Background and Related Work
• Part 6: Common Tools [70] defines tools and common data types which are
used by the different parts in common.
• Part 7: Conformance and Reference Software [71] defines tools for check-
ing the conformance of an MPEG-V description and for generating MPEG-V
descriptions.
This work is based on Part 3: Sensory Information and, thus, the rest of this
section will only focus on this part. Furthermore, there is a 2nd edition of the standard
under development but this work only focuses on the 1st edition.
Figure 2.13 illustrates an excerpt of the MPEG-V architecture which is relevant
for Part 3. For more details about the whole architecture and the other parts, the
reader is referred to the corresponding documents of the standard. On top of the
excerpt of the architecture the Digital Content Provider is located. This provider
offers, for example, enriched multimedia content (e.g., broadcast, games, DVDs).
This content can either be exchanged with other virtual worlds through the virtual
world objects (i.e., Part 4), or the enriched content can be presented in the real
world through actuators (e.g., vibration chairs, lamps) and displays. The scope of
Part 3 is the description of effects that can be rendered on the previously mentioned
actuators. Therefore, a set of tools is defined in Part 3 which will be presented later.
The resulting effects are transformed to commands for controlling the actuators (i.e.,
Part 2).
To provide for easier understanding of how MPEG-V: Part 3 works, in the follow-
ing the conceptual model is described based on our work already published in [65, 72].
Figure 2.14 presents an example of how MPEG-V: Part 3 can work. On the left
side of the figure, one can see the content provider or source. That can, for example,
be a DVD, Blu-ray Disc, or the Internet. From the source, the traditional audio/visual
content is streamed or offered to the consumer but additionally a so-called Sensory
Effect Metadata (SEM) description is sent to the consumer. At the consumer side,
there is a Media Processing Engine (MPE) which handles both the multimedia content
and the SEM description. The multimedia content is presented as usual on a display.
Furthermore, the MPE parses the SEM description and activates MPEG-V-capable
devices such as vibration chairs, lamps, perfumers, etc., synchronized to the content.
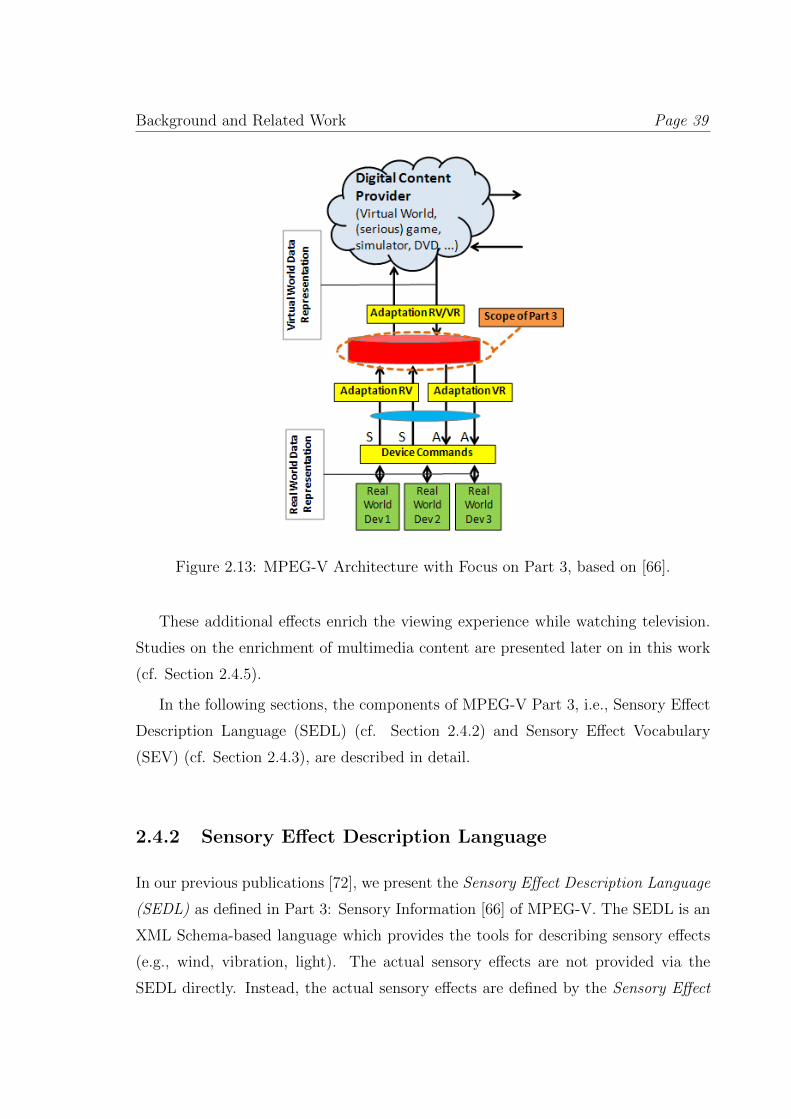
Background and Related Work Page 39
Figure 2.13: MPEG-V Architecture with Focus on Part 3, based on [66].
These additional effects enrich the viewing experience while watching television.
Studies on the enrichment of multimedia content are presented later on in this work
(cf. Section 2.4.5).
In the following sections, the components of MPEG-V Part 3, i.e., Sensory Effect
Description Language (SEDL) (cf. Section 2.4.2) and Sensory Effect Vocabulary
(SEV) (cf. Section 2.4.3), are described in detail.
2.4.2 Sensory Effect Description Language
In our previous publications [72], we present the Sensory Effect Description Language
(SEDL) as defined in Part 3: Sensory Information [66] of MPEG-V. The SEDL is an
XML Schema-based language which provides the tools for describing sensory effects
(e.g., wind, vibration, light). The actual sensory effects are not provided via the
SEDL directly. Instead, the actual sensory effects are defined by the Sensory Effect
Page 40 Background and Related Work
Figure 2.14: Example of MPEG-V: Part 3, adapted from [65].
Vocabulary (SEV) which is presented in Section 2.4.3. The MPEG-V standard pro-
vides a separate SEV schema for allowing extensibility and flexibility. Thus, specific
application domains may define their own sensory effects.
A description conforming to SEDL (and implicitly to SEV) is called Sensory Ef-
fect Metadata (SEM) description. The SEM description can accompany any kind of
multimedia (e.g., movies, music, games). MPEG-V-capable processing engines (e.g.,
set-top boxes) can use the SEM description to steer appropriate sensory devices like
fans, vibrations chairs, lamps, perfumers, etc. Thus, in addition to the audio-visual
content, sensory effects are rendered to enhance the viewing experience of the user.
The current version of SEDL is specified in [66]. In the following, we give an
overview of the components of SEDL. The components are provided in Extended-
Backus-Naur Form (EBNF) [73] because of the verbosity of XML. Note that this
description is based on our work published in [72].
SEM = timeScale , [ autoExtract ion ] , [ Descr ipt ionMetadata ] ,
{Dec la ra t i on s | GroupOfEffects | E f f e c t | Re f e r enc eE f f e c t}−
SEM is the root element of a SEM description. It contains a timeScale attribute
that defines the time scale used for the sensory effects within this description (i.e., the
number of ticks per second). The attribute is based on the XML Streaming Instruc-
tions (XSI) as specified in ISO/IEC 21000-7 [74]. Furthermore, the SEM element
contains an optional autoExtraction attribute and the DescriptionMetadata element.
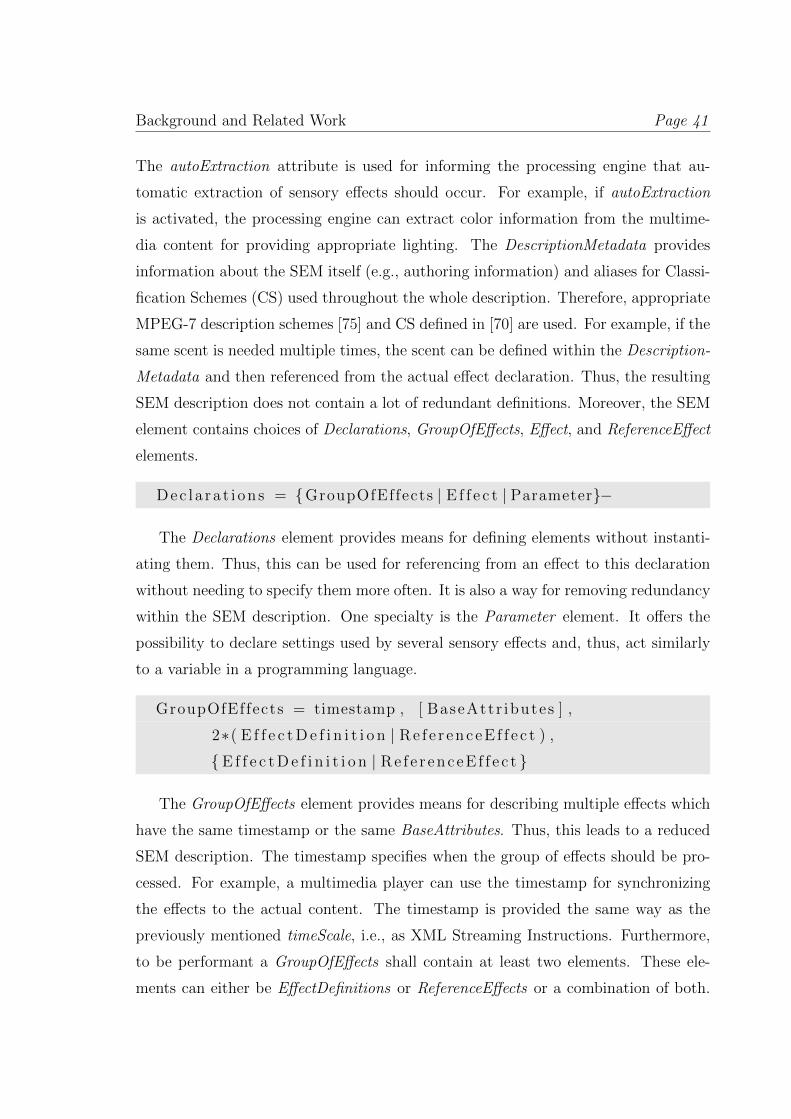
Background and Related Work Page 41
The autoExtraction attribute is used for informing the processing engine that au-
tomatic extraction of sensory effects should occur. For example, if autoExtraction
is activated, the processing engine can extract color information from the multime-
dia content for providing appropriate lighting. The DescriptionMetadata provides
information about the SEM itself (e.g., authoring information) and aliases for Classi-
fication Schemes (CS) used throughout the whole description. Therefore, appropriate
MPEG-7 description schemes [75] and CS defined in [70] are used. For example, if the
same scent is needed multiple times, the scent can be defined within the Description-
Metadata and then referenced from the actual effect declaration. Thus, the resulting
SEM description does not contain a lot of redundant definitions. Moreover, the SEM
element contains choices of Declarations, GroupOfEffects, Effect, and ReferenceEffect
elements.
Dec l a ra t i on s = {GroupOfEffects | E f f e c t | Parameter}−
The Declarations element provides means for defining elements without instanti-
ating them. Thus, this can be used for referencing from an effect to this declaration
without needing to specify them more often. It is also a way for removing redundancy
within the SEM description. One specialty is the Parameter element. It offers the
possibility to declare settings used by several sensory effects and, thus, act similarly
to a variable in a programming language.
GroupOfEffects = timestamp , [ BaseAttr ibutes ] ,
2∗( E f f e c t D e f i n i t i o n | Re f e r enc eE f f e c t ) ,
{E f f e c t D e f i n i t i o n | Re f e r enc eE f f e c t }
The GroupOfEffects element provides means for describing multiple effects which
have the same timestamp or the same BaseAttributes. Thus, this leads to a reduced
SEM description. The timestamp specifies when the group of effects should be pro-
cessed. For example, a multimedia player can use the timestamp for synchronizing
the effects to the actual content. The timestamp is provided the same way as the
previously mentioned timeScale, i.e., as XML Streaming Instructions. Furthermore,
to be performant a GroupOfEffects shall contain at least two elements. These ele-
ments can either be EffectDefinitions or ReferenceEffects or a combination of both.
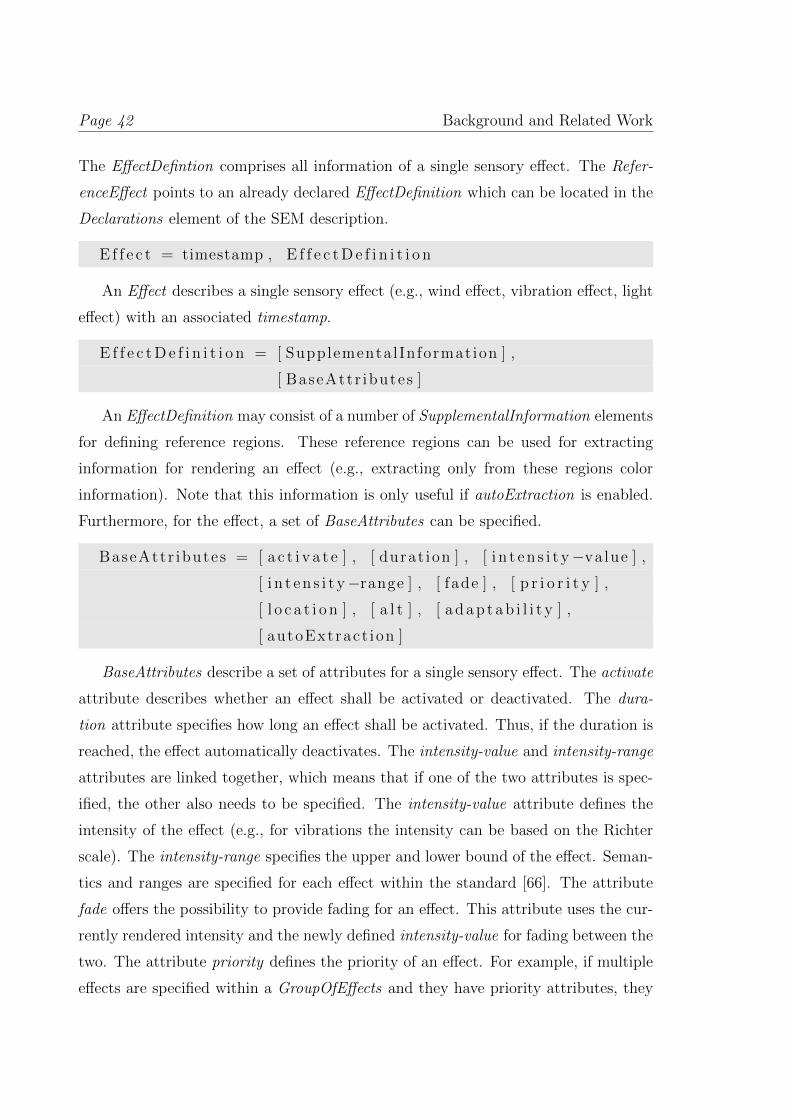
Page 42 Background and Related Work
The EffectDefintion comprises all information of a single sensory effect. The Refer-
enceEffect points to an already declared EffectDefinition which can be located in the
Declarations element of the SEM description.
E f f e c t = timestamp , E f f e c t D e f i n i t i o n
An Effect describes a single sensory effect (e.g., wind effect, vibration effect, light
effect) with an associated timestamp.
E f f e c t D e f i n i t i o n = [ Supplemental Information ] ,
[ BaseAttr ibutes ]
An EffectDefinition may consist of a number of SupplementalInformation elements
for defining reference regions. These reference regions can be used for extracting
information for rendering an effect (e.g., extracting only from these regions color
information). Note that this information is only useful if autoExtraction is enabled.
Furthermore, for the effect, a set of BaseAttributes can be specified.
BaseAttr ibutes = [ a c t i v a t e ] , [ durat ion ] , [ i n t e n s i t y−value ] ,
[ i n t e n s i t y−range ] , [ fade ] , [ p r i o r i t y ] ,
[ l o c a t i o n ] , [ a l t ] , [ a d a p t a b i l i t y ] ,
[ autoExtract ion ]
BaseAttributes describe a set of attributes for a single sensory effect. The activate
attribute describes whether an effect shall be activated or deactivated. The dura-
tion attribute specifies how long an effect shall be activated. Thus, if the duration is
reached, the effect automatically deactivates. The intensity-value and intensity-range
attributes are linked together, which means that if one of the two attributes is spec-
ified, the other also needs to be specified. The intensity-value attribute defines the
intensity of the effect (e.g., for vibrations the intensity can be based on the Richter
scale). The intensity-range specifies the upper and lower bound of the effect. Seman-
tics and ranges are specified for each effect within the standard [66]. The attribute
fade offers the possibility to provide fading for an effect. This attribute uses the cur-
rently rendered intensity and the newly defined intensity-value for fading between the
two. The attribute priority defines the priority of an effect. For example, if multiple
effects are specified within a GroupOfEffects and they have priority attributes, they
Background and Related Work Page 43
are rendered according to their priorities (e.g., first light, then vibration). This can
be useful if the processing engine is not capable of handling all defined effects in time.
The location attribute offers means for providing the same effect in different positions.
For example, if there are two fans available and one is left and the other is right of
the screen, the author can specify which of the two should be used. The standard
provides a number of different positions located in a three-dimensional space. The
attribute alt specifies an alternative if the defined effect cannot be handled. The
attribute adaptability is a combination of two attributes, i.e., adaptType and adap-
tRange. These attributes enable the description of the preferred type of adaptation
with a given upper and lower bound. The last attribute autoExtraction has the same
semantic as already described in the SEM root element. The major difference is that
this definition only applies to this single sensory effect.
2.4.3 Sensory Effect Vocabulary
Besides the Sensory Effect Description Language (SEDL, cf. Section 2.4.2), we further
present in our publications [72] the Sensory Effect Vocabulary (SEV) which is also
part of MPEG-V Part 3: Sensory Information [66].
The Sensory Effect Vocabulary (SEV) defines the sensory effects themselves, not
like SEDL which defines the basic structure of the Sensory Effect Metadata (SEM)
description. SEV is also XML-based and, thus, allows to be extended by additional
effects not yet defined. Furthermore, due to the XML-based approach, own sensory
effects can be derived from already specified sensory effects. Moreover, SEV is an
abstract approach for describing sensory effects from the author’s point of view. This
means that the description provided by the author is independent of the devices the
user owns. The mapping of the annotated sensory effects to the actual available
devices is performed by the media processing engine. Thus, the media processing
engine may have the capability to adapt annotated sensory effects to available devices
(e.g., if a cooler for simulating a scene on a glacier is not available, another device
such as fans for stimulating the appropriate sense has to be used). Note that the
media processing engine is not standardized in MPEG-V, but is left open to industry
competition.
Page 44 Background and Related Work
The 1st edition of the MPEG-V standard supports 15 sensory effects that are
described in the following [72]:
Light offers the possibility to describe light effects with intensity in lux and op-
tional with different colors. If colors are used, then the standard speaks about colored
light [66]. The color can be defined in different ways: first, color can be specified
as a static color either via a classification scheme [70] or directly via hexadecimal
RGB values (e.g., #FFAAFF). Second, the color can be dynamic by extracting color
information from the currently displayed content. There is also an extended version
of the light effect which is called flash light. Flash light provides the same features
as the basic light effect but offers the possibility to provide flickering in a specified
frequency.
Temperature allows describing a temperature effect for simulating heat or cold.
The temperature effect can be used, e.g., in explosions or flying scenes. The wind
effect simulates wind from various directions. For example, it can be used for simu-
lating the speed of a car or the strength of a tornado. Vibration offers the possibility
to stimulate rumble like occurring in an explosion or a tremor. The water sprayer
effect provides the feature of enhancing various scenes that include water, e.g., rain
or sneezing. For stimulating the olfaction sense, the standard offers the scent effect.
The author can select from different types of scents (e.g., rose, lilac) specified in the
classification schemes of MPEG-V Part 6 [70]. The fog effect provides means for
enriching foggy scenes, e.g., scenes in horror movies.
Color correction is not a sensory effect like the previous ones, it is a specification
for adjusting color information. This can be used for changing the color of a scene to
the user’s preferences or impairments. For example, the viewing experience of a color
blind person may be enhanced by using the color adjustment. Another use case for
the color correction may be the highlighting of specific regions or masking of specific
colors for achieving a special effect.
For tactile and kinesthetic devices, several effects are specified in the standard:
rigid body motion, passive kinesthetic motion, passive kinesthetic force, active kines-
thetic and tactile. These effects can be used for providing movement information to
the user, e.g., for medical training or drawing.
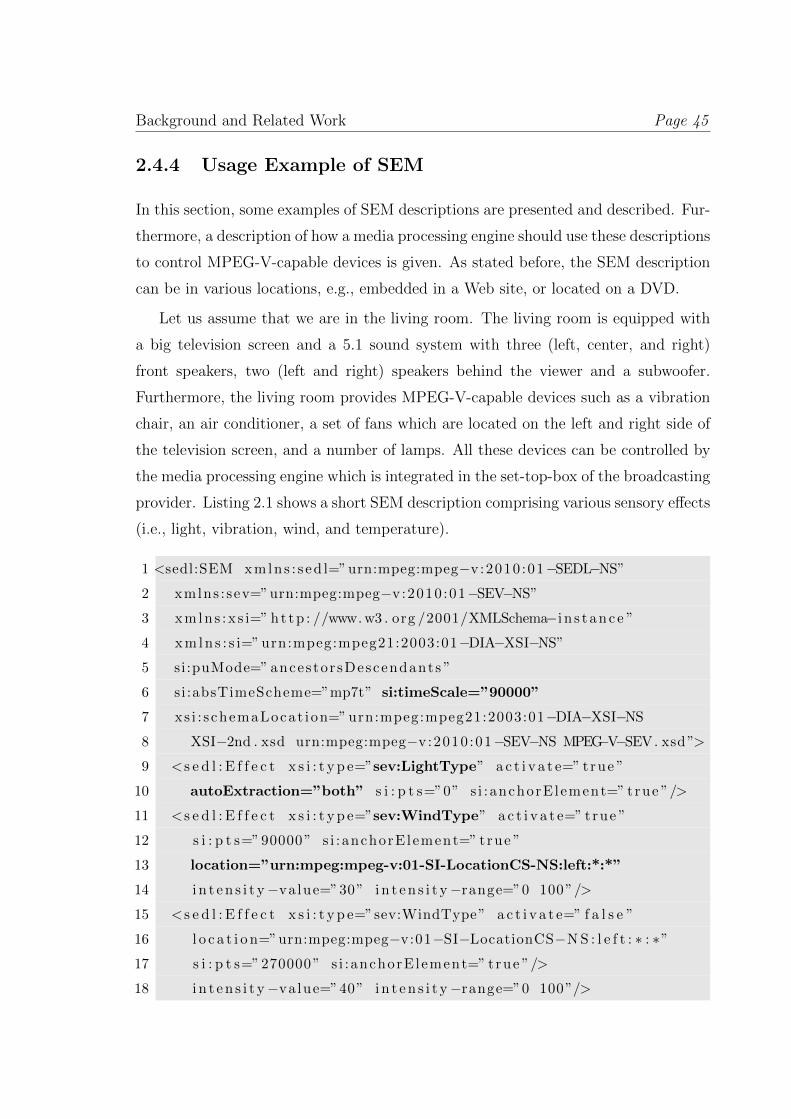
Background and Related Work Page 45
2.4.4 Usage Example of SEM
In this section, some examples of SEM descriptions are presented and described. Fur-
thermore, a description of how a media processing engine should use these descriptions
to control MPEG-V-capable devices is given. As stated before, the SEM description
can be in various locations, e.g., embedded in a Web site, or located on a DVD.
Let us assume that we are in the living room. The living room is equipped with
a big television screen and a 5.1 sound system with three (left, center, and right)
front speakers, two (left and right) speakers behind the viewer and a subwoofer.
Furthermore, the living room provides MPEG-V-capable devices such as a vibration
chair, an air conditioner, a set of fans which are located on the left and right side of
the television screen, and a number of lamps. All these devices can be controlled by
the media processing engine which is integrated in the set-top-box of the broadcasting
provider. Listing 2.1 shows a short SEM description comprising various sensory effects
(i.e., light, vibration, wind, and temperature).
1 <sedl:SEM xmlns : s ed l=”urn:mpeg:mpeg−v:2010 :01−SEDL−NS”2 xmlns : sev=”urn:mpeg:mpeg−v:2010 :01−SEV−NS”3 xmlns :x s i=” ht tp : //www.w3 . org /2001/XMLSchema−i n s t anc e ”4 xmln s : s i=”urn:mpeg:mpeg21:2003:01−DIA−XSI−NS”5 si:puMode=” ancestorsDescendants ”
6 si :absTimeScheme=”mp7t” si:timeScale=”90000”
7 xs i : s chemaLocat ion=”urn:mpeg:mpeg21:2003:01−DIA−XSI−NS8 XSI−2nd . xsd urn:mpeg:mpeg−v:2010 :01−SEV−NS MPEG−V−SEV. xsd”>
9 <s e d l : E f f e c t x s i : t y p e=”sev:LightType” a c t i v a t e=” true ”
10 autoExtraction=”both” s i : p t s=”0” s i :anchorElement=” true ”/>
11 <s e d l : E f f e c t x s i : t y p e=”sev:WindType” a c t i v a t e=” true ”
12 s i : p t s=”90000” s i :anchorElement=” true ”
13 location=”urn:mpeg:mpeg-v:01-SI-LocationCS-NS:left:*:*”
14 i n t en s i t y−value=”30” i n t en s i t y−range=”0 100”/>
15 <s e d l : E f f e c t x s i : t y p e=”sev:WindType” a c t i v a t e=” f a l s e ”
16 l o c a t i o n=”urn:mpeg:mpeg−v:01−SI−LocationCS−NS : l e f t : ∗ : ∗”17 s i : p t s=”270000” s i :anchorElement=” true ”/>
18 i n t en s i t y−value=”40” i n t en s i t y−range=”0 100”/>
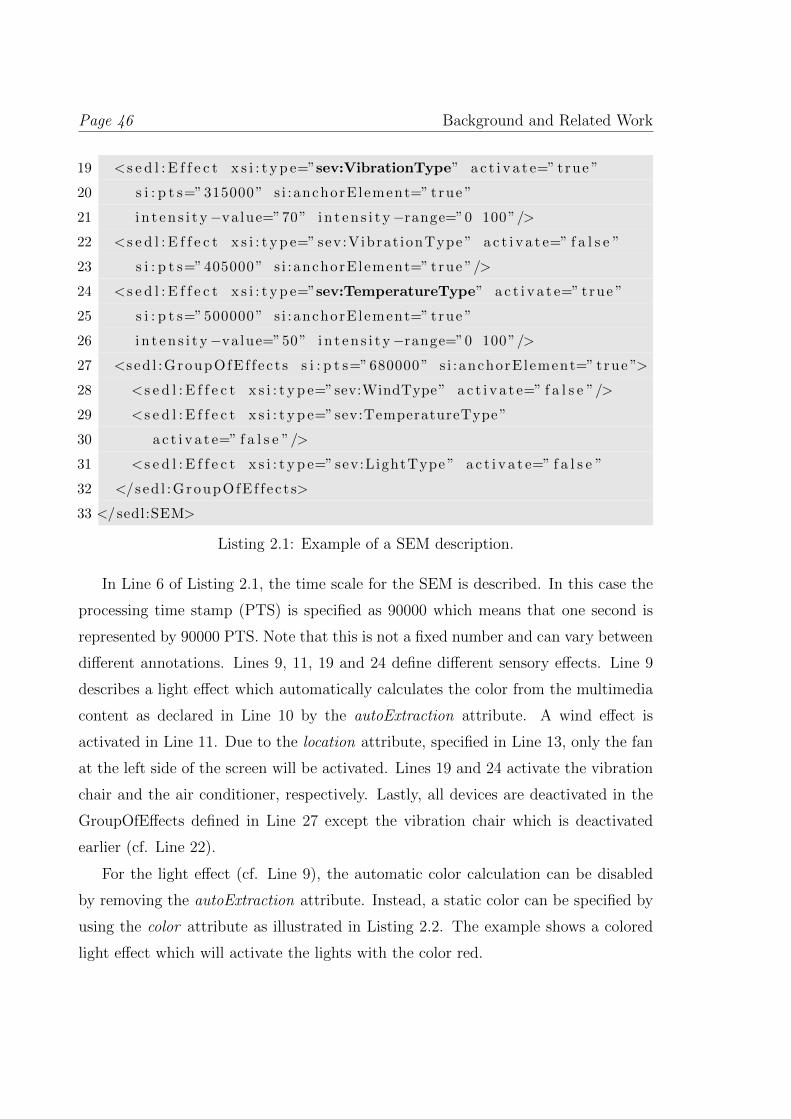
Page 46 Background and Related Work
19 <s e d l : E f f e c t x s i : t y p e=”sev:VibrationType” a c t i v a t e=” true ”
20 s i : p t s=”315000” s i :anchorElement=” true ”
21 i n t en s i t y−value=”70” i n t en s i t y−range=”0 100”/>
22 <s e d l : E f f e c t x s i : t y p e=” sev :Vibrat ionType ” a c t i v a t e=” f a l s e ”
23 s i : p t s=”405000” s i :anchorElement=” true ”/>
24 <s e d l : E f f e c t x s i : t y p e=”sev:TemperatureType” a c t i v a t e=” true ”
25 s i : p t s=”500000” s i :anchorElement=” true ”
26 i n t en s i t y−value=”50” i n t en s i t y−range=”0 100”/>
27 <s ed l :GroupOfEf f e c t s s i : p t s=”680000” s i :anchorElement=” true ”>
28 <s e d l : E f f e c t x s i : t y p e=”sev:WindType” a c t i v a t e=” f a l s e ”/>
29 <s e d l : E f f e c t x s i : t y p e=”sev:TemperatureType”
30 a c t i v a t e=” f a l s e ”/>
31 <s e d l : E f f e c t x s i : t y p e=” sev:LightType ” a c t i v a t e=” f a l s e ”
32 </sed l :GroupOfEf f e c t s>
33 </sedl:SEM>
Listing 2.1: Example of a SEM description.
In Line 6 of Listing 2.1, the time scale for the SEM is described. In this case the
processing time stamp (PTS) is specified as 90000 which means that one second is
represented by 90000 PTS. Note that this is not a fixed number and can vary between
different annotations. Lines 9, 11, 19 and 24 define different sensory effects. Line 9
describes a light effect which automatically calculates the color from the multimedia
content as declared in Line 10 by the autoExtraction attribute. A wind effect is
activated in Line 11. Due to the location attribute, specified in Line 13, only the fan
at the left side of the screen will be activated. Lines 19 and 24 activate the vibration
chair and the air conditioner, respectively. Lastly, all devices are deactivated in the
GroupOfEffects defined in Line 27 except the vibration chair which is deactivated
earlier (cf. Line 22).
For the light effect (cf. Line 9), the automatic color calculation can be disabled
by removing the autoExtraction attribute. Instead, a static color can be specified by
using the color attribute as illustrated in Listing 2.2. The example shows a colored
light effect which will activate the lights with the color red.
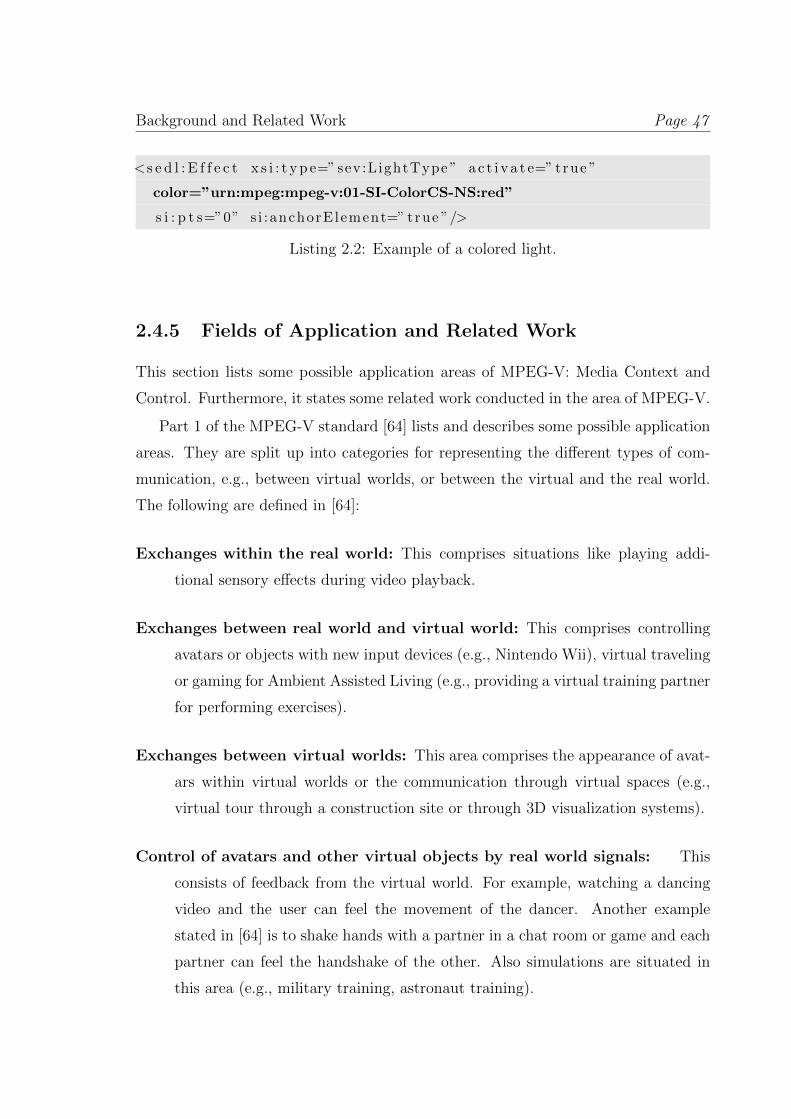
Background and Related Work Page 47
<s e d l : E f f e c t x s i : t y p e=” sev:LightType ” a c t i v a t e=” true ”
color=”urn:mpeg:mpeg-v:01-SI-ColorCS-NS:red”
s i : p t s=”0” s i :anchorElement=” true ”/>
Listing 2.2: Example of a colored light.
2.4.5 Fields of Application and Related Work
This section lists some possible application areas of MPEG-V: Media Context and
Control. Furthermore, it states some related work conducted in the area of MPEG-V.
Part 1 of the MPEG-V standard [64] lists and describes some possible application
areas. They are split up into categories for representing the different types of com-
munication, e.g., between virtual worlds, or between the virtual and the real world.
The following are defined in [64]:
Exchanges within the real world: This comprises situations like playing addi-
tional sensory effects during video playback.
Exchanges between real world and virtual world: This comprises controlling
avatars or objects with new input devices (e.g., Nintendo Wii), virtual traveling
or gaming for Ambient Assisted Living (e.g., providing a virtual training partner
for performing exercises).
Exchanges between virtual worlds: This area comprises the appearance of avat-
ars within virtual worlds or the communication through virtual spaces (e.g.,
virtual tour through a construction site or through 3D visualization systems).
Control of avatars and other virtual objects by real world signals: This
consists of feedback from the virtual world. For example, watching a dancing
video and the user can feel the movement of the dancer. Another example
stated in [64] is to shake hands with a partner in a chat room or game and each
partner can feel the handshake of the other. Also simulations are situated in
this area (e.g., military training, astronaut training).
Page 48 Background and Related Work
Control of objects by signals from the virtual world: This area consists of
motion controlling. For example, controlling a thrill ride in an entertainment
park.
More details about the different applications areas can be found in [64].
As MPEG-V supports a lot of application areas, there are already some publica-
tions in the area of MPEG-V. For example, a new generation of media services which
are called Single Media Multiple Devices (SMMD) has been introduced by Choi et
al. [76]. The paper introduces an SMMD media controller which can process SEM
descriptions and, thus, control various sensory devices. [77] is an earlier version of the
SMMD controller but takes also the context of Universal Plug and Play (UPnP) into
account. Yoon et al. [78] go one step further and introduce a framework for broad-
casting based on MPEG-V. The authors call it 4-D broadcasting. This framework
mainly focuses on SEM delivery via the MPEG-2 Transport Stream and its decoding
at the consumer side. Additionally, in [79], another broadcasting system is intro-
duced for streaming additional sensory effects together with the audio/video content.
Furthermore, Yun et al. [80] introduce a synchronization algorithm for multimedia
content accompanied by sensory effects. In the paper, they also present evaluation
results for their algorithm.
In this work, we do not focus on the streaming aspects of multimedia content
enriched by sensory effects since the goal of this work is to show the impact of sensory
effects on the viewer and the perceived content. Additionally, we store the SEM
descriptions locally or download it from a server before rendering the enriched content.
Hence, the synchronization between the effects and the multimedia content can be
accomplished by using the timestamps within the SEM descriptions and the playback
time. Therefore, the presented synchronization algorithms may be useful in streaming
scenarios but are not relevant for this work.
CHAPTER
3 Influence of Sensory Effects
on the Viewing Experience
Previous research has shown that additional light effects positively influence the view-
ing experience while watching a movie [7]. One issue with this research is that it only
takes light effects into account. Therefore, there is the need for evaluations on the
influence of various effects (i.e., light, wind, vibration) on the viewing experience.
Additionally, to the best of our knowledge, there are no assessments evaluating the
impact of multiple sensory effects on the viewing experience. Hence, this chapter
introduces a first subjective quality assessment comprising multimedia content, es-
pecially videos, enriched by sensory effects (i.e., light, wind, vibration) dealing with
this issue. We use the MPEG-V standard as presented in Section 2.4 because this
standard offers all necessary components to effectively describe sensory effects. This
study is based on the Committee Draft (CD) [81] of Part 3 of MPEG-V, and not the
final version of the standard which describes sensory effects a slightly differently (e.g.,
different attributes). These differences from the used version to the current version
of the standard have no influence on the conducted subjective quality assessment and
its results. Furthermore, this chapter is based on our work published in [82] and [83].
The subjective quality assessment presented in this chapter evaluates the enhance-
ment/impairment of video content enriched by sensory effects with respect to different
genres (i.e., action, sports, commercial, documentary, and news). Thus, the partici-
pants of the assessment provide their feedback on the influence of sensory effects on
their viewing experience based on these genres. The goal of this assessment is to get
an insight into how strong the combination of multiple sensory effects influence the
viewing experience for different genres.
As there is a lack of suitable software for testing sensory effects (i.e., multimedia
player), we present in Section 3.1 a multimedia player which supports sensory effects.
Afterwards, a detailed description of the subjective quality assessment is presented
in Section 3.2 and its results are described in Section 3.3. Section 3.4 provides our
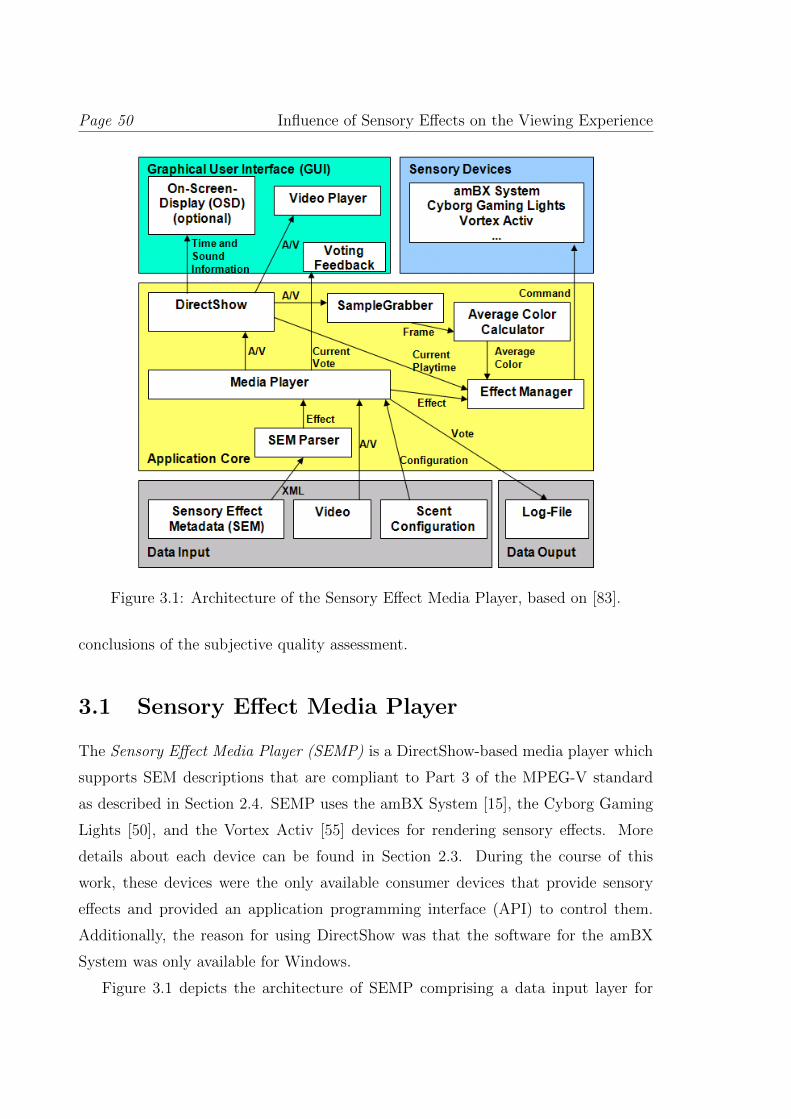
Page 50 Influence of Sensory Effects on the Viewing Experience
Figure 3.1: Architecture of the Sensory Effect Media Player, based on [83].
conclusions of the subjective quality assessment.
3.1 Sensory Effect Media Player
The Sensory Effect Media Player (SEMP) is a DirectShow-based media player which
supports SEM descriptions that are compliant to Part 3 of the MPEG-V standard
as described in Section 2.4. SEMP uses the amBX System [15], the Cyborg Gaming
Lights [50], and the Vortex Activ [55] devices for rendering sensory effects. More
details about each device can be found in Section 2.3. During the course of this
work, these devices were the only available consumer devices that provide sensory
effects and provided an application programming interface (API) to control them.
Additionally, the reason for using DirectShow was that the software for the amBX
System was only available for Windows.
Figure 3.1 depicts the architecture of SEMP comprising a data input layer for
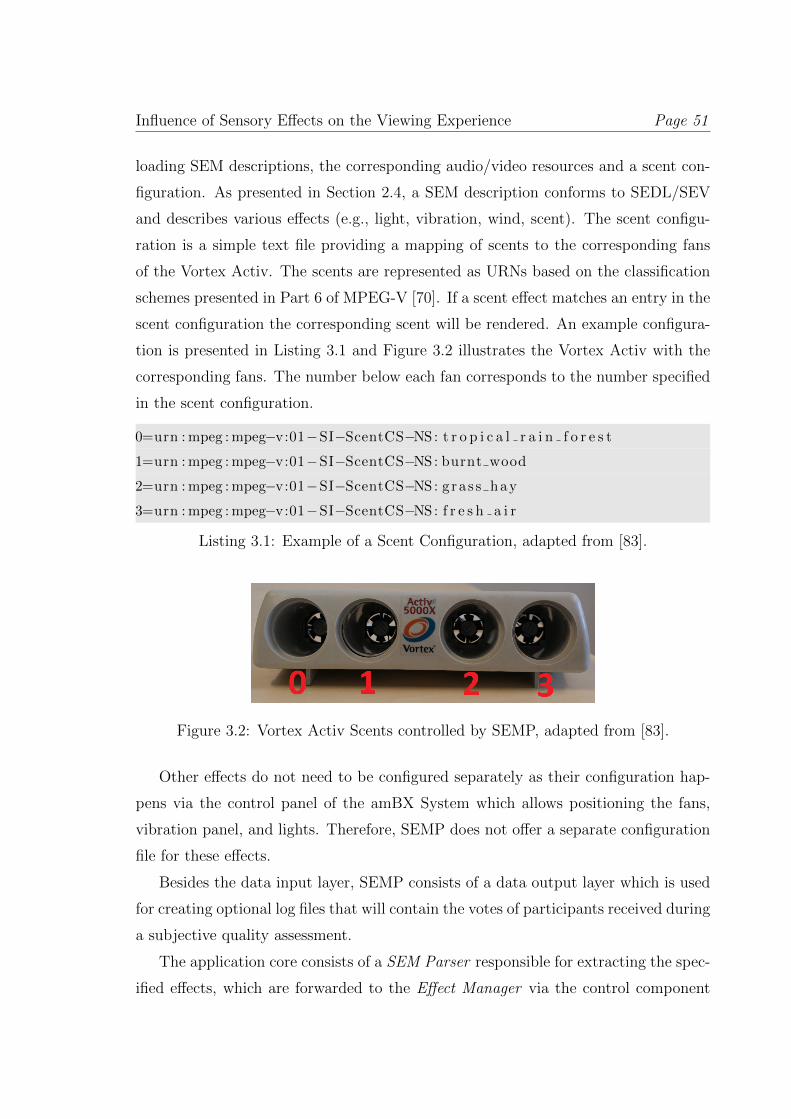
Influence of Sensory Effects on the Viewing Experience Page 51
loading SEM descriptions, the corresponding audio/video resources and a scent con-
figuration. As presented in Section 2.4, a SEM description conforms to SEDL/SEV
and describes various effects (e.g., light, vibration, wind, scent). The scent configu-
ration is a simple text file providing a mapping of scents to the corresponding fans
of the Vortex Activ. The scents are represented as URNs based on the classification
schemes presented in Part 6 of MPEG-V [70]. If a scent effect matches an entry in the
scent configuration the corresponding scent will be rendered. An example configura-
tion is presented in Listing 3.1 and Figure 3.2 illustrates the Vortex Activ with the
corresponding fans. The number below each fan corresponds to the number specified
in the scent configuration.
0=urn :mpeg :mpeg−v:01−SI−ScentCS−NS: t r o p i c a l r a i n f o r e s t
1=urn :mpeg :mpeg−v:01−SI−ScentCS−NS: burnt wood
2=urn :mpeg :mpeg−v:01−SI−ScentCS−NS: gras s hay
3=urn :mpeg :mpeg−v:01−SI−ScentCS−NS: f r e s h a i r
Listing 3.1: Example of a Scent Configuration, adapted from [83].
Figure 3.2: Vortex Activ Scents controlled by SEMP, adapted from [83].
Other effects do not need to be configured separately as their configuration hap-
pens via the control panel of the amBX System which allows positioning the fans,
vibration panel, and lights. Therefore, SEMP does not offer a separate configuration
file for these effects.
Besides the data input layer, SEMP consists of a data output layer which is used
for creating optional log files that will contain the votes of participants received during
a subjective quality assessment.
The application core consists of a SEM Parser responsible for extracting the spec-
ified effects, which are forwarded to the Effect Manager via the control component
Page 52 Influence of Sensory Effects on the Viewing Experience
(Media Player). The Effect Manager stores the effects and creates commands for en-
abling/disabling the devices (i.e., amBX devices, Cyborg Gaming Lights, and Vortex
Activ) with their corresponding parameters. In order to know when to activate an
effect, the Effect Manager uses the timestamp received from DirectShow. DirectShow
is used for rendering the video within the Video Player and sending time and au-
dio information to the (optional) On-Screen-Display (OSD). The OSD is an overlay
over the currently played video which presents information such as current playback
time, duration, volume, or feedback on the last given vote. Furthermore, DirectShow
forwards the video to a so-called SampleGrabber which extracts a frame every 0.1
second. SEMP extracts only every 0.1 second a frame due to the reason that the
extraction and color calculation takes some time and, thus, if high resolution videos
are used the playback can stutter. Moreover, the amBX System needs some time
(i.e., at least 30 ms) before the color can be changed again. The extracted frame is
used by the Average Color Calculator to determine the average color which is used for
the additional light effects. In particular, the frame is divided into three parts (left,
center, and right) and the calculated color for each part is sent to the Effect Man-
ager which steers the corresponding lights (i.e., amBX lights and/or Cyborg Gaming
Lights). That is, the left third of the frame is used for the color of the light located
on the left-hand side of the screen, the middle third of the frame specifies the color
for the wall washer behind the screen, and the right third of the frame defines the
color of the light at the right side of the screen. The splitting of the frame was per-
formed to allow for a more fine-grained color partitioning based on the content of the
video. Vibration and wind effects are not generated automatically. They are anno-
tated manually by using the open-source Sensory Effect Video Annotation (SEVino)
tool which is described in [45, 65], or similar authoring tools (e.g., presented in [84]).
Besides the video playback functionality, SEMP offers a Voting Feedback com-
ponent which allows retrieval of votes from participants of subjective quality assess-
ments. The given votes are stored in a log file and are displayed in the bottom-right-
hand corner of the OSD for providing the participants a feedback of their last given
vote.
SEMP is open-source and can be downloaded from the Sensory Experience Lab
Influence of Sensory Effects on the Viewing Experience Page 53
(SELab) homepage [85]. Furthermore, an annotation tool (i.e., SEVino) and a simu-
lator for sensory effects (i.e., SESim) can be downloaded from the homepage. These
tools were used to generate the SEM descriptions for all subjective quality assess-
ments presented in this work. Note that we used an older version of SEMP for the
evaluation presented in this chapter and in [82] which did not allow us to retrieve
user votings via the media player.
3.2 Experiment Methodology
In this section, we present the setup of the subjective quality assessment including
the used evaluation method and test sequences.
The test procedure and environment was based on the ITU-T Rec. P.911 [40] and
partly on [86]. From [86], we used the description of the test location and, additionally,
adopted the presented structure of the assessments, i.e., splitting the assessment into
three parts comprising pre-questionnaire, assessment, and post-questionnaire.
3.2.1 Location, Participants and Equipment
All sessions of the experiment were conducted in an isolated room with a length of
around 7 meters, a width of around 4 meters and a height of 3 meters, under the same
ambient conditions. That is, there were no external noises except from the essential
equipment, no other persons in the room except the participant and the assessor,
and the room had always the same light settings during the experiments. Before the
session, it was assured that the following conditions hold:
• All nonessential electronic equipment is turned off (e.g., pagers, mobile phones,
computers).
• Windows are closed and covered with translucent blankets and all overhead
lights are turned off.
• The entry door to the room is closed and a ”Do not disturb” sign is placed on
the outside of the door.
Page 54 Influence of Sensory Effects on the Viewing Experience
In this subjective quality assessment, we used a ceiling flooder for illuminating the
room in a warm light and, thus, providing a better viewing experience by simulating
a more living room-like environment. The windows were covered for a better light
contrast; otherwise the light effects will not show to advantage.
For this subjective quality assessment, we invited 25 participants (13 female,
12 male) between 20 and 31 years old. This number of participants was selected
because a number of equal to or more than 16 participants is generally accepted
to provide statistically valid results [39, 41, 42]. The participants were not directly
involved in the area of sensory effects or multimedia communication, and were not
experienced assessors. Thus, these participants represent normal everyday viewers
without specific knowledge about multimedia in general. Before a session, the par-
ticipants were orally informed about the type of assessment, the rating scale and the
presentation of the test sequences. Questions were asked and answered only before
the start of the session. During the session, the participants were not allowed to ask
questions as this would have influenced the concentration on the test sequences.
The subjective tests were conducted using the following hardware and software:
• Dell Precision 360: Pentium 4 3.2 GHz with 1 GB RAM and NVidia Quadro
NVS (64 MB)
• amBX Premium Kit (Fan, Vibrator, Light, Sound)
• 26” Monitor with a resolution of 1680x1050
• Windows XP SP3
• Sensory Effect Media Player (SEMP) (cf. Section 3.1)
• amBX Software (i.e., amBX System 1.1.3.2 and Philips amBX 1.04.0003)
3.2.2 Evaluation Procedure
To conduct the subjective quality assessment, we prepared a test environment con-
sisting of a control station and the actual test computer as depicted in Figure 3.3.
The control station was used to start the test sequences and to resolve possible play-
back issues of SEMP (e.g., crash of SEMP, or the effects not having initialized at
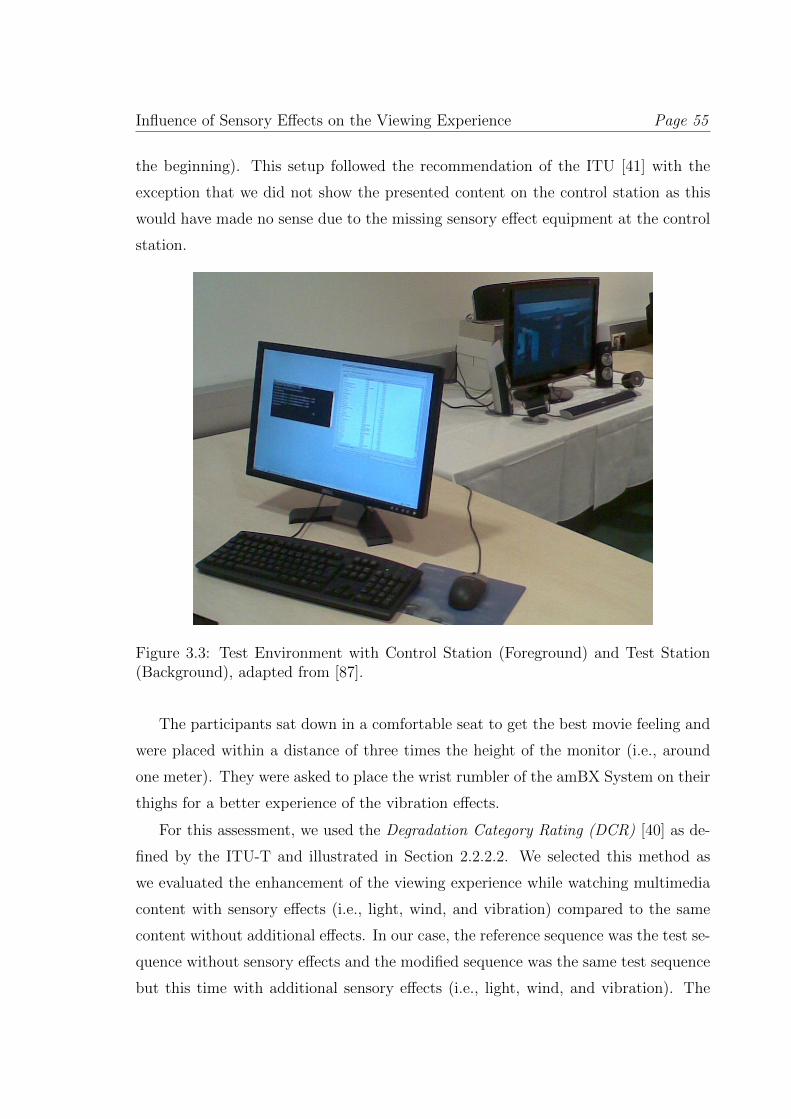
Influence of Sensory Effects on the Viewing Experience Page 55
the beginning). This setup followed the recommendation of the ITU [41] with the
exception that we did not show the presented content on the control station as this
would have made no sense due to the missing sensory effect equipment at the control
station.
Figure 3.3: Test Environment with Control Station (Foreground) and Test Station(Background), adapted from [87].
The participants sat down in a comfortable seat to get the best movie feeling and
were placed within a distance of three times the height of the monitor (i.e., around
one meter). They were asked to place the wrist rumbler of the amBX System on their
thighs for a better experience of the vibration effects.
For this assessment, we used the Degradation Category Rating (DCR) [40] as de-
fined by the ITU-T and illustrated in Section 2.2.2.2. We selected this method as
we evaluated the enhancement of the viewing experience while watching multimedia
content with sensory effects (i.e., light, wind, and vibration) compared to the same
content without additional effects. In our case, the reference sequence was the test se-
quence without sensory effects and the modified sequence was the same test sequence
but this time with additional sensory effects (i.e., light, wind, and vibration). The
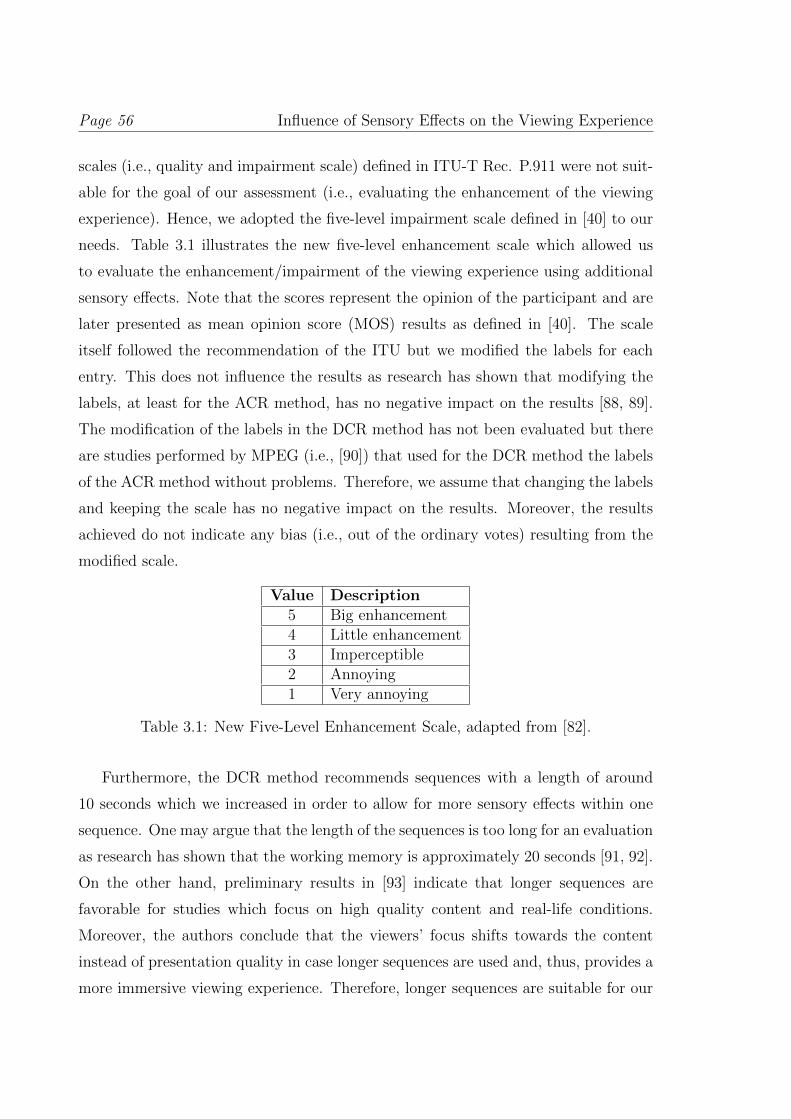
Page 56 Influence of Sensory Effects on the Viewing Experience
scales (i.e., quality and impairment scale) defined in ITU-T Rec. P.911 were not suit-
able for the goal of our assessment (i.e., evaluating the enhancement of the viewing
experience). Hence, we adopted the five-level impairment scale defined in [40] to our
needs. Table 3.1 illustrates the new five-level enhancement scale which allowed us
to evaluate the enhancement/impairment of the viewing experience using additional
sensory effects. Note that the scores represent the opinion of the participant and are
later presented as mean opinion score (MOS) results as defined in [40]. The scale
itself followed the recommendation of the ITU but we modified the labels for each
entry. This does not influence the results as research has shown that modifying the
labels, at least for the ACR method, has no negative impact on the results [88, 89].
The modification of the labels in the DCR method has not been evaluated but there
are studies performed by MPEG (i.e., [90]) that used for the DCR method the labels
of the ACR method without problems. Therefore, we assume that changing the labels
and keeping the scale has no negative impact on the results. Moreover, the results
achieved do not indicate any bias (i.e., out of the ordinary votes) resulting from the
modified scale.
Value Description5 Big enhancement4 Little enhancement3 Imperceptible2 Annoying1 Very annoying
Table 3.1: New Five-Level Enhancement Scale, adapted from [82].
Furthermore, the DCR method recommends sequences with a length of around
10 seconds which we increased in order to allow for more sensory effects within one
sequence. One may argue that the length of the sequences is too long for an evaluation
as research has shown that the working memory is approximately 20 seconds [91, 92].
On the other hand, preliminary results in [93] indicate that longer sequences are
favorable for studies which focus on high quality content and real-life conditions.
Moreover, the authors conclude that the viewers’ focus shifts towards the content
instead of presentation quality in case longer sequences are used and, thus, provides a
more immersive viewing experience. Therefore, longer sequences are suitable for our
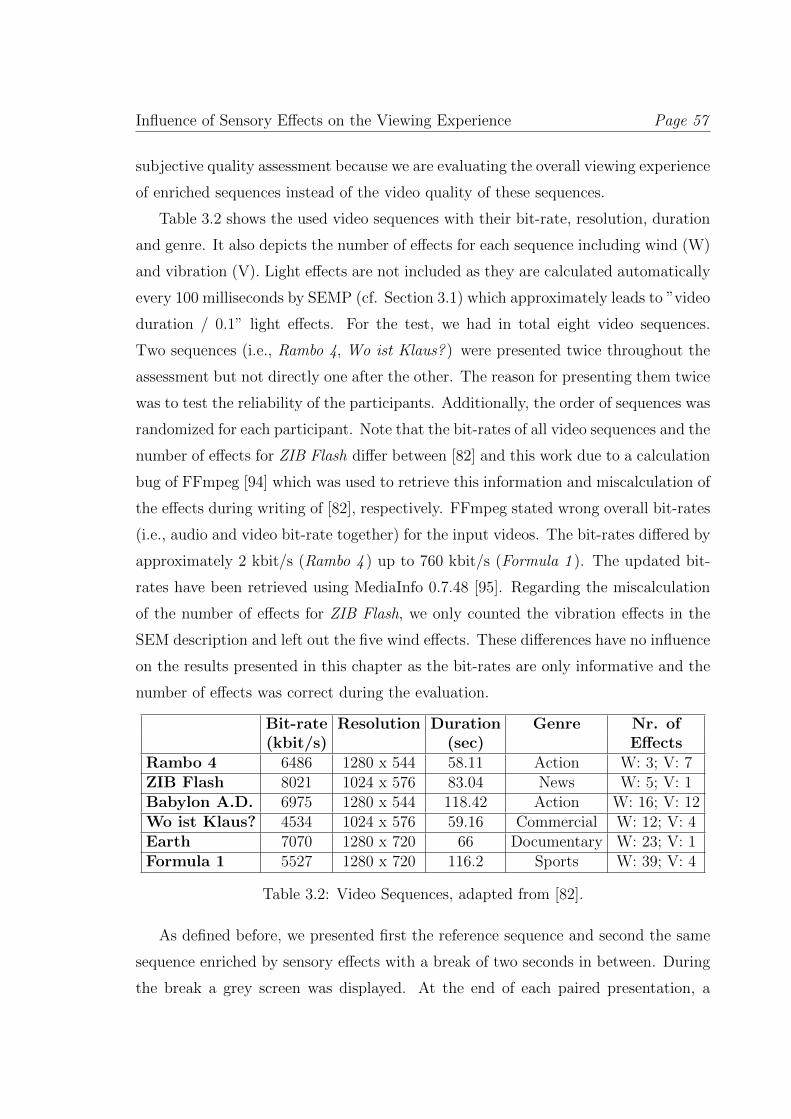
Influence of Sensory Effects on the Viewing Experience Page 57
subjective quality assessment because we are evaluating the overall viewing experience
of enriched sequences instead of the video quality of these sequences.
Table 3.2 shows the used video sequences with their bit-rate, resolution, duration
and genre. It also depicts the number of effects for each sequence including wind (W)
and vibration (V). Light effects are not included as they are calculated automatically
every 100 milliseconds by SEMP (cf. Section 3.1) which approximately leads to ”video
duration / 0.1” light effects. For the test, we had in total eight video sequences.
Two sequences (i.e., Rambo 4, Wo ist Klaus? ) were presented twice throughout the
assessment but not directly one after the other. The reason for presenting them twice
was to test the reliability of the participants. Additionally, the order of sequences was
randomized for each participant. Note that the bit-rates of all video sequences and the
number of effects for ZIB Flash differ between [82] and this work due to a calculation
bug of FFmpeg [94] which was used to retrieve this information and miscalculation of
the effects during writing of [82], respectively. FFmpeg stated wrong overall bit-rates
(i.e., audio and video bit-rate together) for the input videos. The bit-rates differed by
approximately 2 kbit/s (Rambo 4 ) up to 760 kbit/s (Formula 1 ). The updated bit-
rates have been retrieved using MediaInfo 0.7.48 [95]. Regarding the miscalculation
of the number of effects for ZIB Flash, we only counted the vibration effects in the
SEM description and left out the five wind effects. These differences have no influence
on the results presented in this chapter as the bit-rates are only informative and the
number of effects was correct during the evaluation.
Bit-rate Resolution Duration Genre Nr. of(kbit/s) (sec) Effects
Rambo 4 6486 1280 x 544 58.11 Action W: 3; V: 7ZIB Flash 8021 1024 x 576 83.04 News W: 5; V: 1Babylon A.D. 6975 1280 x 544 118.42 Action W: 16; V: 12Wo ist Klaus? 4534 1024 x 576 59.16 Commercial W: 12; V: 4Earth 7070 1280 x 720 66 Documentary W: 23; V: 1Formula 1 5527 1280 x 720 116.2 Sports W: 39; V: 4
Table 3.2: Video Sequences, adapted from [82].
As defined before, we presented first the reference sequence and second the same
sequence enriched by sensory effects with a break of two seconds in between. During
the break a grey screen was displayed. At the end of each paired presentation, a
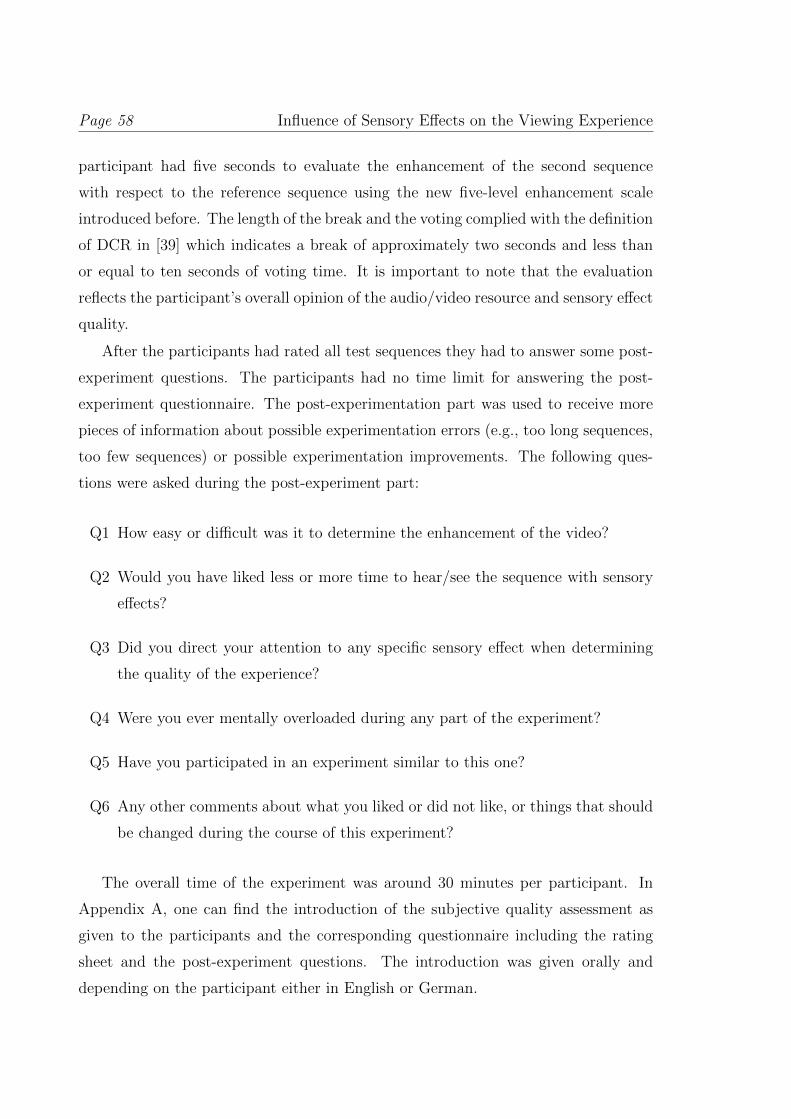
Page 58 Influence of Sensory Effects on the Viewing Experience
participant had five seconds to evaluate the enhancement of the second sequence
with respect to the reference sequence using the new five-level enhancement scale
introduced before. The length of the break and the voting complied with the definition
of DCR in [39] which indicates a break of approximately two seconds and less than
or equal to ten seconds of voting time. It is important to note that the evaluation
reflects the participant’s overall opinion of the audio/video resource and sensory effect
quality.
After the participants had rated all test sequences they had to answer some post-
experiment questions. The participants had no time limit for answering the post-
experiment questionnaire. The post-experimentation part was used to receive more
pieces of information about possible experimentation errors (e.g., too long sequences,
too few sequences) or possible experimentation improvements. The following ques-
tions were asked during the post-experiment part:
Q1 How easy or difficult was it to determine the enhancement of the video?
Q2 Would you have liked less or more time to hear/see the sequence with sensory
effects?
Q3 Did you direct your attention to any specific sensory effect when determining
the quality of the experience?
Q4 Were you ever mentally overloaded during any part of the experiment?
Q5 Have you participated in an experiment similar to this one?
Q6 Any other comments about what you liked or did not like, or things that should
be changed during the course of this experiment?
The overall time of the experiment was around 30 minutes per participant. In
Appendix A, one can find the introduction of the subjective quality assessment as
given to the participants and the corresponding questionnaire including the rating
sheet and the post-experiment questions. The introduction was given orally and
depending on the participant either in English or German.
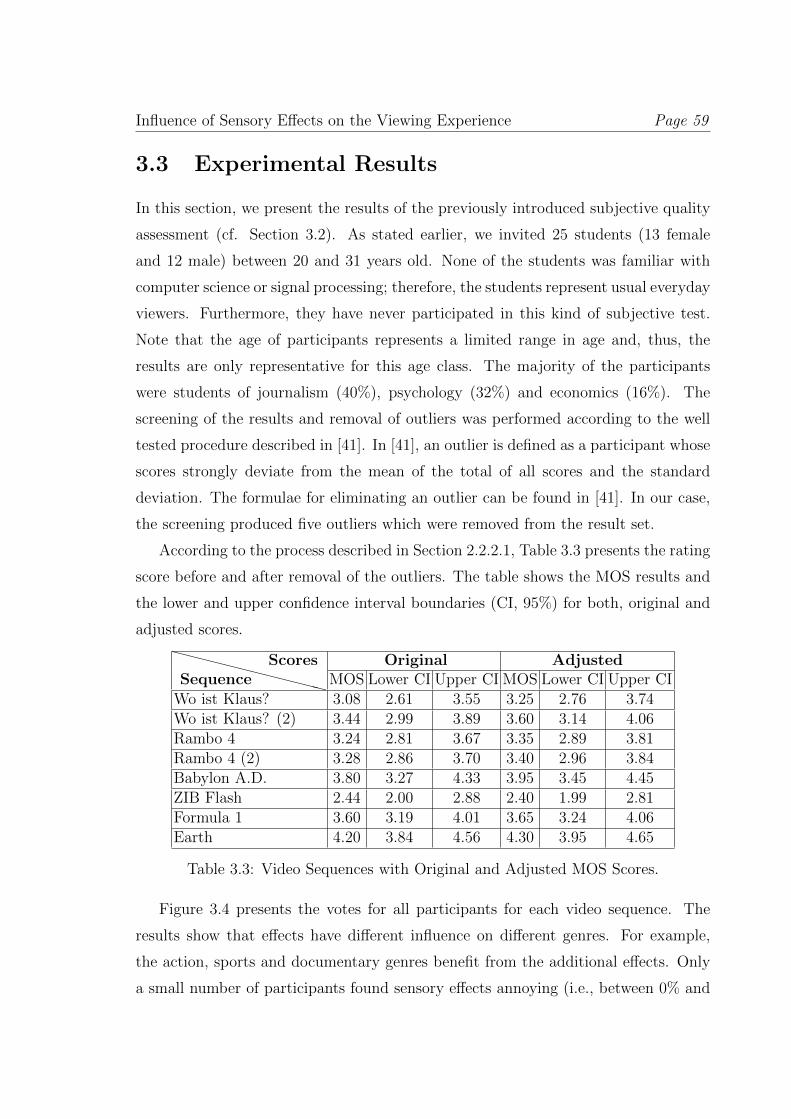
Influence of Sensory Effects on the Viewing Experience Page 59
3.3 Experimental Results
In this section, we present the results of the previously introduced subjective quality
assessment (cf. Section 3.2). As stated earlier, we invited 25 students (13 female
and 12 male) between 20 and 31 years old. None of the students was familiar with
computer science or signal processing; therefore, the students represent usual everyday
viewers. Furthermore, they have never participated in this kind of subjective test.
Note that the age of participants represents a limited range in age and, thus, the
results are only representative for this age class. The majority of the participants
were students of journalism (40%), psychology (32%) and economics (16%). The
screening of the results and removal of outliers was performed according to the well
tested procedure described in [41]. In [41], an outlier is defined as a participant whose
scores strongly deviate from the mean of the total of all scores and the standard
deviation. The formulae for eliminating an outlier can be found in [41]. In our case,
the screening produced five outliers which were removed from the result set.
According to the process described in Section 2.2.2.1, Table 3.3 presents the rating
score before and after removal of the outliers. The table shows the MOS results and
the lower and upper confidence interval boundaries (CI, 95%) for both, original and
adjusted scores.
Original AdjustedXXXXXXXXXXXXSequence
ScoresMOS Lower CI Upper CI MOS Lower CI Upper CI
Wo ist Klaus? 3.08 2.61 3.55 3.25 2.76 3.74Wo ist Klaus? (2) 3.44 2.99 3.89 3.60 3.14 4.06Rambo 4 3.24 2.81 3.67 3.35 2.89 3.81Rambo 4 (2) 3.28 2.86 3.70 3.40 2.96 3.84Babylon A.D. 3.80 3.27 4.33 3.95 3.45 4.45ZIB Flash 2.44 2.00 2.88 2.40 1.99 2.81Formula 1 3.60 3.19 4.01 3.65 3.24 4.06Earth 4.20 3.84 4.56 4.30 3.95 4.65
Table 3.3: Video Sequences with Original and Adjusted MOS Scores.
Figure 3.4 presents the votes for all participants for each video sequence. The
results show that effects have different influence on different genres. For example,
the action, sports and documentary genres benefit from the additional effects. Only
a small number of participants found sensory effects annoying (i.e., between 0% and
Page 60 Influence of Sensory Effects on the Viewing Experience
25%) or did not see any difference between the two video sequences (i.e., between
5% and 30%). The results also show that the enhancement of the viewing experience
strongly depends on the content. For example, the action sequence Rambo 4 is rated
lower than Babylon A.D. which is also an action sequence. The commercial genre
can also profit from additional effects (i.e., depending on the presentation, 50% to
60% of the participants indicated an enhancement of the viewing experience) but not
as much as the previously mentioned genres. In this subjective quality assessment,
the news sequence is rated worst (i.e., the viewing experience was only enhanced for
10% of the participants) due to the presented situation reports, i.e., there are still
pictures in the background and only the moderator talks about the events or news
clips. Thus, there was nearly no possibility to suitably render effects.
Figure 3.4: Evaluation Results on a Per-Video Sequence Basis, adapted from [82].
Figure 3.5 depicts the results of Figure 3.4 in percent of good or better (%GOB)
and in percent of poor or worse (%POW) for easier understanding. %GOB is rep-
resented by the values from Big enhancement and Little enhancement and %POW
uses the values from Annoying and Very annoying. %Rest comprises the values for
Imperceptible. This diagram shows more clearly the preferences of the participants.
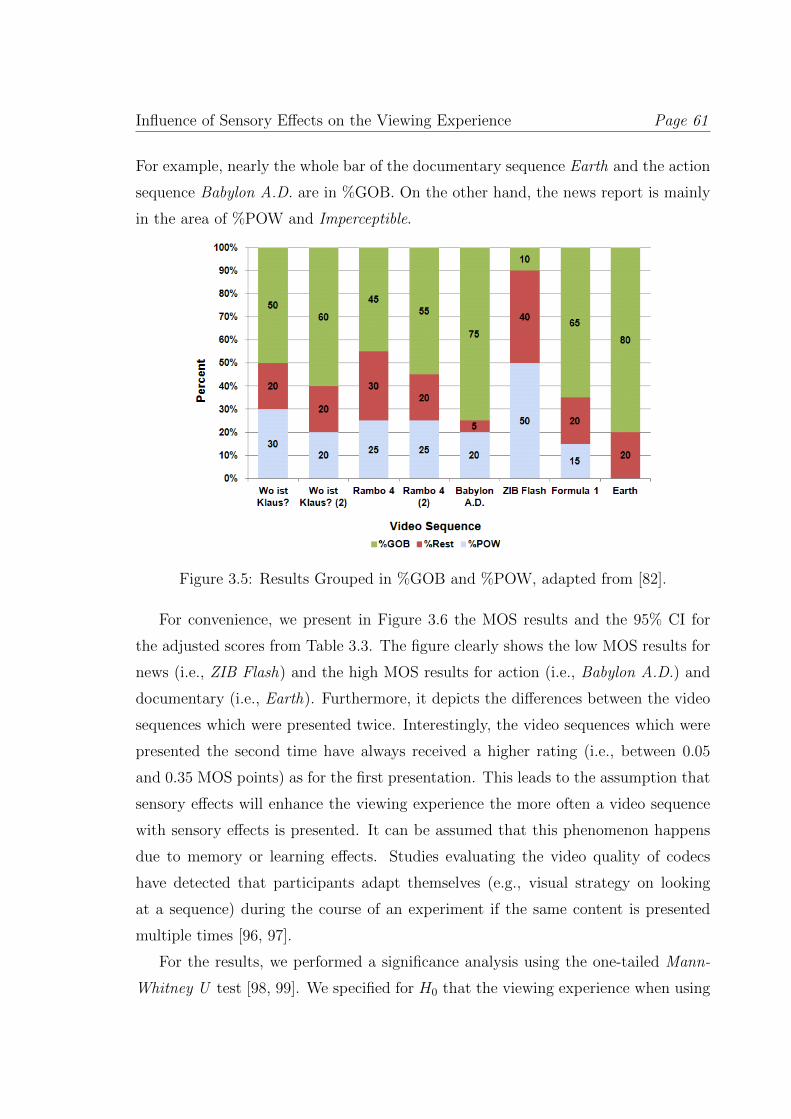
Influence of Sensory Effects on the Viewing Experience Page 61
For example, nearly the whole bar of the documentary sequence Earth and the action
sequence Babylon A.D. are in %GOB. On the other hand, the news report is mainly
in the area of %POW and Imperceptible.
Figure 3.5: Results Grouped in %GOB and %POW, adapted from [82].
For convenience, we present in Figure 3.6 the MOS results and the 95% CI for
the adjusted scores from Table 3.3. The figure clearly shows the low MOS results for
news (i.e., ZIB Flash) and the high MOS results for action (i.e., Babylon A.D.) and
documentary (i.e., Earth). Furthermore, it depicts the differences between the video
sequences which were presented twice. Interestingly, the video sequences which were
presented the second time have always received a higher rating (i.e., between 0.05
and 0.35 MOS points) as for the first presentation. This leads to the assumption that
sensory effects will enhance the viewing experience the more often a video sequence
with sensory effects is presented. It can be assumed that this phenomenon happens
due to memory or learning effects. Studies evaluating the video quality of codecs
have detected that participants adapt themselves (e.g., visual strategy on looking
at a sequence) during the course of an experiment if the same content is presented
multiple times [96, 97].
For the results, we performed a significance analysis using the one-tailed Mann-
Whitney U test [98, 99]. We specified for H0 that the viewing experience when using
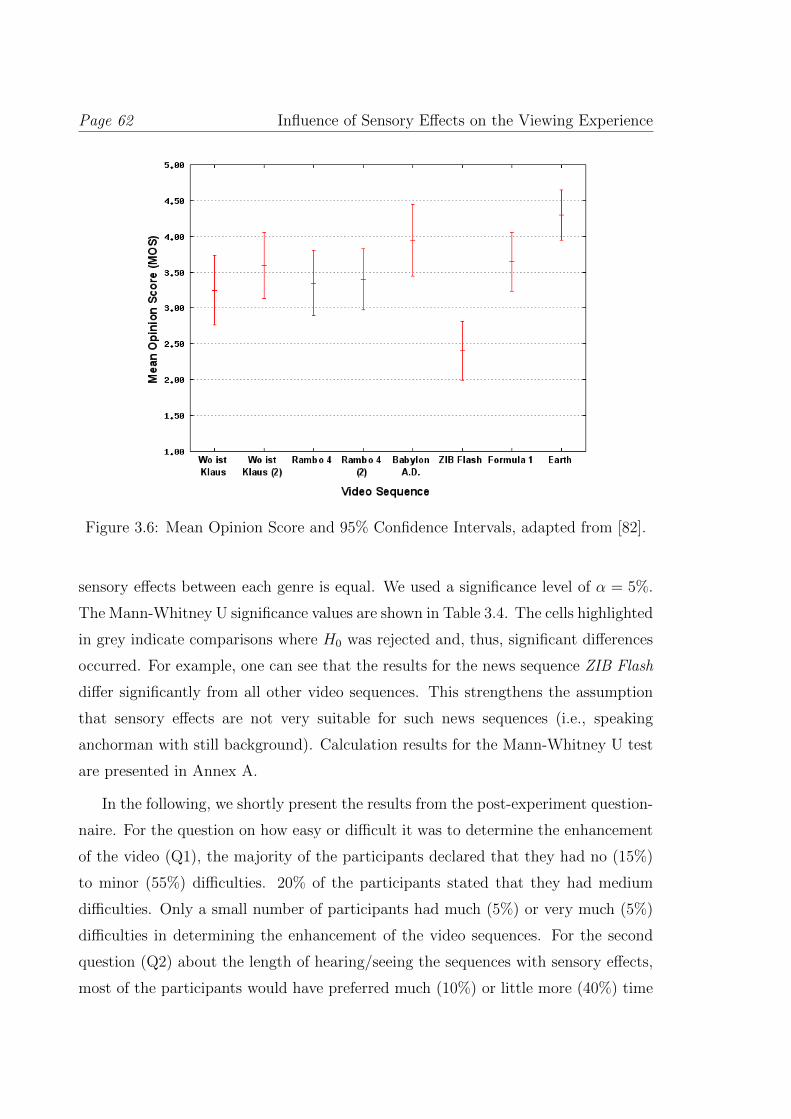
Page 62 Influence of Sensory Effects on the Viewing Experience
Figure 3.6: Mean Opinion Score and 95% Confidence Intervals, adapted from [82].
sensory effects between each genre is equal. We used a significance level of α = 5%.
The Mann-Whitney U significance values are shown in Table 3.4. The cells highlighted
in grey indicate comparisons where H0 was rejected and, thus, significant differences
occurred. For example, one can see that the results for the news sequence ZIB Flash
differ significantly from all other video sequences. This strengthens the assumption
that sensory effects are not very suitable for such news sequences (i.e., speaking
anchorman with still background). Calculation results for the Mann-Whitney U test
are presented in Annex A.
In the following, we shortly present the results from the post-experiment question-
naire. For the question on how easy or difficult it was to determine the enhancement
of the video (Q1), the majority of the participants declared that they had no (15%)
to minor (55%) difficulties. 20% of the participants stated that they had medium
difficulties. Only a small number of participants had much (5%) or very much (5%)
difficulties in determining the enhancement of the video sequences. For the second
question (Q2) about the length of hearing/seeing the sequences with sensory effects,
most of the participants would have preferred much (10%) or little more (40%) time
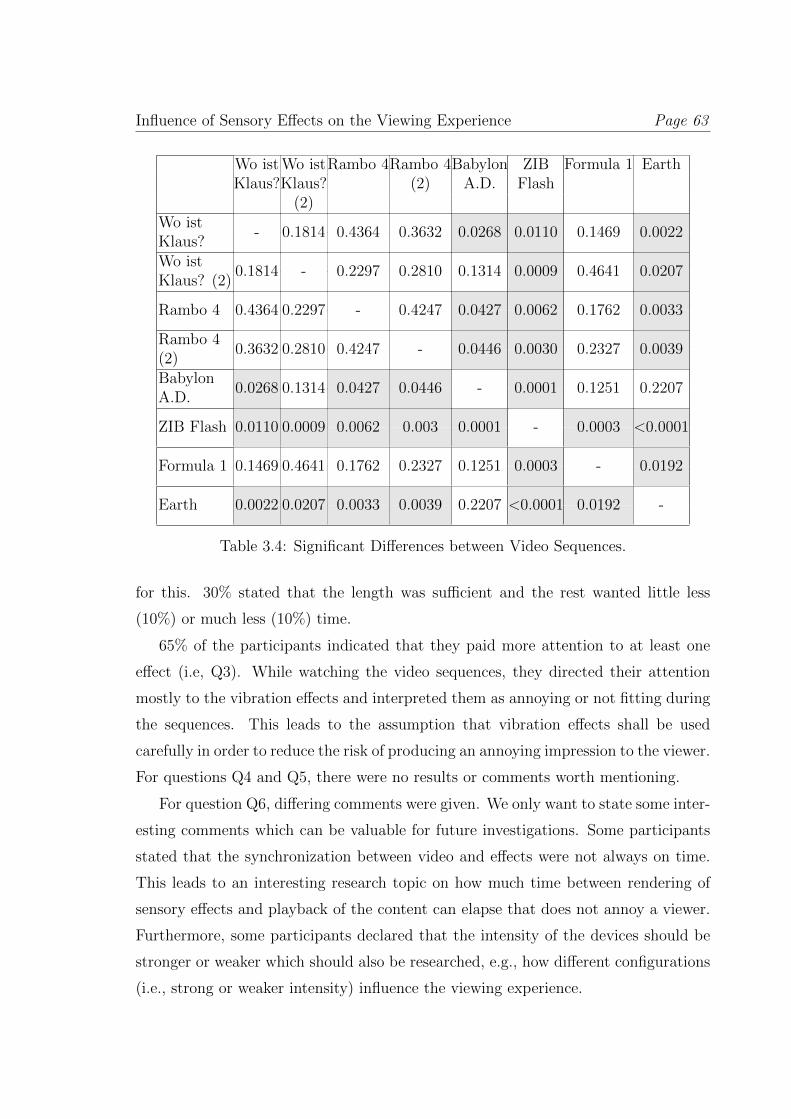
Influence of Sensory Effects on the Viewing Experience Page 63
Wo ist Wo istRambo 4Rambo 4Babylon ZIB Formula 1 EarthKlaus?Klaus? (2) A.D. Flash
(2)Wo istKlaus?
- 0.1814 0.4364 0.3632 0.0268 0.0110 0.1469 0.0022
Wo istKlaus? (2)
0.1814 - 0.2297 0.2810 0.1314 0.0009 0.4641 0.0207
Rambo 4 0.4364 0.2297 - 0.4247 0.0427 0.0062 0.1762 0.0033
Rambo 4(2)
0.3632 0.2810 0.4247 - 0.0446 0.0030 0.2327 0.0039
BabylonA.D.
0.0268 0.1314 0.0427 0.0446 - 0.0001 0.1251 0.2207
ZIB Flash 0.0110 0.0009 0.0062 0.003 0.0001 - 0.0003 <0.0001
Formula 1 0.1469 0.4641 0.1762 0.2327 0.1251 0.0003 - 0.0192
Earth 0.0022 0.0207 0.0033 0.0039 0.2207 <0.0001 0.0192 -
Table 3.4: Significant Differences between Video Sequences.
for this. 30% stated that the length was sufficient and the rest wanted little less
(10%) or much less (10%) time.
65% of the participants indicated that they paid more attention to at least one
effect (i.e, Q3). While watching the video sequences, they directed their attention
mostly to the vibration effects and interpreted them as annoying or not fitting during
the sequences. This leads to the assumption that vibration effects shall be used
carefully in order to reduce the risk of producing an annoying impression to the viewer.
For questions Q4 and Q5, there were no results or comments worth mentioning.
For question Q6, differing comments were given. We only want to state some inter-
esting comments which can be valuable for future investigations. Some participants
stated that the synchronization between video and effects were not always on time.
This leads to an interesting research topic on how much time between rendering of
sensory effects and playback of the content can elapse that does not annoy a viewer.
Furthermore, some participants declared that the intensity of the devices should be
stronger or weaker which should also be researched, e.g., how different configurations
(i.e., strong or weaker intensity) influence the viewing experience.
Page 64 Influence of Sensory Effects on the Viewing Experience
3.4 Discussion and Conclusions
In this chapter, we presented our Sensory Effect Media Player for testing sensory
effects for an enhanced viewing experience. Furthermore, the chapter describes one
of the first subjective tests done in the area of sensory effects combined with the usage
of MPEG-V.
The results of this experiment indicate that the evaluation method used for the
subjective quality assessment is suitable for video sequences enriched by sensory ef-
fects, but show some issues. For example, in our case the evaluation was conducted
with participants that are between 20 and 31 years old which is only a small age class.
Therefore, this assessment produces only valid results for the given age class. Due
to this, it is not possible to provide a general conclusion that sensory effects enhance
the viewing experience for all types of participants (e.g., young people, elderly). Fur-
thermore, the used rating method (i.e., voting on the rating sheet) can influence the
viewing experience as the participants need to direct their attention to the rating
sheet. Moreover, for the first time rating, we observed that some participants had
stress when switching to the rating sheet and back to the next video sequence due to
the short rating time. Additionally, the oral introduction can affect the participants
as the assessor does not explain the participants’ task to each participant the same
manner. Hence, in future experiments, we are using voting devices or sliders for re-
trieving the user feedback as they have proven to be suitable for subjective quality
assessments [100], and written introductions as suggested by the ITU [39, 40].
Moreover, to provide a general conclusion it is advisable to conduct a large scale
assessment (i.e., more participants and long-running evaluation) in a controlled real-
world environment, that is, an assessment which is monitored but performed outside
the laboratory and with only a single presentation of the content. As indicated by [96],
the real-world scenario also prevents the memory effect because a video sequence will
only be presented once.
Based on the results achieved in this subjective quality assessment, the following
conclusions on the enhancement of the viewing experience using additional sensory
effects can be drawn.
Influence of Sensory Effects on the Viewing Experience Page 65
• The most important observation is that sensory effects are enhancing the view-
ing experience, although additional effects do not equally increase the viewing
experience for each tested genre. For genres such as action, documentary, or
sports, sensory effects are enhancing, whereas additional effects are not that
enhancing for the commercial genre. For the news genre, effects are even per-
ceived as annoying and, thus, for this genre, they need to be considered with
caution.
• The usage of sensory effects depends on the presented content. For example, the
video sequences Rambo 4 and Babylon A.D. belong to the same genre but result
in different ratings. As a result, the selection of test content is crucial for the
usage of sensory effects as it influences the rating behaviour of the participants.
• Replicated test conditions or multiple times the same content need to be con-
sidered with care. The results indicate an increase in the viewing experience
which leads to the possibility of memory effects. As research has shown, mem-
ory or learning effects can already occur if a video sequence is presented more
than once [101, 102]. Therefore, we argue that the DCR method is by design
problematic due to the pair presentations; thus, to avoid the issue of memory
effects, training sessions can be introduced before the actual assessment.

CHAPTER
4 Impact of Sensory Effects on
the Perceived Video Quality
As our previous subjective quality assessment (cf. Chapter 3) has shown that sensory
effects (i.e., light, wind, and vibration) positively influence some genres like documen-
tary, action, sports, and commercial, we decided to evaluate the impact of additional
effects on the perceived video quality. Initially, we planned to investigate the influence
of additional SEM descriptions on the objective quality (i.e., PSNR). To evaluate this
approach, we determined the size of the additional metadata and reduced the bit-rate
of the content by the determined size which reduced the overall PSNR of the content.
However, it turned out that the metadata overhead is insignificant due to the compact
design (i.e., using groups of effects and declarations; see Section 2.4) of the MPEG-V
descriptions. Therefore, the overhead resulted in a marginal PSNR difference between
the content with and without sensory effects of approximately 0.1 dB.
Hence, we abandoned our initial goal and, instead, we changed our goal to evaluate
the impact of sensory effects on the perceived video quality using various bit-rates.
This results in different qualities in terms of PSNR. In particular, we were interested
in whether the QoE of a video sequence with a specific bit-rate and sensory effects
(QoE(brw/E.)) is higher than the same sequence with a given bit-rate but without
sensory effects (QoE(brw/oE.)) (cf. Equation 4.1). We assume the relationship of the
video bit-rates as shown in Equation 4.2, i.e., the bit-rate of a sequence with sensory
effect annotations can be equal to or lower than the bit-rate of the same sequence
without sensory effect annotations to achieve a QoE enhancement.
QoE(brw/E.) ≥ QoE(brw/oE.) (4.1)
brw/E. ≤ brw/oE. (4.2)
Please note that the subjective quality assessment presented in this chapter is
based on the Final Committee Draft (FCD) [103] of Part 3 of MPEG-V. Furthermore,
Page 68 Impact of Sensory Effects on the Perceived Video Quality
this chapter is based on the work published in [104]. This chapter is structured as
follows. Section 4.1 presents the evaluation method and setup. Detailed results are
presented in Section 4.2 and Section 4.3 concludes this chapter.
4.1 Experiment Methodology
In this section, we present the setup of the subjective quality assessment including
the evaluation method and test sequences.
The test procedure and environment was based on the ITU-T Recommendation
P.910 [39]. Similar to our previous assessment (cf. Chapter 3), we based the test
location and assessment structure on the work described in [86] as the ITU does
not provide a detailed description of the test location. Furthermore, the three phase
structure of the assessment has proven suitable during our previous assessment.
4.1.1 Location, Participants and Equipment
The location for this subjective quality assessment was the same as the location
described in Section 3.2.1 and, thus, will not be presented here again.
For this subjective quality assessment, we invited 24 students (11 female, 13 male)
between 18 and 37 years old. This number of participants was selected because it
provides statistically valid results [39, 41, 42]. Two of the participants took part in
our subjective quality assessment on the enhancement/impairment of video content
enriched by sensory effects (cf. Chapter 3). Besides these two students, all other
students were not familiar with the evaluation topic and with subjective quality as-
sessments in general.
In our previous assessment (cf. Chapter 3), we gave the participants an oral
introduction which we replaced in this assessment by a written introduction. In
the introduction, we explained the test procedure in detail and described the voting
device (cf. Section 4.1.2) and the voting scale. The introduction of the subjective
quality assessment, as given to the participants, can be found in Appendix B.1. The
introduction was prepared in English and German, and depending on the participant’s
preferences, the corresponding introduction was handed out.
Impact of Sensory Effects on the Perceived Video Quality Page 69
For this subjective quality assessment, we used the same hardware and software
as presented in Section 3.2.1 with the exception of the additional voting device (cf.
Section 4.1.2) and software JoyToKey 3.7.4 1. JoyToKey is needed because the used
voting device is detected as Joystick and, thus, the program is used for mapping the
inputs from the voting device to inputs on the keyboard as SEMP requires keyboard
inputs for retrieving the rating of a participant. Moreover, we used a different voting
device since in our previous study (cf. Chapter 3) switching to the voting sheet and
back to the next video resulted in stress for some participants.
4.1.2 Procedure and Voting Device
Similar to our previous study (cf. Chapter 3), we used a control station and a test
station for performing the subjective quality assessment. Furthermore, also this time
the participants sat down in a comfortable seat at a distance of around one meter from
the monitor, and had the wrist rumbler of the amBX System placed on their thighs for
a better experience of the vibration effects. This setup followed the recommendation
of the ITU [41] with the exception that we did not show the presented content on the
control station due to the lack of sensory devices. Moreover, instead of using rating
sheets, we provided a voting device to the participants which is described later. Note
that the ITU does not define a specific procedure for retrieving user ratings and, thus,
there are different procedures for acquiring ratings (e.g., rating sheets, option buttons
in the test application [86]).
The major difference of this subjective quality assessment compared to the previ-
ous assessment is that we had only two video sequences and a different test methodol-
ogy. Table 4.1 presents the two video sequences. The two video sequences were from
the action (Babylon A.D.) and documentary genre (Earth). The action sequence
had a lot of shot/scene transitions and fast motion, and the documentary video had
much fewer shots/scenes and also less motion. We selected these sequences as they
were the highest ranked genres in our previous study (cf. Chapter 3). The sequences
were not completely the same as we reduced the length of the sequences to better
conform to standardized evaluation methods (cf. Section 2.2.2). Still, the length of
1http://www.electracode.com/4/joy2key/JoyToKey English Version.htm
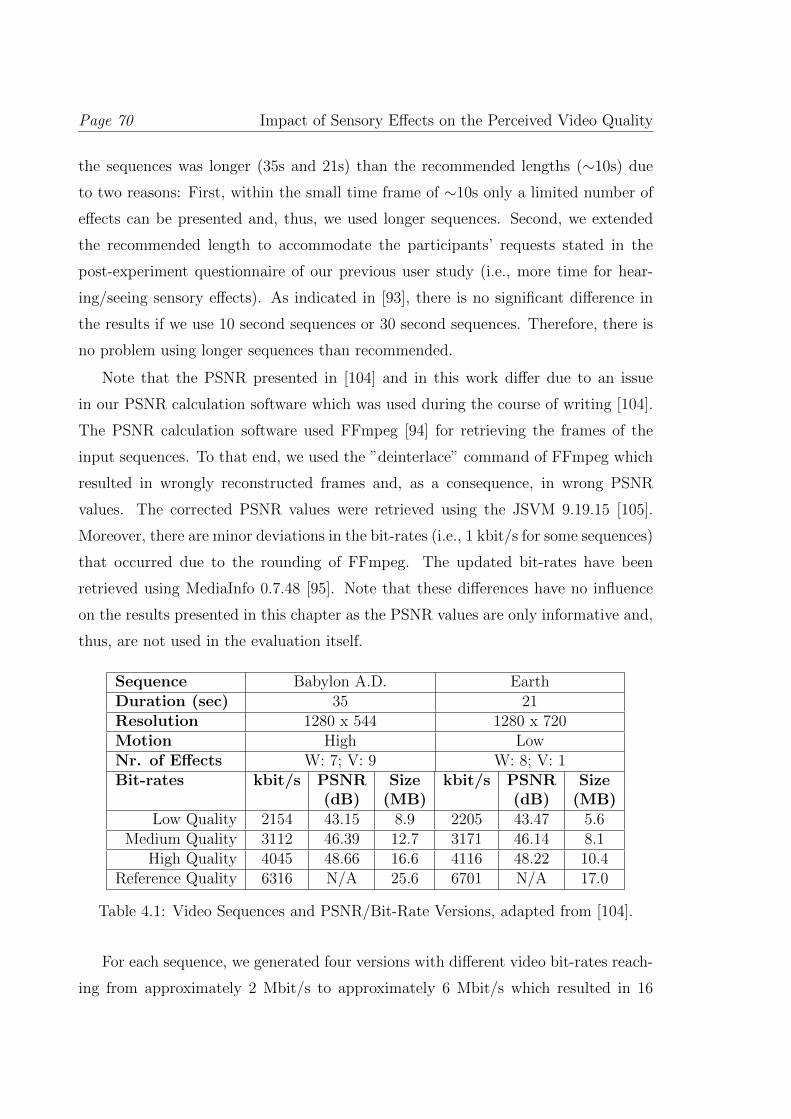
Page 70 Impact of Sensory Effects on the Perceived Video Quality
the sequences was longer (35s and 21s) than the recommended lengths (∼10s) due
to two reasons: First, within the small time frame of ∼10s only a limited number of
effects can be presented and, thus, we used longer sequences. Second, we extended
the recommended length to accommodate the participants’ requests stated in the
post-experiment questionnaire of our previous user study (i.e., more time for hear-
ing/seeing sensory effects). As indicated in [93], there is no significant difference in
the results if we use 10 second sequences or 30 second sequences. Therefore, there is
no problem using longer sequences than recommended.
Note that the PSNR presented in [104] and in this work differ due to an issue
in our PSNR calculation software which was used during the course of writing [104].
The PSNR calculation software used FFmpeg [94] for retrieving the frames of the
input sequences. To that end, we used the ”deinterlace” command of FFmpeg which
resulted in wrongly reconstructed frames and, as a consequence, in wrong PSNR
values. The corrected PSNR values were retrieved using the JSVM 9.19.15 [105].
Moreover, there are minor deviations in the bit-rates (i.e., 1 kbit/s for some sequences)
that occurred due to the rounding of FFmpeg. The updated bit-rates have been
retrieved using MediaInfo 0.7.48 [95]. Note that these differences have no influence
on the results presented in this chapter as the PSNR values are only informative and,
thus, are not used in the evaluation itself.
Sequence Babylon A.D. EarthDuration (sec) 35 21Resolution 1280 x 544 1280 x 720Motion High LowNr. of Effects W: 7; V: 9 W: 8; V: 1Bit-rates kbit/s PSNR Size kbit/s PSNR Size
(dB) (MB) (dB) (MB)Low Quality 2154 43.15 8.9 2205 43.47 5.6
Medium Quality 3112 46.39 12.7 3171 46.14 8.1High Quality 4045 48.66 16.6 4116 48.22 10.4
Reference Quality 6316 N/A 25.6 6701 N/A 17.0
Table 4.1: Video Sequences and PSNR/Bit-Rate Versions, adapted from [104].
For each sequence, we generated four versions with different video bit-rates reach-
ing from approximately 2 Mbit/s to approximately 6 Mbit/s which resulted in 16
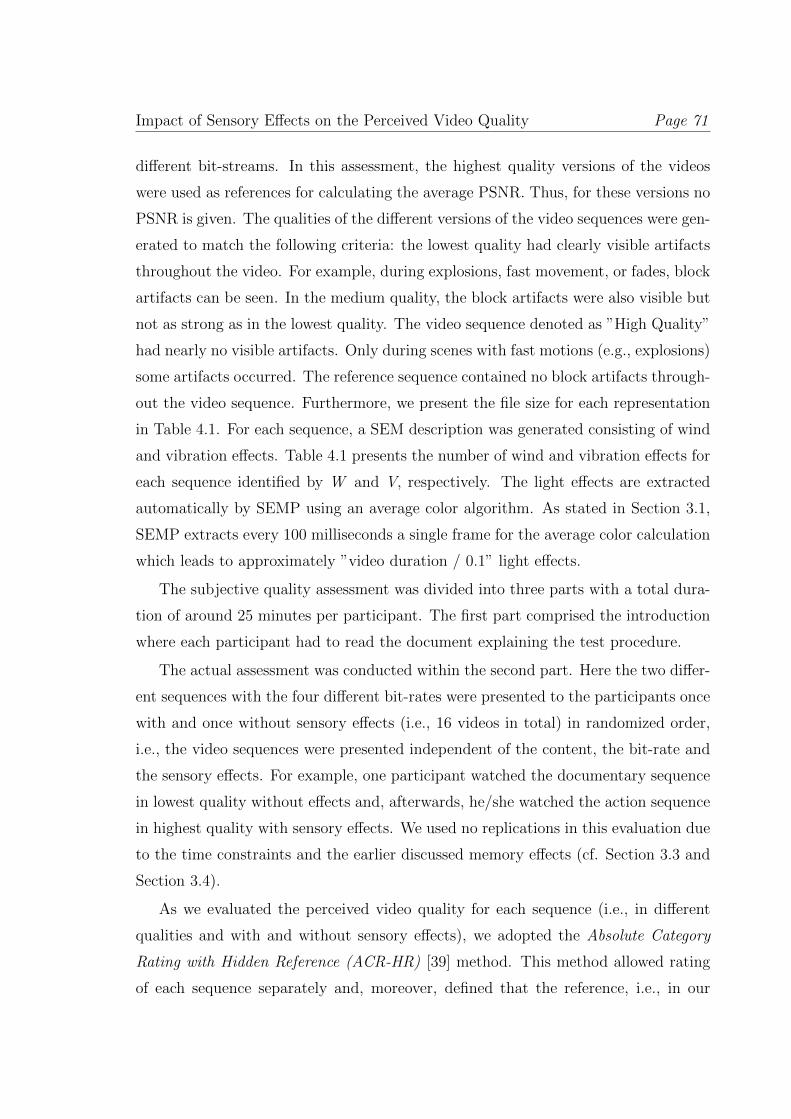
Impact of Sensory Effects on the Perceived Video Quality Page 71
different bit-streams. In this assessment, the highest quality versions of the videos
were used as references for calculating the average PSNR. Thus, for these versions no
PSNR is given. The qualities of the different versions of the video sequences were gen-
erated to match the following criteria: the lowest quality had clearly visible artifacts
throughout the video. For example, during explosions, fast movement, or fades, block
artifacts can be seen. In the medium quality, the block artifacts were also visible but
not as strong as in the lowest quality. The video sequence denoted as ”High Quality”
had nearly no visible artifacts. Only during scenes with fast motions (e.g., explosions)
some artifacts occurred. The reference sequence contained no block artifacts through-
out the video sequence. Furthermore, we present the file size for each representation
in Table 4.1. For each sequence, a SEM description was generated consisting of wind
and vibration effects. Table 4.1 presents the number of wind and vibration effects for
each sequence identified by W and V, respectively. The light effects are extracted
automatically by SEMP using an average color algorithm. As stated in Section 3.1,
SEMP extracts every 100 milliseconds a single frame for the average color calculation
which leads to approximately ”video duration / 0.1” light effects.
The subjective quality assessment was divided into three parts with a total dura-
tion of around 25 minutes per participant. The first part comprised the introduction
where each participant had to read the document explaining the test procedure.
The actual assessment was conducted within the second part. Here the two differ-
ent sequences with the four different bit-rates were presented to the participants once
with and once without sensory effects (i.e., 16 videos in total) in randomized order,
i.e., the video sequences were presented independent of the content, the bit-rate and
the sensory effects. For example, one participant watched the documentary sequence
in lowest quality without effects and, afterwards, he/she watched the action sequence
in highest quality with sensory effects. We used no replications in this evaluation due
to the time constraints and the earlier discussed memory effects (cf. Section 3.3 and
Section 3.4).
As we evaluated the perceived video quality for each sequence (i.e., in different
qualities and with and without sensory effects), we adopted the Absolute Category
Rating with Hidden Reference (ACR-HR) [39] method. This method allowed rating
of each sequence separately and, moreover, defined that the reference, i.e., in our
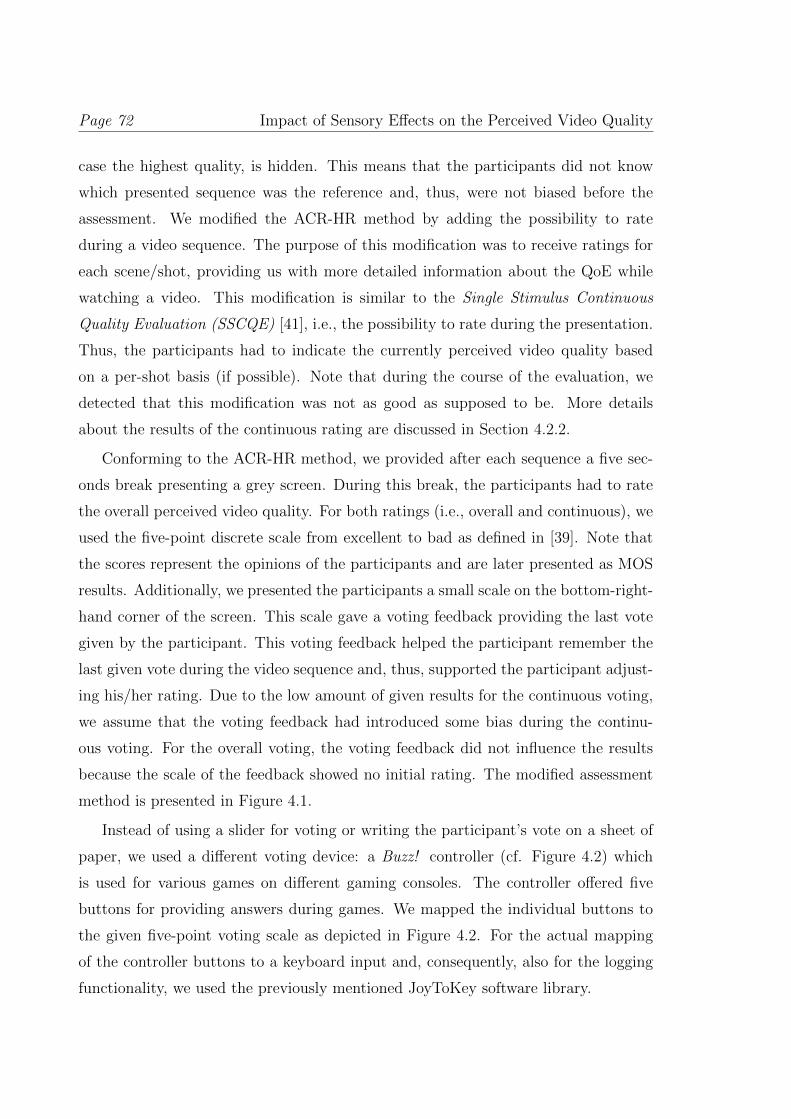
Page 72 Impact of Sensory Effects on the Perceived Video Quality
case the highest quality, is hidden. This means that the participants did not know
which presented sequence was the reference and, thus, were not biased before the
assessment. We modified the ACR-HR method by adding the possibility to rate
during a video sequence. The purpose of this modification was to receive ratings for
each scene/shot, providing us with more detailed information about the QoE while
watching a video. This modification is similar to the Single Stimulus Continuous
Quality Evaluation (SSCQE) [41], i.e., the possibility to rate during the presentation.
Thus, the participants had to indicate the currently perceived video quality based
on a per-shot basis (if possible). Note that during the course of the evaluation, we
detected that this modification was not as good as supposed to be. More details
about the results of the continuous rating are discussed in Section 4.2.2.
Conforming to the ACR-HR method, we provided after each sequence a five sec-
onds break presenting a grey screen. During this break, the participants had to rate
the overall perceived video quality. For both ratings (i.e., overall and continuous), we
used the five-point discrete scale from excellent to bad as defined in [39]. Note that
the scores represent the opinions of the participants and are later presented as MOS
results. Additionally, we presented the participants a small scale on the bottom-right-
hand corner of the screen. This scale gave a voting feedback providing the last vote
given by the participant. This voting feedback helped the participant remember the
last given vote during the video sequence and, thus, supported the participant adjust-
ing his/her rating. Due to the low amount of given results for the continuous voting,
we assume that the voting feedback had introduced some bias during the continu-
ous voting. For the overall voting, the voting feedback did not influence the results
because the scale of the feedback showed no initial rating. The modified assessment
method is presented in Figure 4.1.
Instead of using a slider for voting or writing the participant’s vote on a sheet of
paper, we used a different voting device: a Buzz! controller (cf. Figure 4.2) which
is used for various games on different gaming consoles. The controller offered five
buttons for providing answers during games. We mapped the individual buttons to
the given five-point voting scale as depicted in Figure 4.2. For the actual mapping
of the controller buttons to a keyboard input and, consequently, also for the logging
functionality, we used the previously mentioned JoyToKey software library.
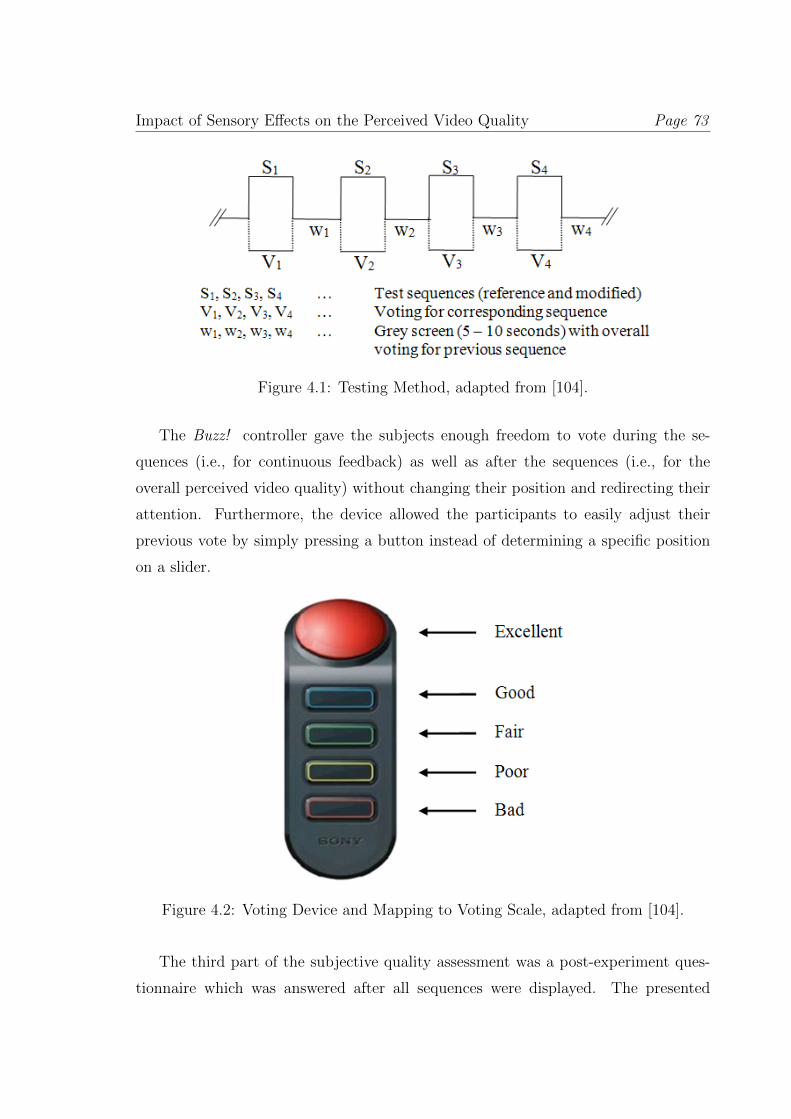
Impact of Sensory Effects on the Perceived Video Quality Page 73
Figure 4.1: Testing Method, adapted from [104].
The Buzz! controller gave the subjects enough freedom to vote during the se-
quences (i.e., for continuous feedback) as well as after the sequences (i.e., for the
overall perceived video quality) without changing their position and redirecting their
attention. Furthermore, the device allowed the participants to easily adjust their
previous vote by simply pressing a button instead of determining a specific position
on a slider.
Figure 4.2: Voting Device and Mapping to Voting Scale, adapted from [104].
The third part of the subjective quality assessment was a post-experiment ques-
tionnaire which was answered after all sequences were displayed. The presented
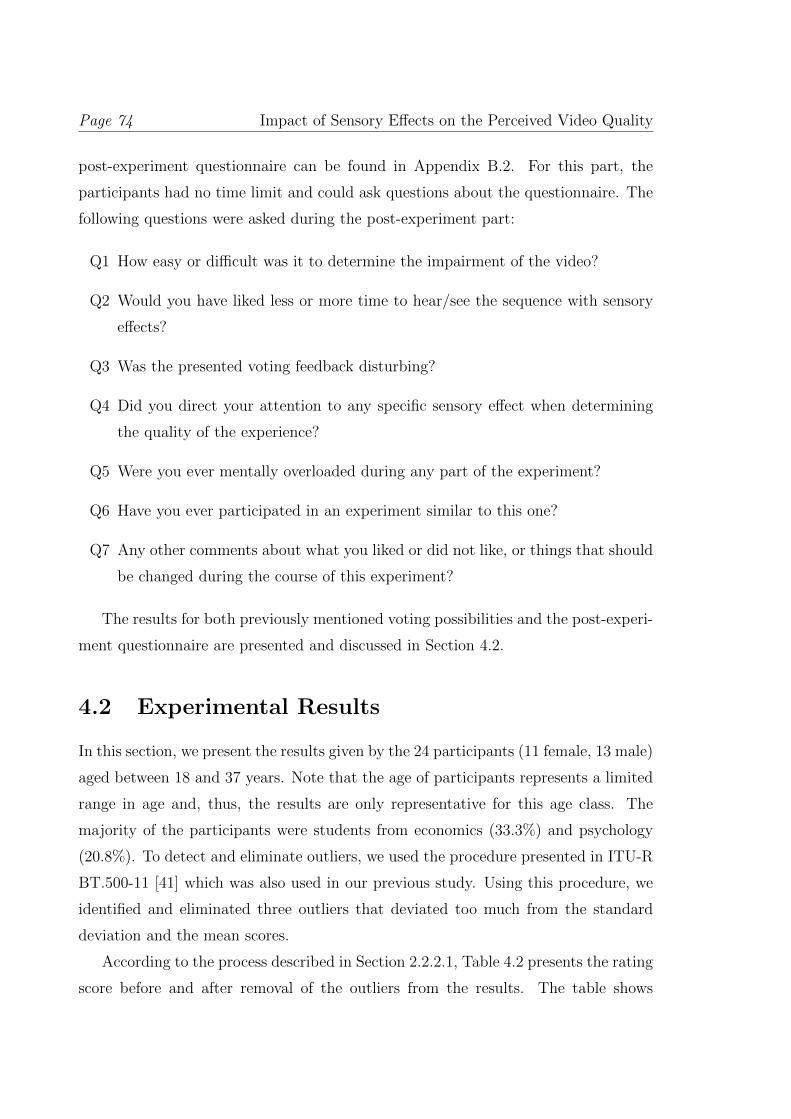
Page 74 Impact of Sensory Effects on the Perceived Video Quality
post-experiment questionnaire can be found in Appendix B.2. For this part, the
participants had no time limit and could ask questions about the questionnaire. The
following questions were asked during the post-experiment part:
Q1 How easy or difficult was it to determine the impairment of the video?
Q2 Would you have liked less or more time to hear/see the sequence with sensory
effects?
Q3 Was the presented voting feedback disturbing?
Q4 Did you direct your attention to any specific sensory effect when determining
the quality of the experience?
Q5 Were you ever mentally overloaded during any part of the experiment?
Q6 Have you ever participated in an experiment similar to this one?
Q7 Any other comments about what you liked or did not like, or things that should
be changed during the course of this experiment?
The results for both previously mentioned voting possibilities and the post-experi-
ment questionnaire are presented and discussed in Section 4.2.
4.2 Experimental Results
In this section, we present the results given by the 24 participants (11 female, 13 male)
aged between 18 and 37 years. Note that the age of participants represents a limited
range in age and, thus, the results are only representative for this age class. The
majority of the participants were students from economics (33.3%) and psychology
(20.8%). To detect and eliminate outliers, we used the procedure presented in ITU-R
BT.500-11 [41] which was also used in our previous study. Using this procedure, we
identified and eliminated three outliers that deviated too much from the standard
deviation and the mean scores.
According to the process described in Section 2.2.2.1, Table 4.2 presents the rating
score before and after removal of the outliers from the results. The table shows
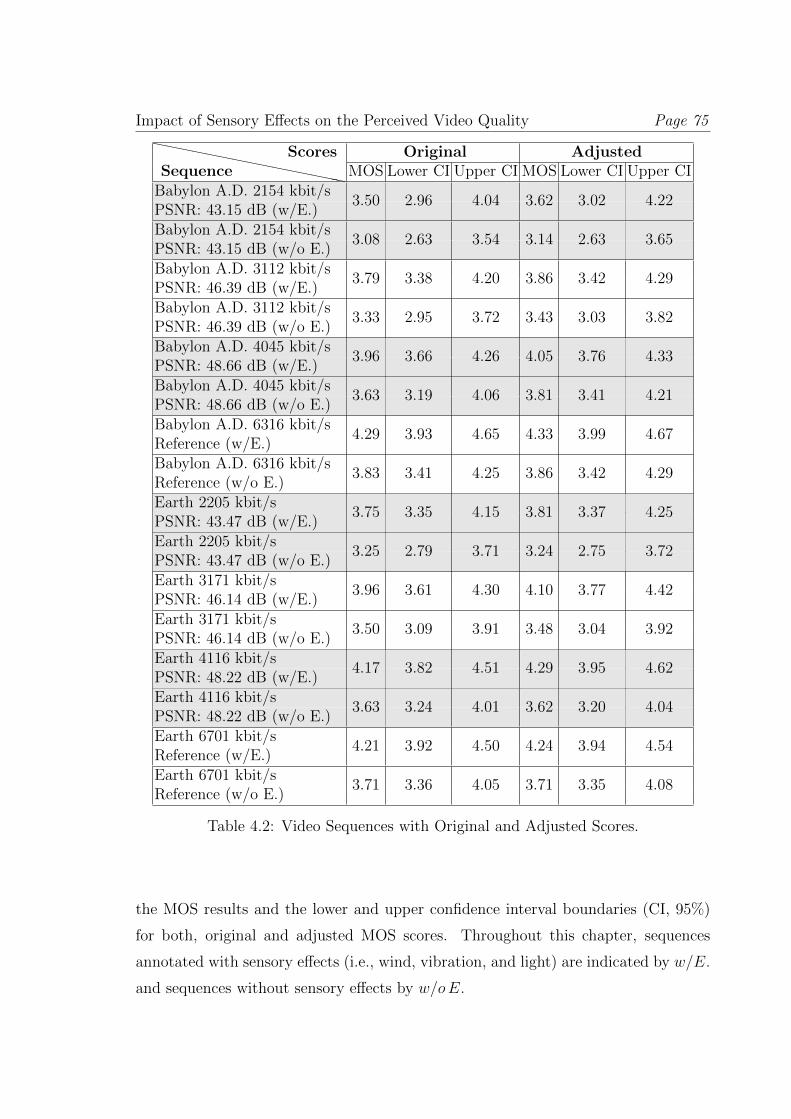
Impact of Sensory Effects on the Perceived Video Quality Page 75
Original Adjusted``````````````Sequence
ScoresMOS Lower CI Upper CI MOS Lower CI Upper CI
Babylon A.D. 2154 kbit/sPSNR: 43.15 dB (w/E.)
3.50 2.96 4.04 3.62 3.02 4.22
Babylon A.D. 2154 kbit/sPSNR: 43.15 dB (w/o E.)
3.08 2.63 3.54 3.14 2.63 3.65
Babylon A.D. 3112 kbit/sPSNR: 46.39 dB (w/E.)
3.79 3.38 4.20 3.86 3.42 4.29
Babylon A.D. 3112 kbit/sPSNR: 46.39 dB (w/o E.)
3.33 2.95 3.72 3.43 3.03 3.82
Babylon A.D. 4045 kbit/sPSNR: 48.66 dB (w/E.)
3.96 3.66 4.26 4.05 3.76 4.33
Babylon A.D. 4045 kbit/sPSNR: 48.66 dB (w/o E.)
3.63 3.19 4.06 3.81 3.41 4.21
Babylon A.D. 6316 kbit/sReference (w/E.)
4.29 3.93 4.65 4.33 3.99 4.67
Babylon A.D. 6316 kbit/sReference (w/o E.)
3.83 3.41 4.25 3.86 3.42 4.29
Earth 2205 kbit/sPSNR: 43.47 dB (w/E.)
3.75 3.35 4.15 3.81 3.37 4.25
Earth 2205 kbit/sPSNR: 43.47 dB (w/o E.)
3.25 2.79 3.71 3.24 2.75 3.72
Earth 3171 kbit/sPSNR: 46.14 dB (w/E.)
3.96 3.61 4.30 4.10 3.77 4.42
Earth 3171 kbit/sPSNR: 46.14 dB (w/o E.)
3.50 3.09 3.91 3.48 3.04 3.92
Earth 4116 kbit/sPSNR: 48.22 dB (w/E.)
4.17 3.82 4.51 4.29 3.95 4.62
Earth 4116 kbit/sPSNR: 48.22 dB (w/o E.)
3.63 3.24 4.01 3.62 3.20 4.04
Earth 6701 kbit/sReference (w/E.)
4.21 3.92 4.50 4.24 3.94 4.54
Earth 6701 kbit/sReference (w/o E.)
3.71 3.36 4.05 3.71 3.35 4.08
Table 4.2: Video Sequences with Original and Adjusted Scores.
the MOS results and the lower and upper confidence interval boundaries (CI, 95%)
for both, original and adjusted MOS scores. Throughout this chapter, sequences
annotated with sensory effects (i.e., wind, vibration, and light) are indicated by w/E.
and sequences without sensory effects by w/oE.
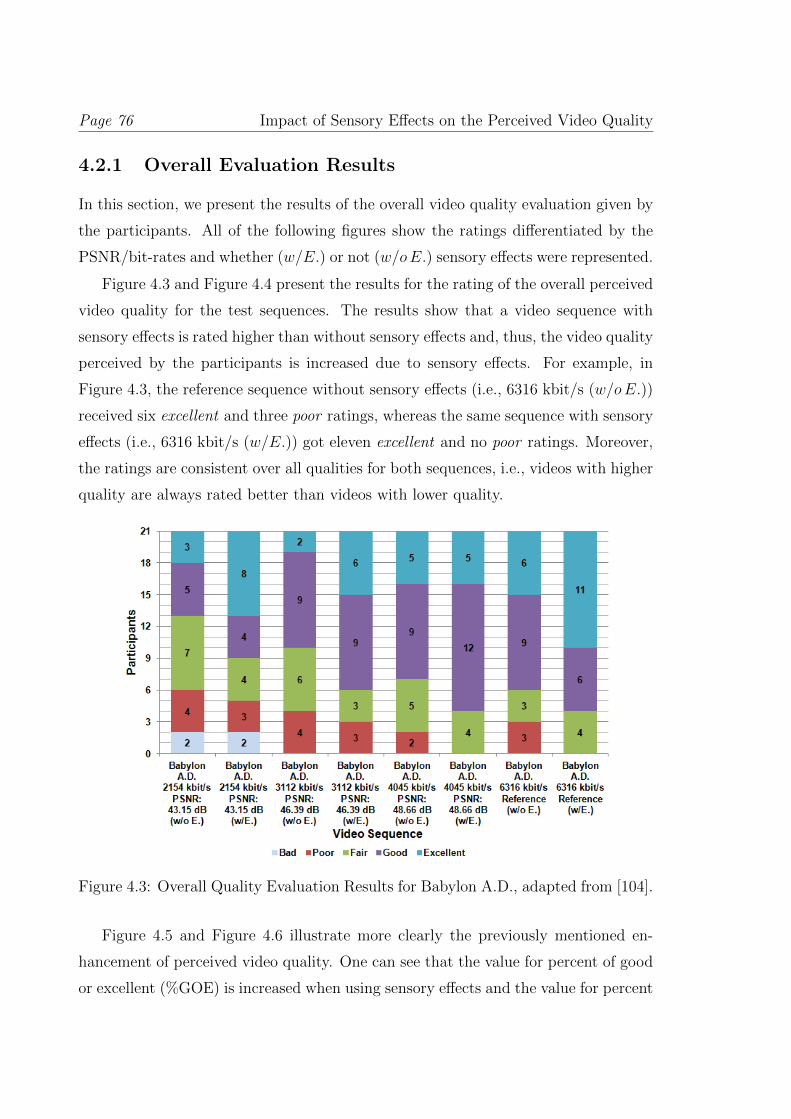
Page 76 Impact of Sensory Effects on the Perceived Video Quality
4.2.1 Overall Evaluation Results
In this section, we present the results of the overall video quality evaluation given by
the participants. All of the following figures show the ratings differentiated by the
PSNR/bit-rates and whether (w/E.) or not (w/oE.) sensory effects were represented.
Figure 4.3 and Figure 4.4 present the results for the rating of the overall perceived
video quality for the test sequences. The results show that a video sequence with
sensory effects is rated higher than without sensory effects and, thus, the video quality
perceived by the participants is increased due to sensory effects. For example, in
Figure 4.3, the reference sequence without sensory effects (i.e., 6316 kbit/s (w/oE.))
received six excellent and three poor ratings, whereas the same sequence with sensory
effects (i.e., 6316 kbit/s (w/E.)) got eleven excellent and no poor ratings. Moreover,
the ratings are consistent over all qualities for both sequences, i.e., videos with higher
quality are always rated better than videos with lower quality.
Figure 4.3: Overall Quality Evaluation Results for Babylon A.D., adapted from [104].
Figure 4.5 and Figure 4.6 illustrate more clearly the previously mentioned en-
hancement of perceived video quality. One can see that the value for percent of good
or excellent (%GOE) is increased when using sensory effects and the value for percent
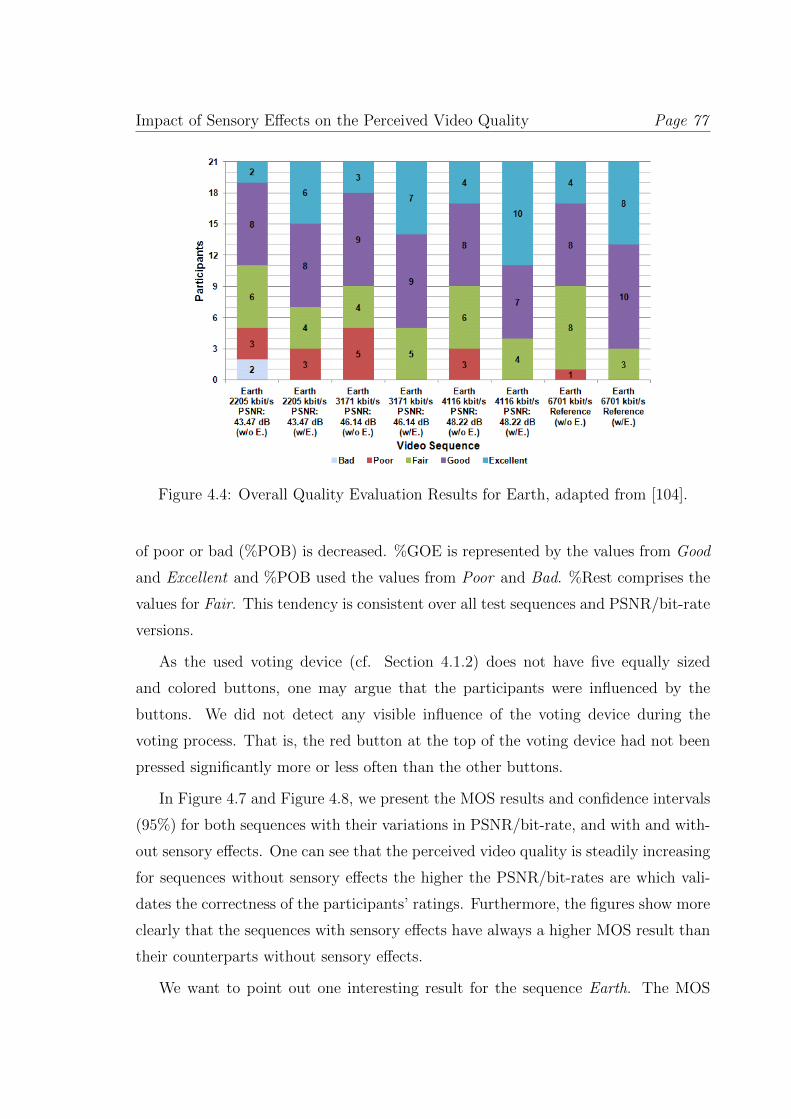
Impact of Sensory Effects on the Perceived Video Quality Page 77
Figure 4.4: Overall Quality Evaluation Results for Earth, adapted from [104].
of poor or bad (%POB) is decreased. %GOE is represented by the values from Good
and Excellent and %POB used the values from Poor and Bad. %Rest comprises the
values for Fair. This tendency is consistent over all test sequences and PSNR/bit-rate
versions.
As the used voting device (cf. Section 4.1.2) does not have five equally sized
and colored buttons, one may argue that the participants were influenced by the
buttons. We did not detect any visible influence of the voting device during the
voting process. That is, the red button at the top of the voting device had not been
pressed significantly more or less often than the other buttons.
In Figure 4.7 and Figure 4.8, we present the MOS results and confidence intervals
(95%) for both sequences with their variations in PSNR/bit-rate, and with and with-
out sensory effects. One can see that the perceived video quality is steadily increasing
for sequences without sensory effects the higher the PSNR/bit-rates are which vali-
dates the correctness of the participants’ ratings. Furthermore, the figures show more
clearly that the sequences with sensory effects have always a higher MOS result than
their counterparts without sensory effects.
We want to point out one interesting result for the sequence Earth. The MOS
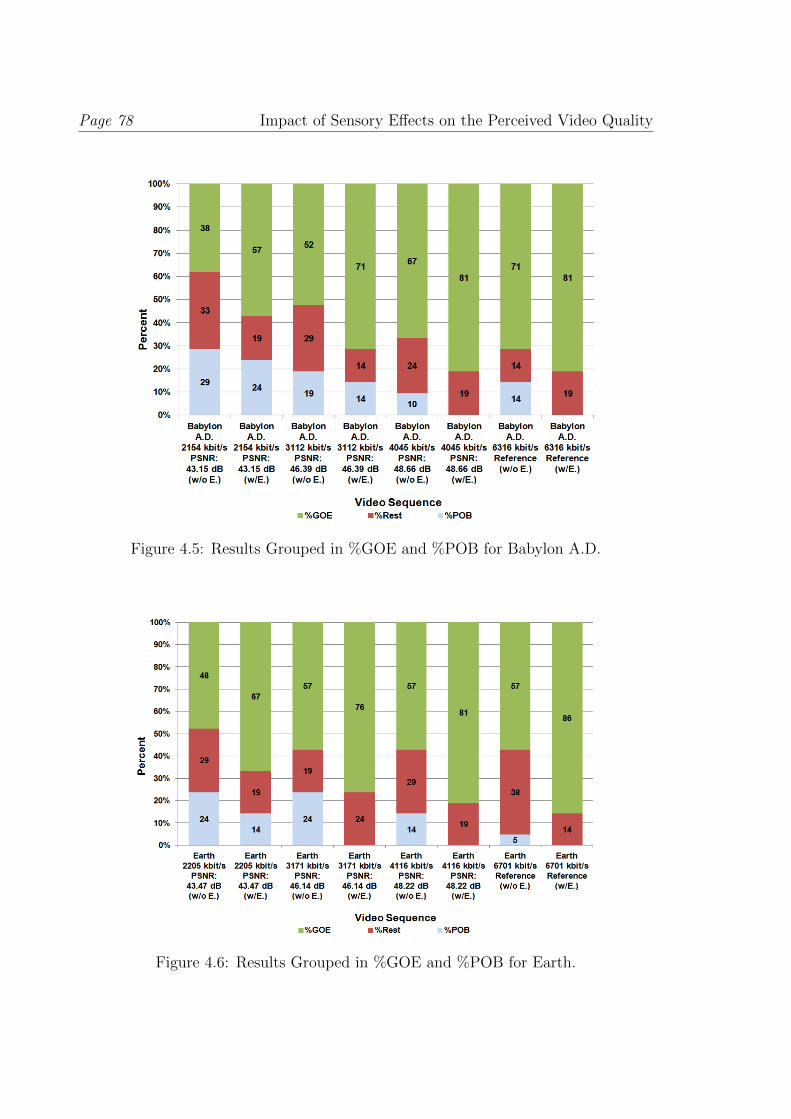
Page 78 Impact of Sensory Effects on the Perceived Video Quality
Figure 4.5: Results Grouped in %GOE and %POB for Babylon A.D.
Figure 4.6: Results Grouped in %GOE and %POB for Earth.
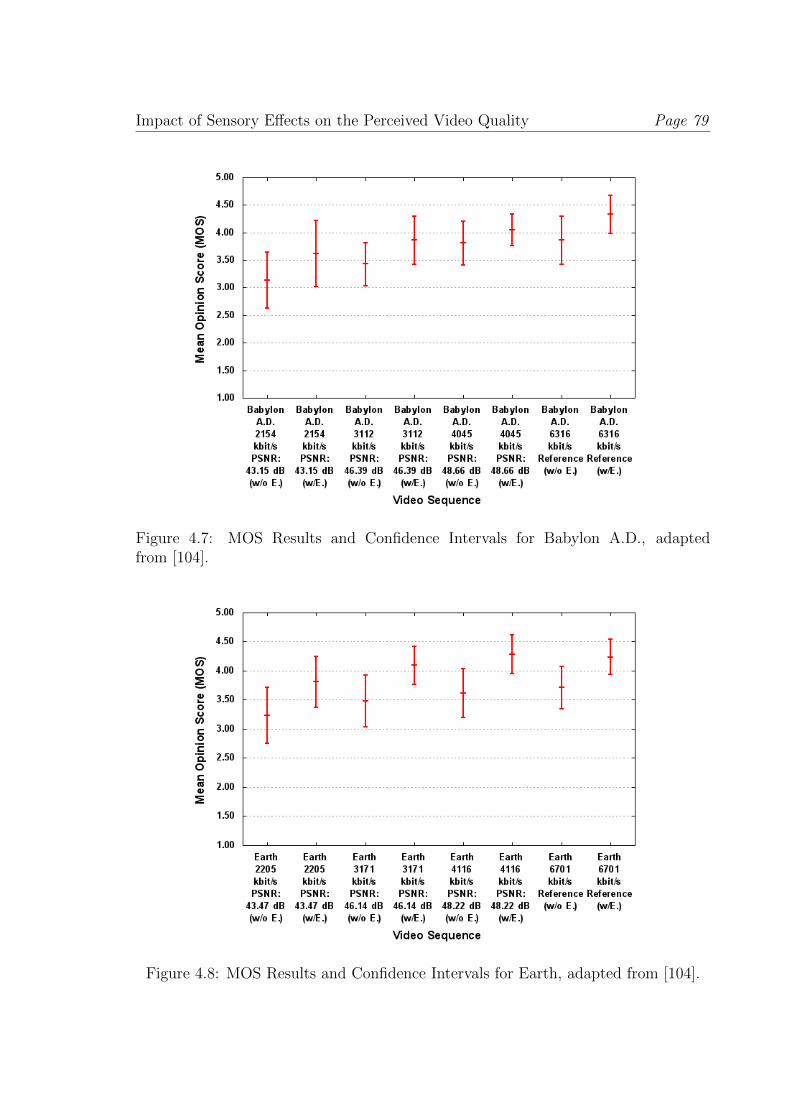
Impact of Sensory Effects on the Perceived Video Quality Page 79
Figure 4.7: MOS Results and Confidence Intervals for Babylon A.D., adaptedfrom [104].
Figure 4.8: MOS Results and Confidence Intervals for Earth, adapted from [104].
Page 80 Impact of Sensory Effects on the Perceived Video Quality
results of the lowest bit-rate version with sensory effects is always higher than the
MOS results of all higher bit-rate versions without sensory effects (cf. Figure 4.8).
This result leads to the assumption that Equation 4.1 and Equation 4.2 are always
true for the sequences and bit-rate variations used in this experiment. However, we
cannot derive a general conclusion from these results as the confidence interval ranges
are very wide and, thus, more tests are required to provide confident results for a wide
range of sequences/genres.
The MOS results’ increase between the video sequences without sensory effects and
with sensory effects is an interesting outcome. Due to these results, we were interested
in the average increase of MOS results compared to the PSNR/bit-rate versions of
the two video sequences. Therefore, we illustrate in Figure 4.9 and Figure 4.10 the
average MOS results versus the PSNR/bit-rate versions for Babylon A.D. and Earth,
respectively. We calculated the average difference between the two curves using the
Bjontegaard Delta (BD) method [106]. The outcome of the BD method is as follows:
For the sequence Babylon A.D., the rating with sensory effects is 0.359 MOS points
higher than without sensory effects and for Earth, the rating for the sequence enriched
by sensory effects is 0.624 MOS points higher than without sensory effects. We assume
the difference between the two average MOS values for Babylon A.D. and Earth arises
due to the difference in the genre, motion and number of scene/shot transitions. The
action sequence Babylon A.D. has high motion and a higher number of scene/shot
transitions than the documentary Earth. High motion in combination with too many
sensory effects could lead to overburdening the participants during the assessment
and, thus, leading to poorer ratings. The continuous voting results (cf. Section 4.2.2)
in combination with the post-experiment questionnaire (cf. Section 4.2.3) confirm this
observation. Still, the improvement of the video sequences annotated with sensory
effects compared to those without sensory effects is about 0.5 MOS points on average.
As we have used the ACR-HR method, we calculated the differential quality score
(DMOS) for each video sequence, according to ITU-T P.910 [39]. Note that here only
the adjusted scores were used, i.e., after outliers had been eliminated. Table 4.3 and
Table 4.4 present the DMOS results for the action sequence Babylon A.D. and the
documentary sequence Earth, respectively. For details on the calculation of DMOS
the reader is referred to Section 2.2.2.2 or [39].
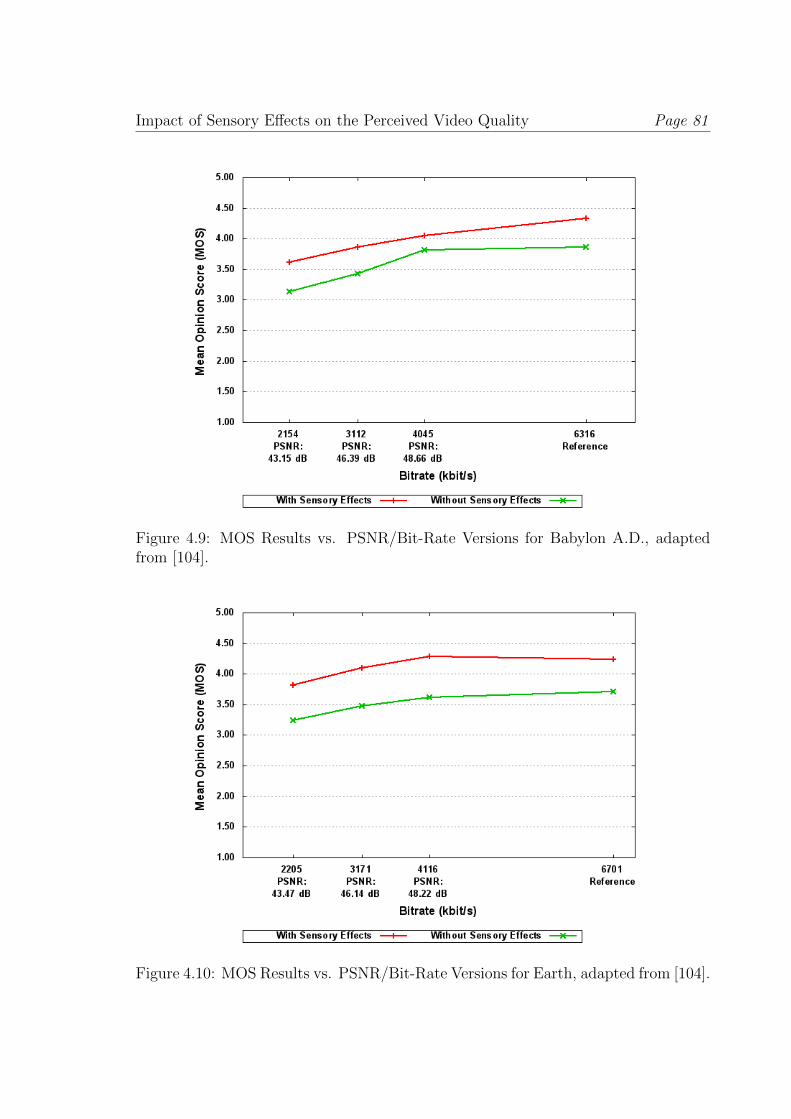
Impact of Sensory Effects on the Perceived Video Quality Page 81
Figure 4.9: MOS Results vs. PSNR/Bit-Rate Versions for Babylon A.D., adaptedfrom [104].
Figure 4.10: MOS Results vs. PSNR/Bit-Rate Versions for Earth, adapted from [104].
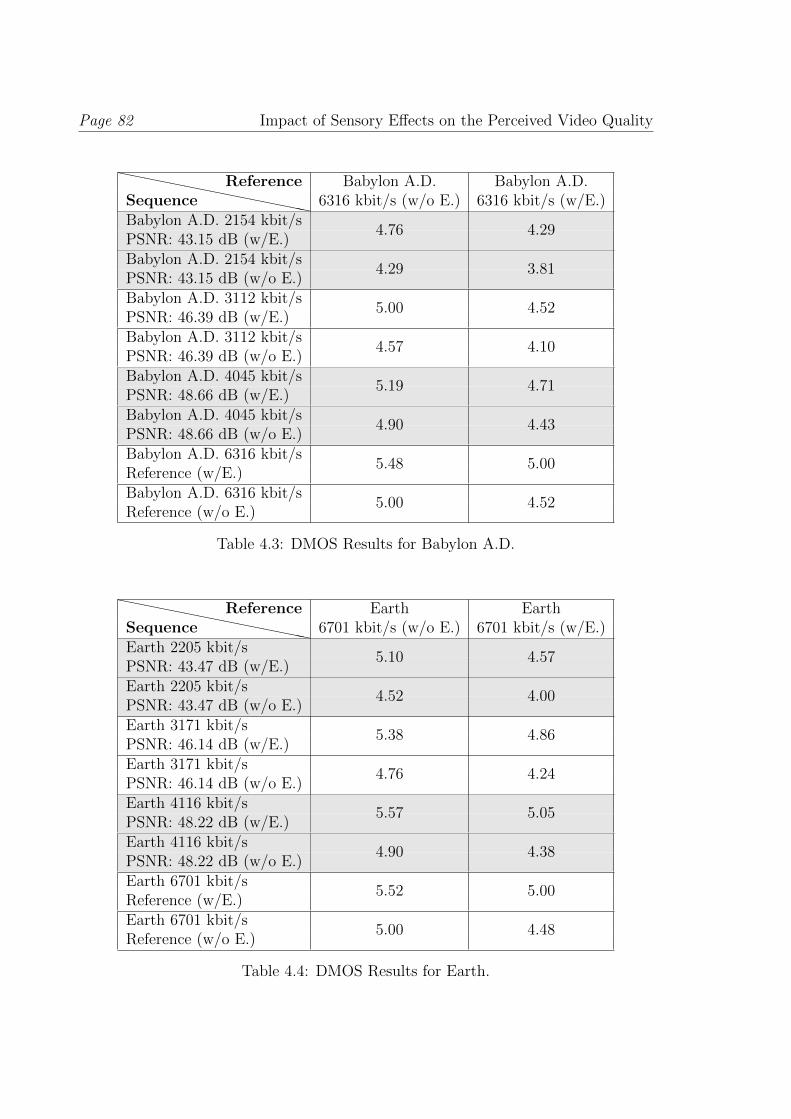
Page 82 Impact of Sensory Effects on the Perceived Video Quality
``````````````SequenceReference Babylon A.D. Babylon A.D.
6316 kbit/s (w/o E.) 6316 kbit/s (w/E.)Babylon A.D. 2154 kbit/sPSNR: 43.15 dB (w/E.)
4.76 4.29
Babylon A.D. 2154 kbit/sPSNR: 43.15 dB (w/o E.)
4.29 3.81
Babylon A.D. 3112 kbit/s5.00 4.52
PSNR: 46.39 dB (w/E.)Babylon A.D. 3112 kbit/s
4.57 4.10PSNR: 46.39 dB (w/o E.)Babylon A.D. 4045 kbit/sPSNR: 48.66 dB (w/E.)
5.19 4.71
Babylon A.D. 4045 kbit/sPSNR: 48.66 dB (w/o E.)
4.90 4.43
Babylon A.D. 6316 kbit/s5.48 5.00
Reference (w/E.)Babylon A.D. 6316 kbit/s
5.00 4.52Reference (w/o E.)
Table 4.3: DMOS Results for Babylon A.D.
``````````````SequenceReference Earth Earth
6701 kbit/s (w/o E.) 6701 kbit/s (w/E.)Earth 2205 kbit/sPSNR: 43.47 dB (w/E.)
5.10 4.57
Earth 2205 kbit/sPSNR: 43.47 dB (w/o E.)
4.52 4.00
Earth 3171 kbit/s5.38 4.86
PSNR: 46.14 dB (w/E.)Earth 3171 kbit/s
4.76 4.24PSNR: 46.14 dB (w/o E.)Earth 4116 kbit/sPSNR: 48.22 dB (w/E.)
5.57 5.05
Earth 4116 kbit/sPSNR: 48.22 dB (w/o E.)
4.90 4.38
Earth 6701 kbit/s5.52 5.00
Reference (w/E.)Earth 6701 kbit/s
5.00 4.48Reference (w/o E.)
Table 4.4: DMOS Results for Earth.
Impact of Sensory Effects on the Perceived Video Quality Page 83
One can clearly see that the scores are always higher when sensory effects (i.e.,
light, wind, and vibration) are used. In the case of Babylon A.D., sometimes the
quality of the sequences with sensory effects are rated better than the reference se-
quences without sensory effects. In case of Earth, the sequences with sensory effects
are always rated higher than the reference sequences without sensory effects.
The results of the DMOS calculation are as follows. If we take the video sequence
without sensory effects as the reference, the DMOS results are always (with the
exception of Babylon A.D. with 2154 kbit/s) equal to or above the Excellent score
(i.e., ≥ 5.00) when sensory effects are used. This means that the sequences with
additional effects are perceived better than the given reference (i.e., the sequence
with the highest quality and without sensory effects). In case the reference is a video
sequence with sensory effects, all sequences (with minor deviations for the Earth
sequence with 4116 kbit/s) receive a rating below 5.00. This indicates that the highest
quality with sensory effects is perceived best. Moreover, one can see that the DMOS
values increase with the quality level (with the exception for Earth with 4116 kbit/s
and sensory effects) independent from the reference sequence which indicates the
correctness of the results. Note that the deviation in the Earth sequence (i.e., decrease
of the DMOS results between 4116 kbit/s (w/E.) and 6701 kbit/s (w/E.)) is only 0.05
MOS points which is negligible. Furthermore, for completeness the calculated DMOS
values for comparing reference with reference are listed in the table. As a result of
the DMOS formula, this comparison always results in a MOS value of 5.00.
Additionally, for the results, we performed the one-tailed Mann-Whitney U test
[98, 99] for determining significant differences. We specified two different H0: first,
the perceived video quality with and without sensory effects is equal for Babylon
A.D. and for Earth separately. Second, the perceived video quality with and without
sensory effects is equal over both video sequences. We used a significance level of
α = 5%. The Mann-Whitney U significance values for Babylon A.D., Earth and the
combination of both are shown in Table 4.5, Table 4.6, and Table 4.7, respectively.
The cells highlighted in grey indicate comparisons where H0 was rejected and, thus,
significant differences occurred.
Table 4.5 illustrates that if no additional effects are used, there are always sig-
nificant differences in the ratings compared to video sequences with higher bit-rates
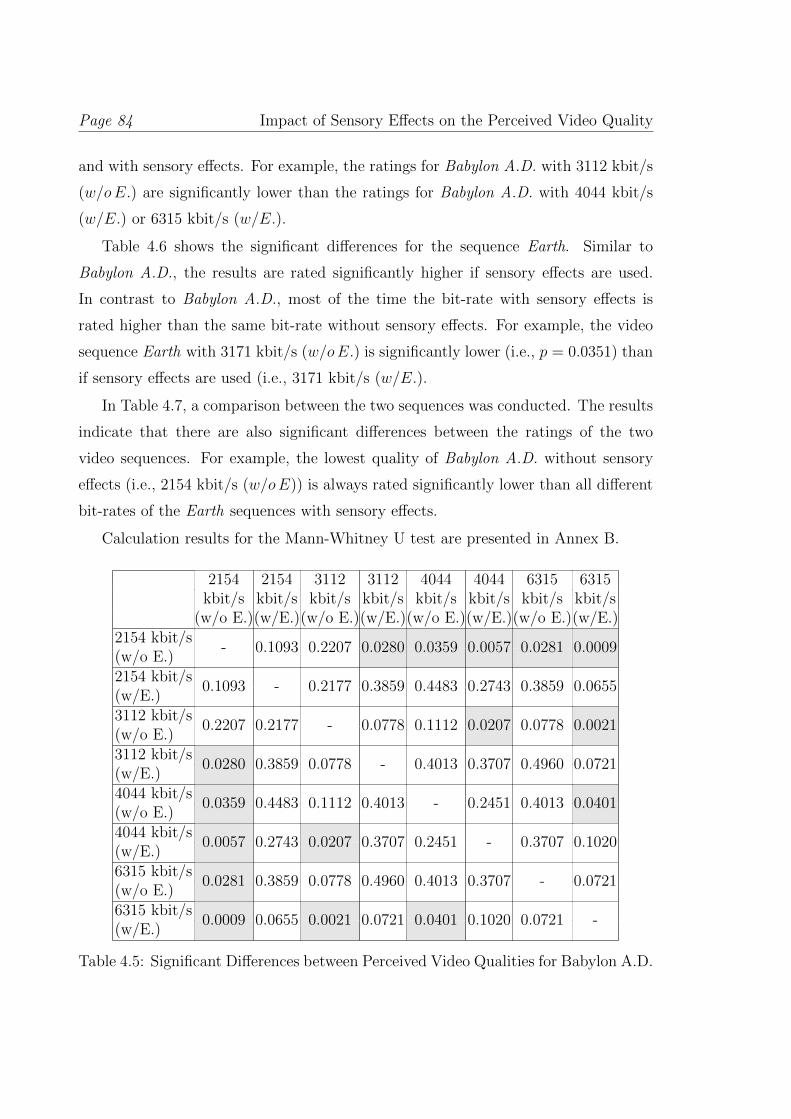
Page 84 Impact of Sensory Effects on the Perceived Video Quality
and with sensory effects. For example, the ratings for Babylon A.D. with 3112 kbit/s
(w/oE.) are significantly lower than the ratings for Babylon A.D. with 4044 kbit/s
(w/E.) or 6315 kbit/s (w/E.).
Table 4.6 shows the significant differences for the sequence Earth. Similar to
Babylon A.D., the results are rated significantly higher if sensory effects are used.
In contrast to Babylon A.D., most of the time the bit-rate with sensory effects is
rated higher than the same bit-rate without sensory effects. For example, the video
sequence Earth with 3171 kbit/s (w/oE.) is significantly lower (i.e., p = 0.0351) than
if sensory effects are used (i.e., 3171 kbit/s (w/E.).
In Table 4.7, a comparison between the two sequences was conducted. The results
indicate that there are also significant differences between the ratings of the two
video sequences. For example, the lowest quality of Babylon A.D. without sensory
effects (i.e., 2154 kbit/s (w/oE)) is always rated significantly lower than all different
bit-rates of the Earth sequences with sensory effects.
Calculation results for the Mann-Whitney U test are presented in Annex B.
2154 2154 3112 3112 4044 4044 6315 6315kbit/s kbit/s kbit/s kbit/s kbit/s kbit/s kbit/s kbit/s
(w/o E.)(w/E.)(w/o E.)(w/E.)(w/o E.)(w/E.)(w/o E.)(w/E.)2154 kbit/s(w/o E.)
- 0.1093 0.2207 0.0280 0.0359 0.0057 0.0281 0.0009
2154 kbit/s(w/E.)
0.1093 - 0.2177 0.3859 0.4483 0.2743 0.3859 0.0655
3112 kbit/s(w/o E.)
0.2207 0.2177 - 0.0778 0.1112 0.0207 0.0778 0.0021
3112 kbit/s(w/E.)
0.0280 0.3859 0.0778 - 0.4013 0.3707 0.4960 0.0721
4044 kbit/s(w/o E.)
0.0359 0.4483 0.1112 0.4013 - 0.2451 0.4013 0.0401
4044 kbit/s(w/E.)
0.0057 0.2743 0.0207 0.3707 0.2451 - 0.3707 0.1020
6315 kbit/s(w/o E.)
0.0281 0.3859 0.0778 0.4960 0.4013 0.3707 - 0.0721
6315 kbit/s(w/E.)
0.0009 0.0655 0.0021 0.0721 0.0401 0.1020 0.0721 -
Table 4.5: Significant Differences between Perceived Video Qualities for Babylon A.D.
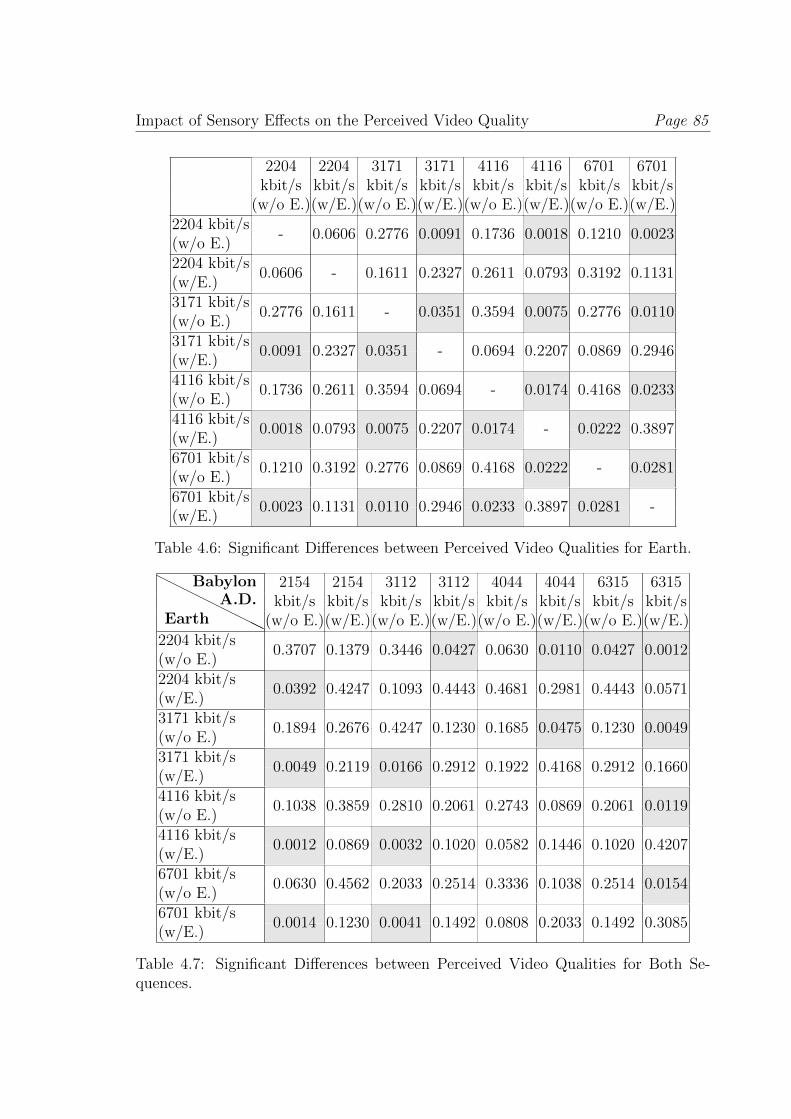
Impact of Sensory Effects on the Perceived Video Quality Page 85
2204 2204 3171 3171 4116 4116 6701 6701kbit/s kbit/s kbit/s kbit/s kbit/s kbit/s kbit/s kbit/s
(w/o E.)(w/E.)(w/o E.)(w/E.)(w/o E.)(w/E.)(w/o E.)(w/E.)2204 kbit/s(w/o E.)
- 0.0606 0.2776 0.0091 0.1736 0.0018 0.1210 0.0023
2204 kbit/s(w/E.)
0.0606 - 0.1611 0.2327 0.2611 0.0793 0.3192 0.1131
3171 kbit/s(w/o E.)
0.2776 0.1611 - 0.0351 0.3594 0.0075 0.2776 0.0110
3171 kbit/s(w/E.)
0.0091 0.2327 0.0351 - 0.0694 0.2207 0.0869 0.2946
4116 kbit/s(w/o E.)
0.1736 0.2611 0.3594 0.0694 - 0.0174 0.4168 0.0233
4116 kbit/s(w/E.)
0.0018 0.0793 0.0075 0.2207 0.0174 - 0.0222 0.3897
6701 kbit/s(w/o E.)
0.1210 0.3192 0.2776 0.0869 0.4168 0.0222 - 0.0281
6701 kbit/s(w/E.)
0.0023 0.1131 0.0110 0.2946 0.0233 0.3897 0.0281 -
Table 4.6: Significant Differences between Perceived Video Qualities for Earth.
HHHHH
HHHHEarth
BabylonA.D.
2154 2154 3112 3112 4044 4044 6315 6315kbit/s kbit/s kbit/s kbit/s kbit/s kbit/s kbit/s kbit/s
(w/o E.)(w/E.)(w/o E.)(w/E.)(w/o E.)(w/E.)(w/o E.)(w/E.)2204 kbit/s(w/o E.)
0.3707 0.1379 0.3446 0.0427 0.0630 0.0110 0.0427 0.0012
2204 kbit/s(w/E.)
0.0392 0.4247 0.1093 0.4443 0.4681 0.2981 0.4443 0.0571
3171 kbit/s(w/o E.)
0.1894 0.2676 0.4247 0.1230 0.1685 0.0475 0.1230 0.0049
3171 kbit/s(w/E.)
0.0049 0.2119 0.0166 0.2912 0.1922 0.4168 0.2912 0.1660
4116 kbit/s(w/o E.)
0.1038 0.3859 0.2810 0.2061 0.2743 0.0869 0.2061 0.0119
4116 kbit/s(w/E.)
0.0012 0.0869 0.0032 0.1020 0.0582 0.1446 0.1020 0.4207
6701 kbit/s(w/o E.)
0.0630 0.4562 0.2033 0.2514 0.3336 0.1038 0.2514 0.0154
6701 kbit/s(w/E.)
0.0014 0.1230 0.0041 0.1492 0.0808 0.2033 0.1492 0.3085
Table 4.7: Significant Differences between Perceived Video Qualities for Both Se-quences.
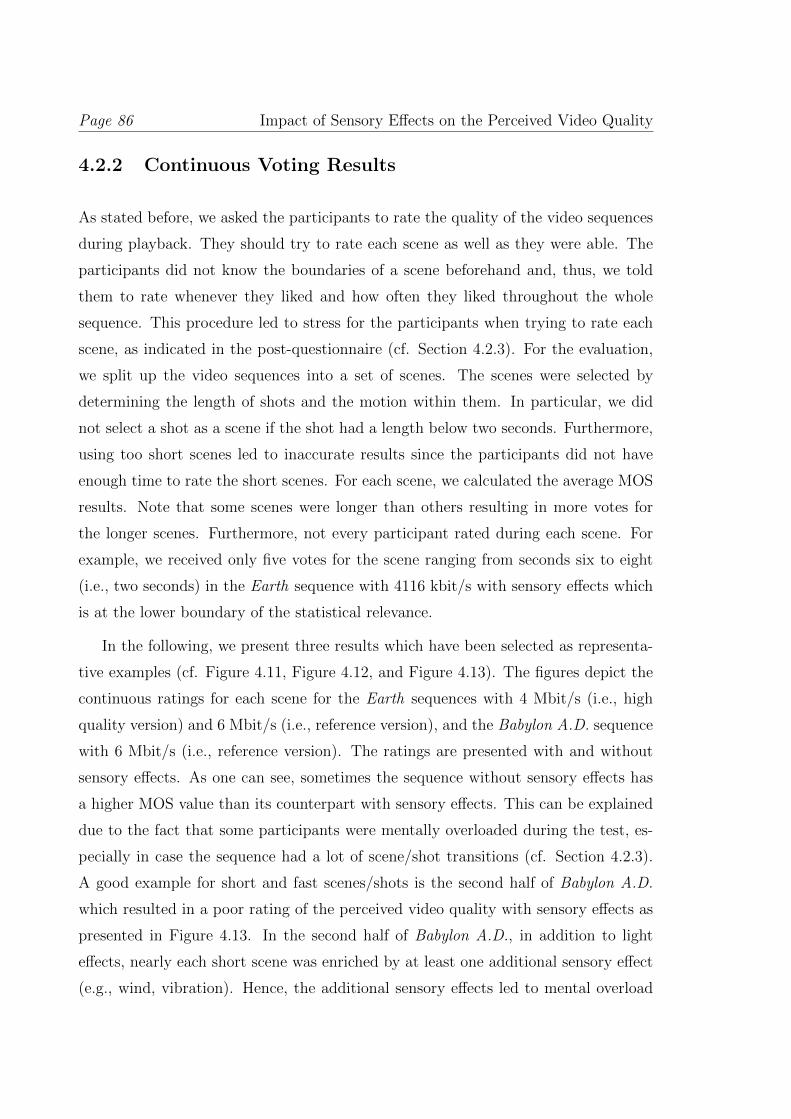
Page 86 Impact of Sensory Effects on the Perceived Video Quality
4.2.2 Continuous Voting Results
As stated before, we asked the participants to rate the quality of the video sequences
during playback. They should try to rate each scene as well as they were able. The
participants did not know the boundaries of a scene beforehand and, thus, we told
them to rate whenever they liked and how often they liked throughout the whole
sequence. This procedure led to stress for the participants when trying to rate each
scene, as indicated in the post-questionnaire (cf. Section 4.2.3). For the evaluation,
we split up the video sequences into a set of scenes. The scenes were selected by
determining the length of shots and the motion within them. In particular, we did
not select a shot as a scene if the shot had a length below two seconds. Furthermore,
using too short scenes led to inaccurate results since the participants did not have
enough time to rate the short scenes. For each scene, we calculated the average MOS
results. Note that some scenes were longer than others resulting in more votes for
the longer scenes. Furthermore, not every participant rated during each scene. For
example, we received only five votes for the scene ranging from seconds six to eight
(i.e., two seconds) in the Earth sequence with 4116 kbit/s with sensory effects which
is at the lower boundary of the statistical relevance.
In the following, we present three results which have been selected as representa-
tive examples (cf. Figure 4.11, Figure 4.12, and Figure 4.13). The figures depict the
continuous ratings for each scene for the Earth sequences with 4 Mbit/s (i.e., high
quality version) and 6 Mbit/s (i.e., reference version), and the Babylon A.D. sequence
with 6 Mbit/s (i.e., reference version). The ratings are presented with and without
sensory effects. As one can see, sometimes the sequence without sensory effects has
a higher MOS value than its counterpart with sensory effects. This can be explained
due to the fact that some participants were mentally overloaded during the test, es-
pecially in case the sequence had a lot of scene/shot transitions (cf. Section 4.2.3).
A good example for short and fast scenes/shots is the second half of Babylon A.D.
which resulted in a poor rating of the perceived video quality with sensory effects as
presented in Figure 4.13. In the second half of Babylon A.D., in addition to light
effects, nearly each short scene was enriched by at least one additional sensory effect
(e.g., wind, vibration). Hence, the additional sensory effects led to mental overload
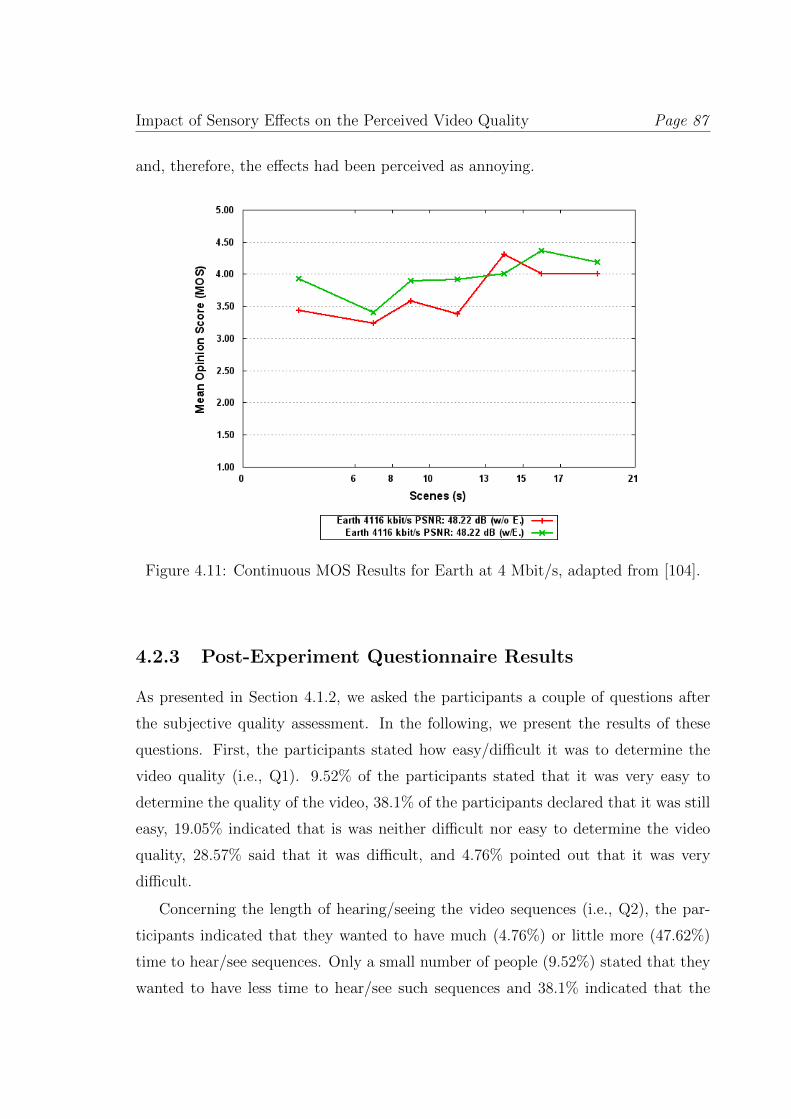
Impact of Sensory Effects on the Perceived Video Quality Page 87
and, therefore, the effects had been perceived as annoying.
Figure 4.11: Continuous MOS Results for Earth at 4 Mbit/s, adapted from [104].
4.2.3 Post-Experiment Questionnaire Results
As presented in Section 4.1.2, we asked the participants a couple of questions after
the subjective quality assessment. In the following, we present the results of these
questions. First, the participants stated how easy/difficult it was to determine the
video quality (i.e., Q1). 9.52% of the participants stated that it was very easy to
determine the quality of the video, 38.1% of the participants declared that it was still
easy, 19.05% indicated that is was neither difficult nor easy to determine the video
quality, 28.57% said that it was difficult, and 4.76% pointed out that it was very
difficult.
Concerning the length of hearing/seeing the video sequences (i.e., Q2), the par-
ticipants indicated that they wanted to have much (4.76%) or little more (47.62%)
time to hear/see sequences. Only a small number of people (9.52%) stated that they
wanted to have less time to hear/see such sequences and 38.1% indicated that the
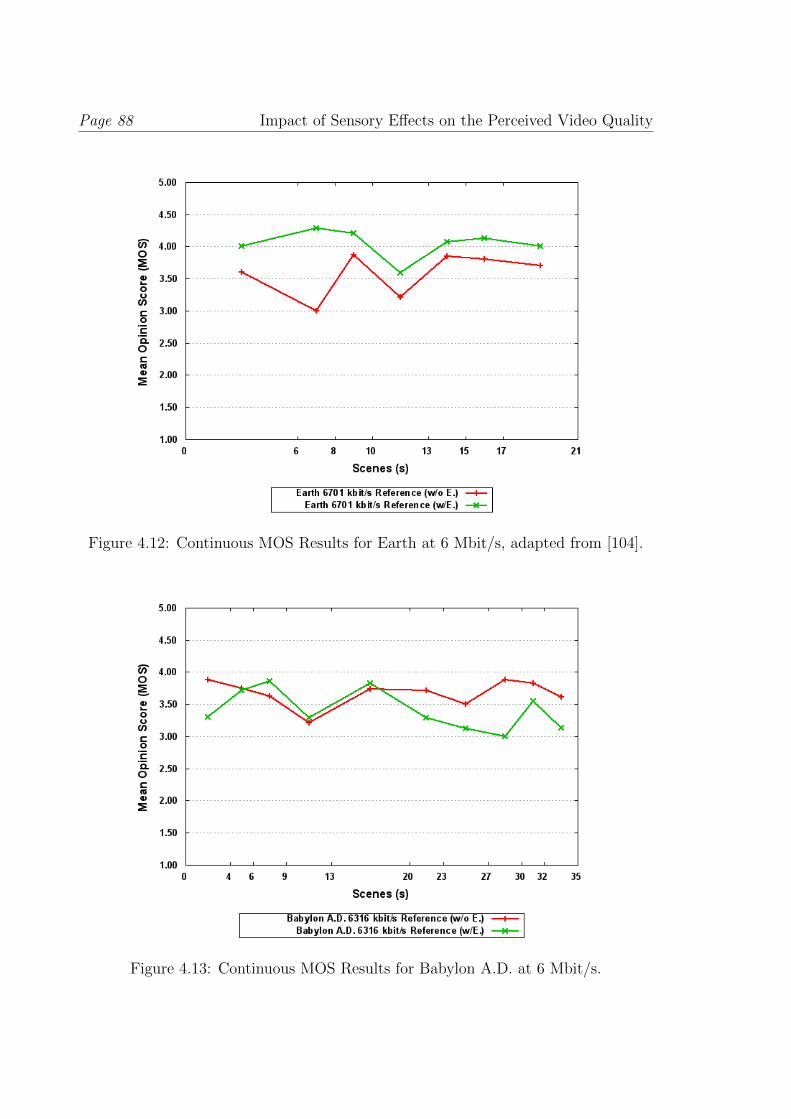
Page 88 Impact of Sensory Effects on the Perceived Video Quality
Figure 4.12: Continuous MOS Results for Earth at 6 Mbit/s, adapted from [104].
Figure 4.13: Continuous MOS Results for Babylon A.D. at 6 Mbit/s.
Impact of Sensory Effects on the Perceived Video Quality Page 89
length was enough. Note that no one wanted to have much less time to hear/see the
sequences.
Regarding Q3, the majority of the participants indicated that the voting feedback
presented in the bottom-right-hand corner of the movie was not disturbing (85.71%).
57.14% of the participants indicated that they have paid more attention to at least
one effect than to the others (i.e., Q4). This indicates that some effects were too
strong and, thus, distracted the participants or even annoyed them. This observation
confirms the results from our first subjective quality assessment (cf. Chapter 3) w.r.t.
the same question.
Furthermore, the participants liked the Buzz! controller for the voting because
it did not interfere too much during watching the sequences. One problem for some
participants was voting during the sequence Babylon A.D. The reason for this was
the high motion and the short scenes within the sequence. This resulted in stress
for the participants during the user study (i.e., Q5) which was indicated by 28.57%
of the participants. For Q6, two participants indicated that they had participated
in our previous subjective quality assessment (cf. Chapter 3); all other participants
had never performed any subjective quality assessment before. For Q7, 42.86% of the
participants stated that they really liked the effects (i.e., wind, light, and vibration)
and one participant even stated that he/she felt like sitting in a cinema. Some
participants (i.e., 19.05%) also stated that there were too many sequences and that
the shots/scenes were too short for rating and, thus, leading to stress situations.
4.3 Discussion and Conclusions
In this chapter, we presented the results of our subjective quality assessment on
the impact of sensory effects (i.e., wind, light, and vibration) on the video quality
which a participant perceives while watching a video. In our case, this comprised
two video sequences from the action and documentary genre. The results illustrated
that the quality of the multimedia experience is increased due to the usage of sensory
effects. Moreover, the results indicate that the modified ACR-HR method used for
the subjective quality assessment is suitable for video sequences enriched by sensory
effects.
Page 90 Impact of Sensory Effects on the Perceived Video Quality
Regarding the continuous voting, the results indicate two points: (1) the used
method is not suitable for retrieving results while watching a video sequence; (2) the
used sequences are not suitable for such an evaluation. For resolving issue (1), it
should be considered if retrieving ratings during a sequence was essential for the
evaluation and, thus, the continuous rating could be omitted. If rating during a se-
quence is necessary, an evaluation method using a continuous voting scale (e.g., Single
Stimulus Continuous Quality Evaluation (SSCQE) [41]) should be considered. The
SSCQE method was developed with the goal to provide ratings for a sequence while
watching it. To resolve issue (2), there are two possible solutions. First, sequences
should be used that do not have too short scenes/transitions and too high a level
of motion. Second, longer sequences should be used. For example, if the SSCQE
method from issue (1) is used, the recommended length for each sequence is around
five minutes [41].
The results for Earth showed interesting tendencies, leading to the assumption
that the storage requirements for video sequences can be reduced if sensory effects
are used. For example, the highest quality version of the Earth sequence has around
17 MB and the lowest quality version has 5.6 MB. As mentioned earlier, the lowest
quality version with sensory effects was perceived better than the highest quality ver-
sion without sensory effects. Therefore, only the lowest quality version with sensory
effects needs to be stored, saving around 67% of storage space. This assumption needs
to be confirmed by further evaluations.
Moreover, similar to our previous study (cf. Chapter 3), we cannot provide a gen-
eral conclusion for this evaluation as it is advisable to conduct a large scale assessment
(i.e., more participants and long-running evaluation) in a real-world environment (i.e.,
outside the laboratory). Furthermore, the participants represent only a small age class
and, thus, there is the need to perform the evaluation with other age classes to pro-
vide a broader range of results. Additionally, the used equipment is very specific and,
thus, other systems providing sensory effects are likely to produce different results.
From the results achieved in this subjective quality assessment, the following con-
clusions on the impact of sensory effects on the perceived video quality can be drawn:
• Sensory effects are an appropriate tool for increasing the viewing experience
Impact of Sensory Effects on the Perceived Video Quality Page 91
by stimulating also other senses than vision and audition. This conclusion is
supported by the subjective quality assessment illustrated in Chapter 3. In
particular, the achieved results show that sensory effects are more appropriate
for the documentary genre (in both assessments it was the highest ranked) than
for action sequences.
• Sensory effects can be used to mask appearing artifacts within video sequences
and, thus, improve the perceived video quality.
• The results of this assessment strengthens the assumption that the usage of
sensory effects depends on the presented content and, hence, the content in-
fluences the rating behaviour of the participants. For example, comparing the
MOS results for reference sequence Babylon A.D. with sensory effects from this
assessment with the rating for the Babylon A.D. sequence from the assessment
in Chapter 3, one can see that the sequence in this chapter is rated approxi-
mately 0.4 MOS points higher than in the previous assessment. The sequences
only differ in length and in a different cutting.
• Allowing a continuous rating during video sequences with short shots/scenes
leads to stress for the participants and, thus, has to be avoided.

CHAPTER
5 Sensory Effects and the
World Wide Web
In our previous user studies (cf. Chapter 3 and Chapter 4), we focused only on
local multimedia consumption. As more and more content becomes available on the
World Wide Web (WWW) everyday, there is the need to integrate video into the
Internet. One step in this direction is the strategy established by the World Wide
Web Consortium (W3C) [107] which should help increase the popularity of video
content in the Internet. Contributions towards this goal are the HTML5 video tag
and video platforms such as YouTube or MySpace.
As a result of this development, we shifted the context from the local multimedia
consumption to the WWW scenario (e.g., playback via YouTube or MySpace). As
there is a lack of evaluations on sensory effects in the context of the WWW, we per-
formed two subjective quality assessments comprising multimedia content, especially
videos, accompanied with sensory effects (i.e., light effects). In our first research
on sensory effects in the WWW context, we only focused on light effects as they
can be generated automatically from the content and, thus, need no additional SEM
descriptions.
Additionally, in our prior publication [108], we proposed an approach for inte-
grating sensory effects in Web sites using JavaScript and the HTML5 video element.
Moreover, in the publication, we discussed if sensory effects are ready for the WWW
and we argued that sensory effects are ready for the WWW but some implementation
efforts are needed. Furthermore, the perception of sensory effects in the context of
the WWW is not clear and, thus, some subjective quality assessments are necessary.
Therefore, we prepared a Web browser plug-in which is able to render sensory
effects (i.e., light, wind, and vibration) and performed subjective quality assessments.
The Web browser plug-in is shortly presented in Section 5.1. A more detailed de-
scription of the plug-in can be found in [14]. For the subjective quality assessments
presented in this chapter, an early version of the plug-in was used which was op-
timized for extracting automatic light effects from the multimedia content without
Page 94 Sensory Effects and the World Wide Web
using additional metadata (i.e., SEM descriptions).
With the Web browser plug-in, we conducted two subjective quality assessments
with the following goals: to investigate, first, the benefit of using sensory effects
(i.e., light effects) in combination with Web videos and, second, the influence of skip-
ping pixel columns, entire pixel rows, and/or whole frames in the computation of
the presented light effects if performance issues arise. Both subjective quality assess-
ments including their results are presented in Section 5.2 and Section 5.3, respectively.
Section 5.4 concludes this chapter with a discussion and summary of the presented
subjective quality assessments.
In contrast to our previous studies, we used the final version of the MPEG-V
standard [13]. Furthermore, this chapter is based on our work published in [109]
and [110]. Note that there are some deviations from the published work which are
described throughout the chapter.
5.1 Architecture of the Web Browser Plug-in
In this section, we present the used software for performing subjective quality assess-
ments in the context of the WWW.
The Web browser plug-in, which was developed by Benjamin Rainer [14], provides
means for communicating between different Web browsers (e.g., Mozilla Firefox, In-
ternet Explorer, Opera) and the amBX System [15] (cf. Section 2.3.1). We used for
the subjective quality assessments, presented in this chapter, an early version of the
plug-in that only used the Gecko SDK 1.9.2 [111] and, thus, only supported Mozilla
Firefox 3.6 and upwards. Furthermore, the plug-in was only able to render light ef-
fects. The current version of the plug-in, which was also used in the subjective quality
assessment presented in Chapter 6, supports light, vibration and wind effects, and all
major Web browsers (i.e., Safari, Opera, Chrome, Firefox, and Internet Explorer).
For rendering multimedia content within a Website, there are two major solutions:
first, using Adobe Flash to embed a video in the Web site, which needs an additional
player; second, using the new HTML5 video element [112] which is supported by all
new Web browsers and does not need an additional player such as Quicktime Player
or the Adobe Flash Player. The plug-in supports both solutions. The reasons for this
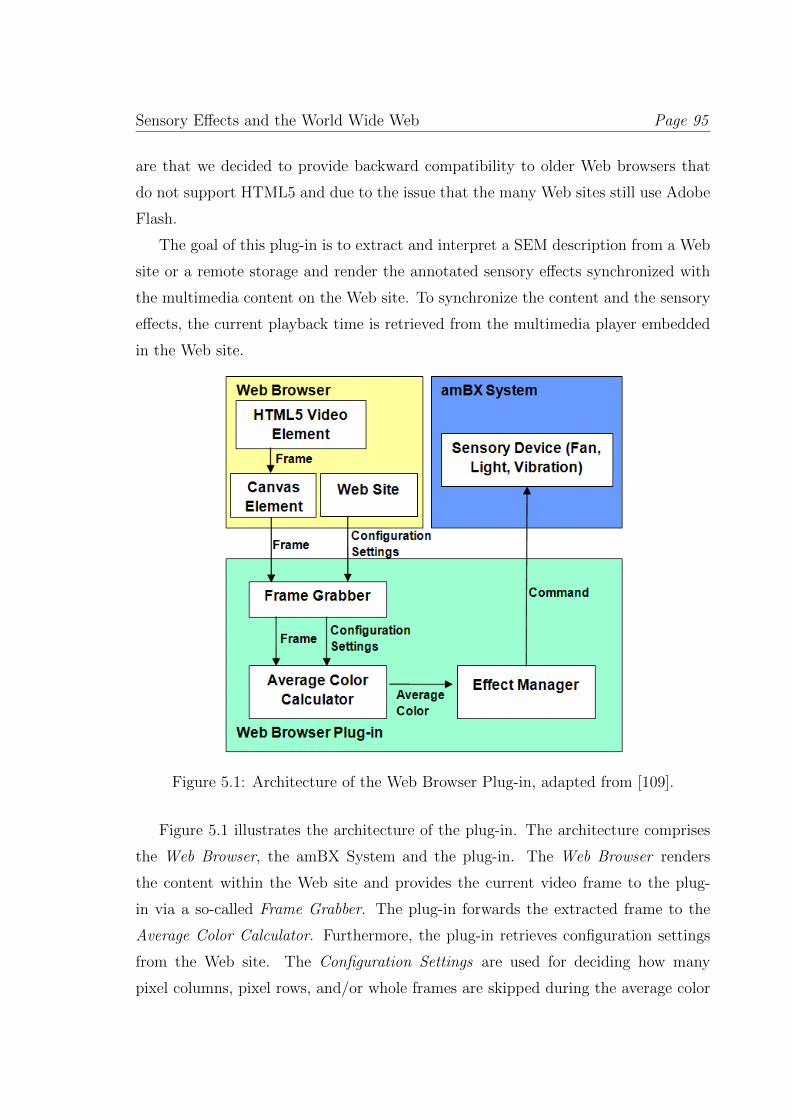
Sensory Effects and the World Wide Web Page 95
are that we decided to provide backward compatibility to older Web browsers that
do not support HTML5 and due to the issue that the many Web sites still use Adobe
Flash.
The goal of this plug-in is to extract and interpret a SEM description from a Web
site or a remote storage and render the annotated sensory effects synchronized with
the multimedia content on the Web site. To synchronize the content and the sensory
effects, the current playback time is retrieved from the multimedia player embedded
in the Web site.
Figure 5.1: Architecture of the Web Browser Plug-in, adapted from [109].
Figure 5.1 illustrates the architecture of the plug-in. The architecture comprises
the Web Browser, the amBX System and the plug-in. The Web Browser renders
the content within the Web site and provides the current video frame to the plug-
in via a so-called Frame Grabber. The plug-in forwards the extracted frame to the
Average Color Calculator. Furthermore, the plug-in retrieves configuration settings
from the Web site. The Configuration Settings are used for deciding how many
pixel columns, pixel rows, and/or whole frames are skipped during the average color
Page 96 Sensory Effects and the World Wide Web
calculation. These parameters are used for increasing the performance of the average
color calculation. This is necessary if the computer running the plug-in is too slow
and, thus, the plug-in would forward color to the light devices too late or, due to the
color extraction, the video playback would stutter. Currently, the plug-in extracts
every 30 milliseconds a frame and, thus, approximately 33 frames/s are retrieved and
processed, depending on the calculation settings. For the extraction, 30 milliseconds
were selected because the settings of the amBX devices can only be changed after
this time period has elapsed. For color calculation, the plug-in uses the MultiMedia
Extension (MMX) instructions which are supported by most modern x86 and x64
CPUs and, thus, provide fast color calculation. If there is no MMX support, the plug-
in has a fallback solution which uses a regular instructions-based color calculation but
is slower.
After determining the average color, the Average Color Calculator forwards it to
the Effect Manager. The Effect Manager handles all available effects and sends com-
mands to the amBX System for activating/deactivating and configuring the sensory
devices (e.g., fans, lights).
A more detailed description of the plug-in can be found in [14]. Note that the
plug-in described in [14] provides additional functionality such as SEM parsing and
rendering of wind and vibration effects.
5.2 Experiment Methodology
This section presents the test environment for the two subjective quality assess-
ments which were based on ITU-T Rec. P.910 [39], P.911 [40], and ITU-R Rec.
BT.500-11 [41]. In particular, we present the number of participants, the used stim-
uli and the test environment (cf. Section 5.2.1). Furthermore, we present the used
test methods and the design of the experiment in Section 5.2.2. The results of the
two subjective quality assessments are presented in Section 5.3.
Note that the methods used in [109, 110] are stated as Absolute Category Rating
with Hidden Reference (ACR-HR) and Degradation Category Rating (DCR) which
were not the correct names for the used methods. Hence, in this work, the methods
are correctly named and described. These name changes have no influence on the
Sensory Effects and the World Wide Web Page 97
performed assessments as the modifications on the evaluation methods (i.e., using
a continuous rating scale instead of the specified discrete rating scale) presented
in [109, 110] led to the methods described in this chapter.
5.2.1 Participants, Stimuli and Test Environment
For the two subjective quality assessments, we invited the following number of partic-
ipants: for the first study, we invited 20 students (11 female, 9 male) between 19 and
31 years. For the second study, we invited 18 students (7 female, 11 male) between
21 and 34 years. Three participants from the first study and two participants from
the second study already took part in one of our previous studies (cf. Chapter 3 and
Chapter 4). Six participants from the second study were students of computer sci-
ence; the rest of the participants were not familiar with the evaluation topic or were
students from other areas (e.g., psychology). The number of invited participants for
both assessments is in the range of participants that provide statistically valid results,
according to [39, 41, 42]. Thus, the results of the assessments are statistically relevant
for the given age classes.
For the subjective quality assessments, we prepared Web sites which contained the
introductions, the assessments themselves, and the post-experiment questionnaires.
Both assessments were provided in English and German to avoid possible misunder-
standings. Moreover, we prepared the Web sites to facilitate each participant the
same test conditions.
The two subjective quality assessments used the same Web videos which are shown
in Table 5.1. Note that the second assessment only used two Web videos. The
table indicates the name of each sequence, the corresponding genre, the bit-rate,
and the length of each sequence. The length of the sequences was again reduced,
as compared to the previous assessments (cf. Chapter 3 and Chapter 4), to better
conform to the recommended sequence duration as indicated in [41, 42]. Still, we
used longer sequences to provide the participants more time to accommodate to the
light effects and to not mentally overload the participants. As presented in [93],
a test sequence can be between 10 and 30 seconds without influencing the results.
Therefore, the selected sequence lengths are producing reliable results. All videos
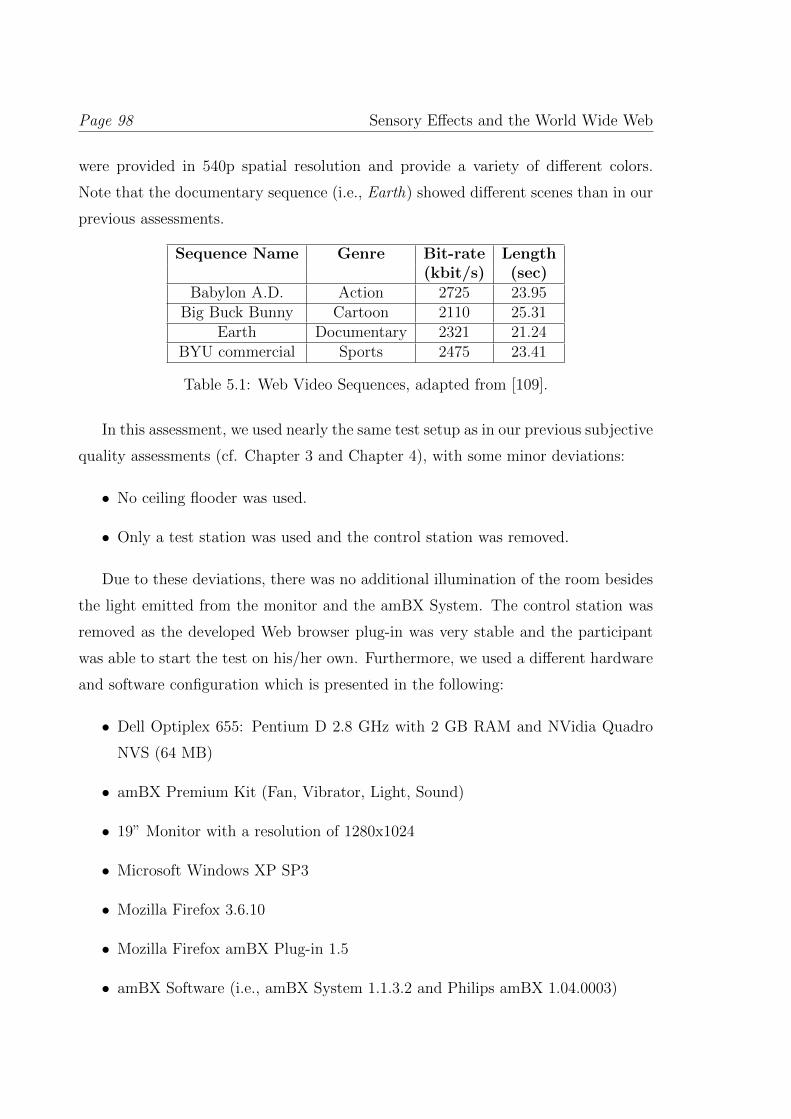
Page 98 Sensory Effects and the World Wide Web
were provided in 540p spatial resolution and provide a variety of different colors.
Note that the documentary sequence (i.e., Earth) showed different scenes than in our
previous assessments.
Sequence Name Genre Bit-rate Length(kbit/s) (sec)
Babylon A.D. Action 2725 23.95Big Buck Bunny Cartoon 2110 25.31
Earth Documentary 2321 21.24BYU commercial Sports 2475 23.41
Table 5.1: Web Video Sequences, adapted from [109].
In this assessment, we used nearly the same test setup as in our previous subjective
quality assessments (cf. Chapter 3 and Chapter 4), with some minor deviations:
• No ceiling flooder was used.
• Only a test station was used and the control station was removed.
Due to these deviations, there was no additional illumination of the room besides
the light emitted from the monitor and the amBX System. The control station was
removed as the developed Web browser plug-in was very stable and the participant
was able to start the test on his/her own. Furthermore, we used a different hardware
and software configuration which is presented in the following:
• Dell Optiplex 655: Pentium D 2.8 GHz with 2 GB RAM and NVidia Quadro
NVS (64 MB)
• amBX Premium Kit (Fan, Vibrator, Light, Sound)
• 19” Monitor with a resolution of 1280x1024
• Microsoft Windows XP SP3
• Mozilla Firefox 3.6.10
• Mozilla Firefox amBX Plug-in 1.5
• amBX Software (i.e., amBX System 1.1.3.2 and Philips amBX 1.04.0003)
Sensory Effects and the World Wide Web Page 99
The major differences to our previous assessments are the smaller monitor and
the usage of a Web browser instead of a local media player. We reduced the size of
the monitor and, as a consequence, the resolution to match state of the art hardware
used for working and Web browsing.
As stated earlier, the actual assessments were divided into three parts. For the two
assessments, the first and third parts were identical. The assessments only differed
in the second part. Both assessments lasted around 20 to 25 minutes per participant
which was within the recommended assessment duration defined by the ITU. The
whole evaluation ran on a local computer, thus reducing possible network influences
(e.g., loading or playback issues).
The first part of the assessments comprised the introduction and general ques-
tions (i.e., gender, age, and field of study) about the participant. Each participant
had to read the introduction carefully since it explained the whole test procedure.
Furthermore, participants could ask questions about the assessment during this part.
The introductions for both assessments can be found in Appendix C.1.
The actual assessment was conducted in the second part of both studies. A de-
tailed description of the two different test methods and experiment designs of the
subjective quality assessments can be found in Section 5.2.2.
After the participants finished the second part of the assessments, a post-experi-
ment questionnaire was presented. For this part, the participants had no time limit
and they again could ask questions about the questionnaire if something was not
comprehensible. The following questions were asked in the post-experiment question-
naire:
Q1 Were you mentally overloaded during any part of the experiment?
Q2 Have you ever participated in an experiment similar to this one?
Q3 Any other comments about what you liked or did not like, or things that should
be changed during the course of this experiment?
The results of the assessments and the post-experiment questionnaires are pre-
sented in Section 5.3.
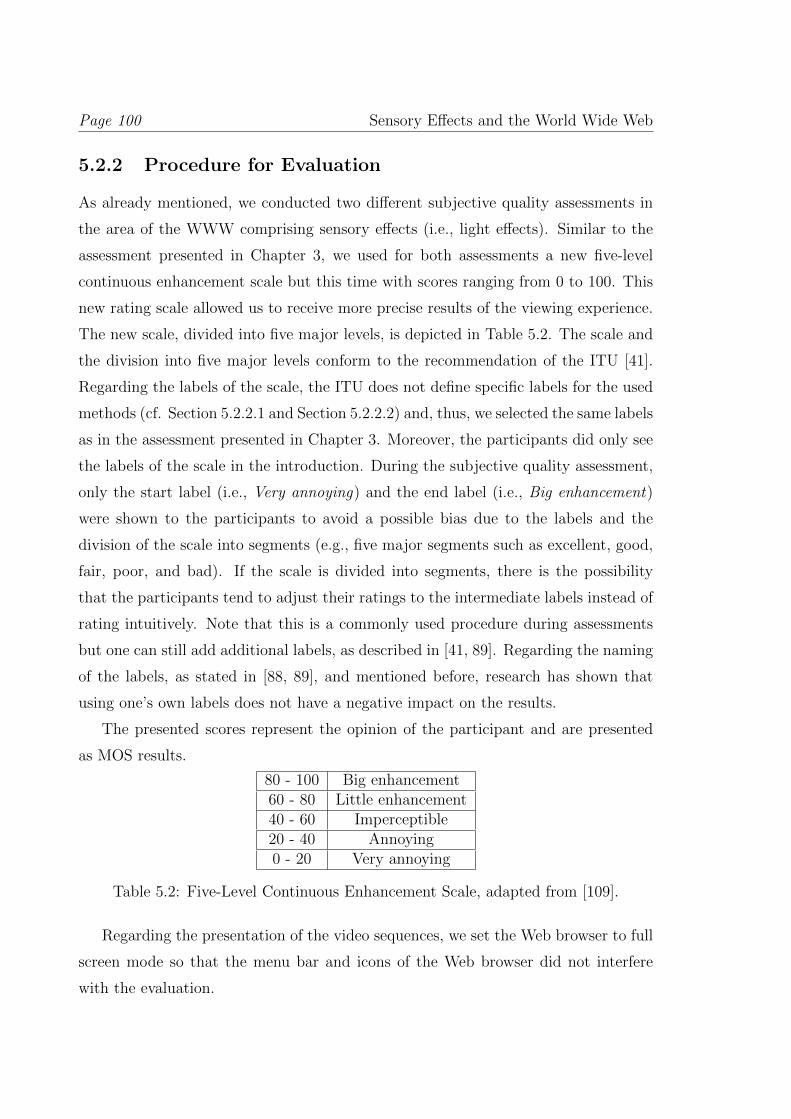
Page 100 Sensory Effects and the World Wide Web
5.2.2 Procedure for Evaluation
As already mentioned, we conducted two different subjective quality assessments in
the area of the WWW comprising sensory effects (i.e., light effects). Similar to the
assessment presented in Chapter 3, we used for both assessments a new five-level
continuous enhancement scale but this time with scores ranging from 0 to 100. This
new rating scale allowed us to receive more precise results of the viewing experience.
The new scale, divided into five major levels, is depicted in Table 5.2. The scale and
the division into five major levels conform to the recommendation of the ITU [41].
Regarding the labels of the scale, the ITU does not define specific labels for the used
methods (cf. Section 5.2.2.1 and Section 5.2.2.2) and, thus, we selected the same labels
as in the assessment presented in Chapter 3. Moreover, the participants did only see
the labels of the scale in the introduction. During the subjective quality assessment,
only the start label (i.e., Very annoying) and the end label (i.e., Big enhancement)
were shown to the participants to avoid a possible bias due to the labels and the
division of the scale into segments (e.g., five major segments such as excellent, good,
fair, poor, and bad). If the scale is divided into segments, there is the possibility
that the participants tend to adjust their ratings to the intermediate labels instead of
rating intuitively. Note that this is a commonly used procedure during assessments
but one can still add additional labels, as described in [41, 89]. Regarding the naming
of the labels, as stated in [88, 89], and mentioned before, research has shown that
using one’s own labels does not have a negative impact on the results.
The presented scores represent the opinion of the participant and are presented
as MOS results.
80 - 100 Big enhancement60 - 80 Little enhancement40 - 60 Imperceptible20 - 40 Annoying0 - 20 Very annoying
Table 5.2: Five-Level Continuous Enhancement Scale, adapted from [109].
Regarding the presentation of the video sequences, we set the Web browser to full
screen mode so that the menu bar and icons of the Web browser did not interfere
with the evaluation.
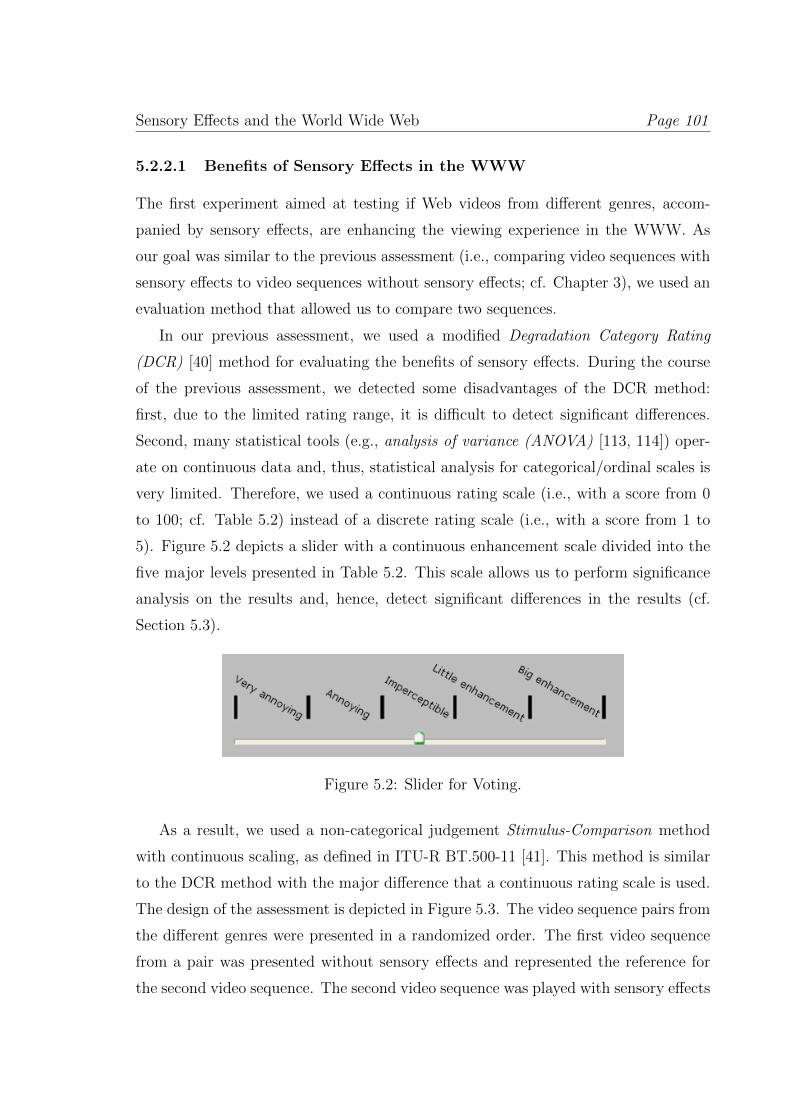
Sensory Effects and the World Wide Web Page 101
5.2.2.1 Benefits of Sensory Effects in the WWW
The first experiment aimed at testing if Web videos from different genres, accom-
panied by sensory effects, are enhancing the viewing experience in the WWW. As
our goal was similar to the previous assessment (i.e., comparing video sequences with
sensory effects to video sequences without sensory effects; cf. Chapter 3), we used an
evaluation method that allowed us to compare two sequences.
In our previous assessment, we used a modified Degradation Category Rating
(DCR) [40] method for evaluating the benefits of sensory effects. During the course
of the previous assessment, we detected some disadvantages of the DCR method:
first, due to the limited rating range, it is difficult to detect significant differences.
Second, many statistical tools (e.g., analysis of variance (ANOVA) [113, 114]) oper-
ate on continuous data and, thus, statistical analysis for categorical/ordinal scales is
very limited. Therefore, we used a continuous rating scale (i.e., with a score from 0
to 100; cf. Table 5.2) instead of a discrete rating scale (i.e., with a score from 1 to
5). Figure 5.2 depicts a slider with a continuous enhancement scale divided into the
five major levels presented in Table 5.2. This scale allows us to perform significance
analysis on the results and, hence, detect significant differences in the results (cf.
Section 5.3).
Figure 5.2: Slider for Voting.
As a result, we used a non-categorical judgement Stimulus-Comparison method
with continuous scaling, as defined in ITU-R BT.500-11 [41]. This method is similar
to the DCR method with the major difference that a continuous rating scale is used.
The design of the assessment is depicted in Figure 5.3. The video sequence pairs from
the different genres were presented in a randomized order. The first video sequence
from a pair was presented without sensory effects and represented the reference for
the second video sequence. The second video sequence was played with sensory effects
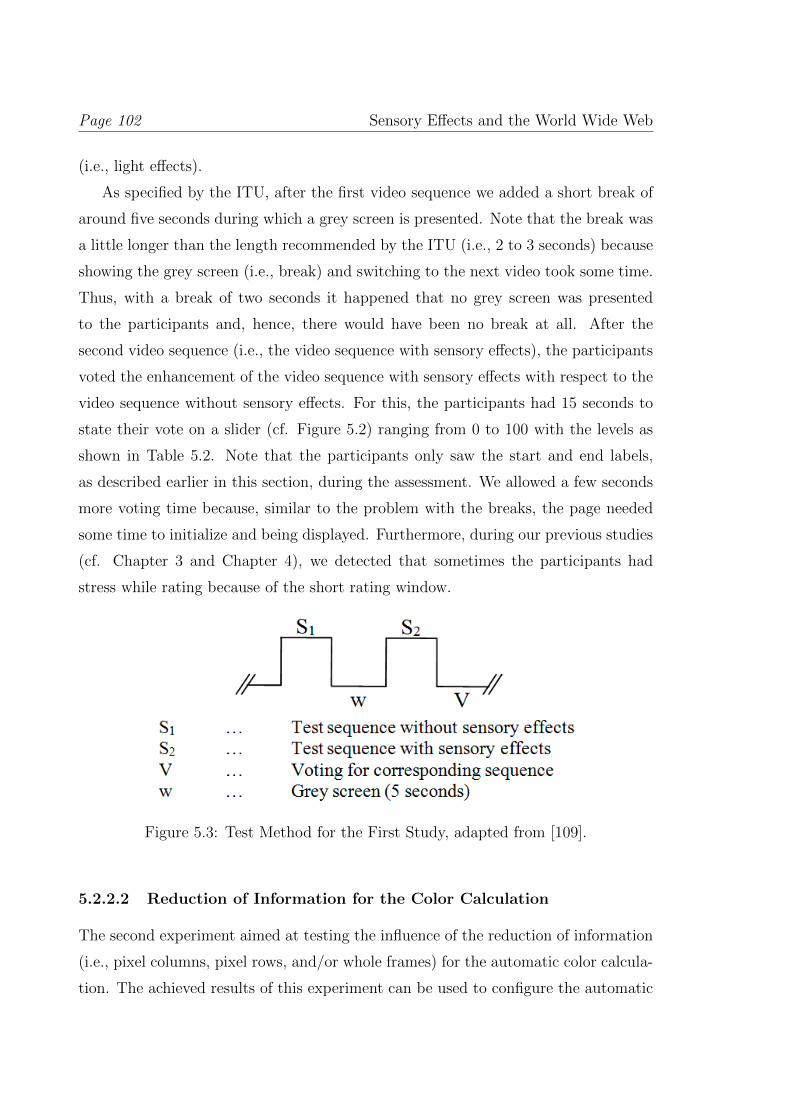
Page 102 Sensory Effects and the World Wide Web
(i.e., light effects).
As specified by the ITU, after the first video sequence we added a short break of
around five seconds during which a grey screen is presented. Note that the break was
a little longer than the length recommended by the ITU (i.e., 2 to 3 seconds) because
showing the grey screen (i.e., break) and switching to the next video took some time.
Thus, with a break of two seconds it happened that no grey screen was presented
to the participants and, hence, there would have been no break at all. After the
second video sequence (i.e., the video sequence with sensory effects), the participants
voted the enhancement of the video sequence with sensory effects with respect to the
video sequence without sensory effects. For this, the participants had 15 seconds to
state their vote on a slider (cf. Figure 5.2) ranging from 0 to 100 with the levels as
shown in Table 5.2. Note that the participants only saw the start and end labels,
as described earlier in this section, during the assessment. We allowed a few seconds
more voting time because, similar to the problem with the breaks, the page needed
some time to initialize and being displayed. Furthermore, during our previous studies
(cf. Chapter 3 and Chapter 4), we detected that sometimes the participants had
stress while rating because of the short rating window.
Figure 5.3: Test Method for the First Study, adapted from [109].
5.2.2.2 Reduction of Information for the Color Calculation
The second experiment aimed at testing the influence of the reduction of information
(i.e., pixel columns, pixel rows, and/or whole frames) for the automatic color calcula-
tion. The achieved results of this experiment can be used to configure the automatic
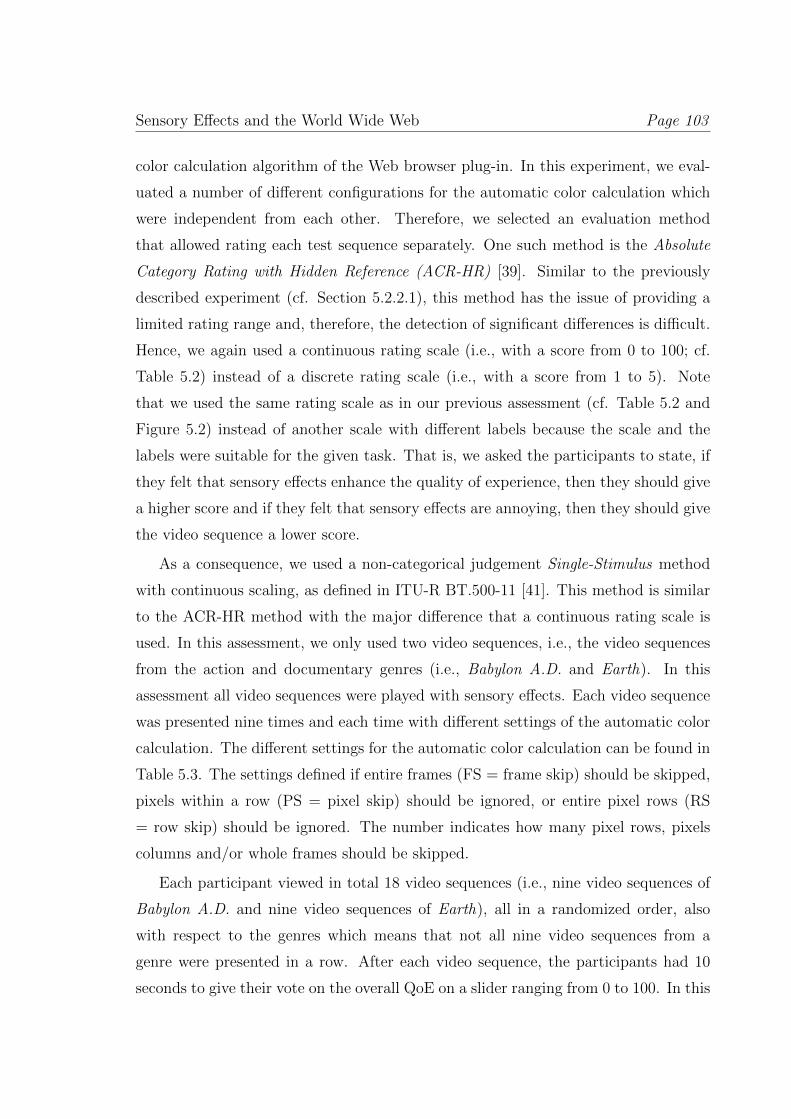
Sensory Effects and the World Wide Web Page 103
color calculation algorithm of the Web browser plug-in. In this experiment, we eval-
uated a number of different configurations for the automatic color calculation which
were independent from each other. Therefore, we selected an evaluation method
that allowed rating each test sequence separately. One such method is the Absolute
Category Rating with Hidden Reference (ACR-HR) [39]. Similar to the previously
described experiment (cf. Section 5.2.2.1), this method has the issue of providing a
limited rating range and, therefore, the detection of significant differences is difficult.
Hence, we again used a continuous rating scale (i.e., with a score from 0 to 100; cf.
Table 5.2) instead of a discrete rating scale (i.e., with a score from 1 to 5). Note
that we used the same rating scale as in our previous assessment (cf. Table 5.2 and
Figure 5.2) instead of another scale with different labels because the scale and the
labels were suitable for the given task. That is, we asked the participants to state, if
they felt that sensory effects enhance the quality of experience, then they should give
a higher score and if they felt that sensory effects are annoying, then they should give
the video sequence a lower score.
As a consequence, we used a non-categorical judgement Single-Stimulus method
with continuous scaling, as defined in ITU-R BT.500-11 [41]. This method is similar
to the ACR-HR method with the major difference that a continuous rating scale is
used. In this assessment, we only used two video sequences, i.e., the video sequences
from the action and documentary genres (i.e., Babylon A.D. and Earth). In this
assessment all video sequences were played with sensory effects. Each video sequence
was presented nine times and each time with different settings of the automatic color
calculation. The different settings for the automatic color calculation can be found in
Table 5.3. The settings defined if entire frames (FS = frame skip) should be skipped,
pixels within a row (PS = pixel skip) should be ignored, or entire pixel rows (RS
= row skip) should be ignored. The number indicates how many pixel rows, pixels
columns and/or whole frames should be skipped.
Each participant viewed in total 18 video sequences (i.e., nine video sequences of
Babylon A.D. and nine video sequences of Earth), all in a randomized order, also
with respect to the genres which means that not all nine video sequences from a
genre were presented in a row. After each video sequence, the participants had 10
seconds to give their vote on the overall QoE on a slider ranging from 0 to 100. In this
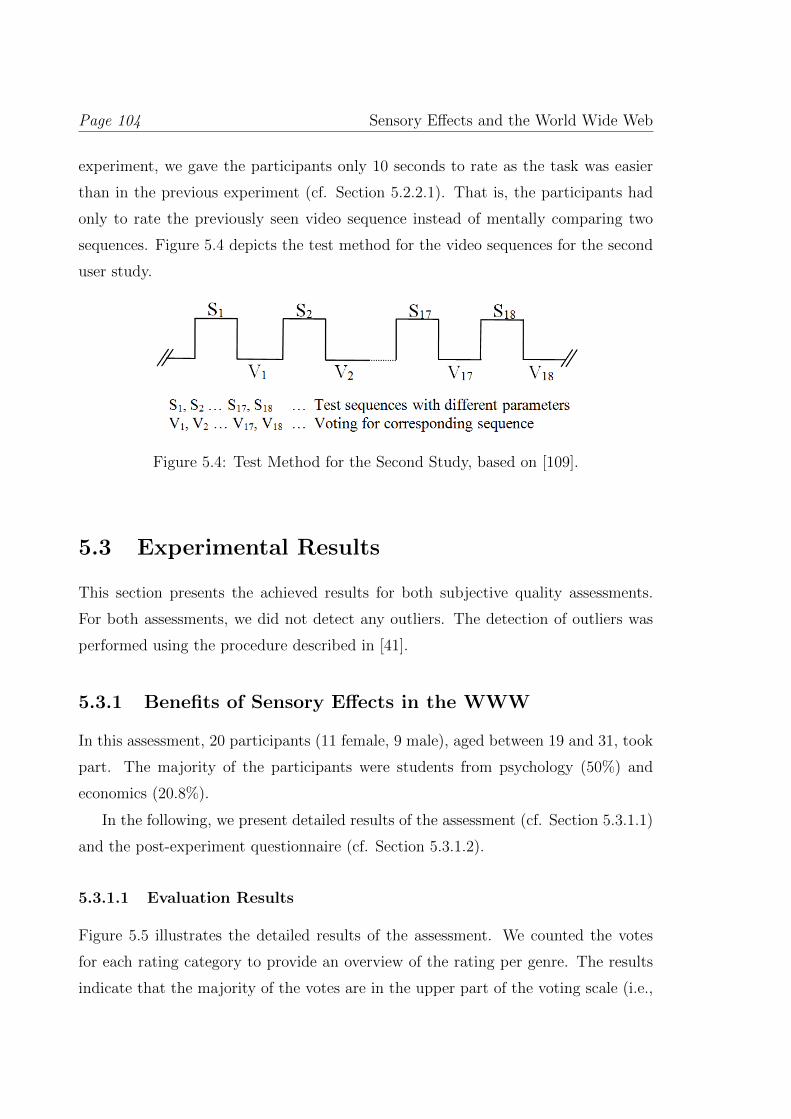
Page 104 Sensory Effects and the World Wide Web
experiment, we gave the participants only 10 seconds to rate as the task was easier
than in the previous experiment (cf. Section 5.2.2.1). That is, the participants had
only to rate the previously seen video sequence instead of mentally comparing two
sequences. Figure 5.4 depicts the test method for the video sequences for the second
user study.
Figure 5.4: Test Method for the Second Study, based on [109].
5.3 Experimental Results
This section presents the achieved results for both subjective quality assessments.
For both assessments, we did not detect any outliers. The detection of outliers was
performed using the procedure described in [41].
5.3.1 Benefits of Sensory Effects in the WWW
In this assessment, 20 participants (11 female, 9 male), aged between 19 and 31, took
part. The majority of the participants were students from psychology (50%) and
economics (20.8%).
In the following, we present detailed results of the assessment (cf. Section 5.3.1.1)
and the post-experiment questionnaire (cf. Section 5.3.1.2).
5.3.1.1 Evaluation Results
Figure 5.5 illustrates the detailed results of the assessment. We counted the votes
for each rating category to provide an overview of the rating per genre. The results
indicate that the majority of the votes are in the upper part of the voting scale (i.e.,
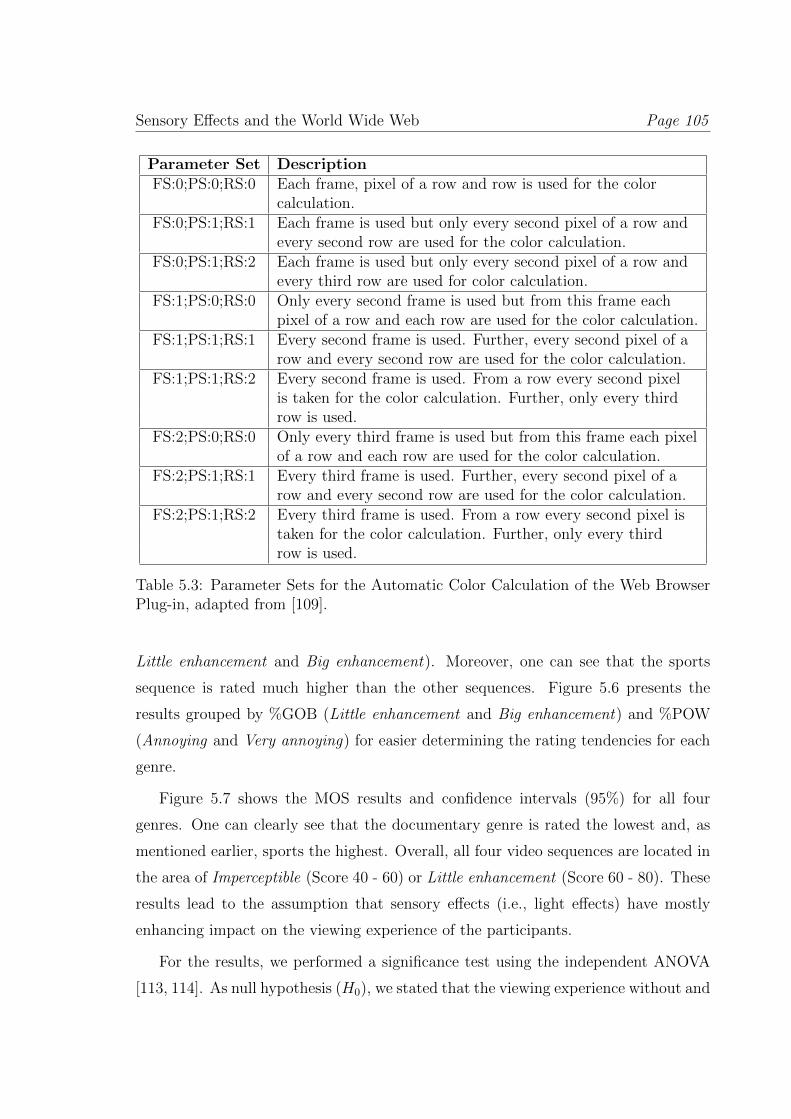
Sensory Effects and the World Wide Web Page 105
Parameter Set DescriptionFS:0;PS:0;RS:0 Each frame, pixel of a row and row is used for the color
calculation.FS:0;PS:1;RS:1 Each frame is used but only every second pixel of a row and
every second row are used for the color calculation.FS:0;PS:1;RS:2 Each frame is used but only every second pixel of a row and
every third row are used for color calculation.FS:1;PS:0;RS:0 Only every second frame is used but from this frame each
pixel of a row and each row are used for the color calculation.FS:1;PS:1;RS:1 Every second frame is used. Further, every second pixel of a
row and every second row are used for the color calculation.FS:1;PS:1;RS:2 Every second frame is used. From a row every second pixel
is taken for the color calculation. Further, only every thirdrow is used.
FS:2;PS:0;RS:0 Only every third frame is used but from this frame each pixelof a row and each row are used for the color calculation.
FS:2;PS:1;RS:1 Every third frame is used. Further, every second pixel of arow and every second row are used for the color calculation.
FS:2;PS:1;RS:2 Every third frame is used. From a row every second pixel istaken for the color calculation. Further, only every thirdrow is used.
Table 5.3: Parameter Sets for the Automatic Color Calculation of the Web BrowserPlug-in, adapted from [109].
Little enhancement and Big enhancement). Moreover, one can see that the sports
sequence is rated much higher than the other sequences. Figure 5.6 presents the
results grouped by %GOB (Little enhancement and Big enhancement) and %POW
(Annoying and Very annoying) for easier determining the rating tendencies for each
genre.
Figure 5.7 shows the MOS results and confidence intervals (95%) for all four
genres. One can clearly see that the documentary genre is rated the lowest and, as
mentioned earlier, sports the highest. Overall, all four video sequences are located in
the area of Imperceptible (Score 40 - 60) or Little enhancement (Score 60 - 80). These
results lead to the assumption that sensory effects (i.e., light effects) have mostly
enhancing impact on the viewing experience of the participants.
For the results, we performed a significance test using the independent ANOVA
[113, 114]. As null hypothesis (H0), we stated that the viewing experience without and
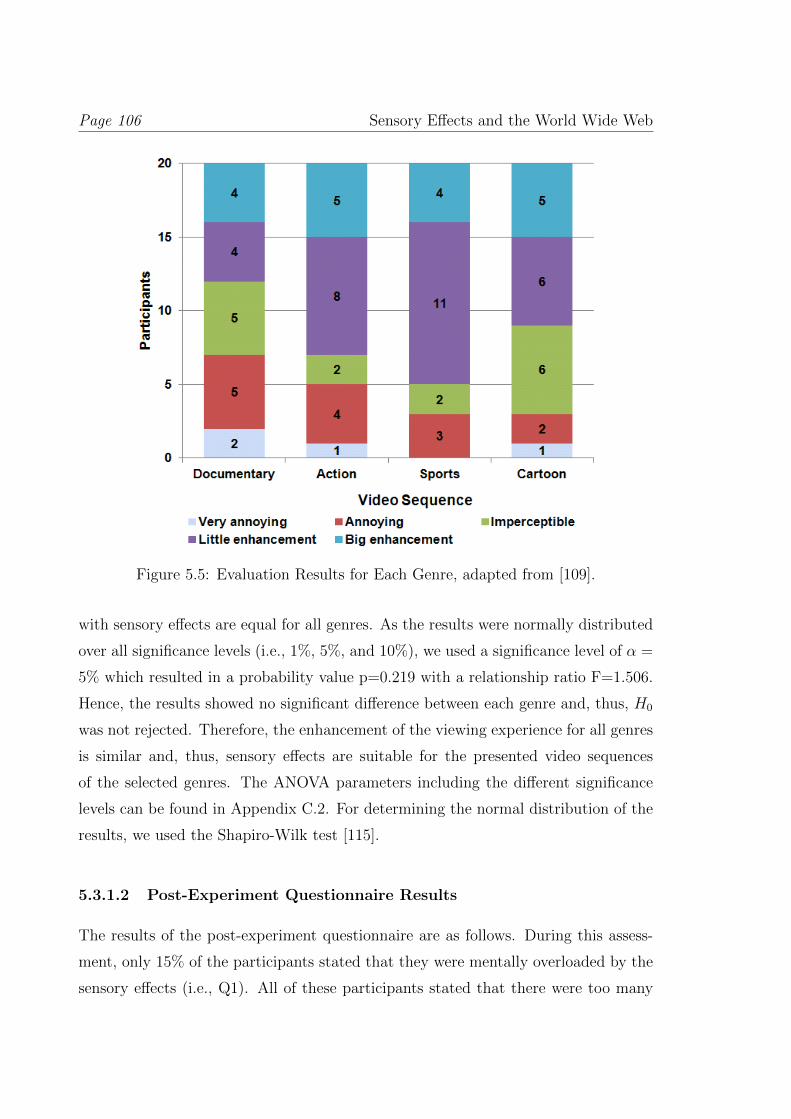
Page 106 Sensory Effects and the World Wide Web
Figure 5.5: Evaluation Results for Each Genre, adapted from [109].
with sensory effects are equal for all genres. As the results were normally distributed
over all significance levels (i.e., 1%, 5%, and 10%), we used a significance level of α =
5% which resulted in a probability value p=0.219 with a relationship ratio F=1.506.
Hence, the results showed no significant difference between each genre and, thus, H0
was not rejected. Therefore, the enhancement of the viewing experience for all genres
is similar and, thus, sensory effects are suitable for the presented video sequences
of the selected genres. The ANOVA parameters including the different significance
levels can be found in Appendix C.2. For determining the normal distribution of the
results, we used the Shapiro-Wilk test [115].
5.3.1.2 Post-Experiment Questionnaire Results
The results of the post-experiment questionnaire are as follows. During this assess-
ment, only 15% of the participants stated that they were mentally overloaded by the
sensory effects (i.e., Q1). All of these participants stated that there were too many
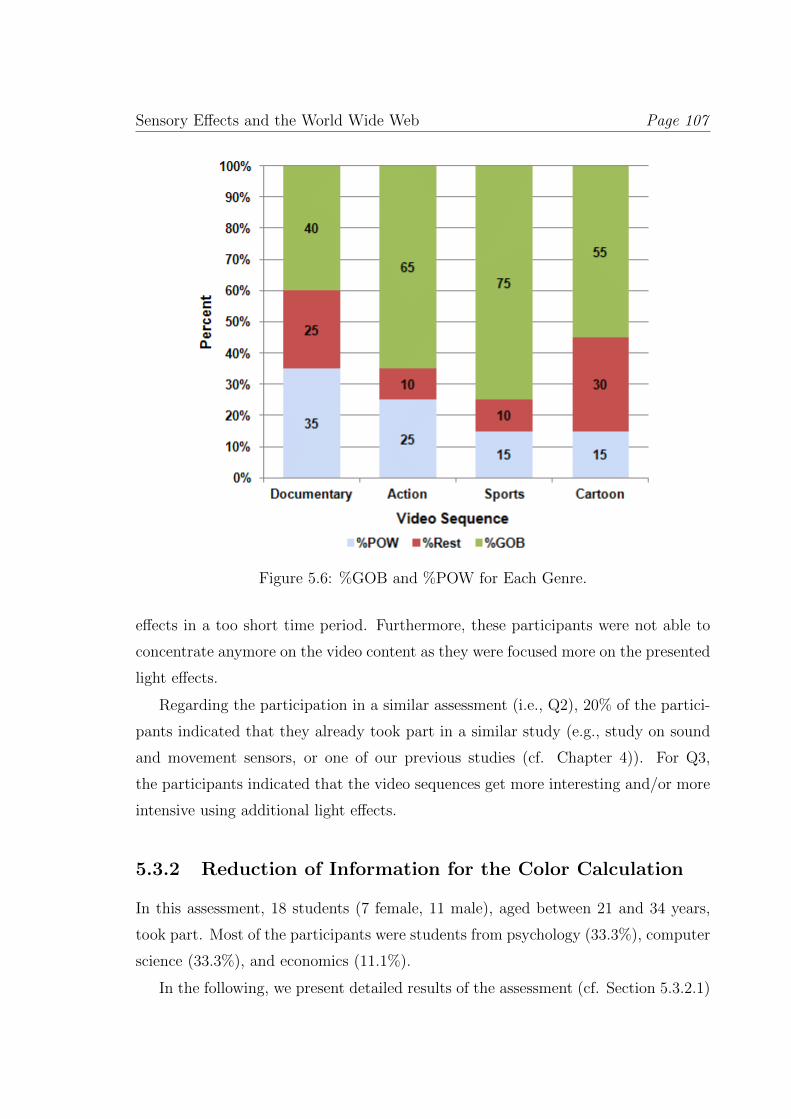
Sensory Effects and the World Wide Web Page 107
Figure 5.6: %GOB and %POW for Each Genre.
effects in a too short time period. Furthermore, these participants were not able to
concentrate anymore on the video content as they were focused more on the presented
light effects.
Regarding the participation in a similar assessment (i.e., Q2), 20% of the partici-
pants indicated that they already took part in a similar study (e.g., study on sound
and movement sensors, or one of our previous studies (cf. Chapter 4)). For Q3,
the participants indicated that the video sequences get more interesting and/or more
intensive using additional light effects.
5.3.2 Reduction of Information for the Color Calculation
In this assessment, 18 students (7 female, 11 male), aged between 21 and 34 years,
took part. Most of the participants were students from psychology (33.3%), computer
science (33.3%), and economics (11.1%).
In the following, we present detailed results of the assessment (cf. Section 5.3.2.1)
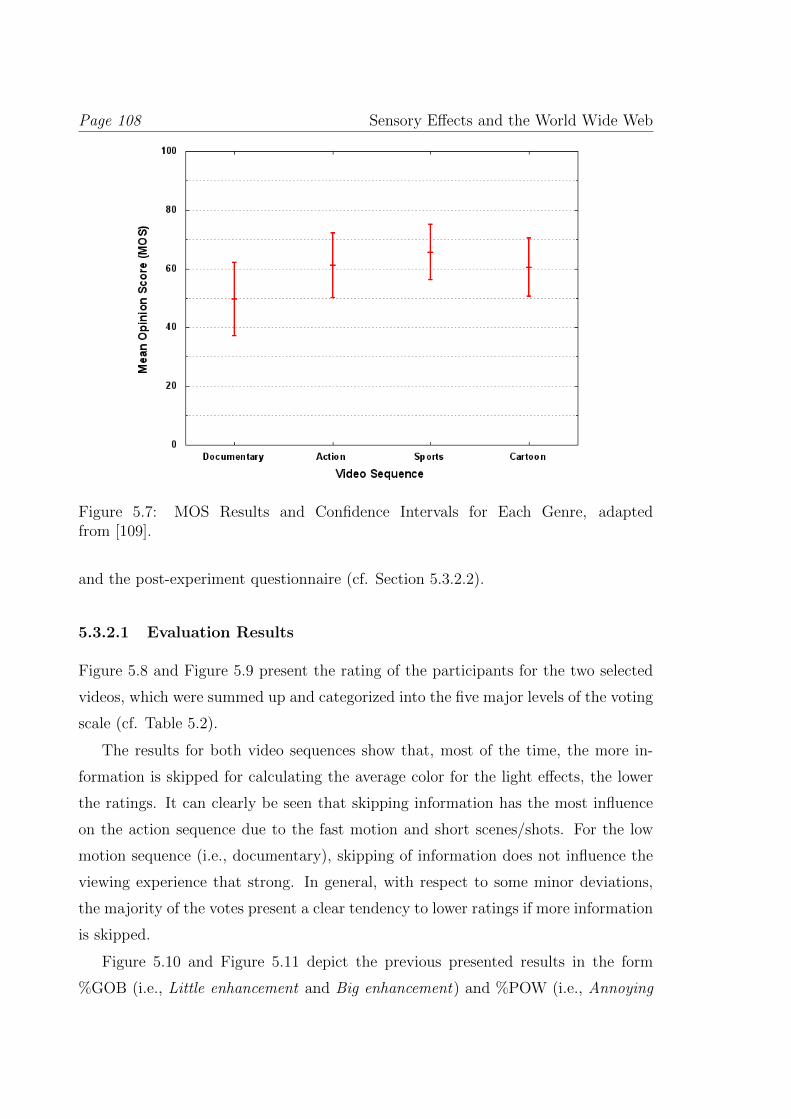
Page 108 Sensory Effects and the World Wide Web
Figure 5.7: MOS Results and Confidence Intervals for Each Genre, adaptedfrom [109].
and the post-experiment questionnaire (cf. Section 5.3.2.2).
5.3.2.1 Evaluation Results
Figure 5.8 and Figure 5.9 present the rating of the participants for the two selected
videos, which were summed up and categorized into the five major levels of the voting
scale (cf. Table 5.2).
The results for both video sequences show that, most of the time, the more in-
formation is skipped for calculating the average color for the light effects, the lower
the ratings. It can clearly be seen that skipping information has the most influence
on the action sequence due to the fast motion and short scenes/shots. For the low
motion sequence (i.e., documentary), skipping of information does not influence the
viewing experience that strong. In general, with respect to some minor deviations,
the majority of the votes present a clear tendency to lower ratings if more information
is skipped.
Figure 5.10 and Figure 5.11 depict the previous presented results in the form
%GOB (i.e., Little enhancement and Big enhancement) and %POW (i.e., Annoying
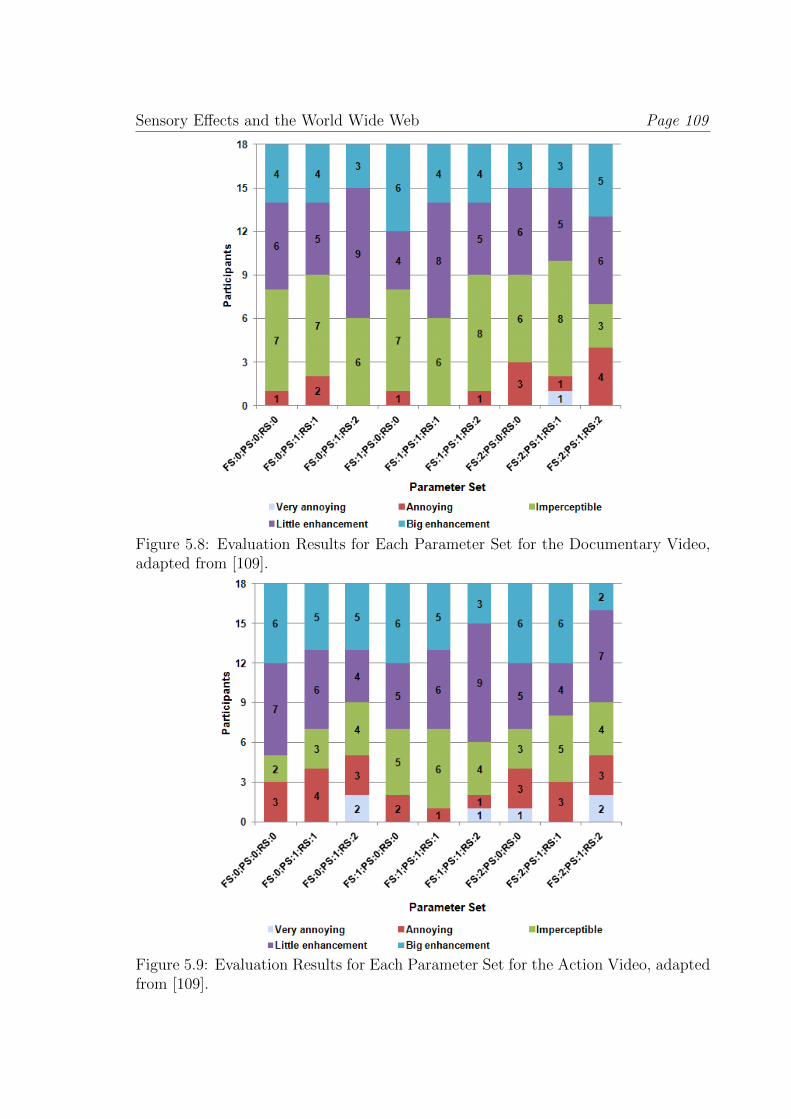
Sensory Effects and the World Wide Web Page 109
Figure 5.8: Evaluation Results for Each Parameter Set for the Documentary Video,adapted from [109].
Figure 5.9: Evaluation Results for Each Parameter Set for the Action Video, adaptedfrom [109].
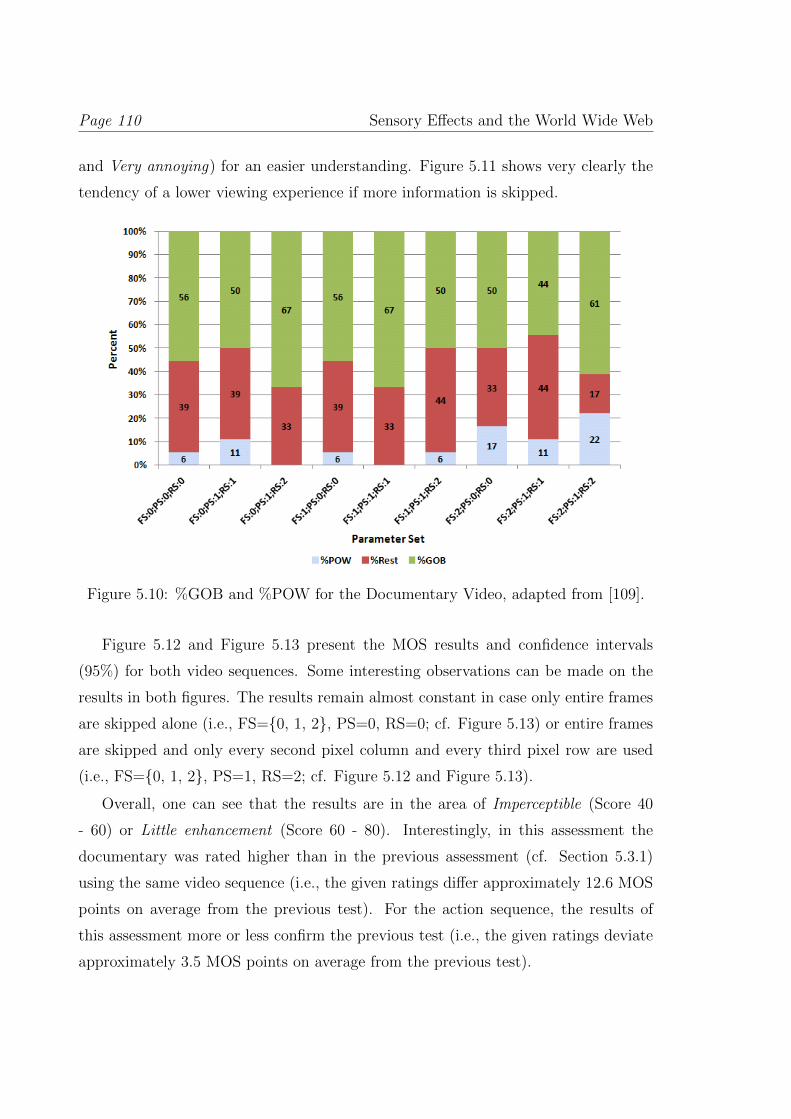
Page 110 Sensory Effects and the World Wide Web
and Very annoying) for an easier understanding. Figure 5.11 shows very clearly the
tendency of a lower viewing experience if more information is skipped.
Figure 5.10: %GOB and %POW for the Documentary Video, adapted from [109].
Figure 5.12 and Figure 5.13 present the MOS results and confidence intervals
(95%) for both video sequences. Some interesting observations can be made on the
results in both figures. The results remain almost constant in case only entire frames
are skipped alone (i.e., FS={0, 1, 2}, PS=0, RS=0; cf. Figure 5.13) or entire frames
are skipped and only every second pixel column and every third pixel row are used
(i.e., FS={0, 1, 2}, PS=1, RS=2; cf. Figure 5.12 and Figure 5.13).
Overall, one can see that the results are in the area of Imperceptible (Score 40
- 60) or Little enhancement (Score 60 - 80). Interestingly, in this assessment the
documentary was rated higher than in the previous assessment (cf. Section 5.3.1)
using the same video sequence (i.e., the given ratings differ approximately 12.6 MOS
points on average from the previous test). For the action sequence, the results of
this assessment more or less confirm the previous test (i.e., the given ratings deviate
approximately 3.5 MOS points on average from the previous test).
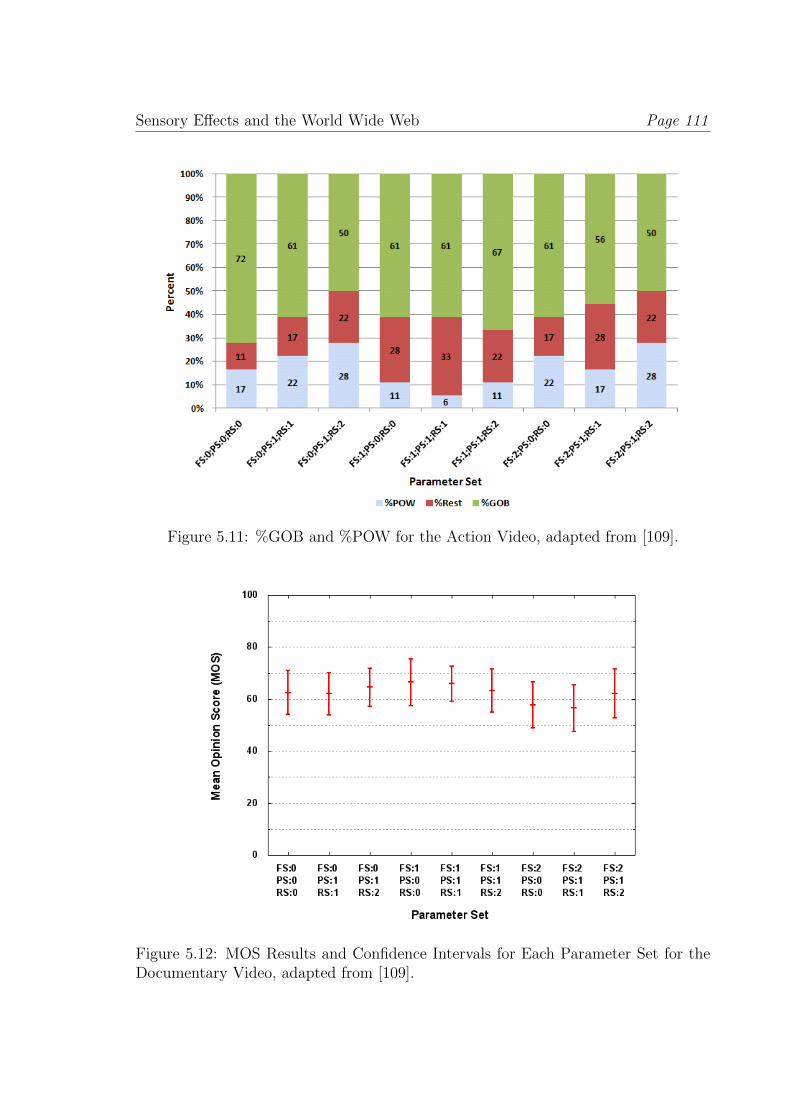
Sensory Effects and the World Wide Web Page 111
Figure 5.11: %GOB and %POW for the Action Video, adapted from [109].
Figure 5.12: MOS Results and Confidence Intervals for Each Parameter Set for theDocumentary Video, adapted from [109].
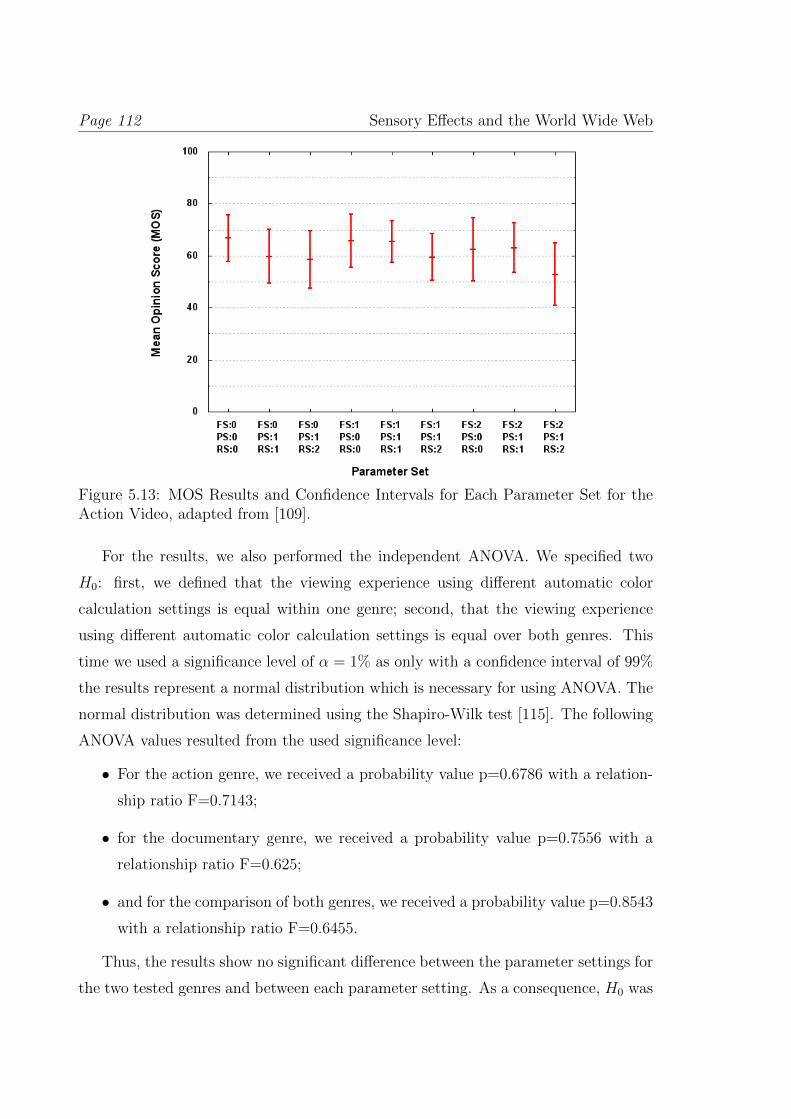
Page 112 Sensory Effects and the World Wide Web
Figure 5.13: MOS Results and Confidence Intervals for Each Parameter Set for theAction Video, adapted from [109].
For the results, we also performed the independent ANOVA. We specified two
H0: first, we defined that the viewing experience using different automatic color
calculation settings is equal within one genre; second, that the viewing experience
using different automatic color calculation settings is equal over both genres. This
time we used a significance level of α = 1% as only with a confidence interval of 99%
the results represent a normal distribution which is necessary for using ANOVA. The
normal distribution was determined using the Shapiro-Wilk test [115]. The following
ANOVA values resulted from the used significance level:
• For the action genre, we received a probability value p=0.6786 with a relation-
ship ratio F=0.7143;
• for the documentary genre, we received a probability value p=0.7556 with a
relationship ratio F=0.625;
• and for the comparison of both genres, we received a probability value p=0.8543
with a relationship ratio F=0.6455.
Thus, the results show no significant difference between the parameter settings for
the two tested genres and between each parameter setting. As a consequence, H0 was
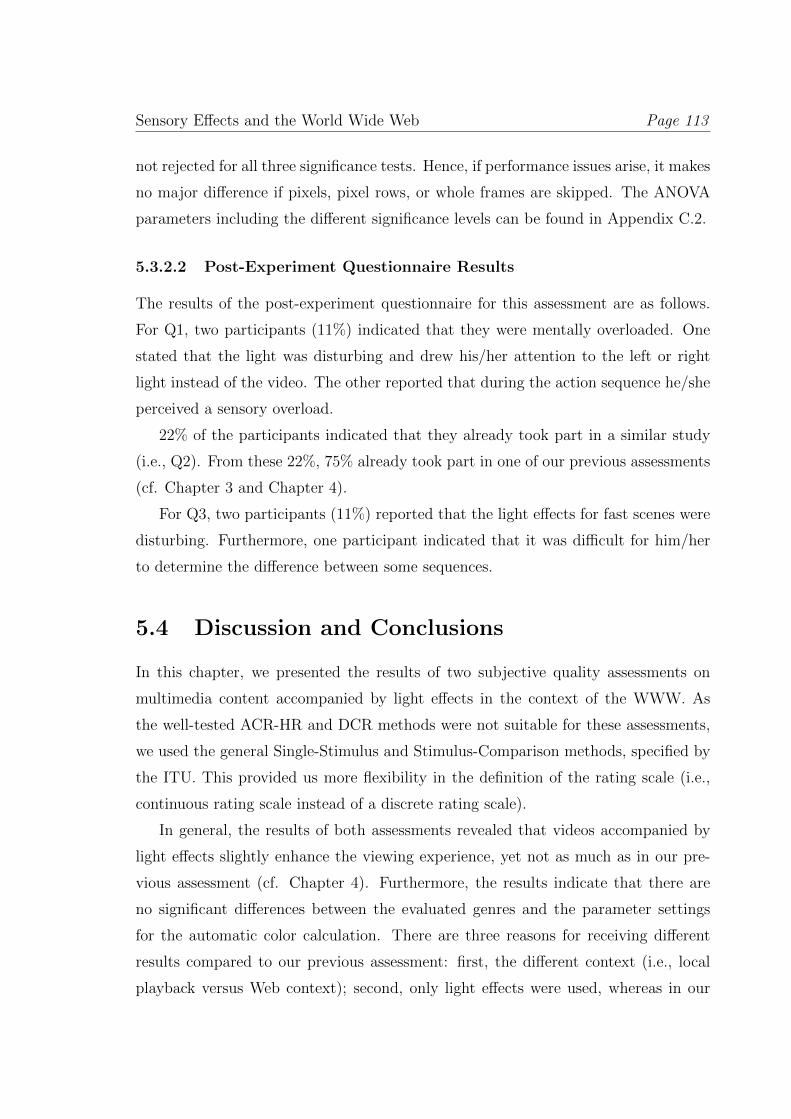
Sensory Effects and the World Wide Web Page 113
not rejected for all three significance tests. Hence, if performance issues arise, it makes
no major difference if pixels, pixel rows, or whole frames are skipped. The ANOVA
parameters including the different significance levels can be found in Appendix C.2.
5.3.2.2 Post-Experiment Questionnaire Results
The results of the post-experiment questionnaire for this assessment are as follows.
For Q1, two participants (11%) indicated that they were mentally overloaded. One
stated that the light was disturbing and drew his/her attention to the left or right
light instead of the video. The other reported that during the action sequence he/she
perceived a sensory overload.
22% of the participants indicated that they already took part in a similar study
(i.e., Q2). From these 22%, 75% already took part in one of our previous assessments
(cf. Chapter 3 and Chapter 4).
For Q3, two participants (11%) reported that the light effects for fast scenes were
disturbing. Furthermore, one participant indicated that it was difficult for him/her
to determine the difference between some sequences.
5.4 Discussion and Conclusions
In this chapter, we presented the results of two subjective quality assessments on
multimedia content accompanied by light effects in the context of the WWW. As
the well-tested ACR-HR and DCR methods were not suitable for these assessments,
we used the general Single-Stimulus and Stimulus-Comparison methods, specified by
the ITU. This provided us more flexibility in the definition of the rating scale (i.e.,
continuous rating scale instead of a discrete rating scale).
In general, the results of both assessments revealed that videos accompanied by
light effects slightly enhance the viewing experience, yet not as much as in our pre-
vious assessment (cf. Chapter 4). Furthermore, the results indicate that there are
no significant differences between the evaluated genres and the parameter settings
for the automatic color calculation. There are three reasons for receiving different
results compared to our previous assessment: first, the different context (i.e., local
playback versus Web context); second, only light effects were used, whereas in our
Page 114 Sensory Effects and the World Wide Web
previous assessment, we used wind, vibration, and light effects. Third, the video se-
quence differed in content and resolution between the two assessments. These reasons
lead to the observation that, in the first assessment (cf. Section 5.3.1), for the docu-
mentary sequence, the enhancement of the viewing experience by sensory effects was
ranked the lowest of all presented video sequences, whereas in our previous assessment
(cf. Chapter 3), the documentary sequence was ranked highest of all presented video
sequences. Thus, we assume that it is necessary to treat different genres differently re-
garding the automatic color calculation. For example, light effects should not change
that frequently if there are many short shots and a lot of shot transitions. Addition-
ally, one reason for the differences in the results to our previous assessment is the used
rating scale. In our previous assessments, we used a discrete rating scale, whereas in
this assessment, we used a continuous rating scale which allowed the participants to
provide more detailed ratings.
Regarding the results of the second assessment, it is surprising that skipping pixel
columns and/or pixel rows influence the viewing experience more than skipping whole
frames. For example, our algorithm uses average color which reacts fast on minor
changes in the available color information. Therefore, if whole frames are skipped,
the currently displayed color persists for a longer time. If pixel columns or pixel
rows are skipped, the average color changes only slightly (e.g., brighter or darker
color tone) or even drastically (e.g., instead of red, a purple color tone is presented).
The achieved results lead to the conclusion that viewers are keener on slower color
transitions and less frequent light changes than having not matching colors if an
average color algorithm is used. As the results show no significant difference between
the different parameter sets, there is no difference which configuration for the color
calculation is used. In contrast, the tendencies of the results indicate that if a client
faces performance issues it is better to reduce the frequency of changing the lights first
(i.e., skipping whole frames). Note that the results achieved are only meaningful for
average color algorithms with the tested parameter sets. If a different algorithm for
the color calculation is selected (e.g., dominant color) or less/more pixels or frames
are extracted from the video, differing results can be achieved.
One interesting observation is the differences in the results between the two set-
tings (i.e, FS={0,2},PS=1,RS=2) of the documentary sequence and the results of
Sensory Effects and the World Wide Web Page 115
the settings that skip less information (i.e., FS={0,2},PS={0,1},RS={0,1}). That is,
the MOS values are not lower than the MOS values where more information for the
color calculation is skipped, instead they are higher (i.e., around 2 to 6 MOS points).
Similarly, for the setting FS=1,PS=0,RS=0, the MOS values are higher (i.e., around
4 MOS points) than without skipping any information for the color calculation. This
may be an indication of the participants remembering the content (i.e., learning effect)
due to long shots/scenes and slow transitions between scenes. Therefore, the partici-
pants have more time to remember the content and light effects for the documentary
sequence than for the action sequence. Hence, we argue that the participants look dif-
ferently at the content and the light effects after multiple repetitions, as indicated for
multimedia content by [96, 97]. As differences in the results are not significant, these
deviations are negligible but need to be taken into account while preparing further
subjective quality assessments (i.e., number of repetitions and shot/scene transitions
of the video content). This observation confirms the results from our previous subjec-
tive quality assessment (cf. Chapter 3). That is, presenting multiple times the same
sequence consisting of long scenes and few shots/scene transitions leads to a strong
learning effect, whereas sequences with short scenes and many shots/scene transitions
do not show a strong learning effect. This can be seen for the Earth sequence in this
chapter and the replication of the Wo ist Klaus? sequence in Chapter 3. The ratings
of the replicated Wo ist Klaus? sequence was higher (i.e., 0.35 MOS points) than the
original sequence. In this chapter, the ratings slightly deviate from the normal rating.
In contrast, the ratings for the Babylon A.D. sequence are consistent over the differ-
ent parameter sets and, thus, no learning effect can be observed which corresponds
with the observation of the Rambo 4 sequence in Chapter 3. The Rambo 4 sequence
showed only a small difference (i.e., 0.05 MOS points) between the original sequence
and the replication which indicates a minor learning effect that is negligible.
General conclusions for both experiments cannot be made as only participants
between the age of 19 and 34 have been evaluated. Therefore, the results achieved in
these experiments are valid for the given age class but for other age classes further
subjective quality assessments are necessary.
Based on the results achieved in this subjective quality assessment, the following
conclusions on the enhancement of the viewing experience using additional sensory
Page 116 Sensory Effects and the World Wide Web
effects in the WWW context can be drawn:
• Sensory effects can improve the viewing experience in the WWW.
• Providing only light effects enhances the viewing experience but not as much
as the combination of multiple sensory effects (i.e., light, wind, and vibration).
• As already detected in our previous assessments, different editing of the se-
quences and, thus, providing scenes with short shots and a lot of transitions
influence the voting behaviour of the participants.
• If performance issues arise, it is advisable to first skip entire frames before
starting to skip pixel columns or entire pixel rows.
CHAPTER
6 Sensory Effects and Emo-
tions
Our previous subjective quality assessments have shown promising results for enhanc-
ing multimedia with sensory effects (cf. Chapter 3) and the usage of sensory effects
in the context of the World Wide Web (cf. Chapter 5). As sensory effects influence
the viewing experience and the perceived video quality, we decided to investigate the
impact of sensory effects on the perceived emotions while watching a movie. Previous
research showed that already the content of a movie can stimulate specific emotions
(e.g., anger, sadness) of a viewer [116]. Hence, we prepared a Web site for conducting
subjective quality assessment which was used for retrieving the perceived emotions
and their intensities while watching video sequences with and without sensory effects
(i.e., wind, vibration, and light). Additionally, we extended this evaluation to assess
the enhancement of the QoE for comparison with our previous assessments.
In our previous assessments, we only had a limited number of participants. For
that reason, we decided to perform a crowdsourced subjective quality assessment to
gain more results. To that end, we performed a number of pre-tests before starting
the crowdsourced assessment. First, we conducted a test check which was to give
us feedback about possible issues with the test setup (e.g., spelling issues, stability
problems). Afterwards, we performed an expert test to retrieve a ground truth which
we wanted to compare with the results from the crowdsourced assessment, thus,
providing a possibility to remove outliers and conduct significance analysis. Finally,
we executed the crowdsourced assessment, unfortunately with poor results. As a
result of announcements that reached around 5000 to 6000 users, only six registered for
the assessment and three finished the assessment. The descriptions of the test setup,
the previously mentioned pre-tests (i.e., test check and expert test), the crowdsourced
assessment and their results are presented in [14].
Due to the problem with the crowdsourced assessment, we performed a subjective
quality assessment together with the Royal Melbourne Institute of Technology (RMIT)
and the University of Wollongong (UoW), both in Australia.
Page 118 Sensory Effects and Emotions
In this chapter, we present the assessments conducted in all three locations and
their results. The chapter is structured as follows. In Section 6.1, we present the
experiment setup at all three locations. Section 6.2 illustrates the results of each
location and the chapter is concluded in Section 6.3.
Note that this chapter is based on the work published in [14] and [117].
6.1 Experiment Methodology
This section presents the test environment for the subjective quality assessment which
was based on ITU-R Rec. BT.500-11 [41]. In particular, we present the number of
participants, the used stimuli and the test environment (cf. Section 6.1.1). Fur-
thermore, we present the used test method and the design of the experiment for
all locations in Section 6.1.2. The results for all locations of the subjective quality
assessment are presented in Section 6.2.
6.1.1 Participants, Stimuli and Test Environment
For the subjective quality assessment, the following number of participants was invited
for each location. At the Alpen-Adria-Universitat Klagenfurt (AAU), Austria, we
invited 26 students (18 female, 8 male) between 20 and 57 years. RMIT invited
21 students and staff members (12 female, 9 male) between 22 and 58 years. UoW
also invited 21 students and staff members (6 female, 15 male) between 22 and 63
years. Only at AAU, one participant already had taken part in a similar subjective
quality assessment; all other participants were not familiar with the evaluation topic.
The number of participants in all three locations produces representative results as
they are in the range of the generally accepted number of participants for producing
valid results [39, 41, 42].
As the range of ages was much higher than in our previous subjective quality
assessments, the representativeness of the results has to be evaluated. Therefore, we
counted the participants’ age for all locations to determine if the results are repre-
sentative, both in a location and over the whole experiment. Thus, we split the ages
in two age classes: from 20 to 40 years and from 40 to 63 years. Note the second age
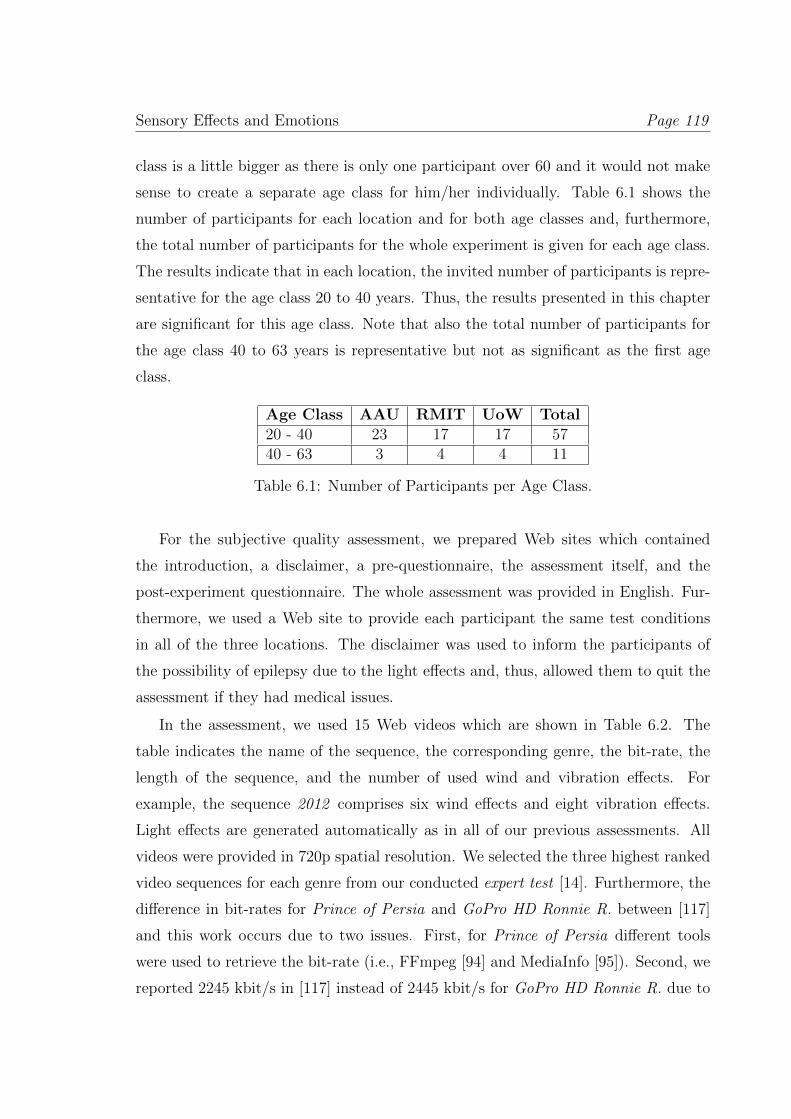
Sensory Effects and Emotions Page 119
class is a little bigger as there is only one participant over 60 and it would not make
sense to create a separate age class for him/her individually. Table 6.1 shows the
number of participants for each location and for both age classes and, furthermore,
the total number of participants for the whole experiment is given for each age class.
The results indicate that in each location, the invited number of participants is repre-
sentative for the age class 20 to 40 years. Thus, the results presented in this chapter
are significant for this age class. Note that also the total number of participants for
the age class 40 to 63 years is representative but not as significant as the first age
class.
Age Class AAU RMIT UoW Total20 - 40 23 17 17 5740 - 63 3 4 4 11
Table 6.1: Number of Participants per Age Class.
For the subjective quality assessment, we prepared Web sites which contained
the introduction, a disclaimer, a pre-questionnaire, the assessment itself, and the
post-experiment questionnaire. The whole assessment was provided in English. Fur-
thermore, we used a Web site to provide each participant the same test conditions
in all of the three locations. The disclaimer was used to inform the participants of
the possibility of epilepsy due to the light effects and, thus, allowed them to quit the
assessment if they had medical issues.
In the assessment, we used 15 Web videos which are shown in Table 6.2. The
table indicates the name of the sequence, the corresponding genre, the bit-rate, the
length of the sequence, and the number of used wind and vibration effects. For
example, the sequence 2012 comprises six wind effects and eight vibration effects.
Light effects are generated automatically as in all of our previous assessments. All
videos were provided in 720p spatial resolution. We selected the three highest ranked
video sequences for each genre from our conducted expert test [14]. Furthermore, the
difference in bit-rates for Prince of Persia and GoPro HD Ronnie R. between [117]
and this work occurs due to two issues. First, for Prince of Persia different tools
were used to retrieve the bit-rate (i.e., FFmpeg [94] and MediaInfo [95]). Second, we
reported 2245 kbit/s in [117] instead of 2445 kbit/s for GoPro HD Ronnie R. due to
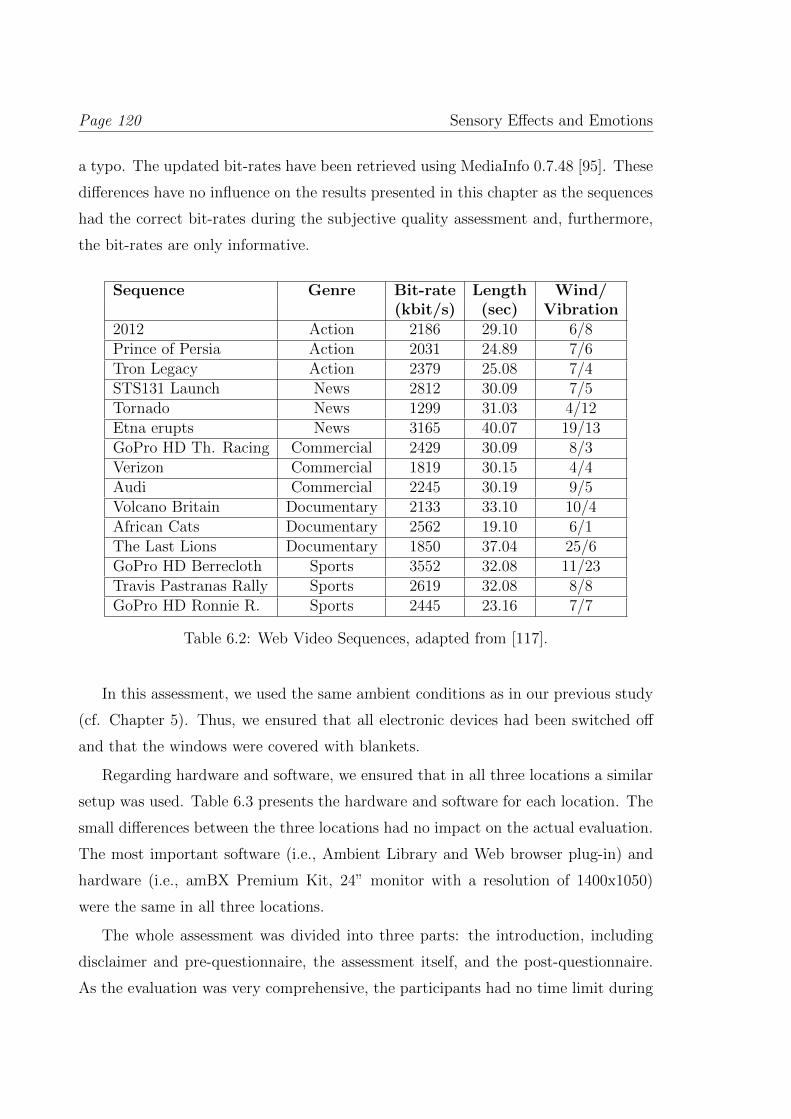
Page 120 Sensory Effects and Emotions
a typo. The updated bit-rates have been retrieved using MediaInfo 0.7.48 [95]. These
differences have no influence on the results presented in this chapter as the sequences
had the correct bit-rates during the subjective quality assessment and, furthermore,
the bit-rates are only informative.
Sequence Genre Bit-rate Length Wind/(kbit/s) (sec) Vibration
2012 Action 2186 29.10 6/8Prince of Persia Action 2031 24.89 7/6Tron Legacy Action 2379 25.08 7/4STS131 Launch News 2812 30.09 7/5Tornado News 1299 31.03 4/12Etna erupts News 3165 40.07 19/13GoPro HD Th. Racing Commercial 2429 30.09 8/3Verizon Commercial 1819 30.15 4/4Audi Commercial 2245 30.19 9/5Volcano Britain Documentary 2133 33.10 10/4African Cats Documentary 2562 19.10 6/1The Last Lions Documentary 1850 37.04 25/6GoPro HD Berrecloth Sports 3552 32.08 11/23Travis Pastranas Rally Sports 2619 32.08 8/8GoPro HD Ronnie R. Sports 2445 23.16 7/7
Table 6.2: Web Video Sequences, adapted from [117].
In this assessment, we used the same ambient conditions as in our previous study
(cf. Chapter 5). Thus, we ensured that all electronic devices had been switched off
and that the windows were covered with blankets.
Regarding hardware and software, we ensured that in all three locations a similar
setup was used. Table 6.3 presents the hardware and software for each location. The
small differences between the three locations had no impact on the actual evaluation.
The most important software (i.e., Ambient Library and Web browser plug-in) and
hardware (i.e., amBX Premium Kit, 24” monitor with a resolution of 1400x1050)
were the same in all three locations.
The whole assessment was divided into three parts: the introduction, including
disclaimer and pre-questionnaire, the assessment itself, and the post-questionnaire.
As the evaluation was very comprehensive, the participants had no time limit during
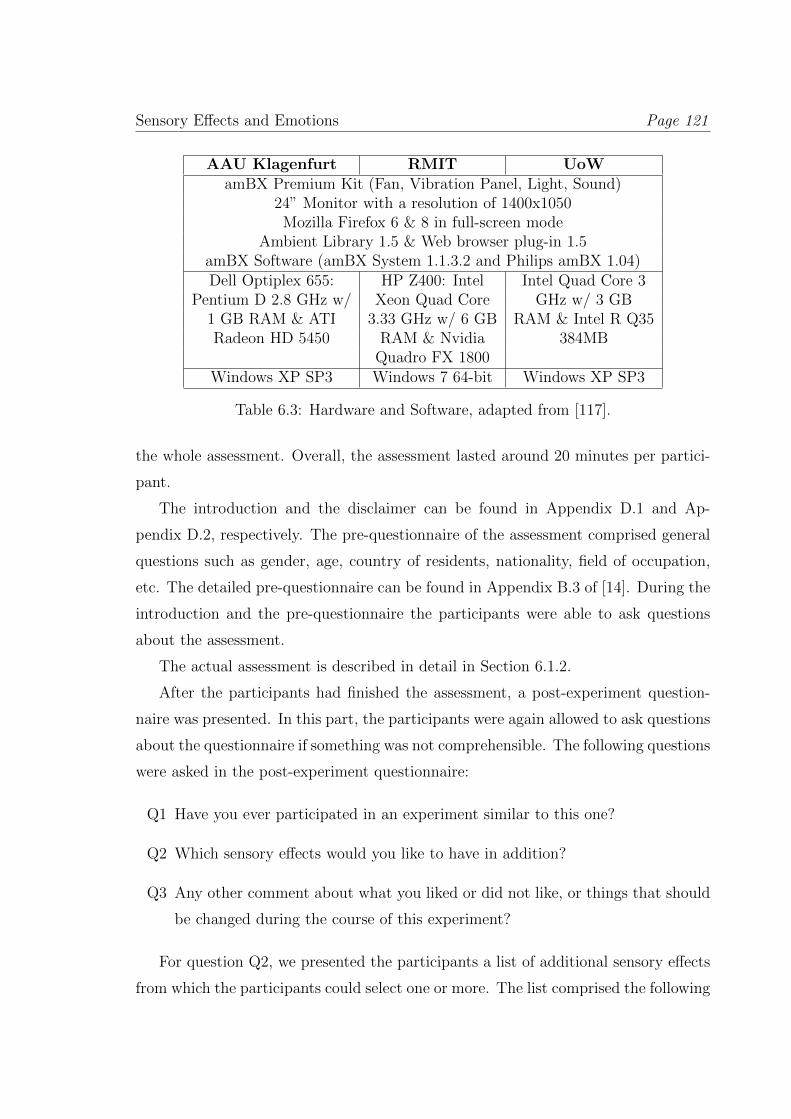
Sensory Effects and Emotions Page 121
AAU Klagenfurt RMIT UoWamBX Premium Kit (Fan, Vibration Panel, Light, Sound)
24” Monitor with a resolution of 1400x1050Mozilla Firefox 6 & 8 in full-screen mode
Ambient Library 1.5 & Web browser plug-in 1.5amBX Software (amBX System 1.1.3.2 and Philips amBX 1.04)Dell Optiplex 655: HP Z400: Intel Intel Quad Core 3
Pentium D 2.8 GHz w/ Xeon Quad Core GHz w/ 3 GB1 GB RAM & ATI 3.33 GHz w/ 6 GB RAM & Intel R Q35Radeon HD 5450 RAM & Nvidia 384MB
Quadro FX 1800Windows XP SP3 Windows 7 64-bit Windows XP SP3
Table 6.3: Hardware and Software, adapted from [117].
the whole assessment. Overall, the assessment lasted around 20 minutes per partici-
pant.
The introduction and the disclaimer can be found in Appendix D.1 and Ap-
pendix D.2, respectively. The pre-questionnaire of the assessment comprised general
questions such as gender, age, country of residents, nationality, field of occupation,
etc. The detailed pre-questionnaire can be found in Appendix B.3 of [14]. During the
introduction and the pre-questionnaire the participants were able to ask questions
about the assessment.
The actual assessment is described in detail in Section 6.1.2.
After the participants had finished the assessment, a post-experiment question-
naire was presented. In this part, the participants were again allowed to ask questions
about the questionnaire if something was not comprehensible. The following questions
were asked in the post-experiment questionnaire:
Q1 Have you ever participated in an experiment similar to this one?
Q2 Which sensory effects would you like to have in addition?
Q3 Any other comment about what you liked or did not like, or things that should
be changed during the course of this experiment?
For question Q2, we presented the participants a list of additional sensory effects
from which the participants could select one or more. The list comprised the following
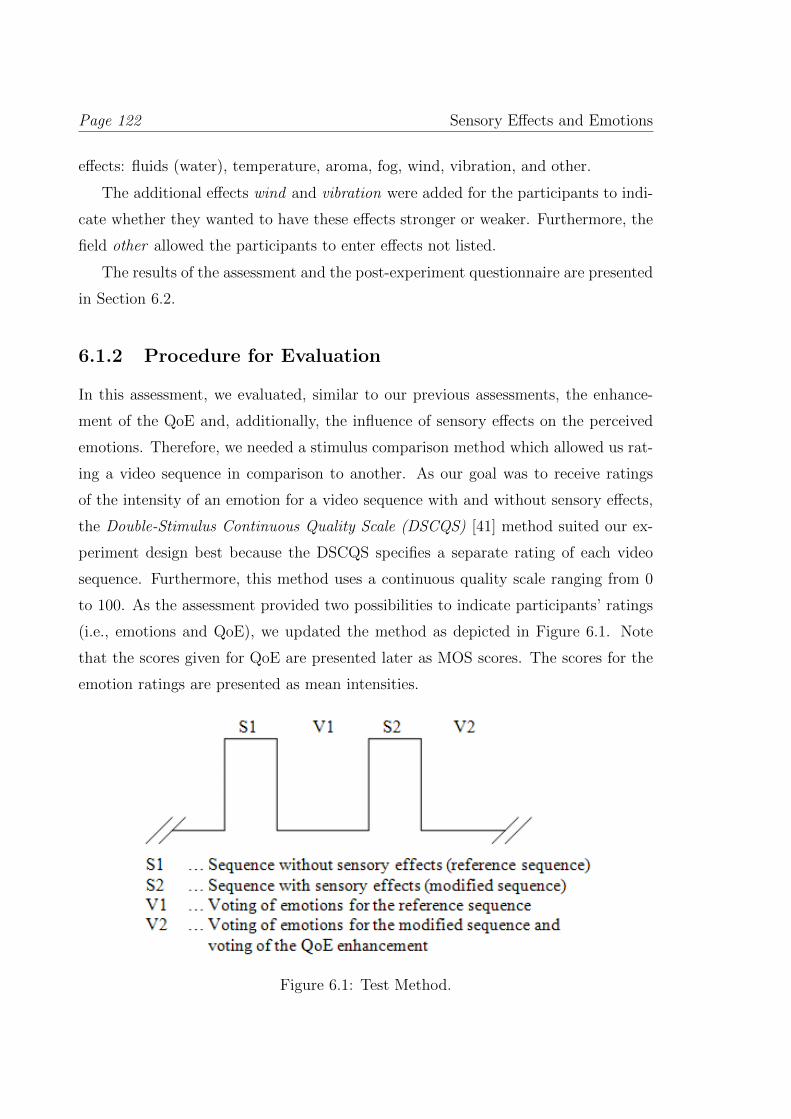
Page 122 Sensory Effects and Emotions
effects: fluids (water), temperature, aroma, fog, wind, vibration, and other.
The additional effects wind and vibration were added for the participants to indi-
cate whether they wanted to have these effects stronger or weaker. Furthermore, the
field other allowed the participants to enter effects not listed.
The results of the assessment and the post-experiment questionnaire are presented
in Section 6.2.
6.1.2 Procedure for Evaluation
In this assessment, we evaluated, similar to our previous assessments, the enhance-
ment of the QoE and, additionally, the influence of sensory effects on the perceived
emotions. Therefore, we needed a stimulus comparison method which allowed us rat-
ing a video sequence in comparison to another. As our goal was to receive ratings
of the intensity of an emotion for a video sequence with and without sensory effects,
the Double-Stimulus Continuous Quality Scale (DSCQS) [41] method suited our ex-
periment design best because the DSCQS specifies a separate rating of each video
sequence. Furthermore, this method uses a continuous quality scale ranging from 0
to 100. As the assessment provided two possibilities to indicate participants’ ratings
(i.e., emotions and QoE), we updated the method as depicted in Figure 6.1. Note
that the scores given for QoE are presented later as MOS scores. The scores for the
emotion ratings are presented as mean intensities.
Figure 6.1: Test Method.
Sensory Effects and Emotions Page 123
First, the participants saw a video sequence without sensory effects (i.e., S1).
Afterwards, the participant had to select and rate one or more perceived emotions
from a list of selectable emotions (i.e., V1). The list of emotions was based on
the emotions presented in [118]. For completeness, we present the list in Table 6.4.
Additionally, the table includes the type of the emotion, i.e., if the emotion is active or
passive. More information about these types of emotions can be found in [119]. Note
that there is no general agreement on the definition of active and passive emotions.
Spinoza [119] defines active emotions as emotions that are related to the mind and,
therefore, they are active if the mind acts. A passive emotion is an emotion of the soul
and, thus, always needs an external cause to produce the emotion. Jerome Neu [120]
argues that the type of an emotion may be active or passive in particular cases. For
example, in the case of love it is active if it is directed to something/someone instead of
a specific detail. Additionally, he defines active and passive as follows: ”Active/passive
corresponds to the distinction between what one does and what happens to one.” [120].
In this work, we follow the definition of Jerome Neu [120] as it is, to the best
of our knowledge, the best matching interpretation of active and passive emotions.
Thus, others may rate the emotions differently depending on the use case. In our
case, we rate the type of emotion with respect to the presented videos. Therefore,
we define an active emotion as an emotion where the participant has feelings towards
the video content. For example, the participant feels hate against something/someone
or worries about something/someone in the video. On the other hand, we define a
passive emotion as an emotion where the video content influences the participant. For
example, the video is perceived as disgusting by the participant or the video bores
the participant. From these definitions of active and passive emotions, we derived the
types of emotion shown in Table 6.4.
After selecting an emotion, the participants had to state the intensity of the
emotion using a slider ranging from 0 (very weak) to 100 (very strong/overwhelming).
Note that the DSCQS method defines different labels for rating a video sequence which
we changed. This was possible, as discussed in earlier chapters, due to the reason
that evaluations have shown that changing labels did not influence the results [88, 89].
Moreover, the ITU [41] indicates that the labels presented in the DSCQS are only for
guidance, i.e., the participants know which direction on the rating scale is poor and
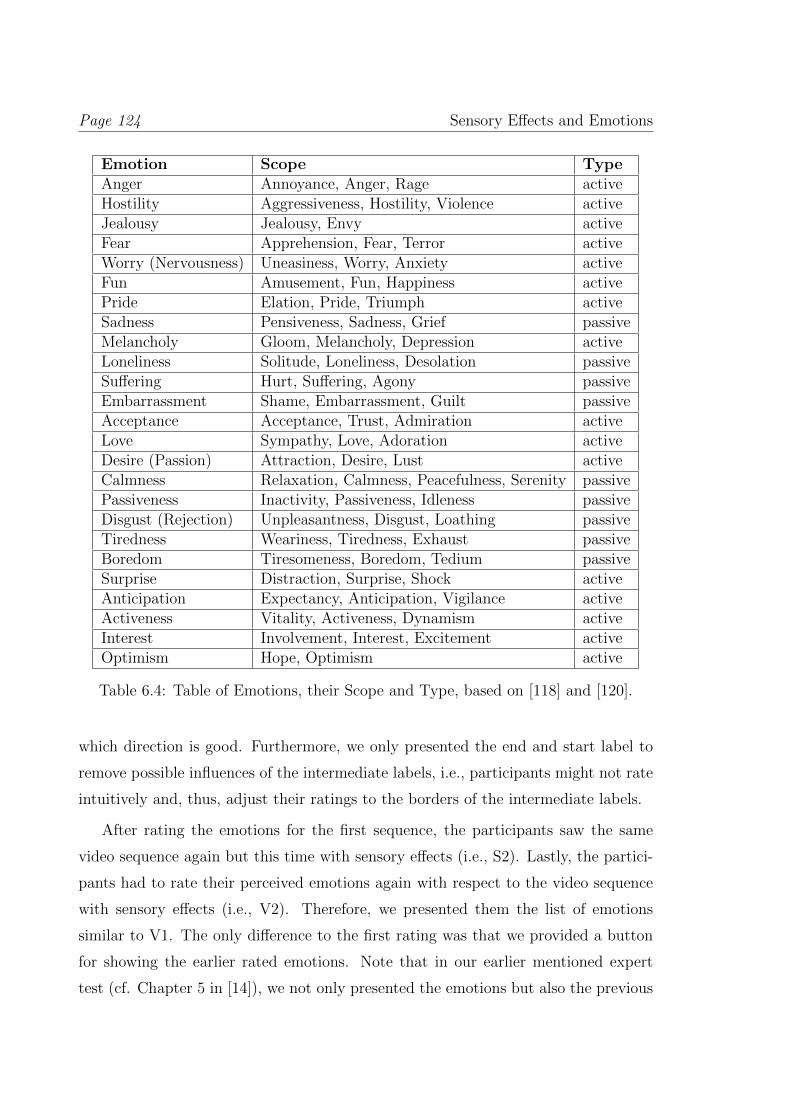
Page 124 Sensory Effects and Emotions
Emotion Scope TypeAnger Annoyance, Anger, Rage activeHostility Aggressiveness, Hostility, Violence activeJealousy Jealousy, Envy activeFear Apprehension, Fear, Terror activeWorry (Nervousness) Uneasiness, Worry, Anxiety activeFun Amusement, Fun, Happiness activePride Elation, Pride, Triumph activeSadness Pensiveness, Sadness, Grief passiveMelancholy Gloom, Melancholy, Depression activeLoneliness Solitude, Loneliness, Desolation passiveSuffering Hurt, Suffering, Agony passiveEmbarrassment Shame, Embarrassment, Guilt passiveAcceptance Acceptance, Trust, Admiration activeLove Sympathy, Love, Adoration activeDesire (Passion) Attraction, Desire, Lust activeCalmness Relaxation, Calmness, Peacefulness, Serenity passivePassiveness Inactivity, Passiveness, Idleness passiveDisgust (Rejection) Unpleasantness, Disgust, Loathing passiveTiredness Weariness, Tiredness, Exhaust passiveBoredom Tiresomeness, Boredom, Tedium passiveSurprise Distraction, Surprise, Shock activeAnticipation Expectancy, Anticipation, Vigilance activeActiveness Vitality, Activeness, Dynamism activeInterest Involvement, Interest, Excitement activeOptimism Hope, Optimism active
Table 6.4: Table of Emotions, their Scope and Type, based on [118] and [120].
which direction is good. Furthermore, we only presented the end and start label to
remove possible influences of the intermediate labels, i.e., participants might not rate
intuitively and, thus, adjust their ratings to the borders of the intermediate labels.
After rating the emotions for the first sequence, the participants saw the same
video sequence again but this time with sensory effects (i.e., S2). Lastly, the partici-
pants had to rate their perceived emotions again with respect to the video sequence
with sensory effects (i.e., V2). Therefore, we presented them the list of emotions
similar to V1. The only difference to the first rating was that we provided a button
for showing the earlier rated emotions. Note that in our earlier mentioned expert
test (cf. Chapter 5 in [14]), we not only presented the emotions but also the previous
Sensory Effects and Emotions Page 125
given intensity ratings. The expert tests illustrated that showing the intensity of
the previously stated emotions biased the participants. Therefore, during the final
assessment only the earlier stated emotions were presented and the intensity was set
to the center (i.e., neutral) position.
Additionally, during the second rating (i.e., V2), the participants had to indicate
the enhancement of the QoE similar to our previous studies (cf. Chapter 5). To that
end, the participants had a slider on which they had to indicate the enhancement of
the QoE for the video with sensory effects compared to the video without sensory
effects. The slider ranged from 0 (very annoying) to 100 (big enhancement) but again
only the end and start labels were presented. One may argue that this extension (i.e.,
two ratings at a time) has a negative impact on the achieved results but we did not
detect any influence in the participants’ ratings. Such an influence would be visible
by strongly differing ratings and appearing outliers which was not the case in this
assessment (cf. Section 6.2).
The participants had no time limit during both rating periods (i.e., V1 and V2).
We did not set a time limit for providing ratings due to the number of possible
emotions. If we would have set a time limit, the participants might not have given
their perceived emotions and their intensity correctly. Moreover, the time limit would
have resulted in stress for the participants and, hence, unreliable results might have
been given.
Standardized evaluation methods indicate that the visible background (i.e., area
not occupied by the video) should be set to grey but in this study, we set the back-
ground to black. The reason for this modification was that only a small area of the
screen was not occupied by the video due to using higher resolutions and, thus, the
grey background would have distracted the participants. Furthermore, the browser
was set to full screen mode to prevent distraction by the menu bar and the browser
icons.
Page 126 Sensory Effects and Emotions
6.2 Experimental Results
This section presents the achieved results of the subjective quality assessment con-
ducted in all three locations. For all locations, we performed outlier detection, ac-
cording to [41]. The outlier detection did not produce any outliers with respect to
the QoE results. For the emotions, we detected some outliers. The detection and
removal of emotion outliers was done using a modified z -score with the median ab-
solute deviation (MAD) estimator and a threshold of 3.5 as presented in [117, 121].
Note that these outliers only influenced the outcome of the emotion ratings but not
the QoE ratings. Thus, not all ratings of the specific participant were removed, only
ratings of the emotions which were detected as outliers were removed from the set of
results.
The goals of this assessment were to determine if there were significant differences
in the QoE enhancement for viewers belonging to different nationalities and whether
sensory effects had an impact on the emotions perceived by a viewer.
6.2.1 Results of the QoE Evaluation
As stated before, we asked the participants to rate the enhancement of the view-
ing experience for the video sequence with sensory effects with respect to the video
sequence without sensory effects.
Figure 6.2 illustrates the MOS results and confidence intervals (95%) of each
video for all three locations (i.e., AAU, RMIT, and UoW). One can see that nearly
all sequences are rated equally high, except, the documentary sequences and one news
sequence which are rated differently. In particular, the news sequence Etna Erupts
is rated pretty low by AAU. One explanation for this low rating is the presented
content. This is encouraged by the results of the second volcano eruption (i.e., the
documentary sequence Volcano Britain) because the QoE rating of this sequence is
much higher (i.e., around 23 MOS points). Consequently, one explanation is that
the participants at AAU preferred the documentary sequence Volcano Britain due to
the content showing a lot more action (i.e., erruptions of the volcano) than the news
sequence Etna Erupts which presents mainly flowing magma and geologists looking
at the volcano. Overall, the ratings in all three locations are very similar due to the
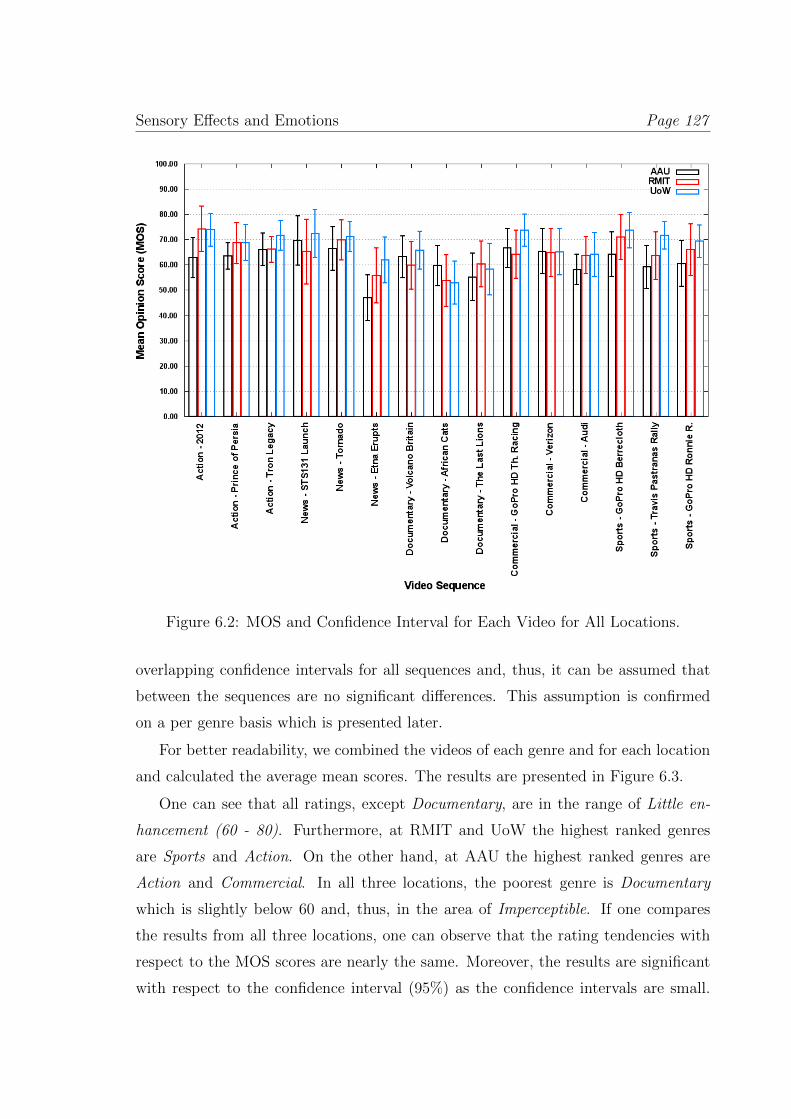
Sensory Effects and Emotions Page 127
Figure 6.2: MOS and Confidence Interval for Each Video for All Locations.
overlapping confidence intervals for all sequences and, thus, it can be assumed that
between the sequences are no significant differences. This assumption is confirmed
on a per genre basis which is presented later.
For better readability, we combined the videos of each genre and for each location
and calculated the average mean scores. The results are presented in Figure 6.3.
One can see that all ratings, except Documentary, are in the range of Little en-
hancement (60 - 80). Furthermore, at RMIT and UoW the highest ranked genres
are Sports and Action. On the other hand, at AAU the highest ranked genres are
Action and Commercial. In all three locations, the poorest genre is Documentary
which is slightly below 60 and, thus, in the area of Imperceptible. If one compares
the results from all three locations, one can observe that the rating tendencies with
respect to the MOS scores are nearly the same. Moreover, the results are significant
with respect to the confidence interval (95%) as the confidence intervals are small.
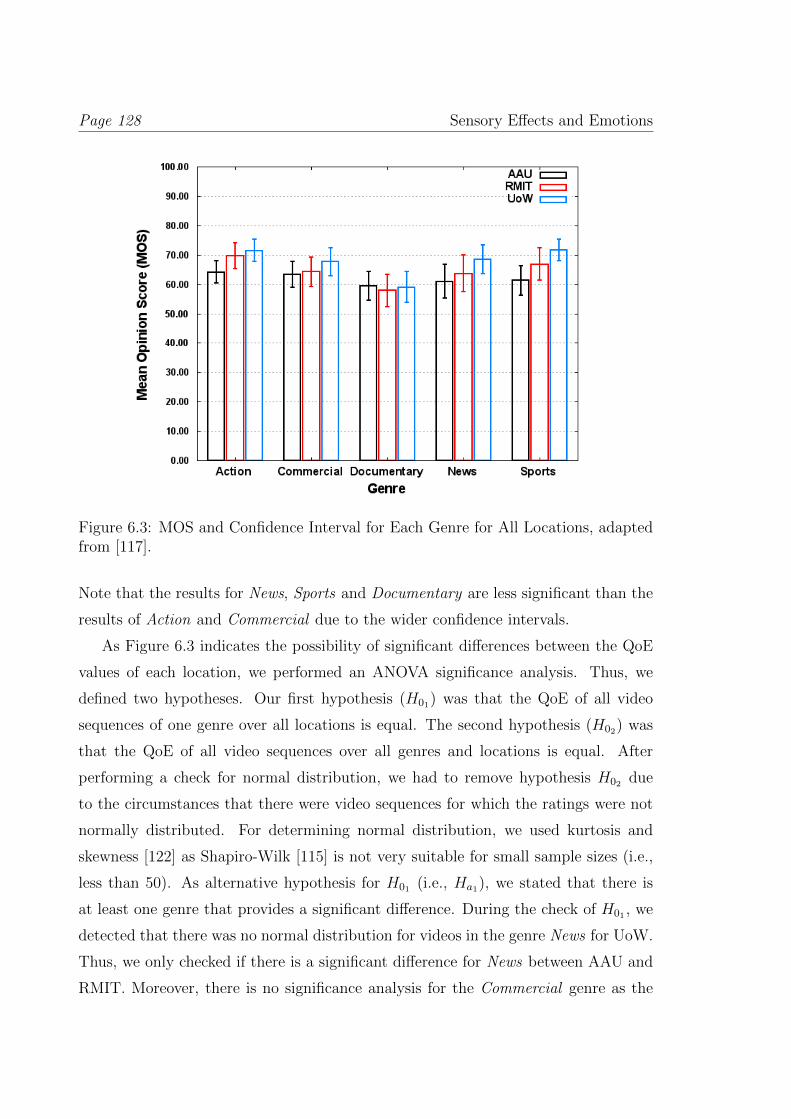
Page 128 Sensory Effects and Emotions
Figure 6.3: MOS and Confidence Interval for Each Genre for All Locations, adaptedfrom [117].
Note that the results for News, Sports and Documentary are less significant than the
results of Action and Commercial due to the wider confidence intervals.
As Figure 6.3 indicates the possibility of significant differences between the QoE
values of each location, we performed an ANOVA significance analysis. Thus, we
defined two hypotheses. Our first hypothesis (H01) was that the QoE of all video
sequences of one genre over all locations is equal. The second hypothesis (H02) was
that the QoE of all video sequences over all genres and locations is equal. After
performing a check for normal distribution, we had to remove hypothesis H02 due
to the circumstances that there were video sequences for which the ratings were not
normally distributed. For determining normal distribution, we used kurtosis and
skewness [122] as Shapiro-Wilk [115] is not very suitable for small sample sizes (i.e.,
less than 50). As alternative hypothesis for H01 (i.e., Ha1), we stated that there is
at least one genre that provides a significant difference. During the check of H01 , we
detected that there was no normal distribution for videos in the genre News for UoW.
Thus, we only checked if there is a significant difference for News between AAU and
RMIT. Moreover, there is no significance analysis for the Commercial genre as the
Sensory Effects and Emotions Page 129
ratings from AAU and UoW were not normally distributed.
The ANOVAs for H01 revealed that there are significant differences in the results
for the genre Sports and Action and, therefore, we rejected H01 and performed Ha1 .
The conducted analyses for proving Ha1 showed that there is a significant difference
for the Action and Sports genre with a p-value of 0.0086 and 0.0023, respectively.
The significant difference was detected in the two genres between the locations AAU
and UoW. Hence, there are demographical differences between AAU and UoW, but
the RMIT results showed no significant differences and, thus, it cannot be stated
that there are really significant demographical difference. The tables of the ANOVA
calculations can be found in Appendix D.3.1.
6.2.2 Results of the Emotion Evaluation
In this section, we present the results of the evaluation on the perceived emotions
without sensory effects (WoE) and with sensory effects (WE). In Figure 6.4, Fig-
ure 6.5, and Figure 6.6 all indicated emotions for all video sequences with their mean
intensity and significance values (p-values of the Student’s t-test) are shown for each
location. The average intensity was calculated as shown in Equation 6.1.
AvgEmotioni =
N∑n=1
Intensityn
N(6.1)
For an emotion i (e.g., anger), all given ratings (N) are extracted and the indicated
intensity of each rating (Intensityn) was summed up and divided by the number
of stated ratings. This procedure is performed for all emotions. Note that only
emotions are presented for which at least four ratings were given. Emotions with
lower than four ratings provide no valid results (i.e., the results cannot be regarded
as relevant), similar to the number of necessary participants for a subjective quality
assessment [41, 42].
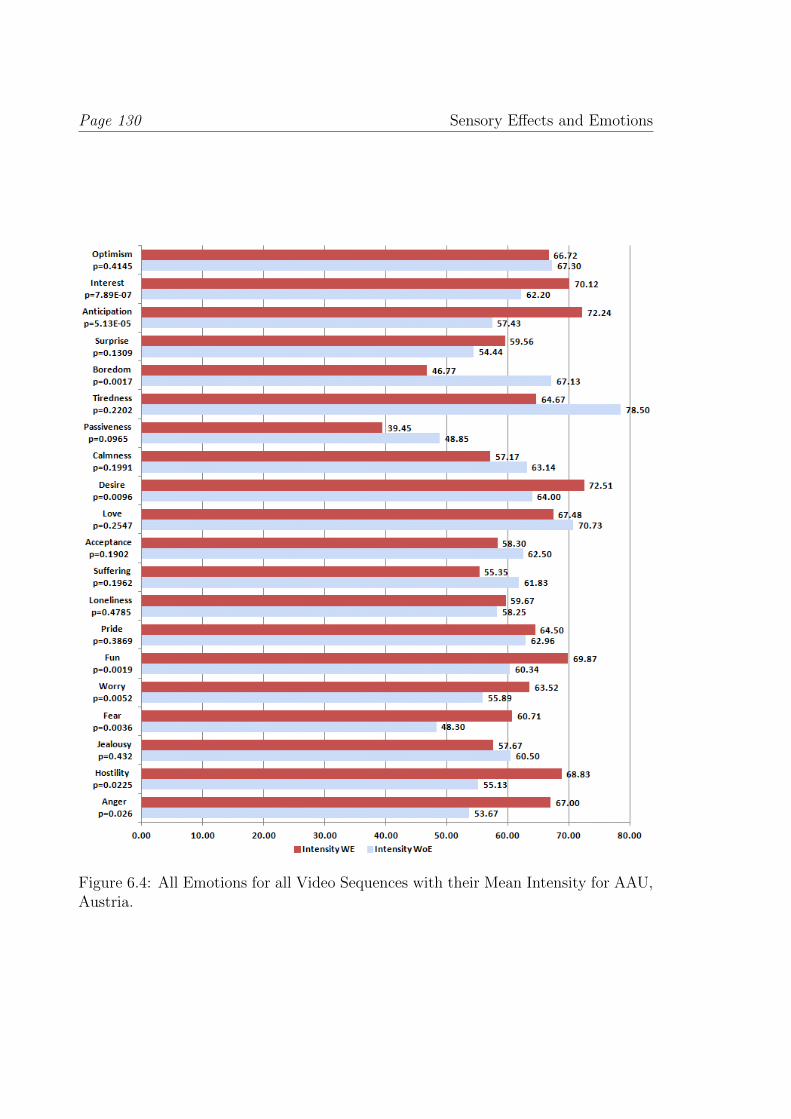
Page 130 Sensory Effects and Emotions
Figure 6.4: All Emotions for all Video Sequences with their Mean Intensity for AAU,Austria.
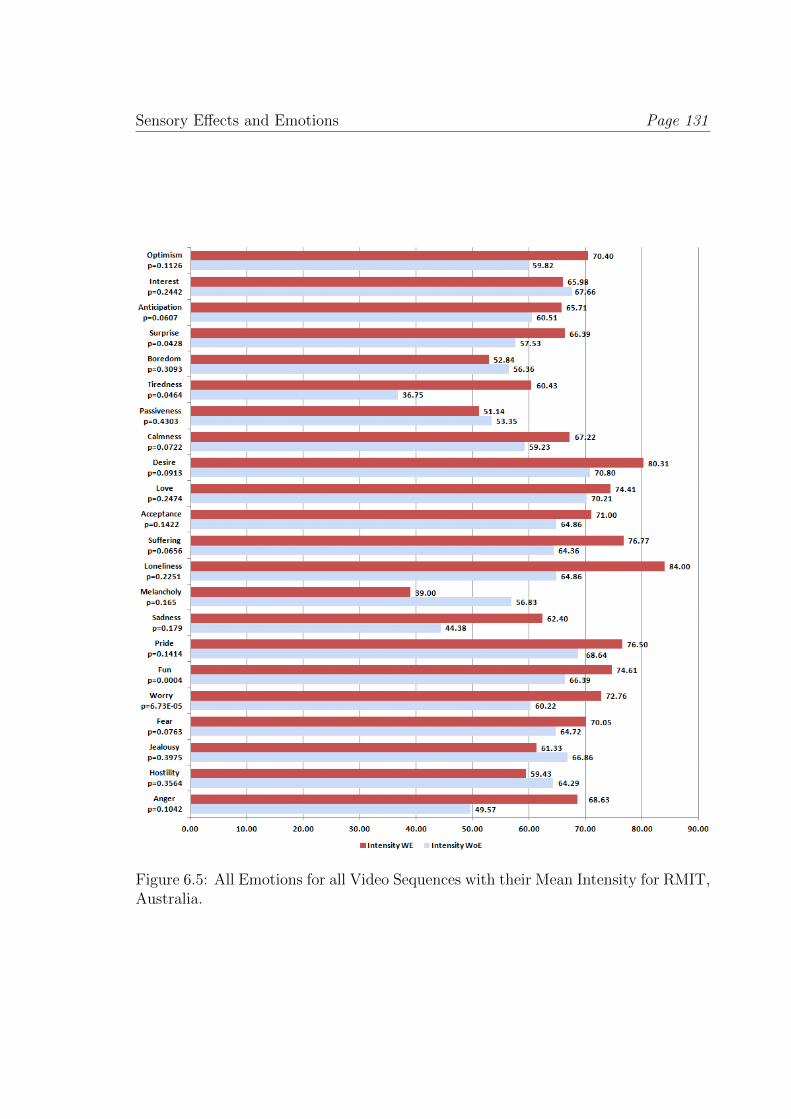
Sensory Effects and Emotions Page 131
Figure 6.5: All Emotions for all Video Sequences with their Mean Intensity for RMIT,Australia.
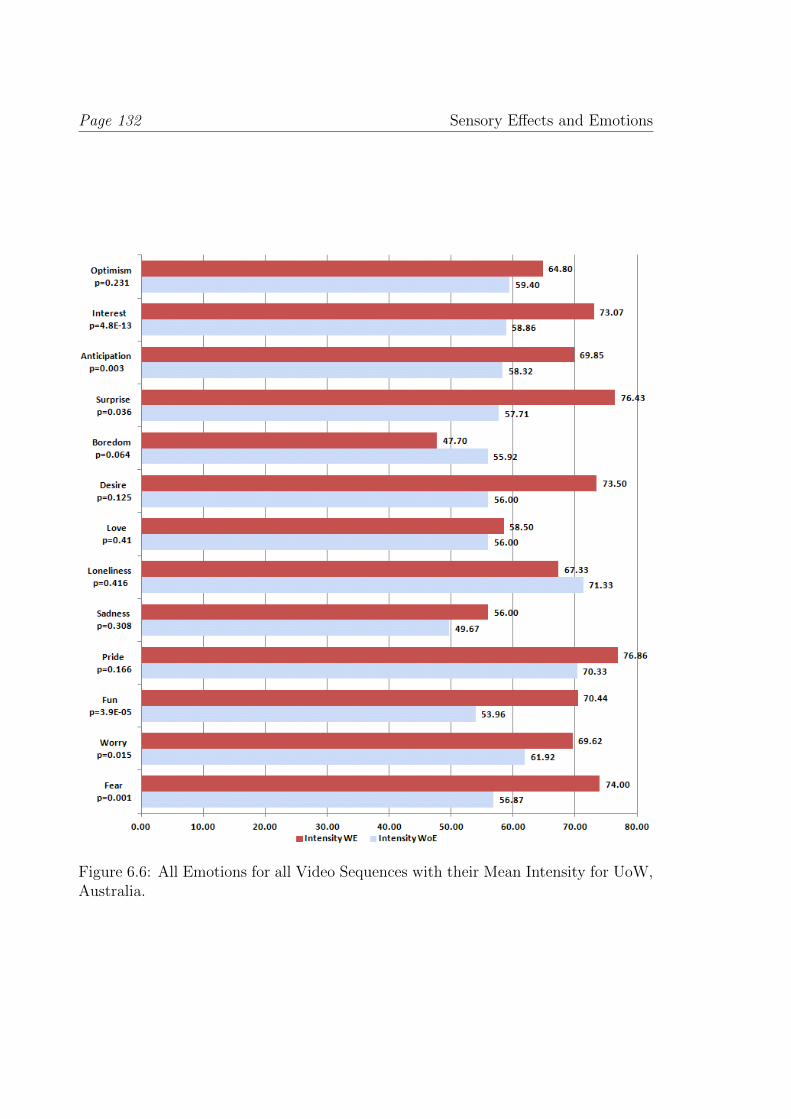
Page 132 Sensory Effects and Emotions
Figure 6.6: All Emotions for all Video Sequences with their Mean Intensity for UoW,Australia.
Sensory Effects and Emotions Page 133
One can see that in each location a large number of emotions had occurred during
the consumption of videos without and with sensory effects. The large number of
emotions led us to the assumption that there have to be significant differences between
the emotions without and with sensory effects and, hence, we performed a one-sided
Student’s t-test [114, 123]. Note that we did not use the ANOVA analysis since the
variances between the emotions without and with sensory effects differed too much.
ANOVA could be used if the variances are approximately equal for the samples [113],
i.e., in our case, the emotion perceived without and with sensory effects. Before
performing the t-test, we evaluated if the samples were normally distributed using
again the kurtosis and skewness [122] and found that all emotions were normally
distributed.
For determining significant differences with the Student’s t-test, we indicated as
null hypothesis (H01) that the mean intensities of active emotions (EM) are equal
when presented without and with sensory effects. Additionally, we used a second
hypothesis (i.e., H02) for checking that the mean intensities of passive emotions are
equal without and with sensory effects. If H01 was rejected, we checked the alternative
hypothesis Ha1 presented in Equation 6.2. On the other hand, if H02 was rejected,
we checked the alternative hypothesis Ha2 as shown in Equation 6.3 [117].
Ha1 = EMWoE(active) < EMWE(active) (6.2)
Ha2 = EMWoE(passive) > EMWE(passive) (6.3)
As one can see, we used the hypotheses to evaluate so-called passive (e.g., tired-
ness, boredom) and active (e.g., happy, fun, worry) emotions [119]. We used Equa-
tion 6.2 for testing if the mean intensity of an active emotion has increased when
using sensory effects. On the other hand, Equation 6.3 was used for testing the de-
crease of the mean intensity for passive emotions if sensory effects have been used. We
used a significance level of 5% (α=0.05) below which we rejected the corresponding
hypothesis.
The significance analysis brought up a number of emotions where the intensity
change is significant. Figure 6.7, Figure 6.8, and Figure 6.9 illustrate the emotions
where the intensity change is significant. The figures show the emotions with their
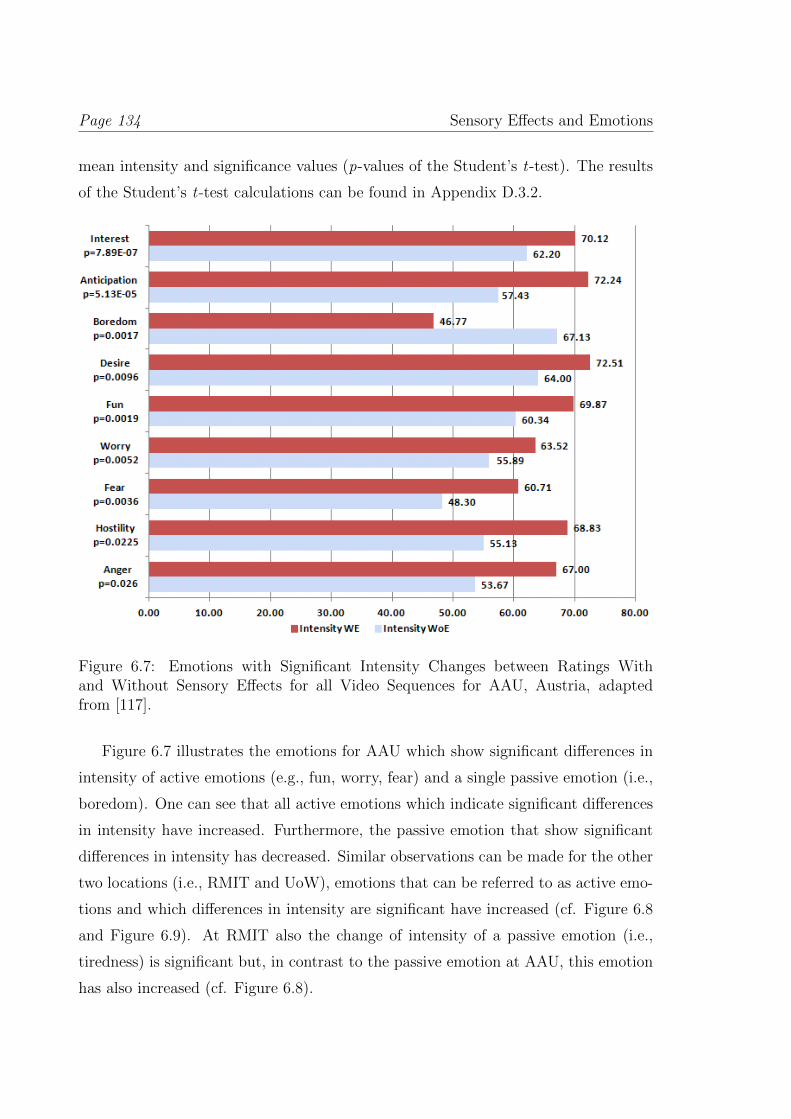
Page 134 Sensory Effects and Emotions
mean intensity and significance values (p-values of the Student’s t-test). The results
of the Student’s t-test calculations can be found in Appendix D.3.2.
Figure 6.7: Emotions with Significant Intensity Changes between Ratings Withand Without Sensory Effects for all Video Sequences for AAU, Austria, adaptedfrom [117].
Figure 6.7 illustrates the emotions for AAU which show significant differences in
intensity of active emotions (e.g., fun, worry, fear) and a single passive emotion (i.e.,
boredom). One can see that all active emotions which indicate significant differences
in intensity have increased. Furthermore, the passive emotion that show significant
differences in intensity has decreased. Similar observations can be made for the other
two locations (i.e., RMIT and UoW), emotions that can be referred to as active emo-
tions and which differences in intensity are significant have increased (cf. Figure 6.8
and Figure 6.9). At RMIT also the change of intensity of a passive emotion (i.e.,
tiredness) is significant but, in contrast to the passive emotion at AAU, this emotion
has also increased (cf. Figure 6.8).
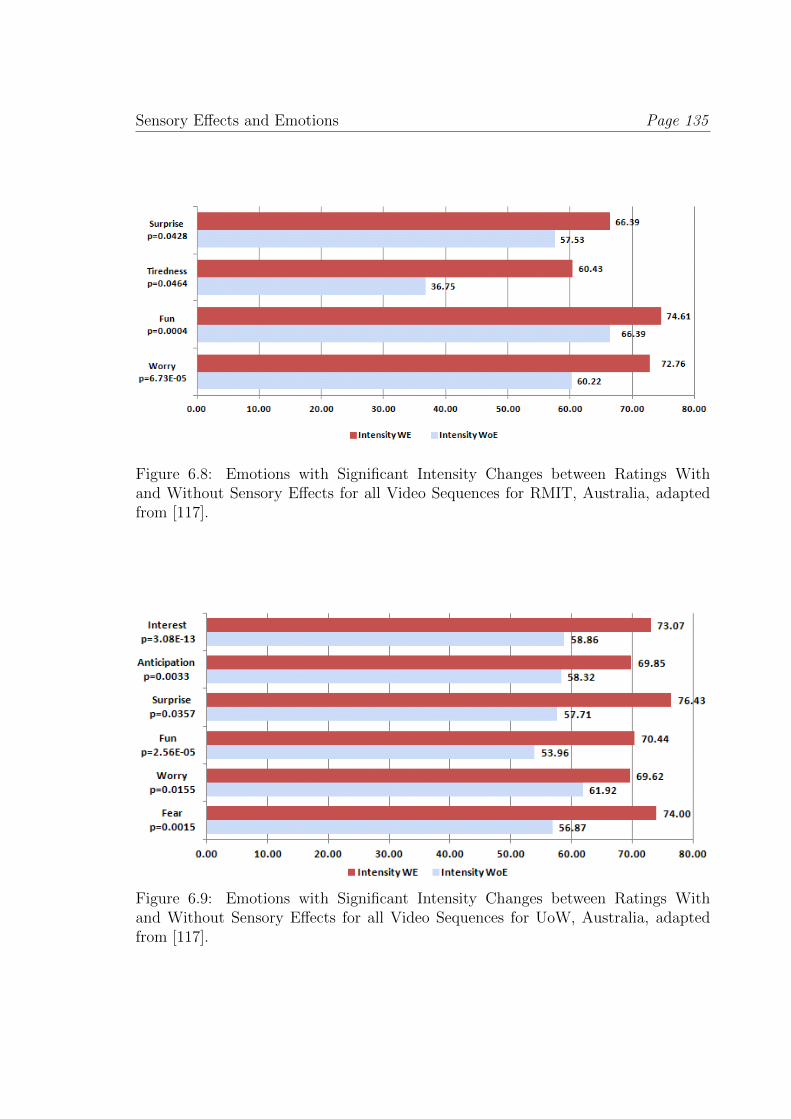
Sensory Effects and Emotions Page 135
Figure 6.8: Emotions with Significant Intensity Changes between Ratings Withand Without Sensory Effects for all Video Sequences for RMIT, Australia, adaptedfrom [117].
Figure 6.9: Emotions with Significant Intensity Changes between Ratings Withand Without Sensory Effects for all Video Sequences for UoW, Australia, adaptedfrom [117].
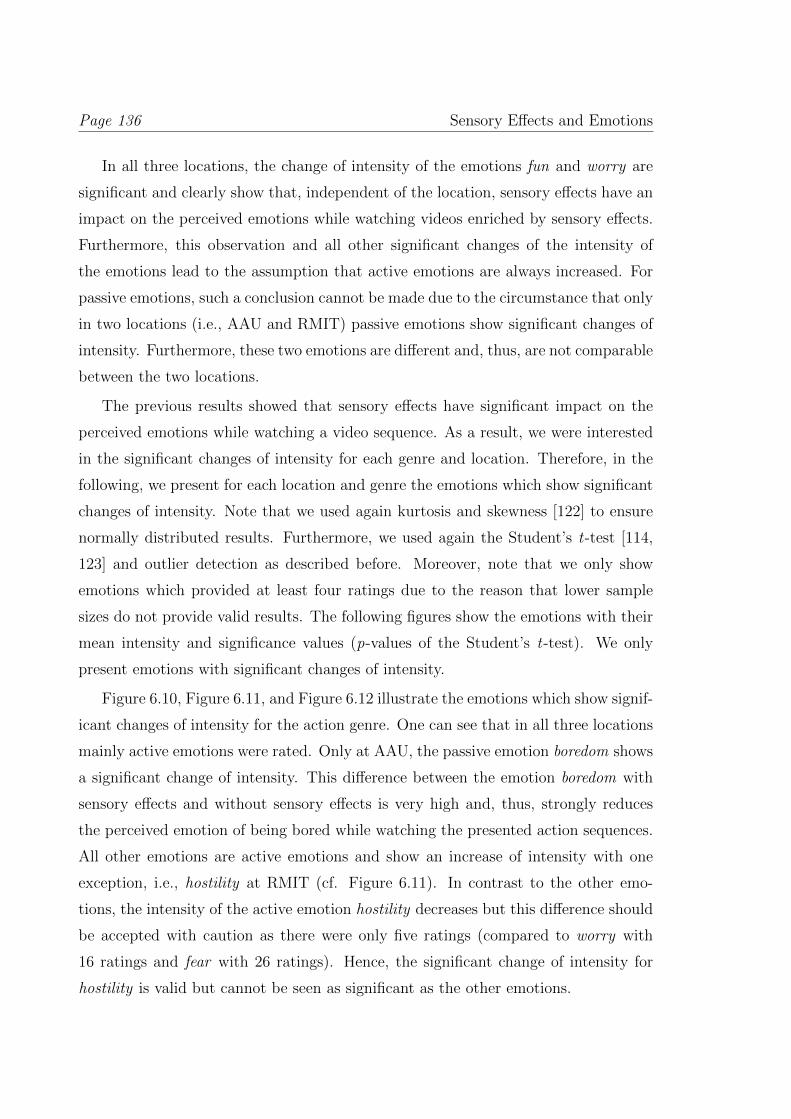
Page 136 Sensory Effects and Emotions
In all three locations, the change of intensity of the emotions fun and worry are
significant and clearly show that, independent of the location, sensory effects have an
impact on the perceived emotions while watching videos enriched by sensory effects.
Furthermore, this observation and all other significant changes of the intensity of
the emotions lead to the assumption that active emotions are always increased. For
passive emotions, such a conclusion cannot be made due to the circumstance that only
in two locations (i.e., AAU and RMIT) passive emotions show significant changes of
intensity. Furthermore, these two emotions are different and, thus, are not comparable
between the two locations.
The previous results showed that sensory effects have significant impact on the
perceived emotions while watching a video sequence. As a result, we were interested
in the significant changes of intensity for each genre and location. Therefore, in the
following, we present for each location and genre the emotions which show significant
changes of intensity. Note that we used again kurtosis and skewness [122] to ensure
normally distributed results. Furthermore, we used again the Student’s t-test [114,
123] and outlier detection as described before. Moreover, note that we only show
emotions which provided at least four ratings due to the reason that lower sample
sizes do not provide valid results. The following figures show the emotions with their
mean intensity and significance values (p-values of the Student’s t-test). We only
present emotions with significant changes of intensity.
Figure 6.10, Figure 6.11, and Figure 6.12 illustrate the emotions which show signif-
icant changes of intensity for the action genre. One can see that in all three locations
mainly active emotions were rated. Only at AAU, the passive emotion boredom shows
a significant change of intensity. This difference between the emotion boredom with
sensory effects and without sensory effects is very high and, thus, strongly reduces
the perceived emotion of being bored while watching the presented action sequences.
All other emotions are active emotions and show an increase of intensity with one
exception, i.e., hostility at RMIT (cf. Figure 6.11). In contrast to the other emo-
tions, the intensity of the active emotion hostility decreases but this difference should
be accepted with caution as there were only five ratings (compared to worry with
16 ratings and fear with 26 ratings). Hence, the significant change of intensity for
hostility is valid but cannot be seen as significant as the other emotions.
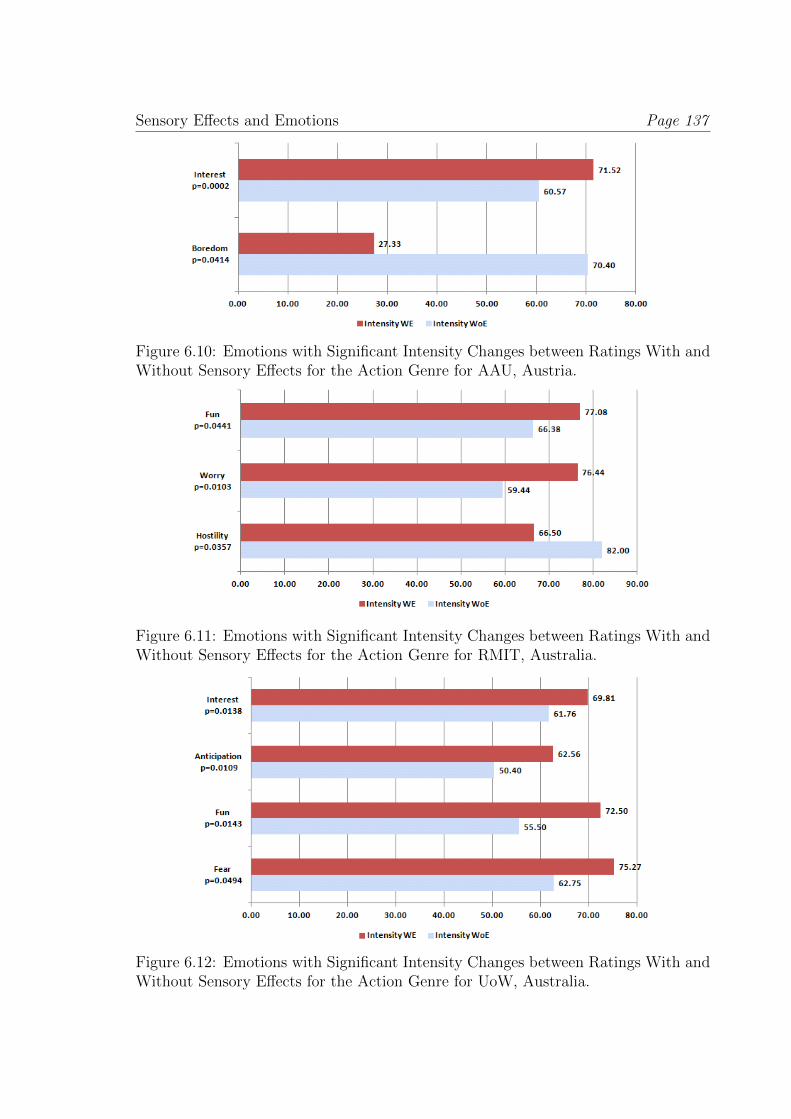
Sensory Effects and Emotions Page 137
Figure 6.10: Emotions with Significant Intensity Changes between Ratings With andWithout Sensory Effects for the Action Genre for AAU, Austria.
Figure 6.11: Emotions with Significant Intensity Changes between Ratings With andWithout Sensory Effects for the Action Genre for RMIT, Australia.
Figure 6.12: Emotions with Significant Intensity Changes between Ratings With andWithout Sensory Effects for the Action Genre for UoW, Australia.
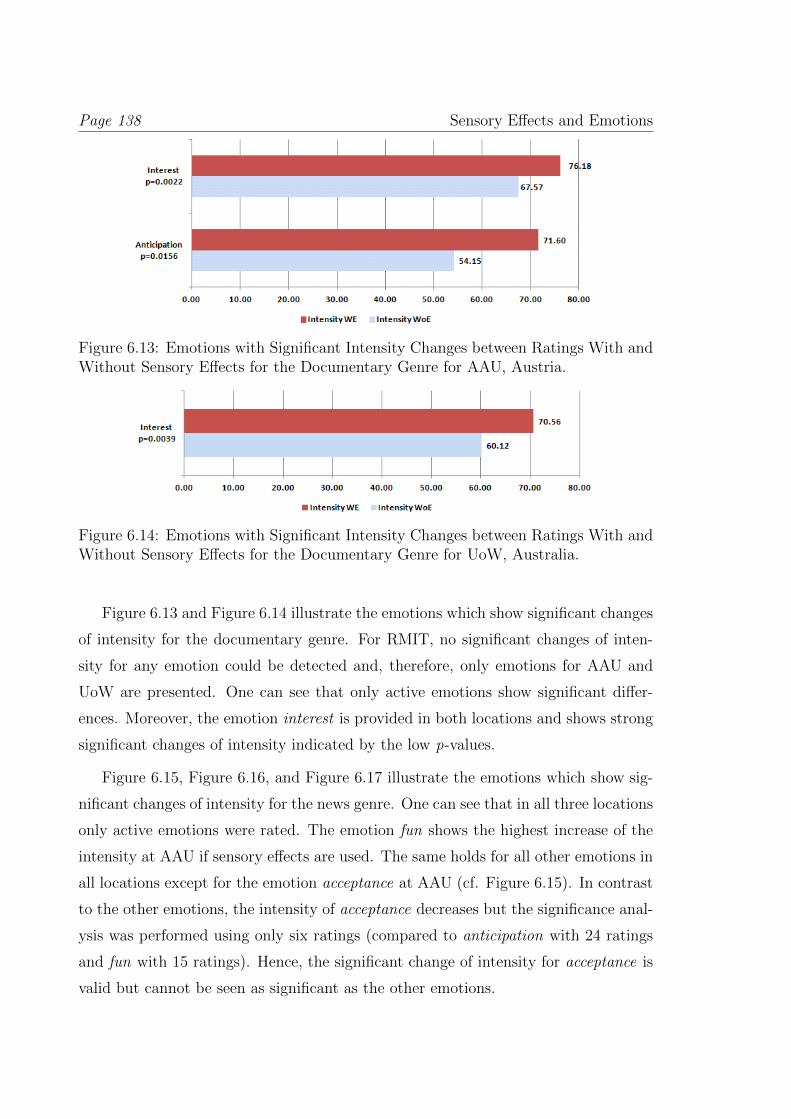
Page 138 Sensory Effects and Emotions
Figure 6.13: Emotions with Significant Intensity Changes between Ratings With andWithout Sensory Effects for the Documentary Genre for AAU, Austria.
Figure 6.14: Emotions with Significant Intensity Changes between Ratings With andWithout Sensory Effects for the Documentary Genre for UoW, Australia.
Figure 6.13 and Figure 6.14 illustrate the emotions which show significant changes
of intensity for the documentary genre. For RMIT, no significant changes of inten-
sity for any emotion could be detected and, therefore, only emotions for AAU and
UoW are presented. One can see that only active emotions show significant differ-
ences. Moreover, the emotion interest is provided in both locations and shows strong
significant changes of intensity indicated by the low p-values.
Figure 6.15, Figure 6.16, and Figure 6.17 illustrate the emotions which show sig-
nificant changes of intensity for the news genre. One can see that in all three locations
only active emotions were rated. The emotion fun shows the highest increase of the
intensity at AAU if sensory effects are used. The same holds for all other emotions in
all locations except for the emotion acceptance at AAU (cf. Figure 6.15). In contrast
to the other emotions, the intensity of acceptance decreases but the significance anal-
ysis was performed using only six ratings (compared to anticipation with 24 ratings
and fun with 15 ratings). Hence, the significant change of intensity for acceptance is
valid but cannot be seen as significant as the other emotions.
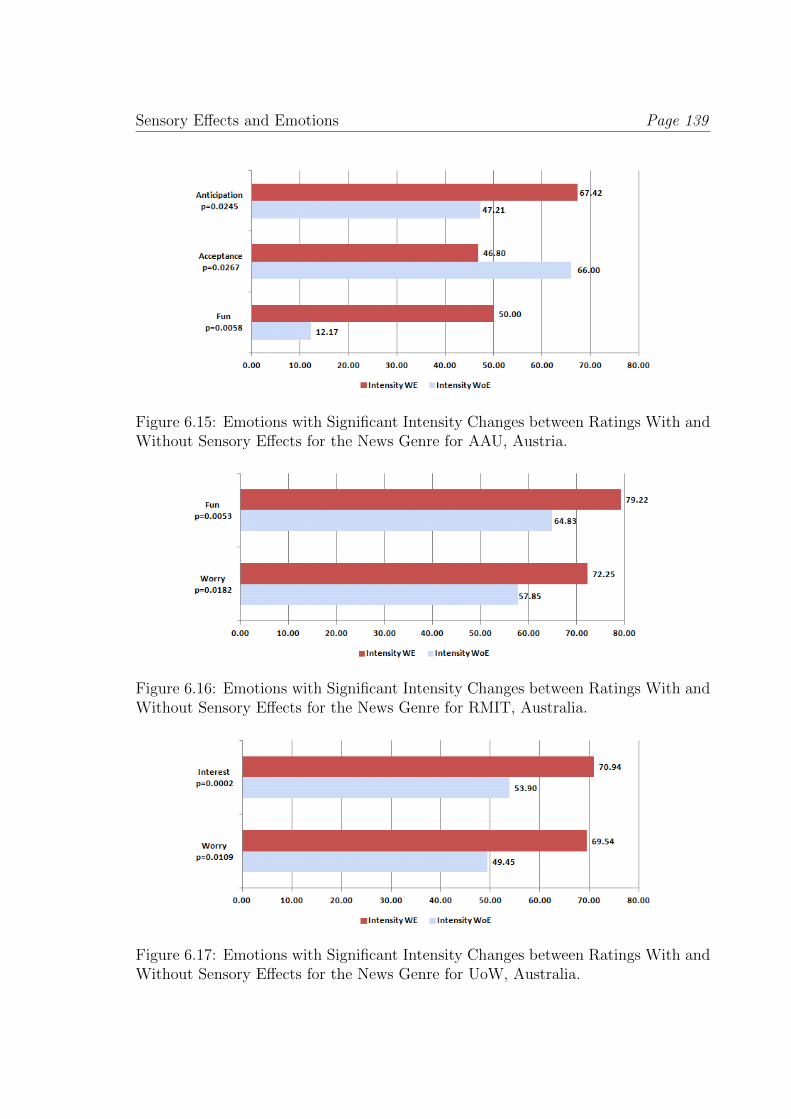
Sensory Effects and Emotions Page 139
Figure 6.15: Emotions with Significant Intensity Changes between Ratings With andWithout Sensory Effects for the News Genre for AAU, Austria.
Figure 6.16: Emotions with Significant Intensity Changes between Ratings With andWithout Sensory Effects for the News Genre for RMIT, Australia.
Figure 6.17: Emotions with Significant Intensity Changes between Ratings With andWithout Sensory Effects for the News Genre for UoW, Australia.
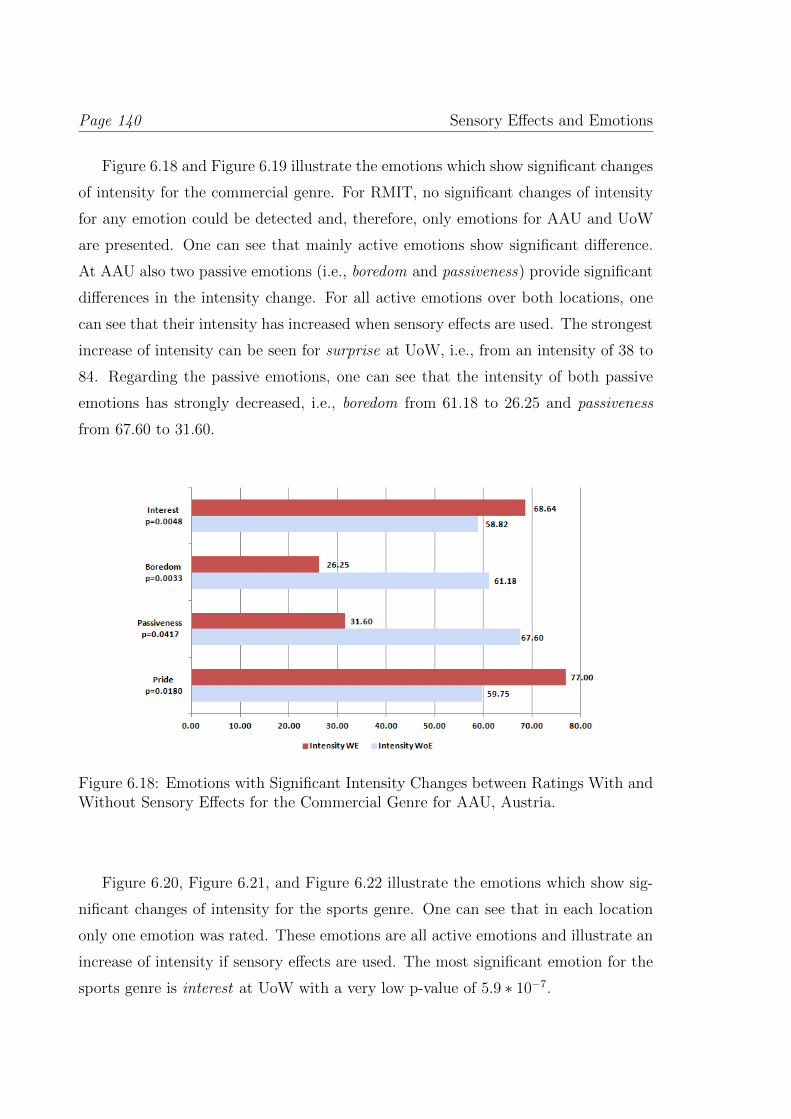
Page 140 Sensory Effects and Emotions
Figure 6.18 and Figure 6.19 illustrate the emotions which show significant changes
of intensity for the commercial genre. For RMIT, no significant changes of intensity
for any emotion could be detected and, therefore, only emotions for AAU and UoW
are presented. One can see that mainly active emotions show significant difference.
At AAU also two passive emotions (i.e., boredom and passiveness) provide significant
differences in the intensity change. For all active emotions over both locations, one
can see that their intensity has increased when sensory effects are used. The strongest
increase of intensity can be seen for surprise at UoW, i.e., from an intensity of 38 to
84. Regarding the passive emotions, one can see that the intensity of both passive
emotions has strongly decreased, i.e., boredom from 61.18 to 26.25 and passiveness
from 67.60 to 31.60.
Figure 6.18: Emotions with Significant Intensity Changes between Ratings With andWithout Sensory Effects for the Commercial Genre for AAU, Austria.
Figure 6.20, Figure 6.21, and Figure 6.22 illustrate the emotions which show sig-
nificant changes of intensity for the sports genre. One can see that in each location
only one emotion was rated. These emotions are all active emotions and illustrate an
increase of intensity if sensory effects are used. The most significant emotion for the
sports genre is interest at UoW with a very low p-value of 5.9 ∗ 10−7.
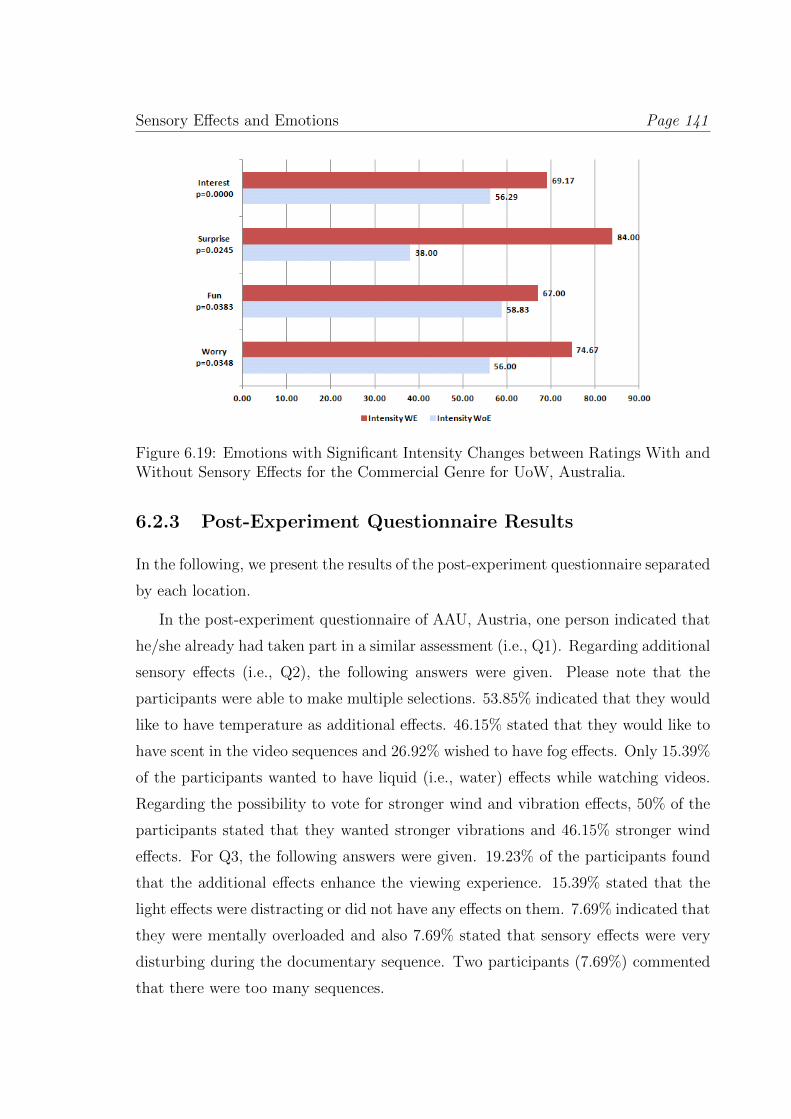
Sensory Effects and Emotions Page 141
Figure 6.19: Emotions with Significant Intensity Changes between Ratings With andWithout Sensory Effects for the Commercial Genre for UoW, Australia.
6.2.3 Post-Experiment Questionnaire Results
In the following, we present the results of the post-experiment questionnaire separated
by each location.
In the post-experiment questionnaire of AAU, Austria, one person indicated that
he/she already had taken part in a similar assessment (i.e., Q1). Regarding additional
sensory effects (i.e., Q2), the following answers were given. Please note that the
participants were able to make multiple selections. 53.85% indicated that they would
like to have temperature as additional effects. 46.15% stated that they would like to
have scent in the video sequences and 26.92% wished to have fog effects. Only 15.39%
of the participants wanted to have liquid (i.e., water) effects while watching videos.
Regarding the possibility to vote for stronger wind and vibration effects, 50% of the
participants stated that they wanted stronger vibrations and 46.15% stronger wind
effects. For Q3, the following answers were given. 19.23% of the participants found
that the additional effects enhance the viewing experience. 15.39% stated that the
light effects were distracting or did not have any effects on them. 7.69% indicated that
they were mentally overloaded and also 7.69% stated that sensory effects were very
disturbing during the documentary sequence. Two participants (7.69%) commented
that there were too many sequences.
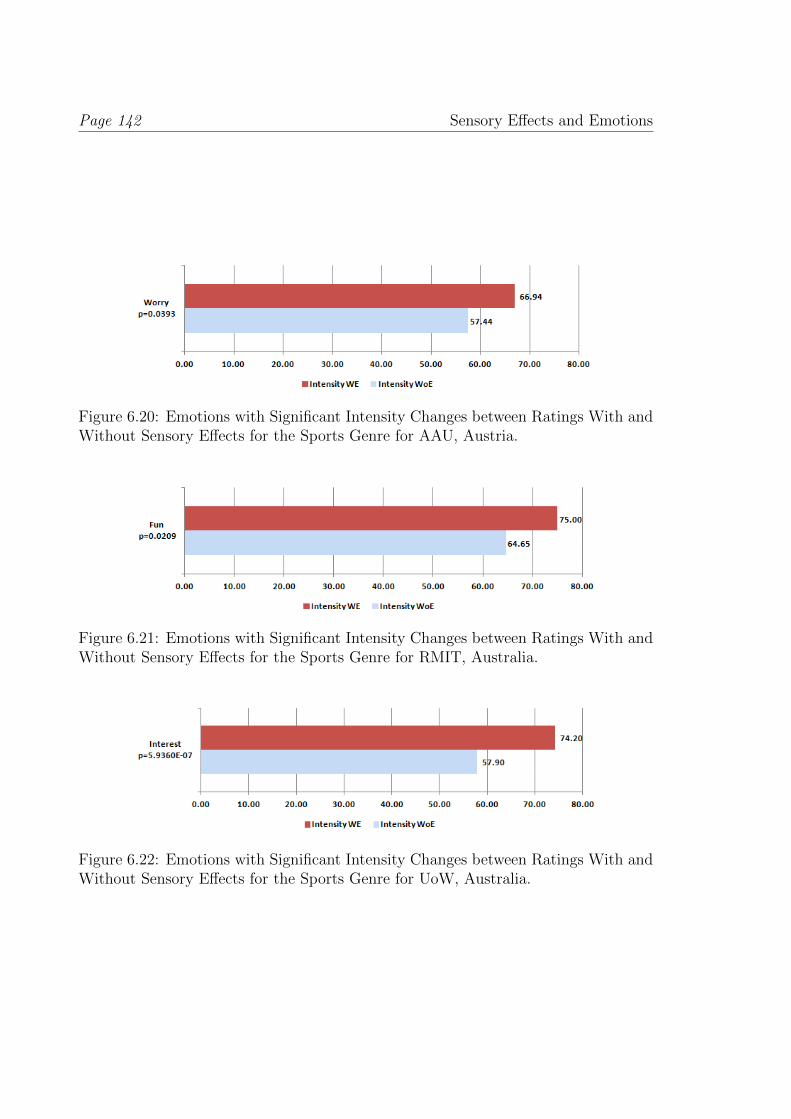
Page 142 Sensory Effects and Emotions
Figure 6.20: Emotions with Significant Intensity Changes between Ratings With andWithout Sensory Effects for the Sports Genre for AAU, Austria.
Figure 6.21: Emotions with Significant Intensity Changes between Ratings With andWithout Sensory Effects for the Sports Genre for RMIT, Australia.
Figure 6.22: Emotions with Significant Intensity Changes between Ratings With andWithout Sensory Effects for the Sports Genre for UoW, Australia.
Sensory Effects and Emotions Page 143
In the experiments at both RMIT and UoW, no one had participated in a similar
assessment (i.e., Q1).
The rest of the post-experiment questionnaire for RMIT, Australia, is as follows.
The participants answered as follows on the question about additional sensory effects
(i.e., Q2): 71.43% of the participants would have liked temperature effects like hot and
cold. 61.91% wanted additional scent during the video sequences. 28.57% indicated
that they would like to have fog during some sequences. Only 9.52% stated that
additional water effects would have been nice. 47.62% of the participants at RMIT
indicated that the wind could have been stronger and 42.86% stated that vibration
should have been stronger. For the question about additional comments (i.e., Q3),
some participants indicated that the light was distracting (23.81%). Moreover, they
indicated that sensory effects provided them a more immersive viewing experience
(19.05%). 9.52% commented that sometimes the wind gave a false sensation, i.e.,
cold wind where the scene indicated that it should be hot.
At UoW, Australia, the participants answered for the question about additional
effects (i.e., Q2) as follows. 61.91% of the participants wanted temperature effects like
hot and cold. 52.38% stated that scent effects would be a nice addition and 14.29%
said that fog should be added. Also at UoW, only 9.52% indicated that they would
like water effects. Regarding the strength of the existing vibration and wind effects,
33.33% of the participants stated that the vibration should be stronger and 28.57%
that the intensity of the wind should be increased. As additional comments (i.e.,
Q3) the participants stated that the effects enhance the viewing experience (19.05%).
Furthermore, they indicated, similar to AAU, that sensory effects were disturbing
during the documentary genre (14.29%).
6.3 Discussion and Conclusions
In this chapter, we presented a subjective quality assessment on the enhancement
of QoE using sensory effects, and the impact of sensory effects on emotions. The
assessment comprised three different locations (i.e., AAU, RMIT, and UoW) in two
different countries (i.e., Austria and Australia).
The assessment clearly indicated that sensory effects are more suitable for some
Page 144 Sensory Effects and Emotions
genres than others. In particular, the action genre benefits the most of using sensory
effects. This confirms our results achieved by our previous subjective quality assess-
ment (cf. Chapter 3). In contrast to our previous assessment, the documentary genre
was rated the worst. One reason for the poor rating is that some participants have
disliked the content of the video sequences (e.g., volcano eruption). Hence, from this
result, one can assume that it is important to take the viewer’s preferences (e.g., the
viewer does not like to have real events intensified) and the content into account when
using sensory effects.
Regarding the evaluation of emotions, the results have shown that active emotions
like fun and worry are increased significantly. Therefore, the results indicate that
sensory effects can be used to increase the emotional connection of the viewer with
the presented video content. For example, in a horror movie, wind effects can be used
to increase the intensity of fear for certain scenes.
Moreover, overall results for the perceived emotions for each location are confirmed
by the results for each genre. That is, active emotions are increased by sensory effects
and passive emotions are decreased by sensory effects. There are two exceptions, i.e.,
hostility in the action genre at RMIT (cf. Figure 6.11) and acceptance in the news
genre at AAU (cf. Figure 6.15). Note that these exceptions need to be accepted with
caution as for both emotions only a small number of participants provided ratings
and, thus, only a low validity of the results is given.
For passive emotions, no general conclusion can be achieved as too few passive
emotions showed significant changes of intensity. Moreover, if there was a passive
emotion with significant differences in intensity, the passive emotion appeared only
at one location. For example, in the per genre evaluation, for the action genre, the
passive emotions boredom and passiveness showed significant changes of intensity at
AAU only (cf. Figure 6.10, Figure 6.11, and Figure 6.12). Similar with the results pre-
senting emotions with significant changes of intensity comprising all video sequences
(cf. Figure 6.7, Figure 6.8, and Figure 6.9). Hence, the results of the passive emotions
need to be considered carefully as they are not comparable. Furthermore, the pas-
sive emotion tiredness showed only significant differences in the intensity without and
with sensory effects for RMIT and not for UoW. Hence, it cannot be concluded that
tiredness is increased due to demographic differences between Austria and Australia.
Sensory Effects and Emotions Page 145
Moreover, the difference for the passive emotion tiredness is not as significant as for
the passive emotion boredom because tiredness has only a p-value of 0.0464 with 13
ratings and boredom has a p-value of 0.0017 with 64 ratings. Hence, the results of
the passive emotion tiredness may be negligible due to the low significance.
Lastly, general conclusions on the impact of sensory effects on the perceived emo-
tions and on QoE cannot be made because most of the participants were between
20 and 40 years and only a small number of participants were between 40 and 63
years. Thus, the presented results are valid for the given age classes but for provid-
ing general conclusions on the influence of sensory effects on the perceived emotions,
additional assessments with more participants and with other age classes are needed
(e.g., participants below 20 years and above 63 years).
Based on the results achieved in this subjective quality assessment, the follow-
ing conclusions on the impact of sensory effects on the viewing experience and the
perceived emotions can be drawn:
• Sensory effects (i.e., wind, light, and vibration) have an impact on the perceived
emotions. That is, active emotions such as anger, fear, etc. are increased in
their intensity.
• Sensory effects are not equally suited for each genre. Additionally, the results
indicate that the content of the video sequence is important for enriching the
viewing experience by sensory effects.
• Independent of demographic differences, sensory effects have similar impact on
the viewing experience and on the perceived emotions.

CHAPTER
7 Sensory Effect Dataset and
Evaluation Recommenda-
tions
In the previous chapters, we focused on the presentation and description of various
subjective quality assessments comprising multimedia content enriched by sensory
effects (i.e., light, wind, and vibration). This chapter introduces the Sensory Effect
Dataset (cf. Section 7.1) which was created during the course of this work for provid-
ing common test content for performing evaluations in the area of sensory experience.
Moreover, we provide recommendations for performing subjective quality assessments
comprising sensory effects (cf. Section 7.2). Additionally, different setups for sensory
devices are illustrated which are suitable for performing experiments in the area of
sensory experience.
Note that the dataset comprises the video sequences from our previous subjective
quality assessments and additional video sequences. Some video sequences, especially
Web videos, from the dataset were selected and annotated together with Benjamin
Rainer during the course of his master’s thesis [14]. The reason for this was that he
constructed the evaluation platforms for the subjective quality assessments presented
in Chapter 5 and Chapter 6. Thus, from the 76 video sequences, 29 video sequences
were selected and annotated during the development of these evaluation platforms. To
that end, the task of annotating the 29 video sequences was divided between Benjamin
Rainer and myself. That is, Benjamin Rainer annotated the video sequences from the
Sports, News and Commercial genres, whereas I annotated the video sequences from
the Action and Documentary genres. The detailed description of the selection and
annotation of these specific video sequences is presented in [14]. Section 7.1 presents
the development of the dataset and the annotation of all video sequences from the
dataset (incl. the 29 Web video sequences).
Furthermore, this chapter is based on the work published in [87].
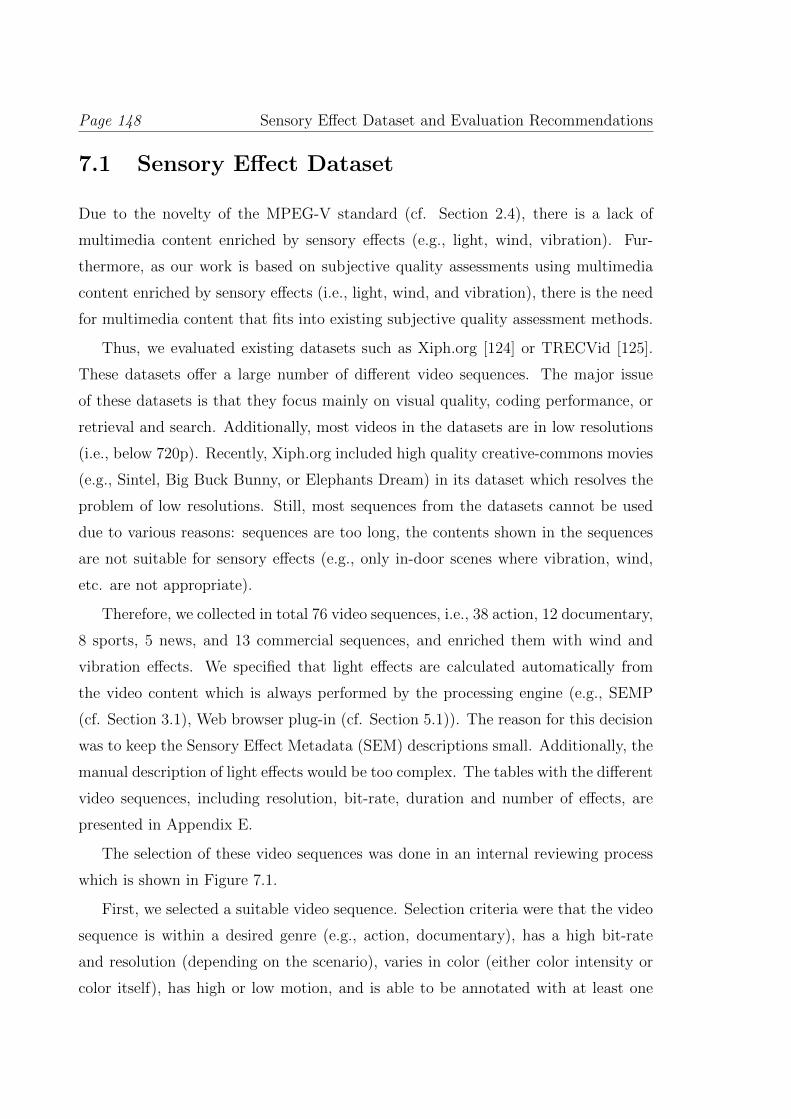
Page 148 Sensory Effect Dataset and Evaluation Recommendations
7.1 Sensory Effect Dataset
Due to the novelty of the MPEG-V standard (cf. Section 2.4), there is a lack of
multimedia content enriched by sensory effects (e.g., light, wind, vibration). Fur-
thermore, as our work is based on subjective quality assessments using multimedia
content enriched by sensory effects (i.e., light, wind, and vibration), there is the need
for multimedia content that fits into existing subjective quality assessment methods.
Thus, we evaluated existing datasets such as Xiph.org [124] or TRECVid [125].
These datasets offer a large number of different video sequences. The major issue
of these datasets is that they focus mainly on visual quality, coding performance, or
retrieval and search. Additionally, most videos in the datasets are in low resolutions
(i.e., below 720p). Recently, Xiph.org included high quality creative-commons movies
(e.g., Sintel, Big Buck Bunny, or Elephants Dream) in its dataset which resolves the
problem of low resolutions. Still, most sequences from the datasets cannot be used
due to various reasons: sequences are too long, the contents shown in the sequences
are not suitable for sensory effects (e.g., only in-door scenes where vibration, wind,
etc. are not appropriate).
Therefore, we collected in total 76 video sequences, i.e., 38 action, 12 documentary,
8 sports, 5 news, and 13 commercial sequences, and enriched them with wind and
vibration effects. We specified that light effects are calculated automatically from
the video content which is always performed by the processing engine (e.g., SEMP
(cf. Section 3.1), Web browser plug-in (cf. Section 5.1)). The reason for this decision
was to keep the Sensory Effect Metadata (SEM) descriptions small. Additionally, the
manual description of light effects would be too complex. The tables with the different
video sequences, including resolution, bit-rate, duration and number of effects, are
presented in Appendix E.
The selection of these video sequences was done in an internal reviewing process
which is shown in Figure 7.1.
First, we selected a suitable video sequence. Selection criteria were that the video
sequence is within a desired genre (e.g., action, documentary), has a high bit-rate
and resolution (depending on the scenario), varies in color (either color intensity or
color itself), has high or low motion, and is able to be annotated with at least one
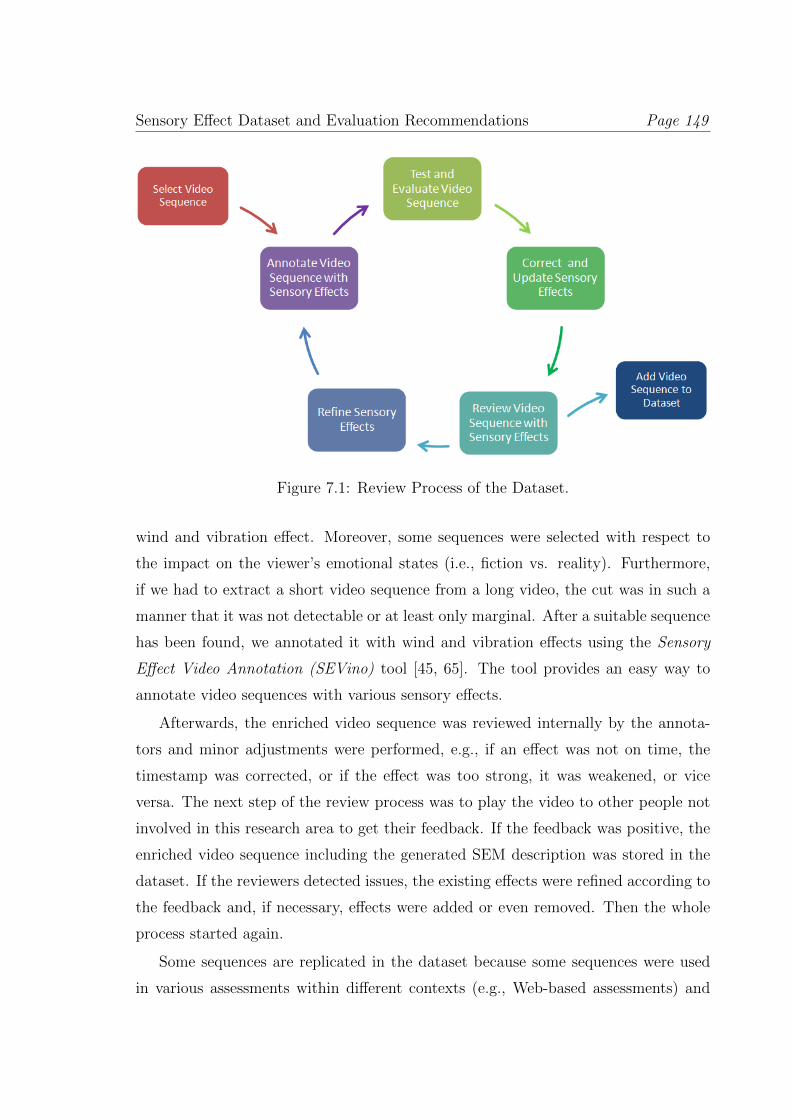
Sensory Effect Dataset and Evaluation Recommendations Page 149
Figure 7.1: Review Process of the Dataset.
wind and vibration effect. Moreover, some sequences were selected with respect to
the impact on the viewer’s emotional states (i.e., fiction vs. reality). Furthermore,
if we had to extract a short video sequence from a long video, the cut was in such a
manner that it was not detectable or at least only marginal. After a suitable sequence
has been found, we annotated it with wind and vibration effects using the Sensory
Effect Video Annotation (SEVino) tool [45, 65]. The tool provides an easy way to
annotate video sequences with various sensory effects.
Afterwards, the enriched video sequence was reviewed internally by the annota-
tors and minor adjustments were performed, e.g., if an effect was not on time, the
timestamp was corrected, or if the effect was too strong, it was weakened, or vice
versa. The next step of the review process was to play the video to other people not
involved in this research area to get their feedback. If the feedback was positive, the
enriched video sequence including the generated SEM description was stored in the
dataset. If the reviewers detected issues, the existing effects were refined according to
the feedback and, if necessary, effects were added or even removed. Then the whole
process started again.
Some sequences are replicated in the dataset because some sequences were used
in various assessments within different contexts (e.g., Web-based assessments) and
Page 150 Sensory Effect Dataset and Evaluation Recommendations
different evaluation scenarios (e.g., influence of sensory effects on the perceived video
quality). Hence, diverse representations had to be generated. For example, in scenar-
ios that comprise playback on TV sets or local playback on a computer, a subjective
quality assessment needs to provide high resolutions (i.e., 720p spatial resolution up-
wards) and high bit-rates (i.e., 4 Mbit/s upwards). On the other hand, in Web-based
assessments, lower resolutions (i.e., 720p spatial resolution downwards) and bit-rates
(i.e., 2 Mbit/s downwards) are enough.
The advantage of our dataset is that we offer a number of video sequences already
enriched by sensory effects and, therefore, the time consuming annotation of these
sequences can be omitted. Furthermore, most of the video sequences from the dataset
have already been used in our previous subjective quality assessments (cf. Chapter 3,
Chapter 4, Chapter 5, and Chapter 6) and, thus, results for comparison purposes are
already available. For example, if one wants to perform an evaluation on the influence
of sensory effects on the QoE for different genres, he/she can compare his/her retrieved
QoE results with our results presented in Chapter 3 and [82].
Furthermore, the dataset can be used for evaluating the impact of sensory effects
on different conditions (e.g., emotions, perceived video quality, QoE). For performing
such evaluations, additional sensory devices (e.g., fans, lamps, or vibration chairs)
are mandatory for rendering sensory effects (i.e., light, wind, and vibration). One
example for a collection of such devices is the amBX System [15] which was used
throughout this work. As the dataset is based on the MPEG-V standard, it can
be used with any device or software supporting MPEG-V for enhancing the viewing
experience. Players and tools that are able to handle the video sequences from the
dataset and the corresponding SEM descriptions are, e.g., SEMP (cf. Section 3.1)
and AmbientLib with the Web browser plug-in (cf. Section 5.1 and [14]).
The entire dataset, including the tools presented in this work, are available on the
Sensory Experience Lab (SELab) Web site [85].
Sensory Effect Dataset and Evaluation Recommendations Page 151
7.2 Subjective Quality Evaluation Recommenda-
tions
The subjective quality assessments which were conducted during the course of this
work brought up some important factors (e.g., suitability of different assessment
methods) for conducting assessments using sensory effects. Hence, in this section,
we present some setups for performing subjective quality assessments which comprise
multimedia content enhanced by sensory effects. The setups presented in this section
have been used in our assessments (cf. Chapter 3, Chapter 4, Chapter 5, and Chap-
ter 6) and/or we find them most suitable for conducting such assessments. The setup
of the test environment (i.e., location) is mainly based on standardized procedures
such as the ITU-T Rec. P.910 [39] or ITU-R Rec. BT.500-11 [41] and on the paper
by Storms et al. [86] who illustrates a test setup for audio-visual quality evaluations
in detail. Additionally, we present different evaluation procedures which can be used
for evaluating multimedia content enriched by sensory effects (cf. Section 7.2.3).
7.2.1 Location
From our conducted subjective quality assessments, the following ambient conditions
for the room in which the assessments on sensory effects are performed have been
most suitable:
• All nonessential electronic equipment is turned off (e.g., monitors and PCs not
needed for the test, mobile phones etc.).
• Windows are closed and covered with translucent blankets or other material
reducing the lighting (e.g., blinds).
• The entry door to the room is closed and a ”Do not disturb” sign is placed on
the outside of the door.
• All overhead lights are turned off and, if necessary or desired, a ceiling flooder
can be used to generate a pleasant atmosphere.
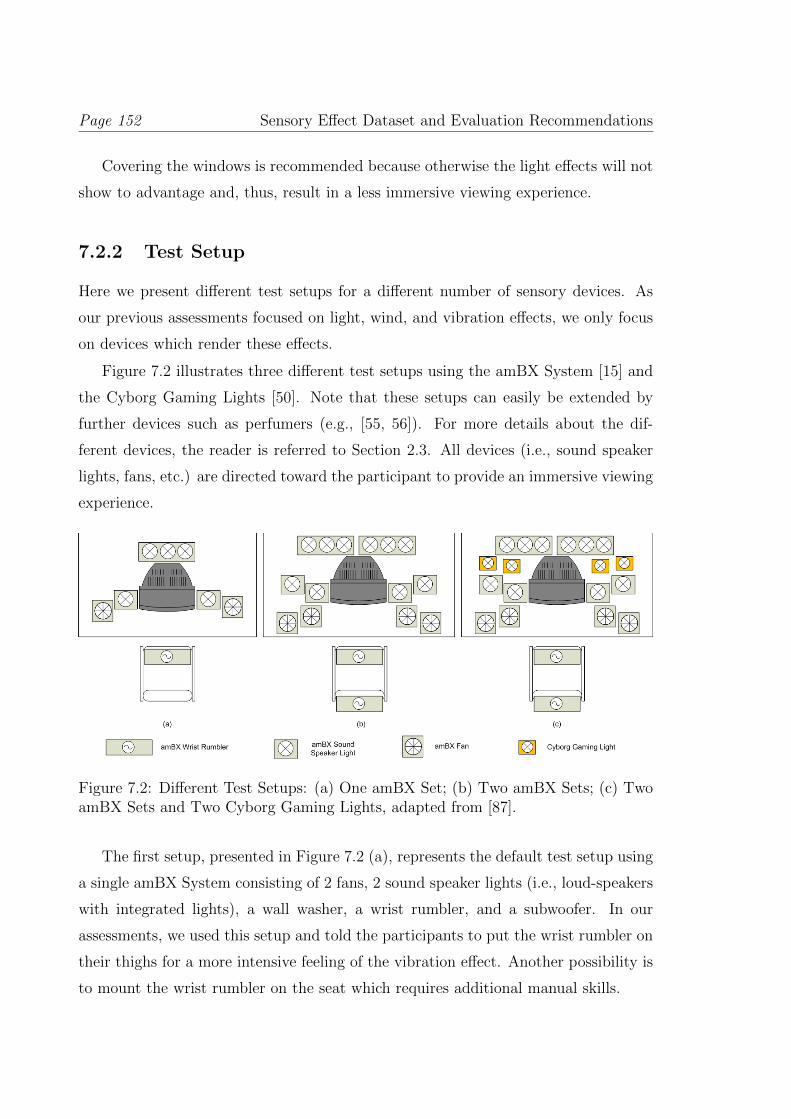
Page 152 Sensory Effect Dataset and Evaluation Recommendations
Covering the windows is recommended because otherwise the light effects will not
show to advantage and, thus, result in a less immersive viewing experience.
7.2.2 Test Setup
Here we present different test setups for a different number of sensory devices. As
our previous assessments focused on light, wind, and vibration effects, we only focus
on devices which render these effects.
Figure 7.2 illustrates three different test setups using the amBX System [15] and
the Cyborg Gaming Lights [50]. Note that these setups can easily be extended by
further devices such as perfumers (e.g., [55, 56]). For more details about the dif-
ferent devices, the reader is referred to Section 2.3. All devices (i.e., sound speaker
lights, fans, etc.) are directed toward the participant to provide an immersive viewing
experience.
Figure 7.2: Different Test Setups: (a) One amBX Set; (b) Two amBX Sets; (c) TwoamBX Sets and Two Cyborg Gaming Lights, adapted from [87].
The first setup, presented in Figure 7.2 (a), represents the default test setup using
a single amBX System consisting of 2 fans, 2 sound speaker lights (i.e., loud-speakers
with integrated lights), a wall washer, a wrist rumbler, and a subwoofer. In our
assessments, we used this setup and told the participants to put the wrist rumbler on
their thighs for a more intensive feeling of the vibration effect. Another possibility is
to mount the wrist rumbler on the seat which requires additional manual skills.
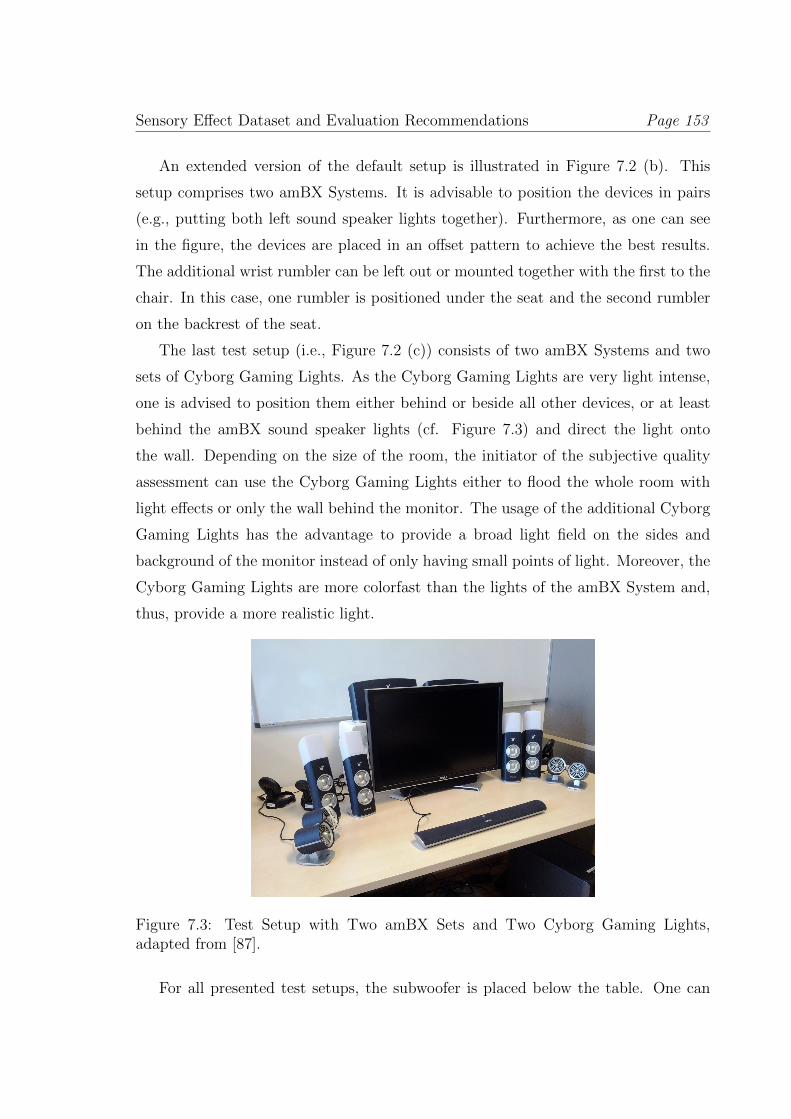
Sensory Effect Dataset and Evaluation Recommendations Page 153
An extended version of the default setup is illustrated in Figure 7.2 (b). This
setup comprises two amBX Systems. It is advisable to position the devices in pairs
(e.g., putting both left sound speaker lights together). Furthermore, as one can see
in the figure, the devices are placed in an offset pattern to achieve the best results.
The additional wrist rumbler can be left out or mounted together with the first to the
chair. In this case, one rumbler is positioned under the seat and the second rumbler
on the backrest of the seat.
The last test setup (i.e., Figure 7.2 (c)) consists of two amBX Systems and two
sets of Cyborg Gaming Lights. As the Cyborg Gaming Lights are very light intense,
one is advised to position them either behind or beside all other devices, or at least
behind the amBX sound speaker lights (cf. Figure 7.3) and direct the light onto
the wall. Depending on the size of the room, the initiator of the subjective quality
assessment can use the Cyborg Gaming Lights either to flood the whole room with
light effects or only the wall behind the monitor. The usage of the additional Cyborg
Gaming Lights has the advantage to provide a broad light field on the sides and
background of the monitor instead of only having small points of light. Moreover, the
Cyborg Gaming Lights are more colorfast than the lights of the amBX System and,
thus, provide a more realistic light.
Figure 7.3: Test Setup with Two amBX Sets and Two Cyborg Gaming Lights,adapted from [87].
For all presented test setups, the subwoofer is placed below the table. One can
Page 154 Sensory Effect Dataset and Evaluation Recommendations
use more than one subwoofer but one should keep the amplification of the vibration
effects due to the subwoofers in mind. Furthermore, for each test setup the wall
washer(s) is/are placed behind the monitor in an elevated way (cf. Figure 7.3). If
this is not done, the participants will not be able to see the emitted lights behind the
monitor.
As used and presented in Chapter 3 and Chapter 4, the assessment initiator can use
a control computer and a test computer. The control computer is used for starting
the assessment and for handling errors. On the test computer, the actual test is
conducted and the results are retrieved. If the assessment can be initiated by the
participant and the evaluation system is stable enough, the control computer can be
omitted.
7.2.3 Evaluation Procedure
For performing subjective quality assessments in the area of sensory effects, one can
use the standard evaluation methods such as specified by the ITU but need to modify
them as they do not take sensory effects into account. In the following sections, we
present the procedure of preparing and evaluating a subjective quality assessment for
sensory effects.
First of all, we are not suggesting in this work a specific evaluation method as the
used evaluation method strongly depends on the context and goal of the evaluation.
For example, if one wants to compare multimedia content enriched by sensory ef-
fects with the same content without sensory effects, one needs a stimulus comparison
method. In contrast, if one simply wants to evaluate the influence of specific effects
on the viewing experience, a single stimulus method is required. Hence, we provide in
Section 7.2.3.4 different subjective quality assessment methods and recommend when
these methods are suitable. Moreover, we base the recommendations on the previ-
ously performed subjective quality assessments (cf. Chapter 3, Chapter 4, Chapter 5,
and Chapter 6). Additionally, we discuss in this section the test sequences and par-
ticipants (cf. Section 7.2.3.1), the rating scale (cf. Section 7.2.3.2), the evaluation
introduction (cf. Section 7.2.3.3), and, finally, the result analysis (cf. Section 7.2.3.5).
Sensory Effect Dataset and Evaluation Recommendations Page 155
7.2.3.1 Test Sequences and Participants
Selecting suitable test sequences and participants is very important. For evaluating
sensory effects, it is important to mention that most standardized test sequences are
not suitable as presented in Section 7.1.
Therefore, we suggest using test sequences such as the ones from our dataset
(cf. Section 7.1), which were already used in subjective quality assessments and proven
suitable. If one wants to use his/her own video sequences, one should keep in mind
that too short sequences enriched by sensory effects can lead to mentally overloaded
participants and, thus, the participants can provide unreliable results. Hence, we
recommend using sequences longer than 10 seconds. According to the observations
of Frohlich et al. [93], sequences with a length between 10 and 30 seconds show no
difference in the results and, thus, are suitable for performing evaluations. Moreover,
Frohlich et al. [93] detected that longer sequences may lead to a more realistic evalu-
ation scenario, i.e., real-world scenario. Thus, results for longer sequences show more
realistic results compared to short sequences. Additionally, we suggest selecting test
sequences similar to the procedure in Section 7.1 because the sequences need to fulfill
a number of properties. For example, depending on the evaluation goal, they need to
vary in color for light effects or provide outdoor scenes for evaluating wind effects.
Lastly, for evaluating sensory effects, the number and type of participants need to
be taken into account. We recommend complying with the defined number of 4 to 40
participants for an assessment as specified by the ITU [39, 40, 41] and Corriveau [42].
Note that more participants provide more reliable and more significant results. Hence,
it is recommended to perform an assessment with at least 16 participants to receive
statistically valid results. Additionally, the type of the participant is important as it
makes a big difference if experts or non-experts are providing ratings. For evaluating
real-world scenarios, it is highly recommended to use non-experts as already presented
in Section 2.2.2.
7.2.3.2 Rating Scales and Labels
Standardized evaluation methods (e.g., ACR, ACR-HR, DCR, DSCQS) can be used
for the evaluation of sensory effects but need to be modified. For example, standard
Page 156 Sensory Effect Dataset and Evaluation Recommendations
evaluation methods usually use a five-level impairment scale (i.e., with ratings from
1 to 5) or a continuous impairment scale (i.e., with ratings from 0 to 100) which –
depending on the evaluation scenario (e.g., comparing videos without sensory effects
to videos with sensory effects) – need to be transformed into a five-level enhancement
scale or a continuous enhancement scale. The transformation of the scale is done
by modifying the labels of the scale. This is possible as research has shown that
the different labels have no influence on the results [88, 89]. Note that it is still
important to have understandable labels which clearly indicate what the participant
has to rate. For example, an assessment will not provide reliable results if the labels of
the rating scale are random words. Furthermore, we recommend using the pre-defined
scales, i.e., the five-level ordinal scale as used in the ACR, ACR-HR, or DCR; and
the continuous quality scale as used in the DSCQS or similar continuous evaluation
methods.
Depending on the evaluation context, we detected that an enhancement scale
is suitable for evaluating the influence of sensory effects on the QoE. Hence, we
suggest to use an enhancement scale divided into the following levels (the number
within the brackets indicate the value for a five-level ordinal scale and a 0 to 100
continuous scale): very annoying (1, 0-20), annoying (2, 20-40), imperceptible (3,
40-60), little enhancement (4, 60-80), and big enhancement (5, 80-100). Moreover,
if one uses a continuous scale, it is advisable to only show the lowest and highest
possible rating to the participants to avoid possible biases due to the intermediate
levels (i.e., participants may not rate intuitively). Using only start and end labels
is a commonly used technique which is also suggested by [41, 89] but the ITU also
indicates that intermediate labels can be added to aid the participants. As stated
earlier, the labels depend on the context and goal of the evaluation. An enhancement
scale makes no sense if one wants to evaluate the perceived video quality. Therefore,
for an evaluation on the perceived video quality, the default labels defined by the
ITU [39, 41] can be used.
Sensory Effect Dataset and Evaluation Recommendations Page 157
7.2.3.3 Evaluation Introduction
Besides the labels and the rating scale, it is very important to clearly tell the par-
ticipants what their task is. For example, after watching a video sequence without
sensory effects and the same video sequence with sensory effects, the participants
have to rate the enhancement of the QoE; that is, their perceived enhancement of
QoE while watching the video sequence with sensory effects with respect to the video
sequence without sensory effects. Therefore, we recommend providing a written in-
troduction for the subjective quality assessment. The reasons for using a written
introduction are manifold. First, each participant receives the same introduction.
Providing an oral introduction, the description of the goal and the evaluation itself
can vary from participant to participant as the assessor may get tired at the end
of the day. Second, in written introductions, figures of scales or additional material
(e.g., screenshots) can be provided without losing the attention of the participant.
For example, during an oral introduction the participant may still think about the
earlier told test setup and goal while the assessor already provides the additional ma-
terial. The ITU [39, 41] also suggests providing the instructions for the participants
in written form. Additionally, the ITU indicates to use a training session which shows
the participant the procedure of the evaluation. According to the ITU, the additional
training session may help to reduce the learning effect of the participants. Moreover,
according to the ITU [39, 41], we propose to allow the participants to ask questions
about the evaluation only during the instructions and questionnaires, and not during
the evaluation itself. The reason for this is that during the actual test, the participant
needs to concentrate only on the given task.
7.2.3.4 Evaluation Methods
After discussing labels, rating scale, and the instruction to the participants, the struc-
ture of the evaluation and evaluation method itself are important. In our previous
assessments and assessments in the literature (e.g., [86]), a three phase evaluation
procedure was used. This structure of an evaluation strongly helps in performing the
evaluation. The first phase comprises the introduction and a pre-questionnaire. The
pre-questionnaire consists of questions about gender, age, field of study, etc. These
Page 158 Sensory Effect Dataset and Evaluation Recommendations
questions are important for analyzing the results and for reporting findings such as
the influence of sensory effects on a specific age class. The second phase consists of
the evaluation itself which is described later. The last phase, i.e., third phase, finalizes
the evaluation with a post-questionnaire. The post-questionnaire is used for receiv-
ing information about the constitution of the participants after the evaluation (e.g.,
mental overloads while watching video sequences enriched by sensory effects, stress
while rating). Additionally, the post-questionnaire can be used to get information
about possible evaluation enhancements. For example, the used test sequences were
too long/short to be rated or indicate some synchronization problems which was not
detected before the assessment.
The most important part of a subjective quality assessment in the context of
sensory effects is the used evaluation method. In previous chapters (cf. Chapter 3,
Chapter 4, Chapter 5, and Chapter 6), we used a number of different assessment
methods which were suitable for the different tasks but showed some minor issues
(e.g., see Chapter 4). In general, we detected that existing evaluation methods can
be used for evaluating multimedia content, especially videos, accompanied by sensory
effects. Depending on the evaluation goal, the existing evaluation methods need to be
extended or modified, e.g., the rating scale needs to be adjusted as described before.
Hence, one needs to decide what the goal of the evaluation is and, thus, select an
existing method defined by, e.g., the ITU [39, 40, 41].
In the following, we list some evaluation methods and evaluation goals for which
these methods can be used. This list is not complete as there are a lot of different
evaluation methods. Hence, we only present evaluation methods which were used
and evaluated during the course of this work. Additionally, the Single Stimulus (SS )
and Stimulus Comparison (SC) methods [41] are general methods which provide rec-
ommendations for an evaluation. Methods such as the Absolute Category Rating
(ACR) or the Degradation Category Rating (DCR) are specialized methods that are
based either on the SS or the SC method. All methods presented are defined by
the ITU either in ITU-T Rec. P.910 [39], ITU-T Rec. P.911 [40], or ITU-R Rec.
BT.500-11 [41].
Sensory Effect Dataset and Evaluation Recommendations Page 159
Absolute Category Rating (ACR): Suitable for scenarios where each test se-
quence is rated individually, e.g., for evaluating the influence of sensory effects
on the perceived video quality. Moreover, this method provides an ordinal qual-
ity scale ranging from 1 to 5 or 1 to 9.
Absolute Category Rating with Hidden Reference (ACR-HR): Suitable for
scenarios where each test sequence is rated individually but providing an addi-
tional reference version of the test sequences. This reference is not known by
the participants. This method can be used for evaluating different calculation
parameters for the color calculation of light effects or for evaluating different
configurations of sensory effects. Moreover, this method provides an ordinal
quality scale ranging from 1 to 5 or 1 to 9.
Degradation Category Rating (DCR): Desirable for evaluating test sequences
without and with sensory effects. In this method, the participants have to com-
pare two test sequences and state, e.g., the enhancement of the QoE. Moreover,
this method provides an ordinal quality scale ranging from 1 to 5 or 1 to 9.
Double Stimulus Continuous Quality Scale (DSCQS): Similar to the DCR
method, this method allows rating two test sequences which are paired. Instead
of comparing the two sequences, both sequences are rated by the participants
individually. This method is useful for evaluating the impact of sensory effects
on emotions since after each sequence the emotion is rated. Moreover, this
method provides a continuous quality scale (e.g., ranging from 0 to 100) which
offers a wider range of ratings.
Single Stimulus (SS) or Stimulus Comparison (SC): If none of the above
methods is suitable, one can use as a starting point the SS or the SC method.
Both methods are similar with respect to the possibility to use either ordinal
ratings (i.e., scales ranging from 1 to 5 or 1 to 9) or continuous ratings (i.e.,
scales ranging from 0 to 100). The methods only differ in the presentation and
voting. The SS method defines rating each test sequence separately and the
SC method specifies rating a test sequence compared to another test sequence.
Hence, these methods can be selected if none of the above sequences are suitable
for the planned evaluation.
Page 160 Sensory Effect Dataset and Evaluation Recommendations
Besides the evaluation methods, the length of the evaluation is important. The
ITU [39, 40, 41] recommends an evaluation duration of maximum 30 minutes per
participant. Hence, using a stimulus comparison method needs more time per test
sequence than a single stimulus method. Additionally, it is advisable to avoid having
evaluations that last longer than 30 minutes due to the possibility that participants
get fatigue and, thus, not provide reliable results [41].
7.2.3.5 Result Analysis
After the evaluation, it is important to analyse the results. The analysis of the results
can be performed similar to usual evaluations as defined by the ITU [39, 40, 41]. The
only difference is the interpretation of the results, i.e., depending on the goal of
an evaluation, one evaluates the enhancement of the viewing experience of a video
sequence enriched by sensory effects instead of the impairment of the video quality
of a video sequence.
As suggested by the ITU, one needs to check for possible outliers. Therefore, one
can use the procedure described in ITU-R Rec. BT.500-11 [41] or use the modified
z -score with the median absolute deviation (MAD) estimator [121, 126]. For MAD,
a threshold of 3.5 is used. For both outlier detection algorithms, it is important that
the screening happens only once. The reason for this is that after the removal of
outliers new outliers can appear due to the changed data basis and, thus, changed
mean values. Hence, removing the outliers a second time will falsify the results.
After the detection and removal of outliers, one has to report the results as pre-
sented in Section 2.2.2. Additionally, if a discrete scale was used, one can carry out
the Mann-Whitney U test [98, 99] for significance analysis. Moreover, if a continuous
rating scale was used, one can perform a significance analysis such as the Student’s
t-test [114, 123] or the analysis of the variances (ANOVA) [113, 114]. The Student’s
t-test is most suitable if there are always two samples (e.g., video sequences without
and with sensory effects) to compare. The ANOVA is appropriate if there are more
than two samples (e.g., differences between multiple genres). Both methods require
normally distributed results which can be checked using Shapiro-Wilk [115] or kurto-
sis and skewness [122]. Moreover, ANOVA cannot be used if the variances between
samples differ too much. It is important to mention that depending on the evaluation
Sensory Effect Dataset and Evaluation Recommendations Page 161
scenario, the results of the significance analysis need to be interpreted differently.
For example, instead of having a significant difference between the video qualities,
we have a significant difference in the enhancement or impairment of the viewing
experience for videos without and with sensory effects.
Besides the most commonly used methods (i.e., Mann-Whitney U test, ANOVA,
Student’s t-test), additional methods for analyzing the results can be found in [113].
7.3 Summary
In this chapter, we introduced the Sensory Effect Dataset that comprises a large
number of different video sequences from different genres. All video sequences were
annotated with wind and vibration effects. Furthermore, most sequences from the
presented dataset have already been used in subjective quality assessments. The
provided SEM descriptions are based on the most current version of the MPEG-V
standard and, thus, the dataset can be used with any MPEG-V-compliant software
or device. Moreover, the tools used for generating this dataset and the dataset itself
are freely available.
Additionally, we presented in this chapter various test setups for conducting sub-
jective quality assessments based on video sequences enriched by sensory effects.
These test setups are a first step towards a common test environment which can
be used for achieving comparable results throughout different subjective quality as-
sessments.
Finally, in this chapter, we provided recommendations for conducting subjective
quality assessments. That is, we suggested test sequences, the number and type
of participants, and test methods. Furthermore, we explained which result analysis
methods can be used and how outliers can be detected and eliminated.

CHAPTER
8 Conclusions and Future
Work
In this work, the evaluation of multimedia content enriched by sensory effects is
investigated. Therefore, we defined a number of general research questions which are
repeated here:
• How can enriched multimedia content be consumed on existing consumer de-
vices?
• How do sensory effects influence the user or the content?
• How can sensory effects be subjectively evaluated?
In this chapter, we summarize the major contributions for each research objective
that was defined to answer these questions. For convenience the objectives as specified
in Section 1.2 are repeated here:
• to introduce sensory effects which accompany multimedia content and to provide
an enhanced multimedia player supporting sensory effects to enrich the viewing
experience;
• to demonstrate the benefits of sensory effects and to show their impact on
perceived video quality;
• to look into the usage of sensory effects in a World Wide Web scenario by
providing a Web browser plug-in and to conduct measurements on the automatic
generation of sensory effects (i.e., light effects);
• to evaluate the impact of sensory effects on the perceived emotions while con-
suming enriched multimedia content;
• to offer a dataset consisting of multimedia content from different genres enriched
by sensory effects;
Page 164 Conclusions and Future Work
• to present recommendations for conducting subjective quality assessments com-
prising video sequences accompanied by sensory effects;
• to provide a basis for future research in the area of sensory effects and multi-
media.
The introduction of sensory effects and a tool for enhancing the user experience
covered the current research on enriching multimedia content and the MPEG-V: Me-
dia Context and Control standard. Thus, the MPEG-V standard offers researchers
and producers a common basis for annotating and controlling devices capable of ren-
dering sensory effects. Currently, the major research on sensory effects covers the
usage of olfaction and light together with multimedia content. Research on addi-
tional effects like vibration and wind is, to the best of our knowledge, not widely
taken up yet. Previous work [14, 45] and this work contributed a number of tools
for annotating (i.e., SEVino), simulating (i.e., SESim) and rendering (i.e., SEMP,
and AmbientLib with the Web browser plug-in) MPEG-V-compliant descriptions to
enhance the viewing experience while watching multimedia content in a home envi-
ronment.
Moreover, the work demonstrated the benefits of sensory effects and their impact
on the perceived video quality. The conducted assessments clearly indicate that mul-
timedia contents accompanied by additional effects are well perceived and, depending
on the content, increase the viewing experience. Furthermore, the results also show
that the video quality can be decreased to reduce storage space or bandwidth require-
ments if additional sensory effects are provided.
This work also looked into the usage of sensory effects in the WWW as the WWW
becomes more and more important and is already omnipresent. Thus, we presented
evaluations on sensory effects in the context of the WWW. The achieved results
indicate that additional effects enhance the viewing experience and, therefore, are
suitable for Web sites like YouTube, MySpace, etc. Moreover, as the WWW is acces-
sible nearly from everywhere and with every device, we evaluated different parameters
for the calculation of light effects. Therefore, we skipped pixel columns, pixel rows,
and/or whole frames and investigated the impact of this information reduction on the
automatic color calculation. The achieved results indicate that there is no significant
Conclusions and Future Work Page 165
difference if pixel columns, pixel rows, and/or whole frames are skipped. However,
the tendencies of the results show that it is more preferable to skip whole frames
first and, afterwards, pixel rows and pixel columns. This information can be used to
configure the color calculation, e.g., if the end-device (e.g., mobile phone) does not
have enough processing power and, therefore, playback would stutter while rendering
light effects.
Additionally, we investigated the impact of sensory effects on the viewer’s emo-
tions. The assessments which were conducted in three different locations (i.e., Alpen-
Adria-Universitat Klagenfurt, Royal Melbourne Institute of Technology, and Uni-
versity of Wollongong), showed that sensory effects have impact on the perceived
emotions. The intensities of active emotions like worry, fun, anger, etc. are increased
significantly and, hence, can be used to provide the viewer a more intense viewing
experience.
During the preparation of the subjective quality assessments, we detected the lack
of suitable content for performing these evaluations. Therefore, this work introduced
one of the first dataset comprising multimedia content enriched by sensory effects.
In particular, light, wind, and vibration effects are supported by the dataset. More-
over, as sensory effects have different impact on different genres (cf. Chapter 3), the
dataset comprises five major genres which are Action, Sports, Commercial, News,
and Documentary.
As a result of the conducted subjective quality evaluations, we presented and
proposed in this work some recommendations for performing subjective quality eval-
uations. These recommendations are based on already existing subjective quality
assessment methods with some extensions and additional suggestions. Moreover, we
presented different evaluation methods and proposed for which type of evaluation in
the area of sensory effects they are suitable.
The presented evaluations, their results and the recommendations provide a first
basis for future research in this area. Thus, the structure of the assessments and
the achieved results offer other researchers the possibility to conduct similar studies
and compare their results with the presented ones. Moreover, the introduced dataset
gives researchers a common stimuli basis and the recommendations are a starting
point for conducting their own assessments and for the development of a standardized
Page 166 Conclusions and Future Work
evaluation method for sensory effects.
Due to the circumstance that this work provides a basis for future research, we
present a number of research items in this area identified throughout the course of
this work. In the following, we show a list of these items and a short explanation.
• (Semi-)automatic extraction of sensory effects. Currently, only light
effects can be extracted automatically from the content. Further effects (e.g.,
wind, vibration) have to be annotated manually which is time consuming. Thus,
this research item motivates to use various assets (e.g., video content, scripts,
audio streams) for generating SEM descriptions offline or render sensory effects
on-the-fly.
• Objective measurement models/methods for QoE and sensory effects.
At the moment, the QoE and sensory effects can only be evaluated using sub-
jective quality assessment, which is a time consuming task. Thus, there is the
need of objective assessment methods. There is ongoing research for determin-
ing a mapping from QoS to QoE and vice versa [12, 29, 127, 128]. The issues
with the current mappings are that: first, they are only suitable for audio/video
and not for sensory effects; second, there is no common mapping table of ob-
jective PSNR (i.e, dB) to subjective MOS (or vice versa). Therefore, there is
no general agreement on an objective assessment method which can indicate
the subjectively perceived QoE and, hence, there is still the necessity of time
consuming subjective quality assessments.
• Further studies with additional sensory effects and on emotions using
EEG devices. This research topic comprises adding further sensory effects
such as scent or fog to the existing dataset and evaluating their impact on
the viewing experience. Furthermore, as the results presented in this work
(cf. Chapter 6) have shown that sensory effects influence perceived emotions
of the participants, a more sophisticated approach using an EEG device to
achieve more detailed results regarding emotions is desirable. Besides the more
detailed results on emotions, the EEG values can be used to train a classifier for
automatic detection of emotions while watching enriched multimedia content.
Conclusions and Future Work Page 167
Moreover, this topic comprises a deeper investigation on the influence of sensory
effects on passive emotions as the results presented in this work only provide
limited insights.
• Evaluation of the influence of different combinations of sensory ef-
fects and color algorithms on the viewing experience. The results from
the subjective quality assessments presented in this work raise the question how
strong a specific effect influences the viewing experience. Therefore, each sen-
sory effect needs to be evaluated separately and in various combinations. For
example, first only the wind effect should be evaluated, afterwards, wind and
vibration together, and so on. Furthermore, currently only average color for
light effects is used in the evaluations, but there is the question how dominant
color, or other algorithms, are perceived by the viewers. For example, a domi-
nant color algorithm may not change the light colors as frequently as an average
color algorithm. Thus, light effects may not be perceived as intense as with an
average color algorithm.
• Synchronization of sensory effects with multimedia content. Similar
to the investigation of lip-synchronization years ago, this also needs to be done
for sensory effects. There is already research on the synchronization of olfac-
tory effects [58]. Similar research needs to be performed with light, wind, and
vibration effects, for example, how late or early can a wind effect be activated
to not be perceived as annoying by the viewer.
• Developing a standardized assessment methodology for sensory ef-
fects. This research topic focuses on the refinement of the recommendations
illustrated in this work (cf. Chapter 7). The ultimate goal of this improvement
is the development of a subjective quality assessment method for sensory effects
which is agreed upon by the community and is widely used.

BIBLIOGRAPHY Page 169
Bibliography
[1] A. Smolic, K. Mueller, P. Merkle, P. Kauff, and T. Wiegand. An Overview
of Available and Emerging 3D Video Formats and Depth Enhanced Stereo as
Efficient Generic Solution. In Proceedings of the 27th Conference on Picture
Coding Symposium, PCS’09, pages 389–392, Piscataway, NJ, USA, 2009. IEEE
Press.
[2] YouTube Blog. Now in 3D: Join the Experiment With Us!, 2009.
http://bit.ly/lZ6pd. Accessed 28. May 2012.
[3] M. Barkowsky, R. Cousseau, and P. L. Callet. Influence of Depth Rendering on
the Quality of Experience for an Autostereoscopic Display. In Proceedings of the
1st International Workshop on Quality of Multimedia Experience (QoMEX’09),
pages 192–197, July 2009.
[4] Universal Studios. http://www.universalstudios.com, Accessed 28. May 2012.
[5] P. Seuntiens, I. Vogels, and A. van Keersop. Visual Experience of 3D-TV with
Pixelated Ambilight. In Proceeding of the 10th Annual International Workshop
on Presence, pages 339–344, 2007.
[6] G. Ghinea and O. Ademoye. Olfaction-Enhanced Multimedia: Perspectives
and Challenges. Multimedia Tools and Applications, 55(3):601–626, 2011.
10.1007/s11042-010-0581-4.
[7] S. H. A. Begemann. A Scientific Study on the Effects of
Ambilight in Flat-Panel Displays. Published: 22. July 2005,
http://www.eetimes.com/design/embedded/4012996/A-scientific-study-on-
the-effects-of-Ambilight-in-flat-panel-displays, Accessed: 07. November 2011.
[8] A. Chang and C. O’Sullivan. Audio-haptic feedback in mobile phones. In CHI
’05 Extended Abstracts on Human Factors in Computing Systems, CHI EA ’05,
pages 1264–1267, New York, NY, USA, 2005. ACM.
Page 170 BIBLIOGRAPHY
[9] V. Roto, E. Law, A. Vermeeren, and J. Hoonhout, editors. User Ex-
perience White Paper - Bringing Clarity to the Concept of User Ex-
perience. Dagstuhl Seminar on Demarcating User Experience, 2011.
http://www.allaboutux.org/uxwhitepaper.
[10] E. Aarts and B. de Ruyter. New Research Perspectives on Ambient Intelligence.
Journal of Ambient Intelligence and Smart Environments, 1(1):5–14, Jan. 2009.
[11] F. Pereira. A Triple User Characterization Model for Video Adaptation and
Quality of Experience Evaluation. In Proceedings of the IEEE 7th Workshop on
Multimedia Signal Processing - MMSP, pages 1 – 4, Shanghai, China, October
2005.
[12] W. Wu, A. Arefin, R. Rivas, K. Nahrstedt, R. Sheppard, and Z. Yang. Quality
of Experience in Distributed Interactive Multimedia Environments: Toward a
Theoretical Framework. In Proceedings of the 17th ACM International Confer-
ence on Multimedia, pages 481–490. ACM, 2009.
[13] ISO/IEC 23005:2011. Information Technology – Media Context and Control.
ISO/IEC, 2011.
[14] B. Rainer. Integrating Sensory Effects into the World Wide Web. Master’s
thesis, Alpen-Adria-Universitat Klagenfurt, Klagenfurt, Austria, 2012.
[15] amBX UK Ltd. http://www.ambx.com, Accessed: 30. October 2011.
[16] G. Ghinea and O. A. Ademoye. Olfaction-Enhanced Multimedia: Bad for In-
formation Recall? In Proceedings of the IEEE International Conference on
Multimedia and Expo (ICME 2009), pages 970–973. IEEE, 2009.
[17] ITU-T Rec. E.800. Definitions of Terms Related to Quality of Service, Septem-
ber 2008.
[18] P. Reichl and F. Hammer. Charging for Quality-of-Experience: a New Paradigm
for Pricing IP-based Services. In Proceedings of the 2nd ISCA Tutorial and
Research Workshop on Perceptual Quality of Systems, Berlin, Germany, 2006.
BIBLIOGRAPHY Page 171
[19] N. Venkatasubramanian and K. Nahrstedt. An Integrated Metric for Video
QoS. In Proceedings of the 5th ACM International Conference on Multimedia,
MM ’97, pages 371–380, New York, NY, USA, 1997. ACM.
[20] P. Reichl, J. Fabini, M. Happenhofer, and C. Egger. From QoS to QoX: A
Charging Perspective. In Proceedings of the 18th ITC Specialist Seminar on
Quality of Experience, Karlskrona, Sweden, 2008.
[21] ITU-T Rec. P.10. Amendment 2: New Definitions for Inclusion in Recommen-
dation ITU-T P.10/G.100, July 2008.
[22] Qualinet. http://www.qualinet.eu, Accessed: 23. November 2012.
[23] European Network on Quality of Experience in Multimedia Systems and Ser-
vices (COST Action IC 1003). Qualinet White Paper on Definitions of Quality
of Experience. P. Le Callet, S. Moller and A. Perkis, editors, Version 1.1, Lau-
sanne, Switzerland, June 2012.
[24] T. Ebrahimi. Quality of Multimedia Experience: Past, Present
and Future. Keynote at ACM Multimedia 2009, October 2009.
http://www.slideshare.net/touradj ebrahimi/qoe.
[25] M. Ries, P. Frohlich, and R. Schatz. QoE Evaluation of High-Definition IPTV
Services. In Proceedings of 21st International Conference Radioelektronika 2011,
pages 1–5. IEEE, Apr. 2011.
[26] R. Stankiewicz, P. Cholda, and A. Jajszczyk. QoX: What is it really? IEEE
Communications Magazine, 49(4):148 –158, April 2011.
[27] D. Smith, J. Mullooly, W. Jaeger, and T. Scholl. Label Edge Router
Forwarding of IPv4 Option Packets. IETF RFC 6178, March 2011.
http://tools.ietf.org/html/rfc6178.
[28] J. Klaue, B. Rathke, and A. Wolisz. EvalVid - A Framework for Video Transmis-
sion and Quality Evaluation. In Proceedings of the 13th Conference on Modelling
Techniques and Tools for Computer Performance Evaluation, Lecture Notes in
Computer Science, pages 255–272. Springer, 2003.
Page 172 BIBLIOGRAPHY
[29] T. Zinner, O. Abboud, O. Hohlfeld, T. Hossfeld, and P. Tran-Gia. Towards
QoE Management for Scalable Video Streaming. In Proceedings of the 21st
ITC Specialist Seminar on Multimedia Applications-Traffic, Performance and
QoE, pages 64–69, 2010.
[30] D. De Vera, P. Rodrıguez-Bocca, and G. Rubino. Automatic Quality of Experi-
ence Measuring on Video Delivering Networks. SIGMETRICS Perform. Eval.
Rev., 36(2):79–82, August 2008.
[31] M. Fiedler, T. Hossfeld, and P. Tran-Gia. A Generic Quantitative Relationship
between Quality of Experience and Quality of Service. IEEE Network, 24(2):36–
41, Mar. 2010.
[32] S. Winkler. Perceptual Video Quality Metrics – A Review. In H. R. Wu
and K. R. Rao, editors, Digital Video Image Quality and Perceptual Coding,
chapter 5, pages 154–179. CRC Press, November 2005.
[33] S. Winkler. A Perceptual Distortion Metric for Digital Color Video. In Proceed-
ings of the Society of Photographic Instrumentation Engineers (SPIE), volume
3644, pages 175–184, San Jose, CA, January 1999.
[34] C. J. van den Branden Lambrecht and O. Verscheure. Perceptual Quality Mea-
sure using a Spatio-Temporal Model of the Human Visual System. In Proceed-
ings of the Society of Photographic Instrumentation Engineers (SPIE), volume
2668, pages 450–461. Spie, 1996.
[35] S. Daly. The Visible Differences Predictor: An Algorithm for the Assessment
of Image Fidelity. In A. B. Watson, editor, Digital Images and Human Vision,
pages 179–206. MIT Press, Cambridge, MA, USA, 1993.
[36] A. B. Watson. Image Data Compression Having Mini-
mum Perceptual Error. Patent, June 1995. US 5426512,
http://www.patentlens.net/patentlens/patent/US 5426512/en/.
[37] A. B. Watson. Image Data Compression Having Mini-
mum Perceptual Error. Patent, May 1997. US 5629780,
http://www.patentlens.net/patentlens/patent/US 5629780/en/.
BIBLIOGRAPHY Page 173
[38] A. P. Hekstra, J. Beerends, D. Ledermann, F. E. de Caluwe, S. Kohler, R. H.
Koenen, S. Rihs, M. Ehrsam, and D. Schlauss. PVQM - A Perceptual Video
Quality Measure. Signal Processing: Image Communication, 17(10):781–798,
November 2002.
[39] ITU-T Rec. P.910. Subjective Video Quality Assessment Methods for Multi-
media Applications, April 2008.
[40] ITU-T Rec. P.911. Subjective Audiovisual Quality Assessment Methods for
Multimedia Applications, December 1998.
[41] ITU-R Rec. BT.500-11. Methodology for the Subjective Assessment of the
Quality of Television Pictures, 2002.
[42] P. Corriveau. Video Quality Testing. In H. R. Wu and K. R. Rao, editors,
Digital Video Image Quality and Perceptual Coding, chapter 4, pages 125–153.
CRC Press, November 2005.
[43] S. Ishihara. Ishihara’s Tests for Colour-Blindness. Kanehara & Co., Tokyo,
Japan, 1985.
[44] H. Snellen. Probebuchstaben zur Bestimmung der Sehscharfe. P. W. van de
Weijer, Utrecht, 1892.
[45] M. Waltl. Enriching Multimedia with Sensory Effects: Annotation and Simula-
tion Tools for the Representation of Sensory Effects. VDM Verlag Saarbrucken,
Saarbrucken, Germany, 2010.
[46] M. Waltl. Annotation and Simulation Tools for the Representation of Sen-
sory Effects. Master’s thesis, Alpen-Adria-Universitat Klagenfurt, Klagenfurt,
Austria, 2009.
[47] B. de Ruyter and E. Aarts. Ambient Intelligence: Visualizing the Future. In
Proceedings of the Working Conference on Advanced Visual Interfaces, AVI ’04,
pages 203–208, New York, NY, USA, 2004. ACM.
Page 174 BIBLIOGRAPHY
[48] J. D. Bullough, Y. Akashi, C. R. Fay, and M. G. Figueiro. Impact of Surrounding
Illumination on Visual Fatigue and Eyestrain While Viewing Television. Journal
of Applied Sciences, 6(8):1664–1670, Aug. 2006.
[49] Philips amBX PC Gaming Accessories. http://bit.ly/jilnyg, Accessed: 28. May
2012.
[50] Cyborg Gaming Lights. http://www.cyborggaming.com, Accessed: 30. October
2011.
[51] H. Zabel and A. Rettberg. Prototyping an Ambient Light System - A Case
Study. In B. Kleinjohann, L. Kleinjohann, R. Machado, C. Pereira, and P. Thi-
agarajan, editors, From Model-Driven Design to Resource Management for Dis-
tributed Embedded Systems, volume 225 of IFIP International Federation for
Information Processing, pages 55–64. Springer Boston, 2006.
[52] T. Recuber. Immersion Cinema: The Rationalization and Reenchantment of
Cinematic Space. Space and Culture, 10(3):315–330, Aug. 2007.
[53] M. J. Smith and P. J. Kiger. The Lingering Reek of ’Smell-O-Vision’. Published:
05. February 2006, http://articles.latimes.com/2006/feb/05/magazine/tm-
oops6, Accessed: 07. November 2011.
[54] J. J. Kaye. Making Scents: Aromatic Output for HCI. Interactions, 11(1):48–
61, January 2004.
[55] Dale Air. http://www.daleair.com, Accessed: 30. October 2011.
[56] Sensory Acumen. http://www.sensoryacumen.com, Accessed: 07. November
2011.
[57] Scent Sciences. http://www.scentsciences.com, Accessed: 25. December 2011.
[58] O. A. Ademoye and G. Ghinea. Synchronization of Olfaction-Enhanced Multi-
media. IEEE Transactions on Multimedia, 11(3):561–565, Apr. 2009.
BIBLIOGRAPHY Page 175
[59] G. Ghinea and O. A. Ademoye. Perceived Synchronization of Olfactory Multi-
media. IEEE Transactions on Systems, Man, and Cybernetics - Part A: Systems
and Humans, 40(4):657–663, July 2010.
[60] S. Sugimoto, D. Noguchi, Y. Bannnai, and K. Okada. Ink Jet Olfactory Display
Enabling Instantaneous Switches of Scents. In Proceedings of the International
Conference on Multimedia, pages 301–310. ACM, 2010.
[61] D. Noguchi, S. Sugimoto, Y. Bannai, and K. Okada. Time Characteristics of
Olfaction in a Single Breath. In Proceedings of the 2011 Annual Conference on
Human Factors in Computing Systems, pages 83–92. ACM, 2011.
[62] C. Wisneski, H. Ishii, A. Dahley, M. G. Gorbet, S. Brave, B. Ullmer, and
P. Yarin. Ambient Displays: Turning Architectural Space into an Interface
between People and Digital Information. Lecture Notes in Computer Science,
1370:22–32, 1998.
[63] A. Chang and H. Ishii. Sensorial Interfaces. In Proceedings of the 6th Conference
on Designing Interactive Systems, DIS ’06, pages 50–59, New York, NY, USA,
2006. ACM.
[64] ISO/IEC 23005-1:2011. Information Technology – Media Context and Control
– Part 1: Architecture. ISO/IEC, 2011.
[65] M. Waltl, C. Timmerer, and H. Hellwagner. A Test-Bed for Quality of Multi-
media Experience Evaluation of Sensory Effects. In Proceedings of the 1st Inter-
national Workshop on Quality of Multimedia Experience (QoMEX’09), pages
145–150, July 2009.
[66] ISO/IEC 23005-3:2011. Information Technology – Media Context and Control
– Part 3: Sensory Information. ISO/IEC, 2011.
[67] ISO/IEC 23005-2:2011. Information Technology – Media Context and Control
– Part 2: Control Information. ISO/IEC, 2011.
[68] ISO/IEC 23005-4:2011. Information Technology – Media Context and Control
– Part 4: Virtual World Object Characteristics. ISO/IEC, 2011.
Page 176 BIBLIOGRAPHY
[69] ISO/IEC 23005-5:2011. Information Technology – Media Context and Control
– Part 5: Data Formats for Interaction Devices. ISO/IEC, 2011.
[70] ISO/IEC 23005-6:2011. Information Technology – Media Context and Control
– Part 6: Common Types and Tools. ISO/IEC, 2011.
[71] ISO/IEC 23005-7:2011. Information Technology – Media Context and Control
– Part 7: Conformance and Reference Software. ISO/IEC, 2011.
[72] C. Timmerer, M. Waltl, B. Rainer, and H. Hellwagner. Assessing the Quality
of Sensory Experience for Multimedia Presentations. Signal Processing: Image
Communication, 27(8):909–916, 2012. doi:10.1016/j.image.2012.01.016.
[73] ISO/IEC 14977:1996. Information Technology – Syntactic Metalanguage – Ex-
tended BNF. ISO/IEC, 1996.
[74] ISO/IEC 21000-7:2007. Information Technology – Multimedia Framework
(MPEG-21) – Part 7: Digital Item Adaptation. ISO/IEC, 2007.
[75] B. Manjunath, P. Salembier, and T. Sikora. Introduction to MPEG-7: Multi-
media Content Description Interface. John Wiley & Sons, Inc., New York, NY,
USA, 2002.
[76] B. S. Choi, S. H. Joo, and H. Y. Lee. Sensory Effect Metadata for SMMD
Media Service. Proceedings of the Fourth International Conference on Internet
and Web Applications and Services, pages 649–654, 2009.
[77] S. Pyo, S. H. Joo, B. S. Choi, and M. Kim. A Metadata Schema Design on
Representation of Sensory Effect Information for Sensible Media and its Service
Framework using UPnP. In Proceedings of the 10th International Conference
on Advanced Communication Technology (ICACT’08), 2008.
[78] K. Yoon, B. S. Choi, E.-S. Lee, and T.-B. Lim. 4-D Broadcasting with MPEG-V.
In IEEE International Workshop on Multimedia Signal Processing (MMSP’10),
pages 257–262, Saint-Malo, France, October 2010.
BIBLIOGRAPHY Page 177
[79] J. Yun, J. Jang, and K. Moon. Development of the Real-Sense Media Broad-
casting Service System based on the SMMD. In Proceedings of the IEEE Inter-
national Conference on Consumer Electronics (ICCE), pages 435–436. IEEE,
2011.
[80] J. Yun, J. Jang, K. Park, and D. Han. Real-Sense Media Representation Tech-
nology using Multiple Devices Synchronization. In S. Lee and P. Narasimhan,
editors, Software Technologies for Embedded and Ubiquitous Systems, volume
5860 of Lecture Notes in Computer Science, pages 343–353. Springer Berlin
Heidelberg, 2009.
[81] C. Timmerer, S. K. Kim, and J. Ryu, editors. Committee Draft of ISO/IEC
23005 Sensory Information. ISO/IEC JTC 1/SC 29/WG 11/N10785, London,
UK, July 2009.
[82] M. Waltl, C. Timmerer, and H. Hellwagner. Increasing the User Experience
of Multimedia Presentations with Sensory Effects. In Proceedings of the 11th
International Workshop on Image Analysis for Multimedia Interactive Services
(WIAMIS 2010), pages 1–4, April 2010.
[83] M. Waltl, B. Rainer, C. Timmerer, and H. Hellwagner. An End-to-End Tool
Chain for Sensory Experience based on MPEG-V. Signal Processing: Image
Communication, 28(2):136–150, 2013. doi:10.1016/j.image.2012.10.009.
[84] B. S. Choi, E.-S. Lee, and K. Yoon. Streaming Media with Sensory Effect. In
Proceedings of the International Conference on Information Science and Appli-
cations (ICISA), pages 1–6, April 2011.
[85] Sensory Experience Lab. http://selab.itec.aau.at, Accessed: 26. March 2012.
[86] R. L. Storms, M. J. Zyda. Interactions in Perceived Quality of Auditory-Visual
Displays. Presence, 9(6):557–580, December 2000.
[87] M. Waltl, C. Timmerer, B. Rainer, and H. Hellwagner. Sensory Effect Dataset
and Test Setups. In Proceedings of the 4th International Workshop on Quality
Page 178 BIBLIOGRAPHY
of Multimedia Experience (QoMEX’12), pages 115–120, Yarra Valley, Australia,
2012. IEEE.
[88] Institute for Telecommunication Sciences (ITS). Research Re-
lated to New Audiovisual Quality Recommendation, 2011.
http://www.its.bldrdoc.gov/resources/video-quality-research/standards/jav-
dist-related-research.aspx, Accessed: 12. August 2012.
[89] S. Zielinski, F. Rumsey, and S. Bech. On some biases encountered in modern
audio quality listening tests-a review. Journal of the Audio Engineering Society
(JAES), 56(6):427–451, 2008.
[90] C. Fenimore, V. Baroncini, T. Oelbaum, and T. K. Tan. Subjective Testing
Methodology in MPEG Video Verification. In A. G. Tescher, editor, Society
of Photo-Optical Instrumentation Engineers (SPIE) Conference Series, volume
5558, pages 503–511, Nov. 2004.
[91] L. R. Peterson and M. J. Peterson. Short-Term Retention of Individual Verbal
Items. Journal of Experimental Psychology, 58(3):193–198, 1959.
[92] The Human Memory. Short-Term (Working) Memory. http://www.human-
memory.net/types short.html, Accessed: 12. August 2012.
[93] P. Frohlich, S. Egger, R. Schatz, M. Muhlegger, K. Masuch, and B. Gardlo.
QoE in 10 Seconds: Are Short Video Clip Lengths Sufficient for Quality of
Experience Assessment? In I. Burnett and H. Wu, editors, Proceedings of the
4th International Workshop on Quality of Multimedia Experience (QoMEX’12),
pages 242–247, Yarra Valley, Australia, 2012. IEEE.
[94] FFmpeg. http://www.ffmpeg.com, Accessed 22. June 2012.
[95] MediaInfo. http://mediainfo.sourceforge.net, Accessed 22. June 2012.
[96] J.-S. Lee, F. De Simone, and T. Ebrahimi. Subjective Quality Evaluation of
Foveated Video Coding Using Audio-Visual Focus of Attention. IEEE Journal
of Selected Topics in Signal Processing, 5(7):1322–1331, Nov. 2011.
BIBLIOGRAPHY Page 179
[97] O. Le Meur, A. Ninassi, P. Le Callet, and D. Barba. Overt Visual Atten-
tion for Free-Viewing and Quality Assessment Tasks. Signal Processing: Image
Communication, 25(7):547–558, Aug. 2010.
[98] H. B. Mann and D. R. Whitney. On a Test of Whether one of Two Random
Variables is Stochastically Larger than the Other. The Annals of Mathematical
Statistics, 18(1):50–60, 1947.
[99] M. P. Fay and M. A. Proschan. Wilcoxon-Mann-Whitney or t-test? On As-
sumptions for Hypothesis Tests and Multiple Interpretations of Decision Rules.
Statistics Surveys, 4:1–39, 2010.
[100] O. Nemethova, M. Ries, A. Dantcheva, S. Fikar, and M. Rupp. Test Equipment
of Time-Variant Subjective Perceptual Video Quality in Mobile Terminals. In
Proceedings of International Conference on Human Computer Interaction (HCI
2005), pages 1–6, Phoenix, USA, November 2005.
[101] R. N. Henson. Item Repetition in Short-Term Memory: Ranschburg Re-
peated. Journal of Experimental Psychology. Learning, Memory, and Cognition,
24(5):1162–81, 1998.
[102] B. H. Challis and R. Sidhu. Effects of Massed Repetition with Level of Process-
ing on Implicit and Explicit Memory Tests. Tsukuba Psychological Research,
19:21–27, 1997.
[103] ISO/IEC 23005-3 FCD. Information Technology - Media Context and Control
- Sensory Information. ISO/IEC JTC 1/SC 29/WG 11/N10987, Xi’an, China,
October 2009.
[104] M. Waltl, C. Timmerer, and H. Hellwagner. Improving the Quality of Multime-
dia Experience through Sensory Effects. In Proceedings of the 2nd International
Workshop on Quality of Multimedia Experience (QoMEX’10), pages 124–129,
June 2010.
[105] Joint Video Team (JVT) of ISO/IEC and MPEG & ITU-T VCEG. Joint
Scalable Video Model (JSVM) 9, January 2007.
Page 180 BIBLIOGRAPHY
[106] G. Bjontegaard. Calculation of Average PSNR Differences between RD Curves.
ITU-T VCEG Meeting, Document VCEG-M33, Austin, USA, 2001.
[107] W3C. Video in the Web Activity Statement. Published: 2008,
http://bit.ly/vTDFZK, Accessed: 09. February 2013.
[108] C. Timmerer, M. Waltl, and H. Hellwagner. Are Sensory Effects Ready for the
World Wide Web? In A. Carreras, J. Delgado, X. Maronas, and V. Rodrıguez,
editors, Proceedings of the Workshop on Interoperable Social Multimedia Ap-
plications (WISMA 2010), pages 57–60, Aachen, Germany, May 2010. CEUR
Workshop Proceedings.
[109] M. Waltl, C. Timmerer, B. Rainer, and H. Hellwagner. Sensory Effects for Am-
bient Experiences in the World Wide Web. Multimedia Tools and Applications,
pages 1–20, 2012. doi:10.1007/s11042-012-1099-8, Available Online: May. 1.
[110] M. Waltl, C. Timmerer, B. Rainer, and H. Hellwagner. Sensory Ef-
fects for Ambient Experiences in the World Wide Web. Technical Report
TR/ITEC/11/1.13, Institute of Information Technology, Alpen-Adria Univer-
sitat Klagenfurt, Klagenfurt, 2011.
[111] Gecko SDK. https://developer.mozilla.org/en/gecko sdk, Accessed: 02. May
2012.
[112] I. Hickson. HTML5, Working Draft. W3C. http://www.w3.org/TR/2010/WD-
html5-20100624/, Accessed: 02. May 2012.
[113] R. Lowry. Concepts and Applications of Inferential Statistics.
http://vassarstats.net/textbook/, Accessed: 21. May 2012, 2012.
[114] J. DeCoster. Testing Group Differences using t-tests, ANOVA, and Nonpara-
metric Measures. http://www.stat-help.com/notes.html, Accessed: 04. May
2012, 2006.
[115] S. S. Shapiro and M. B. Wilk. An Analysis of Variance Test for Normality.
Biometrika, 3(52):591–611, 1965.
BIBLIOGRAPHY Page 181
[116] J. Rottenberg, R. D. Ray, and J. J. Gross. Emotion Elicitation Using Films.
In J. A. Coan and J. B. Allen, editors, Handbook of Emotion Elicitation and
Assessment, pages 9–28. Oxford University Press, 2007.
[117] B. Rainer, M. Waltl, E. Cheng, M. Shujau, C. Timmerer, S. Davis, I. Burnett,
C. Ritz, and H. Hellwagner. Investigating the Impact of Sensory Effects on
the Quality of Experience and Emotional Response in Web Videos. In Proceed-
ings of the 4th International Workshop on Quality of Multimedia Experience
(QoMEX’12), pages 278–283, Yarra Valley, Australia, 2012. IEEE.
[118] T. Tsoneva, P. Fonseca, and J. Skowronek. Towards a Ground Truth for Af-
fective Classification in Movies. In Proceedings of the 11th IEEE International
Symposium on Multimedia, ISM ’09, pages 527–532, Washington, DC, USA,
2009. IEEE Computer Society.
[119] B. de Spinoza. Ethics. World Literature Series. Wordsworth Editions, 1997.
[120] J. Neu. Emotion, Thought & Therapy: A Study of Hume and Spinoza and the
Relationship of Philosophical Theories of the Emotions to Psychological Theo-
ries of Therapy. University of California Press, Berkeley, 1977.
[121] V. Barnett and T. Lewis. Outliers in Statistical Data. Wiley Series in Proba-
bility & Statistics. John Wiley and Sons, New York, Apr. 1994.
[122] L. T. DeCarlo. On the Meaning and Use of Kurtosis. Psychological Methods,
2(3):292–307, 1997. doi:10.1037/1082-989X.2.3.292.
[123] B. L. Welch. The Significance of the Difference between two Means when the
Population Variances are Unequal. Biometrika, 29(3-4):350–362, Feb. 1938.
[124] Xiph.Org Foundation. http://www.xiph.org, Accessed: 06. May 2012.
[125] TREC Video Retrieval Evaluation. http://trecvid.nist.gov/, Accessed: 06. May
2012.
[126] B. Iglewicz and D. Hoaglin. How to Detect and Handle Outliers. ASQC Basic
References in Quality Control. ASQC Quality Press, 1993.
Page 182 BIBLIOGRAPHY
[127] T. Wang, A. Pervez, and H. Zou. VQM-based QoS/QoE Mapping for Streaming
Video. In Proceedings of the 3rd IEEE International Conference on Broadband
Network and Multimedia Technology (IC-BNMT), pages 807–812, Oct. 2010.
[128] D. Rodrigues, E. Cerqueira, and E. Monteiro. Quality of Service and Quality
of Experience in Video Streaming. In Proceedings of the International Work-
shop on Traffic Management and Traffic Engineering for the Future Internet
(FITraMEn2008), Porto, Portugal, Dec. 2008.
[129] T. Kirkman. Statistics to Use. Published: 1996,
http://www.physics.csbsju.edu/stats/, Accessed: 01. May, 2012.
LIST OF PUBLICATIONS Page 183
List of Publications
This chapter lists all publications published during the course of this work.
Conference/Workshop Proceedings
• M. Waltl, B. Rainer, C. Timmerer, H. Hellwagner, ”A Toolset for the Authoring,
Simulation, and Rendering of Sensory Experiences”, In Proceedings of the ACM
Multimedia 2012, Nara, Japan, pp. 1469-1472, October/November 2012.
• B. Rainer, M. Waltl, E. Cheng, M. Shujau, C. Timmerer, S. Davis, I. Burnett, C.
Ritz, H. Hellwagner, ”Investigating the Impact of Sensory Effects on the Quality
of Experience and Emotional Response in Web Videos”, In Proceedings of the
4th International Workshop on Quality of Multimedia Experience (QoMEX’12),
Yarra Valley, Australia, pp. 278-283, July 2012.
• M. Waltl, C. Timmerer, B. Rainer, H. Hellwagner, ”Sensory Effect Dataset and
Test Setups”, In Proceedings of the 4th International Workshop on Quality
of Multimedia Experience (QoMEX’12), Yarra Valley, Australia, pp. 115-120,
July 2012.
• M. Waltl, B. Rainer, C. Timmerer, H. Hellwagner, ”Enhancing the User Expe-
rience with the Sensory Effect Media Player and AmbientLib”, In Advances in
Multimedia Modeling (K. Schoffmann, B. Merialdo, A. Hauptmann, C. Ngo, Y.
Andreopoulos, C. Breiteneder, eds.), Springer Verlag, Berlin, Heidelberg, pp.
624-626, January 2012.
• M. Waltl, B. Rainer, C. Timmerer, H. Hellwagner, ”Sensory Experience for
Videos on the Web”, Proceedings of the Workshop on Multimedia on the Web
2011 (MMWeb2011), Graz, Austria, September 2011.
• M. Waltl, C. Timmerer, B. Rainer, H. Hellwagner, ”Sensory Effects for Ambient
Experiences in the World Wide Web”, In Reports of the Institute of Information
Page 184 LIST OF PUBLICATIONS
Technology, TR/ITEC/11/1.13, Tech. Rep, Alpen-Adria Universitat Klagen-
furt, Klagenfurt, pp. 12, July 2011.
• M. Waltl, ”The Next Dimension of Video Experience: Sensory Effects”, Pro-
ceedings of the 12th IEEE International Symposium on a World of Wireless,
Mobile and Multimedia Networks (WoWMoM) (IEEE WoWMoM 2011 - PhD
Forum), Lucca, Italy, June 2011.
• M. Waltl, C. Raffelsberger, C. Timmerer, H. Hellwagner, ”Metadata-based Con-
tent Management and Sharing System for Improved User Experience”, Pro-
ceedings of the 4th InterMedia Open Forum (IMOF 2010), Palma de Mallorca,
Spain, September 2010.
• C. Timmerer, M. Waltl, H. Hellwagner, ”Are Sensory Effects Ready for the
World Wide Web?”, Proceedings of the Workshop on Interoperable Social Mul-
timedia Applications (WISMA 2010), Barcelona, Spain, May 2010.
• M. Waltl, C. Timmerer, H. Hellwagner, ”Improving the Quality of Multimedia
Experience through Sensory Effects”, Proceedings of the Second International
Workshop on Quality of Multimedia Experience (QoMEX 2010), Trondheim,
Norway, June 2010.
• M. Waltl, C. Timmerer, H. Hellwagner, ”Increasing the User Experience of
Multimedia Presentations with Sensory Effects”, Proceedings of the 11th In-
ternational Workshop on Image Analysis for Multimedia Interactive Services
(WIAMIS’10), Desenzano del Garda, Italy, April 2010.
• C. Timmerer, J. Gelissen, M. Waltl, H. Hellwagner, ”Interfacing with Virtual
Worlds”, Proceedings of the 2009 NEM Summit, Saint-Malo, France, September
2009.
• M. Waltl, C. Timmerer, H. Hellwagner, ”A Test-Bed for Quality of Multimedia
Experience Evaluation of Sensory Effects”, Proceedings of the First Interna-
tional Workshop on Quality of Multimedia Experience (QoMEX 2009), San
Diego, USA, pp. 145-150, July 2009.
LIST OF PUBLICATIONS Page 185
Journals/Special Issues
• M. Waltl, B. Rainer, C. Timmerer, H. Hellwagner, ”An End-to-End Tool Chain
for Sensory Experience based on MPEG-V”, Signal Processing: Image Commu-
nication, Volume 28, Issue 2, pp.136-150, 2013, doi:10.1016/j.image.2012.10.009.
• M. Waltl, C. Timmerer, B. Rainer, H. Hellwagner, ”Sensory Effects for Ambi-
ent Experiences in the World Wide Web”, Multimedia Tools and Applications,
pp. 1-20, 2012, doi:10.1007/s11042-012-1099-8.
• C. Timmerer, M. Waltl, B. Rainer, H. Hellwagner, ”Assessing the Quality
of Sensory Experience for Multimedia Presentations”, Signal Processing: Im-
age Communication, Volume 27, Issue 8, pp. 909-916, 2012, doi:10.1016/
j.image.2012.01.016.

APPENDIX
A Influence of Sensory Effects
Experiment Material
This chapter presents the introduction and the questionnaire of the subjective quality
assessments presented in Chapter 3. Please note that the questionnaire is only an
example as the order of the video sequences varied between candidates and, thus,
also the order of the sequences on the questionnaire varies between the participants.
Furthermore, this chapter shows the tables of the Mann-Whitney U test calculation
(cf. Section A.3) conducted during the statistical analysis.
A.1 Introduction
Welcome to our subjective quality assessment!
In this experiment, short video sequences are shown. Each sequence is presented
twice where the first sequence represents the reference and the second sequences is
enriched with effects. Between the two sequences there is a two seconds break. At the
end of each sequence pair you should rate the enrichment of your quality of experience
between these two videos. For this you have five seconds. The rating is done using
a five-level scale that represents the difference of the second sequence with respect to
the first. The scale reaches from 5: Big enhancement, over 3: Imperceptible, to 1:
Very annoying. Please only check integer values and do not use fractions.
Value Description5 Big enhancement4 Little enhancement3 Imperceptible2 Annoying1 Very annoying
Your evaluation must reflect your opinion on the combined overall quality of video
sequences and effects.
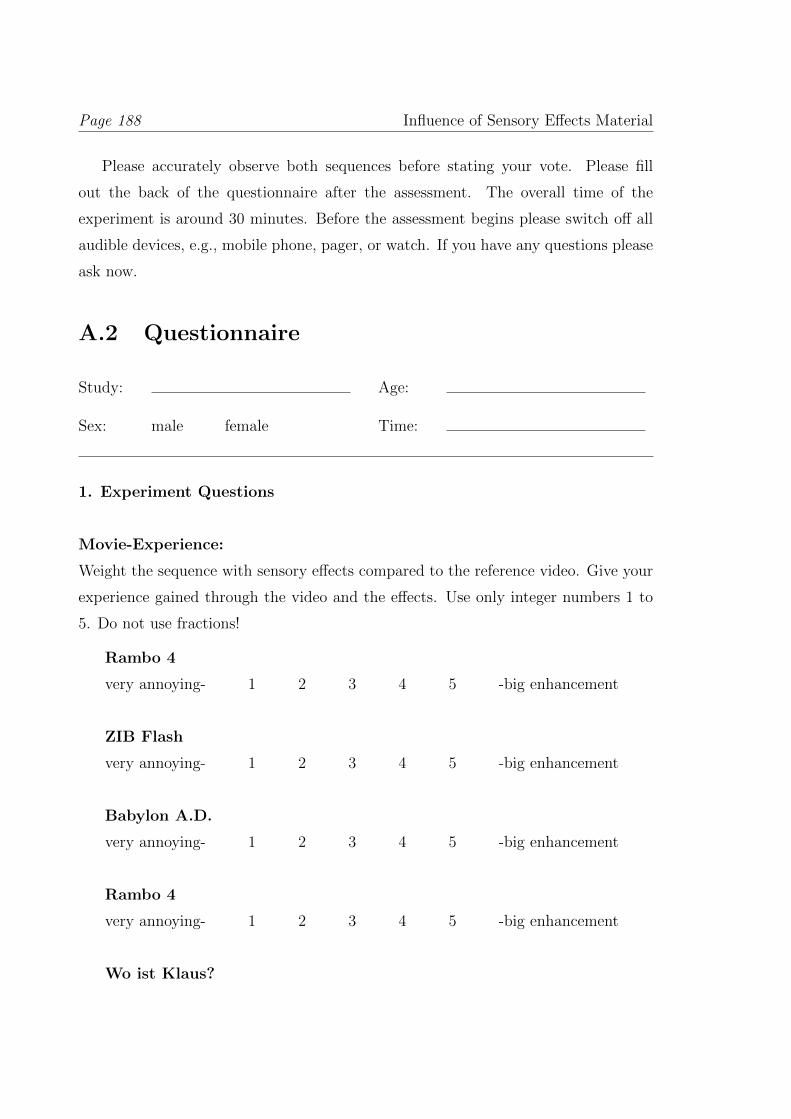
Page 188 Influence of Sensory Effects Material
Please accurately observe both sequences before stating your vote. Please fill
out the back of the questionnaire after the assessment. The overall time of the
experiment is around 30 minutes. Before the assessment begins please switch off all
audible devices, e.g., mobile phone, pager, or watch. If you have any questions please
ask now.
A.2 Questionnaire
Study: Age:
Sex: male female Time:
1. Experiment Questions
Movie-Experience:
Weight the sequence with sensory effects compared to the reference video. Give your
experience gained through the video and the effects. Use only integer numbers 1 to
5. Do not use fractions!
Rambo 4
very annoying- 1 2 3 4 5 -big enhancement
ZIB Flash
very annoying- 1 2 3 4 5 -big enhancement
Babylon A.D.
very annoying- 1 2 3 4 5 -big enhancement
Rambo 4
very annoying- 1 2 3 4 5 -big enhancement
Wo ist Klaus?
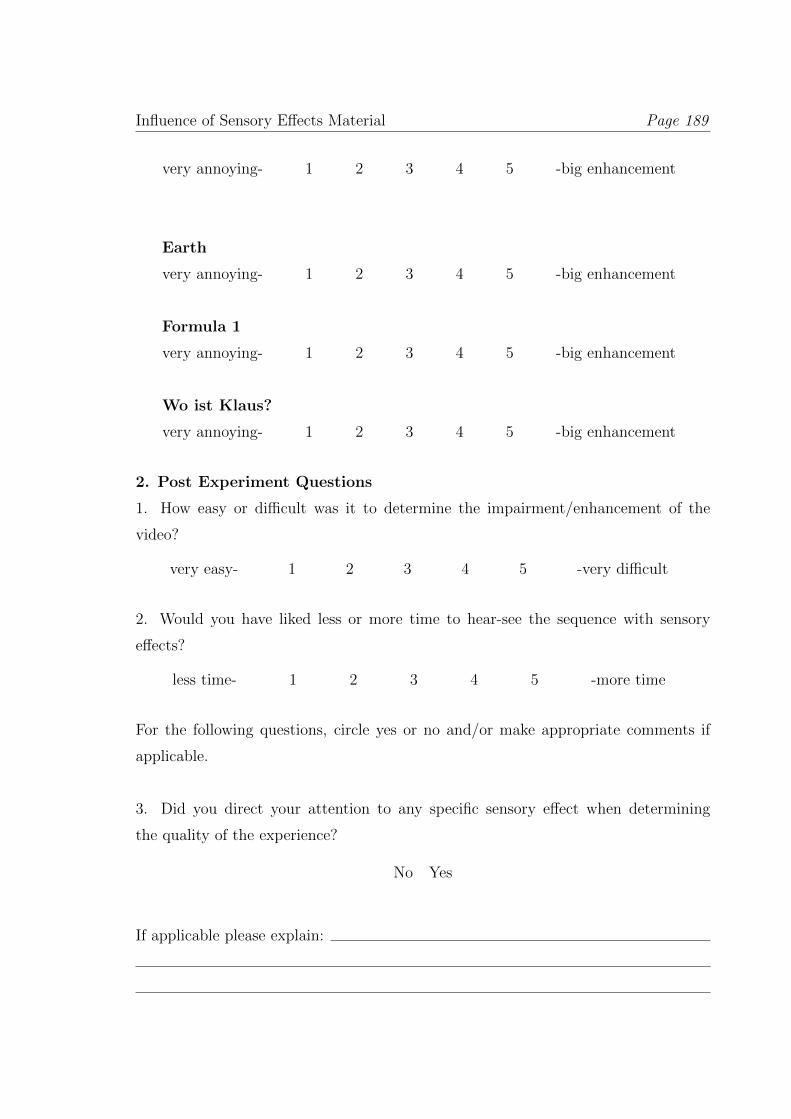
Influence of Sensory Effects Material Page 189
very annoying- 1 2 3 4 5 -big enhancement
Earth
very annoying- 1 2 3 4 5 -big enhancement
Formula 1
very annoying- 1 2 3 4 5 -big enhancement
Wo ist Klaus?
very annoying- 1 2 3 4 5 -big enhancement
2. Post Experiment Questions
1. How easy or difficult was it to determine the impairment/enhancement of the
video?
very easy- 1 2 3 4 5 -very difficult
2. Would you have liked less or more time to hear-see the sequence with sensory
effects?
less time- 1 2 3 4 5 -more time
For the following questions, circle yes or no and/or make appropriate comments if
applicable.
3. Did you direct your attention to any specific sensory effect when determining
the quality of the experience?
No Yes
If applicable please explain:
Page 190 Influence of Sensory Effects Material
4. Were you ever mentally overloaded during any part of the experiment?
No Yes
If applicable please explain:
5. Have you participated in an experiment similar to this one?
No Yes
If applicable please explain:
6. Any other comments about what you liked or did not like, or things that should
be changed during the course of this experiment?
A.3 Mann-Whitney U Tables
Table A.7 represents the values for the one-tailed Mann-Whitney U test [98, 99] from
the assessment on the influence of sensory effects on the viewing experience. The
acronyms presented in the tables have the following meaning [113, 98] and are also
valid for Appendix B:
U: Test statistics.
z: z-distribution.
p: The probability value for determining the significance. If the probability is less
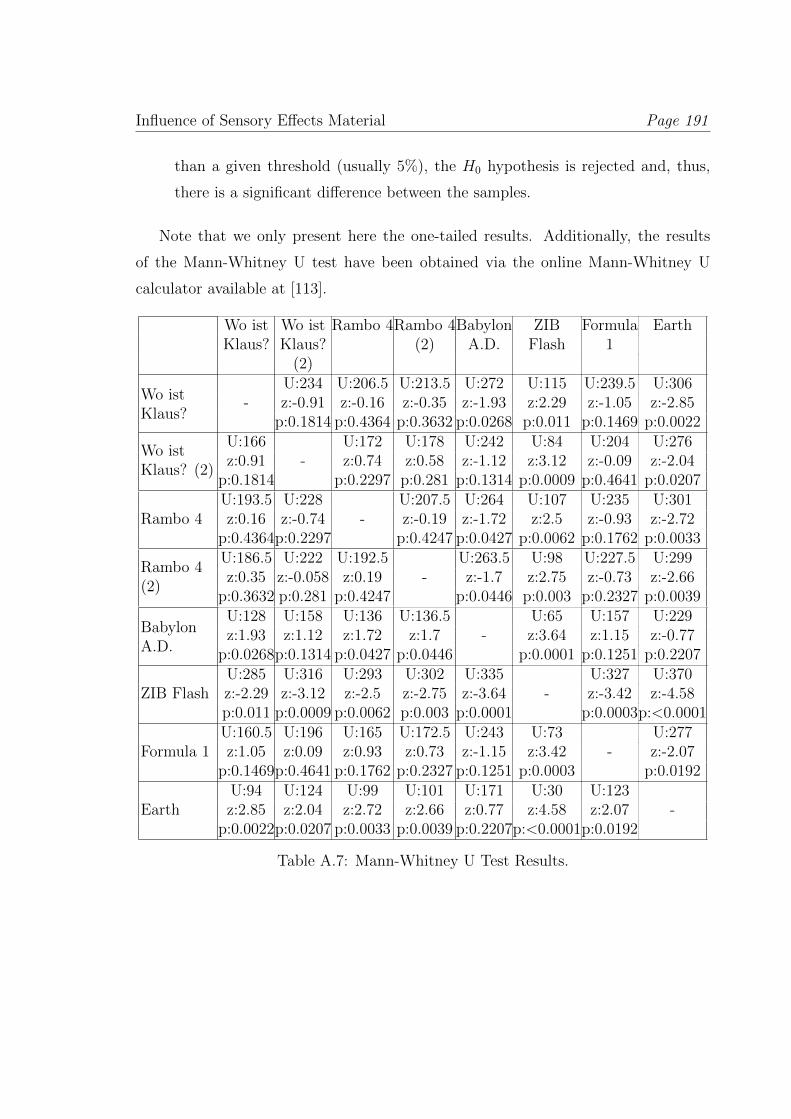
Influence of Sensory Effects Material Page 191
than a given threshold (usually 5%), the H0 hypothesis is rejected and, thus,
there is a significant difference between the samples.
Note that we only present here the one-tailed results. Additionally, the results
of the Mann-Whitney U test have been obtained via the online Mann-Whitney U
calculator available at [113].
Wo ist Wo ist Rambo 4Rambo 4Babylon ZIB Formula EarthKlaus? Klaus? (2) A.D. Flash 1
(2)U:234 U:206.5 U:213.5 U:272 U:115 U:239.5 U:306z:-0.91 z:-0.16 z:-0.35 z:-1.93 z:2.29 z:-1.05 z:-2.85
Wo istKlaus?
-p:0.1814 p:0.4364 p:0.3632 p:0.0268 p:0.011 p:0.1469 p:0.0022
U:166 U:172 U:178 U:242 U:84 U:204 U:276z:0.91 z:0.74 z:0.58 z:-1.12 z:3.12 z:-0.09 z:-2.04
Wo istKlaus? (2)
p:0.1814-
p:0.2297 p:0.281 p:0.1314 p:0.0009 p:0.4641 p:0.0207
Rambo 4U:193.5 U:228 U:207.5 U:264 U:107 U:235 U:301z:0.16 z:-0.74 z:-0.19 z:-1.72 z:2.5 z:-0.93 z:-2.72
p:0.4364p:0.2297-
p:0.4247 p:0.0427 p:0.0062 p:0.1762 p:0.0033U:186.5 U:222 U:192.5 U:263.5 U:98 U:227.5 U:299z:0.35 z:-0.058 z:0.19 z:-1.7 z:2.75 z:-0.73 z:-2.66
Rambo 4(2)
p:0.3632 p:0.281 p:0.4247-
p:0.0446 p:0.003 p:0.2327 p:0.0039U:128 U:158 U:136 U:136.5 U:65 U:157 U:229z:1.93 z:1.12 z:1.72 z:1.7 z:3.64 z:1.15 z:-0.77Babylon
A.D. p:0.0268p:0.1314 p:0.0427 p:0.0446-
p:0.0001 p:0.1251 p:0.2207
ZIB FlashU:285 U:316 U:293 U:302 U:335 U:327 U:370z:-2.29 z:-3.12 z:-2.5 z:-2.75 z:-3.64 z:-3.42 z:-4.58p:0.011 p:0.0009 p:0.0062 p:0.003 p:0.0001
-p:0.0003p:<0.0001
Formula 1U:160.5 U:196 U:165 U:172.5 U:243 U:73 U:277z:1.05 z:0.09 z:0.93 z:0.73 z:-1.15 z:3.42 z:-2.07
p:0.1469p:0.4641 p:0.1762 p:0.2327 p:0.1251 p:0.0003-
p:0.0192
EarthU:94 U:124 U:99 U:101 U:171 U:30 U:123z:2.85 z:2.04 z:2.72 z:2.66 z:0.77 z:4.58 z:2.07
p:0.0022p:0.0207 p:0.0033 p:0.0039 p:0.2207p:<0.0001p:0.0192-
Table A.7: Mann-Whitney U Test Results.

APPENDIX
B Perceived Video Quality
Experiment Material
This chapter presents the introduction and the questionnaire of the subjective quality
assessments presented in Chapter 4. Furthermore, this chapter shows the tables of the
Mann-Whitney U test calculation (cf. Section B.3) conducted during the statistical
analysis.
B.1 Introduction
Thank you for coming. In this experiment, short video sequences will be presented.
Each sequence consists of a set of four short videos with sensory effects (wind, vi-
bration, and light) showing the same video content. Please switch off all electrical
devices (e.g., handy, pager etc.) before reading the rest of the text.
Your first task is to evaluate the quality of single scenes of the videos. You will
see both videos before the start of the test. Try to make your evaluation for every
scene (e.g., before a scene change). For this use the buzzer handed to you. The figure
depicts the buzzer and the assigned values of the buttons. Please vote during the
whole sequence (e.g., if you think the quality is bad of a scene then press the ”bad”
button). You can press the button whenever you like and how often you like. There
is no limit on pressing the buzzer and no specific time you have to press the buttons
on the buzzer. Note that you are evaluating the quality of the current scene and not
the overall quality of the video! In the lower right corner you can see a scale with
your last voting depicted as red bar. Note that you can still press the same voting
button.
Your second task is to evaluate the overall video quality by pressing the corre-
sponding button on the buzzer. For this you have 5 seconds after the video has
finished. The video has finished when you are seeing a grey screen. Please only press
the buzzer once! If you press more than once only the first voting will be accepted.
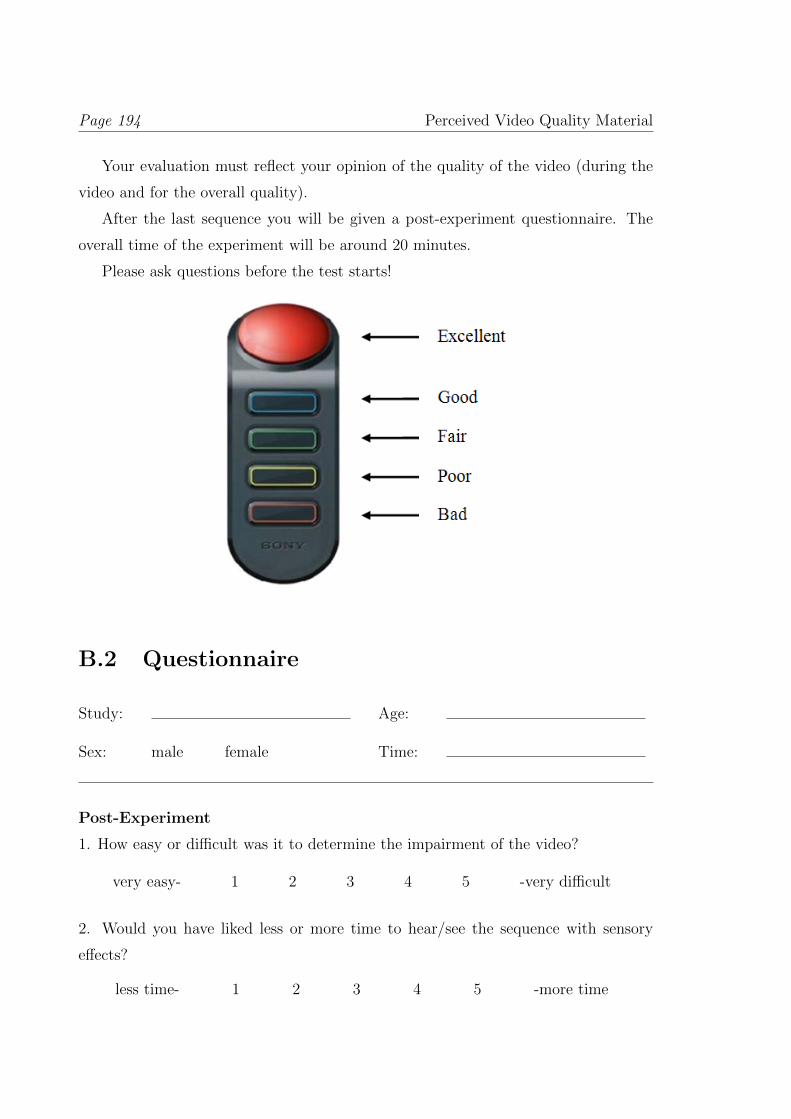
Page 194 Perceived Video Quality Material
Your evaluation must reflect your opinion of the quality of the video (during the
video and for the overall quality).
After the last sequence you will be given a post-experiment questionnaire. The
overall time of the experiment will be around 20 minutes.
Please ask questions before the test starts!
B.2 Questionnaire
Study: Age:
Sex: male female Time:
Post-Experiment
1. How easy or difficult was it to determine the impairment of the video?
very easy- 1 2 3 4 5 -very difficult
2. Would you have liked less or more time to hear/see the sequence with sensory
effects?
less time- 1 2 3 4 5 -more time

Perceived Video Quality Material Page 195
For the following questions, please mark ”Yes” or ”No”. In case of ”Yes”, please
provide an explanation.
3. Was the presented voting feedback disturbing?
No Yes
If ”Yes” please explain:
4. Did you direct your attention to any specific sensory effect when determining
the quality of the experience?
No Yes
If ”Yes” please explain:
5. Were you ever mentally overloaded during any part of the experiment?
No Yes
If ”Yes” please explain:
6. Have you ever participated in an experiment similar to this one?
No Yes
If ”Yes” please explain:
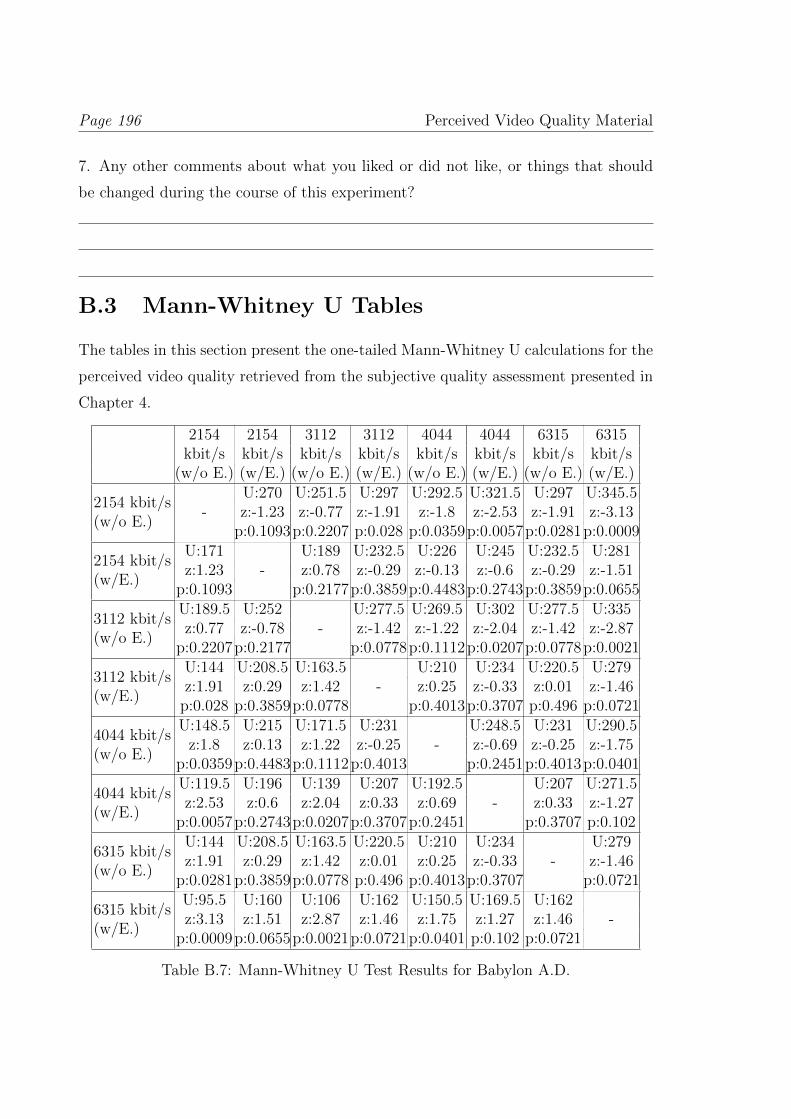
Page 196 Perceived Video Quality Material
7. Any other comments about what you liked or did not like, or things that should
be changed during the course of this experiment?
B.3 Mann-Whitney U Tables
The tables in this section present the one-tailed Mann-Whitney U calculations for the
perceived video quality retrieved from the subjective quality assessment presented in
Chapter 4.
2154 2154 3112 3112 4044 4044 6315 6315kbit/s kbit/s kbit/s kbit/s kbit/s kbit/s kbit/s kbit/s
(w/o E.) (w/E.) (w/o E.) (w/E.) (w/o E.) (w/E.) (w/o E.) (w/E.)U:270 U:251.5 U:297 U:292.5 U:321.5 U:297 U:345.5z:-1.23 z:-0.77 z:-1.91 z:-1.8 z:-2.53 z:-1.91 z:-3.13
2154 kbit/s(w/o E.)
-p:0.1093p:0.2207 p:0.028 p:0.0359p:0.0057p:0.0281p:0.0009
U:171 U:189 U:232.5 U:226 U:245 U:232.5 U:281z:1.23 z:0.78 z:-0.29 z:-0.13 z:-0.6 z:-0.29 z:-1.51
2154 kbit/s(w/E.)
p:0.1093-
p:0.2177p:0.3859p:0.4483p:0.2743p:0.3859p:0.0655U:189.5 U:252 U:277.5 U:269.5 U:302 U:277.5 U:335z:0.77 z:-0.78 z:-1.42 z:-1.22 z:-2.04 z:-1.42 z:-2.87
3112 kbit/s(w/o E.)
p:0.2207p:0.2177-
p:0.0778p:0.1112p:0.0207p:0.0778p:0.0021U:144 U:208.5 U:163.5 U:210 U:234 U:220.5 U:279z:1.91 z:0.29 z:1.42 z:0.25 z:-0.33 z:0.01 z:-1.46
3112 kbit/s(w/E.)
p:0.028 p:0.3859p:0.0778-
p:0.4013p:0.3707 p:0.496 p:0.0721U:148.5 U:215 U:171.5 U:231 U:248.5 U:231 U:290.5
z:1.8 z:0.13 z:1.22 z:-0.25 z:-0.69 z:-0.25 z:-1.754044 kbit/s(w/o E.)
p:0.0359p:0.4483p:0.1112p:0.4013-
p:0.2451p:0.4013p:0.0401U:119.5 U:196 U:139 U:207 U:192.5 U:207 U:271.5z:2.53 z:0.6 z:2.04 z:0.33 z:0.69 z:0.33 z:-1.27
4044 kbit/s(w/E.)
p:0.0057p:0.2743p:0.0207p:0.3707p:0.2451-
p:0.3707 p:0.102U:144 U:208.5 U:163.5 U:220.5 U:210 U:234 U:279z:1.91 z:0.29 z:1.42 z:0.01 z:0.25 z:-0.33 z:-1.46
6315 kbit/s(w/o E.)
p:0.0281p:0.3859p:0.0778 p:0.496 p:0.4013p:0.3707-
p:0.0721U:95.5 U:160 U:106 U:162 U:150.5 U:169.5 U:162z:3.13 z:1.51 z:2.87 z:1.46 z:1.75 z:1.27 z:1.46
6315 kbit/s(w/E.)
p:0.0009p:0.0655p:0.0021p:0.0721p:0.0401 p:0.102 p:0.0721-
Table B.7: Mann-Whitney U Test Results for Babylon A.D.
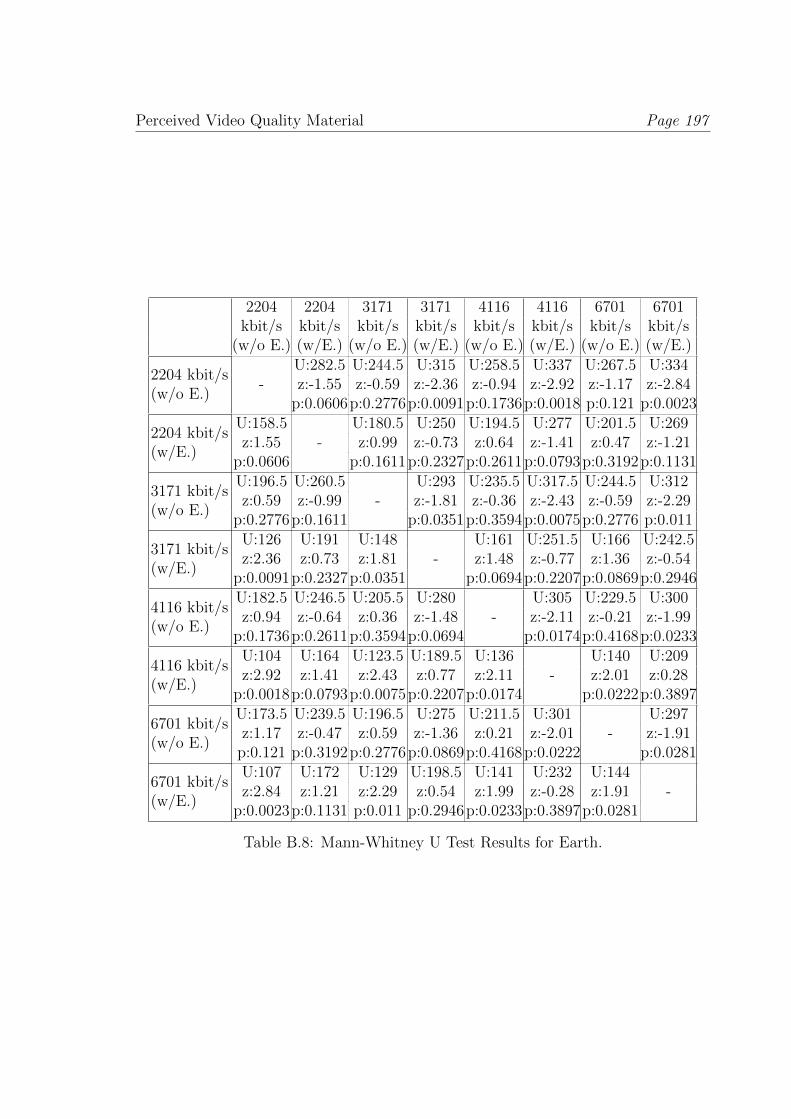
Perceived Video Quality Material Page 197
2204 2204 3171 3171 4116 4116 6701 6701kbit/s kbit/s kbit/s kbit/s kbit/s kbit/s kbit/s kbit/s
(w/o E.) (w/E.) (w/o E.) (w/E.) (w/o E.) (w/E.) (w/o E.) (w/E.)U:282.5 U:244.5 U:315 U:258.5 U:337 U:267.5 U:334z:-1.55 z:-0.59 z:-2.36 z:-0.94 z:-2.92 z:-1.17 z:-2.84
2204 kbit/s(w/o E.)
-p:0.0606p:0.2776p:0.0091p:0.1736p:0.0018 p:0.121 p:0.0023
U:158.5 U:180.5 U:250 U:194.5 U:277 U:201.5 U:269z:1.55 z:0.99 z:-0.73 z:0.64 z:-1.41 z:0.47 z:-1.21
2204 kbit/s(w/E.)
p:0.0606-
p:0.1611p:0.2327p:0.2611p:0.0793p:0.3192p:0.1131U:196.5 U:260.5 U:293 U:235.5 U:317.5 U:244.5 U:312z:0.59 z:-0.99 z:-1.81 z:-0.36 z:-2.43 z:-0.59 z:-2.29
3171 kbit/s(w/o E.)
p:0.2776p:0.1611-
p:0.0351p:0.3594p:0.0075p:0.2776 p:0.011U:126 U:191 U:148 U:161 U:251.5 U:166 U:242.5z:2.36 z:0.73 z:1.81 z:1.48 z:-0.77 z:1.36 z:-0.54
3171 kbit/s(w/E.)
p:0.0091p:0.2327p:0.0351-
p:0.0694p:0.2207p:0.0869p:0.2946U:182.5 U:246.5 U:205.5 U:280 U:305 U:229.5 U:300z:0.94 z:-0.64 z:0.36 z:-1.48 z:-2.11 z:-0.21 z:-1.99
4116 kbit/s(w/o E.)
p:0.1736p:0.2611p:0.3594p:0.0694-
p:0.0174p:0.4168p:0.0233U:104 U:164 U:123.5 U:189.5 U:136 U:140 U:209z:2.92 z:1.41 z:2.43 z:0.77 z:2.11 z:2.01 z:0.28
4116 kbit/s(w/E.)
p:0.0018p:0.0793p:0.0075p:0.2207p:0.0174-
p:0.0222p:0.3897U:173.5 U:239.5 U:196.5 U:275 U:211.5 U:301 U:297z:1.17 z:-0.47 z:0.59 z:-1.36 z:0.21 z:-2.01 z:-1.91
6701 kbit/s(w/o E.)
p:0.121 p:0.3192p:0.2776p:0.0869p:0.4168p:0.0222-
p:0.0281U:107 U:172 U:129 U:198.5 U:141 U:232 U:144z:2.84 z:1.21 z:2.29 z:0.54 z:1.99 z:-0.28 z:1.91
6701 kbit/s(w/E.)
p:0.0023p:0.1131 p:0.011 p:0.2946p:0.0233p:0.3897p:0.0281-
Table B.8: Mann-Whitney U Test Results for Earth.
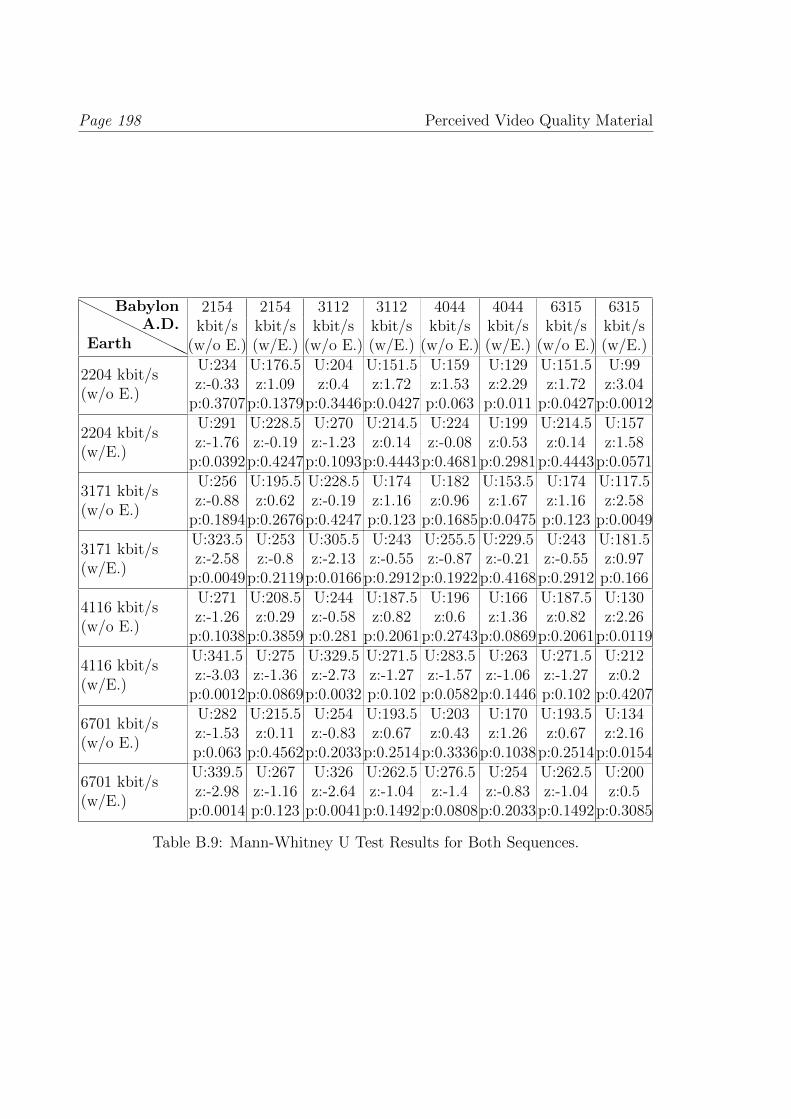
Page 198 Perceived Video Quality Material
HHHH
HHHHHEarth
BabylonA.D.
2154 2154 3112 3112 4044 4044 6315 6315kbit/s kbit/s kbit/s kbit/s kbit/s kbit/s kbit/s kbit/s
(w/o E.) (w/E.) (w/o E.) (w/E.) (w/o E.) (w/E.) (w/o E.) (w/E.)U:234 U:176.5 U:204 U:151.5 U:159 U:129 U:151.5 U:99z:-0.33 z:1.09 z:0.4 z:1.72 z:1.53 z:2.29 z:1.72 z:3.04
2204 kbit/s(w/o E.)
p:0.3707p:0.1379p:0.3446p:0.0427 p:0.063 p:0.011 p:0.0427p:0.0012U:291 U:228.5 U:270 U:214.5 U:224 U:199 U:214.5 U:157z:-1.76 z:-0.19 z:-1.23 z:0.14 z:-0.08 z:0.53 z:0.14 z:1.58
2204 kbit/s(w/E.)
p:0.0392p:0.4247p:0.1093p:0.4443p:0.4681p:0.2981p:0.4443p:0.0571U:256 U:195.5 U:228.5 U:174 U:182 U:153.5 U:174 U:117.5z:-0.88 z:0.62 z:-0.19 z:1.16 z:0.96 z:1.67 z:1.16 z:2.58
3171 kbit/s(w/o E.)
p:0.1894p:0.2676p:0.4247 p:0.123 p:0.1685p:0.0475 p:0.123 p:0.0049U:323.5 U:253 U:305.5 U:243 U:255.5 U:229.5 U:243 U:181.5z:-2.58 z:-0.8 z:-2.13 z:-0.55 z:-0.87 z:-0.21 z:-0.55 z:0.97
3171 kbit/s(w/E.)
p:0.0049p:0.2119p:0.0166p:0.2912p:0.1922p:0.4168p:0.2912 p:0.166U:271 U:208.5 U:244 U:187.5 U:196 U:166 U:187.5 U:130z:-1.26 z:0.29 z:-0.58 z:0.82 z:0.6 z:1.36 z:0.82 z:2.26
4116 kbit/s(w/o E.)
p:0.1038p:0.3859 p:0.281 p:0.2061p:0.2743p:0.0869p:0.2061p:0.0119U:341.5 U:275 U:329.5 U:271.5 U:283.5 U:263 U:271.5 U:212z:-3.03 z:-1.36 z:-2.73 z:-1.27 z:-1.57 z:-1.06 z:-1.27 z:0.2
4116 kbit/s(w/E.)
p:0.0012p:0.0869p:0.0032 p:0.102 p:0.0582p:0.1446 p:0.102 p:0.4207U:282 U:215.5 U:254 U:193.5 U:203 U:170 U:193.5 U:134z:-1.53 z:0.11 z:-0.83 z:0.67 z:0.43 z:1.26 z:0.67 z:2.16
6701 kbit/s(w/o E.)
p:0.063 p:0.4562p:0.2033p:0.2514p:0.3336p:0.1038p:0.2514p:0.0154U:339.5 U:267 U:326 U:262.5 U:276.5 U:254 U:262.5 U:200z:-2.98 z:-1.16 z:-2.64 z:-1.04 z:-1.4 z:-0.83 z:-1.04 z:0.5
6701 kbit/s(w/E.)
p:0.0014 p:0.123 p:0.0041p:0.1492p:0.0808p:0.2033p:0.1492p:0.3085
Table B.9: Mann-Whitney U Test Results for Both Sequences.
APPENDIX
C Sensory Effects and the
WWW Material
This chapter presents the introductions of the subjective quality assessments (cf.
Section C.1) discussed in Chapter 5. Furthermore, it shows the tables of the ANOVA
calculation (cf. Section C.2) conducted during the statistical analysis.
C.1 Introductions
In the following, the two introductions for the two subjective quality assessments from
Chapter 5 are presented. Please note that the introductions were both presented in
English and German to avoid possible misunderstandings.
C.1.1 Introduction of Study on QoE
Thank you for your participation. In this experiment, we will show you four pairs of
short Web video sequences of different genres. Each sequence is played two times, once
without so-called sensory effects and once with sensory effects. The sensory effects
are ambient light effects which are placed next and behind the monitor. Please switch
off all electrical devices (e.g., mobile phone) before reading the rest of the text and
during the entire experiment.
Your task is to evaluate the quality of the Web video accompanied by the sensory
effects in contrast to the same Web video without sensory effects. The experiment
comprises three parts: First, you will have to enter some general information about
yourself (e.g., gender, age, study). Second, the main evaluation will take place as
described below. Third, a post-experiment questionnaire will be shown to you that
you will have to fill in.
The main evaluation procedure is as follows. There are four pairs of short Web
video sequences. Each sequence is played two times. First, it will be shown without
sensory effects and, second, it will be shown with sensory effects. After each pair of
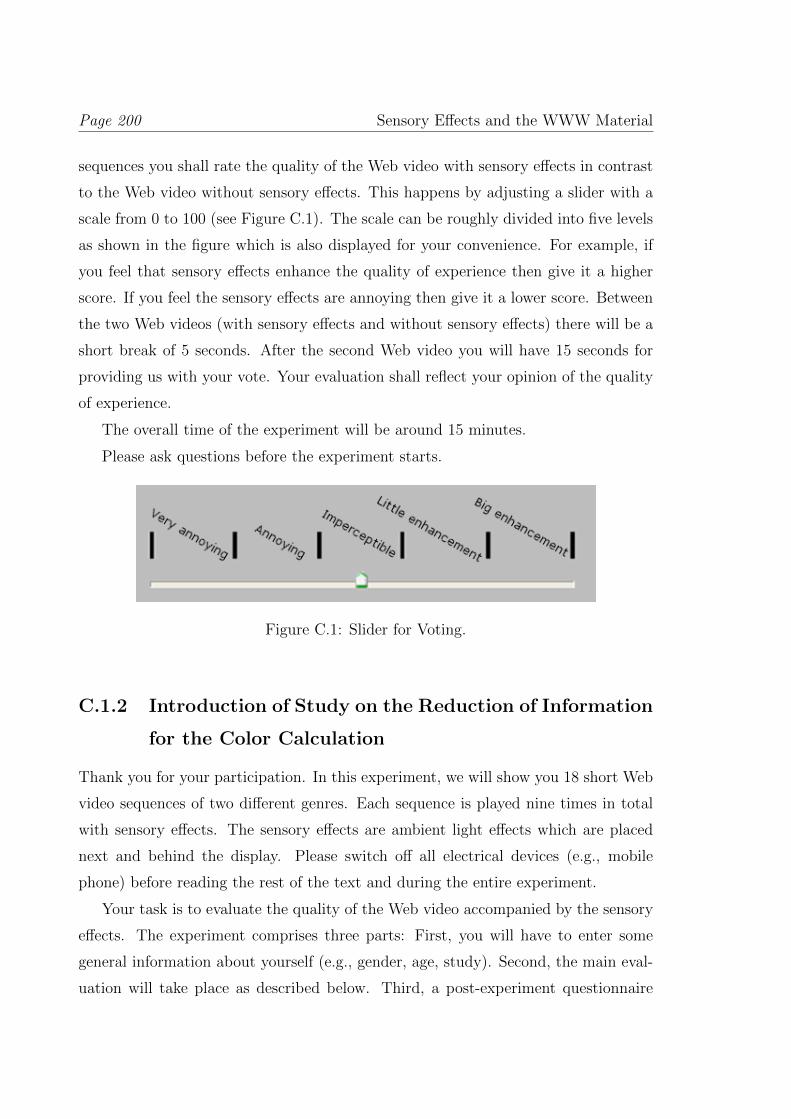
Page 200 Sensory Effects and the WWW Material
sequences you shall rate the quality of the Web video with sensory effects in contrast
to the Web video without sensory effects. This happens by adjusting a slider with a
scale from 0 to 100 (see Figure C.1). The scale can be roughly divided into five levels
as shown in the figure which is also displayed for your convenience. For example, if
you feel that sensory effects enhance the quality of experience then give it a higher
score. If you feel the sensory effects are annoying then give it a lower score. Between
the two Web videos (with sensory effects and without sensory effects) there will be a
short break of 5 seconds. After the second Web video you will have 15 seconds for
providing us with your vote. Your evaluation shall reflect your opinion of the quality
of experience.
The overall time of the experiment will be around 15 minutes.
Please ask questions before the experiment starts.
Figure C.1: Slider for Voting.
C.1.2 Introduction of Study on the Reduction of Information
for the Color Calculation
Thank you for your participation. In this experiment, we will show you 18 short Web
video sequences of two different genres. Each sequence is played nine times in total
with sensory effects. The sensory effects are ambient light effects which are placed
next and behind the display. Please switch off all electrical devices (e.g., mobile
phone) before reading the rest of the text and during the entire experiment.
Your task is to evaluate the quality of the Web video accompanied by the sensory
effects. The experiment comprises three parts: First, you will have to enter some
general information about yourself (e.g., gender, age, study). Second, the main eval-
uation will take place as described below. Third, a post-experiment questionnaire
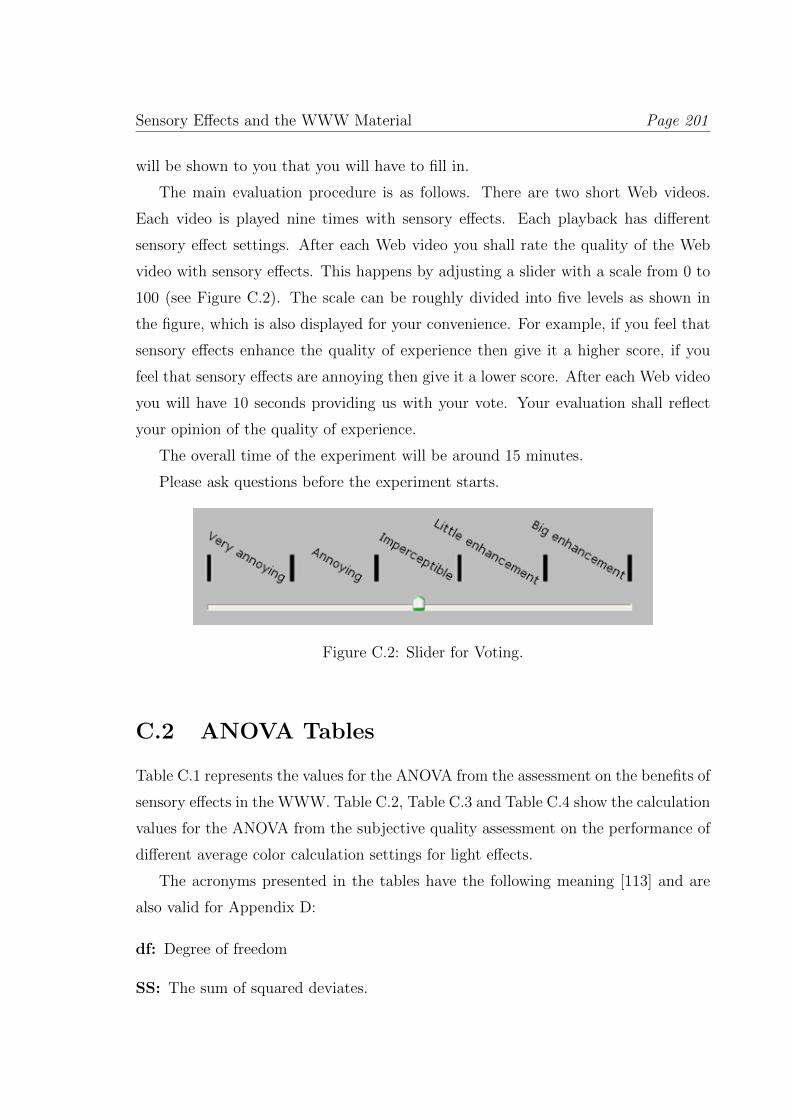
Sensory Effects and the WWW Material Page 201
will be shown to you that you will have to fill in.
The main evaluation procedure is as follows. There are two short Web videos.
Each video is played nine times with sensory effects. Each playback has different
sensory effect settings. After each Web video you shall rate the quality of the Web
video with sensory effects. This happens by adjusting a slider with a scale from 0 to
100 (see Figure C.2). The scale can be roughly divided into five levels as shown in
the figure, which is also displayed for your convenience. For example, if you feel that
sensory effects enhance the quality of experience then give it a higher score, if you
feel that sensory effects are annoying then give it a lower score. After each Web video
you will have 10 seconds providing us with your vote. Your evaluation shall reflect
your opinion of the quality of experience.
The overall time of the experiment will be around 15 minutes.
Please ask questions before the experiment starts.
Figure C.2: Slider for Voting.
C.2 ANOVA Tables
Table C.1 represents the values for the ANOVA from the assessment on the benefits of
sensory effects in the WWW. Table C.2, Table C.3 and Table C.4 show the calculation
values for the ANOVA from the subjective quality assessment on the performance of
different average color calculation settings for light effects.
The acronyms presented in the tables have the following meaning [113] and are
also valid for Appendix D:
df: Degree of freedom
SS: The sum of squared deviates.
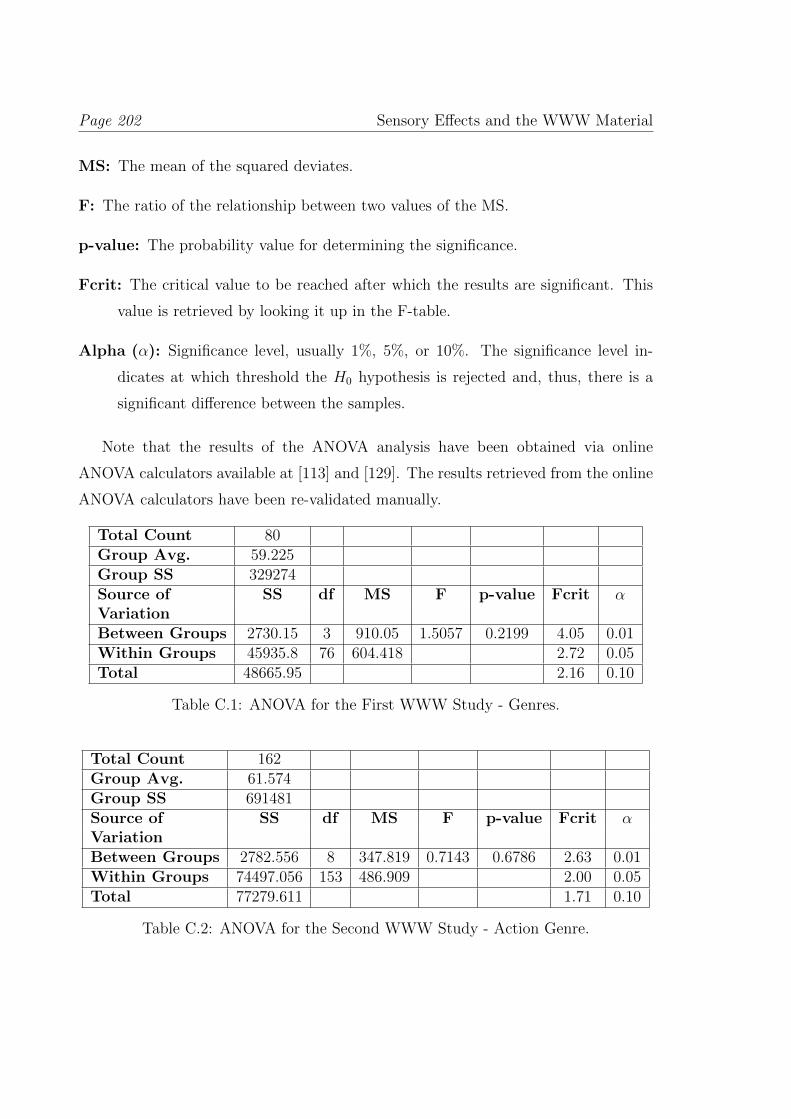
Page 202 Sensory Effects and the WWW Material
MS: The mean of the squared deviates.
F: The ratio of the relationship between two values of the MS.
p-value: The probability value for determining the significance.
Fcrit: The critical value to be reached after which the results are significant. This
value is retrieved by looking it up in the F-table.
Alpha (α): Significance level, usually 1%, 5%, or 10%. The significance level in-
dicates at which threshold the H0 hypothesis is rejected and, thus, there is a
significant difference between the samples.
Note that the results of the ANOVA analysis have been obtained via online
ANOVA calculators available at [113] and [129]. The results retrieved from the online
ANOVA calculators have been re-validated manually.
Total Count 80Group Avg. 59.225Group SS 329274Source of SS df MS F p-value Fcrit αVariationBetween Groups 2730.15 3 910.05 1.5057 0.2199 4.05 0.01Within Groups 45935.8 76 604.418 2.72 0.05Total 48665.95 2.16 0.10
Table C.1: ANOVA for the First WWW Study - Genres.
Total Count 162Group Avg. 61.574Group SS 691481Source of SS df MS F p-value Fcrit αVariationBetween Groups 2782.556 8 347.819 0.7143 0.6786 2.63 0.01Within Groups 74497.056 153 486.909 2.00 0.05Total 77279.611 1.71 0.10
Table C.2: ANOVA for the Second WWW Study - Action Genre.
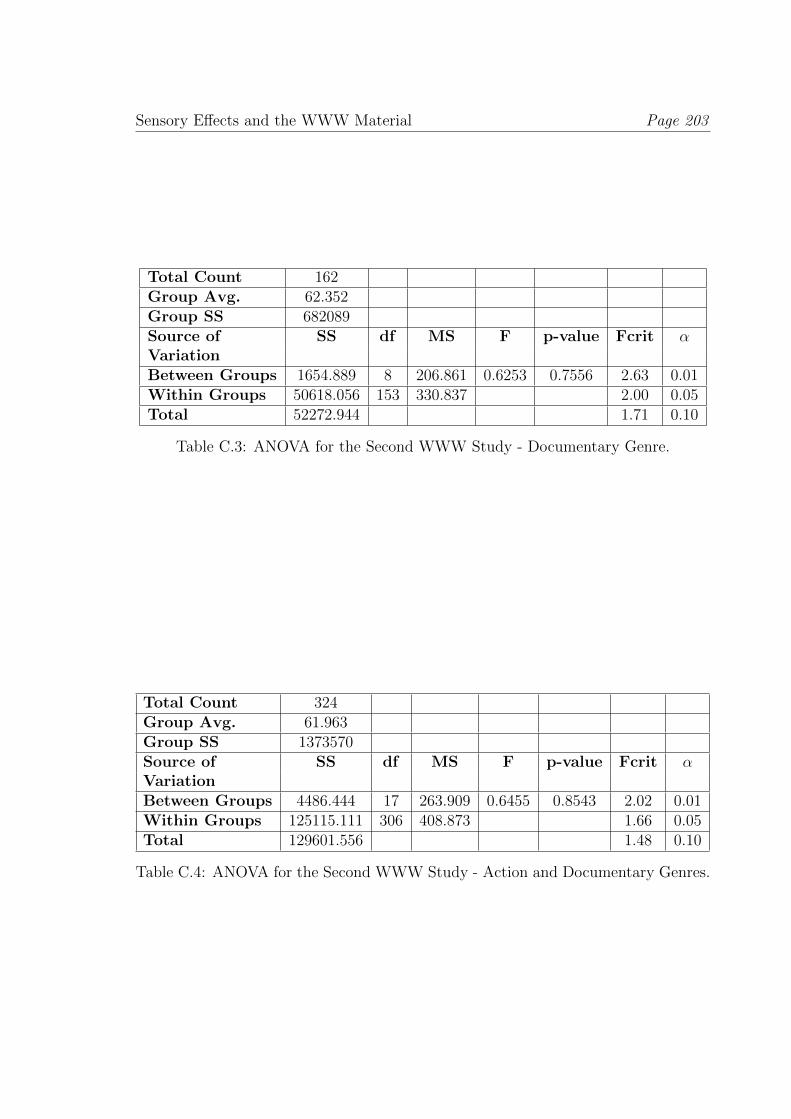
Sensory Effects and the WWW Material Page 203
Total Count 162Group Avg. 62.352Group SS 682089Source of SS df MS F p-value Fcrit αVariationBetween Groups 1654.889 8 206.861 0.6253 0.7556 2.63 0.01Within Groups 50618.056 153 330.837 2.00 0.05Total 52272.944 1.71 0.10
Table C.3: ANOVA for the Second WWW Study - Documentary Genre.
Total Count 324Group Avg. 61.963Group SS 1373570Source of SS df MS F p-value Fcrit αVariationBetween Groups 4486.444 17 263.909 0.6455 0.8543 2.02 0.01Within Groups 125115.111 306 408.873 1.66 0.05Total 129601.556 1.48 0.10
Table C.4: ANOVA for the Second WWW Study - Action and Documentary Genres.

APPENDIX
D Sensory Effects and Emo-
tions Material
This chapter presents the introduction of the subjective quality assessment (cf. Sec-
tion D.1), the disclaimer (cf. Section D.2) and the tables of the ANOVA and t-test
calculation (cf. Section D.3) from Chapter 6.
D.1 Introduction
Thank you for your participation. In this experiment we will show you 15 pairs of
short Web video sequences of different genres. Each sequence is played two times,
once without so-called sensory effects and once with sensory effects. Please switch
off all electrical devices (e.g., mobile phone) and darken the room before reading the
rest of the text and during the entire experiment.
Your task is to evaluate the enhancement of experience due to sensory effects and
the emotions of the Web video sequence accompanied by sensory effects in contrast
to the same Web video sequence without sensory effects. The experiment comprises
three parts: First, you will have to enter some general information about yourself (e.g.,
gender, age, country, nationality, occupational field). Second, the main evaluation will
take place as described below. Third, a post-experiment questionnaire will be shown
to you that you will have to fill in.
The main evaluation procedure is as follows. As stated earlier, there are 15 pairs of
short Web video sequences. Each sequence is played two times. First, it will be shown
without sensory effects and, second, it will be shown with sensory effects. After each
Web video sequence without sensory effects you shall select the emotions you have
had during the Web video sequence. You shall rate the intensity of these emotions
by adjusting a slider ranging from 0 to 100 for each selected emotion. After the same
Web video sequence with effects you will be asked to rate the enhancement of the
Quality of Experience of the Web video sequence with sensory effects with respect to
the Web video sequence without sensory effects. This happens by adjusting a slider
Page 206 Sensory Effects and Emotions Material
with a scale from 0 to 100. In addition you shall select the emotions you have had
during the Web video sequence with sensory effects. The selection of emotions and
their rating that you have selected for the Web video sequence without sensory effects
will be shown for your convenience.
Your evaluation shall reflect your opinion.
With clicking the button ”I agree & start the test” you agree that you are not
visually impaired nor you have any impairments regarding hearing. Furthermore, you
agree on the disclaimer which can be found here.
The overall time of the experiment will be around 18 minutes.
D.2 Disclaimer
Epilepsy warning
Please read before using the software provided by us. Some people are susceptible
to epileptic seizures or loss of consciousness when exposed to certain flashing lights
or light patterns in everyday life. Such people may have a seizure while watching
certain videos with or without sensory effects. This may happen even if the per-
son has no medical history of epilepsy or has never had any epileptic seizures. If
you or anyone in your family has ever had symptoms related to epilepsy (seizures or
loss of consciousness) when exposed to flashing lights, fans generating wind or vibra-
tions, consult your doctor prior to participating in the test. If you experience any
of the following symptoms: dizziness, blurred vision, eye or muscle twitches, loss of
consciousness, disorientation, any involuntary movement convulsion, while watching
videos, immediately discontinue use and consult your doctor.
Content
The author takes no responsibility for the completeness or quality of the information
provided. Liability claims regarding damage caused by the use of any information or
software provided, including any kind of information or software which is incomplete
or incorrect, will therefore be rejected.
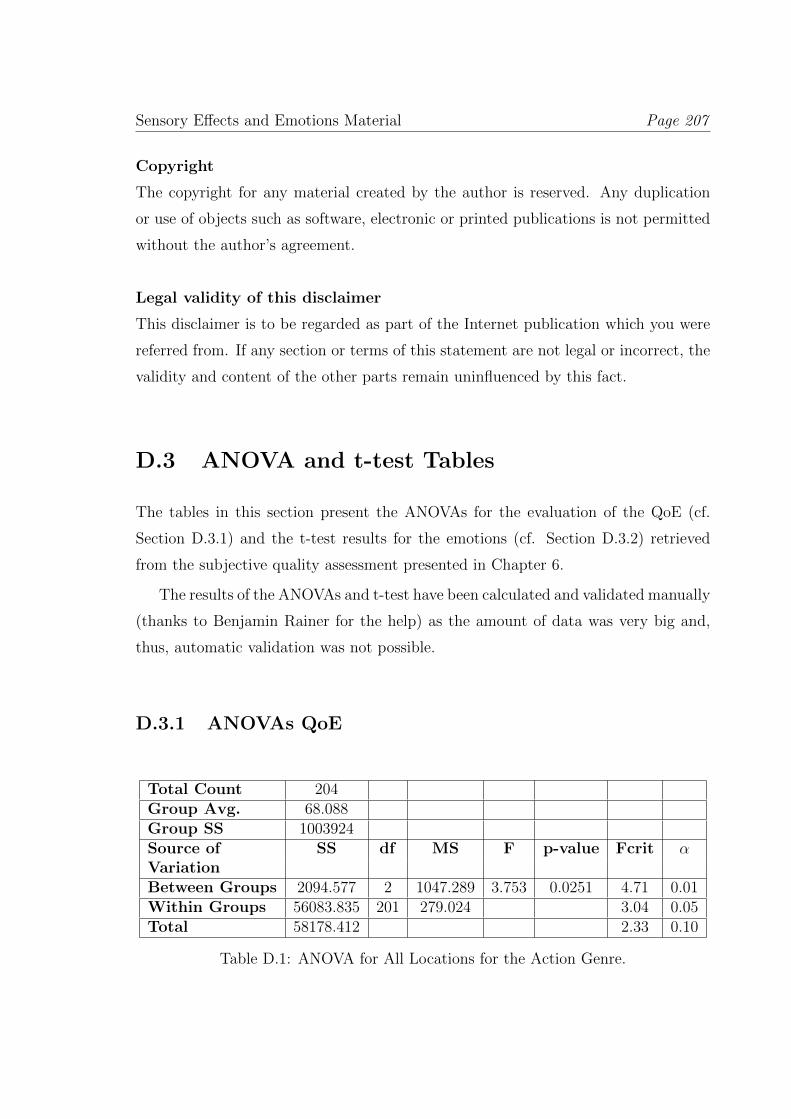
Sensory Effects and Emotions Material Page 207
Copyright
The copyright for any material created by the author is reserved. Any duplication
or use of objects such as software, electronic or printed publications is not permitted
without the author’s agreement.
Legal validity of this disclaimer
This disclaimer is to be regarded as part of the Internet publication which you were
referred from. If any section or terms of this statement are not legal or incorrect, the
validity and content of the other parts remain uninfluenced by this fact.
D.3 ANOVA and t-test Tables
The tables in this section present the ANOVAs for the evaluation of the QoE (cf.
Section D.3.1) and the t-test results for the emotions (cf. Section D.3.2) retrieved
from the subjective quality assessment presented in Chapter 6.
The results of the ANOVAs and t-test have been calculated and validated manually
(thanks to Benjamin Rainer for the help) as the amount of data was very big and,
thus, automatic validation was not possible.
D.3.1 ANOVAs QoE
Total Count 204Group Avg. 68.088Group SS 1003924Source of SS df MS F p-value Fcrit αVariationBetween Groups 2094.577 2 1047.289 3.753 0.0251 4.71 0.01Within Groups 56083.835 201 279.024 3.04 0.05Total 58178.412 2.33 0.10
Table D.1: ANOVA for All Locations for the Action Genre.
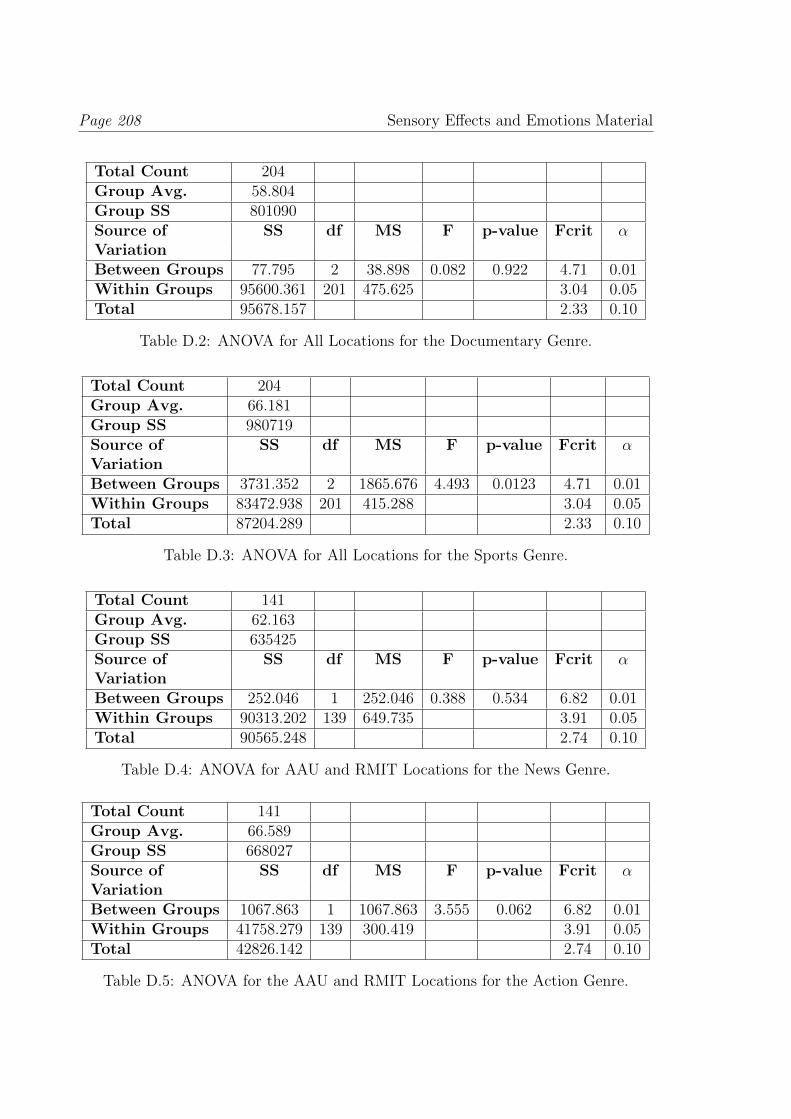
Page 208 Sensory Effects and Emotions Material
Total Count 204Group Avg. 58.804Group SS 801090Source of SS df MS F p-value Fcrit αVariationBetween Groups 77.795 2 38.898 0.082 0.922 4.71 0.01Within Groups 95600.361 201 475.625 3.04 0.05Total 95678.157 2.33 0.10
Table D.2: ANOVA for All Locations for the Documentary Genre.
Total Count 204Group Avg. 66.181Group SS 980719Source of SS df MS F p-value Fcrit αVariationBetween Groups 3731.352 2 1865.676 4.493 0.0123 4.71 0.01Within Groups 83472.938 201 415.288 3.04 0.05Total 87204.289 2.33 0.10
Table D.3: ANOVA for All Locations for the Sports Genre.
Total Count 141Group Avg. 62.163Group SS 635425Source of SS df MS F p-value Fcrit αVariationBetween Groups 252.046 1 252.046 0.388 0.534 6.82 0.01Within Groups 90313.202 139 649.735 3.91 0.05Total 90565.248 2.74 0.10
Table D.4: ANOVA for AAU and RMIT Locations for the News Genre.
Total Count 141Group Avg. 66.589Group SS 668027Source of SS df MS F p-value Fcrit αVariationBetween Groups 1067.863 1 1067.863 3.555 0.062 6.82 0.01Within Groups 41758.279 139 300.419 3.91 0.05Total 42826.142 2.74 0.10
Table D.5: ANOVA for the AAU and RMIT Locations for the Action Genre.
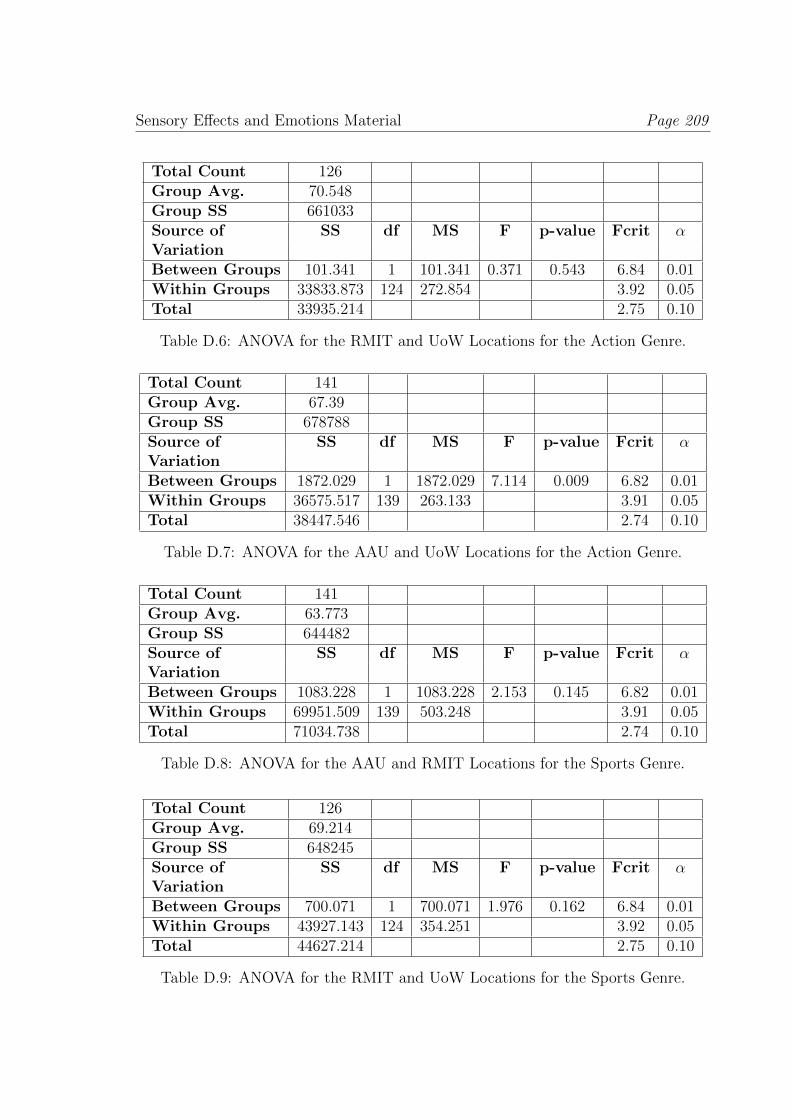
Sensory Effects and Emotions Material Page 209
Total Count 126Group Avg. 70.548Group SS 661033Source of SS df MS F p-value Fcrit αVariationBetween Groups 101.341 1 101.341 0.371 0.543 6.84 0.01Within Groups 33833.873 124 272.854 3.92 0.05Total 33935.214 2.75 0.10
Table D.6: ANOVA for the RMIT and UoW Locations for the Action Genre.
Total Count 141Group Avg. 67.39Group SS 678788Source of SS df MS F p-value Fcrit αVariationBetween Groups 1872.029 1 1872.029 7.114 0.009 6.82 0.01Within Groups 36575.517 139 263.133 3.91 0.05Total 38447.546 2.74 0.10
Table D.7: ANOVA for the AAU and UoW Locations for the Action Genre.
Total Count 141Group Avg. 63.773Group SS 644482Source of SS df MS F p-value Fcrit αVariationBetween Groups 1083.228 1 1083.228 2.153 0.145 6.82 0.01Within Groups 69951.509 139 503.248 3.91 0.05Total 71034.738 2.74 0.10
Table D.8: ANOVA for the AAU and RMIT Locations for the Sports Genre.
Total Count 126Group Avg. 69.214Group SS 648245Source of SS df MS F p-value Fcrit αVariationBetween Groups 700.071 1 700.071 1.976 0.162 6.84 0.01Within Groups 43927.143 124 354.251 3.92 0.05Total 44627.214 2.75 0.10
Table D.9: ANOVA for the RMIT and UoW Locations for the Sports Genre.
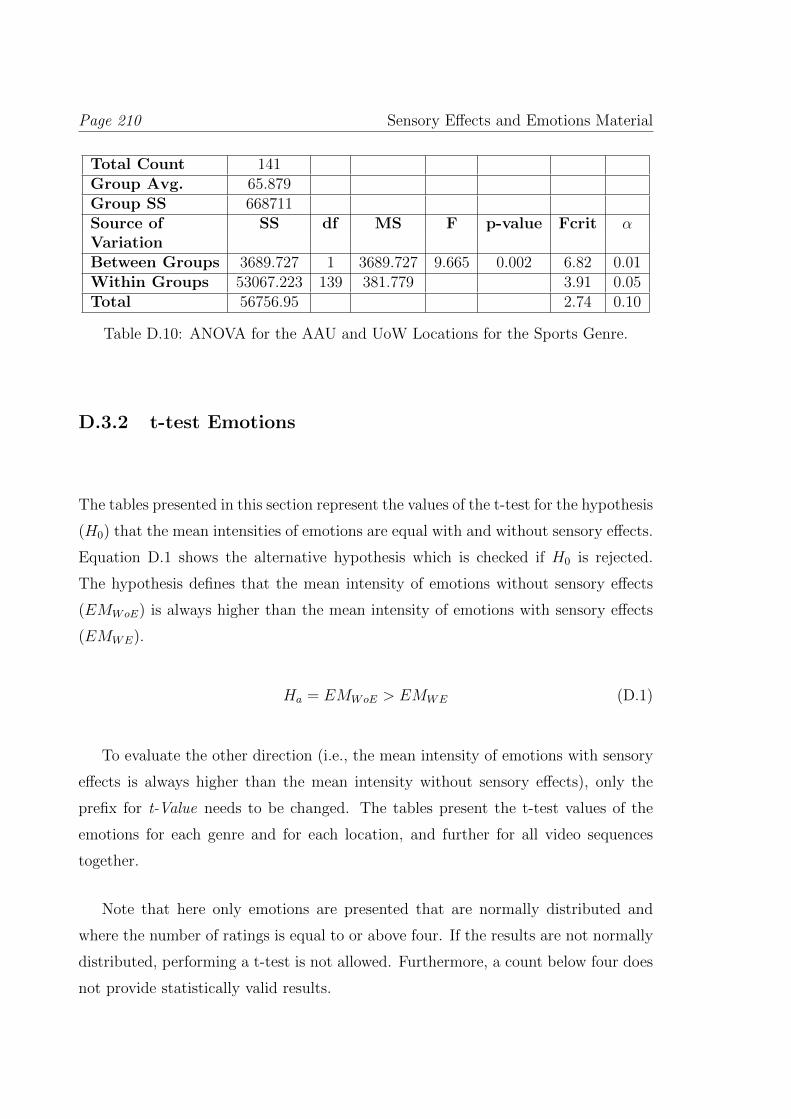
Page 210 Sensory Effects and Emotions Material
Total Count 141Group Avg. 65.879Group SS 668711Source of SS df MS F p-value Fcrit αVariationBetween Groups 3689.727 1 3689.727 9.665 0.002 6.82 0.01Within Groups 53067.223 139 381.779 3.91 0.05Total 56756.95 2.74 0.10
Table D.10: ANOVA for the AAU and UoW Locations for the Sports Genre.
D.3.2 t-test Emotions
The tables presented in this section represent the values of the t-test for the hypothesis
(H0) that the mean intensities of emotions are equal with and without sensory effects.
Equation D.1 shows the alternative hypothesis which is checked if H0 is rejected.
The hypothesis defines that the mean intensity of emotions without sensory effects
(EMWoE) is always higher than the mean intensity of emotions with sensory effects
(EMWE).
Ha = EMWoE > EMWE (D.1)
To evaluate the other direction (i.e., the mean intensity of emotions with sensory
effects is always higher than the mean intensity without sensory effects), only the
prefix for t-Value needs to be changed. The tables present the t-test values of the
emotions for each genre and for each location, and further for all video sequences
together.
Note that here only emotions are presented that are normally distributed and
where the number of ratings is equal to or above four. If the results are not normally
distributed, performing a t-test is not allowed. Furthermore, a count below four does
not provide statistically valid results.
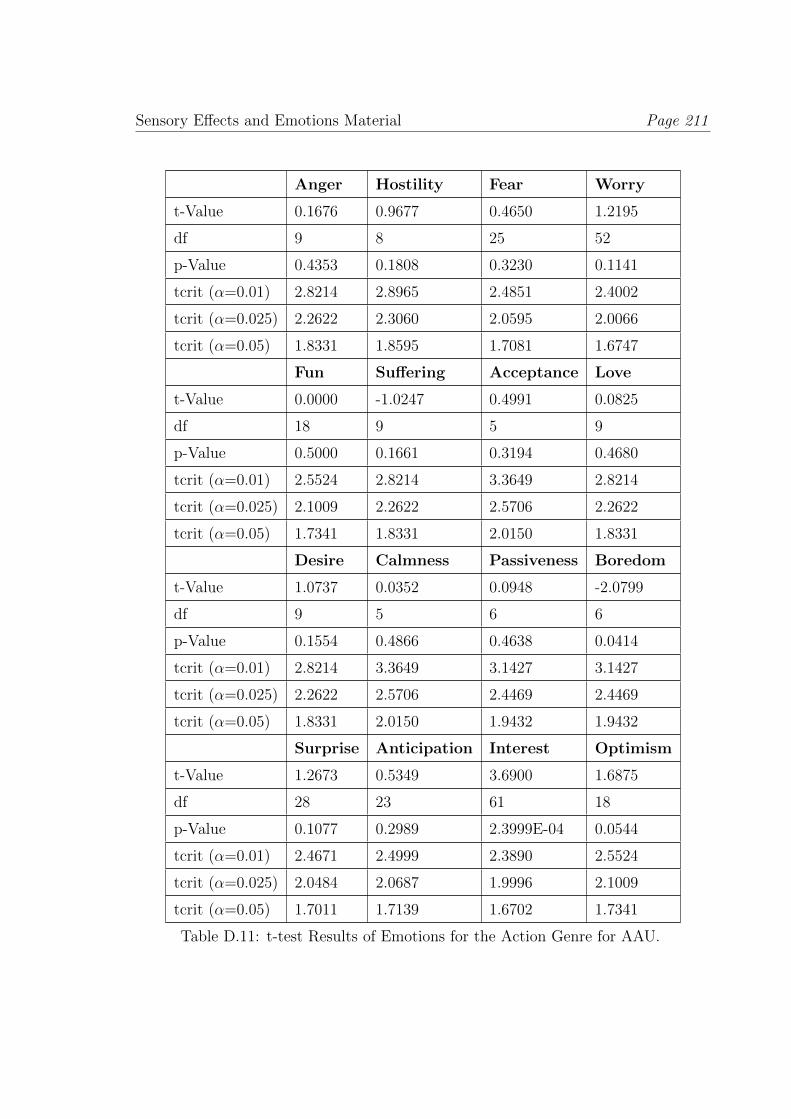
Sensory Effects and Emotions Material Page 211
Anger Hostility Fear Worry
t-Value 0.1676 0.9677 0.4650 1.2195
df 9 8 25 52
p-Value 0.4353 0.1808 0.3230 0.1141
tcrit (α=0.01) 2.8214 2.8965 2.4851 2.4002
tcrit (α=0.025) 2.2622 2.3060 2.0595 2.0066
tcrit (α=0.05) 1.8331 1.8595 1.7081 1.6747
Fun Suffering Acceptance Love
t-Value 0.0000 -1.0247 0.4991 0.0825
df 18 9 5 9
p-Value 0.5000 0.1661 0.3194 0.4680
tcrit (α=0.01) 2.5524 2.8214 3.3649 2.8214
tcrit (α=0.025) 2.1009 2.2622 2.5706 2.2622
tcrit (α=0.05) 1.7341 1.8331 2.0150 1.8331
Desire Calmness Passiveness Boredom
t-Value 1.0737 0.0352 0.0948 -2.0799
df 9 5 6 6
p-Value 0.1554 0.4866 0.4638 0.0414
tcrit (α=0.01) 2.8214 3.3649 3.1427 3.1427
tcrit (α=0.025) 2.2622 2.5706 2.4469 2.4469
tcrit (α=0.05) 1.8331 2.0150 1.9432 1.9432
Surprise Anticipation Interest Optimism
t-Value 1.2673 0.5349 3.6900 1.6875
df 28 23 61 18
p-Value 0.1077 0.2989 2.3999E-04 0.0544
tcrit (α=0.01) 2.4671 2.4999 2.3890 2.5524
tcrit (α=0.025) 2.0484 2.0687 1.9996 2.1009
tcrit (α=0.05) 1.7011 1.7139 1.6702 1.7341
Table D.11: t-test Results of Emotions for the Action Genre for AAU.
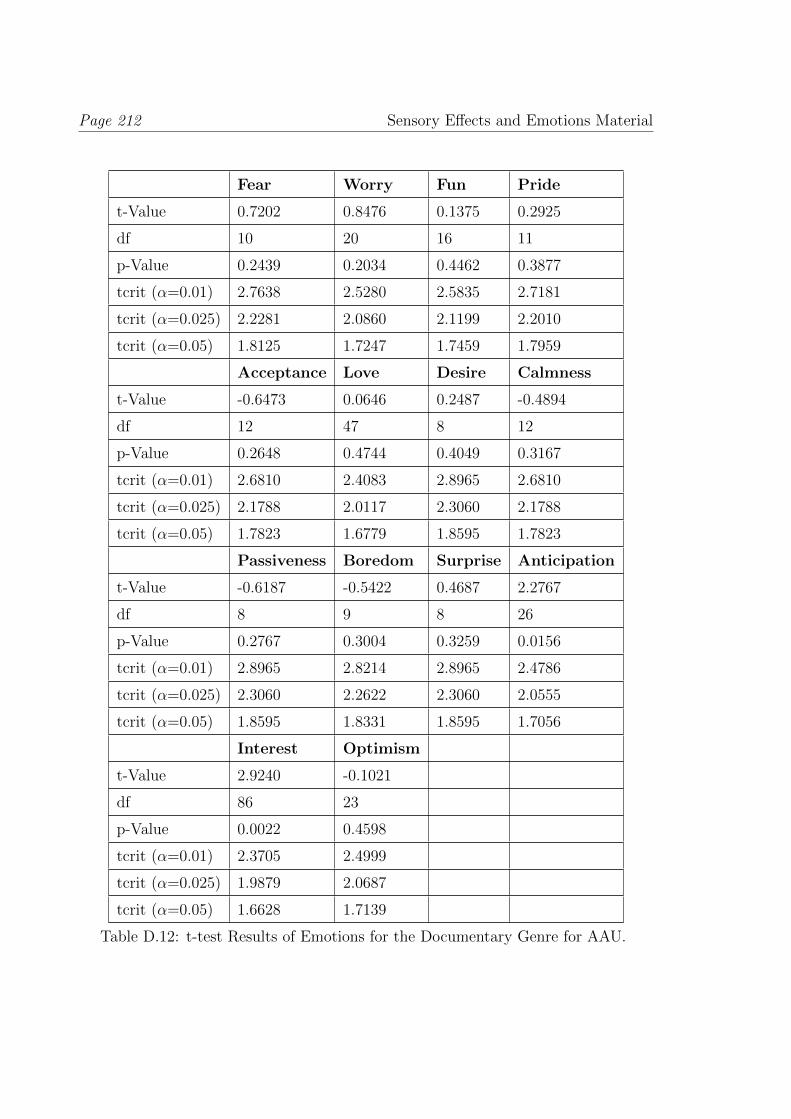
Page 212 Sensory Effects and Emotions Material
Fear Worry Fun Pride
t-Value 0.7202 0.8476 0.1375 0.2925
df 10 20 16 11
p-Value 0.2439 0.2034 0.4462 0.3877
tcrit (α=0.01) 2.7638 2.5280 2.5835 2.7181
tcrit (α=0.025) 2.2281 2.0860 2.1199 2.2010
tcrit (α=0.05) 1.8125 1.7247 1.7459 1.7959
Acceptance Love Desire Calmness
t-Value -0.6473 0.0646 0.2487 -0.4894
df 12 47 8 12
p-Value 0.2648 0.4744 0.4049 0.3167
tcrit (α=0.01) 2.6810 2.4083 2.8965 2.6810
tcrit (α=0.025) 2.1788 2.0117 2.3060 2.1788
tcrit (α=0.05) 1.7823 1.6779 1.8595 1.7823
Passiveness Boredom Surprise Anticipation
t-Value -0.6187 -0.5422 0.4687 2.2767
df 8 9 8 26
p-Value 0.2767 0.3004 0.3259 0.0156
tcrit (α=0.01) 2.8965 2.8214 2.8965 2.4786
tcrit (α=0.025) 2.3060 2.2622 2.3060 2.0555
tcrit (α=0.05) 1.8595 1.8331 1.8595 1.7056
Interest Optimism
t-Value 2.9240 -0.1021
df 86 23
p-Value 0.0022 0.4598
tcrit (α=0.01) 2.3705 2.4999
tcrit (α=0.025) 1.9879 2.0687
tcrit (α=0.05) 1.6628 1.7139
Table D.12: t-test Results of Emotions for the Documentary Genre for AAU.
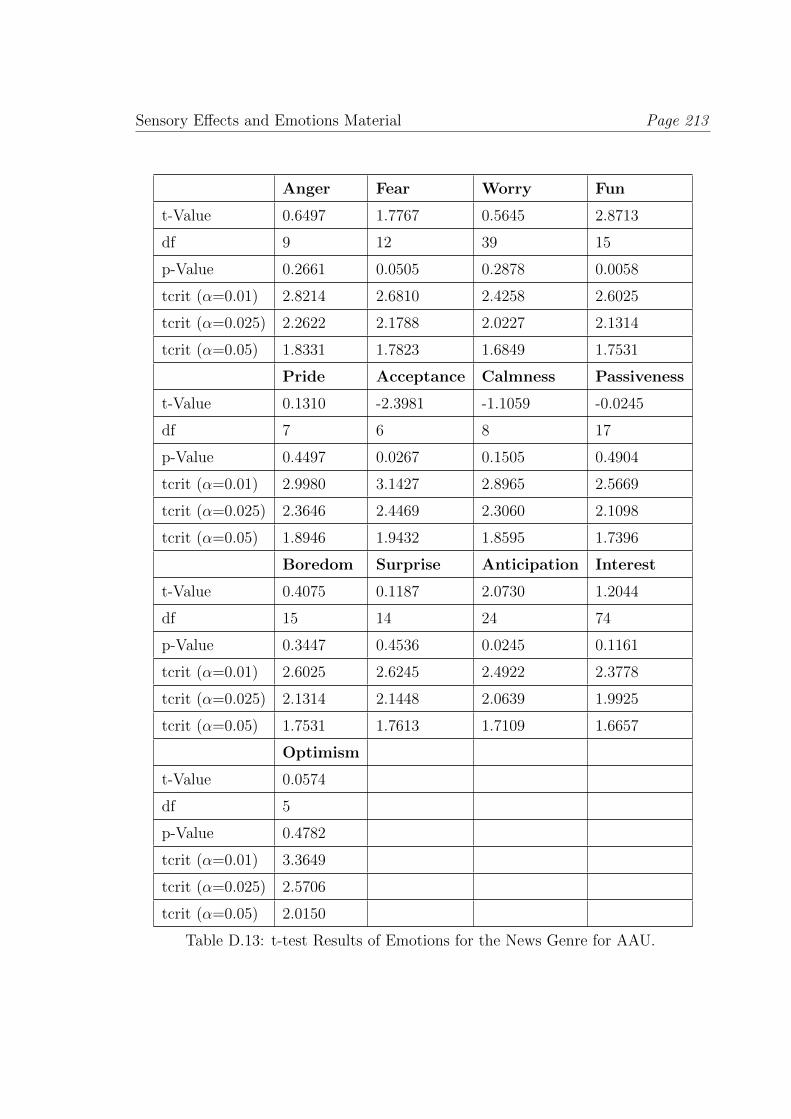
Sensory Effects and Emotions Material Page 213
Anger Fear Worry Fun
t-Value 0.6497 1.7767 0.5645 2.8713
df 9 12 39 15
p-Value 0.2661 0.0505 0.2878 0.0058
tcrit (α=0.01) 2.8214 2.6810 2.4258 2.6025
tcrit (α=0.025) 2.2622 2.1788 2.0227 2.1314
tcrit (α=0.05) 1.8331 1.7823 1.6849 1.7531
Pride Acceptance Calmness Passiveness
t-Value 0.1310 -2.3981 -1.1059 -0.0245
df 7 6 8 17
p-Value 0.4497 0.0267 0.1505 0.4904
tcrit (α=0.01) 2.9980 3.1427 2.8965 2.5669
tcrit (α=0.025) 2.3646 2.4469 2.3060 2.1098
tcrit (α=0.05) 1.8946 1.9432 1.8595 1.7396
Boredom Surprise Anticipation Interest
t-Value 0.4075 0.1187 2.0730 1.2044
df 15 14 24 74
p-Value 0.3447 0.4536 0.0245 0.1161
tcrit (α=0.01) 2.6025 2.6245 2.4922 2.3778
tcrit (α=0.025) 2.1314 2.1448 2.0639 1.9925
tcrit (α=0.05) 1.7531 1.7613 1.7109 1.6657
Optimism
t-Value 0.0574
df 5
p-Value 0.4782
tcrit (α=0.01) 3.3649
tcrit (α=0.025) 2.5706
tcrit (α=0.05) 2.0150
Table D.13: t-test Results of Emotions for the News Genre for AAU.
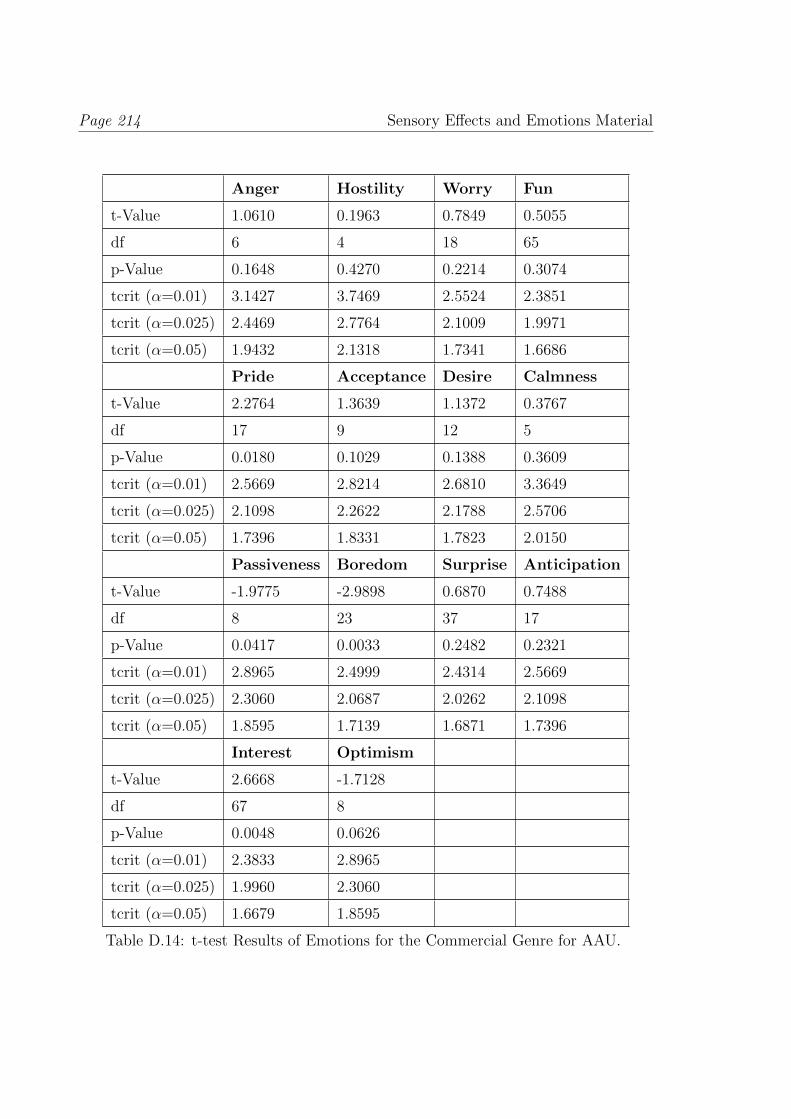
Page 214 Sensory Effects and Emotions Material
Anger Hostility Worry Fun
t-Value 1.0610 0.1963 0.7849 0.5055
df 6 4 18 65
p-Value 0.1648 0.4270 0.2214 0.3074
tcrit (α=0.01) 3.1427 3.7469 2.5524 2.3851
tcrit (α=0.025) 2.4469 2.7764 2.1009 1.9971
tcrit (α=0.05) 1.9432 2.1318 1.7341 1.6686
Pride Acceptance Desire Calmness
t-Value 2.2764 1.3639 1.1372 0.3767
df 17 9 12 5
p-Value 0.0180 0.1029 0.1388 0.3609
tcrit (α=0.01) 2.5669 2.8214 2.6810 3.3649
tcrit (α=0.025) 2.1098 2.2622 2.1788 2.5706
tcrit (α=0.05) 1.7396 1.8331 1.7823 2.0150
Passiveness Boredom Surprise Anticipation
t-Value -1.9775 -2.9898 0.6870 0.7488
df 8 23 37 17
p-Value 0.0417 0.0033 0.2482 0.2321
tcrit (α=0.01) 2.8965 2.4999 2.4314 2.5669
tcrit (α=0.025) 2.3060 2.0687 2.0262 2.1098
tcrit (α=0.05) 1.8595 1.7139 1.6871 1.7396
Interest Optimism
t-Value 2.6668 -1.7128
df 67 8
p-Value 0.0048 0.0626
tcrit (α=0.01) 2.3833 2.8965
tcrit (α=0.025) 1.9960 2.3060
tcrit (α=0.05) 1.6679 1.8595
Table D.14: t-test Results of Emotions for the Commercial Genre for AAU.
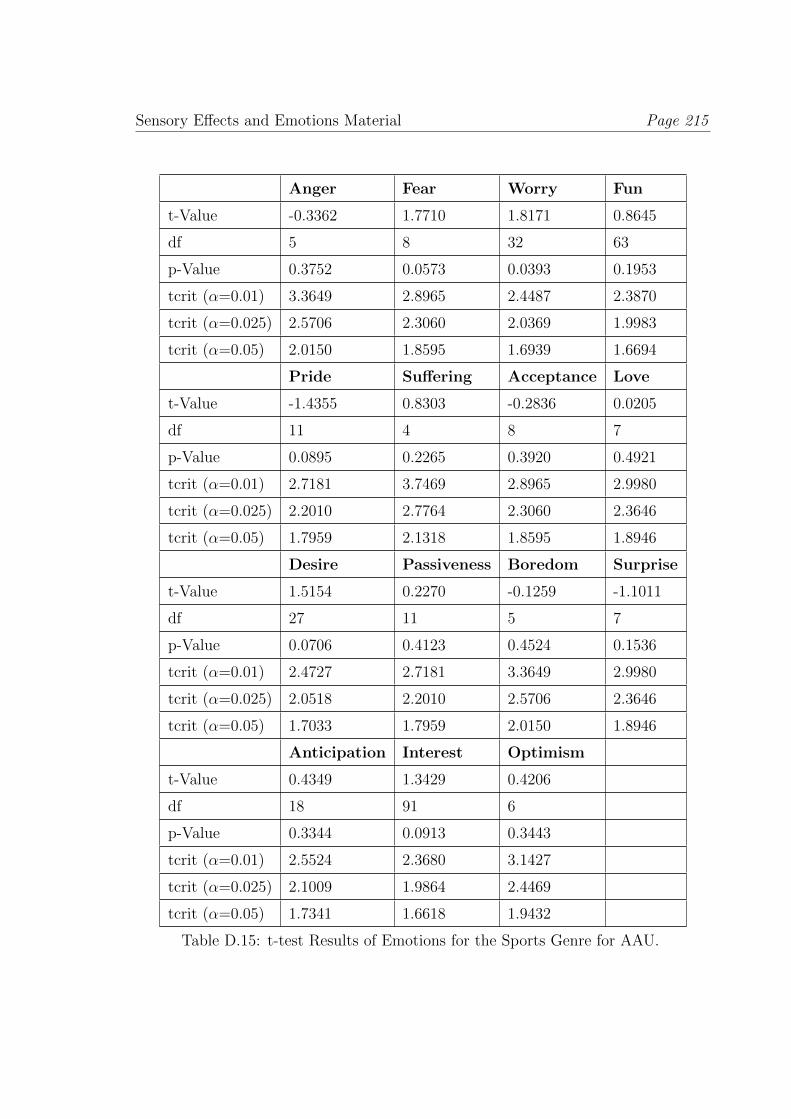
Sensory Effects and Emotions Material Page 215
Anger Fear Worry Fun
t-Value -0.3362 1.7710 1.8171 0.8645
df 5 8 32 63
p-Value 0.3752 0.0573 0.0393 0.1953
tcrit (α=0.01) 3.3649 2.8965 2.4487 2.3870
tcrit (α=0.025) 2.5706 2.3060 2.0369 1.9983
tcrit (α=0.05) 2.0150 1.8595 1.6939 1.6694
Pride Suffering Acceptance Love
t-Value -1.4355 0.8303 -0.2836 0.0205
df 11 4 8 7
p-Value 0.0895 0.2265 0.3920 0.4921
tcrit (α=0.01) 2.7181 3.7469 2.8965 2.9980
tcrit (α=0.025) 2.2010 2.7764 2.3060 2.3646
tcrit (α=0.05) 1.7959 2.1318 1.8595 1.8946
Desire Passiveness Boredom Surprise
t-Value 1.5154 0.2270 -0.1259 -1.1011
df 27 11 5 7
p-Value 0.0706 0.4123 0.4524 0.1536
tcrit (α=0.01) 2.4727 2.7181 3.3649 2.9980
tcrit (α=0.025) 2.0518 2.2010 2.5706 2.3646
tcrit (α=0.05) 1.7033 1.7959 2.0150 1.8946
Anticipation Interest Optimism
t-Value 0.4349 1.3429 0.4206
df 18 91 6
p-Value 0.3344 0.0913 0.3443
tcrit (α=0.01) 2.5524 2.3680 3.1427
tcrit (α=0.025) 2.1009 1.9864 2.4469
tcrit (α=0.05) 1.7341 1.6618 1.9432
Table D.15: t-test Results of Emotions for the Sports Genre for AAU.
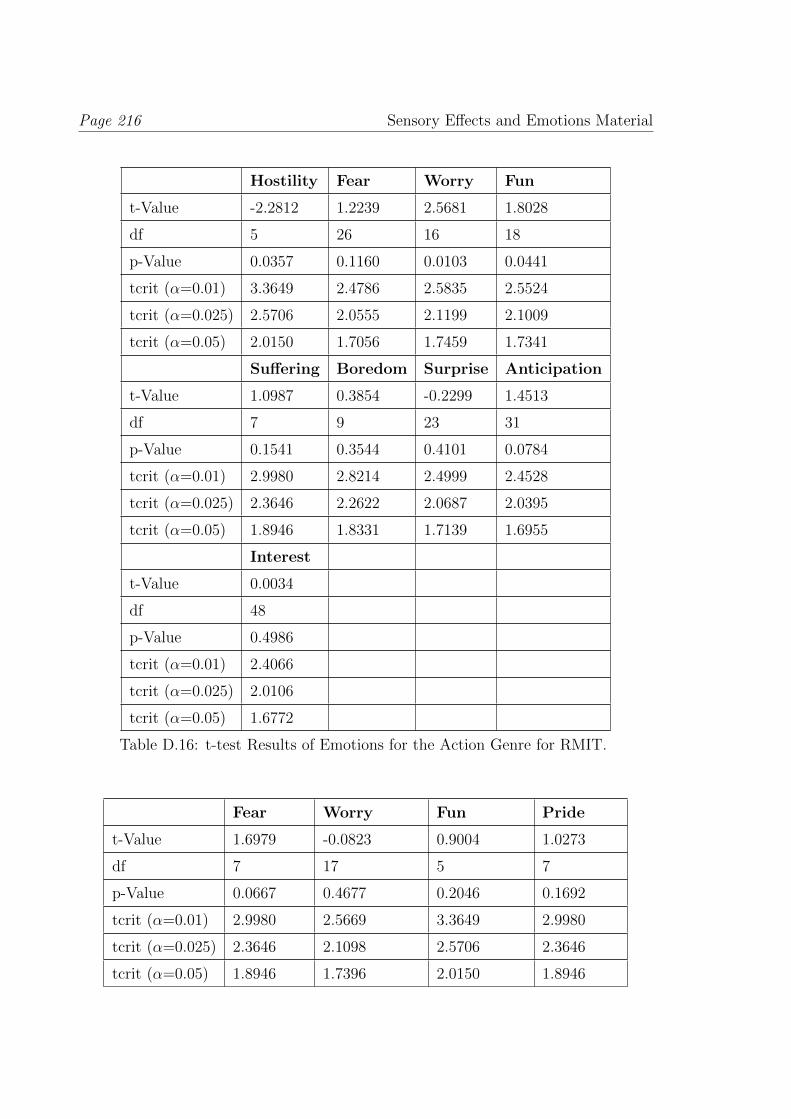
Page 216 Sensory Effects and Emotions Material
Hostility Fear Worry Fun
t-Value -2.2812 1.2239 2.5681 1.8028
df 5 26 16 18
p-Value 0.0357 0.1160 0.0103 0.0441
tcrit (α=0.01) 3.3649 2.4786 2.5835 2.5524
tcrit (α=0.025) 2.5706 2.0555 2.1199 2.1009
tcrit (α=0.05) 2.0150 1.7056 1.7459 1.7341
Suffering Boredom Surprise Anticipation
t-Value 1.0987 0.3854 -0.2299 1.4513
df 7 9 23 31
p-Value 0.1541 0.3544 0.4101 0.0784
tcrit (α=0.01) 2.9980 2.8214 2.4999 2.4528
tcrit (α=0.025) 2.3646 2.2622 2.0687 2.0395
tcrit (α=0.05) 1.8946 1.8331 1.7139 1.6955
Interest
t-Value 0.0034
df 48
p-Value 0.4986
tcrit (α=0.01) 2.4066
tcrit (α=0.025) 2.0106
tcrit (α=0.05) 1.6772
Table D.16: t-test Results of Emotions for the Action Genre for RMIT.
Fear Worry Fun Pride
t-Value 1.6979 -0.0823 0.9004 1.0273
df 7 17 5 7
p-Value 0.0667 0.4677 0.2046 0.1692
tcrit (α=0.01) 2.9980 2.5669 3.3649 2.9980
tcrit (α=0.025) 2.3646 2.1098 2.5706 2.3646
tcrit (α=0.05) 1.8946 1.7396 2.0150 1.8946
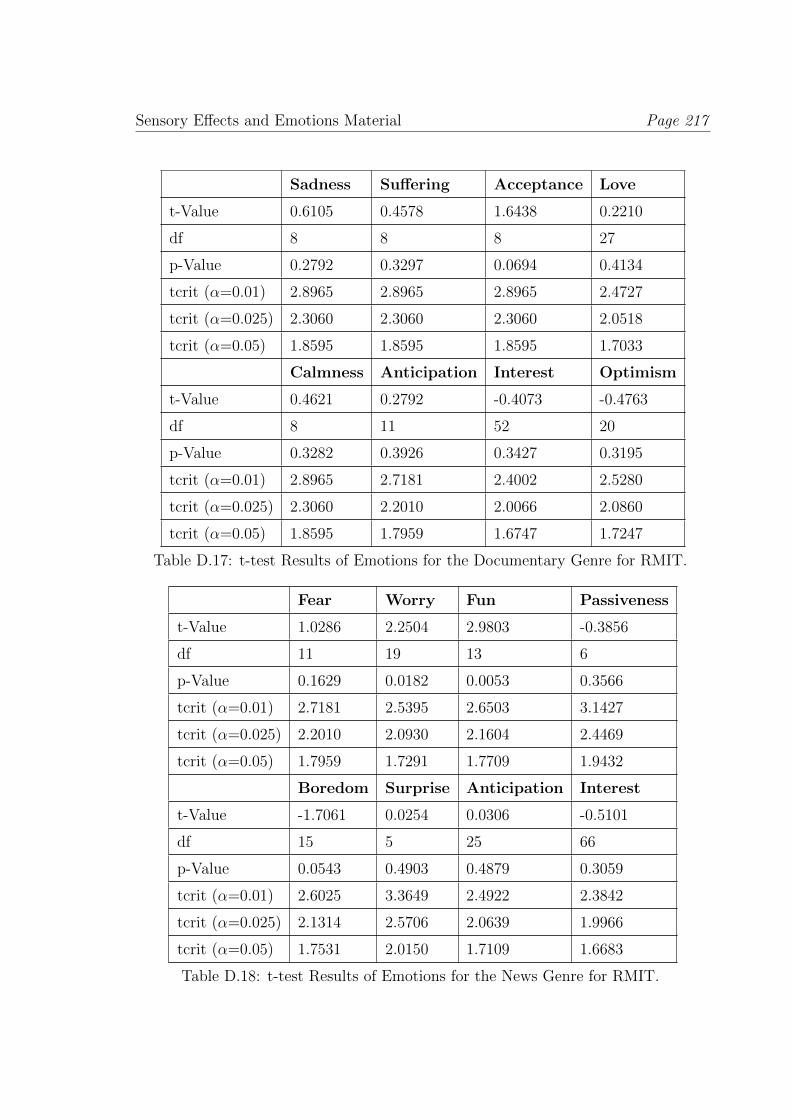
Sensory Effects and Emotions Material Page 217
Sadness Suffering Acceptance Love
t-Value 0.6105 0.4578 1.6438 0.2210
df 8 8 8 27
p-Value 0.2792 0.3297 0.0694 0.4134
tcrit (α=0.01) 2.8965 2.8965 2.8965 2.4727
tcrit (α=0.025) 2.3060 2.3060 2.3060 2.0518
tcrit (α=0.05) 1.8595 1.8595 1.8595 1.7033
Calmness Anticipation Interest Optimism
t-Value 0.4621 0.2792 -0.4073 -0.4763
df 8 11 52 20
p-Value 0.3282 0.3926 0.3427 0.3195
tcrit (α=0.01) 2.8965 2.7181 2.4002 2.5280
tcrit (α=0.025) 2.3060 2.2010 2.0066 2.0860
tcrit (α=0.05) 1.8595 1.7959 1.6747 1.7247
Table D.17: t-test Results of Emotions for the Documentary Genre for RMIT.
Fear Worry Fun Passiveness
t-Value 1.0286 2.2504 2.9803 -0.3856
df 11 19 13 6
p-Value 0.1629 0.0182 0.0053 0.3566
tcrit (α=0.01) 2.7181 2.5395 2.6503 3.1427
tcrit (α=0.025) 2.2010 2.0930 2.1604 2.4469
tcrit (α=0.05) 1.7959 1.7291 1.7709 1.9432
Boredom Surprise Anticipation Interest
t-Value -1.7061 0.0254 0.0306 -0.5101
df 15 5 25 66
p-Value 0.0543 0.4903 0.4879 0.3059
tcrit (α=0.01) 2.6025 3.3649 2.4922 2.3842
tcrit (α=0.025) 2.1314 2.5706 2.0639 1.9966
tcrit (α=0.05) 1.7531 2.0150 1.7109 1.6683
Table D.18: t-test Results of Emotions for the News Genre for RMIT.
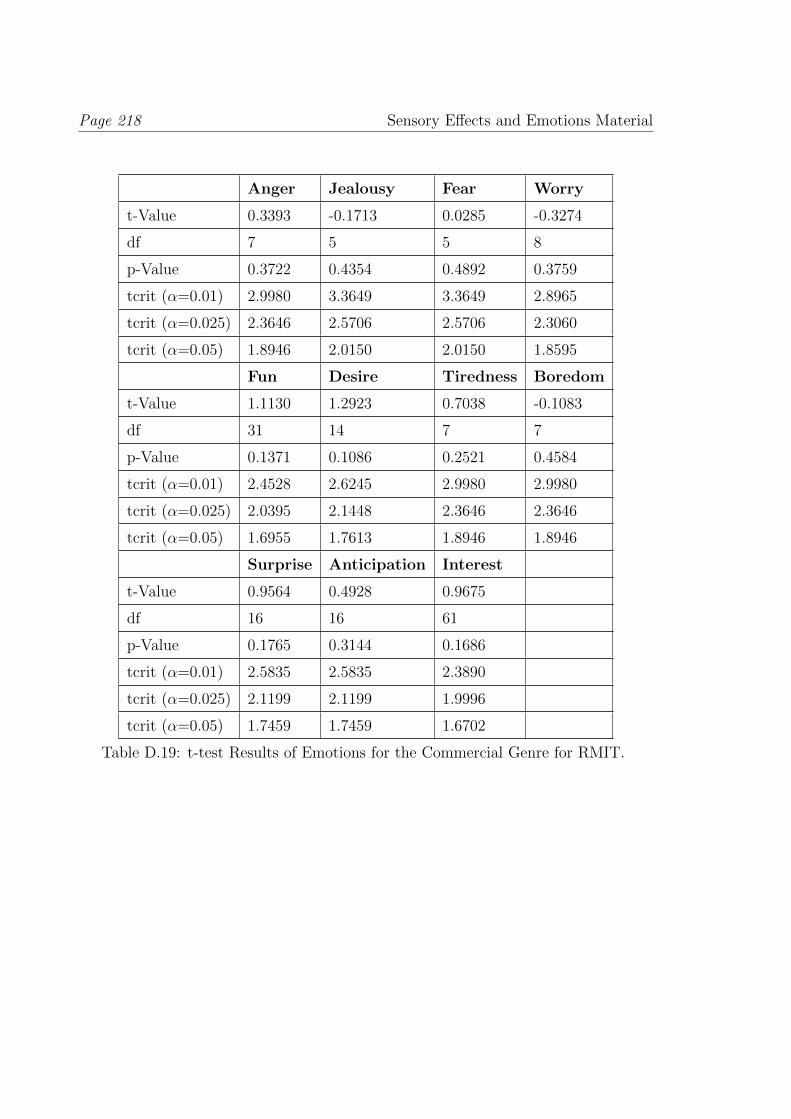
Page 218 Sensory Effects and Emotions Material
Anger Jealousy Fear Worry
t-Value 0.3393 -0.1713 0.0285 -0.3274
df 7 5 5 8
p-Value 0.3722 0.4354 0.4892 0.3759
tcrit (α=0.01) 2.9980 3.3649 3.3649 2.8965
tcrit (α=0.025) 2.3646 2.5706 2.5706 2.3060
tcrit (α=0.05) 1.8946 2.0150 2.0150 1.8595
Fun Desire Tiredness Boredom
t-Value 1.1130 1.2923 0.7038 -0.1083
df 31 14 7 7
p-Value 0.1371 0.1086 0.2521 0.4584
tcrit (α=0.01) 2.4528 2.6245 2.9980 2.9980
tcrit (α=0.025) 2.0395 2.1448 2.3646 2.3646
tcrit (α=0.05) 1.6955 1.7613 1.8946 1.8946
Surprise Anticipation Interest
t-Value 0.9564 0.4928 0.9675
df 16 16 61
p-Value 0.1765 0.3144 0.1686
tcrit (α=0.01) 2.5835 2.5835 2.3890
tcrit (α=0.025) 2.1199 2.1199 1.9996
tcrit (α=0.05) 1.7459 1.7459 1.6702
Table D.19: t-test Results of Emotions for the Commercial Genre for RMIT.
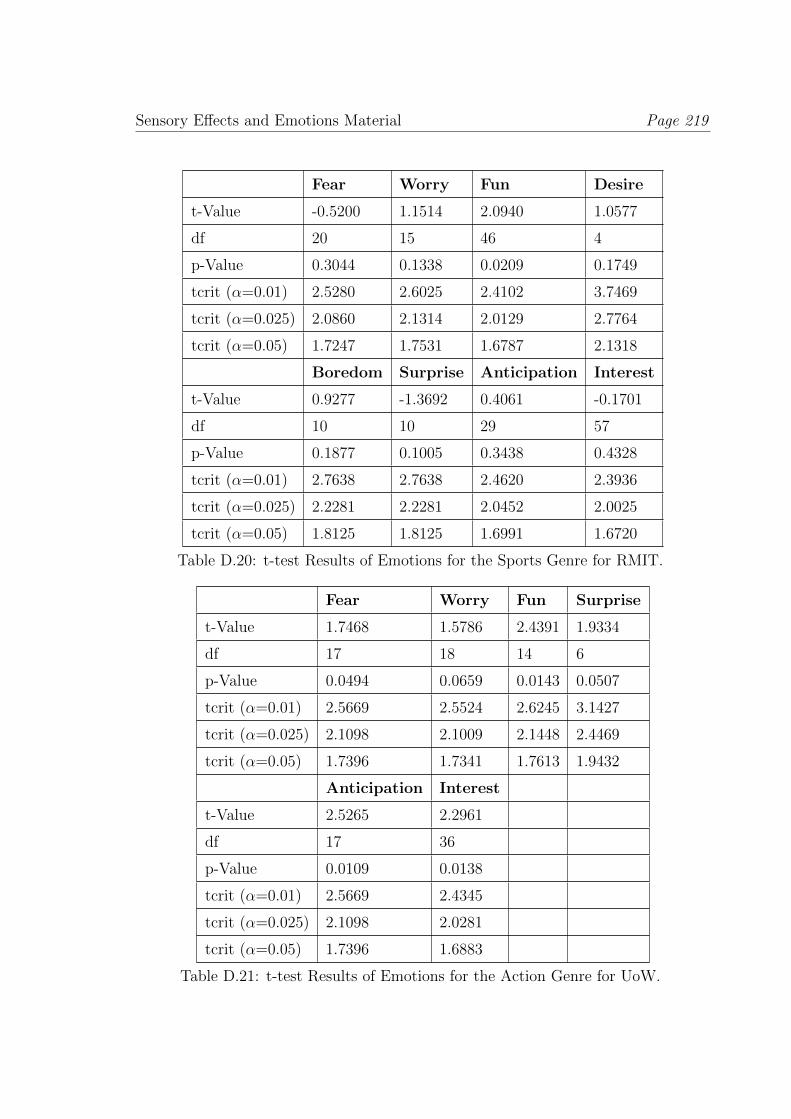
Sensory Effects and Emotions Material Page 219
Fear Worry Fun Desire
t-Value -0.5200 1.1514 2.0940 1.0577
df 20 15 46 4
p-Value 0.3044 0.1338 0.0209 0.1749
tcrit (α=0.01) 2.5280 2.6025 2.4102 3.7469
tcrit (α=0.025) 2.0860 2.1314 2.0129 2.7764
tcrit (α=0.05) 1.7247 1.7531 1.6787 2.1318
Boredom Surprise Anticipation Interest
t-Value 0.9277 -1.3692 0.4061 -0.1701
df 10 10 29 57
p-Value 0.1877 0.1005 0.3438 0.4328
tcrit (α=0.01) 2.7638 2.7638 2.4620 2.3936
tcrit (α=0.025) 2.2281 2.2281 2.0452 2.0025
tcrit (α=0.05) 1.8125 1.8125 1.6991 1.6720
Table D.20: t-test Results of Emotions for the Sports Genre for RMIT.
Fear Worry Fun Surprise
t-Value 1.7468 1.5786 2.4391 1.9334
df 17 18 14 6
p-Value 0.0494 0.0659 0.0143 0.0507
tcrit (α=0.01) 2.5669 2.5524 2.6245 3.1427
tcrit (α=0.025) 2.1098 2.1009 2.1448 2.4469
tcrit (α=0.05) 1.7396 1.7341 1.7613 1.9432
Anticipation Interest
t-Value 2.5265 2.2961
df 17 36
p-Value 0.0109 0.0138
tcrit (α=0.01) 2.5669 2.4345
tcrit (α=0.025) 2.1098 2.0281
tcrit (α=0.05) 1.7396 1.6883
Table D.21: t-test Results of Emotions for the Action Genre for UoW.
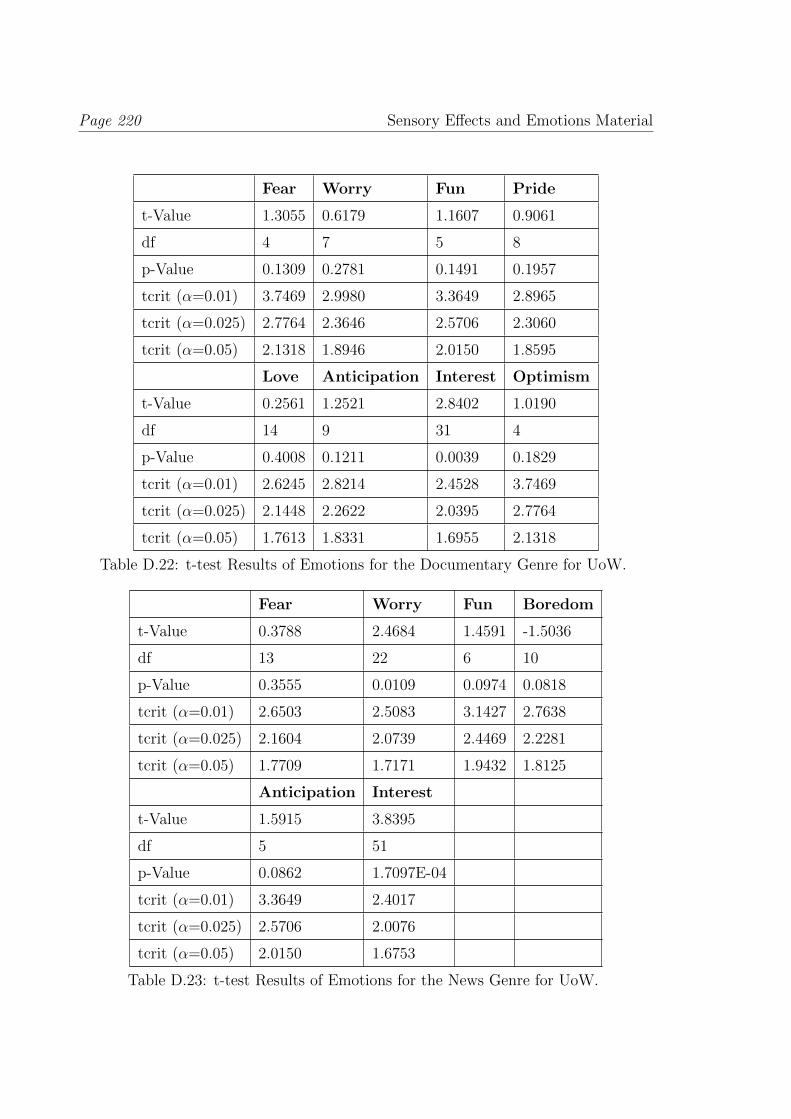
Page 220 Sensory Effects and Emotions Material
Fear Worry Fun Pride
t-Value 1.3055 0.6179 1.1607 0.9061
df 4 7 5 8
p-Value 0.1309 0.2781 0.1491 0.1957
tcrit (α=0.01) 3.7469 2.9980 3.3649 2.8965
tcrit (α=0.025) 2.7764 2.3646 2.5706 2.3060
tcrit (α=0.05) 2.1318 1.8946 2.0150 1.8595
Love Anticipation Interest Optimism
t-Value 0.2561 1.2521 2.8402 1.0190
df 14 9 31 4
p-Value 0.4008 0.1211 0.0039 0.1829
tcrit (α=0.01) 2.6245 2.8214 2.4528 3.7469
tcrit (α=0.025) 2.1448 2.2622 2.0395 2.7764
tcrit (α=0.05) 1.7613 1.8331 1.6955 2.1318
Table D.22: t-test Results of Emotions for the Documentary Genre for UoW.
Fear Worry Fun Boredom
t-Value 0.3788 2.4684 1.4591 -1.5036
df 13 22 6 10
p-Value 0.3555 0.0109 0.0974 0.0818
tcrit (α=0.01) 2.6503 2.5083 3.1427 2.7638
tcrit (α=0.025) 2.1604 2.0739 2.4469 2.2281
tcrit (α=0.05) 1.7709 1.7171 1.9432 1.8125
Anticipation Interest
t-Value 1.5915 3.8395
df 5 51
p-Value 0.0862 1.7097E-04
tcrit (α=0.01) 3.3649 2.4017
tcrit (α=0.025) 2.5706 2.0076
tcrit (α=0.05) 2.0150 1.6753
Table D.23: t-test Results of Emotions for the News Genre for UoW.
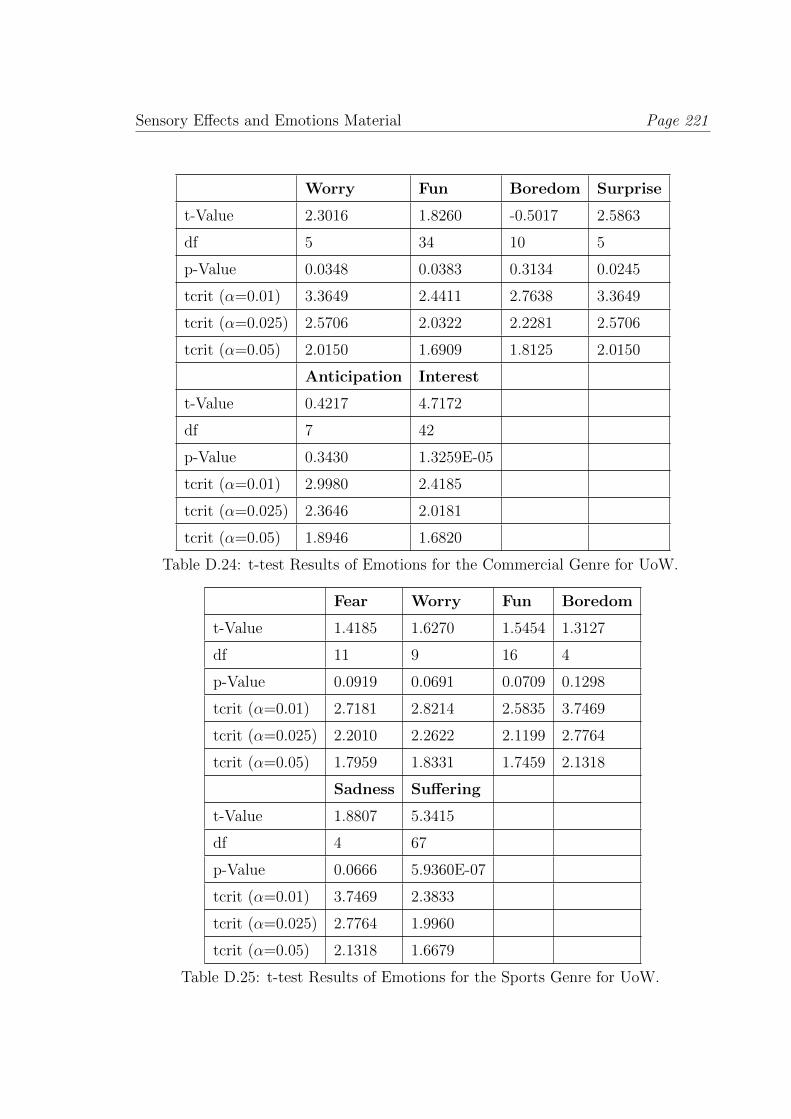
Sensory Effects and Emotions Material Page 221
Worry Fun Boredom Surprise
t-Value 2.3016 1.8260 -0.5017 2.5863
df 5 34 10 5
p-Value 0.0348 0.0383 0.3134 0.0245
tcrit (α=0.01) 3.3649 2.4411 2.7638 3.3649
tcrit (α=0.025) 2.5706 2.0322 2.2281 2.5706
tcrit (α=0.05) 2.0150 1.6909 1.8125 2.0150
Anticipation Interest
t-Value 0.4217 4.7172
df 7 42
p-Value 0.3430 1.3259E-05
tcrit (α=0.01) 2.9980 2.4185
tcrit (α=0.025) 2.3646 2.0181
tcrit (α=0.05) 1.8946 1.6820
Table D.24: t-test Results of Emotions for the Commercial Genre for UoW.
Fear Worry Fun Boredom
t-Value 1.4185 1.6270 1.5454 1.3127
df 11 9 16 4
p-Value 0.0919 0.0691 0.0709 0.1298
tcrit (α=0.01) 2.7181 2.8214 2.5835 3.7469
tcrit (α=0.025) 2.2010 2.2622 2.1199 2.7764
tcrit (α=0.05) 1.7959 1.8331 1.7459 2.1318
Sadness Suffering
t-Value 1.8807 5.3415
df 4 67
p-Value 0.0666 5.9360E-07
tcrit (α=0.01) 3.7469 2.3833
tcrit (α=0.025) 2.7764 1.9960
tcrit (α=0.05) 2.1318 1.6679
Table D.25: t-test Results of Emotions for the Sports Genre for UoW.
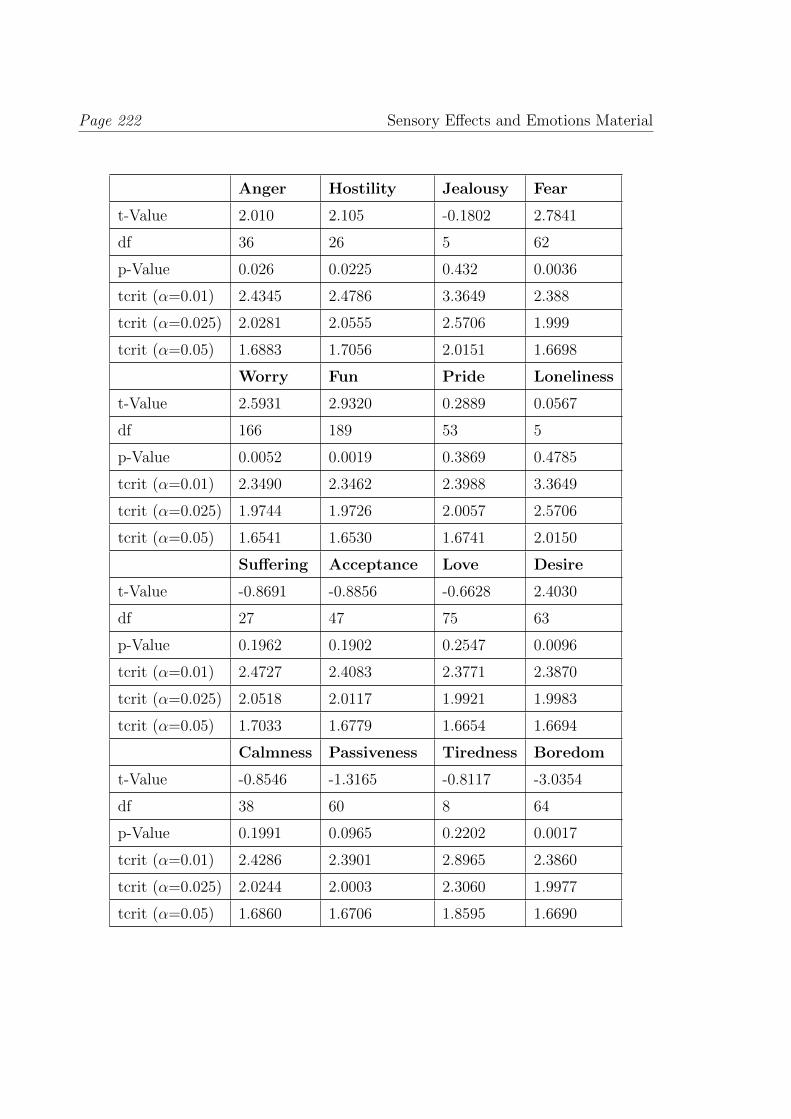
Page 222 Sensory Effects and Emotions Material
Anger Hostility Jealousy Fear
t-Value 2.010 2.105 -0.1802 2.7841
df 36 26 5 62
p-Value 0.026 0.0225 0.432 0.0036
tcrit (α=0.01) 2.4345 2.4786 3.3649 2.388
tcrit (α=0.025) 2.0281 2.0555 2.5706 1.999
tcrit (α=0.05) 1.6883 1.7056 2.0151 1.6698
Worry Fun Pride Loneliness
t-Value 2.5931 2.9320 0.2889 0.0567
df 166 189 53 5
p-Value 0.0052 0.0019 0.3869 0.4785
tcrit (α=0.01) 2.3490 2.3462 2.3988 3.3649
tcrit (α=0.025) 1.9744 1.9726 2.0057 2.5706
tcrit (α=0.05) 1.6541 1.6530 1.6741 2.0150
Suffering Acceptance Love Desire
t-Value -0.8691 -0.8856 -0.6628 2.4030
df 27 47 75 63
p-Value 0.1962 0.1902 0.2547 0.0096
tcrit (α=0.01) 2.4727 2.4083 2.3771 2.3870
tcrit (α=0.025) 2.0518 2.0117 1.9921 1.9983
tcrit (α=0.05) 1.7033 1.6779 1.6654 1.6694
Calmness Passiveness Tiredness Boredom
t-Value -0.8546 -1.3165 -0.8117 -3.0354
df 38 60 8 64
p-Value 0.1991 0.0965 0.2202 0.0017
tcrit (α=0.01) 2.4286 2.3901 2.8965 2.3860
tcrit (α=0.025) 2.0244 2.0003 2.3060 1.9977
tcrit (α=0.05) 1.6860 1.6706 1.8595 1.6690
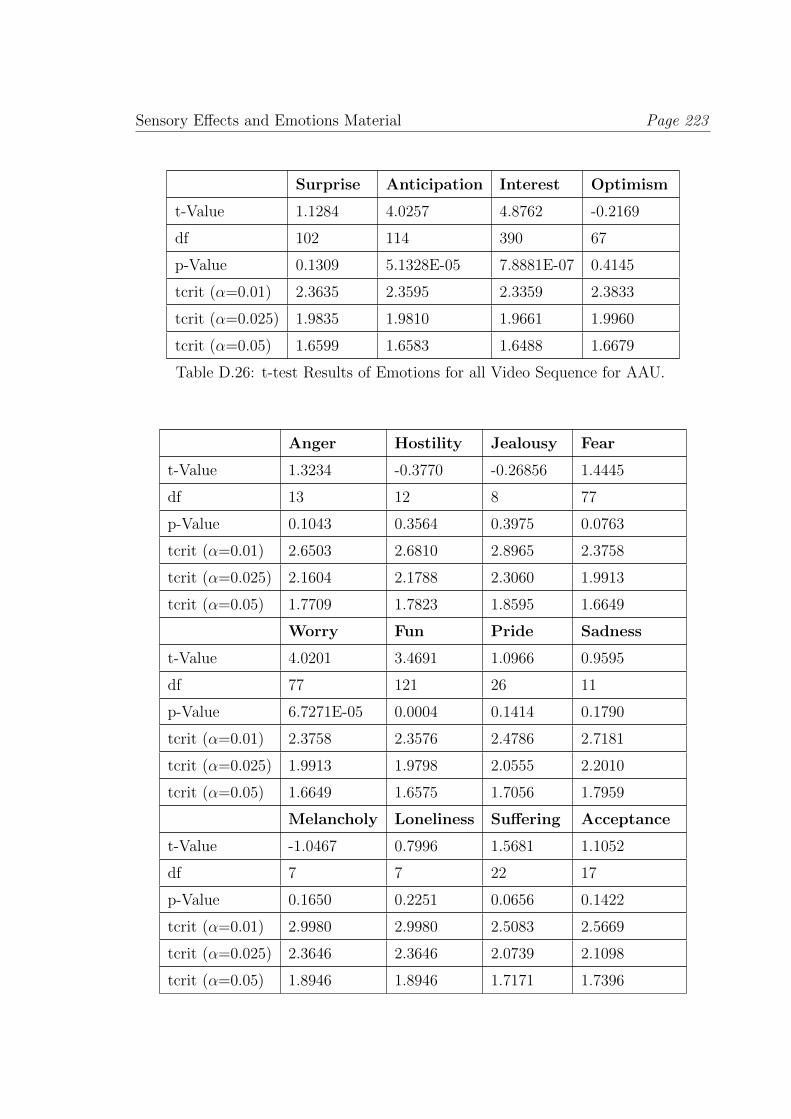
Sensory Effects and Emotions Material Page 223
Surprise Anticipation Interest Optimism
t-Value 1.1284 4.0257 4.8762 -0.2169
df 102 114 390 67
p-Value 0.1309 5.1328E-05 7.8881E-07 0.4145
tcrit (α=0.01) 2.3635 2.3595 2.3359 2.3833
tcrit (α=0.025) 1.9835 1.9810 1.9661 1.9960
tcrit (α=0.05) 1.6599 1.6583 1.6488 1.6679
Table D.26: t-test Results of Emotions for all Video Sequence for AAU.
Anger Hostility Jealousy Fear
t-Value 1.3234 -0.3770 -0.26856 1.4445
df 13 12 8 77
p-Value 0.1043 0.3564 0.3975 0.0763
tcrit (α=0.01) 2.6503 2.6810 2.8965 2.3758
tcrit (α=0.025) 2.1604 2.1788 2.3060 1.9913
tcrit (α=0.05) 1.7709 1.7823 1.8595 1.6649
Worry Fun Pride Sadness
t-Value 4.0201 3.4691 1.0966 0.9595
df 77 121 26 11
p-Value 6.7271E-05 0.0004 0.1414 0.1790
tcrit (α=0.01) 2.3758 2.3576 2.4786 2.7181
tcrit (α=0.025) 1.9913 1.9798 2.0555 2.2010
tcrit (α=0.05) 1.6649 1.6575 1.7056 1.7959
Melancholy Loneliness Suffering Acceptance
t-Value -1.0467 0.7996 1.5681 1.1052
df 7 7 22 17
p-Value 0.1650 0.2251 0.0656 0.1422
tcrit (α=0.01) 2.9980 2.9980 2.5083 2.5669
tcrit (α=0.025) 2.3646 2.3646 2.0739 2.1098
tcrit (α=0.05) 1.8946 1.8946 1.7171 1.7396
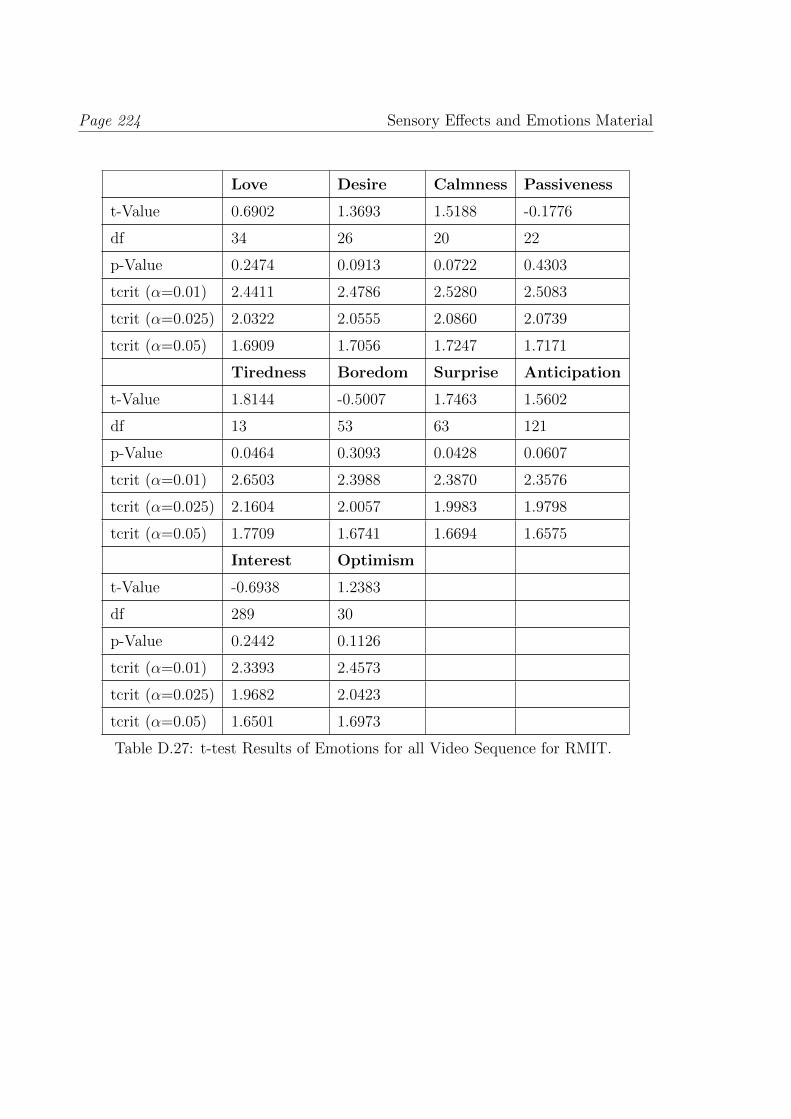
Page 224 Sensory Effects and Emotions Material
Love Desire Calmness Passiveness
t-Value 0.6902 1.3693 1.5188 -0.1776
df 34 26 20 22
p-Value 0.2474 0.0913 0.0722 0.4303
tcrit (α=0.01) 2.4411 2.4786 2.5280 2.5083
tcrit (α=0.025) 2.0322 2.0555 2.0860 2.0739
tcrit (α=0.05) 1.6909 1.7056 1.7247 1.7171
Tiredness Boredom Surprise Anticipation
t-Value 1.8144 -0.5007 1.7463 1.5602
df 13 53 63 121
p-Value 0.0464 0.3093 0.0428 0.0607
tcrit (α=0.01) 2.6503 2.3988 2.3870 2.3576
tcrit (α=0.025) 2.1604 2.0057 1.9983 1.9798
tcrit (α=0.05) 1.7709 1.6741 1.6694 1.6575
Interest Optimism
t-Value -0.6938 1.2383
df 289 30
p-Value 0.2442 0.1126
tcrit (α=0.01) 2.3393 2.4573
tcrit (α=0.025) 1.9682 2.0423
tcrit (α=0.05) 1.6501 1.6973
Table D.27: t-test Results of Emotions for all Video Sequence for RMIT.
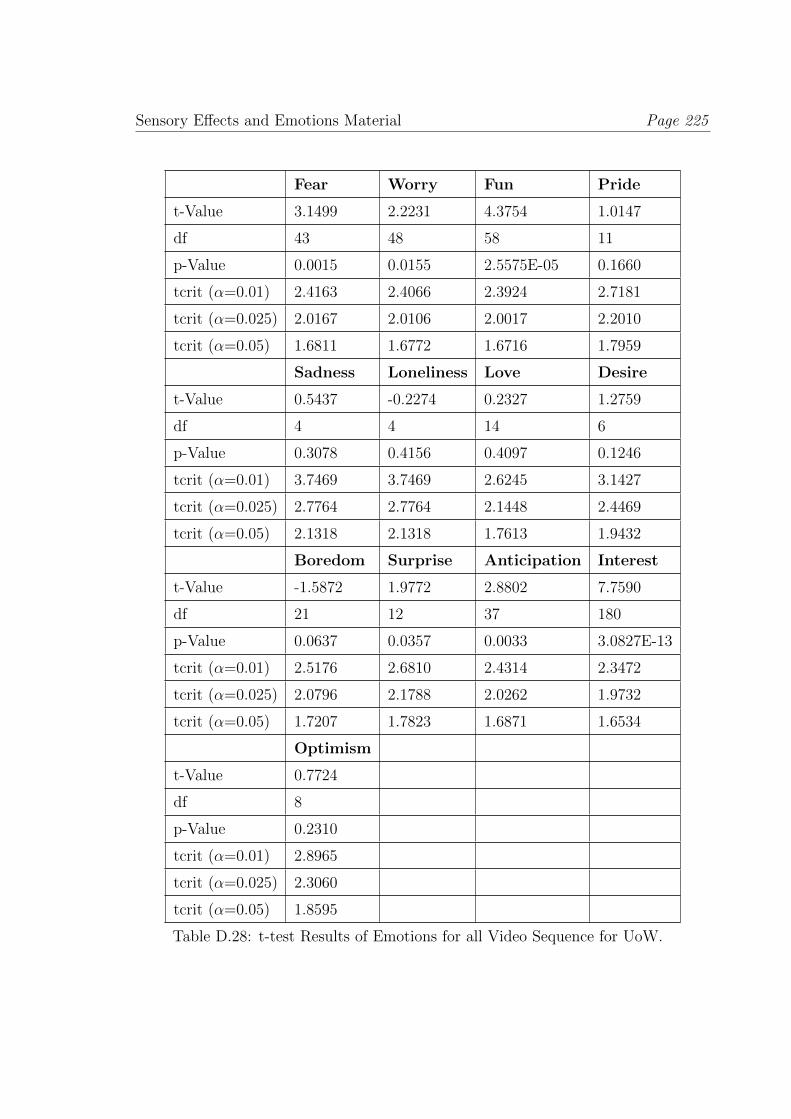
Sensory Effects and Emotions Material Page 225
Fear Worry Fun Pride
t-Value 3.1499 2.2231 4.3754 1.0147
df 43 48 58 11
p-Value 0.0015 0.0155 2.5575E-05 0.1660
tcrit (α=0.01) 2.4163 2.4066 2.3924 2.7181
tcrit (α=0.025) 2.0167 2.0106 2.0017 2.2010
tcrit (α=0.05) 1.6811 1.6772 1.6716 1.7959
Sadness Loneliness Love Desire
t-Value 0.5437 -0.2274 0.2327 1.2759
df 4 4 14 6
p-Value 0.3078 0.4156 0.4097 0.1246
tcrit (α=0.01) 3.7469 3.7469 2.6245 3.1427
tcrit (α=0.025) 2.7764 2.7764 2.1448 2.4469
tcrit (α=0.05) 2.1318 2.1318 1.7613 1.9432
Boredom Surprise Anticipation Interest
t-Value -1.5872 1.9772 2.8802 7.7590
df 21 12 37 180
p-Value 0.0637 0.0357 0.0033 3.0827E-13
tcrit (α=0.01) 2.5176 2.6810 2.4314 2.3472
tcrit (α=0.025) 2.0796 2.1788 2.0262 1.9732
tcrit (α=0.05) 1.7207 1.7823 1.6871 1.6534
Optimism
t-Value 0.7724
df 8
p-Value 0.2310
tcrit (α=0.01) 2.8965
tcrit (α=0.025) 2.3060
tcrit (α=0.05) 1.8595
Table D.28: t-test Results of Emotions for all Video Sequence for UoW.

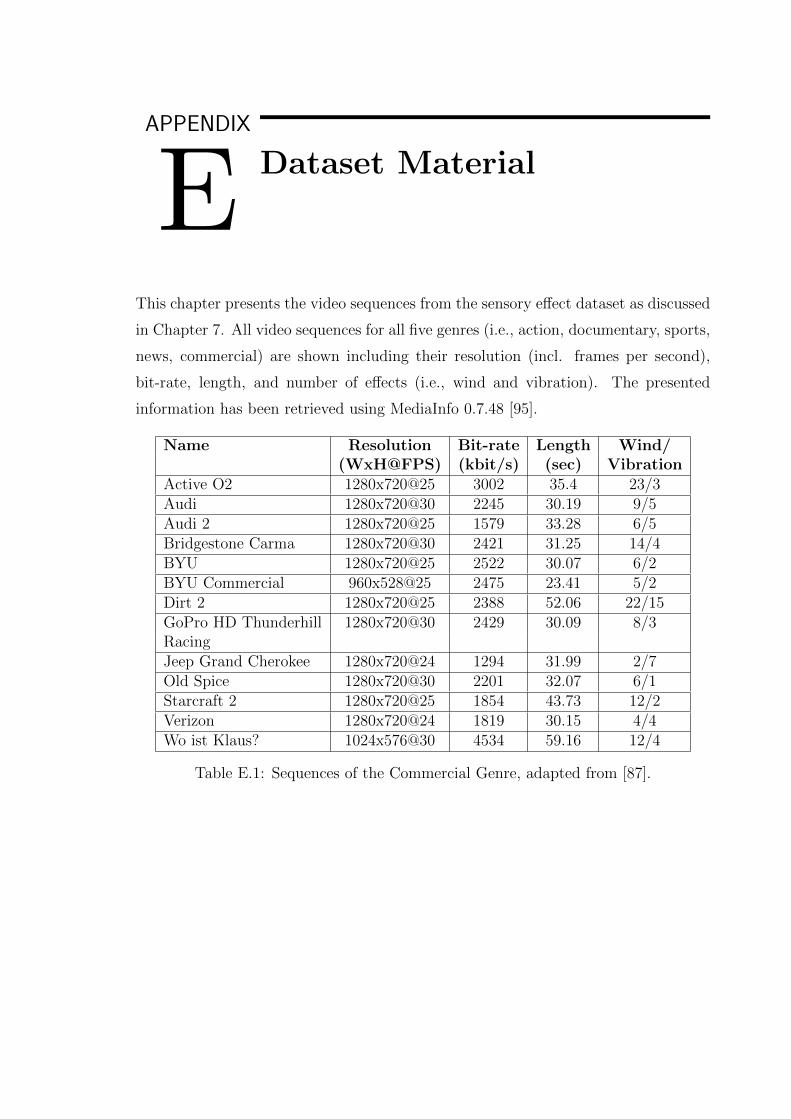
APPENDIX
E Dataset Material
This chapter presents the video sequences from the sensory effect dataset as discussed
in Chapter 7. All video sequences for all five genres (i.e., action, documentary, sports,
news, commercial) are shown including their resolution (incl. frames per second),
bit-rate, length, and number of effects (i.e., wind and vibration). The presented
information has been retrieved using MediaInfo 0.7.48 [95].
Name Resolution Bit-rate Length Wind/(WxH@FPS) (kbit/s) (sec) Vibration
Active O2 1280x720@25 3002 35.4 23/3Audi 1280x720@30 2245 30.19 9/5Audi 2 1280x720@25 1579 33.28 6/5Bridgestone Carma 1280x720@30 2421 31.25 14/4BYU 1280x720@25 2522 30.07 6/2BYU Commercial 960x528@25 2475 23.41 5/2Dirt 2 1280x720@25 2388 52.06 22/15GoPro HD Thunderhill 1280x720@30 2429 30.09 8/3RacingJeep Grand Cherokee 1280x720@24 1294 31.99 2/7Old Spice 1280x720@30 2201 32.07 6/1Starcraft 2 1280x720@25 1854 43.73 12/2Verizon 1280x720@24 1819 30.15 4/4Wo ist Klaus? 1024x576@30 4534 59.16 12/4
Table E.1: Sequences of the Commercial Genre, adapted from [87].
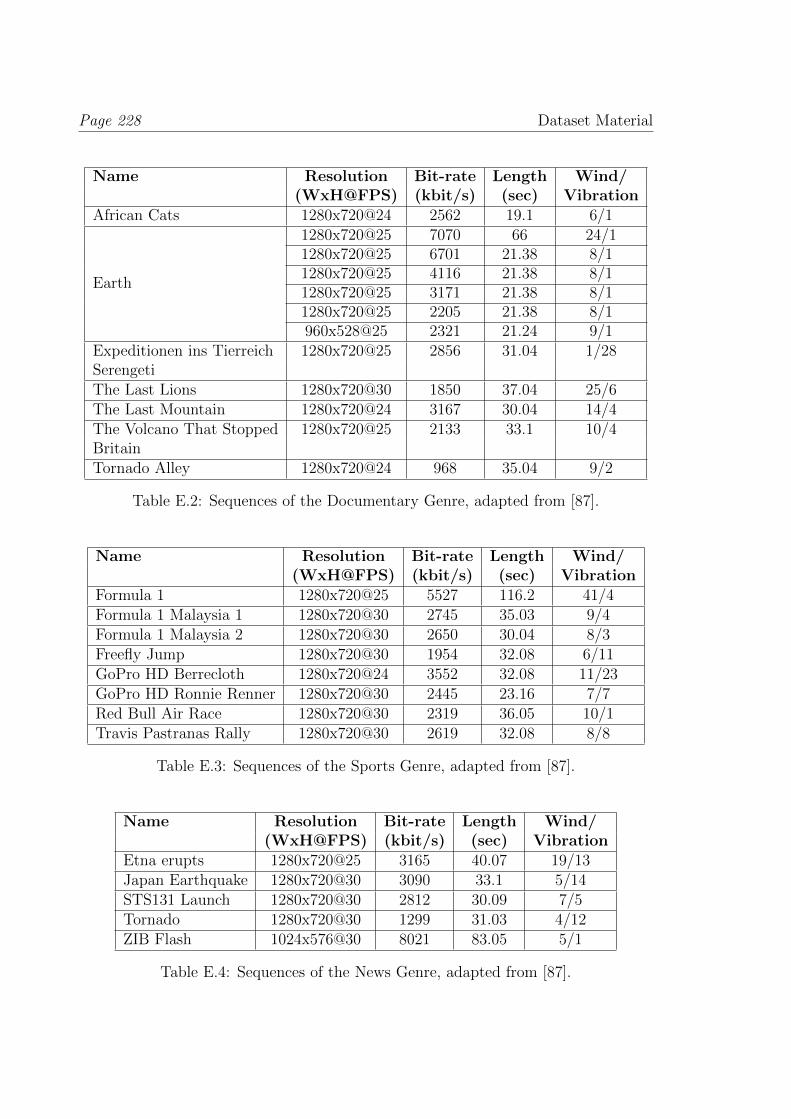
Page 228 Dataset Material
Name Resolution Bit-rate Length Wind/(WxH@FPS) (kbit/s) (sec) Vibration
African Cats 1280x720@24 2562 19.1 6/1
Earth
1280x720@25 7070 66 24/11280x720@25 6701 21.38 8/11280x720@25 4116 21.38 8/11280x720@25 3171 21.38 8/11280x720@25 2205 21.38 8/1960x528@25 2321 21.24 9/1
Expeditionen ins Tierreich 1280x720@25 2856 31.04 1/28SerengetiThe Last Lions 1280x720@30 1850 37.04 25/6The Last Mountain 1280x720@24 3167 30.04 14/4The Volcano That Stopped 1280x720@25 2133 33.1 10/4BritainTornado Alley 1280x720@24 968 35.04 9/2
Table E.2: Sequences of the Documentary Genre, adapted from [87].
Name Resolution Bit-rate Length Wind/(WxH@FPS) (kbit/s) (sec) Vibration
Formula 1 1280x720@25 5527 116.2 41/4Formula 1 Malaysia 1 1280x720@30 2745 35.03 9/4Formula 1 Malaysia 2 1280x720@30 2650 30.04 8/3Freefly Jump 1280x720@30 1954 32.08 6/11GoPro HD Berrecloth 1280x720@24 3552 32.08 11/23GoPro HD Ronnie Renner 1280x720@30 2445 23.16 7/7Red Bull Air Race 1280x720@30 2319 36.05 10/1Travis Pastranas Rally 1280x720@30 2619 32.08 8/8
Table E.3: Sequences of the Sports Genre, adapted from [87].
Name Resolution Bit-rate Length Wind/(WxH@FPS) (kbit/s) (sec) Vibration
Etna erupts 1280x720@25 3165 40.07 19/13Japan Earthquake 1280x720@30 3090 33.1 5/14STS131 Launch 1280x720@30 2812 30.09 7/5Tornado 1280x720@30 1299 31.03 4/12ZIB Flash 1024x576@30 8021 83.05 5/1
Table E.4: Sequences of the News Genre, adapted from [87].
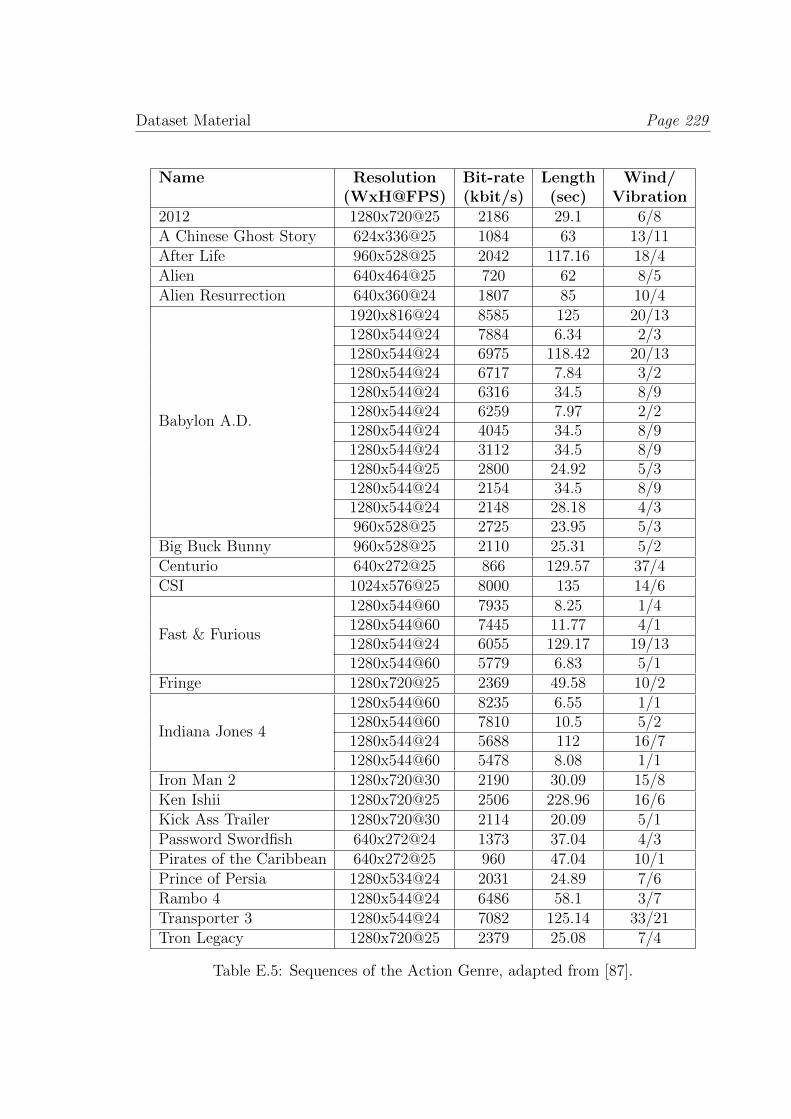
Dataset Material Page 229
Name Resolution Bit-rate Length Wind/(WxH@FPS) (kbit/s) (sec) Vibration
2012 1280x720@25 2186 29.1 6/8A Chinese Ghost Story 624x336@25 1084 63 13/11After Life 960x528@25 2042 117.16 18/4Alien 640x464@25 720 62 8/5Alien Resurrection 640x360@24 1807 85 10/4
Babylon A.D.
1920x816@24 8585 125 20/131280x544@24 7884 6.34 2/31280x544@24 6975 118.42 20/131280x544@24 6717 7.84 3/21280x544@24 6316 34.5 8/91280x544@24 6259 7.97 2/21280x544@24 4045 34.5 8/91280x544@24 3112 34.5 8/91280x544@25 2800 24.92 5/31280x544@24 2154 34.5 8/91280x544@24 2148 28.18 4/3960x528@25 2725 23.95 5/3
Big Buck Bunny 960x528@25 2110 25.31 5/2Centurio 640x272@25 866 129.57 37/4CSI 1024x576@25 8000 135 14/6
Fast & Furious
1280x544@60 7935 8.25 1/41280x544@60 7445 11.77 4/11280x544@24 6055 129.17 19/131280x544@60 5779 6.83 5/1
Fringe 1280x720@25 2369 49.58 10/2
Indiana Jones 4
1280x544@60 8235 6.55 1/11280x544@60 7810 10.5 5/21280x544@24 5688 112 16/71280x544@60 5478 8.08 1/1
Iron Man 2 1280x720@30 2190 30.09 15/8Ken Ishii 1280x720@25 2506 228.96 16/6Kick Ass Trailer 1280x720@30 2114 20.09 5/1Password Swordfish 640x272@24 1373 37.04 4/3Pirates of the Caribbean 640x272@25 960 47.04 10/1Prince of Persia 1280x534@24 2031 24.89 7/6Rambo 4 1280x544@24 6486 58.1 3/7Transporter 3 1280x544@24 7082 125.14 33/21Tron Legacy 1280x720@25 2379 25.08 7/4
Table E.5: Sequences of the Action Genre, adapted from [87].