Embed Size (px)
Citation preview

RUHRECONOMIC PAPERS
The Returns to Language Skills
in the US Labor Market
#391
Ingo IsphordingMathias Sinning
Imprint
Ruhr Economic Papers
Published by
Ruhr-Universität Bochum (RUB), Department of EconomicsUniversitätsstr. 150, 44801 Bochum, Germany
Technische Universität Dortmund, Department of Economic and Social SciencesVogelpothsweg 87, 44227 Dortmund, Germany
Universität Duisburg-Essen, Department of EconomicsUniversitätsstr. 12, 45117 Essen, Germany
Rheinisch-Westfälisches Institut für Wirtschaftsforschung (RWI)Hohenzollernstr. 1-3, 45128 Essen, Germany
Editors
Prof. Dr. Thomas K. BauerRUB, Department of Economics, Empirical EconomicsPhone: +49 (0) 234/3 22 83 41, e-mail: [email protected]
Prof. Dr. Wolfgang LeiningerTechnische Universität Dortmund, Department of Economic and Social SciencesEconomics – MicroeconomicsPhone: +49 (0) 231/7 55-3297, email: [email protected]
Prof. Dr. Volker ClausenUniversity of Duisburg-Essen, Department of EconomicsInternational EconomicsPhone: +49 (0) 201/1 83-3655, e-mail: [email protected]
Prof. Dr. Christoph M. SchmidtRWI, Phone: +49 (0) 201/81 49-227, e-mail: [email protected]
Editorial Offi ce
Joachim SchmidtRWI, Phone: +49 (0) 201/81 49-292, e-mail: [email protected]
Ruhr Economic Papers #391
Responsible Editor: Thomas K. Bauer
All rights reserved. Bochum, Dortmund, Duisburg, Essen, Germany, 2012
ISSN 1864-4872 (online) – ISBN 978-3-86788-446-4The working papers published in the Series constitute work in progress circulated to stimulate discussion and critical comments. Views expressed represent exclusively the authors’ own opinions and do not necessarily refl ect those of the editors.

Ruhr Economic Papers #391
Ingo Isphording and Mathias Sinning
The Returns to Language Skills
in the US Labor Market

Bibliografi sche Informationen
der Deutschen Nationalbibliothek
Die Deutsche Bibliothek verzeichnet diese Publikation in der deutschen National-bibliografi e; detaillierte bibliografi sche Daten sind im Internet über: http://dnb.d-nb.de abrufb ar.
http://dx.doi.org/10.4419/86788446ISSN 1864-4872 (online)ISBN 978-3-86788-446-4
Ingo Isphording and Mathias Sinning1
The Returns to Language Skills in the US
Labor Market
Abstract
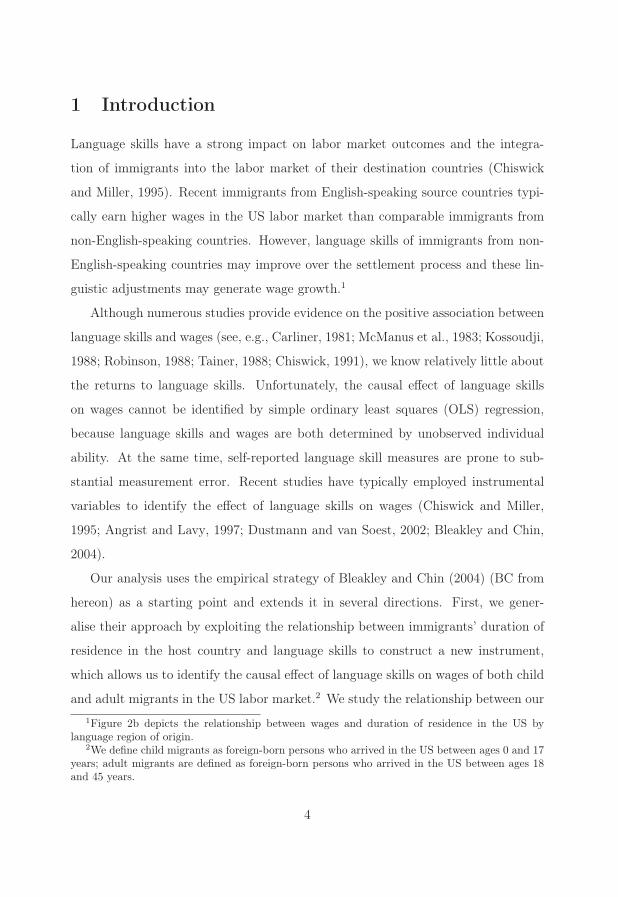
This paper uses data from the 2010 American Community Survey (ACS) to study the returns to language skills of child and adult migrants in the US labor market. We employ an instrumental variable strategy, which exploits diff erences in language acquisition profi les between immigrants from English- and non-English-speaking countries of origin, to address problems related to endogeneity and measurement error. We fi nd signifi cantly positive returns to language skills and demonstrate that education is an important channel through which language skills aff ect wages of child migrants. Although the returns of adult migrants do not depend on education, we fi nd that child and adult migrants exhibit similar returns to language skills.
JEL Classifi cation: F22, J24, J31
Keywords: International migration; language skills; labor productivity
December 2012
1 Ingo Isphording, Ruhr-Universität Bochum; Mathias Sinning, Australian National University, RWI, IZA, CReAM. – We thank Alicia Adsera, Andrew Clarke, Christian Dustmann, Sara McLanahan, Maria Medvedeva, Marcos Rangel, and Marta Tienda for helpful comments and suggestions and gratefully acknowledge the support of the Australian Group of Eight (Go8) and the German Academic Exchange Service (DAAD). – All correspondence to Mathias Sinning, Research School of Economics (RSE), HW Arndt Building 25a, Australian National University, Canberra ACT 0200, Australia, E-Mail: [email protected].
1 Introduction
Language skills have a strong impact on labor market outcomes and the integra-
tion of immigrants into the labor market of their destination countries (Chiswick
and Miller, 1995). Recent immigrants from English-speaking source countries typi-
cally earn higher wages in the US labor market than comparable immigrants from
non-English-speaking countries. However, language skills of immigrants from non-
English-speaking countries may improve over the settlement process and these lin-
guistic adjustments may generate wage growth.1
Although numerous studies provide evidence on the positive association between
language skills and wages (see, e.g., Carliner, 1981; McManus et al., 1983; Kossoudji,
1988; Robinson, 1988; Tainer, 1988; Chiswick, 1991), we know relatively little about
the returns to language skills. Unfortunately, the causal effect of language skills
on wages cannot be identified by simple ordinary least squares (OLS) regression,
because language skills and wages are both determined by unobserved individual
ability. At the same time, self-reported language skill measures are prone to sub-
stantial measurement error. Recent studies have typically employed instrumental
variables to identify the effect of language skills on wages (Chiswick and Miller,
1995; Angrist and Lavy, 1997; Dustmann and van Soest, 2002; Bleakley and Chin,
2004).
Our analysis uses the empirical strategy of Bleakley and Chin (2004) (BC from
hereon) as a starting point and extends it in several directions. First, we gener-
alise their approach by exploiting the relationship between immigrants’ duration of
residence in the host country and language skills to construct a new instrument,
which allows us to identify the causal effect of language skills on wages of both child
and adult migrants in the US labor market.2 We study the relationship between our1Figure 2b depicts the relationship between wages and duration of residence in the US by
language region of origin.2We define child migrants as foreign-born persons who arrived in the US between ages 0 and 17
years; adult migrants are defined as foreign-born persons who arrived in the US between ages 18and 45 years.
4
approach and the one originally proposed by BC for a sample of child migrants. Sec-
ond, we take into account that child and adult migrants accumulate human capital
in different ways by analysing differences in the extent to which the effect of lan-
guage skills on wages of child and adult migrants is mediated by education. Third,
we study the role of thresholds for different durations of residence when constructing
instrumental variables based on binary treatments and provide evidence on gender
differences in the returns to language skills of child and adult migrants. Finally, we
use a recent data source, the 2010 wave of the American Community Survey (ACS),
to perform our analysis.
Studying the causal effect of language skills on wages of immigrants is highly
relevant because languages constitute important barriers in the international labor
market. Language barriers do not only affect international migration flows (Adsera
and Pytlikova, 2012), but may also impede the economic integration of immigrants
by contributing to labor market discrimination and segregation (Borjas, 2002; Heller-
stein and Neumark, 2008). Unfortunately, we cannot simply assume that the returns
to language skills of child and adult migrants are the same. While adult migrants
typically make the decision to migrate after they have obtained a considerable part
of their education in the country of origin, child migrants are brought to the US by
their parents and typically receive most or all of their education in the US. Beck
et al. (2012) show that the age at arrival of child migrants to the US affects edu-
cational outcomes and conclude that children experience migration differently from
adults.
Using data from the 1990 Census, BC find a significantly positive effect of
English-language skills on wages of individuals who arrived in the US as children.
Their identification strategy is motivated by the psychobiological literature, which
suggests that there is a critical age range in which children learn languages almost
automatically (Newport, 2002). This relationship between language acquisition and
age, which is referred to as “critical period hypothesis”, explains their choice of an
5
instrumental variable that is based on differences in age at arrival effects between
child migrants from English-speaking and non-English-speaking countries of origin.
In this paper, we study a modification of the instrumental variable proposed
by BC to extend the analysis to adult migrants. Instead of using an instrumental
variable based on age at arrival, we employ differences in the underlying duration
of residence in the US between immigrants from English-speaking and non-English-
speaking source countries. It appears likely that the duration of residence affects
wages of immigrants through channels other than language, such as the accumu-
lation of country-specific human capital (Chiswick, 1978). To isolate the part of
the duration of residence that affects wages through the language channel, we use
immigrants from English-speaking countries as a control group for immigrants from
non-English-speaking countries. We exploit this variation by using the interaction
between immigrants’ duration of residence in the US and a dummy for non-English-
speaking countries of origin as our identifying instrument.
Our findings reveal significantly positive returns to language skills and demon-
strate that a considerable part of the effect on wages of child migrants is mediated
by education, confirming the results of BC for the sample of child migrants. By con-
trast, the returns to language skills of adult migrants do not depend on education,
which appears reasonable because most adult migrants were educated in their native
language before they immigrated to the US. Despite differences in the relevance of
language skills for investments in education, we find that differences in the returns
to language skills between child and adult migrants are rather small and insignif-
icant. Robustness checks indicate that the choice of age at arrival or duration of
residence thresholds used to construct instrumental variables based on binary treat-
ments does not affect our results significantly. We also find no significant differences
in the returns to language skills between male and female workers.
The remainder of this paper is organised as follows. Section 2 explains our
estimation strategy. Data and descriptive statistics are presented in Section 3. We
6
discuss the results in Section 4 and Section 5 concludes.
2 Language and Assimilation
Our empirical analysis utilises differences in assimilation profiles between immigrants
from English-speaking and non-English-speaking countries of origin to obtain un-
biased estimates of the effects of language skills on wages. While immigrants from
English-speaking countries are fluent in English upon arrival in the US, immigrants
from non-English-speaking countries are less likely to be fluent in English, but may
improve their English skills over time. When compared to a reference point, we may
expect that the two groups exhibit different assimilation profiles with regard to both
language skills and wages. We exploit these differences to identify the causal effect
of language skills on wages. A simple model of the relationship between wages and
language skills constitutes the starting point of our analysis. Formally, let Yi denote
(the logarithm of) the annual wage of individual i, which is described by
Yi = β0 + β1Di + β2Ni + β3Li +X ′iβ4 + ηi, (1)
where Di denotes the duration of residence (or the age at arrival) of individual i
in the US, Ni indicates whether individual i originated from an English-speaking
country (Ni = 0) or a non-English-speaking country (Ni = 1), Li is a measure
of English-language skills, and Xi is a set of control variables. The error term ηi
contains an unobserved wage component that is uncorrelated with Di, Ni, and Xi.
Equation (1) implies that we may only obtain an unbiased ordinary least squares
(OLS) estimate of the effect of language skills on wages if E(ηi|Li) = 0, which
is quite unlikely. On one hand, both wages and language skills may depend on
unobserved ability, which may cause an upward bias of the OLS estimate. On the
other hand, measurement error in the language skill measure is likely to cause a
severe downward bias of the OLS estimate. Subjective measures of language skills
7
are prone to substantial degrees of measurement error (Charette and Meng, 1994,
1998; Dustmann and van Soest , 2001; de Coulon and Wolff, 2007) and differences
between subjective and objective measures of language skills can be related to poor
labor market outcomes (Akresh and Frank, 2011). In sum, we have to take into
account the possibility that the conditional expectation of the error term is different
from zero and that the OLS estimate of β3 is biased, although the direction of the
bias is a priori unclear.
We employ an instrumental variable (IV) strategy to address these issues, using
the interaction term Di · Ni as an instrument for language skills. The first stage
equation of the IV approach relates language skills to the instrument and the set of
control variables of equation (1):
Li = γ0 + γ1Di + γ2Ni + γ3Di ·Ni +X ′iγ4 + εi. (2)
By using the interaction between duration of residence (or age at arrival) and non-
English-speaking country of origin as an instrument for English skills, we assume
that the difference in assimilation profiles between English and non-English-speaking
countries affects immigrants’ wages exclusively through English skills. It is im-
portant to note that country-specific differences between migrants from English-
speaking and non-English-speaking countries persist, even after differencing out
non-linguistic factors of their years since migration (or age at arrival) profiles. Both
child and adult migrants are affected by self-selection and selective immigration
policies, although in different ways. While adult migrants have made the decision
to migrate for themselves, the selection of child migrants is based on their parents’
decision to migrate. For that reason, we follow BC and include country fixed effects
(instead of Ni) in all our IV regressions. By using immigrants from English-speaking
countries as a control group for immigrants from non-English-speaking countries of
origin and controlling for country-of-origin fixed effects in our regression model, we
are able to remove any non-linguistic factors from the duration of residence (or age
8
at arrival) profile. We therefore expect that the resulting variation in our instrument
is orthogonal to the error term of equation (1).
Finally, if both Di and Ni are dummy variables, then we may derive the popu-
lation analog of the Wald estimator, which is identical to a two-stage least square
(2SLS) estimator and may be written as
β3 =[E(Yi11)− E(Yi01)]− [E(Yi10)− E(Yi00)]
[E(Li11)− E(Li01)]− [E(Li10)− E(Li00)], (3)
where E(Aijk) ≡ E(Ai|Di = j,Ni = k). The numerator and denominator of equa-
tion (3) are the difference in difference estimators of annual wages and English
ability, respectively.
In our empirical analysis, we will present a number of results for separate samples
of child and adult migrants and modified versions of equations (1) to (3). Specifically,
we will construct binary treatment and continuous instrumental variables based on
age at arrival and years since migration to present difference in difference estimates of
English ability and annual (log) wages and 2SLS estimates of the returns to language
skills. We will further study the extent to which the effect of language skills on wages
obtained from the 2SLS model is mediated by educational attainment.
3 Data
We use data from the 2006-2010 Public Use Microdata Sample (PUMS) American
Community Survey (ACS). To avoid dealing with issues related to labor market
dynamics during the Great Recession, we focus on the year 2010.3 We restrict our
analysis to foreign-born persons aged 25 to 55 years and distinguish between child
migrants, who arrived in the US between ages 0 and 17 years, and adult migrants,
who arrived between ages 18 and 45 years. The narrow age range excludes most3Using data from the period 2006-2010 to perform a cross-sectional analysis does not affect our
results qualitatively.
9
individuals in education and limits the duration of residence in the US to 55 years
for child migrants and to 37 years for adult migrants. By excluding individuals
above age 55 years, we also reduce problems related to early retirement. Taken
together, our sample restrictions allow comparisons over an important part of the
age-earnings profile of child and adult migrants.4
In addition to these restrictions, we remove 3,104 outliers (1,017 child migrants
and 2,087 adult migrants) from our data by dropping the highest and lowest 1.5th
percentile of the respective wage distributions of child and adult migrants because
robustness checks indicate that the inclusion of these outliers has a considerable
impact on our results. After deleting observations with missing values on language
skills and wages, we obtain a sample of 125,027 immigrants. To implement our
identification strategy, we distinguish between immigrants from English-speaking
and non-English-speaking countries.5 Following BC, we further exclude officially
English-speaking countries if less than 50% of adult immigrants report English as
their mother tongue.6 Our sample of immigrants from non-English-speaking coun-
tries consists of 30,887 child and 66,558 adult migrants. We further observe 3,089
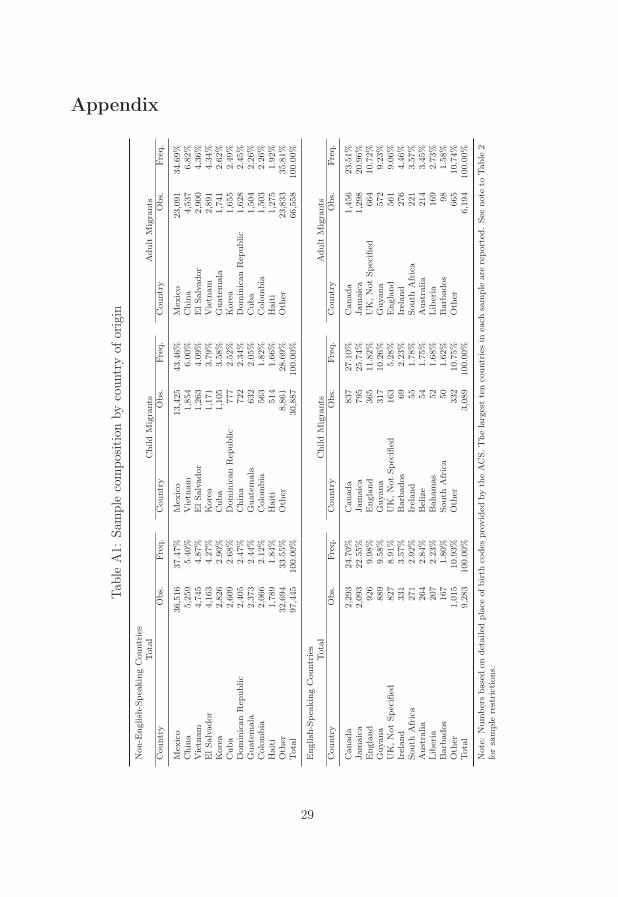
child and 6,194 adult migrants from English-speaking countries of origin. Table A1
illustrates the composition of the sample with regard to country of origin.
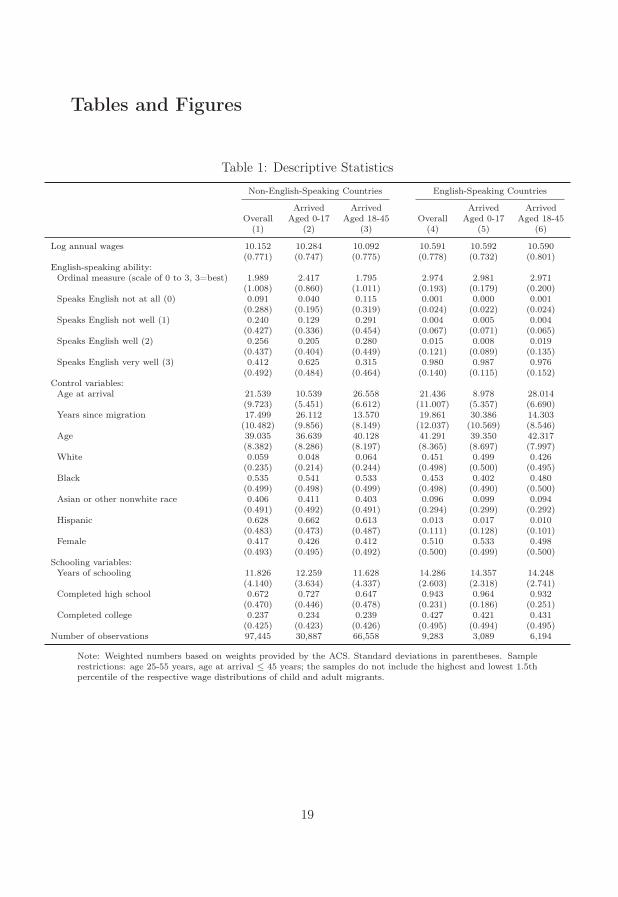
Table 1 contains summary statistics for child and adult migrants by age of arrival
and language of origin. The numbers in Table 1 reveal a difference in language skills4Our results are robust to changes in the lower and upper age bound of the sample. BC use a
more restrictive sample in their analysis of child migrants. Specifically, they focus on child migrantsaged 25 to 38 years and residing in the US between 16 and 30 years, but mention that their resultsare not sensitive to these particular sample restrictions. Using their sample restrictions does notchange our results qualitatively.
5The list of English-speaking countries follows BC and includes (in alphabetical order): An-tigua and Bermuda, Australia, Bahamas, Barbados, Belize, Bermuda, Canada, England, Grenada,Guyana, Ireland, Jamaica, Liberia, New Zealand, Northern Ireland, Scotland, South Africa, St.Kitts and Nevis, St. Lucia, St. Vincent and the Grenadines, United Kingdom, West Indies, andZimbabwe.
6The list of countries comprises American Samoa, Dominica, Fiji, Gambia, Ghana, Gibraltar,Guam, Hong Kong, India, Kenya, Kiribati, Malta, Marshall Islands, Mauritius, Micronesia, Nige-ria, Pakistan, Palau, Papua New Guinea, Philippines, Senegal, Seychelles, Sierra Leone, Singapore,Tanzania, Tonga, Uganda, US Territory, Zambia, and the category “not specified”. Including thesecountries as non-English-speaking countries in our analysis does not affect our results qualitatively.
10
between immigrants from English-speaking and non-English-speaking countries of
origin. As expected, child migrants from non-English-speaking countries have bet-
ter English skills than adult migrants. By construction of the sample, we observe
large differences in age at arrival and years since migration between child and adult
migrants from both regions. We further observe that immigrants from English-
speaking countries are better educated than immigrants from non-English-speaking
countries. In the sample of child migrants, differences in educational attainment
between the two groups may arise from different language skills. Differences in
educational attainment in the adult migrant sample are more likely to stem from
immigrant selection processes because adult migrants typically receive their educa-
tion in the country of origin. In our empirical analysis, we will examine the extent
to which the effect of language skills on wages is mediated by education. Further
control variables include the individual age, racial indicators for black and Asian or
other non-white background and an indicator for hispanic origin.
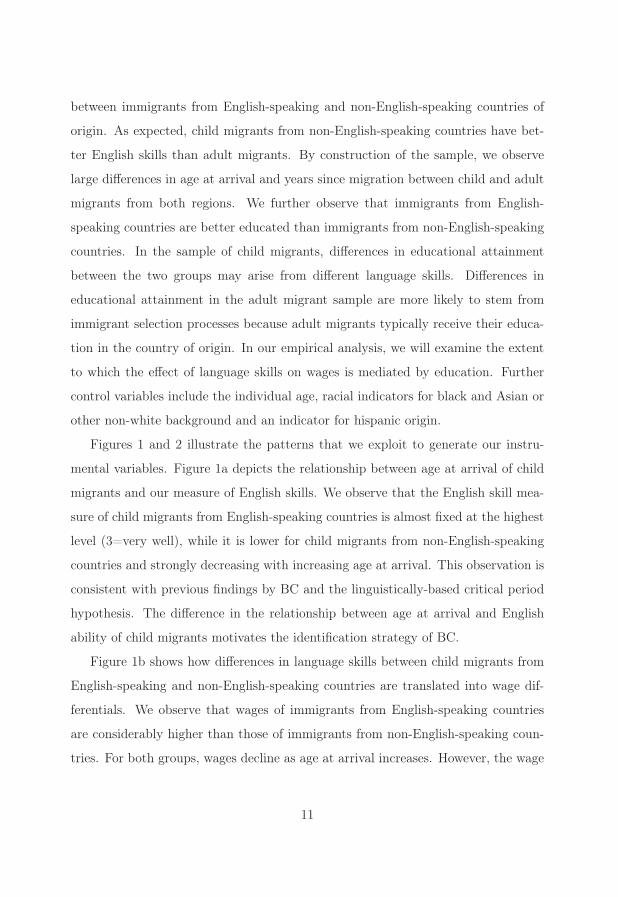
Figures 1 and 2 illustrate the patterns that we exploit to generate our instru-
mental variables. Figure 1a depicts the relationship between age at arrival of child
migrants and our measure of English skills. We observe that the English skill mea-
sure of child migrants from English-speaking countries is almost fixed at the highest
level (3=very well), while it is lower for child migrants from non-English-speaking
countries and strongly decreasing with increasing age at arrival. This observation is
consistent with previous findings by BC and the linguistically-based critical period
hypothesis. The difference in the relationship between age at arrival and English
ability of child migrants motivates the identification strategy of BC.
Figure 1b shows how differences in language skills between child migrants from
English-speaking and non-English-speaking countries are translated into wage dif-
ferentials. We observe that wages of immigrants from English-speaking countries
are considerably higher than those of immigrants from non-English-speaking coun-
tries. For both groups, wages decline as age at arrival increases. However, the wage
11
decline is stronger for child migrants from non-English-speaking countries, and as a
result the wage gap is larger at higher ages of entry. BC argue that the difference in
the variation in wages across the age at arrival distribution between the two groups
is entirely due to English ability. Figures 1c and 1d present differences in means
between child migrants from English-speaking and non-English-speaking countries
and specify the corresponding 95% confidence intervals, which indicate that the
differences are significant along the entire age at arrival distribution.
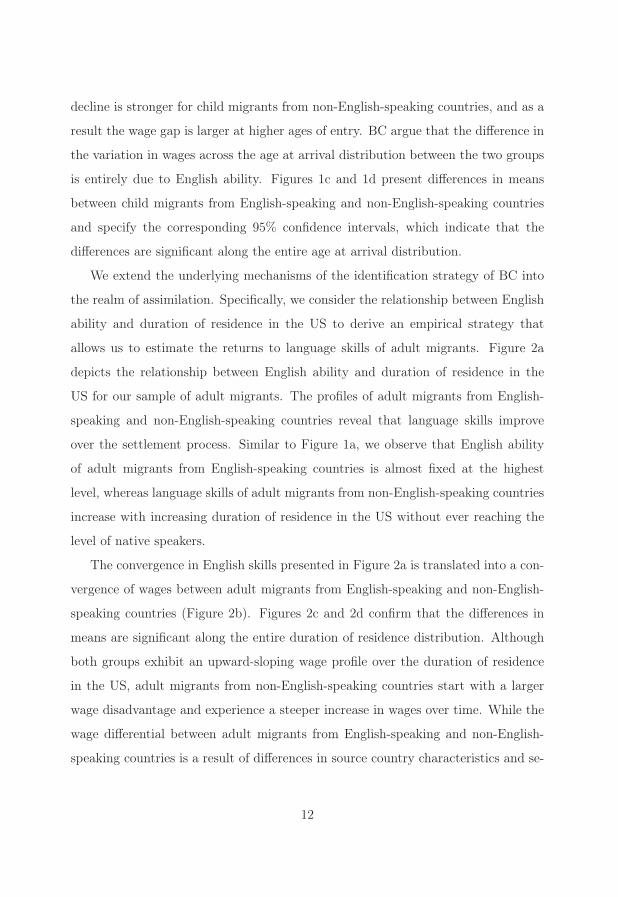
We extend the underlying mechanisms of the identification strategy of BC into
the realm of assimilation. Specifically, we consider the relationship between English
ability and duration of residence in the US to derive an empirical strategy that
allows us to estimate the returns to language skills of adult migrants. Figure 2a
depicts the relationship between English ability and duration of residence in the
US for our sample of adult migrants. The profiles of adult migrants from English-
speaking and non-English-speaking countries reveal that language skills improve
over the settlement process. Similar to Figure 1a, we observe that English ability
of adult migrants from English-speaking countries is almost fixed at the highest
level, whereas language skills of adult migrants from non-English-speaking countries
increase with increasing duration of residence in the US without ever reaching the
level of native speakers.
The convergence in English skills presented in Figure 2a is translated into a con-
vergence of wages between adult migrants from English-speaking and non-English-
speaking countries (Figure 2b). Figures 2c and 2d confirm that the differences in
means are significant along the entire duration of residence distribution. Although
both groups exhibit an upward-sloping wage profile over the duration of residence
in the US, adult migrants from non-English-speaking countries start with a larger
wage disadvantage and experience a steeper increase in wages over time. While the
wage differential between adult migrants from English-speaking and non-English-
speaking countries is a result of differences in source country characteristics and se-
12
lection mechanisms, we may difference out non-linguistic factors by using differences
in assimilation profiles between the two groups to construct an instrumental variable
for language skills of adult migrants. As described in Section 2, we will control for
country origin fixed effects in all our IV regressions to account for country-specific
differences that could affect the linguistic part of the assimilation profiles.
4 Results
Table 2 presents the difference in difference estimates of the numerator and the
denominator of equation (3) for different samples of child and adult migrants and
different treatment and outcome variables. Panel A of Table 2 includes the treatment
effects for the sample restriction employed by BC (child migrants from selected
countries of origin between ages 25 and 38 years residing in the US between 16
and 30 years). After removing outliers from our data by dropping the highest and
lowest 1.5th percentile of the wage distribution and after deleting observations with
missing values on language skills and wages, the restricted sample of child migrants
in the ACS includes 12,713 observations.7
Panel A of Table 2 includes the treatment effects of a treatment based on age at
arrival between 0 and 11 years, which is consistent with the definition of BC. The
coefficients of the interaction term in Columns (1) to (4) indicate that early arrival
increases English ability both along the cumulative distribution (Columns (1) to (3))
and is higher on the ordinal scale of the English ability measure (Column (4)). Col-
umn (5) further reveals that the wage differential between early and late arrival from
English-speaking-countries minus the difference between early and late arrivals from
non-English-speaking countries is significantly positive. The estimates presented in
Panel A do not differ much from those of BC, suggesting that the underlying re-
lationships between the variables of interest have not changed over the last two7Our restricted sample of child migrants is considerably smaller than the 1990 Census sample of
BC because the ACS is designed as a rolling cross-section and sample sizes of yearly data collectionsare smaller than those of previous US Censuses.
13
decades.
Panel B of Table 2 includes the estimates of the full sample of child migrants
(aged 25 to 55 years), which do not differ substantially from the estimates presented
in Panel A. In Panel C, we replace the treatment variable by an interaction be-
tween an indicator variable for a duration of residence above the sample average
and an indicator for non-English-speaking countries of origin. We choose the sam-
ple average of the duration of residence as a threshold for the duration of residence
indicator because sample averages differ considerably for child and adult migrants
(see Table 1).8 The estimates in Panel C of Table 2 indicate that more established
immigrants exhibit higher English skills, although the treatment effects on English
ability are smaller than in Panels A and B, which is in line with the relatively slow
convergence of English ability over the settlement process (see Figures 1a and 2a).
At the same time, the treatment effect on wages does not differ significantly from
the treatment effects presented in Panels A and B.
Using a treatment variable based on years since migration allows us to extend
the empirical analysis to adult migrants. The treatment effect estimates for the
full sample of adult migrants, which are presented in Panel D of Table 2, indicate
that the difference in difference estimates between more and less established adult
migrants from non-English and English-speaking countries are positive, although
not increasing along the cumulative English ability distribution, suggesting that the
treatment effects are more important for speaking English “Well or Very Well” than
for speaking English “Very Well”. We further observe that the treatment effect on
wages is slightly smaller, although not significantly different from the corresponding
treatment effect presented in Panel C.
Table 3 presents the IV estimates for the full sample of child migrants.9 The first8Table A2 in the Appendix includes the estimates obtained from different underlying age at
arrival and duration of residence thresholds around the respective sample averages. The estimatesof our preferred model specifications (Panels A and C of Table A2) are remarkably stable, while theresults vary significantly across thresholds if we apply an instrument based on years since migrationto the sample of child migrants (Panel B).
9The identifying instruments are highly significant in all specifications. The Kleibergen-Paap
14
two columns in Panel A of Table 3 include the estimated parameters of different
specifications of the first stage regression. Similar to BC, we estimate a model
with a control variable for age at arrival and another one with age at arrival fixed
effects, which does not affect our results qualitatively. The estimates confirm the
negative effect of the instrument based on age at arrival on English ability. The OLS
estimates presented in Columns (3) and (4) indicate that an increase in the English
ability measure by one unit increases wages by about 20%. However, the second
stage estimates in Columns (5) and (6) reveal a considerable downward bias in the
OLS estimates and suggest that the wage increase induced by a one unit increase
in the English ability measure is about 30%. These results confirm the findings of
BC who demonstrate that the OLS estimates suffer from substantial downward bias
due to measurement error, which sets off the smaller upward bias resulting from
endogeneity.
Panel B of Table 3 includes the estimates for the instrumental variable based
on years since migration. The estimates of the first stage regression (Columns (1)
and (2)) are significantly positive, reflecting that English ability improves over the
settlement process. In contrast to Panel A, the second stage estimates (presented
in Columns (5) and (6)) are much higher when we use years since migration instead
of age at arrival to construct the instrumental variable. The difference between the
second stage estimates presented in Panels A and B may be attributed to different
age-earnings profiles between child migrants from English and non-English-speaking
countries (note that age at arrival = age − years since migration). Specifically, the
increase in the second stage estimates in Panel B reflects that child migrants from
English-speaking countries exhibit a steeper age-earnings profile than child migrants
from non-English-speaking countries.10 For that reason, we obtain second stage re-
sults that are similar to those of Panel A when we control for differences in age effects
statistic clearly exceeds the critical values of Stock and Yogo (2005) in all cases.10Separate linear regressions of log annual wages on age, age squared, and the control variables
of the regressions presented in Table 3 confirm that child migrants from English-speaking countrieshave a steeper age-earnings profile than child migrants from non-English-speaking countries.
15
between child migrants from English-speaking and non-English-speaking countries
of origin (Panel C). Overall, these estimates suggest that our new instrument based
on years since migration appears to have the expected properties, even though we
are unable to test its validity.
Table 4 includes the IV estimates for the sample of adult migrants, using our
instrumental variable based on years since migration. The estimates in Panel A
of Table 4 reveal that differences in the returns to language skills between child
and adult migrants are rather small and not significant. The estimates in Panel B,
which account for differences in age effects between adult migrants from English
and non-English-speaking countries of origin, further suggest that the age-earnings
profiles of adult migrants do not differ much across regions of origin. As a result,
differences in the second stage estimates between Panels A and B of Table 4 are also
insignificant.11
Although our findings suggest that the returns to language skills between child
and adult migrants are about the same, we have reason to expect that the chan-
nels through which language skills affect wages of child and adult migrants are
very different. In particular, child migrants typically receive their education in the
destination country, while adult migrants typically receive their education abroad.
Consequently, it seems reasonable to expect that a considerable part of the effect
of language skills on wages of child migrants is mediated by education, while the
contribution of education to the effect of language skills on wages of adult migrants
should be very small. The estimates in Table 5 confirm this hypothesis. Specifi-
cally, we use the IV estimates from Column (6), Panel A of Tables 1 and 2 as base
results and compare them to a model in which we include years of schooling and
years of schooling fixed effects, respectively.12 After controlling for education, the11Since the results presented in Tables 3 and 4 are not necessarily the same for male and female
workers, we also study gender differences in the returns to language skills. The results, which arepresented in Table A3, suggest that differences in the returns to language skills between male andfemale workers are insignificant.
12Years of schooling are computed from individual responses on the highest degree. We use amodified version of the definition proposed by Jaeger (1997) because categories in the ACS are
16
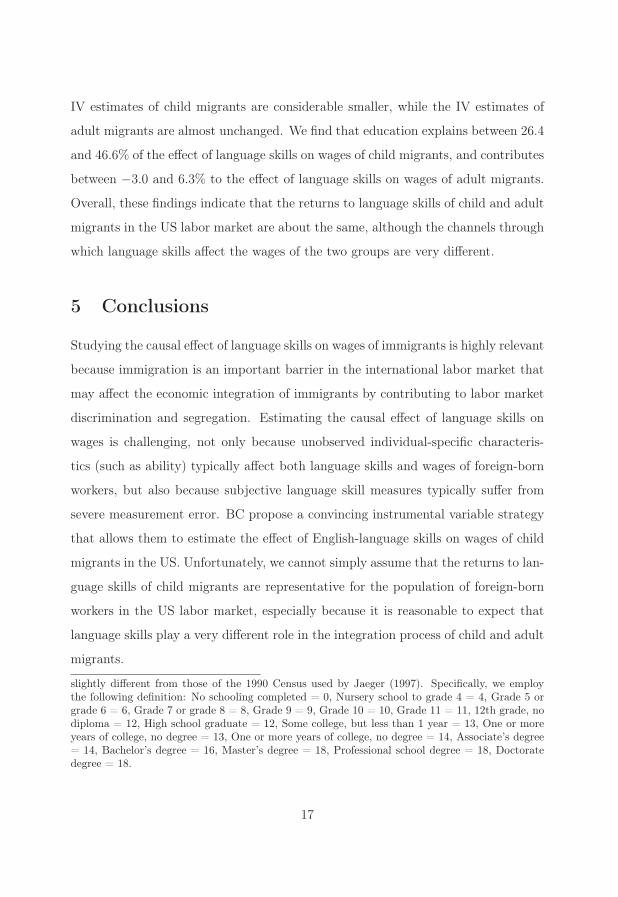
IV estimates of child migrants are considerable smaller, while the IV estimates of
adult migrants are almost unchanged. We find that education explains between 26.4
and 46.6% of the effect of language skills on wages of child migrants, and contributes
between −3.0 and 6.3% to the effect of language skills on wages of adult migrants.
Overall, these findings indicate that the returns to language skills of child and adult
migrants in the US labor market are about the same, although the channels through
which language skills affect the wages of the two groups are very different.
5 Conclusions
Studying the causal effect of language skills on wages of immigrants is highly relevant
because immigration is an important barrier in the international labor market that
may affect the economic integration of immigrants by contributing to labor market
discrimination and segregation. Estimating the causal effect of language skills on
wages is challenging, not only because unobserved individual-specific characteris-
tics (such as ability) typically affect both language skills and wages of foreign-born
workers, but also because subjective language skill measures typically suffer from
severe measurement error. BC propose a convincing instrumental variable strategy
that allows them to estimate the effect of English-language skills on wages of child
migrants in the US. Unfortunately, we cannot simply assume that the returns to lan-
guage skills of child migrants are representative for the population of foreign-born
workers in the US labor market, especially because it is reasonable to expect that
language skills play a very different role in the integration process of child and adult
migrants.
slightly different from those of the 1990 Census used by Jaeger (1997). Specifically, we employthe following definition: No schooling completed = 0, Nursery school to grade 4 = 4, Grade 5 orgrade 6 = 6, Grade 7 or grade 8 = 8, Grade 9 = 9, Grade 10 = 10, Grade 11 = 11, 12th grade, nodiploma = 12, High school graduate = 12, Some college, but less than 1 year = 13, One or moreyears of college, no degree = 13, One or more years of college, no degree = 14, Associate’s degree= 14, Bachelor’s degree = 16, Master’s degree = 18, Professional school degree = 18, Doctoratedegree = 18.
17

Against this background, we use data from the 2010 wave of the American Com-
munity Survey (ACS) and exploit the relationship between immigrants’ duration of
residence in the host country and the language spoken in the country of origin to
construct a new instrument, which allows us to identify the causal effect of language
skills on wages of both child and adult migrants in the US labor market. We further
study the extent to which the effect of language skills on wages of child and adult
migrants is mediated by education.
Our findings reveal significantly positive returns to language skills and demon-
strate that a considerable part of the effect of language skills on wages of child
migrants is mediated by education. Although the returns to language skills of adult
migrants do not depend on education, differences in the returns to language skills
between child and adult migrants are insignificant. The instrumental variable pro-
posed in this paper permits an analysis of the effect of language skills on other
relevant outcome variables beyond the group of child migrants (see Bleakley and
Chin, 2010).
18
Tables and Figures
Table 1: Descriptive Statistics
Non-English-Speaking Countries English-Speaking Countries
Arrived Arrived Arrived ArrivedOverall Aged 0-17 Aged 18-45 Overall Aged 0-17 Aged 18-45
(1) (2) (3) (4) (5) (6)
Log annual wages 10.152 10.284 10.092 10.591 10.592 10.590(0.771) (0.747) (0.775) (0.778) (0.732) (0.801)
English-speaking ability:Ordinal measure (scale of 0 to 3, 3=best) 1.989 2.417 1.795 2.974 2.981 2.971
(1.008) (0.860) (1.011) (0.193) (0.179) (0.200)Speaks English not at all (0) 0.091 0.040 0.115 0.001 0.000 0.001
(0.288) (0.195) (0.319) (0.024) (0.022) (0.024)Speaks English not well (1) 0.240 0.129 0.291 0.004 0.005 0.004
(0.427) (0.336) (0.454) (0.067) (0.071) (0.065)Speaks English well (2) 0.256 0.205 0.280 0.015 0.008 0.019
(0.437) (0.404) (0.449) (0.121) (0.089) (0.135)Speaks English very well (3) 0.412 0.625 0.315 0.980 0.987 0.976
(0.492) (0.484) (0.464) (0.140) (0.115) (0.152)Control variables:
Age at arrival 21.539 10.539 26.558 21.436 8.978 28.014(9.723) (5.451) (6.612) (11.007) (5.357) (6.690)
Years since migration 17.499 26.112 13.570 19.861 30.386 14.303(10.482) (9.856) (8.149) (12.037) (10.569) (8.546)
Age 39.035 36.639 40.128 41.291 39.350 42.317(8.382) (8.286) (8.197) (8.365) (8.697) (7.997)
White 0.059 0.048 0.064 0.451 0.499 0.426(0.235) (0.214) (0.244) (0.498) (0.500) (0.495)
Black 0.535 0.541 0.533 0.453 0.402 0.480(0.499) (0.498) (0.499) (0.498) (0.490) (0.500)
Asian or other nonwhite race 0.406 0.411 0.403 0.096 0.099 0.094(0.491) (0.492) (0.491) (0.294) (0.299) (0.292)
Hispanic 0.628 0.662 0.613 0.013 0.017 0.010(0.483) (0.473) (0.487) (0.111) (0.128) (0.101)
Female 0.417 0.426 0.412 0.510 0.533 0.498(0.493) (0.495) (0.492) (0.500) (0.499) (0.500)
Schooling variables:Years of schooling 11.826 12.259 11.628 14.286 14.357 14.248
(4.140) (3.634) (4.337) (2.603) (2.318) (2.741)Completed high school 0.672 0.727 0.647 0.943 0.964 0.932
(0.470) (0.446) (0.478) (0.231) (0.186) (0.251)Completed college 0.237 0.234 0.239 0.427 0.421 0.431
(0.425) (0.423) (0.426) (0.495) (0.494) (0.495)Number of observations 97,445 30,887 66,558 9,283 3,089 6,194
Note: Weighted numbers based on weights provided by the ACS. Standard deviations in parentheses. Samplerestrictions: age 25-55 years, age at arrival ≤ 45 years; the samples do not include the highest and lowest 1.5thpercentile of the respective wage distributions of child and adult migrants.
19
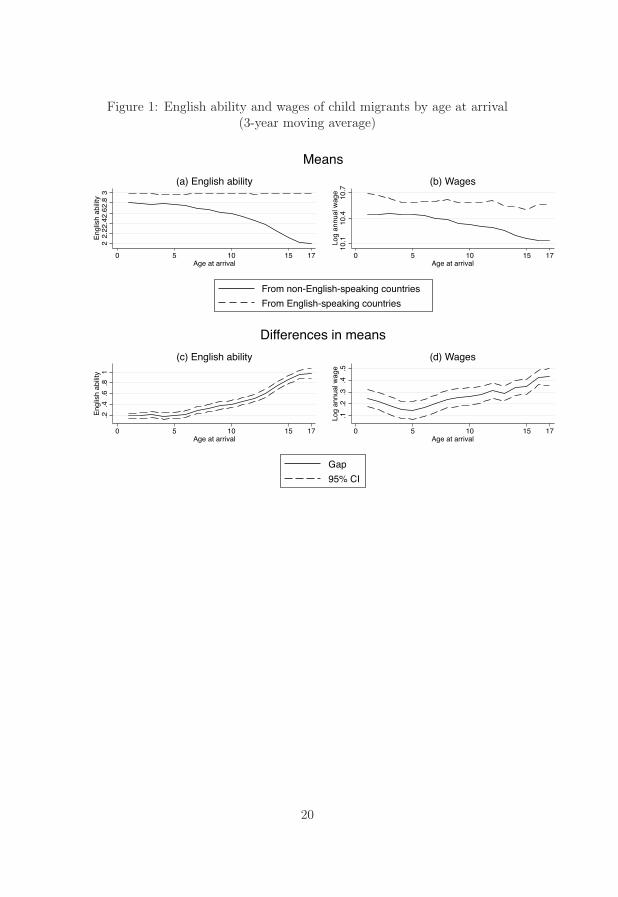
Figure 1: English ability and wages of child migrants by age at arrival(3-year moving average)
22.
22.
42.
62.
83
Eng
lish
abili
ty
0 5 10 15 17Age at arrival
(a) English ability
10.1
10.4
10.7
Log
annu
al w
age
0 5 10 15 17Age at arrival
(b) Wages
Means
From non-English-speaking countries
From English-speaking countries
.2.4
.6.8
1E
nglis
h ab
ility
0 5 10 15 17Age at arrival
(c) English ability
.1.2
.3.4
.5Lo
g an
nual
wag
e
0 5 10 15 17Age at arrival
(d) Wages
Differences in means
Gap
95% CI
20
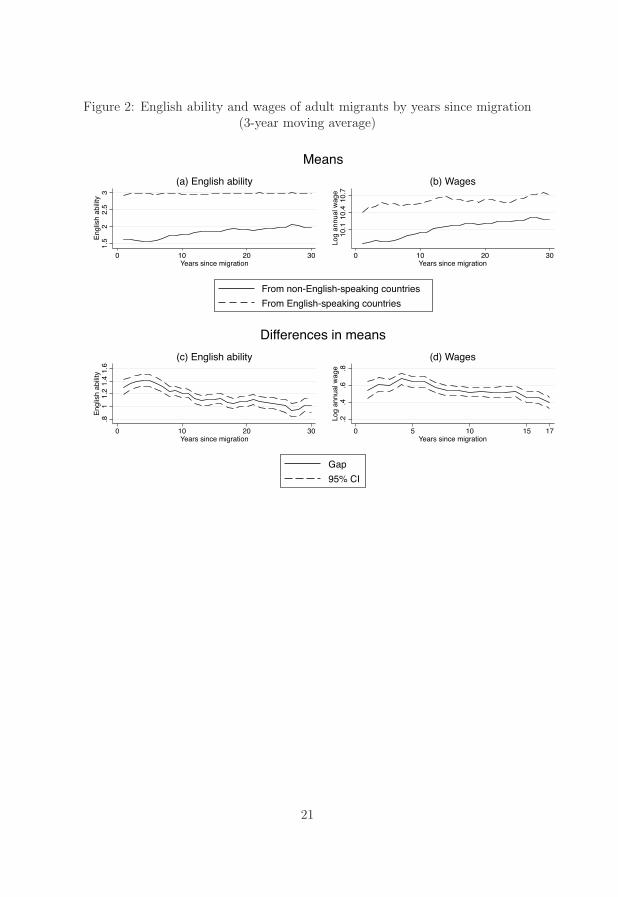
Figure 2: English ability and wages of adult migrants by years since migration(3-year moving average)
1.5
22.
53
Eng
lish
abili
ty
0 10 20 30Years since migration
(a) English ability
10.1
10.4
10.7
Log
annu
al w
age
0 10 20 30Years since migration
(b) Wages
Means
From non-English-speaking countries
From English-speaking countries
.81
1.2
1.4
1.6
Eng
lish
abili
ty
0 10 20 30Years since migration
(c) English ability
.2.4
.6.8
Log
annu
al w
age
0 5 10 15 17Years since migration
(d) Wages
Differences in means
Gap
95% CI
21
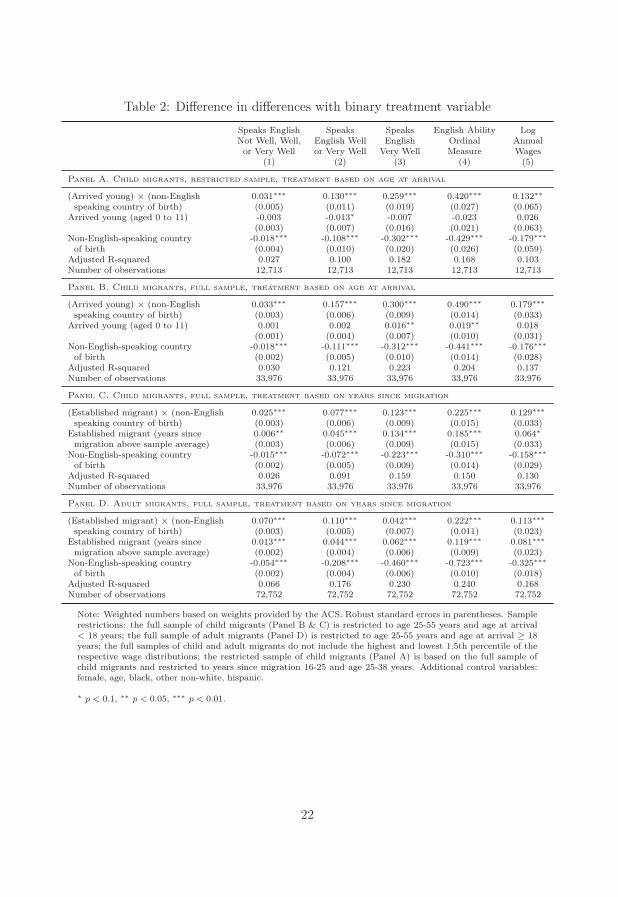
Table 2: Difference in differences with binary treatment variable
Speaks English Speaks Speaks English Ability LogNot Well, Well, English Well English Ordinal Annualor Very Well or Very Well Very Well Measure Wages
(1) (2) (3) (4) (5)
Panel A. Child migrants, restricted sample, treatment based on age at arrival
(Arrived young) × (non-English 0.031∗∗∗ 0.130∗∗∗ 0.259∗∗∗ 0.420∗∗∗ 0.132∗∗speaking country of birth) (0.005) (0.011) (0.019) (0.027) (0.065)
Arrived young (aged 0 to 11) -0.003 -0.013∗ -0.007 -0.023 0.026(0.003) (0.007) (0.016) (0.021) (0.063)
Non-English-speaking country -0.018∗∗∗ -0.108∗∗∗ -0.302∗∗∗ -0.429∗∗∗ -0.179∗∗∗of birth (0.004) (0.010) (0.020) (0.026) (0.059)
Adjusted R-squared 0.027 0.100 0.182 0.168 0.103Number of observations 12,713 12,713 12,713 12,713 12,713
Panel B. Child migrants, full sample, treatment based on age at arrival
(Arrived young) × (non-English 0.033∗∗∗ 0.157∗∗∗ 0.300∗∗∗ 0.490∗∗∗ 0.179∗∗∗speaking country of birth) (0.003) (0.006) (0.009) (0.014) (0.033)
Arrived young (aged 0 to 11) 0.001 0.002 0.016∗∗ 0.019∗∗ 0.018(0.001) (0.004) (0.007) (0.010) (0.031)
Non-English-speaking country -0.018∗∗∗ -0.111∗∗∗ -0.312∗∗∗ -0.441∗∗∗ -0.176∗∗∗of birth (0.002) (0.005) (0.010) (0.014) (0.028)
Adjusted R-squared 0.030 0.121 0.223 0.204 0.137Number of observations 33,976 33,976 33,976 33,976 33,976
Panel C. Child migrants, full sample, treatment based on years since migration
(Established migrant) × (non-English 0.025∗∗∗ 0.077∗∗∗ 0.123∗∗∗ 0.225∗∗∗ 0.129∗∗∗speaking country of birth) (0.003) (0.006) (0.009) (0.015) (0.033)
Established migrant (years since 0.006∗∗ 0.045∗∗∗ 0.134∗∗∗ 0.185∗∗∗ 0.064∗migration above sample average) (0.003) (0.006) (0.009) (0.015) (0.033)
Non-English-speaking country -0.015∗∗∗ -0.072∗∗∗ -0.223∗∗∗ -0.310∗∗∗ -0.158∗∗∗of birth (0.002) (0.005) (0.009) (0.014) (0.029)
Adjusted R-squared 0.026 0.091 0.159 0.150 0.130Number of observations 33,976 33,976 33,976 33,976 33,976
Panel D. Adult migrants, full sample, treatment based on years since migration
(Established migrant) × (non-English 0.070∗∗∗ 0.110∗∗∗ 0.042∗∗∗ 0.222∗∗∗ 0.113∗∗∗speaking country of birth) (0.003) (0.005) (0.007) (0.011) (0.023)
Established migrant (years since 0.013∗∗∗ 0.044∗∗∗ 0.062∗∗∗ 0.119∗∗∗ 0.081∗∗∗migration above sample average) (0.002) (0.004) (0.006) (0.009) (0.023)
Non-English-speaking country -0.054∗∗∗ -0.208∗∗∗ -0.460∗∗∗ -0.723∗∗∗ -0.325∗∗∗of birth (0.002) (0.004) (0.006) (0.010) (0.018)
Adjusted R-squared 0.066 0.176 0.230 0.240 0.168Number of observations 72,752 72,752 72,752 72,752 72,752
Note: Weighted numbers based on weights provided by the ACS. Robust standard errors in parentheses. Samplerestrictions: the full sample of child migrants (Panel B & C) is restricted to age 25-55 years and age at arrival< 18 years; the full sample of adult migrants (Panel D) is restricted to age 25-55 years and age at arrival ≥ 18years; the full samples of child and adult migrants do not include the highest and lowest 1.5th percentile of therespective wage distributions; the restricted sample of child migrants (Panel A) is based on the full sample ofchild migrants and restricted to years since migration 16-25 and age 25-38 years. Additional control variables:female, age, black, other non-white, hispanic.
∗ p < 0.1, ∗∗ p < 0.05, ∗∗∗ p < 0.01.
22
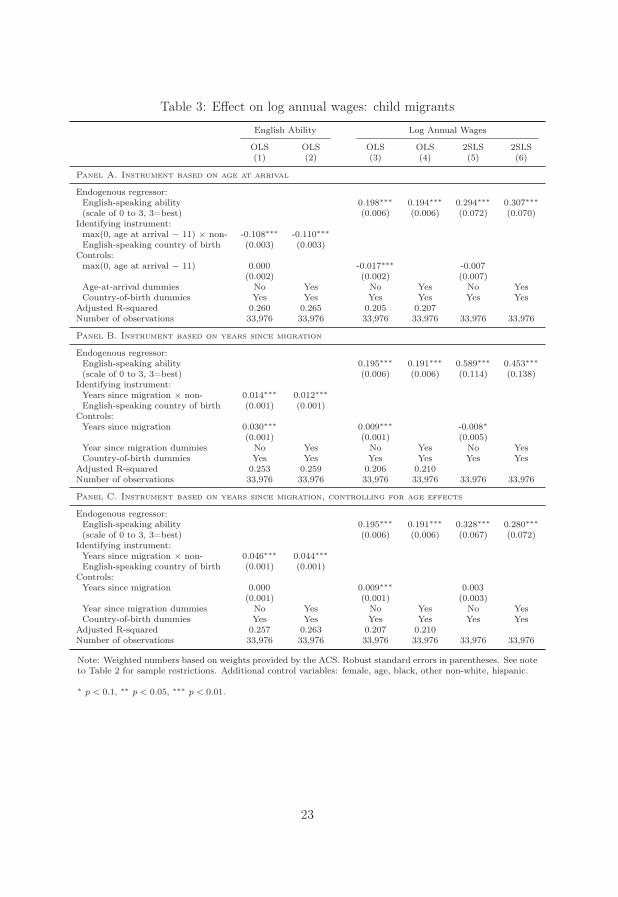
Table 3: Effect on log annual wages: child migrants
English Ability Log Annual Wages
OLS OLS OLS OLS 2SLS 2SLS(1) (2) (3) (4) (5) (6)
Panel A. Instrument based on age at arrival
Endogenous regressor:English-speaking ability 0.198∗∗∗ 0.194∗∗∗ 0.294∗∗∗ 0.307∗∗∗(scale of 0 to 3, 3=best) (0.006) (0.006) (0.072) (0.070)
Identifying instrument:max(0, age at arrival − 11) × non- -0.108∗∗∗ -0.110∗∗∗English-speaking country of birth (0.003) (0.003)
Controls:max(0, age at arrival − 11) 0.000 -0.017∗∗∗ -0.007
(0.002) (0.002) (0.007)Age-at-arrival dummies No Yes No Yes No YesCountry-of-birth dummies Yes Yes Yes Yes Yes Yes
Adjusted R-squared 0.260 0.265 0.205 0.207Number of observations 33,976 33,976 33,976 33,976 33,976 33,976
Panel B. Instrument based on years since migration
Endogenous regressor:English-speaking ability 0.195∗∗∗ 0.191∗∗∗ 0.589∗∗∗ 0.453∗∗∗(scale of 0 to 3, 3=best) (0.006) (0.006) (0.114) (0.138)
Identifying instrument:Years since migration × non- 0.014∗∗∗ 0.012∗∗∗English-speaking country of birth (0.001) (0.001)
Controls:Years since migration 0.030∗∗∗ 0.009∗∗∗ -0.008∗
(0.001) (0.001) (0.005)Year since migration dummies No Yes No Yes No YesCountry-of-birth dummies Yes Yes Yes Yes Yes Yes
Adjusted R-squared 0.253 0.259 0.206 0.210Number of observations 33,976 33,976 33,976 33,976 33,976 33,976
Panel C. Instrument based on years since migration, controlling for age effects
Endogenous regressor:English-speaking ability 0.195∗∗∗ 0.191∗∗∗ 0.328∗∗∗ 0.280∗∗∗(scale of 0 to 3, 3=best) (0.006) (0.006) (0.067) (0.072)
Identifying instrument:Years since migration × non- 0.046∗∗∗ 0.044∗∗∗English-speaking country of birth (0.001) (0.001)
Controls:Years since migration 0.000 0.009∗∗∗ 0.003
(0.001) (0.001) (0.003)Year since migration dummies No Yes No Yes No YesCountry-of-birth dummies Yes Yes Yes Yes Yes Yes
Adjusted R-squared 0.257 0.263 0.207 0.210Number of observations 33,976 33,976 33,976 33,976 33,976 33,976
Note: Weighted numbers based on weights provided by the ACS. Robust standard errors in parentheses. See noteto Table 2 for sample restrictions. Additional control variables: female, age, black, other non-white, hispanic.
∗ p < 0.1, ∗∗ p < 0.05, ∗∗∗ p < 0.01.
23
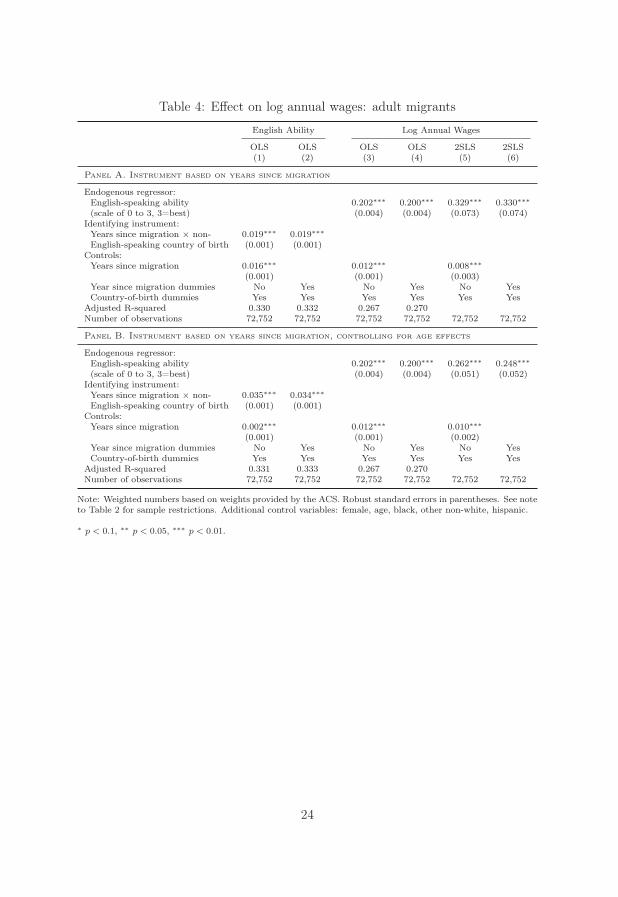
Table 4: Effect on log annual wages: adult migrants
English Ability Log Annual Wages
OLS OLS OLS OLS 2SLS 2SLS(1) (2) (3) (4) (5) (6)
Panel A. Instrument based on years since migration
Endogenous regressor:English-speaking ability 0.202∗∗∗ 0.200∗∗∗ 0.329∗∗∗ 0.330∗∗∗(scale of 0 to 3, 3=best) (0.004) (0.004) (0.073) (0.074)
Identifying instrument:Years since migration × non- 0.019∗∗∗ 0.019∗∗∗English-speaking country of birth (0.001) (0.001)
Controls:Years since migration 0.016∗∗∗ 0.012∗∗∗ 0.008∗∗∗
(0.001) (0.001) (0.003)Year since migration dummies No Yes No Yes No YesCountry-of-birth dummies Yes Yes Yes Yes Yes Yes
Adjusted R-squared 0.330 0.332 0.267 0.270Number of observations 72,752 72,752 72,752 72,752 72,752 72,752
Panel B. Instrument based on years since migration, controlling for age effects
Endogenous regressor:English-speaking ability 0.202∗∗∗ 0.200∗∗∗ 0.262∗∗∗ 0.248∗∗∗(scale of 0 to 3, 3=best) (0.004) (0.004) (0.051) (0.052)
Identifying instrument:Years since migration × non- 0.035∗∗∗ 0.034∗∗∗English-speaking country of birth (0.001) (0.001)
Controls:Years since migration 0.002∗∗∗ 0.012∗∗∗ 0.010∗∗∗
(0.001) (0.001) (0.002)Year since migration dummies No Yes No Yes No YesCountry-of-birth dummies Yes Yes Yes Yes Yes Yes
Adjusted R-squared 0.331 0.333 0.267 0.270Number of observations 72,752 72,752 72,752 72,752 72,752 72,752
Note: Weighted numbers based on weights provided by the ACS. Robust standard errors in parentheses. See noteto Table 2 for sample restrictions. Additional control variables: female, age, black, other non-white, hispanic.
∗ p < 0.1, ∗∗ p < 0.05, ∗∗∗ p < 0.01.
24
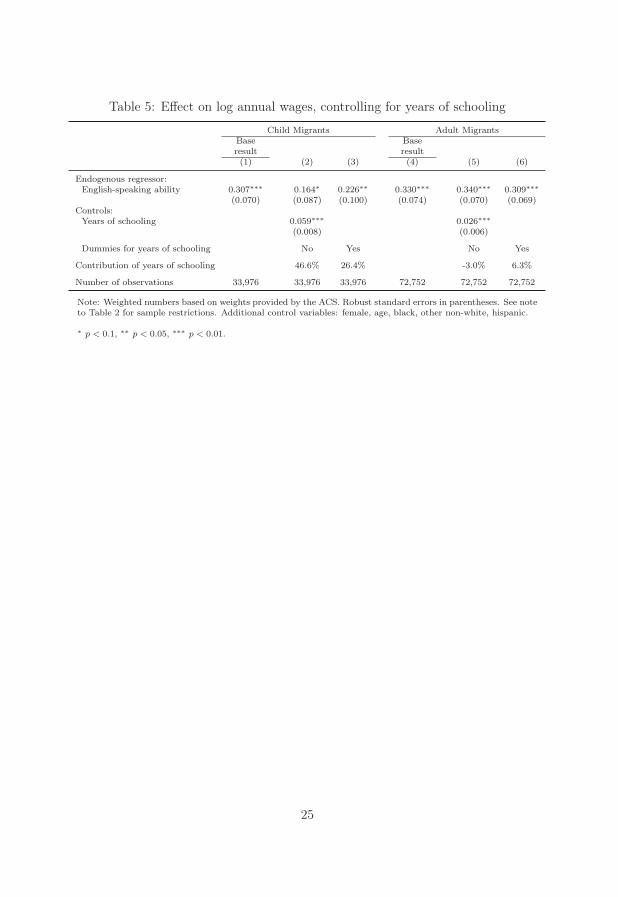
Table 5: Effect on log annual wages, controlling for years of schooling
Child Migrants Adult MigrantsBase Baseresult result(1) (2) (3) (4) (5) (6)
Endogenous regressor:English-speaking ability 0.307∗∗∗ 0.164∗ 0.226∗∗ 0.330∗∗∗ 0.340∗∗∗ 0.309∗∗∗
(0.070) (0.087) (0.100) (0.074) (0.070) (0.069)Controls:
Years of schooling 0.059∗∗∗ 0.026∗∗∗(0.008) (0.006)
Dummies for years of schooling No Yes No Yes
Contribution of years of schooling 46.6% 26.4% -3.0% 6.3%
Number of observations 33,976 33,976 33,976 72,752 72,752 72,752
Note: Weighted numbers based on weights provided by the ACS. Robust standard errors in parentheses. See noteto Table 2 for sample restrictions. Additional control variables: female, age, black, other non-white, hispanic.
∗ p < 0.1, ∗∗ p < 0.05, ∗∗∗ p < 0.01.
25
References
Adsera, A. and Pytlikova, M. (2012). The role of language in shaping international
migration. CReAM Discussion Paper Series 1206, Centre for Research and Analy-
sis of Migration (CReAM), Department of Economics, University College London.
Akresh, I. R. and Frank, R. (2011). At the intersection of self and other: English
language ability and immigrant labor market outcomes. Social Science Research
40: 1362 – 1370.
Angrist, J. D. and Lavy, V. (1997). The effect of a change in language of instruction
on the returns to schooling in Morocco. Journal of Labor Economics 15: S48–76.
Beck, A., Corak, M. and Tienda, M. (2012). Age at immigration and the adult
attainments of child migrants to the United States. The ANNALS of the American
Academy of Political and Social Sciences 643: 134–159.
Bleakley, H. and Chin, A. (2004). Language skills and earnings: Evidence from
childhood immigrants. The Review of Economics and Statistics 86: 481–496.
Bleakley, H. and Chin, A. (2010). Age at arrival, English proficiency, and social
assimilation among US immigrants. American Economic Journal: Applied Eco-
nomics 2: 165–192.
Borjas, G. J. (2002). Homeownership in the immigrant population. Journal of Urban
Economics 42: 448–476.
Carliner, G. (1981). Wage differences by language group and the market for language
skills in Canada. Journal of Human Resources 16: 384–399.
Charette, M. and Meng, R. (1994). Explaining language proficiency: Objective ver-
sus self-assessed measures of literacy. Economics Letters 44: 313–321.
26
Charette, M. and Meng, R. (1998). The determinants of literacy and numeracy, and
the effect of literacy and numeracy on labour market outcomes. Canadian Journal
of Economics 31: 495–517.
Chiswick, B. R. (1978). The effect of Americanization on the earnings of foreign-born
men. Journal of Political Economy 86: 897–921.
Chiswick, B. R. (1991). Speaking, reading, and earnings among low-skilled immi-
grants. Journal of Labor Economics 9: 149–70.
Chiswick, B. R. and Miller, P. W. (1995). The endogeneity between language and
earnings: International analyses. Journal of Labor Economics 13: 246–288.
Coulon, A. de and Wolff, F.-C. (2007). Language proficiency of immigrants and
misclassification. Applied Economics Letters 14: 857–861.
Dustmann, C. and van Soest , A. (2001). Language fluency and earnings: Estimation
with misclassified language indicators. Review of Economics and Statistics 83:
663–674.
Dustmann, C. and van Soest, A. (2002). Language and the earnings of immigrants.
Industrial and Labor Relations Review 55: 473–492.
Hellerstein, J. K. and Neumark, D. (2008). Workplace segregation in the United
States: Race, ethnicity and skill. Review of Economics and Statistics 90: 459–
477.
Jaeger, D. A. (1997). Reconciling the old and new Census Bureau education ques-
tions: Recommendations for researchers. Journal of Business & Economic Statis-
tics 15: 300–309.
Kossoudji, S. A. (1988). English language ability and the labor market opportunities
of Hispanic and East Asian immigrant men. Journal of Labor Economics 6: 205–
28.
27
McManus, W., Gould, W. and Welch, F. (1983). Earnings of Hispanic men: The
role of English language proficiency. Journal of Labor Economics 1: 101–30.
Newport, E. (2002). Critical periods in language development. In Nadel, L. (ed.),
Encyclopedia of Cognitive Science.. London: Macmillan Publishers Ltd./Nature
Publishing Group.
Robinson, C. (1988). Language choice: The distribution of language skills and earn-
ings in a dual language economy. Research in Labor Economics 9: 53–90.
Stock, J. H. and Yogo, M. (2005). Testing for weak instruments in linear IV regres-
sion. In Andrews, D. and Stock, J. (eds), Identification and Inference for Econo-
metric Models: Essays in Honor of Thomas Rothenberg.. Cambridge: Cambridge
University Press.
Tainer, E. (1988). English language proficiency and the determination of earnings
among foreign-born men. Journal of Human Resources 23: 108–122.
28
AppendixTa
ble
A1:
Sam
ple
com
posi
tion
byco
untr
yof
orig
inN
on-E
nglis
h-Sp
eaki
ngC
ount
ries
Tot
alC
hild
Mig
rant
sA
dult
Mig
rant
sC
ount
ryO
bs.
Freq
.C
ount
ryO
bs.
Freq
.C
ount
ryO
bs.
Freq
.
Mex
ico
36,5
1637
.47%
Mex
ico
13,4
2543
.46%
Mex
ico
23,0
9134
.69%
Chi
na5,
259
5.40
%V
ietn
am1,
854
6.00
%C
hina
4,53
76.
82%
Vie
tnam
4,74
54.
87%
ElSa
lvad
or1,
263
4.09
%E
lSa
lvad
or2,
900
4.36
%E
lSa
lvad
or4,
163
4.27
%K
orea
1,17
13.
79%
Vie
tnam
2,89
14.
34%
Kor
ea2,
826
2.90
%C
uba
1,10
53.
58%
Gua
tem
ala
1,74
12.
62%
Cub
a2,
609
2.68
%D
omin
ican
Rep
ublic
777
2.52
%K
orea
1,65
52.
49%
Dom
inic
anR
epub
lic2,
405
2.47
%C
hina
722
2.34
%D
omin
ican
Rep
ublic
1,62
82.
45%
Gua
tem
ala
2,37
32.
44%
Gua
tem
ala
632
2.05
%C
uba
1,50
42.
26%
Col
ombi
a2,
066
2.12
%C
olom
bia
563
1.82
%C
olom
bia
1,50
32.
26%
Hai
ti1,
789
1.84
%H
aiti
514
1.66
%H
aiti
1,27
51.
92%
Oth
er32
,694
33.5
5%O
ther
8,86
128
.69%
Oth
er23
,833
35.8
1%Tot
al97
,445
100.
00%
30,8
8710
0.00
%66
,558
100.
00%
Eng
lish-
Spea
king
Cou
ntri
esTot
alC
hild
Mig
rant
sA
dult
Mig
rant
sC
ount
ryO
bs.
Freq
.C
ount
ryO
bs.
Freq
.C
ount
ryO
bs.
Freq
.
Can
ada
2,29
324
.70%
Can
ada
837
27.1
0%C
anad
a1,
456
23.5
1%Ja
mai
ca2,
093
22.5
5%Ja
mai
ca79
525
.74%
Jam
aica
1,29
820
.96%
Eng
land
926
9.98
%E
ngla
nd36
511
.82%
UK
,N
otSp
ecifi
ed66
410
.72%
Guy
ana
889
9.58
%G
uyan
a31
710
.26%
Guy
ana
572
9.23
%U
K,N
otSp
ecifi
ed82
78.
91%
UK
,N
otSp
ecifi
ed16
35.
28%
Eng
land
561
9.06
%Ir
elan
d33
13.
57%
Bar
bado
s69
2.23
%Ir
elan
d27
64.
46%
Sout
hA
fric
a27
12.
92%
Irel
and
551.
78%
Sout
hA
fric
a22
13.
57%
Aus
tral
ia26
42.
84%
Bel
ize
541.
75%
Aus
tral
ia21
43.
45%
Lib
eria
207
2.23
%B
aham
as52
1.68
%Lib
eria
169
2.73
%B
arba
dos
167
1.80
%So
uth
Afr
ica
501.
62%
Bar
bado
s98
1.58
%O
ther
1,01
510
.93%
Oth
er33
210
.75%
Oth
er66
510
.74%
Tot
al9,
283
100.
00%
3,08
910
0.00
%6,
194
100.
00%
Not
e:N
umbe
rsba
sed
onde
taile
dpl
ace
ofbi
rth
code
spr
ovid
edby
the
AC
S.T
hela
rges
tte
nco
untr
ies
inea
chsa
mpl
ear
ere
port
ed.
See
note
toTab
le2
for
sam
ple
rest
rict
ions
.
29
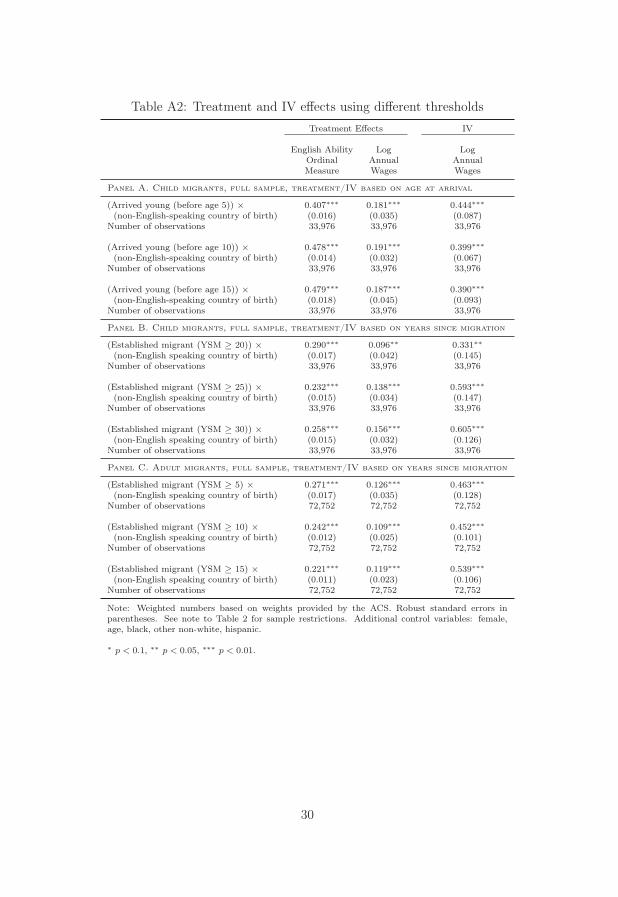
Table A2: Treatment and IV effects using different thresholdsTreatment Effects IV
English Ability Log LogOrdinal Annual AnnualMeasure Wages Wages
Panel A. Child migrants, full sample, treatment/IV based on age at arrival
(Arrived young (before age 5)) × 0.407∗∗∗ 0.181∗∗∗ 0.444∗∗∗(non-English-speaking country of birth) (0.016) (0.035) (0.087)
Number of observations 33,976 33,976 33,976
(Arrived young (before age 10)) × 0.478∗∗∗ 0.191∗∗∗ 0.399∗∗∗(non-English-speaking country of birth) (0.014) (0.032) (0.067)
Number of observations 33,976 33,976 33,976
(Arrived young (before age 15)) × 0.479∗∗∗ 0.187∗∗∗ 0.390∗∗∗(non-English-speaking country of birth) (0.018) (0.045) (0.093)
Number of observations 33,976 33,976 33,976
Panel B. Child migrants, full sample, treatment/IV based on years since migration
(Established migrant (YSM ≥ 20)) × 0.290∗∗∗ 0.096∗∗ 0.331∗∗(non-English speaking country of birth) (0.017) (0.042) (0.145)
Number of observations 33,976 33,976 33,976
(Established migrant (YSM ≥ 25)) × 0.232∗∗∗ 0.138∗∗∗ 0.593∗∗∗(non-English speaking country of birth) (0.015) (0.034) (0.147)
Number of observations 33,976 33,976 33,976
(Established migrant (YSM ≥ 30)) × 0.258∗∗∗ 0.156∗∗∗ 0.605∗∗∗(non-English speaking country of birth) (0.015) (0.032) (0.126)
Number of observations 33,976 33,976 33,976
Panel C. Adult migrants, full sample, treatment/IV based on years since migration
(Established migrant (YSM ≥ 5) × 0.271∗∗∗ 0.126∗∗∗ 0.463∗∗∗(non-English speaking country of birth) (0.017) (0.035) (0.128)
Number of observations 72,752 72,752 72,752
(Established migrant (YSM ≥ 10) × 0.242∗∗∗ 0.109∗∗∗ 0.452∗∗∗(non-English speaking country of birth) (0.012) (0.025) (0.101)
Number of observations 72,752 72,752 72,752
(Established migrant (YSM ≥ 15) × 0.221∗∗∗ 0.119∗∗∗ 0.539∗∗∗(non-English speaking country of birth) (0.011) (0.023) (0.106)
Number of observations 72,752 72,752 72,752
Note: Weighted numbers based on weights provided by the ACS. Robust standard errors inparentheses. See note to Table 2 for sample restrictions. Additional control variables: female,age, black, other non-white, hispanic.
∗ p < 0.1, ∗∗ p < 0.05, ∗∗∗ p < 0.01.
30
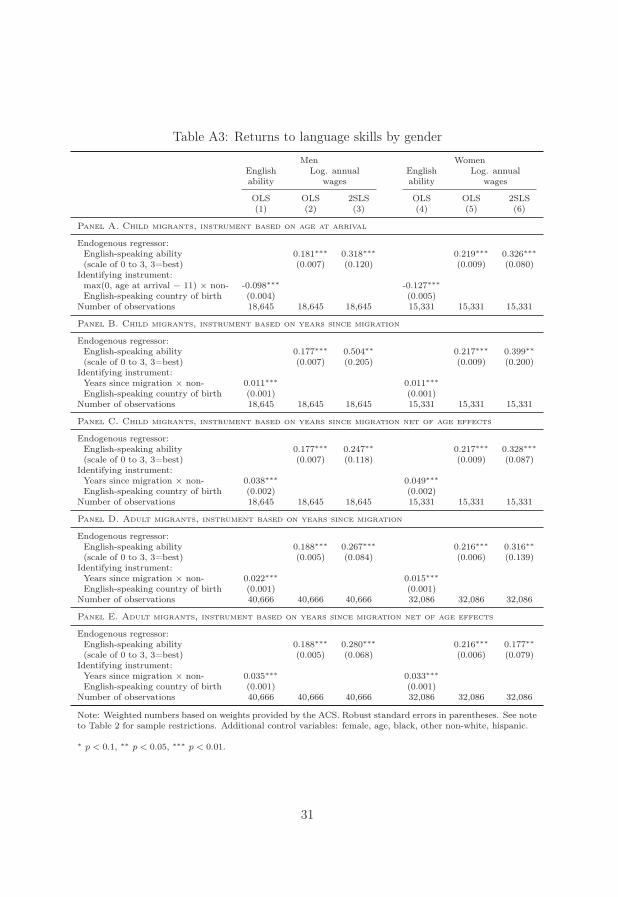
Table A3: Returns to language skills by gender
Men WomenEnglish Log. annual English Log. annualability wages ability wages
OLS OLS 2SLS OLS OLS 2SLS(1) (2) (3) (4) (5) (6)
Panel A. Child migrants, instrument based on age at arrival
Endogenous regressor:English-speaking ability 0.181∗∗∗ 0.318∗∗∗ 0.219∗∗∗ 0.326∗∗∗(scale of 0 to 3, 3=best) (0.007) (0.120) (0.009) (0.080)
Identifying instrument:max(0, age at arrival − 11) × non- -0.098∗∗∗ -0.127∗∗∗English-speaking country of birth (0.004) (0.005)
Number of observations 18,645 18,645 18,645 15,331 15,331 15,331
Panel B. Child migrants, instrument based on years since migration
Endogenous regressor:English-speaking ability 0.177∗∗∗ 0.504∗∗ 0.217∗∗∗ 0.399∗∗(scale of 0 to 3, 3=best) (0.007) (0.205) (0.009) (0.200)
Identifying instrument:Years since migration × non- 0.011∗∗∗ 0.011∗∗∗English-speaking country of birth (0.001) (0.001)
Number of observations 18,645 18,645 18,645 15,331 15,331 15,331
Panel C. Child migrants, instrument based on years since migration net of age effects
Endogenous regressor:English-speaking ability 0.177∗∗∗ 0.247∗∗ 0.217∗∗∗ 0.328∗∗∗(scale of 0 to 3, 3=best) (0.007) (0.118) (0.009) (0.087)
Identifying instrument:Years since migration × non- 0.038∗∗∗ 0.049∗∗∗English-speaking country of birth (0.002) (0.002)
Number of observations 18,645 18,645 18,645 15,331 15,331 15,331
Panel D. Adult migrants, instrument based on years since migration
Endogenous regressor:English-speaking ability 0.188∗∗∗ 0.267∗∗∗ 0.216∗∗∗ 0.316∗∗(scale of 0 to 3, 3=best) (0.005) (0.084) (0.006) (0.139)
Identifying instrument:Years since migration × non- 0.022∗∗∗ 0.015∗∗∗English-speaking country of birth (0.001) (0.001)
Number of observations 40,666 40,666 40,666 32,086 32,086 32,086
Panel E. Adult migrants, instrument based on years since migration net of age effects
Endogenous regressor:English-speaking ability 0.188∗∗∗ 0.280∗∗∗ 0.216∗∗∗ 0.177∗∗(scale of 0 to 3, 3=best) (0.005) (0.068) (0.006) (0.079)
Identifying instrument:Years since migration × non- 0.035∗∗∗ 0.033∗∗∗English-speaking country of birth (0.001) (0.001)
Number of observations 40,666 40,666 40,666 32,086 32,086 32,086
Note: Weighted numbers based on weights provided by the ACS. Robust standard errors in parentheses. See noteto Table 2 for sample restrictions. Additional control variables: female, age, black, other non-white, hispanic.
∗ p < 0.1, ∗∗ p < 0.05, ∗∗∗ p < 0.01.
31