Embed Size (px)
Citation preview
Improvements in the analysis of food contaminations
deriving from packaging materials
Dissertation zur Erlangung des Doktorgrades der Naturwissenschaften (Dr. rer. nat.)
Fakultät Naturwissenschaften Universität Hohenheim
Institut für Lebensmittelchemie
vorgelegt von
Thorsten Rothenbacher
aus Konstanz
2009
Die vorliegende Arbeit wurde am 03.12.2009 von der Fakultät Naturwissenschaften
der Universität Hohenheim als „Dissertation zur Erlangung des Grades eines Doktors
der Naturwissenschaften“ angenommen.
Die mündlichen Prüfung fand am 28.01.2010 mit folgenden Prüfern statt:
Dekan: Prof. Dr. H. Breer
Berichterstatter: 1. Prüfer: Prof. Dr. W. Schwack
2. Prüfer: Prof. Dr. H.-D. Isengard
3. Prüfer: Prof. Dr. W. Vetter
Preliminary Remarks
Parts of the work presented in this thesis have already been published or
submitted to international peer reviewed journals and/ or were presented on scientific
conferences as oral or poster presentations:
Full papers: 1. T. Rothenbacher, M. Baumann and D. Fuegel. 2-Isopropylthioxanthone (2-ITX) in
food and food packaging materials on the German market. Food Additives and
Contaminants 2007; 24: pp. 438-444
2. T. Rothenbacher, W. Schwack. Determination of epoxidized soybean oil by gas
chromatography/single quadrupole and tandem mass spectrometry stable isotope
dilution assay. Rapid Communications in Mass Spectrometry 2007; 21: pp. 1937-
1943
3. T. Rothenbacher, W. Schwack. Non-targeted multi-component analytical screening
of plastic food contact materials using fast interpretation of deliverables via expert
structure-activity relationship software Journal of AOAC INTERNATIONAL 2009; 92 (3): pp. 941-950*
4. T. Rothenbacher, W. Schwack. Rapid and nondestructive analysis of phthalic acid
esters in toys of poly(vinyl chloride) by direct analysis in real time–single
quadrupole mass spectrometry. Rapid Communications in Mass Spectrometry
2009; 23: pp. 2829–2835
5. T. Rothenbacher, W. Schwack. Rapid identification of additives in poly(vinyl
chloride) lid gaskets by direct analysis in real time ionisation and single-quadrupole
mass spectrometry. Rapid Communications in Mass Spectrometry 2010; 24: pp.
21-29
* Reprinted from The Journal of AOAC INTERNATIONAL, Rothenbacher, T., and Schwack, W. (2009) J. AOAC Int. 92, 941. Copyright 2009 by AOAC INTERNATIONAL.
Poster presentations: 1. “Schnelles Screening mit DART-MS am Beispiel von Weichmachern in PVC“.
Poster at the Deutscher Lebensmittelchemikertag 2009 (14.-16. Sept., Berlin) “
2. “Nachweis von Phthalsäureestern in Spielzeug und Babyartikeln aus PVC mit
DART™-MS in 4 min“. Poster at the Deutscher Lebensmittelchemikertag 2008
(08.-09. Sept., Kaiserslautern)
3. “Identifizierung von Additiven in Deckeldichtungen mit DART™-MS in 5 min?“.
Poster at Deutscher Lebensmittelchemikertag 2008 (08.-09. Sept., Kaiserslautern)
4. “Bestimmung von epoxidiertem Sojaöl mittels GC-MS(/MS) SIVA”. Poster at
Deutscher Lebensmittelchemikertag 2007 (10.–12. Sept., Nürnberg-Erlangen)
Oral presentations: 1. “Schnelle und zerstörungsfreie Analytik von Phthalsäureestern in Spielzeug und
Babyartikeln mittels DART-MS”. Presentation at ANAKON 2009 (17.-20. Mar.,
Berlin))
2. “Schnelles Screening für Weichmacher in Spielzeug und Deckeldichtungen aus
PVC mittels DART-MS“. Presentation at Tagung des Regionalverbandes Südwest
der Lebensmittelchemischen Gesellschaft 2009 (02.-03. Mar., Koblenz)
3. “Bestimmung des Weichmachers ESBO mittels GC/MS-SIVA“. Presentation at
Tagung des Regionalverbandes Südwest der Lebensmittelchemischen
Gesellschaft 2007 (05.-06. Mar., Gießen)
Contributions to the dissertation
All experimental and analytical work including analyses and interpretations of
all obtained data was performed by Thorsten Rothenbacher, except otherwise
mentioned in this section. Moreover, conceptions and the preparations of the original
versions of the manuscripts leading to publications originated from his initiative.
Professor Dr. W. Schwack was the supervisor of this work and helped to find
optimum formulations and forms for the English text manuscripts, except for paper 1.
In case of paper 1, samples selections, analysis strategy and the sample preparation
for food contact materials were developed by Thorsten Rothenbacher and sample
preparation in foods by Rüdiger Weishaar. Practical work was done by lab assistants
of the CVUA Stuttgart under supervision of Thorsten Rothenbacher, Dr. Markus
Baumann, Diane Fügel, and Rüdiger Weishaar. The publication text was from
Thorsten Rothenbacher with suggestions from Dr. Markus Baumann and Diane
Fügel. Sample preparation of 2-isopropylthioxanthone in foods and the spiking
procedure was from Diane Fügel, the instrumental analysis part was written by Dr.
Markus Baumann. For paper 2 the practical works according the sample preparation
and the solving of analytical standards in isooctane was carried out by lab assistants
of the CVUA Stuttgart under the supervision of Thorsten Rothenbacher. In case of
paper 3 practical work was made by lab assistants of the CVUA Stuttgart under the
supervision of Werner Altkofer and Thorsten Rothenbacher according sample
preparation, preparation of 13C18-labelled ethyl 9,10,12,13-diepoxyoctadecanoate and 13C18-labelled methyl 9,10,12,13-diepoxyoctadecanoate.
Table of Contents
I. General Introduction........................................................................1 I.1. Constituents of plastic materials................................................................... 1
I.1.a. Polymers................................................................................................... 1 I.1.b. Non polymeric constituents....................................................................... 1
I.2. Regulation of plastic food contact materials by the European Union ........... 5 I.2.a. General regulations .................................................................................. 5 I.2.b. Regulations covering specific substances ................................................ 6
I.3. Substance transfer into food and its impact on human health...................... 7 I.3.a. Migration................................................................................................... 7 I.3.b. Risk exposure........................................................................................... 9
I.4. Plastic food contact material analysis........................................................... 9 I.4.a. Targeted analysis ................................................................................... 10 I.4.b. Non targeted analysis ............................................................................. 11
I.5. An actual example for alarming migrants deriving from one product.......... 13 I.6. Phthalic acid esters - a transferable problem for toys made of plastic materials ............................................................................................................... 15 I.7. Aims of the study........................................................................................ 15 I.8. References................................................................................................. 16
II. Non-targeted multi-component analytical screening of plastic food contact materials using fast interpretation of deliverables via expert structure-activity relationship software. ................................31
II.1. Abstract ...................................................................................................... 31 II.2. Introduction ................................................................................................ 32 II.3. Materials and methods ............................................................................... 35 II.4. Results and discussion............................................................................... 38 II.5. Conclusion ................................................................................................. 49 II.6. Acknowledgment ........................................................................................ 50 II.7. References................................................................................................. 50
III. 2-Isopropylthioxanthone (2-ITX) in food and food packaging materials on the German market ........................................................55
III.1. Abstract ...................................................................................................... 55 III.2. Introduction ................................................................................................ 55 III.3. Experimental .............................................................................................. 58 III.4. Results and discussion............................................................................... 61 III.5. Conclusion ................................................................................................. 65 III.6. Acknowledgement ...................................................................................... 66 III.7. References................................................................................................. 66
IV. Rapid identification of additives in gaskets for lids of polyvinyl chloride with direct analysis in real time ionisation and single quadrupole mass spectrometry (DART−MS) .....................................69
IV.1. Abstract ...................................................................................................... 69 IV.2. Introduction ................................................................................................ 70 IV.3. Experimental .............................................................................................. 72 IV.4. Results and discussion............................................................................... 76 IV.5. Conclusion ................................................................................................. 85 IV.6. Acknowledgement ...................................................................................... 86 IV.7. References................................................................................................. 86
V. Determination of epoxidized soy bean oil by gas chromatography / single quadrupole and tandem mass spectrometry stable isotope dilution assay ......................................90
V.1. Abstract ...................................................................................................... 90 V.2. Introduction ................................................................................................ 91 V.3. Materials and Methods ............................................................................... 93 V.4. Results and discussion............................................................................... 97 V.5. Conclusion ............................................................................................... 103 V.6. Acknowledgement .................................................................................... 104 V.7. References:.............................................................................................. 104
VI. Rapid and nondestructive analysis of phthalic acid esters in toys of polyvinyl chloride by direct analysis in real time–single quadrupole mass spectrometry (DART–MS). ..................................106
VI.1. Abstract .................................................................................................... 106 VI.2. Introduction .............................................................................................. 107 VI.3. Experimental ............................................................................................ 109 VI.4. Results and discussion............................................................................. 112 VI.5. Conclusions.............................................................................................. 120 VI.6. Acknowledgement .................................................................................... 121 VI.7. References............................................................................................... 121
VII. Summary.......................................................................................124
VIII. Zusammenfassung ......................................................................129
Chapter I 1
I. General Introduction
I.1. Constituents of plastic materials
The packaging of food and beverages composes about 60% of the European
packaging market and seems to be growing.1,2 The principal intrinsic requirements for
food packaging materials are a control over transfer of moisture and other
gases/vapours, a wide temperature range in storage and use, low cost and the
absence of toxic constitutents.3 The packaging of food is needed to prevent the food
of unintentional changes. It protects from mechanical damage, microbiological
interference and chemical degradation such as oxidation, moisture transfer, and
ultraviolet light. Furthermore it is used to transport information that concerns
consumers, food industry and plastic recycling industry.
I.1.a. Polymers
Plastics primarily consist of polymers, in which each molecule represents a
long chain or a network of repeating units, depending on the monomers. In terms of
chemical composition, there are the homopolymers and the heteropolymers. The
former exist of the same repeating block and the latter are polymers with different
building-block units, regulary or irregulary distributed throughout their lengh.
Copolymers, as an example for heteropolymers, possess exactly two different
monomers which are polymerised together. Furthermore plastic polymers can be
divided into two groups: i) polymers which are linear and extend in one dimension
and ii) into cross-linked polymers that built more dimensional giant molecules.
Different production parameters also influence the polymer molecule. Low density
polyethylene, e.g., is processed between 1-3*105 kPa and 100-300 ºC and therefore
contains chain branches of different length. Contrary in high density polyethylene
chain branches are inexistent. All these parameters influence the physical properties
of the polymer.4
I.1.b. Non polymeric constituents
Other constituents of plastics may derive from the production process like
polymerisation residues including monomers, oligomers, catalysts, solvents,
Chapter I 2
emulsifiers and wetting agents, or can be raw material impurities, plant contaminants,
inhibitors, decomposition and side reaction products. In order to change
characteristics of polymers and to optimise production processes, additives are
added. These additives can be subdivided into different groups which provide
different efforts:
Nucleating agents are added to trigger a heterogeneous nucleation of the
plastic melt and to give crystals of regular size. They can be organic compounds like
salts of organophosphates or benzoic and phthalic acid, but also inorganic
compounds like silica for example, used as finely ground filler. Utilisation is practiced
in amounts 0.1-0.3% in polypropylene (PP), polyamide (PA) and polyethylene
terephthalate (PET).5
Lubricants affect the melt rheology and facilitate processing due to decrease
of internal and external friction. The former improves the polymeric chain movements
and the latter the friction between the plastic surface and the processing equipment.
Typical lubricants are fatty alcohols C12-C22, fatty acids C14-C18 and their esters with
fatty alcohols, glycerol or pentaerythritol, amides or diamides and other similar
molecules. They may be used in all plastics, except PA and PET in concentrations up
to 1.5%.5
By use of friction or rubbing of polymeric surfaces against each other, static
electricity can be generated. Antistatic agents reduce the chargeability of plastic
material because they form a conducting layer through the absorption of atmospheric
moisture on the surface.4 They can be applied on the plastic’s surface or into the
plastic mass during the processing.5 If an “internal antistatic” is used and the plastic’s
surface is cleaned, the inner antistatic agent may migrate onto the plastic material’s
surface and build a film similar to the former one.6 Typical external antistatic agents
are cationic- and anionic active substances like quaterny ammonium or sulfonium
salts of hydrocarbons C10 and typical internal antistatic agents are non-ionic agents
like ethoxylated fatty alkylamines. Their content in mostly all plastics is about 0.1 to
2%.5
Chapter I 3
Blowing or foaming agents can mainly be used in polyvinyl chloride (PVC) and
polystyrene (PS). They reduce consumption of raw materials, improve moisture
transfer properties of the plastic material and provide cushioning effects. Depending
on the processing physical foaming agents like carbon dioxide, nitrogen or
hydrocarbons C4-C5 are common. Due to global warming, ozone depletion and the
Montreal Protocol chlorinated and fluorinated hydrocarbons should no longer be
used.7,8 There exist also various chemical foaming agents that generate inert gases
and are mixed into the plastic mass during the processing, like e.g.
azodicarbonamide, sodium carbonate and diisopropylhydrazodicarboxylate.
Plasticisers are the probably most known additives. They improve
processibility, flexability and stretchability of the polymer and are used in PA and
PVC.5 Plasticisers divide into two groups, the internal and the external plasticisers.
Internal plasticisers are held in polymer systems by chemical bonds, while external
plasticisers maintain their molecular identity in the polymer system and their
comparability with it by hydrogen bonding and Van der Waals attraction. Well known
plasticisers are phthalic acid esters, di-(ethylhexyl)adipate, and epoxidized soy bean
oil.9-11 As PVC may contain plasticisers up to 50%, low molecular weight plasticisers
became its most problematic additives.
Plastics have to be stabilised to withstand chemical and physical stress during
processing, storage and application. Therefore stabilisers defend from deteriorating
agents like oxygen, high-energy radiations and heat. According their mechanisms,
they can be subdivided into antioxidants, photoantioxidants, photostabilisers, heat
stabilisers and antiacids. Other kinds of stabilisers like metal deactivators,
antiozonants, fire retardants and biostabilisers are not used in food contact
materials.5 By use of thermal processing or triggered by UV-radiation, radicals are
produced in the polymer. These macroradicals form alkylperoxyls which abstract an
H-atom from another molecule, therefore forms another macroradical and turns into a
hydroperoxide. The hydroperoxide also decomposes into radicals which may
continue the typical radical chain reactions or release smaller molecules via ß-
scission.12 In order to prevent these reactions, there are so called primary or chain
breaking antioxidants which are suitable to stabilise radicals, like steric hindered
phenols and aromatic amines.13 The concentration is up to 0.3% in plastic.5
Chapter I 4
Secondary or hydroperoxide decomposing antioxidants reduce hydroperoxides to
alcohols. Usual secondary antioxidants possess a thioether or a phosphit group that
will get oxidised during hydroperoxide decomposing.13 Substances which provide
similar functionality, but additionally are more photostable than common antioxidants,
are the photoantioxidants. These are hindered amine stabilisers which often posses
a 2,2,6,6-tetramethylpiperidine moiety. Photoantioxidants known to be very effective
are oligomeric molecules, which are used in a concentration range from 0.2 to
0.5%.14-16 Chromophores which are often impurities in plastic material, may trigger
the photodegradation by the formation of singlet oxygen and acceleration of
hydroperoxide decomposition. To prevent, UV absorbers which absorb from
wavelenghs of 200 up 400 nm are used. In these molecules, like for example
benzophenone, the energy of the absorbed light leads to mesomeric changing of the
molecule and finally to radiationless transition of the molecule to the ground state. UV
absorbers are used in a range of 0.25 to 0.5 %.5,17 Antioxidants are used in almost all
kinds of plastics. Antiacids neutralise acids arising from residues of catalysts or from
thermodegradation of PVC and therefore are used especially in polyolefines or PVC.
They can be for example zinc or calcium salts of weak organic acids or fatty acids,
epoxidised oils and inorganic salts.18
If products with high water content are packed, small water droplets may
condensate on the inside surface of the plastic film and becloud bright packagings.
Antifogging agents are used to prevent a clear view of the packaging. They are non-
ionic ethoxylates or hydrophilic fatty acid esters like sorbitol stearate and are applied
internally or on the surface of the packaging material in ranges from 0.5 to 4%.4,5
Otherwise there are packaging materials that should not be clear, but possess
other optical properties. Therefore dyes and pigments are applied. Pigments include
a wide range of both organic and inorganic products, and are dispersed into a
polymer in its liquid phase. After the polymer solidifies, the dispersed pigment
particles are retained physically within the solid polymer matrix. In contrast, dyes are
exclusively coloured organic compounds and are dissolved more or less completely
in a polymeric mass and are usually retained as a result of intermolecular forces.
Additionally there exists also fluorescent or so called optical brightening or whitening
agents which are used for white coloured plastics. White plastics possess commonly
Chapter I 5
a strong absorption band in the UV region of the absorption spectrum which tails into
the visible region, leading to a yellowish impression. Whitening agents absorb UV
radiation and re-emit the energy by means of fluorescence in the blue to blue-violet
region of the visible spectrum and therefore cause brilliant white plastics with a bluish
impression.4,5,19
I.2. Regulation of plastic food contact materials by the European Union
I.2.a. General regulations
Generally, food contact materials (FCM) are regulated by the so called
“Framework Regulation” of the European Parliament and of the Council of 27
October 2004 on materials and articles intended to come into contact with food.20 Its
purpose is to ensure functioning of the internal market, whilst a high level of health
protection and the interests of consumers are maintained. Therefore, article 3 forces
the general requirements “that materials and articles, including active and intelligent
materials and articles, shall be manufactured in compliance with good manufacturing
practice so that, under normal or foreseeable conditions of use, they do not transfer
their constituents to food in quantities which could endanger human health; or bring
about an unacceptable change in the composition of the food; or bring about a
deterioration in the organoleptic characteristics thereof”. Very important for plastic
material also is article 5, which enables specific measures for a list of substances
and their purity for use in the manufacturing of materials and articles. It authorizes
the use of specific migration limits (SMLs) and overall migration limits (OMLs) and the
promulgation of rules to check on compliance, for example for sample collection and
the methods for analysis. In absence of these specific measures, article 6 allows
national provisions in these terms, provided they comply with the rules of the treaty.
In order to define “good manufacturing practice” the regulation 2023/2006
forces an effective quality assurance and control system at all sectors and stages of
the manufacturing, processing, and distribution of FCM, except for the production of
starting substances.21 The term “starting substance” is defined according the
Commission as any substance, regardless of its chemical nature (e.g. compound,
mixture, monomer, oligomer, prepolymer natural or synthetic macromolecules), that
Chapter I 6
is used in any type of polymerisation process including the modification of natural or
synthetic substances.22
Several measures for plastic FCM have been released in the Commission
directive 2002/72/EC in its actual amended version.23-28 This directive covers mono-
and multilayer materials and articles exclusively made of plastics, but does not cover
those composed of two or more layers, of which one or more does not exclusively
consist of plastics, even if the one intended to come into direct contact with food does
consist of plastics. For this case, one exception is given for plastic layers that form
gaskets in lids. Article 2 of 2002/72/EC declares an OML of 60 mg kg-1 or 10 mg dm-2
surface, depending on the product. Furthermore the use of starting substances and
additives is limited by force of article 3 and 4 to only those substances listed in this
directive with the requirement that given SMLs are maintained. This implements the
idea of a positive list of substances, which exclusively have to be used in the
manufacturing process. This idea was created 1972, but not implemented into
legislative until 2008, but will get into force on 1st January 2010 and therefore can be
regarded as a milestone.29 The directive 2002/72/EC also applies in articles 3 and 8
rules for the verification of the compliance with the migration limits and therefore
refers to its annex I and the directives 82/711/EEC and 85/572/EEC, in which rules
for migration testing are given.30-33 Regulations for layers which are not in direct
contact with food and are separated from the food by a functional barrier are given
additionally in article 7a.
I.2.b. Regulations covering specific substances
Beneath the already mentioned regulation and directives, there are some
regulations covering specific substances. Directive 78/142/EEC limits the presence of
vinyl chloride monomer to 1 mg kg-1 in materials and articles prepared with vinyl
chloride polymers or copolymers and to a not detectable migration in food, defined as
0.01 mg kg-1.34 Methods for its analysis in plastics and in food are given in the
directives 80/766/EEC and 81/432/EEC.35,36
The use of the epoxy derivatives bis(hydroxyphenyl)methane bis(2,3-
epoxypropyl)ether (BFDGE) and other novolac glycidyl ethers (NOGE) is not allowed
in food contact materials, and SMLs are given for 2,2-bis(4-hydroxyphenyl)
Chapter I 7
propane bis(2,3-epoxypropyl) ether (BADGE) and its water and hydrochlorine
adducts in the Commission regulation (EC) no. 1895/2005.37
In order to provide time for the lid producing industry to solve migration
problems of additives in fatty food, the regulation no. 372/2007 in its amended form
lays down transitional SMLs until 30 April 2009 for plasticisers in gaskets of lids.38,39
The use of recycled plastic material in the manufacturing process of FCM and
especially conditions and applications for the authorisation of such a process are
treated in the regulation no. 282/2008.40
As a future scope the Commission directive 2002/72/EC should be changed in
the terms of regulating also plastic layers in multi-material multi-layer materials and
articles.41 Authorised substances for the manufacturing process shall be presented
including their functions and limitations in the food contact material. Also the
guidelines on migration testing will be more concrete and adapted to the actual level
of knowledge. For some food, e.g. dried products, the corresponding food simulant
will be a blend of poly(p-phenylene oxide) with polystyrene, traded under the name
Tenax®.42
In the case of Germany, the implementations of the directives mentioned
above into national legislation are made by the Bedarfsgegenständeverordnung.43
I.3. Substance transfer into food and its impact on human health
I.3.a. Migration
To provide a cost-effective production and wide functionality, the packaging
industry increased its portfolio over the last decades. As a consequence of an
increasing number of substances used for food packaging and efforts in the analysis
of food contact materials, concerns with regard to harmful substances in FCM have
also arisen in the last decades.44 They rely on the fact that there is a possibility for
substances to leave the packaging material and diffuse into the foodstuff. This
process of food contamination is called migration and may alter organoleptic and
toxicological properties of the foodstuff.5,22,45-47
Chapter I 8
Migration occurs as foreseeable physical process and can be divided into two
parts: i) diffusion inside the polymer, followed by ii) a partition of the migrant in the
two phase system food and polymer. The diffusion follows in most cases the Fick’s
laws.48 As a consequence the process of migration can be mathematically modelled
in complex equitations. The migrated amount of a substance through the contact
surface depends on the initial migrant concentration in the packaging material, the
volume and density of packaging material and food, the diffusion coefficient of the
migrant in the packaging material and the partition coefficient of the migrant between
the FCM and the food.49 The partition coefficient drastically may depend on
temperature, chemical groups and the molecular size and structure of the migrant as
well as the fat content of food and the degree of crystallinity of the food structure.50 In
case of multilayer materials, additionally the diffusion coefficients, density and
thickness of each layer and partition coefficients of the migrant between adjacent
layers have to be considered.49 Comparisons between analysed and calculated data
of migration proved in general a good correlation between the two methods, but
sometimes also large deviations, like for example a predicted migration of 57 µg kg-1,
but measured to be 157 µg kg-1.51,52 Therefore, the European legislation allows in
article 8 of the directive 2002/72/EC migration modelling to prove compliance, but not
to demonstrate non-compliance.53
In order to prevent substances of the packaging from migrating into food,
functional barriers can be incorporated into food contact materials, lowering diffusion
of migrants.54 But even in case of absolute powerful functional barriers, a
contamination via the set-off procedure is possible.55 The set-off can be defined as
the unintentional transfer of substances, which derive from the external surface, to
the inner food-contact surface. Possible mechanisms in this process are blocking,
rubbing, peeling and migration by diffusion.56 By use of these mechanism even
substances that are separated via an effective functional barrier can contaminate
food, like 2-isopropylthioxanthone deriving from the outside of multilayer cartons, for
example.57
Chapter I 9
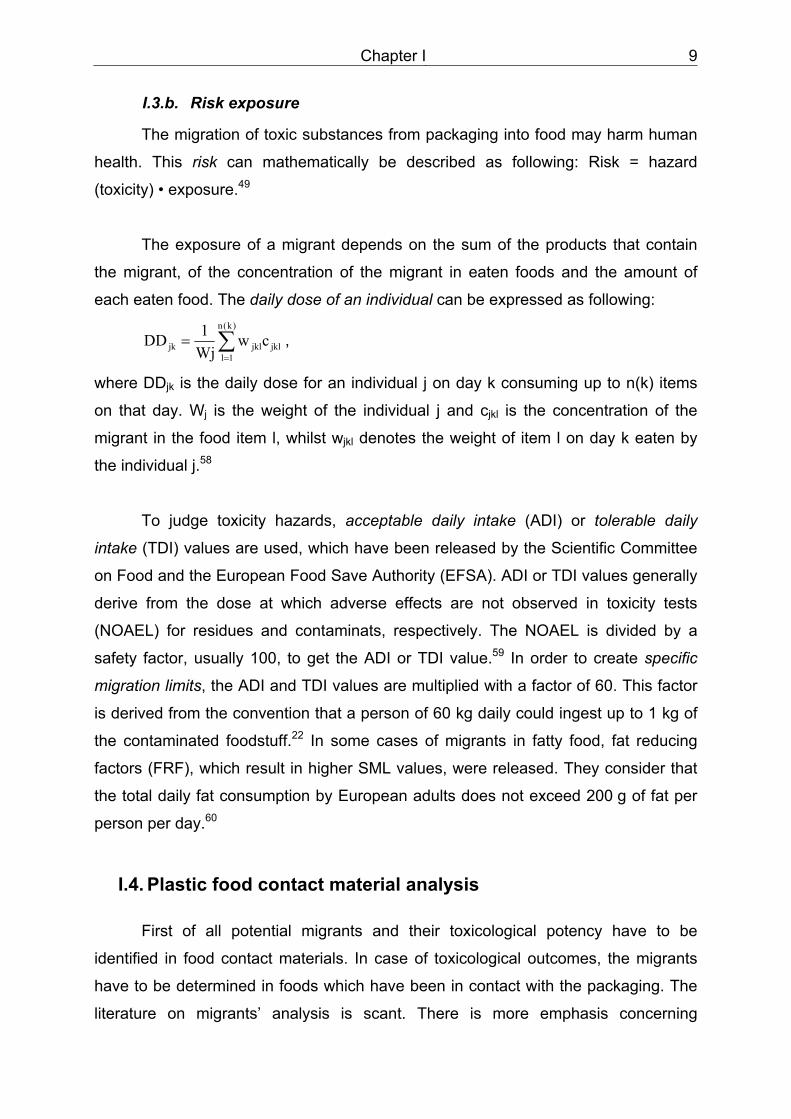
I.3.b. Risk exposure
The migration of toxic substances from packaging into food may harm human
health. This risk can mathematically be described as following: Risk = hazard
(toxicity) • exposure.49
The exposure of a migrant depends on the sum of the products that contain
the migrant, of the concentration of the migrant in eaten foods and the amount of
each eaten food. The daily dose of an individual can be expressed as following:
∑=
=)k(n
1ljkljkljk cw
Wj1DD ,
where DDjk is the daily dose for an individual j on day k consuming up to n(k) items
on that day. Wj is the weight of the individual j and cjkl is the concentration of the
migrant in the food item l, whilst wjkl denotes the weight of item l on day k eaten by
the individual j.58
To judge toxicity hazards, acceptable daily intake (ADI) or tolerable daily
intake (TDI) values are used, which have been released by the Scientific Committee
on Food and the European Food Save Authority (EFSA). ADI or TDI values generally
derive from the dose at which adverse effects are not observed in toxicity tests
(NOAEL) for residues and contaminats, respectively. The NOAEL is divided by a
safety factor, usually 100, to get the ADI or TDI value.59 In order to create specific
migration limits, the ADI and TDI values are multiplied with a factor of 60. This factor
is derived from the convention that a person of 60 kg daily could ingest up to 1 kg of
the contaminated foodstuff.22 In some cases of migrants in fatty food, fat reducing
factors (FRF), which result in higher SML values, were released. They consider that
the total daily fat consumption by European adults does not exceed 200 g of fat per
person per day.60
I.4. Plastic food contact material analysis
First of all potential migrants and their toxicological potency have to be
identified in food contact materials. In case of toxicological outcomes, the migrants
have to be determined in foods which have been in contact with the packaging. The
literature on migrants’ analysis is scant. There is more emphasis concerning
Chapter I 10
migrations into food simulants than into food itself and analytical methods are still in
the research and development stage.61 The analytical procedures typically involve
sample preparation, extraction, clean up and a final determination step. For the
analysis in polymer materials solvents are used that extract the migrant or dissolve
the polymer and migrant, followed by precipitation of the polymer.62 In foodstuffs
extraction is also done by solvents, but often solid phase extraction (SPE) or size
exclusion or gel permeation chromatography (SEC or GPC) as cleaning step is
necessary.61 For determination most applied instruments nowadays are gas or liquid
chromatography coupled with mass spectrometry (GC/MS or LC/MS).47,63
I.4.a. Targeted analysis
As food additives extremely vary in their physical and chemical properties, a
“multi method” to determine all additives does not exist. An actual example for the
efforts that have to be made to analyse regulated substances is the analysis of
gaskets in lids of metal twist closures for glass jars. The gaskets usually are made of
PVC that contains plasticisers, stabilisers, slipping and blowing agents and pigments.
Only focussed on plasticisers that migrate into food and possess an SML, 1,2-
cyclohexane-dicarboxylic acid,1,2-diisononyl ester (DINCH), bis(2-ethylhexyl) adipate
(DEHA), dibutyl sebacate (DBS), tributyl O-acetylcitrate (ATBC), and the phthalic
acid esters benzyl butyl phthalate (BBP), bis(2-ethylhexyl) phthalate (DEHP), dibutyl
phthalate (DBP), di-''isodecyl'' phthalate (DIDP), di-''isononyl'' phthalate (DINP) and
dioctyl phthalate (DNOP), acetylated mono- and diglycerides of fatty acids (AcPG),
epoxidized soybean oil (ESBO) and polyadipates (PAD) are specific regulated and
have to be checked.38,64 Phthalic acid esters, DEHA, ATBC and DBS mainly are
extracted from food, cleaned via GPC or SPE and determined via GC/FID or GC/MS,
if available by use of stable isotope dilution assay.65-70 There also exist multi methods
that determine phthalates, DBS, DEHA and ATBC together or more special methods
that use injector-internal thermal desorption GC/MS or headspace solid-phase
microextraction.71-75 AcPG can be a mixture of different compounds or a single
substance like octadecanoic acid-12-(acetyloxy)-2,3-bis(acetyloxy)propyl ester and
can be determined in food by injector-internal thermal desorption GC/MS or by food
extraction, subsequent GPC and GC/MS analysis.76,77 Since soy bean oil mainly
consists of triglycerides of linolenic, linoleic, oleic, stearic and palmitic acid, there is a
vast variety of different triglycerides in ESBO and its analysis is more difficult.78
Beneath one method that proposes extraction and direct analysis by use of liquid
Chapter I 11
chromatography- electrospray ionisation- tandem mass spectrometry (HPLC/ESI-
MS/MS), GC methods seem to be preferred.79 Thus for use of GC separation, a
transesterification step is necessary, followed by different processing depending on
the instrumental setup.80-82 Additionally, it should be controlled via an analysis of the
fatty acids composition, that ESBO was determined and not epoxidised line seed oil,
because the latter is not covered by Commission directive 2002/72/EC. The exact
analysis of PAD is a challenge. After isolation of the part of PAD below 1000 Da by
SEC, the extract needs to be transesterified and determined by use of GC/MS.
Afterwards the amount of migrated PAD has to be calculated by use of a conversion
factor (CF) which depends on the used PAD and takes into account the relation of
the different molecular weight of the transesterification product and the original
PAD.83 The CF therefore has to be analysed separately, which was not considered in
previous released methods.84,85 To put it in a nutshell, for the analysis of the
regulated plasticisers of gaskets which migrated into food, strenuous efforts have to
be made. In spite of these efforts, the results do not consider impurities of the
additives nor decomposition and reaction products. Regarding ESBO, for example,
structural and toxicological reaction products are formed in toxicological possibly
relevant amounts, especially during heating of PVC, which were impossible to
identify until now and actually are not regulated.86,87 This leads to the more
complicated kind of analysis, the identification of health hazards deriving from
migrants.
I.4.b. Non targeted analysis
First of all the sensivity of an analysis method has to be considered. For this
purpose, the US Food and Drug Administration established 1995 the threshold of
regulation, which allows migrants whose dietary concentrations are up to 0.5 µg kg-1
with the reserve, that carcinogens or substances that may be carcinogens are
excluded from this regulation.88 On base of the works of Kroes et al., a task force of
the International Life Sciences Institute released a threshold of toxicological concern
that depends on the structure of the substance and is applicable to chemicals with
low mass and known structure, but does not cover allergenicity, accumulation and
endocrine disruption.89,90 Therefore, a substance whose intake does not exceed
1.5 µg day-1 and whose structure does not raise concerns for potentional genotoxicity
would not be expected to be a safety concern. In case of genotoxic related doubts,
there is a negligible risk if the daily intake does not exceed 0.15 µg and the
Chapter I 12
substance is not an essential metal or metal containing compound, polyhalogenated
dibenzodioxin, dibenzofuran or biphenyl, or an aflatoxin-like, azoxy or N-nitroso
compound.90 According the principles for establishing an SML, these values
correspond to SMLs of 90 µg kg-1 and 9 µg kg-1 respectively. The European
Commission regulates in directive 2002/72/EC in its actual form, article 7a a SML of
10 µg kg-1 for a migrant that is not covered by the positive list, but also excludes from
this regulation substances that are classified as proved or suspect
‘carcinogenic’,‘mutagenic’ or ‘toxic to reproduction’ according Annex I or VI of Council
Directive 67/548/EEC.53,91 The SML of 10 µg kg-1 also applies to a group of
compounds, if they are structurally and toxicologically related, in particular isomers or
compounds with the same relevant functional group, which drastically may lower the
SML for a specific substance that belongs to such a group. To put it in a nutshell, the
limit for unregulated substances is very low and therefore a very high sensivity is
demanded for the identification of health hazards deriving from migrants.
Analysis is complicated in addition by the huge amount of additives used for
production of plastic FCM and the fact, that compositions of raw materials are treated
by the suppliers as industrial secrets. The Synoptic Document lists all monomers and
additives notified to the European Commission in view of their use for FCM.92 It
includes about 3000 substances, while aids to polymerisation, colorants, inks,
adhesives and solvents are not mentioned in principle, and the list only presents the
notified auxiliary material. Additionally there can also be impurities in additives or
possible degradation products. So comprehensive analysis of migrates from food
packaging materials is a real challenge.
In order to analyse the toxicological potential of migrants, some different
approaches have been released. Short-term toxicity tests can be used, but generally
they do not provide the necessary sensivity.93,94 Another approach is to mark the
specific structures of substances, which are responsible for the toxicological
properties. However, until now this method does not apply owing to a general lack of
known suitable markers and a barely specificity of existing derivatisation reagents.95
The more classic analytical approach is to fractionate migrants with a molecular
mass below 1000 D via GPC or SEC, in order to remove toxically insignificant
substances whose absorptions by the human gastrointestinal tract are negligible and
Chapter I 13
also to clean the migrate from matrix.22,96 Afterwards the extract has to be analysed
by LC/MS or GC/MS. In this case, the operator is often challenged with the
identification of a forest of unknown peaks followed by toxicological assessment. The
substance identification only by use of mass spectra databases can be considered as
critical.63 Also the limits of detection reported so far, e.g. 20 μg kg-1 for compounds in
the very unproblematic matrix water, determined after enrichment by solid-phase
extraction.97 Another critical part can be the toxicological assessment due to missing
data information.
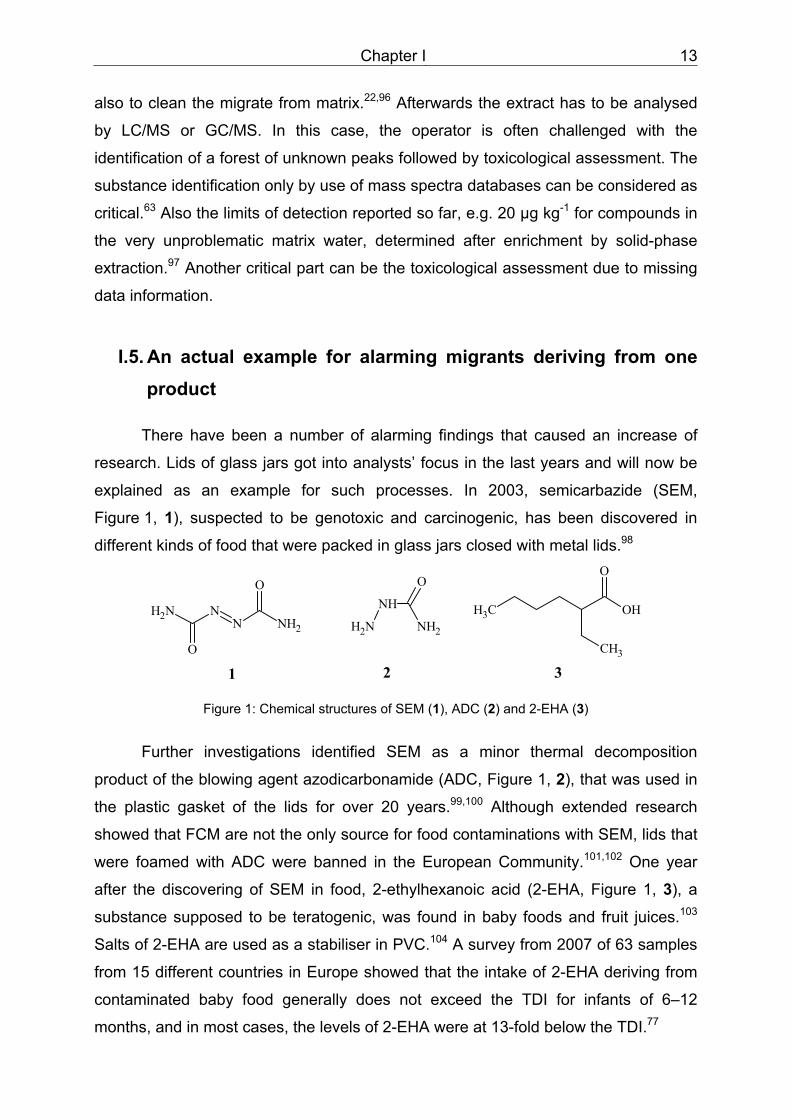
I.5. An actual example for alarming migrants deriving from one product
There have been a number of alarming findings that caused an increase of
research. Lids of glass jars got into analysts’ focus in the last years and will now be
explained as an example for such processes. In 2003, semicarbazide (SEM,
Figure 1, 1), suspected to be genotoxic and carcinogenic, has been discovered in
different kinds of food that were packed in glass jars closed with metal lids.98
NN
O
NH2
O
NH2NH2
NH
O
NH2
1 2CH3
O
CH3 OH
3
Figure 1: Chemical structures of SEM (1), ADC (2) and 2-EHA (3)
Further investigations identified SEM as a minor thermal decomposition
product of the blowing agent azodicarbonamide (ADC, Figure 1, 2), that was used in
the plastic gasket of the lids for over 20 years.99,100 Although extended research
showed that FCM are not the only source for food contaminations with SEM, lids that
were foamed with ADC were banned in the European Community.101,102 One year
after the discovering of SEM in food, 2-ethylhexanoic acid (2-EHA, Figure 1, 3), a
substance supposed to be teratogenic, was found in baby foods and fruit juices.103
Salts of 2-EHA are used as a stabiliser in PVC.104 A survey from 2007 of 63 samples
from 15 different countries in Europe showed that the intake of 2-EHA deriving from
contaminated baby food generally does not exceed the TDI for infants of 6–12
months, and in most cases, the levels of 2-EHA were at 13-fold below the TDI.77
Chapter I 14
OCH3
O O O
O
CH3
O
O O
OCH3
O O O
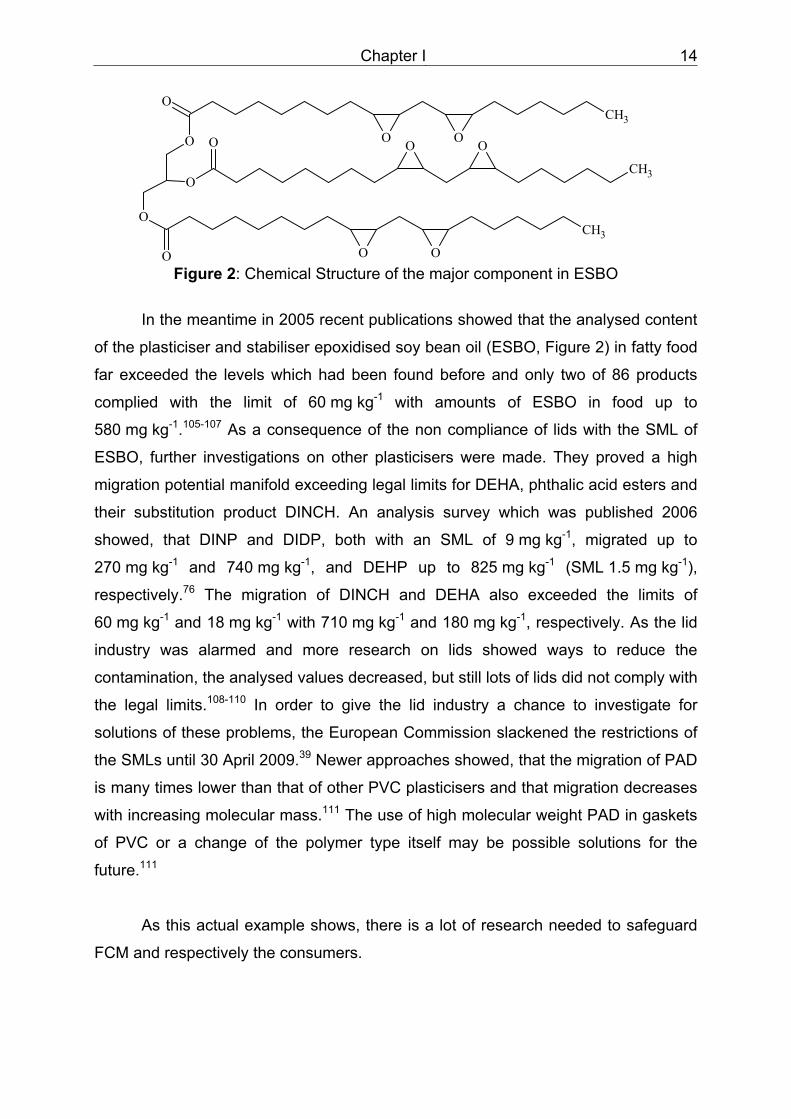
Figure 2: Chemical Structure of the major component in ESBO
In the meantime in 2005 recent publications showed that the analysed content
of the plasticiser and stabiliser epoxidised soy bean oil (ESBO, Figure 2) in fatty food
far exceeded the levels which had been found before and only two of 86 products
complied with the limit of 60 mg kg-1 with amounts of ESBO in food up to
580 mg kg-1.105-107 As a consequence of the non compliance of lids with the SML of
ESBO, further investigations on other plasticisers were made. They proved a high
migration potential manifold exceeding legal limits for DEHA, phthalic acid esters and
their substitution product DINCH. An analysis survey which was published 2006
showed, that DINP and DIDP, both with an SML of 9 mg kg-1, migrated up to
270 mg kg-1 and 740 mg kg-1, and DEHP up to 825 mg kg-1 (SML 1.5 mg kg-1),
respectively.76 The migration of DINCH and DEHA also exceeded the limits of
60 mg kg-1 and 18 mg kg-1 with 710 mg kg-1 and 180 mg kg-1, respectively. As the lid
industry was alarmed and more research on lids showed ways to reduce the
contamination, the analysed values decreased, but still lots of lids did not comply with
the legal limits.108-110 In order to give the lid industry a chance to investigate for
solutions of these problems, the European Commission slackened the restrictions of
the SMLs until 30 April 2009.39 Newer approaches showed, that the migration of PAD
is many times lower than that of other PVC plasticisers and that migration decreases
with increasing molecular mass.111 The use of high molecular weight PAD in gaskets
of PVC or a change of the polymer type itself may be possible solutions for the
future.111
As this actual example shows, there is a lot of research needed to safeguard
FCM and respectively the consumers.
Chapter I 15
I.6. Phthalic acid esters - a transferable problem for toys made of plastic materials
Phthalic acid esters (PAEs) are plasticisers in food contact materials, but their
applications also cover a wider scope. They are constituents of foils, floor coverings,
tubes, cables, dyes, lacquers, cosmetics and even additives in
pharmaceuticals.112,113 As they can be considered an environmental contaminant
they also occur in food not due to packaging but other processes or in mother’s
milk.114 An important source for the PAE exposure of children can be the mouthing of
soft plastic material.115,116 For example mouthing actually is responsible for 90% of
the exposure of European infants and toddlers with di-isononyl phthalate (DINP)
whereas the daily exposure is about 1 µg kg-1 body-weight.117 The Commission
Directive 2005/84/EC prohibits to place toys and childcare on the market, that contain
bis (2-ethylhexyl) phthalate, dibutyl phthalate or benzyl butyl phthalate at
concentrations of more than 0.1% by mass of the material. It is equivalent for DINP,
di-isodecyl phthalate or di-n-octyl phthalate, if the articles can be placed in the mouth
by children.118 This directive is implemented like the others directives mentioned
above into the German legislation via the “Bedarfsgegenständeverordnung”.
According the European Union rapid alert system for all dangerous consumer
products (RAPEX), 140 toys or childcare products were withdrawn from the market
during the year 2008 due to their contents of PAEs, which did not comply with the
legislation.119 As analysis of PAEs in toys and childcare is also a time consuming
process which includes extraction with organic solvents and evaporation steps
followed by the analysis with GC, HPLC or HPTLC, a fast and reliable method to
identify PAEs in toys and childcare may ease analysis and therefore guarantee a
higher level of health security for children.120-123
I.7. Aims of the study
Experts rightfully consider the use of packaging materials as the largest and
least controlled source of food contaminations with organic materials in Europe.124
Since the analysis of contaminants deriving from packaging material is faced to
multiple difficulties, as for example the generally unknown formulation of material in
combination with the chemical variety and huge number of additives, methods to
identify sensitively contaminants deriving from FCMs and to measure substances in
Chapter I 16
food have to be created. In order to exclude human health hazards the analysis
should be focussed on the identification of harmful substances.
New methods should be as easy as possible and applicable for the majority of
analysts with standard instruments in order to improve the situation. The health of
consumers has also to be safeguarded in similar respects, like the exposure of
children and toddlers with phthalic acid esters.
Beneath these general objectives, the specific aims were:
1. To develop an improved GC/MS method to identify substances in food contact
materials that may migrate into food followed by an evaluation of these
substances.
2. To develop a method that enables to get an overview of the use of
2-Isopropythioxanthone in food packaging materials, well suited for routine
surveillance.
3. To evaluate, if a rapid identification of the complex additives in lids of glass jars is
possible by Direct Analysis in Real Time- Mass Spectrometry.
4. To develop a facilitated gaschromatographic method that enables the analysis of
epoxidised soy bean oil in fatty food and children’s food.
5. To prove if Direct Analysis in Real Time- Mass spectrometry may be a tool for a
rapid identification of phthalic acid ester plasticisers in toys and childcare products
of polyvinylchloride.
I.8. References
1. SPG Media Limited. European Packaging Sectors Breakdown. Available at
http://www.packaging-gateway.com/market_statistics_europe.asp. Accessed 11
November 2008
2. SPG Media Limited. Food Packaging Market Forecast, Trends 2004-2008.
Available at http://www.packaging-gateway.com/market_statistics_food.asp.
Accessed 11 November 2008
3. Crosby N.T. Food Packaging Materials. Aspects of Analysis and Migration of
Contaminats., Applied Science Publishers LTD, London. ISBN 0-85334-926-6
Chapter I 17
4. Robertson, G. L. Food Packaging, Principles and Practice, Taylor and Francis
Group, LLC. ISBN 0-8493-3775-5
5. Piringer O.G.; Baner A.L. Packaging Materials for Food, Wiley-VCH, Weinheim,
Germany. ISBN 3-527-28868-6
6. Woggon H, Uhde WJ. Antistatic finishing of plastics from the food-toxicological
point of view. Nahrung 1977; 21(3): pp.235-245
7. United Nations Environment Programme The Montreal Protocol on Substances
that Deplete the Ozone Layer, Ozone Secretariat, United Nations Environment
Programme, P. O. Box 30552, Nairobi, Kenya. ISBN 92-807-1888-6
8. Praller A. Foaming plastics with inert gases. Physical blowing agents. Kunststoffe
2005; 95(6): pp.96-99
9. Petersen JH, Naamansen ET. DEHA-plasticized PVC for retail packaging of fresh
meat. Zeitschrift fuer Lebensmittel-Untersuchung und -Forschung A: Food
Research and Technology 1998; 206(3): pp.156-160
10. Freire MTD, Santana IA, Reyes FGR. Plasticisers in Brazilian food-packaging
materials acquired on the retail market. Food Additives & Contaminants 2006;
23(1): pp.93-99
11. Harrison N. Migration of plasticisers from cling-film. Food Additives and
Contaminants 1988; 5(Suppl. 1): pp.493-499
12. Society of Plastics Engineers ANTEC 2000: Plastics, the Magical Solution :
Conference Proceedings, May 7-11 2000, Orlando, Florida, CRC Press. ISBN
978-1566768559
13. Pospisil J. Transformation products of antioxidants: the role in stabilization
mechanisms. Angewandte Makromolekulare Chemie 1988; 158-159: pp.209-219
14. Freitag W, Wurster R, Mady N. Determination of the polymeric light stabilizer
Tinuvin 622 in polyolefins. Journal of Chromatography 1988; 450(3): pp.426-429
15. Trones R, Andersen T, Hegna DR, Greibrokk T. Hindered amine stabilizers
investigated by the use of packed capillary temperature programmed liquid
chromatography. II: Poly-(N-b-hydroxyethyl-2,2,6,6-tetramethyl-4-
hydroxypiperidyl succinate). Journal of Chromatography, A 2000; 902(2): pp.421-
426
Chapter I 18
16. Todesco RV, Ergenc N. Additives in plastics applications. Chimia 2002; 56(5):
pp.225-238
17. SpecialChem S.A. Ultraviolet Absorbers. Available at
http://www.specialchem4adhesives.com/tc/uv-light-
stabilizers/index.aspx?id=uvabsorbers. Accessed 31 October 2008
18. Geoffrey Pritchard Plastics Additives: An A-Z Reference, Springer, Berlin. ISBN
978-0-412-72720-7
19. Christie RM. Pigments, dyes and fluorescent brightening agents for plastics: an
overview. Polymer International 1994; 34(4): pp.351-361
20. European Communities. Regulation (EC) No 1935/2004 of the European
Parliament and of the Council of 27 October 2004 on materials and articles
intended to come into contact with food and repealing Directives 80/590/EEC and
89/109/EEC. Official Journal of the European Union 2004; L 336: pp.4-17
21. European Commission. Commission Regulation (EC) No 2023/2006 of 22
December 2006 on good manufacturing practice for materials and articles
intended to come into contact with food. Official Journal of the European Union
2006; L 384: pp.75-78
22. Health & Consumer Protection Directorate of the European Commission. Food
Contact Materials. A practical guide. Available at
http://ec.europa.eu/food/food/chemicalsafety/ foodcontact/practical_guide_en.pdf.
Accessed 13 November 2007
23. European Communities. Commission Directive 2002/72/EC of 6 August 2002
relating to plastic materials and articles intended to come into contact with
foodstuffs (consolidated version 2007-04-20). Official Journal of the European
Union 2002; L 220: pp.18-58
24. European Communities. Commission Directive 2004/1/EC of 6 January 2004
amending Directive 2002/72/EC as regards the suspension of the use of
azodicarbonamide as blowing agent. Official Journal of the European Union
2004; L 7: pp.45-46
Chapter I 19
25. European Communities. Commission Directive 2004/19/EC of 1 March 2004
amending Directive 2002/72/EC relating to plastic materials and articles intended
to come into contact with foodstuffs. Official Journal of the European Union 2004;
L 71: pp.8-21
26. European Communities. Commission Directive 2005/79/EC of 18 November 2005
amending Directive 2002/72/EC relating to plastic materials and articles intended
to come into contact with food. Official Journal of the European Union 2005; L 302: pp.35-45
27. European Communities. Commission Directive 2007/19/EC of 30 March 2007
amending Directive 2002/72/EC relating to plastic materials and articles intended
to come into contact with food and Council Directive 85/572/EEC laying down the
list of simulants to be used for testing migration of constituents of plastic materials
and articles intended to come into contact with foodstuffs. Official Journal of the
European Union 2007; L 91: pp.17-36
28. European Communities. Commission Directive 2008/39/EC of 6 March 2008
amending Directive 2002/72/EC relating to plastic materials and articles intended
to come into contact with food. Official Journal of the European Union 2008; L 63:
pp.6-13
29. Heckman JH. Food packaging regulation in the United States and the European
Union. Regul Toxicol Pharmacol 2005; 42(1): pp.96-122
30. European Communities. Council Directive 82/711/EEC of 18 October 1982 laying
down the basic rules necessary for testing migration of the constituents of plastic
materials and articles intended to come into contact with foodstuffs. Official
Journal of the European Union 1982; L 297: pp.26-30
31. European Communities. Commission Directive 93/8/EEC of 15 March 1993
amending Council Directive 82/711/EEC laying down the basic rules necessary
for testing migration of constituents of plastic materials and articles intended to
come into contact with foodstuffs. Official Journal of the European Union 1993; L 90: pp.22-25

Chapter I 20
32. European Communities. Commission Directive 97/48/EC of 29 July 1997
amending for the second time Council Directive 82/711/EEC laying down the
basic rules necessary for testing migration of the constituents of plastic materials
and articles intended to come into contact with foodstuffs. Official Journal of the
European Union 1997; L 222: pp.10-15
33. European Communities. Council Directive 85/572/EEC of 19 December 1985
laying down the list of simulants to be used for testing migration of constituents of
plastic materials and articles intended to come into contact with foodstuffs.
Official Journal of the European Union 1985; L 372: pp.14-21
34. European Communities. Council Directive 78/142/EEC of 30 January 1978 on the
approximation of the laws of the Member States relating to materials and articles
which contain vinyl chloride monomer and are intended to come into contact with
foodstuffs. Official Journal of the European Union 1978; L 44: pp.15-17
35. European Communities. Commission Directive 80/766/EEC of 8 July 1980 laying
down the Community method of analysis for the official control of the vinyl
chloride monomer level in materials and articles which are intended to come into
contact with foodstuffs. Official Journal of the European Union 1980; L 213:
pp.42-46
36. European Communities. Commission Directive 81/432/EEC of 29 April 1981
laying down the Community method of analysis for the official control of vinyl
chloride released by materials and articles into foodstuffs. Official Journal of the
European Union 1981; L 167: pp.6-11
37. European Communities. Commission Regulation (EC) No 1895/2005 of 18
November 2005 on the restriction of use of certain epoxy derivatives in materials
and articles intended to come into contact with food. Official Journal of the
European Union 2005; L 302: pp.28-32
38. European Commission. Commission Regulation (EC) No 372/2007 of 2 April
2007 laying down transitional migration limits for plasticisers in gaskets in lids
intended to come into contact with foods (corrected form). Official Journal of the
European Union 2007; L 92: pp.9-12
Chapter I 21
39. European Commission. Commission Regulation (EC) No 597/2008 of 24 June
2008 amending Regulation (EC) No 372/2007 laying down transitional migration
limits for plasticisers in gaskets in lids intended to come into contact with foods.
Official Journal of the European Union 2008; L 134: pp.12-13
40. European Commission. Commission Regulation (EC) No 282/2008 of 27 March
2008 on recycled plastic materials and articles intended to come into contact with
foods and amending Regulation (EC) No 2023/2006. Official Journal of the
European Union 2008; L 86: pp.9-18
41. DG SANCO/E/3/AS. Comission services working document in preparation of a
Comission relating to plastic materials and articles intended to come into contact
with foodstuffs. Available at personal communication with professor W. Schwack,
Universtity of Hohenheim, Germany. 5 November 2008
42. DG SANCO/E/3/AS. Draft on Community Guidelines on migration testing of
plastic materials and articles. Available at personal communication with professor
W. Schwack, Universtity of Hohenheim, Germany. 5 November 2008
43. Bundesministerium für Gesundheit. Bedarfsgegenständeverordnung in der
Fassung der Bekanntmachung vom 23. Dezember 1997. Bürgerliches
Gesetzbuch 1998; 1: pp.5-
44. Jung H.Han Innovations in Food Packaging, Elsevier, Oxford, England. ISBN 978
0123 11632 1
45. Widen H, Leufven A, Nielsen T. Identification of chemicals, possibly originating
from misuse of refillable PET bottles, responsible for consumer complaints about
off-odours in water and soft drinks. Food Additives & Contaminants 2005; 22(7):
pp.681-692
46. Arvanitoyannis IS, Bosnea L. Migration of substances from food packaging
materials to foods. Critical Reviews in Food Science and Nutrition 2004; 44(2):
pp.63-76
47. Lau OW, Wong SK. Contamination in food from packaging material. Journal of
Chromatography, A 2000; 882(1+2): pp.255-270
48. Franz R. Migration modelling from food-contact plastics into foodstuffs as a new
tool for consumer exposure estimation. Food Additives & Contaminants 2005;
22(10): pp.920-937
Chapter I 22
49. K Barnes; R Sinclair; D Watson Chemical migration and food contact materials,
Woodhead Publishing Limited, Cambridge, England. ISBN 978 1 84569 029 8
50. Tehrany EA, Desobry S. Partition coefficients in food/packaging systems: a
review. Food Additives & Contaminants 2004; 21(12): pp.1186-1202
51. O'Brien A, Cooper I. Practical experience in the use of mathematical models to
predict migration of additives from food-contact polymers. Food Additives and
Contaminants 2002; 19(Suppl.): pp.63-72
52. Merck, E. Anfärbereagenzien für Dünnschicht- und Papier-Chromatographie,
Merck.
53. European Communities. Commission Directive 2002/72/EC of 6 August 2002
relating to plastic materials and articles intended to come into contact with
foodstuffs. Official Journal of the European Union 2002; L 220: pp.18-58
54. Feigenbaum A, Dole P, Aucejo S, Dainelli D, Cruz Garcia C, Hankemeier T,
N'gono Y, Papaspyrides CD, Paseiro P, Pastorelli S, Pavlidou S, Pennarun PY,
Saillard P, Vidal L, Vitrac O, Voulzatis Y. Functional barriers: Properties and
evaluation. Food Additives & Contaminants 2005; 22(10): pp.956-967
55. Rothenbacher T, Baumann M, Fuegel D. 2-isopropylthioxanthone (2-ITX) in food
and food packaging materials on the German market. Food Additives and
Contaminants 2007; 24(4): pp.438-444
56. Bradley EL, Castle L, Dines TJ, Fitzgerald AG, Gonzalez Tunon P, Jickells SM,
Johns SM, Layfield ES, Mountfort KA, Onoh H, Ramsay IA. Test method for
measuring non-visible set-off from inks and lacquers on the food-contact surface
of printed packaging materials. Food Additives & Contaminants 2005; 22(5):
pp.490-502
57. European Food Save Authority. Opinion of the Scientific Panel on Food Additives,
Flavourings, Processing Aids and Materials in Contact with Food on a request
from the Commission related to 2-Isopropyl thioxanthone (ITX) and 2-ethylhexyl-
4-dimethylaminobenzoate (EHDAB) in food contact materials . Available at
http://www.efsa.europa.eu/EFSA/Scientific_Opinion/afc_op_ej293_itx_opinion_en
1.pdf. Accessed 11 November 2008
Chapter I 23
58. Holmes MJ, Hart A, Northing P, Oldring PKT, Castle L, Stott D, Smith G,
Wardman O. Dietary exposure to chemical migrants from food contact materials:
A probabilistic approach. Food Additives & Contaminants 2005; 22(10): pp.907-
919
59. Benford, D. The Acceptable Daily Intake: A Tool for Ensuring Food Safety, ILSI
Press, Washington, U.S.A. ISBN 1-57881-091-4
60. European Food Save Authority. Opinion of the Scientific Panel on Food Additives,
Flavourings, Processing Aids and Materials in Contact with Food (AFC) on a
request from the Commission related to the introduction of a Fat (consumption)
Reduction Factor for infants and children. Available at
http://www.efsa.europa.eu/EFSA/efsa_locale-
1178620753812_1178620770209.htm. Accessed 11 November 2008
61. Silva AS, Garcia RS, Cooper I, Franz R, Losada PP. Compilation of analytical
methods and guidelines for the determination of selected model migrants from
plastic packaging. Trends in Food Science & Technology 2006; 17(10): pp.535-
546
62. EU DG XII research programme AIR 941025 (1994-1997). Safety and quality
control of plastics materials for food, synthetic report. Available at http://crl-
fcm.jrc.it. Accessed 13 November 2007
63. Veiga-Rial M, Sarria-Vidal M, de la Montana-Miguelez J, Simal-Gandara J.
Identification of residual constituents in plastic packaging for dairy products.
Recent Research Developments in Agricultural & Food Chemistry 1999; 3(Pt. 1):
pp.305-311
64. Biedermann-Brem S, Biedermann M, Fiselier K, Grob K. Compositional GC-FID
analysis of the additives to PVC, focusing on the gaskets of lids for glass jars.
Food Additives & Contaminants 2005; 22(12): pp.1274-1284
65. Gruber L, Wolz G, Piringer O. Analysis of phthalates in baby food. Deutsche
Lebensmittel-Rundschau 1998; 94(6): pp.177-179
66. Castle L, Mercer AJ, Startin JR, Gilbert J. Migration from plasticized films into
foods. 3. Migration of phthalate, sebacate, citrate and phosphate esters from films
used for retail food packaging. Food Additives & Contaminants 1988; 5(1): pp.9-
20
Chapter I 24
67. Startin JR, Parker I, Sharman M, Gilbert J. Analysis of di-(2-ethylhexyl)adipate
plasticiser in foods by stable isotope dilution gas chromatography-mass
spectrometry. Journal of Chromatography 1987; 387: pp.509-514
68. Castle L, Gilbert J, Jickells SM, Gramshaw JW. Analysis of the plasticiser
acetyltributyl citrate in foods by stable isotope dilution gas chromatography-mass
spectrometry. Journal of Chromatography 1988; 437(1): pp.281-286
69. Petersen JH, Breindahl T. Plasticisers in total diet samples, baby food and infant
formulae. Food Addit Contam 2000; 17(2): pp.133-141
70. Kueseng P, Thavarungkul P, Kanatharana P. Trace phthalate and adipate esters
contaminated in packaged food. Journal of Environmental Science and Health,
Part B: Pesticides, Food Contaminants, and Agricultural Wastes 2007; 42(5):
pp.569-576
71. Lau OW, Wong SK. Determination of plasticisers in food by gas chromatography-
mass spectrometry with ion-trap mass detection. J Chromatogr A 1996; 737(2):
pp.338-342
72. Simoneau C, Ezerskis Z, Morkunas V. Determination of plasticisers and additives
in PVC gasket seals and in fatty sauces and migration study. Food Contact
Polymers 2007, International Conference, 1st, Brussels, Belgium, Feb.21-22,
2007 2007: pp.8/1-8/5
73. Fiselier K, Biedermann M, Grob K. Injector-internal thermal desorption from
edible oils. Part 2: Chromatographic optimization for the analysis of migrants from
food packaging material. Journal of Separation Science 2005; 28(16): pp.2144-
2152
74. Fankhauser-Noti A, Grob K. Injector-internal thermal desorption from edible oils
performed by programmed temperature vaporizing (PTV) injection. Journal of
Separation Science 2006; 29(15): pp.2365-2374
75. Holadova K, Prokupkova G, Hajslova J, Poustka J. Headspace solid-phase
microextraction of phthalic acid esters from vegetable oil employing solvent
based matrix modification. Analytica Chimica Acta 2007; 582(1): pp.24-33
76. Fankhauser-Noti A, Biedermann-Brem S, Grob K. PVC plasticisers/additives
migrating from the gaskets of metal closures into oily food: Swiss market survey
June 2005. European Food Research and Technology 2006; 223(4): pp.447-453
Chapter I 25
77. Ezerskis Z, Pastorelli S, Contini C, Simoneau C. Survey of 2-ethylhexanoic acid
in baby food. Food Additives & Contaminants 2007; 24(7): pp.792-797
78. Belitz, H.-D.; Grosch, W. Food Chemistry, Springer-Verlag, Berlin - Heidelberg -
New York. ISBN 3-540-64704-X
79. Suman M, La Tegola S, Catellani D, Bersellini U. Liquid Chromatography-
Electrospray Ionization-Tandem Mass Spectrometry Method for the
Determination of Epoxidized Soybean Oil in Food Products. Journal of
Agricultural and Food Chemistry 2005; 53(26): pp.9879-9884
80. Castle L, Sharman M, Gilbert J. Gas chromatographic-mass spectrometric
determination of epoxidized soybean oil contamination of food by migration from
plastic packaging. Journal - Association of Official Analytical Chemists 1988;
71(6): pp.1183-1186
81. Biedermann-Brem S, Biedermann M, Fankhauser-Noti A, Grob K, Helling R.
Determination of epoxidized soy bean oil (ESBO) in oily foods by GC-FID or GC-
MS analysis of the methyl diepoxy linoleate. European Food Research and
Technology 2007; 224(3): pp.309-314
82. Weller P, Herrnreiter M, Donaubauer A. A miniaturized method to determine
epoxidized soybean oil in baby food. LC-GC Europe 2007; 20(5): pp.280-282,
285
83. Biedermann M, Grob K. GC method for determining polyadipate plasticisers in
foods: transesterification to dibutyl adipate, conversion to migrating polyadipate.
Chromatographia 2006; 64(9-10): pp.543-552
84. Biedermann M, Grob K. GC-MS characterization of oligomers in polyadipates
used as plasticisers for PVC in food contact. Packaging Technology & Science
2006; 19(3): pp.159-178
85. Castle L, Mercer AJ, Gilbert J. Gas chromatographic-mass spectrometric
determination of adipate-based polymeric plasticisers in foods. Journal -
Association of Official Analytical Chemists 1988; 71(2): pp.394-396
Chapter I 26
86. Biedermann-Brem S, Grob K, Biedermann M. Analysis of reaction products (e.g.
chlorhydrins) of ESBO in poly(vinyl chloride) type polymers and coatings.
Mitteilungen aus Lebensmitteluntersuchung und Hygiene 2001; 92(5): pp.515-
534
87. Biedermann-Brem S, Biedermann M, Grob K. Reaction of epoxidized soya bean
oil (ESBO) with hydrogen chloride formed in PVC: Investigation on model
systems. Mitteilungen aus Lebensmitteluntersuchung und Hygiene 2004; 95(3):
pp.261-286
88. Begley TH. Methods and approaches used by FDA to evaluate the safety of food
packaging materials. Food Addit Contam 1997; 14(6-7): pp.545-553
89. Kroes R, Renwick AG, Cheeseman M, Kleiner J, Mangelsdorf I, Piersma A,
Schilter B, Schlatter J, van Schothorst F, Vos JG, Wurtzen G. Structure-based
thresholds of toxicological concern (TTC): guidance for application to substances
present at low levels in the diet. Food and Chemical Toxicology 2004; 42(1):
pp.65-83
90. Barlow, S. Threshold of Toxicological Concern (TTC), ILSI Press, Washington,
U.S.A. ISBN 1-57881-188-0
91. European Communities. Council Directive 67/548/EEC of 27 June 1967 on the
approximation of laws, regulations and administrative provisions relating to the
classification, packaging and labelling of dangerous substances. Official Journal
of the European Union 1967; L 196: pp.1-98
92. European Communities. Synoptic Document. Available at
http://europa.eu.int/comm/food/food/chemicalsafety/foodcontact/synoptic_doc_en
.pdf. Accessed 13 November 2007
93. Severin I, Dahbi L, Lhuguenot JC, Andersson MA, Hoornstra D, Salkinoja-
Salonen M, Turco L, Zucco F, Stammati A, Dahlman O, Castle L, Savolainen M,
Weber A, Honkalampi-Haemaelaeinen U, Von Wright A. Safety assessment of
food-contact paper and board using a battery of short-term toxicity tests:
European union BIOSAFEPAPER project. Food Additives and Contaminants
2005; 22(10): pp.1032-1041
Chapter I 27
94. Mittag N, Foerster S, Hoppe S, Simat TJ, Sehr A, Renz S, Vobach M, Kammann
U. Bioassay guided analysis of migrants from can coatings. Journal fuer
Verbraucherschutz und Lebensmittelsicherheit 2006; 1(4): pp.345-353
95. Coulier L, Muilwijk B, van Stee L, Rijk R, Peters R, Zondervan-van den Beuken E,
van Dongen WD. Analytical strategy to assess the safety of food contact
materials. Food Contact Polymers 2007 2007: pp.7/1-7/10
96. Grob K. Comprehensive analysis of migrates from food-packaging materials: A
challenge. Food Additives and Contaminants 2002; 19(Suppl.): pp.185-191
97. Skjevrak I, Brede C, Steffensen IL, Mikalsen A, Alexander J, Fjeldal P, Herikstad
H. Non-targeted multi-component analytical surveillance of plastic food contact
materials: Identification of substances not included in EU positive lists and their
risk assessment. Food Additives and Contaminants 2005; 22(10): pp.1012-1022
98. European Food Safety Authority. EFSA Expert Group looks at semicarbazide: too
early for any conclusions. Available at
http://www.efsa.europa.eu/EFSA/efsa_locale-
1178620753812_1178620779504.htm. Accessed 08 September 2008
99. Stadler RH, Mottier P, Guy P, Gremaud E, Varga N, Lalljie S, Whitaker R,
Kintscher J, Dudler V, Read WA, Castle L. Semicarbazide is a minor thermal
decomposition product of azodicarbonamide used in the gaskets of certain food
jars. Analyst (Cambridge, United Kingdom) 2004; 129(3): pp.276-281
100. European Food Safety Authority. FAQ on Semicarbazide. Available at
http://www.efsa.europa.eu/EFSA/efsa_locale-
1178620753812_SemicarbazideFAQs.htm. Accessed 08 September 2008
101. de la Calle MB, Anklam E. Semicarbazide: occurrence in food products and
state-of-the-art in analytical methods used for its determination. Analytical and
Bioanalytical Chemistry 2005; 382(4): pp.968-977
102. European Communities. Commission directive 2004/1/EC amending Directive
2002/72/EC as regards the suspension of the use of azodicarbonamide as
blowing agent. Official Journal of the European Union 2004; L 7: pp.45-46
103. Elss S, Gruenewald L, Richling E, Schreier P. Occurrence of 2-ethylhexanoic
acid in foods packed in glass jars. Food Additives and Contaminants 2004; 21(8):
pp.811-814

Chapter I 28
104. Falbe, J.; Regitz, M. Römpp Chemie Lexikon, Georg Thieme Verlag, Stuttgart,
Germany. ISBN 3-13-102759-2
105. Hammarling L, Gustavsson H, Svensson K, Karlsson S, Oskarsson A. Migration
of epoxidized soya bean oil from plasticized PVC gaskets into baby food. Food
Addit Contam 1998; 15(2): pp.203-208
106. Fantoni L, Simoneau C. European survey of contamination of homogenized
baby food by epoxidized soybean oil migration from plasticized PVC gaskets.
Food Additives & Contaminants 2003; 20(11): pp.1087-1096
107. Fankhauser-Noti A, Fiselier K, Biedermann S, Biedermann M, Grob K, Armellini
F, Rieger K, Skjevrak I. Epoxidized soy bean oil (ESBO) migrating from the
gaskets of lids into food packed in glass jars. European Food Research and
Technology 2005; 221(3-4): pp.416-422
108. Fankhauser-Noti A, Grob K. Migration of plasticisers from PVC gaskets of lids
for glass jars into oily foods: Amount of gasket material in food contact, proportion
of plasticiser migrating into food and compliance testing by simulation. Trends in
Food Science & Technology 2006; 17(3): pp.105-112
109. Ezerskis Z, Morkunas V, Suman M, Simoneau C. Analytical screening of
polyadipates and other plasticisers in poly(vinyl chloride) gasket seals and in fatty
food by gas chromatography-mass spectrometry. Analytica Chimica Acta 2007;
604(1): pp.29-38
110. Pedersen GA, Jensen LK, Fankhauser A, Biedermann S, Petersen JH, Fabech
B. Migration of epoxidized soybean oil (ESBO) and phthalates from twist closures
into food and enforcement of the overall migration limit. Food Additives &
Contaminants, Part A: Chemistry, Analysis, Control, Exposure & Risk
Assessment 2008; 25(4): pp.503-510
111. Biedermann M, Fiselier K, Marmiroli G, Avanzini G, Rutschmann E, Pfenninger
S, Grob K. Migration from the gaskets of lids into oily foods: first results on
polyadipates. European Food Research and Technology 2008; 226(6): pp.1399-
1407
Chapter I 29
112. Schweizerische Eidgenossenschaft, Bundesamt für Gesundheit
Direktionsbereich Verbraucherschutz. Factsheet Phthalate. Available at
http://www.bag.admin.ch/themen/chemikalien/ 00228/01378/index.html?lang=de.
accessed 07 October 2008
113. Butte W, Hostrup O, Walker G. Phthalates in house dust and air: associations
and potential sources in the indoors. Gefahrstoffe - Reinhaltung der Luft 2008;
68(3): pp.79-81
114. Pford J. Levels of Di(2-ethylhexyl)phthalate(DEHP) and dibutyl phthalates in
some foodstuffs with plastic packagings and in mother's milk. Deutsche
Lebensmittel-Rundschau 2004; 100(11): pp.431-436
115. Earls AO, Axford IP, Braybrook JH. Gas chromatography-mass spectrometry
determination of the migration of phthalate plasticisers from polyvinyl chloride
toys and childcare articles. Journal of Chromatography, A 2003; 983(1-2):
pp.237-246
116. Wilkinson CF, Lamb JC, IV. The Potential Health Effects of Phthalate Esters in
Children's Toys: A Review and Risk Assessment. Regulatory Toxicology and
Pharmacology 1999; 30(2, Pt. 1): pp.140-155
117. Wormuth M, Scheringer M, Vollenweider M, Hungerbuhler K. What are the
sources of exposure to eight frequently used phthalic acid esters in Europeans?
Risk Anal 2006; 26(3): pp.803-824
118. European Communities. Commission Directive 2005/84/EC of the European
Parliament and of the Council of 14 December 2005 amending for the 22nd time
Council Directive 76/769/EEC on the approximation of the laws, regulations and
administrative provisions of the Member States relating to restrictions on the
marketing and use of certain dangerous substances and preparations (phthalates
in toys and childcare articles). Official Journal of the European Union 2005; L 344: pp.40-43
119. European Commission. Rapid Alert System for Non-Food Products (RAPEX) -
Latest notifications. Available at http://ec.europa.eu/
consumers/dyna/rapex/rapex_archives_en.cfm. Accessed 03 February 2009
120. Rastogi SC. Gas chromatography analysis of phthalate esters in plastic toys.
Chromatographia 1998; 47(11/12): pp.724-726
Chapter I 30
121. Vandenburg HJ, Clifford AA, Bartle KD, Carlson RE, Carroll J, Newton ID. A
simple solvent selection method for accelerated solvent extraction of additives
from polymers. Analyst (Cambridge, United Kingdom) 1999; 124(11): pp.1707-
1710
122. Stringer R, Labunska I, Santillo D, Johnston P, Siddorn J, Stephenson A.
Concentrations of phthalate esters and identification of other additives in PVC
children's toys. Environmental Science and Pollution Research International
2000; 7(1): pp.27-36
123. Hauri U, Schlegel U, Wagmann M, Hohl C. Determination of phthalates in toys
and childcare articles made of PVC with HPLC and HPTLC. Mitteilungen aus
Lebensmitteluntersuchung und Hygiene 2002; 93(4): pp.179-185
124. Grob K, Biedermann M, Scherbaum E, Roth M, Rieger K. Food contamination
with organic materials in perspective: Packaging materials as the largest and
least controlled source? A view focusing on the European Situation. Critical
Reviews in Food Science and Nutrition 2006; 46(7): pp.529-535
Chapter II 31
II. Non-targeted multi-component analytical screening of plastic food contact materials using fast interpretation of deliverables via expert structure-activity relationship software.
THORSTEN ROTHENBACHER1, WOLFGANG SCHWACK2
1 Chemisches und Veterinäruntersuchungsamt Stuttgart,
Schaflandstraße 3/ 2, 70736 Fellbach, Germany.§ 2 Institut für Lebensmittelchemie, Universität Hohenheim,
Garbenstr. 28, 70599 Stuttgart, Germany, e-mail:
[email protected], corresponding author
II.1. Abstract
Plastic packaging materials may release compounds into packed foodstuffs.
To identify potential migrants of toxicological concern, resins and multilayer foils
(mainly polyethylene), intended for the production of food contact materials, were
extracted and analysed by gas chromatography - mass spectrometry (GC/MS). To
identify even compounds of low concentrations, the software AMDIS was used and
data evaluation was safeguarded by the Kovats Retention Index (RI) system. By this
way, 46 compounds were identified as possible migrants. The expert structure-
activity relationship software DEREK for Windows™ (DfW) was utilized to evaluate all
identified substances in terms of carcinogenicity, genotoxicity, thyroid toxicity and
miscellaneous endpoints for humans. Additionally a literature search for these
compounds was carried out with Sci-Finder®, but relevant data were missing for 28
substances. Summarized seven compounds with adverse toxicological effects were
§ Present adress: Institut für Lebensmittelchemie, Universität Hohenheim, Germany
Chapter II 32
identified. In addition, the RIs of 24 commercial additive standards, measured with a
GC capillary column of middle polarity, are given.
II.2. Introduction
Huge sectors of plastic materials are food packagings. During the contact of
packaging with food, components deriving from the plastic material can be
transferred into the food.
The transferred components, so called migrants, are part of the polymer and
can be additives, catalysts, impurities of monomers and additives, oligomers and
monomers of the core polymer or from polymeric additives.1 Depending on the
processing, there are additional possibilities for the carry-over of possible food
contaminations. During storage of packaging, for example, substances like printing
ink components can be transferred via offset from the non- food contact material side
to the food contact material (FCM) side and subsequently migrate into the foodstuff.2
Possible degradation products of any migrant have also to be respected.3,4
To overview the number of substances used for the production of FCM, the
European Synoptic Document (SD) or the U.S.-American List of “Indirect” Additives
Used in Food Contact Substances (LIA) can be used.5,6 The SD lists all monomers
and additives notified to the European Commission in view of their use for the
manufacturing of plastics and coatings that will later be FCMs and includes about
3000 substances, while aids to polymerisation, colorants, inks, adhesives and
solvents are not mentioned in principle. The list only presents the notified auxiliary
materials. Quite the same number of substances used for food material production
are listed by LIA, but this list is not limited to plastic and coating materials. It deals
with substances used in food-contact articles, called “indirect food additives”, and
includes adhesives and components of coatings, paper and paperboard components,
polymers, adjuvants and production aids. In conclusion there is a vast variety of
possible and unknown contaminants deriving from FCM.
Chapter II 33
To evaluate health risks of a migrating substance, its toxicological properties
and the concentration in the food in conjunction with the average daily food intake
have to be considered. According to the structure-based threshold of toxicological
concern risk assessment tool for application to substances present at low levels in
the diet by Kroes et al., the intake of a toxicological and structural unknown and
therefore possible genotoxic substance should not exceed 0.15 μg per day, if it is
excluded that the substance is not an non-essential metal or metal containing
compound, polyhalogenated dibenzodioxin, dibenzofuran or biphenyl, or an aflatoxin-
like, azoxy or N-nitroso compound.7 In United States there is a substance-
independent threshold of regulation tolerated by the U.S. Food and Drug
Administration of 0.5 µg kg-1 foodstuff.8 Obviously, the determination of the
toxicological potential of a big variety of probably unknown substances at trace levels
is the claim.
There are different general approaches of late to face this analytical claim, but
a striking solution has not been found. From the toxicological point of view, FCM
migrates can be characterized by short-term toxicity tests.9 The application to
migrants of can coatings proved this concept as principally possible, but due to lack
of sensivity not generally usable.10 Heading to the analytical viewpoint, specific
compound classes known for toxic effects are determined by, e.g., gas
chromatography (GC). However, this method does not apply owing to i) a general
lack of known suitable reagents for derivatization and ii) a barely specificity, as
evaluated, e.g., for the GC analysis of aromatic amines with pentafluorobenzyl
chloride derivatization and mass spectrometric detection (GC/MS).11 Fundamentally,
the ranges of instrumental applications have to be considered, in case of GC analysis
primarily the vapor pressure and thermal stability of analytes. In spite of this, GC/MS
screening analysis actually is the most applied analytical method for unknown
migrants. In this case, the operator is challenged with the identification of a forest of
unknown peaks followed by toxicological assessment. Critical points are substance
identification only by use of mass spectra databases12 and insufficient limits of
detection for compounds in food simulants or food, e.g 20 μg kg-1 as reported for
compounds in water, determined after enrichment by solid-phase extraction.13
Chapter II 34
The toxicological assessment as a subsequent step of the screening analysis
is a part of the whole evaluation, which is as important as the analysis. Salts of
2-ethylhexanoic acid (2-EHA) used as a stabilizer for polyvinylchloride (PVC), for
example, were identified as a main migrant of PVC in 1997,3 but toxicological
concerns for 2-EHA in food were not published before 2004.14 Due to the fact that
generally not every compound identified as a potential migrant will be listed in
national legislation, a time-consuming literature database search for toxic properties
is required, often resulting in imperfect or negative results. A more effective way
could be the use of structure-activity relationship software. To improve the overall
accuracy and specificity of toxicological predictions, a multiple combination of
software is proposed,15 but for evaluation of the method presented here, the use of
one software seems to be sufficient. DEREK (Deductive Estimation of Risk from
Existing Knowledge) for WindowsTM (DfW), for example, is one of the most widely
used commercial toxicity prediction programs. It contains expert knowledge rules in
toxicology and predicts toxic properties for substances on the base of their molecular
structure.16 DfW is a well suited toxicological screening tool ranging in the lower price
region and best predicting mutagenicity and carcinogenicity as compared to other
software systems.17
The aim of this study was to establish an improved GC/MS screening method
including toxic interpretation of identified substances. To improve and safeguard the
data interpretation in view of correct substance identification, the software AMDIS
(Automated Mass Spectral Deconvolution and Identification System) from the
National Institute of Standards and Technology (NIST, U.S.A.) should be
implemented, because it provides efforts in the identification of substances at trace
levels, as proved for pesticides.18-20 AMDIS additionally offers an integrated Kovats
Retention Index (RI) system, to support correct peak identification.21 Subsequent the
toxic evaluation should be done by DfW. Due to contaminations in the range of
traces, the polymer instead of migrates should be investigated to achieve better
sensitivity. In the case of positive findings, however, the migrations of harmful
substances into food or food-simulants have to be checked by specific analysis,
depending on the food intended for packaging. For this new approach, several
resins, foils and multilayer foils, intended for the production of FCM, were screened.
Chapter II 35
The experiments were focused mainly on polyethylene, because it is the mostly used
material for food packaging.
II.3. Materials and methods
Chemicals and reagents 1,1,1,3,3,3-Hexafluoro-2-propanol (HFIP), 2-(2-butoxyethoxy) ethanol,
benzophenone, octadecyl 3-(3,5-di-tert-butyl-4-hydroxyphenyl) propionate, 2-ethyl-
hexanoic acid, oleamide, 2-phenoxyethanol, bis(2-ethylhexyl) phthalate, dioctyl
phthalate, (Z)-docos-13-enamide, 2,6-di-tert-butyl-p-cresol, octabenzone and the
alkanes for the alkane standard mixture C16-C38 (n-hexadecane, n-octadecane, n-
eicosane, n-docosane, n-tetracosane, n-hexacosane, n-octacosane, n-triacontane, n-
dotriacontane, n-tetratriacontane, n-hexatriacontane and n-octatriacontane) were
purchased from Sigma-Aldrich (Taufkirchen, Germany). Methanol, ethanol, toluene,
2-ethylhexyl 4-methoxycinnamate, ε-caprolactam, bis(2-ethylhexyl) adipate,
triacetine, diisobutyl phthalate, dimethyl heptanedioate, phthalic anhydride, α-
tocopherolacetate, isooctane, tributyl phosphate, dibutyl phthalate, tris(2-ethylhexyl)
phosphate and 4-methyl-m-phenylenediamine were from Merck (Darmstadt,
Germany). Methanol, ethanol, isooctane, toluene and HFIP were distilled before use.
Samples Eighteen polymeric resins, two single-layer foils and four multi-layer foils, all
intended for the production of food contact materials, were provided from different
fabricators. The resins 1-12 were made of low-density polyethylene (LDPE), the
resins 13-15 of linear low density polyethylene (LLDPE), resins 16 and 17 of
polyamide (PA), and resin 18 of 1,2-polybutadiene (PB). Foil 1 was made of
polyethylene terephthalate (PET), foil 2 of amorphous polyethylene terephthalate
(APET), foil 3 was a multilayer foil made of APET, PE and polyethylene vinyl acetate
(EVA), foil 4 a multilayer foil made of metalized PET, PE and PA, foil 5 a multilayer
foil made of APET and PE, and foil 6 a multilayer foil made of PA and PE.
Chapter II 36
Sample preparation The foils were cut into pieces smaller than 0.16 cm2. Samples of foil or resin
pieces (0.1 g) were refluxed in 4 mL HFIP (APET, PET and PA) or toluene (PE and
PB) until the plastic material was dissolved. For multilayer foils HFIP as well as
toluene was used. Afterwards, 15 mL of methanol (PET, PA) or ethanol (PE, PB)
were added and the suspension was filtered. The extracts were evaporated by a
gentle stream of nitrogen. The residue was taken up in 1 mL isooctane, 10 μL of
dodecane in isooctane (c=2 g L-1) were added and the solution was analysed by
GC/MS. To identify contaminations of solvents and instruments, blanks were
prepared and analysed the same way.
GC/MS A Thermo Finnigan Trace Gas Chromatograph with a straight splitless liner
containing a small packing of deactivated glass wool at its bottom, a Phenomenex
ZB50 column (30 m length, 0.25 mm id., 0.25 µm film) and a 0.7 m uncoated and
deactivated retention gap, coupled with a Thermo Finnigan Polaris QE 230 Ion Trap
Mass Spectrometer was used. While helium was used with a flow of 1 mL/min, 1 μL
was injected at 300°C for one minute splitless. Then the split was changed to 1/30.
The oven temperature gradient was 50°C(5min)/100°C(10°C/min)/
300°C(15°C/min)/300°C(10min). The transfer line was at 330°C and electron impact
ionization at 70 eV and a scan range from m/z 33-600 in positive detection mode
were used.
Determination of RI and target list compounds The alkane standard mixture C16-C38 (each hydrocarbon at a concentration of
100 mg L-1 in isooctane) was injected to obtain the RI calibration data and to assure
the GC/MS instrument supports analysis of substances with low vapor pressure.
To obtain the RI of 2-(2-butoxyethoxy)ethanol, 2,6-di-tert-butyl-p-cresol, 2-
ethyl-hexanoic acid, 2-ethylhexyl 4-methoxycinnamate, 2-phenoxyethanol, 4-methyl-
m-phenylenediamine, benzophenone, bis(2-ethylhexyl) adipate, bis(2-ethylhexyl)
phthalate, bis(2-methoxyethyl) phthalate, dibutyl phthalate, diisobutyl phthalate,
dimethyl heptanedioate, dioctyl phthalate, ε-caprolactam, (Z)-docos-13-enamide,
octabenzone, octadecyl 3-(3,5-di-tert-butyl-4-hydroxyphenyl)propionate, oleamide,
Chapter II 37
phthalic anhydride, triacetine, tributyl phosphate, tris(2-ethylhexyl) phosphate and α-
tocopheryl acetate, each component was dissolved in isooctane in the concentration
range of 20-50 mg L-1 and measured by GC/MS under conditions as described above
for the samples, except a Varian VF-17ms column without precolumn was used. The
obtained data were processed with AMDIS to set up a target list.
Software tools AMDIS (version 2.62, NIST, U.S.A.)22 was used to automatically detect peaks
in chromatograms, deconvolute the centroided mass spectra and calculate the RIs.
The adjacent peak subtraction was set to two, resolution, sensivity and shape
requirements each to low.
Detected peaks were target-list searched and afterwards batch processed with
NIST MS Search 2.0 (version 2.0 d) and the NIST/EPA/NIH Mass Spectral Library
(Version NIST 05).23
Compound identification was on base of the mass spectra and its database
search results in combination with the RI.
For the toxicological evaluation, the molecular structure of the identified
substance was transferred from NIST MS Search 2.0 to DfW (software version
9.0.0)24 via copy and paste. Then the structures were processed with DfW regarding
carcinogenicity, genotoxicity, thyroid toxicity and miscellaneous endpoints for
humans, the function “perceive tautomers” was enabled.
To evaluate identified substances by literature search, SciFinder® scholar
(version 2006)25 was used. First the substance was located via the substance
identifier, followed by a search for references associated with adverse effects,
including toxicity. If the title of the reference and the summary fit to the question of
toxicological evaluation concerning carcinogenicity or genotoxicity, the literature was
obtained and the toxicological data were extracted.
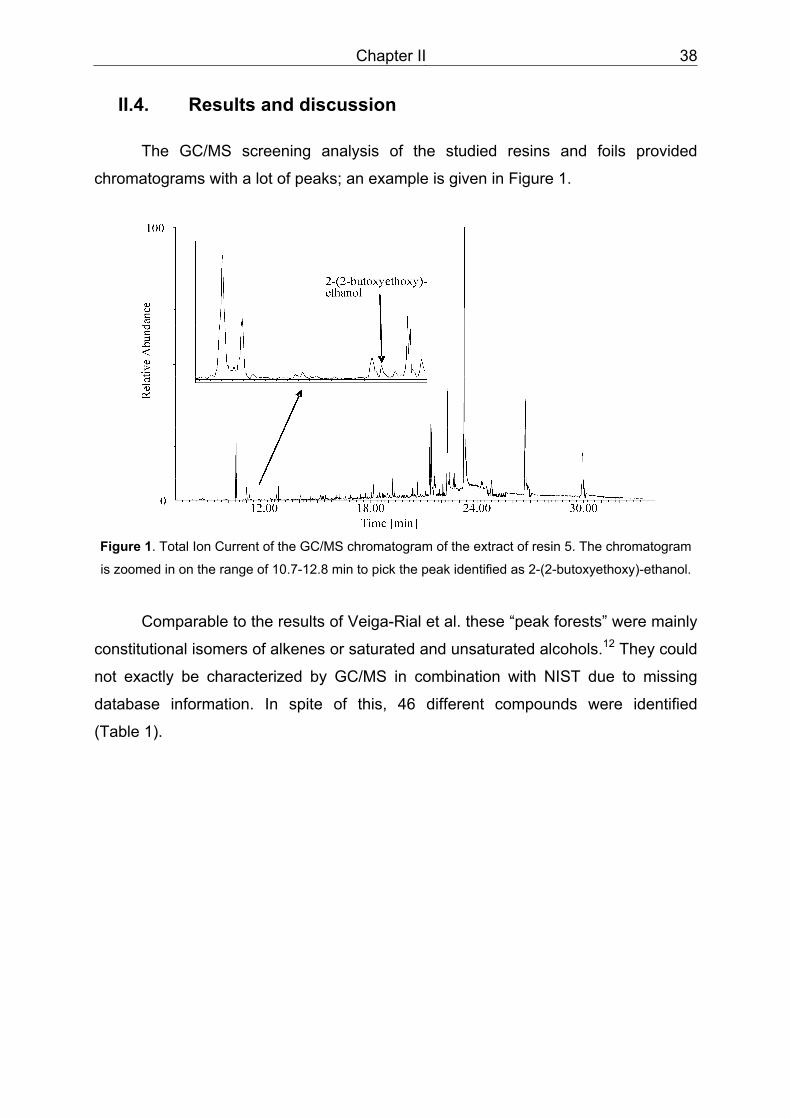
Chapter II 38
II.4. Results and discussion
The GC/MS screening analysis of the studied resins and foils provided
chromatograms with a lot of peaks; an example is given in Figure 1.
Figure 1. Total Ion Current of the GC/MS chromatogram of the extract of resin 5. The chromatogram
is zoomed in on the range of 10.7-12.8 min to pick the peak identified as 2-(2-butoxyethoxy)-ethanol.
Comparable to the results of Veiga-Rial et al. these “peak forests” were mainly
constitutional isomers of alkenes or saturated and unsaturated alcohols.12 They could
not exactly be characterized by GC/MS in combination with NIST due to missing
database information. In spite of this, 46 different compounds were identified
(Table 1).
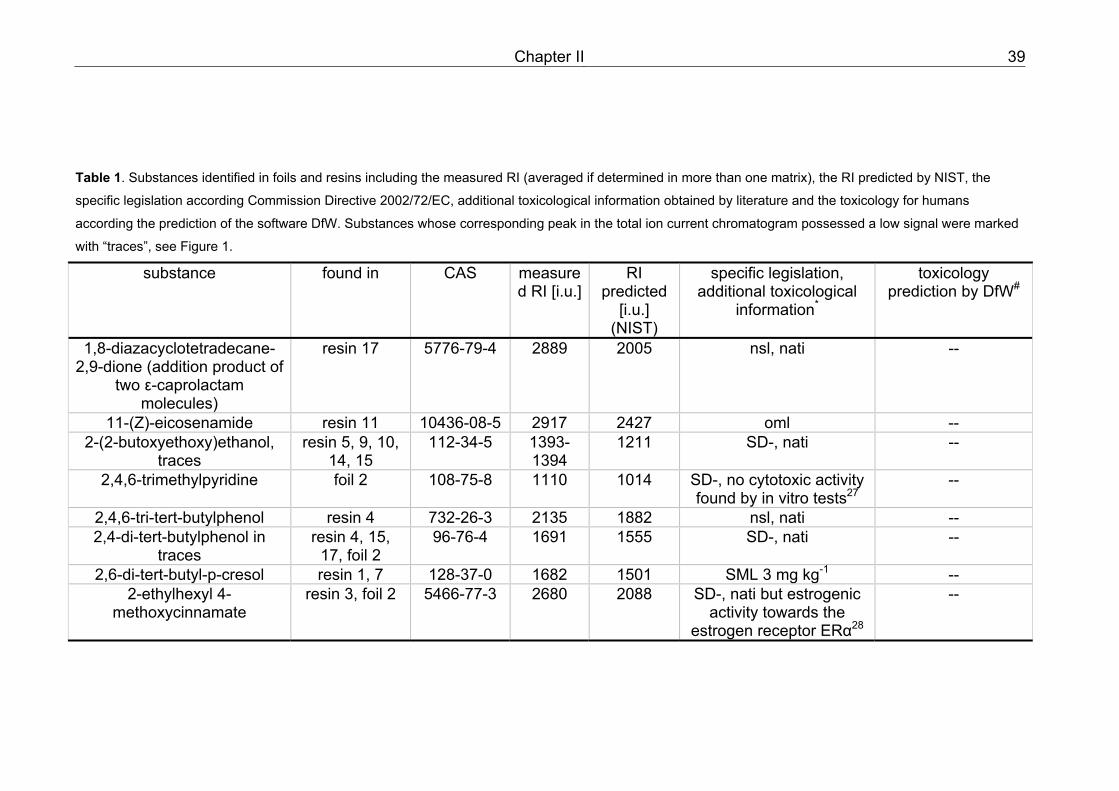
Chapter II 39
Table 1. Substances identified in foils and resins including the measured RI (averaged if determined in more than one matrix), the RI predicted by NIST, the
specific legislation according Commission Directive 2002/72/EC, additional toxicological information obtained by literature and the toxicology for humans
according the prediction of the software DfW. Substances whose corresponding peak in the total ion current chromatogram possessed a low signal were marked
with “traces”, see Figure 1.
substance found in CAS measured RI [i.u.]
RI predicted
[i.u.] (NIST)
specific legislation, additional toxicological
information*
toxicology prediction by DfW#
1,8-diazacyclotetradecane-2,9-dione (addition product of
two ε-caprolactam molecules)
resin 17 5776-79-4 2889 2005 nsl, nati --
11-(Z)-eicosenamide resin 11 10436-08-5 2917 2427 oml -- 2-(2-butoxyethoxy)ethanol,
traces resin 5, 9, 10,
14, 15 112-34-5 1393-
1394 1211 SD-, nati --
2,4,6-trimethylpyridine foil 2 108-75-8 1110 1014 SD-, no cytotoxic activity found by in vitro tests27
--
2,4,6-tri-tert-butylphenol resin 4 732-26-3 2135 1882 nsl, nati -- 2,4-di-tert-butylphenol in
traces resin 4, 15,
17, foil 2 96-76-4 1691 1555 SD-, nati --
2,6-di-tert-butyl-p-cresol resin 1, 7 128-37-0 1682 1501 SML 3 mg kg-1 -- 2-ethylhexyl 4-
methoxycinnamate resin 3, foil 2 5466-77-3 2680 2088 SD-, nati but estrogenic
activity towards the estrogen receptor ERα28
--
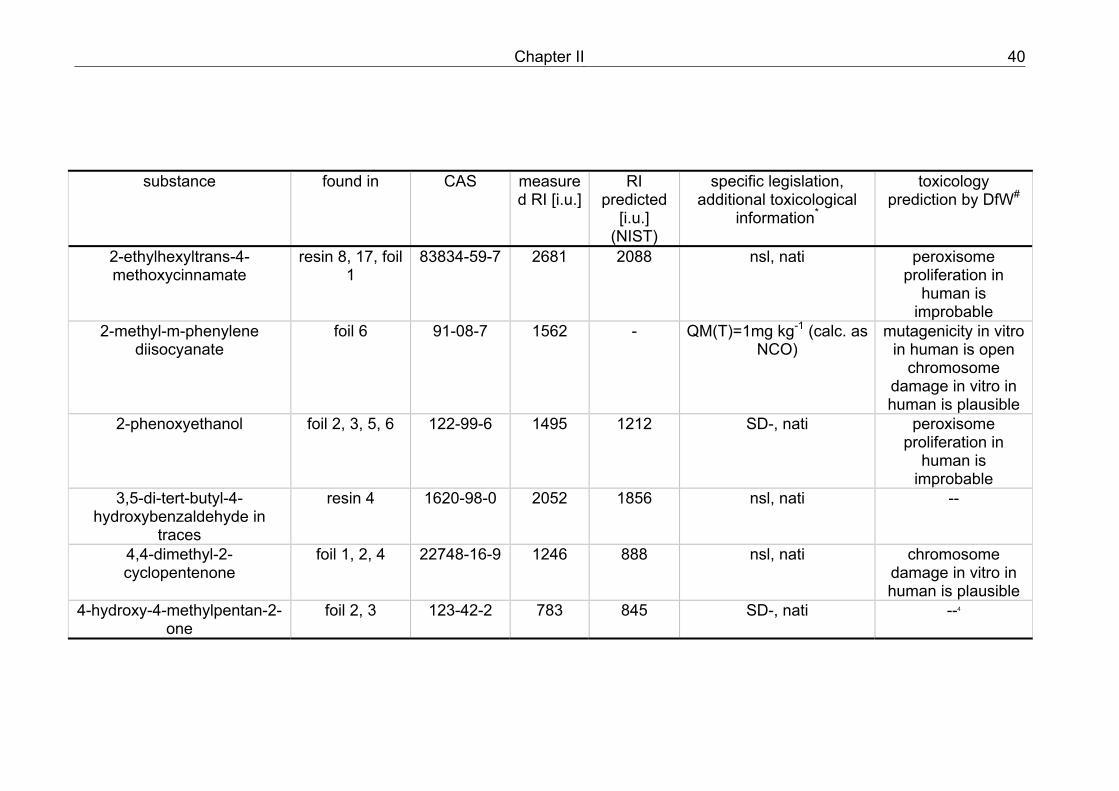
Chapter II 40
substance found in CAS measured RI [i.u.]
RI predicted
[i.u.] (NIST)
specific legislation, additional toxicological
information*
toxicology prediction by DfW#
2-ethylhexyltrans-4-methoxycinnamate
resin 8, 17, foil 1
83834-59-7 2681 2088 nsl, nati peroxisome proliferation in
human is improbable
2-methyl-m-phenylene diisocyanate
foil 6 91-08-7 1562 - QM(T)=1mg kg-1 (calc. as NCO)
mutagenicity in vitro in human is open
chromosome damage in vitro in human is plausible
2-phenoxyethanol foil 2, 3, 5, 6 122-99-6 1495 1212 SD-, nati peroxisome proliferation in
human is improbable
3,5-di-tert-butyl-4-hydroxybenzaldehyde in
traces
resin 4 1620-98-0 2052 1856 nsl, nati --
4,4-dimethyl-2-cyclopentenone
foil 1, 2, 4 22748-16-9 1246 888 nsl, nati chromosome damage in vitro in human is plausible
4-hydroxy-4-methylpentan-2-one
foil 2, 3 123-42-2 783 845 SD-, nati --4
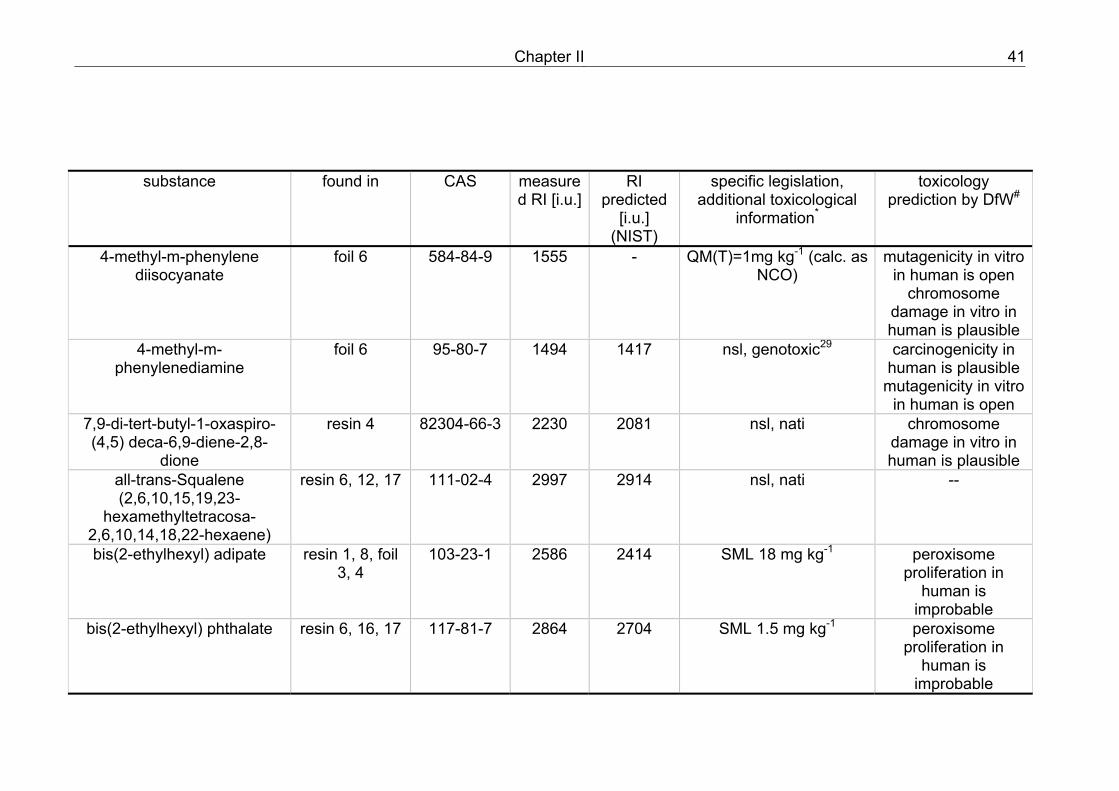
Chapter II 41
substance found in CAS measured RI [i.u.]
RI predicted
[i.u.] (NIST)
specific legislation, additional toxicological
information*
toxicology prediction by DfW#
4-methyl-m-phenylene diisocyanate
foil 6 584-84-9 1555 - QM(T)=1mg kg-1 (calc. as NCO)
mutagenicity in vitro in human is open
chromosome damage in vitro in human is plausible
4-methyl-m-phenylenediamine
foil 6 95-80-7 1494 1417 nsl, genotoxic29 carcinogenicity in human is plausible
mutagenicity in vitro in human is open
7,9-di-tert-butyl-1-oxaspiro-(4,5) deca-6,9-diene-2,8-
dione
resin 4 82304-66-3 2230 2081 nsl, nati chromosome damage in vitro in human is plausible
all-trans-Squalene (2,6,10,15,19,23-
hexamethyltetracosa-2,6,10,14,18,22-hexaene)
resin 6, 12, 17 111-02-4 2997 2914 nsl, nati --
bis(2-ethylhexyl) adipate resin 1, 8, foil 3, 4
103-23-1 2586 2414 SML 18 mg kg-1 peroxisome proliferation in
human is improbable
bis(2-ethylhexyl) phthalate resin 6, 16, 17 117-81-7 2864 2704 SML 1.5 mg kg-1 peroxisome proliferation in
human is improbable
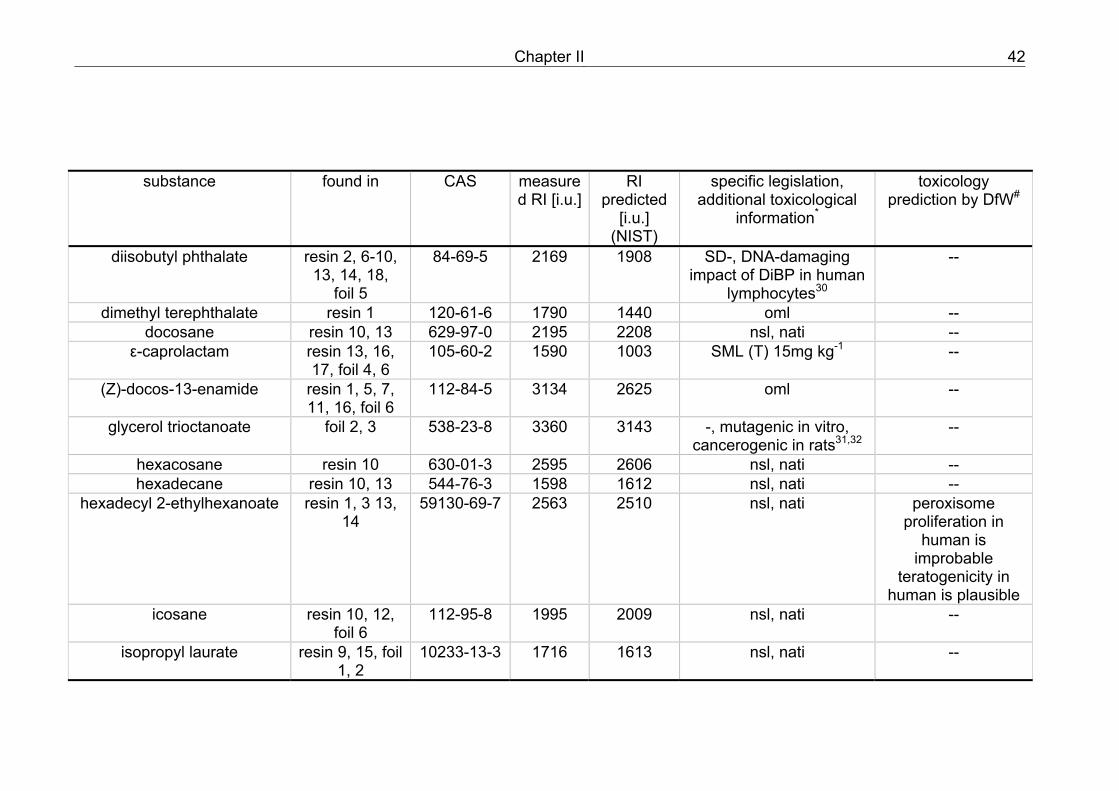
Chapter II 42
substance found in CAS measured RI [i.u.]
RI predicted
[i.u.] (NIST)
specific legislation, additional toxicological
information*
toxicology prediction by DfW#
diisobutyl phthalate resin 2, 6-10, 13, 14, 18,
foil 5
84-69-5 2169 1908 SD-, DNA-damaging impact of DiBP in human
lymphocytes30
--
dimethyl terephthalate resin 1 120-61-6 1790 1440 oml -- docosane resin 10, 13 629-97-0 2195 2208 nsl, nati --
ε-caprolactam resin 13, 16, 17, foil 4, 6
105-60-2 1590 1003 SML (T) 15mg kg-1 --
(Z)-docos-13-enamide resin 1, 5, 7, 11, 16, foil 6
112-84-5 3134 2625 oml --
glycerol trioctanoate foil 2, 3 538-23-8 3360 3143 -, mutagenic in vitro, cancerogenic in rats31,32
--
hexacosane resin 10 630-01-3 2595 2606 nsl, nati -- hexadecane resin 10, 13 544-76-3 1598 1612 nsl, nati --
hexadecyl 2-ethylhexanoate resin 1, 3 13, 14
59130-69-7 2563 2510 nsl, nati peroxisome proliferation in
human is improbable
teratogenicity in human is plausible
icosane resin 10, 12, foil 6
112-95-8 1995 2009 nsl, nati --
isopropyl laurate resin 9, 15, foil 1, 2
10233-13-3 1716 1613 nsl, nati --
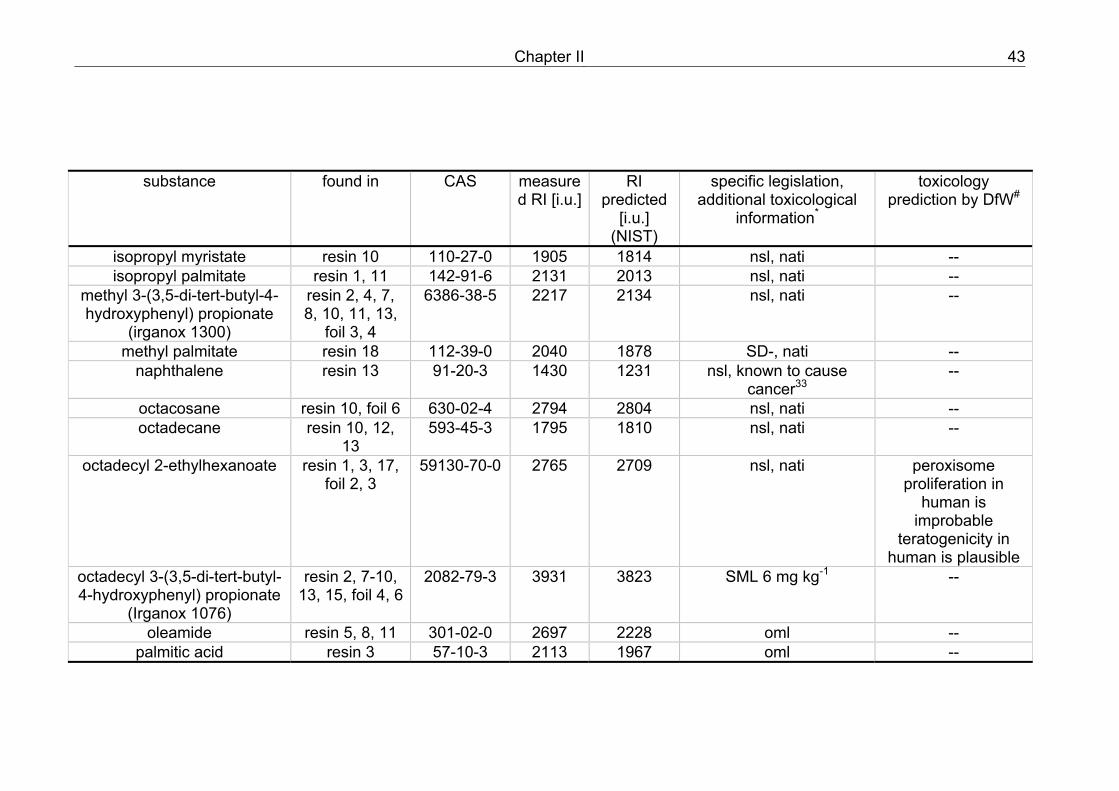
Chapter II 43
substance found in CAS measured RI [i.u.]
RI predicted
[i.u.] (NIST)
specific legislation, additional toxicological
information*
toxicology prediction by DfW#
isopropyl myristate resin 10 110-27-0 1905 1814 nsl, nati -- isopropyl palmitate resin 1, 11 142-91-6 2131 2013 nsl, nati --
methyl 3-(3,5-di-tert-butyl-4-hydroxyphenyl) propionate
(irganox 1300)
resin 2, 4, 7, 8, 10, 11, 13,
foil 3, 4
6386-38-5 2217 2134 nsl, nati --
methyl palmitate resin 18 112-39-0 2040 1878 SD-, nati -- naphthalene resin 13 91-20-3 1430 1231 nsl, known to cause
cancer33 --
octacosane resin 10, foil 6 630-02-4 2794 2804 nsl, nati -- octadecane resin 10, 12,
13 593-45-3 1795 1810 nsl, nati --
octadecyl 2-ethylhexanoate resin 1, 3, 17, foil 2, 3
59130-70-0 2765 2709 nsl, nati peroxisome proliferation in
human is improbable
teratogenicity in human is plausible
octadecyl 3-(3,5-di-tert-butyl-4-hydroxyphenyl) propionate
(Irganox 1076)
resin 2, 7-10, 13, 15, foil 4, 6
2082-79-3 3931 3823 SML 6 mg kg-1 --
oleamide resin 5, 8, 11 301-02-0 2697 2228 oml -- palmitic acid resin 3 57-10-3 2113 1967 oml --
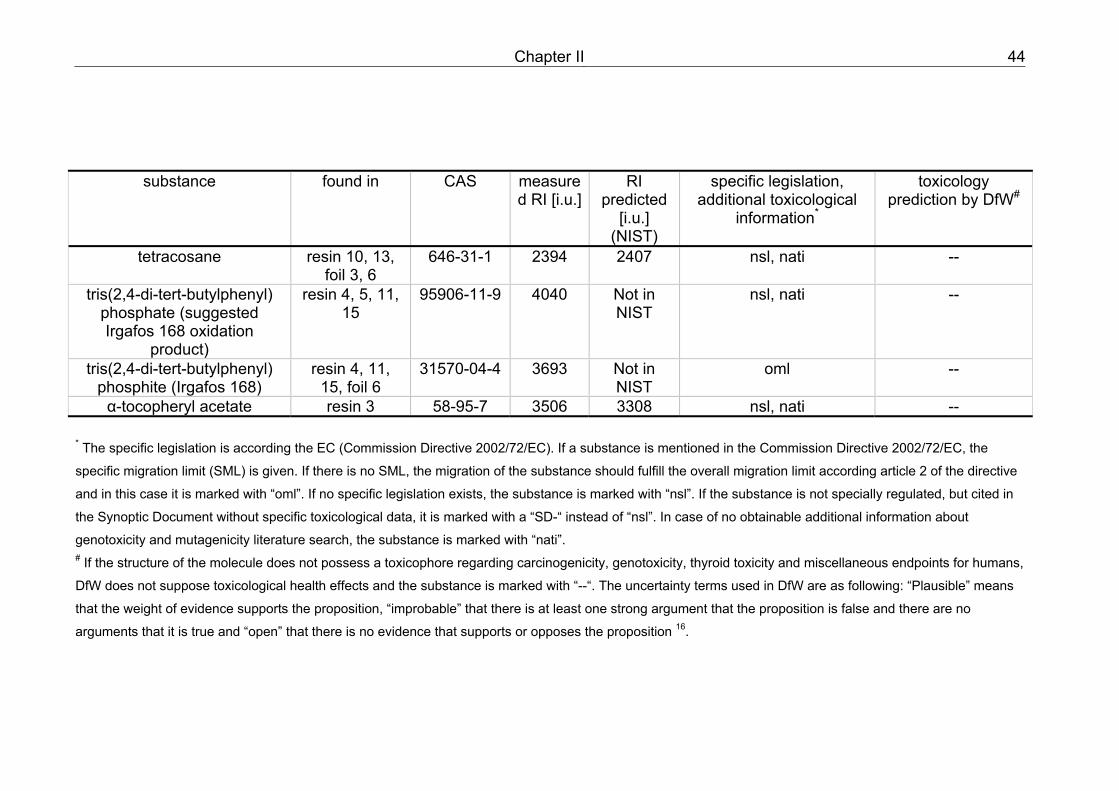
Chapter II 44
substance found in CAS measured RI [i.u.]
RI predicted
[i.u.] (NIST)
specific legislation, additional toxicological
information*
toxicology prediction by DfW#
tetracosane resin 10, 13, foil 3, 6
646-31-1 2394 2407 nsl, nati --
tris(2,4-di-tert-butylphenyl) phosphate (suggested Irgafos 168 oxidation
product)
resin 4, 5, 11, 15
95906-11-9 4040 Not in NIST
nsl, nati --
tris(2,4-di-tert-butylphenyl) phosphite (Irgafos 168)
resin 4, 11, 15, foil 6
31570-04-4 3693 Not in NIST
oml --
α-tocopheryl acetate resin 3 58-95-7 3506 3308 nsl, nati --
* The specific legislation is according the EC (Commission Directive 2002/72/EC). If a substance is mentioned in the Commission Directive 2002/72/EC, the
specific migration limit (SML) is given. If there is no SML, the migration of the substance should fulfill the overall migration limit according article 2 of the directive
and in this case it is marked with “oml”. If no specific legislation exists, the substance is marked with “nsl”. If the substance is not specially regulated, but cited in
the Synoptic Document without specific toxicological data, it is marked with a “SD-“ instead of “nsl”. In case of no obtainable additional information about
genotoxicity and mutagenicity literature search, the substance is marked with “nati”. # If the structure of the molecule does not possess a toxicophore regarding carcinogenicity, genotoxicity, thyroid toxicity and miscellaneous endpoints for humans,
DfW does not suppose toxicological health effects and the substance is marked with “--“. The uncertainty terms used in DfW are as following: “Plausible” means
that the weight of evidence supports the proposition, “improbable” that there is at least one strong argument that the proposition is false and there are no
arguments that it is true and “open” that there is no evidence that supports or opposes the proposition 16.
Chapter II 45
The structural majority of them are hydrocarbons (7 compounds) and fatty acid
esters (9 compounds). Some are known additives for plastic materials like the
antioxidants α-tocopheryl acetate, methyl 3-(3,5-di-tert-butyl-4-
hydroxyphenyl)propionate, tris(2,4-di-tert-butylphenyl) phosphite and octadecyl 3-
(3,5-di-tert-butyl-4-hydroxyphenyl) propionate, the slipping agents (Z)-docos-13-
enamide and oleamide and the derivates of the phthalates and bis(2-ethylhexyl)
adipate, used as plasticisers. Some other identified compounds are not known
additives, but have been found in earlier publications as contaminants of FCM, like 2-
phenoxyethanol for example found in coating material of cookware products.26
Caprolactam and its dimers were found as migrants from polyamide cooking utensils
and 2,4-di-tert-butylphenol, a degradation product of irgafos antioxidants, as a
migrant of polyolefin bottles.13 Nevertheless, still 19 compounds are remaining, which
are not expected to be in food contact materials. Concerning the toxic evaluation of
the identified compounds, all 46 compounds were checked, because known additives
or contaminants can also possess health risks. Of all these substances, only 13
compounds were regulated by the Commission Directive 2002/72/EC and eight are
mentioned in the Synoptic Document without sufficient toxicological data. These eight
substances should be reviewed by the European Food Safety Authority (EFSA) in the
forthcoming years.
Therefore 33 identified compounds had to be evaluated, so the required level
of own initiative was very high. Using SciFinder®, it took about five hours, but
toxicological data comparable to an acceptable daily intake dose in the diet were not
found for all substances. Only for five compounds, there was access to toxicologically
relevant data like cytotoxic activity or genotoxicity. Therefore the SciFinder® search
did not satisfy and left a great level of uncertainty for 28 substances. In contrast to
this, the evaluation with DfW on base of the structure quickly gave results for each
compound. For 26 of the 33 compounds to be evaluated negative effects were not
predicted by DfW. For 2-ethylhexyl-(trans)-4-methoxycinnamate and 2-
phenoxyethanol, a peroxisome proliferation in human is improbable, but not
excluded. Thus, there could be the possibility that these compounds may lead to
oxidative stress in the human body. DfW predicts for five compounds that they
plausibly possess more negative health effects: 7,9-di-tert-butyl-1-oxaspiro(4,5)deca-
6,9-diene-2,8-dione and 4,4-dimethyl-2-cyclopentenone damage human
Chapter II 46
chromosomes, 4-methyl-m-phenylenediamine is carcinogenic and hexadecyl 2-
ethylhexanoate and octadecyl 2-ethylhexanoate are teratogenic for humans. In
comparison to the evaluation via SciFinder® search, on the one hand, these adverse
effects predicted by DfW have not been found in literature, except the carcinogenicity
for 4-methyl-m-phenylenediamine.29 On the other hand, naphthalene and surprisingly
glycerol trioctanoate, too, are both reported as mutagenic31-33 and diisobutyl
phthalate possesses a DNA damaging impact in human lymphocytes according to
the literature,30 but DfW did not calculate a risk.
Regarding our data evaluation and the report of Dagan et al.,20 the use of
AMDIS saved time, because it automatically i) calculates the RIs for all detected
peaks, ii) deconvolutes their mass spectra, iii) compares the data with the target list
and iv) allows to search automatically for matches of the deconvoluted mass spectra
in NIST. Although AMDIS featured fast processing, it sometimes excluded
characteristic mass peaks of the spectrum of a compound. Therefore, to assure
correct identification results, the deconvoluted mass spectrum of a compound was
also manually compared with the native recorded mass spectrum as well as with the
spectrum of the substances that were high-match proposed by the NIST library by an
experienced GC/MS operator, who finally made the identification decision. Figure 1
illustrates a peak identified as 2-(2-butoxyethoxy)-ethanol to give an example for a
substance which is found “in traces”. The mass spectrum of exactly this peak was
treated with different kinds of data evaluation and compared to the mass spectrum of
2-(2-butoxyethoxy)-ethanol of the NIST database. Figure 2 demonstrates the
reduction of the background by use of conventional background correction and
deconvolution. The NIST database search, which can be considered as an important
step of the method, gave no valueable results for the untreated spectrum. In case of
the conventional background correction the database search delivered on the first
position 2-(2-butoxyethoxy)ethyl thiocyanate, on the second position 17,20:20,21-
bis[methylenebis(oxy)]-,cyclic 3-(1,2-ethanediyl acetal)pregn-5-ene-3,11-dione and
on the third position with a probability of 2.2% the correct identification of 2-(2-
butoxyethoxy)-ethanol. The search with the deconvoluted mass spectrum yielded a
probability of 15.0% for the target compound in the first position. In this example, it is
obvious that AMDIS improved correct substance identification significantly compared
to the conventional data evaluation.
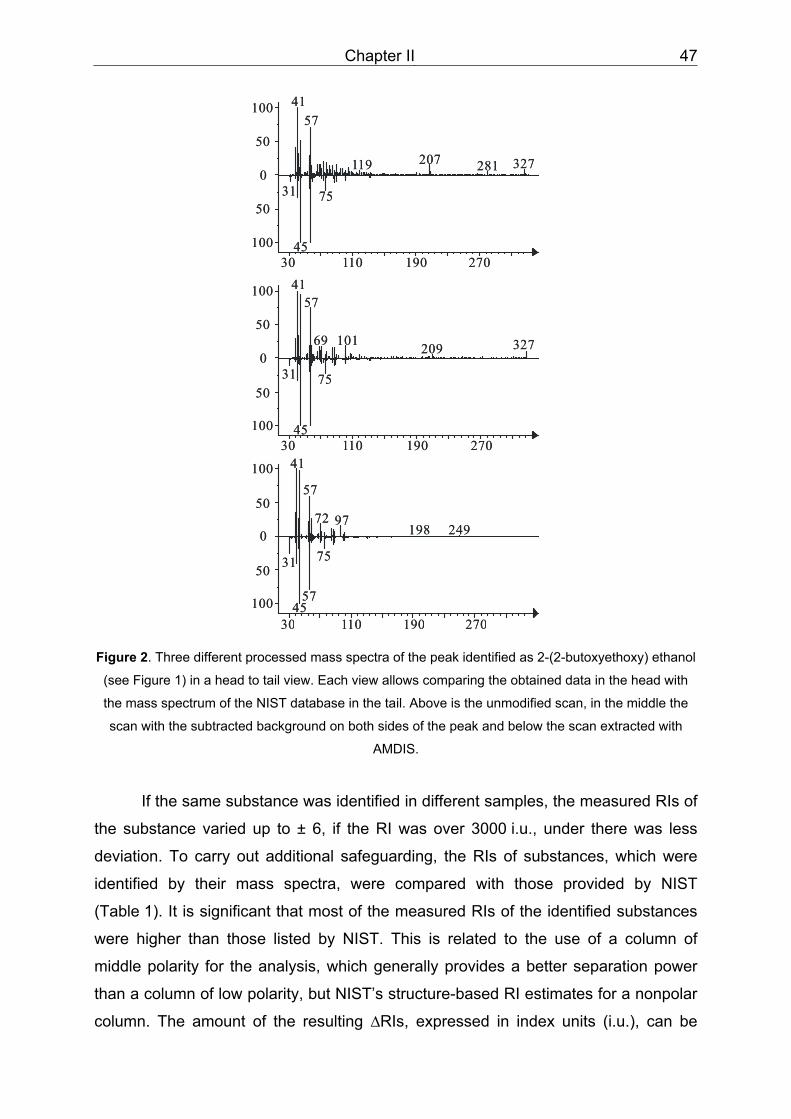
Chapter II 47
30 110 190 270
0
50
100
50
100
31
41
45
57
57
72
75
97198 249
30 110 190 270
0
50
100
50
100
31
41
45
57
69
75
101 209 327
30 110 190 270
0
50
100
50
100
4157
119 207 281 327
30 110 190 270
0
50
100
50
100
31
41
45
57
57
72
75
97198 249
30 110 190 270
0
50
100
50
100
31
41
45
57
69
75
101 209 327
30 110 190 270
0
50
100
50
100
4157
119 207 281 327
31
45
7531
45
75
Figure 2. Three different processed mass spectra of the peak identified as 2-(2-butoxyethoxy) ethanol
(see Figure 1) in a head to tail view. Each view allows comparing the obtained data in the head with
the mass spectrum of the NIST database in the tail. Above is the unmodified scan, in the middle the
scan with the subtracted background on both sides of the peak and below the scan extracted with
AMDIS.
If the same substance was identified in different samples, the measured RIs of
the substance varied up to ± 6, if the RI was over 3000 i.u., under there was less
deviation. To carry out additional safeguarding, the RIs of substances, which were
identified by their mass spectra, were compared with those provided by NIST
(Table 1). It is significant that most of the measured RIs of the identified substances
were higher than those listed by NIST. This is related to the use of a column of
middle polarity for the analysis, which generally provides a better separation power
than a column of low polarity, but NIST’s structure-based RI estimates for a nonpolar
column. The amount of the resulting ∆RIs, expressed in index units (i.u.), can be
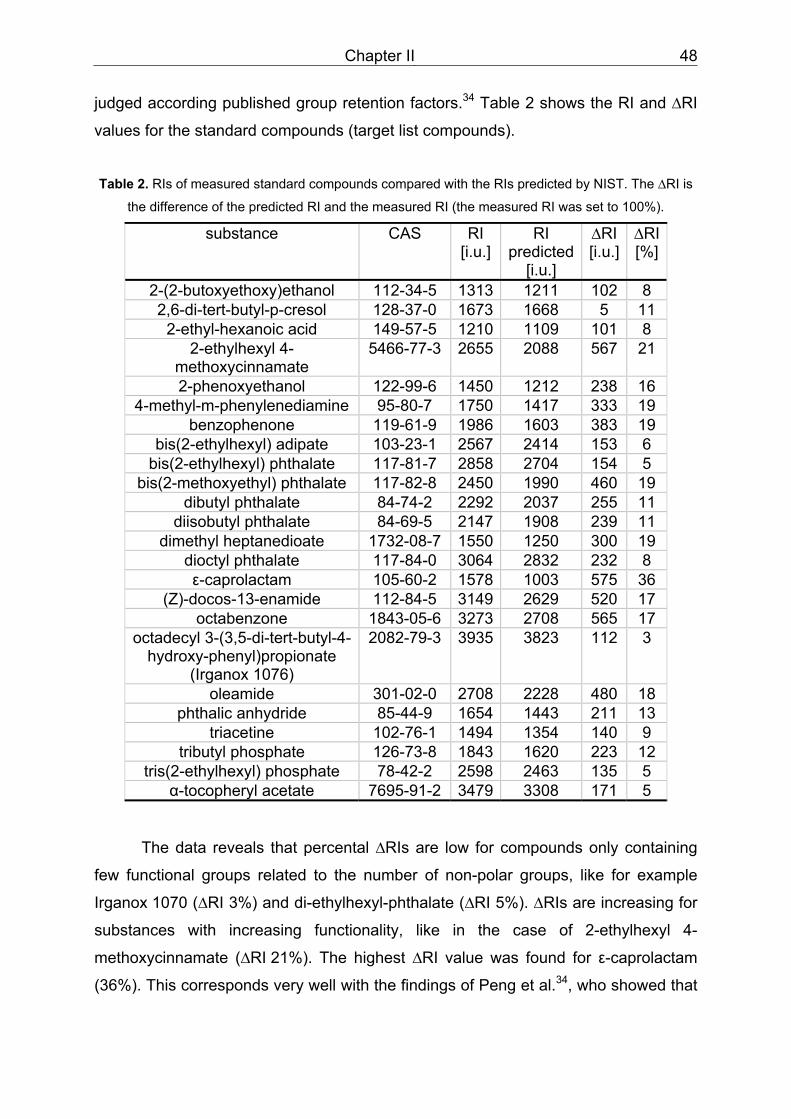
Chapter II 48
judged according published group retention factors.34 Table 2 shows the RI and ∆RI
values for the standard compounds (target list compounds).
Table 2. RIs of measured standard compounds compared with the RIs predicted by NIST. The ∆RI is
the difference of the predicted RI and the measured RI (the measured RI was set to 100%).
substance CAS RI [i.u.]
RI predicted
[i.u.]
∆RI [i.u.]
∆RI [%]
2-(2-butoxyethoxy)ethanol 112-34-5 1313 1211 102 8 2,6-di-tert-butyl-p-cresol 128-37-0 1673 1668 5 11
2-ethyl-hexanoic acid 149-57-5 1210 1109 101 8 2-ethylhexyl 4-
methoxycinnamate 5466-77-3 2655 2088 567 21
2-phenoxyethanol 122-99-6 1450 1212 238 16 4-methyl-m-phenylenediamine 95-80-7 1750 1417 333 19
benzophenone 119-61-9 1986 1603 383 19 bis(2-ethylhexyl) adipate 103-23-1 2567 2414 153 6
bis(2-ethylhexyl) phthalate 117-81-7 2858 2704 154 5 bis(2-methoxyethyl) phthalate 117-82-8 2450 1990 460 19
dibutyl phthalate 84-74-2 2292 2037 255 11 diisobutyl phthalate 84-69-5 2147 1908 239 11
dimethyl heptanedioate 1732-08-7 1550 1250 300 19 dioctyl phthalate 117-84-0 3064 2832 232 8 ε-caprolactam 105-60-2 1578 1003 575 36
(Z)-docos-13-enamide 112-84-5 3149 2629 520 17 octabenzone 1843-05-6 3273 2708 565 17
octadecyl 3-(3,5-di-tert-butyl-4-hydroxy-phenyl)propionate
(Irganox 1076)
2082-79-3 3935 3823 112 3
oleamide 301-02-0 2708 2228 480 18 phthalic anhydride 85-44-9 1654 1443 211 13
triacetine 102-76-1 1494 1354 140 9 tributyl phosphate 126-73-8 1843 1620 223 12
tris(2-ethylhexyl) phosphate 78-42-2 2598 2463 135 5 α-tocopheryl acetate 7695-91-2 3479 3308 171 5
The data reveals that percental ∆RIs are low for compounds only containing
few functional groups related to the number of non-polar groups, like for example
Irganox 1070 (∆RI 3%) and di-ethylhexyl-phthalate (∆RI 5%). ∆RIs are increasing for
substances with increasing functionality, like in the case of 2-ethylhexyl 4-
methoxycinnamate (∆RI 21%). The highest ∆RI value was found for ε-caprolactam
(36%). This corresponds very well with the findings of Peng et al.34, who showed that
Chapter II 49
the monosubstituted acid amido group possesses one of the largest group-retaining
factor for polar columns.
Finally, there was left a question of the source of the identified compounds
evaluated as toxicologically relevant. Di-tert-butyl-1-oxaspiro-(4,5) deca-6,9-diene-
2,8-dione, that probably will cause a chromosome damage in humans, is a
degradation product of Irganox 1010 (pentaerythritol tetrakis(3-(3,5-di-tert-butyl-4-
hydroxyphenyl) propionate))35 and has also been found in extracts of FCM before.13
The same adverse effects possesses 4,4-dimethyl-2-cyclopentenone. It was found
before in minor quantities in extrudates of food,36 but is not known to be a FCM
contaminant. The two isocyanates 2-methyl-m-phenylene diisocyanate and 4-methyl-
m-phenylene diisocyanate were only detected in one multilayer foil and possibly
derive from the glue between the layers. Another compound only found in the same
multilayer foil is 4-methyl-m-phenylenediamine. It is also carcinogenic according DfW
and supposably also derived from the glue, because it can be used as raw material
for 4-methyl-m-phenylene diisocyanate and additionally is a degradation product of
the hydrolyzed diisocyanate. Glycerol trioctanoate was found before as a lubricant in
FCM37 and should surprisingly be considered as mutagenic and genotoxic according
to literature.31,32 Naphthalene was found before in coating material of cookware
products26 and is described in literature to be carcinogenic.32,33
II.5. Conclusion
The method described allows a sensitive analysis of compounds in plastic
materials accompanied by safeguarded identification via mass spectrometry and
retention index system. Furthermore every resulting substance can be toxicologically
evaluated in seconds and expeditiously data processing is implemented in the whole
process. With regard to a forthcoming process of recycling in FCM production, the
range of substances that possibly contaminate packed food may expand in the
future. According to the opinion of the authors, the challenge of the identification of
hazardous substances in the diet should be persecuted in the future on a larger
scale. The use of the method described is an important aspect to resolve this hurdle.
Chapter II 50
II.6. Acknowledgment
The authors would like to thank CVUA Stuttgart for supply with equipment,
materials and support and FABES Forschungs-GmbH for support.
II.7. References
1. Feigenbaum A, Scholler D, Bouquant J, Brigot G, Ferrier D, Franz R, Lillemark L,
Riquet AM, Petersen JH, Van Lierop B, Yagoubi N. Safety and quality of food
contact materials. Part 1: Evaluation of analytical strategies to introduce migration
testing into good manufacturing practice. Food Additives and Contaminants 2002;
19(2): pp.184-201
2. Rothenbacher T, Baumann M, Fuegel D. 2-isopropylthioxanthone (2-ITX) in food
and food packaging materials on the German market. Food Additives and
Contaminants 2007; 24(4): pp.438-444
3. EU DG XII research programme AIR 941025. Safety and quality control of
plastics materials for food, synthetic report. Available at http://crl-fcm.jrc.it.
Accessed 13 November 2007
4. Piringer O.G.; Baner A.L. Packaging Materials for Food, Wiley-VCH, Weinheim,
Germany. ISBN 3-527-28868-6
5. European Communities. Synoptic Document. Available at
http://europa.eu.int/comm/food/food/chemicalsafety/foodcontact/synoptic_doc_en
.pdf. Accessed 13 November 2007
6. U.S.Food and Drug Administration/ Center for Food Safety & Applied Nutrition.
The List of "Indirect" Additives Used in Food Contact Substances. Available at
http://www.cfsan.fda.gov/~dms/opa-indt.html.
7. Kroes R, Renwick AG, Cheeseman M, Kleiner J, Mangelsdorf I, Piersma A,
Schilter B, Schlatter J, van Schothorst F, Vos JG, Wurtzen G. Structure-based
thresholds of toxicological concern (TTC): guidance for application to substances
present at low levels in the diet. Food and Chemical Toxicology 2004; 42(1):
pp.65-83
Chapter II 51
8. Heckman JH. Food packaging regulation in the United States and the European
Union. Regul Toxicol Pharmacol 2005; 42(1): pp.96-122
9. Severin I, Dahbi L, Lhuguenot JC, Andersson MA, Hoornstra D, Salkinoja-
Salonen M, Turco L, Zucco F, Stammati A, Dahlman O, Castle L, Savolainen M,
Weber A, Honkalampi-Haemaelaeinen U, Von Wright A. Safety assessment of
food-contact paper and board using a battery of short-term toxicity tests:
European union BIOSAFEPAPER project. Food Additives and Contaminants
2005; 22(10): pp.1032-1041
10. Mittag N, Foerster S, Hoppe S, Simat TJ, Sehr A, Renz S, Vobach M, Kammann
U. Bioassay guided analysis of migrants from can coatings. Journal fuer
Verbraucherschutz und Lebensmittelsicherheit 2006; 1(4): pp.345-353
11. Coulier L, Muilwijk B, van Stee L, Rijk R, Peters R, Zondervan-van den Beuken E,
van Dongen WD. Analytical strategy to assess the safety of food contact
materials. Food Contact Polymers 2007 2007: pp.7/1-7/10
12. Veiga-Rial M, Sarria-Vidal M, de la Montana-Miguelez J, Simal-Gandara J.
Identification of residual constituents in plastic packaging for dairy products.
Recent Research Developments in Agricultural & Food Chemistry 1999; 3(Pt. 1):
pp.305-311
13. Skjevrak I, Brede C, Steffensen IL, Mikalsen A, Alexander J, Fjeldal P, Herikstad
H. Non-targeted multi-component analytical surveillance of plastic food contact
materials: Identification of substances not included in EU positive lists and their
risk assessment. Food Additives and Contaminants 2005; 22(10): pp.1012-1022
14. Elss S, Gruenewald L, Richling E, Schreier P. Occurrence of 2-ethylhexanoic acid
in foods packed in glass jars. Food Additives and Contaminants 2004; 21(8):
pp.811-814
15. White AC, Mueller RA, Gallavan RH, Aaron S, Wilson AGE. A multiple in silico
program approach for the prediction of mutagenicity from chemical structure.
Mutation Research, Genetic Toxicology and Environmental Mutagenesis 2003;
539(1-2): pp.77-89
16. Judson PN, Marchant CA, Vessey JD. Using Argumentation for Absolute
Reasoning about the Potential Toxicity of Chemicals. Journal of Chemical
Information and Computer Sciences 2003; 43(5): pp.1364-1370
Chapter II 52
17. Hulzebos E, Sijm D, Traas T, Posthumus R, Maslankiewicz L. Validity and
validation of expert (Q)SAR systems. SAR QSAR Environ Res 2005; 16(4):
pp.385-401
18. Stein SE. An integrated method for spectrum extraction and compound
identification from gas chromatography/mass spectrometry data. Journal of the
American Society for Mass Spectrometry 1999; 10(8): pp.770-781
19. Zhang W, Wu P, Li C. Study of automated mass spectral deconvolution and
identification system (AMDIS) in pesticide residue analysis. Rapid
Communications in Mass Spectrometry 2006; 20(10): pp.1563-1568
20. Dagan S. Comparison of gas chromatography-pulsed flame photometric
detection-mass spectrometry, automated mass spectral deconvolution and
identification system and gas chromatography-tandem mass spectrometry as
tools for trace level detection and identification. Journal of Chromatography, A
2000; 868(2): pp.229-247
21. Kovats E. Gas chromatographic characterization of organic compounds. I.
Retention indexes of aliphatic halides, alcohols, aldehydes, and ketones.
Helvetica Chimica Acta 1958; 41: pp.1915-1932
22. AMDIS download page. Available at http://chemdata.nist.gov/mass-spc/amdis/.
Accessed 03 May 2008
23. NIST/EPA/NIH Mass Spectral Library. Available at http://www.nist.gov/
srd/nist1a.htm. Accessed 03 May 2008
24. DEREK for WindowsTM . Available at http://www.lhasalimited.org/
index.php?cat=2&sub_cat=64. Accessed 03 May 2008
25. SciFinder® scholar . Available at http://www.cas.org/SCIFINDER/
SCHOLAR/index.html. Accessed 03 May 2008
26. Bradley EL, Read WA, Castle L. Investigation into the migration potential of
coating materials from cookware products. Food Additives and Contaminants
2007; 24(3): pp.326-335
27. Curvall M, Enzell CR, Pettersson B. An evaluation of the utility of four in vitro
short term tests for predicting the cytotoxicity of individual compounds derived
from tobacco smoke. Cell Biology and Toxicology 1984; 1(1): pp.173-193
Chapter II 53
28. Gomez E, Pillon A, Fenet H, Rosain D, Duchesne MJ, Nicolas JC, Balaguer P,
Casellas C. Estrogenic activity of cosmetic components in reporter cell lines:
parabens, UV screens, and musks. Journal of Toxicology and Environmental
Health, Part A 2005; 68(4): pp.239-251
29. Severin I, Jondeau A, Dahbi L, Chagnon MC. 2,4-Diaminotoluene (2,4-DAT)-
induced DNA damage, DNA repair and micronucleus formation in the human
hepatoma cell line HepG2. Toxicology 2005; 213(1-2): pp.138-146
30. Kleinsasser NH, Wallner BC, Kastenbauer ER, Weissacher H, Harreus UA.
Genotoxicity of di-butyl-phthalate and di-iso-butyl-phthalate in human
lymphocytes and mucosal cells. Teratogenesis, Carcinogenesis, and
Mutagenesis 2001; 21(3): pp.189-196
31. National Toxicology Program. Comparative toxicology studies of corn oil,
safflower oil, and tricaprylin (CAS Nos.8001-30-7, 8001-23-8, and 538-23-8) in
male F344/N rats as vehicles for gavage. Technical Report Series No. 426
(Research Triangle Park, NC). Available at
http://ntp.niehs.nih.gov/?objectid=0709D0C9-A575-BA2F-3069EBD44EA674E2.
Accessed 13 November 2007
32. Carcinogenic Potency Database. Carcinogenic Potency Database of the
University of Berkley, California, USA. Available at
http://potency.berkeley.edu/chempages/TRICAPRYLIN.html and
http://potency.berkeley.edu/chempages/NAPHTHALENE.html. Accessed 13
November 2007
33. Office of Environmental Health Hazard Assessment of the State of California
USA. Proposition 65 list. Available at http://www.oehha.ca.gov/prop65. Accessed
13 November 2007
34. Peng CT, Yang ZC, Ding SF. Prediction of retention indexes. II. Structure-
retention index relationship on polar columns. Journal of Chromatography 1991;
586(1): pp.85-112
Chapter II 54
35. Chen JT, Mossoba MM, Varner SL, Roach JAG, Sphon JA, Page SW. GC/matrix
isolation/FTIR studies of decomposition products of Irganox 1010 in an aqueous
ethanol system. Proceedings of SPIE - The International Society for Optical
Engineering 1989; 1145(Int. Conf. Fourier Transform Spectrosc., 7th): pp.600-
601
36. Solina M, Johnson RL, Whitfield FB. Effects of glucose and acid-hydrolysed
vegetable protein on the volatile components of extruded wheat starch. Food
Chemistry 2006; 100(2): pp.678-692
37. Tateo F, Bononi M. Identification of organic contaminants in disposable
aluminium foil containers. Food Additives and Contaminants 2006; 23(10):
pp.1030-1037
Chapter III 55
III. 2-Isopropylthioxanthone (2-ITX) in food and food packaging materials on the German market
T. ROTHENBACHER, M. BAUMANN & D. FÜGEL‡
Chemisches und Veterinäruntersuchungsamt Stuttgart,
Schaflandstr. 3/2, D-70736 Fellbach, Germany
III.1. Abstract
To elucidate the occurrence of the photo-initiator 2-isopropylthioxanthone
(2-ITX), more than 100 food products on the German market, packed in cartons,
plastic cups and foils, were investigated. For this, a rapid method to detect 2-ITX in
food packaging materials was established. In case of positive findings the
accompanying foodstuffs were analysed in a subsequent step using different
extraction methods, depending on the fat content of the food. Determination of the
photo-initiator was done by high performance liquid chromatography with diode array
and fluorescence detection (HPLC-DAD/FLD). The recoveries ranged between 94
and 106% for non-fatty (RSD ≤ 1.1) and between 80 and 105% for fatty foods
(RSD ≤ 8.5). The limit of detection and the limit of quantification were determined to 2
and 5 µg L-1. 2-ITX was detected in 36 out of 137 packages (26%) and significant
migration occurred in 75% of the packaging materials tested positive. The amounts of
2-ITX ranged up to 357 µg kg-1 in orange juice.
III.2. Introduction
In September 2005 the Italian authorities informed the European Commission
by a notification transmitted through the Rapid Alert System for Food and Feed
‡ To whom correspondence should be addressed. e-mail: [email protected]
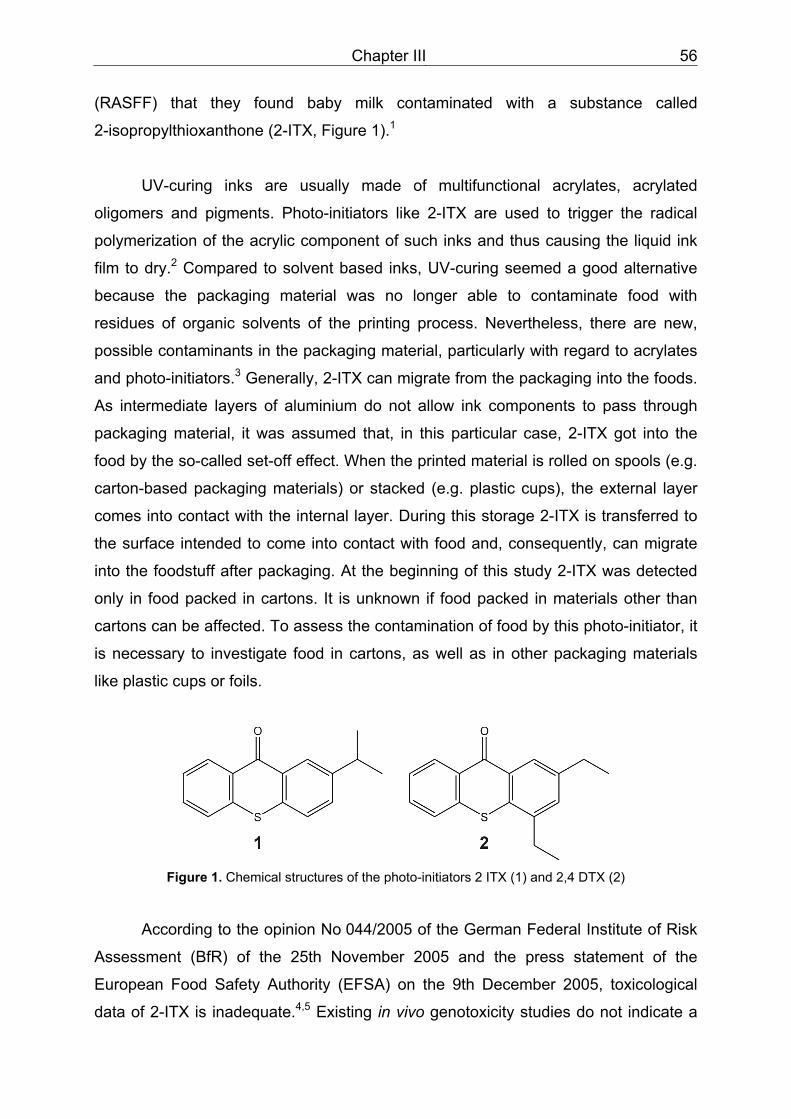
Chapter III 56
(RASFF) that they found baby milk contaminated with a substance called
2-isopropylthioxanthone (2-ITX, Figure 1).1
UV-curing inks are usually made of multifunctional acrylates, acrylated
oligomers and pigments. Photo-initiators like 2-ITX are used to trigger the radical
polymerization of the acrylic component of such inks and thus causing the liquid ink
film to dry.2 Compared to solvent based inks, UV-curing seemed a good alternative
because the packaging material was no longer able to contaminate food with
residues of organic solvents of the printing process. Nevertheless, there are new,
possible contaminants in the packaging material, particularly with regard to acrylates
and photo-initiators.3 Generally, 2-ITX can migrate from the packaging into the foods.
As intermediate layers of aluminium do not allow ink components to pass through
packaging material, it was assumed that, in this particular case, 2-ITX got into the
food by the so-called set-off effect. When the printed material is rolled on spools (e.g.
carton-based packaging materials) or stacked (e.g. plastic cups), the external layer
comes into contact with the internal layer. During this storage 2-ITX is transferred to
the surface intended to come into contact with food and, consequently, can migrate
into the foodstuff after packaging. At the beginning of this study 2-ITX was detected
only in food packed in cartons. It is unknown if food packed in materials other than
cartons can be affected. To assess the contamination of food by this photo-initiator, it
is necessary to investigate food in cartons, as well as in other packaging materials
like plastic cups or foils.
Figure 1. Chemical structures of the photo-initiators 2 ITX (1) and 2,4 DTX (2)
According to the opinion No 044/2005 of the German Federal Institute of Risk
Assessment (BfR) of the 25th November 2005 and the press statement of the
European Food Safety Authority (EFSA) on the 9th December 2005, toxicological
data of 2-ITX is inadequate.4,5 Existing in vivo genotoxicity studies do not indicate a
Chapter III 57
genotoxic potential for 2-ITX and, at a maximum migration level of 50 µg kg-1 food,
2-ITX appears unlikely to pose a health risk.4,5
Inks applied to the outer surface of food packaging materials are not covered
by specific European legislation. One exception is Commission Directive 93/10/EEC
According to this directive, the printed surfaces of regenerated cellulose film must not
come into contact with the foodstuffs.6 However, the only actual European legislation
concerning 2-ITX in food and packaging materials, other than regenerated cellulose
film, are the Framework Regulation (EC) No 1935/2004, Regulation (EEC) No 315/93
and the Regulation (EC) No 178/2002.7-9 Pursuant to article 3 of Regulation (EC)
No. 1935/2004, materials and articles intended to come into contact with food shall
not transfer their constituents in food in quantities which could endanger human
health or bring about unacceptable changes in composition or characteristics of
foodstuffs. Following article 14 of Regulation (EC) No 178/2002, the food itself must
not be placed on the market if it is injurious to health or unfit for human consumption,
whether by extraneous matter or otherwise.
Another document concerning printing inks is the Resolution ResAP(2005)2
on packaging inks applied to the non-food contact surface of food-packaging
materials and articles intended to come into contact with foodstuffs of the Council of
Europe.10 This resolution is not a legal norm, but it is assumed that the general
requirements of article 3 of Regulation (EC) No. 1935/2004 for food contact materials
are fulfilled if the packaging inks are in accordance with the requirements made.
Manufacturers of food packaging materials are responsible for ensuring that
their products comply with the abovementioned regulations and that, from a
technological viewpoint, they are suitable for the use for which they are intended.
Therefore, the European Printing Ink Association (EuPIA) defined a guideline on
printing inks.11 According to this guideline, if only insufficient toxicological data are
available, a substance is acceptable if its specific migration does not exceed
10 µg kg-1. If three negative mutagenicity tests as requested by the EFSA-Guidelines
are available, as in the case of 2-ITX, the specific migration limit is raised to
50 µg kg-1.To assess the migration of 2-ITX into food, several methods have been
developed. With respect to UV-curing inks and the determination of major acrylates
Chapter III 58
and widely used photo-initiators migrating into simulating solvents, gas
chromatography coupled to a mass selective detector (GC-MS) was applied
successfully with a recovery rate of 70-100%, depending on the simulant used.3 In
milk, yoghurt and fat 2-ITX was determined using accelerated solvent extraction and
high performance thin layer chromatography (HPTLC)– fluorescence detection.
Confirmation of the results was done by HPTLC-mass spectrometry.12 The
recoveries of this method ranged between 6-70%, corrected by internal standard up
to 70-130%, with a limit of detection of 1 μg kg-1 in butter. A method to determine 2-
ITX in fruit juices using pressurized liquid extraction and high performance liquid
chromatography (HPLC) coupled to a single quadrupole, ion trap, or triple
quadrupole MS detection systems gave recoveries of ~70% and detection limits up to
0.05 μg L-1.13
Here, a fast and reliable method to determine 2-ITX in food and food contact
materials, to enable an effective, routine surveillance of commodities on the German
market, is described. Due to the UV-activity of photo-initiators it is possible to
determine these compounds via their characteristic UV-spectra and fluorescence
activity. Therefore, a method based on HPLC coupled to a diode array (DAD) and a
fluorescence detector (FLD) for the quantitation of 2-ITX and other photo-initiators
(Figure 1) was developed. Following a stepwise procedure, identification was done
initially in food contact materials (multilayer cartons, plastic cups, and foil) and in
case of positive findings, analysis was carried out on the wrapped foodstuffs.
III.3. Experimental
Chemicals HPLC grade acetonitrile was purchased from Mallinckrodt Chemicals
(Griesheim, Germany) and hexafluoro-2-propanol from Sigma-Aldrich (Taufkirchen,
Germany). All further solvents were of gradient grade or distilled prior to use. Distilled
water was produced by a Milli-Q water purification system (Millipore, Schwalbach,
Germany). The sorbent used for the cleanup Bondesil-PSA (40 µm) came from
Varian (Darmstadt, Germany). Analytical standard of 2-isopropylthioxanthone (2-ITX,
purity 98%) was provided by IGM Resins (Krefeld, Germany) and
Chapter III 59
2,4-diethylthioxanthone (2,4-DTX, Figure 1) as internal standard (purity 98%) by
Sigma-Aldrich (Taufkirchen, Germany). All further chemicals were at least analytical
quality.
For preparation of 0.1 M citrate phosphate buffer (pH 6.0) 21 g citric acid
monohydrate and 14.2 g disodium hydrogen phosphate are dissolved in
approximately 900 mL water. After adjusting to pH 6.0 with sodium hydroxide, the
solution is diluted up to 1000 ml with water. Solutions of 2-ITX and 2,4-DTX were
prepared in acetonitrile and stored at 4°C in the dark.
Samples A total of 137 samples of fatty and non-fatty food were collected randomly
from October 2005 until April 2006 on the German retail market or partly direct from
the food manufacturer. Following a stepwise procedure, the food contact materials
were tested for 2-ITX initially while storing the homogenized fillings at -18 °C for
further analysis.
Sample preparation Food contact material. After separation of the food contact material from the
filling approximately 4 cm2 of the printed packaging material were cut into small
pieces and extracted with 1 mL hexafluoro-2-propanol (EU DG XII Research
Programm AIR 941025 (1994-1997) 1997) in an ultrasonic bath for 45 min. Then
4 mL ethanol were added and the mixture shaken intensively for 1 min. The
precipitate is removed by filtration prior to HPLC analysis.
If 2,4-DTX was found originally in food packaging materials, no internal
standard was added during the sample preparation (as described below) and both
photo-initiators were determined by external standard calculation.
Non-fatty foods (e.g. juices, tomato puree). Sample preparation for non-fatty
foods was based on the QuEChERS-method.14 To 10 g of the homogenized sample
material 10 mL acetonitrile are added. Extraction was done by shaking intensively for
1 min. Then 4 g magnesium sulphate and 1 g sodium chloride were added and the
mixture was shaken intensively for 1 min. After addition of the internal standard and
Chapter III 60
gently shaking for 30 s, the mixture was centrifuged for 5 min at 3000 rpm. An 8 mL
aliquot of the supernatant was mixed with 1.2 g anhydrous magnesium sulphate and
200 mg PSA. After shaking intensively for 30 s, the mixture was centrifuged for 1 min
at 5300 rpm. The supernatant was directly subjected to HPLC analysis.
Fatty foods (e.g. yogurt, milk, sausage). To approximately 5 g of homogenized
fatty food 5 mL 0.1 M buffer solution (pH 6.0) was added and the sample was
extracted by shaking intensively for 1 min. After addition of the internal standard and
30 mL acetonitrile, the mixture was shaken for 10 min and quantitatively filtered
through filter paper. Flask and filter paper were rinsed with 10 mL acetonitrile/water
(3/1 v/v). After addition of 1.5 g sodium chloride and intensively shaking for 30 s, the
filtrate was mixed with 20 mL tert.-butyl methyl ether/isohexane (80/20, v/v) before
shaking gently again. The lower aqueous phase was discarded. The organic layer
was washed two times with 20 mL water. After addition of 10 mL tert.-butyl methyl
ether/isohexane (50/50 v/v) and, if necessary, separation of the aqueous phase, the
organic layer was dried over anhydrous sodium sulphate. The solution was
evaporated to dryness under vacuum. Finally, the residue was dissolved in 1 mL
acetonitrile and directly subjected to HPLC analysis.
High performance liquid chromatography with diode array and fluorescence detection (HPLC-DAD/FLD)
Analysis was performed on a Agilent 1100 high performance liquid
chromatograph (Agilent, Waldbronn, Germany) equipped with a LC-PAH Supelcosil
(250 mm; 4.6 mm ID; 5 µm) column (Sigma-Aldrich, Taufkirchen, Germany) coupled
to a diode array (260 nm; spectra recorded from 200 up to 500 nm) and a
fluorescence detector (excitation 272 nm/emission 440 nm) connected in series. The
system was run at 40 °C (stop time 10 min) in isocratic mode (dist. water/acetonitrile
15/85 v/v) with a flow rate of 1 mL min-1 and an injection volume set to 10 µL.
Limit of detection and quantitation (2-ITX), as well as the linearity range (2-ITX
and 2,4-DTX), were determined by HPLC-FLD analysis of solutions of the photo-
initiators in acetonitrile in the absence of matrix interferences according to DIN
standard 32645 (DIN 1994).
Chapter III 61
Spiking procedure Spiking of homogenized blank samples was performed by adding 2-ITX
standard solution directly into the matrix. The spiked matrices were shaken briefly
and left to stand 2 min before extraction to enable dispersion of the photo-initiator.
For non fatty foods, recovery tests were conducted on blank homogenized orange
and vegetable juice by spiking (five times each matrix and level) with 0.05 and
0.5 mg kg-1. For fatty foods, blank homogenized milk and oil was spiked (six times
each matrix and level) with 0.1 mg kg-1 of 2-ITX (Table 1).
III.4. Results and discussion
Validation of the method Limits of detection and quantitation. The method for the determination of 2-ITX
with HPLC-DAD/FLD (Figure 2) in acetonitrile was linear in the range 6-120 µg L-1
(Mandel test of linearity) for the FLD-signal, with a correlation coefficient of 0.9995.
Due similarities in molecular structure and chemical properties 2,4-DTX was used as
internal standard (linearity 5 up to 100 µg L-1). According to DIN standard 32645, the
limit of detection and quantification by fluorescence detection were determined to 2
and 5 µg L-1 2-ITX in acetonitrile, respectively.15 Confirmation of 2-ITX by its UV-
spectrum could be achieved above 12 µg l-1. The results of the samples analysed
were only accepted, if the presence of the photo-initiator was approved by its
characteristic UV spectrum (Figure 2).
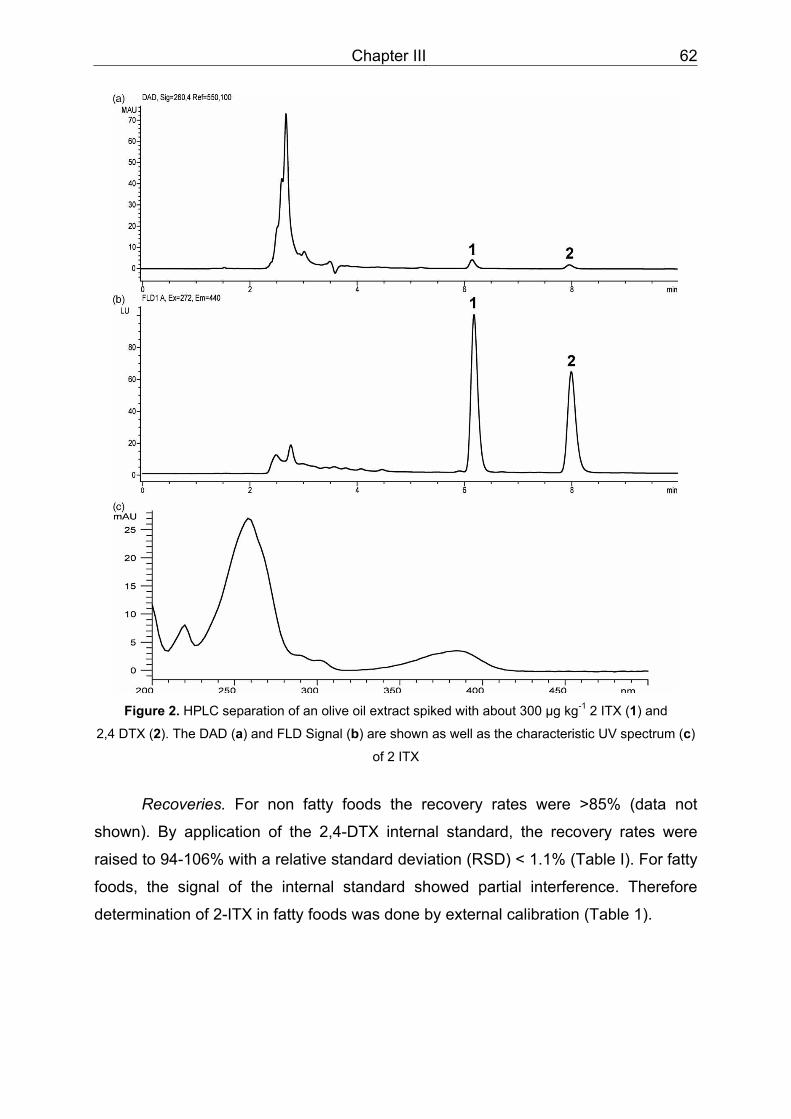
Chapter III 62
Figure 2. HPLC separation of an olive oil extract spiked with about 300 µg kg-1 2 ITX (1) and
2,4 DTX (2). The DAD (a) and FLD Signal (b) are shown as well as the characteristic UV spectrum (c)
of 2 ITX
Recoveries. For non fatty foods the recovery rates were >85% (data not
shown). By application of the 2,4-DTX internal standard, the recovery rates were
raised to 94-106% with a relative standard deviation (RSD) < 1.1% (Table I). For fatty
foods, the signal of the internal standard showed partial interference. Therefore
determination of 2-ITX in fatty foods was done by external calibration (Table 1).
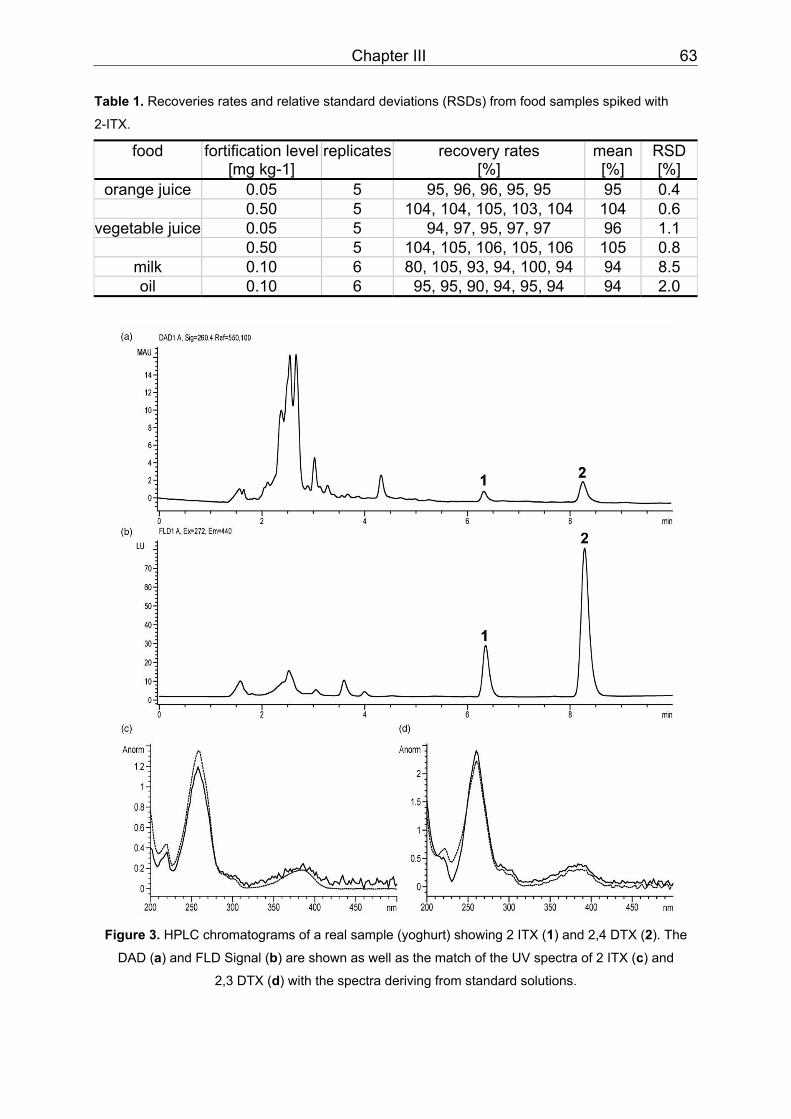
Chapter III 63
Table 1. Recoveries rates and relative standard deviations (RSDs) from food samples spiked with
2-ITX.
food fortification level [mg kg-1]
replicates recovery rates [%]
mean [%]
RSD[%]
orange juice 0.05 5 95, 96, 96, 95, 95 95 0.4 0.50 5 104, 104, 105, 103, 104 104 0.6
vegetable juice 0.05 5 94, 97, 95, 97, 97 96 1.1 0.50 5 104, 105, 106, 105, 106 105 0.8
milk 0.10 6 80, 105, 93, 94, 100, 94 94 8.5 oil 0.10 6 95, 95, 90, 94, 95, 94 94 2.0
Figure 3. HPLC chromatograms of a real sample (yoghurt) showing 2 ITX (1) and 2,4 DTX (2). The
DAD (a) and FLD Signal (b) are shown as well as the match of the UV spectra of 2 ITX (c) and
2,3 DTX (d) with the spectra deriving from standard solutions.
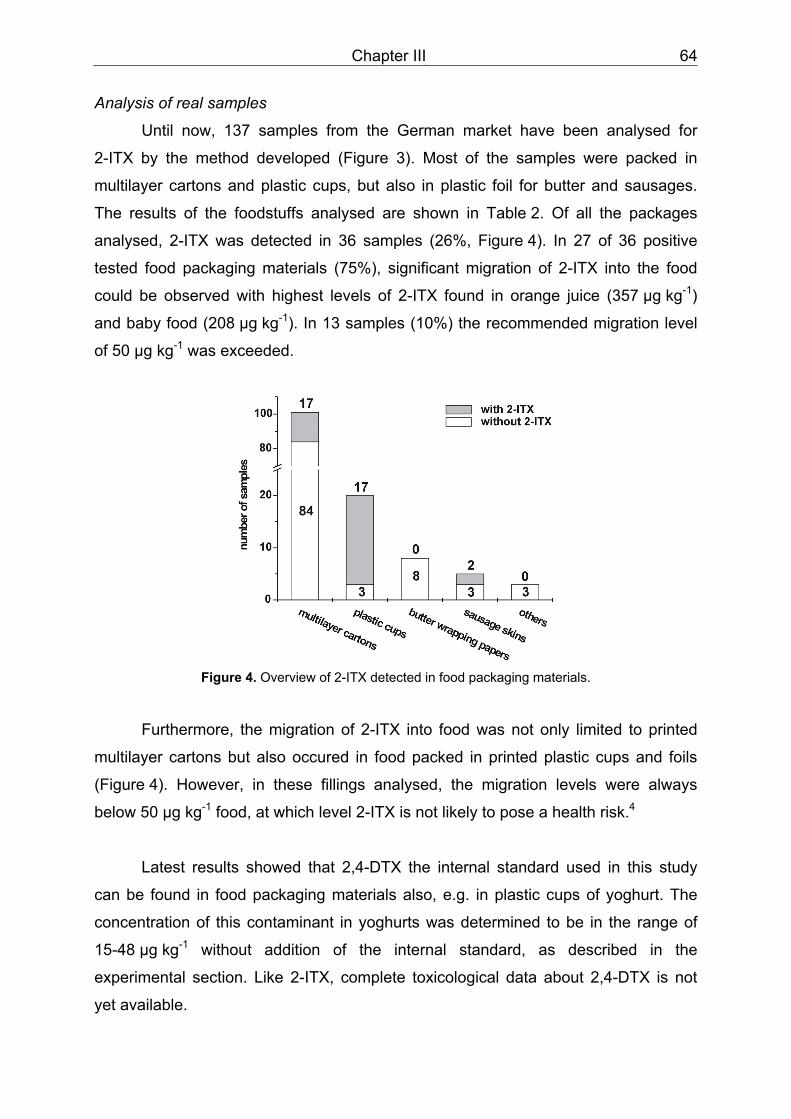
Chapter III 64
Analysis of real samples
Until now, 137 samples from the German market have been analysed for
2-ITX by the method developed (Figure 3). Most of the samples were packed in
multilayer cartons and plastic cups, but also in plastic foil for butter and sausages.
The results of the foodstuffs analysed are shown in Table 2. Of all the packages
analysed, 2-ITX was detected in 36 samples (26%, Figure 4). In 27 of 36 positive
tested food packaging materials (75%), significant migration of 2-ITX into the food
could be observed with highest levels of 2-ITX found in orange juice (357 µg kg-1)
and baby food (208 µg kg-1). In 13 samples (10%) the recommended migration level
of 50 µg kg-1 was exceeded.
Figure 4. Overview of 2-ITX detected in food packaging materials.
Furthermore, the migration of 2-ITX into food was not only limited to printed
multilayer cartons but also occured in food packed in printed plastic cups and foils
(Figure 4). However, in these fillings analysed, the migration levels were always
below 50 µg kg-1 food, at which level 2-ITX is not likely to pose a health risk.4
Latest results showed that 2,4-DTX the internal standard used in this study
can be found in food packaging materials also, e.g. in plastic cups of yoghurt. The
concentration of this contaminant in yoghurts was determined to be in the range of
15-48 µg kg-1 without addition of the internal standard, as described in the
experimental section. Like 2-ITX, complete toxicological data about 2,4-DTX is not
yet available.
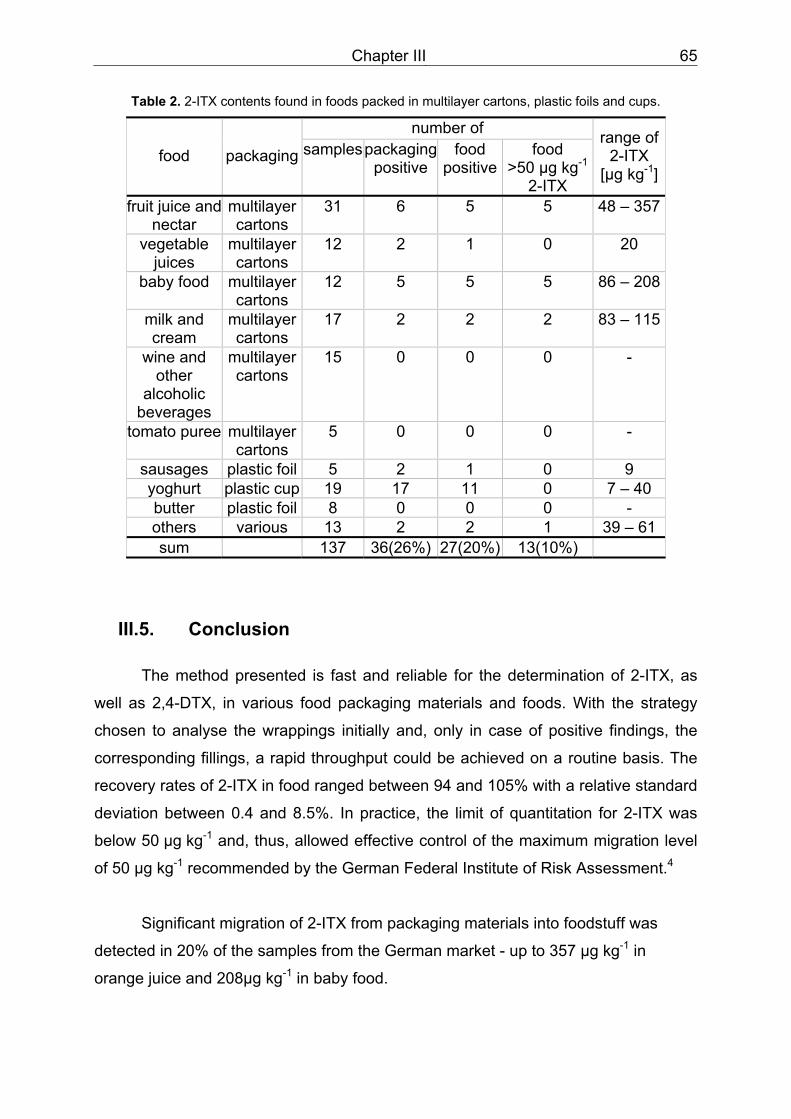
Chapter III 65
Table 2. 2-ITX contents found in foods packed in multilayer cartons, plastic foils and cups.
number of
food packaging samplespackaging positive
food positive
food >50 µg kg-1
2-ITX
range of 2-ITX
[µg kg-1]
fruit juice and nectar
multilayer cartons
31 6 5 5 48 – 357
vegetable juices
multilayer cartons
12 2 1 0 20
baby food multilayer cartons
12 5 5 5 86 – 208
milk and cream
multilayer cartons
17 2 2 2 83 – 115
wine and other
alcoholic beverages
multilayer cartons
15 0 0 0 -
tomato puree multilayer cartons
5 0 0 0 -
sausages plastic foil 5 2 1 0 9 yoghurt plastic cup 19 17 11 0 7 – 40 butter plastic foil 8 0 0 0 - others various 13 2 2 1 39 – 61 sum 137 36(26%) 27(20%) 13(10%)
III.5. Conclusion
The method presented is fast and reliable for the determination of 2-ITX, as
well as 2,4-DTX, in various food packaging materials and foods. With the strategy
chosen to analyse the wrappings initially and, only in case of positive findings, the
corresponding fillings, a rapid throughput could be achieved on a routine basis. The
recovery rates of 2-ITX in food ranged between 94 and 105% with a relative standard
deviation between 0.4 and 8.5%. In practice, the limit of quantitation for 2-ITX was
below 50 µg kg-1 and, thus, allowed effective control of the maximum migration level
of 50 µg kg-1 recommended by the German Federal Institute of Risk Assessment.4
Significant migration of 2-ITX from packaging materials into foodstuff was
detected in 20% of the samples from the German market - up to 357 µg kg-1 in
orange juice and 208µg kg-1 in baby food.
Chapter III 66
The occurrence of 2-ITX and 2,4-DTX in various food packaging materials, not
limited to multilayer cartons, should direct the industry to utilize other, less-migrating
photo-initiators. Moreover, the implementation of legislative standards for good
manufacturing practice, with a positive list for printing inks and maximum migration
limits, especially for substances with incomplete toxicological assessment, is
essential.
III.6. Acknowledgement
We wish to thank Ms Pechstein, Ms Drewnik and Ms Moser for the skilful
technical assistance, Mr. Dr. Weißhaar and Mr. Altkofer for valuable discussions and
IGM resins for providing 2-ITX.
III.7. References
1. European Commission. Rapid Alert System for Food and Feed (RASFF):
Isopropyl thioxanthone in milk for babies from Spain, Alert notification 2005.631,
2005 Sep t8. Available at http://ec.europa.eu/ food/food/rapidalert/ reports/week37-
2005_en.pdf. Accessed 18 September 2006
2. European Food Safety Authority. Opinion of the Scientific Panel on Food
Additives, Flavourings, Processing Aids and Materials in Contact with Food on a
request from the Commission related to 2-Isopropyl thioxanthone (ITX) and 2-
ethylhexyl-4-dimethylaminobenzoate (EHDAB) in food contact materials .
Available at http://www.efsa.
europa.eu/EFSA/Scientific_Opinion/afc_op_ej293_itx_opinion_en1.pdf. Accessed
11 November 2008
3. Papilloud S, Baudraz D. Analysis of food packaging UV inks for chemicals with
potential to migrate into food simulants. Food Additives and Contaminants 2002;
19(2): pp.168-175
Chapter III 67
4. German Federal Institute of Risk Assessment. Constituents of printing inks in
beverages from cartons. Opinion No 044/2005 of the German federal institute of
risk assessment (BfR) on the 25th November 2005. Available at
http://www.bfr.bund.de/cm/230/constituents_of_printing_inks_in_beverages_from
_cartons.pdf. Accessed 18 November 2006
5. European Food Safety Authority. Opinion of the scientific panel on food additives,
flavourings, processing aids and materials in contact with food on a request from
the commission related to 2Isopropyl thioxanthone (ITX) and
2ethylhexyl4dimethylaminobenzoate (EHDAB) in food contact materials.
Available at http://www.efsa.europa.eu/etc/medialib/efsa/science/afc/afc_
opinions/1256.Par.0002.File.dat/afc_op_ej293_itx_opinion_en1.pdf. Accessed 16
November 2006
6. European Communities. Commission Directive 93/10/EEC, relating to materials
and articles made of regenerated cellulose film intended to come into contact with
foodstuffs. Official Journal of the European Union 1993; L 93: pp.27-36
7. European Communities. Regulation (EC) No 1935/2004 of the European
Parliament and of the Council of 27 October 2004 on materials and articles
intended to come into contact with food and repealing Directives 80/590/EEC and
89/109/EEC. Official Journal of the European Union 2004; L 336: pp.4-17
8. European Communities. Regulation (EEC) No 315/93 of 8 February 1993 laying
down Community procedures for contaminants in food. Official Journal of the
European Union 1993; L37: pp.1-3
9. European Communities. Regulation (EC) No 178/2002 of the European
Parliament and of the Council of 28 January 2002 laying down the general
principles and requirements of food law, establishing the European Food Safety
Authority and laying down procedures in matters of food safety. Official Journal of
the European Union 2002; 31: pp.1-24
10. Committee of Ministers of the Council of Europe. Resolution ResAP(2005)2 on
packaging inks applied to the non-food contact surface of food packaging
materials and articles intended to come into contact with foodstuffs. Available at
https://wcd.coe.int/ViewDoc.jsp?id=908523&Site=COE&BackColorInternet=DBD
CF2 &BackColorIntranet=FDC864&BackColorLogged=FDC864. Accessed 12
July 2009
Chapter III 68
11. European Printing Ink Assoc iation. Guideline on printing inks applied to the non-
food contact surface of food packaging materials and articles. Available at
http://www.eupia.org/doc/easnet.dll/GetDoc?APPL=2&DAT_IM=0205BB&TYPE=
PDF. Accessed 18 September 2006
12. Morlock G, Schwack W. Determination of isopropylthioxanthone (ITX) in milk,
yoghurt and fat by HPTLC-FLD, HPTLC-ESI/MS and HPTLC-DART/MS.
Anal.Bioanal.Chem. 2006; 385(3): pp.586-595
13. Sagratini G, Manes J, Giardina D, Pico Y. Determination of Isopropyl
Thioxanthone (ITX) in Fruit Juices by Pressurized Liquid Extraction and Liquid
Chromatography-Mass Spectrometry. Journal of Agricultural and Food Chemistry
2006; 54(20): pp.7947-7952
14. Anastassiades M, Lehotay SJ, Stajnbaher D, Schenck FJ. Fast and easy
multiresidue method employing acetonitrile extraction/partitioning and "dispersive
solid-phase extraction" for the determination of pesticide residues in produce.
J.AOAC Int. 2003; 86(2): pp.412-431
15. Deutsches Institut für Normung e.V. DIN standard 32645, Chemical analysis,
decision limit, detection limit and determination limit, estimation in case of
repeatability, terms, methods, evaluation., Beuth Verlag GmbH, Berlin, Germany.
Chapter IV 69
IV. Rapid identification of additives in gaskets for lids of polyvinyl chloride with direct analysis in real time ionisation and single quadrupole mass
spectrometry (DART−MS)
Thorsten Rothenbacher, Wolfgang Schwack
Institut für Lebensmittelchemie, Universität Hohenheim,
Garbenstrasse 28, 70599 Stuttgart, Germany,
Correspondence to: W. Schwack, e-mail: wschwack@uni-
hohenheim.de
IV.1. Abstract
Gaskets for lids of glass jars usually consist of polyvinyl chloride (PVC)
containing plasticisers and additional additives, which may migrate into packed
foodstuffs. Concerning legal regulations, migration has to be determined analytically,
which is a big challenge due to the huge chemical variety of additives in use.
Therefore, a rapid screening method by means of direct analysis in real time
ionisation and single quadrupole mass spectrometry (DART™−MS) was developed.
Introducing a plastisol sample into the DART™ interface, additives revealed
protonated molecules and ammonium adducts as the typical ionisation products, and
cleavages of ester bonds as typical fragmentation processes. Generally, additives
present in the range of 1% could directly and easily be identified if ion suppressive
effects deriving from specific molecules did not occur. These effects could be
avoided by measuring toluene extracts of plastisol samples, which also improved the
sensivity. Using this method, it was possible to identify phthalates, fatty acid amides,
tributyl O-acetylcitrate, dibutyl sebacate, bis(2-ethylhexyl) adipate, 1,2-diisononyl 1,2-
cyclohexanedicarboxylate, and even more complex additives like acetylated mono-
and diacylglycerides, epoxidized soybean oil, and polyadipates with a limit of
detection of ≤1% in PVC plastisols. Only in the case of epoxidized linseed oil were
Chapter IV 70
levels ≥ 5% required for identification. The detection of azodicarbonamide as foaming
agent within the manufacturing process was principally possible, but was not highly
reproducible due to very low concentrations in plastisols.
IV.2. Introduction
Gaskets of metal twist closures for glass jars usually are manufactured from
polyvinyl chloride (PVC) containing different additives, i.e., plasticisers, stabilisers,
and slipping and blowing agents,1 altogether also called a plastisol. The
concentration of plasticisers is mainly 15% or more.1,2 If packed foodstuff comes into
direct contact with plastisols, additives or their reaction/degradation products can
migrate into the foodstuff.3 Hence, in the recent years food packed in glass jars were
frequently found to be contaminated by additives, exceeding the limits of European
food law.2-11 Typically used additives are summarized in Table 1, divided into low and
high molecular weight compounds. Due to different physicochemical and chemical
properties, diverse analytical methods are required to analyse them. Commonly, the
low molecular weight additives are extracted from foodstuffs followed by clean-up
and concentration steps and analysed by gas chromatography with flame ionisation
(GC/FID) or mass spectrometric detection (GC/MS), or by high performance liquid
chromatography−mass spectrometry (LC/MS).12-14 Acetylated mono- and diglycerides
of fatty acids (AcPG) can be mixtures of different compounds or defined single
substances, like 2,3-diacetoxy-propyl 12-acetoxystearate (APAS), which is the
acetylated monoacylglyceride of hydrogenated ricinoleic acid, for example. According
to the literature, mixtures of AcPGs can only be determined in food by injector-
internal thermal desorption GC/MS, a method also suitable for other plasticisers,
whereas APAS can be isolated from food extracts by gel permeation chromatography
and determined by GC/MS.3,15 For the epoxidized vegetable oils ESBO and ELO,
extraction and direct determination by liquid chromatography/ electrospray
ionisation−tandem mass spectrometry (LC/ESI-MS/MS) was reported,16 whereas for
GC analysis a transesterification step is mandatory and, depending on the method,
an additional derivatisation reaction has to be used.17-20 Polyadipates (PADs) are
polyesters of 1,2-propanediol, 1,3- or 1,4-butanediol, or polypropyleneglycol with
adipic acid, also end-capped with acetic acid, fatty acids (C12-C18), n-octanol or n-
decanol.21 As these units are also used in different mixtures, PADs represent a very
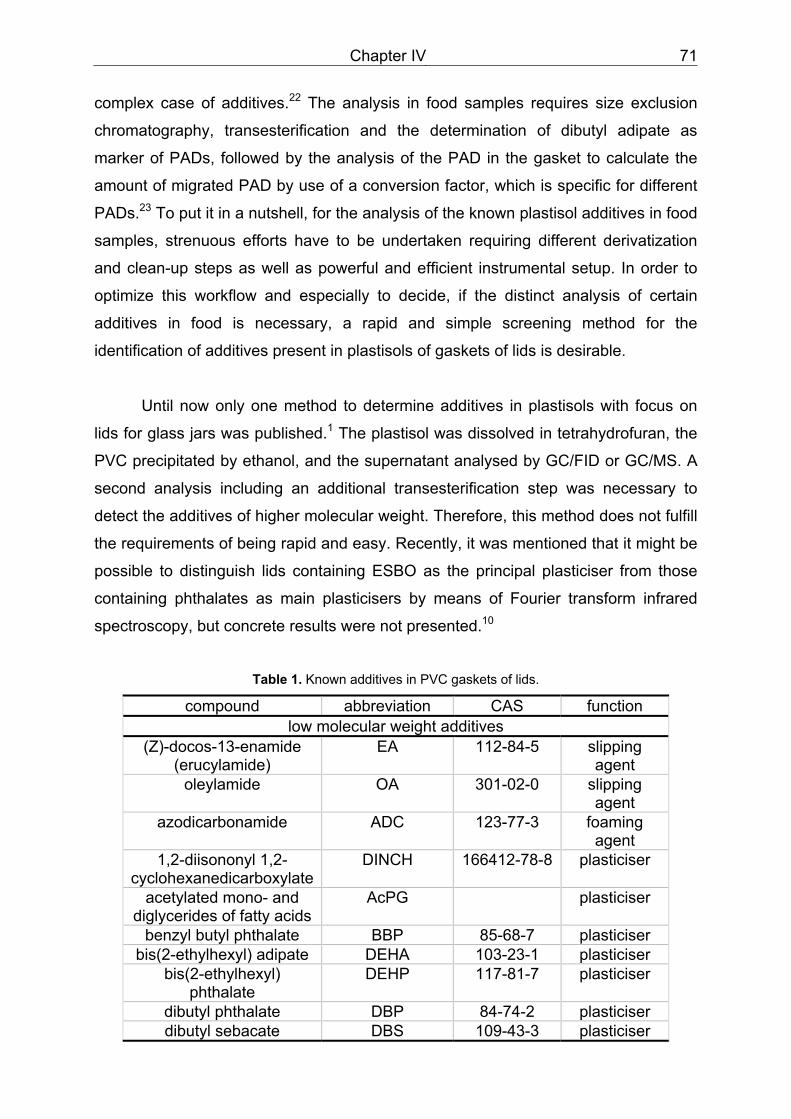
Chapter IV 71
complex case of additives.22 The analysis in food samples requires size exclusion
chromatography, transesterification and the determination of dibutyl adipate as
marker of PADs, followed by the analysis of the PAD in the gasket to calculate the
amount of migrated PAD by use of a conversion factor, which is specific for different
PADs.23 To put it in a nutshell, for the analysis of the known plastisol additives in food
samples, strenuous efforts have to be undertaken requiring different derivatization
and clean-up steps as well as powerful and efficient instrumental setup. In order to
optimize this workflow and especially to decide, if the distinct analysis of certain
additives in food is necessary, a rapid and simple screening method for the
identification of additives present in plastisols of gaskets of lids is desirable.
Until now only one method to determine additives in plastisols with focus on
lids for glass jars was published.1 The plastisol was dissolved in tetrahydrofuran, the
PVC precipitated by ethanol, and the supernatant analysed by GC/FID or GC/MS. A
second analysis including an additional transesterification step was necessary to
detect the additives of higher molecular weight. Therefore, this method does not fulfill
the requirements of being rapid and easy. Recently, it was mentioned that it might be
possible to distinguish lids containing ESBO as the principal plasticiser from those
containing phthalates as main plasticisers by means of Fourier transform infrared
spectroscopy, but concrete results were not presented.10
Table 1. Known additives in PVC gaskets of lids.
compound abbreviation CAS function low molecular weight additives
(Z)-docos-13-enamide (erucylamide)
EA 112-84-5 slipping agent
oleylamide OA 301-02-0 slipping agent
azodicarbonamide ADC 123-77-3 foaming agent
1,2-diisononyl 1,2-cyclohexanedicarboxylate
DINCH 166412-78-8 plasticiser
acetylated mono- and diglycerides of fatty acids
AcPG plasticiser
benzyl butyl phthalate BBP 85-68-7 plasticiser bis(2-ethylhexyl) adipate DEHA 103-23-1 plasticiser
bis(2-ethylhexyl) phthalate
DEHP 117-81-7 plasticiser
dibutyl phthalate DBP 84-74-2 plasticiser dibutyl sebacate DBS 109-43-3 plasticiser
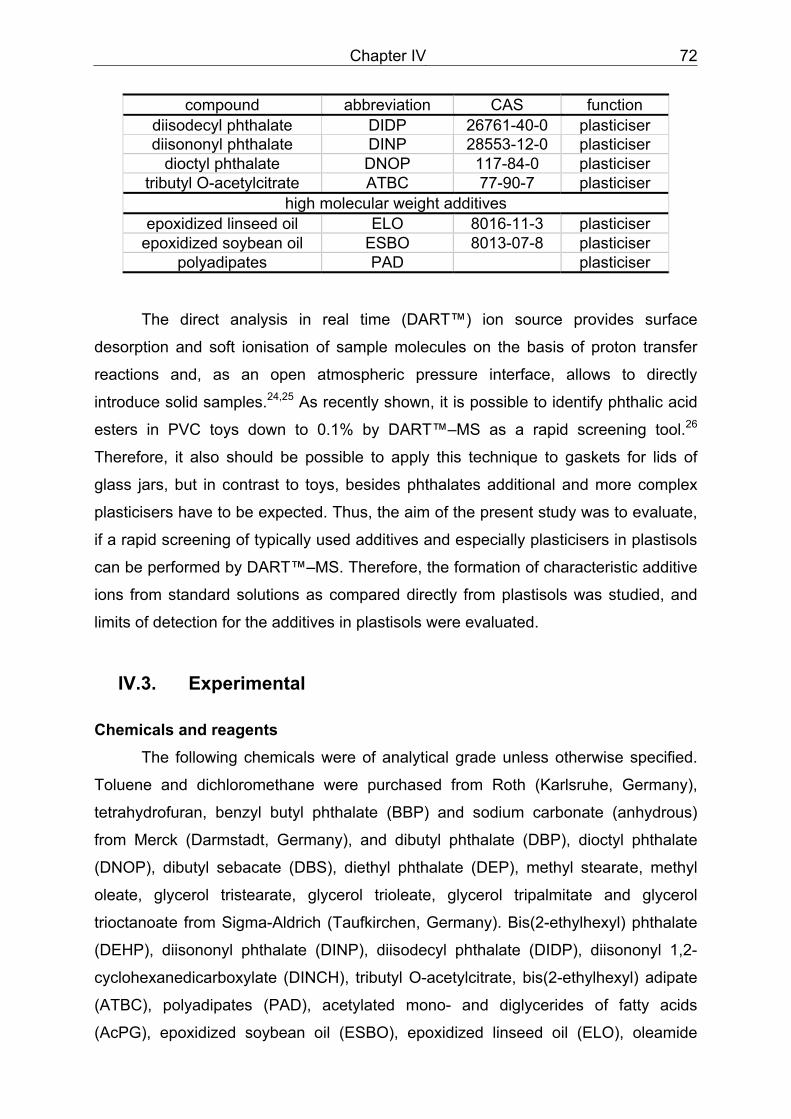
Chapter IV 72
compound abbreviation CAS function diisodecyl phthalate DIDP 26761-40-0 plasticiser diisononyl phthalate DINP 28553-12-0 plasticiser
dioctyl phthalate DNOP 117-84-0 plasticiser tributyl O-acetylcitrate ATBC 77-90-7 plasticiser
high molecular weight additives epoxidized linseed oil ELO 8016-11-3 plasticiser
epoxidized soybean oil ESBO 8013-07-8 plasticiser polyadipates PAD plasticiser
The direct analysis in real time (DART™) ion source provides surface
desorption and soft ionisation of sample molecules on the basis of proton transfer
reactions and, as an open atmospheric pressure interface, allows to directly
introduce solid samples.24,25 As recently shown, it is possible to identify phthalic acid
esters in PVC toys down to 0.1% by DART™–MS as a rapid screening tool.26
Therefore, it also should be possible to apply this technique to gaskets for lids of
glass jars, but in contrast to toys, besides phthalates additional and more complex
plasticisers have to be expected. Thus, the aim of the present study was to evaluate,
if a rapid screening of typically used additives and especially plasticisers in plastisols
can be performed by DART™–MS. Therefore, the formation of characteristic additive
ions from standard solutions as compared directly from plastisols was studied, and
limits of detection for the additives in plastisols were evaluated.
IV.3. Experimental
Chemicals and reagents The following chemicals were of analytical grade unless otherwise specified.
Toluene and dichloromethane were purchased from Roth (Karlsruhe, Germany),
tetrahydrofuran, benzyl butyl phthalate (BBP) and sodium carbonate (anhydrous)
from Merck (Darmstadt, Germany), and dibutyl phthalate (DBP), dioctyl phthalate
(DNOP), dibutyl sebacate (DBS), diethyl phthalate (DEP), methyl stearate, methyl
oleate, glycerol tristearate, glycerol trioleate, glycerol tripalmitate and glycerol
trioctanoate from Sigma-Aldrich (Taufkirchen, Germany). Bis(2-ethylhexyl) phthalate
(DEHP), diisononyl phthalate (DINP), diisodecyl phthalate (DIDP), diisononyl 1,2-
cyclohexanedicarboxylate (DINCH), tributyl O-acetylcitrate, bis(2-ethylhexyl) adipate
(ATBC), polyadipates (PAD), acetylated mono- and diglycerides of fatty acids
(AcPG), epoxidized soybean oil (ESBO), epoxidized linseed oil (ELO), oleamide
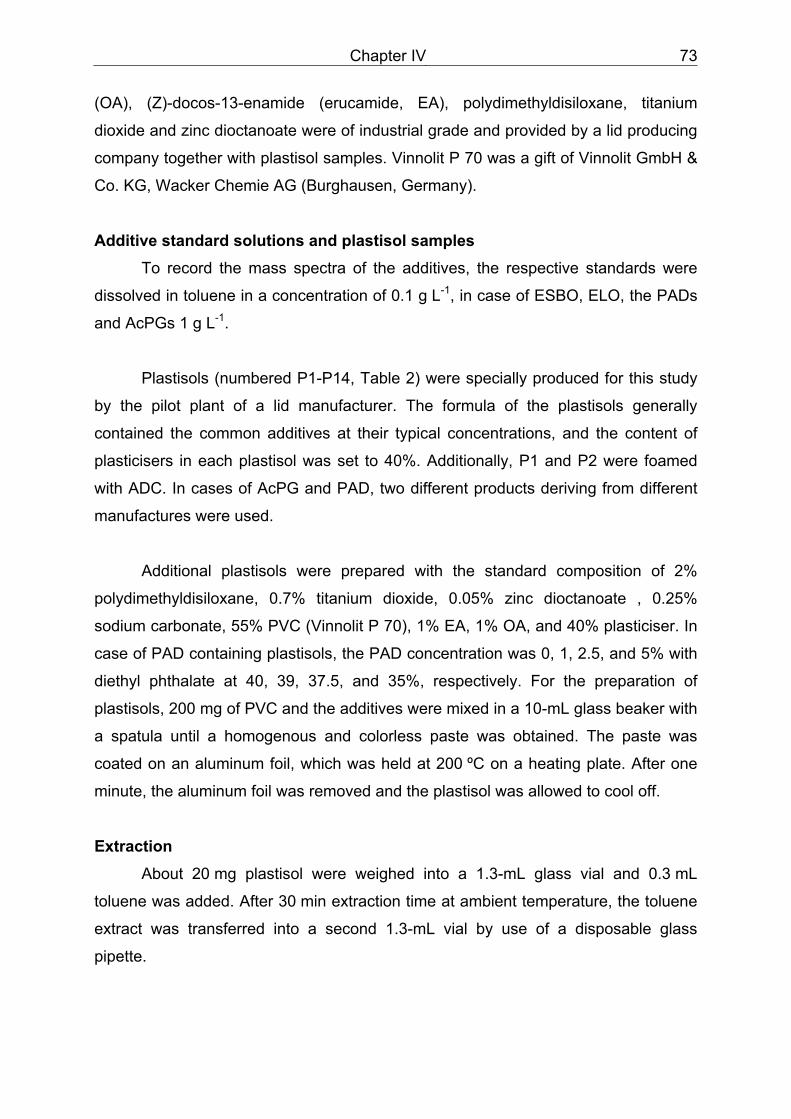
Chapter IV 73
(OA), (Z)-docos-13-enamide (erucamide, EA), polydimethyldisiloxane, titanium
dioxide and zinc dioctanoate were of industrial grade and provided by a lid producing
company together with plastisol samples. Vinnolit P 70 was a gift of Vinnolit GmbH &
Co. KG, Wacker Chemie AG (Burghausen, Germany).
Additive standard solutions and plastisol samples
To record the mass spectra of the additives, the respective standards were
dissolved in toluene in a concentration of 0.1 g L-1, in case of ESBO, ELO, the PADs
and AcPGs 1 g L-1.
Plastisols (numbered P1-P14, Table 2) were specially produced for this study
by the pilot plant of a lid manufacturer. The formula of the plastisols generally
contained the common additives at their typical concentrations, and the content of
plasticisers in each plastisol was set to 40%. Additionally, P1 and P2 were foamed
with ADC. In cases of AcPG and PAD, two different products deriving from different
manufactures were used.
Additional plastisols were prepared with the standard composition of 2%
polydimethyldisiloxane, 0.7% titanium dioxide, 0.05% zinc dioctanoate , 0.25%
sodium carbonate, 55% PVC (Vinnolit P 70), 1% EA, 1% OA, and 40% plasticiser. In
case of PAD containing plastisols, the PAD concentration was 0, 1, 2.5, and 5% with
diethyl phthalate at 40, 39, 37.5, and 35%, respectively. For the preparation of
plastisols, 200 mg of PVC and the additives were mixed in a 10-mL glass beaker with
a spatula until a homogenous and colorless paste was obtained. The paste was
coated on an aluminum foil, which was held at 200 ºC on a heating plate. After one
minute, the aluminum foil was removed and the plastisol was allowed to cool off.
Extraction About 20 mg plastisol were weighed into a 1.3-mL glass vial and 0.3 mL
toluene was added. After 30 min extraction time at ambient temperature, the toluene
extract was transferred into a second 1.3-mL vial by use of a disposable glass
pipette.
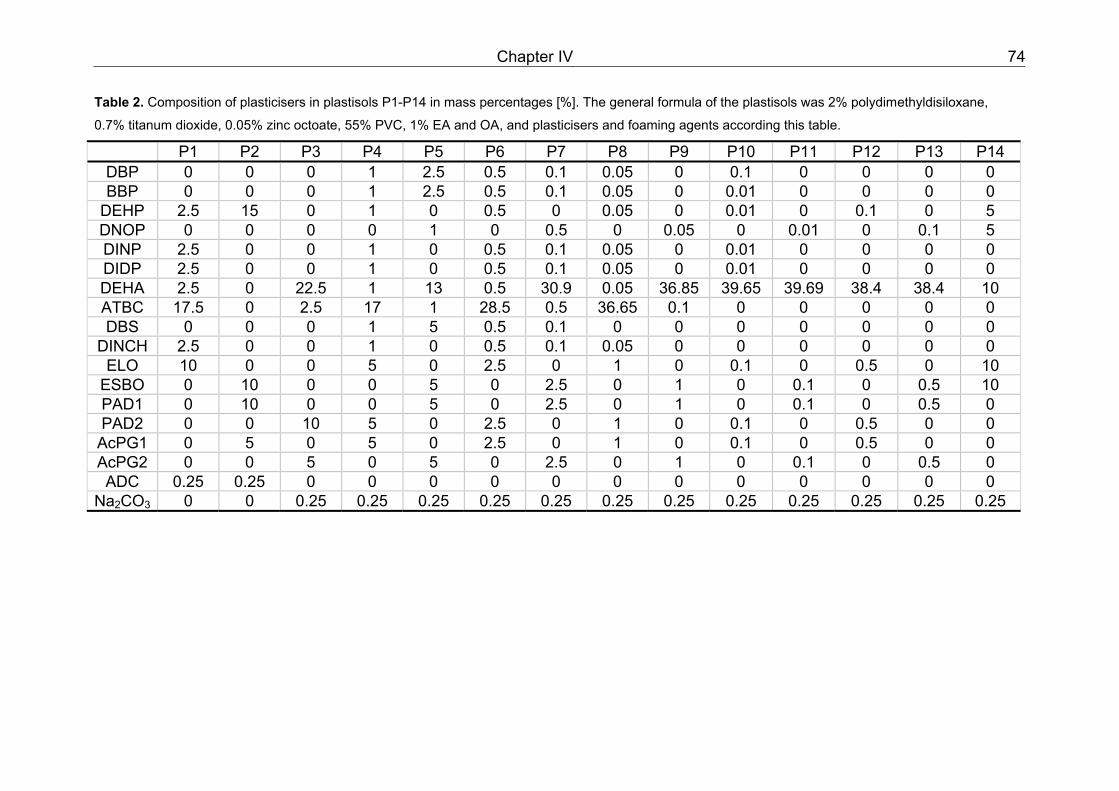
Chapter IV 74
Table 2. Composition of plasticisers in plastisols P1-P14 in mass percentages [%]. The general formula of the plastisols was 2% polydimethyldisiloxane,
0.7% titanum dioxide, 0.05% zinc octoate, 55% PVC, 1% EA and OA, and plasticisers and foaming agents according this table.
P1 P2 P3 P4 P5 P6 P7 P8 P9 P10 P11 P12 P13 P14 DBP 0 0 0 1 2.5 0.5 0.1 0.05 0 0.1 0 0 0 0 BBP 0 0 0 1 2.5 0.5 0.1 0.05 0 0.01 0 0 0 0
DEHP 2.5 15 0 1 0 0.5 0 0.05 0 0.01 0 0.1 0 5 DNOP 0 0 0 0 1 0 0.5 0 0.05 0 0.01 0 0.1 5 DINP 2.5 0 0 1 0 0.5 0.1 0.05 0 0.01 0 0 0 0 DIDP 2.5 0 0 1 0 0.5 0.1 0.05 0 0.01 0 0 0 0 DEHA 2.5 0 22.5 1 13 0.5 30.9 0.05 36.85 39.65 39.69 38.4 38.4 10 ATBC 17.5 0 2.5 17 1 28.5 0.5 36.65 0.1 0 0 0 0 0 DBS 0 0 0 1 5 0.5 0.1 0 0 0 0 0 0 0
DINCH 2.5 0 0 1 0 0.5 0.1 0.05 0 0 0 0 0 0 ELO 10 0 0 5 0 2.5 0 1 0 0.1 0 0.5 0 10
ESBO 0 10 0 0 5 0 2.5 0 1 0 0.1 0 0.5 10 PAD1 0 10 0 0 5 0 2.5 0 1 0 0.1 0 0.5 0 PAD2 0 0 10 5 0 2.5 0 1 0 0.1 0 0.5 0 0
AcPG1 0 5 0 5 0 2.5 0 1 0 0.1 0 0.5 0 0 AcPG2 0 0 5 0 5 0 2.5 0 1 0 0.1 0 0.5 0 ADC 0.25 0.25 0 0 0 0 0 0 0 0 0 0 0 0
Na2CO3 0 0 0.25 0.25 0.25 0.25 0.25 0.25 0.25 0.25 0.25 0.25 0.25 0.25
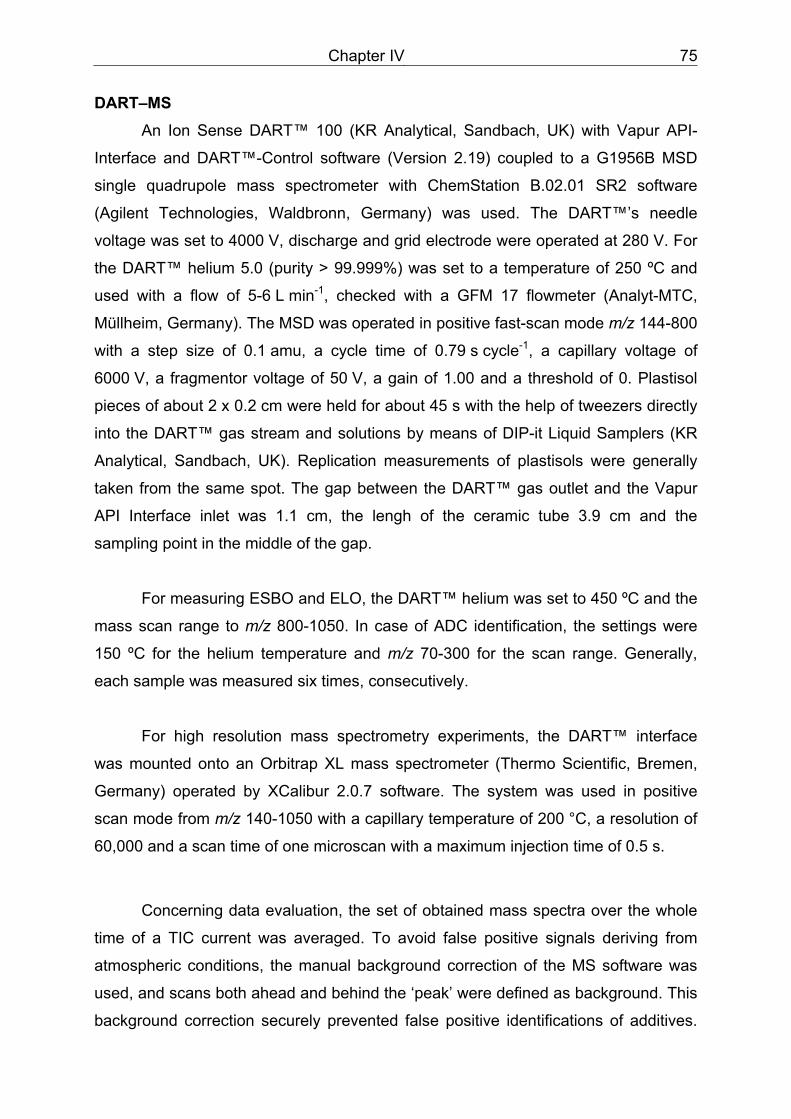
Chapter IV 75
DART–MS An Ion Sense DART™ 100 (KR Analytical, Sandbach, UK) with Vapur API-
Interface and DART™-Control software (Version 2.19) coupled to a G1956B MSD
single quadrupole mass spectrometer with ChemStation B.02.01 SR2 software
(Agilent Technologies, Waldbronn, Germany) was used. The DART™’s needle
voltage was set to 4000 V, discharge and grid electrode were operated at 280 V. For
the DART™ helium 5.0 (purity > 99.999%) was set to a temperature of 250 ºC and
used with a flow of 5-6 L min-1, checked with a GFM 17 flowmeter (Analyt-MTC,
Müllheim, Germany). The MSD was operated in positive fast-scan mode m/z 144-800
with a step size of 0.1 amu, a cycle time of 0.79 s cycle-1, a capillary voltage of
6000 V, a fragmentor voltage of 50 V, a gain of 1.00 and a threshold of 0. Plastisol
pieces of about 2 x 0.2 cm were held for about 45 s with the help of tweezers directly
into the DART™ gas stream and solutions by means of DIP-it Liquid Samplers (KR
Analytical, Sandbach, UK). Replication measurements of plastisols were generally
taken from the same spot. The gap between the DART™ gas outlet and the Vapur
API Interface inlet was 1.1 cm, the lengh of the ceramic tube 3.9 cm and the
sampling point in the middle of the gap.
For measuring ESBO and ELO, the DART™ helium was set to 450 ºC and the
mass scan range to m/z 800-1050. In case of ADC identification, the settings were
150 ºC for the helium temperature and m/z 70-300 for the scan range. Generally,
each sample was measured six times, consecutively.
For high resolution mass spectrometry experiments, the DART™ interface
was mounted onto an Orbitrap XL mass spectrometer (Thermo Scientific, Bremen,
Germany) operated by XCalibur 2.0.7 software. The system was used in positive
scan mode from m/z 140-1050 with a capillary temperature of 200 °C, a resolution of
60,000 and a scan time of one microscan with a maximum injection time of 0.5 s.
Concerning data evaluation, the set of obtained mass spectra over the whole
time of a TIC current was averaged. To avoid false positive signals deriving from
atmospheric conditions, the manual background correction of the MS software was
used, and scans both ahead and behind the ‘peak’ were defined as background. This
background correction securely prevented false positive identifications of additives.
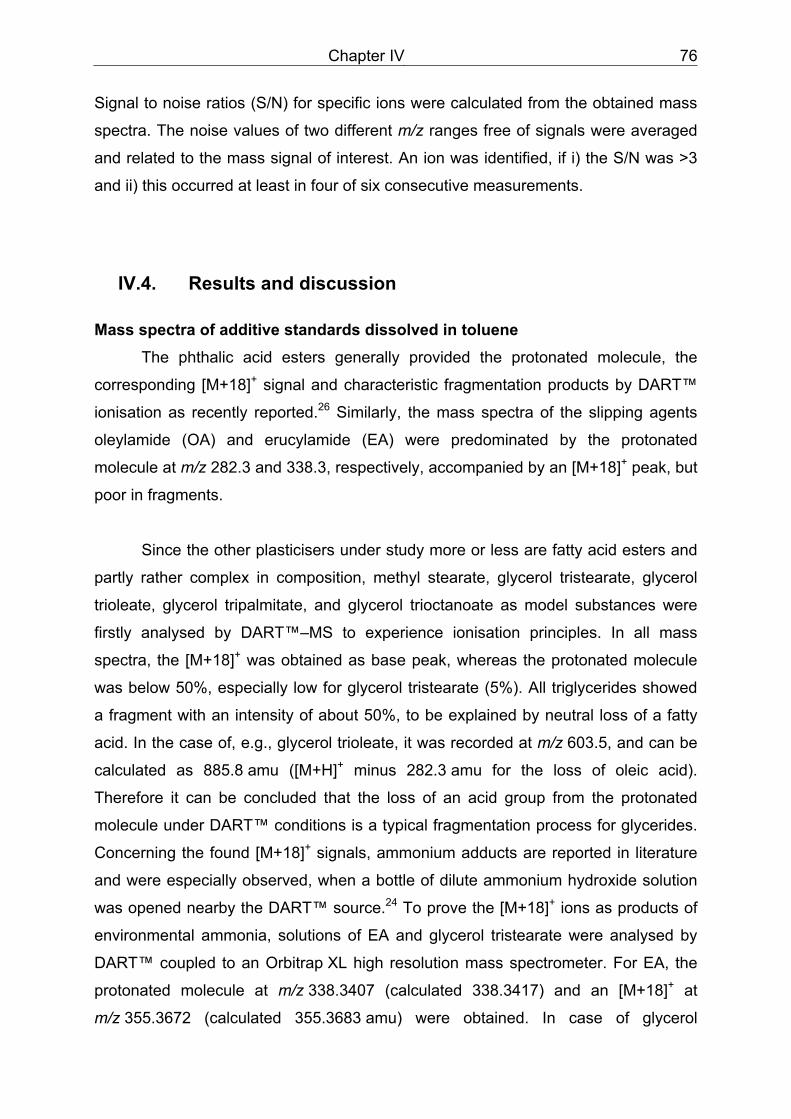
Chapter IV 76
Signal to noise ratios (S/N) for specific ions were calculated from the obtained mass
spectra. The noise values of two different m/z ranges free of signals were averaged
and related to the mass signal of interest. An ion was identified, if i) the S/N was >3
and ii) this occurred at least in four of six consecutive measurements.
IV.4. Results and discussion
Mass spectra of additive standards dissolved in toluene The phthalic acid esters generally provided the protonated molecule, the
corresponding [M+18]+ signal and characteristic fragmentation products by DART™
ionisation as recently reported.26 Similarly, the mass spectra of the slipping agents
oleylamide (OA) and erucylamide (EA) were predominated by the protonated
molecule at m/z 282.3 and 338.3, respectively, accompanied by an [M+18]+ peak, but
poor in fragments.
Since the other plasticisers under study more or less are fatty acid esters and
partly rather complex in composition, methyl stearate, glycerol tristearate, glycerol
trioleate, glycerol tripalmitate, and glycerol trioctanoate as model substances were
firstly analysed by DART™–MS to experience ionisation principles. In all mass
spectra, the [M+18]+ was obtained as base peak, whereas the protonated molecule
was below 50%, especially low for glycerol tristearate (5%). All triglycerides showed
a fragment with an intensity of about 50%, to be explained by neutral loss of a fatty
acid. In the case of, e.g., glycerol trioleate, it was recorded at m/z 603.5, and can be
calculated as 885.8 amu ([M+H]+ minus 282.3 amu for the loss of oleic acid).
Therefore it can be concluded that the loss of an acid group from the protonated
molecule under DART™ conditions is a typical fragmentation process for glycerides.
Concerning the found [M+18]+ signals, ammonium adducts are reported in literature
and were especially observed, when a bottle of dilute ammonium hydroxide solution
was opened nearby the DART™ source.24 To prove the [M+18]+ ions as products of
environmental ammonia, solutions of EA and glycerol tristearate were analysed by
DART™ coupled to an Orbitrap XL high resolution mass spectrometer. For EA, the
protonated molecule at m/z 338.3407 (calculated 338.3417) and an [M+18]+ at
m/z 355.3672 (calculated 355.3683 amu) were obtained. In case of glycerol
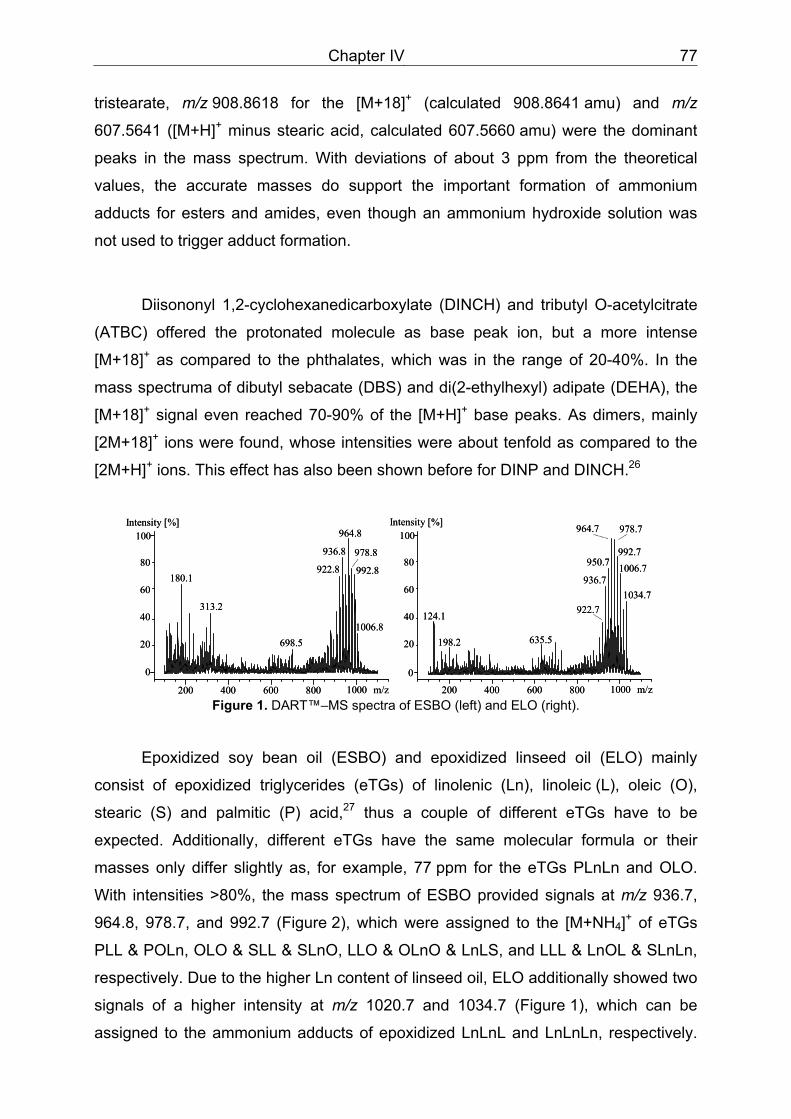
Chapter IV 77
tristearate, m/z 908.8618 for the [M+18]+ (calculated 908.8641 amu) and m/z
607.5641 ([M+H]+ minus stearic acid, calculated 607.5660 amu) were the dominant
peaks in the mass spectrum. With deviations of about 3 ppm from the theoretical
values, the accurate masses do support the important formation of ammonium
adducts for esters and amides, even though an ammonium hydroxide solution was
not used to trigger adduct formation.
Diisononyl 1,2-cyclohexanedicarboxylate (DINCH) and tributyl O-acetylcitrate
(ATBC) offered the protonated molecule as base peak ion, but a more intense
[M+18]+ as compared to the phthalates, which was in the range of 20-40%. In the
mass spectruma of dibutyl sebacate (DBS) and di(2-ethylhexyl) adipate (DEHA), the
[M+18]+ signal even reached 70-90% of the [M+H]+ base peaks. As dimers, mainly
[2M+18]+ ions were found, whose intensities were about tenfold as compared to the
[2M+H]+ ions. This effect has also been shown before for DINP and DINCH.26
m/z200 400 600 800 1000
20
40
60
80
100Intensity [%]
922.8 992.8
936.8
964.8
978.8
1006.8
180.1
313.2
698.5
m/z200 400 600 800 1000
20
40
60
80
100Intensity [%] 964.7 978.7
992.71006.7
1034.7
124.1
198.2 635.5
950.7
936.7
922.7
0 0
m/z200 400 600 800 1000
20
40
60
80
100Intensity [%]
922.8 992.8
936.8
964.8
978.8
1006.8
180.1
313.2
698.5
m/z200 400 600 800 1000
20
40
60
80
100Intensity [%] 964.7 978.7
992.71006.7
1034.7
124.1
198.2 635.5
950.7
936.7
922.7
0 0
Figure 1. DART™–MS spectra of ESBO (left) and ELO (right).
Epoxidized soy bean oil (ESBO) and epoxidized linseed oil (ELO) mainly
consist of epoxidized triglycerides (eTGs) of linolenic (Ln), linoleic (L), oleic (O),
stearic (S) and palmitic (P) acid,27 thus a couple of different eTGs have to be
expected. Additionally, different eTGs have the same molecular formula or their
masses only differ slightly as, for example, 77 ppm for the eTGs PLnLn and OLO.
With intensities >80%, the mass spectrum of ESBO provided signals at m/z 936.7,
964.8, 978.7, and 992.7 (Figure 2), which were assigned to the [M+NH4]+ of eTGs
PLL & POLn, OLO & SLL & SLnO, LLO & OLnO & LnLS, and LLL & LnOL & SLnLn,
respectively. Due to the higher Ln content of linseed oil, ELO additionally showed two
signals of a higher intensity at m/z 1020.7 and 1034.7 (Figure 1), which can be
assigned to the ammonium adducts of epoxidized LnLnL and LnLnLn, respectively.
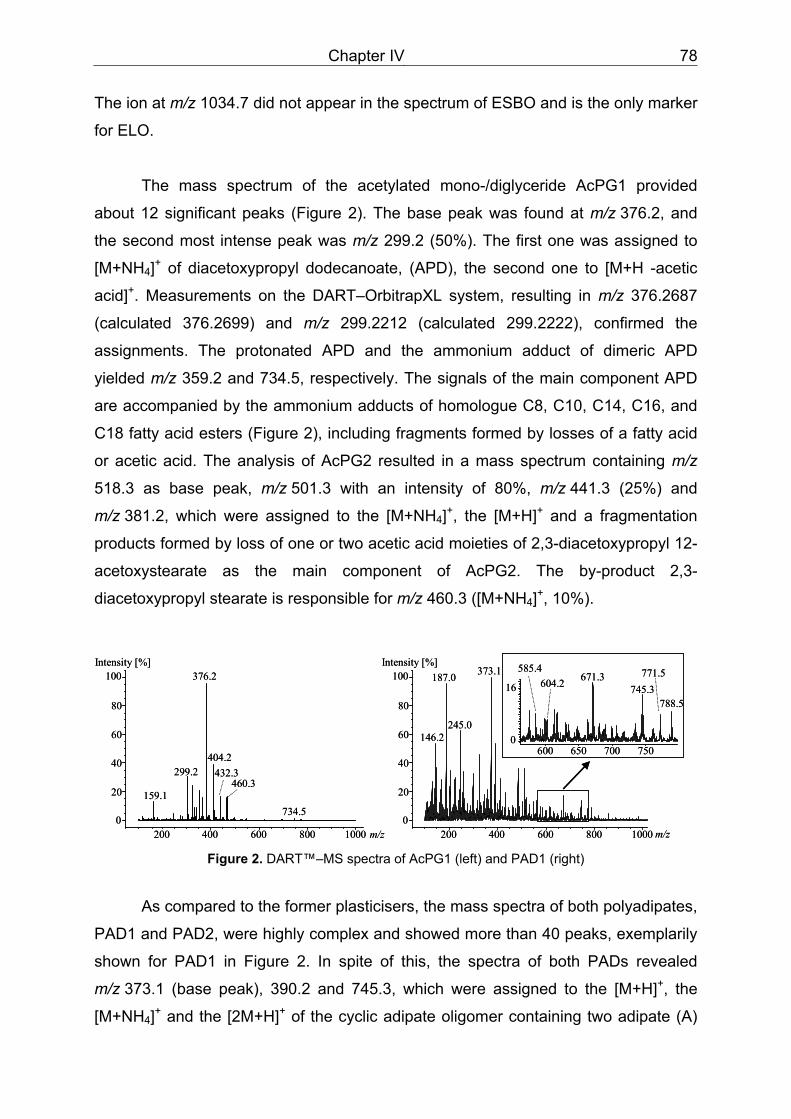
Chapter IV 78
The ion at m/z 1034.7 did not appear in the spectrum of ESBO and is the only marker
for ELO.
The mass spectrum of the acetylated mono-/diglyceride AcPG1 provided
about 12 significant peaks (Figure 2). The base peak was found at m/z 376.2, and
the second most intense peak was m/z 299.2 (50%). The first one was assigned to
[M+NH4]+ of diacetoxypropyl dodecanoate, (APD), the second one to [M+H -acetic
acid]+. Measurements on the DART–OrbitrapXL system, resulting in m/z 376.2687
(calculated 376.2699) and m/z 299.2212 (calculated 299.2222), confirmed the
assignments. The protonated APD and the ammonium adduct of dimeric APD
yielded m/z 359.2 and 734.5, respectively. The signals of the main component APD
are accompanied by the ammonium adducts of homologue C8, C10, C14, C16, and
C18 fatty acid esters (Figure 2), including fragments formed by losses of a fatty acid
or acetic acid. The analysis of AcPG2 resulted in a mass spectrum containing m/z
518.3 as base peak, m/z 501.3 with an intensity of 80%, m/z 441.3 (25%) and
m/z 381.2, which were assigned to the [M+NH4]+, the [M+H]+ and a fragmentation
products formed by loss of one or two acetic acid moieties of 2,3-diacetoxypropyl 12-
acetoxystearate as the main component of AcPG2. The by-product 2,3-
diacetoxypropyl stearate is responsible for m/z 460.3 ([M+NH4]+, 10%).
200 400 600 800 10000
20
40
60
80
100
m/z
Intensity [%]
600 650 700 7500
16
200 400 600 800 10000
20
40
60
80
100
m/z
Intensity [%]
159.1
299.2
376.2
404.2432.3
460.3
734.5
146.2
187.0
245.0
373.1 585.4604.2 671.3
745.3771.5
788.5
200 400 600 800 10000
20
40
60
80
100
m/z
Intensity [%]
600 650 700 7500
16
200 400 600 800 10000
20
40
60
80
100
m/z
Intensity [%]
159.1
299.2
376.2
404.2432.3
460.3
734.5
146.2
187.0
245.0
373.1 585.4604.2 671.3
745.3771.5
788.5
Figure 2. DART™–MS spectra of AcPG1 (left) and PAD1 (right)
As compared to the former plasticisers, the mass spectra of both polyadipates,
PAD1 and PAD2, were highly complex and showed more than 40 peaks, exemplarily
shown for PAD1 in Figure 2. In spite of this, the spectra of both PADs revealed
m/z 373.1 (base peak), 390.2 and 745.3, which were assigned to the [M+H]+, the
[M+NH4]+ and the [2M+H]+ of the cyclic adipate oligomer containing two adipate (A)
Chapter IV 79
and two 1,2-propanediol (P) units. This PAD component was described as cy(A-P)2
and identified in 7 of 14 commercially available PADs by Biedermann et al.22.
DART™–MS signals at m/z 187.0 and m/z 204.1 were also significant for both PADs,
which correspond to the [M+H]+ and [M+NH4]+ of a cyclic 1,2-propanediol adipate
(cy(A-P), which was identified by Biedermann et al. in the same PADs), but they also
found m/z 187 as a very stable fragment of cy(A-P)2 during GC/MS studies. The
former assignments were confirmed by high resolution mass spectrometry resulting
in signals at m/z 373.1847, 390.2113, 745.3624, 187.0959, and 204.1224, all of
which with a deviation of about 2.5 ppm from the calculated exact masses. Besides
the common signals, there also were differences in the mass spectra of PAD1 and
PAD2. Signals, for example, at m/z 585.4, 602.4, 771.5, and 788.5 were only
recorded in case of PAD1. The first two are assigned to the [M+NH4]+ and [M+H]+,
respectively, of an oligomer consisting of two A and one P, endcapped with decanol
(D) and octanol (O), i.e., O-A-P-A-D, according to the nomenclature of Biedermann et
al.,22 whereas the latter two ions correspond to the respective adducts of O-A-P-A-P-
A-D. High resolution mass spectrometry delivered m/z 585.4346, 602.4610,
771.5236, and 788.5519, which are in agreement with the calculated exact masses
with a deviation of about 2.5 ppm. These two components were identified by
Biedermann et al. in only one of the 14 investigated PADs. Therefore, the DART™–
MS method should be suitable for rapid identification of a specific PAD deriving from
a well known and characterized pool of PADs.
Data obtained from plastisol analysis From the MS data obtained, the characteristic ions summarized in Table 3
were selected and used for the identification of additives in plastisols by DART™–
MS.
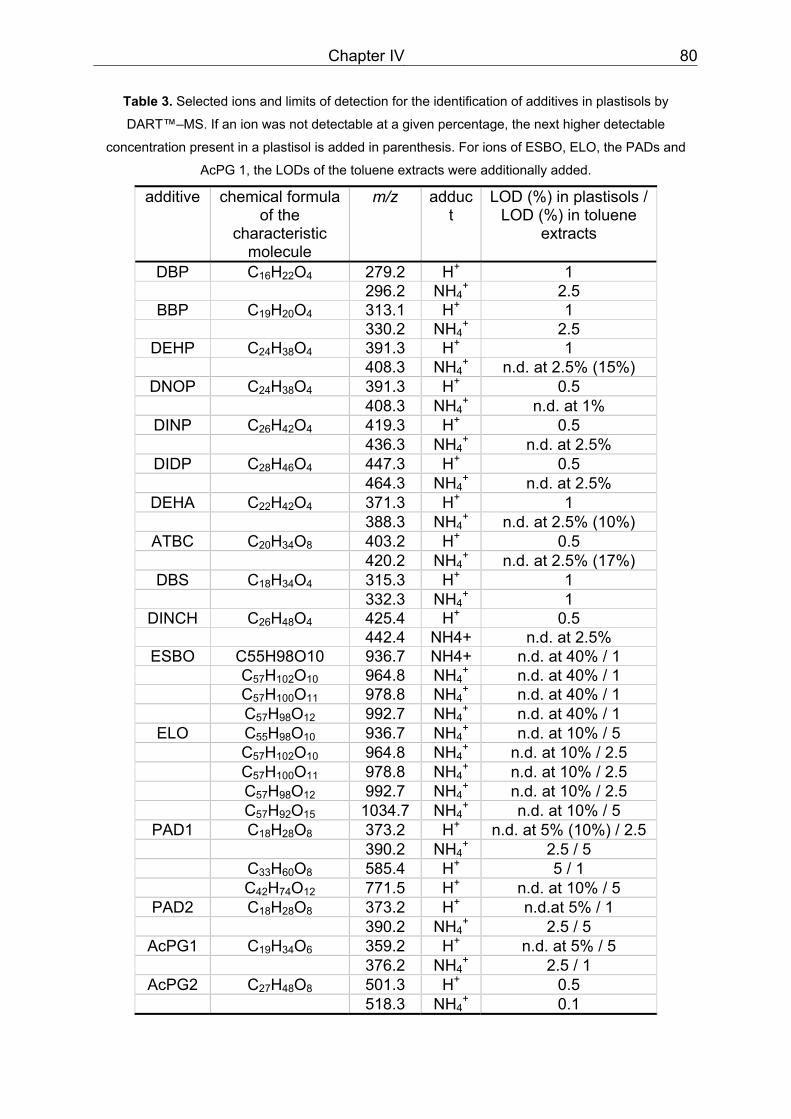
Chapter IV 80
Table 3. Selected ions and limits of detection for the identification of additives in plastisols by
DART™–MS. If an ion was not detectable at a given percentage, the next higher detectable
concentration present in a plastisol is added in parenthesis. For ions of ESBO, ELO, the PADs and
AcPG 1, the LODs of the toluene extracts were additionally added.
additive chemical formula of the
characteristic molecule
m/z adduct
LOD (%) in plastisols / LOD (%) in toluene
extracts
DBP C16H22O4 279.2 H+ 1 296.2 NH4
+ 2.5 BBP C19H20O4 313.1 H+ 1
330.2 NH4+ 2.5
DEHP C24H38O4 391.3 H+ 1 408.3 NH4
+ n.d. at 2.5% (15%) DNOP C24H38O4 391.3 H+ 0.5
408.3 NH4+ n.d. at 1%
DINP C26H42O4 419.3 H+ 0.5 436.3 NH4
+ n.d. at 2.5% DIDP C28H46O4 447.3 H+ 0.5
464.3 NH4+ n.d. at 2.5%
DEHA C22H42O4 371.3 H+ 1 388.3 NH4
+ n.d. at 2.5% (10%) ATBC C20H34O8 403.2 H+ 0.5
420.2 NH4+ n.d. at 2.5% (17%)
DBS C18H34O4 315.3 H+ 1 332.3 NH4
+ 1 DINCH C26H48O4 425.4 H+ 0.5
442.4 NH4+ n.d. at 2.5% ESBO C55H98O10 936.7 NH4+ n.d. at 40% / 1
C57H102O10 964.8 NH4+ n.d. at 40% / 1
C57H100O11 978.8 NH4+ n.d. at 40% / 1
C57H98O12 992.7 NH4+ n.d. at 40% / 1
ELO C55H98O10 936.7 NH4+ n.d. at 10% / 5
C57H102O10 964.8 NH4+ n.d. at 10% / 2.5
C57H100O11 978.8 NH4+ n.d. at 10% / 2.5
C57H98O12 992.7 NH4+ n.d. at 10% / 2.5
C57H92O15 1034.7 NH4+ n.d. at 10% / 5
PAD1 C18H28O8 373.2 H+ n.d. at 5% (10%) / 2.5 390.2 NH4
+ 2.5 / 5 C33H60O8 585.4 H+ 5 / 1 C42H74O12 771.5 H+ n.d. at 10% / 5
PAD2 C18H28O8 373.2 H+ n.d.at 5% / 1 390.2 NH4
+ 2.5 / 5 AcPG1 C19H34O6 359.2 H+ n.d. at 5% / 5
376.2 NH4+ 2.5 / 1
AcPG2 C27H48O8 501.3 H+ 0.5 518.3 NH4
+ 0.1
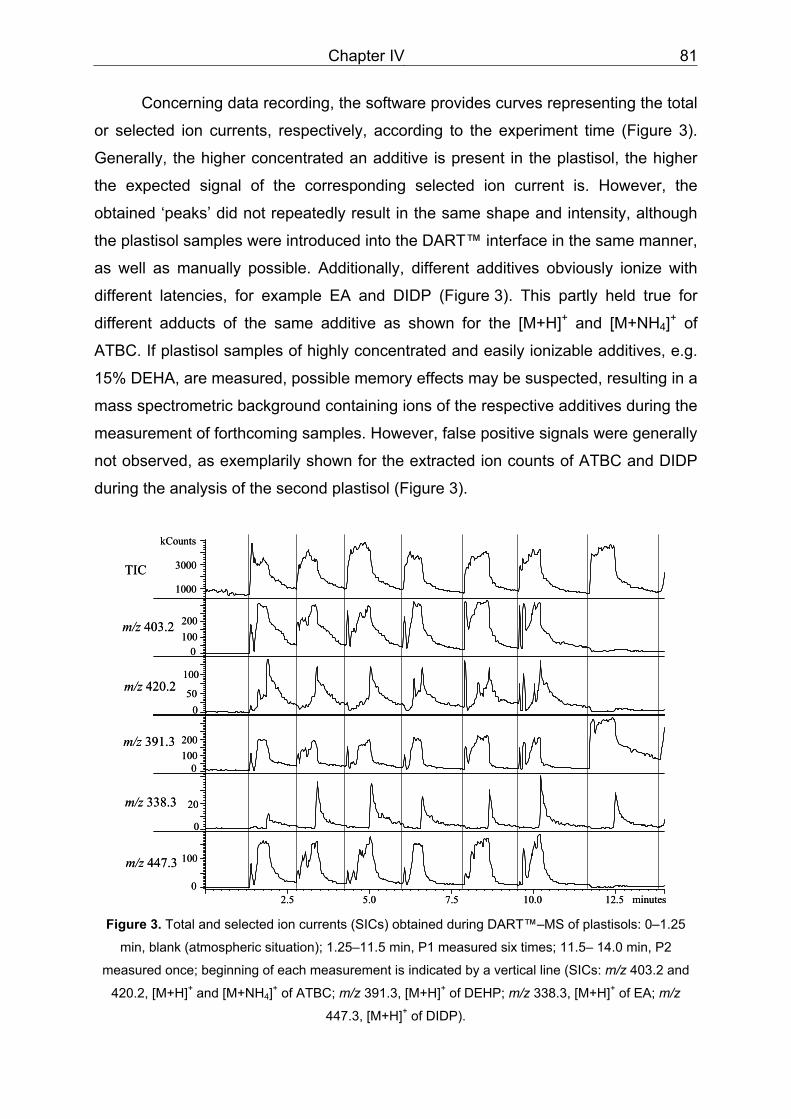
Chapter IV 81
Concerning data recording, the software provides curves representing the total
or selected ion currents, respectively, according to the experiment time (Figure 3).
Generally, the higher concentrated an additive is present in the plastisol, the higher
the expected signal of the corresponding selected ion current is. However, the
obtained ‘peaks’ did not repeatedly result in the same shape and intensity, although
the plastisol samples were introduced into the DART™ interface in the same manner,
as well as manually possible. Additionally, different additives obviously ionize with
different latencies, for example EA and DIDP (Figure 3). This partly held true for
different adducts of the same additive as shown for the [M+H]+ and [M+NH4]+ of
ATBC. If plastisol samples of highly concentrated and easily ionizable additives, e.g.
15% DEHA, are measured, possible memory effects may be suspected, resulting in a
mass spectrometric background containing ions of the respective additives during the
measurement of forthcoming samples. However, false positive signals were generally
not observed, as exemplarily shown for the extracted ion counts of ATBC and DIDP
during the analysis of the second plastisol (Figure 3).
2.5 5.0 7.5 10.0 12.5 minutes
1000
3000
kCounts
0100200
050
100
0100200
0
20
0
100
TIC
m/z 403.2
m/z 420.2
m/z 391.3
m/z 338.3
m/z 447.3
2.5 5.0 7.5 10.0 12.5 minutes
1000
3000
kCounts
0100200
050
100
0100200
0
20
0
100
TIC
m/z 403.2
m/z 420.2
m/z 391.3
m/z 338.3
m/z 447.3
Figure 3. Total and selected ion currents (SICs) obtained during DART™–MS of plastisols: 0–1.25
min, blank (atmospheric situation); 1.25–11.5 min, P1 measured six times; 11.5– 14.0 min, P2
measured once; beginning of each measurement is indicated by a vertical line (SICs: m/z 403.2 and
420.2, [M+H]+ and [M+NH4]+ of ATBC; m/z 391.3, [M+H]+ of DEHP; m/z 338.3, [M+H]+ of EA; m/z
447.3, [M+H]+ of DIDP).
Chapter IV 82
Identification of additives in the standardized plastisols P1-P14 The phthalic acid esters, DINCH, ATBC, AcPG, DBS and DEHA showed the
same mass signals deriving from different plastisols as they were obtained from the
toluene solutions. Identification of PAD1 and PAD2 through m/z 373.2 and m/z 390.2
was generally possible, but the signals may coincide with the M+2 satellites of DEHA,
if it is present in high concentrations.
EA and OA, present at 1% in plastisols, were generally detectable through
their protonated molecules at the defined LOD of S/N>3. The identification was
significantly enhanced by measuring the toluene extracts, when both slipping agents
provided clear signals with a S/N ratio of 20.
ESBO and ELO surprisingly were not detectable in the plastisols P1-P14. An
additionally prepared plastisol with 40% ESBO showed the same result. Instead of
the typical ESBO signals, only m/z 989.8, 1009.8, 1022.8 and 1042.7 (base peak)
were detected within the relevant mass range in intensities that had been expected
for ESBO signals. Further experiments showed that EA and OA, i) in combination
and ii) both at a concentration of only 1%, strongly gave rise to ion suppressive
effects according to ESBO ions. To avoid these effects, an extraction of ESBO with
organic solvents was tested. Therefore, about 20 mg plastisol were extracted by
0.3 mL tetrahydrofuran, dichloromethane and toluene for 30 min and 12 h,
respectively. Tetrahydrofuran dissolved the plastisol during both extraction times, but
decrease of the ion suppressive effects did not occur. The same effects were
observed for the 12-h extraction with dichloromethane. In case of the 12-h extraction
with toluene and the 30-min extractions with both dichloromethane and toluene, the
plastisol was not completely dissolved, and ESBO was well detectable. To avoid
halogenated solvents, the 30 min extraction with toluene was preferred. Figure 4
exemplarily demonstrates the success of extraction as compared to direct
measurement of plastisols; all used plasticisers were clearly identified. As the
extraction procedure takes about half an hour and direct measuring of the plastisol
including data evaluation can be performed during the extraction, the whole
procedure of a plastisol analysis will only take approximately 45 min.
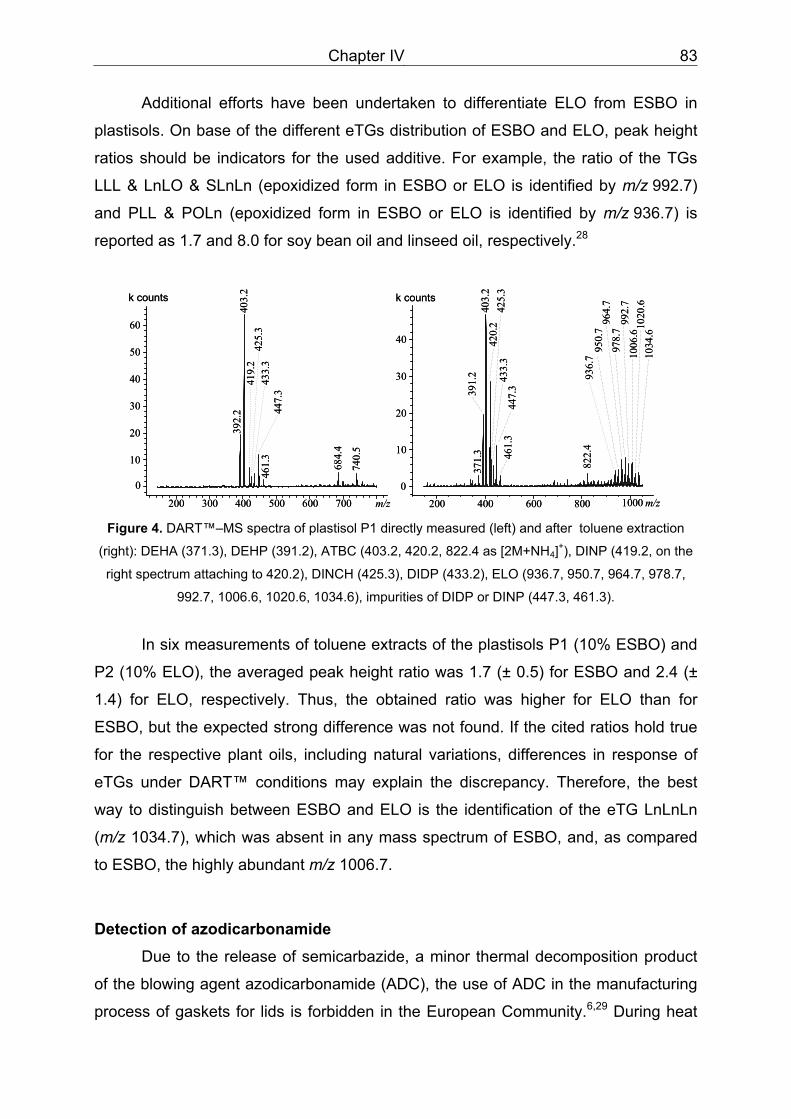
Chapter IV 83
Additional efforts have been undertaken to differentiate ELO from ESBO in
plastisols. On base of the different eTGs distribution of ESBO and ELO, peak height
ratios should be indicators for the used additive. For example, the ratio of the TGs
LLL & LnLO & SLnLn (epoxidized form in ESBO or ELO is identified by m/z 992.7)
and PLL & POLn (epoxidized form in ESBO or ELO is identified by m/z 936.7) is
reported as 1.7 and 8.0 for soy bean oil and linseed oil, respectively.28
m/z200 300 400 500 600 700
0
10
20
30
40
50
60
740.
5
419.
239
2.2
684.
4
447.
3
403.
2k counts
461.
342
5.3
433.
3
m/z200 400 600 800 10000
10
20
30
40
1006
.6
964.
7
992.
7
371.
3 461.
3
822.
4
978.
7
391.
240
3.2
k counts
420.
2
447.
342
5.3
433.
3 1034
.610
20.6
950.
793
6.7
m/z200 300 400 500 600 700
0
10
20
30
40
50
60
740.
5
419.
239
2.2
684.
4
447.
3
403.
2k counts
461.
342
5.3
433.
3
m/z200 400 600 800 10000
10
20
30
40
1006
.6
964.
7
992.
7
371.
3 461.
3
822.
4
978.
7
391.
240
3.2
k counts
420.
2
447.
342
5.3
433.
3 1034
.610
20.6
950.
793
6.7
Figure 4. DART™–MS spectra of plastisol P1 directly measured (left) and after toluene extraction
(right): DEHA (371.3), DEHP (391.2), ATBC (403.2, 420.2, 822.4 as [2M+NH4]+), DINP (419.2, on the
right spectrum attaching to 420.2), DINCH (425.3), DIDP (433.2), ELO (936.7, 950.7, 964.7, 978.7,
992.7, 1006.6, 1020.6, 1034.6), impurities of DIDP or DINP (447.3, 461.3).
In six measurements of toluene extracts of the plastisols P1 (10% ESBO) and
P2 (10% ELO), the averaged peak height ratio was 1.7 (± 0.5) for ESBO and 2.4 (±
1.4) for ELO, respectively. Thus, the obtained ratio was higher for ELO than for
ESBO, but the expected strong difference was not found. If the cited ratios hold true
for the respective plant oils, including natural variations, differences in response of
eTGs under DART™ conditions may explain the discrepancy. Therefore, the best
way to distinguish between ESBO and ELO is the identification of the eTG LnLnLn
(m/z 1034.7), which was absent in any mass spectrum of ESBO, and, as compared
to ESBO, the highly abundant m/z 1006.7.
Detection of azodicarbonamide Due to the release of semicarbazide, a minor thermal decomposition product
of the blowing agent azodicarbonamide (ADC), the use of ADC in the manufacturing
process of gaskets for lids is forbidden in the European Community.6,29 During heat
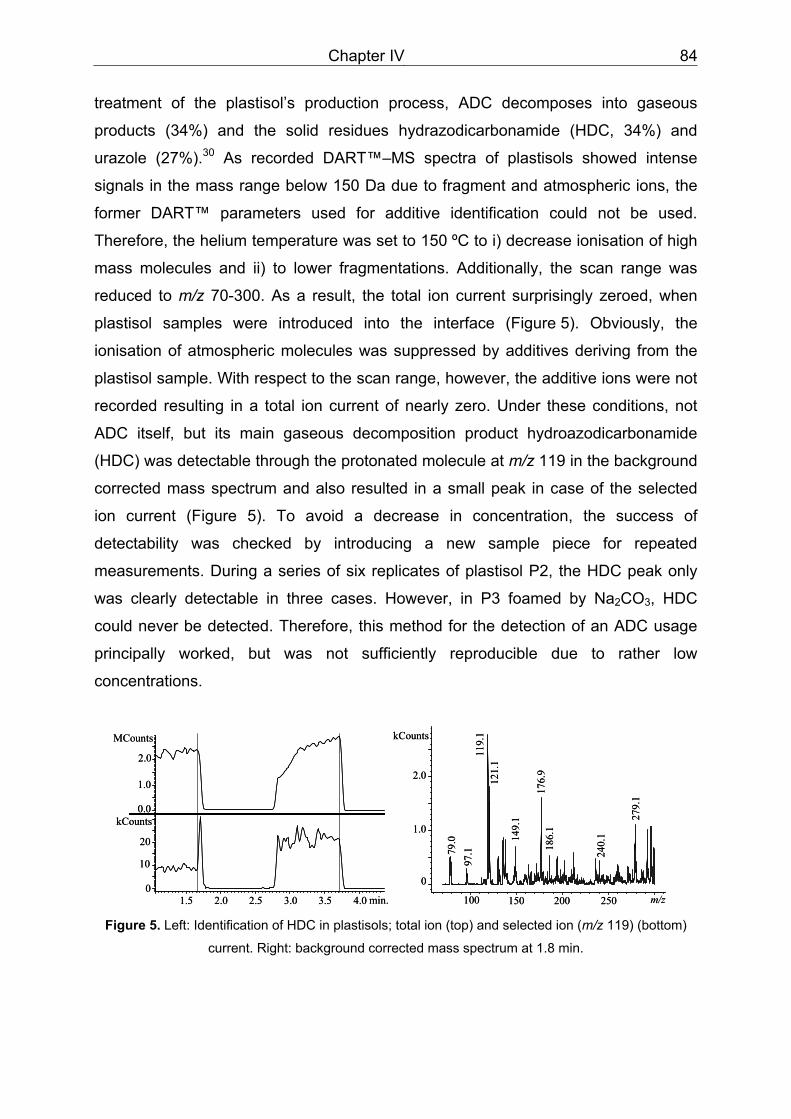
Chapter IV 84
treatment of the plastisol’s production process, ADC decomposes into gaseous
products (34%) and the solid residues hydrazodicarbonamide (HDC, 34%) and
urazole (27%).30 As recorded DART™–MS spectra of plastisols showed intense
signals in the mass range below 150 Da due to fragment and atmospheric ions, the
former DART™ parameters used for additive identification could not be used.
Therefore, the helium temperature was set to 150 ºC to i) decrease ionisation of high
mass molecules and ii) to lower fragmentations. Additionally, the scan range was
reduced to m/z 70-300. As a result, the total ion current surprisingly zeroed, when
plastisol samples were introduced into the interface (Figure 5). Obviously, the
ionisation of atmospheric molecules was suppressed by additives deriving from the
plastisol sample. With respect to the scan range, however, the additive ions were not
recorded resulting in a total ion current of nearly zero. Under these conditions, not
ADC itself, but its main gaseous decomposition product hydroazodicarbonamide
(HDC) was detectable through the protonated molecule at m/z 119 in the background
corrected mass spectrum and also resulted in a small peak in case of the selected
ion current (Figure 5). To avoid a decrease in concentration, the success of
detectability was checked by introducing a new sample piece for repeated
measurements. During a series of six replicates of plastisol P2, the HDC peak only
was clearly detectable in three cases. However, in P3 foamed by Na2CO3, HDC
could never be detected. Therefore, this method for the detection of an ADC usage
principally worked, but was not sufficiently reproducible due to rather low
concentrations.
1.5 2.0 2.5 3.0 3.5 4.0 min.
0.0
1.0
2.0
MCounts
0
10
20
kCounts
m/z100 150 200 250
0
1.0
2.0
97.179
.0
240.
1
186.
1
149.
1 279.
1
176.
9
121.
111
9.1kCounts
1.5 2.0 2.5 3.0 3.5 4.0 min.
0.0
1.0
2.0
MCounts
0
10
20
kCounts
m/z100 150 200 250
0
1.0
2.0
97.179
.0
240.
1
186.
1
149.
1 279.
1
176.
9
121.
111
9.1kCounts
Figure 5. Left: Identification of HDC in plastisols; total ion (top) and selected ion (m/z 119) (bottom)
current. Right: background corrected mass spectrum at 1.8 min.
Chapter IV 85
Limits of detection Considering the defined data evaluation method, the obtained results for the
plastisols P1-P14 were interpreted to establish LODs for significant ions used for the
identification of the additives. On basis of at least one characteristic ion, DNOP,
DINP, DINCH, ATBC, and AcPG2 were detectable in concentrations of ≥0.5% in
plastisols, whereas for DBP, BBP, DEHP, DBS, and DEHA, the LOD was 1%
(Table 3). Detectability was also given at lower concentrations, but then only
occurred in less than four of six consecutive measurements. Compared to the LODs
of phthalic acid esters in plastisols that only contained DINCH as additional
plasticizer,26 the present results of more complex plastisols showed higher LODs.
This may be due to ion suppression effects and the increased gas temperature,
which enhanced fragmentation of molecular ions, as shown for DHEP and DNOP.26
In the case of AcPG1, direct identification in the plastisol was only possible, if the
concentration was above 2.5%; extraction with toluene resulted in an LOD of 1%. As
the plastisols P1-P14 almost had high concentrations of interfering DEHA, additional
plastisols were prepared at levels of 0–5% PAD1 or PAD2, respectively. DART™–
MS measurements showed that m/z 373.3 ([M+H]+ of cy(A-P)2) was not detectable,
but the ion at m/z 390.2 ([M+NH4]+ of cy(A-P)2) of both PADs at a level of 2.5%, and
m/z 585.4 of PAD1 at 5%. For some characteristic ions of the PADs, LODs were also
lowered by toluene extraction (Table 3). The epoxidized vegetable oils were only
detectable in toluene extracts; the resulting LODs were 1% for the characteristic
ESBO ions, and 2.5% as well as 5% for typical ELO ions (Table 3). Significant
identification of ELO is limited to 5% and does not cover mixtures of ESBO and ELO.
IV.5. Conclusion
The method presented shows great possibilities to identify additives in
plastisols very easily and rapidly, compared to already published methods. As more
clarity is brought into the results of ionisation and fragmentation processes, this
method may be transferred easily to other applications dealing with similar subjects.
DART™-MS may also be very useful to rapidly identify complex plasticisers as, for
example, to distinguish between different kinds of PADs used in a plastisol.
Chapter IV 86
IV.6. Acknowledgement
The authors would like to thank Wacker Chemie AG for providing the PVC and
especially Ms Tatjana Resner for her commitment with DART™-MS measurements.
Thanks are also given to Dr. Jens Pfannstiel (Life Science Center, University
of Hohenheim) for the chance to mount the DART™ interface onto the Orbitrap XL
mass spectrometer.
IV.7. References
1. Biedermann-Brem S, Biedermann M, Fiselier K, Grob K. Compositional GC-FID
analysis of the additives to PVC, focusing on the gaskets of lids for glass jars.
Food Additives & Contaminants 2005; 22(12): pp.1274-1284
2. Ezerskis Z, Morkunas V, Suman M, Simoneau C. Analytical screening of
polyadipates and other plasticisers in poly(vinyl chloride) gasket seals and in fatty
food by gas chromatography-mass spectrometry. Analytica Chimica Acta 2007;
604(1): pp.29-38
3. Fankhauser-Noti A, Biedermann-Brem S, Grob K. PVC plasticisers/additives
migrating from the gaskets of metal closures into oily food: Swiss market survey
June 2005. European Food Research and Technology 2006; 223(4): pp.447-453
4. Hammarling L, Gustavsson H, Svensson K, Karlsson S, Oskarsson A. Migration
of epoxidized soya bean oil from plasticized PVC gaskets into baby food. Food
Addit Contam 1998; 15(2): pp.203-208
5. Fantoni L, Simoneau C. European survey of contamination of homogenized baby
food by epoxidized soybean oil migration from plasticized PVC gaskets. Food
Additives & Contaminants 2003; 20(11): pp.1087-1096
6. Stadler RH, Mottier P, Guy P, Gremaud E, Varga N, Lalljie S, Whitaker R,
Kintscher J, Dudler V, Read WA, Castle L. Semicarbazide is a minor thermal
decomposition product of azodicarbonamide used in the gaskets of certain food
jars. Analyst (Cambridge, United Kingdom) 2004; 129(3): pp.276-281
Chapter IV 87
7. Elss S, Gruenewald L, Richling E, Schreier P. Occurrence of 2-ethylhexanoic acid
in foods packed in glass jars. Food Additives and Contaminants 2004; 21(8):
pp.811-814
8. Fankhauser-Noti A, Fiselier K, Biedermann S, Biedermann M, Grob K, Armellini
F, Rieger K, Skjevrak I. Epoxidized soy bean oil (ESBO) migrating from the
gaskets of lids into food packed in glass jars. European Food Research and
Technology 2005; 221(3-4): pp.416-422
9. Fankhauser-Noti A, Grob K. Migration of plasticisers from PVC gaskets of lids for
glass jars into oily foods: Amount of gasket material in food contact, proportion of
plasticiser migrating into food and compliance testing by simulation. Trends in
Food Science & Technology 2006; 17(3): pp.105-112
10. Pedersen GA, Jensen LK, Fankhauser A, Biedermann S, Petersen JH, Fabech B.
Migration of epoxidized soybean oil (ESBO) and phthalates from twist closures
into food and enforcement of the overall migration limit. Food Additives &
Contaminants, Part A: Chemistry, Analysis, Control, Exposure & Risk
Assessment 2008; 25(4): pp.503-510
11. European Communities. Commission Directive 2002/72/EC of 6 August 2002
relating to plastic materials and articles intended to come into contact with
foodstuffs. Official Journal of the European Union 2002; L 220: pp.18-58
12. Silva AS, Garcia RS, Cooper I, Franz R, Losada PP. Compilation of analytical
methods and guidelines for the determination of selected model migrants from
plastic packaging. Trends in Food Science & Technology 2006; 17(10): pp.535-
546
13. Lau OW, Wong SK. Determination of plasticisers in food by gas chromatography-
mass spectrometry with ion-trap mass detection. J Chromatogr A 1996; 737(2):
pp.338-342
14. Lau OW, Wong SK. Contamination in food from packaging material. Journal of
Chromatography, A 2000; 882(1+2): pp.255-270
15. Simoneau C, Ezerskis Z, Morkunas V. Determination of plasticisers and additives
in PVC gasket seals and in fatty sauces and migration study. Food Contact
Polymers 2007, International Conference, 1st, Brussels, Belgium, Feb.21-22,
2007 2007: pp.8/1-8/5
Chapter IV 88
16. Suman M, La Tegola S, Catellani D, Bersellini U. Liquid Chromatography-
Electrospray Ionization-Tandem Mass Spectrometry Method for the
Determination of Epoxidized Soybean Oil in Food Products. Journal of
Agricultural and Food Chemistry 2005; 53(26): pp.9879-9884
17. Castle L, Sharman M, Gilbert J. Gas chromatographic-mass spectrometric
determination of epoxidized soybean oil contamination of food by migration from
plastic packaging. Journal - Association of Official Analytical Chemists 1988;
71(6): pp.1183-1186
18. Weller P, Herrnreiter M, Donaubauer A. A miniaturized method to determine
epoxidized soybean oil in baby food. LC-GC Europe 2007; 20(5): pp.280-282,
285
19. Biedermann-Brem S, Biedermann M, Fankhauser-Noti A, Grob K, Helling R.
Determination of epoxidized soy bean oil (ESBO) in oily foods by GC-FID or GC-
MS analysis of the methyl diepoxy linoleate. European Food Research and
Technology 2007; 224(3): pp.309-314
20. Rothenbacher T, Schwack W. Determination of epoxidized soybean oil by gas
chromatography/single quadrupole and tandem mass spectrometry stable isotope
dilution assay. Rapid Communications in Mass Spectrometry 2007; 21(12):
pp.1937-1943
21. European Commission. Commission Regulation (EC) No 372/2007 of 2 April
2007 laying down transitional migration limits for plasticisers in gaskets in lids
intended to come into contact with foods (corrected form). Official Journal of the
European Union 2007; L 92: pp.9-12
22. Biedermann M, Grob K. GC-MS characterization of oligomers in polyadipates
used as plasticisers for PVC in food contact. Packaging Technology & Science
2006; 19(3): pp.159-178
23. Biedermann M, Grob K. GC method for determining polyadipate plasticisers in
foods: transesterification to dibutyl adipate, conversion to migrating polyadipate.
Chromatographia 2006; 64(9-10): pp.543-552
24. Cody RB, Laramee JA, Durst HD. Versatile new ion source for the analysis of
materials in open air under ambient conditions. Anal.Chem. 2005; 77(8): pp.2297-
2302
Chapter IV 89
25. Cody RB, Laramee JA, Nilles JM, Durst HD. Direct Analysis in Real Time
(DARTTM) Mass Spectrometry; 78. JEOL News 2005; 40(1): pp.8-12
26. Rothenbacher T, Schwack W. Rapid and nondestructive analysis of phthalic acid
esters in PVC by direct analysis in real time-single quadrupole mass
spectrometry (DART™-MS). Rapid Communications in Mass Spectrometry 2009;
status: accepted
27. Belitz, H.-D.; Grosch, W. Food Chemistry, Springer-Verlag, Berlin - Heidelberg -
New York. ISBN 3-540-64704-X
28. Rezanka T, Mares P. Determination of plant triacylglycerols using capillary gas
chromatography, high-performance liquid chromatography and mass
spectrometry. Journal of Chromatography 1991; 542(1): pp.145-159
29. European Communities. Commission directive 2004/1/EC amending Directive
2002/72/EC as regards the suspension of the use of azodicarbonamide as
blowing agent. Official Journal of the European Union 2004; L 7: pp.45-46
30. De la Calle MB, Anklam E. Semicarbazide: occurrence in food products and
state-of-the-art in analytical methods used for its determination. Analytical and
Bioanalytical Chemistry. 2005; 382: 968-977
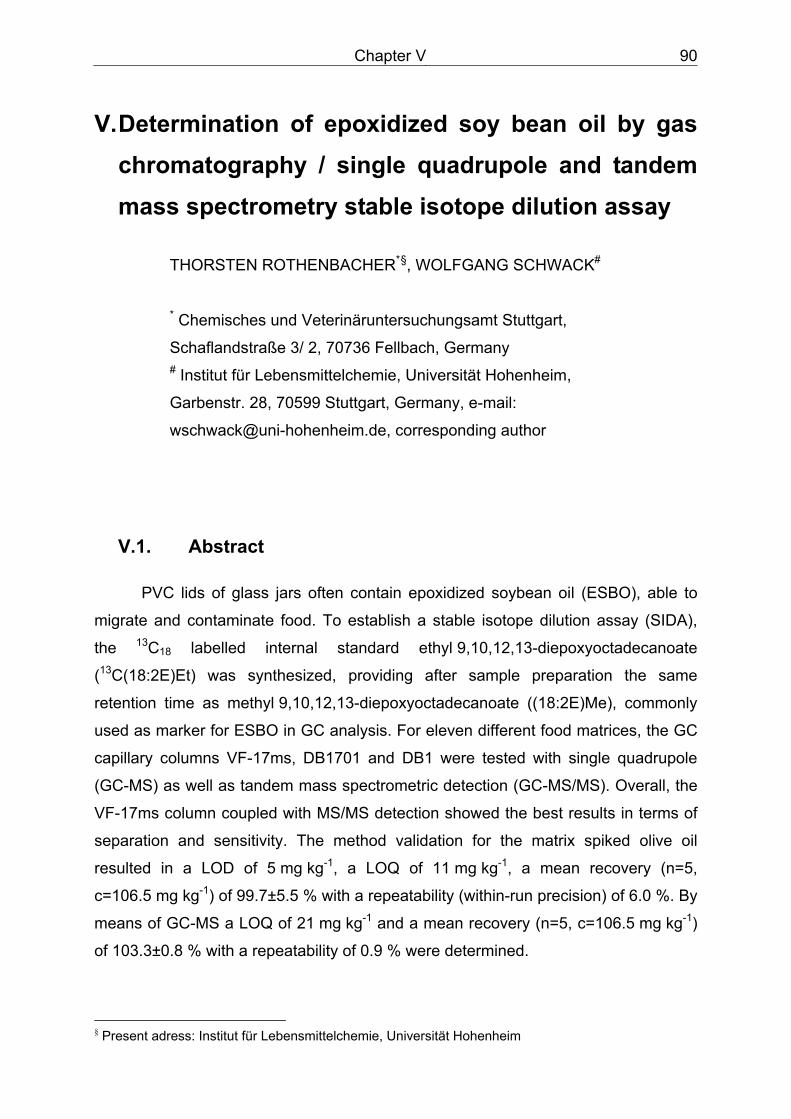
Chapter V 90
V. Determination of epoxidized soy bean oil by gas chromatography / single quadrupole and tandem mass spectrometry stable isotope dilution assay
THORSTEN ROTHENBACHER*§, WOLFGANG SCHWACK#
* Chemisches und Veterinäruntersuchungsamt Stuttgart,
Schaflandstraße 3/ 2, 70736 Fellbach, Germany # Institut für Lebensmittelchemie, Universität Hohenheim,
Garbenstr. 28, 70599 Stuttgart, Germany, e-mail:
[email protected], corresponding author
V.1. Abstract
PVC lids of glass jars often contain epoxidized soybean oil (ESBO), able to
migrate and contaminate food. To establish a stable isotope dilution assay (SIDA),
the 13C18 labelled internal standard ethyl 9,10,12,13-diepoxyoctadecanoate
(13C(18:2E)Et) was synthesized, providing after sample preparation the same
retention time as methyl 9,10,12,13-diepoxyoctadecanoate ((18:2E)Me), commonly
used as marker for ESBO in GC analysis. For eleven different food matrices, the GC
capillary columns VF-17ms, DB1701 and DB1 were tested with single quadrupole
(GC-MS) as well as tandem mass spectrometric detection (GC-MS/MS). Overall, the
VF-17ms column coupled with MS/MS detection showed the best results in terms of
separation and sensitivity. The method validation for the matrix spiked olive oil
resulted in a LOD of 5 mg kg-1, a LOQ of 11 mg kg-1, a mean recovery (n=5,
c=106.5 mg kg-1) of 99.7±5.5 % with a repeatability (within-run precision) of 6.0 %. By
means of GC-MS a LOQ of 21 mg kg-1 and a mean recovery (n=5, c=106.5 mg kg-1)
of 103.3±0.8 % with a repeatability of 0.9 % were determined.
§ Present adress: Institut für Lebensmittelchemie, Universität Hohenheim
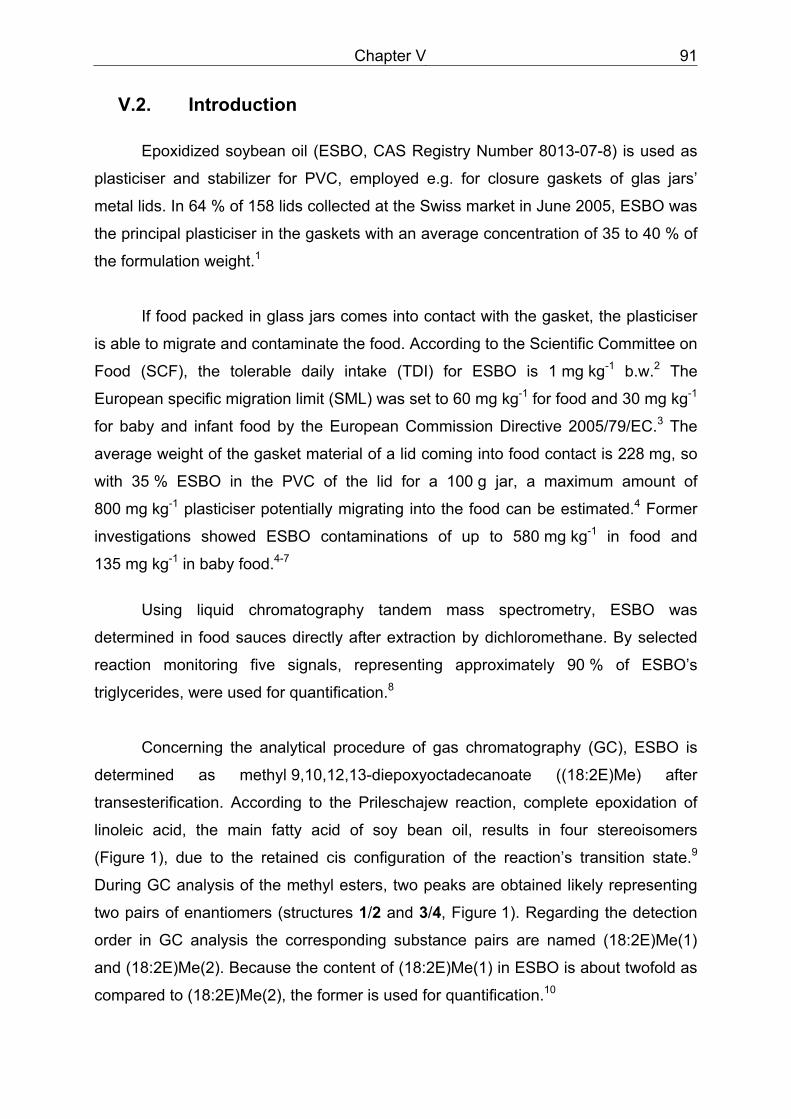
Chapter V 91
V.2. Introduction
Epoxidized soybean oil (ESBO, CAS Registry Number 8013-07-8) is used as
plasticiser and stabilizer for PVC, employed e.g. for closure gaskets of glas jars’
metal lids. In 64 % of 158 lids collected at the Swiss market in June 2005, ESBO was
the principal plasticiser in the gaskets with an average concentration of 35 to 40 % of
the formulation weight.1
If food packed in glass jars comes into contact with the gasket, the plasticiser
is able to migrate and contaminate the food. According to the Scientific Committee on
Food (SCF), the tolerable daily intake (TDI) for ESBO is 1 mg kg-1 b.w.2 The
European specific migration limit (SML) was set to 60 mg kg-1 for food and 30 mg kg-1
for baby and infant food by the European Commission Directive 2005/79/EC.3 The
average weight of the gasket material of a lid coming into food contact is 228 mg, so
with 35 % ESBO in the PVC of the lid for a 100 g jar, a maximum amount of
800 mg kg-1 plasticiser potentially migrating into the food can be estimated.4 Former
investigations showed ESBO contaminations of up to 580 mg kg-1 in food and
135 mg kg-1 in baby food.4-7
Using liquid chromatography tandem mass spectrometry, ESBO was
determined in food sauces directly after extraction by dichloromethane. By selected
reaction monitoring five signals, representing approximately 90 % of ESBO’s
triglycerides, were used for quantification.8
Concerning the analytical procedure of gas chromatography (GC), ESBO is
determined as methyl 9,10,12,13-diepoxyoctadecanoate ((18:2E)Me) after
transesterification. According to the Prileschajew reaction, complete epoxidation of
linoleic acid, the main fatty acid of soy bean oil, results in four stereoisomers
(Figure 1), due to the retained cis configuration of the reaction’s transition state.9
During GC analysis of the methyl esters, two peaks are obtained likely representing
two pairs of enantiomers (structures 1/2 and 3/4, Figure 1). Regarding the detection
order in GC analysis the corresponding substance pairs are named (18:2E)Me(1)
and (18:2E)Me(2). Because the content of (18:2E)Me(1) in ESBO is about twofold as
compared to (18:2E)Me(2), the former is used for quantification.10
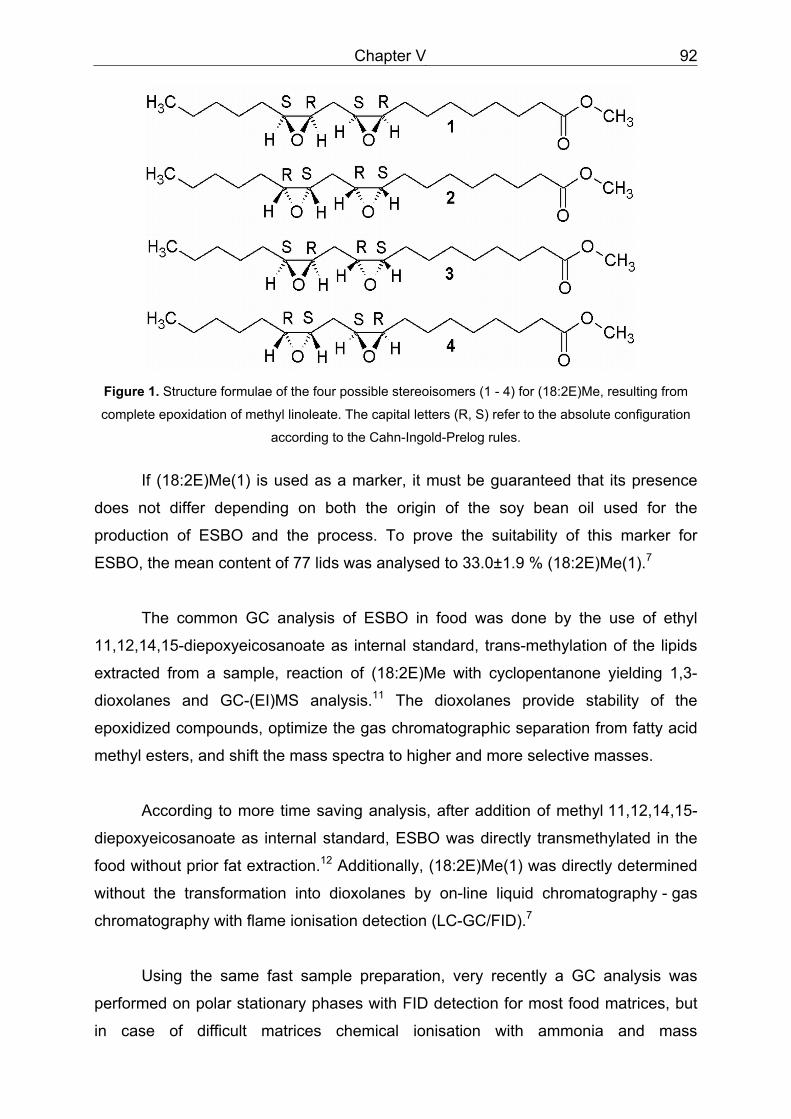
Chapter V 92
Figure 1. Structure formulae of the four possible stereoisomers (1 - 4) for (18:2E)Me, resulting from
complete epoxidation of methyl linoleate. The capital letters (R, S) refer to the absolute configuration
according to the Cahn-Ingold-Prelog rules.
If (18:2E)Me(1) is used as a marker, it must be guaranteed that its presence
does not differ depending on both the origin of the soy bean oil used for the
production of ESBO and the process. To prove the suitability of this marker for
ESBO, the mean content of 77 lids was analysed to 33.0±1.9 % (18:2E)Me(1).7
The common GC analysis of ESBO in food was done by the use of ethyl
11,12,14,15-diepoxyeicosanoate as internal standard, trans-methylation of the lipids
extracted from a sample, reaction of (18:2E)Me with cyclopentanone yielding 1,3-
dioxolanes and GC-(EI)MS analysis.11 The dioxolanes provide stability of the
epoxidized compounds, optimize the gas chromatographic separation from fatty acid
methyl esters, and shift the mass spectra to higher and more selective masses.
According to more time saving analysis, after addition of methyl 11,12,14,15-
diepoxyeicosanoate as internal standard, ESBO was directly transmethylated in the
food without prior fat extraction.12 Additionally, (18:2E)Me(1) was directly determined
without the transformation into dioxolanes by on-line liquid chromatography - gas
chromatography with flame ionisation detection (LC-GC/FID).7
Using the same fast sample preparation, very recently a GC analysis was
performed on polar stationary phases with FID detection for most food matrices, but
in case of difficult matrices chemical ionisation with ammonia and mass
Chapter V 93
spectrometric detection was favoured.13 However, the GC-FID method requires
tenfold extract concentration before GC analysis, to achieve a detection limit of 20
mg kg-1, and LC/GC-FID or GC-MS with chemical ionisation with ammonia,
respectively, are not common equipments of food control laboratories. Therefore,
regarding the advantages of fast sample preparation, it was the aim of the present
study to use GC-MS and GC-MS/MS instruments with 70 eV electron impact
ionisation for quantification of (18:2E)Me(1). For optimized analysis, 13C18-labelled
ethyl 9,10,12,13-diepoxyoctadecanoate (13C(18:2E)Et) was introduced as internal
standard, providing stable isotope dilution assay (SIDA) features after
transesterification into the corresponding methyl ester. Furthermore, the
chromatographic separation power of three different GC capillary columns was
checked for eleven different food matrices by means of mass spectrometric detection
in the selected ion monitoring (SIM) and the single reaction monitoring (SRM) mode.
V.3. Materials and Methods
Chemicals and reagents All chemicals were of analytical grade unless otherwise specified. ESBO
(Edenol D82) was a gift of the Official Food Control Authority of the Canton of Zürich
(Switzerland) and originally came from Vernicolor (Switzerland).
3-Chloroperoxybenzoic acid and methyl linoleate were purchased from Sigma-Aldrich
(Seelze, Germany), [1-18-13C]-ethyl linoleate from Euriso-Top GmbH (Saarbrücken,
Germany), sodium methoxide (30 % in methanol), all salts and solvents from Merck
(Darmstadt, Germany).
Preparation of 13C(18:2E)Et, 13C(18:2E)Me and (18:2E)Me According to the method described by Castle et al.,11 solutions of
3-chloroperoxybenzoic acid (50.4 mg / 1 mL chloroform) and 13C18-ethyl linoleate
(25.5 mg / 1 mL chloroform) were mixed in an 15 mL test screw capped tube and
kept at ambient temperature overnight. Thereafter extraction was performed three
times by 5 mL sodium sulfite (10 % in water), 5 mL sodium hydrogen carbonate
(10 % in water) and 5 mL water. The organic phase was diluted with 10 mL isooctane
and filtered over 5 g of anhydrous sodium sulphate into a 50 mL volumetric flask. The
Chapter V 94
test tube was rinsed with 20 mL isooctane given over the filter into the flask, which
was finally filled up to mark, to obtain the stock solution of the internal standard. By
dilution (2 mL / 15 mL) the internal standard working solution was obtained and
stored at -20 ºC.
To prepare 13C(18:2E)Me and get solution S(13C(18:2E)Me) for recording the
mass spectrum, 1 mL of the above stock solution was diluted with 4 mL
tetrahydrofuran (THF), and the transesterification was performed as described for the
sample preparation procedure, but without adding any more THF.
Following the same protocol, (18:2E)Me was synthesized starting from
unlabelled methyl linoleate. For GC-MS, 100 μL of the prepared (18:2E)Me stock
solution were filled up with isooctane to 10 mL, to obtain solution S((18:2E)Me).
Samples The following samples were purchased from local grocerys, all packed in glass
jars: three pesto a la Genovese, two pesto rosso, one surrogate of salmon in oil, one
garlic in oil and four baby food (vegetable with chicken, potatoes with carrots and
meat, spaghetti with vegetables and meat, potatoes with beans and meat); olive oil
for validation purposes (packed in a glass bottle with a closure made of metal and
polyethylene).
Validation For the on-matrix calibration, 21.3 mg ESBO were dissolved in 20 mL dioxane
and suitably diluted with dioxane to spike olive oil at the following levels: 1.1, 5.3,
10.7, 21.3, 32.0, 42.6, 53.3, 106.5, 159.8, 213.0, 266.3, 319.5, 372.8, 426.0, 479.3
and 532.5 mg kg-1. After addition of the ESBO solution the samples were
homogenized by thorough agitation with a glass bar. All samples were used to create
a calibration curve. To determine the limits of detection (LODs) and quantification
(LOQs), the signal to noise ratios of (18:2E)Me(1) were determined with the MS
Workstation software integrated tool (the noise was calculated as root mean square
(rms)) and manually to obtain values qualified through expertise. For the LODs a
manually determined signal to noise base of leastwise S/N = 3 and for the LOQs
S/N = 9, respectively, was decisive. The repeatability (within-run precision) and
Chapter V 95
recovery were calculated on the base of five separately spiked olive oil samples of
106.5 mg kg-1.
Sample preparation The pestos and baby food samples, including the food adhering to the lid,
were transferred into a beaker and homogenized with a ESGE Zauberstab (Unold
AG, Hockenheim, Germany). In case of products in oil, only the oil was used for the
analysis. Oil (100 mg), pesto (500 mg) or baby food (500 mg) samples were weighed
into a 50 mL screw capped vial, 100 μL internal standard solution and 4 mL THF
were added and mixed together. After the addition of 5 mL sodium methoxide
solution (6 % in methanol) the vial was shaken vigorously for 90 s. Extraction was
performed by the addition of 10 mL n-hexane and 10 mL disodium hydrogencitrate
(15 % in water), and the organic phase was used for GC analysis.
Spiked olive oil samples (53, 107, 213, and 426 mg kg-1) were prepared and
used for a four-point calibration to determine ESBO in samples.
GC columns and oven temperatures for the analysis in food (i) Varian (Darmstadt, Germany) VF-17ms (30 m lengh, 0.25 mm id., 0.25 µm
film thickness), oven temperature gradient: 80°C (2 min) / 200°C (15°C min-1) / 280°C
(8°C min-1) / 320°C (15°C min-1) / 320°C (2 min).
(ii) J & W Scientific (Agilent, Waldbronn, Germany) DB 1701 (30 m lengh,
0.25 mm id., 0.25 µm film thickness), oven temperature gradient: 80°C (2 min) /
200°C (15 C min-1) / 280°C (8°C min-1) / 300°C (15°C min-1) / 300°C (2 min).
(iii) J & W Scientific (Agilent, Waldbronn, Germany) DB 1 (30 m length, 0.25
mm id., 0.25 µm film thickness), oven temperature gradient: 80°C (2 min) / 320°C
(15°C min-1) / 320°C (2 min).
Gas chromatography- mass spectrometry (single and triple quadrupole conditions)
A Varian (Darmstadt, Germany) CP-3800 gas chromatograph with a
GERSTEL (Mülheim an der Ruhr, Germany) KAS 3 split/ splitless injector coupled to
a Varian 1200 triple quadrupole mass spectrometer was used with electron impact
(EI) ionization at 70 eV in the positive-ion mode. Data acquisition and analysis were
Chapter V 96
performed using standard software supplied by the manufacturer (Varian, MS
Workstation 6.2). The injection volume was 1 μL splitless. The injector started at a
temperature of 80°C, increased by 12°C s-1 to 320°C and hold this temperature for
10 min. The ion source and transferline temperature were 300 and 350°C,
respectively. Helium was used as carrier gas with a column head pressure of
117 kPa.
By using the MS in single quadrupole mode (GC-MS) the mass spectra of
(18:2E)Me(1) (with solution S((18:2E)Me) and 13C(18:2E)Me(1) (with solution
S(13C(18:2E)Me) were recorded from m/z 33-600 at a scan time of 0.5 scans s-1.
Product ion scans (PIS) were based on collision-induced dissociation (CID) occurring
in the collision cell of the tandem quadrupole. A peak width of 1.0 atomic mass units
(amu) was chosen for the precursor ions and the collision cell was operated with
argon (pressure 0.27 Pa) and a collision energy of -10 V. The PIS for (18:2E)Me(1)
scanned the precursor ions of m/z 155 in the range m/z 10-150 and for 13C(18:2E)Me(1) the precursor ions of m/z 164 in the range m/z 8-170 with a scan
time 0.2 scans s-1, respectively.
For quantification by GC-MS, the SIM mode was used for m/z 155
[(18:2E)Me(1)] and 164 [13C(18:2E)Me(1)], respectively, with a scan time of 0.2
scans s-1 and a peak width of 1.0 amu. The GC-MS/MS was run in SRM mode with
the same scan time, a peak width of 1.5 amu for the transitions m/z 155 → 67 and
m/z 164 → 72, respectively. For fragmentation the collision cell contained argon at a
pressure of 0.20 Pa, and the collision energy was set to -10 V.
Gas chromatography- mass spectrometry (ion trap conditions) Additional GC-MS2 analyses were performed with a 3400 Saturn4D ion trap
system (Varian, Darmstadt, Germany) in 70 eV electron impact ionization mode with
a CID time of 20 ms, a CID amplitude of 1 V and a CID rf storage level of m/z 35. The
carrier gas (helium) was used at a constant pressure of 22.5 PSI with a HP-5
(Agilent, Waldbronn, Germany) column (50 m length, 0.32 mm id., 0.17 μm film
thickness), the oven temperature gradient of 80°C (2 min) / 300°C (10°C min-1) /
300°C (2 min) and a transferline temperature of 300°C. For recording the mass
spectra, 1 μL of S(13C(18:2E)Me) and S((18:2E)Me) were injected in splitless mode.
Chapter V 97
The precursors m/z 109 for (18:2E)Me and m/z 117 for 13C(18:2E)Me, respectively,
were scanned from m/z 30-170.
V.4. Results and discussion
There are two great advantages of using 13C18-labelled ethyl diepoxyocta-
decanoate (13C(18:2E)Et) instead of the common internal standard methyl diepoxy-
eicosanate (20:2E)Me.7,13 During sample preparation, 13C(18:2E)Et is also
transesterified, together with the ESBO triglycerides, yielding the corresponding
methyl ester 13C(18:2E)Me as shown in the chromatograms of Figure 3. Therefore,
controlling of the transesterification process as important and sensible part of sample
preparation is enabled, which was also achieved by Castle et al.,11 using ethyl
diepoxyeicosanate as internal standard. However furthermore, the signals of the 13C(18:2E)Me and the analyte are obtained under absolute identical instrumental
conditions, regarding matrix effects. The chromatograms of the full scan GC-MS
analysis, recorded with the VF-17ms column, of (18:2E)Me and 13C(18:2E)Me
provide peaks at the same retention time of 17.7 min representing (18:2)Me(1) and 13C(18:2)Me(1), thus additionally providing the tools of SIDA.
The spectra of the full scan analysis show base peaks at m/z 155 and 164 for
(18:2E)Me(1) and 13C(18:2E)Me(1), respectively (Figure 2). Besides the base peak
both mass spectra look rather similar in terms peak pattern as comparable
fragmentation is to be expected. The significant fragment of (18:2E)Me(1) at m/z 155
was also found in the 70 eV spectra of both methyl 9,10-epoxyoctadecanoate and
methyl 9,10-epoxyoctadec-12-enoate,14 and in the spectra of dimeric fatty acids
formed by heating of methyl 9,10-epoxyoctadecanoate, methyl 9,10-
epoxyhexadecanoate, and methyl 9,10-epoxytetradecanoate.15 Therefore, it can be
concluded that m/z 155 is not only characteristic for (18:2E)Me, but generally typical
for 9,10-epoxidized fatty acid esters or 9-ether bridged fatty acid ester dimers. By
means of tandem mass spectrometry, the product ion scan (PIS) of m/z 155
((18:2E)Me(1)) gave m/z 109 (base peak) and m/z 67 as most abundant product ions
(Figure 2), whereas the PIS of m/z 164 (13C(18:2E)Me(1)) provided m/z 117 (base
peak) and m/z 72.
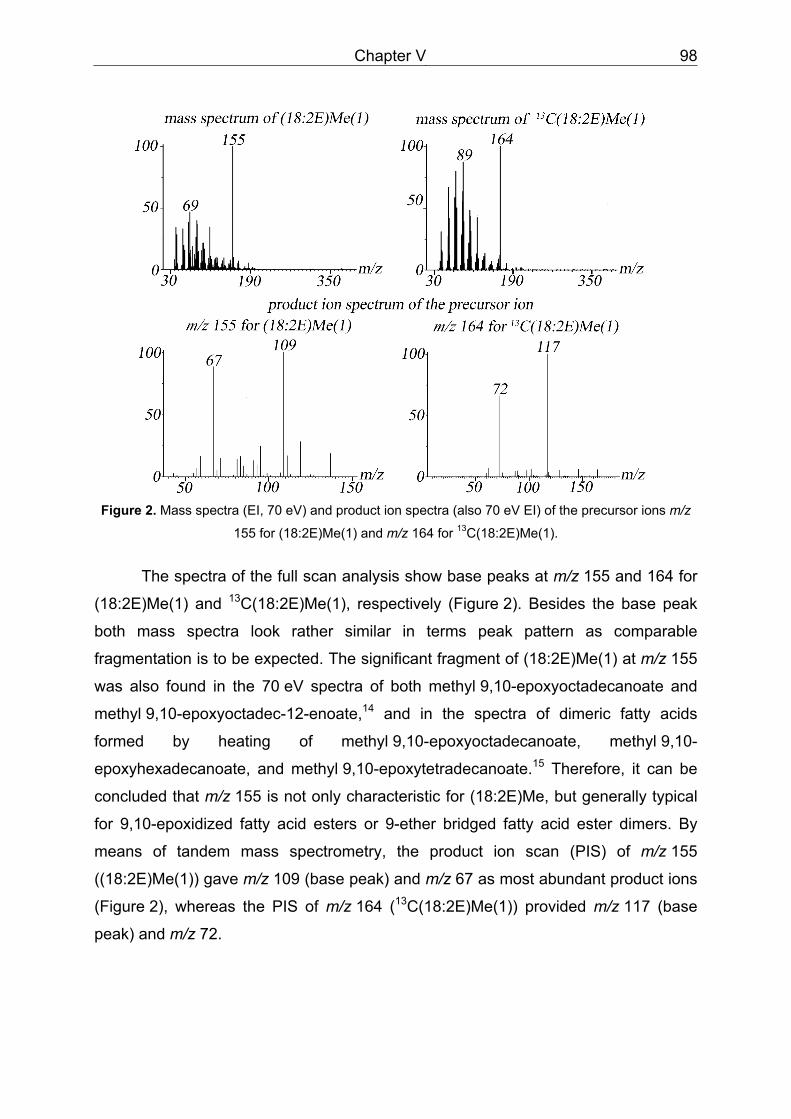
Chapter V 98
Figure 2. Mass spectra (EI, 70 eV) and product ion spectra (also 70 eV EI) of the precursor ions m/z
155 for (18:2E)Me(1) and m/z 164 for 13C(18:2E)Me(1).
The spectra of the full scan analysis show base peaks at m/z 155 and 164 for
(18:2E)Me(1) and 13C(18:2E)Me(1), respectively (Figure 2). Besides the base peak
both mass spectra look rather similar in terms peak pattern as comparable
fragmentation is to be expected. The significant fragment of (18:2E)Me(1) at m/z 155
was also found in the 70 eV spectra of both methyl 9,10-epoxyoctadecanoate and
methyl 9,10-epoxyoctadec-12-enoate,14 and in the spectra of dimeric fatty acids
formed by heating of methyl 9,10-epoxyoctadecanoate, methyl 9,10-
epoxyhexadecanoate, and methyl 9,10-epoxytetradecanoate.15 Therefore, it can be
concluded that m/z 155 is not only characteristic for (18:2E)Me, but generally typical
for 9,10-epoxidized fatty acid esters or 9-ether bridged fatty acid ester dimers. By
means of tandem mass spectrometry, the product ion scan (PIS) of m/z 155
((18:2E)Me(1)) gave m/z 109 (base peak) and m/z 67 as most abundant product ions
(Figure 2), whereas the PIS of m/z 164 (13C(18:2E)Me(1)) provided m/z 117 (base
peak) and m/z 72.
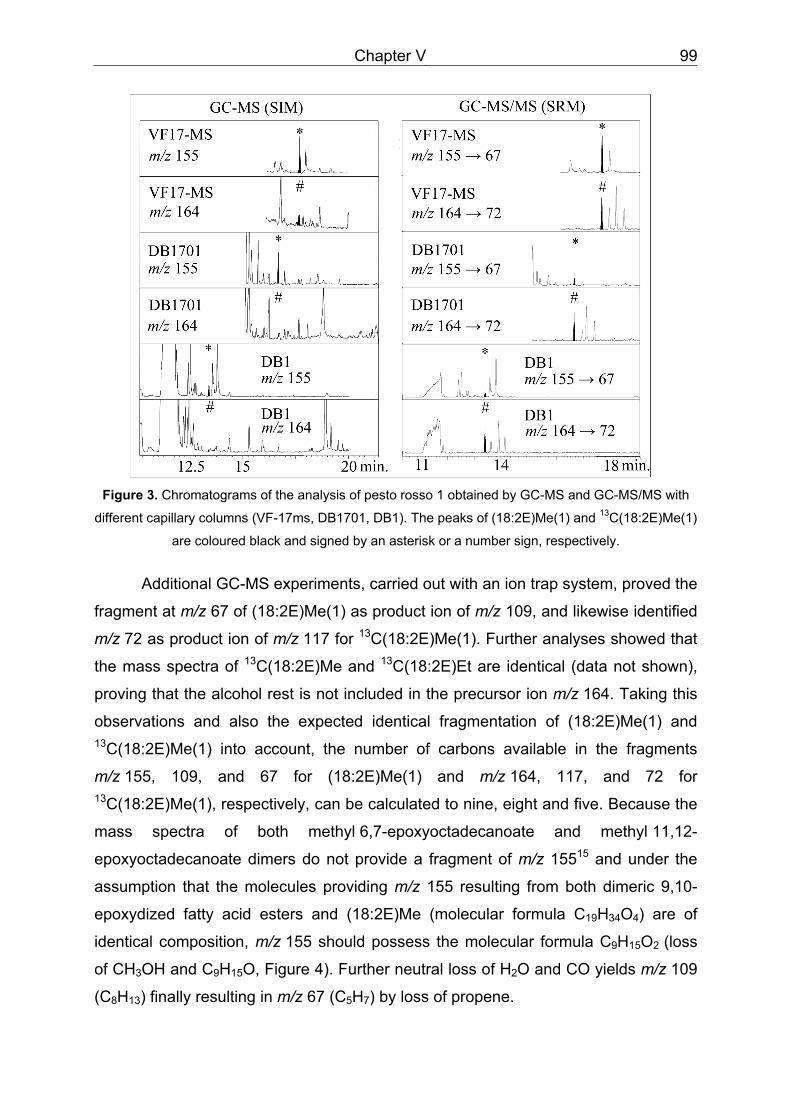
Chapter V 99
Figure 3. Chromatograms of the analysis of pesto rosso 1 obtained by GC-MS and GC-MS/MS with
different capillary columns (VF-17ms, DB1701, DB1). The peaks of (18:2E)Me(1) and 13C(18:2E)Me(1)
are coloured black and signed by an asterisk or a number sign, respectively.
Additional GC-MS experiments, carried out with an ion trap system, proved the
fragment at m/z 67 of (18:2E)Me(1) as product ion of m/z 109, and likewise identified
m/z 72 as product ion of m/z 117 for 13C(18:2E)Me(1). Further analyses showed that
the mass spectra of 13C(18:2E)Me and 13C(18:2E)Et are identical (data not shown),
proving that the alcohol rest is not included in the precursor ion m/z 164. Taking this
observations and also the expected identical fragmentation of (18:2E)Me(1) and 13C(18:2E)Me(1) into account, the number of carbons available in the fragments
m/z 155, 109, and 67 for (18:2E)Me(1) and m/z 164, 117, and 72 for 13C(18:2E)Me(1), respectively, can be calculated to nine, eight and five. Because the
mass spectra of both methyl 6,7-epoxyoctadecanoate and methyl 11,12-
epoxyoctadecanoate dimers do not provide a fragment of m/z 15515 and under the
assumption that the molecules providing m/z 155 resulting from both dimeric 9,10-
epoxydized fatty acid esters and (18:2E)Me (molecular formula C19H34O4) are of
identical composition, m/z 155 should possess the molecular formula C9H15O2 (loss
of CH3OH and C9H15O, Figure 4). Further neutral loss of H2O and CO yields m/z 109
(C8H13) finally resulting in m/z 67 (C5H7) by loss of propene.
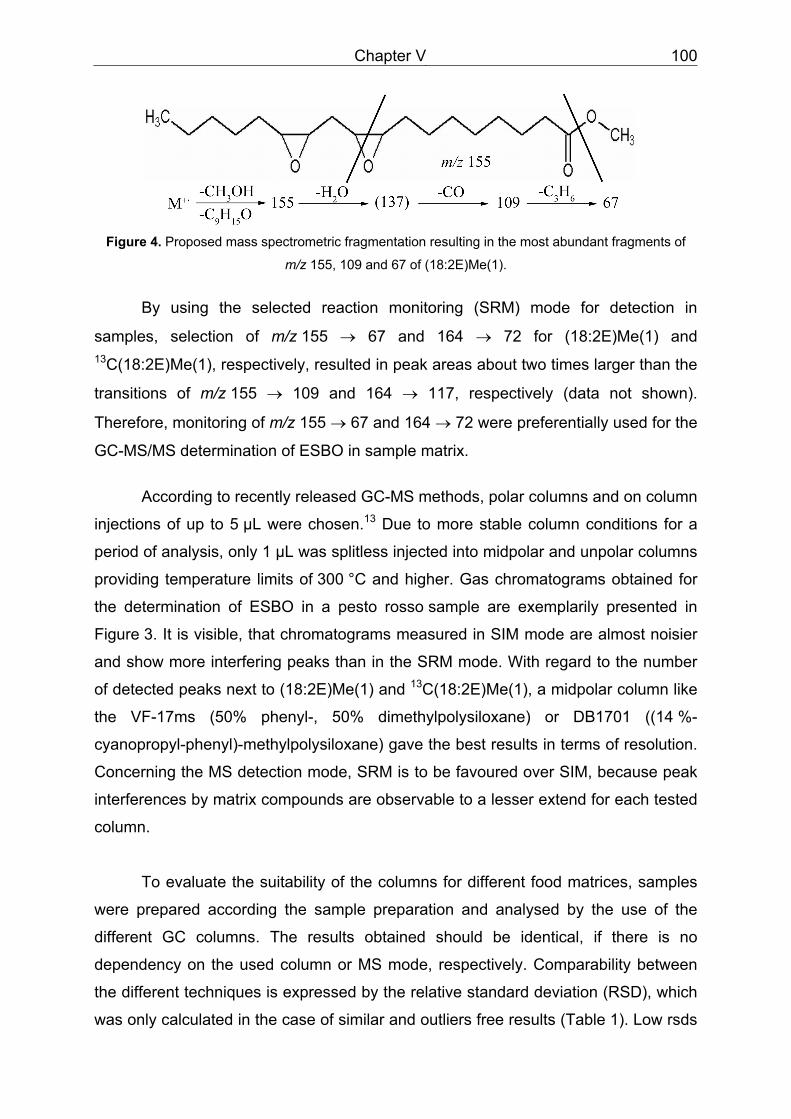
Chapter V 100
Figure 4. Proposed mass spectrometric fragmentation resulting in the most abundant fragments of
m/z 155, 109 and 67 of (18:2E)Me(1).
By using the selected reaction monitoring (SRM) mode for detection in
samples, selection of m/z 155 → 67 and 164 → 72 for (18:2E)Me(1) and 13C(18:2E)Me(1), respectively, resulted in peak areas about two times larger than the
transitions of m/z 155 → 109 and 164 → 117, respectively (data not shown).
Therefore, monitoring of m/z 155 → 67 and 164 → 72 were preferentially used for the
GC-MS/MS determination of ESBO in sample matrix.
According to recently released GC-MS methods, polar columns and on column
injections of up to 5 μL were chosen.13 Due to more stable column conditions for a
period of analysis, only 1 μL was splitless injected into midpolar and unpolar columns
providing temperature limits of 300 °C and higher. Gas chromatograms obtained for
the determination of ESBO in a pesto rosso sample are exemplarily presented in
Figure 3. It is visible, that chromatograms measured in SIM mode are almost noisier
and show more interfering peaks than in the SRM mode. With regard to the number
of detected peaks next to (18:2E)Me(1) and 13C(18:2E)Me(1), a midpolar column like
the VF-17ms (50% phenyl-, 50% dimethylpolysiloxane) or DB1701 ((14 %-
cyanopropyl-phenyl)-methylpolysiloxane) gave the best results in terms of resolution.
Concerning the MS detection mode, SRM is to be favoured over SIM, because peak
interferences by matrix compounds are observable to a lesser extend for each tested
column.
To evaluate the suitability of the columns for different food matrices, samples
were prepared according the sample preparation and analysed by the use of the
different GC columns. The results obtained should be identical, if there is no
dependency on the used column or MS mode, respectively. Comparability between
the different techniques is expressed by the relative standard deviation (RSD), which
was only calculated in the case of similar and outliers free results (Table 1). Low rsds
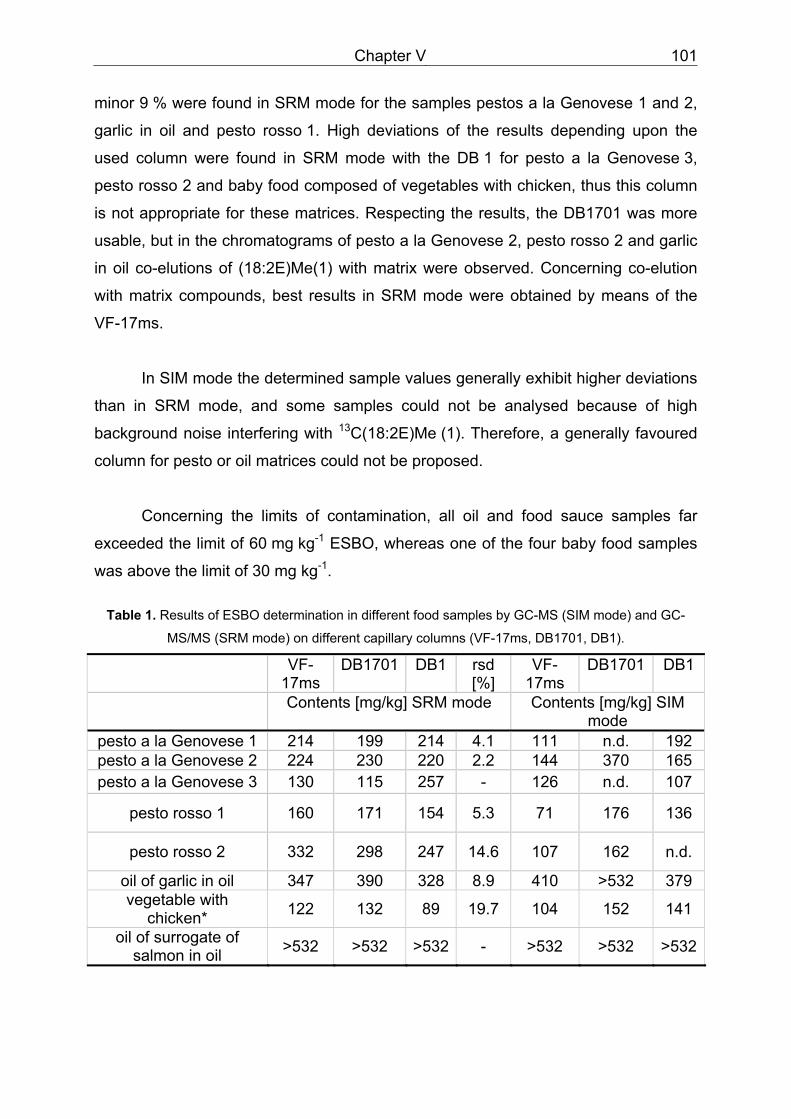
Chapter V 101
minor 9 % were found in SRM mode for the samples pestos a la Genovese 1 and 2,
garlic in oil and pesto rosso 1. High deviations of the results depending upon the
used column were found in SRM mode with the DB 1 for pesto a la Genovese 3,
pesto rosso 2 and baby food composed of vegetables with chicken, thus this column
is not appropriate for these matrices. Respecting the results, the DB1701 was more
usable, but in the chromatograms of pesto a la Genovese 2, pesto rosso 2 and garlic
in oil co-elutions of (18:2E)Me(1) with matrix were observed. Concerning co-elution
with matrix compounds, best results in SRM mode were obtained by means of the
VF-17ms.
In SIM mode the determined sample values generally exhibit higher deviations
than in SRM mode, and some samples could not be analysed because of high
background noise interfering with 13C(18:2E)Me (1). Therefore, a generally favoured
column for pesto or oil matrices could not be proposed.
Concerning the limits of contamination, all oil and food sauce samples far
exceeded the limit of 60 mg kg-1 ESBO, whereas one of the four baby food samples
was above the limit of 30 mg kg-1.
Table 1. Results of ESBO determination in different food samples by GC-MS (SIM mode) and GC-
MS/MS (SRM mode) on different capillary columns (VF-17ms, DB1701, DB1).
VF-17ms
DB1701 DB1 rsd [%]
VF-17ms
DB1701 DB1
Contents [mg/kg] SRM mode Contents [mg/kg] SIM mode
pesto a la Genovese 1 214 199 214 4.1 111 n.d. 192 pesto a la Genovese 2 224 230 220 2.2 144 370 165 pesto a la Genovese 3 130 115 257 - 126 n.d. 107
pesto rosso 1 160 171 154 5.3 71 176 136
pesto rosso 2 332 298 247 14.6 107 162 n.d.
oil of garlic in oil 347 390 328 8.9 410 >532 379 vegetable with
chicken* 122 132 89 19.7 104 152 141
oil of surrogate of salmon in oil >532 >532 >532 - >532 >532 >532
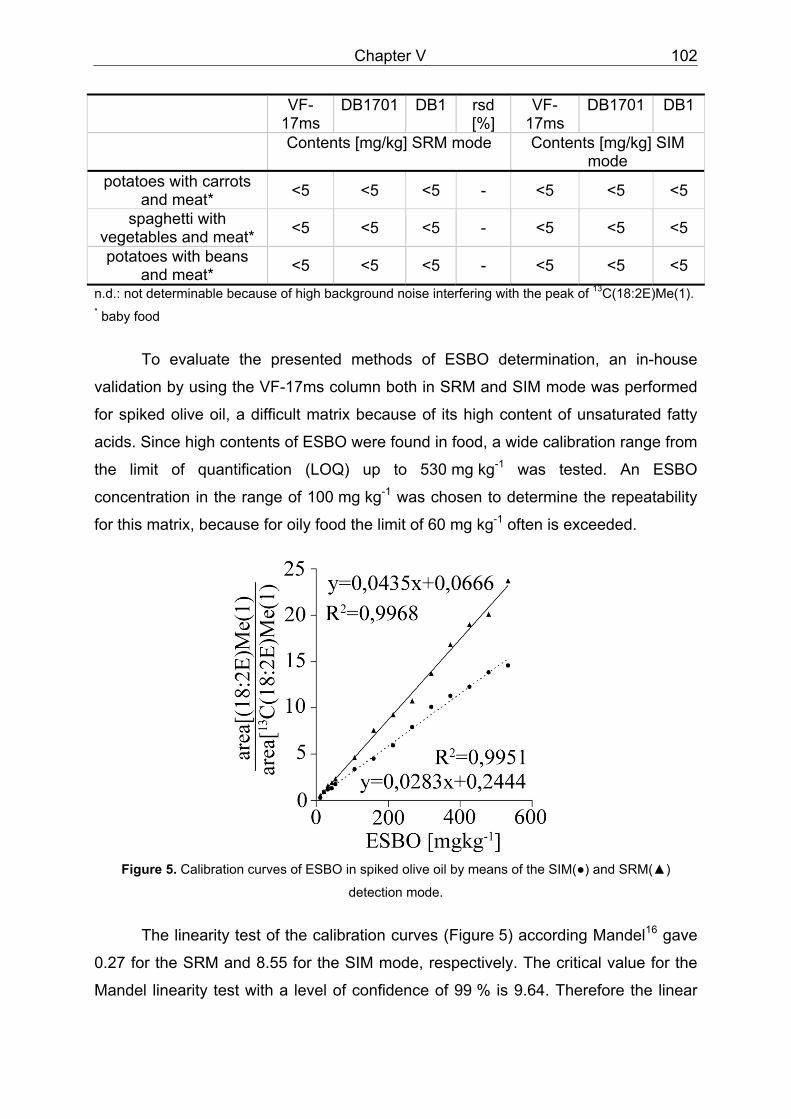
Chapter V 102
VF-17ms
DB1701 DB1 rsd [%]
VF-17ms
DB1701 DB1
Contents [mg/kg] SRM mode Contents [mg/kg] SIM mode
potatoes with carrots and meat* <5 <5 <5 - <5 <5 <5
spaghetti with vegetables and meat* <5 <5 <5 - <5 <5 <5
potatoes with beans and meat* <5 <5 <5 - <5 <5 <5
n.d.: not determinable because of high background noise interfering with the peak of 13C(18:2E)Me(1). * baby food
To evaluate the presented methods of ESBO determination, an in-house
validation by using the VF-17ms column both in SRM and SIM mode was performed
for spiked olive oil, a difficult matrix because of its high content of unsaturated fatty
acids. Since high contents of ESBO were found in food, a wide calibration range from
the limit of quantification (LOQ) up to 530 mg kg-1 was tested. An ESBO
concentration in the range of 100 mg kg-1 was chosen to determine the repeatability
for this matrix, because for oily food the limit of 60 mg kg-1 often is exceeded.
Figure 5. Calibration curves of ESBO in spiked olive oil by means of the SIM(●) and SRM(▲)
detection mode.
The linearity test of the calibration curves (Figure 5) according Mandel16 gave
0.27 for the SRM and 8.55 for the SIM mode, respectively. The critical value for the
Mandel linearity test with a level of confidence of 99 % is 9.64. Therefore the linear
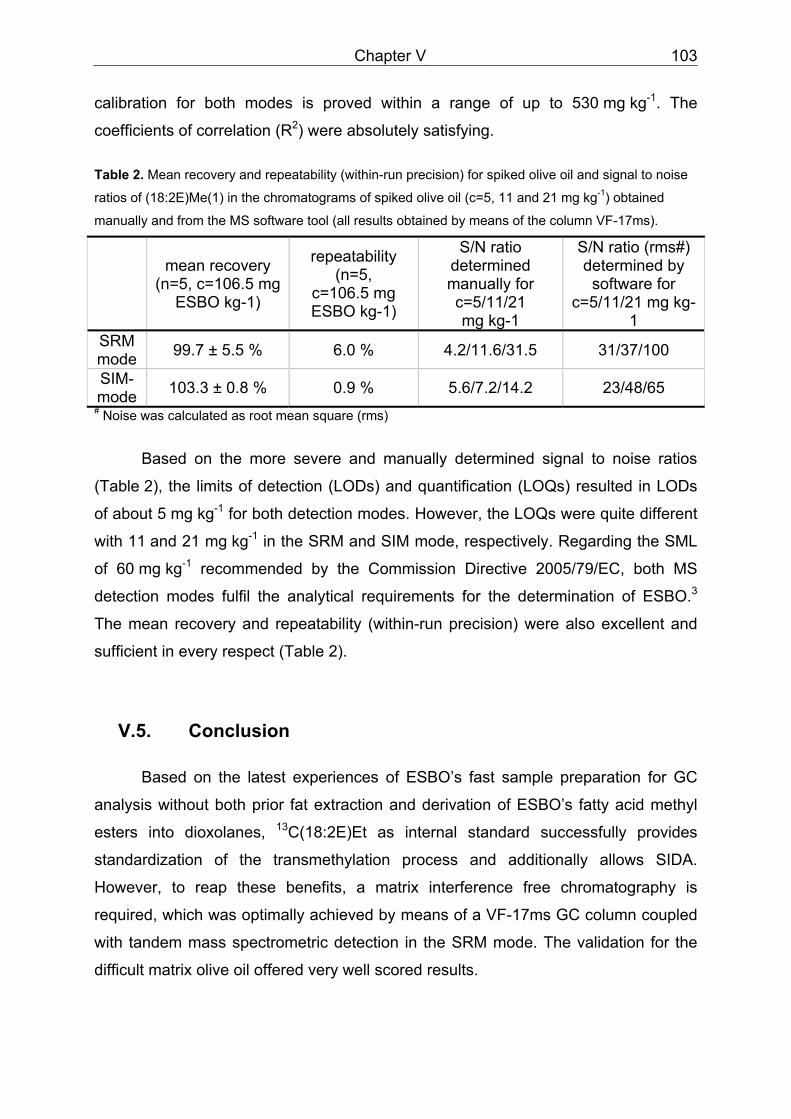
Chapter V 103
calibration for both modes is proved within a range of up to 530 mg kg-1. The
coefficients of correlation (R2) were absolutely satisfying.
Table 2. Mean recovery and repeatability (within-run precision) for spiked olive oil and signal to noise
ratios of (18:2E)Me(1) in the chromatograms of spiked olive oil (c=5, 11 and 21 mg kg-1) obtained
manually and from the MS software tool (all results obtained by means of the column VF-17ms).
mean recovery
(n=5, c=106.5 mg ESBO kg-1)
repeatability (n=5,
c=106.5 mg ESBO kg-1)
S/N ratio determined manually for c=5/11/21 mg kg-1
S/N ratio (rms#) determined by software for
c=5/11/21 mg kg-1
SRM mode 99.7 ± 5.5 % 6.0 % 4.2/11.6/31.5 31/37/100
SIM-mode 103.3 ± 0.8 % 0.9 % 5.6/7.2/14.2 23/48/65
# Noise was calculated as root mean square (rms)
Based on the more severe and manually determined signal to noise ratios
(Table 2), the limits of detection (LODs) and quantification (LOQs) resulted in LODs
of about 5 mg kg-1 for both detection modes. However, the LOQs were quite different
with 11 and 21 mg kg-1 in the SRM and SIM mode, respectively. Regarding the SML
of 60 mg kg-1 recommended by the Commission Directive 2005/79/EC, both MS
detection modes fulfil the analytical requirements for the determination of ESBO.3
The mean recovery and repeatability (within-run precision) were also excellent and
sufficient in every respect (Table 2).
V.5. Conclusion
Based on the latest experiences of ESBO’s fast sample preparation for GC
analysis without both prior fat extraction and derivation of ESBO’s fatty acid methyl
esters into dioxolanes, 13C(18:2E)Et as internal standard successfully provides
standardization of the transmethylation process and additionally allows SIDA.
However, to reap these benefits, a matrix interference free chromatography is
required, which was optimally achieved by means of a VF-17ms GC column coupled
with tandem mass spectrometric detection in the SRM mode. The validation for the
difficult matrix olive oil offered very well scored results.
Chapter V 104
V.6. Acknowledgement
The authors would like to thank CVUA Stuttgart and especially Mr. Altkofer
and Ms. Morandini for supply with equipment, materials and support.
V.7. References:
1. Fankhauser-Noti A, Biedermann-Brem S, Grob K. PVC plasticisers/additives
migrating from the gaskets of metal closures into oily food: Swiss market survey
June 2005. European Food Research and Technology 2006; 223(4): pp.447-453
2. European Communities. Synoptic Document. Available at
http://europa.eu.int/comm/food/food/chemicalsafety/foodcontact/synoptic_doc_en
.pdf. Accessed 13 November 2007
3. European Communities. Commission Directive 2005/79/EC of 18 November 2005
amending Directive 2002/72/EC relating to plastic materials and articles intended
to come into contact with food. Official Journal of the European Union 2005; L 302: pp.35-45
4. Biedermann-Brem S, Biedermann M, Fiselier K, Grob K. Compositional GC-FID
analysis of the additives to PVC, focusing on the gaskets of lids for glass jars.
Food Additives & Contaminants 2005; 22(12): pp.1274-1284
5. Hammarling L, Gustavsson H, Svensson K, Karlsson S, Oskarsson A. Migration
of epoxidized soya bean oil from plasticized PVC gaskets into baby food. Food
Addit Contam 1998; 15(2): pp.203-208
6. Fantoni L, Simoneau C. European survey of contamination of homogenized baby
food by epoxidized soybean oil migration from plasticized PVC gaskets. Food
Additives & Contaminants 2003; 20(11): pp.1087-1096
7. Fankhauser-Noti A, Fiselier K, Biedermann-Brem S, Grob K. Epoxidized soy
bean oil migrating from the gaskets of lids into food packed in glass jars. Analysis
by on-line liquid chromatography-gas chromatography. J Chromatogr A 2005;
1082(2): pp.214-219
Chapter V 105
8. Suman M, La Tegola S, Catellani D, Bersellini U. Liquid Chromatography-
Electrospray Ionization-Tandem Mass Spectrometry Method for the
Determination of Epoxidized Soybean Oil in Food Products. Journal of
Agricultural and Food Chemistry 2005; 53(26): pp.9879-9884
9. Rebek J, Jr., Marshall L, McManis J, Wolak R. Convergent functional groups. 2.
Structure and selectivity in olefin epoxidation with peracids. Journal of Organic
Chemistry 1986; 51(10): pp.1649-1653
10. Fankhauser-Noti A, Fiselier K, Biedermann-Brem S, Grob K. Assessment of
epoxidized soy bean oil (ESBO) migrating into foods: Comparison with ESBO-like
epoxy fatty acids in our normal diet. Food and Chemical Toxicology 2006; 44(8):
pp.1279-1286
11. Castle L, Sharman M, Gilbert J. Gas chromatographic-mass spectrometric
determination of epoxidized soybean oil contamination of food by migration from
plastic packaging. Journal - Association of Official Analytical Chemists 1988;
71(6): pp.1183-1186
12. Suter B, Grob K, Pacciarelli B. Determination of fat content and fatty acid
composition through 1-min transesterification in the food sample. Principles.
Z.Lebensm.-Unters.Forsch.A 1997; 204(4): pp.252-258
13. Biedermann-Brem S, Biedermann M, Fankhauser-Noti A, Grob K, Helling R.
Determination of epoxidized soy bean oil (ESBO) in oily foods by GC-FID or GC-
MS analysis of the methyl diepoxy linoleate. European Food Research and
Technology 2007; 224(3): pp.309-314
14. Dr William W Christie. The Lipid Library. Available at http://www.lipidlibrary.co.uk/.
Accessed 22 November 2006
15. Gilbert J, Shepherd MJ, Startin JR, Eagles J. Dimeric epoxy fatty acid methyl
esters: formation, chromatography and mass spectrometry. Chemistry and
Physics of Lipids 1981; 28(1): pp.61-68
16. IUPAC. Guidelines for Calibration in Analytical Chemistry Part 1: Fundamentals
and Single Component Calibration. Pure and Applied Chemistry 1998; 70(4):
pp.993-1014
Chapter VI 106
VI. Rapid and nondestructive analysis of phthalic acid esters in toys of polyvinyl chloride by direct analysis in real time–single quadrupole mass spectrometry (DART–MS).
THORSTEN ROTHENBACHER, WOLFGANG SCHWACK
Institut für Lebensmittelchemie, Universität Hohenheim,
Garbenstr. 28, 70599 Stuttgart, Germany, Correspondence
to:W. Schwack, e-mail: [email protected]
VI.1. Abstract
In the European Community, selected phthalic acid esters (PAE) are restricted
in their use for the manufacturing of toys and childcare articles to a content of 0.1%
by weight. As they are mainly used as plasticisers for polyvinyl chloride (PVC), a
rapid screening method for PVC samples with direct analysis in real time ionisation
and single quadrupole mass spectrometry (DART™–MS) was developed. Using the
most intensive protonated molecules, a limit of detection (LOD) of 0.05% was
obtained for benzyl butyl phthalate, bis(2-ethylhexyl) phthalate and di-isononyl
phthalate, while for dibutyl phthalate, di-n-octyl phthalate and di-isodecyl phthalate
the LOD was 0.1%. Validation of identification by ammonium adducts and
characteristic fragments was possible to a content of ≥1% for all PAEs, except for
benzyl butyl phthalate (≥5%). Based on fragmentation products, bis(2-ethylhexyl)
phthalate clearly could be distinguished from di-n-octyl phthalate, if the
concentrations were ≥5% and ≥1% at measured DART™ helium temperatures of 130
and 310 ºC, respectively. The complete analysis of one sample only took about 8
minutes. At the generally used gas temperature of 130 ºC, most toy and childcare
samples did not sustain damage if their shape fitted into the DART™ source.
Chapter VI 107
VI.2. Introduction
Phthalic acid esters (PAE) represent an important group of plasticisers for
polyvinyl chloride (PVC), which also were used since many years for the fabrication
of toys and childcare articles made from PVC. Since in 1999 several European
Member States expressed concerns about the risk of adverse effects of phthalates
on the health of children,1 six PAE in toys and childcare articles were temporarily
banned from the European market. The facts that i) the toxicology of all phthalates in
humans was not totally clarified, ii) especially bis(2-ethylhexyl) phthalate (DEHP)
clearly showed adverse effects on the development and reproduction of laboratory
animals,2,3 and iii) a high level of health protection, especially for children, was
demanded, led to a permanent regulation for phthalates.4 Actual results show that
different PAE act on the same target organ, but they individually possess complex
modes of action.5 Therefore, the council directive 76/769/EEC of the European
Commission in its actual form prohibits to place toys and childcare articles on the
market, which contain bis(2-ethylhexyl) phthalate (DEHP), dibutyl phthalate (DBP) or
benzyl butyl phthalate (BBP) at concentrations of more than 0.1% by mass of the
material. This is equivalent for di-isononyl phthalate (DINP), diisodecyl phthalate
(DIDP) or di-n-octyl phthalate (DNOP), if the articles can be taken into the mouth by
children.6
According to a survey of 72 toys made from PVC and purchased in 17
different countries, nearly all toys or at least their PVC subsections contained PAE,
mainly in the range 10-40% by weight.7 More actual data were obtained from the
European Union rapid alert system for all dangerous consumer products (RAPEX),8
in which toys or childcare products are named together with the reason of
hazardousness. A search for the phrase ‘phthalate’ in the notifications of 2008
resulted in 143 hits, but cosmetics, clothing and stationery products were also
included herein, and the search result only represented those entries, in which a
nomenclature was used that contained the term ‘phthalate’. Entries that used a
nomenclature like e.g. ‘* phthalic acid ester’ did not result in a hit. A closer look at
each alert of 2008 identified 140 toys or childcare products having been withdrawn
from the market due to PAE violations. In seven samples, the PAE content was
below 3%, and in nine samples just an analysis result of >0.1% was given. Vice
versa, 95% of the notified samples revealed PAE at 3% or more.
Chapter VI 108
For the determination of PAE in plastic toys according published methods,
about 1 g of the sample is directly soxhlet extracted with dichloromethane for 16 h9 or
is finely grounded and extracted twice by sonication in hexane for 30 min.7 The
extracted phthalates are determined by gas chromatography with flame ionisation or
mass spectrometric detection. Extraction of PVC by accelerated solvent extraction
also led to good results.10 Another approach for the analysis of PAE in PVC consists
in completely dissolving the plastic in tetrahydrofuran and precipitating PVC by the
addition of methanol. Determination was performed by high performance liquid
chromatography or high performance thin-layer chromatography (HPTLC).11 HPTLC
was especially used to facilitate quantification of the isoalkyl PAE DINP and DIDP,
which both are mixtures of several compounds, resulting in a sharply separated
HPTLC zone instead of a hump during HPLC for both DINP and DIDP.
As toys or childcare products contain alternative plasticisers substituting PAE,
the analysis of PAE is possibly done to no avail. To avoid wasting of solvents,
instrumental measuring and human working time, rapid identification methods are
worthwhile to check the presence of phthalates in the specimens prior to exact
determination. As PAEs are regulated differentially by authorities, the method should
be at least able to distinguish DEHP, DBP and BBP from DIDP, DINP and DNOP.
Following this objective, different pure phthalates were measured by fourier transform
Raman spectroscopy (FTRS), but an identification in PVC was successfully
demonstrated only for DEHP.12 However, due to similarities in the spectra of the
common dialkyl phthalates it is doubtful, whether it would be possible to qualitatively
determine the exact kind of phthalate ester present in a sample containing a mix of
phthalates.
Therefore, the aim of the present study was to evaluate, if a rapid screening
test for PAE in PVC materials can be developed by using direct analysis in real time–
mass spectrometry (DART™–MS), with an open interface allowing to directly insert
solid specimens.13,14 DART™-MS was successfully employed for the analysis of
different compounds in almost solid samples, like strobilurin fungicides in wheat,15
flavors in perfumery raw materials,16 and isopropylthioxanthone17 or lubricant
additives18 from HPTLC plates.
Chapter VI 109
As DART™ is a rather new ionisation technique, characteristic ions of
phthalates as standards and in PVC plastics containing additives (also called
plastisols) had to be identified, the sensivity of identification to be evaluated, and the
applicability to toy samples of known PAE concentrations to be shown.
VI.3. Experimental
Chemicals and reagents The following chemicals were of analytical grade unless otherwise specified.
Toluene was from Roth (Karlsruhe, Germany) benzyl butyl phthalate (BBP) from
Merck (Darmstadt, Germany), dibutyl phthalate (DBP) and dioctyl phthalate (DNOP)
from Sigma-Aldrich (Taufkirchen, Germany). Bis(2-ethylhexyl) phthalate (DEHP),
diisodecyl phthalate (DIDP), diisononyl phthalate (DINP), and 1,2-
cyclohexanedicarboxylic acid 1,2-diisononyl ester (DINCH) were of technical grade
and were provided by a plastisol producing company. Vinnolit P 70 was used as PVC
material and was provided by Vinnolit GmbH & Co. KG, Wacker Chemie AG
(Burghausen, Germany).
Plastisol samples
Twenty five different plastisols of three different types containing a) DBP &
DINP, b) DEHP & DIDP and c) BBP & DNOP at mass percentages of 0%, 0.05%,
0.01%, 0.5%, 1%, 5%, 10%, 15%, and 25% were prepared. Generally, plastisols
contained 60% PVC and the respective PAE, which were filled up to 40% with
DINCH. In case of the plastisols with 25% PAE, PVC was only present at 50%, and
DINCH was not used. To prepare the plastisols, about 0.5-1 g of the PVC and the
platicisers were mixed with a metal spatula in a 10 mL glass beaker until the mixture
was a homogenous and colourless paste. Then, it was coated with about 1 mm
thickness on a heating plate covered by aluminum foil at 200ºC. After one minute, the
aluminum foil was removed from the plate to cool off the plastisol.
Toy samples
Five toys made from PVC and containing PAE or DINCH were provided by
Chemisches und Veterinäruntersuchungsamt Stuttgart (Germany) and were already
analysed for plasticisers: a horror mask (42.6% DEHP), childrens’ swimming aids
Chapter VI 110
(16.2% DEHP and 23.0% DINP), 2 heads of puppets (containing 22.0% DINP or
35.4% DINCH, respectively), and a fish (30.8% DINCH). Additionally, three about 25
year old toys with unknown content of PAEs were used for analysis: one lizard, one
bicycle driver and one squeaky toy.
DART™–MS
An Ion Sense DART™ 100 with Vapur API-Interface, DART™ control software
version 2.19 (KR Analytical, Sandbach, UK) and a G1956B MSD single quadrupole
mass spectrometer with ChemStation B.02.01 SR2 software (Agilent Technologies,
Waldbronn, Germany) were used. The DART™’s needle voltage was 4000 V,
discharge and grid electrode were each at 280 V. DART™ was operated at 200 °C
with helium 5.0 (purity > 99.999%) at a flow rate of 5–6 L min-1, controlled by a GFM
17 flowmeter (Analyt-MTC, Müllheim, Germany). The MSD was operated in positive
fast-scan mode m/z 140-920 with a step size of 0.1 amu, a cycle time of
0.79 s cycle-1, a capillary voltage of 6000 V, a fragmentor voltage of 200 V, a gain of
1.00 and a threshold of 0. The data were recorded in profile mode.
Mass spectra of the target PAE were obtained by dissolving the substances in
toluene (0.1–1 g L-1) and introducing the samples by means of DIP-it liquid samplers
(KR Analytical) under the same MS conditions as described above. Plastisol
specimens of about 2 x 0.2 cm were manually introduced into the DART™ gas
stream by use of tweezers. Replicate measurements of plastisols were performed
from the same spot, when a depletion of the signals was not observed. The gap
between the DART™ gas outlet and the Vapur API Interface inlet was 1.1 cm, the
lengh of the ceramic tube 3.9 cm and the sampling point in the middle of the gap
(Figure 1). Each sample was measured six times, consecutively, while keeping it in
the same position in the helium stream for about 30 seconds. When the sample was
inserted, the signal increased in a split second, remained at a constant level and,
after sample removal, generally decreased within several seconds, depending on the
PAE content. In replicate measurements, the signal heights showed deviations
concerning the intensity.
For data evaluation, the set of mass spectra recorded during the measuring
time (30 s) and resulting in a total ion current ‘peak’ was averaged. Background
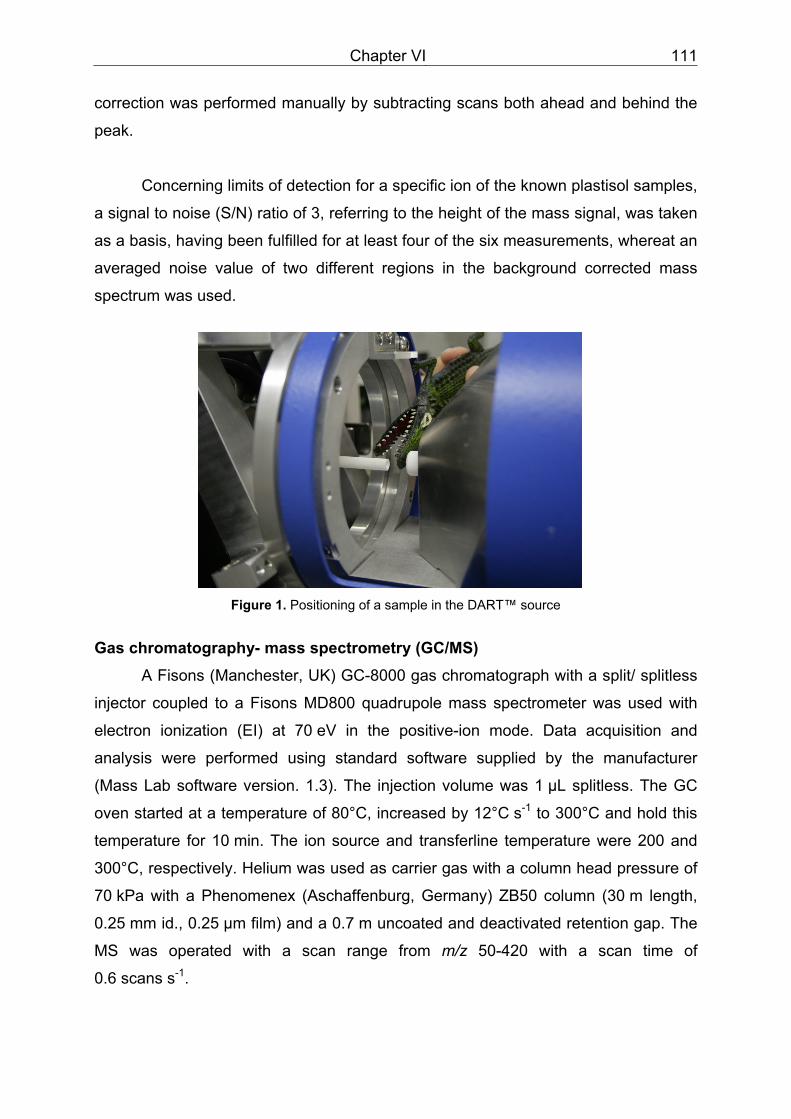
Chapter VI 111
correction was performed manually by subtracting scans both ahead and behind the
peak.
Concerning limits of detection for a specific ion of the known plastisol samples,
a signal to noise (S/N) ratio of 3, referring to the height of the mass signal, was taken
as a basis, having been fulfilled for at least four of the six measurements, whereat an
averaged noise value of two different regions in the background corrected mass
spectrum was used.
Figure 1. Positioning of a sample in the DART™ source
Gas chromatography- mass spectrometry (GC/MS)
A Fisons (Manchester, UK) GC-8000 gas chromatograph with a split/ splitless
injector coupled to a Fisons MD800 quadrupole mass spectrometer was used with
electron ionization (EI) at 70 eV in the positive-ion mode. Data acquisition and
analysis were performed using standard software supplied by the manufacturer
(Mass Lab software version. 1.3). The injection volume was 1 μL splitless. The GC
oven started at a temperature of 80°C, increased by 12°C s-1 to 300°C and hold this
temperature for 10 min. The ion source and transferline temperature were 200 and
300°C, respectively. Helium was used as carrier gas with a column head pressure of
70 kPa with a Phenomenex (Aschaffenburg, Germany) ZB50 column (30 m length,
0.25 mm id., 0.25 µm film) and a 0.7 m uncoated and deactivated retention gap. The
MS was operated with a scan range from m/z 50-420 with a scan time of
0.6 scans s-1.
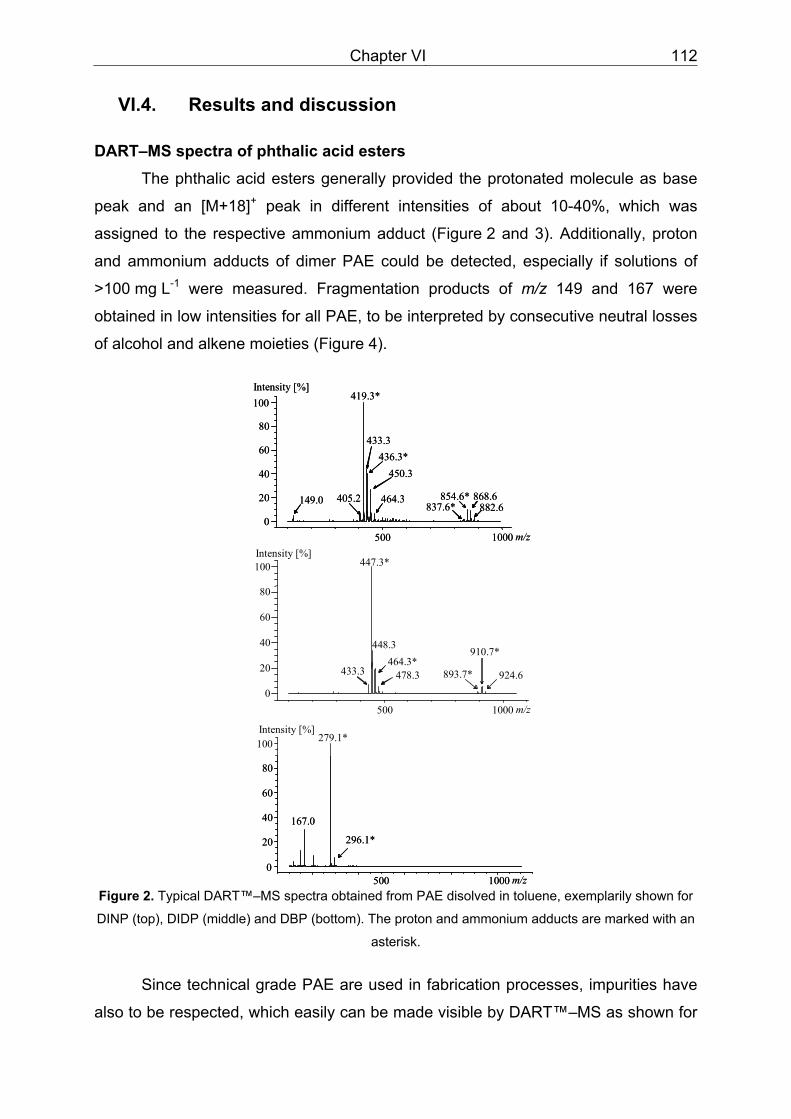
Chapter VI 112
VI.4. Results and discussion
DART–MS spectra of phthalic acid esters The phthalic acid esters generally provided the protonated molecule as base
peak and an [M+18]+ peak in different intensities of about 10-40%, which was
assigned to the respective ammonium adduct (Figure 2 and 3). Additionally, proton
and ammonium adducts of dimer PAE could be detected, especially if solutions of
>100 mg L-1 were measured. Fragmentation products of m/z 149 and 167 were
obtained in low intensities for all PAE, to be interpreted by consecutive neutral losses
of alcohol and alkene moieties (Figure 4).
m/z5000
20
40
60
80
100
405.2882.6
464.3
436.3*
419.3*Intensity [%]
433.3
450.3
854.6*837.6*
868.6
1000
149.0
5000
20
40
60
80
100
478.3
910.7*448.3
447.3*
1000
464.3*924.6893.7*433.3
m/z
Intensity [%]
0
20
40
60
80
100
500 1000 m/z
Intensity [%]279.1*
296.1*
167.0
m/z5000
20
40
60
80
100
405.2882.6
464.3
436.3*
419.3*Intensity [%]
433.3
450.3
854.6*837.6*
868.6
1000
149.0
5000
20
40
60
80
100
478.3
910.7*448.3
447.3*
1000
464.3*924.6893.7*433.3
m/z
Intensity [%]
0
20
40
60
80
100
500 1000 m/z
Intensity [%]279.1*
296.1*
167.0
Figure 2. Typical DART™–MS spectra obtained from PAE disolved in toluene, exemplarily shown for
DINP (top), DIDP (middle) and DBP (bottom). The proton and ammonium adducts are marked with an
asterisk.
Since technical grade PAE are used in fabrication processes, impurities have
also to be respected, which easily can be made visible by DART™–MS as shown for
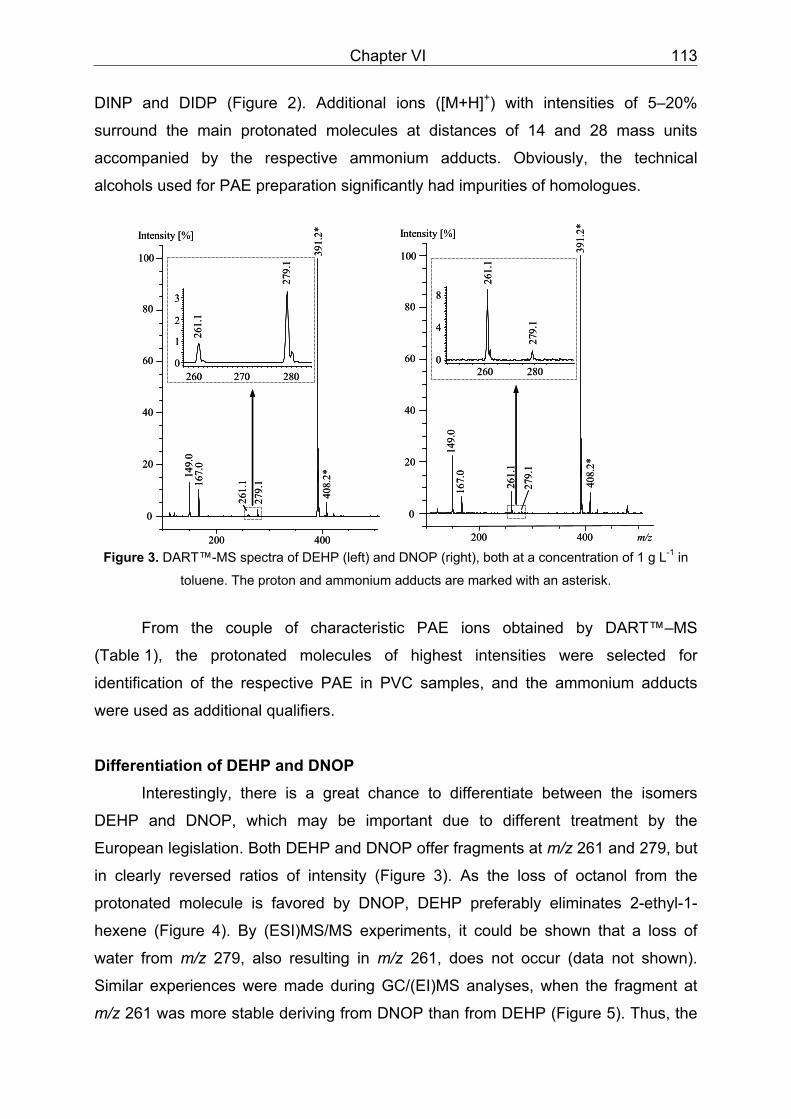
Chapter VI 113
DINP and DIDP (Figure 2). Additional ions ([M+H]+) with intensities of 5–20%
surround the main protonated molecules at distances of 14 and 28 mass units
accompanied by the respective ammonium adducts. Obviously, the technical
alcohols used for PAE preparation significantly had impurities of homologues.
200 400
408.
2*
167.
0
261.
1
149.
0
279.
1
391.
2*
200 400
0
20
40
60
80
100
167.
0
279.
1
391.
2*40
8.2*
261.
1
149.
0
Intensity [%]
0
1
2
3
260 270 280
279.
1
261.
1
m/z
260 2800
4
8
279.
1
261.
1
0
20
40
60
80
100
Intensity [%]
200 400
408.
2*
167.
0
261.
1
149.
0
279.
1
391.
2*
200 400
0
20
40
60
80
100
167.
0
279.
1
391.
2*40
8.2*
261.
1
149.
0
Intensity [%]
0
1
2
3
260 270 280
279.
1
261.
1
m/z
260 2800
4
8
279.
1
261.
1
0
20
40
60
80
100
Intensity [%]
Figure 3. DART™-MS spectra of DEHP (left) and DNOP (right), both at a concentration of 1 g L-1 in
toluene. The proton and ammonium adducts are marked with an asterisk.
From the couple of characteristic PAE ions obtained by DART™–MS
(Table 1), the protonated molecules of highest intensities were selected for
identification of the respective PAE in PVC samples, and the ammonium adducts
were used as additional qualifiers.
Differentiation of DEHP and DNOP Interestingly, there is a great chance to differentiate between the isomers
DEHP and DNOP, which may be important due to different treatment by the
European legislation. Both DEHP and DNOP offer fragments at m/z 261 and 279, but
in clearly reversed ratios of intensity (Figure 3). As the loss of octanol from the
protonated molecule is favored by DNOP, DEHP preferably eliminates 2-ethyl-1-
hexene (Figure 4). By (ESI)MS/MS experiments, it could be shown that a loss of
water from m/z 279, also resulting in m/z 261, does not occur (data not shown).
Similar experiences were made during GC/(EI)MS analyses, when the fragment at
m/z 261 was more stable deriving from DNOP than from DEHP (Figure 5). Thus, the
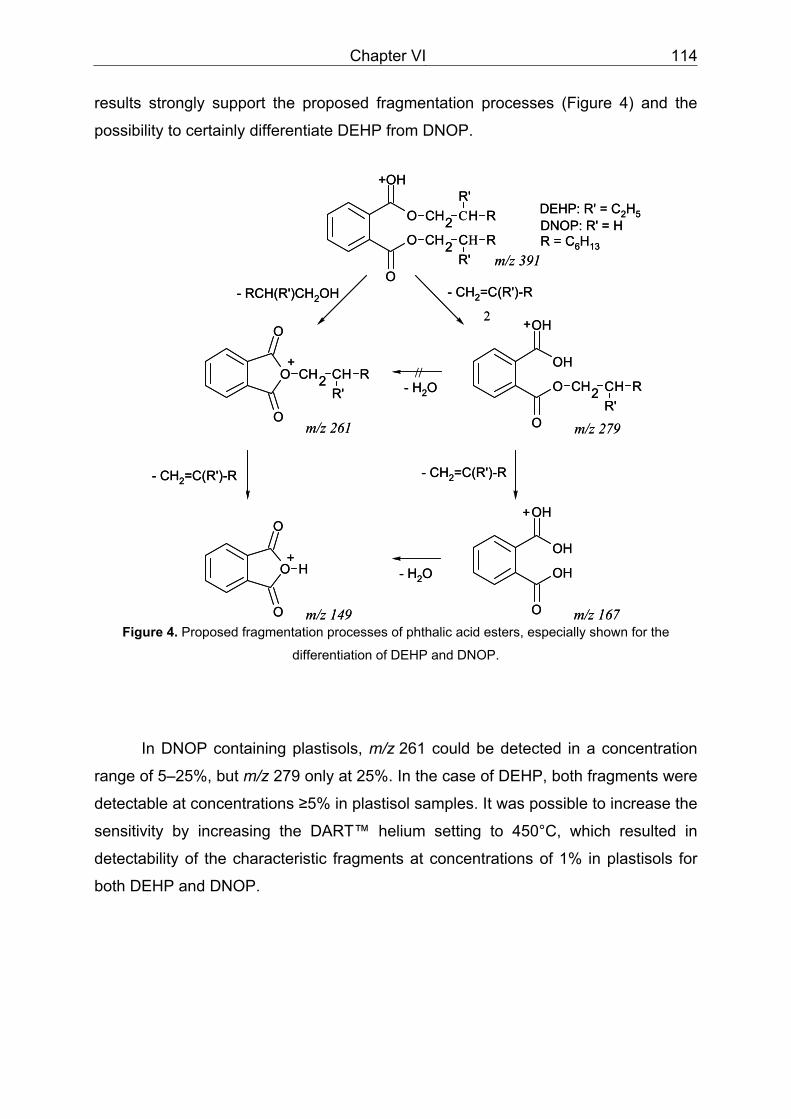
Chapter VI 114
results strongly support the proposed fragmentation processes (Figure 4) and the
possibility to certainly differentiate DEHP from DNOP.
+OH
O CH2 CR'
H R
O
O CH2 CR'
H R
OH
OH
O
O CH2 CR'
H R
+
- RCH(R')CH2OH - CH2=C(R')-R
2
m/z 261 m/z 279
m/z 391
- CH2=C(R')-R
OH
OH
O
OH
+
m/z 149 m/z 167
DEHP: R' = C2H5DNOP: R' = HR = C6H13
O CH2 CR'
H R
O
O
+
O H
O
O
+
//- H2O
- H2O
- CH2=C(R')-R
+OH
O CH2 CR'
H R
O
O CH2 CR'
H R
OH
OH
O
O CH2 CR'
H R
+
- RCH(R')CH2OH - CH2=C(R')-R
2
m/z 261 m/z 279
m/z 391
- CH2=C(R')-R
OH
OH
O
OH
+
m/z 149 m/z 167
DEHP: R' = C2H5DNOP: R' = HR = C6H13
O CH2 CR'
H R
O
O
+
O H
O
O
+
//- H2O
- H2O
- CH2=C(R')-R
Figure 4. Proposed fragmentation processes of phthalic acid esters, especially shown for the
differentiation of DEHP and DNOP.
In DNOP containing plastisols, m/z 261 could be detected in a concentration
range of 5–25%, but m/z 279 only at 25%. In the case of DEHP, both fragments were
detectable at concentrations ≥5% in plastisol samples. It was possible to increase the
sensitivity by increasing the DART™ helium setting to 450°C, which resulted in
detectability of the characteristic fragments at concentrations of 1% in plastisols for
both DEHP and DNOP.
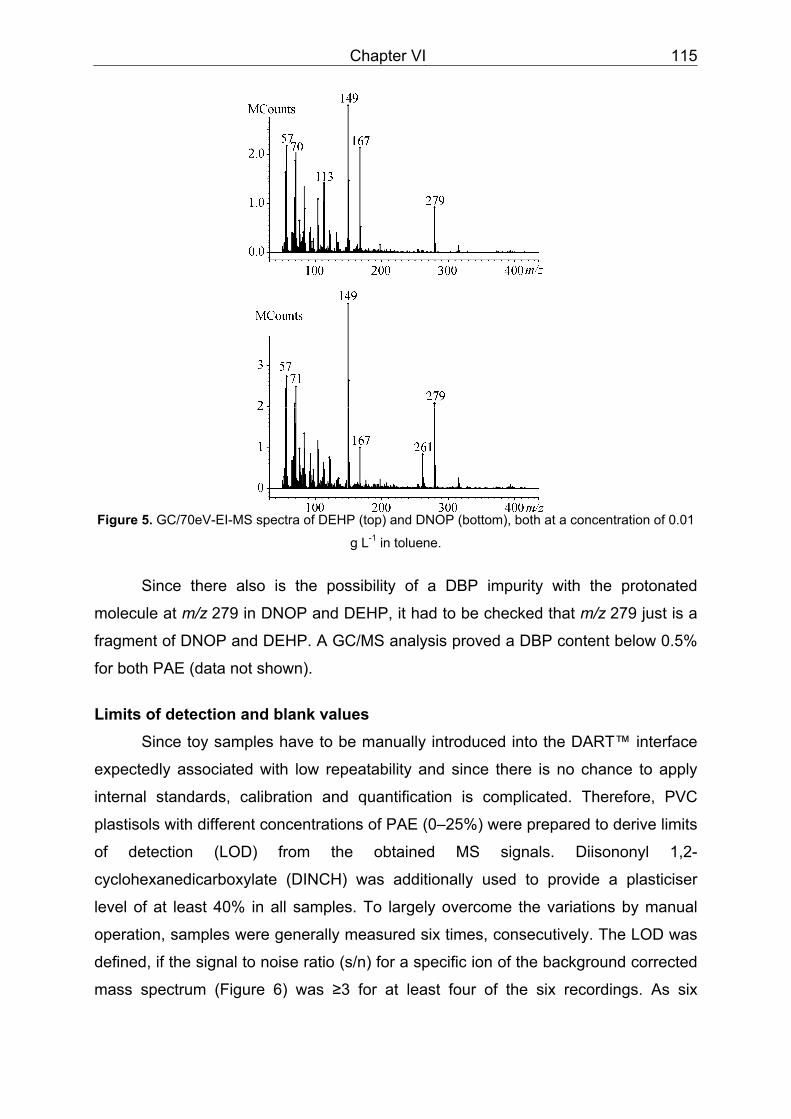
Chapter VI 115
Figure 5. GC/70eV-EI-MS spectra of DEHP (top) and DNOP (bottom), both at a concentration of 0.01
g L-1 in toluene.
Since there also is the possibility of a DBP impurity with the protonated
molecule at m/z 279 in DNOP and DEHP, it had to be checked that m/z 279 just is a
fragment of DNOP and DEHP. A GC/MS analysis proved a DBP content below 0.5%
for both PAE (data not shown).
Limits of detection and blank values
Since toy samples have to be manually introduced into the DART™ interface
expectedly associated with low repeatability and since there is no chance to apply
internal standards, calibration and quantification is complicated. Therefore, PVC
plastisols with different concentrations of PAE (0–25%) were prepared to derive limits
of detection (LOD) from the obtained MS signals. Diisononyl 1,2-
cyclohexanedicarboxylate (DINCH) was additionally used to provide a plasticiser
level of at least 40% in all samples. To largely overcome the variations by manual
operation, samples were generally measured six times, consecutively. The LOD was
defined, if the signal to noise ratio (s/n) for a specific ion of the background corrected
mass spectrum (Figure 6) was ≥3 for at least four of the six recordings. As six
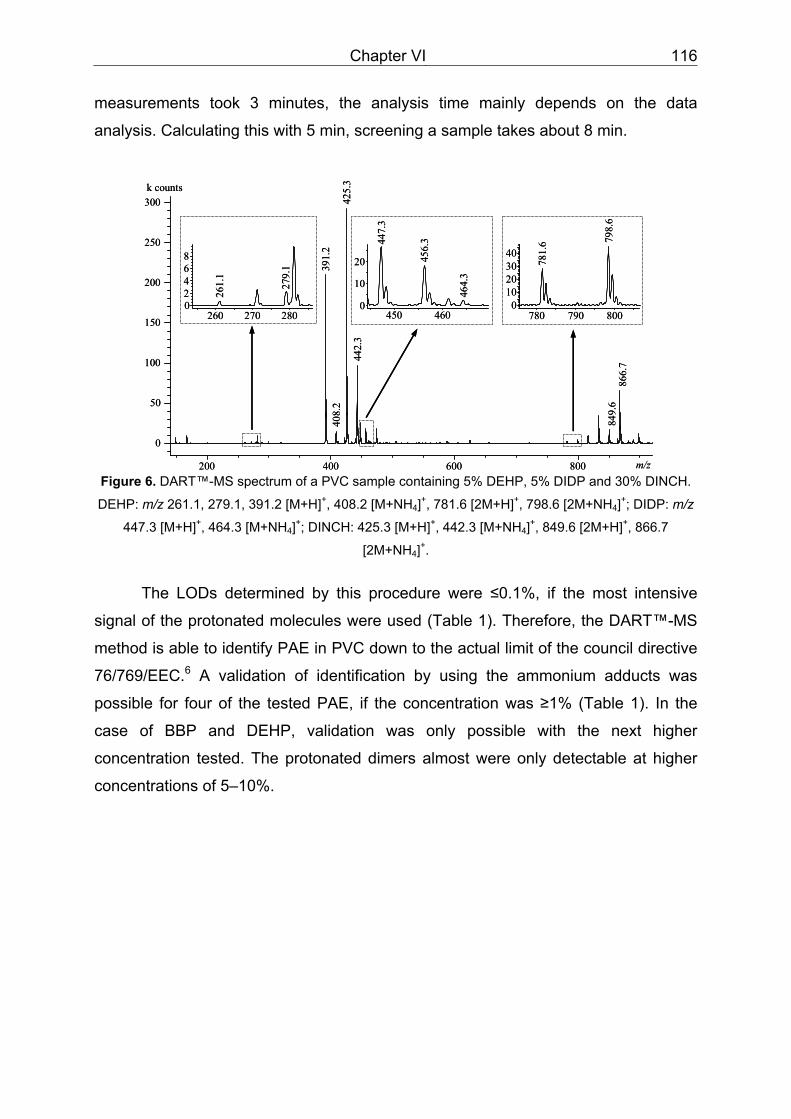
Chapter VI 116
measurements took 3 minutes, the analysis time mainly depends on the data
analysis. Calculating this with 5 min, screening a sample takes about 8 min.
m/z200 400 600 800
0
50
100
150
200
250
300
408.
2
849.
686
6.7
391.
2
425.
3
260 270 28002468
450 4600
10
20 456.
3447.
3
780 790 8000
10203040
k counts
442.
3
781.
6 798.
6
464.
3
261.
1
279.
1
m/z200 400 600 800
0
50
100
150
200
250
300
408.
2
849.
686
6.7
391.
2
425.
3
260 270 28002468
450 4600
10
20 456.
3447.
3
780 790 8000
10203040
k counts
442.
3
781.
6 798.
6
464.
3
261.
1
279.
1
Figure 6. DART™-MS spectrum of a PVC sample containing 5% DEHP, 5% DIDP and 30% DINCH.
DEHP: m/z 261.1, 279.1, 391.2 [M+H]+, 408.2 [M+NH4]+, 781.6 [2M+H]+, 798.6 [2M+NH4]+; DIDP: m/z
447.3 [M+H]+, 464.3 [M+NH4]+; DINCH: 425.3 [M+H]+, 442.3 [M+NH4]+, 849.6 [2M+H]+, 866.7
[2M+NH4]+.
The LODs determined by this procedure were ≤0.1%, if the most intensive
signal of the protonated molecules were used (Table 1). Therefore, the DART™-MS
method is able to identify PAE in PVC down to the actual limit of the council directive
76/769/EEC.6 A validation of identification by using the ammonium adducts was
possible for four of the tested PAE, if the concentration was ≥1% (Table 1). In the
case of BBP and DEHP, validation was only possible with the next higher
concentration tested. The protonated dimers almost were only detectable at higher
concentrations of 5–10%.
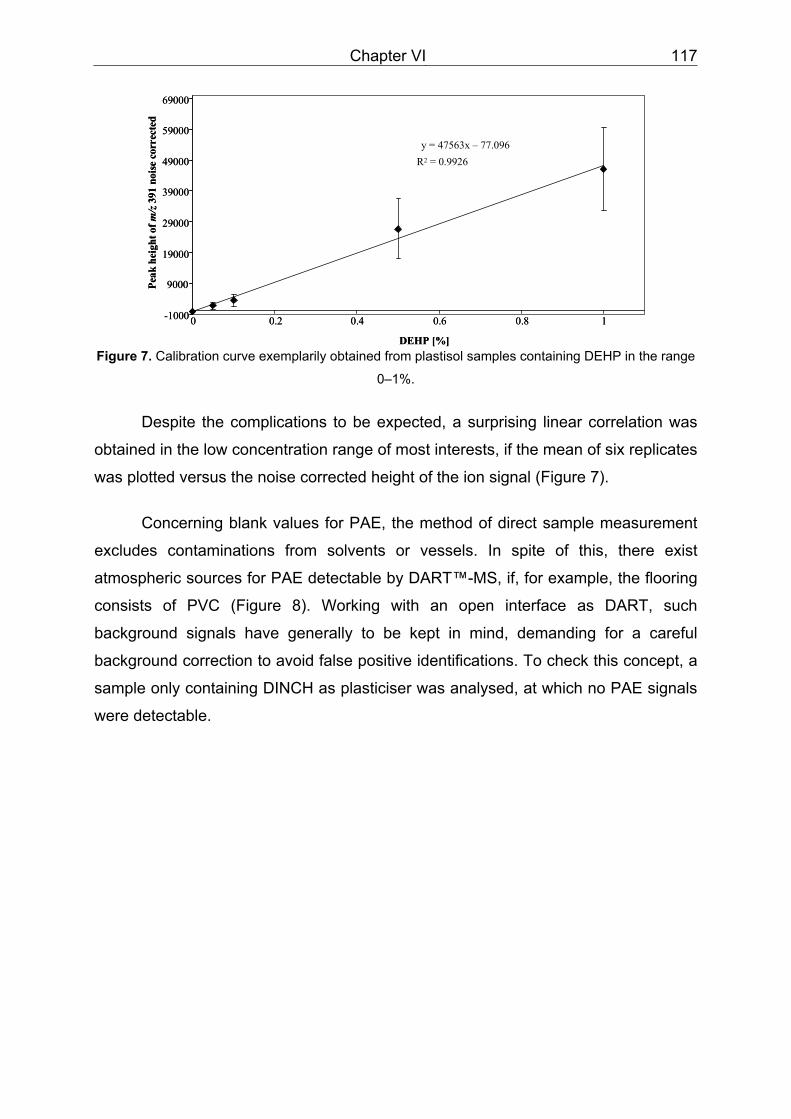
Chapter VI 117
y = 47563x – 77.096R2 = 0.9926
-1000
9000
19000
29000
39000
49000
59000
69000
0 0.2 0.4 0.6 0.8 1
DEHP [%]
Peak
hei
ghto
f m/z
391
noise
corr
ecte
dy = 47563x – 77.096
R2 = 0.9926
-1000
9000
19000
29000
39000
49000
59000
69000
0 0.2 0.4 0.6 0.8 1
DEHP [%]
Peak
hei
ghto
f m/z
391
noise
corr
ecte
d
Figure 7. Calibration curve exemplarily obtained from plastisol samples containing DEHP in the range
0–1%.
Despite the complications to be expected, a surprising linear correlation was
obtained in the low concentration range of most interests, if the mean of six replicates
was plotted versus the noise corrected height of the ion signal (Figure 7).
Concerning blank values for PAE, the method of direct sample measurement
excludes contaminations from solvents or vessels. In spite of this, there exist
atmospheric sources for PAE detectable by DART™-MS, if, for example, the flooring
consists of PVC (Figure 8). Working with an open interface as DART, such
background signals have generally to be kept in mind, demanding for a careful
background correction to avoid false positive identifications. To check this concept, a
sample only containing DINCH as plasticiser was analysed, at which no PAE signals
were detectable.
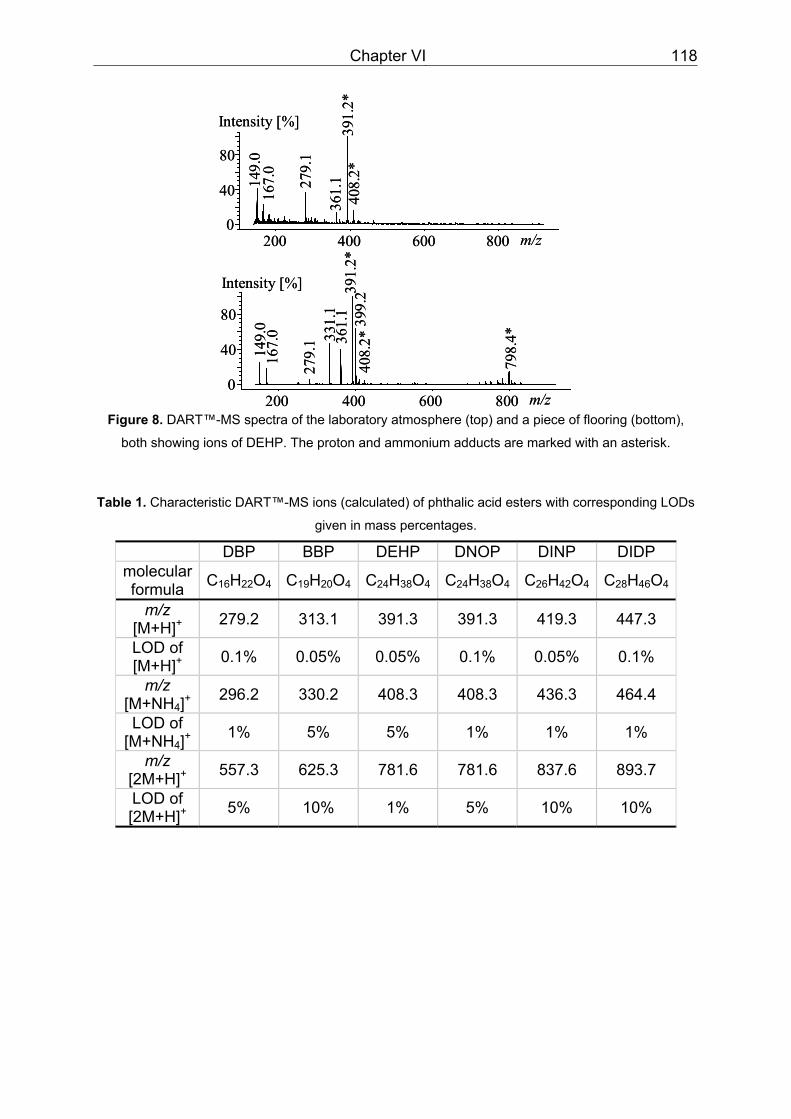
Chapter VI 118
200 400 600 8000
40
8027
9.1
408.
2*
167.
0 361.
133
1.1
798.
4*
399.
2391.
2*
149.
0
m/z
200 400 600 8000
40
80
361.
1
167.
0
408.
2*
279.
1
149.
0
391.
2*
m/z
Intensity [%]
Intensity [%]
200 400 600 8000
40
8027
9.1
408.
2*
167.
0 361.
133
1.1
798.
4*
399.
2391.
2*
149.
0
m/z
200 400 600 8000
40
80
361.
1
167.
0
408.
2*
279.
1
149.
0
391.
2*
m/z
Intensity [%]
Intensity [%]
Figure 8. DART™-MS spectra of the laboratory atmosphere (top) and a piece of flooring (bottom),
both showing ions of DEHP. The proton and ammonium adducts are marked with an asterisk.
Table 1. Characteristic DART™-MS ions (calculated) of phthalic acid esters with corresponding LODs
given in mass percentages.
DBP BBP DEHP DNOP DINP DIDP molecular formula C16H22O4 C19H20O4 C24H38O4 C24H38O4 C26H42O4 C28H46O4
m/z [M+H]+ 279.2 313.1 391.3 391.3 419.3 447.3
LOD of [M+H]+ 0.1% 0.05% 0.05% 0.1% 0.05% 0.1%
m/z [M+NH4]+
296.2 330.2 408.3 408.3 436.3 464.4
LOD of [M+NH4]+
1% 5% 5% 1% 1% 1%
m/z [2M+H]+ 557.3 625.3 781.6 781.6 837.6 893.7
LOD of [2M+H]+ 5% 10% 1% 5% 10% 10%
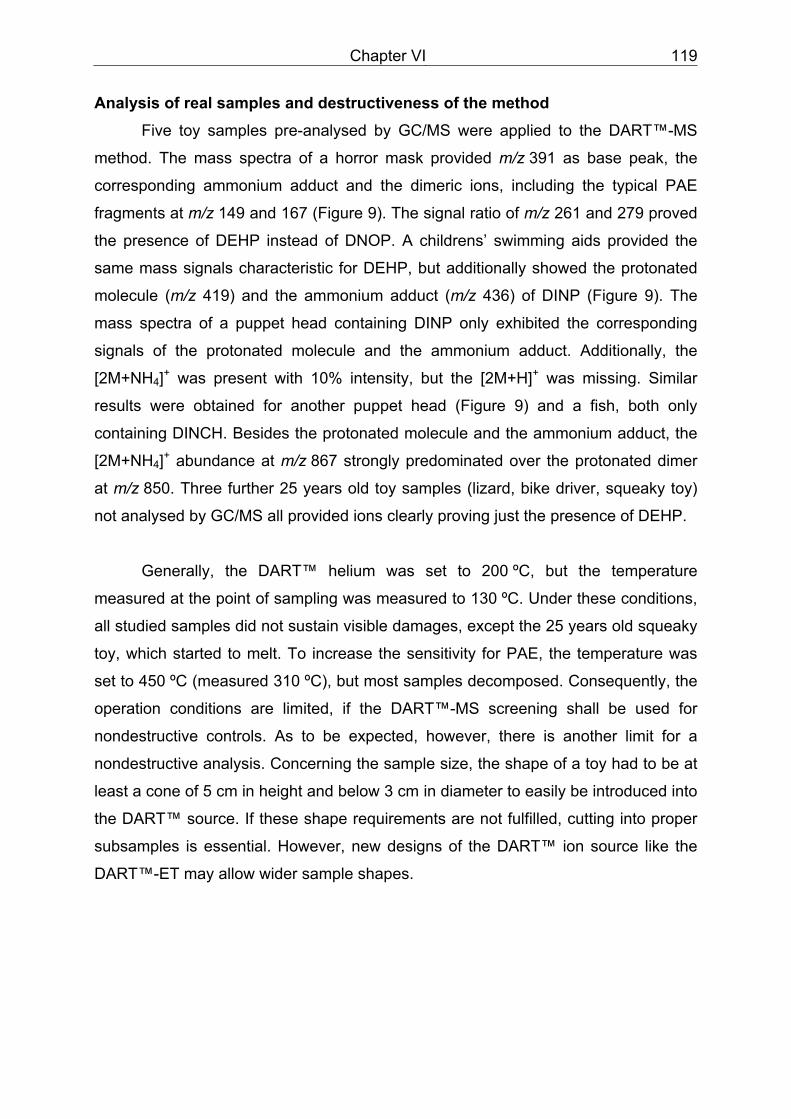
Chapter VI 119
Analysis of real samples and destructiveness of the method Five toy samples pre-analysed by GC/MS were applied to the DART™-MS
method. The mass spectra of a horror mask provided m/z 391 as base peak, the
corresponding ammonium adduct and the dimeric ions, including the typical PAE
fragments at m/z 149 and 167 (Figure 9). The signal ratio of m/z 261 and 279 proved
the presence of DEHP instead of DNOP. A childrens’ swimming aids provided the
same mass signals characteristic for DEHP, but additionally showed the protonated
molecule (m/z 419) and the ammonium adduct (m/z 436) of DINP (Figure 9). The
mass spectra of a puppet head containing DINP only exhibited the corresponding
signals of the protonated molecule and the ammonium adduct. Additionally, the
[2M+NH4]+ was present with 10% intensity, but the [2M+H]+ was missing. Similar
results were obtained for another puppet head (Figure 9) and a fish, both only
containing DINCH. Besides the protonated molecule and the ammonium adduct, the
[2M+NH4]+ abundance at m/z 867 strongly predominated over the protonated dimer
at m/z 850. Three further 25 years old toy samples (lizard, bike driver, squeaky toy)
not analysed by GC/MS all provided ions clearly proving just the presence of DEHP.
Generally, the DART™ helium was set to 200 ºC, but the temperature
measured at the point of sampling was measured to 130 ºC. Under these conditions,
all studied samples did not sustain visible damages, except the 25 years old squeaky
toy, which started to melt. To increase the sensitivity for PAE, the temperature was
set to 450 ºC (measured 310 ºC), but most samples decomposed. Consequently, the
operation conditions are limited, if the DART™-MS screening shall be used for
nondestructive controls. As to be expected, however, there is another limit for a
nondestructive analysis. Concerning the sample size, the shape of a toy had to be at
least a cone of 5 cm in height and below 3 cm in diameter to easily be introduced into
the DART™ source. If these shape requirements are not fulfilled, cutting into proper
subsamples is essential. However, new designs of the DART™ ion source like the
DART™-ET may allow wider sample shapes.
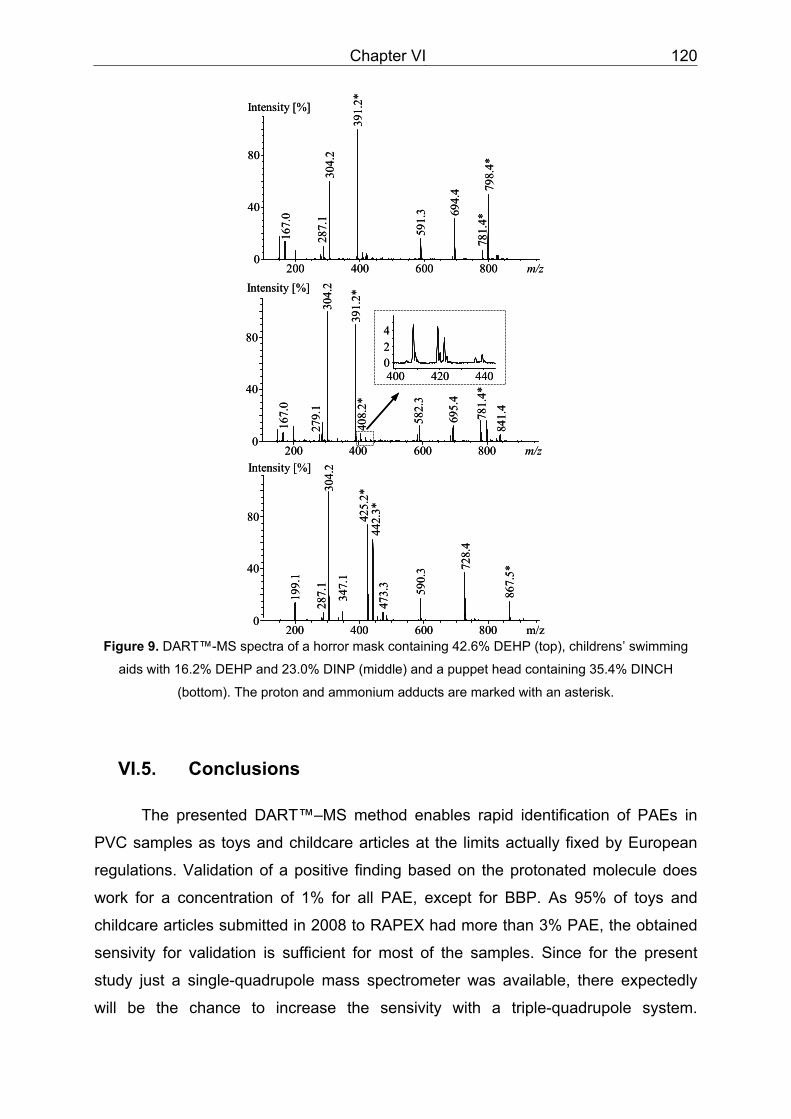
Chapter VI 120
m/z200 400 600 8000
40
80
591.
3
781.
4*
287.
1
167.
0 694.
4 798.
4*
304.
2
391.
2*
m/z200 400 600 8000
40
80
582.
3
841.
4
279.
1
408.
2*
695.
4
781.
4*
167.
0
391.
2*
304.
2
m/z200 400 600 8000
40
80
287.
1
473.
3
347.
1
867.
5*
199.
1
590.
3 728.
4
442.
3*425.
2*
304.
2
400 420 440024
Intensity [%]
Intensity [%]
Intensity [%]
m/z200 400 600 8000
40
80
591.
3
781.
4*
287.
1
167.
0 694.
4 798.
4*
304.
2
391.
2*
m/z200 400 600 8000
40
80
582.
3
841.
4
279.
1
408.
2*
695.
4
781.
4*
167.
0
391.
2*
304.
2
m/z200 400 600 8000
40
80
287.
1
473.
3
347.
1
867.
5*
199.
1
590.
3 728.
4
442.
3*425.
2*
304.
2
400 420 440024
Intensity [%]
Intensity [%]
Intensity [%]
Figure 9. DART™-MS spectra of a horror mask containing 42.6% DEHP (top), childrens’ swimming
aids with 16.2% DEHP and 23.0% DINP (middle) and a puppet head containing 35.4% DINCH
(bottom). The proton and ammonium adducts are marked with an asterisk.
VI.5. Conclusions
The presented DART™–MS method enables rapid identification of PAEs in
PVC samples as toys and childcare articles at the limits actually fixed by European
regulations. Validation of a positive finding based on the protonated molecule does
work for a concentration of 1% for all PAE, except for BBP. As 95% of toys and
childcare articles submitted in 2008 to RAPEX had more than 3% PAE, the obtained
sensivity for validation is sufficient for most of the samples. Since for the present
study just a single-quadrupole mass spectrometer was available, there expectedly
will be the chance to increase the sensivity with a triple-quadrupole system.
Chapter VI 121
Concludingly, DART™–MS provides a powerful up-to-date screening tool, well suited
for surveillance purposes to screen with a high sample throughput.
VI.6. Acknowledgement
The authors would like to thank the Chemisches und
Veterinäruntersuchungsamt Stuttgart for providing the samples, the Analytisches
Institut Bostel for the chance to measure PAEs with ESI-MS/MS and especially Ms
Tatjana Resner for her commitment with DART™-MS measurements.
VI.7. References
1. European Commission. Consumer affairs. Available at
http://ec.europa.eu/consumers/safety/prod_legis/index_en.htm#Phthalates.
Accessed 01 December 2008
2. Fay M, Donohue JM, De Rosa C. ATSDR evaluation of health effects of
chemicals. VI. Di(2-ethylhexyl)phthalate. Toxicology and Industrial Health 1999;
15(8): pp.651-746
3. Center for the Evaluation of Risks to Human Reproduction of the National
Toxicology Program of the United States of America. Di-(2-ethylhexyl) Phthalate
(DEHP) Evaluation. Available at http://ntp.niehs.
nih.gov:8080/cs.html?charset=iso-8859-1&url=http%3A//cerhr.niehs.
nih.gov/chemicals/dehp/dehp-eval.html&qt=DEHP&col=005main&n= 1&la=en.
Accessed 01 December 2008
4. European Communities. Commission Directive 2005/84/EC of the European
Parliament and of the Council of 14 December 2005 amending for the 22nd time
Council Directive 76/769/EEC on the approximation of the laws, regulations and
administrative provisions of the Member States relating to restrictions on the
marketing and use of certain dangerous substances and preparations (phthalates
in toys and childcare articles). Official Journal of the European Union 2005; L 344: pp.40-43
Chapter VI 122
5. European Food Safety Authority. Statement of the Scientific Panel on Food
Additives, Flavourings, Processing Aids and Materials in Contact with Food on a
request from the Commission on the possibility of allocating a group-TDI for
Butylbenzylphthalate (BBP), di-Butylphthalate (DBP), Bis(2-ethylhexyl) phthalate
(DEHP), di-Isononylphthalate (DINP) and di-Isodecylphthalate (DIDP). Available
at http://www.efsa.europa.eu:80/cs/BlobServer/Statement/
phthalategroup_minutes_statement1.pdf. Accessed 01 December 2008
6. European Communities. Council Directive 76/769/EEC of 27 July 1976 on the
approximation of the laws, regulations and administrative provisions of the
Member States relating to restrictions on the marketing and use of certain
dangerous substances and preparations. Official Journal of the European Union
1976; L 262: pp.201-203
7. Stringer R, Labunska I, Santillo D, Johnston P, Siddorn J, Stephenson A.
Concentrations of phthalate esters and identification of other additives in PVC
children's toys. Environmental Science and Pollution Research International
2000; 7(1): pp.27-36
8. European Commission. Rapid Alert System for Non-Food Products (RAPEX) -
Latest notifications. Available at
http://ec.europa.eu/consumers/dyna/rapex/rapex_archives_en.cfm. Accessed 03
February 2009
9. Rastogi SC. Gas chromatography analysis of phthalate esters in plastic toys.
Chromatographia 1998; 47(11/12): pp.724-726
10. Vandenburg HJ, Clifford AA, Bartle KD, Carlson RE, Carroll J, Newton ID. A
simple solvent selection method for accelerated solvent extraction of additives
from polymers. Analyst (Cambridge, United Kingdom) 1999; 124(11): pp.1707-
1710
11. Hauri U, Schlegel U, Wagmann M, Hohl C. Determination of phthalates in toys
and childcare articles made of PVC with HPLC and HPTLC. Mitteilungen aus
Lebensmitteluntersuchung und Hygiene 2002; 93(4): pp.179-185
12. Norbygaard T, Berg RW. Analysis of phthalate ester content in poly(vinyl
chloride) plastics by means of Fourier transform Raman spectroscopy. Applied
Spectroscopy 2004; 58(4): pp.410-413
Chapter VI 123
13. Cody RB, Laramee JA, Durst HD. Versatile new ion source for the analysis of
materials in open air under ambient conditions. Anal.Chem. 2005; 77(8): pp.2297-
2302
14. Cody RB, Laramee JA, Nilles JM, Durst HD. Direct Analysis in Real Time
(DARTTM) Mass Spectrometry. JEOL News 2005; 40(1): pp.8-12
15. Schurek J, Vaclavik L, Hooijerink H, Lacina O, Poustka J, Sharman M, Caldow M,
Nielen MWF, Hajslova J. Control of strobilurin fungicides in wheat using direct
analysis in real time accurate time-of-flight and desorption electrospray ionization
linear ion trap mass spectrometry. Anal.Chem.(Washington, DC, U.S.) 2008;
80(24): pp.9567-9575
16. Haefliger OP, Jeckelmann N. Direct mass spectrometric analysis of flavors and
fragrances in real applications using DART. Rapid Communications in Mass
Spectrometry 2007; 21(8): pp.1361-1366
17. Morlock G, Ueda Y. New coupling of planar chromatography with direct analysis
in real time mass spectrometry. J.Chromatogr., A 2007; 1143(1-2): pp.243-251
18. Dytkiewitz E, Morlock GE. Analytical strategy for rapid identification and
quantification of lubricant additives in mineral oil by high-performance thin-layer
chromatography with UV absorption and fluorescence detection combined with
mass spectrometry and infrared spectroscopy. J.AOAC Int. 2008; 91(5): pp.1237-
1243
Chapter VII 124
VII. Summary Food packaging is an important part of today’s lifestyle. Its applications cover
a wide different range which still is growing and plastic packaging plays a very
important role at this. In order to enable diverse functions a widespread range of
substances is used, covering most diverse chemical and physical characteristics.
Therefore additives are used in the manufacturing process of polymers, fulfilling a lot
of different functions. Most of the additives are not covalently bounded to the polymer
and therefore are able to move inside the plastic material and also to break through
the contact surface between polymer and food. These processes are called migration
and can be ascribed to different and foreseeable physical processes. As migration of
toxic substances from packaging into food may harm human health, the European
legislation lays down rules to ensure consumers’ safety. Beneath general regulations
there are also specific regulations for plastic food contact material covering for
example migration of substances into food and methods of analysis. Specific
migration limits are established mainly on base of toxicological evaluations and
consumers’ consumption habits.
The analyst’s work is to ensure the compliance of packaging material with the
European legislation, especially in terms of health safety. The huge variety of used
additives and their reaction and degradation products in combination with their
different physical and chemical properties and in particular the fact that the used
additives are only known to specific links of the packaging material producing chain
set severe requirements to the analysis. Even today only a part of used additives is
known to the European Community. Therefore an important part of the analysis
primarily is the identification of hazardous substances, a non targeted analysis which
can be considered as an analytical challenge and should be followed by toxicological
evaluations. Chapter II deals with the non-targeted multi-component analytical
screening of plastic food contact materials using fast interpretation of deliverables via
expert structure-activity relationship software. To identify potential migrants of
toxicological concern, resins and multilayer foils which were intended for the
production of food contact materials were extracted and analysed by gas
chromatography - mass spectrometry (GC-MS). In order to identify even compounds
of low concentrations, the software AMDIS was used and data evaluation was
Chapter VII 125
safeguarded by the Kovats Retention Index system. By this way, 46 compounds
were identified as possible migrants. The expert structure-activity relationship
software DEREK for WindowsTM was utilized to evaluate all identified substances in
terms of carcinogenicity, genotoxicity, thyroid toxicity and miscellaneous endpoints
for humans. Additionally a literature search for these compounds was carried out with
Sci-Finder®, but relevant data were missing for 28 substances. Summarized seven
compounds with adverse toxicological effects were identified. In addition, the RIs of
24 commercial additive standards, measured with a GC capillary column of middle
polarity, were given. Chapter II provides a valuable method to practically and
efficiently identify substances of toxicological concern in food contact materials.
The analysis of specific substances can often be considered as challenging,
too, due to lack of existing methods and the complexity of target substances and
matrices. Actual examples like semicarbazide, a decomposition product of the
foaming agent azodicarbonamide used for the gaskets of lids for glass jars and
suspected to be genotoxic and carcinogenic, or 2-isopropylthioxanthone (ITX), a
photo initiator for UV-curing inks which occurred in baby food, show that food can be
seriously contaminated by packaging materials. Chapter III describes a survey that
was made after the first findings of ITX in food have become public. In order to
elucidate the occurrence of ITX in products on the German market more than 100
foods packed in cartons as well as in plastic cups and foils were investigated. For
this, a fast method to detect ITX in food packaging materials was established. In case
of positive findings the accompanying foodstuffs were analysed in a subsequent step
using different extraction methods, depending on the fat content of the food.
Determination of the photo-initiator was done by high performance liquid
chromatography with diode array and fluorescence detection with recoveries
between 94 and 106% for non-fatty foods with a relative standard deviation value
(RSD) smaller than 1.2. For fatty foods the recoveries were between 80 and 105%
with a rsd ≤ 8.5, respectively. The limit of detection (LOD) and the limit of
quantification (LOQ) were determined to 2 and 5 µg L-1. ITX was detected in 36 out of
137 packages (26%) and significant migration occurred in 75% of the packaging
materials tested positive with amounts ranging up to 357 µg kg-1 in orange juice and
208 mg kg-1 in baby food. In this survey of chapter III, 2,4 diethylthioxanthone, mainly
used as a substitution product for ITX, was also found.
Chapter VII 126
Other examples for food which is seriously contaminated by packaging
materials are plasticisers in oily food migrating from the gaskets of lids for glass jars
and exceeding manifold legislative migration limits. Generally the first step for the
analysis of plasticisers in food, whose source might be the gasket of glass jars, is the
identification of additives in gaskets, which also requires considerable efforts.
Chapter IV shows how up to date instrumental equipment can be very helpful in the
rapid identification of substances in plastics with direct analysis in real time ionisation
and single quadrupole mass spectrometry (DART™-MS), using the example of
additives in gaskets for lids made of polyvinylchloride (PVC). In chapter IV it is shown
that solutions of substances measured with DART™-MS showed the [M+H]+ and
[M+NH4]+ as typical ionisation and the cleavage of ester bonds as typical
fragmentation products of the molecules. The additives were identified rapidly and
easily via DART™-MS generally in the range of 1% (wt), if ion suppressive effects did
not occur. It was shown that in order to avoid these effects deriving from specific
molecules, extracts of a plastic with appropriate organic solvents can improve
sensivity. By use of this method it was possible to identify fatty acid amides,
phthalates, tributyl O-acetylcitrate, dibutyl sebacate, bis(2-ethylhexyl) adipate, 1,2-
cyclohexanedicarboxylic acid 1,2-diisononyl ester and even more complex additives
like acetylated mono- and diglycerides of fatty acids, epoxidised soybean oil and
polyadipates in ranges up to a content of 1% or better in plastic material. Epoxidised
linseed oil could also be identified if contained at 5% or higher and false positive
identifications only occurred for di-isononyl phthalate. The detection of the use of
azodicarbonamide as foaming agent in the manufacturing process showed
possibilities, but failed due to missing robustness. A great value of the method
presented in chapter IV is the complete analysis time of about 45 minutes for very
complex plastic samples. As more clarity was brought into the results of ionisation
and fragmentation processes of DART™-MS, this method may be transferred easily
to other applications dealing with similar subjects.
Experts consider the use of packaging materials as the largest and least
controlled source of food contaminations with organic materials in Europe and
improvements in the analysis of food contaminations deriving from packaging
materials are an imperative exigence. The plasticiser epoxidised soy bean oil (ESBO)
was also a substance which contaminated especially oily food and baby food, in
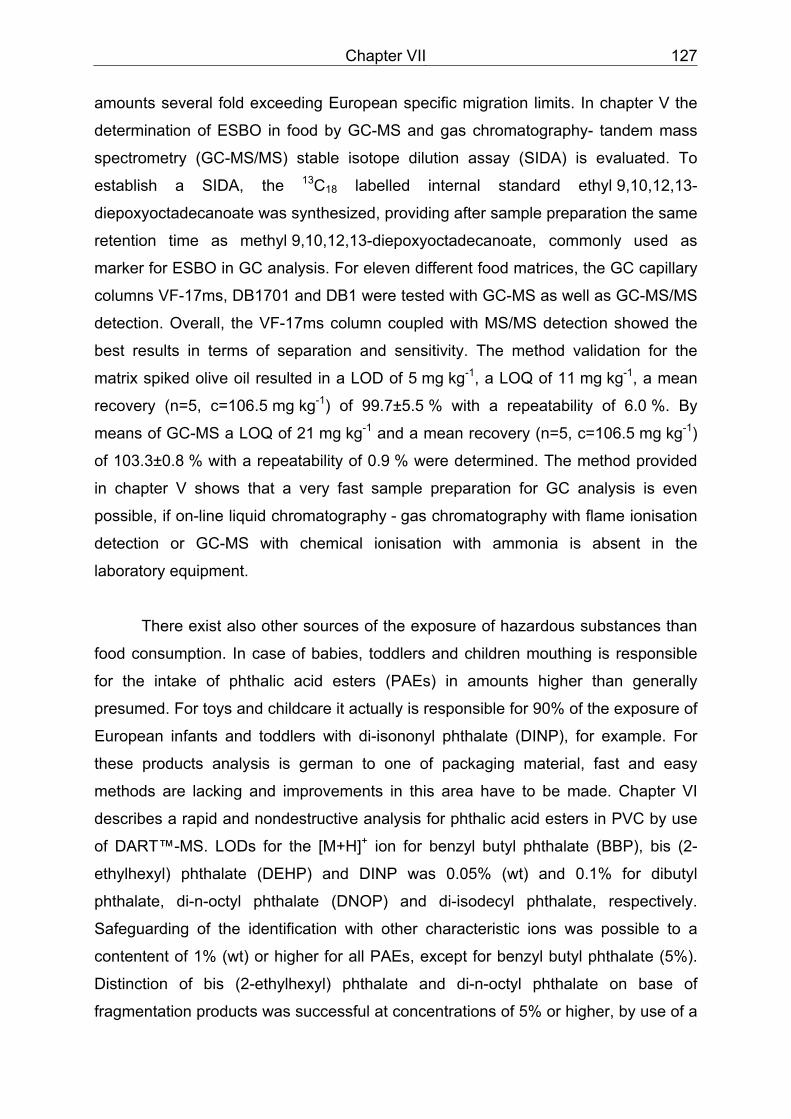
Chapter VII 127
amounts several fold exceeding European specific migration limits. In chapter V the
determination of ESBO in food by GC-MS and gas chromatography- tandem mass
spectrometry (GC-MS/MS) stable isotope dilution assay (SIDA) is evaluated. To
establish a SIDA, the 13C18 labelled internal standard ethyl 9,10,12,13-
diepoxyoctadecanoate was synthesized, providing after sample preparation the same
retention time as methyl 9,10,12,13-diepoxyoctadecanoate, commonly used as
marker for ESBO in GC analysis. For eleven different food matrices, the GC capillary
columns VF-17ms, DB1701 and DB1 were tested with GC-MS as well as GC-MS/MS
detection. Overall, the VF-17ms column coupled with MS/MS detection showed the
best results in terms of separation and sensitivity. The method validation for the
matrix spiked olive oil resulted in a LOD of 5 mg kg-1, a LOQ of 11 mg kg-1, a mean
recovery (n=5, c=106.5 mg kg-1) of 99.7±5.5 % with a repeatability of 6.0 %. By
means of GC-MS a LOQ of 21 mg kg-1 and a mean recovery (n=5, c=106.5 mg kg-1)
of 103.3±0.8 % with a repeatability of 0.9 % were determined. The method provided
in chapter V shows that a very fast sample preparation for GC analysis is even
possible, if on-line liquid chromatography - gas chromatography with flame ionisation
detection or GC-MS with chemical ionisation with ammonia is absent in the
laboratory equipment.
There exist also other sources of the exposure of hazardous substances than
food consumption. In case of babies, toddlers and children mouthing is responsible
for the intake of phthalic acid esters (PAEs) in amounts higher than generally
presumed. For toys and childcare it actually is responsible for 90% of the exposure of
European infants and toddlers with di-isononyl phthalate (DINP), for example. For
these products analysis is german to one of packaging material, fast and easy
methods are lacking and improvements in this area have to be made. Chapter VI
describes a rapid and nondestructive analysis for phthalic acid esters in PVC by use
of DART™-MS. LODs for the [M+H]+ ion for benzyl butyl phthalate (BBP), bis (2-
ethylhexyl) phthalate (DEHP) and DINP was 0.05% (wt) and 0.1% for dibutyl
phthalate, di-n-octyl phthalate (DNOP) and di-isodecyl phthalate, respectively.
Safeguarding of the identification with other characteristic ions was possible to a
contentent of 1% (wt) or higher for all PAEs, except for benzyl butyl phthalate (5%).
Distinction of bis (2-ethylhexyl) phthalate and di-n-octyl phthalate on base of
fragmentation products was successful at concentrations of 5% or higher, by use of a

Chapter VII 128
gas temperature of 310 ºC even at 1%. As the generally used gas temperature was
131ºC, most toy and childcare samples do not get destroyed. The analysis of one
sample generally took between 10 and 15 minutes. Summarised the method
described in chapter VI is a powerful and up to date screening tool allowing a fast
identification of PAEs in PVC up to the legislative European limits. It is very well
suited for surveillance purposes in order to screen with a high sample throughput.
Chapter VIII 129
VIII. Zusammenfassung Lebensmittelverpackungen sind ein wichtiger Teil des momentanen
Lebensstils. Sie werden in einem weiten, sich stets vergrößernden Bereich
angewendet und Verpackungen aus Kunststoff spielen hierbei eine sehr wichtige
Rolle. Um unterschiedlichste Funktionen zu gewährleisten wird eine breitgefächerte
Auswahl an Stoffen, welche mannigfachste chemische und physikalische
Eigenschaften aufweisen, verwendet. Aus diesem Grund werden Additive, die
diverse Funktionen erfüllen in der Produktion von Kunststoffen eingesetzt. Da die
meisten Additive nicht kovalent an das Kunststoffpolymer gebunden sind, können sie
im Kunststoff diffundieren und sogar die Grenzschicht zwischen Kunststoff und
Lebensmittel überwinden. Diese Vorgänge können unterschiedlichen und
vorhersehbaren physikalischen Prozessen zugeordnet werden und werden fachlich
Migration genannt. Da die Migration von toxischen Stoffen aus
Kunststoffverpackungen in Lebensmittel gesundheitsgefährdend sein kann, hat die
europäische Gesetzgebung Normen erlassen um die Sicherheit der Verbraucher zu
gewährleisten. Neben allgemeinen Normen gibt es auch sehr spezielle Regelungen,
die zum Beispiel von der Migration von Stoffen in Lebensmittel und von
Analysenmethoden handeln. Überwiegend auf der Basis von toxikologischen
Untersuchungen und Verzehrsgewohnheiten von Verbrauchern wurden spezifische
Migrationsgrenzwerte erlassen.
Analytiker überprüfen, ob Verpackungsmaterial den europäischen
gesetzlichen Vorschriften und insbesondere der gesundheitlichen Unbedenklichkeit
entspricht. Die große Anzahl an verwendeten Additiven sowie deren Reaktions- und
Abbauprodukte zusammen mit ihren unterschiedlichen physikalischen und
chemischen Eigenschaften, und insbesondere die Tatsache, dass die benutzten
Additive nur einzelnen Gliedern der Kette des Herstellungsprozesses bekannt sind,
wirken sich als sehr hohe Anforderungen für die Analytik aus. Momentan ist nur ein
Teil der benutzten Additive der Europäischen Gemeinschaft bekannt. Deshalb spielt
die Identifizierung von gesundheitsgefährdenden Substanzen als erster Schritt eine
wichtige Rolle. Die sogenannte nicht zielgerichtete Analyse, welche als analytische
Herausforderung betrachtet werden kann, sollte eine toxikologische Bewertung nach
sich ziehen. Kapitel II handelt von der nicht zielgerichteten Analyse von
Chapter VIII 130
Lebensmittelverpackungen aus Kunststoff, indem die Ergebnisse rasch mittels einer
Software gesundheitlich aufgrund von Struktur- Aktivitätsbeziehungen bewertet
werden. Um toxikologisch bedenkliche, mögliche Migranten zu identifizieren, wurden
Kunststoffgranulate und Mehrschichtfolien, die zur Lebensmittelverpackungs-
herstellung benutzt werden, extrahiert und mittels Gaschromatographie gekoppelt mit
Massenspektrometrie (GC-MS) untersucht. Damit auch Komponenten geringer
Konzentration identifiziert werden können wurde die Software AMDIS benutzt, und
zusätzlich wurde die Auswertung durch das Kovats- Retentionsindexsystem
abgesichert. Auf diese Art und Weise wurden 46 Stoffe als mögliche Migranten
identifiziert. Die Struktur- Aktivitätsbeziehungs- Software DEREK for Windows™
wurde eingesetzt um alle identifizierten Stoffe bezüglich Kanzerogenität,
Genotoxizität, Schilddrüsentoxizität und sonstigen Endpunkten, die für Menschen
relevant sind, zu beurteilen. Zusätzlich wurde eine Literaturrecherche mit SciFinder®
durchgeführt, die jedoch in den zu untersuchenden Bereichen für 28 Substanzen
erfolglos blieb. Zusammengefasst wurden sieben gesundheitsgefährdende Stoffe
identifiziert. Zusätzlich wurde von 24 kommerziell verwendeten Additiven der Kovats-
Retentionsindex, der mit einer mittelpolaren GC-Säule bestimmt wurde, gegeben.
Kapitel II übermittelt eine wertvolle Methode um praktisch und effizient toxikologisch
bedenkliche Stoffe in Lebensmittelbedarfsgegenständen zu identifizieren.
Da weder analytische Methoden existieren und Zielanalyten, sowie deren
Matrix sehr komplex sind, kann auch die Analyse von speziellen Analyten häufig als
Herausforderung betrachtet werden. Aktuelle Beispiele wie Semicarbazid, ein
Abbauprodukt von dem Treibmittel Azodicarbonamid, welches für die
Dichtungsmasse von Gläschendeckel verwendet und im Verdacht steht genotoxisch
und karzinogen zu sein, oder 2-Isopropylthioxanton (ITX), ein Fotoinitiator für UV-
härtende Druckfarben, welcher in Babynahrung auftrat, zeigen, dass Lebensmittel
von Verpackungen schwerwiegend kontaminiert werden können. Kapitel III beinhaltet
eine Erhebung, die gemacht wurde nachdem erste ITX Funde in Lebensmitteln
veröffentlicht wurden. Um das Vorhandensein von ITX in deutschen Produkten
aufzuklären wurden über 100 Lebensmittel, die in sowohl in Kartonverpackungen, als
auch in Kunststoffbechern und Folien verpackt waren, untersucht. Um dies
durchzuführen wurde eine Schnellmethode entwickelt, die ITX in
Lebensmittelverpackungen detektiert, Wurde ITX identifiziert, so wurde auch
nachfolgend das entsprechende Lebensmittel untersucht, wobei entsprechend
Chapter VIII 131
dessen Fettgehalt unterschiedliche Extraktionsmethoden angewendet wurden. Die
Bestimmung des Fotoinitiators wurde mittels Hochleistungsflüssigkeits-
chromatographie mit Diodenarray- und Fluoreszenzdetektion und
Wiederfindungsraten für nicht fetthaltige Lebensmittel zwischen 94 und 106% mit
einer relativen Standardabweichung (RSD) kleiner als 1,2 durchgeführt. Für
fetthaltige Lebensmittel waren entsprechend die Wiederfindungsraten zwischen 80
und 105% mit einer RSD kleiner oder gleich 8,5. Die Erfassungsgrenze wurde zu
2 µg/L und die Bestimmungsgrenze zu 5 µg/L bestimmt. ITX wurde in 36 von 137
Lebensmitteln identifiziert, dies entspricht einer Trefferquote von 26%. Eine
signifikante Migration fand in 75% der positiv getesteten Verpackungen statt, mit
Gehalten bis zu 357 µg/kg in Orangensaft und 208 µg/kg in Babynahrung. In dieser
Erhebung von Kapitel III wurde auch 2,4-Diethylthioxanthon gefunden, welches
überwiegend als Ersatzprodukt für ITX eingesetzt wurde.
Andere Beispiele, bei denen Lebensmittel schwerwiegend durch
Lebensmittelverpackungen kontaminiert wurden, sind Weichmacher, die aus der
Dichtungsmasse von Gläschendeckel migrierten und gesetzliche Grenzwerte
mehrfach überschritten. Im Allgemeinen ist der erste Schritt der Analyse von
verpackungsbedingeten Weichmachern in Lebensmitteln die Analyse der
Weichmacher in der Dichtungsmasse, welche auch beträchtlichen Aufwand erfordert.
Kapitel IV zeigt, wie modernes Equipment sehr hilfreich bei der schnellen
Identifizierung von Substanzen in Kunststoffen mittels der direkten Echtzeitionisation
gekoppelt mit der Einfachquadrupolmassenspektrometrie (DART™-MS), am Beispiel
von Additiven in Dichtmassen für Gläschendeckel aus Polyvinylchlorid (PVC), sein
kann. Kapitel IV führt aus, dass Lösungen von Stoffen, die mit DART™-MS
gemessen werden, die Ionen [M+H]+ und [M+NH4]+ als typische Ionisationsprodukte
und eine Spaltung der Esterbindung als typische Zerfallsprodukte der Moleküle
zeigen. Die Additive wurden schnell und einfach mit DART™-MS identifiziert, im
Allgemeinen im Bereich von einem Massenprozent falls keine ionensuppresiven
Effekte auftraten. Da diese Effekte von bestimmten Molekülen verursacht werden,
konnte gezeigt werden, dass Extrakte von einem Kunststoff mit dem entsprechend
geeigneten organischen Lösungsmittel die Nachweisempfindlichkeit erhöhen können.
Mit dieser Methodik war es möglich Fettsäureamide, Phthalate, Tributyl-O-
acetylcitrat, Dibutylsebacat, Bis(2-ethylhexyl)adipat, 1,2-Cyclohexanedicarboxyl-
säure, 1,2-diisononyl ester und sogar komplexere Additive wie acetylierte Mono- und
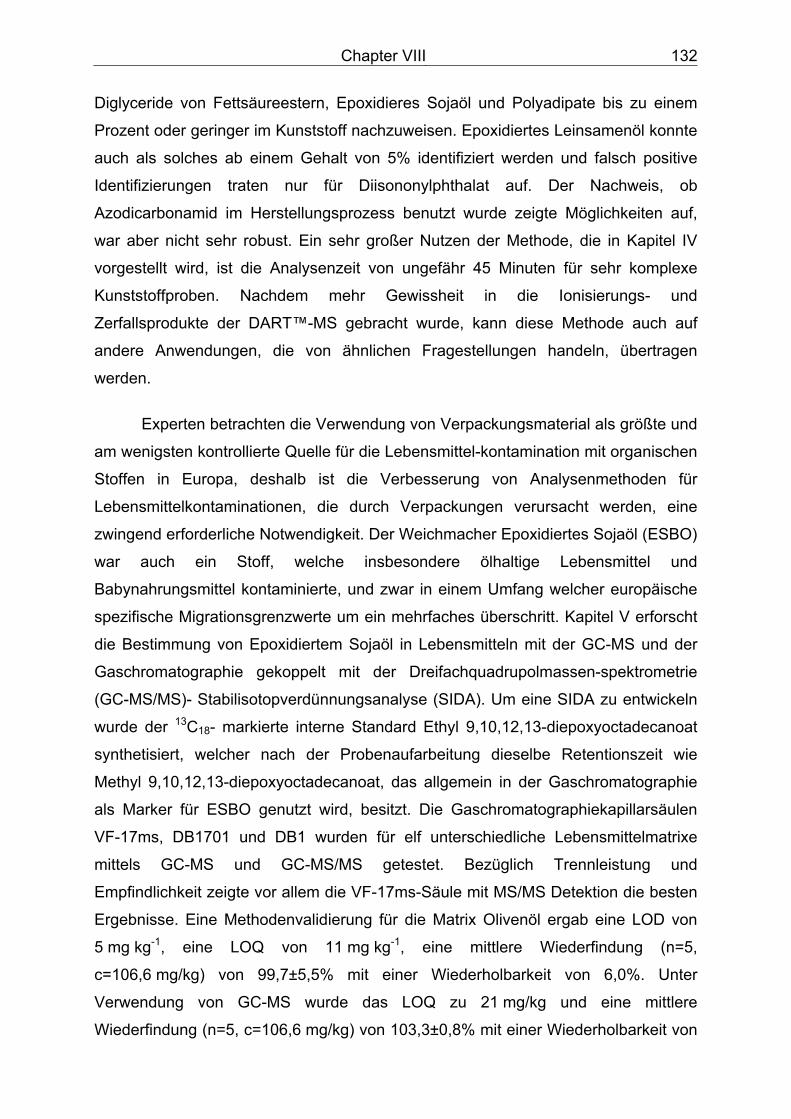
Chapter VIII 132
Diglyceride von Fettsäureestern, Epoxidieres Sojaöl und Polyadipate bis zu einem
Prozent oder geringer im Kunststoff nachzuweisen. Epoxidiertes Leinsamenöl konnte
auch als solches ab einem Gehalt von 5% identifiziert werden und falsch positive
Identifizierungen traten nur für Diisononylphthalat auf. Der Nachweis, ob
Azodicarbonamid im Herstellungsprozess benutzt wurde zeigte Möglichkeiten auf,
war aber nicht sehr robust. Ein sehr großer Nutzen der Methode, die in Kapitel IV
vorgestellt wird, ist die Analysenzeit von ungefähr 45 Minuten für sehr komplexe
Kunststoffproben. Nachdem mehr Gewissheit in die Ionisierungs- und
Zerfallsprodukte der DART™-MS gebracht wurde, kann diese Methode auch auf
andere Anwendungen, die von ähnlichen Fragestellungen handeln, übertragen
werden.
Experten betrachten die Verwendung von Verpackungsmaterial als größte und
am wenigsten kontrollierte Quelle für die Lebensmittel-kontamination mit organischen
Stoffen in Europa, deshalb ist die Verbesserung von Analysenmethoden für
Lebensmittelkontaminationen, die durch Verpackungen verursacht werden, eine
zwingend erforderliche Notwendigkeit. Der Weichmacher Epoxidiertes Sojaöl (ESBO)
war auch ein Stoff, welche insbesondere ölhaltige Lebensmittel und
Babynahrungsmittel kontaminierte, und zwar in einem Umfang welcher europäische
spezifische Migrationsgrenzwerte um ein mehrfaches überschritt. Kapitel V erforscht
die Bestimmung von Epoxidiertem Sojaöl in Lebensmitteln mit der GC-MS und der
Gaschromatographie gekoppelt mit der Dreifachquadrupolmassen-spektrometrie
(GC-MS/MS)- Stabilisotopverdünnungsanalyse (SIDA). Um eine SIDA zu entwickeln
wurde der 13C18- markierte interne Standard Ethyl 9,10,12,13-diepoxyoctadecanoat
synthetisiert, welcher nach der Probenaufarbeitung dieselbe Retentionszeit wie
Methyl 9,10,12,13-diepoxyoctadecanoat, das allgemein in der Gaschromatographie
als Marker für ESBO genutzt wird, besitzt. Die Gaschromatographiekapillarsäulen
VF-17ms, DB1701 und DB1 wurden für elf unterschiedliche Lebensmittelmatrixe
mittels GC-MS und GC-MS/MS getestet. Bezüglich Trennleistung und
Empfindlichkeit zeigte vor allem die VF-17ms-Säule mit MS/MS Detektion die besten
Ergebnisse. Eine Methodenvalidierung für die Matrix Olivenöl ergab eine LOD von
5 mg kg-1, eine LOQ von 11 mg kg-1, eine mittlere Wiederfindung (n=5,
c=106,6 mg/kg) von 99,7±5,5% mit einer Wiederholbarkeit von 6,0%. Unter
Verwendung von GC-MS wurde das LOQ zu 21 mg/kg und eine mittlere
Wiederfindung (n=5, c=106,6 mg/kg) von 103,3±0,8% mit einer Wiederholbarkeit von
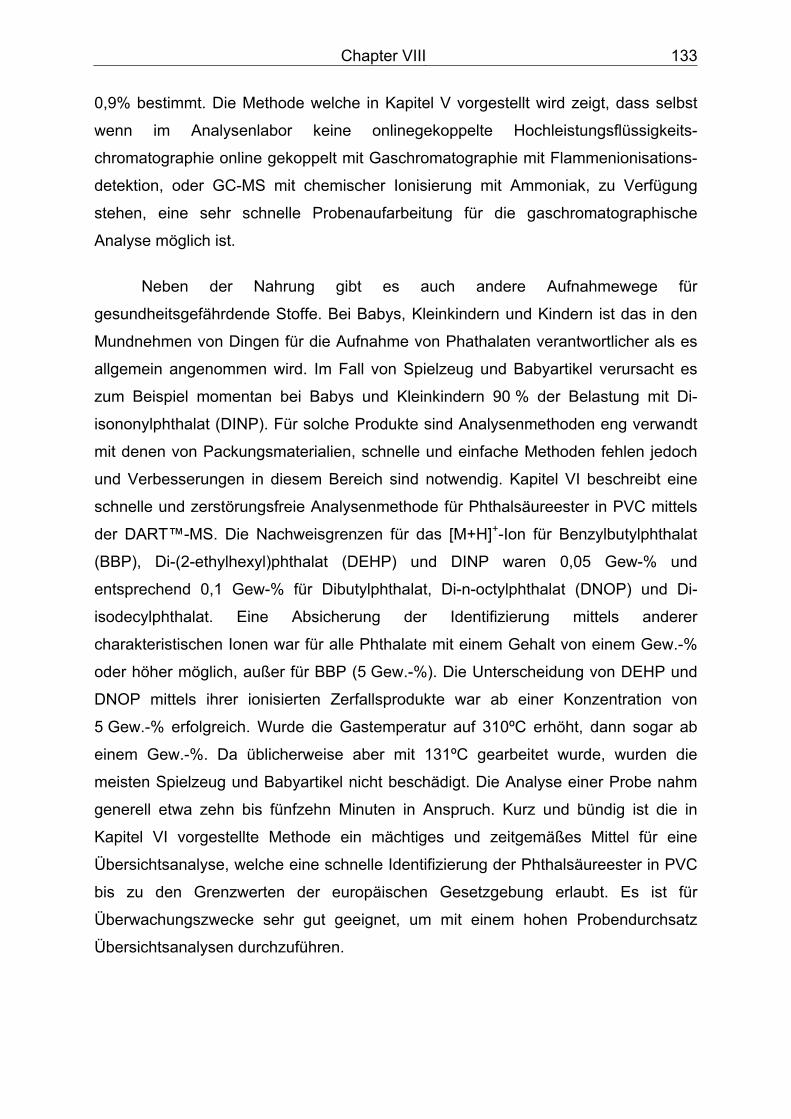
Chapter VIII 133
0,9% bestimmt. Die Methode welche in Kapitel V vorgestellt wird zeigt, dass selbst
wenn im Analysenlabor keine onlinegekoppelte Hochleistungsflüssigkeits-
chromatographie online gekoppelt mit Gaschromatographie mit Flammenionisations-
detektion, oder GC-MS mit chemischer Ionisierung mit Ammoniak, zu Verfügung
stehen, eine sehr schnelle Probenaufarbeitung für die gaschromatographische
Analyse möglich ist.
Neben der Nahrung gibt es auch andere Aufnahmewege für
gesundheitsgefährdende Stoffe. Bei Babys, Kleinkindern und Kindern ist das in den
Mundnehmen von Dingen für die Aufnahme von Phathalaten verantwortlicher als es
allgemein angenommen wird. Im Fall von Spielzeug und Babyartikel verursacht es
zum Beispiel momentan bei Babys und Kleinkindern 90 % der Belastung mit Di-
isononylphthalat (DINP). Für solche Produkte sind Analysenmethoden eng verwandt
mit denen von Packungsmaterialien, schnelle und einfache Methoden fehlen jedoch
und Verbesserungen in diesem Bereich sind notwendig. Kapitel VI beschreibt eine
schnelle und zerstörungsfreie Analysenmethode für Phthalsäureester in PVC mittels
der DART™-MS. Die Nachweisgrenzen für das [M+H]+-Ion für Benzylbutylphthalat
(BBP), Di-(2-ethylhexyl)phthalat (DEHP) und DINP waren 0,05 Gew-% und
entsprechend 0,1 Gew-% für Dibutylphthalat, Di-n-octylphthalat (DNOP) und Di-
isodecylphthalat. Eine Absicherung der Identifizierung mittels anderer
charakteristischen Ionen war für alle Phthalate mit einem Gehalt von einem Gew.-%
oder höher möglich, außer für BBP (5 Gew.-%). Die Unterscheidung von DEHP und
DNOP mittels ihrer ionisierten Zerfallsprodukte war ab einer Konzentration von
5 Gew.-% erfolgreich. Wurde die Gastemperatur auf 310ºC erhöht, dann sogar ab
einem Gew.-%. Da üblicherweise aber mit 131ºC gearbeitet wurde, wurden die
meisten Spielzeug und Babyartikel nicht beschädigt. Die Analyse einer Probe nahm
generell etwa zehn bis fünfzehn Minuten in Anspruch. Kurz und bündig ist die in
Kapitel VI vorgestellte Methode ein mächtiges und zeitgemäßes Mittel für eine
Übersichtsanalyse, welche eine schnelle Identifizierung der Phthalsäureester in PVC
bis zu den Grenzwerten der europäischen Gesetzgebung erlaubt. Es ist für
Überwachungszwecke sehr gut geeignet, um mit einem hohen Probendurchsatz
Übersichtsanalysen durchzuführen.

Acknowledgements
Acknowledgements
Additionally to acknowledgements previously mentioned in this work, I particulary thank: -My parents, my wife and my children for supporting me during this work, -Prof. Dr. W. Schwack for his help in all kind of matters and the people of the Institut für Lebensmittelchemie of the Universität Hohenheim who assisted me, especially Ms. Tatjana Resner and Mr. Axel Lang, -The Chemisches und Veterinäruntersuchungsamt Stuttgart for supporting me in the beginning of this work.


![Dederer-Vortrag ALB Hohenheim [Kompatibilitätsmodus]](https://img.pdfslide.org/doc/110x75/625fadab6d0d5963d474a7ae/dederer-vortrag-alb-hohenheim-kompatibilittsmodus.jpg)