Embed Size (px)
Citation preview
White Paper Sustainable Land Management programme / GLUES:
Models and Scenarios
Das vorliegende „white paper“ versucht die Arbeiten, die das Wissenschaftliche
Begleitvorhaben GLUES im Bereich Modelle und Szenarien leisten möchte, zu
konkretisieren.
Dieser Entwurf stellt eine erste Arbeitsgrundlage für die kommende gemeinsame Arbeit
mit den Regionalprojekten dar und wird durch den Input des Kick-offs „Nachhaltiges
Landmanagement“ in Bonn modifiziert.
Bei Rückfragen wenden Sie sich bitte an Frau Ruth Delzeit, [email protected]
Models and scenarios
Tamara Avellan4, Benjamin Bodirsky1, Ruth Delzeit2, Thomas Heckelei3, Christoph Heinzeller4, Gernot Klepper2, Hermann Lotze-Campen1, Wolfgang Lucht1, Wolfram Mauser4, Alexander Popp1, Sibyll Schaphoff1, Leila Shamsaifar3 1Potsdam Institute for Climate Impact Research (PIK), PO Box 60 12 03, 14412 Potsdam, Germany2 Kiel Earth Institute, Hindenburgufer 66, 24104 Kiel, Germany3 Institute for Food and Resource Economics, University of Bonn, Nussallee 21, 53115 Bonn, Germany4 Department of Geography, Ludwig-Maximilians Universität Munich, Luisenstraße 37 / III / 428, 80333 Munich, Germany
1. Aim and ScopeThis paper aims to serve as basis for an exchange between the GLUES Work Packages
3 and 4 and the regional projects on global data sets on long term and midterm
scenarios. This exchange should on the one hand consist of the provision of global data
sets under different scenarios from GLUES to the regional projects, whereas global data
sets will be provided through the Geodata Infrastructure (GDI). On the other hand, since
models applied by the GLUES partners and the regional projects work on different
regional scales and might have different assumptions and drivers, a comparison of the
model results and a validation of regional results simulated by the global models is
another field of exchange. Within GLUES, the models used to simulate mid term and
long term scenarios do not run only on different temporal, but also on different spatial
scales. Therefore, in order to describe steps to make global data sets consistent, the
paper additionally provides an overview on the modelling activities applied for
developing global data sets with different models.
2. General overview Scenarios of alternative plausible futures have been increasingly used in environmental
change assessments as a means of exploring potential consequences of socioeconomic
change on the environment.
One important contribution of GLUES is to support regional projects in their efforts in
modeling and impact assessment of land use change on greenhouse gas emissions and
ecosystem services. GLUES will apply different models to derive climate change
scenarios and biophysical impacts, to explore future pathways of the land use system
and to undertake structured analysis of complex interactions within the land system.
While assessing consistent regional and spatially-explicit scenarios, these models will
take account for the global context, as local and regional demands can be met in
spatially unconnected regions through international trade (Erb et al. 2009).
Most environmental foresight studies including the climate change scenarios of the
Intergovernmental Panel on Climate Change (IPCC) Special Report on Emissions
Scenarios (Nakicenovic et al. 2000) and the Millennium Ecosystem Assessment (MEA
2005) have used explorative storylines to provide scenarios of alternative plausible
futures. The ultimate objective of such storylines is to assess the variation in possible
futures and to provide insights into the magnitude and uncertainty of future changes.
Explorative storylines can finally be used for communication in the scientific community
and with stakeholders (Van der Heijden, 2005) in an attempt to extract policy
implications.
Within GLUES, a set of alternative scenarios will be developed that explores contrasting
trajectories within this scenario framework.
In the following sections we introduce models used within GLUES to simulate scenarios,
possible parameter spaces for the construction of scenarios, and expected outputs. To
construct these scenarios, explorative scenarios with associated deviations based on
differences in the underlying drivers will be adapted, elaborating the underlying
qualitative storylines. This contribution has two temporal facets: Medium-term (to 2030)
and long term (to 2100) scenarios as will be described in the following sections:
3. Medium-term scenarios (WP 3)
3.1 Objective
Besides land use dynamics that are driven by long term trends such as population
growth and climate change, there are some short term factors which are policy driven
and vary over time. Therefore, the aim of WP 3 “Medium-Term Projections” is to
combine long and short term trends in order to provide activities of the regional projects
on modelling and impact assessment with a common set of scenarios for global land use
change on a mid term time scale. The scenarios will consider important feedbacks of
agricultural markets, climate, economy and the related land use. Since factors
influencing land use dynamics are located in interdisciplinary research fields, three
different types of models are applied to produce and simulate drivers of mid term
scenarios.
3.2 Models
PROMET
In order to understand where agriculture takes place nowadays and how much is
produced, global models have been applied in the past ten years to examine global land
cover, climate variability, soil properties, extension of irrigation and ultimately the
extension and amount of harvest of agricultural crops. However, the scale at which these
models, due to technical limitations, have been run is mainly insufficient to truly be able
to extrapolate useful information about the productivity of the land stretches. With the
PROMET model (PROcess of radiation Mass and Energy Transfer) (Mauser & Bach,
2009) we therefore, contrary to current models, propose to study a large number of
statistically selected points (synonymous with a site on which a crop growth) on the
global land surface that are representative for a) the local climatic condition, b) the soil
properties of the region. PROMET is a physically based, spatially distributed process
model that simulates a wide variety of land surface categories including crop growth.
The included dynamic plant module in PROMET calculates the site specific biomass for
each relevant crop and makes inferences about maximum attainable yields and yield
gaps possible.
Outcomes of the approach is to furnish the global trade models (DART & CAPRI) with
biophysically maximum attainable yields of economically relevant crops/crop aggregates
(see Appendix A), in order to understand the role of climate and soil on crop production.
We will do so by first creating a global suitability classification of the relevant crops
(triggered by climate, soil and terrain) and randomly selecting representative areas from
this. Using the site-specific soil and climate values, we will then apply PROMET on these
areas and calculate potential maximum yields for each crop. An aggregation of these
results into the accorded regions (see Appendix B) will provide the final output result as
an input for the trade models.
CAPRI
The Common Agricultural Policy Regionalised Impact Analysis (CAPRI) Model1 has
been developed by a Europe-wide network of researchers under the lead of the Institute
for Food and Resource Economics at the University of Bonn. Its main objective is to
support decision making on reforms of the Common Agricultural Policy of the EU.
Global, trade related feedbacks have received increasing attention in recent years
CAPRI is a global agricultural sector model which is divided into two major modules, an
EU supply and a global market module: The supply module covers EU27 as well as
Norway, Western Balkans and Turkey. Regional disaggregation takes place at level 2 of
the Nomenclature of Statistical Territorial Units (NUTS, 280 regions)2. The NUTS 2
system divides the territory of the EU into a hierarchical system of administrative
regions. Within these regions, optimization models for up to ten representative farm
types determine land allocation to crop production activities and animal production
levels.3
The market module is a partial, spatial, global multi-commodity model for agricultural
products and includes 60 countries in 28 trade blocks for 47 products. It is characterized
as partial, because non-agricultural factor and product markets and some agricultural
products such as flowers are excluded. It is spatial, as bilateral trade flows and related
trade policy instruments and transportation costs between territorially explicit trade
blocks are included. 4
Data in CAPRI are stored in the GDX format. As CAPRI is a GAMS-based system, the
GDX format enables the use of an interface to pass data in or out more rapidly. Along
with a native interface definition, data can then be exchanged with applications.
For the GLUES project, the explicit representation of land use of agricultural production
activities already implemented in the EU supply module will be integrated into the supply
specification at the global scale with an alternative approach compatible with the
structure of the market module. In addition, the currently specified regions will be
aggregated and mapped to 23 regions. This development will enable simulations of
global agricultural land use changes depending on medium term scenarios. Scenario 1 Website: http://www.capri-model.org/index.htm2 Website: http://epp.eurostat.ec.europa.eu/portal/page/portal/nuts_nomenclature/introduction3 See Annex for a list of output, income indicators, policy variables and processed products in the database
as well as a list for aggregated farm types in the supply model.4 See Annex for a list regions and databases of further elements in the market model.
variables currently include exogenous determinants of demand and supply such as
population, shifts in preferences, income, input prices, all potentially differentiated by
trading blocks. The explicit integration of land at the global level will be accompanied by
allowing for climate dependent yield developments.
DART
At the Kiel Earth Institute, the Dynamic Applied Regional Trade (DART) model, a
recursive dynamic computable general equilibrium (CGE) model of the world economy,
covering multiple sectors and regions has been developed. It simulates the
repercussions on economic activity between the different world regions and countries
and can be used to analyse the world-wide feedback effects of economic policies across
different sectors and regions (see Springer 2002, Klepper et al. 2003, Kretschmer et al.
2008). Hence it computes likely impacts outside the land use sectors and derives
welfare effects of different policy scenarios (see section 3.3).
The model’s primary factors are labour, capital and land and it is based on the GTAP7
data set of the Global Trade Projects. For the analysis of land use change, it is
calibrated to an aggregation of 23 regions (see Appendix B), and consequently model
outputs are values (changes compared to a base year) for each region. Each regional
economy comprises five energy sectors, sixteen agricultural sectors that include the
most important energy crops (wheat, maize, sugar cane, four types of oil seeds), and
three industrial production sectors. An explicit representation of land is included into
DART via the introduction of Agro-Ecological-Zones (AEZs). In each region there are up
to 18 AEZs, which differ along growing period and climatic zones. The AEZs enter as
inputs into national production functions for each land-using sector.
The major exogenous drivers of the model dynamics are changes in the labour force, the
rate of labour productivity growth, changes in human capital, the savings rate, the gross
rate of return on capital, and thus the endogenous rate of capital accumulation.
The agricultural sector is represented in a less detailed way compared to the CAPRI
model, but the advantage of DART is that it endogenously considers all sectors of the
world economy. Thus, by taking into account both agricultural and energy markets and
their interactions, in the GLUES project, DART is applied to generate a set of global
projections of agricultural markets and related land use. Thereby, parameters driving the
demand side such as population dynamics and shifts in nutrition are linked with regional
economic growth dynamics and their world market repercussions. As in CAPRI, data are
stored in GDX format.
The model outputs are summarised in the following section.
3.3 Global data sets and parameter spaces
All data are generated for the 23 regions; therefore, they are average values for these
world regions. Some data might be available in a more disaggregated resolution, since
CAPRI is very detailed for the European Union. Global data sets, produced for midterm
scenarios are:
GLUES Activities in this context (WP 3)
o In a dialogue with the regional projects, GLUES will develop global scenarios with the following parameters to be discussed:
o An exogenous parameter in DART and CAPRI is population growth. In DART population growth is taken from the PHOENIX model, which is in line with OECD projections. If of interest for regional projects, it could be changed for scenario analysis.
o Impacts of climate change on the maximum attainable yield.
o Climate policies: different green house gas reduction goals can be implemented into DART
o Biofuel policies: we can e.g. assume different countries to implement policies to support biofuels (for example EU target on 10% biofuels by 2020)
o Change in food consumption behaviour: we can assume a world with current food preferences or scenarios assuming, for example, more meat and milk consumption, or in contrast a more vegetarian diet
o We can assume a scenario with and without agricultural production in protected areas or areas with high biodiversity.
o The output of the models under these different scenario settings are global data sets which GLUES can provide to the regional projects. These are:
o Maximum attainable yield of the specified crops per GLUES region (see section 3.2),
o Yield gaps of the specified crops per GLUES region (see section 3.2),
o Land use (in production value and hectare) for the GLUES regions
o In many regional models, parameters on development of global market prices of e.g. agricultural goods or energy goods are exogenously given. GLUES can provide these data to the regional projects at the level of aggregation of the GLUES regions.
o Changes in the average Gross Domestic Product by GLUES region under different scenario settings can be used to measure welfare effects of different policy settings. This also provides another category of input data for the regional projects.
4. Long-term scenarios (WP 4)WP4 will help to assess global-scale, yet regionally explicit quantitative scenarios of
factors that are likely to co-determine regional trajectories of land use change under
policies that consider long-term global sustainability objectives and trade-offs such as
climate change impacts, adaptation and mitigation. To construct these scenarios,
explorative scenarios with associated deviations based on differences in the underlying
drivers will be adapted, elaborating the underlying qualitative storylines. The quantitative
trends for the main driving forces will either be elaborated or compiled from existing
sources (i.e. MEA 2005, Nakicenovic 2000).
First, temperature stratified climate scenarios will be made available at a spatial
resolution of 0.5 x 0.5 degrees for the climate parameters temperature, precipitation and
cloudiness. The range of IPCC AR4 scenarios and updates of these as well as more
recent scenarios as they become available in the lead-up to the AR5, will be transformed
for impact, mitigation and adaptation research in the regional consortia.
Second, we will apply different simulation models and methodologies to derive a set of
drivers (such as the impact of global warming on yield changes and freshwater
availability), consequences (such as greenhouse gas emissions) and patterns of
potential future land use under specified interregional optimization and sustainability
criteria using an internally consistent framework (see Fig. 1 for an overview):
LPJmL
The prime eco-physiological model that will be employed is the long-established,
internationally recognized, global-scale, spatially and temporally explicit biogeochemical
process model of natural and agricultural vegetation LPJmL (Sitch et al. 2003, Gerten et
al. 2004, Bondeau et al. 2007). It is able to simulate the transient changes in carbon and
water stocks and fluxes in response to land use change and climate change, the specific
phenology and seasonal CO2 fluxes of agricultural-dominated areas, and the production
of crops and grazing land as well as the potential of biomass plantation of the second
generation within grid cells of 0.5 degree resolution. Crops are represented by 12 crop
functional types and biomass plants by 1 temperate tree ( e.g poplars and willows) and 1
tropical tree (e.g. Eukalyptus) and a C4 grass (e.g. Miscanthus). Crops, grazing land and
land for biomass production can be either rainfed or irregated. This allows the global and
regional quantification and differentiation of irrigation water use and rainwater use from
agricultural products, including biomass production for bioenergy use. External drivers
are climate parameters as temperature, precipitation, cloudiness and wet days, these
data, used for the historical period, are provided by the Climatic Research Unit Datasets
- CRU TS 3.00 (Mitchel and Jones, 2005) and by atmospheric carbon dioxide content.
The individual cover fraction per gridcell are prescribed by a land use data set and soil
texture parameters are derived from the FAO database (FAO, 1991).
MAgPIE
The global land-use optimization model MAgPIE (Lotze-Campen et al. 2008, Popp et al.
2010) simulates future transitions of the landuse sector. The model works on a time
step of 10 years in a recursive dynamic mode. The optimized land-use pattern from one
period is taken as the initial land constraint in the next period.The model inputs are both
socio-economic parameters like population, income or production costs (labour,
chemicals and other capital from GTAP) and biophysical information like yield-levels or
water requirements from LPJmL. The model features 20 cropping and 5 livestock
sectors, and uses depending on data-availability either 0.5° grid-based data sets or
regional parameters for 10 world regions. The objective function of MAgPIE is to
minimize total cost of production for a given amount of regional food and bioenergy
demand. Feed for livestock is produced as a mixture of grain, green fodder produced on
crop land and pasture. The model simulates trajectories for the agricultural sector and
determines endogenously cropping patterns, trade flows, land-expansion and increases
in future crop-yields. The direct link of MAgPIE to the LPJml model allows for an
integration of biophysical constraints into an economic decision-making process and
thus provides a straightforward link between monetary and physical units as well as
processes, producing insights into the internal use value of resource constraints.
The following products will be produced and made available to the regional projects
through the Geodata Infrastructure (GDI) (see Fig. 1 for an overview):
(S0) Temperature-scaled Climate Change Scenarios
(S1) Scenarios of calorie demand for different demographic, GDP and lifestyle
trajectories (regions-based)
(S2) Scenarios of (potential) agricultural yield development under climate change (by
temperate increase, GCM, 0.5° resolution, 2000-2100)
(S3) Scenarios of macrohydrological freshwater availability (0.5° resolution and for river
basins, monthly 2000-2100)
(S4) Scenarios of 2nd generation bioenergy demand (regional [EJ]) and production (10-
yearly, 0.5° resolution, 2000-2100)
(S5) Biome composition shifts (in the form of change metrics, to be used as a top-level
indicators of shifts in ecosystem services) under climate and land use change (0.5°
resolution, annually 2000-2100)
(S6) Scenarios of potential future land use patterns (0.5° resolution, 10-yearly time slices
2000-2100)
(S7) Scenarios of potential (implied) change in global agricultural trade (including
bioenergy) as a consequence of the land use scenarios produced (regions, 10-yearly
time slices 2000-2100)
(S8) Scenarios of shadow prices for environmental resources (within 10 macroeconomic
regions, with selected regional resolution to the pixel level, 10-yearly time slices 2000-
2100)
(S9) Scenarios of greenhouse gas emissions (CH4, N2O, CO2) from land use
(agriculture) and land use change (e.g. deforestation) under (0.5° resolution, 10-yearly
time slices 2000-2100)
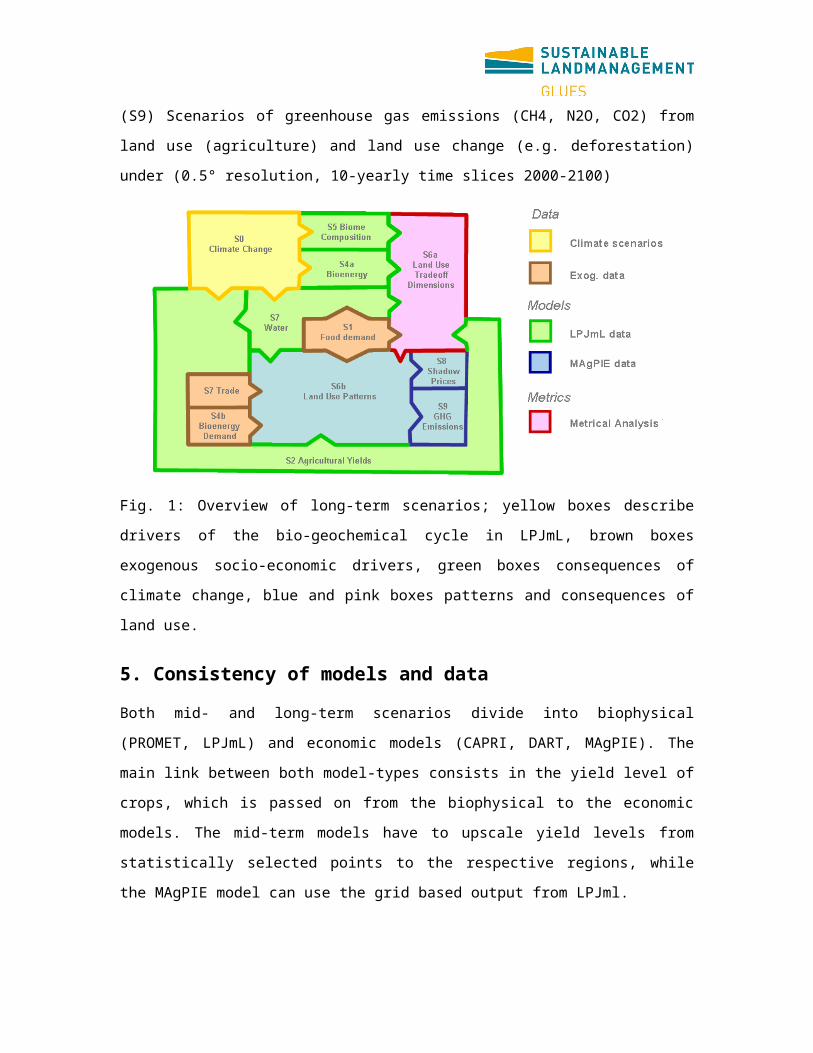
Fig. 1: Overview of long-term scenarios; yellow boxes describe drivers of the bio-
geochemical cycle in LPJmL, brown boxes exogenous socio-economic drivers, green
boxes consequences of climate change, blue and pink boxes patterns and
consequences of land use.
5. Consistency of models and dataBoth mid- and long-term scenarios divide into biophysical (PROMET, LPJmL) and
economic models (CAPRI, DART, MAgPIE). The main link between both model-types
consists in the yield level of crops, which is passed on from the biophysical to the
economic models. The mid-term models have to upscale yield levels from statistically
selected points to the respective regions, while the MAgPIE model can use the grid
based output from LPJml.
The two mid-term economic models will be harmonised with respect to the
representation of land in order to increase consistency of the models. Whether and how
the data sets of mid-term and the long-term models shall be harmonised has not been
decided yet. The economic models use different modelling approaches: CAPRI is a
partial equilibrium model, DART a computable general equilibrium model and MAgPIE a
partial optimisation model.
6. ReferencesBondeau, A.; Smith, P. C.; Zaehle, S.; Schaphoff, S.; Lucht, W.; Cramer, W.; Gerten, D.; Lotze-Campen, H.; Müller, C.; Reichstein, M.; Smith, B. (2007): Modelling the role of
agriculture for the 20th century global terrestrial carbon balance. Global Change Biology 13(3): 679-706.
Erb K, Krausmann F, Lucht W, Haberl H 2009 Embodied HANPP Mapping the spatial disconnect between global biomass production and consumption Ecological Economics, 692 328-334
FAO: The digitized soil map of the world, Food and Agriculture Organization of the United Nations, Rome, Italy, 1991.
Gerten, D., Schaphoff, S., Haberlandt, U., Lucht, W., Sitch, S., 2004. Terrestrial vegetation and water balance: hydrological evaluation of a dynamic global vegetation model. Journal of Hydrology 286, 249–270.
Klepper, G., S. Peterson, K. Springer (2003): DART97: A Description of the Multi-regional, Multi-sectoral Trade Model fort he analysis of Climate Policies. Kiel Working Paper 1149.
Kretschmer, B., S. Peterson, A. Ignaciuk (2008): Integrating Biofuels into the DART Model. Kiel Working Papers 1472.
Lotze-Campen, H., Müller, C., Bondeau, A., Rost, S., Popp, A., Lucht, W., 2008. Global food demand, productivity growth and the scarcity of land and water resources: a spatially explicit mathematical programming approach. Agricultural Economics 39 (3), 325–338.
Mauser, W., Bach H. (2009): PROMET – a Physically Based Hydrological Model to Study the Impact of Climate Change on the Water Flows of Medium Sized, Mountain Watersheds, J. Hydrol., 376(2009)362-377, DOI:10.1016/j.hydrol.2009.07.046
Millennium Ecosystem Assessment (MA). 2005. Millennium ecosystem assessment synthesis report. Island Press, Washington, D.C., USA.
Mitchell and Jones, 2005: An improved method of constructing a database of monthly climate observations and associated high-resolution grids. Int. J. Climatology, 25, 693-712, Doi: 10.1002/joc.1181.
Nakicenovic, N., J. Alcamo, G. Davis, B. de Vries, J. Fenhann, S. Gaffin, K. Gregory, A. Grübler, T. Y. Jung, T. Kram, E. la Rovere, L. Michaelis, S. Mori, T. Morita, W. Pepper, H. Pitcher, L. Price, K. Riahi, A. Roehrl, H.-H. Rogner, A. Sankovski, M. E. Schlesinger, P. R. Shukla, S. Smith, R. J. Swart, S. van Rooijen, N. Victor, and Z. Dadi. 2000. Special report on emissions scenarios. Cambridge University Press, Cambridge, UK.
Popp A, Lotze-Campen H and Bodirsky B 2010 Food consumption, diet shifts and associated non-CO2 greenhouse gas emissions from agricultural production. Global Environmental Change 20 451-462
Sitch, S., Smith, B., Prentice, I., Arneth, A., Bondeau, A., Cramer, W., Kaplan, J., Levis, S., Lucht, W., Sykes, M., Thonicke, K., Venevsky, S., (2003). Evaluation of ecosystem dynamics, plant geography and terrestrial carbon cycling in the LPJ dynamic global vegetation model. Global Change Biology 9 (2), 161–185.
Springer, K. (2002): Climate Policy in an Globalizing World: A CGE Model with Capital Mobility and Trade. Kieler Studien. Springer, Berlin.
Van der Heijden, K. (2005). "Scenarios: The Art of Strategic Conversation," 2nd/Ed. Wiley, Chichester, UK.
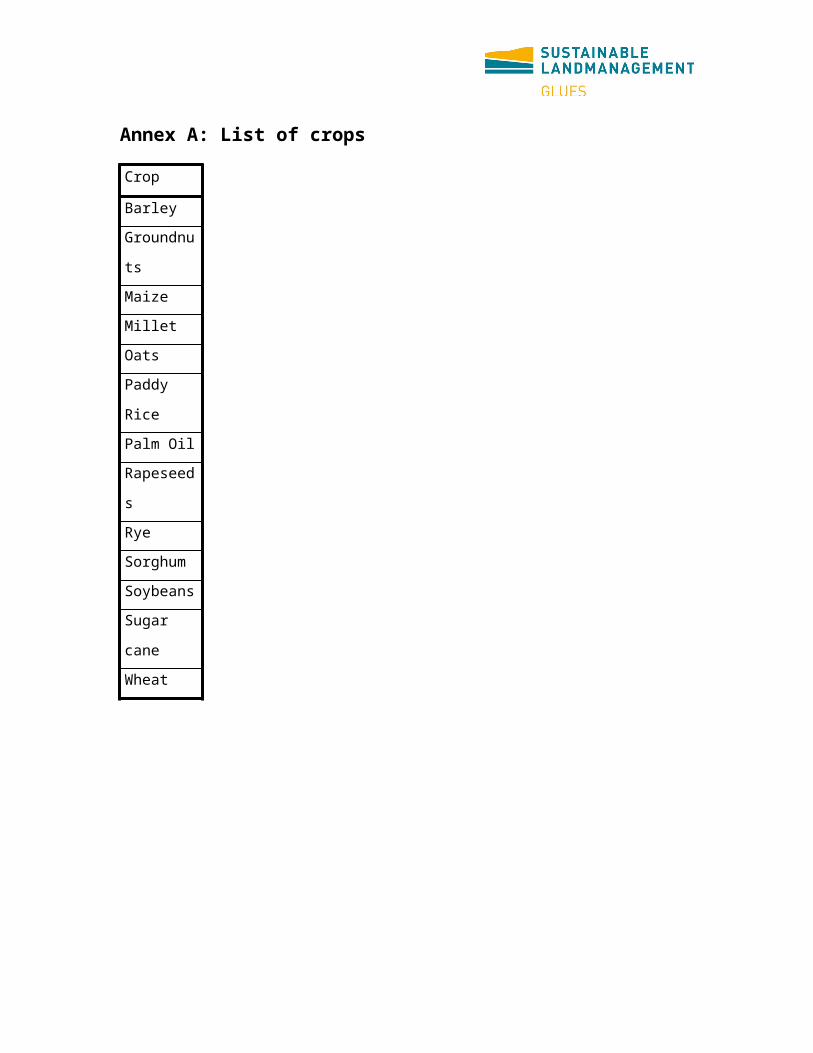
Annex A: List of crops
Crop
Barley
Groundnut
s
Maize
Millet
Oats
Paddy
Rice
Palm Oil
Rapeseed
s
Rye
Sorghum
Soybeans
Sugar
cane
Wheat
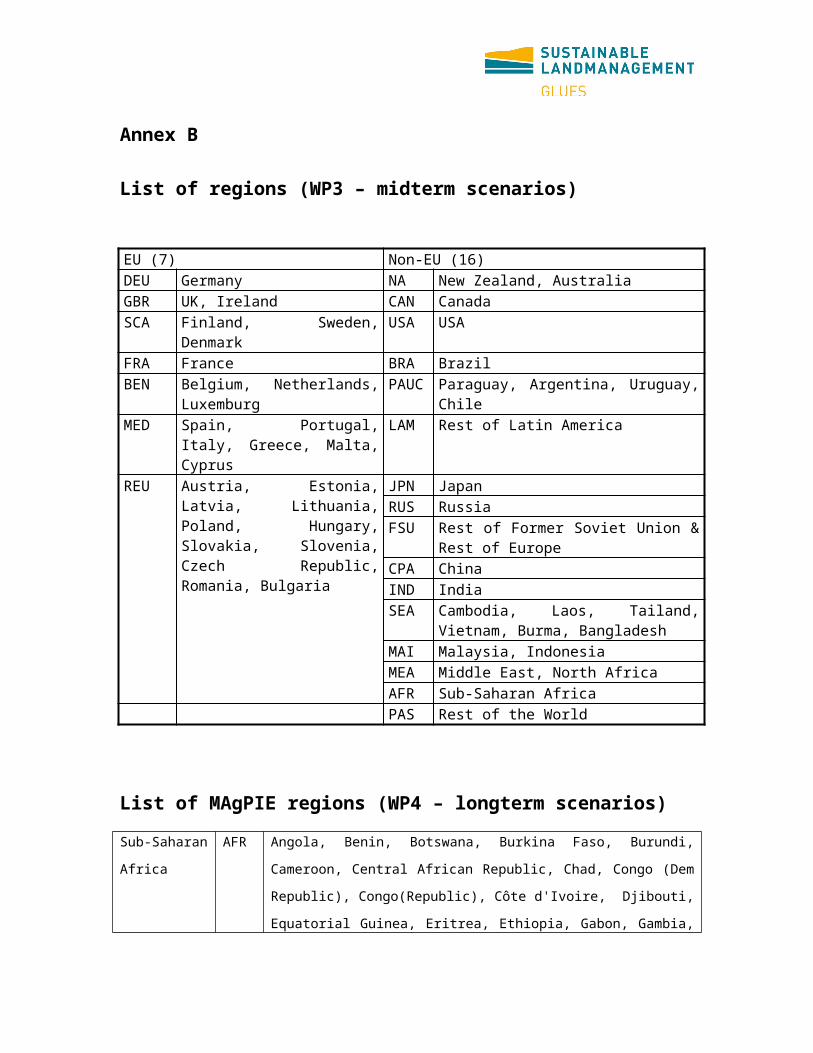
Annex B
List of regions (WP3 – midterm scenarios)
EU (7) Non-EU (16)DEU Germany NA New Zealand, AustraliaGBR UK, Ireland CAN CanadaSCA Finland, Sweden, Denmark USA USAFRA France BRA BrazilBEN Belgium, Netherlands,
LuxemburgPAUC Paraguay, Argentina, Uruguay, Chile
MED Spain, Portugal, Italy, Greece, Malta, Cyprus
LAM Rest of Latin America
REU Austria, Estonia, Latvia, Lithuania, Poland, Hungary, Slovakia, Slovenia, Czech Republic, Romania, Bulgaria
JPN JapanRUS RussiaFSU Rest of Former Soviet Union & Rest of
EuropeCPA ChinaIND IndiaSEA Cambodia, Laos, Tailand, Vietnam,
Burma, BangladeshMAI Malaysia, IndonesiaMEA Middle East, North AfricaAFR Sub-Saharan AfricaPAS Rest of the World
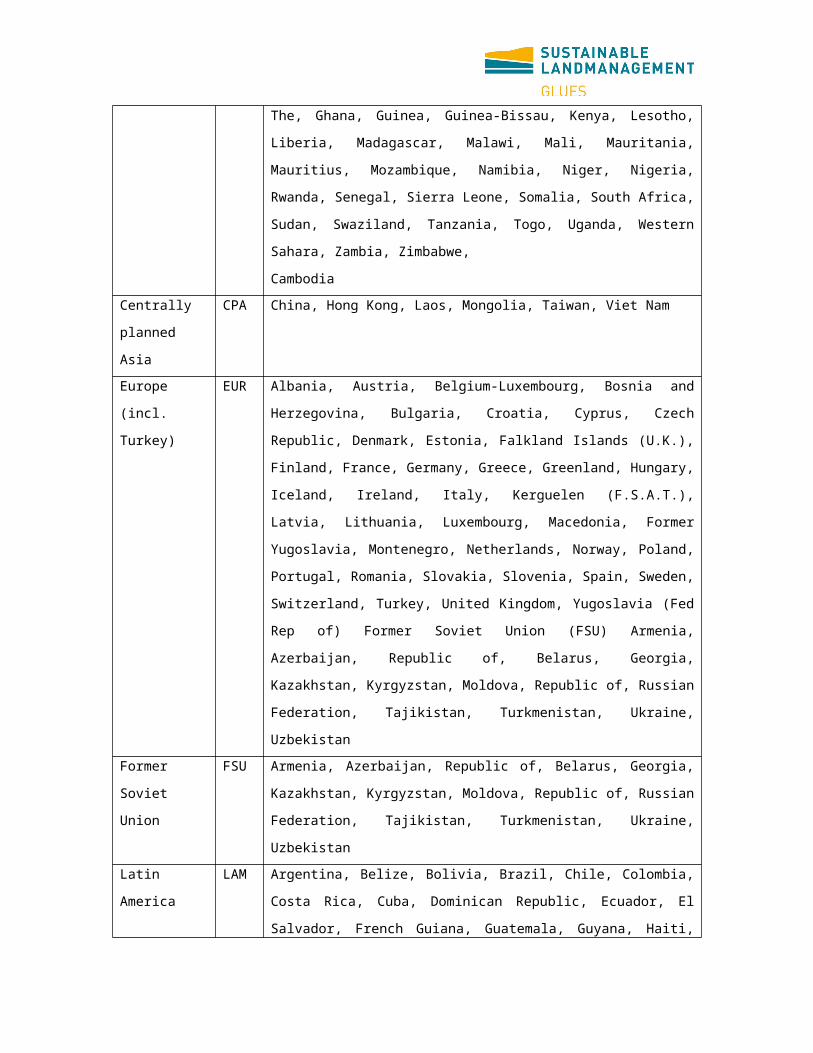
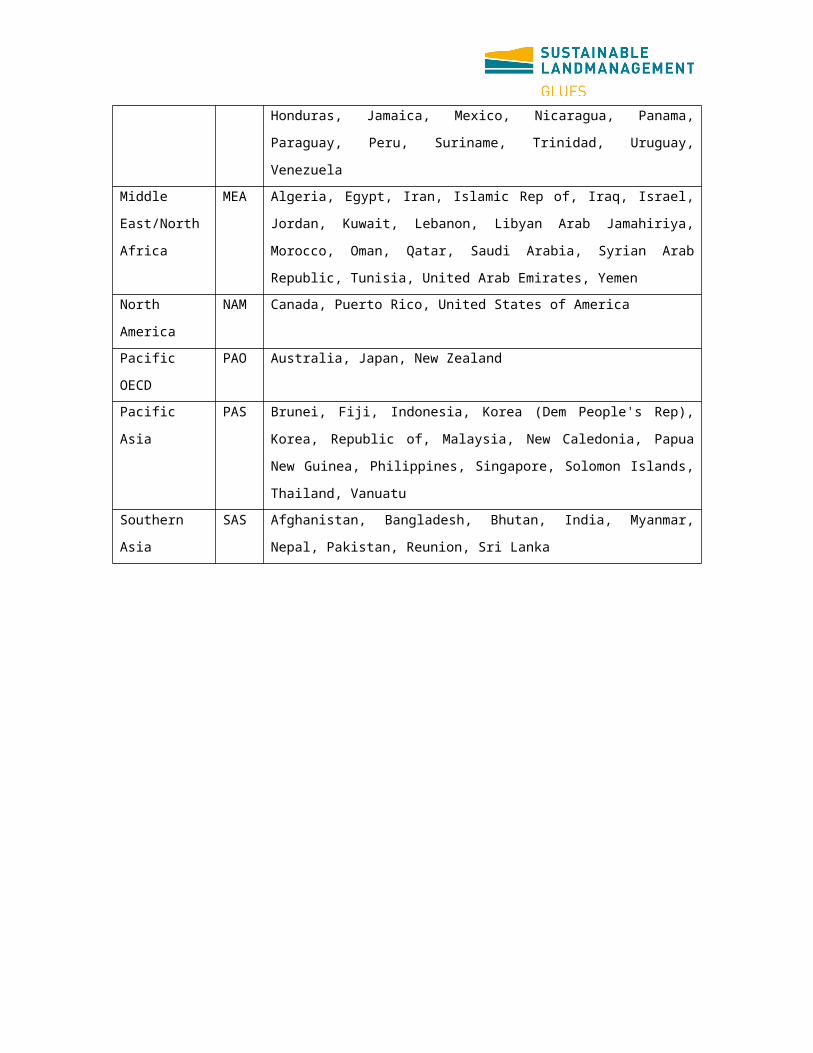
List of MAgPIE regions (WP4 – longterm scenarios)Sub-Saharan Africa
AFR Angola, Benin, Botswana, Burkina Faso, Burundi, Cameroon, Central African Republic, Chad, Congo (Dem Republic), Congo(Republic), Côte d'Ivoire, Djibouti, Equatorial Guinea, Eritrea, Ethiopia, Gabon, Gambia, The, Ghana, Guinea, Guinea-Bissau, Kenya, Lesotho, Liberia, Madagascar, Malawi, Mali, Mauritania, Mauritius, Mozambique, Namibia, Niger, Nigeria, Rwanda, Senegal, Sierra Leone, Somalia, South Africa, Sudan, Swaziland, Tanzania, Togo, Uganda, Western Sahara, Zambia, Zimbabwe,
CambodiaCentrally planned Asia
CPA China, Hong Kong, Laos, Mongolia, Taiwan, Viet Nam
Europe(incl. Turkey)
EUR Albania, Austria, Belgium-Luxembourg, Bosnia and Herzegovina, Bulgaria, Croatia, Cyprus, Czech Republic, Denmark, Estonia, Falkland Islands (U.K.), Finland, France, Germany, Greece, Greenland, Hungary, Iceland, Ireland, Italy, Kerguelen (F.S.A.T.), Latvia, Lithuania, Luxembourg, Macedonia, Former Yugoslavia, Montenegro, Netherlands, Norway, Poland, Portugal, Romania, Slovakia, Slovenia, Spain, Sweden, Switzerland, Turkey, United Kingdom, Yugoslavia (Fed Rep of) Former Soviet Union (FSU) Armenia, Azerbaijan, Republic of, Belarus, Georgia, Kazakhstan, Kyrgyzstan, Moldova, Republic of, Russian Federation, Tajikistan, Turkmenistan, Ukraine, Uzbekistan
Former Soviet Union
FSU Armenia, Azerbaijan, Republic of, Belarus, Georgia, Kazakhstan, Kyrgyzstan, Moldova, Republic of, Russian Federation, Tajikistan, Turkmenistan, Ukraine, Uzbekistan
Latin America
LAM Argentina, Belize, Bolivia, Brazil, Chile, Colombia, Costa Rica, Cuba, Dominican Republic, Ecuador, El Salvador, French Guiana, Guatemala, Guyana, Haiti, Honduras, Jamaica, Mexico, Nicaragua, Panama, Paraguay, Peru, Suriname, Trinidad, Uruguay, Venezuela
Middle East/North Africa
MEA Algeria, Egypt, Iran, Islamic Rep of, Iraq, Israel, Jordan, Kuwait, Lebanon, Libyan Arab Jamahiriya, Morocco, Oman, Qatar, Saudi Arabia, Syrian Arab Republic, Tunisia, United Arab Emirates, Yemen
North America
NAM Canada, Puerto Rico, United States of America
Pacific OECD PAO Australia, Japan, New ZealandPacific Asia PAS Brunei, Fiji, Indonesia, Korea (Dem People's Rep), Korea,
Republic of, Malaysia, New Caledonia, Papua New Guinea, Philippines, Singapore, Solomon Islands, Thailand, Vanuatu
Southern Asia
SAS Afghanistan, Bangladesh, Bhutan, India, Myanmar, Nepal, Pakistan, Reunion, Sri Lanka
CAPRI Supply Module: Output, Input, income indicators, policy variables and processed products in the data base
Group Activity Code
Outputs
Cereals Soft wheatDurum wheatRye and Meslin Barley Oats Paddy rice Maize Other cereals
SWHE DWHE RYEM BARL OATS PARI MAIZ OCER
Oilseeds Rape Sunflower Soya Olives for oil Other oilseeds
RAPE SUNF SOYA OLIV OOIL
Other annual crops Pulses Potatoes Sugar beet Flax and hemp Tobacco Other industrial crops
PULS POTA SUGB TEXT TOBA OIND
Vegetables Fruits Other perennials
Tomatoes Other vegetablesApples, pear & peaches Citrus fruits Other fruits Table grapes Table olives Table wine Nurseries Flowers Other marketable crops
TOMA OVEG APPL CITR OFRU TAGR TABO TWIN NURS FLOW OCRO
Fodder GrasFodder maize Fodder root crops Fodder root crops Straw
GRAS MAIF OFAR ROOF STRA
Marketable products from animal product
Milk from cows Beef Pork meat Sheep and goat meat Sheep and goat milk Poultry meat Other marketable animal products
COMI BEEF PORK SGMT SGMI POUM OANI
Intermediate products from animal production
Milk from cows for feedingMilk from sheep and goat cows for feeding Young cows Young bulls Young heifers
COMF SGMF
YCOW YBUL YHEI
Young male calves Young female calves Piglets Lambs Chicken
Nitrogen from manure Phosphate from manure Potassium from manure
YCAM YCAF YPIG YLAM YCHI
MANN MANP MANK
Other Output from EAA Renting of milk quota Agricultural services
RQUO SERO
Inputs
Mineral and organic fertiliser Seed and plant protection
Nitrogen fertiliser Phosphate fertiliser Potassium fertiliser Calcium fertiliser Seed Plant protection
NITF PHOF POTF CAOF SEED PLAP
Feeding stuff Feed cereals Feed rich protein Feed rich energy Feed based on milk products Gras Fodder maize Other Feed from arable land Fodder root crops Feed otherStraw
FCER FPRO FENE FMIL FGRA FMAI FOFA FROO FOTHFSTRA
Young animal Other animal specific inputs
Young cow Young bull Young heifer Young male calf Young female calf Piglet Lamb Chicken Pharmaceutical inputs
ICOW IBUL HEI ICAM ICAF IPIG ILAM ICHI IPHA
General inputs Maintenance machineryMaintenance buildings Electricity Heating gas and oil Fuels Lubricants Water Agricultural services input Other inputs
REPM REPB ELEC EGAS EFUL ELUB WATR SERI INPO
Income indicators Production value Total input costs Gross value added at producer prices Gross value added at basic pricesGross value added at market prices plus CAP premiums
TOOU TOIN GVAP GVAB MGVA
Activity level Cropped area, slaughtered heads or herd size
LEVL
Policy variables Relating to activities
Premium ceiling Historic yield
PRMC HSTY
Premium per ton historic yield Set-aside rate Premium declared below base area/herd Premium effectively paid Premium amount in regulation Type of premium application Factor converting PRMR into PRMD Ceiling cut factor
PRET SETR PRMD
PRME PRMR APPTYPE APPFACT CEILCUT
Processed products Rice milled Molasse Starch Sugar Rape seed oil Sunflower seed oil Soya oil Olive oil Other oil Rape seed cake Sunflower seed cake Soya cake Olive cakes Other cakes Gluten feed from ethanol production Biodiesel Bioethanol Palm oil Butter Skimmed milk powder Cheese Fresh milk products Creams Concentrated milk Whole milk powder Whey powder Casein and caseinates Feed rich protein imports or byproducts Feed rich energy imports or byproducts
RICE MOLA STAR SUGA RAPO SUNO SOYO OLIO OTHO RAPC SUNC SOYC OLIC OTHC GLUE BIOD BIOE PLMO BUTT SMIP CHES FRMI CREM COCM WMIO WHEP CASE FPRI FENI
Source: CAPRI Model Documentation
CAPRI Supply module: Aggregated farm types used for impact assessmentCode Description Farm type included
A10 Specialist COP (other than rice) or various field crops
133,144
A13 Specialist Rice or Rice & COP 132,133
A14 Root crops 141,142
A23 Permanent crops & vegetables 143,201,202,203,311,312,313,314,321,322,323,330,340
A41 Dairy 411,412,431
A42 Cattle fattening & rairing 421,422,432
A44 Sheep & goats 441,442,443,444
501 Specialist pigs 501
A52 Specialist poultry 502,503
A60 Field crops diversified 601,602,603,604,605,606
A70 Livestock diversified 711,712,721,722,723
A80 Livestock & crops diversified 811,812,813,814,821,822,823
999 Various
Source: CAPRI modeling system
CAPRI Market Module: Regional BreakdownCountry/Country
aggregateCode Components with own
behavioural functionsCountry name Covered by
programming models in supply module?
European Union 15, broken down into Member States (Luxembourg aggregated with Belgium)
EU015000 AT000000BL000000DK000000DE000000EL000000ES000000FI000000FR000000IR000000IT000000NL000000PT000000SE000000UK000000
AustriaBelgium/LuxDenmarkGermanyGreeceSpainFinlandFranceIrlandItalyNetherlandsPortugalSwedenUnited Kingdom
Yes
European Union 10, broken down into Member States
EU010000 CY000000
CZ000000
EE000000
HU000000
LT000000
LV000000
MT000000
SI000000
SK000000
PL000000
CyprusCzech RepublicEstoniaHungaryLithuaniaLatviaMaltaSloveniaSlovakiaPoland
Yes
Norway NO000000 Norway Yes
Bulgaria & BUR BG000000 Bulgaria Yes
Romania RO000000 Romania
Other mediterranean countries
MED TUNALGEGYISR
TunisiaAlgeriaEqypt Israel
No
Turkey TUR Yes
Morocco MOR MOR No
Western Balkan countries
WBA HR000000 CS000000MO000000KO000000AL000000BA000000
MK000000
Croatia SerbiaMontenegroKosovoAlbaniaBosnia & Herzegov.TFYR Macedonia
Yes
Rest of Europe REU No
Russia, Belarus & Ukraine RBU No
United States of America USA No
Canada CAN No
Mexico MEX No
Venezuela VEN No
Argentina ARG No
Brazil BRA No
Chile CHL No
Uruguay URU No
Paraguay PAR No
Bolivia BOL No
Rest of South America RSA No
Australia & New Zealand ANZ No
China CHN No
India IND No
Japan JAP No
Least Developed Countries LDC No
ACP Countries which are not
ACP No
LDCs
Rest of World ACP No
Source: CAPRI modeling system
CAPRI Market Module: Data Sources Based on
Bi-lateral trade flows FAOSTAT
Items of the market balances for countries not covered by the supply model. (production, feed demand, processing demand, human consumption)
FAOSTAT
Most favorite nation tariffs and data for TRQs and bilateral agreements AMAD data base, EU legislation
Source: CAPRI modeling system


![Capsule & Powder Technology] - Bickel & Wolf HOeFLIGER/1 Modu-C_d.pdf · Capsule & Powder Technology] - Optionale Tara/Brutto-Waage für die Stichproben - Modu-C kontrolle oder 100%-Qualitätskontrolle](https://img.pdfslide.org/doc/110x75/5e1c6045626e4d6d4779fb2b/capsule-powder-technology-bickel-hoefliger1-modu-cdpdf-capsule.jpg)