Embed Size (px)
Citation preview

AUS DEM LEHRSTUHL
FÜR
MUND-, KIEFER- und GESICHTSCHIRURGIE
Prof. Dr. Dr. Torsten E. Reichert
DER FAKULTÄT FÜR MEDIZIN
DER UNIVERSITÄT REGENSBURG
THE INFLUENCE OF SUBSTRATE STIFFNESS ON THE OSTEOGENIC
DIFFERENTIATION OF STEM-AND PROGENITOR CELLS FROM DENTAL TISSUE
Inaugural – Dissertation
zur Erlangung des Doktorgrades
der Zahnmedizin
der
Fakultät für Medizin
der Universität Regensburg
vorgelegt von
Esthera Prateeptongkum
2014

Dekan: Prof. Dr. Dr. Torsten E. Reichert
1. Berichterstatter: PD Dr. rer. nat. Christian Morsczeck
2. Berichterstatter: Prof. Dr. Lukas Prantl
Tag der mündlichen Prüfung: 11.03.15
Abstract
The influence of substrate stiffness on the osteogenic differentiation
of stem-and progenitor cells from dental tissue
This thesis is mainly concerned with the influence of substrate stiffness on periodontal ligament
stem cells (PDLSCs) and stem cells from the apical papilla (SCAPs). PDLSCs and SCAPs are stem cells
from dental tissues which are known to be a valuable source for regenerative procedures. The substrate
stiffness is an important factor to promote the differentiation of stem cells to specific cell lineage. For
example, stiff substrate induces the osteogenic differentiation of mesenchymal stem cells (MSCs) and stem
cells from human exfoliated deciduous teeth (SHED), while soft matrix promoted the differentiation of
dental follicle cells (DFCs) into the osteogenic lineage. In this study, PDLSCs and SCAPs were
characterized in terms of stem cell properties. The characterization of PDLSCs and SCAPs which were
obtained from different isolation methods and donors were comparable. However, the strongest
mineralization was observed in PDLSCs and SCAPs which were isolated from the same tooth.
Subsequently, polyacrylamide (PA) substrates with 3 different stiffness; stiff, medium and soft, were used
to determine the influence of matrix stiffnesses on PDLSCs and SCAPs. Here, the matrix stiffness could
not promote the osteogenic differentiation of PDLSCs and SCAPs. However, soft substrate tended to
induce PDLSCs, while stiff substrate tended to promote SCAPs into osteogenic lineage, which is similar to
DFCs and SHED respectively. Interestingly, soft matrix induced both PDLSCs and SCAPs into adipocytes,
which is similar to MSCs.
Diese Doktorarbeit beschäftigt sich vor allem mit dem Einfluss der Substratsteifigkeit auf
Parodontalligament-Stammzellen (PDLSCs) und Stammzellen aus der apikalen Papille (SCAPs). PDLSCs
und SCAPs sind Stammzellen aus Zahngewebe, die dafür bekannt sind, eine wertvolle Quelle für
regenerative Verfahren zu sein. Die Substratsteifigkeit ist ein wichtiger Faktor, um die Differenzierung von
Stammzellen zu spezifischen Zelllinien zu fördern. Steifes Substrat induziert zum Beispiel die osteogene
Differenzierung von mesenchymalen Stammzellen (MSCs) und Stammzellen aus der Pulpa von
Milchzähnen (SHED), während die weiche Matrix die osteogene Differenzierung dentaler Follikelzellen
(DFCs) fördert. In dieser Studie wurden PDLSCs und SCAPs hinsichtlich der Stammzelleigenschaften
untersucht. Die Charakterisierung der PDLSCs und SCAPs, die aus verschiedenen Isolationsmethoden und
Spendern stammen, waren vergleichbar. Jedoch wurde die stärkste Mineralisierung in PDLSCs und SCAPs
die aus dem gleichen Zahn stammen beobachtet. Anschließend wurden Polyacrylamid (PA) Substrate mit 3
verschiedenen Steifigkeiten, steif, mittel und weich, verwendet, um den Einfluss der Matrix-Steifigkeit auf
PDLSCs und SCAPs zu bestimmen. Hier konnte die Matrix-Steifigkeit die osteogene Differenzierung von

PDLSCs und SCAPs nicht fördern. Tendenziell jedoch haben ein weicher Untergrund bei PDLSCs und ein
steifer Untergrund bei SCAPs die osteogene Richtung gefördert, ähnlich wie bei DFCs beziehungsweise
SHED. Interessanterweise und ähnlich wie bei MSCs hat eine weiche Matrix sowohl bei PDLSCs als auch
bei SCAPs die Differenzierung in Adipozyten gefördert.
Contents
1. Introduction 1
1.1 Tooth development 1
1.2 Dental stem cell isolation method 2
1.3 Tooth tissue-derived stem cell 4
1.3.1 Dental pulp stem cells (DPSCs) 4
1.3.2 Periodontal ligament stem cells (PDLSCs) 5
1.3.3 Stem cells from apical papilla (SCAPs) 5
1.3.4 Dental follicle stem cells (DFSCs) 6
1.4 Tissue engineering 6
1.5 Factors influence the fate of stem cells 8
1.5.1 Soluble factor directs stem cell fate 8
1.5.2 Mechanical and physical factors direct stem cell fate 9
1.5.2.1 Mechanical force controls the gene expression of MSCs 9
1.5.2.2 Topography influences MSC fate 10
1.5.2.3 Stiffness substrate directs MSCs fate specification 10
1.5.2.4 Influences of stiffness substrate on dental stem cells 13
1.6 Objective of the study 14
2. Materials and Methods 15
2.1 Materials 15
2.2 Methods 24
2.2.1 Cell culture 24
2.2.2 Flow cytometry 25
2.2.3 Preparation of Polyacrylamide Substrate 26
2.2.4 Cell attachment and proliferation 27
2.2.5 Colony-Forming Efficiency 27
2.2.6 Differentiation protocol 28
2.2.7 Mineralization measurement 28
2.2.8 Alkaline phosphatase (ALP) activity measurement 29
2.2.9 Adipogenic differentiation 30
2.2.10 Quantitative reverse transcription-polymerase chain reaction (qRT-PCR) 31
2.2.11 Statistical analysis 32
3. Results 33
3.1 Phenotype characterization of PDLSCs and SCAPs 33
3.2 Osteogenic differentiation of PDLSCs and SCAPs 36
3.3 Adipogenic differentiation of PDLSCs and SCAPs 40
3.4 Substrate characterization 42
3.5 PDLSCs and SCAPs on polyacrylamide (PA) substrates 42
3.6 Effect of substrate stiffness on the ALP activity of PDLSCs and SCAPs 43
3.7 Effect of substrate stiffness on the osteoblast-related-gene expressions of PDLSCs 45
and SCAPs
3.8 Effect of substrate stiffness on the adipogenic differentiation of PDLSCs and SCAPs 48
4. Discussion 51
4.1 Characterization of PDLSCs and SCAPs 51
4.2 Osteogenic differentiation potential of PDLSCs and SCAPs 52
4.3 Adipogenic differentiation potential of PDLSCs and SCAPs 53
4.4 PDLSCs and SCAPs selection for the experiment with PA substrate 53
4.5 PA substrate fabrication 54
4.6 PDLSCs and SCAPs attachment and proliferation on PA substrate 55
4.7 Osteogenic differentiation of PDLSCs and SCAPs on PA substrate 56
4.8 Adipogenic differentiation of PDLSCs and SCAPs on PA substrate 58
4.9 Conclusion 58
5. References 60
Supplementary data 74
Introduction
Page | 1
1. Introduction
Tooth loss or the onset of oral health problems, including periodontal disease, dental
caries, traumatic injury, etc., causes physical and mental suffering such as mastication, occlusion,
esthetic and associated general health issues that compromise an individual’s self-esteem and
quality of life (1-4). A tooth is a complex biological organ that arises from the tooth germ under
the sequential reciprocal interactions between oral epithelial cells (ectoderm) and cranial neural
crest derived mesenchymal cells (5-8), as well as consisting of distinctive hard tissues including
enamel, dentin and cementum (9-10). The soft connective tissues, including pulp and periodontal
ligament (PDL) that contain blood vessels and nerve fibers, are also the component of vital pulp
for maintaining the homeostasis of a tooth. Therefore, a tooth has a three dimensional multicellular
structure which forms the functional cooperation with the maxillofacial region (9-10).
1.1 Tooth development
Embryologically, teeth are ectodermal organs regulated by the reciprocal interaction of
epithelial and mesenchymal cells that is a principal development mechanism related to stem cells,
signaling molecules and the transcription factor pathway. Tooth forming fields are specified
through the expression of homoeobox genes such as Msx1, Msx2, Barx1 and Lhx8 and secretory
molecules including fibroblast growth factors (FGFs) and bone morphogenetic proteins (BMPs)
during the development of craniofacial in mice (5,11-13). The invagination of oral epithelium into
the mesenchymal region occurs between embryonic day (ED) 11-12 and then the tooth bud is
formed by the aggregation of cranial neural crest derived mesenchymal cells. Between ED 13-15,
an enamel knot, which is a transient epithelial signaling center that expresses several signaling
molecules including Wnt 10b, Shh, FGFs and BMPs, is thought to be the regulation of epithelial-
mesenchymal and individual cell fate interactions. The epithelial and mesenchymal cells in the
tooth germ finally differentiate into the precursors of the specialized tooth cells such as
Introduction
Page | 2
ameloblasts, odontoblasts and dental follicle cells between ED 16.5-18.5 (14-15). These
progenitor cells coordinate enamel deposition and produce dentin matrix at the boundary surface
between the epithelium and the mesenchyme (14). Simultaneously, dental follicle cells
differentiate into periodontal tissues, including periodontal ligament (PDL), cementum, and
alveolar bone (16). Teeth continue to develop postnatally, tooth elongation is followed by tooth
crown formation and then the mature teeth erupt into the oral cavity. It is believed that various
immature cells remain as adult tissue stem cells, which can act as a self-repairing system for
injured dental tissue (17).
1.2 Dental stem cell isolation method
To obtain the cells from dental tissues, two main methods were used to isolate cells;
outgrowth and single cell isolation methods, which previously named the cells as progenitor and
stem cell, respectively (18-22). Regarding the outgrowth method, the fragments were placed into
the culture dishes, after the dental tissues had been separated from a tooth and minced into small
pieces. Afterwards, the progenitor cells migrated from the tissue fragments and attached
themselves on the surface of the culture dishes. The single cell isolation method was first
documented by Friedenstein, with the presence of nonhematopoietic cells that were able to
autorenovate and differentiate in the bone marrow (20). Subsequently, bone-marrow-derived cells
which were isolated following Friedenstein’s technique, also demonstrated the high capacity of
proliferation and differentiation into mesenchymal cells. Therefore, the term “mesenchymal stem
cell” (MSC) was used by Caplan to describe them (23). For stem cells from dental tissues,
Gronthos et al. were the first group of people to isolate stem cells from human dental pulp by
using a single cell isolation method (24). In short, the small pieces of dental tissues were digested
with a digestive enzyme and passed through a 70 µm strainer. Single cells were then seeded into
Introduction
Page | 3
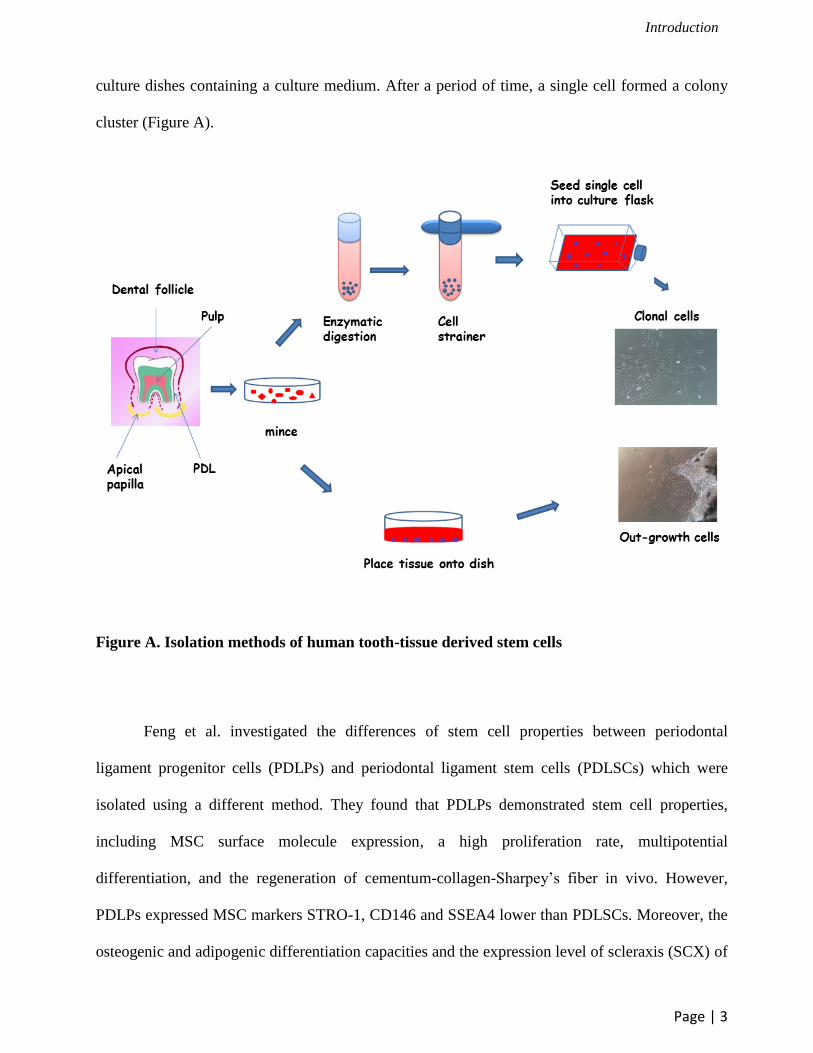
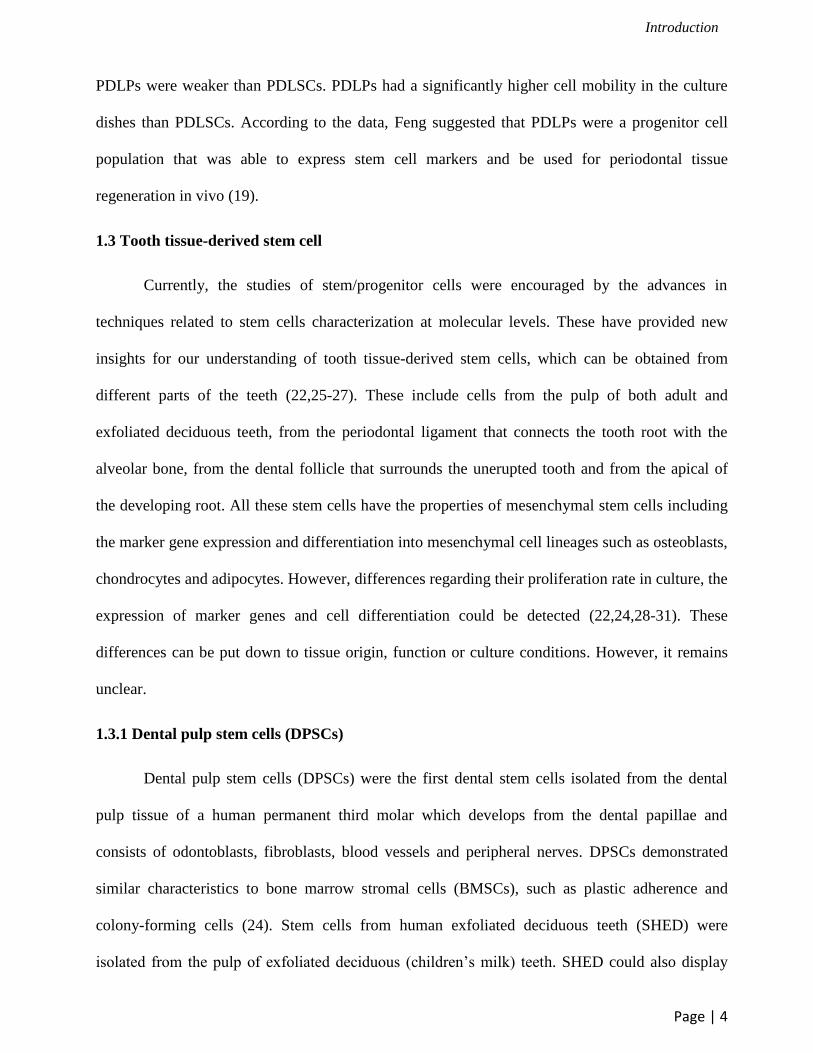
culture dishes containing a culture medium. After a period of time, a single cell formed a colony
cluster (Figure A).
Figure A. Isolation methods of human tooth-tissue derived stem cells
Feng et al. investigated the differences of stem cell properties between periodontal
ligament progenitor cells (PDLPs) and periodontal ligament stem cells (PDLSCs) which were
isolated using a different method. They found that PDLPs demonstrated stem cell properties,
including MSC surface molecule expression, a high proliferation rate, multipotential
differentiation, and the regeneration of cementum-collagen-Sharpey’s fiber in vivo. However,
PDLPs expressed MSC markers STRO-1, CD146 and SSEA4 lower than PDLSCs. Moreover, the
osteogenic and adipogenic differentiation capacities and the expression level of scleraxis (SCX) of
Introduction
Page | 4
PDLPs were weaker than PDLSCs. PDLPs had a significantly higher cell mobility in the culture
dishes than PDLSCs. According to the data, Feng suggested that PDLPs were a progenitor cell
population that was able to express stem cell markers and be used for periodontal tissue
regeneration in vivo (19).
1.3 Tooth tissue-derived stem cell
Currently, the studies of stem/progenitor cells were encouraged by the advances in
techniques related to stem cells characterization at molecular levels. These have provided new
insights for our understanding of tooth tissue-derived stem cells, which can be obtained from
different parts of the teeth (22,25-27). These include cells from the pulp of both adult and
exfoliated deciduous teeth, from the periodontal ligament that connects the tooth root with the
alveolar bone, from the dental follicle that surrounds the unerupted tooth and from the apical of
the developing root. All these stem cells have the properties of mesenchymal stem cells including
the marker gene expression and differentiation into mesenchymal cell lineages such as osteoblasts,
chondrocytes and adipocytes. However, differences regarding their proliferation rate in culture, the
expression of marker genes and cell differentiation could be detected (22,24,28-31). These
differences can be put down to tissue origin, function or culture conditions. However, it remains
unclear.
1.3.1 Dental pulp stem cells (DPSCs)
Dental pulp stem cells (DPSCs) were the first dental stem cells isolated from the dental
pulp tissue of a human permanent third molar which develops from the dental papillae and
consists of odontoblasts, fibroblasts, blood vessels and peripheral nerves. DPSCs demonstrated
similar characteristics to bone marrow stromal cells (BMSCs), such as plastic adherence and
colony-forming cells (24). Stem cells from human exfoliated deciduous teeth (SHED) were
isolated from the pulp of exfoliated deciduous (children’s milk) teeth. SHED could also display
Introduction
Page | 5
the adherence to plastic, fibroblast-like cells and neural-like stem cells (31). Both DPSCs and
SHED express stem cell markers CD146 and STRO-1. They were suggested to be dental stem
cells with high proliferation and multipotential of differentiation into odontoblasts, osteoblasts,
adipocytes and neural cells. Thus, these stem cells would be a good resource for stem cell
mediated dentin-pulp complex regeneration (24,31-34).
1.3.2 Periodontal ligament stem cells (PDLSCs)
Periodontal ligament (PDL), a specialized connective tissue, is developed from dental
follicle tissue during tooth formation in tooth development, and establishes a biological connection
between the cementum of the tooth root and the alveolar bone (16,35-36). PDL-derived stem cells
could also be isolated from adult human PDL and cultured in vitro as stem cells. Recently, several
studies have demonstrated that PDLSCs were able to differentiate into all of the periodontal cell
types after transplantation in vivo, and were able to generate cementum and the PDL complex
structure in vivo transplantation into an immunocompromised animal (28). The periodontal
ligament is under constant strain from the mastication forces. Therefore, PDL cell numbers are
assumed to be maintained by PDLSCs. This could explain why they are better than other dental
stem cells at forming a PDL-like structure (37).
1.3.3 Stem cells from apical papilla (SCAPs)
Stem cells from the root apical papilla (SCAPs) are isolated from dental papilla located
apically to the developing pulp. So, SCAPs can only be obtained during a period of tooth
development. SCAPs demonstrated higher rates of proliferation than DPSCs in vitro culture and
had the capability to differentiate into odontoblasts and adipocytes (29). Interestingly, the study of
Sonoyama et al. showed that dentin and periodontal ligament were formed after co-transplanting
SCAPs (to form a root) and PDLSCs (to form a periodontal ligament) into tooth sockets of pigs.
These findings suggested that a combination of SCAPs and PDLSCs could be used to create a
Introduction
Page | 6
biological root which is similar to the principle of a metal implant. Therefore, the apical papilla, an
embryonic-like tissue with a very active source of stem cells, is considered to be a valuable source
of stem cells for tissue engineering (29).
1.3.4 Dental follicle stem cells (DFSCs)
The dental follicle is an ectomesenchyme-derived connective tissue sac surrounding the
tooth crown and the dental papilla of the developing tooth germ before eruption (38). It is believed
that this tissue contains progenitor cells for cementoblasts, PDL, and osteoblasts. During the tooth
development stage, dental follicle cells (DFCs) differentiate into PDL fibroblasts which secrete
collagen and interact on the surface of root cementum and alveolar bone with PDL fibers (39,40).
Dental follicle stem cells (DFSCs) isolated from the first molars of the neo-natal rat were
first identified as mesenchymal stem/progenitors cells (41). Human DFSCs can also be easily
isolated after surgical removal of impacted third molars. Similar to BMSCs, DFSCs are plastic
adherent and colony forming cells. In addition, DFSCs have shown the ability of differentiation
into osteoblasts, cementoblasts, adipocytes and neural cells (22,42). Therefore, these cells are
thought to be good candidate cell types for periodontal tissue regeneration.
1.4 Tissue engineering
Tissue engineering is an interdisciplinary field that is expected to have a marked impact in
the field of healthcare. Tissue engineers are working on developing new approaches to encourage
tissue growth or repair that are founded on the basic science of organ development and wound
healing. The loss of tissue or loss of an organ, as well as damaged tissue or a damaged organ is
one of the most frequent, devastating, and costly problems in human health care. A new field,
tissue engineering, applies the principles of biology and engineering to develop the functional
substitutes for damaged tissue (43-44). Recently, the production of synthetic implantable devices,
Introduction
Page | 7
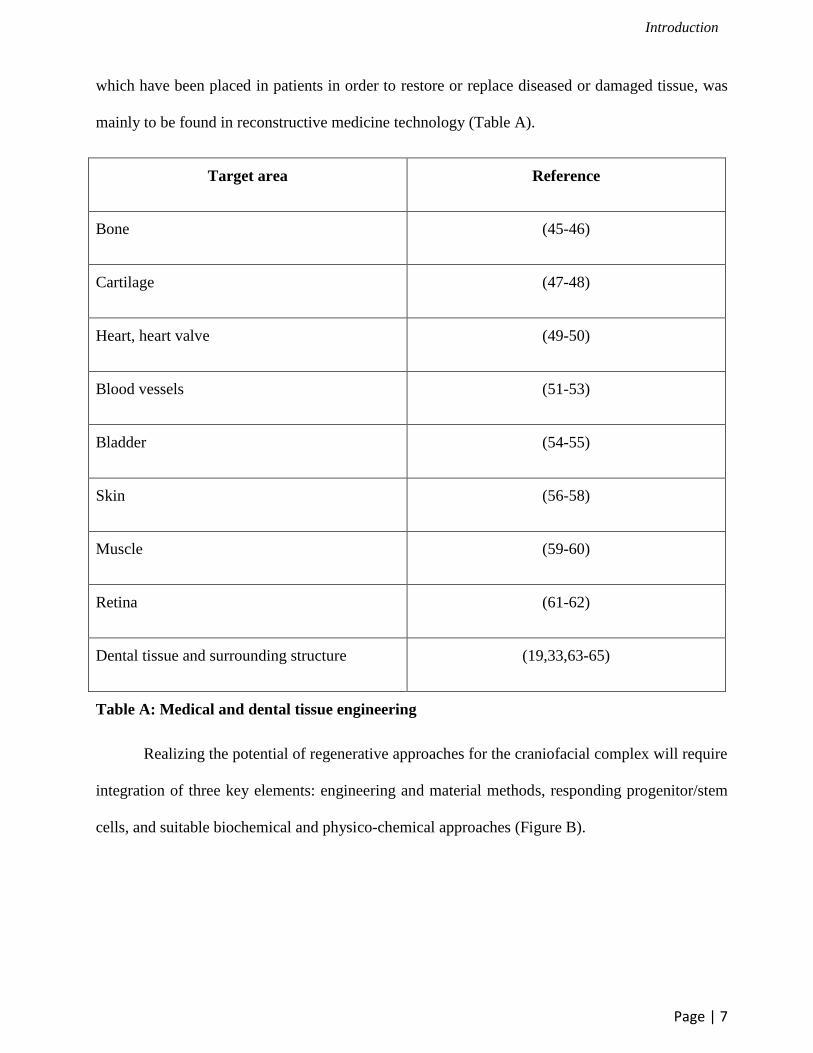
which have been placed in patients in order to restore or replace diseased or damaged tissue, was
mainly to be found in reconstructive medicine technology (Table A).
Target area Reference
Bone (45-46)
Cartilage (47-48)
Heart, heart valve (49-50)
Blood vessels (51-53)
Bladder (54-55)
Skin (56-58)
Muscle (59-60)
Retina (61-62)
Dental tissue and surrounding structure (19,33,63-65)
Table A: Medical and dental tissue engineering
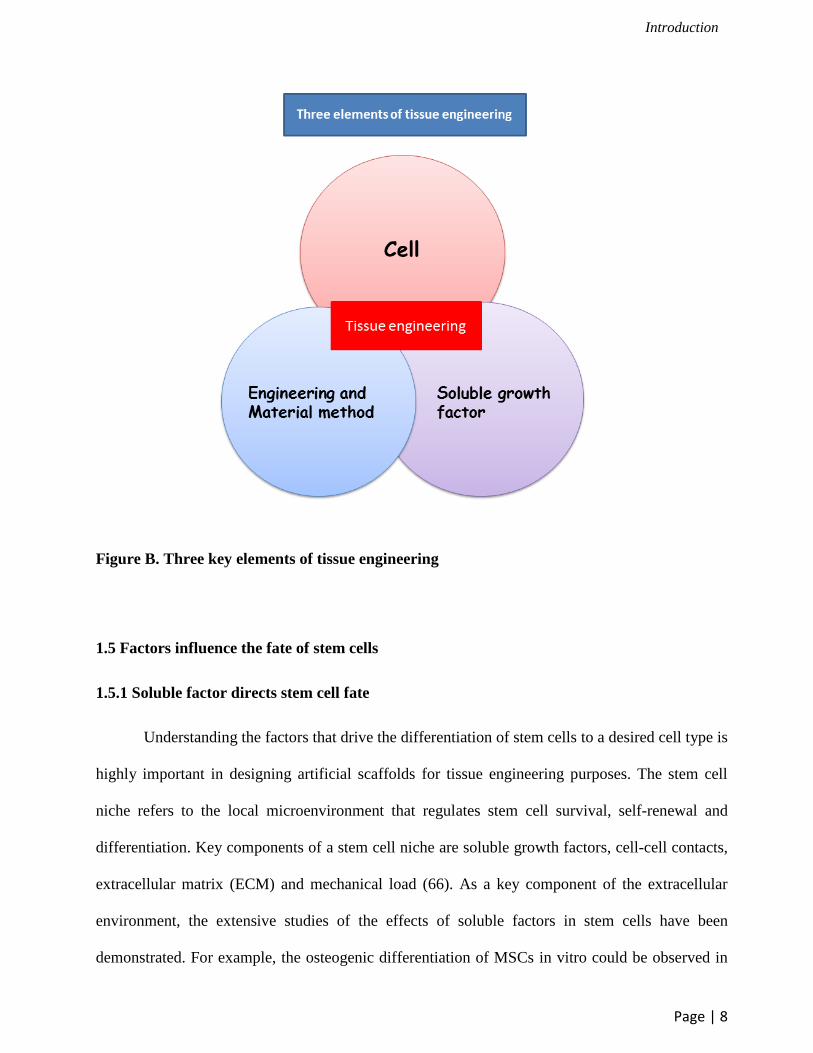
Realizing the potential of regenerative approaches for the craniofacial complex will require
integration of three key elements: engineering and material methods, responding progenitor/stem
cells, and suitable biochemical and physico-chemical approaches (Figure B).
Introduction
Page | 8
Figure B. Three key elements of tissue engineering
1.5 Factors influence the fate of stem cells
1.5.1 Soluble factor directs stem cell fate
Understanding the factors that drive the differentiation of stem cells to a desired cell type is
highly important in designing artificial scaffolds for tissue engineering purposes. The stem cell
niche refers to the local microenvironment that regulates stem cell survival, self-renewal and
differentiation. Key components of a stem cell niche are soluble growth factors, cell-cell contacts,
extracellular matrix (ECM) and mechanical load (66). As a key component of the extracellular
environment, the extensive studies of the effects of soluble factors in stem cells have been
demonstrated. For example, the osteogenic differentiation of MSCs in vitro could be observed in
Introduction
Page | 9
the presence of a combination of dexamethasone, ascorbic acid, and β-glycerophosphate (67), in a
conditioned medium from osteocytes (68), and with a variety of factors such as transforming
growth factor-β1 (TGF-β1) (69), and basic fibroblast growth factor (70). Furthermore, TGF-β1 has
been verified in global gene expression analyses of MSCs as a key growth factor pathway for
chondrogenic, osteogenic and adipogenic differentiation (71-72).
1.5.2 Mechanical and physical factors direct stem cell fate
Mechanical and physical factors such as mechanical loading (73), electromagnetic fields
(74), and biomaterials (75-80) have been studied in tissue engineering approaches for the
differentiation of MSCs into osteogenic lineage. Advances in biomaterial engineering and scaffold
fabrication were able to develop in vitro cell culture systems for accommodation and application
of MSCs in regenerative medicine. Several studies showed the strong influences of the features of
extracellular matrix (ECM) on regulating stem cell fate as follows.
1.5.2.1 Mechanical force controls the gene expression of MSCs
Kurpinski et al. investigated the effects of mechanical forces on the differentiation of
MSCs by using a micropatterned strip to align MSCs along the uniaxial strain direction. The result
showed that the expression of smooth muscle cell (SMC) marker calponin-1 was increased, while
the expression of cartilage matrix marker was decreased. However, the changes of gene expression
were diminished when aligning MSCs perpendicularly to the direction of the strain. Therefore, the
study suggested that mechanical strain had an effect on the differentiation of MSCs (81).
Moreover, the study from the same group has shown that the synergistic upregulation of calponin-
1 was detected when TGFβ1 was applied together with cyclic mechanical strain. So, they
suggested that both TGF-β and mechanical stimulation play an important role in MSC regulation
(82).
Introduction
Page | 10
1.5.2.2 Topography influences MSC fate
Physical topography, a part of ECM networks, was shown to influence the behavior of
stem cells (83-84). The studies of cell-nanoenvironment interaction were performed using nano
topographies which were fabricated by electron beam lithography (EBL). Dalby et al. examined
the effect of nanoscale topographic features on MSCs. Bone-specific ECM protein osteocalcin and
osteopontin-positive regions, as well as early nodule formation were detected in MSCs grown on
the substrate with dots displaced randomly by up to 50 nm (DSQ50). However, a distinct
differentiation profile of differentiated cells could be observed in comparison to those treated with
osteogenic medium. Therefore, they suggested that the mechanism for the regulation of
differentiation between cells cultivated on nanotopography substrate and in osteogenic medium
was different (85).
1.5.2.3 Stiffness substrate directs MSCs fate specification
Engler et al. illustrated the first evaluation of the matrix stiffness role in modulating the
fate of human mesenchymal stem cells (hMSCs) (86). Polyacrylamide gels, which were
established according to the protocol described previously by Pelham et al. (87) and were coated
with type I collagen as an artificial matrix for the attachment of stem cells in vitro, were used in
this publication. The elasticity of matrix substrates ranged from relatively rigid to soft, depending
on the proportion of chemical crosslinking. The result showed that MSC fate was promoted by the
substrate stiffness. For example, MSCs demonstrated neuronal phenotype when they were grown
on a soft matrix that mimicked brain elasticity (E ~ 0.1-1 kPa). In addition, when MSCs were
cultured on substrate with intermediate stiffness that mimicked the elasticity of striated muscle (E
~ 8-17 kPa), they displayed myogenic characteristics. Furthermore, the stiffer substrates
comparable to collagenous bone (E ~ 25-40 kPa) led MSCs to osteoblast. Hence, the substrate
stiffness was very effective in regulating MSCs to develop into the desired lineage (86).
Introduction
Page | 11
In order to understand the mechanism, Engler found that the elasticity-directed lineage
specification was blocked by non-muscle myosin II (NMM II) inhibition without strongly
perturbing many aspects of cell function. The results indicated the distinct mechanism by which
matrix stiffness governed directed differentiation. This conclusion was supported by the
investigation that the induction by substrate stiffness was complementary to the regulatory effects
of specialized soluble factors which have previously been shown to regulate MSCs into specific
cell lineages (86).
In order to support the study from Engler, Li et al. investigated the effect of substrate
stiffness on the functions of rat bone marrow and adipose tissue derived mesenchymal stem cells
in vitro (88). Polydimethylsiloxane (PDMS) was used in this study with five different stiffnesses;
the softest (Sot), soft (SO), medium (M), stiff (ST), and the stiffest (STt). They found that when
rat bone marrow derived MSCs (rBMSCs) and rat adiposed tissue derived MSCs (rAMSCs) were
grown on different surface substrates, cellular functions were detected according to the matrix
stiffness. The attachment of both rBMSCs and rAMSCs on the softer substrate was better than that
on the stiffer one. The proliferation of these cells had no significant difference according to the
matrix stiffness. However, the stiffer substrate induced the osteogenic differentiation of the two
kinds of stem cells significantly more than the softer one. In addition, rBMSCs grown on the same
stiffness exhibited the expression of more osteoblast-related gene markers than rAMSCs.
Moreover, biomaterials, together with biochemical reagents influenced a stronger effect on
osteogenic differentiation of MSCs than with either treatment alone (88).
Park et al. also showed the influence of substrate stiffness on MSC differentiation (89).
They observed how the matrix stiffness modulated MSC differentiation into SMC and
chondrogenic lineages in response to TGF-β. They found that MSCs on a stiff matrix exhibited a
higher expression of SMC marker α-actin and calponin-1, on the other hand, MSCs on a soft
Introduction
Page | 12
matrix showed a high expression of chondrogenic marker collagen II and adipogenic marker
lipoprotein lipase (LPL). They also showed that TGF-β increases SMC marker expression on stiff
substrates and chondrogenic marker expression of soft substrates. However, TGF-β suppressed
adipogenic marker expression on soft substrates while the adipogenic medium and soft matrix
promoted the differentiation of MSCs into adipogenic lineage effectively. From the results, it was
suggested that although substrate stiffness was an important determinant of stem cell
differentiation, its effect might not be specific for only one lineage, and specialized soluble factors
such as TGF-β are required, together with matrix stiffness, to determine a unique differentiation
pathway (89).
Xue et al. observed the influences of substrate elasticity and cell seeding density on MSC
lineage differentiation (90). They generated polyacrylamide substrates with two different
stiffnesses that were hard and soft matrices corresponding to Young’s moduli of 40 + 3.6 and 1.6
+ 0.3 respectively. Type I collagen and fibronectin were used to coat the surface of substrates. The
result demonstrated that the regulation of osteogenic marker expression by stiff substrate was
overridden by a high cell seeding density. However, cell seeding density did not influence the
chondrogenic marker expression induced by soft gel. These evidences suggested that the
interplays between cell-matrix and cell-cell interactions contribute to hMSCs differentiation
(Figure C) (90).
Introduction
Page | 13
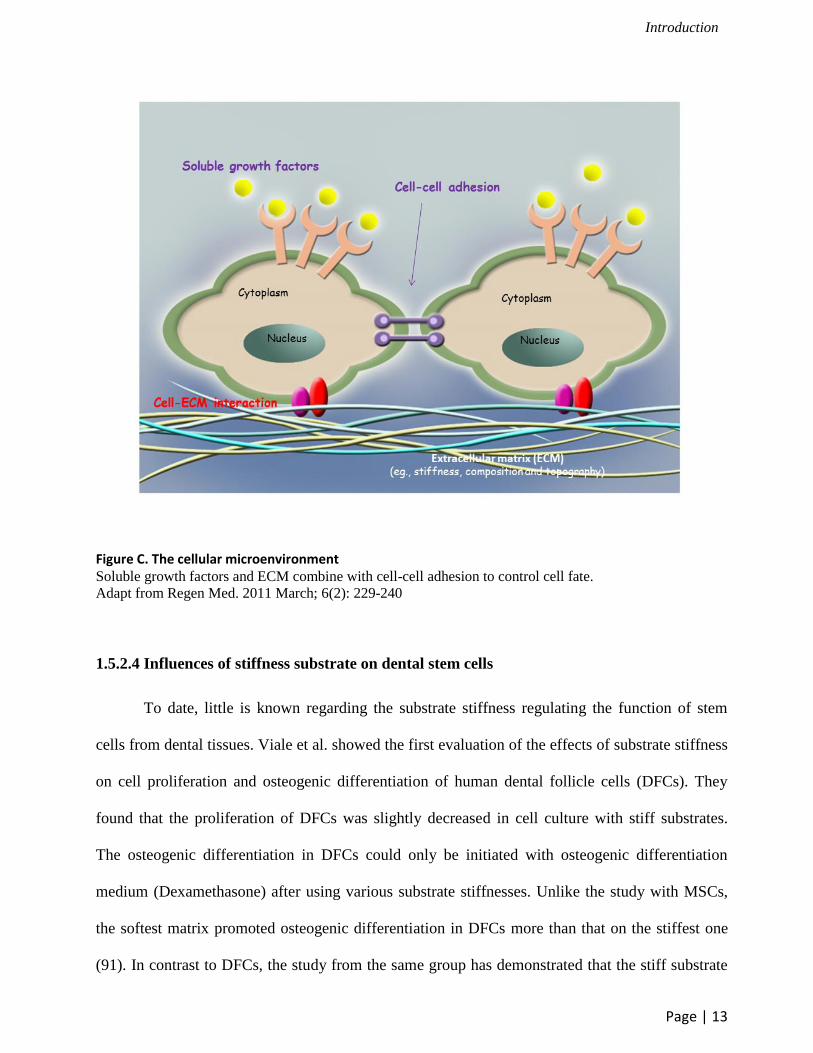
Figure C. The cellular microenvironment Soluble growth factors and ECM combine with cell-cell adhesion to control cell fate.
Adapt from Regen Med. 2011 March; 6(2): 229-240
1.5.2.4 Influences of stiffness substrate on dental stem cells
To date, little is known regarding the substrate stiffness regulating the function of stem
cells from dental tissues. Viale et al. showed the first evaluation of the effects of substrate stiffness
on cell proliferation and osteogenic differentiation of human dental follicle cells (DFCs). They
found that the proliferation of DFCs was slightly decreased in cell culture with stiff substrates.
The osteogenic differentiation in DFCs could only be initiated with osteogenic differentiation
medium (Dexamethasone) after using various substrate stiffnesses. Unlike the study with MSCs,
the softest matrix promoted osteogenic differentiation in DFCs more than that on the stiffest one
(91). In contrast to DFCs, the study from the same group has demonstrated that the stiff substrate
Introduction
Page | 14
promoted osteogenic differentiation in SHED which was similar to MSCs. In addition, the
proliferation of SHED was increased on a stiff substrate. Thus, they suggested that cellular
reactions on matrix-elasticity actually depended on the kind of the cell type and the extracellular
environment. However, additional studies are required to confirm this suggestion (92).
1.6 Objective of the study
The effect of surface stiffness on the function of MSCs has been well studied, and the
influence of this factor on DFCs and SHED has come to be known. However, for the other stem
cell lineages from dental tissues, the effect of matrix stiffness has not yet been examined.
This study investigated the effect of substrate stiffness on regulating the proliferation and
differentiation of two kinds of dental stem cells, PDLSCs and SCAPs. The following questions
were addressed:
1. Is there an association between human dental stem cell attachment, proliferation, the
osteogenic differentiation or adipogenic differentiation and the substrate stiffness?
2. Do the different kinds of dental stem cells respond differently to the substrate stiffness?
In the first part of this study, PDLSCs and SCAPs which are closely related to DFCs and
SHED were characterized in terms of stem cell properties from three teeth. Next, the best quality
of each stem cell lineage according to stem cell properties such as the capability of osteogenic
differentiation focusing on the mineralization induction and the multipotential differentiation was
used for the surface stiffness experiments.
Materials and Methods
Page | 15
2. Materials and Methods
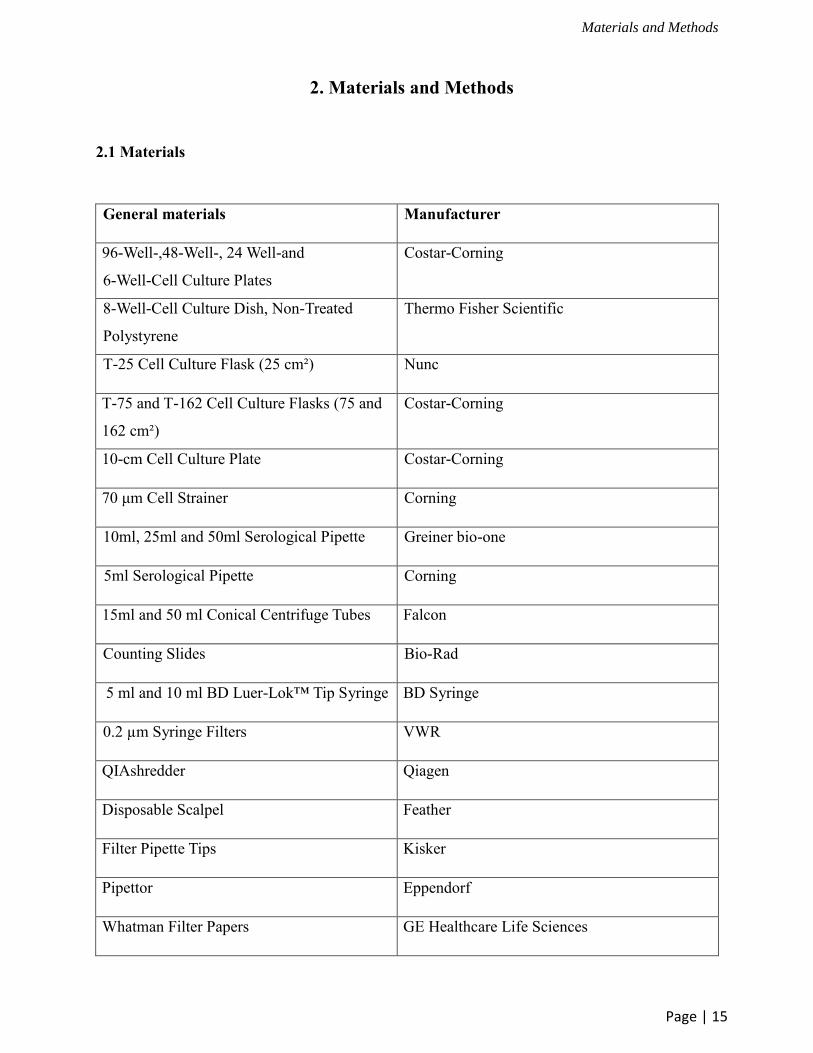
2.1 Materials
General materials Manufacturer
96-Well-,48-Well-, 24 Well-and
6-Well-Cell Culture Plates
Costar-Corning
8-Well-Cell Culture Dish, Non-Treated
Polystyrene
Thermo Fisher Scientific
T-25 Cell Culture Flask (25 cm²) Nunc
T-75 and T-162 Cell Culture Flasks (75 and
162 cm²)
Costar-Corning
10-cm Cell Culture Plate Costar-Corning
70 μm Cell Strainer Corning
10ml, 25ml and 50ml Serological Pipette Greiner bio-one
5ml Serological Pipette Corning
15ml and 50 ml Conical Centrifuge Tubes Falcon
Counting Slides Bio-Rad
5 ml and 10 ml BD Luer-Lok™ Tip Syringe BD Syringe
0.2 µm Syringe Filters VWR
QIAshredder Qiagen
Disposable Scalpel Feather
Filter Pipette Tips Kisker
Pipettor Eppendorf
Whatman Filter Papers GE Healthcare Life Sciences
Materials and Methods
Page | 16
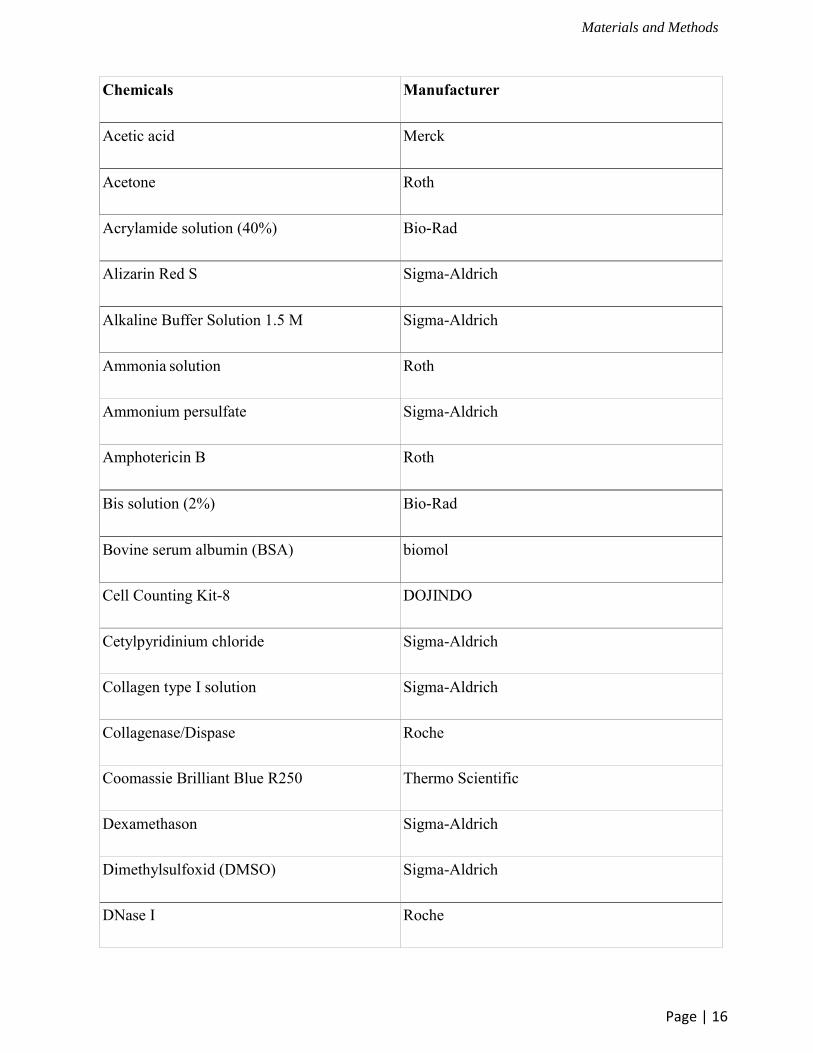
Chemicals Manufacturer
Acetic acid Merck
Acetone Roth
Acrylamide solution (40%) Bio-Rad
Alizarin Red S Sigma-Aldrich
Alkaline Buffer Solution 1.5 M Sigma-Aldrich
Ammonia solution Roth
Ammonium persulfate Sigma-Aldrich
Amphotericin B Roth
Bis solution (2%) Bio-Rad
Bovine serum albumin (BSA) biomol
Cell Counting Kit-8 DOJINDO
Cetylpyridinium chloride Sigma-Aldrich
Collagen type I solution Sigma-Aldrich
Collagenase/Dispase Roche
Coomassie Brilliant Blue R250 Thermo Scientific
Dexamethason Sigma-Aldrich
Dimethylsulfoxid (DMSO) Sigma-Aldrich
DNase I Roche
Materials and Methods
Page | 17
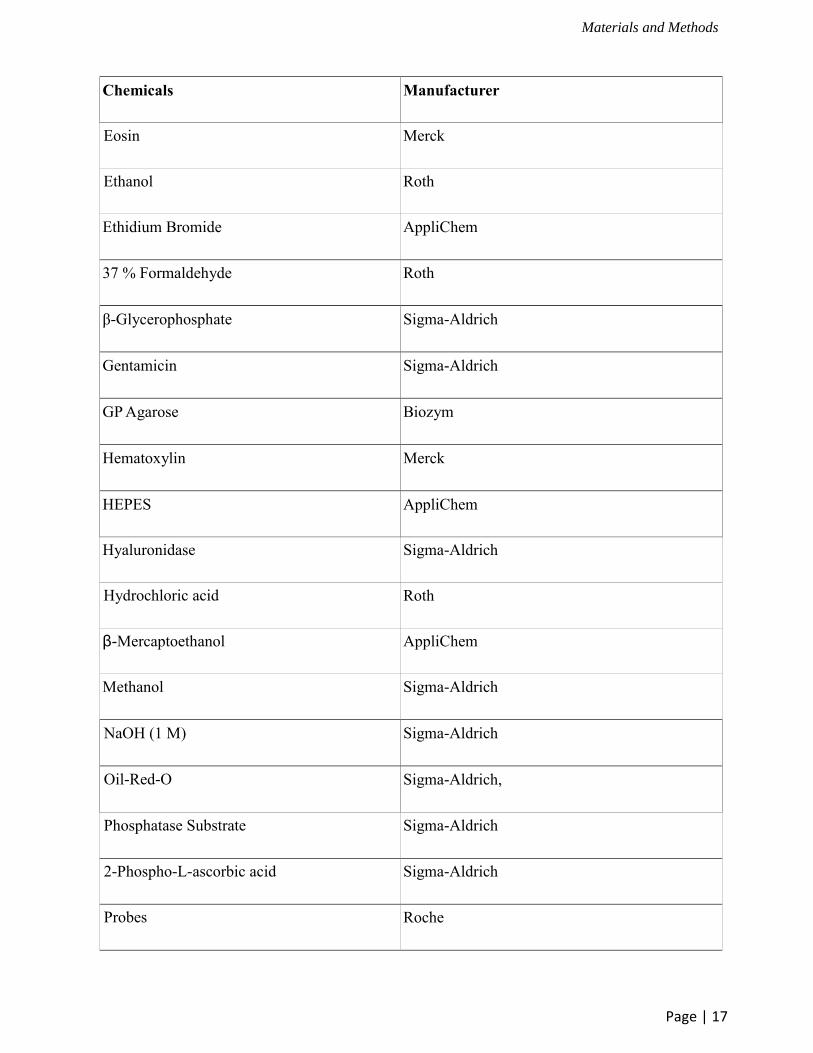
Chemicals Manufacturer
Eosin Merck
Ethanol Roth
Ethidium Bromide AppliChem
37 % Formaldehyde Roth
β-Glycerophosphate Sigma-Aldrich
Gentamicin Sigma-Aldrich
GP Agarose Biozym
Hematoxylin Merck
HEPES AppliChem
Hyaluronidase Sigma-Aldrich
Hydrochloric acid Roth
β-Mercaptoethanol AppliChem
Methanol Sigma-Aldrich
NaOH (1 M) Sigma-Aldrich
Oil-Red-O Sigma-Aldrich,
Phosphatase Substrate Sigma-Aldrich
2-Phospho-L-ascorbic acid Sigma-Aldrich
Probes Roche
Materials and Methods
Page | 18
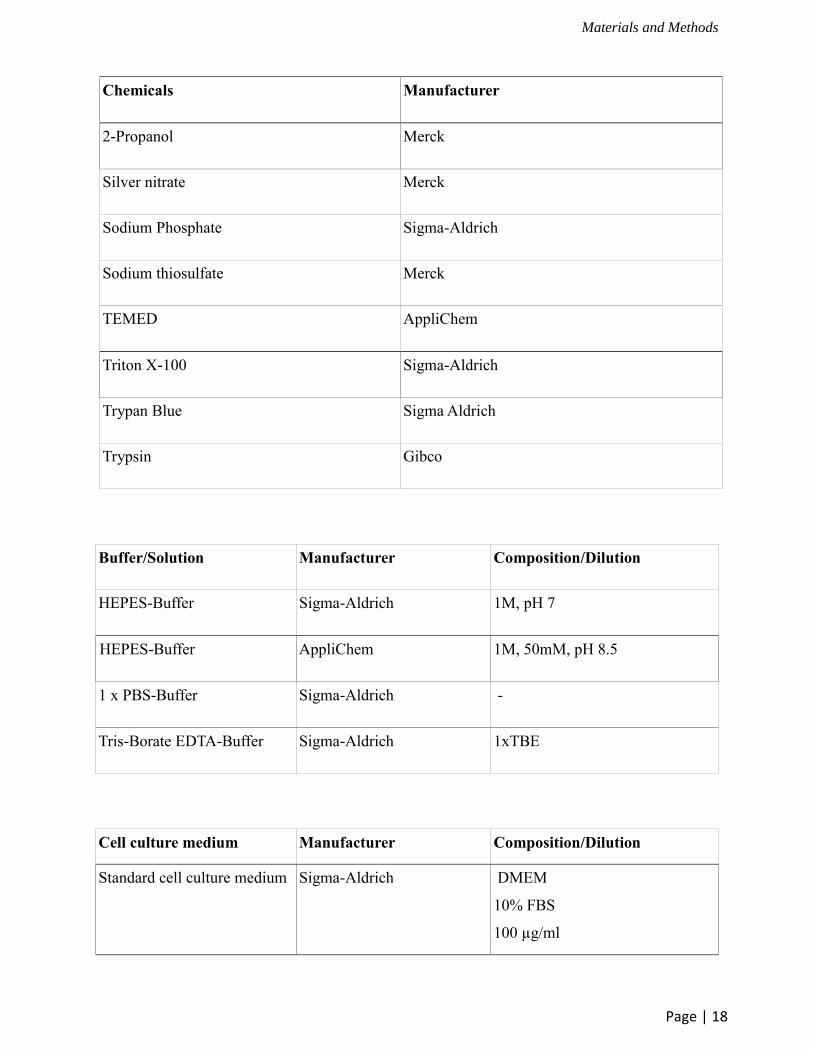
Chemicals Manufacturer
2-Propanol Merck
Silver nitrate Merck
Sodium Phosphate Sigma-Aldrich
Sodium thiosulfate Merck
TEMED AppliChem
Triton X-100 Sigma-Aldrich
Trypan Blue Sigma Aldrich
Trypsin Gibco
Buffer/Solution Manufacturer Composition/Dilution
HEPES-Buffer Sigma-Aldrich 1M, pH 7
HEPES-Buffer AppliChem 1M, 50mM, pH 8.5
1 x PBS-Buffer Sigma-Aldrich -
Tris-Borate EDTA-Buffer Sigma-Aldrich 1xTBE
Cell culture medium Manufacturer Composition/Dilution
Standard cell culture medium Sigma-Aldrich DMEM
10% FBS
100 µg/ml
Materials and Methods
Page | 19
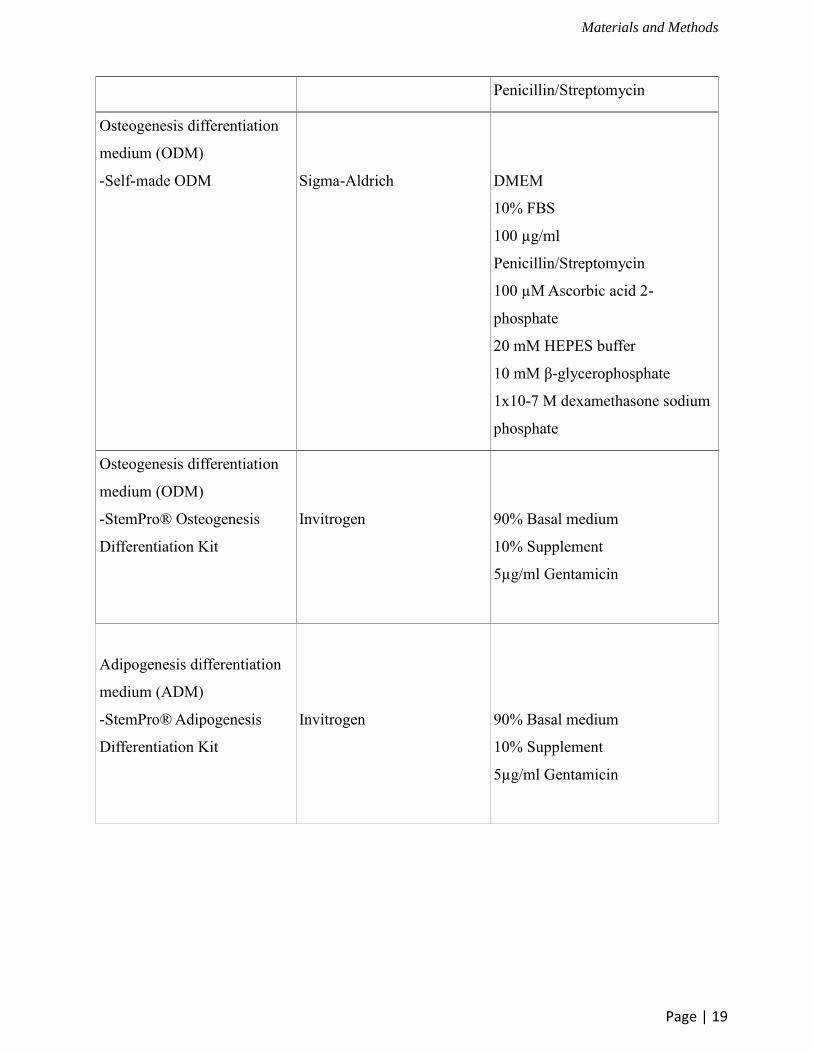
Penicillin/Streptomycin
Osteogenesis differentiation
medium (ODM)
-Self-made ODM
Sigma-Aldrich
DMEM
10% FBS
100 µg/ml
Penicillin/Streptomycin
100 µM Ascorbic acid 2-
phosphate
20 mM HEPES buffer
10 mM β-glycerophosphate
1x10⁻⁷ M dexamethasone sodium
phosphate
Osteogenesis differentiation
medium (ODM)
-StemPro® Osteogenesis
Differentiation Kit
Invitrogen
90% Basal medium
10% Supplement
5µg/ml Gentamicin
Adipogenesis differentiation
medium (ADM)
-StemPro® Adipogenesis
Differentiation Kit
Invitrogen
90% Basal medium
10% Supplement
5µg/ml Gentamicin
Materials and Methods
Page | 20
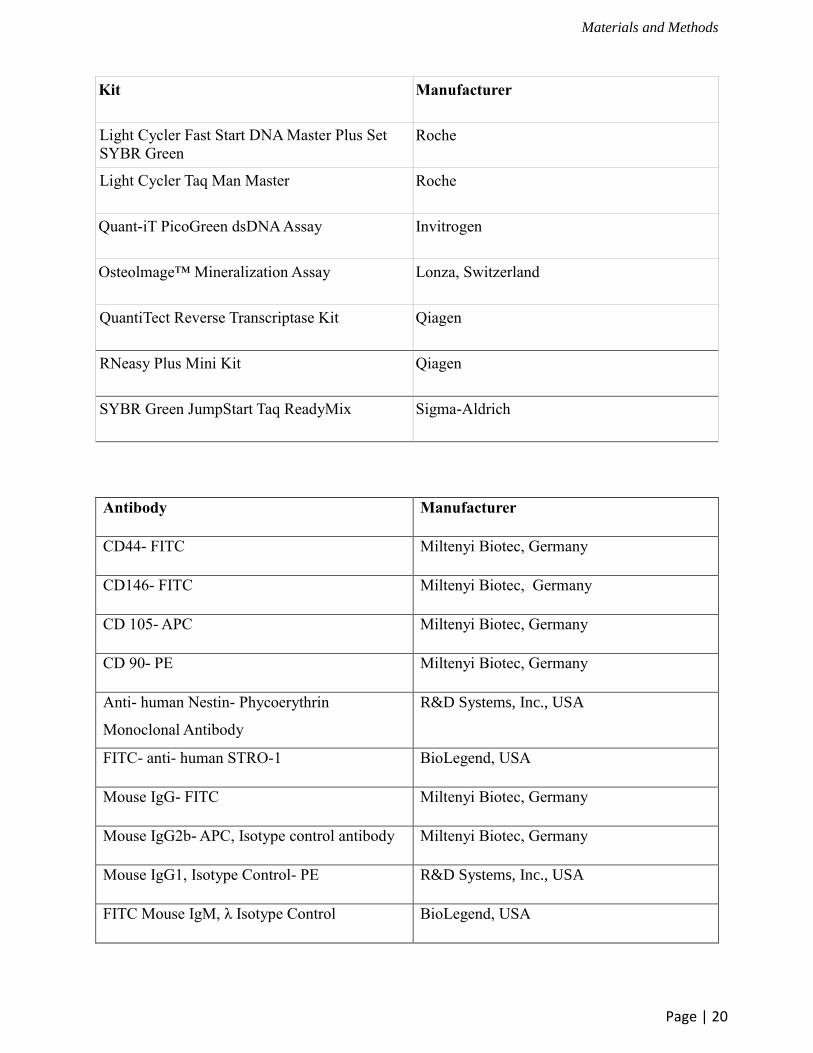
Kit Manufacturer
Light Cycler Fast Start DNA Master Plus Set
SYBR Green
Roche
Light Cycler Taq Man Master Roche
Quant-iT PicoGreen dsDNA Assay Invitrogen
Osteolmage™ Mineralization Assay Lonza, Switzerland
QuantiTect Reverse Transcriptase Kit Qiagen
RNeasy Plus Mini Kit Qiagen
SYBR Green JumpStart Taq ReadyMix Sigma-Aldrich
Antibody Manufacturer
CD44- FITC Miltenyi Biotec, Germany
CD146- FITC Miltenyi Biotec, Germany
CD 105- APC Miltenyi Biotec, Germany
CD 90- PE Miltenyi Biotec, Germany
Anti- human Nestin- Phycoerythrin
Monoclonal Antibody
R&D Systems, Inc., USA
FITC- anti- human STRO-1 BioLegend, USA
Mouse IgG- FITC Miltenyi Biotec, Germany
Mouse IgG2b- APC, Isotype control antibody Miltenyi Biotec, Germany
Mouse IgG1, Isotype Control- PE R&D Systems, Inc., USA
FITC Mouse IgM, λ Isotype Control BioLegend, USA
Materials and Methods
Page | 21
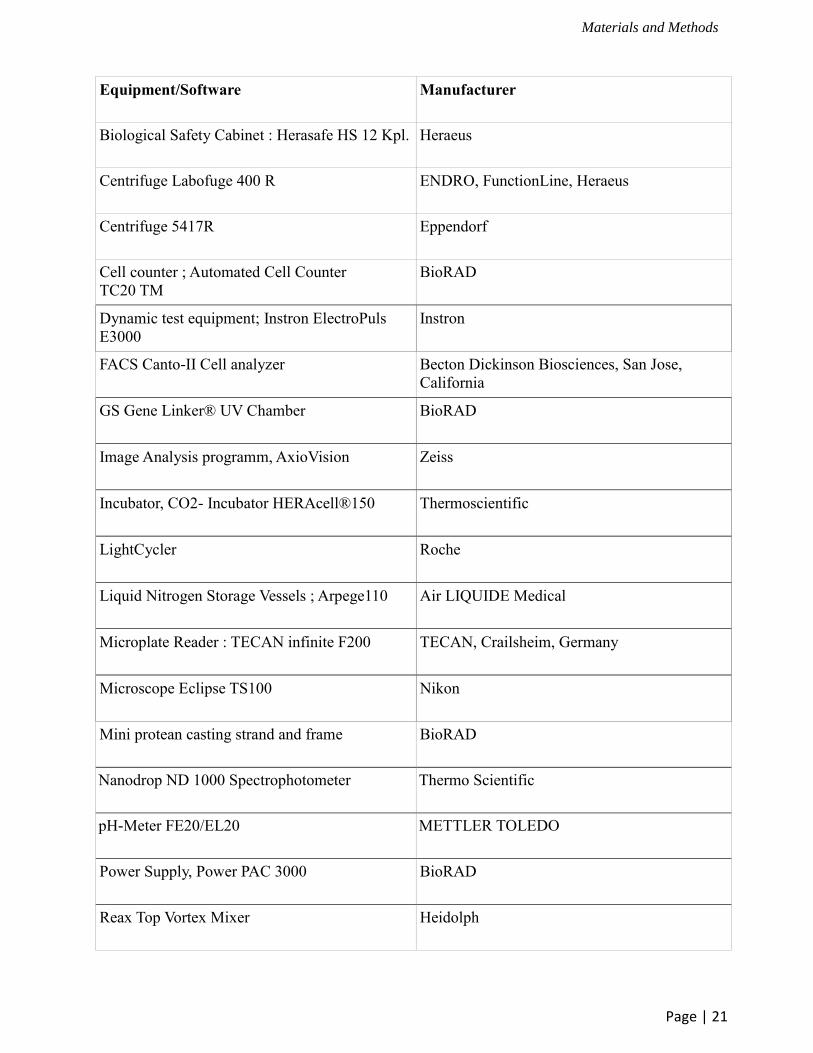
Equipment/Software Manufacturer
Biological Safety Cabinet : Herasafe HS 12 Kpl. Heraeus
Centrifuge Labofuge 400 R ENDRO, FunctionLine, Heraeus
Centrifuge 5417R Eppendorf
Cell counter ; Automated Cell Counter
TC20 TM
BioRAD
Dynamic test equipment; Instron ElectroPuls
E3000
Instron
FACS Canto-II Cell analyzer Becton Dickinson Biosciences, San Jose,
California
GS Gene Linker® UV Chamber BioRAD
Image Analysis programm, AxioVision Zeiss
Incubator, CO2- Incubator HERAcell®150 Thermoscientific
LightCycler Roche
Liquid Nitrogen Storage Vessels ; Arpege110 Air LIQUIDE Medical
Microplate Reader : TECAN infinite F200 TECAN, Crailsheim, Germany
Microscope Eclipse TS100 Nikon
Mini protean casting strand and frame BioRAD
Nanodrop ND 1000 Spectrophotometer Thermo Scientific
pH-Meter FE20/EL20 METTLER TOLEDO
Power Supply, Power PAC 3000 BioRAD
Reax Top Vortex Mixer Heidolph
Materials and Methods
Page | 22
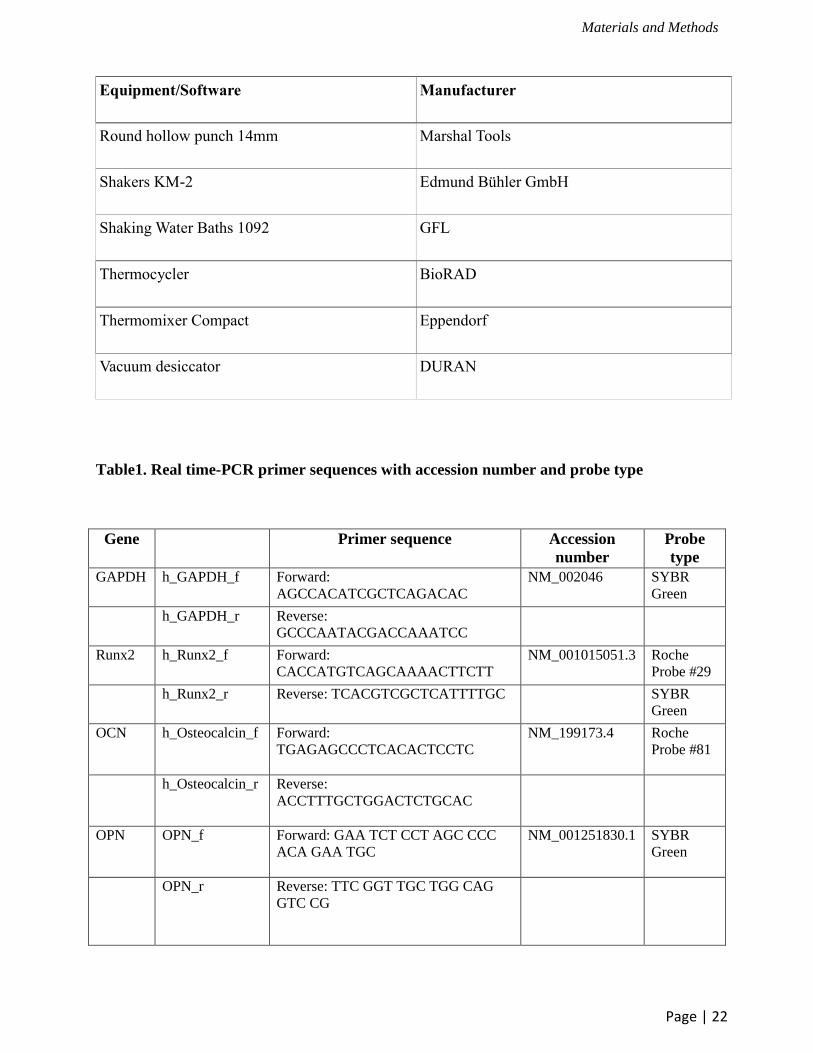
Equipment/Software Manufacturer
Round hollow punch 14mm Marshal Tools
Shakers KM-2 Edmund Bühler GmbH
Shaking Water Baths 1092 GFL
Thermocycler BioRAD
Thermomixer Compact Eppendorf
Vacuum desiccator DURAN
Table1. Real time-PCR primer sequences with accession number and probe type
Gene Primer sequence Accession
number
Probe
type
GAPDH h_GAPDH_f Forward:
AGCCACATCGCTCAGACAC
NM_002046 SYBR
Green
h_GAPDH_r Reverse:
GCCCAATACGACCAAATCC
Runx2 h_Runx2_f Forward:
CACCATGTCAGCAAAACTTCTT
NM_001015051.3 Roche
Probe #29
h_Runx2_r Reverse: TCACGTCGCTCATTTTGC SYBR
Green
OCN h_Osteocalcin_f
Forward:
TGAGAGCCCTCACACTCCTC
NM_199173.4 Roche
Probe #81
h_Osteocalcin_r
Reverse:
ACCTTTGCTGGACTCTGCAC
OPN OPN_f
Forward: GAA TCT CCT AGC CCC
ACA GAA TGC
NM_001251830.1 SYBR
Green
OPN_r
Reverse: TTC GGT TGC TGG CAG
GTC CG
Materials and Methods
Page | 23
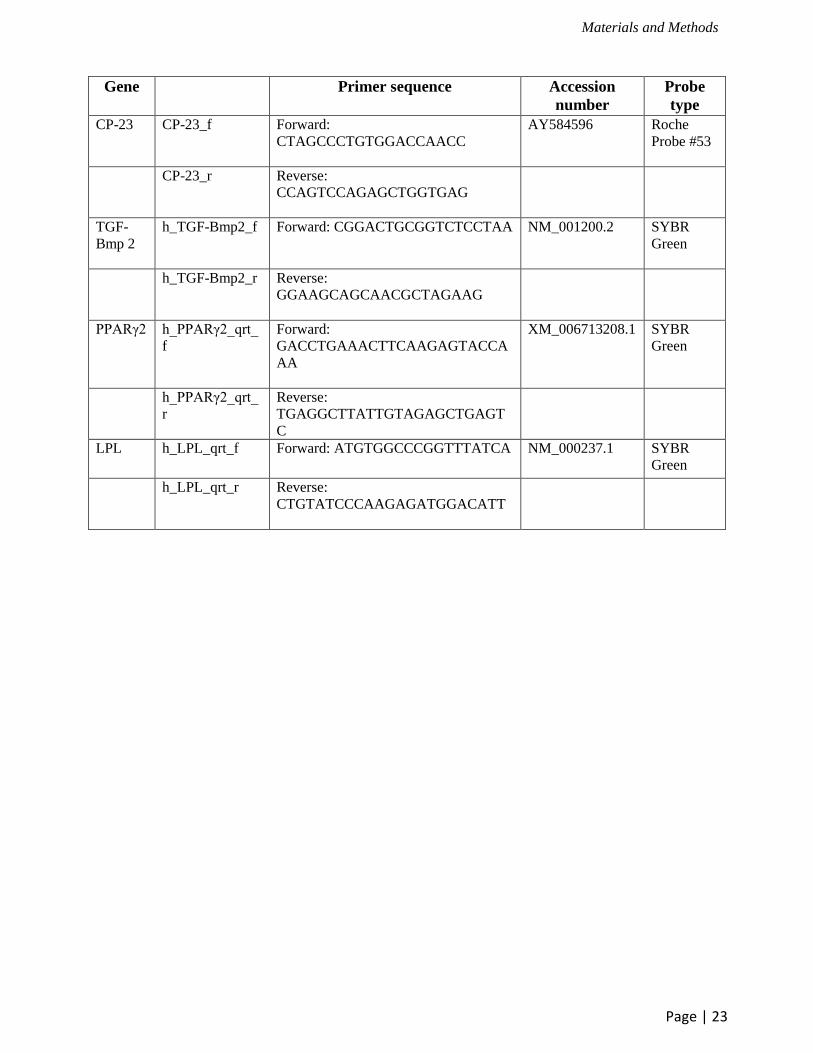
Gene Primer sequence Accession
number
Probe
type
CP-23 CP-23_f
Forward:
CTAGCCCTGTGGACCAACC
AY584596
Roche
Probe #53
CP-23_r
Reverse:
CCAGTCCAGAGCTGGTGAG
TGF-
Bmp 2
h_TGF-Bmp2_f
Forward: CGGACTGCGGTCTCCTAA
NM_001200.2 SYBR
Green
h_TGF-Bmp2_r
Reverse:
GGAAGCAGCAACGCTAGAAG
PPARγ2
h_PPARγ2_qrt_
f
Forward:
GACCTGAAACTTCAAGAGTACCA
AA
XM_006713208.1
SYBR
Green
h_PPARγ2_qrt_
r
Reverse:
TGAGGCTTATTGTAGAGCTGAGT
C
LPL
h_LPL_qrt_f
Forward: ATGTGGCCCGGTTTATCA
NM_000237.1
SYBR
Green
h_LPL_qrt_r
Reverse:
CTGTATCCCAAGAGATGGACATT
Materials and Methods
Page | 24
2.2 Methods
2.2.1 Cell culture
In this experiment, Tooth no. 1A and 1B were surgically removed from the same patient,
while tooth no.2 was obtained from a different person. Stem cells from apical papilla (SCAPs) and
periodontal ligament stem cells (PDLSCs) were isolated by two different methods. All SCAPs and
PDLSCs except PDLSCs no.1A were isolated with the single cell isolation method as previously
described (24). The protocol was approved by the Ethics Committee of the University of
Regensburg. Briefly, the impacted third molars were surgically removed from young patients in
the department of Cranio- and Maxillo-facial Surgery of the University Hospital Regensburg and
placed into Dulbecco´s modified Eagle´s medium (DMEM; Sigma-Aldrich) containing 100 µg/ml
Penicillin/Streptomycin (Sigma-Aldrich) and stored at 4°C after informed consent. Before starting
the cell isolation procedure, the teeth were washed with phosphate buffered saline (PBS; Sigma-
Aldrich). The apical papilla tissues were separated from the exterior of the root foramen area and
the periodontal tissues were removed along the surface of the root with a sterile surgical blade.
The tissues were then minced into small pieces and digested in a solution of 1 mg/ml
Collagenase/Dispase, 0.3 mg/ml DNase I (Roche Applied Science, Manheim, Germany) and 0.2
mg/ml Hyaluronidase (Sigma-Aldrich) in PBS for 1 hour at 37°C. Cell suspensions were passed
through a 70 µm strainer to get single cell suspension, then centrifuged at 400 x g for 10 minutes
and then the cells were resuspended by complete growth medium containing DMEM
supplemented with 20% Fetal bovine serum (FBS; Sigma-Aldrich), 100 µg/ml
Penicillin/Streptomycin, 2.5 µg/ml Amphotericin B (Sigma-Aldrich) and 50 µg/ml Gentamycin
(Sigma-Aldrich ). Subsequently, the cell suspension was seeded into T25 flasks in complete
growth medium at 37°C in 5% carbon dioxide (CO2). After 24 hours, the cell culture medium was
changed to remove non-adherent cells. Then, the remaining cells grew as a small cluster and
Materials and Methods
Page | 25
formed colonies approximately 10-14 days after seeding cells. The standard cell culture medium
containing DMEM supplemented with 10% FBS and 100 µg/ml Penicillin/Streptomycin was used
after the first passaging was done.
Due to the small amount of periodontal tissue we were able to harvest from tooth no.1A,
PDLSCs no.1A were isolated with the explant outgrowth method (19). After the tissues were
minced and put into a digestion enzyme solution, the tissues were then placed into a 6-well plate,
and incubated for 10 minutes at 37°C to allow adherence. The complete cell culture medium was
carefully placed into the culture plates and cultured at 37°C with 5% CO2 like as the first method.
Non-adherent cells were removed by changing the medium. After the cell culture had reached
confluency between 2 and 4 weeks, PDLSCs were passaged as a cell passage 1. Passaged cells
were seeded at 5,000 cells/cm2 and medium change was carried out every 2-3 days. For all
experiments, SCAPs and PDLSCs were used at cell passage 4-6.
2.2.2 Flow cytometry
For characterization, PDLSCs and SCAPs were investigated for stem cell associated
markers with flow cytometry which has been done by Anja Reck, department of Cranio- and
Maxillo-facial Surgery of University Hospital Regensburg. In short, PDLSCs and SCAPs were
incubated with the following monoclonal antibodies; CD44- FITC, CD146- FITC, CD 105- APC,
CD 90- PE (Miltenyi Biotec, Bergisch Gladbach, Germany), anti- human Nestin- Phycoerythrin
monoclonal antibody (R&D Systems, Inc., Minneapolis, USA) and FITC- anti- human STRO-1
(BioLegend, San Diego, CA 92121, USA) for 45 minutes at 4°C. Then, they were washed with
PBS containing 0.5% bovine serum albumin (BSA) and 2 mM EDTA. Cells were permeabilized
with 0.2% saponin and 0.1% BSA for 15 minutes and washed in PBS containing 0.1% BSA and 2
mM EDTA before intracellular staining. The following antibodies were used as negative controls;
mouse IgG- FITC (Miltenyi Biotec), mouse IgG2b- APC isotype control antibody (Miltenyi
Materials and Methods
Page | 26
Biotec), Mouse IgG1 isotype Control- PE (R&D Systems, Inc.) and FITC mouse IgM, λ isotype
control (BioLegend). Flow cytometry analysis was performed using the FACS Canto II (Becton
Dickinson).
2.2.3 Preparation of Polyacrylamide Substrate
Polyacrylamide gels were prepared according to the method described previously (87). In
short, five milliliters of PA gel solution with the three different concentrations of acrylamide and
bis-acrylamide (Bio-Rad) that are 8% acrylamide and 0.1% bis-acrylamide, 8% acrylamide and
0.06% bis-acrylamide, and 5% acrylamide and 0.06% bis-acrylamide for stiff, medium, and soft
substrate respectively were mixed and degassed under a vacuum for at least 20 minutes to remove
the oxygen. Then, 30 µl of 0.1 mg/ml ammonium persulfate (Sigma-Aldrich) and 20 µl TEMED
(Applichem) were added and placed into the mini protean casting strand and frame (Bio-Rad) to
form 1 mm thickness of substrate. After letting the gel polymerize for 30-45 minutes, it was gently
removed and the gel was rinsed with 50 mM HEPES, pH 8.5 (Applichem). PA gel was then cut
into a circular shape with 14 mm diameters and placed in a 24 well-plate for all experiments
except RNA isolation. For RNA isolation, PA gel was cut into a rectangular shape with 2.5 x 3.5
cm length and prepared in an 8 well-plate. Sulfo-SANPAH (Pierce) 0.5 mg/ml in 50 mM HEPES,
pH 8.5, which is used for the cross linking of collagen I and PA gel, was pipetted onto the surface
of substrate and exposed to UV light for 5-8 minutes at a distance of 2-3 inches for
photoactivation procedure. The sulfo-SANPAH solution was then removed, and the
photoactivation was repeated. After photoactivation, the substrate was washed several times in 50
mM HEPES to remove excess reagent. A 0.2 mg/ml of type I collagen (Sigma-Aldrich) was then
layered onto the surface of gel and incubated for 4 hours at room temperature or overnight at 4°C
on a shaker. After washing with PBS, the gels were stored in PBS at 4°C. Before platting the cells,
the gel was exposed to UV for 15 minutes for sterilization. The gel was transfered to the new
Materials and Methods
Page | 27
culture plate whose surface had been pre-treated for 1 hour with 0.1% BSA to reduce the
attachment of cells on the plate. Then, the PBS was replaced with a complete culture medium for 1
hour at 37°C to allow the equilibrium.
In order to confirm the stiffness of polyacrylamide substrate, the PA gel was prepared in
circular shapes with 2 mm thickness and 14 mm diameter and measured by dynamic test
equipment (Instron ElectroPuls E3000) at the Biomedical Engineering department of the
University of Applied Science, Regensburg.
2.2.4 Cell attachment and proliferation
For stem cell characterization, both SCAPs and PDLSCs were cultured in DMEM,
supplemented with 10% FBS and 100 µg/mL Penicillin/Streptomycin (standard cell culture
medium) in a 96-well plate with a cell seeding density of 5,000 cells/cm2. Similarly so with cell
characterization, cell attachment and proliferation on PA gel analysis were cultured in a standard
cell culture medium. The cell seeding density on the control group was 5,000 cells/cm2, but on the
PA gel it was 10,000 cells/cm2. Cell attachment and proliferation were then estimated by cell
counting kit-8 (CCK-8; Dojindo, Japan) following the instructions from the manufacturer. CCK-8
is a colorimetric assay for determining the number of viable cells in cell proliferation and
cytotoxicity assays. Cell cultures with CCK-8 were incubated for 2 hours at 37°C. After that, the
optical density was measured at 450 nm wavelength.
2.2.5 Colony-Forming Efficiency
The assessment of colony forming unit fibroblast (CFU-F) in SCAPs and PDLSCs was
done at cell passage 4. Cell suspension of PDLSCs and SCAPs were seeded into a 6-well culture
plate at a concentration of 100 cells/well in standard cell culture medium. Cultures were set up in
quadruplicates and incubated at 37°C in 5% CO2 for 2 weeks. For enumeration, colonies were
Materials and Methods
Page | 28
washed twice with PBS and then fixed in 2% paraformaldehyde for 10-15 minutes. The fixed
cultures were then stained with 0.2% Coomassie Brilliant Blue R250 for 15 minutes and the
stained culture was rinsed with tap water. Aggregates greater than 50 cells were scored as CFU-F
which was observed under the microscope.
2.2.6 Differentiation protocol
SCAPs and PDLSCs were cultivated in a standard cell culture medium until sub-
confluence (>80%). Then, the culture medium was changed to osteogenic differentiation medium
(ODM) or adipogenic differentiation medium (ADM). Two different kinds of ODM were used in
this study; StemPro® osteogenic differentiation medium (StemPro® ODM; Invitrogen) and a self-
made osteogenic differentiation medium (self-made ODM), while StemPro® adipogenic
differentiation medium (StemPro® ADM; Invitrogen) was used for adipogenic differentiation.
StemPro® ODM and ADM are the instant kits containing all reagents required for inducing MSCs
to be committed to the osteogenesis and adipogenic pathway which can be prepared from 90%
basal medium, 10% supplement and 5µg/ml Penicillin/Streptomycin. Important to note is that,
StemPro® ODM and ADM should be used within 1 month after preparing. For self-made ODM,
the culture medium contains DMEM supplemented with 10% FBS, 100 µg/mL
Penicillin/Streptomycin, 100 µM Ascorbic acid 2-phosphate, 20 mM HEPES buffer, 10 mM β-
glycerophosphate and 10-7
M dexamethasone sodium phosphate.
2.2.7 Mineralization measurement
SCAPs and PDLSCs were cultivated in a standard cell culture medium until subconfluency
was reached (>80%) before that they had been stimulated with the StemPro® ODM. Long-term
cell cultures were carried out in a standard cell culture medium as a control. The mineralized
deposits of the differentiated cells were determined by alizarin red staining after 28 days of the
differentiation. Briefly, cells were washed with PBS and fixed with 70% Ethanol for 10 minutes.
Materials and Methods
Page | 29
Cells were then washed with distilled water and stained with alizarin red reagent, pH4.2 [adjusted
pH by using hydrochloric acid (HCl) and Ammonium hydroxide solution (NH4OH)] thereafter for
10 minutes at room temperature. Subsequently, the alizarin red was removed from the culture
plates and washed several times with PBS. Calcium staining was observed under a phase contrast
microscope. The alizarin crystals were quantified by dissolved in 100 µl of 10% cetylpyridinium
chloride monohydrate solution at room temperature for 30 minutes. The samples were then
measured at 540 nm wavelength by a using a plate reader (TECAN infinite F200).
2.2.8 Alkaline phosphatase (ALP) activity measurement
Activity of ALP was measured with a colorimetric assay. Briefly, after cells had been
cultivated in DMEM until reaching subconfluency, the cell culture medium was then changed to
ODM. For cell characterization, all PDLSCs and SCAPs were induced with StemPro® ODM and
ALP activity was evaluated on day 3 and day 7. However, the effect of the surface stiffness on
ALP activity of PDLSCs and SCAPs was determined by inducing cells with two different kinds of
ODM; StemPro® and self-made ODM at day 7. Cells cultured in a standard cell culture (DMEM)
on day 0 were used as a control. SCAPs and PDLSCs on polystyrene or on PA gel either treated
with ODM or control with DMEM were washed with PBS buffer. Then, the cells underwent the
process of lysis with 0.1% Triton X-100 for 10 minutes. Cell lysate (approximately 25 µl) was
mixed with 25 µl of 1.5 M alkaline buffer and 41.6 µl of phosphatase substrate (Sigma-Aldrich)
and incubated at 37°C for 1 hour. Subsequently, the reaction was stopped by using 41.6 µl of 0.3
M NaOH solution and absorbance at 405 nm was measured thereafter by using a TECAN plate
reader. ALP activity was normalized to the DNA content. DNA concentration was performed by
using 15 µl of cell lysate and mixed with 85 µl of 1xTE buffer and 100 µl of working reagent
which could be prepared following the protocol of the Quant-iT PicoGreen ds DNA Assay Kit
Materials and Methods
Page | 30
(Life Technology). The mixture was then measured by using a plate reader (TECAN) with
standard fluorescein wavelength at 485 nm.
2.2.9 Adipogenic differentiation
SCAPs and PDLSCs were seeded at 5,000 cells/cm2 on polystyrene plates or 10,000 cells/
cm2 on the PA gel and cultivated in a standard cell culture medium until sub-confluence (>80%)
before they were induced with the StemPro® ADM. As a control, long-term cell cultures were
carried out in a standard cell culture medium (DMEM). The presence of lipid droplets was
detected by Oil Red O staining after 4 weeks of adipogenic induction and 2 weeks of adipogenic
differentiation of stem cells on PA gel.
The staining was started with removing the media from the wells and gently rinsing the
samples with PBS. Cells were then fixed with 10% formalin and incubated at room temperature
for 30-60 minutes. Subsequently, each well was rinsed with distilled water and 60% isopropanol
was added to each sample for 5 minutes. After isopropanol was removed from the plates, Oil Red
O working solution was prepared according to the manufacturer’s protocol and was added to the
wells and incubated for 5 minutes at room temperature. Then, the cultures were rinsed several
times with tap water and Hematoxylin stain was added into each well for 1 minute. Finally, the
cultures were washed with tap water until the water was clear, and water was added to each well
and viewed on a phase contrast microscope.
The quantification of lipid droplets of PDLSCs and SCAPs on PA gel was measured by 5
fields of each replicate using AxioVision-Release 4.8.2-SP2 (Carl Zeiss Microscopy GmbH).
Three biological replicates were used for statistical analysis.
Materials and Methods
Page | 31
2.2.10 Quantitative reverse transcription-polymerase chain reaction (qRT-PCR)
Total RNA was isolated from cells by using RNeasy Mini Kit (Qiagen, Hilden, Germany)
according to the manufacturer’s protocol. The cDNA synthesis was performed using 400 ng total
RNA and the QuantiTect Reverse Transcription Kit (Qiagen) was used for reverse transcription. In
this study, qRT-PCR was done with two different PCR systems; the LightCycler 2.0 (Roche) and
The StepOnePlus Real-Time PCR system (Applied Biosystems). With the characterization of
PDLSCs and SCAPs no.1A and 1B and the experiments of PDLSCs and SCAPs no.1B cultivated
on PA gel by using StemPro® ODM as a differentiation medium, the LightCycler® FastStart
DNA MasterPLUS SYBR Green I (Roche Applied Science) was used for studying
Glyceraldehyde 3-phosphate dehydrogenase (GAPDH), osteopontin (OPN), bone morphogenetic
protein 2 (BMP2), peroxisome proliferator-activated receptor γ2 (PPARγ2) and Lipoprotein
lipase (LPL). Furthermore, runt-related transcription factor 2 (RUNX2), osteocalcin (OCN),
cementum protein 23 (CP23) was done by using the LightCycler® TaqMan® Master (Roche). The
LightCycler 2.0 with the light cycler 4.05 software was used to estimate the threshold cycles (Ct-
value). For SYBR Green run protocol, the PCR was performed by using 20 µl of final reaction
volumes starting with a pre-incubation step of 10 minutes at 95°C. A total of 45 cycles were
executed for 10 seconds at 95°C for denaturation and an annealing temperature of 60-64°C for 5
seconds followed by an extension period of 20 seconds at 72°C. After the last cycle had finished,
all products were denaturated for a melting curve analysis. The TaqMan run protocol starting with
pre-incubation step at 95°C for 10 minutes followed by 45 cycles of amplification at an annealing
temperature of 60°C.
For the studies of the characterization on PDLSCs and SCAPs no.2, and PDLSCs and
SCAPs no.1B grown on PA gel by using self-made ODM (Dexamethasone) and StemPro® ADM
as the differentiation medium, SYBR Green JumpStart Taq ReadyMix (Sigma-Aldrich) was used
Materials and Methods
Page | 32
to investigate GAPDH, Runx2, OPN, BMP2, PPARγ2 and LPL, and the LightCycler® TaqMan®
Master (Roche) was used to observe gene expression of CP23 and OCN. The StepOnePlus Real-
Time PCR system with StepOneTM
software v2.0.1 was used to estimate the Ct-value. For SYBR
Green run protocol, the PCR was performed by using 15 µl of final reaction volumes starting with
a pre-incubation step of 20 minutes at 95°C. A total of 40 cycles were executed for 3 seconds at
95°C for denaturation and an annealing temperature of 60-64°C for 30 seconds. After the last
cycle had finished, all products were denaturated for melting curve analysis. The TaqMan run
protocol starting with pre-incubation step at 50°C for 2 minutes and 95°C for 10 minutes followed
by 40 cycles of amplification at an annealing temperature of 60°C.
Primer sequences or Roche probe numbers can be obtained from table 1. To determine all
gene expressions, GAPDH was used as a housekeeping gene for normalizing each sample. The
delta/delta-calculation-method as described by Winer et al. was used to investigate the relative
gene expression (93). For each real time RT-PCR, a selected total RNA sample derived from cells
grown in a standard cell culture medium on standard cell culture plates was used for the
calibration (relative gene expression of one sample = 1)
2.2.11 Statistical analysis
The collections of data throughout this study were reported as mean + standard deviation
or standard error of at least three samples (notice in result part). Student’s t test was used for
statistical analysis and p-values less than 0.05 were considered significant.
Results
Page | 33
3. Results
3.1 Phenotype characterization of PDLSCs and SCAPs
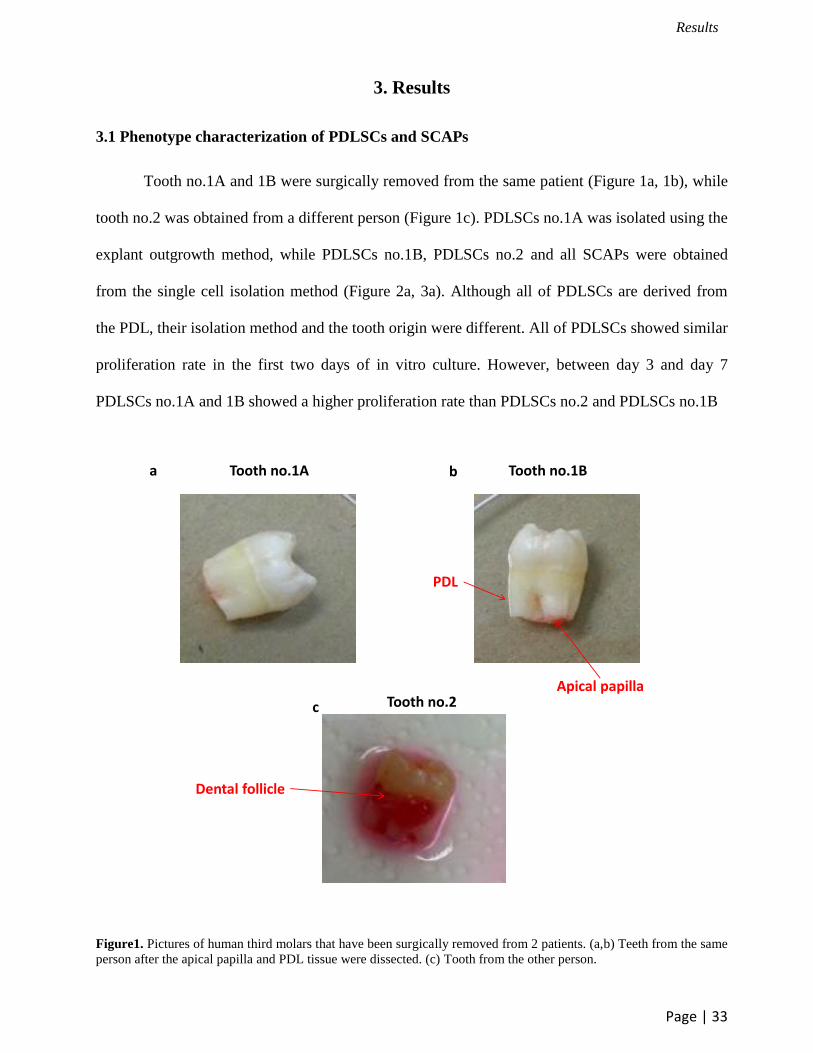
Tooth no.1A and 1B were surgically removed from the same patient (Figure 1a, 1b), while
tooth no.2 was obtained from a different person (Figure 1c). PDLSCs no.1A was isolated using the
explant outgrowth method, while PDLSCs no.1B, PDLSCs no.2 and all SCAPs were obtained
from the single cell isolation method (Figure 2a, 3a). Although all of PDLSCs are derived from
the PDL, their isolation method and the tooth origin were different. All of PDLSCs showed similar
proliferation rate in the first two days of in vitro culture. However, between day 3 and day 7
PDLSCs no.1A and 1B showed a higher proliferation rate than PDLSCs no.2 and PDLSCs no.1B
Tooth no.1A Tooth no.1B
Tooth no.2
PDL
Apical papilla
Dental follicle
a b
c
Figure1. Pictures of human third molars that have been surgically removed from 2 patients. (a,b) Teeth from the same
person after the apical papilla and PDL tissue were dissected. (c) Tooth from the other person.
Results
Page | 34
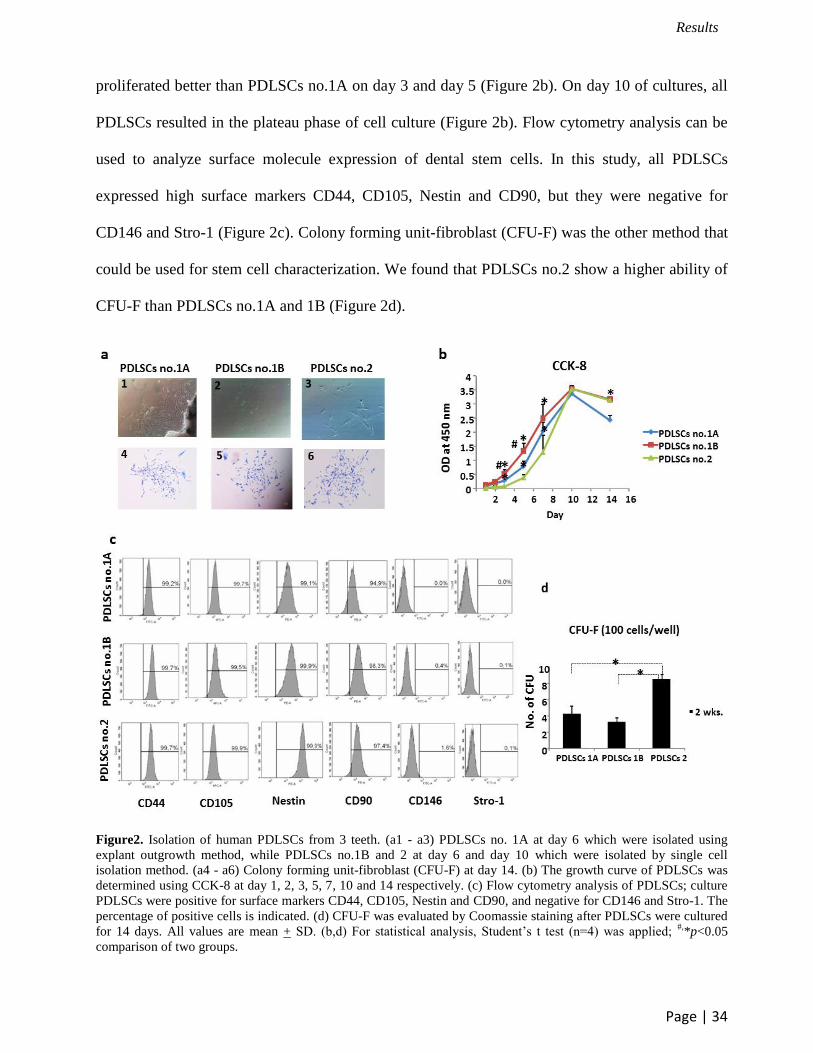
proliferated better than PDLSCs no.1A on day 3 and day 5 (Figure 2b). On day 10 of cultures, all
PDLSCs resulted in the plateau phase of cell culture (Figure 2b). Flow cytometry analysis can be
used to analyze surface molecule expression of dental stem cells. In this study, all PDLSCs
expressed high surface markers CD44, CD105, Nestin and CD90, but they were negative for
CD146 and Stro-1 (Figure 2c). Colony forming unit-fibroblast (CFU-F) was the other method that
could be used for stem cell characterization. We found that PDLSCs no.2 show a higher ability of
CFU-F than PDLSCs no.1A and 1B (Figure 2d).
Figure2. Isolation of human PDLSCs from 3 teeth. (a1 - a3) PDLSCs no. 1A at day 6 which were isolated using
explant outgrowth method, while PDLSCs no.1B and 2 at day 6 and day 10 which were isolated by single cell
isolation method. (a4 - a6) Colony forming unit-fibroblast (CFU-F) at day 14. (b) The growth curve of PDLSCs was
determined using CCK-8 at day 1, 2, 3, 5, 7, 10 and 14 respectively. (c) Flow cytometry analysis of PDLSCs; culture
PDLSCs were positive for surface markers CD44, CD105, Nestin and CD90, and negative for CD146 and Stro-1. The
percentage of positive cells is indicated. (d) CFU-F was evaluated by Coomassie staining after PDLSCs were cultured
for 14 days. All values are mean + SD. (b,d) For statistical analysis, Student’s t test (n=4) was applied; #,
*p<0.05
comparison of two groups.
Results
Page | 35
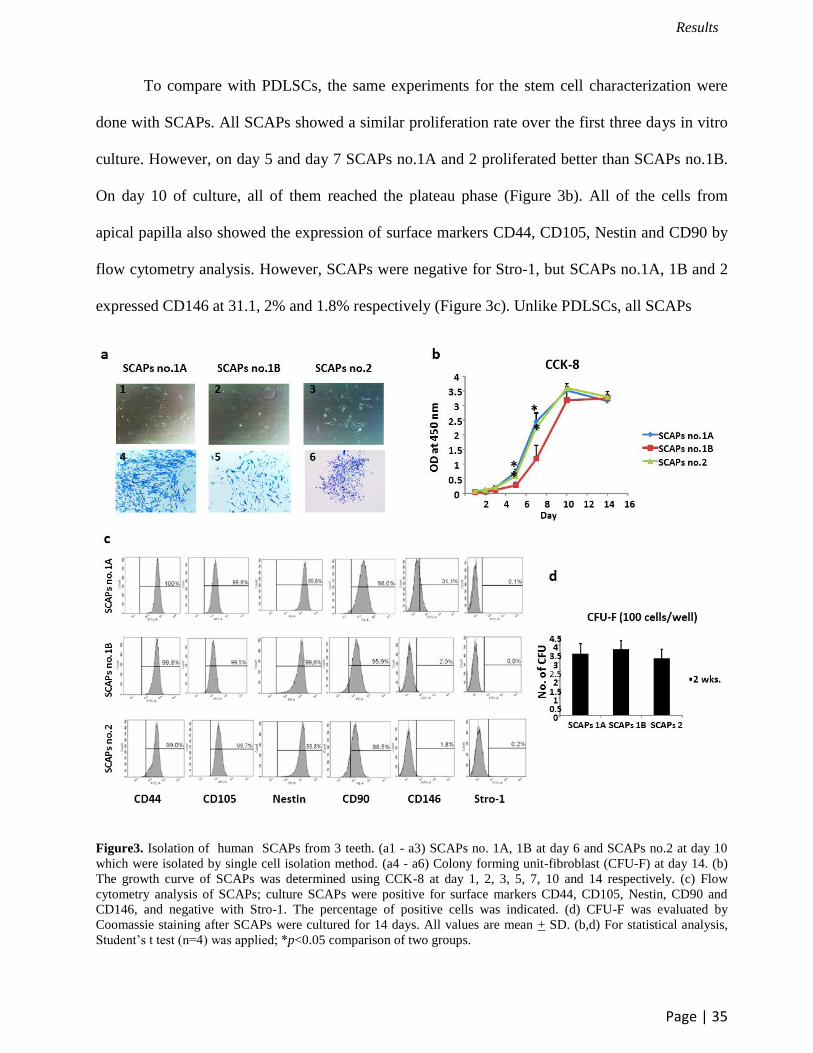
To compare with PDLSCs, the same experiments for the stem cell characterization were
done with SCAPs. All SCAPs showed a similar proliferation rate over the first three days in vitro
culture. However, on day 5 and day 7 SCAPs no.1A and 2 proliferated better than SCAPs no.1B.
On day 10 of culture, all of them reached the plateau phase (Figure 3b). All of the cells from
apical papilla also showed the expression of surface markers CD44, CD105, Nestin and CD90 by
flow cytometry analysis. However, SCAPs were negative for Stro-1, but SCAPs no.1A, 1B and 2
expressed CD146 at 31.1, 2% and 1.8% respectively (Figure 3c). Unlike PDLSCs, all SCAPs
Figure3. Isolation of human SCAPs from 3 teeth. (a1 - a3) SCAPs no. 1A, 1B at day 6 and SCAPs no.2 at day 10
which were isolated by single cell isolation method. (a4 - a6) Colony forming unit-fibroblast (CFU-F) at day 14. (b)
The growth curve of SCAPs was determined using CCK-8 at day 1, 2, 3, 5, 7, 10 and 14 respectively. (c) Flow
cytometry analysis of SCAPs; culture SCAPs were positive for surface markers CD44, CD105, Nestin, CD90 and
CD146, and negative with Stro-1. The percentage of positive cells was indicated. (d) CFU-F was evaluated by
Coomassie staining after SCAPs were cultured for 14 days. All values are mean + SD. (b,d) For statistical analysis,
Student’s t test (n=4) was applied; *p<0.05 comparison of two groups.
Results
Page | 36
had a similar colony forming efficiency (Figure 3d).
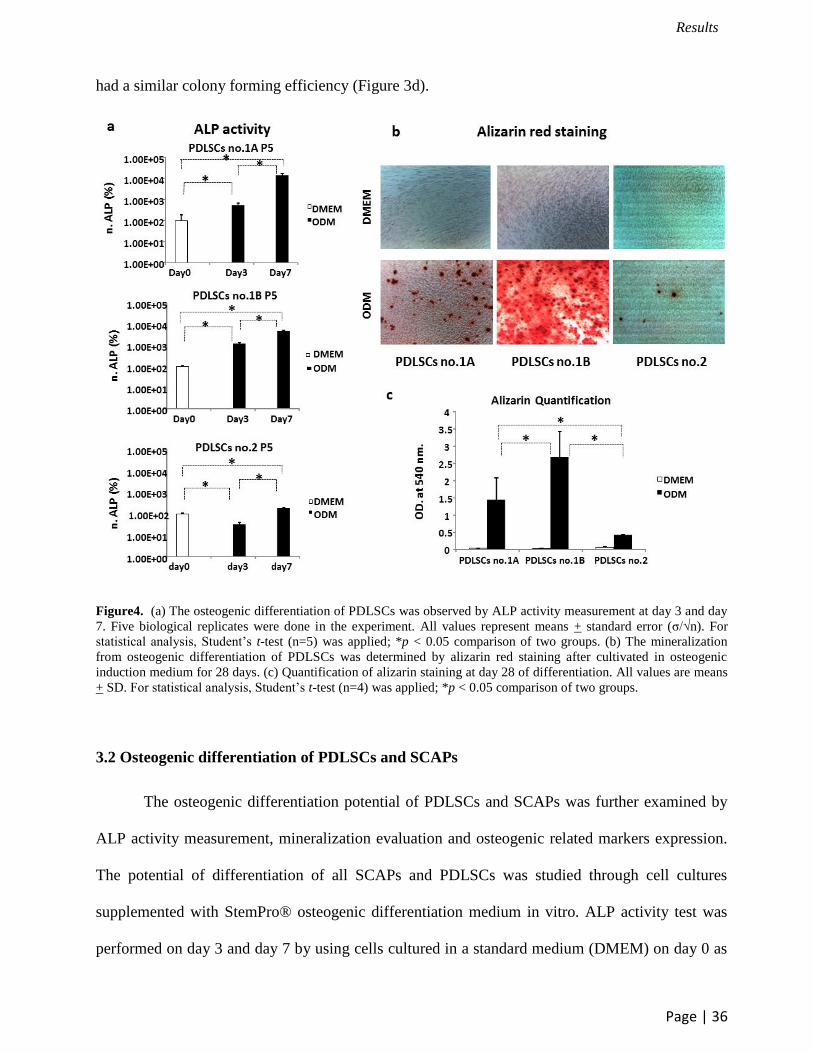
Figure4. (a) The osteogenic differentiation of PDLSCs was observed by ALP activity measurement at day 3 and day
7. Five biological replicates were done in the experiment. All values represent means + standard error (σ/√n). For
statistical analysis, Student’s t-test (n=5) was applied; *p < 0.05 comparison of two groups. (b) The mineralization
from osteogenic differentiation of PDLSCs was determined by alizarin red staining after cultivated in osteogenic
induction medium for 28 days. (c) Quantification of alizarin staining at day 28 of differentiation. All values are means
+ SD. For statistical analysis, Student’s t-test (n=4) was applied; *p < 0.05 comparison of two groups.
3.2 Osteogenic differentiation of PDLSCs and SCAPs
The osteogenic differentiation potential of PDLSCs and SCAPs was further examined by
ALP activity measurement, mineralization evaluation and osteogenic related markers expression.
The potential of differentiation of all SCAPs and PDLSCs was studied through cell cultures
supplemented with StemPro® osteogenic differentiation medium in vitro. ALP activity test was
performed on day 3 and day 7 by using cells cultured in a standard medium (DMEM) on day 0 as
Results
Page | 37
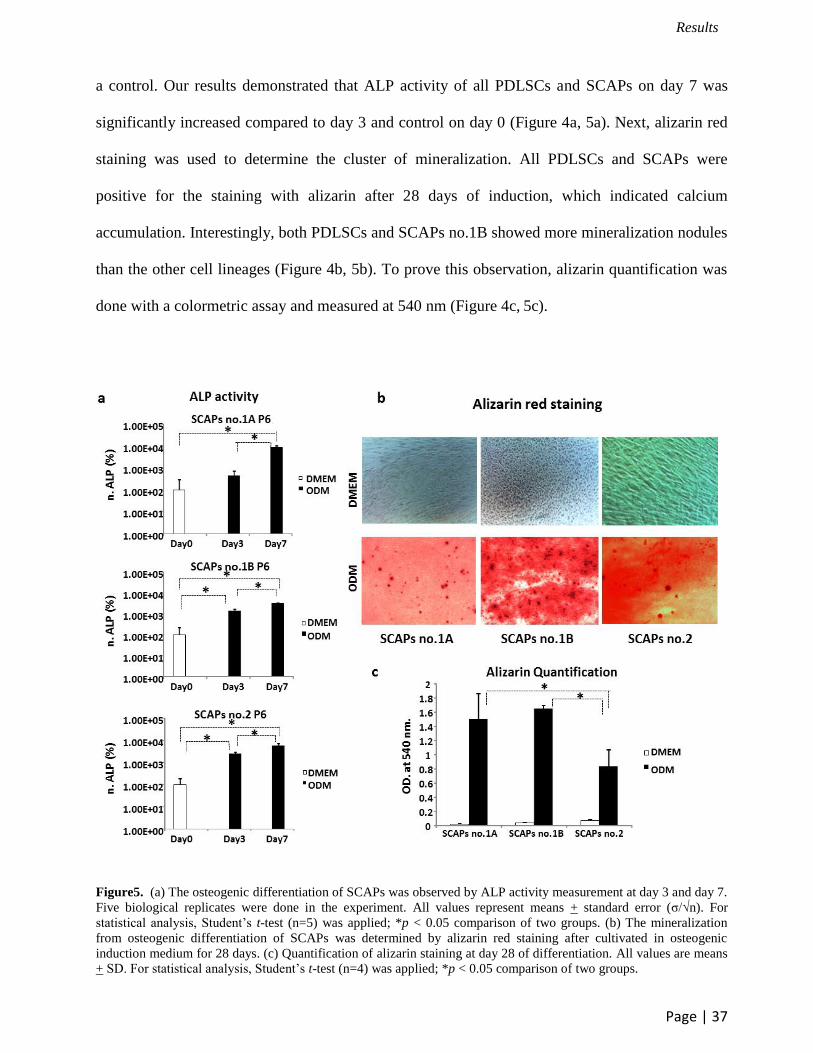
a control. Our results demonstrated that ALP activity of all PDLSCs and SCAPs on day 7 was
significantly increased compared to day 3 and control on day 0 (Figure 4a, 5a). Next, alizarin red
staining was used to determine the cluster of mineralization. All PDLSCs and SCAPs were
positive for the staining with alizarin after 28 days of induction, which indicated calcium
accumulation. Interestingly, both PDLSCs and SCAPs no.1B showed more mineralization nodules
than the other cell lineages (Figure 4b, 5b). To prove this observation, alizarin quantification was
done with a colormetric assay and measured at 540 nm (Figure 4c, 5c).
Figure5. (a) The osteogenic differentiation of SCAPs was observed by ALP activity measurement at day 3 and day 7.
Five biological replicates were done in the experiment. All values represent means + standard error (σ/√n). For
statistical analysis, Student’s t-test (n=5) was applied; *p < 0.05 comparison of two groups. (b) The mineralization
from osteogenic differentiation of SCAPs was determined by alizarin red staining after cultivated in osteogenic
induction medium for 28 days. (c) Quantification of alizarin staining at day 28 of differentiation. All values are means
+ SD. For statistical analysis, Student’s t-test (n=4) was applied; *p < 0.05 comparison of two groups.
Results
Page | 38
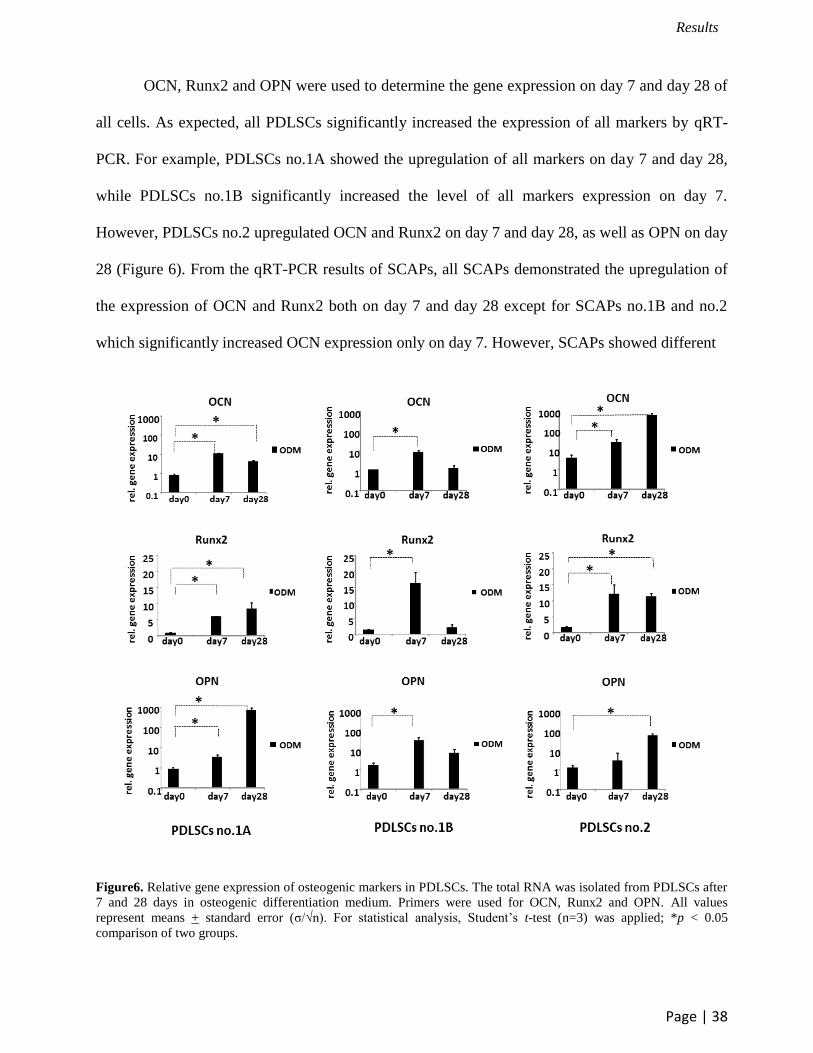
OCN, Runx2 and OPN were used to determine the gene expression on day 7 and day 28 of
all cells. As expected, all PDLSCs significantly increased the expression of all markers by qRT-
PCR. For example, PDLSCs no.1A showed the upregulation of all markers on day 7 and day 28,
while PDLSCs no.1B significantly increased the level of all markers expression on day 7.
However, PDLSCs no.2 upregulated OCN and Runx2 on day 7 and day 28, as well as OPN on day
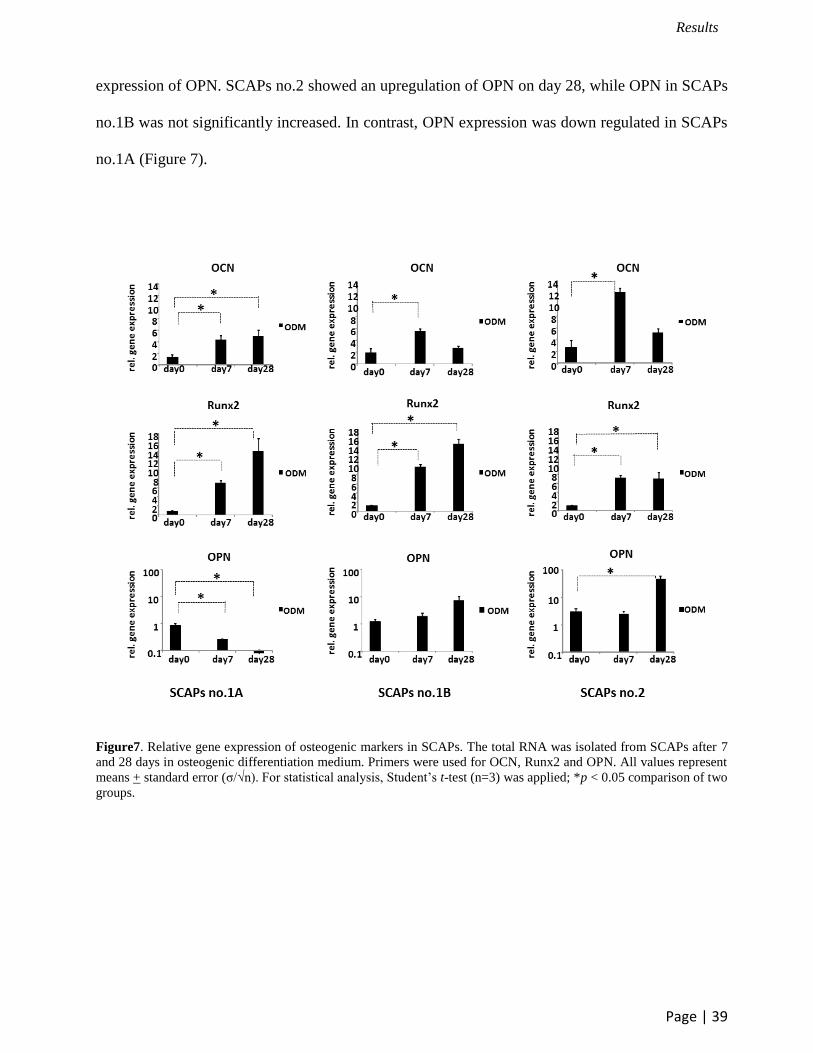
28 (Figure 6). From the qRT-PCR results of SCAPs, all SCAPs demonstrated the upregulation of
the expression of OCN and Runx2 both on day 7 and day 28 except for SCAPs no.1B and no.2
which significantly increased OCN expression only on day 7. However, SCAPs showed different
Figure6. Relative gene expression of osteogenic markers in PDLSCs. The total RNA was isolated from PDLSCs after
7 and 28 days in osteogenic differentiation medium. Primers were used for OCN, Runx2 and OPN. All values
represent means + standard error (σ/√n). For statistical analysis, Student’s t-test (n=3) was applied; *p < 0.05
comparison of two groups.
Results
Page | 39
expression of OPN. SCAPs no.2 showed an upregulation of OPN on day 28, while OPN in SCAPs
no.1B was not significantly increased. In contrast, OPN expression was down regulated in SCAPs
no.1A (Figure 7).
Figure7. Relative gene expression of osteogenic markers in SCAPs. The total RNA was isolated from SCAPs after 7
and 28 days in osteogenic differentiation medium. Primers were used for OCN, Runx2 and OPN. All values represent
means + standard error (σ/√n). For statistical analysis, Student’s t-test (n=3) was applied; *p < 0.05 comparison of two
groups.
Results
Page | 40
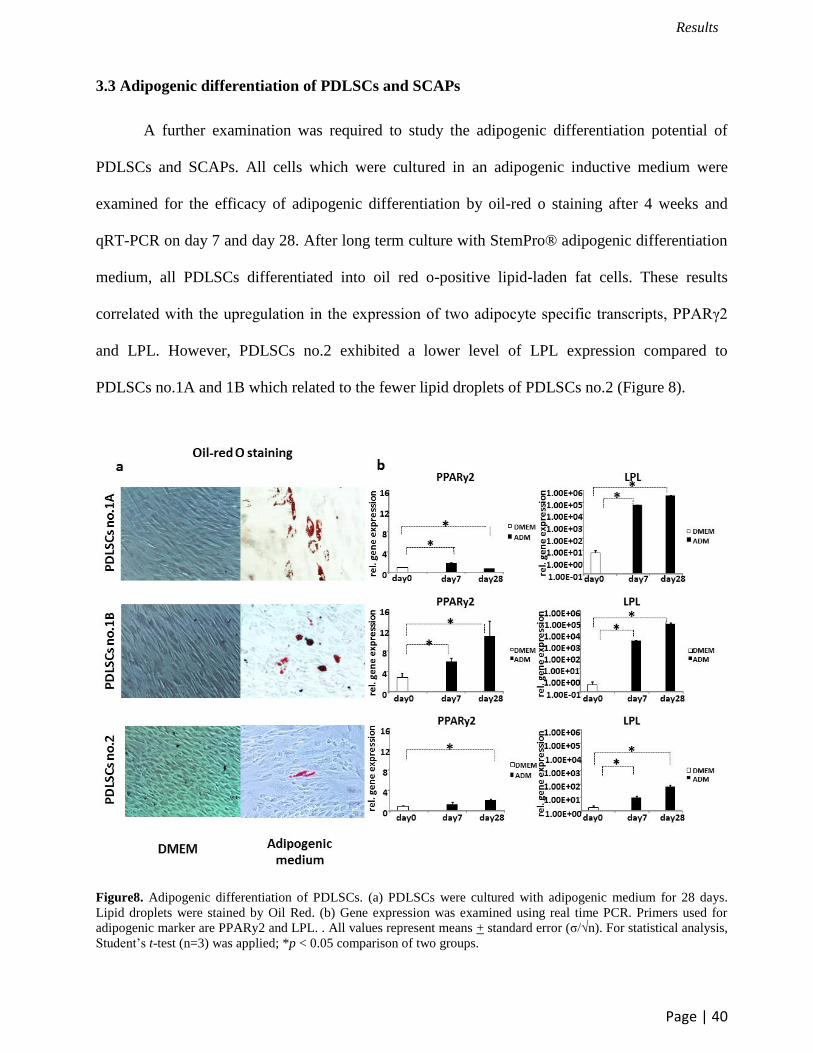
3.3 Adipogenic differentiation of PDLSCs and SCAPs
A further examination was required to study the adipogenic differentiation potential of
PDLSCs and SCAPs. All cells which were cultured in an adipogenic inductive medium were
examined for the efficacy of adipogenic differentiation by oil-red o staining after 4 weeks and
qRT-PCR on day 7 and day 28. After long term culture with StemPro® adipogenic differentiation
medium, all PDLSCs differentiated into oil red o-positive lipid-laden fat cells. These results
correlated with the upregulation in the expression of two adipocyte specific transcripts, PPARγ2
and LPL. However, PDLSCs no.2 exhibited a lower level of LPL expression compared to
PDLSCs no.1A and 1B which related to the fewer lipid droplets of PDLSCs no.2 (Figure 8).
Figure8. Adipogenic differentiation of PDLSCs. (a) PDLSCs were cultured with adipogenic medium for 28 days.
Lipid droplets were stained by Oil Red. (b) Gene expression was examined using real time PCR. Primers used for
adipogenic marker are PPARy2 and LPL. . All values represent means + standard error (σ/√n). For statistical analysis,
Student’s t-test (n=3) was applied; *p < 0.05 comparison of two groups.
Results
Page | 41
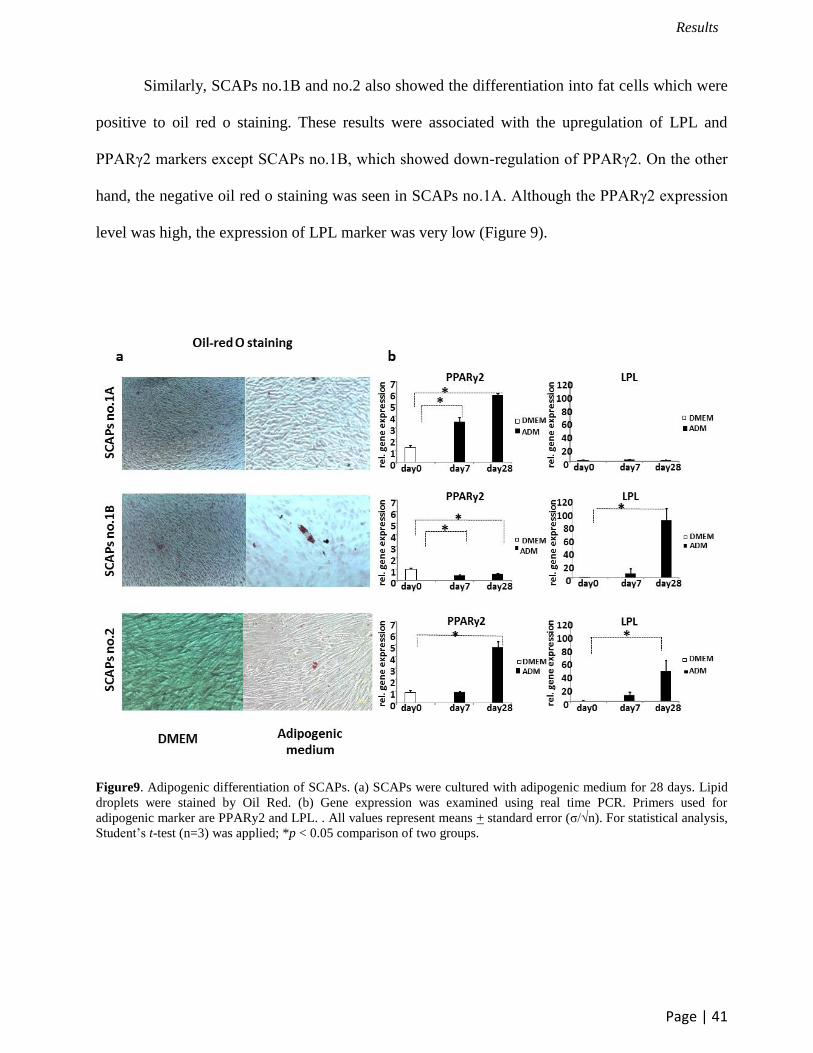
Similarly, SCAPs no.1B and no.2 also showed the differentiation into fat cells which were
positive to oil red o staining. These results were associated with the upregulation of LPL and
PPARγ2 markers except SCAPs no.1B, which showed down-regulation of PPARγ2. On the other
hand, the negative oil red o staining was seen in SCAPs no.1A. Although the PPARγ2 expression
level was high, the expression of LPL marker was very low (Figure 9).
Figure9. Adipogenic differentiation of SCAPs. (a) SCAPs were cultured with adipogenic medium for 28 days. Lipid
droplets were stained by Oil Red. (b) Gene expression was examined using real time PCR. Primers used for
adipogenic marker are PPARy2 and LPL. . All values represent means + standard error (σ/√n). For statistical analysis,
Student’s t-test (n=3) was applied; *p < 0.05 comparison of two groups.
Results
Page | 42
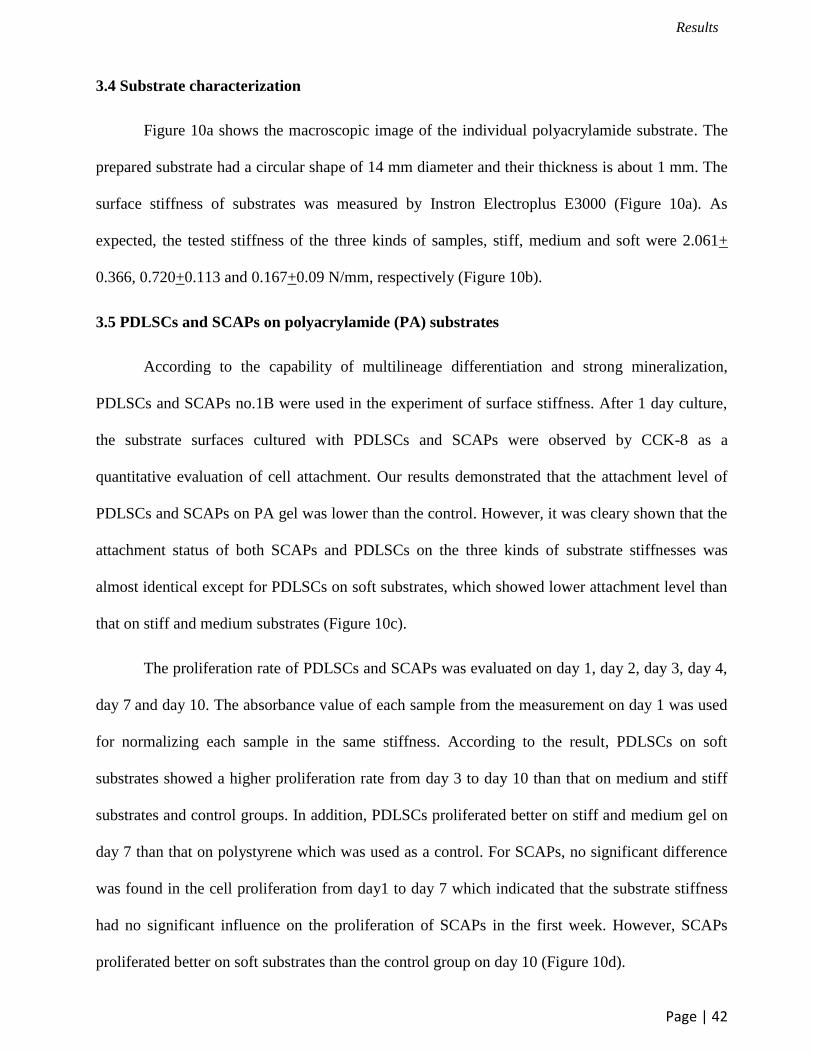
3.4 Substrate characterization
Figure 10a shows the macroscopic image of the individual polyacrylamide substrate. The
prepared substrate had a circular shape of 14 mm diameter and their thickness is about 1 mm. The
surface stiffness of substrates was measured by Instron Electroplus E3000 (Figure 10a). As
expected, the tested stiffness of the three kinds of samples, stiff, medium and soft were 2.061+
0.366, 0.720+0.113 and 0.167+0.09 N/mm, respectively (Figure 10b).
3.5 PDLSCs and SCAPs on polyacrylamide (PA) substrates
According to the capability of multilineage differentiation and strong mineralization,
PDLSCs and SCAPs no.1B were used in the experiment of surface stiffness. After 1 day culture,
the substrate surfaces cultured with PDLSCs and SCAPs were observed by CCK-8 as a
quantitative evaluation of cell attachment. Our results demonstrated that the attachment level of
PDLSCs and SCAPs on PA gel was lower than the control. However, it was cleary shown that the
attachment status of both SCAPs and PDLSCs on the three kinds of substrate stiffnesses was
almost identical except for PDLSCs on soft substrates, which showed lower attachment level than
that on stiff and medium substrates (Figure 10c).
The proliferation rate of PDLSCs and SCAPs was evaluated on day 1, day 2, day 3, day 4,
day 7 and day 10. The absorbance value of each sample from the measurement on day 1 was used
for normalizing each sample in the same stiffness. According to the result, PDLSCs on soft
substrates showed a higher proliferation rate from day 3 to day 10 than that on medium and stiff
substrates and control groups. In addition, PDLSCs proliferated better on stiff and medium gel on
day 7 than that on polystyrene which was used as a control. For SCAPs, no significant difference
was found in the cell proliferation from day1 to day 7 which indicated that the substrate stiffness
had no significant influence on the proliferation of SCAPs in the first week. However, SCAPs
proliferated better on soft substrates than the control group on day 10 (Figure 10d).
Results
Page | 43
Figure10. (a,b) Polyacrylamide (PA) gel was prepared into circular shape with 1 mm thickness and 14 mm diameter
with three different stiffness values. The stiffness of gel was confirmed by Instron E3000. (c) The attachment of
PDLSCs and SCAPs on PA gel was determined using CCK-8 after cells were cultured for 24 hrs. (d) For evaluation
of proliferation rate of PDLSCs and SCAPs on different stiffness of PA gel, CCK-8 test was performed at day 1, 2, 3,
4, 7 and 10 (Day 1=100%). (c,d) All values represent means + SD. For statistical analysis, Student’s t test (n=4) was
applied; #p<0.05 comparison of two groups, * p<0.05 comparison of the control group.
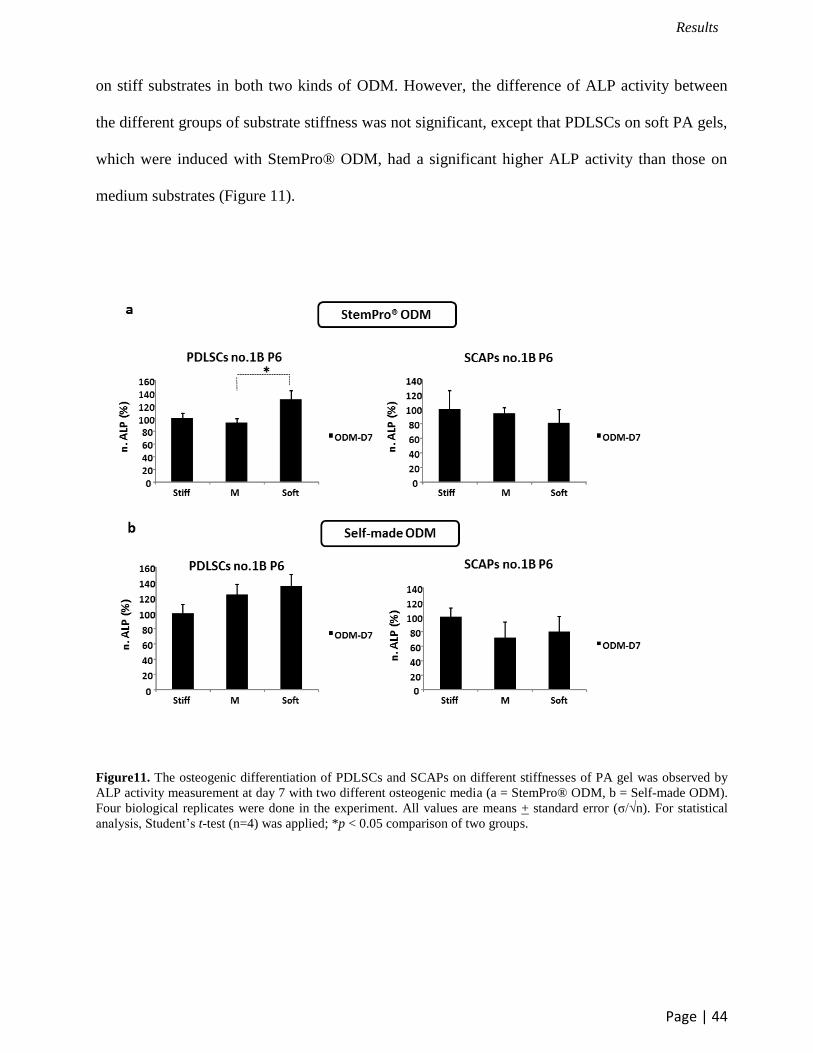
3.6 Effect of substrate stiffness on the ALP activity of PDLSCs and SCAPs
The influence of matrix stiffness on osteogenic differentiation was investigated after
cultivation of PDLSCs and SCAPs on PA gel with different grades of stiffness. Two different
kinds of osteogenic differentiation medium (ODM); StemPro® and self-made ODM were used in
this study. The induction of osteogenic differentiation in PDLSCs and SCAPs was estimated by
quantification of alkaline phosphatase (ALP) activity on day 7. The highest ALP activity of
PDLSCs was observed on soft substrates, while the highest ALP activity of SCAPs was detected
Results
Page | 44
on stiff substrates in both two kinds of ODM. However, the difference of ALP activity between
the different groups of substrate stiffness was not significant, except that PDLSCs on soft PA gels,
which were induced with StemPro® ODM, had a significant higher ALP activity than those on
medium substrates (Figure 11).
Figure11. The osteogenic differentiation of PDLSCs and SCAPs on different stiffnesses of PA gel was observed by
ALP activity measurement at day 7 with two different osteogenic media (a = StemPro® ODM, b = Self-made ODM).
Four biological replicates were done in the experiment. All values are means + standard error (σ/√n). For statistical
analysis, Student’s t-test (n=4) was applied; *p < 0.05 comparison of two groups.
Results
Page | 45
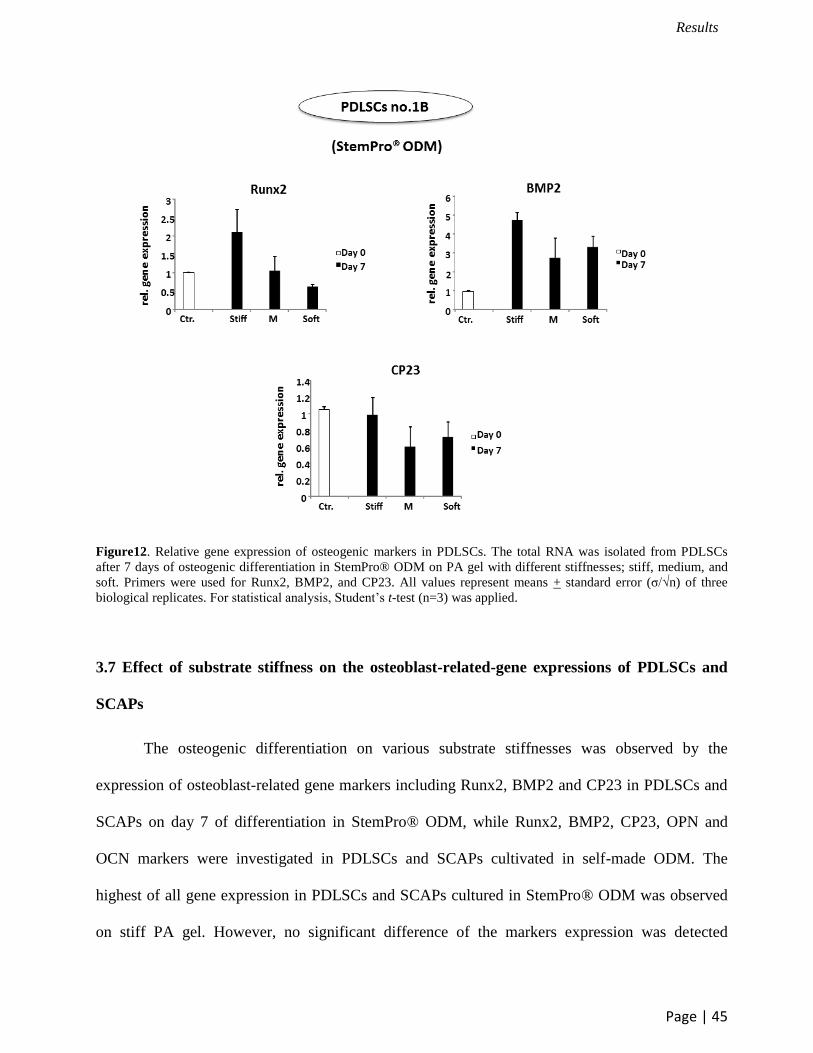
Figure12. Relative gene expression of osteogenic markers in PDLSCs. The total RNA was isolated from PDLSCs
after 7 days of osteogenic differentiation in StemPro® ODM on PA gel with different stiffnesses; stiff, medium, and
soft. Primers were used for Runx2, BMP2, and CP23. All values represent means + standard error (σ/√n) of three
biological replicates. For statistical analysis, Student’s t-test (n=3) was applied.
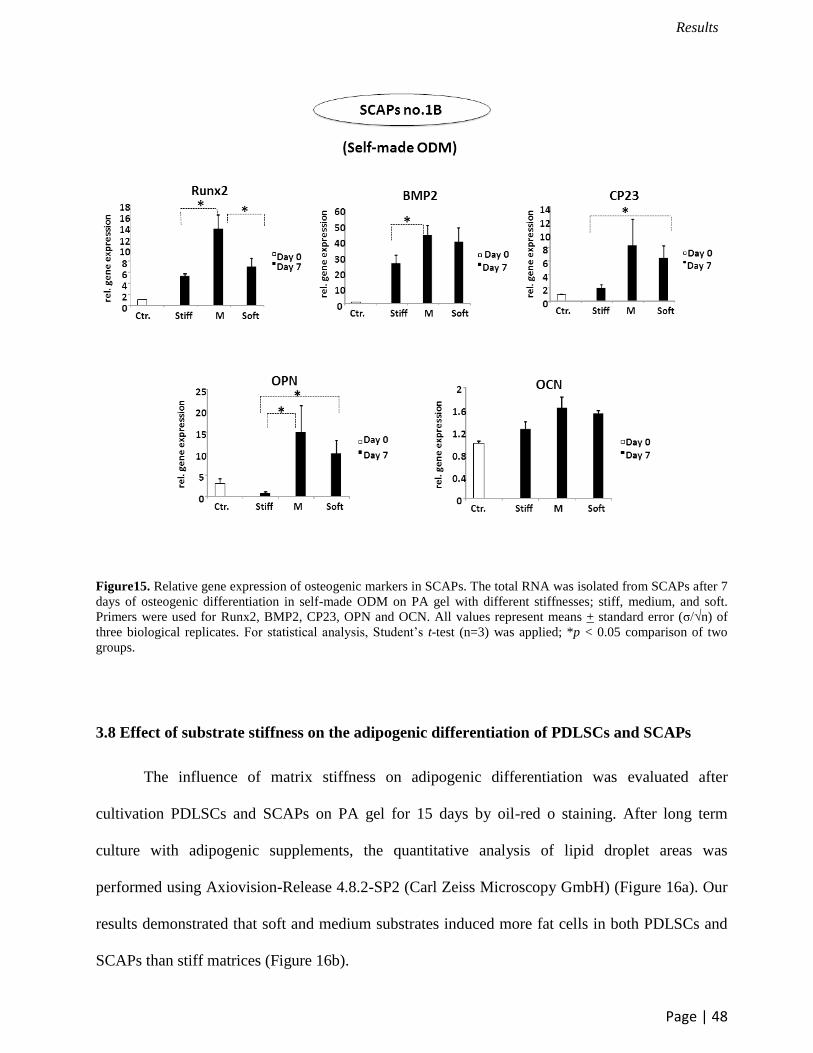
3.7 Effect of substrate stiffness on the osteoblast-related-gene expressions of PDLSCs and
SCAPs
The osteogenic differentiation on various substrate stiffnesses was observed by the
expression of osteoblast-related gene markers including Runx2, BMP2 and CP23 in PDLSCs and
SCAPs on day 7 of differentiation in StemPro® ODM, while Runx2, BMP2, CP23, OPN and
OCN markers were investigated in PDLSCs and SCAPs cultivated in self-made ODM. The
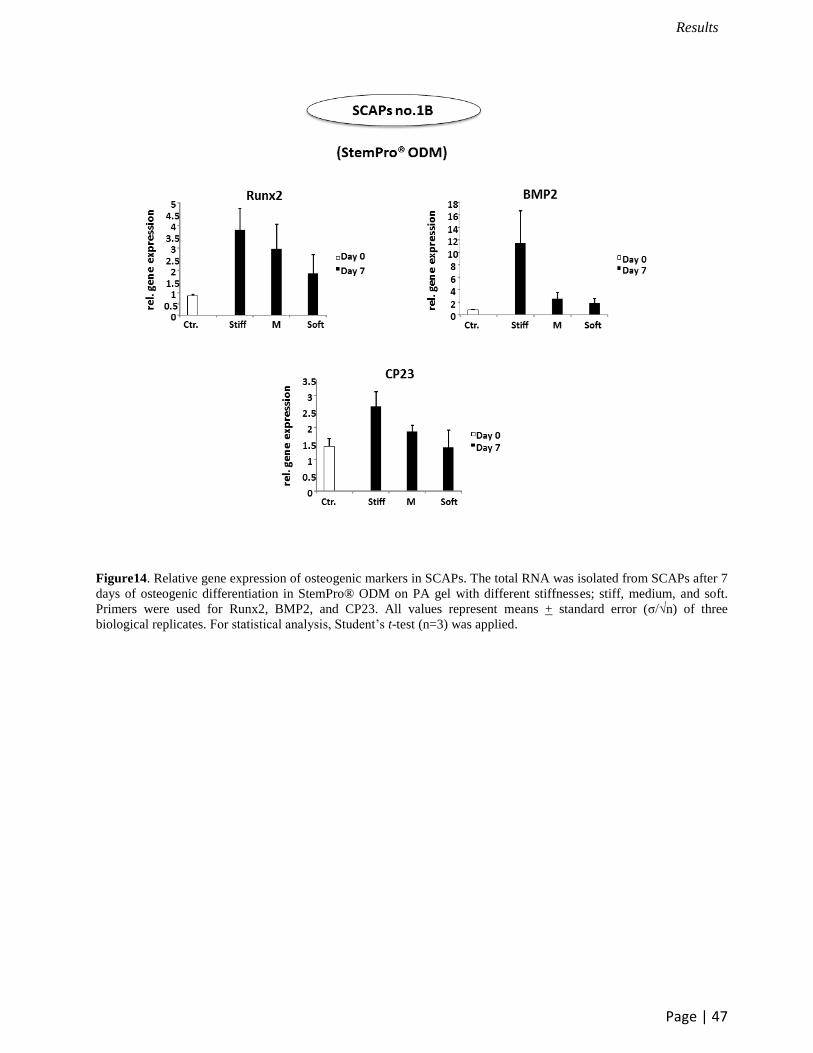
highest of all gene expression in PDLSCs and SCAPs cultured in StemPro® ODM was observed
on stiff PA gel. However, no significant difference of the markers expression was detected
Results
Page | 46
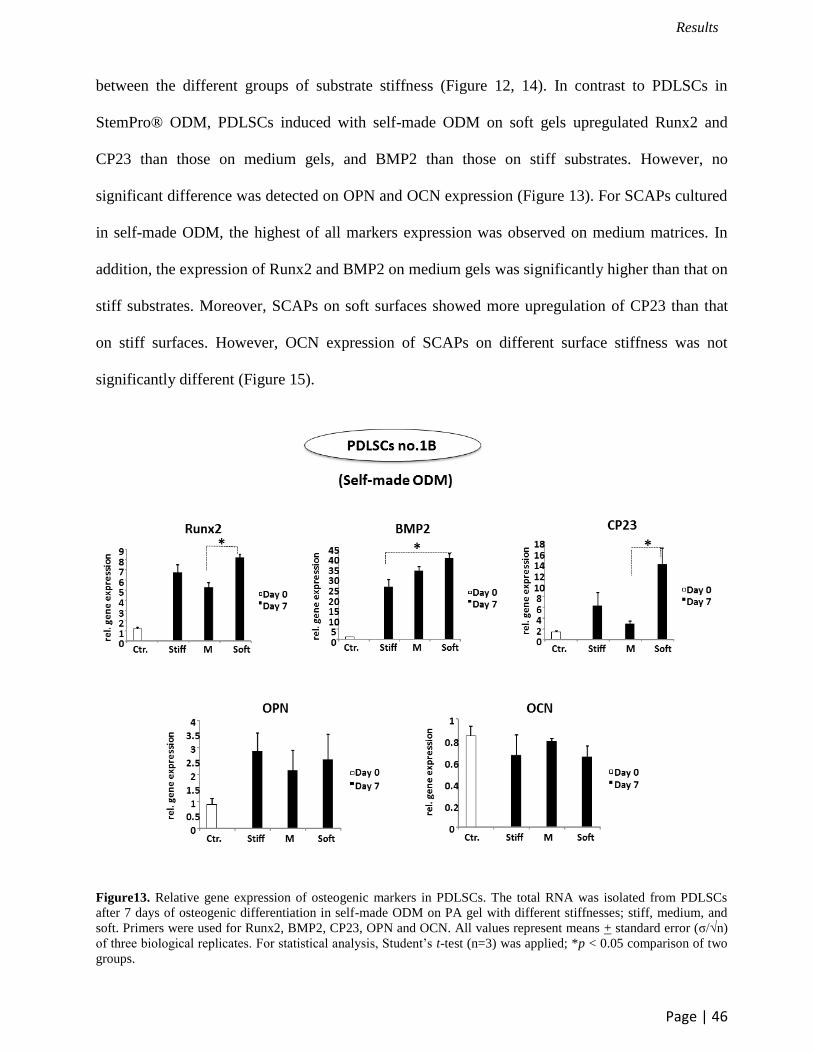
between the different groups of substrate stiffness (Figure 12, 14). In contrast to PDLSCs in
StemPro® ODM, PDLSCs induced with self-made ODM on soft gels upregulated Runx2 and
CP23 than those on medium gels, and BMP2 than those on stiff substrates. However, no
significant difference was detected on OPN and OCN expression (Figure 13). For SCAPs cultured
in self-made ODM, the highest of all markers expression was observed on medium matrices. In
addition, the expression of Runx2 and BMP2 on medium gels was significantly higher than that on
stiff substrates. Moreover, SCAPs on soft surfaces showed more upregulation of CP23 than that
on stiff surfaces. However, OCN expression of SCAPs on different surface stiffness was not
significantly different (Figure 15).
Figure13. Relative gene expression of osteogenic markers in PDLSCs. The total RNA was isolated from PDLSCs
after 7 days of osteogenic differentiation in self-made ODM on PA gel with different stiffnesses; stiff, medium, and
soft. Primers were used for Runx2, BMP2, CP23, OPN and OCN. All values represent means + standard error (σ/√n)
of three biological replicates. For statistical analysis, Student’s t-test (n=3) was applied; *p < 0.05 comparison of two
groups.
Results
Page | 47
Figure14. Relative gene expression of osteogenic markers in SCAPs. The total RNA was isolated from SCAPs after 7
days of osteogenic differentiation in StemPro® ODM on PA gel with different stiffnesses; stiff, medium, and soft.
Primers were used for Runx2, BMP2, and CP23. All values represent means + standard error (σ/√n) of three
biological replicates. For statistical analysis, Student’s t-test (n=3) was applied.
Results
Page | 48
Figure15. Relative gene expression of osteogenic markers in SCAPs. The total RNA was isolated from SCAPs after 7
days of osteogenic differentiation in self-made ODM on PA gel with different stiffnesses; stiff, medium, and soft.
Primers were used for Runx2, BMP2, CP23, OPN and OCN. All values represent means + standard error (σ/√n) of
three biological replicates. For statistical analysis, Student’s t-test (n=3) was applied; *p < 0.05 comparison of two
groups.
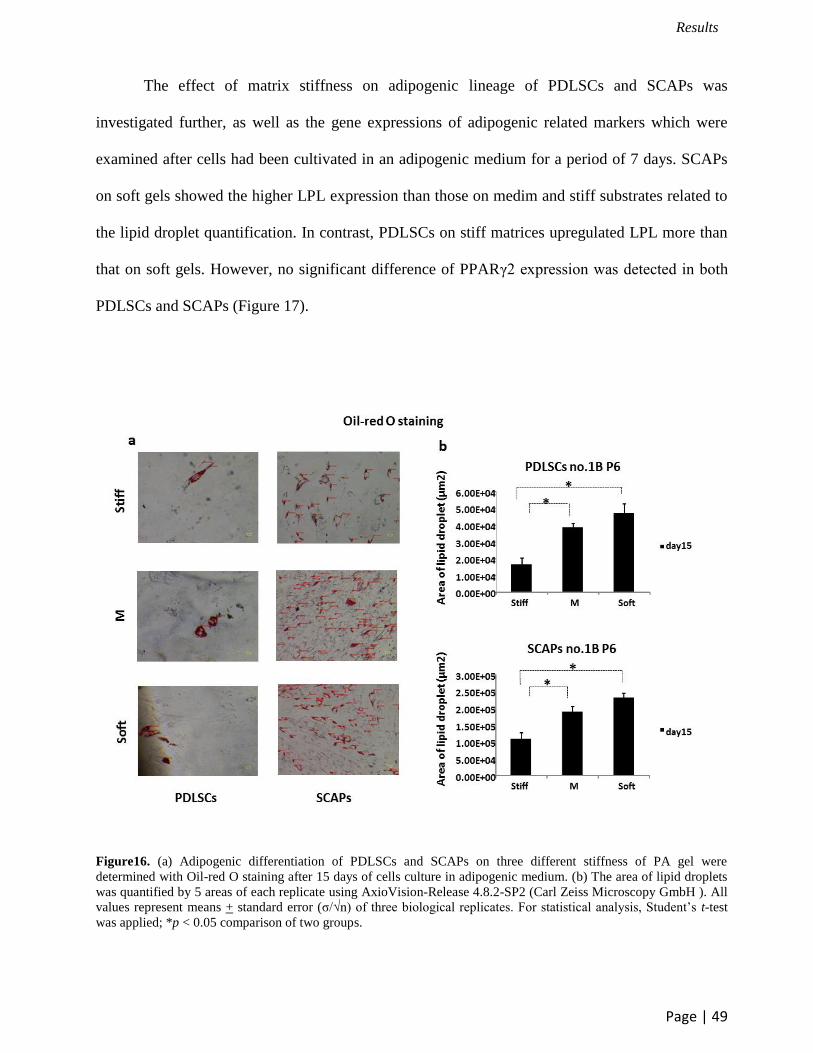
3.8 Effect of substrate stiffness on the adipogenic differentiation of PDLSCs and SCAPs
The influence of matrix stiffness on adipogenic differentiation was evaluated after
cultivation PDLSCs and SCAPs on PA gel for 15 days by oil-red o staining. After long term
culture with adipogenic supplements, the quantitative analysis of lipid droplet areas was
performed using Axiovision-Release 4.8.2-SP2 (Carl Zeiss Microscopy GmbH) (Figure 16a). Our
results demonstrated that soft and medium substrates induced more fat cells in both PDLSCs and
SCAPs than stiff matrices (Figure 16b).
Results
Page | 49
The effect of matrix stiffness on adipogenic lineage of PDLSCs and SCAPs was
investigated further, as well as the gene expressions of adipogenic related markers which were
examined after cells had been cultivated in an adipogenic medium for a period of 7 days. SCAPs
on soft gels showed the higher LPL expression than those on medim and stiff substrates related to
the lipid droplet quantification. In contrast, PDLSCs on stiff matrices upregulated LPL more than
that on soft gels. However, no significant difference of PPARγ2 expression was detected in both
PDLSCs and SCAPs (Figure 17).
Figure16. (a) Adipogenic differentiation of PDLSCs and SCAPs on three different stiffness of PA gel were
determined with Oil-red O staining after 15 days of cells culture in adipogenic medium. (b) The area of lipid droplets
was quantified by 5 areas of each replicate using AxioVision-Release 4.8.2-SP2 (Carl Zeiss Microscopy GmbH ). All
values represent means + standard error (σ/√n) of three biological replicates. For statistical analysis, Student’s t-test
was applied; *p < 0.05 comparison of two groups.
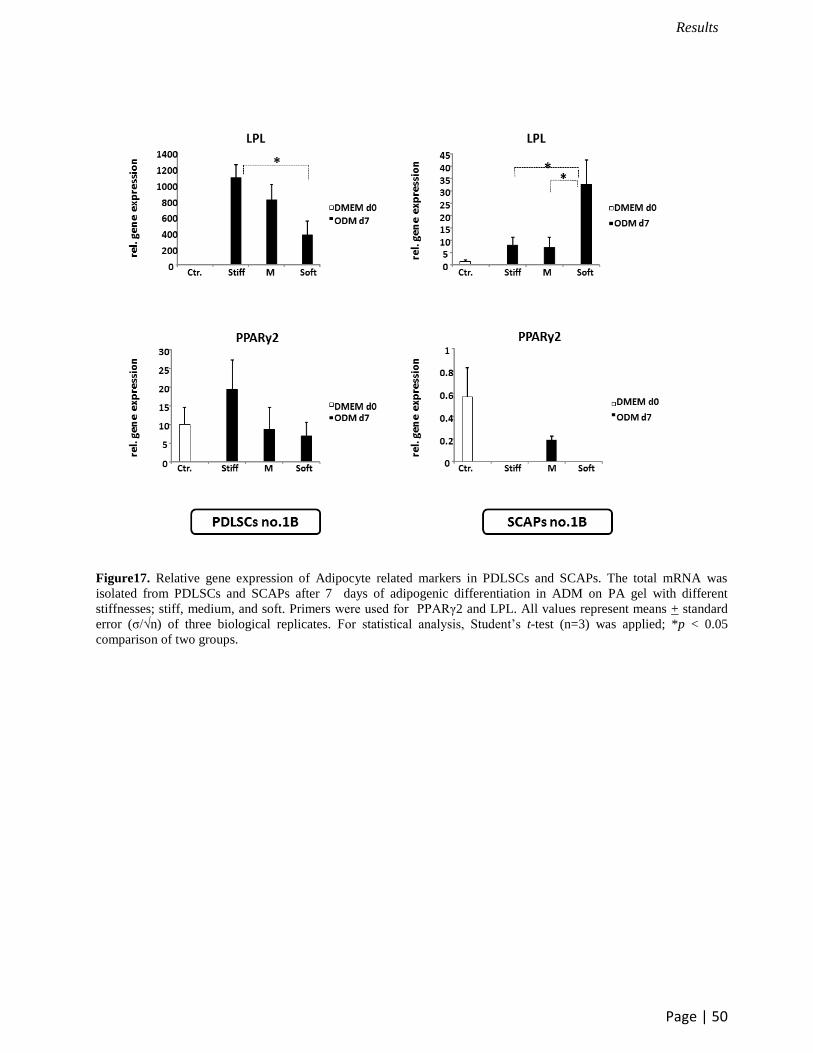
Results
Page | 50
Figure17. Relative gene expression of Adipocyte related markers in PDLSCs and SCAPs. The total mRNA was
isolated from PDLSCs and SCAPs after 7 days of adipogenic differentiation in ADM on PA gel with different
stiffnesses; stiff, medium, and soft. Primers were used for PPARγ2 and LPL. All values represent means + standard
error (σ/√n) of three biological replicates. For statistical analysis, Student’s t-test (n=3) was applied; *p < 0.05
comparison of two groups.
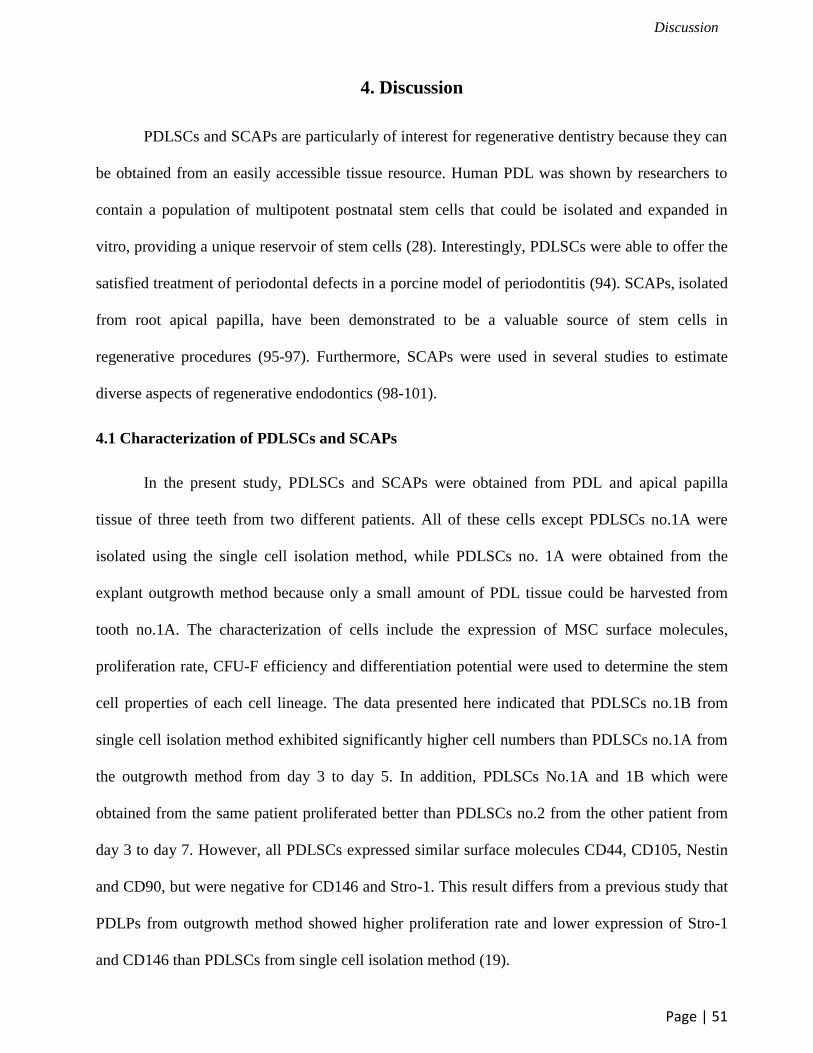
Discussion
Page | 51
4. Discussion
PDLSCs and SCAPs are particularly of interest for regenerative dentistry because they can
be obtained from an easily accessible tissue resource. Human PDL was shown by researchers to
contain a population of multipotent postnatal stem cells that could be isolated and expanded in
vitro, providing a unique reservoir of stem cells (28). Interestingly, PDLSCs were able to offer the
satisfied treatment of periodontal defects in a porcine model of periodontitis (94). SCAPs, isolated
from root apical papilla, have been demonstrated to be a valuable source of stem cells in
regenerative procedures (95-97). Furthermore, SCAPs were used in several studies to estimate
diverse aspects of regenerative endodontics (98-101).
4.1 Characterization of PDLSCs and SCAPs
In the present study, PDLSCs and SCAPs were obtained from PDL and apical papilla
tissue of three teeth from two different patients. All of these cells except PDLSCs no.1A were
isolated using the single cell isolation method, while PDLSCs no. 1A were obtained from the
explant outgrowth method because only a small amount of PDL tissue could be harvested from
tooth no.1A. The characterization of cells include the expression of MSC surface molecules,
proliferation rate, CFU-F efficiency and differentiation potential were used to determine the stem
cell properties of each cell lineage. The data presented here indicated that PDLSCs no.1B from
single cell isolation method exhibited significantly higher cell numbers than PDLSCs no.1A from
the outgrowth method from day 3 to day 5. In addition, PDLSCs No.1A and 1B which were
obtained from the same patient proliferated better than PDLSCs no.2 from the other patient from
day 3 to day 7. However, all PDLSCs expressed similar surface molecules CD44, CD105, Nestin
and CD90, but were negative for CD146 and Stro-1. This result differs from a previous study that
PDLPs from outgrowth method showed higher proliferation rate and lower expression of Stro-1
and CD146 than PDLSCs from single cell isolation method (19).
Discussion
Page | 52
As mentioned above, all SCAPs were obtained with the same isolation method, but from
different donors. SCAPs no.1A and 2 showed similar proliferation rate. In addition, they
proliferated better than SCAPs no.1B between day 5 to day 7. However, all SCAPs demonstrated
the similar colony-forming efficiency. All SCAPs also showed the expression of CD44, CD105,
Nestin, CD90 and CD146. This result is in accordance with a previous study, where it was shown
that the apical papilla was densely populated with CD105, CD90 and CD73 positive cells (102). In
contrast to the previous study by Sonoyama et al. where SCAPs were first characterized based on
the expression of the surface marker Stro-1 (96), all SCAPs in this study were found to be
negative for Stro-1. However, the study from Degistirici et al. demonstrated that dental neural
crest-derived progenitor cells (dNC-PCs) from the apical papilla (pad-like tissue) of human
developing third molar were also negative for Stro-1. Although these cells were negative for Stro-
1, several charateristics of multipotency both in vitro and in vivo could be investigated from dNC-
PCs (103). However, all SCAPs from this study which were obtained from complete dental apical
papilla should be positive for Stro-1. These might be because of the difference of cell culture
condition or the isolation technique in our cell culture condition.
In general, the cell characteristics of PDLSCs and SCAPs in this study both from different
donors and isolation methods are comparable. However, more samples are needed for statistical
reliability.
4.2 Osteogenic differentiation potential of PDLSCs and SCAPs
Next, the osteogenic differentiation potential was observed by mineralization evaluation,
ALP activity measurement and osteogenic related gene expression. All PDLSCs and SCAPs
differentiated into the osteogenic cells after cultivating these cells in StemPro® ODM. Although
the ALP activity of PDLSCs no.2 decreased on day 3, it significantly increased on day 7. This
result might be explained by the fact that ALP activity on day 0 from PDLSCs no.2 showed higher
ALP activity level than PDLSCs no.1A and 1B (data not shown). Therefore, increasing the
Discussion
Page | 53
activity of ALP of PDLSCs no.2 may need a longer time such as 10 days. Interestingly, both
PDLSCs and SCAPs no.1B showed more mineralization nodules than the others which was
observed by alizarin red staining, corresponding to alizarin quantification and ALP activity
evaluation. As expected, the upregulation of OCN, Runx2 and OPN supported the osteogenic
differentiation potential of PDLSCs and SCAPs. Although OPN in SCAPs no.1B was not
significantly increased and OPN expression was downregulated in SCAPs no.1A, the
mineralization nodule could be detected in both SCAPs no.1A and 1B. However, the previous
study has shown that MSCs in hyaline cartilaginous graft upregulated OPN on day 17 and
downregulated on day 30 (75). So, it was possible that the time-point was not appropriate for the
expression of OPN in the cell lineages or OPN was not the best marker to determine the
osteogenic differentiation in this cell culture condition.
4.3 Adipogenic differentiation potential of PDLSCs and SCAPs
Adipogenic differentiation potential was observed by oil red o staining and adipogenic
related gene expression. All PDLSCs displayed lipid droplets after being cultivated in StemPro®
ADM for 28 days. However, PDLSCs no.1A and 1B showed more droplets than PDLSCs no.2
which related to the lower level of LPL expression in PDLSCs no.2. SCAPs no.1B and 2 were
also positive to oil red o staining. However, only a few droplets could be detected in both cell
lineages. In contrast, lipid droplet was not found in SCAPs no.1A which is related to the
expression of LPL that was very low in SCAPs no.1A. This result was similar to the study of
Sonoyama et al. which demonstrated that the adipogenic differentiation potential of SCAPs was
much weaker when compared to BMMSCs (96).
4.4 PDLSCs and SCAPs selection for the experiment with PA substrate
In dentistry, one of the important objectives of regenerative treatment is to produce bone
for replacing bone loss from diseases such as periodontitis. For this reason, PDLSCs and SCAPs
Discussion
Page | 54
no.1B were selected for the experiment of substrate stiffness because more mineralization nodules
were detected in both cell lineages. In addition, both PDLSCs and SCAPs no.1B could
differentiate into adipogenic pathway. Moreover, they were obtained from the same tooth, and
focusing on one cell lineage with the surface stiffness study makes the result clearer.
4.5 PA substrate fabrication
One of the important factors to direct stem cells into specific cell lineages is the matrix
stiffness (66,86,104). The previous studies demonstrated that MSCs differentiated into osteogenic,
myogenic and neurogenic when cultivated on the surface substrate which has a stiffness
comparable to bone, muscle and neural environments, respectively (66,105). Furthermore, the
study of SHED on different substrate stiffness also supported this hypothesis. For example, SHED
performed stronger osteogenic differentiation potential on stiff PDMS substrate than that on soft
substrate (92). In contrast to MSCs and SHED, the induction of osteogenic differentiation of DFCs
on soft substrate was better than that on a stiff matrix (91). However, more experiments are
required to support the conclusion that SHED and DFCs are contrary. Therefore, the other cell
lineages from human dental tissue such as SCAPs and PDLSCs, which are closely related to
SHED and DFCs, will be used in this study to investigate the influence of surface stiffness on
stem cell differentiation.
In the present study, PA gel with various stiffnesses was used to determine the effect of
substrate stiffness on PDLSCs and SCAPs. PA gel is one of the remarkable materials that is easy
to prepare and several studies with stem cell differentiation have reported about this material
(86,87,89,90). To achieve the different surface stiffness, PA substrate was fabricated with various
concentrations of acrylamide and bisacrylamide according to the protocol described previously by
Pelham et al. (87). However, there are some differences in the preparation procedure. For
example, the substrate in this study was not fixed to the bottom of the cell culture plate
Discussion
Page | 55
(polystyrene) which differed from several previous studies (90-92). In addition, PA gel was
prepared in the identical circular shape with 1 mm thickness and 14 mm diameter for all
experiments except for RNA isolation. It should be noted that, PA gel for the experiment of RNA
isolation was prepared in rectangular shape with 2.5 x 3.5 cm length to get adequate cell numbers.
Moreover, the surface stiffness of substrate in this study was measured by Instron E3000 which
represented the value in terms of N/mm. This measurement was different from many previous
studies that showed the value of stiffness in terms of kPa (86,88,90-92). However, the stiffness of
preparing substrate was confirmed as stiff, medium and soft.
4.6 PDLSCs and SCAPs attachment and proliferation on PA substrate
CCK-8 was used to determine cell attachment and proliferation in this study, which
differed from some previous studies (76-77). For example, Li et al. and Costa et al. used scanning
electron microscopes (SEM) and fluorescence microscopes respectively to analyse cell images,
and the quantification of cell attachment and proliferation was performed by counting the total
number of cells (76-77). However, the image of PDLSCs and SCAPs on PA gel in the present
study could be observed by a phase contrast microscope (data not shown). In addition, CCK-8
allowed convenient assays using WST-8 (2-(2-methoxy-4-nitrophenyl)-3-(4-nitrophenyl)-5-(2, 4-
disulfophenyl)-2H-tetrazolium, monosodium salt), which produced a water-soluble formazan dye
upon bioreduction in the presence of an electron carrier, 1-Methoxy PMS. The amount of
formazan produced was directly proportional to the number of living cells (106). Importantly, the
toxicity of CCK-8 was so low that the same cells could be used to measure viable cells at the other
time-points. Therefore, investigating cell proliferation on PA substrate at various time-points
could be done with the same culture plates.
Here, the attachment level of PDLSCs on soft substrate was lower than on medium and
stiff substrates, while the attachment status and proliferation rate of SCAPs on different surface
Discussion
Page | 56
stiffness were not different. However, after PDLSCs attached to the soft surface of PA gel, they
proliferated better than that on medium and stiff gel. This result was similar to the previous study
that the proliferation of DFCs on soft substrate was higher than that on stiff substrate (91).
4.7 Osteogenic differentiation of PDLSCs and SCAPs on PA substrate
ALP activity test was used to evaluate the osteogenic differentiation of PDLSCs and
SCAPs on different stiffnesses of PA gel. After 7 days of the induction of PDLSCs and SCAPs on
PA substrate with StemPro® ODM, PDLSCs on soft substrates showed the highest ALP activity
level, while the highest ALP activity level of SCAPs was detected on stiff substrates. However,
the difference of ALP activity on different stiffness was not significant. It can be supposed that the
StemPro® ODM, which is a commercial ODM and has been proved to induce cells into
osteogenic lineage effectively (107-109), was responsible for the stronger effect than the matrix
stiffness. Therefore, the self-made ODM, which it can be believed has a weaker influence on
osteogenic differentiation than StemPro® ODM, was used to cultivate PDLSCs and SCAPs on PA
substrate. Similarly, ALP activity level of PDLSCs and SCAPs was the highest on soft and stiff
gels, respectively. However, no significant difference could be detected between the different
groups of stiffness. Although the osteogenic differentiation potential of PDLSCs and SCAPs on
different stiffness was not significant, the tendency of ALP activity could be evaluated.
Next, the mineralization measurement, which is a gold standard method for osteogenic
differentiation evaluation, should have been performed. Alizarin red staining, osteolmage
mineralization assay and von Kossa staining were used to determine the cluster of mineralization.
Unfortunately, not only calcium cluster, but also PA gel could be stained with all methods. Thus
the quantification of mineralization was not successful (Supplementary Figure S1). Then, it can be
tried to count the mineralization nodules from H&E staining with AxioVision-Release 4.8.2-SP2.
Discussion
Page | 57
After 2 weeks of cell cultivation in ODM, PDLSCs and SCAPs started rolling up on PA substrate.
So, it was not possible to evaluate the mineralization precisely (Supplementary Figure S1).
The expression of Runx2, BMP2 and CP23, the markers for osteogenic differentiation, was
increased in PDLSCs on soft substrate, cultivated in self-made ODM. In addition, SCAPs on stiff
substrate which induced osteogenic differentiation with StemPro® ODM showed the highest
expression level for Runx2, BMP2 and CP23. However, no significant difference was detected
regarding different stiffness. This result could support the ALP activity of PDLSCs and SCAPs.
However, some markers such as OPN and OCN were incompatible with the ALP activity.
Therefore, the screening test of gene expression, which is evaluated with one sample per one
marker, was done on day 1 and day 3. The result showed that the expression of Runx2 and BMP2
was increased in PDLSCs on soft substrate on day 1 (Supplementary Figure S2), while the
expression of OPN and OCN was increased in SCAPs on stiff substrate on day 1 (Supplementary
Figure S3). So, it might be suggested that the proper time-point to investigate the expression of
different gene markers was different (75).
In this study, the difference of osteogenic differentiation potential of PDLSCs and SCAPs
on different stiffness of PA substrate was not detected. However, the tendency of osteogenic
differentiation potential of PDLSCs and SCAPs could be found on soft and stiff substrates
respectively. From these results, PDLSCs seem to behave like DFCs, while SCAPs seem to
behave like SHED and MSC from the previous studies (66,86,91,92,105).
It can be supposed that the stiffness of PA gel in this study has less influence on the
differentiation into osteogenic lineage. For example, the difference of stiffness between the
substrate groups was not enough to direct stem cells into osteogenic. Moreover, the stiff PA
substrate was not stiff enough to mimic a bone stiffness environment, which was supported by the
previous studies that the stiffness of cartilage ranged from 5 to 20 N/mm (110-112), while the
Discussion
Page | 58
stiffness of muscle was approximately 1.4 N/mm (113). Therefore, the stiff substrate in this study
was stiffer than muscle, but softer than cartilage.
4.8 Adipogenic differentiation of PDLSCs and SCAPs on PA substrate
Although the substrate stiffness did not influence osteogenic differentiation of PDLSCs
and SCAPs in this study, the tendency of osteogenic differentiation of PDLSCs could be observed
on a soft surface, while stiff substrates tended to regulate SCAPs into osteogenic lineage.
However, the influence of surface stiffness could be clearly detected on adipogenic pathway. For
example, the soft substrate could promote both PDLSCs and SCAPs into adipogenic lineage as
seen by the quantification of lipid droplets. In addition, SCAPs on soft gel upregulated LPL which
conformed to a greater number of lipid droplets on soft gel than on stiff gel. This result was
similar to the previous study that soft matrix supported adipogenic differentiation of MSC (89).
Therefore, it might be concluded that the environment of PA substrate in this study was more
suitable for adipogenic than osteogenic pathway.
4.9 Conclusion
In the present study, the characterization of PDLSCs and SCAPs from different methods
and donors are comparable. However, the strong mineralization could be detected on PDLSCs and
SCAPs no.1B which were obtained from the same tooth. Although all PDLSCs and SCAPs were
negative for Stro-1 which contradicted the previous study, the multipotential differentiation could
be observed. The influence of substrate stiffness on osteogenic differentiation of PDLSCs and
SCAPs could not be detected in this study. The reason for this result might be explained by the
characteristic of surface stiffness and the environment of PA substrate. For example, the stiff
substrate was not stiff enough to mimic bone stiffness. In addition, the preparation PA gel was not
attached to the bottom of culture dishes (floating). Therefore, the environment of PA substrate in
this study could not obviously promote the osteogenic differentiation. However, soft matrix tended
Discussion
Page | 59
to regulate PDLSCs, while stiff matrix tended to promote SCAPs into osteogenic lineage. So,
PDLSCs seem to behave like DFCs, while the behavior of SCAPs seems like SHED and MSCs.
Interestingly, the environment of PA gel in this study was appropriate for adipogenic pathway. As
expected, the soft substrate promoted both PDLSCs and SCAPs into adipogenic lineage which is
similar to MSCs.
References
Page | 60
5. References
1. Proffit WR, Jr HWF, Sarver DM. Contemporary Orthodontics. Elsevier Health Sciences;
2006. 2069 p.
2. Rosenstiel SF. Contemporary Fixed Prosthodontics. Elsevier Health Sciences; 2006. 1141 p.
3. Lindhe J, Lang NP, Karring T. Clinical Periodontology and Implant Dentistry. John Wiley
& Sons; 2009. 1393 p.
4. Geerts SO, Legrand V, Charpentier J, Albert A, Rompen EH. Further evidence of the
association between periodontal conditions and coronary artery disease. J Periodontol. 2004
Sep; 75(9): 1274–80.
5. Tucker A, Sharpe P. The cutting-edge of mammalian development; how the embryo makes
teeth. Nat Rev Genet. 2004 Jul; 5(7): 499–508.
6. Jernvall J, Thesleff I. Tooth shape formation and tooth renewal: evolving with the same
signals. Dev Camb Engl. 2012 Oct; 139(19): 3487–97.
7. Volponi AA, Pang Y, Sharpe PT. Stem cell-based biological tooth repair and regeneration.
Trends Cell Biol. 2010 Dec; 20(12): 715–22.
8. Ikeda E, Tsuji T. Growing bioengineered teeth from single cells: potential for dental
regenerative medicine. Expert Opin Biol Ther. 2008 Jun; 8(6): 735–44.
9. Avery JK, Steele PF, Avery N. Oral Development and Histology. Thieme; 2002. 458 p.
10. Nanci A. Ten Cate’s Oral Histology: Development, Structure, and Function. Elsevier Health
Sciences; 2008. 432 p.
References
Page | 61
11. Jernvall J, Thesleff I. Reiterative signaling and patterning during mammalian tooth
morphogenesis. Mech Dev. 2000 Mar 15; 92(1): 19–29.
12. Bei M. Molecular genetics of tooth development. Curr Opin Genet Dev. 2009 Oct; 19(5):
504–10.
13. Nakatomi M, Wang X-P, Key D, Lund JJ, Turbe-Doan A, Kist R, et al. Genetic interactions
between Pax9 and Msx1 regulate lip development and several stages of tooth
morphogenesis. Dev Biol. 2010 Apr 15; 340(2): 438–49.
14. Fukumoto S, Yamada Y. Review: Extracellular Matrix Regulates Tooth Morphogenesis.
Connect Tissue Res. 2005 Jan 1; 46(4-5): 220–6.
15. Oshima M, Tsuji T. Functional tooth regenerative therapy: tooth tissue regeneration and
whole-tooth replacement. Odontol Soc Nippon Dent Univ. 2014 Jul; 102(2): 123–36.
16. Saito M, Nishida E, Sasaki T, Yoneda T, Shimizu N. The KK-Periome database for
transcripts of periodontal ligament development. J Exp Zoolog B Mol Dev Evol. 2009 Jul
15; 312B(5): 495–502.
17. Yen AH-H, Sharpe PT. Stem cells and tooth tissue engineering. Cell Tissue Res. 2008 Jan;
331(1): 359–72.
18. D’Errico JA, Ouyang H, Berry JE, MacNeil RL, Strayhorn C, Imperiale MJ, et al.
Immortalized cementoblasts and periodontal ligament cells in culture. Bone. 1999 Jul;
25(1): 39–47.
19. Feng F, Akiyama K, Liu Y, Yamaza T, Wang T-M, Chen J-H, et al. Utility of PDL
progenitors for in vivo tissue regeneration: a report of 3 cases. Oral Dis. 2010 Jan; 16(1):
20–8.
References
Page | 62
20. Friedenstein AJ, Chailakhjan RK, Lalykina KS. The development of fibroblast colonies in
monolayer cultures of guinea-pig bone marrow and spleen cells. Cell Tissue Kinet. 1970
Oct; 3(4): 393–403.
21. Owen M, Friedenstein AJ. Stromal stem cells: marrow-derived osteogenic precursors. Ciba
Found Symp. 1988; 136: 42–60.
22. Morsczeck C, Götz W, Schierholz J, Zeilhofer F, Kühn U, Möhl C, et al. Isolation of
precursor cells (PCs) from human dental follicle of wisdom teeth. Matrix Biol J Int Soc
Matrix Biol. 2005 Apr; 24(2): 155–65.
23. Caplan AI. Mesenchymal stem cells. J Orthop Res Off Publ Orthop Res Soc. 1991 Sep;
9(5): 641–50.
24. Gronthos S, Mankani M, Brahim J, Robey PG, Shi S. Postnatal human dental pulp stem
cells (DPSCs) in vitro and in vivo. Proc Natl Acad Sci U S A. 2000 Dec 5; 97(25): 13625–
30.
25. Thesleff I. Epithelial-mesenchymal signalling regulating tooth morphogenesis. J Cell Sci.
2003 May 1; 116(Pt 9): 1647–8.
26. Koussoulakou DS, Margaritis LH, Koussoulakos SL. A curriculum vitae of teeth: evolution,
generation, regeneration. Int J Biol Sci. 2009; 5(3): 226–43.
27. Sarkar L, Cobourne M, Naylor S, Smalley M, Dale T, Sharpe PT. Wnt/Shh interactions
regulate ectodermal boundary formation during mammalian tooth development. Proc Natl
Acad Sci U S A. 2000 Apr 25; 97(9): 4520–4.
28. Seo B-M, Miura M, Gronthos S, Bartold PM, Batouli S, Brahim J, et al. Investigation of
multipotent postnatal stem cells from human periodontal ligament. Lancet. 2004 Jul 10;
364(9429): 149–55.
References
Page | 63
29. Sonoyama W, Liu Y, Fang D, Yamaza T, Seo B-M, Zhang C, et al. Mesenchymal stem cell-
mediated functional tooth regeneration in swine. PloS One. 2006; 1: e79.
30. Jo Y-Y, Lee H-J, Kook S-Y, Choung H-W, Park J-Y, Chung J-H, et al. Isolation and
characterization of postnatal stem cells from human dental tissues. Tissue Eng. 2007 Apr;
13(4): 767–73.
31. Miura M, Gronthos S, Zhao M, Lu B, Fisher LW, Robey PG, et al. SHED: stem cells from
human exfoliated deciduous teeth. Proc Natl Acad Sci U S A. 2003 May 13; 100(10): 5807–
12.
32. Gronthos S, Brahim J, Li W, Fisher LW, Cherman N, Boyde A, et al. Stem cell properties
of human dental pulp stem cells. J Dent Res. 2002 Aug; 81(8): 531–5.
33. Murray PE, Garcia-Godoy F, Hargreaves KM. Regenerative endodontics: a review of
current status and a call for action. J Endod. 2007 Apr; 33(4): 377–90.
34. Sloan AJ, Smith AJ. Stem cells and the dental pulp: potential roles in dentine regeneration
and repair. Oral Dis. 2007 Mar; 13(2): 151–7.
35. Shimono M, Ishikawa T, Ishikawa H, Matsuzaki H, Hashimoto S, Muramatsu T, et al.
Regulatory mechanisms of periodontal regeneration. Microsc Res Tech. 2003 Apr 1; 60(5):
491–502.
36. Foster BL, Popowics TE, Fong HK, Somerman MJ. Advances in defining regulators of
cementum development and periodontal regeneration. Curr Top Dev Biol. 2007; 78: 47–
126.
37. Yang Z, Jin F, Zhang X, Ma D, Han C, Huo N, et al. Tissue engineering of
cementum/periodontal-ligament complex using a novel three-dimensional pellet cultivation
References
Page | 64
system for human periodontal ligament stem cells. Tissue Eng Part C Methods. 2009 Dec;
15(4): 571–81.
38. Ten Cate AR. The development of the periodontium--a largely ectomesenchymally derived
unit. Periodontol 2000. 1997 Feb; 13: 9–19.
39. MacNeil RL, Thomas HF. Development of the murine periodontium. II. Role of the
epithelial root sheath in formation of the periodontal attachment. J Periodontol. 1993 Apr;
64(4): 285–91.
40. Spouge JD. A new look at the rests of Malassez. A review of their embryological origin,
anatomy, and possible role in periodontal health and disease. J Periodontol. 1980 Aug;
51(8): 437–44.
41. Saito M, Handa K, Kiyono T, Hattori S, Yokoi T, Tsubakimoto T, et al. Immortalization of
cementoblast progenitor cells with Bmi-1 and TERT. J Bone Miner Res Off J Am Soc Bone
Miner Res. 2005 Jan; 20(1): 50–7.
42. Luan X, Ito Y, Dangaria S, Diekwisch TGH. Dental follicle progenitor cell heterogeneity in
the developing mouse periodontium. Stem Cells Dev. 2006 Aug; 15(4): 595–608.
43. Körbling M, Estrov Z. Adult Stem Cells for Tissue Repair — A New Therapeutic Concept?
N Engl J Med. 2003 Aug 7; 349(6): 570–82.
44. Gurtner GC, Werner S, Barrandon Y, Longaker MT. Wound repair and regeneration.
Nature. 2008 May 15; 453(7193): 314–21.
45. Romagnoli C, D’Asta F, Brandi ML. Drug delivery using composite scaffolds in the context
of bone tissue engineering. Clin Cases Miner Bone Metab Off J Ital Soc Osteoporos Miner
Metab Skelet Dis. 2013 Sep; 10(3): 155–61.
References
Page | 65
46. Rodriguez IA, Growney Kalaf EA, Bowlin GL, Sell SA. Platelet-rich plasma in bone
regeneration: engineering the delivery for improved clinical efficacy. BioMed Res Int.
2014; 2014: 392398.
47. Thomas JT, Schneider BS, Frank EL, Krizan SJ. Cartilage repair and replacement in the
knee: a regulatory perspective. Trends Biotechnol. 2013 Dec; 31(12): 665–7.
48. Musumeci G, Castrogiovanni P, Leonardi R, Trovato FM, Szychlinska MA, Di Giunta A, et
al. New perspectives for articular cartilage repair treatment through tissue engineering: A
contemporary review. World J Orthop. 2014 Apr 18; 5(2): 80–8.
49. Mol A, Smits AIPM, Bouten CVC, Baaijens FPT. Tissue engineering of heart valves:
advances and current challenges. Expert Rev Med Devices. 2009 May; 6(3): 259–75.
50. Kidane AG, Burriesci G, Cornejo P, Dooley A, Sarkar S, Bonhoeffer P, et al. Current
developments and future prospects for heart valve replacement therapy. J Biomed Mater
Res B Appl Biomater. 2009 Jan; 88(1): 290–303.
51. Li J, Ding M, Fu Q, Tan H, Xie X, Zhong Y. A novel strategy to graft RGD peptide on
biomaterials surfaces for endothelization of small-diamater vascular grafts and tissue
engineering blood vessel. J Mater Sci Mater Med. 2008 Jul; 19(7): 2595–603.
52. Bischel LL, Young EWK, Mader BR, Beebe DJ. Tubeless microfluidic angiogenesis assay
with three-dimensional endothelial-lined microvessels. Biomaterials. 2013 Feb; 34(5):
1471–7.
53. Niu G, Sapoznik E, Lu P, Criswell T, Mohs AM, Wang G, et al. Fluorescent imaging of
endothelial cells in bioengineered blood vessels: the impact of crosslinking of the scaffold. J
Tissue Eng Regen Med. 2014 Feb 26;
References
Page | 66
54. Orabi H, Bouhout S, Morissette A, Rousseau A, Chabaud S, Bolduc S. Tissue engineering
of urinary bladder and urethra: advances from bench to patients. ScientificWorldJournal.
2013; 2013: 154564.
55. Franck D, Gil ES, Adam RM, Kaplan DL, Chung YG, Estrada CR, et al. Evaluation of silk
biomaterials in combination with extracellular matrix coatings for bladder tissue
engineering with primary and pluripotent cells. PloS One. 2013; 8(2): e56237.
56. Lin C, Mao C, Zhang J, Li Y, Chen X. Healing effect of bioactive glass ointment on full-
thickness skin wounds. Biomed Mater Bristol Engl. 2012 Aug; 7(4): 045017.
57. Kobsa S, Kristofik NJ, Sawyer AJ, Bothwell ALM, Kyriakides TR, Saltzman WM. An
electrospun scaffold integrating nucleic acid delivery for treatment of full-thickness
wounds. Biomaterials. 2013 May; 34(15): 3891–901.
58. Pan J-F, Liu N-H, Sun H, Xu F. Preparation and Characterization of Electrospun
PLCL/Poloxamer Nanofibers and Dextran/Gelatin Hydrogels for Skin Tissue Engineering.
PloS One. 2014; 9(11): e112885.
59. Fuoco C, Sangalli E, Vono R, Testa S, Sacchetti B, Latronico MVG, et al. 3D hydrogel
environment rejuvenates aged pericytes for skeletal muscle tissue engineering. Front
Physiol. 2014; 5: 203.
60. Teodori L, Costa A, Marzio R, Perniconi B, Coletti D, Adamo S, et al. Native extracellular
matrix: a new scaffolding platform for repair of damaged muscle. Front Physiol. 2014; 5:
218.
61. Tomita M, Mori T, Maruyama K, Zahir T, Ward M, Umezawa A, et al. A comparison of
neural differentiation and retinal transplantation with bone marrow-derived cells and retinal
progenitor cells. Stem Cells Dayt Ohio. 2006 Oct; 24(10): 2270–8.
References
Page | 67
62. McHugh KJ, Saint-Geniez M, Tao SL. Topographical control of ocular cell types for tissue
engineering. J Biomed Mater Res B Appl Biomater. 2013 Nov; 101(8): 1571–84.
63. Yamada Y, Ueda M, Hibi H, Baba S. A novel approach to periodontal tissue regeneration
with mesenchymal stem cells and platelet-rich plasma using tissue engineering technology:
A clinical case report. Int J Periodontics Restorative Dent. 2006 Aug; 26(4): 363–9.
64. Zigdon-Giladi H, Khoury N, Evron A. Adult stem cells in the use of jaw bone regeneration:
Current and prospective research. Quintessence Int Berl Ger 1985. 2014 Nov 13;
65. Yildirim S, Fu SY, Kim K, Zhou H, Lee CH, Li A, et al. Tooth regeneration: a revolution in
stomatology and evolution in regenerative medicine. Int J Oral Sci. 2011 Jul; 3(3): 107–16.
66. Discher DE, Mooney DJ, Zandstra PW. Growth factors, matrices, and forces combine and
control stem cells. Science. 2009 Jun 26; 324(5935): 1673–7.
67. Pittenger MF, Mackay AM, Beck SC, Jaiswal RK, Douglas R, Mosca JD, et al.
Multilineage potential of adult human mesenchymal stem cells. Science. 1999 Apr 2;
284(5411): 143–7.
68. Heino TJ, Hentunen TA, Väänänen HK. Conditioned medium from osteocytes stimulates
the proliferation of bone marrow mesenchymal stem cells and their differentiation into
osteoblasts. Exp Cell Res. 2004 Apr 1; 294(2): 458–68.
69. Locklin RM, Williamson MC, Beresford JN, Triffitt JT, Owen ME. In vitro effects of
growth factors and dexamethasone on rat marrow stromal cells. Clin Orthop. 1995 Apr;
(313): 27–35.
70. Maegawa N, Kawamura K, Hirose M, Yajima H, Takakura Y, Ohgushi H. Enhancement of
osteoblastic differentiation of mesenchymal stromal cells cultured by selective combination
References
Page | 68
of bone morphogenetic protein-2 (BMP-2) and fibroblast growth factor-2 (FGF-2). J Tissue
Eng Regen Med. 2007 Aug; 1(4): 306–13.
71. Barry F, Boynton RE, Liu B, Murphy JM. Chondrogenic differentiation of mesenchymal
stem cells from bone marrow: differentiation-dependent gene expression of matrix
components. Exp Cell Res. 2001 Aug 15; 268(2): 189–200.
72. Ng F, Boucher S, Koh S, Sastry KSR, Chase L, Lakshmipathy U, et al. PDGF, TGF-beta,
and FGF signaling is important for differentiation and growth of mesenchymal stem cells
(MSCs): transcriptional profiling can identify markers and signaling pathways important in
differentiation of MSCs into adipogenic, chondrogenic, and osteogenic lineages. Blood.
2008 Jul 15; 112(2): 295–307.
73. David V, Martin A, Lafage-Proust M-H, Malaval L, Peyroche S, Jones DB, et al.
Mechanical loading down-regulates peroxisome proliferator-activated receptor gamma in
bone marrow stromal cells and favors osteoblastogenesis at the expense of adipogenesis.
Endocrinology. 2007 May; 148(5): 2553–62.
74. Schwartz Z, Simon BJ, Duran MA, Barabino G, Chaudhri R, Boyan BD. Pulsed
electromagnetic fields enhance BMP-2 dependent osteoblastic differentiation of human
mesenchymal stem cells. J Orthop Res Off Publ Orthop Res Soc. 2008 Sep; 26(9): 1250–5.
75. Lau TT, Lee LQP, Vo BN, Su K, Wang D-A. Inducing ossification in an engineered 3D
scaffold-free living cartilage template. Biomaterials. 2012 Nov; 33(33): 8406–17.
76. Costa DO, Prowse PDH, Chrones T, Sims SM, Hamilton DW, Rizkalla AS, et al. The
differential regulation of osteoblast and osteoclast activity by surface topography of
hydroxyapatite coatings. Biomaterials. 2013 Oct; 34(30): 7215–26.
References
Page | 69
77. Li Z, Gong Y, Sun S, Du Y, Lü D, Liu X, et al. Differential regulation of stiffness,
topography, and dimension of substrates in rat mesenchymal stem cells. Biomaterials. 2013
Oct; 34(31): 7616–25.
78. Li X, Liu H, Niu X, Yu B, Fan Y, Feng Q, et al. The use of carbon nanotubes to induce
osteogenic differentiation of human adipose-derived MSCs in vitro and ectopic bone
formation in vivo. Biomaterials. 2012 Jun; 33(19): 4818–27.
79. Jiang Y, Chen J, Deng C, Suuronen EJ, Zhong Z. Click hydrogels, microgels and nanogels:
emerging platforms for drug delivery and tissue engineering. Biomaterials. 2014 Jun;
35(18): 4969–85.
80. Sun H, Zhu F, Hu Q, Krebsbach PH. Controlling stem cell-mediated bone regeneration
through tailored mechanical properties of collagen scaffolds. Biomaterials. 2014 Jan; 35(4):
1176–84.
81. Kurpinski K, Chu J, Hashi C, Li S. Anisotropic mechanosensing by mesenchymal stem
cells. Proc Natl Acad Sci U S A. 2006 Oct 31; 103(44): 16095–100.
82. Kurpinski K, Chu J, Wang D, Li S. Proteomic Profiling of Mesenchymal Stem Cell
Responses to Mechanical Strain and TGF-beta1. Cell Mol Bioeng. 2009 Dec; 2(4): 606–14.
83. Curtis A, Wilkinson C. Nantotechniques and approaches in biotechnology. Trends
Biotechnol. 2001 Mar; 19(3): 97–101.
84. Flemming RG, Murphy CJ, Abrams GA, Goodman SL, Nealey PF. Effects of synthetic
micro- and nano-structured surfaces on cell behavior. Biomaterials. 1999 Mar; 20(6): 573–
88.
References
Page | 70
85. Dalby MJ, Gadegaard N, Tare R, Andar A, Riehle MO, Herzyk P, et al. The control of
human mesenchymal cell differentiation using nanoscale symmetry and disorder. Nat
Mater. 2007 Dec; 6(12): 997–1003.
86. Engler AJ, Sen S, Sweeney HL, Discher DE. Matrix elasticity directs stem cell lineage
specification. Cell. 2006 Aug 25; 126(4): 677–89.
87. Pelham RJ, Wang Y l. Cell locomotion and focal adhesions are regulated by substrate
flexibility. Proc Natl Acad Sci U S A. 1997 Dec 9; 94(25): 13661–5.
88. Li X, Huang Y, Zheng L, Liu H, Niu X, Huang J, et al. Effect of substrate stiffness on the
functions of rat bone marrow and adipose tissue derived mesenchymal stem cells in vitro. J
Biomed Mater Res A. 2014 Apr; 102(4): 1092–101.
89. Park JS, Chu JS, Tsou AD, Diop R, Tang Z, Wang A, et al. The effect of matrix stiffness on
the differentiation of mesenchymal stem cells in response to TGF-β. Biomaterials. 2011
Jun; 32(16): 3921–30.
90. Xue R, Li JY-S, Yeh Y, Yang L, Chien S. Effects of matrix elasticity and cell density on
human mesenchymal stem cells differentiation. J Orthop Res Off Publ Orthop Res Soc.
2013 Sep; 31(9): 1360–5.
91. Viale-Bouroncle S, Völlner F, Möhl C, Küpper K, Brockhoff G, Reichert TE, et al. Soft
matrix supports osteogenic differentiation of human dental follicle cells. Biochem Biophys
Res Commun. 2011 Jul 8; 410(3): 587–92.
92. Viale-Bouroncle S, Gosau M, Küpper K, Möhl C, Brockhoff G, Reichert TE, et al. Rigid
matrix supports osteogenic differentiation of stem cells from human exfoliated deciduous
teeth (SHED). Differ Res Biol Divers. 2012 Dec; 84(5): 366–70.
References
Page | 71
93. Winer J, Jung CK, Shackel I, Williams PM. Development and validation of real-time
quantitative reverse transcriptase-polymerase chain reaction for monitoring gene expression
in cardiac myocytes in vitro. Anal Biochem. 1999 May 15; 270(1): 41–9.
94. Liu Y, Zheng Y, Ding G, Fang D, Zhang C, Bartold PM, et al. Periodontal Ligament Stem
Cell-Mediated Treatment for Periodontitis in Miniature Swine. Stem Cells Dayt Ohio. 2008
Apr; 26(4): 1065–73.
95. Lovelace TW, Henry MA, Hargreaves KM, Diogenes A. Evaluation of the delivery of
mesenchymal stem cells into the root canal space of necrotic immature teeth after clinical
regenerative endodontic procedure. J Endod. 2011 Feb; 37(2): 133–8.
96. Sonoyama W, Liu Y, Yamaza T, Tuan RS, Wang S, Shi S, et al. Characterization of the
apical papilla and its residing stem cells from human immature permanent teeth: a pilot
study. J Endod. 2008 Feb; 34(2): 166–71.
97. Huang GT-J, Sonoyama W, Liu Y, Liu H, Wang S, Shi S. The hidden treasure in apical
papilla: the potential role in pulp/dentin regeneration and bioroot engineering. J Endod.
2008 Jun; 34(6): 645–51.
98. Trevino EG, Patwardhan AN, Henry MA, Perry G, Dybdal-Hargreaves N, Hargreaves KM,
et al. Effect of irrigants on the survival of human stem cells of the apical papilla in a
platelet-rich plasma scaffold in human root tips. J Endod. 2011 Aug; 37(8): 1109–15.
99. Wu J, Huang GT-J, He W, Wang P, Tong Z, Jia Q, et al. Basic fibroblast growth factor
enhances stemness of human stem cells from the apical papilla. J Endod. 2012 May; 38(5):
614–22.
References
Page | 72
100. Wang S, Mu J, Fan Z, Yu Y, Yan M, Lei G, et al. Insulin-like growth factor 1 can promote
the osteogenic differentiation and osteogenesis of stem cells from apical papilla. Stem Cell
Res. 2012 May; 8(3): 346–56.
101. Bakopoulou A, Leyhausen G, Volk J, Tsiftsoglou A, Garefis P, Koidis P, et al. Comparative
analysis of in vitro osteo/odontogenic differentiation potential of human dental pulp stem
cells (DPSCs) and stem cells from the apical papilla (SCAP). Arch Oral Biol. 2011 Jul;
56(7): 709–21.
102. Ruparel NB, de Almeida JFA, Henry MA, Diogenes A. Characterization of a stem cell of
apical papilla cell line: effect of passage on cellular phenotype. J Endod. 2013 Mar; 39(3):
357–63.
103. Degistirici O, Jaquiery C, Schönebeck B, Siemonsmeier J, Götz W, Martin I, et al. Defining
properties of neural crest-derived progenitor cells from the apex of human developing tooth.
Tissue Eng Part A. 2008 Feb; 14(2): 317–30.
104. Reilly GC, Engler AJ. Intrinsic extracellular matrix properties regulate stem cell
differentiation. J Biomech. 2010 Jan 5; 43(1): 55–62.
105. Rowlands AS, George PA, Cooper-White JJ. Directing osteogenic and myogenic
differentiation of MSCs: interplay of stiffness and adhesive ligand presentation. Am J
Physiol Cell Physiol. 2008 Oct; 295(4): C1037–44.
106. Ishiyama M, Miyazono Y, Sasamoto K, Ohkura Y, Ueno K. A highly water-soluble
disulfonated tetrazolium salt as a chromogenic indicator for NADH as well as cell viability.
Talanta. 1997 Jul; 44(7): 1299–305.
References
Page | 73
107. Yu S, Diao S, Wang J, Ding G, Yang D, Fan Z. Comparative analysis of proliferation and
differentiation potentials of stem cells from inflamed pulp of deciduous teeth and stem cells
from exfoliated deciduous teeth. BioMed Res Int. 2014; 2014: 930907.
108. Takamiya M, Haider KH, Ashraf M. Identification and characterization of a novel
multipotent sub-population of Sca-1+ cardiac progenitor cells for myocardial regeneration.
PloS One. 2011; 6(9): e25265.
109. Shi Y, Niedzinski JR, Samaniego A, Bogdansky S, Atkinson BL. Adipose-derived stem
cells combined with a demineralized cancellous bone substrate for bone regeneration.
Tissue Eng Part A. 2012 Jul; 18(13-14): 1313–21.
110. Thambyah A, Nather A, Goh J. Mechanical properties of articular cartilage covered by the
meniscus. Osteoarthr Cartil OARS Osteoarthr Res Soc. 2006 Jun; 14(6): 580–8.
111. Lyyra T, Kiviranta I, Väätäinen U, Helminen HJ, Jurvelin JS. In vivo characterization of
indentation stiffness of articular cartilage in the normal human knee. J Biomed Mater Res.
1999; 48(4): 482–7.
112. Yang Q, Peng J, Lu S-B, Guo Q-Y, Zhao B, Zhang L, et al. Evaluation of an extracellular
matrix-derived acellular biphasic scaffold/cell construct in the repair of a large articular
high-load-bearing osteochondral defect in a canine model. Chin Med J (Engl). 2011 Dec;
124(23): 3930–8.
113. Webster JG. Prevention of Pressure Sores: Engineering and Clinical Aspects. CRC Press;
1991. 272 p.
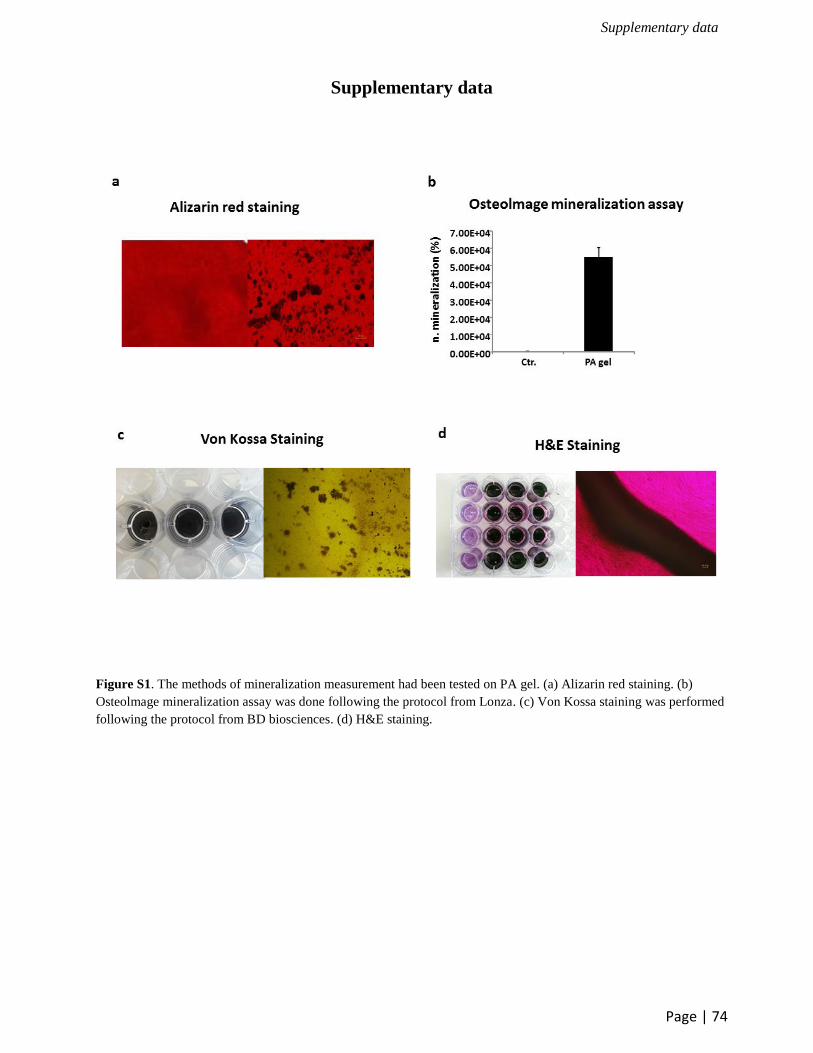
Supplementary data
Page | 74
Supplementary data
Figure S1. The methods of mineralization measurement had been tested on PA gel. (a) Alizarin red staining. (b)
Osteolmage mineralization assay was done following the protocol from Lonza. (c) Von Kossa staining was performed
following the protocol from BD biosciences. (d) H&E staining.
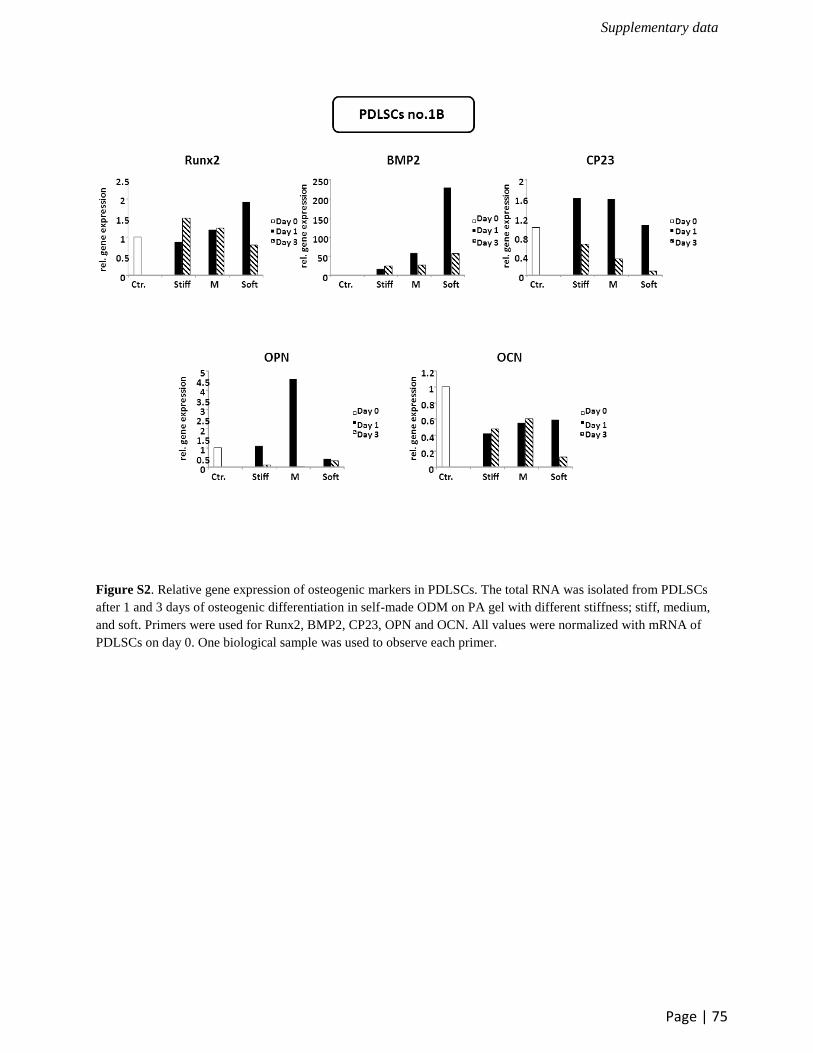
Supplementary data
Page | 75
Figure S2. Relative gene expression of osteogenic markers in PDLSCs. The total RNA was isolated from PDLSCs
after 1 and 3 days of osteogenic differentiation in self-made ODM on PA gel with different stiffness; stiff, medium,
and soft. Primers were used for Runx2, BMP2, CP23, OPN and OCN. All values were normalized with mRNA of
PDLSCs on day 0. One biological sample was used to observe each primer.
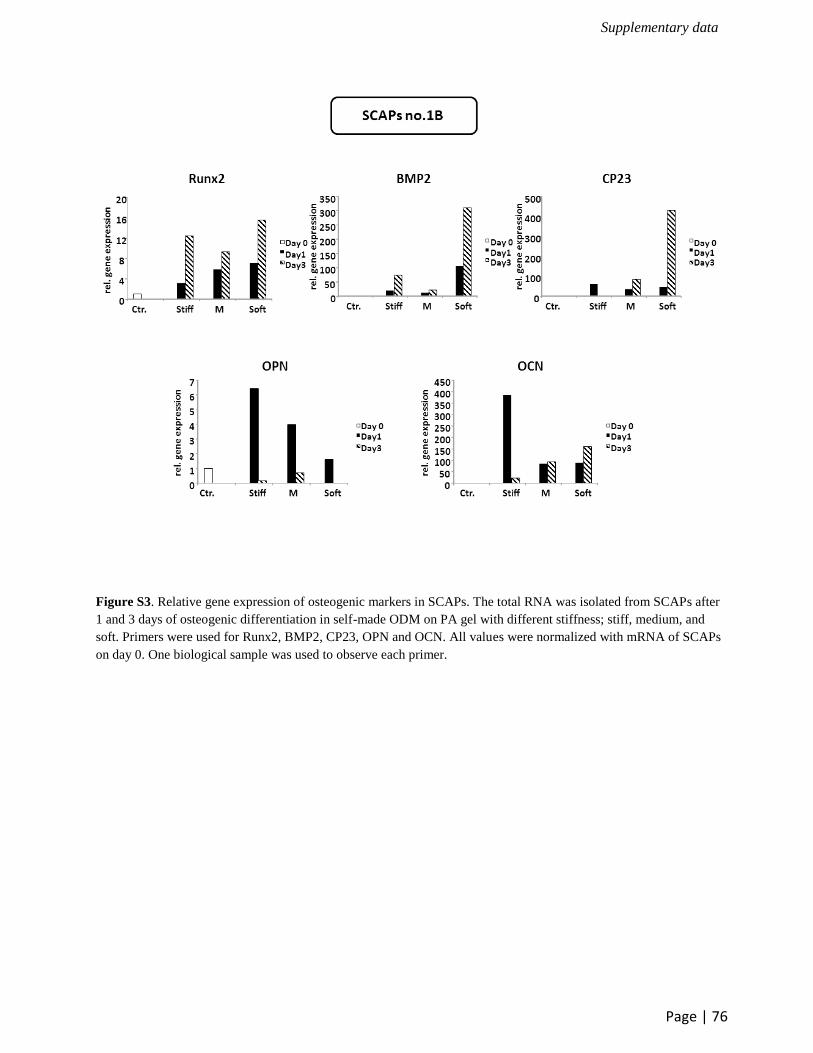
Supplementary data
Page | 76
Figure S3. Relative gene expression of osteogenic markers in SCAPs. The total RNA was isolated from SCAPs after
1 and 3 days of osteogenic differentiation in self-made ODM on PA gel with different stiffness; stiff, medium, and
soft. Primers were used for Runx2, BMP2, CP23, OPN and OCN. All values were normalized with mRNA of SCAPs
on day 0. One biological sample was used to observe each primer.