Embed Size (px)
Citation preview
Friedrich-Alexander Universität Erlangen-Nürnberg
Non-canonical pre-T cell receptor signaling and proteasome activity requirements during early T cell development
Den Naturwissenschaftlichen Fakultäten der Friedrich-Alexander-Universität Erlangen-Nürnberg
zur Erlangung des Doktorgrades
vorgelegt von Damian Maseda Caballero
aus Madrid
I
Als Dissertation genehmigt von den Naturwissenschaftlichen Fakultäten der Universität Erlangen-Nürnberg
Damian Maseda Caballero IZKF-N2. Department of Internal Medicine III
Tag der mündlichen Prüfung: 11.10.2007 Vorsitzender der Promotionskommission: Prof. Dr. rer. nat. E. Bänsch Erstberichterstatter: Prof. Dr. rer. nat. T. Winkler Zweitberichtserstatter: Prof. Dr. rer. nat. H.M. Jäck
II
Table of contents
1. Abstract ...................................................................................................................................... 3 1. Zusammenfassung..................................................................................................................... 4 2. Introduction ............................................................................................................................... 5
2.1 T cell development................................................................................................................ 5 2.2 The pre-TCR and the β-selection checkpoint ....................................................................... 8 2.3 Non-canonical TCR signaling during the β-selection process............................................ 13 2.4 Proteasomal activity during T-cell development ................................................................ 18
3. Hypothesis ................................................................................................................................ 22 4. Results ...................................................................................................................................... 23
4.1 Expression of the TCRβ-chain in immature thymocytes lacking a classical pre-TCR..... 24 4.1.1 The TCRβ chain can be detected on the surface of DN thymocytes in the absence of pairing pTα and TCRα chains. ............................................................................................. 24 4.1.2 Transition from the DN3 to DN4 stages in pTα-/- and pTα-/- x TCRα-/- thymocytes. 26 4.1.3 Expression of the TCRβ chain protein in absence of pTα and TCRα chain proteins. 26
4.2 Signaling capability in the absence of pre-Tα and TCRα chains....................................... 28 4.2.1 Rise of intracellular Ca2+ influx upon TCR stimulation in thymocytes of pTα-/- and pTα-/- x TCRα-/- mice............................................................................................................ 28 4.2.2 NF-κB DNA-binding activity in thymic subsets of pTα-/- and pTα-/- x TCRα-/- mice. ………………………………………………………………………………………. 30 4.2.3 Induction of in vivo development of DN thymocytes into DP and SP thymocyte subsets. .................................................................................................................................. 32
4.3 Developmental potential of TCRβ-only cells ................................................................... 34 4.3.1 In vitro development of pTα-/- and pTα-/- x TCRα-/- thymocytes in the OP9-Dll1 murine stroma cells coculture system. .................................................................................. 34 4.3.2 Promotion of DN thymocytes to DP and SP stages and commitment to the αβ T-cell lineage. .................................................................................................................................. 39 4.3.3 Influence of CD28 costimulation during β-Selection. ................................................ 41
4.4 Proteasomal requirements during early T-cell development .............................................. 44 4.4.1 Proteasome inhibition induces strong but reversible lymphocyte impairment during development. ......................................................................................................................... 44 4.4.2 Proteasome inhibition triggers autonomous cell death of lymphocytes...................... 47 4.4.3 Induction of apoptosis in thymocytes by proteasome inhibition is mediated by triggering of an Unfolded Protein Response (UPR)-related pathway................................... 49 4.4.4 Requirements for proteasomal activity in pre-TCR- and TCR-expressing thymocytes. ………………………………………………………………………………………. 51
5. Discussion................................................................................................................................. 53 5.1 Relevance of receptors lacking the pTα and TCRα chains during the pre-TCR checkpoint. …………………………………………………………………………………………... 53 5.2 Commitment to the αβ-T cell lineage in pTα-/- and pTα-/- x TCRα-/- thymocytes............. 56 5.3 Proteasome activity requirements during early thymocyte development. .......................... 60
6. Material and methods ............................................................................................................. 64 6.1 Chemicals, reagents and laboratory tools............................................................................ 64
6.1.1 Antibodies .................................................................................................................... 64 6.1.2 Oligonucleotides .......................................................................................................... 66
6.2 Cell culture methods ........................................................................................................... 66 6.2.1 Cultivation of immortalized non-adherent cell lines.................................................... 67 6.2.3 Cultivation of primary lymphocytes ............................................................................ 67 6.2.4 Cocultures of thymocytes with OP9 and OP9-Dll1 stroma cells ................................. 67
1
6.2.5 Long-term storage of cells ........................................................................................... 67 6.3 Animal (rodent) experimentation........................................................................................ 68
6.3.1 Mice strains .................................................................................................................. 68 6.3.2 Mice handling and treatments ...................................................................................... 68
6.4 Preparation of single cell suspensions from blood and lymphoid organs........................... 68 6.4.1 Isolation of total cells from bone marrow, spleen, blood and thymus ......................... 68 6.4.2 Purification of lymphocyte subtypes through magnetic cell sorting............................ 69 6.4.3 Purification of lymphocyte subtypes with high speed cell sorter (MoFlo).................. 69
6.5 Flow cytometry cell analysis............................................................................................... 70 6.5.1 Cell count determination and viability......................................................................... 70 6.5.2 Surface staining and fluorescence activated cell sorting analysis (FACS) .................. 70 6.5.3 Intracellular staining with fluorescent-marked monoclonal antibodies ....................... 70 6.5.4 Cell cycle analysis........................................................................................................ 71 6.5.5 Intracellular Ca2+ flux determination ........................................................................... 71 6.5.6 Induction of apoptosis and apoptotic stage determination........................................... 72 6.5.7 CFSE staining for flow cytometry analysis ................................................................. 72
6.6 DNA and RNA methods ..................................................................................................... 73 6.6.1 Standard DNA methods ............................................................................................... 73 6.6.2 Polymerase-Chain Reaction (PCR).............................................................................. 73 6.6.3 Genotyping of transgenic and knockout mice.............................................................. 74 6.6.4 Standard RNA methods................................................................................................ 74 6.6.5 Real-time PCR analysis............................................................................................... 74
6.7 Protein methods................................................................................................................... 75 6.7.1 Whole cells protein extraction and quantification. ...................................................... 75 6.7.2 Nuclear and cytoplasmic protein extraction................................................................. 76 6.7.3 SDS-Polyacrilamide Gel Electrophoresis (PAGE) ...................................................... 76 6.7.4 Western blot analysis and Immunoblotting.................................................................. 77 6.8 Electromobility Shift Assay (EMSA) ............................................................................. 78 6.9 Caspase activity assays ................................................................................................... 80
7. Abbreviations........................................................................................................................... 82 8. Literature ................................................................................................................................. 84 9. Acknowledgements.................................................................................................................. 95
2
1. Abstract
T cells undergoing maturation in the thymus need to receive a pre-TCR-delivered signal to undergo β-
selection and develop further properly. The pre-TCR is composed of a constitutively expressed pre-Tα
(pTα) chain and a de novo expressed TCRβ chain. A productive recombination of the TCRβ chain is
mandatory to overcome the first checkpoint that controls T cells survival and transition from double-negative (DN) 3 to DN4 stages. However, in a very low but consistent extent, DN3 thymocytes lacking a canonical pre-TCR can differentiate to the double positive (DP) and CD4+ or CD8+ single positive (SP)
stages. Nevertheless, pTα- and pTα/TCRα-deficient mice denote a very similar phenotype in thymus,
displaying few DP thymocytes, while only TCRβ-/- x TCRδ-/- mice depict a phenotype comparable to
RAG-/- mice. Control of apoptosis during T cell maturation demands strict regulation of survival and cell-cycle proteins. The ubiquitin-proteasome machinery is in great extent responsible for protein degradation in mammalian cells. Inhibition of the proteasomal enzymatic activity can lead to dramatic changes in protein homeostasis and lead to cell death. Important mechanisms of proteasome inhibition-mediated cell death are the
impairment of NF-κB activation and induction of the terminal unfolded protein response (UPR). However,
little is known about proteasomal activity in early developing thymocytes. The aims of this thesis were to elucidate apoptotic mechanisms shared by unconventional pre-TCR signals and altered proteasomal activity during early T cell development.
In the first part of this thesis it could be demonstrated that in the absence of pTα and TCRα chains, DN
thymocytes have the potential to develop into DP and SP thymocytes. This survival was accompanied by
increased Ca2+ influx and NF-κB activity. It could also be described that unconventional pre-TCR
signaling affects αβ vs. γδ T cell proportions. Finally, the data suggest that there may be additional factors
in vivo that explain the overcome of β-selection in the absence of pTα and TCRα chains which are not
dependent on Notch or IL-7 signaling. The effect of proteasomal inhibition during T cell development was investigated in the second part of this work. In vivo treatment with bortezomib resulted in a dramatic decrease of thymocytes. The decreased numbers of developing thymocytes was detected 24h after a single injection of bortezomib and was accompanied by strongly increased caspase 3/7 activities. Thymocytes were almost completely depleted at day three, with complete recovery within two weeks. This impairment of lymphopoiesis did correlate with induction of Hsp70 and CHOP, indicating activation of ER-stress and triggering of a pro-apoptotic terminal UPR. However, we could not detect a clear direct implication of pre-TCR or TCR signaling during induction of apoptosis by proteasome inhibition. In summary, this thesis evidences that thymocytes lacking a classical pre-TCR can survive and
differentiate to DP and SP stages. Besides, signaling through a pTα-less TCR is enough to achieve Ca2+
influx and NF-κB activation, which may explain the survival till DP and SP stages. In addition, it was
demonstrated that the mechanisms underlying cell death of thymocytes in conditions of proteasome
inhibition are in great extent independent of NF-κB activation and pre-TCR or TCR signaling, rather
dependent on triggering of the pro-apoptotic terminal UPR.
3
1. Zusammenfassung
T-Zellen, die sich im Thymus entwickeln, benötigen ein prä-T Zell Rezeptor-vermitteltes (pre-TZR)
Signal zur β-Selektion und Weiterdifferenzierung. Der prä-TZR besteht aus einer konstitutiv exprimierten
prä-Tα (pTα) Kette gepaart mit einer de novo exprimierten TZRβ Kette. Eine produktive Rekombination
der TZRβ-Kette ist notwendig für das Überleben und die Entwicklung von Thymozyten vom doppelt
negativen (DN) 3 zum DN4 Stadium. Trotz Fehlen des klassischen prä-TZR Signals können einige DN3 bis zum CD4+/CD8+ (DP) und CD4+ oder CD8+ single positive (SP) Stadium differenzieren. Allerdings
weisen pTα-defiziente und pTα-/TZRα-doppeltdefiziente Mäuse einen sehr ähnlich Phänotyp auf, d.h.
einige CD4+CD8+-Thymozyten sind nachweisbar, während TZRβ-/- x TZRγ-/--Mäuse, ähnlich wie RAG-/-
Mäuse, keine CD4+CD8+-Zellen mehr besitzen. Der Apoptoseprozess benötigt während der T-Zell-Entwicklung eine strenge Regulation von Proteinen, die für das Überleben und die Zellzyklusregulation wichtig sind. Das Ubiquitin-Proteasom-System ist für die Degradierung von Proteinen in Säugetierzellen verantwortlich. Die Hemmung der enzymatischen Aktivität des Proteasoms kann zu drastischen Veränderungen in der Proteinhomöostase und somit zum Zelltod führen. Verantwortlich für den Zelltod
als Folge der Proteasominhibition werden in erster Linie eine verminderte NF-κB-Aktivität und Induktion
der Unfolded Protein Response (UPR) verantwortlich gemacht. Es ist jedoch sehr wenig bekannt über die Rolle der Proteasom-Aktivierung während der T-Zell Entwicklung. Ziel dieser Arbeit war es, gemeinsame Mechanismen des Zelltodes durch unkonventionelle prä-TZR-Signale und veränderte Proteasom-Aktivität in früheren Stadien der T-Zell Entwicklung aufzuklären.
Im ersten Teil dieses Arbeit wurde gezeigt, dass DN Thymozyten von pTα-/- und pTα-/- x TZRα-/--Mäusen
in der Lage sind, sich ohne ein klassisches prä-TZR-vermitteltes Signal in DP und SP Thymozyten zu entwickeln. In diesen Ko-Thymozyten konnte sowohl Ca2+-Einstrom als auch Aktivierung des
Transkriptionsfaktors NF-κB nachgewiesen werden. Außerdem zeigte sich, dass ein unkonventionelles
prä-TZR-Signal das Verhältnis von γδ- zu αβ-T-Zellen beeinflusst. Ferner fanden sich Hinweise, dass in
vivo neben IL-7 und Notch weitere Faktoren bei der β-Selektion eine Rolle spielen.
Im zweiten Teil der Arbeit wurde der Effekt von Proteasom-Inhibitoren auf die Thymozytenentwicklung untersucht. Behandlung mit Bortezomib führte in Wt-Mäusen zu einer drastischen Abnahme der Thymozyten nach 24 Std. Zu diesem Zeitpunkt konnte außerdem Caspase 3/7-Aktivierung nachgewiesen werden. Drei Tage nach Behandlung waren die Thymozyten extrem reduziert, nach zwei Wochen hatte sich die Zellzahl jedoch vollständig regeneriert. Die Abnahme der Thymozyten korrelierte mit der Induktion von Komponenten der ER-Stress-Antwort wie Hsp70 und CHOP, wobei die Expression von CHOP auf die Aktivierung der pro-apopototischen/terminalen UPR hinweist.
Somit wurde gezeigt, dass Thymozyten ohne pTα- und TZRα-Expression sich zu αβ-ähnlichen DP und SP Thymozyten weiterentwickeln können. Außerdem war das unkonventionelle prä-
TZR-Signal ausreichend für die NF-κB-Aktivierung und den Ca2+-Einstrom und konnte somit die weitere Thymozytendifferenzierung vermitteln. Weiterhin wurde gezeigt, dass der durch Proteasom-Inhibition induzierte Zelltod mit Aktivierung der terminalen UPR einhergeht und auch
in Reifungsstadien auftritt, die weitgehend unabhängig von NF-κB und TZR-Signalen sind.
4
2. Introduction
2.1 T cell development In mammals, common lymphoid progenitor (CLP) cells of bone marrow origin migrate and
colonize the thymus, organ where these cells will progressively differentiate and undergo a series
of processes that will conclude with the creation of a T cell repertoire. During thymic maturation,
the CLP cells become thymocytes, undergo crucial genomic rearrangements, are be committed to
different lineages and proliferate through clonal expansion. All these processes are qualitative
and quantitatively modulated by means of the different microenvironments and signals present in
the thymus (Haks et al., 1999, Hayes et al 2003, Starr et al., 2003.). Thymocyte development can
be categorized through the phenotype of their surface markers CD25, CD44, TCR, CD4 and
CD8, which are sequentially expressed. These markers indicate the progress from the double
negative (DN, CD4-CD8-) stages DN1 to DN4, then become double positive (DP, CD4+CD8+)
and select finally a single positive fate (SP, CD4+ or CD8+) before emigrating from thymus
(Godfrey et al., 1993).
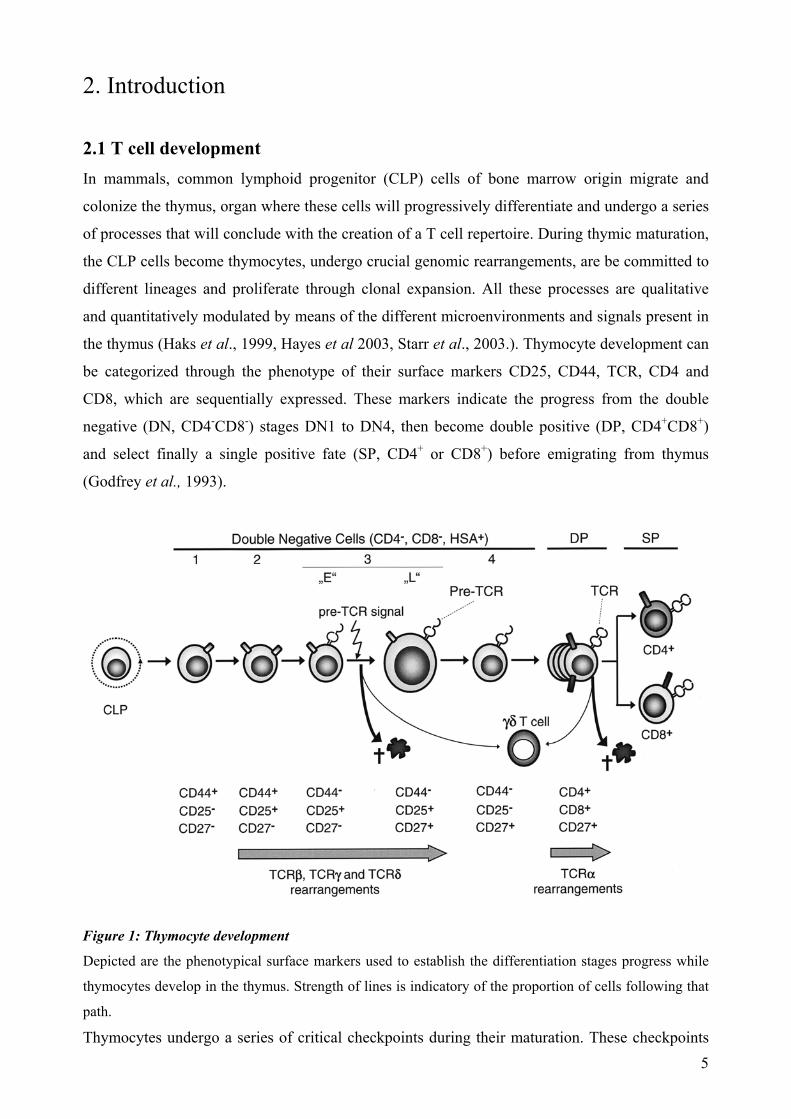
Figure 1: Thymocyte development Depicted are the phenotypical surface markers used to establish the differentiation stages progress while
thymocytes develop in the thymus. Strength of lines is indicatory of the proportion of cells following that
path.
Thymocytes undergo a series of critical checkpoints during their maturation. These checkpoints 5
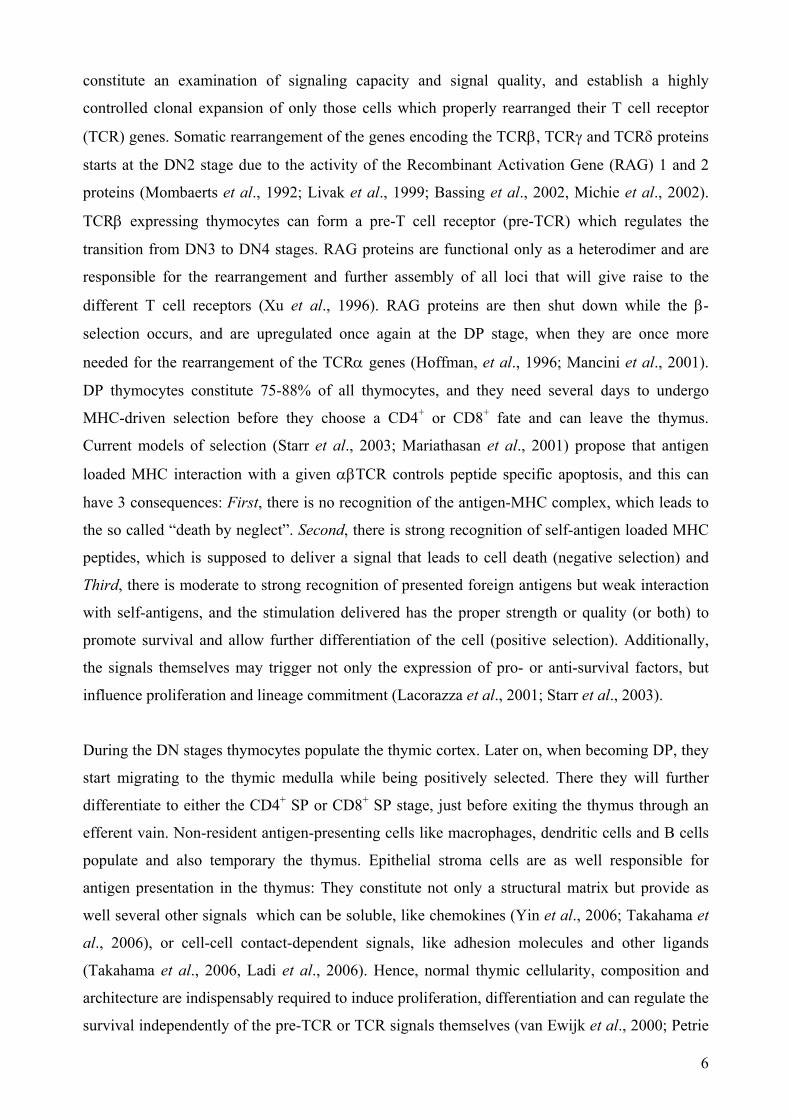
constitute an examination of signaling capacity and signal quality, and establish a highly
controlled clonal expansion of only those cells which properly rearranged their T cell receptor
(TCR) genes. Somatic rearrangement of the genes encoding the TCRβ, TCRγ and TCRδ proteins
starts at the DN2 stage due to the activity of the Recombinant Activation Gene (RAG) 1 and 2
proteins (Mombaerts et al., 1992; Livak et al., 1999; Bassing et al., 2002, Michie et al., 2002).
TCRβ expressing thymocytes can form a pre-T cell receptor (pre-TCR) which regulates the
transition from DN3 to DN4 stages. RAG proteins are functional only as a heterodimer and are
responsible for the rearrangement and further assembly of all loci that will give raise to the
different T cell receptors (Xu et al., 1996). RAG proteins are then shut down while the β-
selection occurs, and are upregulated once again at the DP stage, when they are once more
needed for the rearrangement of the TCRα genes (Hoffman, et al., 1996; Mancini et al., 2001).
DP thymocytes constitute 75-88% of all thymocytes, and they need several days to undergo
MHC-driven selection before they choose a CD4+ or CD8+ fate and can leave the thymus.
Current models of selection (Starr et al., 2003; Mariathasan et al., 2001) propose that antigen
loaded MHC interaction with a given αβTCR controls peptide specific apoptosis, and this can
have 3 consequences: First, there is no recognition of the antigen-MHC complex, which leads to
the so called “death by neglect”. Second, there is strong recognition of self-antigen loaded MHC
peptides, which is supposed to deliver a signal that leads to cell death (negative selection) and
Third, there is moderate to strong recognition of presented foreign antigens but weak interaction
with self-antigens, and the stimulation delivered has the proper strength or quality (or both) to
promote survival and allow further differentiation of the cell (positive selection). Additionally,
the signals themselves may trigger not only the expression of pro- or anti-survival factors, but
influence proliferation and lineage commitment (Lacorazza et al., 2001; Starr et al., 2003).
During the DN stages thymocytes populate the thymic cortex. Later on, when becoming DP, they
start migrating to the thymic medulla while being positively selected. There they will further
differentiate to either the CD4+ SP or CD8+ SP stage, just before exiting the thymus through an
efferent vain. Non-resident antigen-presenting cells like macrophages, dendritic cells and B cells
populate and also temporary the thymus. Epithelial stroma cells are as well responsible for
antigen presentation in the thymus: They constitute not only a structural matrix but provide as
well several other signals which can be soluble, like chemokines (Yin et al., 2006; Takahama et
al., 2006), or cell-cell contact-dependent signals, like adhesion molecules and other ligands
(Takahama et al., 2006, Ladi et al., 2006). Hence, normal thymic cellularity, composition and
architecture are indispensably required to induce proliferation, differentiation and can regulate the
survival independently of the pre-TCR or TCR signals themselves (van Ewijk et al., 2000; Petrie
6
et al., 2007), as demonstrated by the fact that differentiation and mitogenesis can occur
independently of pre-TCR expression (Petrie et al., 2000). DP stage thymocytes have an average
life-span of 3-4 days in absence of selection and they may need up to 2 weeks for being selected
and before they emigrate from the thymus (Xi et al., 2004, Williams et al., 1998).
All the signals generated in the thymus must be interpreted and coordinated by the thymocytes in
a well established space- and time-framed manner to achieve a proper T cell maturation and
selection. This will finally lead to the production of an individual T cell repertoire.
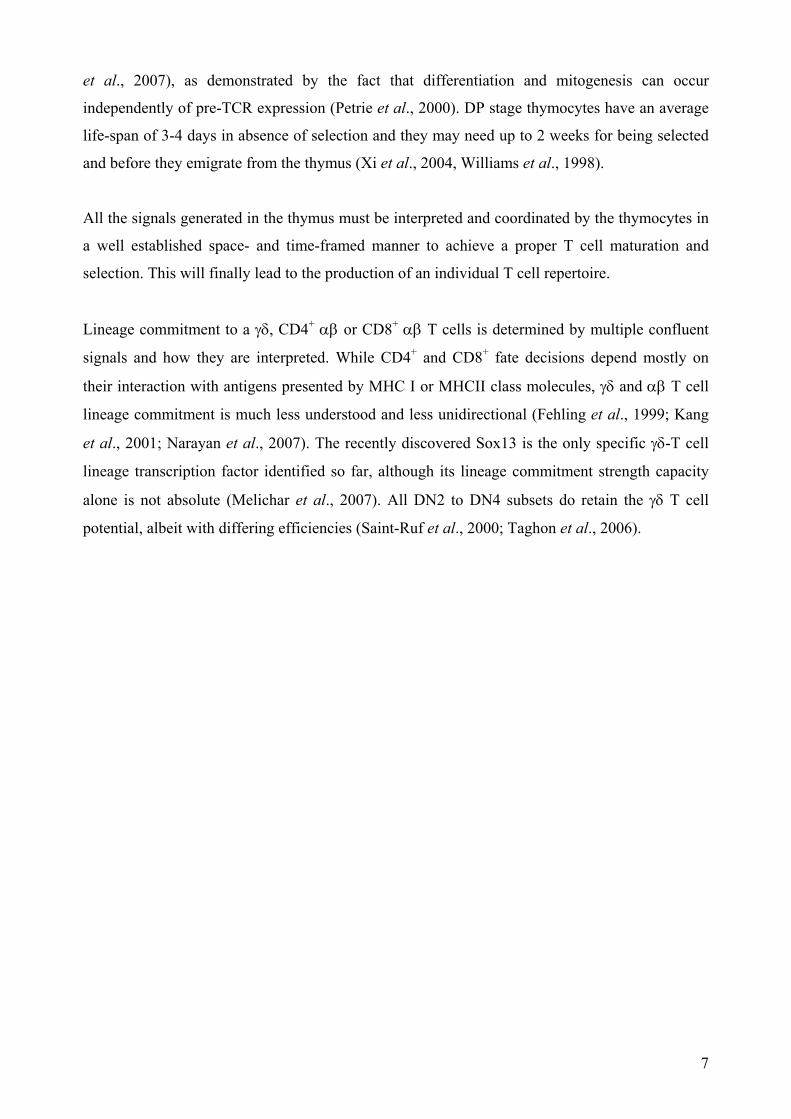
Lineage commitment to a γδ, CD4+ αβ or CD8+ αβ T cells is determined by multiple confluent
signals and how they are interpreted. While CD4+ and CD8+ fate decisions depend mostly on
their interaction with antigens presented by MHC I or MHCII class molecules, γδ and αβ T cell
lineage commitment is much less understood and less unidirectional (Fehling et al., 1999; Kang
et al., 2001; Narayan et al., 2007). The recently discovered Sox13 is the only specific γδ-T cell
lineage transcription factor identified so far, although its lineage commitment strength capacity
alone is not absolute (Melichar et al., 2007). All DN2 to DN4 subsets do retain the γδ T cell
potential, albeit with differing efficiencies (Saint-Ruf et al., 2000; Taghon et al., 2006).
7
2.2 The pre-TCR and the β-selection checkpoint
The pre-TCR receptor is configured by a constitutively expressed invariant pre-T alpha (pTα)
chain that pairs the first rearranged and expressed TCRβ chain. The pTα chain is expressed in
stages previous to rearrangement of the TCRβ locus, which enables a very rapid formation of the
dimer as soon as the TCRβ chain protein is expressed (von Boehmer et al., 1997; Borowski et al.,
2004). The affinity of the TCRβ chain for the pTα chain is in the majority of the cases higher
than for the TCRα chain. This is supposed to be able to displace any prematurely formed TCRα-
TCRβ heterodimer (Trop et al., 2000). The pre-TCR does as well have several unique
autonomous signaling capacities (Yamasaki et al., 2006, Michie et al., 2002) that allow the
selective survival of those thymocytes able to express a correctly folded and “pairing” TCRβ.
Pre-TCR derived signals enable survival of those thymocytes, which can then undergo up to 9
rounds of cell division and thus enlarge the repertoire of cells with a functional β-chain that will
undergo β-selection. Thus, an initial consequence of beta chain expression by early thymocytes is
clonal expansion, increasing the size of the pool of useful precursors (Dudley et al., 1994,
Laurent et al., 2004).
Most of the extracellular domains of the pTα and the TCRβ chains are dispensable for function
(Irving et al., 1998; Aifantis et al., 2002), but the TCRβ requires the presence of transmembrane
tyrosine kinases for correct pre-TCR signaling (Spain et al., 2002). This could be explained
because the signals delivered by the pre-TCR are independent of ligands presented through
MHC-class molecules of surrounding cells (Irving et al., 1998; Dillon et al., 1995). The pre-TCR,
nevertheless, needs to leave the ER compartment and reach the cell surface to exert its signaling
capacities, as retention in the ER abolishes completely its function (O´Shea et al., 1997). Other
pre-TCR dimer peculiarities are that its internalization is a PKC-independent process that
involves combination of src-kinase dependent and independent pathways (Carrasco et al., 2003).
Some reports claim a distinct capacity to mobilize and induce the formation of lipid rafts,
although its relevance is still controversial due to investigations reporting opposite results
(Panigada et al., 2002; Haks et al., 2003; Aifantis et al., 2002; Borowski et al., 2004). All these
data together establish central differing characteristics of pre-TCR to TCR signaling: The pre-
TCR is constitutively internalized and routed to lysosomes and proteasomes after reaching the
cell surface (Panigada et al., 2002; Carrasco et al., 2003), and this is absolutely mandatory to
achieve proper signal deliver from the pre-TCR, while the TCR needs to be engaged
extracellularly to deliver its associated signal. Nevertheless, contribution to the pre-TCR-driven
8
signal by some galectins in the extracellular matrix and other pre-TCR-internalized intracellular
signaling events cannot be absolutely excluded (Mee et al., 1995; Vespa et al., 1999; Falahati et
al., 2007). In humans and mice, the pTα gene encodes two RNAs, pTαa, and a substantially
truncated form, pTαb. Their functionality seems to be almost identical, as both are biologically
active in their capacity to rescue multiple thymocyte defects in pTα mice (Gibbons et al., 2001).
Even so, the lack of pTα does not appears to interfere with allelic exclusion at the TCRβ gene
locus (Xu et al., 1995). This supports the relative low importance of most of the extracellular pTα
chain domains.
Before any antigen-driven selection happens, thymocytes suffer a first receptor surveillance at the
DN3 to DN4 transition. The further survival of those cells depends strictly on the expression of
the pre-TCR. This delimitation to which DN thymocytes are subdued is the so-called β-selection
process. The pre-TCR delivers signals that regulate expression of critical survival factors like
bclX (Ma et al., 1995), bcl2-A1 (Mandal et al., 2005), bax and bak (Rathmel et al., 2002),
DGKα (Outram et al., 2002), FADD/MORT (Newton et al., 2000) and bcl10b (Jost et al., 2007).
However, bcl-2 family proteins can display redundant roles (Rathmel et al., 2002). Several
pathways coincide as well during progress from DN to DP stages: ERK phosphorylation (Michie
et al., 1999, Fischer et al., 2005), MAP Kinases (Zhang et al., 2005), Akt (Mao et al.,2001), Rac
(Gomez et al., 2000), PI3Ks (Swat et al., 2006) and Syk/Zap70 (Chu et al., 1999; Van Oers et al.,
1995) related pathway activities are implicated in thymocyte survival and although survival and
proliferation occurs together, they are separately controlled processes (Petrie et al., 2007).
Transcription factors control the expression of the implicated effector survival factors, as is the
case of NF-κB (Voll et al., 2000; Claudio et al., 2006; Hayday et al., 2006), NFAT (Rincón et
al.,1996; Irving et al., 1998, Steff et al., 2001, Aifantis et al., 2001; Cante-Barret et al., 2007),
cMyc (Dose et al., 2006), cJun (Riera-Sans et al., 2007), cMyb (Pearson et al., 2000) E2A, HEB
(Kim et al., 2002), TCF-1 (Goux et al., 2005), CREB (Grady et al., 2004), LEF-1 and RORγt
(Silva-Santos et al., 2005; Xi et al., 2006). At the same time, Ca2+ release and homeostasis
(Aifantis et al., 2001, Steff et al., 2001), cell cycle regulation (Hoffman et al., 1996; Sicinska et
al., 2003; Aifantis et al., 2006), allelic exclusion (Hoffman et al., 1996; Aifantis et al., 1997;
Spain et al., 2002) and T cell lineage commitment (Bruno et al., 1999; Tourigny et al., 1997;
Murga et al., 2002; Guidos et al., 2006) are as well processes modulated by the pre-TCR. The
survival window established by the pre-TCR signal allows the progression to the DP stage, where
a different set of survival factors like Egr3, bclXL and NFATc must be upregulated and activated
while signals previous to the pre-TCR like bcl2 may be repressed or simply fade.
9
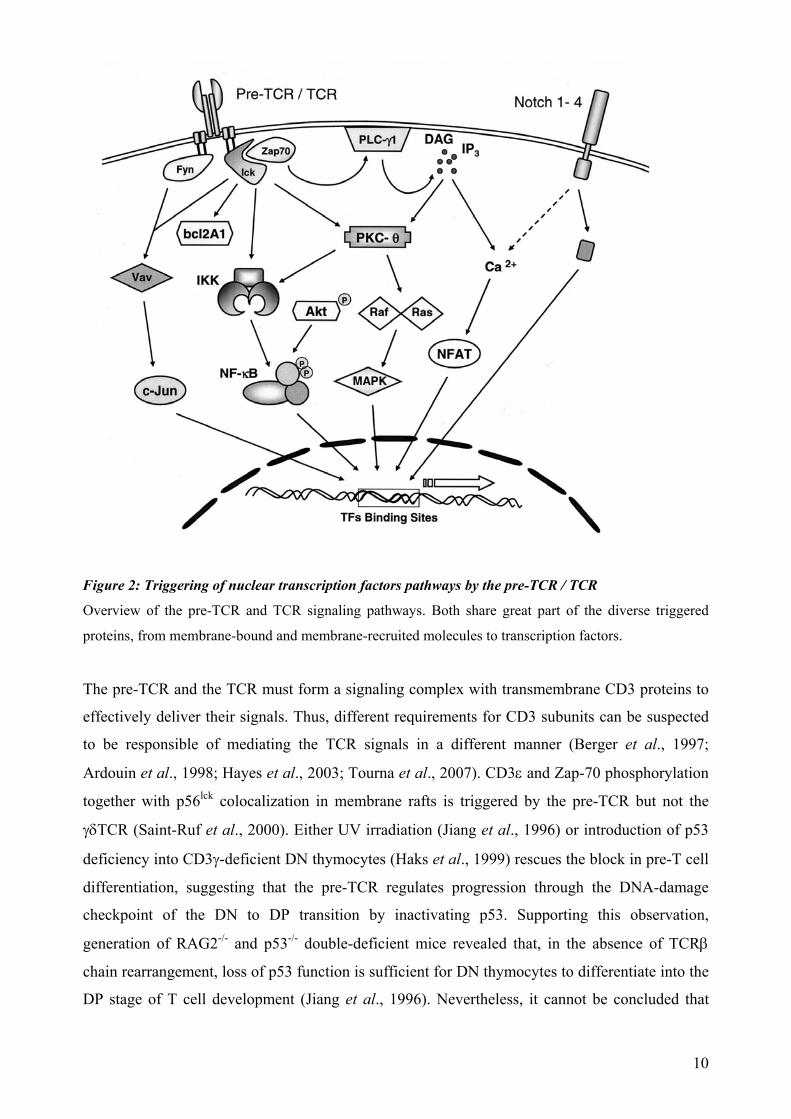
Figure 2: Triggering of nuclear transcription factors pathways by the pre-TCR / TCR
Overview of the pre-TCR and TCR signaling pathways. Both share great part of the diverse triggered
proteins, from membrane-bound and membrane-recruited molecules to transcription factors.
The pre-TCR and the TCR must form a signaling complex with transmembrane CD3 proteins to
effectively deliver their signals. Thus, different requirements for CD3 subunits can be suspected
to be responsible of mediating the TCR signals in a different manner (Berger et al., 1997;
Ardouin et al., 1998; Hayes et al., 2003; Tourna et al., 2007). CD3ε and Zap-70 phosphorylation
together with p56lck colocalization in membrane rafts is triggered by the pre-TCR but not the
γδTCR (Saint-Ruf et al., 2000). Either UV irradiation (Jiang et al., 1996) or introduction of p53
deficiency into CD3γ-deficient DN thymocytes (Haks et al., 1999) rescues the block in pre-T cell
differentiation, suggesting that the pre-TCR regulates progression through the DNA-damage
checkpoint of the DN to DP transition by inactivating p53. Supporting this observation,
generation of RAG2-/- and p53-/- double-deficient mice revealed that, in the absence of TCRβ
chain rearrangement, loss of p53 function is sufficient for DN thymocytes to differentiate into the
DP stage of T cell development (Jiang et al., 1996). Nevertheless, it cannot be concluded that
10
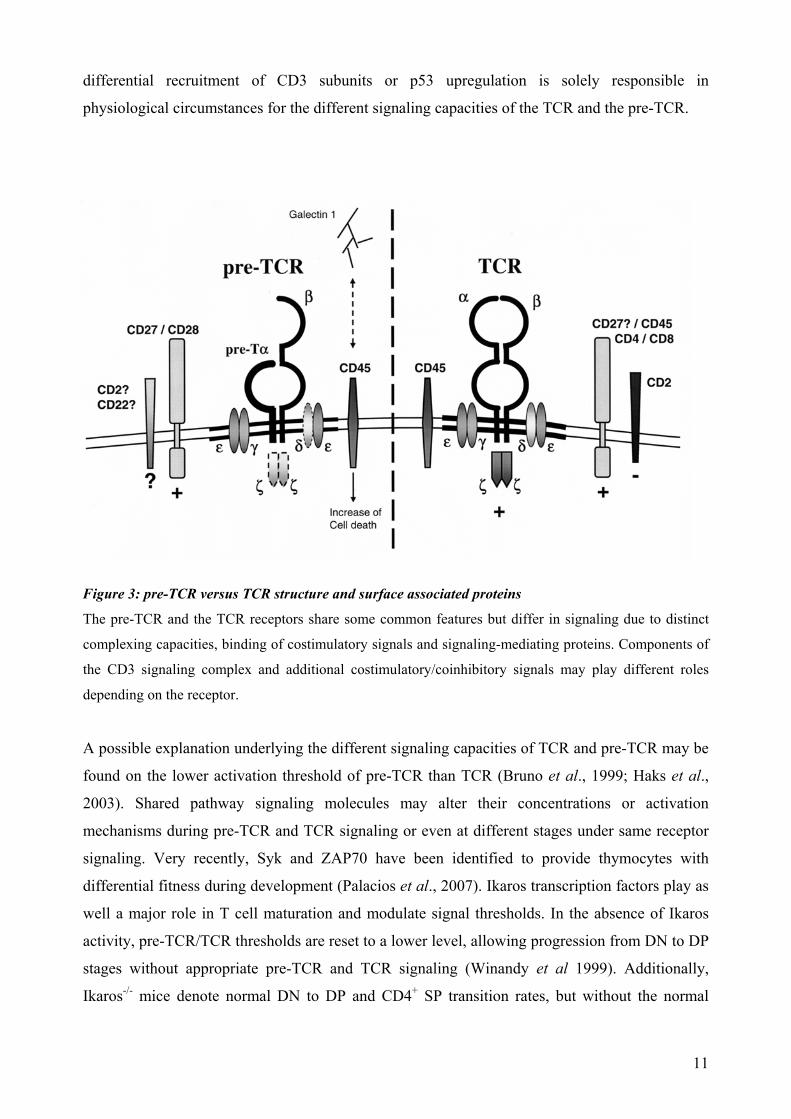
differential recruitment of CD3 subunits or p53 upregulation is solely responsible in
physiological circumstances for the different signaling capacities of the TCR and the pre-TCR.
igure 3: pre-TCR versus TCR structure and surface associated proteins
fer in signaling due to distinct
possible explanation underlying the different signaling capacities of TCR and pre-TCR may be
F
The pre-TCR and the TCR receptors share some common features but dif
complexing capacities, binding of costimulatory signals and signaling-mediating proteins. Components of
the CD3 signaling complex and additional costimulatory/coinhibitory signals may play different roles
depending on the receptor.
A
found on the lower activation threshold of pre-TCR than TCR (Bruno et al., 1999; Haks et al.,
2003). Shared pathway signaling molecules may alter their concentrations or activation
mechanisms during pre-TCR and TCR signaling or even at different stages under same receptor
signaling. Very recently, Syk and ZAP70 have been identified to provide thymocytes with
differential fitness during development (Palacios et al., 2007). Ikaros transcription factors play as
well a major role in T cell maturation and modulate signal thresholds. In the absence of Ikaros
activity, pre-TCR/TCR thresholds are reset to a lower level, allowing progression from DN to DP
stages without appropriate pre-TCR and TCR signaling (Winandy et al 1999). Additionally,
Ikaros-/- mice denote normal DN to DP and CD4+ SP transition rates, but without the normal
11
occurring proliferative expansion (Winandy et al., 1999). Thus, Ikaros is one of the few clear
factors that uncouple the process of differentiation from proliferation during T cell development.
Regarding possible contribution of costimulatory signals during β selection, CD28 and CTLA4
are mostly expressed in DN3 (19 and 63%) and DN4 (86 and 39%) cells during early thymocyte
development (Williams et al., 2005). A classical ligand for CD28, B7.2, is highly preferentially
expressed in thymic cortex. B7-CD28 interaction suppresses differentiation to the DP subset in
thymus and promotes proliferation and survival of DN4 cells but at the same time it decelerates
the transition from DN3 to DN4 by increasing accumulation of RAG-2 protein (Zheng et al.,
2004; Williams et al., 2005).
Non-natural occurring constructs have been extensively used to identify lineage choices decision
or signaling capabilities in diverse cell systems, mostly in vitro with differently mutated pre-TCR
constructs but as well by retroviral expression of TCRβ proteins in Rag-/- background FTOC and
DN3 thymocytes (Michie et al., 1999; Ciofani et al., 2005). Pre-TCR and TCR genetic
constructs, some based exclusively on TCRβ proteins, share some pre-TCR signaling capabilities
as it has been shown with several immature pro/pre-T cell lines (Jacobs al., 1996; Spain et al.,
2001). Nevertheless, the pre-TCR has several unique features which have no match with any of
the constructs tested so far (Borowski et al., 2004). In thymoma cell lines, several TCR constructs
induce a more potent apoptosis upon cross-linking stimulation than pre-TCR constructs, and this
is independent of TCRζ association capabilities. In this latter report, it is shown how the αβTCR
and pre-TCR signals seem to diverge in their ability to activate NFAT and Nur77, ultimately
leading to effective or impaired FasL induction according to receptor engagement (Steff et al.,
2001).
12
2.3 Non-canonical TCR signaling during the β-selection process
In the absence of the pTα chain, thymocytes are arrested in the DN3 stage in a similar way as in a
RAG-deficient background, but this developmental block is incomplete. DN thymocytes from
pTα-/- mice are able to overcome this checkpoint, eluding cell death in a relatively inefficient but
consistent manner.
Those thymocytes which differentiate further to mostly DP and some very few SP stages are
nevertheless “fully functional” (Liu et al., 1993; Mancini et al., 1999) and may colonize mature T
cell niches in the periphery, as it is the case of CD8αα intestinal intraepithelial lymphocytes
(Baldwin et al., 2005) and T regulatory cells (Bosco et al., 2006). Some of them may however be
directly exported as precursors (Lambolez et al., 2006). At the DN3 stage, premature TCRα
chain expression can also lead in vivo to a premature TCRα-TCRβ heterodimer that can
functionally replace the pre-TCR (Lacorazza et al., 2001; Schnell et al., 2006). However, in the
absence of both the TCRα and the pre-Tα the thymic phenotype still resembles very much that of
a pTα-/- mouse. Apart from Rag-/- mice, only TCRβ-/-xTCRδ-/- mice are completely devoid of DP
cells. This indicates that a premature TCRαβ cannot fully explain the observed phenotype, and
that TCRβ-alone, TCRββ or TCRβγ dimers may be responsible for generating DP thymocytes in
the absence of conventional pre-TCR signaling. This is further confirmed by the capacity of
Vβ8.2 TCR transgenic mice to promote cells to DP stage in Rag-/- x pTα-/- genetic background
(Krotkova et al., 1997). Expression of this Vβ8.2 TCR transgene in pTα-/- mice allows large
reconstitution of DP (78%), CD4+ and CD8+ (16% and 5%) compartments, while in Rag-/- x pTα-
/- they are able only to generate mostly only DP cells (60%).
13
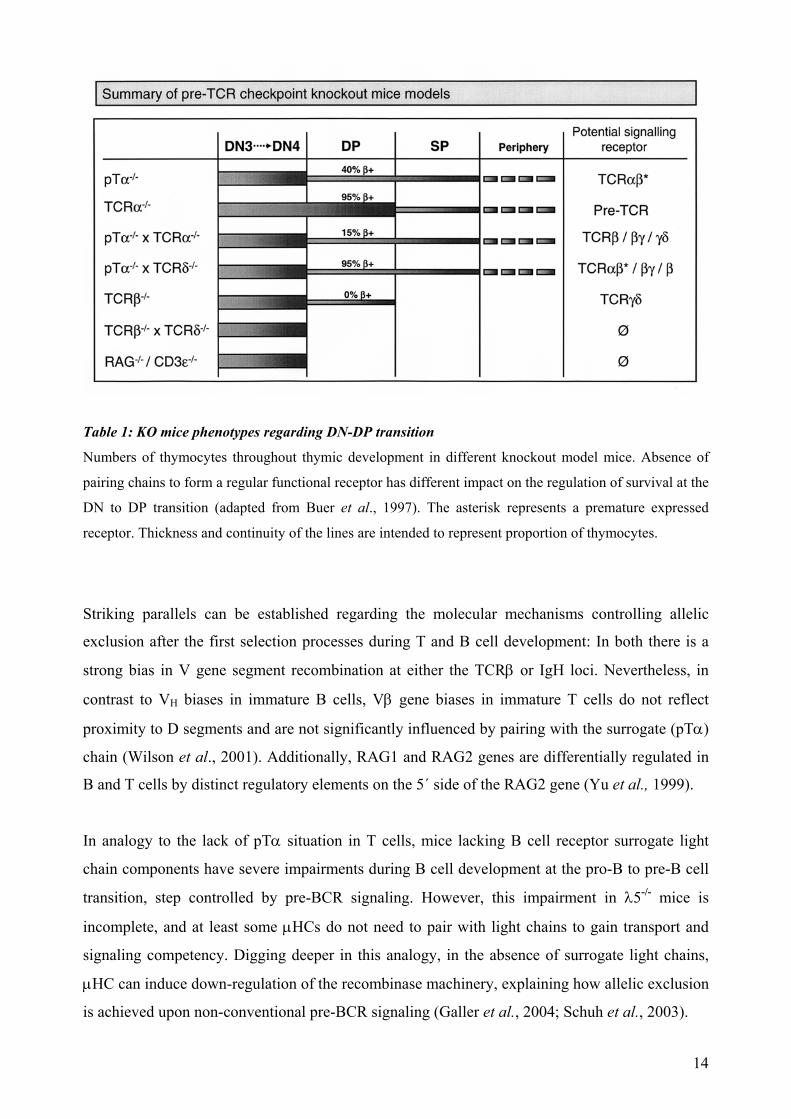
Table 1: KO mice phenotypes regarding DN-DP transition Numbers of thymocytes throughout thymic development in different knockout model mice. Absence of
pairing chains to form a regular functional receptor has different impact on the regulation of survival at the
DN to DP transition (adapted from Buer et al., 1997). The asterisk represents a premature expressed
receptor. Thickness and continuity of the lines are intended to represent proportion of thymocytes.
Striking parallels can be established regarding the molecular mechanisms controlling allelic
exclusion after the first selection processes during T and B cell development: In both there is a
strong bias in V gene segment recombination at either the TCRβ or IgH loci. Nevertheless, in
contrast to VH biases in immature B cells, Vβ gene biases in immature T cells do not reflect
proximity to D segments and are not significantly influenced by pairing with the surrogate (pTα)
chain (Wilson et al., 2001). Additionally, RAG1 and RAG2 genes are differentially regulated in
B and T cells by distinct regulatory elements on the 5´ side of the RAG2 gene (Yu et al., 1999).
In analogy to the lack of pTα situation in T cells, mice lacking B cell receptor surrogate light
chain components have severe impairments during B cell development at the pro-B to pre-B cell
transition, step controlled by pre-BCR signaling. However, this impairment in λ5-/- mice is
incomplete, and at least some μHCs do not need to pair with light chains to gain transport and
signaling competency. Digging deeper in this analogy, in the absence of surrogate light chains,
μHC can induce down-regulation of the recombinase machinery, explaining how allelic exclusion
is achieved upon non-conventional pre-BCR signaling (Galler et al., 2004; Schuh et al., 2003).
14
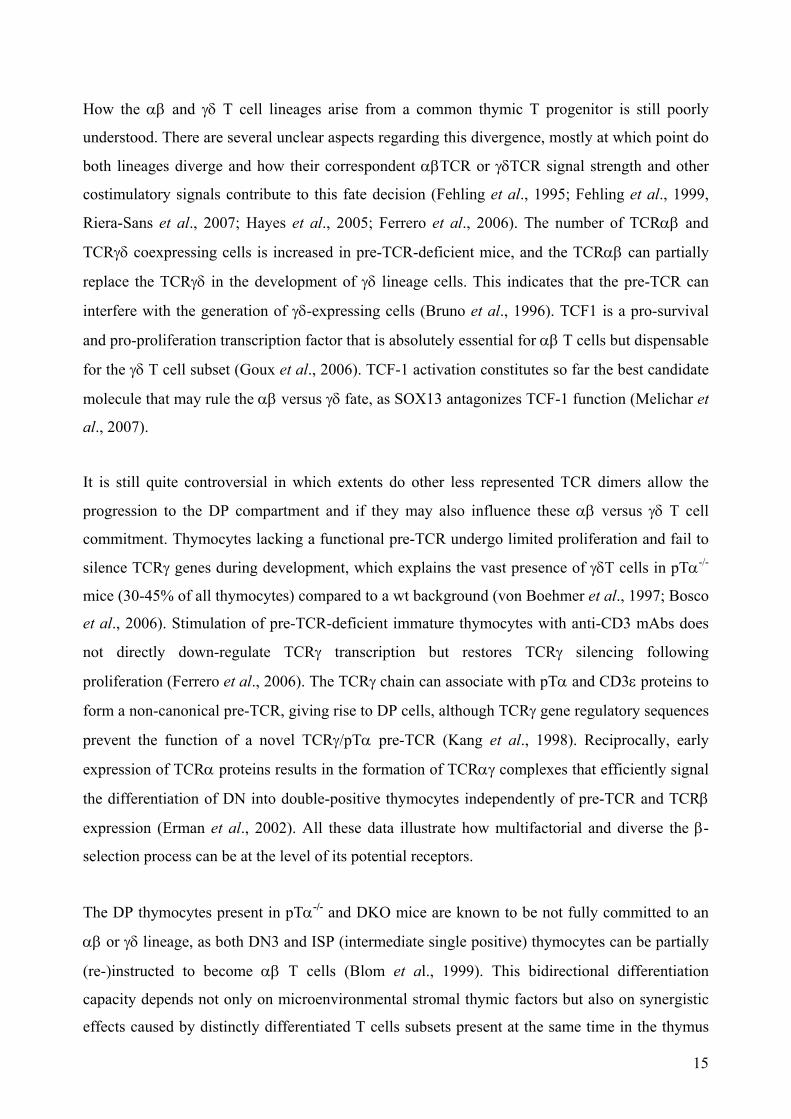
How the αβ and γδ T cell lineages arise from a common thymic T progenitor is still poorly
understood. There are several unclear aspects regarding this divergence, mostly at which point do
both lineages diverge and how their correspondent αβTCR or γδTCR signal strength and other
costimulatory signals contribute to this fate decision (Fehling et al., 1995; Fehling et al., 1999,
Riera-Sans et al., 2007; Hayes et al., 2005; Ferrero et al., 2006). The number of TCRαβ and
TCRγδ coexpressing cells is increased in pre-TCR-deficient mice, and the TCRαβ can partially
replace the TCRγδ in the development of γδ lineage cells. This indicates that the pre-TCR can
interfere with the generation of γδ-expressing cells (Bruno et al., 1996). TCF1 is a pro-survival
and pro-proliferation transcription factor that is absolutely essential for αβ T cells but dispensable
for the γδ T cell subset (Goux et al., 2006). TCF-1 activation constitutes so far the best candidate
molecule that may rule the αβ versus γδ fate, as SOX13 antagonizes TCF-1 function (Melichar et
al., 2007).
It is still quite controversial in which extents do other less represented TCR dimers allow the
progression to the DP compartment and if they may also influence these αβ versus γδ T cell
commitment. Thymocytes lacking a functional pre-TCR undergo limited proliferation and fail to
silence TCRγ genes during development, which explains the vast presence of γδT cells in pTα-/-
mice (30-45% of all thymocytes) compared to a wt background (von Boehmer et al., 1997; Bosco
et al., 2006). Stimulation of pre-TCR-deficient immature thymocytes with anti-CD3 mAbs does
not directly down-regulate TCRγ transcription but restores TCRγ silencing following
proliferation (Ferrero et al., 2006). The TCRγ chain can associate with pTα and CD3ε proteins to
form a non-canonical pre-TCR, giving rise to DP cells, although TCRγ gene regulatory sequences
prevent the function of a novel TCRγ/pTα pre-TCR (Kang et al., 1998). Reciprocally, early
expression of TCRα proteins results in the formation of TCRαγ complexes that efficiently signal
the differentiation of DN into double-positive thymocytes independently of pre-TCR and TCRβ
expression (Erman et al., 2002). All these data illustrate how multifactorial and diverse the β-
selection process can be at the level of its potential receptors.
The DP thymocytes present in pTα-/- and DKO mice are known to be not fully committed to an
αβ or γδ lineage, as both DN3 and ISP (intermediate single positive) thymocytes can be partially
(re-)instructed to become αβ T cells (Blom et al., 1999). This bidirectional differentiation
capacity depends not only on microenvironmental stromal thymic factors but also on synergistic
effects caused by distinctly differentiated T cells subsets present at the same time in the thymus
15
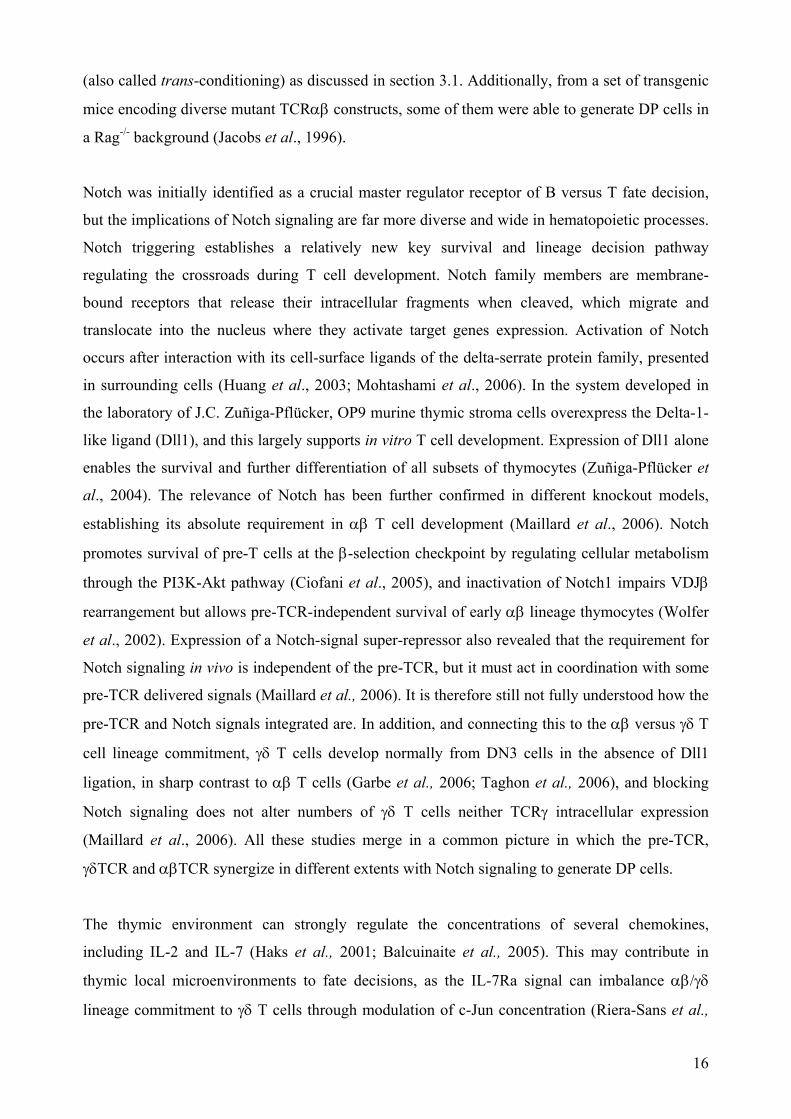
(also called trans-conditioning) as discussed in section 3.1. Additionally, from a set of transgenic
mice encoding diverse mutant TCRαβ constructs, some of them were able to generate DP cells in
a Rag-/- background (Jacobs et al., 1996).
Notch was initially identified as a crucial master regulator receptor of B versus T fate decision,
but the implications of Notch signaling are far more diverse and wide in hematopoietic processes.
Notch triggering establishes a relatively new key survival and lineage decision pathway
regulating the crossroads during T cell development. Notch family members are membrane-
bound receptors that release their intracellular fragments when cleaved, which migrate and
translocate into the nucleus where they activate target genes expression. Activation of Notch
occurs after interaction with its cell-surface ligands of the delta-serrate protein family, presented
in surrounding cells (Huang et al., 2003; Mohtashami et al., 2006). In the system developed in
the laboratory of J.C. Zuñiga-Pflücker, OP9 murine thymic stroma cells overexpress the Delta-1-
like ligand (Dll1), and this largely supports in vitro T cell development. Expression of Dll1 alone
enables the survival and further differentiation of all subsets of thymocytes (Zuñiga-Pflücker et
al., 2004). The relevance of Notch has been further confirmed in different knockout models,
establishing its absolute requirement in αβ T cell development (Maillard et al., 2006). Notch
promotes survival of pre-T cells at the β-selection checkpoint by regulating cellular metabolism
through the PI3K-Akt pathway (Ciofani et al., 2005), and inactivation of Notch1 impairs VDJβ
rearrangement but allows pre-TCR-independent survival of early αβ lineage thymocytes (Wolfer
et al., 2002). Expression of a Notch-signal super-repressor also revealed that the requirement for
Notch signaling in vivo is independent of the pre-TCR, but it must act in coordination with some
pre-TCR delivered signals (Maillard et al., 2006). It is therefore still not fully understood how the
pre-TCR and Notch signals integrated are. In addition, and connecting this to the αβ versus γδ T
cell lineage commitment, γδ T cells develop normally from DN3 cells in the absence of Dll1
ligation, in sharp contrast to αβ T cells (Garbe et al., 2006; Taghon et al., 2006), and blocking
Notch signaling does not alter numbers of γδ T cells neither TCRγ intracellular expression
(Maillard et al., 2006). All these studies merge in a common picture in which the pre-TCR,
γδTCR and αβTCR synergize in different extents with Notch signaling to generate DP cells.
The thymic environment can strongly regulate the concentrations of several chemokines,
including IL-2 and IL-7 (Haks et al., 2001; Balcuinaite et al., 2005). This may contribute in
thymic local microenvironments to fate decisions, as the IL-7Ra signal can imbalance αβ/γδ
lineage commitment to γδ T cells through modulation of c-Jun concentration (Riera-Sans et al.,
16

2007), while at the same time pre-TCR signaling can regulate IL-7Rα expression (Trigueros et
al., 2003; Hagenbeek et al., 2004), but being proliferation of DN3 itself independent of IL-7
(Balcuinaite et al., 2005).
17
2.4 Proteasomal activity during T-cell development Degradation of intracellular proteins is a tightly regulated process and is extremely relevant for
protein homeostasis, especially for regulatory proteins. A highly conserved and coordinated
enzymatic system links ubiquitin residues covalently to proteins in order to target them for
proteasomal degradation. The proteasome is a 26S ATP-dependent multicatalytic protease
responsible for 70 to 90% of nonlysosomal protein breakdowns both in cytosol and nucleus
(Ciechanover et al., 2005).
Correct function of the ubiquitin-proteasome machinery is critically involved in cellular
processes such as cell survival, cell cycle control, antigen processing, angiogenesis, removal of
nonreceptor kinases and cell adhesion as well as migration. Multiple immunological relevant
receptors like the TCR, BCR, TNFRs and CD40 lead to NF-κB activation (Palombella et al.,
1994; Grimm et al., 1996). The anti-apoptotic transcription factor NF-κB requires degradation of
its inhibitory proteins, so called IκBs, by the ubiquitin-proteasome pathway to translocate into the
nucleus and bind its target sequences. The 20S catalytic core of the proteasome is composed of
28 constitutive subunits which form outer and inner rings. The inner ring contains the β-type
subunits, being 3 of them catalytically active (Ciechanover et al., 2005). In addition, vertebrates
have three IFNγ-inducible β-subunits (LMP2, LMP7 and MECL) which are responsible of altered
peptidase specificities. This inducible 20S complex has received the name of
“Immunoproteasome” (Griffin et al., 1998).
The requirement of proteasomal activity has been so far strongly related to thymic development
only in the frame of MHC presentation processes (Callahan et al., 2006; Osterloh et al., 2006)
and regarding the degradation of improperly folded TCRα chains (Yu et al., 1997).
18
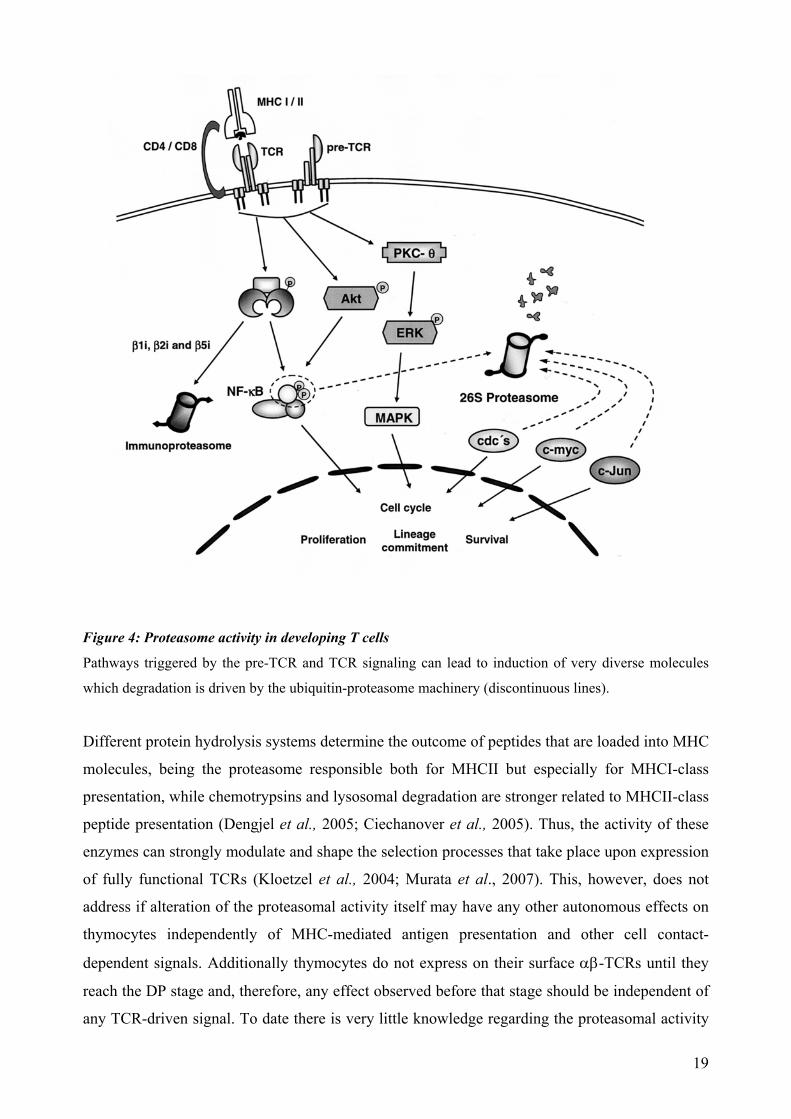
Figure 4: Proteasome activity in developing T cells Pathways triggered by the pre-TCR and TCR signaling can lead to induction of very diverse molecules
which degradation is driven by the ubiquitin-proteasome machinery (discontinuous lines).
Different protein hydrolysis systems determine the outcome of peptides that are loaded into MHC
molecules, being the proteasome responsible both for MHCII but especially for MHCI-class
presentation, while chemotrypsins and lysosomal degradation are stronger related to MHCII-class
peptide presentation (Dengjel et al., 2005; Ciechanover et al., 2005). Thus, the activity of these
enzymes can strongly modulate and shape the selection processes that take place upon expression
of fully functional TCRs (Kloetzel et al., 2004; Murata et al., 2007). This, however, does not
address if alteration of the proteasomal activity itself may have any other autonomous effects on
thymocytes independently of MHC-mediated antigen presentation and other cell contact-
dependent signals. Additionally thymocytes do not express on their surface αβ-TCRs until they
reach the DP stage and, therefore, any effect observed before that stage should be independent of
any TCR-driven signal. To date there is very little knowledge regarding the proteasomal activity
19
requirements during early thymocyte development. Apart from the receptors themselves and NF-
κB (Palombella et al., 1994), only cyclinD3, a key cell cycle regulator protein during early T cell
development, has been shown to depict a strong dependence on proteasome activity (Sicinska et
al., 2003).
Considering that caspase and proteasome activities constitute the two major enzymatic
protagonists during apoptosis, the degradation of most short-lived regulatory proteins is regulated
by the ubiquitin-proteasome pathway (Ciechanover et al., 2005). Proteasome activity is regulated
in all mammalian cells. Alteration of this activity configures a critical regulatory step as well
during thymocyte apoptosis (Grimm et al., 1996: Dallaporta et al,. 2000). However, most of the
current evidence is based on in vitro assays under strongly cell death-inducing conditions
(Dallaporta et al., 2000). Bortezomib is a dipeptidyl boronic acid derivative that represents the
only proteasome inhibitor in clinical use to date, and is a model drug which enables a highly
selective inhibition of the proteasome with minimal detrimental effects (Kaufman et al., 2002).
Selective induction of cell death mediated by proteasome inhibition has been well documented in
various human and murine malignancies, among them myeloma, ovarian cancers, leukemia,
along with T and B cell lymphomas (Satou et al., 2004; Servida et al., 2005; Henderson et al.,
2005), but also in primary non-malignant mature T cells (Blanco et al., 2006; Wang et al., 1998).
Proteasome inhibition is known as well to lead to a heat-shock response with induction of
endoplasmic reticulum chaperones (Bush et al, 1997) and to promote formation of the
immunoproteasome under heat shock conditions (Callahan et al., 2006). At the same time,
terminal caspases activation and both mitochondrial dependent and independent cell death
mechanisms have been extensively reported (Henderson et al., 2005).
The unfolded protein response (UPR) is triggered by the accumulation of misfolded proteins in
the endoplasmic reticulum (ER) lumen (Kaufman et al., 2002). This leads to increased synthesis
of chaperones, generally reduced protein biosynthesis and induction of anti-apoptotic factors,
thereby enabling cell survival (Ron et al., 2007). However, prolonged excessive ER overload,
which can be caused by proteasome inhibition, induces the terminal UPR resulting in apoptotic
cell death (Szegedzi et al., 2006; Meister et al., 2007). Survival can be favored during mild ER
stress as a consequence of the intrinsic instabilities of mRNAs and proteins that promote
apoptosis compared to those that facilitate protein folding and adaptation (Rutkowski et al.,
2006). Part of the selective cell death induced by proteasome inhibition is strongly dependent on
this triggering of the terminal UPR. This response, however, is not supposed to account for
apoptosis induction during normal T cell development, but may be triggered under abnormal
20
situations, as when lacking time-framed appropriate survival proteins balance delivered by pre-
TCR or TCR pairing chains. Very recently, a thymic-specific subunit of the immunoproteasome
(β5t) has been identified which has profound implications for selection of CD8+ cells (Murata et
al., 2007). This matches with the predominant role of the proteasome during MHCI class antigen
presentation.
The relevance of proteasome activity during early stages of thymocyte development is largely
unknown, and its interdependence with the pre-TCR and TCR signaling events during maturation
of T cells has been only slightly addressed so far.
21
3. Hypothesis
In the case of productive TCRβ gene rearrangement, a pre-TCR consisting of a TCRβ and the
constitutively expressed pTα chain can be formed, and induces calcium flux, NF-κB, and NFAT
activation, eventually resulting in survival and further differentiation into DP αβ-T cells. The
presence and relevance of TCRβ surface expression on thymocytes lacking a pairing pTα and/or
TCRα chain are still unresolved questions. If thymic cells cannot form a classical pre-TCR, they
suffer a strong but incomplete blockade at the DN3 to DN4 transition (β-selection). However,
there is a consistent leakage of cells which overcome this survival checkpoint and progress to the
DP and single positive (SP) stages and can even constitute mature peripheral T cells. The
mechanisms underlying this unconventional survival are not yet completely understood. Only in
TCRβ-/- x TCRδ-/- and Rag-/- mutant mice there is a complete lack of DP thymocytes. These
findings indicate that signals originating from other receptors than the classical pre-TCR can
mediate survival and further development of thymocytes in pTα-/- and pTα-/- x TCRα-/- mice.
We hypothesize that expression of the TCRβ chain by itself can lead to the formation of a TCRβ
complex on the cell surface mediating NF-κB activation and β-selection. This signaling-
competent TCRβ-only complex may promote thymocytes from the DN to the DP stage. Signals
derived from such a receptor may simultaneously influence αβ versus γδ T-cell lineage
commitment.
During thymocyte development there are two very discrete survival checkpoints: β-selection at
the DN3 to DN4 transition, which involves activation of NF-κB mediating cell survival, and
MHC/antigen-driven selection (DP to SP transition). The ubiquitin-proteasome system is the
main machinery responsible of protein degradation in the cell. NF-κB activation depends
critically on the proteasome-dependent degradation of its inhibitor protein IκB. Also,
proteasomes generate the peptides for presentation in MHC molecules, especially MHC class I
molecules.
Therefore, we hypothesized that disruption of proteasomal function through proteasome
inhibitors may preferentially impair thymocyte development at the β-selection checkpoint due to
inhibition of NF-κB and at stage of positive/negative selection due to impaired peptide generation
of MHC loading as well as additional ER-stress and UPR-mediated modulation of pro- and anti-
apoptotic factors.
22
4. Results The signaling capacity and implications of receptors that regulate the β-selection process is
absolutely crucial in regulating the survival of developing T cells. Various phenotypic
observations during thymocyte development of mice lacking pTα and TCRα proteins cannot be
currently explained and have not been experimentally addressed yet.
The presence and regulation of the TCRβ chain surface and intracellular expression during the
early stages of murine thymic development when a classical pre-TCR is absent are depicted in the
first chapter of the results.
The second part deals with the signal delivering capacity of the identified receptor. In the absence
of regular pTα and/or TCRα chains, we illustrate how an irregular β-checkpoint signal can be
triggered. We depict some concise proximal and distal signalization events induced by
stimulation of this non-canonical pre-TCR.
This non-classical checkpoint regulates not only the DN3 to DN4 transition, but it also
constraints the potential of those thymocytes. Signaling during β-selection has further
implications regarding progression to the DP compartment and commitment to the αβ-T cell
lineage, which is showed in chapter 3.
Regulation of the activity of the ubiquitin-proteasome machinery during early stages of T cell
development is largely unknown, and thus the role of proteasomal protein degradation in
modulating thymocyte survival. How receptor signals delivered during β-selection and
proteasomal activity are interconnected is depicted in the last chapter of the results.
23
4.1 Expression of the TCRβ-chain in immature thymocytes lacking a
classical pre-TCR.
The absence of a pTα chain pairing with the TCRβ chain at the DN3 stage and throughout β-
selection has a dramatic effect which results in a very strong arrest at the transition from DN3 to
DN4 stages of thymocyte development. This block is not drastic but incomplete, and there are
constitutive numbers of cells at the DP stage of maturation in mice with pTα-/- and pTα-/- x
TCRα-/- mice. This implies that those surviving cells must evade at least temporally the apoptosis
induction that the rest of thymocytes which did not properly rearranged their TCRβ genes suffer,
and at the same time overcome the developmental arrest imposed by the lack of a classical pre-
TCR signal. Escaping thymocytes under these circumstances must receive another non-classical
signal delivered from a TCR receptor that although with very low efficiency, allows them to
survive and promote to further developmental stages. Transport of the pre-TCR to the surface
during those stages is mandatory to achieve signaling capacity.
4.1.1 The TCRβ chain can be detected on the surface of DN thymocytes in the
absence of pairing pTα and TCRα chains.
In order to confirm the presence of a receptor configured by β-chain proteins in DN thymocyte
membranes, we isolated different thymocyte subsets lacking either the pTα or both the pTα and
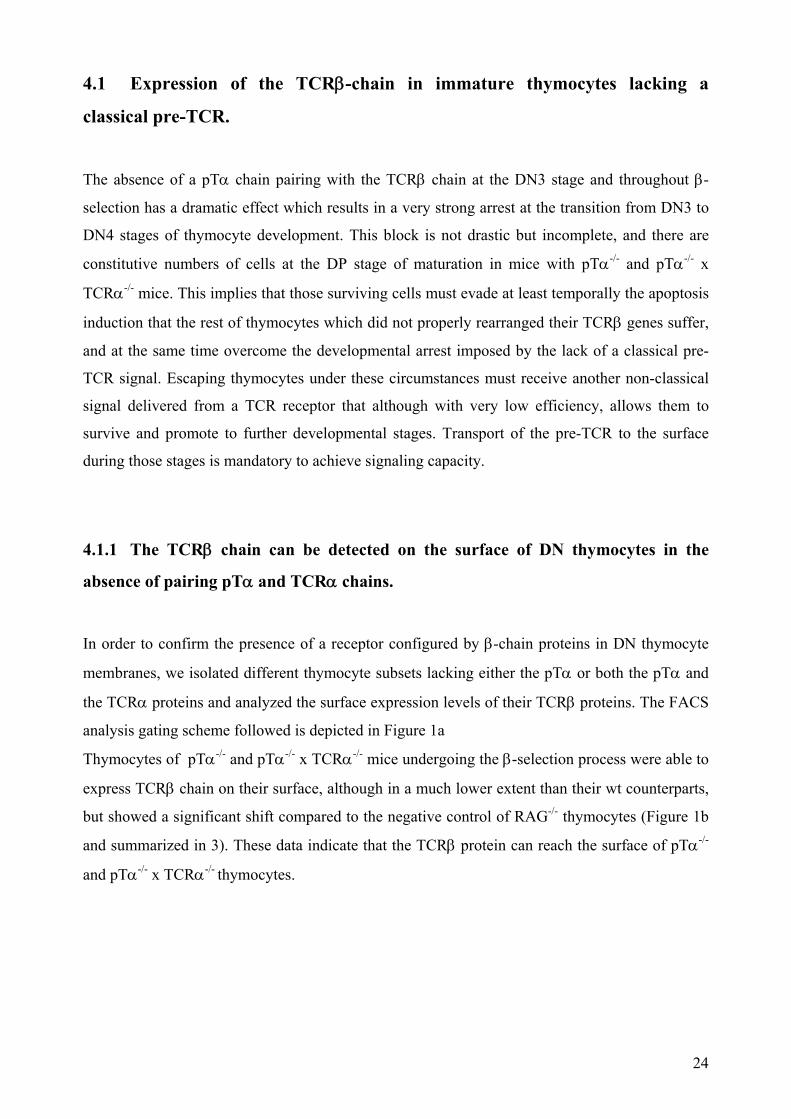
the TCRα proteins and analyzed the surface expression levels of their TCRβ proteins. The FACS
analysis gating scheme followed is depicted in Figure 1a
Thymocytes of pTα-/- and pTα-/- x TCRα-/- mice undergoing the β-selection process were able to
express TCRβ chain on their surface, although in a much lower extent than their wt counterparts,
but showed a significant shift compared to the negative control of RAG-/- thymocytes (Figure 1b
and summarized in 3). These data indicate that the TCRβ protein can reach the surface of pTα-/-
and pTα-/- x TCRα-/- thymocytes.
24
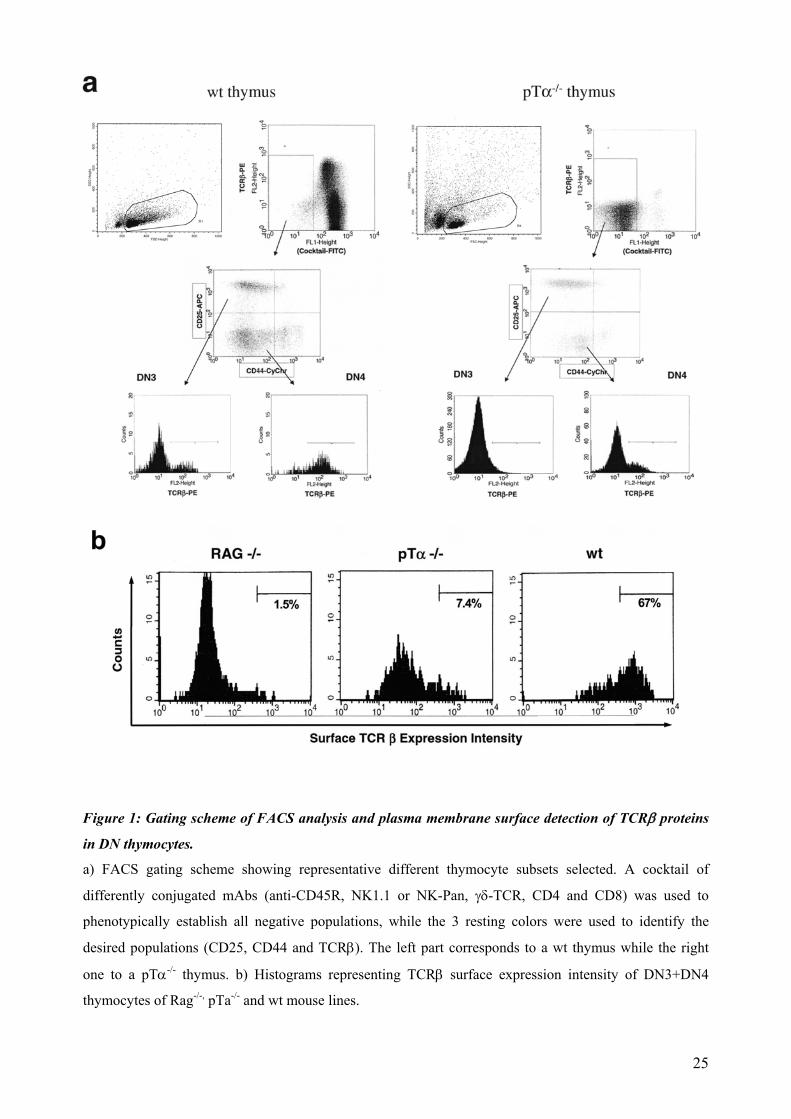
Figure 1: Gating scheme of FACS analysis and plasma membrane surface detection of TCRβ proteins
in DN thymocytes.
a) FACS gating scheme showing representative different thymocyte subsets selected. A cocktail of
differently conjugated mAbs (anti-CD45R, NK1.1 or NK-Pan, γδ-TCR, CD4 and CD8) was used to
phenotypically establish all negative populations, while the 3 resting colors were used to identify the
desired populations (CD25, CD44 and TCRβ). The left part corresponds to a wt thymus while the right
one to a pTα-/- thymus. b) Histograms representing TCRβ surface expression intensity of DN3+DN4
thymocytes of Rag-/-, pTa-/- and wt mouse lines.
25
4.1.2 Transition from the DN3 to DN4 stages in pTα-/- and pTα-/- x TCRα-/-
thymocytes.
Absolute numbers of the DN4 cell subsets differed in the pTα-/- and pTα-/- x TCRα-/- mice. The
percentage of DN3 cells was in all cases very similar. Interestingly, the ratio of DN4 to DN3 cells
is almost the same in wt and DKO, whereas in the pTα-/- mice it drops strongly (Figure 2). This
fact may indicate that in pTα-/- mice, the presence of premature TCRαβ could impair the DN3 to
DN4 transition, as this is the only difference between the two knockout models at that exact
developmental point. In any case, it denotes a difference in the effectiveness in surpassing the β-
selection checkpoint between both knockout models.
Figure 2: Absolute cell numbers and ratio of DN3 and DN4 thymocyte populations.
a) Proportion of identified DN3 and DN4 subpopulations in wt, pTα-/- and pTα-/- x TCRα-/- mice. b) The
calculated DN4:DN3 ratio is an indicator of the β-selection efficiency. n = 20.
4.1.3 Expression of the TCRβ chain protein in absence of pTα and TCRα chain
proteins.
Although expression of a surface TCR is mandatory, this is not enough for proper signaling at the
pre-TCR checkpoint. The pre-TCR complex undergoes unique intracellular traffic migration
processes, and internalization of the pre-TCR appears to be required for further development of
pre-T cells (Yamasaki et al., 2006). It could be hypothesized that the DN3 and especially the
DN4 thymocytes of pTα-/- and pTα-/- x TCRα-/- mice may strongly alter the transcriptional or
26
even translational capacities of the cell to regulate TCRβ protein expression in a feedback
manner.
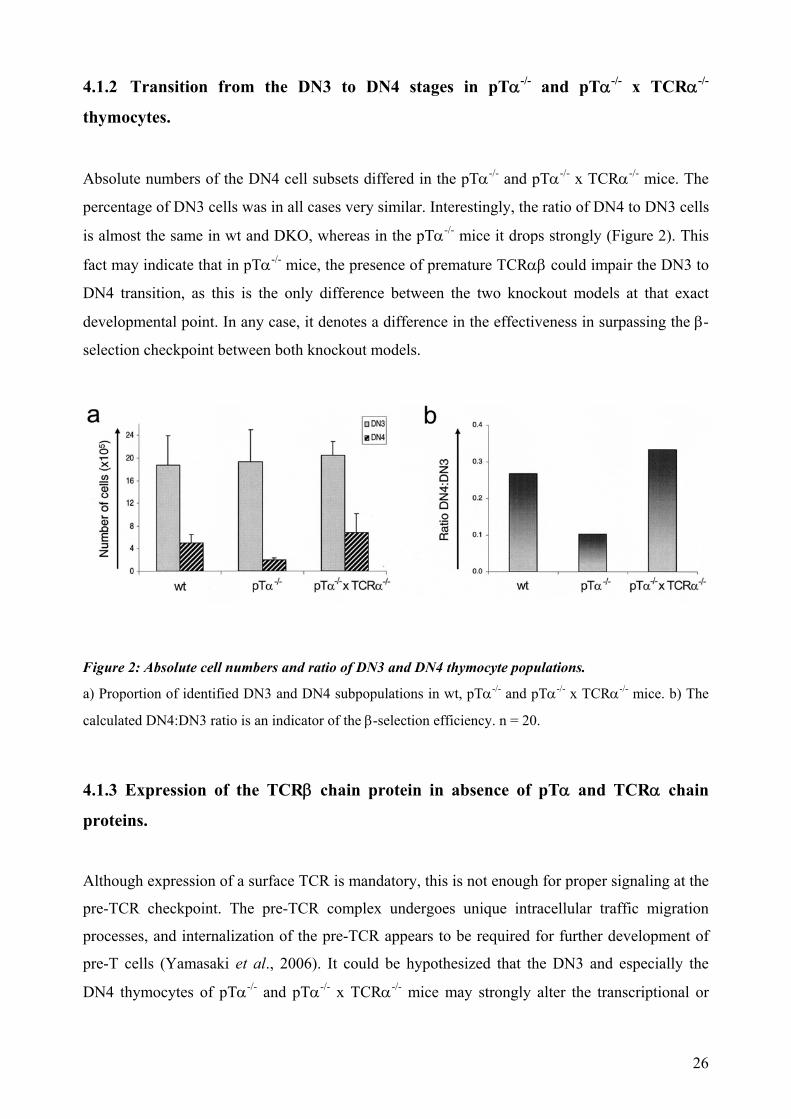
DN3 and DN4 thymocytes lacking pTα or pTα and TCRα express markedly reduced levels of
intracellular TCRβ proteins, but these levels are consistently present (Figure 3). What is more
important, at the transition from DN3 to DN4, the percentage of cells expressing intracellular
TCRβ proteins did rise in approximately 4-fold, which is a proportion of increase very similar to
wt thymocytes. This demonstrates that those cells that overcome the pre-TCR checkpoint without
a pTα and/or a TCRα achieve regulation of their TCRβ protein concentrations with similar
efficiency as in the presence of a regular pre-TCR.
igure 3: Surface and intracellular expression of TCRβ proteins in pTα-/-, pTα-/- x TCRα-/- and Rag2 -/-
tage of surface (left) and intracellular (right) TCRβ protein expressing thymocytes in DN3 and DN4
F
mice.
Percen
subpopulations of the indicated mice. Data shown are representative of 3 experiments. n= 4, P < 0.05 in a
two-tails Student´s T-test for unpaired heterostochastic samples.
27
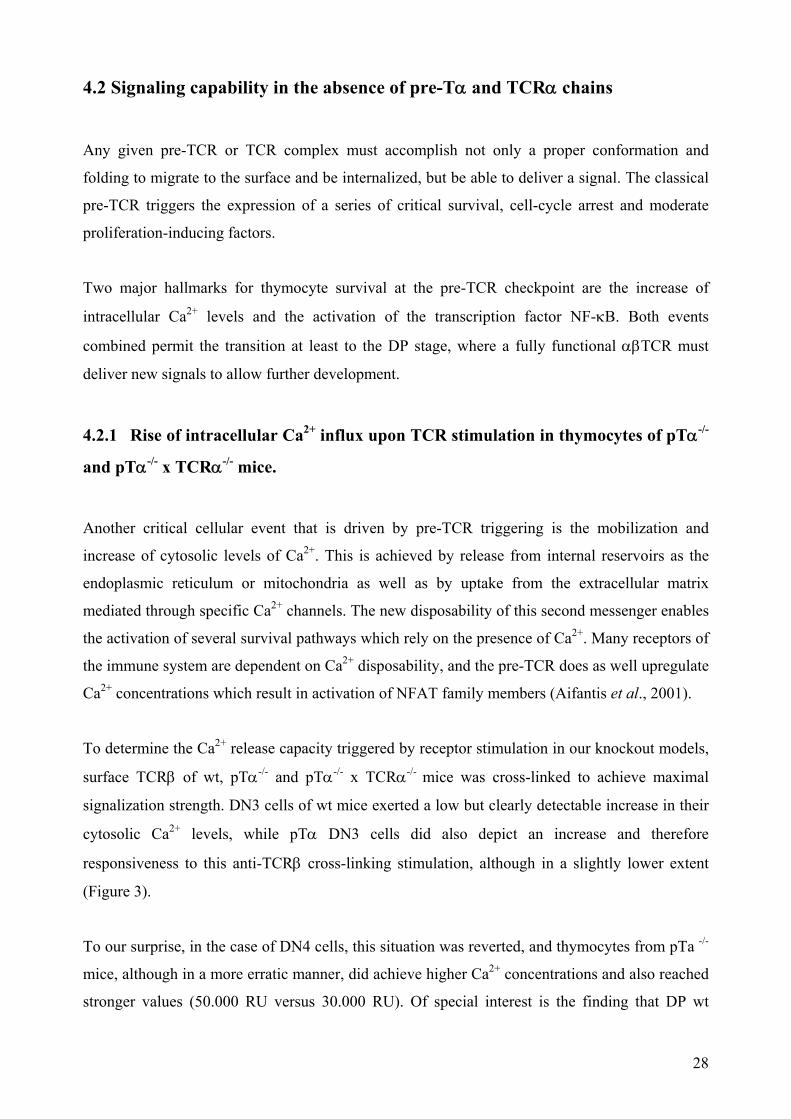
4.2 Signaling capability in the absence of pre-Tα and TCRα chains
Any given pre-TCR or TCR complex must accomplish not only a proper conformation and
folding to migrate to the surface and be internalized, but be able to deliver a signal. The classical
pre-TCR triggers the expression of a series of critical survival, cell-cycle arrest and moderate
proliferation-inducing factors.
Two major hallmarks for thymocyte survival at the pre-TCR checkpoint are the increase of
intracellular Ca2+ levels and the activation of the transcription factor NF-κB. Both events
combined permit the transition at least to the DP stage, where a fully functional αβTCR must
deliver new signals to allow further development.
4.2.1 Rise of intracellular Ca2+ influx upon TCR stimulation in thymocytes of pTα-/-
and pTα-/- x TCRα-/- mice.
Another critical cellular event that is driven by pre-TCR triggering is the mobilization and
increase of cytosolic levels of Ca2+. This is achieved by release from internal reservoirs as the
endoplasmic reticulum or mitochondria as well as by uptake from the extracellular matrix
mediated through specific Ca2+ channels. The new disposability of this second messenger enables
the activation of several survival pathways which rely on the presence of Ca2+. Many receptors of
the immune system are dependent on Ca2+ disposability, and the pre-TCR does as well upregulate
Ca2+ concentrations which result in activation of NFAT family members (Aifantis et al., 2001).
To determine the Ca2+ release capacity triggered by receptor stimulation in our knockout models,
surface TCRβ of wt, pTα-/- and pTα-/- x TCRα-/- mice was cross-linked to achieve maximal
signalization strength. DN3 cells of wt mice exerted a low but clearly detectable increase in their
cytosolic Ca2+ levels, while pTα DN3 cells did also depict an increase and therefore
responsiveness to this anti-TCRβ cross-linking stimulation, although in a slightly lower extent
(Figure 3).
To our surprise, in the case of DN4 cells, this situation was reverted, and thymocytes from pTa -/-
mice, although in a more erratic manner, did achieve higher Ca2+ concentrations and also reached
stronger values (50.000 RU versus 30.000 RU). Of special interest is the finding that DP wt
28
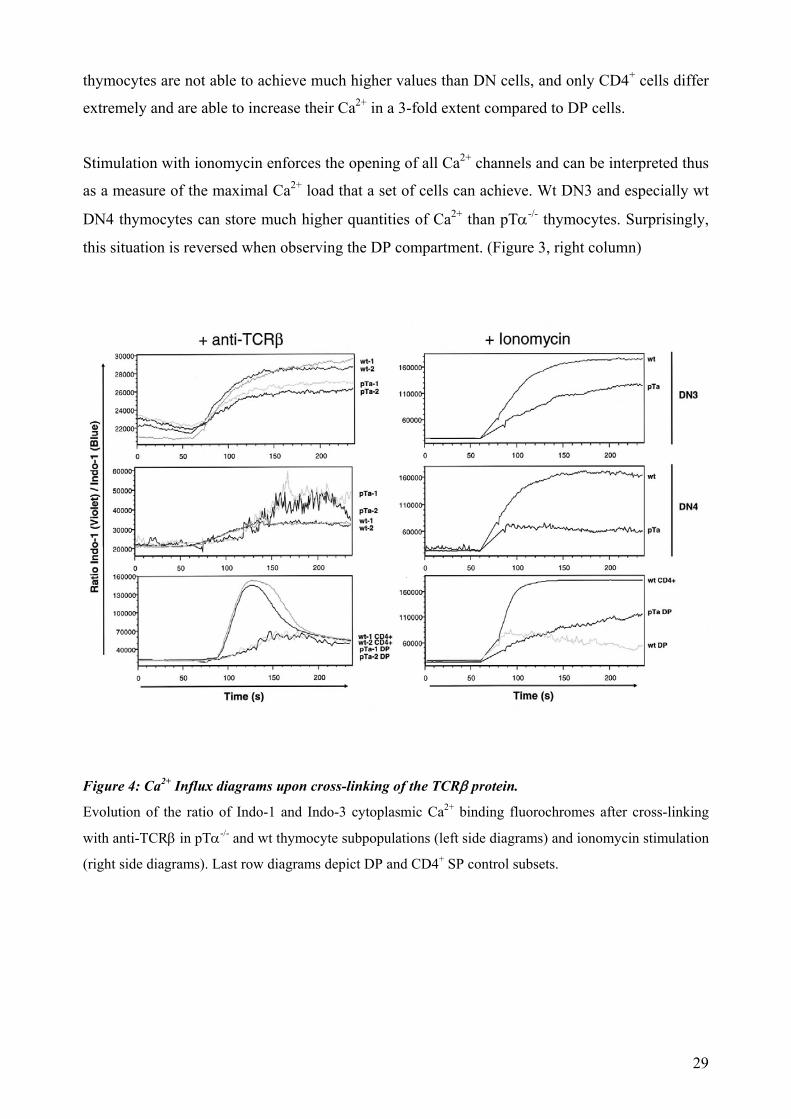
thymocytes are not able to achieve much higher values than DN cells, and only CD4+ cells differ
extremely and are able to increase their Ca2+ in a 3-fold extent compared to DP cells.
Stimulation with ionomycin enforces the opening of all Ca2+ channels and can be interpreted thus
as a measure of the maximal Ca2+ load that a set of cells can achieve. Wt DN3 and especially wt
DN4 thymocytes can store much higher quantities of Ca2+ than pTα-/- thymocytes. Surprisingly,
this situation is reversed when observing the DP compartment. (Figure 3, right column)
Figure 4: Ca2+ Influx diagrams upon cross-linking of the TCRβ protein.
Evolution of the ratio of Indo-1 and Indo-3 cytoplasmic Ca2+ binding fluorochromes after cross-linking
with anti-TCRβ in pTα-/- and wt thymocyte subpopulations (left side diagrams) and ionomycin stimulation
(right side diagrams). Last row diagrams depict DP and CD4+ SP control subsets.
29
4.2.2 NF-κB DNA-binding activity in thymic subsets of pTα-/- and pTα-/- x TCRα-/-
mice.
Sorted thymocytes of wt, pTα-/- and pTα-/- x TCRα-/- subsets were analysed by an EMSA assay.
Nuclear and cytoplasmic extracts were obtained from 5x10⁵ or 1x10⁶ sorted thymocytes. Equal
protein amounts of nuclear extracts were loaded in an EMSA gel.
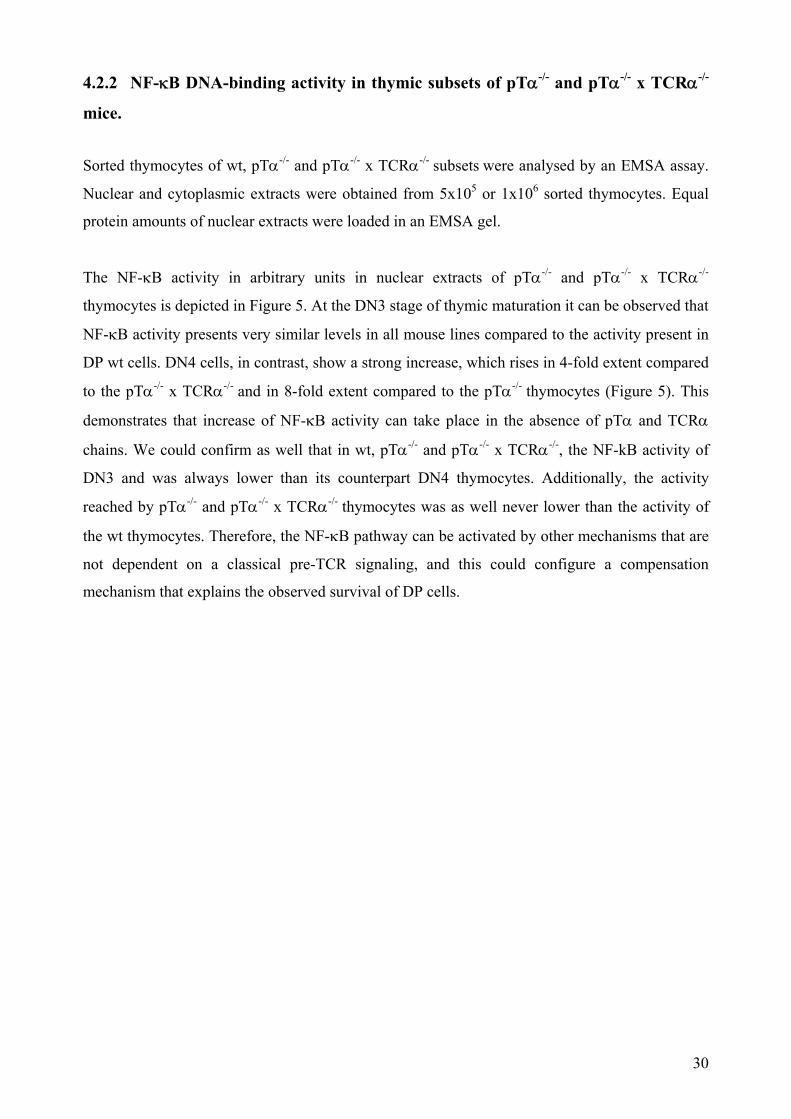
The NF-κB activity in arbitrary units in nuclear extracts of pTα-/- and pTα-/- x TCRα-/-
thymocytes is depicted in Figure 5. At the DN3 stage of thymic maturation it can be observed that
NF-κB activity presents very similar levels in all mouse lines compared to the activity present in
DP wt cells. DN4 cells, in contrast, show a strong increase, which rises in 4-fold extent compared
to the pTα-/- x TCRα-/- and in 8-fold extent compared to the pTα-/- thymocytes (Figure 5). This
demonstrates that increase of NF-κB activity can take place in the absence of pTα and TCRα
chains. We could confirm as well that in wt, pTα-/- and pTα-/- x TCRα-/-, the NF-kB activity of
DN3 and was always lower than its counterpart DN4 thymocytes. Additionally, the activity
reached by pTα-/- and pTα-/- x TCRα-/- thymocytes was as well never lower than the activity of
the wt thymocytes. Therefore, the NF-κB pathway can be activated by other mechanisms that are
not dependent on a classical pre-TCR signaling, and this could configure a compensation
mechanism that explains the observed survival of DP cells.
30
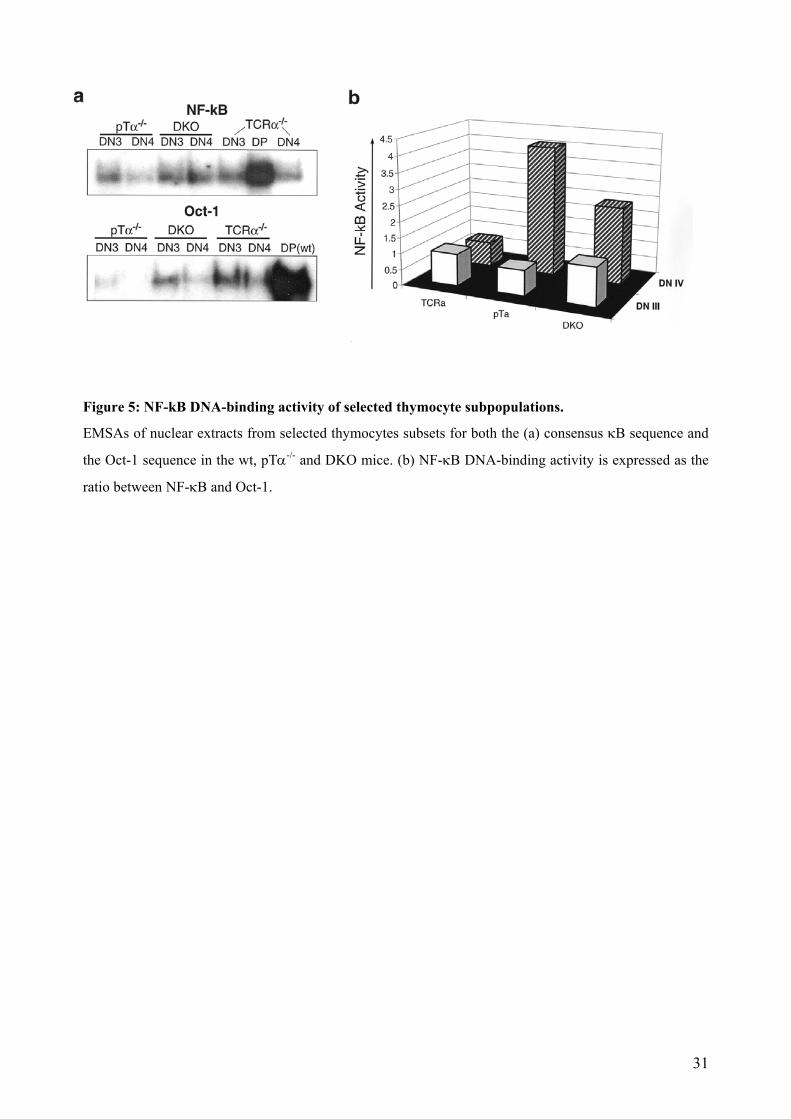
Figure 5: NF-kB DNA-binding activity of selected thymocyte subpopulations.
EMSAs of nuclear extracts from selected thymocytes subsets for both the (a) consensus κB sequence and
the Oct-1 sequence in the wt, pTα-/- and DKO mice. (b) NF-κB DNA-binding activity is expressed as the
ratio between NF-κB and Oct-1.
31
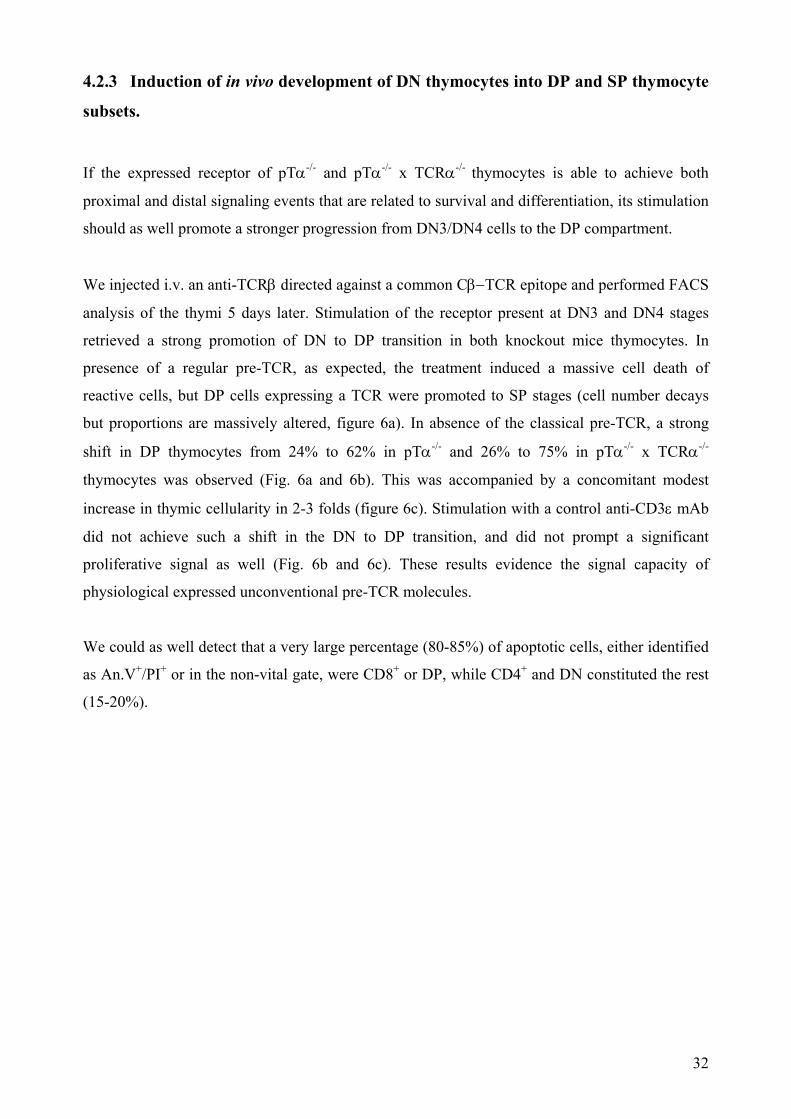
4.2.3 Induction of in vivo development of DN thymocytes into DP and SP thymocyte
subsets.
If the expressed receptor of pTα-/- and pTα-/- x TCRα-/- thymocytes is able to achieve both
proximal and distal signaling events that are related to survival and differentiation, its stimulation
should as well promote a stronger progression from DN3/DN4 cells to the DP compartment.
We injected i.v. an anti-TCRβ directed against a common Cβ−TCR epitope and performed FACS
analysis of the thymi 5 days later. Stimulation of the receptor present at DN3 and DN4 stages
retrieved a strong promotion of DN to DP transition in both knockout mice thymocytes. In
presence of a regular pre-TCR, as expected, the treatment induced a massive cell death of
reactive cells, but DP cells expressing a TCR were promoted to SP stages (cell number decays
but proportions are massively altered, figure 6a). In absence of the classical pre-TCR, a strong
shift in DP thymocytes from 24% to 62% in pTα-/- and 26% to 75% in pTα-/- x TCRα-/-
thymocytes was observed (Fig. 6a and 6b). This was accompanied by a concomitant modest
increase in thymic cellularity in 2-3 folds (figure 6c). Stimulation with a control anti-CD3ε mAb
did not achieve such a shift in the DN to DP transition, and did not prompt a significant
proliferative signal as well (Fig. 6b and 6c). These results evidence the signal capacity of
physiological expressed unconventional pre-TCR molecules.
We could as well detect that a very large percentage (80-85%) of apoptotic cells, either identified
as An.V+/PI+ or in the non-vital gate, were CD8+ or DP, while CD4+ and DN constituted the rest
(15-20%).
32
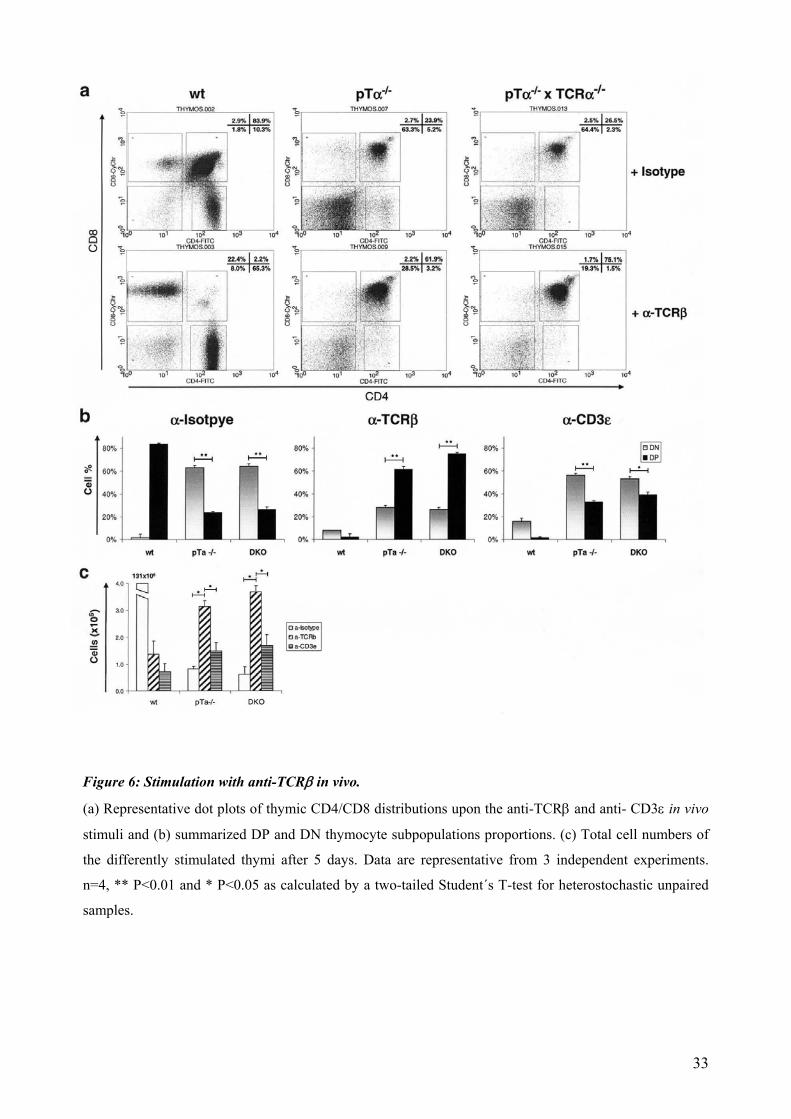
Figure 6: Stimulation with anti-TCRβ in vivo.
(a) Representative dot plots of thymic CD4/CD8 distributions upon the anti-TCRβ and anti- CD3ε in vivo
stimuli and (b) summarized DP and DN thymocyte subpopulations proportions. (c) Total cell numbers of
the differently stimulated thymi after 5 days. Data are representative from 3 independent experiments.
n=4, ** P<0.01 and * P<0.05 as calculated by a two-tailed Student´s T-test for heterostochastic unpaired
samples.
33
4.3 Developmental potential of TCRβ-only cells
We have defined that pre-T cells can express on their surface a β-chain-only based TCR without
pairing pTα or TCRα chains, and have demonstrated that this β-TCR is able to deliver a TCR-
like signal. Next, we addressed the question whether such receptors can confer the pre-T cells
with the potency not only to survive till DP stages but to support the generation of functional
mature T cells.
4.3.1 In vitro development of pTα-/- and pTα-/- x TCRα-/- thymocytes in the OP9-
Dll1 murine stroma cells coculture system.
The OP9-Dll1 stroma cell coculture system enables in-vitro T cell development which largely
mimics in vivo maturation of T cells and can render mature functional SP T cells from very early
thymocyte precursors or even hematopoietic stem cells (HSCs).
We therefore pursued if immature T cells of pTα-/- and pTα-/- x TCRα-/- mice were able as well to
give rise to DP and SP cells. We isolated 2x10⁵ DN3 and 5x10⁴ DN4 cells from wt, pTα-/- and
pTα-/- x TCRα-/- and TCRβ-/- x TCRδ-/- mice and cocultured them with freshly confluent OP9-
Dll1 on 6-well plates for 5 days. As expected, in the presence of the pre-TCR there was much
higher survival rate, proliferation and further differentiation than in its absence (Figure 7).
Supporting also the above mentioned data, at the time of analysis, DN4 cells reached further
differentiated stages, although they proliferated less and wer more prone to enter cell death in a
longer term (2 weeks). Both pTα-/- and pTα-/- x TCRα-/- DN3 and DN4 thymocytes (as in the in
vivo anti-TCRβ stimulation situation) were much less efficient in promoting survival,
proliferation or further differentiation. After 2 weeks in coculture, only 5-10% of those
thymocytes survived, and those who did were predominantly phenotypically characterized as DN
thymocytes. However, compared to the TCRβ-/- x TCRδ-/- controls, a significant percent of
thymocytes achieved a small progress to the DP compartment during the first week in culture
(Figure 7). This indicates that both DN3 and DN4 surviving cells populations of pTα-/- and pTα-/-
x TCRα-/- origin retain their potential to develop to the DP compartment upon Notch-receptor
stimulation without an evident TCR-delivered signal.
34
Regarding the predisposition to undergo cell death, DP and CD8 SP cells were always much
more prone to enter apoptosis, constituting around 80% of all dying cells after 5 days of
coculture. (Not shown).
Presence or absence of Notch stimulation did alter more the proliferative than the differentiation
capacities of wt DN3 cells. DN3 and DN4 cells can both progress to DP, but DN3 cells retain a
stronger capacity to proliferate while they are less promoted to DP cells when a regular pre-TCR
is present. At the same time, only 20-30% of all cells still survive if Notch signal is absent, while
in its presence, survival rates of DN3 and DN4 cells reach 90% of wt but drop to 40-60% in pTα-
/- and pTα-/- x TCRα-/- thymocytes (Figure 8d). An.V surface staining also revealed much higher
numbers of apoptotic cells in the absence of Notch signal, as expected.
Figure 7: Thymocyte coculture in OP9-Dll1 stroma cells.
Flow cytometry dot plot analysis illustrating DN3 (upper row) and DN4 thymocytes (lower row) of wt,
pTα- and pTαxTCRα-deficient mice after 5 days of coculture with OP9-Dll1 stroma cells. Total numbers
of living cells by the time of acquisition are indicated above each diagram.
35
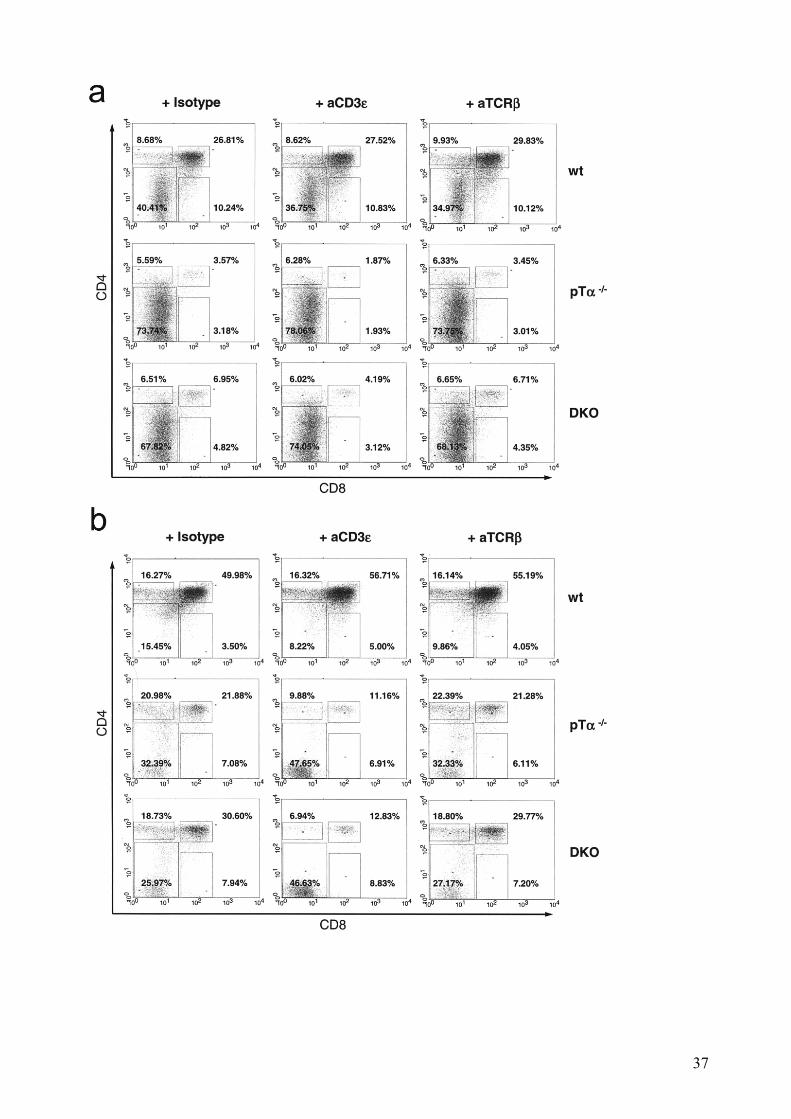
We next investigated if we could reproduce the promotion to DP stage we observed in vivo upon
stimulation of the TCR. We repeated the same OP9-Dll1 coculture experimental setting but in the
presence or absence of anti-TCRβ mAb. However, after 5 days of coculture we were unable to
identify any significant difference among the DN3 (Figure 8a) and DN4 (Figure 8b)
subpopulations of either treated or untreated thymocytes of wt and mutant mice. These results
indicate that TCR stimulation cannot induce promotion of DN to DP stages under saturating
Notch signaling conditions in vitro, probably due to missing signals which are provided in the
thymus.
Treatment with anti-CD3ε mAb impaired the progression to DP in the absence of canonical pre-
TCR (Figure 8c), which was especially obvious in the DN4 cocultures. This denotes a selective
increased sensitivity to TCR-induced cell death of thymocytes that already reached the DN4
compartment when they lack a regular pre-TCR if the signal strength is high.
36
37
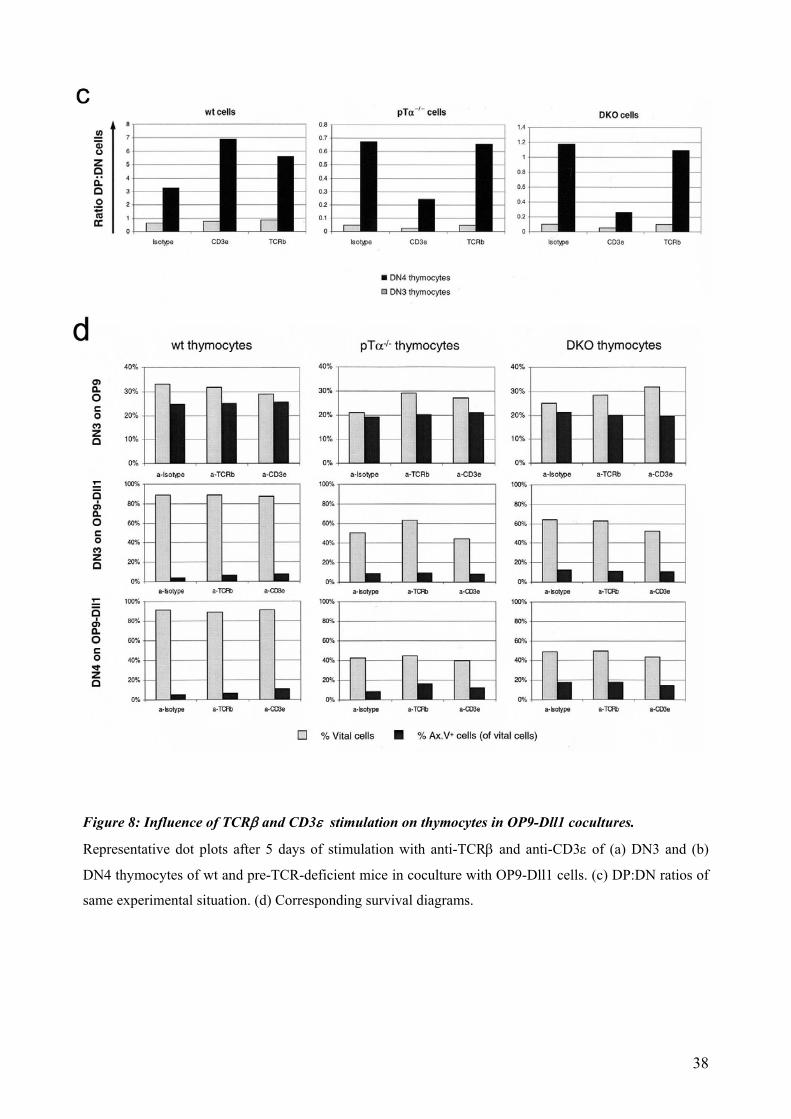
Figure 8: Influence of TCRβ and CD3ε stimulation on thymocytes in OP9-Dll1 cocultures.
Representative dot plots after 5 days of stimulation with anti-TCRβ and anti-CD3ε of (a) DN3 and (b)
DN4 thymocytes of wt and pre-TCR-deficient mice in coculture with OP9-Dll1 cells. (c) DP:DN ratios of
same experimental situation. (d) Corresponding survival diagrams.
38
4.3.2 Promotion of DN thymocytes to DP and SP stages and commitment to the αβ
T-cell lineage.
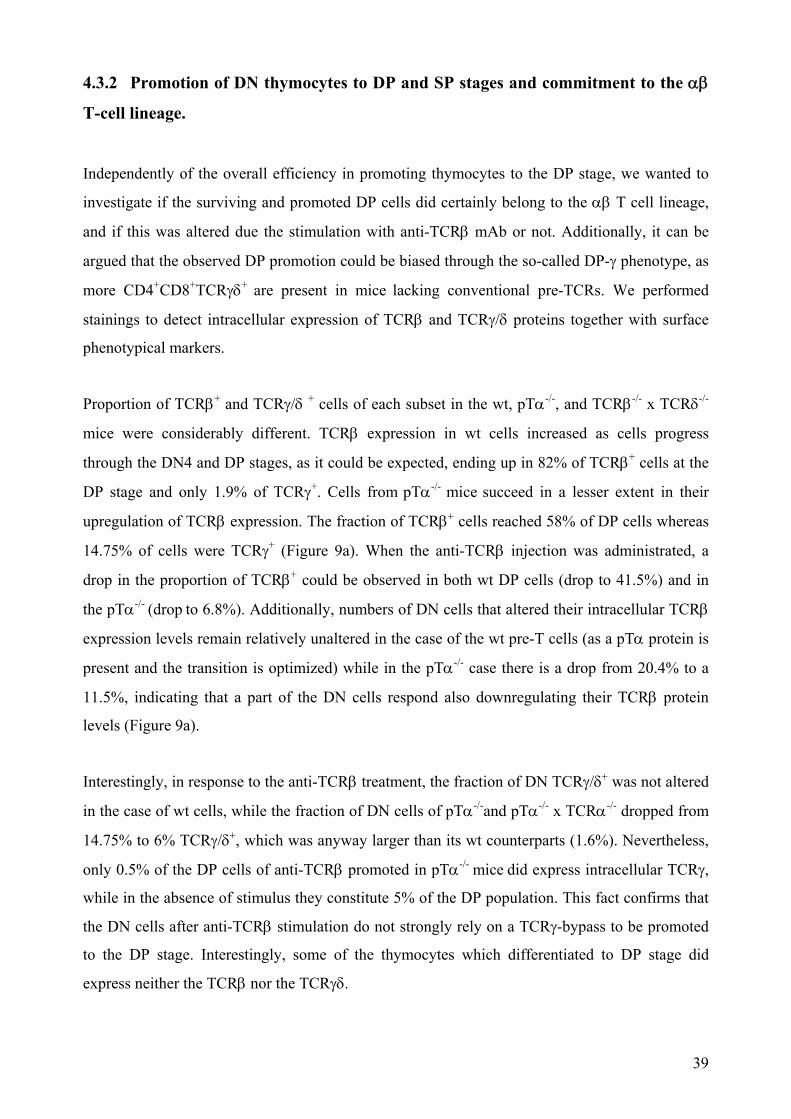
Independently of the overall efficiency in promoting thymocytes to the DP stage, we wanted to
investigate if the surviving and promoted DP cells did certainly belong to the αβ T cell lineage,
and if this was altered due the stimulation with anti-TCRβ mAb or not. Additionally, it can be
argued that the observed DP promotion could be biased through the so-called DP-γ phenotype, as
more CD4+CD8+TCRγδ+ are present in mice lacking conventional pre-TCRs. We performed
stainings to detect intracellular expression of TCRβ and TCRγ/δ proteins together with surface
phenotypical markers.
Proportion of TCRβ+ and TCRγ/δ + cells of each subset in the wt, pTα-/-, and TCRβ-/- x TCRδ-/-
mice were considerably different. TCRβ expression in wt cells increased as cells progress
through the DN4 and DP stages, as it could be expected, ending up in 82% of TCRβ+ cells at the
DP stage and only 1.9% of TCRγ+. Cells from pTα-/- mice succeed in a lesser extent in their
upregulation of TCRβ expression. The fraction of TCRβ+ cells reached 58% of DP cells whereas
14.75% of cells were TCRγ+ (Figure 9a). When the anti-TCRβ injection was administrated, a
drop in the proportion of TCRβ+ could be observed in both wt DP cells (drop to 41.5%) and in
the pTα-/- (drop to 6.8%). Additionally, numbers of DN cells that altered their intracellular TCRβ
expression levels remain relatively unaltered in the case of the wt pre-T cells (as a pTα protein is
present and the transition is optimized) while in the pTα-/- case there is a drop from 20.4% to a
11.5%, indicating that a part of the DN cells respond also downregulating their TCRβ protein
levels (Figure 9a).
Interestingly, in response to the anti-TCRβ treatment, the fraction of DN TCRγ/δ+ was not altered
in the case of wt cells, while the fraction of DN cells of pTα-/-and pTα-/- x TCRα-/- dropped from
14.75% to 6% TCRγ/δ+, which was anyway larger than its wt counterparts (1.6%). Nevertheless,
only 0.5% of the DP cells of anti-TCRβ promoted in pTα-/- mice did express intracellular TCRγ,
while in the absence of stimulus they constitute 5% of the DP population. This fact confirms that
the DN cells after anti-TCRβ stimulation do not strongly rely on a TCRγ-bypass to be promoted
to the DP stage. Interestingly, some of the thymocytes which differentiated to DP stage did
express neither the TCRβ nor the TCRγδ.
39
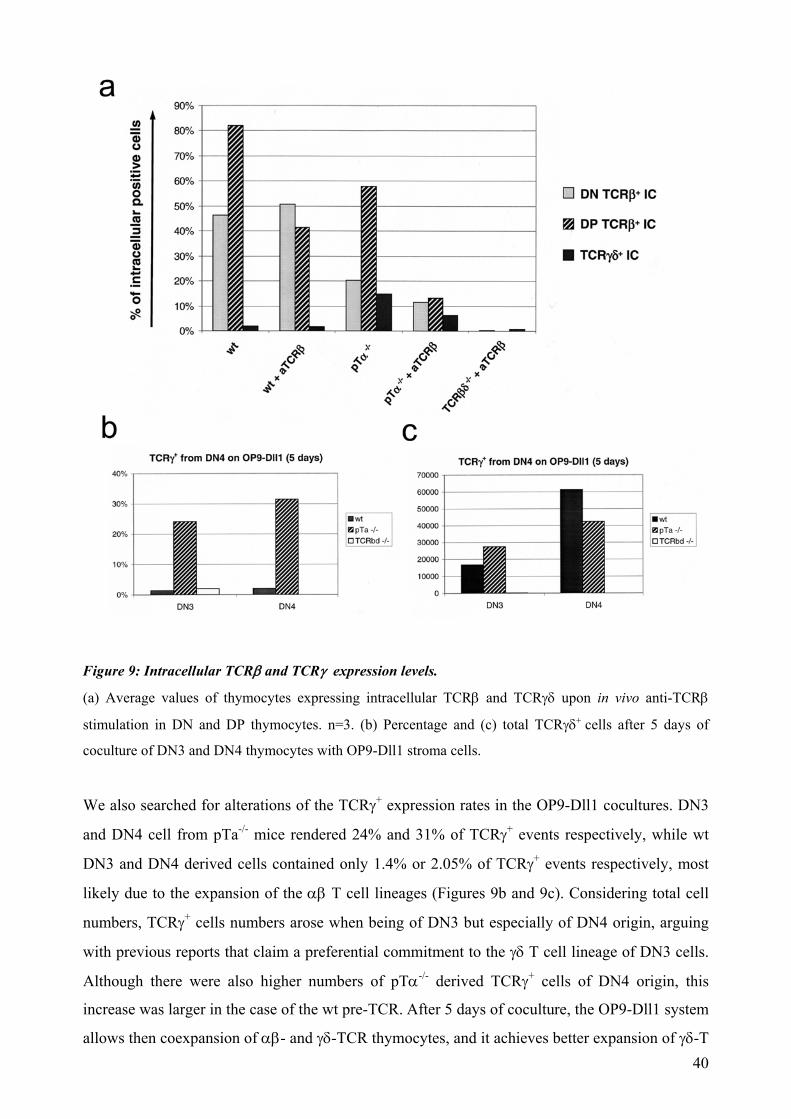
Figure 9: Intracellular TCRβ and TCRγ expression levels.
(a) Average values of thymocytes expressing intracellular TCRβ and TCRγδ upon in vivo anti-TCRβ
stimulation in DN and DP thymocytes. n=3. (b) Percentage and (c) total TCRγδ+ cells after 5 days of
coculture of DN3 and DN4 thymocytes with OP9-Dll1 stroma cells.
We also searched for alterations of the TCRγ+ expression rates in the OP9-Dll1 cocultures. DN3
and DN4 cell from pTa-/- mice rendered 24% and 31% of TCRγ+ events respectively, while wt
DN3 and DN4 derived cells contained only 1.4% or 2.05% of TCRγ+ events respectively, most
likely due to the expansion of the αβ T cell lineages (Figures 9b and 9c). Considering total cell
numbers, TCRγ+ cells numbers arose when being of DN3 but especially of DN4 origin, arguing
with previous reports that claim a preferential commitment to the γδ T cell lineage of DN3 cells.
Although there were also higher numbers of pTα-/- derived TCRγ+ cells of DN4 origin, this
increase was larger in the case of the wt pre-TCR. After 5 days of coculture, the OP9-Dll1 system
allows then coexpansion of αβ- and γδ-TCR thymocytes, and it achieves better expansion of γδ-T 40
cells in presence of a canonical pre-TCR than in its absence, as same numbers of precursor cells
were seeded.
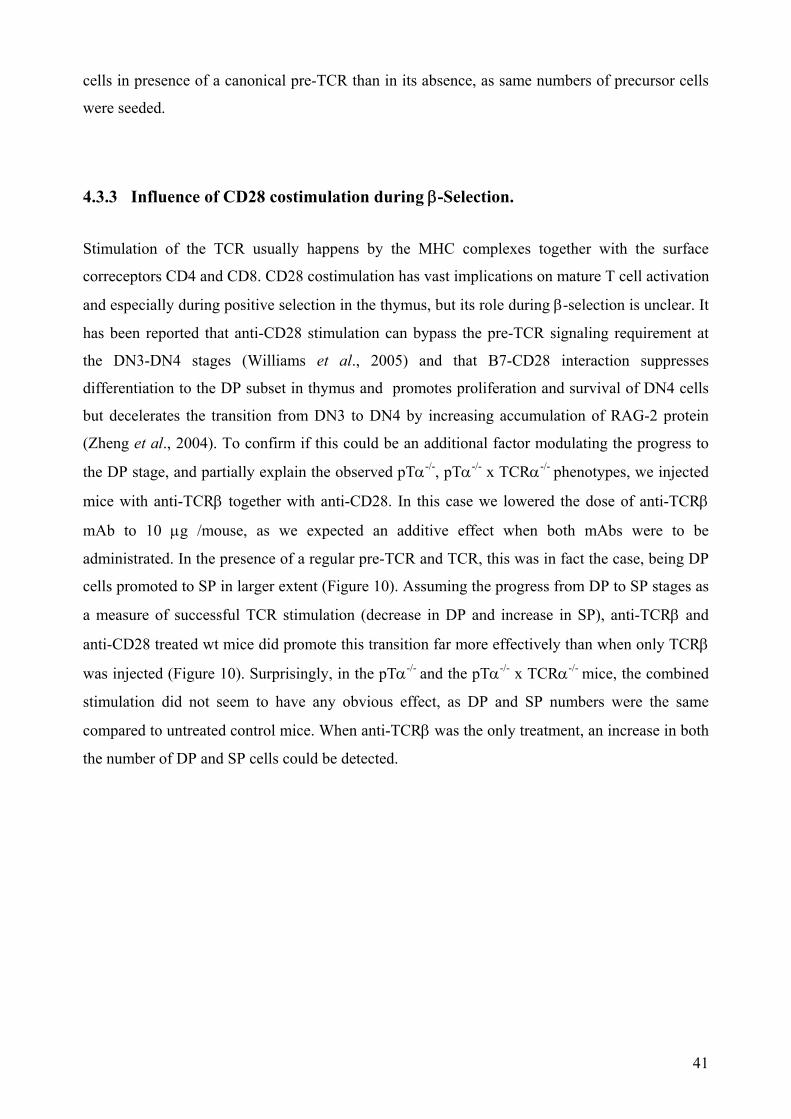
4.3.3 Influence of CD28 costimulation during β-Selection.
timulation of the TCR usually happens by the MHC complexes together with the surface S
correceptors CD4 and CD8. CD28 costimulation has vast implications on mature T cell activation
and especially during positive selection in the thymus, but its role during β-selection is unclear. It
has been reported that anti-CD28 stimulation can bypass the pre-TCR signaling requirement at
the DN3-DN4 stages (Williams et al., 2005) and that B7-CD28 interaction suppresses
differentiation to the DP subset in thymus and promotes proliferation and survival of DN4 cells
but decelerates the transition from DN3 to DN4 by increasing accumulation of RAG-2 protein
(Zheng et al., 2004). To confirm if this could be an additional factor modulating the progress to
the DP stage, and partially explain the observed pTα-/-, pTα-/- x TCRα-/- phenotypes, we injected
mice with anti-TCRβ together with anti-CD28. In this case we lowered the dose of anti-TCRβ
mAb to 10 μg /mouse, as we expected an additive effect when both mAbs were to be
administrated. In the presence of a regular pre-TCR and TCR, this was in fact the case, being DP
cells promoted to SP in larger extent (Figure 10). Assuming the progress from DP to SP stages as
a measure of successful TCR stimulation (decrease in DP and increase in SP), anti-TCRβ and
anti-CD28 treated wt mice did promote this transition far more effectively than when only TCRβ
was injected (Figure 10). Surprisingly, in the pTα-/- and the pTα-/- x TCRα-/- mice, the combined
stimulation did not seem to have any obvious effect, as DP and SP numbers were the same
compared to untreated control mice. When anti-TCRβ was the only treatment, an increase in both
the number of DP and SP cells could be detected.
41
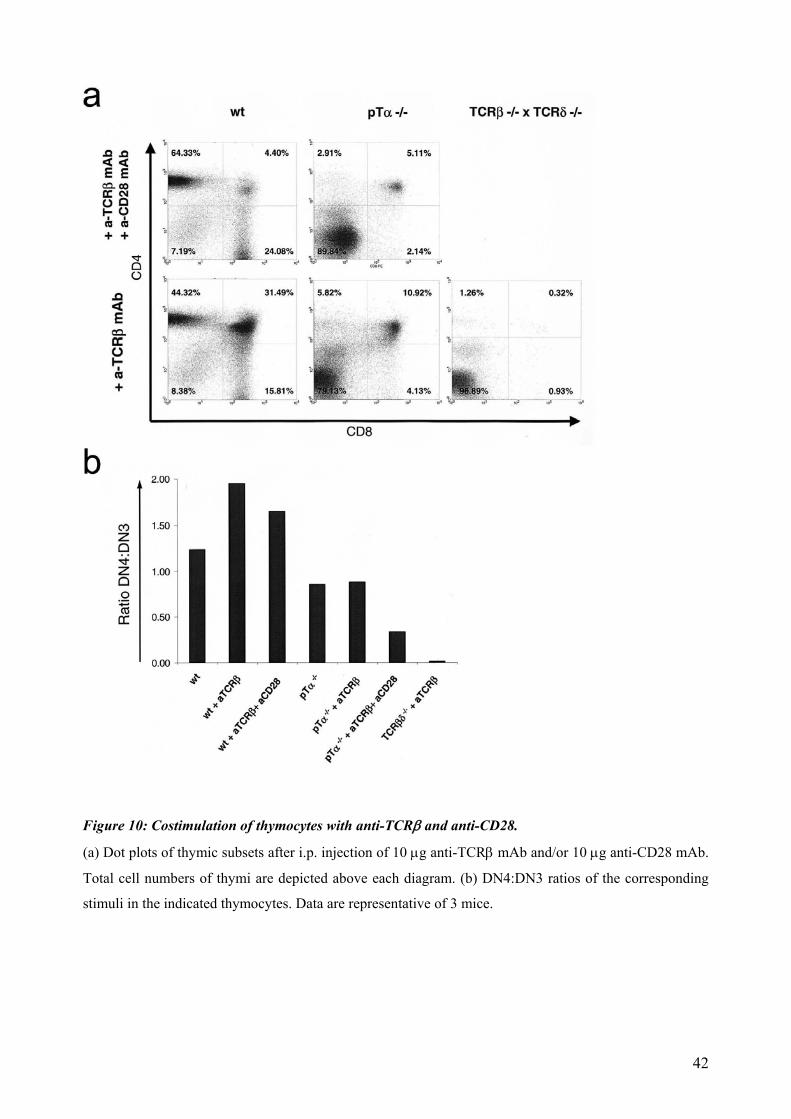
Figure 10: Costimulation of thymocytes with anti-TCRβ and anti-CD28.
(a) Dot plots of thymic subsets after i.p. injection of 10 μg anti-TCRβ mAb and/or 10 μg anti-CD28 mAb.
Total cell numbers of thymi are depicted above each diagram. (b) DN4:DN3 ratios of the corresponding
stimuli in the indicated thymocytes. Data are representative of 3 mice.
42
We could detect as well a strong influence of the CD28 costimulation in the transition from DN3
to DN4 cells both in wt and pTα-/- mice. Although pTα-/- mice are relatively less effective in
promoting this transition, it is at the DN4 stage were the vast majority of T cells die in the
absence of regular pre-TCR (Falk et al., 2001). Stimulation with anti-TCRβ or anti-TCRβ/CD28
mAbs increased the DN4:DN3 ratio in 2- and 1.75-fold extent respectively in wt background. In
the case of pTα-/- thymocytes, this ratio denoted a strong decay to 0.34-fold only under
costimulation with both mAbs (Figure 10.b).
43
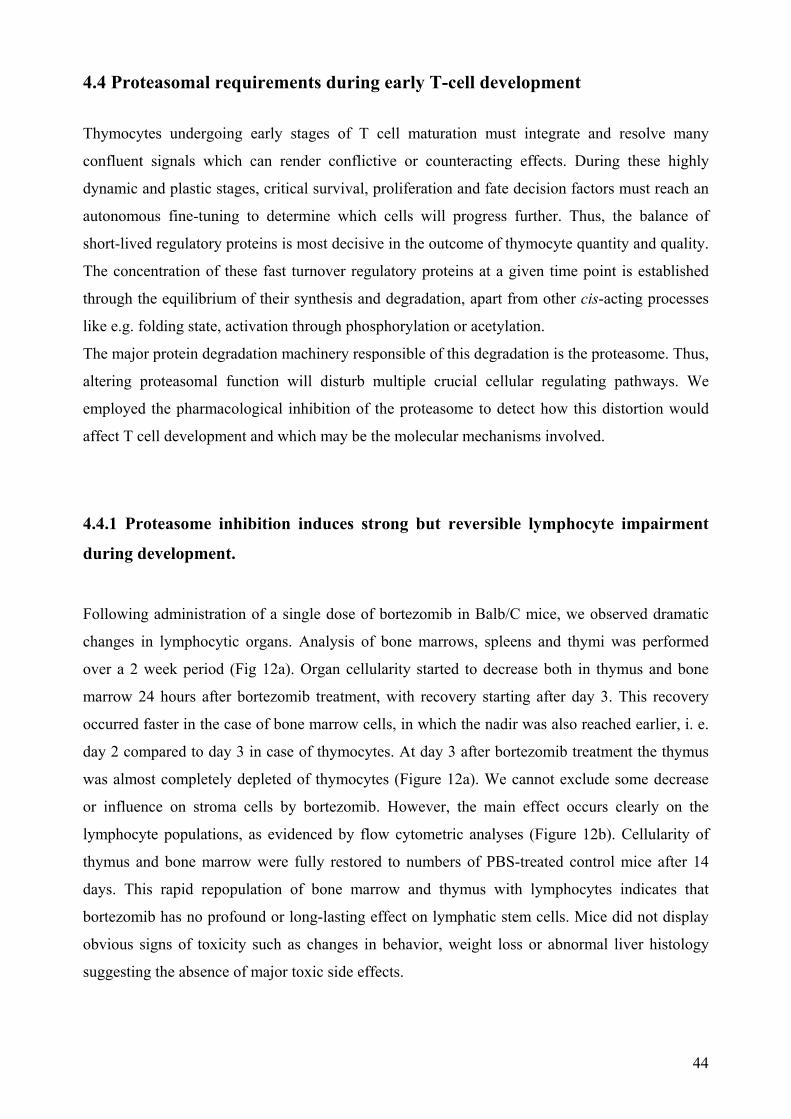
4.4 Proteasomal requirements during early T-cell development
Thymocytes undergoing early stages of T cell maturation must integrate and resolve many
confluent signals which can render conflictive or counteracting effects. During these highly
dynamic and plastic stages, critical survival, proliferation and fate decision factors must reach an
autonomous fine-tuning to determine which cells will progress further. Thus, the balance of
short-lived regulatory proteins is most decisive in the outcome of thymocyte quantity and quality.
The concentration of these fast turnover regulatory proteins at a given time point is established
through the equilibrium of their synthesis and degradation, apart from other cis-acting processes
like e.g. folding state, activation through phosphorylation or acetylation.
The major protein degradation machinery responsible of this degradation is the proteasome. Thus,
altering proteasomal function will disturb multiple crucial cellular regulating pathways. We
employed the pharmacological inhibition of the proteasome to detect how this distortion would
affect T cell development and which may be the molecular mechanisms involved.
4.4.1 Proteasome inhibition induces strong but reversible lymphocyte impairment
during development.
Following administration of a single dose of bortezomib in Balb/C mice, we observed dramatic
changes in lymphocytic organs. Analysis of bone marrows, spleens and thymi was performed
over a 2 week period (Fig 12a). Organ cellularity started to decrease both in thymus and bone
marrow 24 hours after bortezomib treatment, with recovery starting after day 3. This recovery
occurred faster in the case of bone marrow cells, in which the nadir was also reached earlier, i. e.
day 2 compared to day 3 in case of thymocytes. At day 3 after bortezomib treatment the thymus
was almost completely depleted of thymocytes (Figure 12a). We cannot exclude some decrease
or influence on stroma cells by bortezomib. However, the main effect occurs clearly on the
lymphocyte populations, as evidenced by flow cytometric analyses (Figure 12b). Cellularity of
thymus and bone marrow were fully restored to numbers of PBS-treated control mice after 14
days. This rapid repopulation of bone marrow and thymus with lymphocytes indicates that
bortezomib has no profound or long-lasting effect on lymphatic stem cells. Mice did not display
obvious signs of toxicity such as changes in behavior, weight loss or abnormal liver histology
suggesting the absence of major toxic side effects.
44
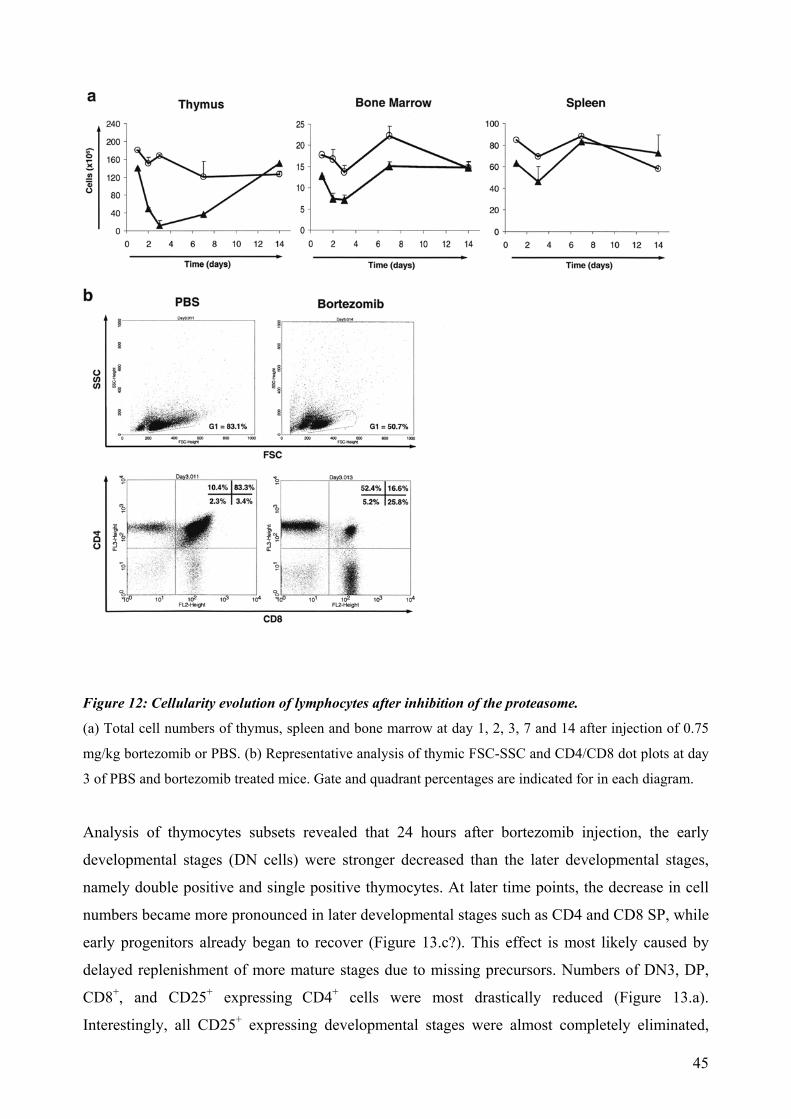
Figure 12: Cellularity evolution of lymphocytes after inhibition of the proteasome.
(a) Total cell numbers of thymus, spleen and bone marrow at day 1, 2, 3, 7 and 14 after injection of 0.75
mg/kg bortezomib or PBS. (b) Representative analysis of thymic FSC-SSC and CD4/CD8 dot plots at day
3 of PBS and bortezomib treated mice. Gate and quadrant percentages are indicated for in each diagram.
Analysis of thymocytes subsets revealed that 24 hours after bortezomib injection, the early
developmental stages (DN cells) were stronger decreased than the later developmental stages,
namely double positive and single positive thymocytes. At later time points, the decrease in cell
numbers became more pronounced in later developmental stages such as CD4 and CD8 SP, while
early progenitors already began to recover (Figure 13.c?). This effect is most likely caused by
delayed replenishment of more mature stages due to missing precursors. Numbers of DN3, DP,
CD8+, and CD25+ expressing CD4+ cells were most drastically reduced (Figure 13.a).
Interestingly, all CD25+ expressing developmental stages were almost completely eliminated,
45
indicating a possible connection with the IL-2R signal transduction pathway. Notably, there was
no marked decrease of mature CD4+ CD25+ splenic T cells, mainly representing regulatory T
cells. At day 3, DP thymocytes represented the most strongly decreased subpopulation. This
effect may be caused both by direct apoptosis induction and lack of incoming newly generated
DP cells from the DN compartment. Considering that DP cells populate the thymus at least 4
days before they undergo thymic selection and exit into the periphery, all these factors together
may contribute to an almost complete depletion of DP cells by day 3. This “lag” was also
observed in SP cells, as they were the last to reach a minimum and to recover.
Figure 13: Lymphocyte subpopulations cell numbers after inhibition of the proteasome.
Diverse (a) thymic and (b) splenic T cell subpopulations cell numbers at day 1,2,3,7 and 14 days after a
single injection of PBS or bortezomib at 0.75 mg/kg.
Numbers of mature peripheral splenic CD4+ and CD8+ T cells were barely affected during the
observation period of 14 days. Also peripheral CD4+ CD25+ T cells, containing regulatory T cells
and activated effector cells, were not significantly decreased (Figure 13b). However, the CD8+
46
thymocytes subset was the only subpopulation which was not fully restored after 14 days.
Apoptosis detection by Ax.V / PI staining of freshly isolated cells revealed only a moderate
increase in apoptotic lymphocytes upon bortezomib treatment (data not shown). The low numbers
of dying cells detectable are most likely explained by the extremely efficient clearance of
apoptotic cells in vivo as it has been noted by us and other investigators previously. In all cases,
cells entering apoptosis after bortezomib exposure showed first an AxV+/PI- phenotype and
became later permeable for PI, indicating apoptotic cell death with progression to secondary
necrosis (data not shown). Age did not modulate the sensitivity towards bortezomib-induced
apoptosis, since we obtained virtually identical results with 4- and 10-week old mice.
4.4.2 Proteasome inhibition triggers autonomous cell death of lymphocytes.
Consistent with our previous observations, treatment of mice with bortezomib resulted in
increased caspase 3/7 activity in thymocytes (Figure 14a). However, the induction of apoptosis
triggered in lymphocytes could be as well explained in a non-autonomous way which depends on
concomitantly induced microenvironmental factors. To discard this possibility, we isolated
primary thymocytes and cultured them in vitro over 24 hours in the presence or absence of
different apoptosis-inducing agents (staurosporine and anti-murine Fas mAb) or various
proteasome inhibitors (MG132, lactacystin, and bortezomib) (Figure 14b). Proteasome inhibition
was more potent in inducing cell death after 12-24 hours than other apoptosis inducers, regardless
of initiating extrinsic or intrinsic apoptosis pathways. Thymocyte cultures showed an increase of
apoptotic cell death that preceded caspase 3/7 activation and was detected before
phosphatidylserine exposure. All apoptosis inducers tested including anti-Fas, staurosporine, and
MG132 enhanced caspase 3/7 activity in vitro, however, bortezomib was most potent, causing 2-
3 fold higher values of caspase 3/7 activity compared to other apoptosis inducers (Figure 14c).
47
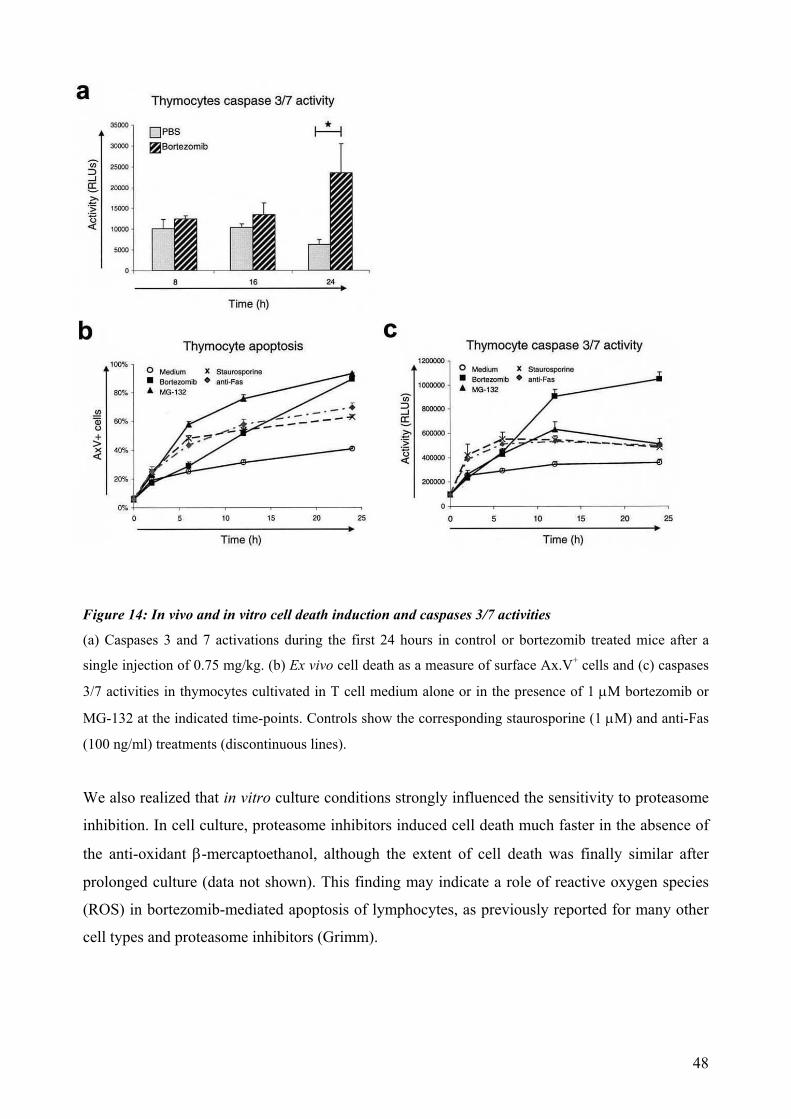
Figure 14: In vivo and in vitro cell death induction and caspases 3/7 activities
(a) Caspases 3 and 7 activations during the first 24 hours in control or bortezomib treated mice after a
single injection of 0.75 mg/kg. (b) Ex vivo cell death as a measure of surface Ax.V+ cells and (c) caspases
3/7 activities in thymocytes cultivated in T cell medium alone or in the presence of 1 μM bortezomib or
MG-132 at the indicated time-points. Controls show the corresponding staurosporine (1 μM) and anti-Fas
(100 ng/ml) treatments (discontinuous lines).
We also realized that in vitro culture conditions strongly influenced the sensitivity to proteasome
inhibition. In cell culture, proteasome inhibitors induced cell death much faster in the absence of
the anti-oxidant β-mercaptoethanol, although the extent of cell death was finally similar after
prolonged culture (data not shown). This finding may indicate a role of reactive oxygen species
(ROS) in bortezomib-mediated apoptosis of lymphocytes, as previously reported for many other
cell types and proteasome inhibitors (Grimm).
48
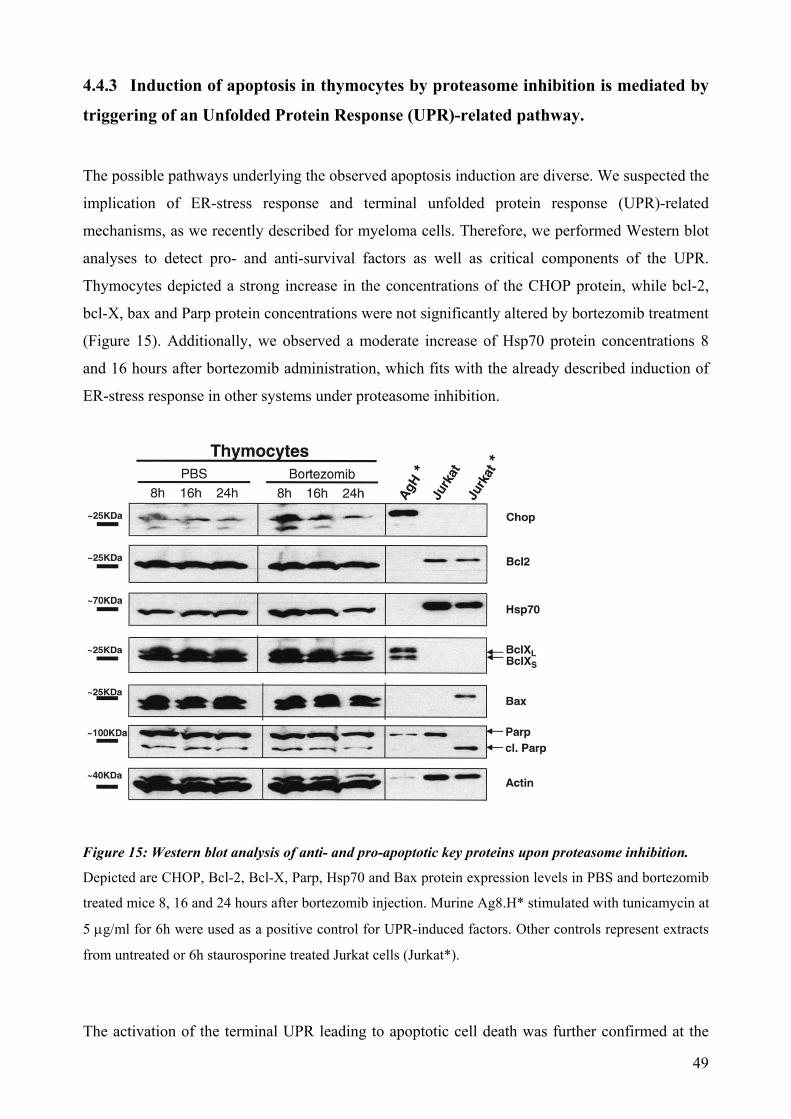
4.4.3 Induction of apoptosis in thymocytes by proteasome inhibition is mediated by
triggering of an Unfolded Protein Response (UPR)-related pathway.
The possible pathways underlying the observed apoptosis induction are diverse. We suspected the
implication of ER-stress response and terminal unfolded protein response (UPR)-related
mechanisms, as we recently described for myeloma cells. Therefore, we performed Western blot
analyses to detect pro- and anti-survival factors as well as critical components of the UPR.
Thymocytes depicted a strong increase in the concentrations of the CHOP protein, while bcl-2,
bcl-X, bax and Parp protein concentrations were not significantly altered by bortezomib treatment
(Figure 15). Additionally, we observed a moderate increase of Hsp70 protein concentrations 8
and 16 hours after bortezomib administration, which fits with the already described induction of
ER-stress response in other systems under proteasome inhibition.
Figure 15: Western blot analysis of anti- and pro-apoptotic key proteins upon proteasome inhibition.
Depicted are CHOP, Bcl-2, Bcl-X, Parp, Hsp70 and Bax protein expression levels in PBS and bortezomib
treated mice 8, 16 and 24 hours after bortezomib injection. Murine Ag8.H* stimulated with tunicamycin at
5 μg/ml for 6h were used as a positive control for UPR-induced factors. Other controls represent extracts
from untreated or 6h staurosporine treated Jurkat cells (Jurkat*).
The activation of the terminal UPR leading to apoptotic cell death was further confirmed at the
49
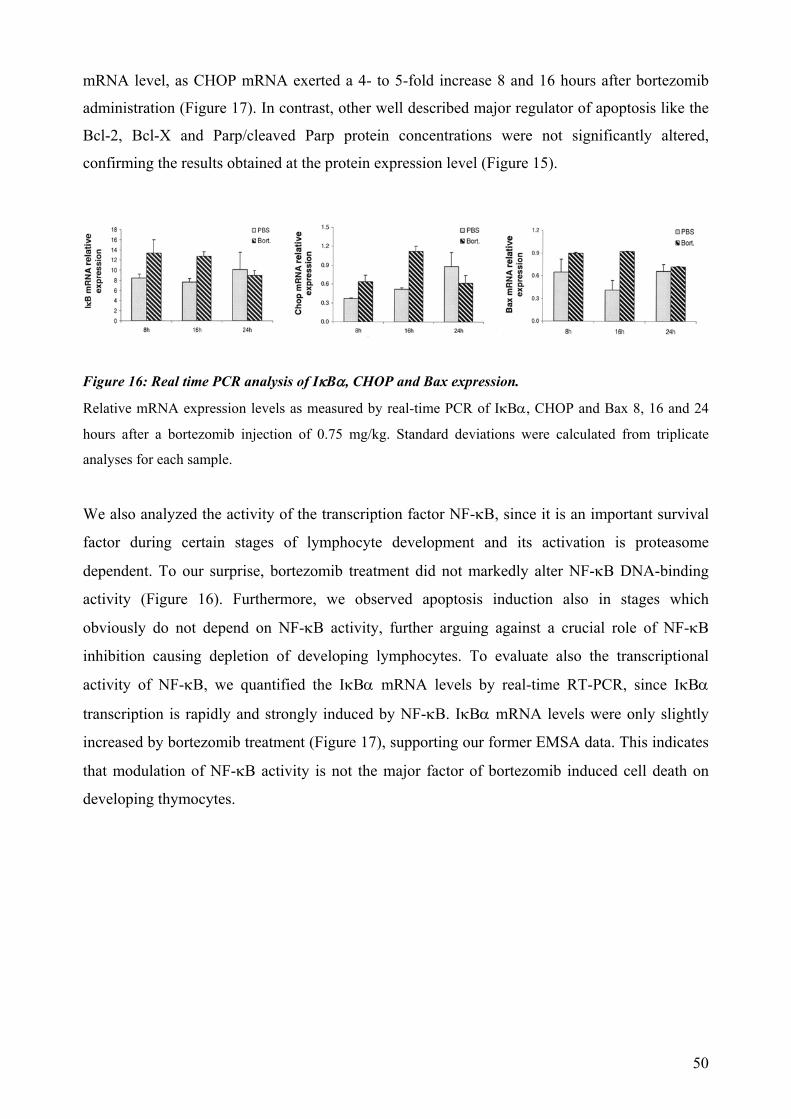
mRNA level, as CHOP mRNA exerted a 4- to 5-fold increase 8 and 16 hours after bortezomib
administration (Figure 17). In contrast, other well described major regulator of apoptosis like the
Bcl-2, Bcl-X and Parp/cleaved Parp protein concentrations were not significantly altered,
confirming the results obtained at the protein expression level (Figure 15).
Figure 16: Real time PCR analysis of IκBα, CHOP and Bax expression.
Relative mRNA expression levels as measured by real-time PCR of IκBα, CHOP and Bax 8, 16 and 24
hours after a bortezomib injection of 0.75 mg/kg. Standard deviations were calculated from triplicate
analyses for each sample.
We also analyzed the activity of the transcription factor NF-κB, since it is an important survival
factor during certain stages of lymphocyte development and its activation is proteasome
dependent. To our surprise, bortezomib treatment did not markedly alter NF-κB DNA-binding
activity (Figure 16). Furthermore, we observed apoptosis induction also in stages which
obviously do not depend on NF-κB activity, further arguing against a crucial role of NF-κB
inhibition causing depletion of developing lymphocytes. To evaluate also the transcriptional
activity of NF-κB, we quantified the IκBα mRNA levels by real-time RT-PCR, since IκBα
transcription is rapidly and strongly induced by NF-κB. IκBα mRNA levels were only slightly
increased by bortezomib treatment (Figure 17), supporting our former EMSA data. This indicates
that modulation of NF-κB activity is not the major factor of bortezomib induced cell death on
developing thymocytes.
50
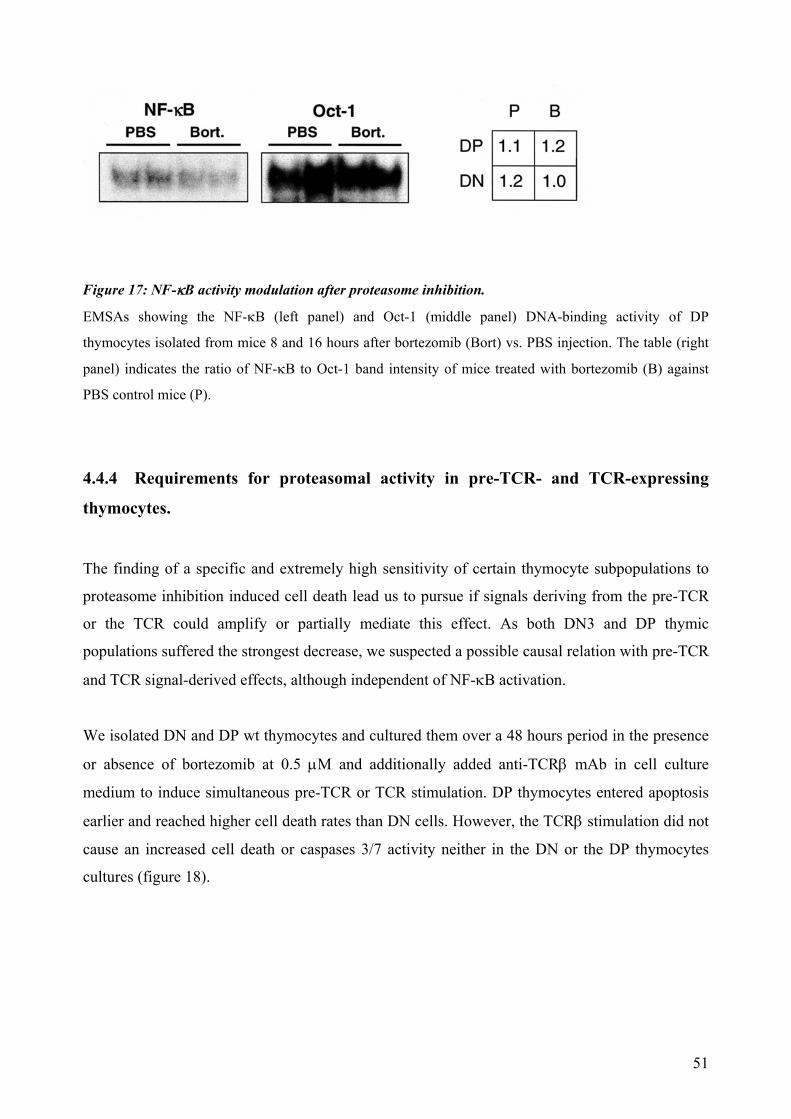
Figure 17: NF-κB activity modulation after proteasome inhibition.
EMSAs showing the NF-κB (left panel) and Oct-1 (middle panel) DNA-binding activity of DP
thymocytes isolated from mice 8 and 16 hours after bortezomib (Bort) vs. PBS injection. The table (right
panel) indicates the ratio of NF-κB to Oct-1 band intensity of mice treated with bortezomib (B) against
PBS control mice (P).
4.4.4 Requirements for proteasomal activity in pre-TCR- and TCR-expressing
thymocytes.
The finding of a specific and extremely high sensitivity of certain thymocyte subpopulations to
proteasome inhibition induced cell death lead us to pursue if signals deriving from the pre-TCR
or the TCR could amplify or partially mediate this effect. As both DN3 and DP thymic
populations suffered the strongest decrease, we suspected a possible causal relation with pre-TCR
and TCR signal-derived effects, although independent of NF-κB activation.
We isolated DN and DP wt thymocytes and cultured them over a 48 hours period in the presence
or absence of bortezomib at 0.5 μM and additionally added anti-TCRβ mAb in cell culture
medium to induce simultaneous pre-TCR or TCR stimulation. DP thymocytes entered apoptosis
earlier and reached higher cell death rates than DN cells. However, the TCRβ stimulation did not
cause an increased cell death or caspases 3/7 activity neither in the DN or the DP thymocytes
cultures (figure 18).
51
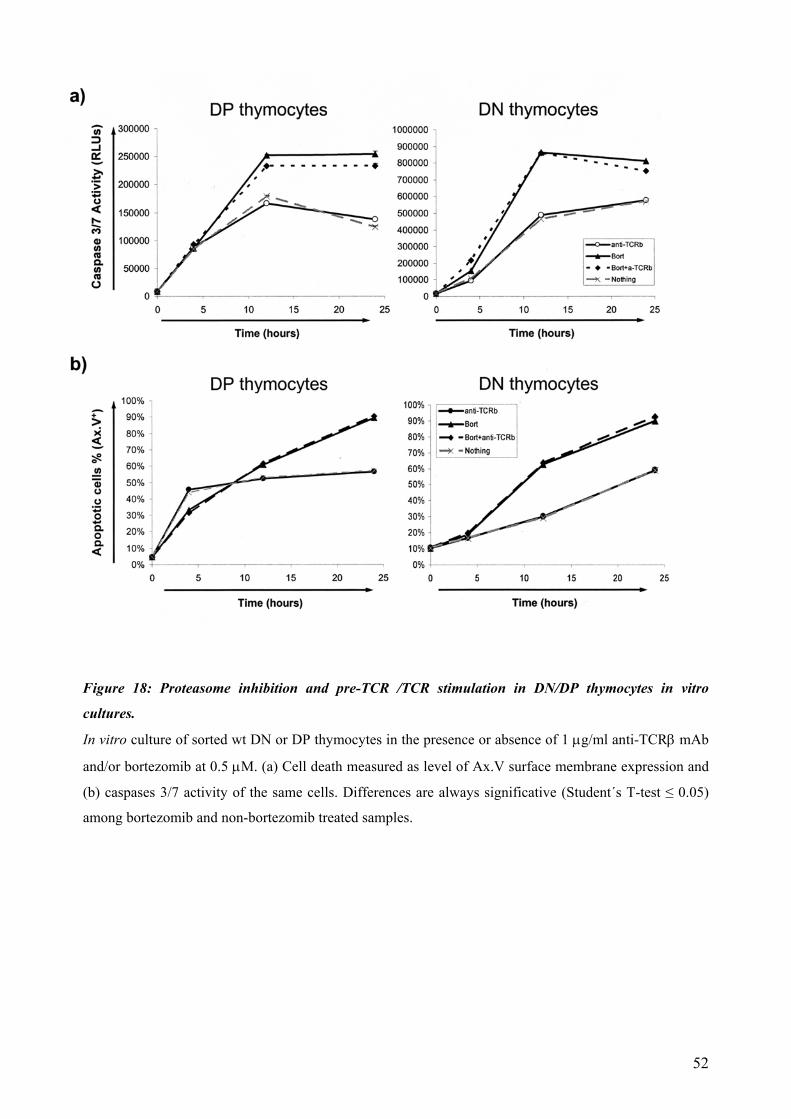
Figure 18: Proteasome inhibition and pre-TCR /TCR stimulation in DN/DP thymocytes in vitro
cultures.
In vitro culture of sorted wt DN or DP thymocytes in the presence or absence of 1 μg/ml anti-TCRβ mAb
and/or bortezomib at 0.5 μM. (a) Cell death measured as level of Ax.V surface membrane expression and
(b) caspases 3/7 activity of the same cells. Differences are always significative (Student´s T-test ≤ 0.05)
among bortezomib and non-bortezomib treated samples.
52
5. Discussion
5.1 Relevance of receptors lacking the pTα and TCRα chains during the pre-
TCR checkpoint.
During T cell development many signals and processes closely coincide in time and space to
permit, control and guide the outcome of thymocytes that will be selected at the end of their
maturation. There is currently a lack of systems that allow integrative understanding of
simultaneous factors affecting survival, proliferation, differentiation and fate decisions at critical
T cell developmental checkpoints. The β-selection process is the very first checkpoint
determining the quality of a rearranged TCRβ chain, and therefore of a potential final TCR (von
Boehmer et al., 1997). Unconventional pre-TCR signaling during early stages of T cell
maturation constitutes still an event with many unresolved causes and consequences. Diverse
genetically modified mouse models have demonstrated the relevance of the pre-TCR in
thymocyte development. More precisely, pTα and TCRα KO mice have shown that although the
pre-TCR is critical, thymocytes can undergo β-selection in absence of classical pre-TCR
molecules. Additionally, expression of TCRβ homodimers has been demonstrated so far only
with genetic transformation in determined cell culture systems (Groettrup et al., 1992) and in
mice expressing a retroviral TCRβ construct (Krotkova et al., 1997). Independence of
requirements for surrogate light chains in B-Cell development also demonstrate that a μ HC
receptor induces survival and differentiation signals (Schuh et al., 2003), and is as well capable of
down-regulation of the V(D)J recombinase machinery (Galler et al., 2004).
In this thesis it is shown that thymocytes of mice lacking either the pTα or the pTα and TCRα
chains express on their membrane surface a TCRβ protein-based receptor. Expression of this
receptor explains the presence of the few but consistent numbers of DP and SP thymocytes in
those deficient mice. Percentages of DN4 cells expressing intracellular TCRβ in pTα-/- and pTα-/-
x TCRα-/- mice achieve much lower amounts than in its wt counterparts, but this expression is
consistent and covers ~20% of thymocytes (Figure 1). The intracellular expression levels in the
transition from DN3 to DN4 stages vary as well in a very similar extent (4-fold increase) when
compared to wt DN3 and DN4 cells (Figure 3), indicating similar cis- and trans-regulating events
controlling TCRβ protein expression once the cells achieved expression of an early functional
TCRβ. Additionally, this partial success of DN4 cells in expressing the TCRβ protein was also
very similar in the pTα-/- and the pTα-/- x TCRα-/- thymocytes. This may indicate a partial
53
independence of neither pTα nor TCRα chains in regulating β-selection and constitutes a hint for
assuming no major transition differences due to premature expression of a TCRα protein. It
should be noticed that our detected intracellular TCRβ expression levels differ from those of Buer
et al., who observe a stronger difference between pTα-/- and the pTα-/- x TCRα-/- thymocytes
(40% versus 15%). This discrepancy may be partially explained by the intrinsic variability of
TCRβ chain expression among individuals (von Boehmer et al., 1999)
Our results also describe how the unconventional TCRβ receptor of pTα-/- and pTα-/- x TCRα-/-
mice is signaling-competent, as it delivers a signal that achieves a moderate increase of Ca2+
influx upon cross-linking (Figure 4) and triggers NF-κB activation in a constitutive manner (Fig.
5). Both events are hallmarks of receptor-initiated signal, from the level of second messenger
release as a proximal event and finally leading to modulation of gene transcription (Voll et al.,
2000; Aifantis et al., 2001). NF-κB activity under resting conditions is 4- to 6-fold higher in DN4
cells of pTα-/- and pTα-/- x TCRα-/- thymocytes compared to wt DP thymocytes, which can
account for the survival of those cells in the absence of a classical pre-TCR. The increase of Ca2+
influx upon cross-linking of the TCRβ is stronger in wt DN3 cells than in pTα-/- DN3 cells,
whereas in DN4 cells turns into the opposite (figure 4). The proportion of receptor-expressing
cells is much lower in pTα-/- cells than in wt thymocytes expressing a regular pre-TCR, and this
can partially explain the difference observed in DN3 cells, while DN4 cells reach higher Ca2+
influx values, even with a lower load of total Ca2+ (Aifantis et al., 2001). Our interpretation is
that those surviving pTα-/- DN4 cells may trigger additional mechanisms to increase their Ca2+
levels, as suggested by Aifantis et al. Additionally, in response to increases in Ca2+
concentrations, both NF-κB and NFAT are activated in pre-T cells, but while NF-κB is activated
during a primary transient elevation in Ca2+ levels, NFAT activation is only evident after a
secondary, sustained plateau of Ca2+ level (Aifantis et al., 2006), which can result in a different
set of target genes being transcribed.
Current models of pre-TCR signaling still debate if the signal strength or the quality is more
relevant. As the intensity of NF-κB activity reaches very similar increase during the DN3 to DN4
transition, Ca2+ dynamics after stimulation behave similarly, and the DN3 and DN4 subsets retain
a certain potential to generate DP cells (Figures 4 and 5), we hypothesize that there must be a
qualitative rather than a quantitative difference of the TCR signal underlying the survival
capacity of thymocyte lacking a classical pre-TCR. This result matches with the independence of
54
ligand-mediated triggering at the pre-TCR checkpoint, and thus favors a model that does not
imply signal strength as the only causal explanation collaborating on β-selection.
Appropriate thymocyte differentiation can occur independently of extensive proliferation
(Gibbons et al., 2001). The anti-TCRβ stimulation experiments alone did not considerably alter
the DN4:DN3 ratios in pTα-/- mice but increased DP and total thymocytes, indicating that it
promoted proliferation and survival of DN4s with concomitant/simultaneous differentiation to DP
/ SP stages, and hence validating its potential physiological functionality.
The enablement of transition to DP stages in the absence of both the pTα and TCRα chains does
not however explicitly implicate that all potential TCRβ chain proteins have the same capacity to
proper signalize and promote onward maturation. Some TCRβ proteins may have more
appropriate structures to build TCRββ homodimers or TCRβγ heterodimers, but this question
cannot be answered at the light of our results, and additional structural and biochemical analysis
would be needed to address this question. Nevertheless, no prevalence of any specific set of VDJ
rearrangements in pTα-/- DN4 or DP thymocytes has been discovered so far either, and the TCR
repertoire of pTα-/- T cells is as diverse as wt mice (Mancini et al., 1999). It is strongly
questionable as well that, as it happens with the pre-BCR, there is a strong bias in the structural
motifs of the β chain of the pre-TCR. This is supported by the observation that the Vβ usage is
independent of pTα pairing (Wilson et al., 2001). Transgenic overexpression of Vβ8.2 TCR
generates a large population of DP stage cells (60%) in a Rag-/- x pTα-/- background (Krotkova et
al., 1997; Spain et al., 2002). However, these data are based on transgenic overexpresion of
TCRβ proteins, which confers several limitations: 1- TCRβ is strongly overexpressed on the
surface and intracellularly (Accumulation of TCRβ proteins may trigger ER stress responses with
concomitant UPR response and NF-κB activation) 2- Transgenic expression must not follow
same genetic regulation as endogenous TCRβ genes 3- It obviates the diversity of TCRβ proteins
4- It is not known if they signalize properly (they may not be expressed in the surface). Despite of
these artifact limitations, this permits us to consider that a TCRβ homodimer is mechanistically
possible and is signaling competent in vivo. Our data support the physiological relevance of such
receptors.
55
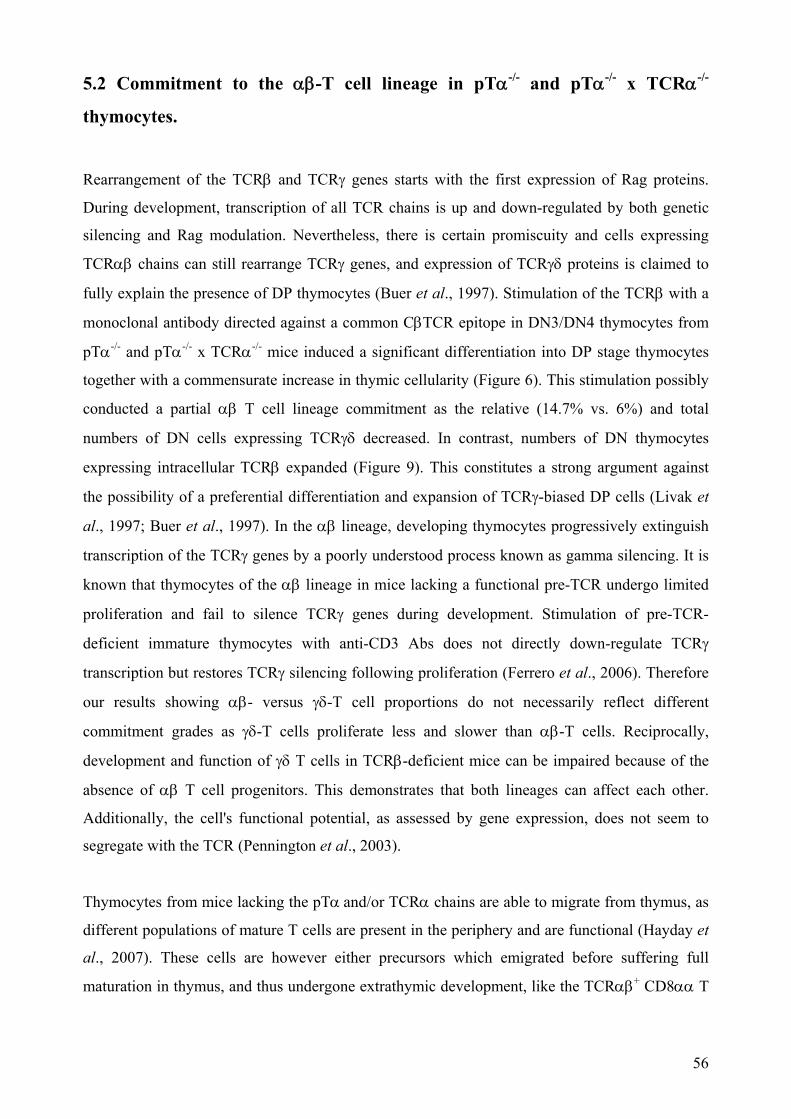
5.2 Commitment to the αβ-T cell lineage in pTα-/- and pTα-/- x TCRα-/-
thymocytes.
Rearrangement of the TCRβ and TCRγ genes starts with the first expression of Rag proteins.
During development, transcription of all TCR chains is up and down-regulated by both genetic
silencing and Rag modulation. Nevertheless, there is certain promiscuity and cells expressing
TCRαβ chains can still rearrange TCRγ genes, and expression of TCRγδ proteins is claimed to
fully explain the presence of DP thymocytes (Buer et al., 1997). Stimulation of the TCRβ with a
monoclonal antibody directed against a common CβTCR epitope in DN3/DN4 thymocytes from
pTα-/- and pTα-/- x TCRα-/- mice induced a significant differentiation into DP stage thymocytes
together with a commensurate increase in thymic cellularity (Figure 6). This stimulation possibly
conducted a partial αβ T cell lineage commitment as the relative (14.7% vs. 6%) and total
numbers of DN cells expressing TCRγδ decreased. In contrast, numbers of DN thymocytes
expressing intracellular TCRβ expanded (Figure 9). This constitutes a strong argument against
the possibility of a preferential differentiation and expansion of TCRγ-biased DP cells (Livak et
al., 1997; Buer et al., 1997). In the αβ lineage, developing thymocytes progressively extinguish
transcription of the TCRγ genes by a poorly understood process known as gamma silencing. It is
known that thymocytes of the αβ lineage in mice lacking a functional pre-TCR undergo limited
proliferation and fail to silence TCRγ genes during development. Stimulation of pre-TCR-
deficient immature thymocytes with anti-CD3 Abs does not directly down-regulate TCRγ
transcription but restores TCRγ silencing following proliferation (Ferrero et al., 2006). Therefore
our results showing αβ- versus γδ-T cell proportions do not necessarily reflect different
commitment grades as γδ-T cells proliferate less and slower than αβ-T cells. Reciprocally,
development and function of γδ T cells in TCRβ-deficient mice can be impaired because of the
absence of αβ T cell progenitors. This demonstrates that both lineages can affect each other.
Additionally, the cell's functional potential, as assessed by gene expression, does not seem to
segregate with the TCR (Pennington et al., 2003).
Thymocytes from mice lacking the pTα and/or TCRα chains are able to migrate from thymus, as
different populations of mature T cells are present in the periphery and are functional (Hayday et
al., 2007). These cells are however either precursors which emigrated before suffering full
maturation in thymus, and thus undergone extrathymic development, like the TCRαβ+ CD8αα T
56
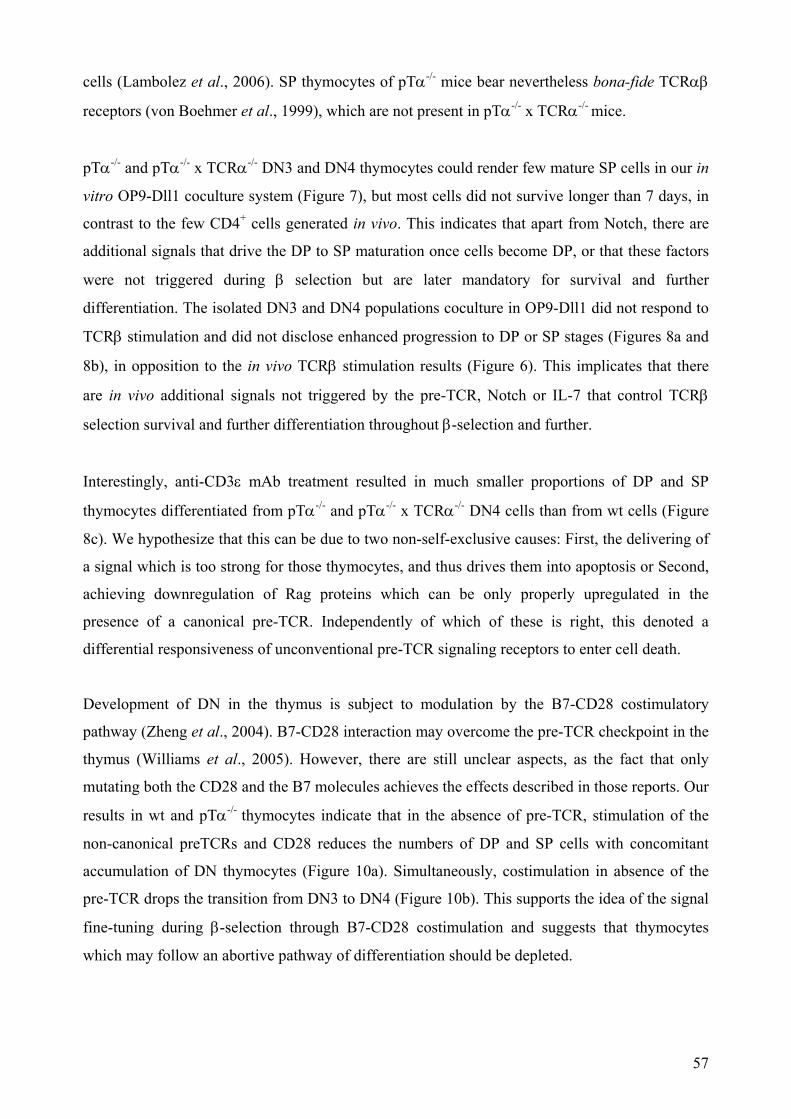
cells (Lambolez et al., 2006). SP thymocytes of pTα-/- mice bear nevertheless bona-fide TCRαβ
receptors (von Boehmer et al., 1999), which are not present in pTα-/- x TCRα-/- mice.
pTα-/- and pTα-/- x TCRα-/- DN3 and DN4 thymocytes could render few mature SP cells in our in
vitro OP9-Dll1 coculture system (Figure 7), but most cells did not survive longer than 7 days, in
contrast to the few CD4+ cells generated in vivo. This indicates that apart from Notch, there are
additional signals that drive the DP to SP maturation once cells become DP, or that these factors
were not triggered during β selection but are later mandatory for survival and further
differentiation. The isolated DN3 and DN4 populations coculture in OP9-Dll1 did not respond to
TCRβ stimulation and did not disclose enhanced progression to DP or SP stages (Figures 8a and
8b), in opposition to the in vivo TCRβ stimulation results (Figure 6). This implicates that there
are in vivo additional signals not triggered by the pre-TCR, Notch or IL-7 that control TCRβ
selection survival and further differentiation throughout β-selection and further.
Interestingly, anti-CD3ε mAb treatment resulted in much smaller proportions of DP and SP
thymocytes differentiated from pTα-/- and pTα-/- x TCRα-/- DN4 cells than from wt cells (Figure
8c). We hypothesize that this can be due to two non-self-exclusive causes: First, the delivering of
a signal which is too strong for those thymocytes, and thus drives them into apoptosis or Second,
achieving downregulation of Rag proteins which can be only properly upregulated in the
presence of a canonical pre-TCR. Independently of which of these is right, this denoted a
differential responsiveness of unconventional pre-TCR signaling receptors to enter cell death.
Development of DN in the thymus is subject to modulation by the B7-CD28 costimulatory
pathway (Zheng et al., 2004). B7-CD28 interaction may overcome the pre-TCR checkpoint in the
thymus (Williams et al., 2005). However, there are still unclear aspects, as the fact that only
mutating both the CD28 and the B7 molecules achieves the effects described in those reports. Our
results in wt and pTα-/- thymocytes indicate that in the absence of pre-TCR, stimulation of the
non-canonical preTCRs and CD28 reduces the numbers of DP and SP cells with concomitant
accumulation of DN thymocytes (Figure 10a). Simultaneously, costimulation in absence of the
pre-TCR drops the transition from DN3 to DN4 (Figure 10b). This supports the idea of the signal
fine-tuning during β-selection through B7-CD28 costimulation and suggests that thymocytes
which may follow an abortive pathway of differentiation should be depleted.
57
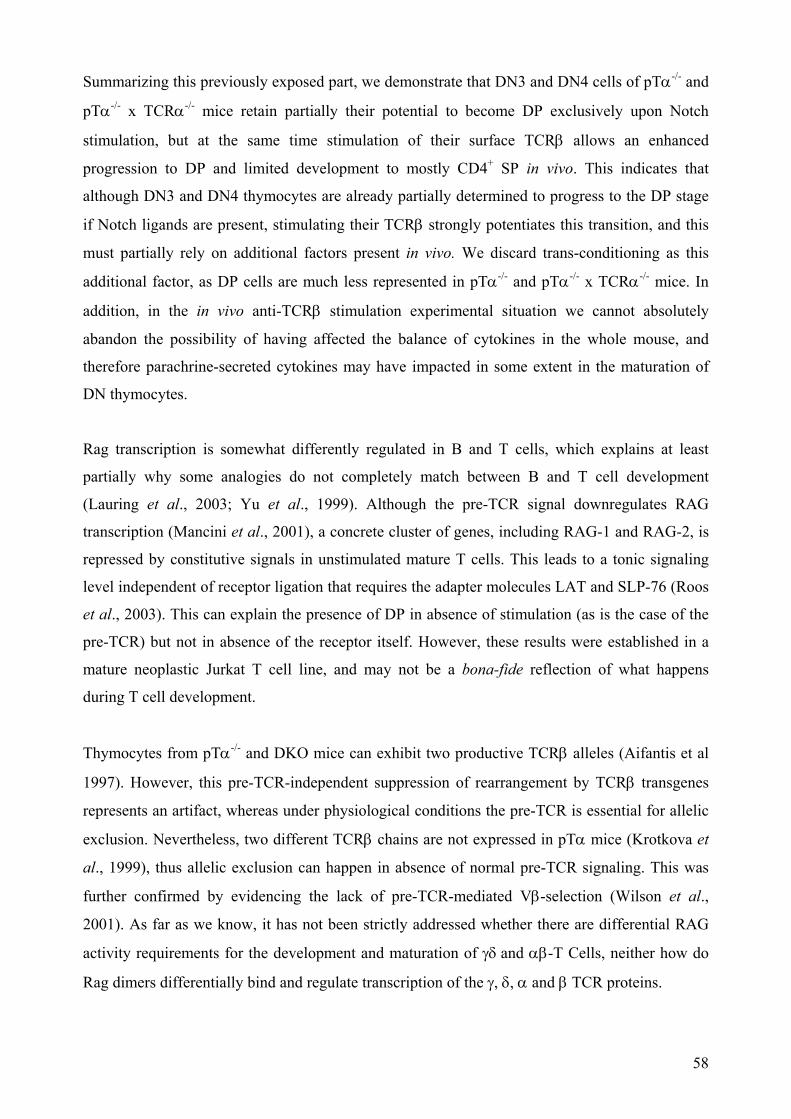
Summarizing this previously exposed part, we demonstrate that DN3 and DN4 cells of pTα-/- and
pTα-/- x TCRα-/- mice retain partially their potential to become DP exclusively upon Notch
stimulation, but at the same time stimulation of their surface TCRβ allows an enhanced
progression to DP and limited development to mostly CD4+ SP in vivo. This indicates that
although DN3 and DN4 thymocytes are already partially determined to progress to the DP stage
if Notch ligands are present, stimulating their TCRβ strongly potentiates this transition, and this
must partially rely on additional factors present in vivo. We discard trans-conditioning as this
additional factor, as DP cells are much less represented in pTα-/- and pTα-/- x TCRα-/- mice. In
addition, in the in vivo anti-TCRβ stimulation experimental situation we cannot absolutely
abandon the possibility of having affected the balance of cytokines in the whole mouse, and
therefore parachrine-secreted cytokines may have impacted in some extent in the maturation of
DN thymocytes.
Rag transcription is somewhat differently regulated in B and T cells, which explains at least
partially why some analogies do not completely match between B and T cell development
(Lauring et al., 2003; Yu et al., 1999). Although the pre-TCR signal downregulates RAG
transcription (Mancini et al., 2001), a concrete cluster of genes, including RAG-1 and RAG-2, is
repressed by constitutive signals in unstimulated mature T cells. This leads to a tonic signaling
level independent of receptor ligation that requires the adapter molecules LAT and SLP-76 (Roos
et al., 2003). This can explain the presence of DP in absence of stimulation (as is the case of the
pre-TCR) but not in absence of the receptor itself. However, these results were established in a
mature neoplastic Jurkat T cell line, and may not be a bona-fide reflection of what happens
during T cell development.
Thymocytes from pTα-/- and DKO mice can exhibit two productive TCRβ alleles (Aifantis et al
1997). However, this pre-TCR-independent suppression of rearrangement by TCRβ transgenes
represents an artifact, whereas under physiological conditions the pre-TCR is essential for allelic
exclusion. Nevertheless, two different TCRβ chains are not expressed in pTα mice (Krotkova et
al., 1999), thus allelic exclusion can happen in absence of normal pre-TCR signaling. This was
further confirmed by evidencing the lack of pre-TCR-mediated Vβ-selection (Wilson et al.,
2001). As far as we know, it has not been strictly addressed whether there are differential RAG
activity requirements for the development and maturation of γδ and αβ-T Cells, neither how do
Rag dimers differentially bind and regulate transcription of the γ, δ, α and β TCR proteins.
58
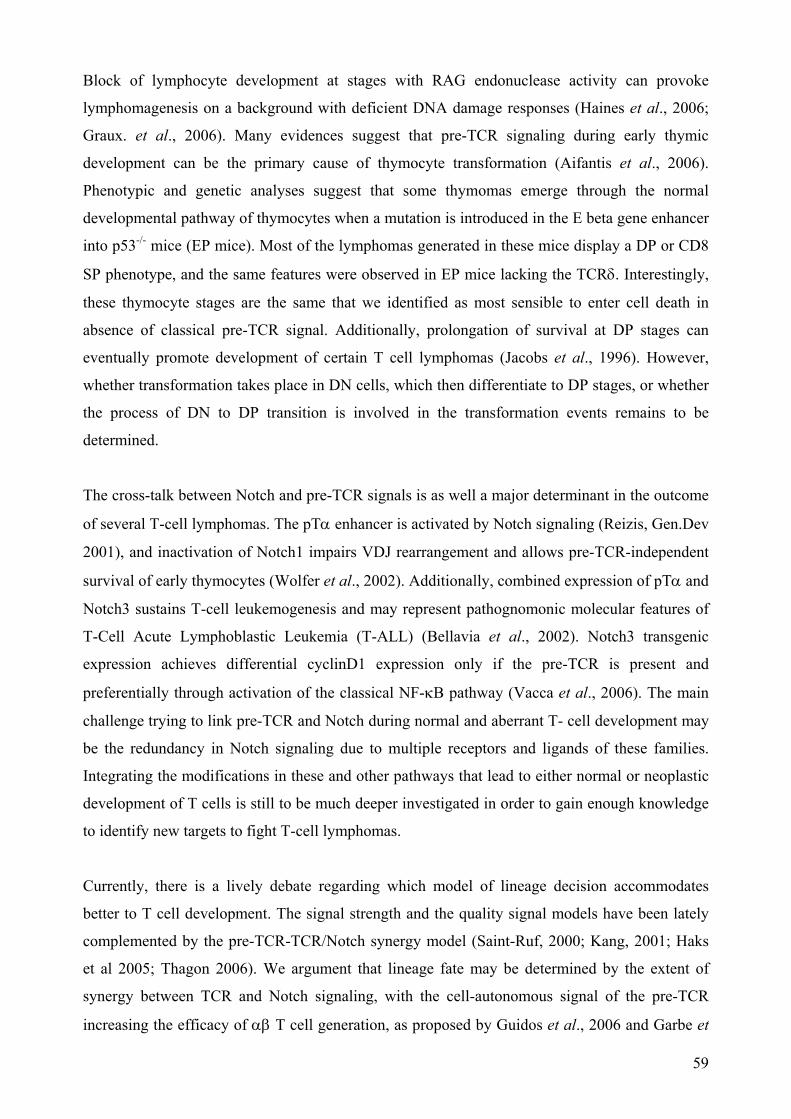
Block of lymphocyte development at stages with RAG endonuclease activity can provoke
lymphomagenesis on a background with deficient DNA damage responses (Haines et al., 2006;
Graux. et al., 2006). Many evidences suggest that pre-TCR signaling during early thymic
development can be the primary cause of thymocyte transformation (Aifantis et al., 2006).
Phenotypic and genetic analyses suggest that some thymomas emerge through the normal
developmental pathway of thymocytes when a mutation is introduced in the E beta gene enhancer
into p53-/- mice (EP mice). Most of the lymphomas generated in these mice display a DP or CD8
SP phenotype, and the same features were observed in EP mice lacking the TCRδ. Interestingly,
these thymocyte stages are the same that we identified as most sensible to enter cell death in
absence of classical pre-TCR signal. Additionally, prolongation of survival at DP stages can
eventually promote development of certain T cell lymphomas (Jacobs et al., 1996). However,
whether transformation takes place in DN cells, which then differentiate to DP stages, or whether
the process of DN to DP transition is involved in the transformation events remains to be
determined.
The cross-talk between Notch and pre-TCR signals is as well a major determinant in the outcome
of several T-cell lymphomas. The pTα enhancer is activated by Notch signaling (Reizis, Gen.Dev
2001), and inactivation of Notch1 impairs VDJ rearrangement and allows pre-TCR-independent
survival of early thymocytes (Wolfer et al., 2002). Additionally, combined expression of pTα and
Notch3 sustains T-cell leukemogenesis and may represent pathognomonic molecular features of
T-Cell Acute Lymphoblastic Leukemia (T-ALL) (Bellavia et al., 2002). Notch3 transgenic
expression achieves differential cyclinD1 expression only if the pre-TCR is present and
preferentially through activation of the classical NF-κB pathway (Vacca et al., 2006). The main
challenge trying to link pre-TCR and Notch during normal and aberrant T- cell development may
be the redundancy in Notch signaling due to multiple receptors and ligands of these families.
Integrating the modifications in these and other pathways that lead to either normal or neoplastic
development of T cells is still to be much deeper investigated in order to gain enough knowledge
to identify new targets to fight T-cell lymphomas.
Currently, there is a lively debate regarding which model of lineage decision accommodates
better to T cell development. The signal strength and the quality signal models have been lately
complemented by the pre-TCR-TCR/Notch synergy model (Saint-Ruf, 2000; Kang, 2001; Haks
et al 2005; Thagon 2006). We argument that lineage fate may be determined by the extent of
synergy between TCR and Notch signaling, with the cell-autonomous signal of the pre-TCR
increasing the efficacy of αβ T cell generation, as proposed by Guidos et al., 2006 and Garbe et
59
al., 2007. The OP9-Dll1 coculture experiments of this thesis did as well confirm the preferential
implication of Notch signaling on triggering proliferation (Figure 7), commitment to the αβ T
cell lineage and loss of plasticity in the transition from the DN3 to the DN4 stages (Figure 9),.
However, it should be considered that some Notch signaling effects may rely stronger in the β-
catenin/wnt-pathway leading to TCF-1 activation (Gounari et al., 2001, Goux et al., 2005), which
is independent of the pre-TCR.
5.3 Proteasome activity requirements during early thymocyte development.
Correct function of the ubiquitin-proteasome machinery is critically involved in cellular
processes such as cell survival, cell cycle control, antigen processing, angiogenesis, removal of
nonreceptor kinases, cell adhesion and migration (reviewed in Ciechanover et al., 2005). The role
of the ubiquitin-proteasome machinery has been extensively addressed regarding T cell and
thymocyte apoptosis, homeostasis, T-cell leukemias and several other immune responses (Wang
et al., 1998; Satou et al., 2005; Dallaporta et al., 2005). Nevertheless, lack of defined
experimental models and variance of doses and experimental settings have produced conflicting
results in considerable extent, being the inhibition of proteasomal function either pro- or anti-
apoptotic depending on case conditions. Although many investigations have been performed to
address the role of the proteasome in MHC-driven selection, the importance of proteasomal
activity at early stages of T-cell development independent of MHC is much unknown.
We identified that developing thymocytes denote an exquisite sensitivity to cell death caused by
proteasomal activity inhibition (Figure 12). This apoptosis induction is very specific for
developing lymphocytes and displays its strongest effects on the DN3 and DP thymocyte
subpopulations, although it slightly affects mature recirculating T cells as well (Figures 13a and
13b). We could confirm that this apoptosis induced by proteasome inhibition is in great extent a
cell autonomous-driven consequence, since in vitro cell culture assays of purified thymocytes
also showed strongly increased cell death and caspases 3/7 activities. It is to mention that DN
stage thymocytes depicted always a 2-4 fold stronger caspases 3/7 activities either upon certain
stimuli or not and in vivo or in vitro (Figures 14a and 14c). This observation can not be due to a
higher extent of cell death, as cultures contained identical cell numbers. Although DP cells have
larger proliferative potential than DN thymocytes, they acquire as well a relative quiescence state
during their maturation. This may explain the strong difference in caspase activation observed
between DN and DP thymocytes. Some pathways leading to an increase in caspase activity are
60
activated both in T cells undergoing apoptosis and proliferation, although this may appear
contradictory (Kataoka et al., 2000; Salmena et al., 2003). Caspase-independent signal
transduction pathways have been as well reported to mediate thymocyte death during normal T
cell development (Doerfler et al., 2000).
The stages of T cell development which suffered major diminution upon proteasome inhibition
coincided with the pre-TCR and TCR controlled stages. The pre-TCR and TCR molecules depict
as well different abilities in inducing apoptosis upon their stimulation (Steff et al., 2001).
Though, we were not able to evict any correlation or functional connection among expression or
stimulation of the pre-TCR or TCR with sensitivity towards bortezomib treatments (Figure 18).
These observations lead us to suspect that the apoptosis induction depends mostly on alteration of
pro-survival signals independent of pre-TCR or TCR signaling but partially dependant of thymic-
delivered signals.
Very recently, a thymus-specific β5 subunit of the proteasome has been identified to control
development of CD8+ cells (Murata et al., 2007). Additionally, the proteasome is responsible for
generating the great majority of MHC-I associated peptides (Fehling et al., 1994). This fits with
our results disclosing a delayed recovery of the CD8+ stage thymocytes population after
proteasome inhibition compared to all other thymocyte subsets (Figure 13a). Nevertheless, the
proteasome can generate as well peptides that are presented through the MHCII, either in the case
of identified viral antigens or as a general mechanism mediated by macroautophagy processes
(Anton et al., 1999; Dengjel et al., 2005; Bernales et al., 2006). Additionally, it is known that
proteasomal specificity shapes the repertoire of T cells participating in antigen-specific immune
responses (Osterloh et al., 2006). How does proteasome-mediated MHCI and II presentation
modulates selection is still unclear. Differential effects on MHCI and MHCII may partially
explain why CD4+ thymocytes are faster depleted than CD8+ thymocytes. Alternatively CD8+ and
CD4+ thymocytes may need different times to complete differentiation in thymus. Our results
show how CD4+ are stronger affected than CD8+ thymocytes, but CD8+ is the only population
which did not fully recover after 14 days. DP thymocytes are as well the most affected
population. These data support the possibility of modulation of selection as an additional
mechanism induced by bortezomib treatment (Grimm et al., 1996; Dallaporta et al., 2000).
The UPR senses unfolded proteins in the ER lumen and transmits that information to the cell
nucleus, where it drives a transcriptional program that is can re-establish intracellular
homeostasis (Bernales et al., 2006). If the stress is prolonged, or an adaptive response fails,
61
apoptotic cell death ensues (Szegezdi et al., 2006). Previous investigation in our group and others
has demonstrated that the proapoptotic effect of bortezomib in multiple myeloma cells is mainly
due to the accumulation of unfolded proteins in cells with high protein biosynthesis (Meister et
al., 2007).
We could not observe major deregulation of classical anti-apoptotic proteins like bcl2, bclX,
PARP cleavage, or deregulation of NF-κB activity (Figures 15, 16 and 17), which are usually
reported to play a dominant role during proteasome inhibition induced cell death in other
systems.
In order to trigger cell death, concrete spatial and temporal coordination of ER stress and the
UPR response are mediated by Hsp70 chaperones and the transcription factor C/EBP homologous
protein (CHOP). The cytoplasmic Hsp70 chaperone machinery subjects misfolded and
endoplasmic reticulum import-incompetent proteins to degradation via the ubiquitin-proteasome
system (Park et al., 2007). On the other hand, CHOP is activated by ER stress, and its deletion
protects against its lethal consequences. CHOP deletion protects cells from ER stress by
decreasing ER client protein load and changing redox conditions within the organelle (Wang et
al., 1996; Marciniak et al., 2004). In concordance with this, the major strong deregulation in our
experiments was observed in Hsp70 and CHOP protein concentrations (Fig 15), unraveling the
ER-stress with activation of the terminal UPR as the putative mechanisms underlying the
observed cell death induction.
Thus, activation of terminal caspases without PARP cleavage and induction of Hsp70 and CHOP
without marked changes in NF-κB activity configure all together a new scenario in apoptosis
commitment during T cell development, and this requires further research to unveil how all these
molecular pathways merge.
It can be argued that proteasome inhibition through bortezomib administration could lead to the
observed imbalance in lymphocyte subpopulations mostly by deregulating the proliferative
capacities of the affected cells. Although this could be the case, we cannot disclose it because cell
death is taking place in high extension simultaneously. However we did not exclusively observe
effects in highly proliferative subsets. Another argument could be that proliferating cells might be
even more sensitive. Nevertheless, our in vitro experiments confirmed that even if proliferative
capacities are altered, the apoptosis is induced independently, as thymocytes in our culture
conditions should not proliferate.
62

In addition, Rag protein degradation might be inhibited by proteasome inhibitors. Rag protein
concentrations are mostly controlled in a post-transcriptional manner and throughout cell cycle
(Hsu et al. 2003; Yu et al., 1999, Lin et al., 1994), which may contribute to explain the blockade
in lymphocyte development observed after proteasome inhibition. This last observation could
very well fit with the recently E3 ubiquitin ligase activity discovered in the Rag1 protein
(Yurchenko et al. 2003).
63
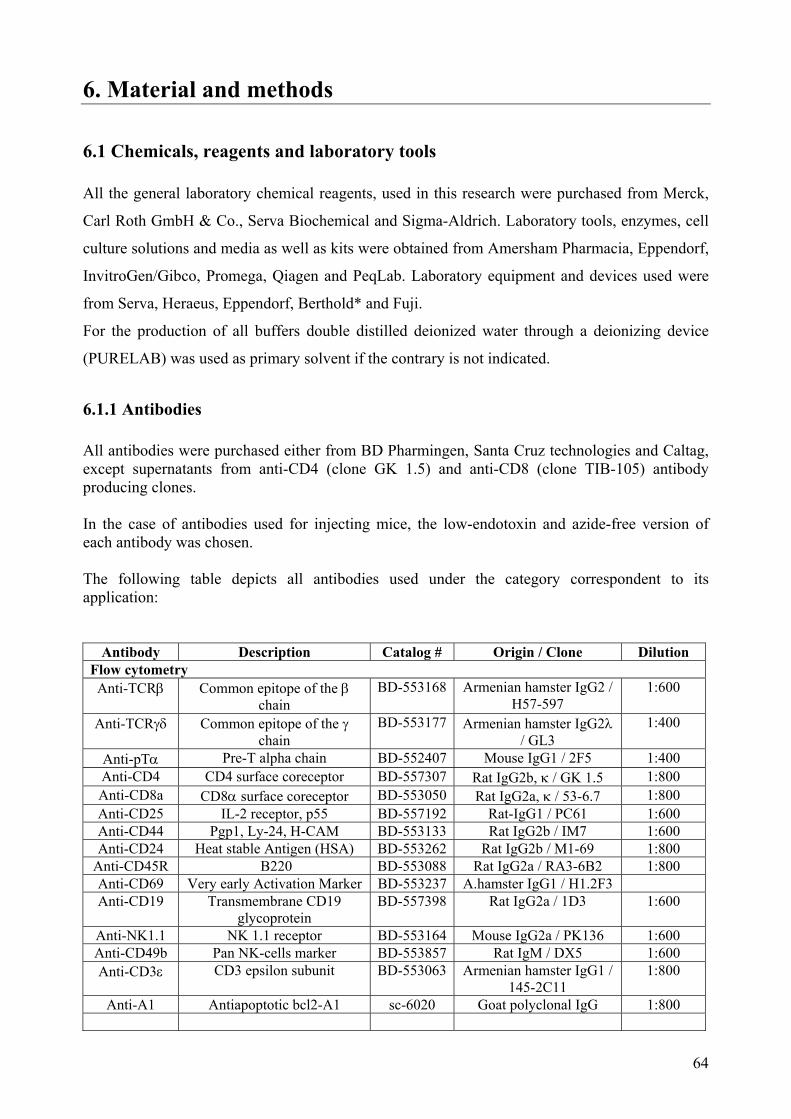
6. Material and methods
6.1 Chemicals, reagents and laboratory tools All the general laboratory chemical reagents, used in this research were purchased from Merck,
Carl Roth GmbH & Co., Serva Biochemical and Sigma-Aldrich. Laboratory tools, enzymes, cell
culture solutions and media as well as kits were obtained from Amersham Pharmacia, Eppendorf,
InvitroGen/Gibco, Promega, Qiagen and PeqLab. Laboratory equipment and devices used were
from Serva, Heraeus, Eppendorf, Berthold* and Fuji.
For the production of all buffers double distilled deionized water through a deionizing device
(PURELAB) was used as primary solvent if the contrary is not indicated.
6.1.1 Antibodies All antibodies were purchased either from BD Pharmingen, Santa Cruz technologies and Caltag, except supernatants from anti-CD4 (clone GK 1.5) and anti-CD8 (clone TIB-105) antibody producing clones. In the case of antibodies used for injecting mice, the low-endotoxin and azide-free version of each antibody was chosen. The following table depicts all antibodies used under the category correspondent to its application:
Antibody Description Catalog # Origin / Clone Dilution Flow cytometry Anti-TCRβ Common epitope of the β
chain BD-553168 Armenian hamster IgG2 /
H57-597 1:600
Anti-TCRγδ Common epitope of the γ chain
BD-553177 Armenian hamster IgG2λ / GL3
1:400
Anti-pTα Pre-T alpha chain BD-552407 Mouse IgG1 / 2F5 1:400 Anti-CD4 CD4 surface coreceptor BD-557307 Rat IgG2b, κ / GK 1.5 1:800 Anti-CD8a CD8α surface coreceptor BD-553050 Rat IgG2a, κ / 53-6.7 1:800 Anti-CD25 IL-2 receptor, p55 BD-557192 Rat-IgG1 / PC61 1:600 Anti-CD44 Pgp1, Ly-24, H-CAM BD-553133 Rat IgG2b / IM7 1:600 Anti-CD24 Heat stable Antigen (HSA) BD-553262 Rat IgG2b / M1-69 1:800
Anti-CD45R B220 BD-553088 Rat IgG2a / RA3-6B2 1:800 Anti-CD69 Very early Activation Marker BD-553237 A.hamster IgG1 / H1.2F3 Anti-CD19 Transmembrane CD19
glycoprotein BD-557398 Rat IgG2a / 1D3 1:600
Anti-NK1.1 NK 1.1 receptor BD-553164 Mouse IgG2a / PK136 1:600 Anti-CD49b Pan NK-cells marker BD-553857 Rat IgM / DX5 1:600 Anti-CD3ε CD3 epsilon subunit BD-553063 Armenian hamster IgG1 /
145-2C11 1:800
Anti-A1 Antiapoptotic bcl2-A1 sc-6020 Goat polyclonal IgG 1:800
64
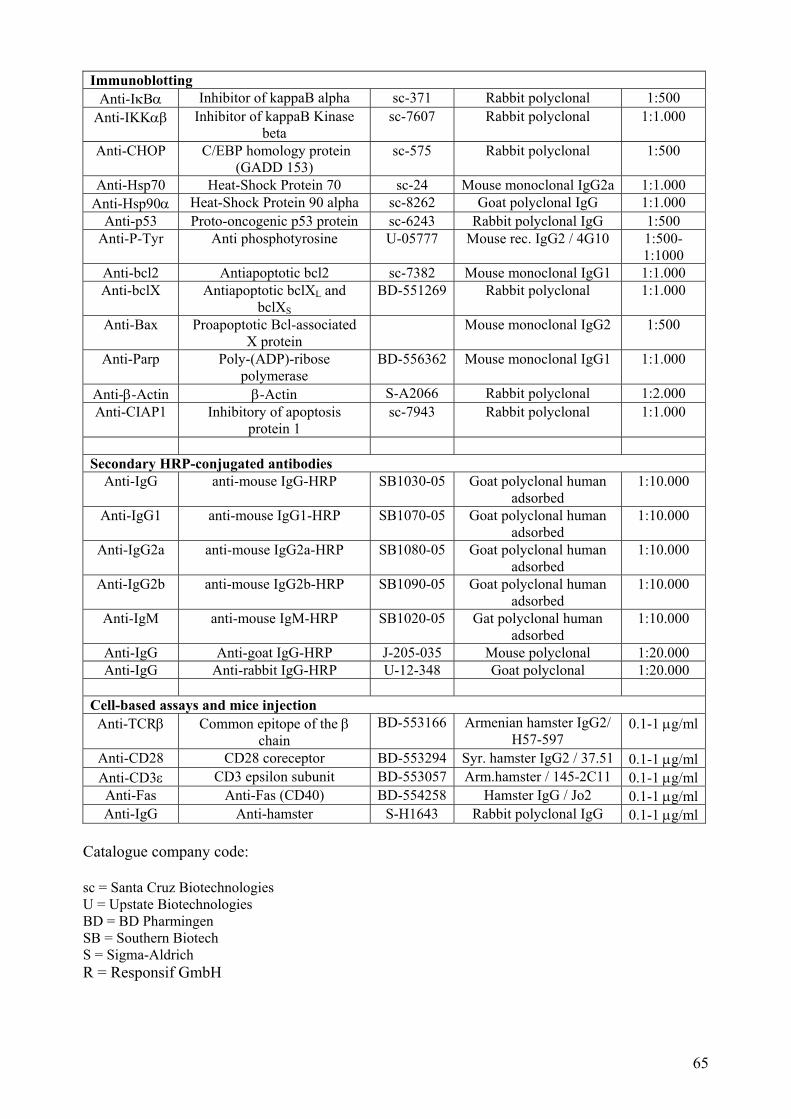
Immunoblotting Anti-IκBα Inhibitor of kappaB alpha sc-371 Rabbit polyclonal 1:500
Anti-IKKαβ Inhibitor of kappaB Kinase beta
sc-7607 Rabbit polyclonal 1:1.000
Anti-CHOP C/EBP homology protein (GADD 153)
sc-575 Rabbit polyclonal 1:500
Anti-Hsp70 Heat-Shock Protein 70 sc-24 Mouse monoclonal IgG2a 1:1.000 Anti-Hsp90α Heat-Shock Protein 90 alpha sc-8262 Goat polyclonal IgG 1:1.000
Anti-p53 Proto-oncogenic p53 protein sc-6243 Rabbit polyclonal IgG 1:500 Anti-P-Tyr Anti phosphotyrosine U-05777 Mouse rec. IgG2 / 4G10 1:500-
1:1000 Anti-bcl2 Antiapoptotic bcl2 sc-7382 Mouse monoclonal IgG1 1:1.000 Anti-bclX Antiapoptotic bclXL and
bclXS
BD-551269 Rabbit polyclonal 1:1.000
Anti-Bax Proapoptotic Bcl-associated X protein
Mouse monoclonal IgG2 1:500
Anti-Parp Poly-(ADP)-ribose polymerase
BD-556362 Mouse monoclonal IgG1 1:1.000
Anti-β-Actin β-Actin S-A2066 Rabbit polyclonal 1:2.000 Anti-CIAP1 Inhibitory of apoptosis
protein 1 sc-7943 Rabbit polyclonal 1:1.000
Secondary HRP-conjugated antibodies
Anti-IgG anti-mouse IgG-HRP SB1030-05 Goat polyclonal human adsorbed
1:10.000
Anti-IgG1 anti-mouse IgG1-HRP SB1070-05 Goat polyclonal human adsorbed
1:10.000
Anti-IgG2a anti-mouse IgG2a-HRP SB1080-05 Goat polyclonal human adsorbed
1:10.000
Anti-IgG2b anti-mouse IgG2b-HRP SB1090-05 Goat polyclonal human adsorbed
1:10.000
Anti-IgM anti-mouse IgM-HRP SB1020-05 Gat polyclonal human adsorbed
1:10.000
Anti-IgG Anti-goat IgG-HRP J-205-035 Mouse polyclonal 1:20.000 Anti-IgG Anti-rabbit IgG-HRP U-12-348 Goat polyclonal 1:20.000
Cell-based assays and mice injection Anti-TCRβ Common epitope of the β
chain BD-553166 Armenian hamster IgG2/
H57-597 0.1-1 μg/ml
Anti-CD28 CD28 coreceptor BD-553294 Syr. hamster IgG2 / 37.51 0.1-1 μg/mlAnti-CD3ε CD3 epsilon subunit BD-553057 Arm.hamster / 145-2C11 0.1-1 μg/mlAnti-Fas Anti-Fas (CD40) BD-554258 Hamster IgG / Jo2 0.1-1 μg/mlAnti-IgG Anti-hamster S-H1643 Rabbit polyclonal IgG 0.1-1 μg/ml
Catalogue company code: sc = Santa Cruz Biotechnologies U = Upstate Biotechnologies BD = BD Pharmingen SB = Southern Biotech S = Sigma-Aldrich R = Responsif GmbH
65
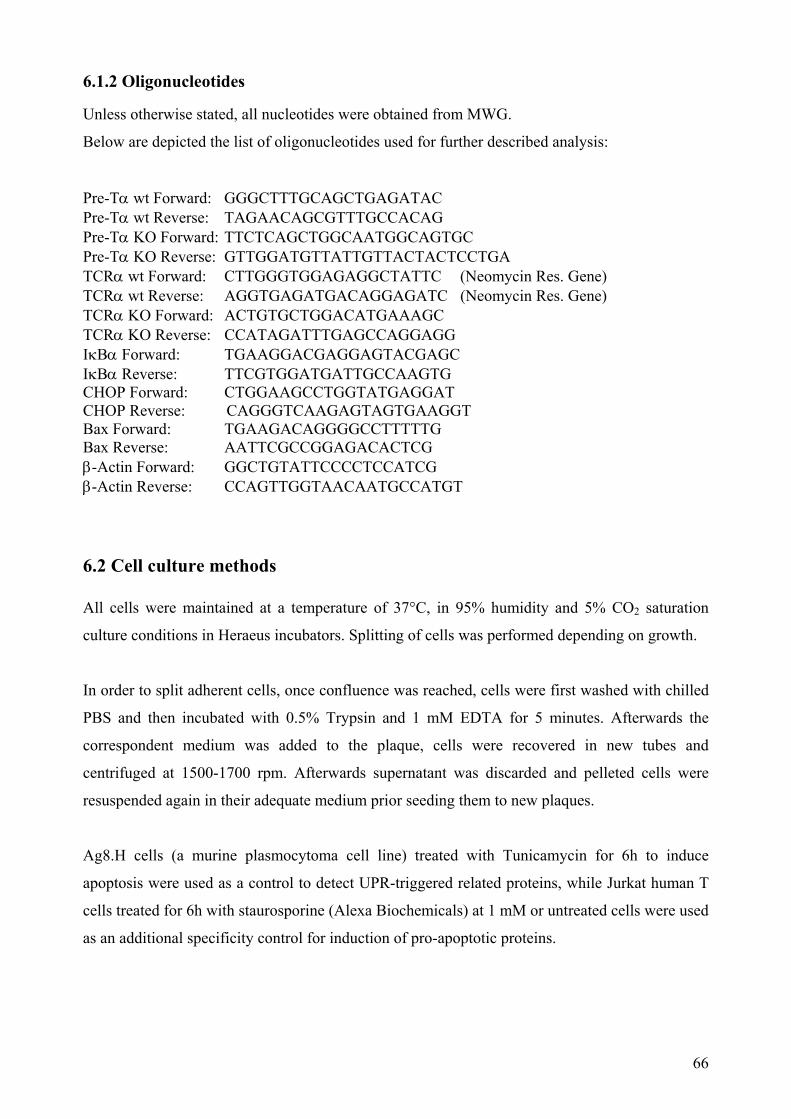
6.1.2 Oligonucleotides
Unless otherwise stated, all nucleotides were obtained from MWG.
Below are depicted the list of oligonucleotides used for further described analysis:
Pre-Tα wt Forward: GGGCTTTGCAGCTGAGATAC Pre-Tα wt Reverse: TAGAACAGCGTTTGCCACAG Pre-Tα KO Forward: TTCTCAGCTGGCAATGGCAGTGC Pre-Tα KO Reverse: GTTGGATGTTATTGTTACTACTCCTGA TCRα wt Forward: CTTGGGTGGAGAGGCTATTC (Neomycin Res. Gene) TCRα wt Reverse: AGGTGAGATGACAGGAGATC (Neomycin Res. Gene) TCRα KO Forward: ACTGTGCTGGACATGAAAGC TCRα KO Reverse: CCATAGATTTGAGCCAGGAGG IκBα Forward: TGAAGGACGAGGAGTACGAGC IκBα Reverse: TTCGTGGATGATTGCCAAGTG CHOP Forward: CTGGAAGCCTGGTATGAGGAT CHOP Reverse: CAGGGTCAAGAGTAGTGAAGGT Bax Forward: TGAAGACAGGGGCCTTTTTG Bax Reverse: AATTCGCCGGAGACACTCG β-Actin Forward: GGCTGTATTCCCCTCCATCG β-Actin Reverse: CCAGTTGGTAACAATGCCATGT
6.2 Cell culture methods All cells were maintained at a temperature of 37°C, in 95% humidity and 5% CO2 saturation
culture conditions in Heraeus incubators. Splitting of cells was performed depending on growth.
In order to split adherent cells, once confluence was reached, cells were first washed with chilled
PBS and then incubated with 0.5% Trypsin and 1 mM EDTA for 5 minutes. Afterwards the
correspondent medium was added to the plaque, cells were recovered in new tubes and
centrifuged at 1500-1700 rpm. Afterwards supernatant was discarded and pelleted cells were
resuspended again in their adequate medium prior seeding them to new plaques.
Ag8.H cells (a murine plasmocytoma cell line) treated with Tunicamycin for 6h to induce
apoptosis were used as a control to detect UPR-triggered related proteins, while Jurkat human T
cells treated for 6h with staurosporine (Alexa Biochemicals) at 1 mM or untreated cells were used
as an additional specificity control for induction of pro-apoptotic proteins.
66
6.2.1 Cultivation of immortalized non-adherent cell lines Cell lines employed include Jurkat T cells (lymphoma-derived cells), Ag8H B cells (half-
adherent myeloma derived cells). If not explicitly indicated so, cells were always cultivated in
RPMI cell medium supplemented with 10% fetal calf serum (FCS), penicillin (100 U/ml),
streptomycin (100 μg/ml) and L-Glutamine (2 mM). Cells were split and diluted 1:5 or 1:10 once
the medium colorant indicated the first signs of starvation.
6.2.3 Cultivation of primary lymphocytes
Primary lymphocytes were cultured in RPMI cell medium supplemented with 10% FCS, 2 mM
Glutamine, 20 μM HEPES, 100 U/ml penicillin at and 100 μg/ml streptomycin. All T cells were
cultured in lymphocyte medium with additional 50 μM β-mercaptoethanol (T-cell medium).
When needed, additional cytokines were added as follows: 1-5 ng/ml recombinant mouse IL-2
and 1-2 ng/ml recombinant mouse IL-7.
6.2.4 Cocultures of thymocytes with OP9 and OP9-Dll1 stroma cells OP9 Murine thymus derived stroma cells with or without constitutive expression of the Notch
ligand Delta-like 1 (Dll1) were grown up and maintained in α-MEM according to the indications
given in the article from Ciofani et al., 2005. Once cells reached monolayer confluence,
thymocytes were cocultured and medium replaced to T cell medium supplemented with
recombinant murine IL-7 (BD Pharmingen) at 2 ng/ml. Cell cocultures lasted for 5 or 14 days.
When needed, thymocytes were recovered from those cultures and places into freshly confluent
new OP9-Dll1 cells for further cultivation.
6.2.5 Long-term storage of cells
To cryopreserve cells, a pellet was first obtained and cells were resuspended in RPMI with 70%
FCS and 8% Dimethylsulfoxide (DMSO). All the steps were carried at 4°C or ice-chilled and
cells were then slowly frozen at -70°C before being brought into liquid nitrogen conservation
tanks. When needed to cultivate again, cells were rapidly thaw at 37° and washed in their
correspondent medium prior to seed.
67
6.3 Animal (rodent) experimentation 6.3.1 Mice strains C57BL/6NCrl and Balb/C mice were purchased from Charles River laboratories Inc. / Jackson
laboratories, while pTα and TCRα knockout mice were a kind gift from H.J Fehling and H.von
Boehmer. Pre-TCRα-/- and TCRα-/- were then crossed to obtain the double pTα-/- x TCRα-/-
knockout (DKO) mice. RAG2-/- and TCRβ-/- x TCRδ-/- in C57BL/6 genetic background served as
control strains.
Genotyping of all mouse strains was performed according to PCR protocols established by the
Jackson laboratories and optimized for our devices. Primers used for genotyping are listed in
7.1.2.
6.3.2 Mice handling and treatments All mice were kept in the animal house of the department of Internal Medicine 3 at the University
Clinic Erlangen-Nuernberg according to the internal animal care and FELASA statements. All
mice were sacrificed by administration of CO2 gas in closed cages.
Antibody administration was carried at a dose of 5-10 μg/10 mg mouse weight of isotype control
mock, anti-TCRβ, anti-CD28 or anti-CD3α mAb diluted in 200 μl PBS was injected in the tail-
vein or peritoneum. Five to ten days later mice were sacrificed for further analysis.
For the proteasome inhibitor experiments, three to five age-matched female mice Balb/C mice of
6 to 8 weeks age received a single injection into the tail vein with either PBS alone or bortezomib
(PS-341 or Velcade®, obtained from the University Hospital Pharmacy of Erlangen) dissolved in
PBS at a dose of 0.75 mg/kg doses. Mice were sacrificed and cells from different organs analyzed
8, 16, 24 hours or 2, 3, 7 and 14 days after the single injection.
6.4 Preparation of single cell suspensions from blood and lymphoid organs 6.4.1 Isolation of total cells from bone marrow, spleen, blood and thymus After sacrifice of mice, cut of the skin and opening of the peritoneum, thymus and spleen were
removed and mashed through a 70 μm diameter pore-size strainer with a syringe plunger to
disrupt thymus structure and release the cells. The strainer was rinsed with either culture medium
68
or FACS-buffer with additional 1-2 mM EDTA to prevent clumping of cells due to DNA release
from dying and disrupted cells. Cells were then centrifuged at 1600 rpm 10min once with either
medium or FACS-buffer in 50ml or 15 ml tubes. The pellet was carefully and repeatedly
resuspended in 1 ml of erythrocyte lysis buffer per each 2x10⁶ cells. Incubation was then carried
at room temperature for 1 minute per each 2x10⁶ cells and cells were filled up to 50 ml, then
centrifuged again 10 min at 1600 rpm and supernatant was discarded. Finally, the cell pellet was
resuspended in the appropriate medium or buffer volume for performing the desired following
experiment. All buffers used except the erythrocyte lysis buffer were chilled and kept on ice or at
4°C.
Bone marrow cells were obtained from femur and xx bones of mice. Muscles and xxx tissue was
cut and removed and then both extremes of the bones were cut. Then an appropriate diameter
syringe was used to make medium or FACS-buffer flow through the bone medullas and the eluate
was collected in 15 ml tubes
6.4.2 Purification of lymphocyte subtypes through magnetic cell sorting Cell subsets were purified with specific mAbs coupled to magnetic beads, carrying either positive
or negative sortings (marked cells are to be preserved or discarded respectively). Cells were then
sorted using an AutoMACS sorter (Miltenyi Biotec, Bergisch Gladbach, Germany).
Alternatively, magnetic beads conjugated to Rat anti-mouse IgG (BioMag beads, Qiagen) were
added to thymocytes previously incubated with supernatants from GK1.5 and TIB-105 clone
(anti-CD4 and anti-CD8 secreting clones respectively). Then magnetic beads were incubated with
the marked cells for 30 minutes with soft shaking. After incubation, magnetic beads-binding cells
were depleted using a Qiagen magnetic separator twice and the negative fraction was recovered
for further analysis.
6.4.3 Purification of lymphocyte subtypes with high speed cell sorter (MoFlo) Cell sorting was performed with a MoFlo Sorter from Dako Cytomation Corporation after
fluorochrome-conjugated mAbs stainings. Gating was always performed to avoid cell duplets and
dying or undesired cells by pre-gating on FCS-SSC. Isolated fractions were re-analyzed after
sorting for assuring a purity of >98%. Recovered cells after sorting were collected in medium for
further analysis or cultivation.
69
6.5 Flow cytometry cell analysis 6.5.1 Cell count determination and viability Numbers of cells were determined with the help of a Neubauer counting chamber. An aliquot of
cells suspension was obtained from samples and mixed with at least 1:10 (V/V) of a 4% trypan
blue solution in PBS to identify dead cells, which are permeable to this dye and therefore stain
intracellular with dark blue color (also called vital dye). The concentration of cells was estimated
using the following formula:
Negative trypan blue cells/big quadrant x dilution factor x 104 = cells/ml.
Mean values of four quadrants were always calculated.
6.5.2 Surface staining and fluorescence activated cell sorting analysis (FACS) Thymus, bone marrow and spleen single cells suspension were washed once with medium. Cells
were incubated with anti-Fcγ II/III receptors (CD16 and CD32, clone FCR 4G8, Caltag
Biotechnologies) polyclonal antibody for 30 minutes in PBS with 5% FCS. Cells were then
washed and stained in 5 % FCS-supplemented PBS buffer (106 cells/200 μl) with diverse
combinations of fluorochrome-conjugated antibodies directed against CD4, CD8, CD25, CD44,
CD24, TCRβ, TCRγ, NK1.1, Pan-NK, pre-Tα, CD45R (B220), CD19, IgG, IgM and
Streptavidin. All antibodies were purchased from BD Pharmingen. All data were obtained using
FACScalibur and analyzed using Cellquest Software (BD Pharmingen).
For amplifying the cell surface signal of immature DN3 and DN4 cells a surface enzyme
biotynilation kit was used (Enzyme Amplification Staining, EAS from Flow-Amp, Cleveland).
Additionally, a 3-step amplification FACS staining for detection of the pre-Tα was used using
anti-mouse TCRβ-biotin, then Streptavidin-rat IgG1 and finally anti-rat IgG1-FITC.
6.5.3 Intracellular staining with fluorescent-marked monoclonal antibodies Intracellular FACS analysis was performed using the cytofix/cytoperm kit from BD prior to
regular flurochrome-mAb staining. A first short incubation with low-detergent containing buffer
permeablized the cells, then washed with PBS and fixed with 2-4%-paraformaldehyde.
Fluorochromes-stained mAbs were then added to the permeabilized and fixed cells in PBS
containing 5%FCS prior to flow cytometry analysis.
70
6.5.4 Cell cycle analysis Cell cycle stages were determined by the double-stranded DNA binding/intercalating capacity of
the colorant propidium iodide (PI). Cells of interest were first fixed by incubation with ethanol
70% in PBS for 20 minutes at room temperature. Cells were then rinsed with PBS and the clean
pellet was incubated with 500 μl PI solution / 5x10⁵ cells for 30 minutes at room temperature. A
final rinse step with PBS was performed before analyzing by flow cytometry.
PI Solution (10 ml): PBS 19.15 /17.15 ml MgCl2 250 ul (Stock 100 mM) PI 200 ul (Stock 1 mg/ml) RNAse A 200 ul / 2 ml (Stock 5000 U/ml or Stock 10 mg/ml) *
.
According to their fluorescence intensity, cells were then assigned to regions corresponding to
SubG1, G1, S and G2M phases identified in the FL2 histograms.
6.5.5 Intracellular Ca2+ flux determination Calcium flux measurements were performed by measuring the ratio fluorescent signal given by
staining with Ca2+-binding fluorochrome Indo-1AM to either saturated or free Ca2+ molecules.
0.5x10⁶ cells in 100 μl T-cells medium were first incubated with surface marker flurocohrome-
stained mAbs for 20 minutes at 4°C and then with Indo-1-AM (Molecular Probes, I1202) at 1-2
μM and Pluronic F-127 detergent during 25 minutes at 30°C. 100 μl of extra T cells medium
were added and 10 minutes later cells were washed twice with Krebs-Ringer solution. Cells were
then resuspended at 0.5x10⁶ cells/0.1 ml Krebs-Ringer solution and chilled on ice before an anti-
TCRβ or anti-Isotype mAb were added at 1μg/ml. Cells were kept on ice additional 30 minutes
and after that 500 μl of 37°C-warm Krebs-Ringer solution together with a polyclonal anti-
hamster IgG (0.1 or 0.2 μg/ml) was added to induce cross-reaction exactly 1 minute prior to
analysis. A BD LSR flow cytometer was used to acquire data during 90 seconds after the
stimulation. Data were further analyzed and represented using FlowJo software (Tree Star, Inc.,
Ashland, OR). As a cell-autonomous Ca2+ “charge” control, full-scale deflection of the calcium
flux was measured by addition of ionomycin instead of the mAbs at 1-10 μg/ml to evaluate the
absolute Ca2+ potential release capacity of the cells. CD4+ cells served as reference to optimize
assay settings prior to all analysis initiation. Additionally, contribution of internal stores of Ca2+
can be measured by resuspending cells in calcium-free medium and then adding ionomycin.
71
Krebs-Ringer solution
HEPES (pH 7.0) 10 mM 2,3 g NaCl 140 mM 8,18 g KCl 4 mM 0,29 g MgCl2 1 mM 0,20 g CaCl2 1mM 0,15 g Glucose 10 mM 1,8 g
1 l ddH20
6.5.6 Induction of apoptosis and apoptotic stage determination
Cell death was determined by surface binding capacity of FITC labeled-Annexin V (Chicken
recombinant annexin V, Responsif GmbH, Erlangen, Germany) to exposed membrane
Phosphatidylserine residues together with propidium iodide (PI) exclusion capacity of vital cells,
and then analyzed with a FACSCalibur (BD Biosciences). An.V+ / PI- cells were regarded as
“apoptotic” while An.V+/PI+ cells were considered “necrotic”. For cell death induction in ex vivo
cell culture we used staurosporine at 10 µM and anti-murine Fas 100 U/ml. Proteasome inhibitors
MG132 and bortezomib were added at 1 μg/ml.
Ex vivo lymphocyte culture was performed with primary thymocytes at 1-2x10⁵ cells/well in 96-
well or 6-well plates. Cells were freshly isolated and cultured in RPMI supplemented with 10%
FCS, penicillin 100 U/ml, 100 μg/ml streptomycin, 20 mM HEPES and 50 μM beta-
mercaptoethanol (all products from Invitrogen GmbH, Karlsruhe, Germany). Additionally, cell
media was prepared with 0.5 or 1 μM anti-TCRβ or anti-CD28 mAbs, or cell death inductors (10
μM staurosporine, Alexis biochemicals or 0.2 μM anti-Fas mAb).
6.5.7 CFSE staining for flow cytometry analysis
Carboxyfluorsecein Diacetate Succinimidyl Ester (CFSE) is a proliferation measure reagent
which spontaneously and irreversibly couples to both intracellular and cell surface proteins by
reaction with lysine side chains and other available amine groups. Its dilution monitors
cytokinesis as a result of its equal distribution in daughter cells. Thus, halving of cellular
fluorescence intensity marks each successive generation in a population of proliferating cells.
Cells were resuspended in PBS supplemented with 5%FCS at 20x106 cells/ml and incubated with
5 μM CFSE (final concentration, from a stock in DMSO) for 5 minutes at RT. After the
72
incubation cells were thoroughly washed with 10 ml of the same buffer thrice, as CFSE is highly
toxic and any unbounded remaining CFSE must be completely discarded to avoid staining of
other cells. The cells were then resuspended in the desired concentration for either in vitro further
culture or in vivo injection and tracking.
6.6 DNA and RNA methods 6.6.1 Standard DNA methods
Precipitation of DNA, plasmids isolation (Mini- or Midipreps), digestion with restriction
enzymes, ligation, separation and recovery of plasmid fragments from agarose gels were all
performed according to protocol descriptions of the “Protocols in molecular Biology” Handbook,
by Maniatis et al. If a commercial kit was used, instructions according to manufacturer’s
description were followed.
6.6.2 Polymerase-Chain Reaction (PCR)
A general PCR reaction contained 10-100 ng of DNA, 10 pmol of each forward and reverse
oligonucleotide primers, 1x PCR buffer, 100 mM dNTPs, 20 mM MgCl2 and 1 U Taq
polymerase / 30 μl final reaction volume. The following general program was performed in an
Eppendorf Mastercycler Thermocycler:
“Hot start” 94°C 2 min. Denaturation 94°C 30 sec. Hybridization X°C 30 sec. Elongation 72°C 1-2 min
Temperature and time for elongation and hybridization phases were optimized for each
oligonucleotide primer pair to obtain a stable and clear amplification.
Resulting amplicons were supplemented with loading buffer (glycerol) and then analyzed for
proper size in a 0.7-1.2 % agarose gel with 0.2 μg/ml ethidium bromide run at 80-100V till
appropriate separation of fragments was achieved. Gels were analyzed in a UV light and video
camera chamber for documentation.
73
6.6.3 Genotyping of transgenic and knockout mice
A 5 mm length small biopsy of mouse tail was cut and digested overnight in 200-300 μl tail-
buffer with additional 1 mg/ml recombinant proteinase K from Pichia pastoris in 1.5 ml tubes at
56°C. On the next day the tubes were heated to 95°C for 10 minutes and then centrifuged 5
minutes at 10.000 rpm. The supernatant was then recovered in fresh sterile 1.5 ml tubes
Tail-buffer: Tris-HCl pH 8.0 10 mM
KCl 50 mM EDTA 2.5 mM NP-40 0.45% Tween20 0.45%
PCR was then performed as described in 7.6.2 using the recovered supernatant as sample DNA
source. Primes used for each mouse line are described in 7.1.2
6.6.4 Standard RNA methods RNA concentration and protein or xxx contamination was evaluated through spectrophotometry.
Determination of absorbance at 260, 280 and 242 nm and calculation of 260/280 ratios were used
to ensure the quality of the samples obtained. 260/280 values over 1.70 were considered
appropriate for primary cells, while for cell culture cells this value was elevated to 1.90.
Cells were either freshly isolated or thawed from -80°C. Isolation of total mRNA from total
thymocytes, sorted thymocytes or CD19+ bone marrow B cells obtained by magnetic-labeled
beads separation (Miltenyi Biotec, Bergisch Gladbach, Germany) was performed with the
QIAGEN mini RNAeasy kit. 2-5x10⁶ cells were used for thymocytes while 2x10⁶ cells were used
for CD19+ bone marrow cells. The obtained total mRNA was digested with DNAse I (Fermentas
GmbH, St. Leon Rot, Germany) during 30 min at 37°C before synthesizing cDNA with a Reverse
transcriptase system from Promega (Mannheim, Germany).
Synthesis of cDNA was performed using 250 ng-1 μg of total cellular RNA. The reverse
transcription reaction was carried using oligo-dTs and the SuperScript-II polymerase following
instructions of the manufacturer (InVitrogen). 2-4 μl from a 1:5 dilution in DEPC-treated water
were used as single-stranded cDNA templates for PCR reactions.
6.6.5 Real-time PCR analysis 74
Sample cDNA was used as template for quantitative real time PCR reactions with the
correspondant primers indicated in 7.1.2 and absolute qRT-PCR SYBR green ROX reagent
(Abgene, Hamburg, Germany) according to manufactures instructions. Quantitative real-time
PCR was performed in triplicates for each sample in an Applied Biosystems 7300 real-time PCR
system (Applied Biosystems, Darmstadt, Germany).
6.7 Protein methods 6.7.1 Whole cells protein extraction and quantification. Whole cell lysates were obtained as well by direct lysis in laemli buffer. Each 5x10⁵-1x10⁶ cells
(depending on cell size and cytoplasmic content) were first washed with PBS, pelleted and then
resuspended in 50 μl of Laemmli buffer with freshly added β-mercaptoethanol per each 2-4x10⁶
cells. Then tubes were vortexed for 30s and heated to 96°C for 5 minutes. Alternatively, whole
cell lysates were obtained after 30 minutes incubation at 4°C in RadioImmunoPrecipitation Assay
(RIPA) or NET buffer.
RIPA buffer (10x, pH 6.8) Tris-HCl, pH 7.5 0.5 M NaCl 1.5 M Na-Deoxycholate 2.5% EDTA pH 7.5 10 mM
NET Buffer (10x, pH 7.4 with HCl. Store aliquots at -20°C)
NaCl 1.5 M EDTA 50 mM Tris-HCl 0.5 M NaAz 1%
Laemmli buffer (4x, 100 ml)
Tris-HCl pH 6.8 1M 6.25 ml SDS 5% 20 ml Glycerol 7.7 M 25 ml Bromophenol blue 0.1% 10 ml
Fill up with H20bd to 100 ml A general protease inhibitors cocktail (Complete, Roche) was added to all protein extracts to
prevent protein degradation. Alternatively, a set of protease inhibitors (Aprotinin, leupeptin,
pepstatin at 1mg/ml, phenylmethylsulfonylfluorid (PMSF) and Dithiotreithol (DTT) at 1mM) and
phosphatase inhibitors (1 mM Sodium Fluoride (NaF), Orthovanadate and β-glycerolphosphate)
were added to all lysates.
75
Protein concentration was evaluated either by direct staining with coomasie blue of the gel (1-4h
incubation) and further destaining or previous to gel loading with BCA colorimetric-based test
from PeqLab.
6.7.2 Nuclear and cytoplasmic protein extraction Dry pellets (frozen or not) were resuspended in 45 μl / 1-2x10⁶ cells of ice-cold NAR A buffer in
1.5 ml tubes (low-protein binding tubes, Eppendorf) and left to swell for 5-10 min. Then 5 μl of
NP-40 1% was added and left at room temperature for 2-5 minutes Suspensions were then
vortexed strongly for 10-60 seconds and centrifuged 5 min at 3000 rpm. Supernatant contained
the cytoplasmic proteins, while a transparent and leaky nuclear pellet is then formed which was
recovered in new 0.5 ml tubes by suction with pipette tips. This nuclear pellet was then
resuspended in 20 μl high-salt containing ice-cold NAR C buffer and vigorously shacked at 4°C
for 30-60 minutes. Subsequently, tubes were centrifuged at 14.000 rpm for 30 minutes and
supernatant recovered in new 0.5 ml tubes.
NAR A: HEPES pH 7.9 10 mM (10 ml of 100 mM stock) (100 ml) KCl 10 mM (0.5 ml of 2 M stock)
EDTA 0.1 mM (20 μl of 0.5 M stock pH 8.0) H2Obd up to 100 ml
NAR C: HEPES pH 7.9 20 mM (20 ml of a 100 mM stock) (100 ml) NaCl 0.4 M (8 ml of a 5 M stock)
EDTA 1 mM (200 μl of a 0.5 M stock pH 8) H2Obd up to 100 ml The solution of 1% NP40 was freshly prepared, or in its defect frozen aliquoted 1% NP40 was
freshly thawed. Protease and phosphatase inhibitors described in 7.7.1 were added only prior to
use to both NAR A and NAR C buffers.
6.7.3 SDS-Polyacrilamide Gel Electrophoresis (PAGE)
Either Laemmli, NET or RIPA buffer whole cell lysates or nuclear/cytoplasmic extracts were
loaded in wells and separated by 7-12.5% PAGE. The first 3-4 cm of the gel where the loading
wells are located were stacking gel, while the rest till the bottom was running gel. Listed below
are the recipes of all buffers used as well as a table indicating the proportions of stacking and
running gels:
76
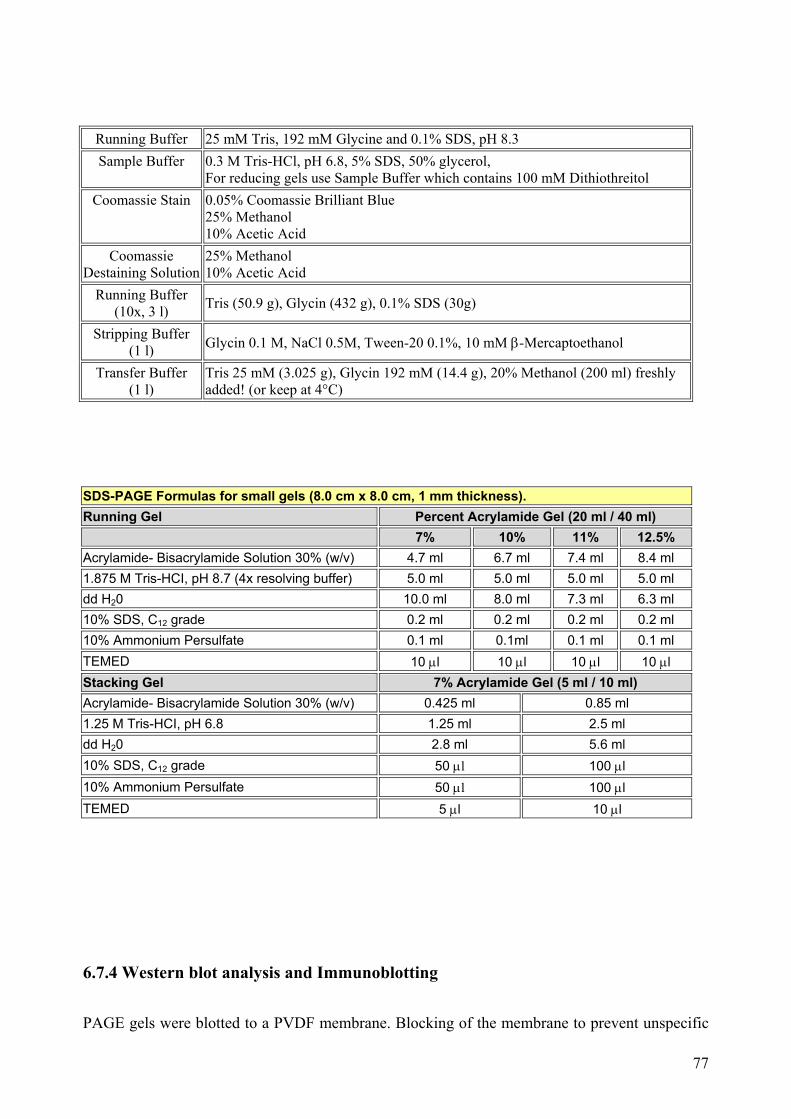
Running Buffer 25 mM Tris, 192 mM Glycine and 0.1% SDS, pH 8.3 Sample Buffer 0.3 M Tris-HCl, pH 6.8, 5% SDS, 50% glycerol,
For reducing gels use Sample Buffer which contains 100 mM Dithiothreitol Coomassie Stain 0.05% Coomassie Brilliant Blue
25% Methanol 10% Acetic Acid
Coomassie Destaining Solution
25% Methanol 10% Acetic Acid
Running Buffer (10x, 3 l) Tris (50.9 g), Glycin (432 g), 0.1% SDS (30g)
Stripping Buffer (1 l) Glycin 0.1 M, NaCl 0.5M, Tween-20 0.1%, 10 mM β-Mercaptoethanol
Transfer Buffer (1 l)
Tris 25 mM (3.025 g), Glycin 192 mM (14.4 g), 20% Methanol (200 ml) freshly added! (or keep at 4°C)
SDS-PAGE Formulas for small gels (8.0 cm x 8.0 cm, 1 mm thickness). Running Gel Percent Acrylamide Gel (20 ml / 40 ml) 7% 10% 11% 12.5% Acrylamide- Bisacrylamide Solution 30% (w/v) 4.7 ml 6.7 ml 7.4 ml 8.4 ml 1.875 M Tris-HCI, pH 8.7 (4x resolving buffer) 5.0 ml 5.0 ml 5.0 ml 5.0 ml dd H20 10.0 ml 8.0 ml 7.3 ml 6.3 ml 10% SDS, C12 grade 0.2 ml 0.2 ml 0.2 ml 0.2 ml 10% Ammonium Persulfate 0.1 ml 0.1ml 0.1 ml 0.1 ml TEMED 10 μl 10 μl 10 μl 10 μl Stacking Gel 7% Acrylamide Gel (5 ml / 10 ml) Acrylamide- Bisacrylamide Solution 30% (w/v) 0.425 ml 0.85 ml 1.25 M Tris-HCI, pH 6.8 1.25 ml 2.5 ml dd H20 2.8 ml 5.6 ml 10% SDS, C12 grade 50 μl 100 μl 10% Ammonium Persulfate 50 μl 100 μl TEMED 5 μl 10 μl
6.7.4 Western blot analysis and Immunoblotting
PAGE gels were blotted to a PVDF membrane. Blocking of the membrane to prevent unspecific
77
reactions was performed with 5% nonfat milk powder or 2% BSA in PBS containing 0.05%
Tween-20. Blots were probed with primary antibodies for 2 hours at room temperature or at 4°C
overnight with soft shacking. Then they were washed during 1 hour with TBS-T or PBS-T
changing the buffer each 15 minutes. After that, incubation with the secondary antibody was
performed during 1 hour at room temperature. Before developing, blots were washed again with
PBS-T for 30-60 minutes. After careful drying of the membrane, ECL chemiluminescence’s
solution was spread over the blot for 1-2 minutes and chemolumiscence signal was detected by
exposition in darkness to photographic films (from Kodak or Amersham Pharmacia).
All primary and secondary horseradish peroxidase conjugated (HRP) antibodies used for western
blot detections are listed in section 7.1.1. Blotted PVDF membranes were eventually dried and
protein detection performed again. The next antibody targeted a protein with a different weight
and/or was from different specie to avid cross-reactivity. The same membrane may as well be
stripped and new detection carried over, but there may be a considerable sensitivity and protein
loss in the step.
6.8 Electromobility Shift Assay (EMSA) EMSAs were performed as described by R.Voll et al, 1999. This protocols deals with handling of
radioactive material, and all precautions and state laws and statements must be strictly followed
according to that. Only radioactive prepared rooms and material should be used, and a
radioactivity exposure should be measured while working with radioactivity.
In order to minimize errors due to inaccurate sample loading, the DNA binding capacity to a κB
probe was related to the binding capacity to an Oct-1 probe. Then κB intensity values were
referenced to Oct-1 values, and this ratio was used as a measure of the nuclear NF-κB activity. In
this manner the obtained values are absolutely related to the nuclear protein concentration of the
constitutively active transcription factor Oct-1, which does not suffer major regulation till the SP
stages.
A retrotranscriptase reaction was performed using radioactive 32P marked dGTP to obtain the κB
and Oct-1 common DNA binding region probes. The reaction only added marked guanosines to
overhanging cytosines of the following double-stranded oligos.
78
κB Forward: CAT-CAG-AGG-GGA-CTT-TCC-GAG-GGA-T
κB Reverse: CAT-CCC-TCG-GAA-AGT-CCC-CTC-TGA-T
Oct-1 Forward: CTG-TCG-AAT-GCA-AAT-CAC-TAG-AA
Oct-1 Reverse: CTT-CTA-GTG-ATT-TGC-ATT-CGA-CA
The annealing of these oligos was performed by incubation at 92° for 3 minutes and cooling
down at RT for 20 minutes before freezing.
Annealing of dsDNA templates:
- Oligo1 (100 mM) 30 μl - Oligo2 (100 mM) 30 μl - STE-Buffer 60 μl (NaCl 150 mM, Tris 10 mM, EDTA 1 mM).
Then the radioactive probes were generated following the DNA-binding probe reaction:
First Strand Buffer 5x 6 μl DTT 0.1 M 1.5 μl ds Oligos* 2.5 μl Radioactive dCTP 4 μl RT Superscript II/III 1 μl H2Obd +10 mg/ml BSA 15 μl Total 30 μl
This mix was incubated at 37°C for 1-2 hours and then the whole volume was purified using
Probequant sephadex G-50 microcolumns (Amersham Pharmacia) to remove proteins and purify
the dsDNA generated. After that, 10 μl of EMSA cocktail were added to the nuclear extracts of
samples and DNA-dye to reach 20 μl of total volume to be loaded in each lane.
EMSA cocktail: Each sample Stock
dI-dC 1 μl 2mg/ml (competitor DNA) GTP 1 μl 60 mM (increases efficiency) BSA 2 μl 10 mg/ml Lipage binding buffer 10x 2 μl -- 32P-labelled probe 0.5 μl (depending on age of the probe) EMSA L.B. 0.5 μl H20bd 3 μl (depending on probe amount) Total 10 μl
An 8% Lipage-PA gel was first pre-run to remove unpolymerized TEMED and APS for 30 min.
without being loaded. After loading the mixed samples, it was run in Lipage buffer at 150V for 2-
3 hours. As this is a low-ionic strength buffer gel, the buffer of the running chamber should keep
on circulating (either with a peristaltic pump or by agitation).
79
Lipage Buffer (50x) Stock 50 x
Tris-HCl, pH 7.5 1 M 168 ml NaOAc, pH 7.0 3 M 27.5 ml EDTA, pH 8.0 0.5 M 50 ml H20bd up to 500 ml
Lipage binding buffer (10x) Stock 10 x
Tris-HCl, pH 7.5 1 M 1 ml NaCl 5 M 1 ml EDTA pH 7.5 0.5 M 0.2 ml Glycerol -- 5 ml H2Obd -- 2.8 ml Total 10 ml
Lipage gel (8%, 16x16 cm)
Polyacrilamide:bis 29:1 6.6 ml Lipage buffer 50x 1 ml H20bd 42 ml APS 10% 450 μl TEMED 28 μ
Once the gel was run, it was blotted* to Whatmann paper for 2-3 h with a gel-vacuum and drying
device. After that, a highly sensible photographic film or a fotosensible sheet was exposed to the
blot for 2-4 days at -70°C in darkness in a closed chamber. Intensity of the radioactive signal of
the bands was then either photographically developed or analyzed in a Fujifilm LAS-3000
phosphoimager. Intensity of bands was measured using the AIDA 2D software (Agilent
Technologies, Palo Alto CA) for imaging analysis.
6.9 Caspase activity assays
Caspases 3 and 7 activity was measured using a luciferase-based Caspase-Glo 3/7 assay kit
(Promega, Madison, WI, USA), in which cells are incubated with a DEVD-aminoluciferin
substrate according to the manufacturer’s instructions. A Sirius luminometer (Berthold AG, Bad
Wildbad, Germany) and a 96-well plate reader Spectramax 190 (Molecular Devices Corporation,
Sunnyvale, CA, U.S.) were used for quantification of caspase activity, which is given in relative
luminescence units (RLU). All samples were measured in triplicates at 3 different serial dilutions
ranging from 50.000 to 5.000 cells, respectively.
80

81
7. Abbreviations A Ampere Ab. Antibody (NOT Andi-body) APC Antigen Presenting Cell APC Allophycocyanin APS Ammonium Persulfate ATP Adenosin Triphosphate Ax. Annexin BiP Heavy chain Binding Protein BIS Bisacrilamide BM Bone Marrow BSA Bovine Serum Albumine bp base pair BCR B-Cell Receptor C° Celsius grade CD Cluster of Differentiation cDNA complementary DNA CHOP C/EBP Homologous Protein CLP Common Lymphoid Progenitor CyChr CyChrome (PE-Cy5 conjugated) Da Dalton dCTP Desoxicytosine triphosphate DKO Double Knockout DEPC Diethylpirocarbonate Dll1 Delta-like-1 protein DMSO Dimethylsulfoxide * DN Double Negative (CD4- and CD8-) DNA Desoxyribonucleicacid dNTP Desoxynucleotidetriphosphate DP Double Positive (CD4+ and CD8+) DTT Dithiothreitol ds double stranded ECL Enhanced Chemiluminiscence EDTA Ethylendiaminetetracetate ER Endoplasmic reticulum EtBr Ethidium Bromide FACS Fluorescence Activated Cell Sorting FCS Fetal Calf Serum FITC Fluorescein Isothiocyanate G gram GALT Gut Associated Lymphoid Tissue GAPDH Glyceraldehyd-3-Phosphate Dehydrogenase HRP Horseradish Peroxidase IFN Interferon Ig Immunoglobulin IL Interleukine * IP Immunoprecipitation
82
l Liter LPS Lipopolysaccharide M Molar mAb Monoclonal Antibody MACS Magnetic Cell Sorting MHC Major HistoCompatibility group min. minute MOPS 3-Morpholino-1-propanesulfonate mRNA messenger RNA NFAT Nuclear Factor of Activated T lymphocytes NF-κB Nuclear Factor kappa B OD Optical density PAA Polyachrylamide PAGE Polyachrylamide Gel Electrophoresis PBS Phosphate Buffer Saline PCR Polymerase Chain Reaction PE Phycoerythrin PI Propidium Iodide Pre-TCR pre-T cell Receptor pTα pre-TCR alpha RAG Recombinase Activation Gene RLU Relative Luminescence Unit RNA Ribonucleicacid rpm Revolution per minute ROS Reactive Oxygen Species RT Room Temperature RT Retrotranscriptase / Reverse Transcriptase SDS Sodium Dodecyl Sulfate SP Single Positive TBS Tris Buffered Saline TCR T-Cell Receptor TCRα T-Cell Receptor alpha chain TCRβ T-Cell Receptor beta chain TdT Terminal Deoxynucleotide Transferase * TE Tris / EDTA TEMED N, N, N´, N´-Tetramethylethylendiamine TLR Toll-like Receptor TNF Tumor Necrosis Factor Tris Trishydroxymethyaminomethane * Tween Poly (oxyethylen)n–Sorbitan-Monolaurate U Unit UPR Unfolded Protein Response UV Ultraviolet light V Volt WB Western Blot wt Wild type XBP-1 X-box Binding Protein 1
83
8. Literature
Abbey, J. L., M. Hulett, et al. (2006). "Cell surface expression of a peptide encoded by the unrearranged TCR-Vbeta8.2 gene." Mol Immunol 43(9): 1408-17. Aifantis, I., C. H. Bassing, et al. (2006). "The E delta enhancer controls the generation of CD4- CD8- alphabetaTCR-expressing T cells that can give rise to different lineages of alphabeta T cells." J Exp Med 203(6): 1543-50. Aifantis, I., C. Borowski, et al. (2002). "A critical role for the cytoplasmic tail of pTalpha in T lymphocyte development." Nat Immunol 3(5): 483-8. Aifantis, I., J. Buer, et al. (1997). "Essential role of the pre-T cell receptor in allelic exclusion of the T cell receptor beta locus." Immunity 7(5): 601-7. Aifantis, I., J. Feinberg, et al. (1999). "Early T cell receptor beta gene expression is regulated by the pre-T cell receptor-CD3 complex." J Exp Med 190(1): 141-4. Aifantis, I., F. Gounari, et al. (2001). "Constitutive pre-TCR signaling promotes differentiation through Ca2+ mobilization and activation of NF-kappaB and NFAT." Nat Immunol 2(5): 403-9. Aifantis, I., M. Mandal, et al. (2006). "Regulation of T-cell progenitor survival and cell-cycle entry by the pre-T-cell receptor." Immunol Rev 209: 159-69. Anton, L. C., U. Schubert, et al. (1999). "Intracellular localization of proteasomal degradation of a viral antigen." J Cell Biol 146(1): 113-24. Ardouin, L., J. Ismaili, et al. (1998). "The CD3-gammadeltaepsilon and CD3-zeta/eta modules are each essential for allelic exclusion at the T cell receptor beta locus but are both dispensable for the initiation of V to (D)J recombination at the T cell receptor-beta, -gamma, and -delta loci." J Exp Med 187(1): 105-16. Balciunaite, G., R. Ceredig, et al. (2005). "The role of Notch and IL-7 signaling in early thymocyte proliferation and differentiation." Eur J Immunol 35(4): 1292-300. Baldwin, T. A., M. M. Sandau, et al. (2005). "The timing of TCR alpha expression critically influences T cell development and selection." J Exp Med 202(1): 111-21. Berger, M. A., M. Carleton, et al. (2000). "Identification of a novel pre-TCR isoform in which the accessibility of the TCR beta subunit is determined by occupancy of the 'missing' V domain of pre-T alpha." Int Immunol 12(11): 1579-91. Berger, M. A., V. Dave, et al. (1997). "Subunit composition of pre-T cell receptor complexes expressed by primary thymocytes: CD3 delta is physically associated but not functionally required." J Exp Med 186(9): 1461-7. Bernales, S., K. L. McDonald, et al. (2006). "Autophagy counterbalances endoplasmic reticulum expansion during the unfolded protein response." PLoS Biol 4(12): e423. Blom, B., M. C. Verschuren, et al. (1999). "TCR gene rearrangements and expression of the pre-T cell receptor complex during human T-cell differentiation." Blood 93(9): 3033-43. Borowski, C., X. Li, et al. (2004). "Pre-TCRalpha and TCRalpha are not interchangeable partners of TCRbeta during T lymphocyte development." J Exp Med 199(5): 607-15.
84
Bosco, N., F. Agenes, et al. (2006). "Peripheral T cell lymphopenia and concomitant enrichment in naturally arising regulatory T cells: the case of the pre-Talpha gene-deleted mouse." J Immunol 177(8): 5014-23. Bruno, L., H. J. Fehling, et al. (1996). "The alpha beta T cell receptor can replace the gamma delta receptor in the development of gamma delta lineage cells." Immunity 5(4): 343-52. Bruno, L., A. Scheffold, et al. (1999). "Threshold of pre-T-cell-receptor surface expression is associated with alphabeta T-cell lineage commitment." Curr Biol 9(11): 559-68. Buer, J., I. Aifantis, et al. (1997). "Role of different T cell receptors in the development of pre-T cells." J Exp Med 185(9): 1541-7. Bush, K. T., A. L. Goldberg, et al. (1997). "Proteasome inhibition leads to a heat-shock response, induction of endoplasmic reticulum chaperones, and thermotolerance." J Biol Chem 272(14): 9086-92. Callahan, M. K., E. A. Wohlfert, et al. (2006). "Heat shock up-regulates lmp2 and lmp7 and enhances presentation of immunoproteasome-dependent epitopes." J Immunol 177(12): 8393-9. Cante-Barrett, K., M. M. Winslow, et al. (2007). "Selective Role of NFATc3 in Positive Selection of Thymocytes." J Immunol 179(1): 103-10. Carrasco, Y. R., M. N. Navarro, et al. (2003). "A role for the cytoplasmic tail of the pre-T cell receptor (TCR) alpha chain in promoting constitutive internalization and degradation of the pre-TCR." J Biol Chem 278(16): 14507-13. Chu, D. H., N. S. van Oers, et al. (1999). "Pre-T cell receptor signals are responsible for the down-regulation of Syk protein tyrosine kinase expression." J Immunol 163(5): 2610-20. Ciechanover, A. (2005). "Intracellular protein degradation: from a vague idea thru the lysosome and the ubiquitin-proteasome system and onto human diseases and drug targeting." Cell Death Differ 12(9): 1178-90. Ciofani, M. and J. C. Zuniga-Pflucker (2005). "Notch promotes survival of pre-T cells at the beta-selection checkpoint by regulating cellular metabolism." Nat Immunol 6(9): 881-8. Claudio, E., K. Brown, et al. (2006). "NF-kappaB guides the survival and differentiation of developing lymphocytes." Cell Death Differ 13(5): 697-701. Creagh, E. M., H. Conroy, et al. (2003). "Caspase-activation pathways in apoptosis and immunity." Immunol Rev 193: 10-21. Dallaporta, B., M. Pablo, et al. (2000). "Proteasome activation as a critical event of thymocyte apoptosis." Cell Death Differ 7(4): 368-73. Dengjel, J., O. Schoor, et al. (2005). "Autophagy promotes MHC class II presentation of peptides from intracellular source proteins." Proc Natl Acad Sci U S A 102(22): 7922-7. Dillon, S. R. and P. J. Fink (1995). "Thymic selection events mediated by the pre-TCR do not depend upon a limiting ligand." Int Immunol 7(8): 1363-73. Doerfler, P., K. A. Forbush, et al. (2000). "Caspase enzyme activity is not essential for apoptosis during thymocyte development." J Immunol 164(8): 4071-9. Dose, M., I. Khan, et al. (2006). "c-Myc mediates pre-TCR-induced proliferation but not developmental progression." Blood 108(8): 2669-77.
85
Dudley, E. C., H. T. Petrie, et al. (1994). "T cell receptor beta chain gene rearrangement and selection during thymocyte development in adult mice." Immunity 1(2): 83-93. Engel, I. and C. Murre (2004). "E2A proteins enforce a proliferation checkpoint in developing thymocytes." Embo J 23(1): 202-11. Erman, B., L. Feigenbaum, et al. (2002). "Early TCRalpha expression generates TCRalphagamma complexes that signal the DN-to-DP transition and impair development." Nat Immunol 3(6): 564-9. Falahati, R. and D. Leitenberg (2007). "Changes in the role of the CD45 protein tyrosine phosphatase in regulating Lck tyrosine phosphorylation during thymic development." J Immunol 178(4): 2056-64. Falk, I., G. Nerz, et al. (2001). "Immature thymocytes that fail to express TCRbeta and/or TCRgamma delta proteins die by apoptotic cell death in the CD44(-)CD25(-) (DN4) subset." Eur J Immunol 31(11): 3308-17. Fehling, H. J., S. Gilfillan, et al. (1999). "Alpha beta/gamma delta lineage commitment in the thymus of normal and genetically manipulated mice." Adv Immunol 71: 1-76. Fehling, H. J., B. M. Iritani, et al. (1997). "Restoration of thymopoiesis in pT alpha-/- mice by anti-CD3epsilon antibody treatment or with transgenes encoding activated Lck or tailless pT alpha." Immunity 6(6): 703-14. Fehling, H. J., A. Krotkova, et al. (1995). "Crucial role of the pre-T-cell receptor alpha gene in development of alpha beta but not gamma delta T cells." Nature 375(6534): 795-8. Fehling, H. J., W. Swat, et al. (1994). "MHC class I expression in mice lacking the proteasome subunit LMP-7." Science 265(5176): 1234-7. Ferrero, I., S. J. Mancini, et al. (2006). "TCRgamma silencing during alphabeta T cell development depends upon pre-TCR-induced proliferation." J Immunol 177(9): 6038-43. Fischer, A. M., C. D. Katayama, et al. (2005). "The role of erk1 and erk2 in multiple stages of T cell development." Immunity 23(4): 431-43. Galler, G. R., C. Mundt, et al. (2004). "Surface mu heavy chain signals down-regulation of the V(D)J-recombinase machinery in the absence of surrogate light chain components." J Exp Med 199(11): 1523-32. Garbe, A. I., A. Krueger, et al. (2006). "Differential synergy of Notch and T cell receptor signaling determines alphabeta versus gammadelta lineage fate." J Exp Med 203(6): 1579-90. Garbe, A. I. and H. von Boehmer (2007). "TCR and Notch synergize in alphabeta versus gammadelta lineage choice." Trends Immunol. Gartner, F., F. W. Alt, et al. (1999). "Immature thymocytes employ distinct signaling pathways for allelic exclusion versus differentiation and expansion." Immunity 10(5): 537-46. Gibbons, D., N. C. Douglas, et al. (2001). "The biological activity of natural and mutant pTalpha alleles." J Exp Med 194(5): 695-703. Godfrey, D. I., J. Kennedy, et al. (1993). "A developmental pathway involving four phenotypically and functionally distinct subsets of CD3-CD4-CD8- triple-negative adult mouse thymocytes defined by CD44 and CD25 expression." J Immunol 150(10): 4244-52. Gomez, M., V. Tybulewicz, et al. (2000). "Control of pre-T cell proliferation and differentiation by the GTPase Rac-I." Nat Immunol 1(4): 348-52.
86
Gong, Q., X. Jin, et al. (2001). "Requirement for tyrosine residues 315 and 319 within zeta chain-associated protein 70 for T cell development." J Exp Med 194(4): 507-18. Gounari, F., I. Aifantis, et al. (2001). "Somatic activation of beta-catenin bypasses pre-TCR signaling and TCR selection in thymocyte development." Nat Immunol 2(9): 863-9. Gounari, F., I. Aifantis, et al. (2002). "Tracing lymphopoiesis with the aid of a pTalpha-controlled reporter gene." Nat Immunol 3(5): 489-96. Goux, D., J. D. Coudert, et al. (2005). "Cooperating pre-T-cell receptor and TCF-1-dependent signals ensure thymocyte survival." Blood 106(5): 1726-33. Graux, C., J. Cools, et al. (2006). "Cytogenetics and molecular genetics of T-cell acute lymphoblastic leukemia: from thymocyte to lymphoblast." Leukemia 20(9): 1496-510. Gravestein, L. A., W. van Ewijk, et al. (1996). "CD27 cooperates with the pre-T cell receptor in the regulation of murine T cell development." J Exp Med 184(2): 675-85. Griffin, T. A., D. Nandi, et al. (1998). "Immunoproteasome assembly: cooperative incorporation of interferon gamma (IFN-gamma)-inducible subunits." J Exp Med 187(1): 97-104. Grimm, L. M., A. L. Goldberg, et al. (1996). "Proteasomes play an essential role in thymocyte apoptosis." Embo J 15(15): 3835-44. Groettrup, M., A. Baron, et al. (1992). "T cell receptor (TCR) beta chain homodimers on the surface of immature but not mature alpha, gamma, delta chain deficient T cell lines." Embo J 11(7): 2735-45. Guidos, C. J. (2006). "Synergy between the pre-T cell receptor and Notch: cementing the alphabeta lineage choice." J Exp Med 203(10): 2233-7. Hagenbeek, T. J., M. Naspetti, et al. (2004). "The loss of PTEN allows TCR alphabeta lineage thymocytes to bypass IL-7 and Pre-TCR-mediated signaling." J Exp Med 200(7): 883-94. Haines, B. B., C. J. Ryu, et al. (2006). "Block of T cell development in P53-deficient mice accelerates development of lymphomas with characteristic RAG-dependent cytogenetic alterations." Cancer Cell 9(2): 109-20. Haks, M. C., S. M. Belkowski, et al. (2003). "Low activation threshold as a mechanism for ligand-independent signaling in pre-T cells." J Immunol 170(6): 2853-61. Haks, M. C., P. Krimpenfort, et al. (1998). "The CD3gamma chain is essential for development of both the TCRalphabeta and TCRgammadelta lineages." Embo J 17(7): 1871-82. Haks, M. C., P. Krimpenfort, et al. (1999). "Pre-TCR signaling and inactivation of p53 induces crucial cell survival pathways in pre-T cells." Immunity 11(1): 91-101. Haks, M. C., M. A. Oosterwegel, et al. (1999). "Cell-fate decisions in early T cell development: regulation by cytokine receptors and the pre-TCR." Semin Immunol 11(1): 23-37. Hayday, A. C. and D. J. Pennington (2007). "Key factors in the organized chaos of early T cell development." Nat Immunol 8(2): 137-44. Hayes, S. M., E. W. Shores, et al. (2003). "An architectural perspective on signaling by the pre-, alphabeta and gammadelta T cell receptors." Immunol Rev 191: 28-37. Henderson, C. J., E. Aleo, et al. (2005). "Caspase activation and apoptosis in response to proteasome inhibitors." Cell Death Differ 12(9): 1240-54.
87
Hirsch, T., B. Dallaporta, et al. (1998). "Proteasome activation occurs at an early, premitochondrial step of thymocyte apoptosis." J Immunol 161(1): 35-40. Hoffman, E. S., L. Passoni, et al. (1996). "Productive T-cell receptor beta-chain gene rearrangement: coincident regulation of cell cycle and clonality during development in vivo." Genes Dev 10(8): 948-62. Huang, C. Y. and O. Kanagawa (2004). "Impact of early expression of TCR alpha chain on thymocyte development." Eur J Immunol 34(6): 1532-41. Huang, C. Y., B. P. Sleckman, et al. (2005). "Revision of T cell receptor {alpha} chain genes is required for normal T lymphocyte development." Proc Natl Acad Sci U S A 102(40): 14356-61. Huang, E. Y., A. M. Gallegos, et al. (2003). "Surface expression of Notch1 on thymocytes: correlation with the double-negative to double-positive transition." J Immunol 171(5): 2296-304. Irving, B. A., F. W. Alt, et al. (1998). "Thymocyte development in the absence of pre-T cell receptor extracellular immunoglobulin domains." Science 280(5365): 905-8. Ito, Y., S. Arai, et al. (2002). "Positive selection by the pre-TCR yields mature CD8+ T cells." J Immunol 169(9): 4913-9. Jacobs, H., J. Iacomini, et al. (1996). "Domains of the TCR beta-chain required for early thymocyte development." J Exp Med 184(5): 1833-43. Jacobs, H., F. Ossendorp, et al. (1996). "Oncogenic potential of a pre-T cell receptor lacking the TCR beta variable domain." Oncogene 12(10): 2089-99. Jiang, D., M. J. Lenardo, et al. (1996). "p53 prevents maturation to the CD4+CD8+ stage of thymocyte differentiation in the absence of T cell receptor rearrangement." J Exp Med 183(4): 1923-8. Jost, P. J., S. Weiss, et al. (2007). "Bcl10/Malt1 signaling is essential for TCR-induced NF-kappaB activation in thymocytes but dispensable for positive or negative selection." J Immunol 178(2): 953-60. Kang, J., M. Coles, et al. (1998). "The developmental fate of T cells is critically influenced by TCRgammadelta expression." Immunity 8(4): 427-38. Kang, J., H. J. Fehling, et al. (1998). "T cell receptor gamma gene regulatory sequences prevent the function of a novel TCRgamma/pTalpha pre-T cell receptor." Immunity 8(6): 713-21. Kang, J., A. Volkmann, et al. (2001). "Evidence that gammadelta versus alphabeta T cell fate determination is initiated independently of T cell receptor signaling." J Exp Med 193(6): 689-98. Kataoka, T., R. C. Budd, et al. (2000). "The caspase-8 inhibitor FLIP promotes activation of NF-kappaB and Erk signaling pathways." Curr Biol 10(11): 640-8. Kaufman, R. J. (2002). "Orchestrating the unfolded protein response in health and disease." J Clin Invest 110(10): 1389-98. Kim, D., M. Xu, et al. (2002). "Helix-loop-helix proteins regulate pre-TCR and TCR signaling through modulation of Rel/NF-kappaB activities." Immunity 16(1): 9-21. Kloetzel, P. M. and F. Ossendorp (2004). "Proteasome and peptidase function in MHC-class-I-mediated antigen presentation." Curr Opin Immunol 16(1): 76-81. Koyasu, S., L. K. Clayton, et al. (1997). "Pre-TCR signaling components trigger transcriptional activation of a rearranged TCR alpha gene locus and silencing of the pre-TCR alpha locus: implications for intrathymic differentiation." Int Immunol 9(10): 1475-80.
88
Krotkova, A., H. von Boehmer, et al. (1997). "Allelic exclusion in pTalpha-deficient mice: no evidence for cell surface expression of two T cell receptor (TCR)-beta chains, but less efficient inhibition of endogeneous Vbeta--> (D)Jbeta rearrangements in the presence of a functional TCR-beta transgene." J Exp Med 186(5): 767-75. Kuwabara, I., H. Ohno, et al. (1994). "Transition from TCR-beta dimer to TCR-alpha beta-expressing cells by introduction of an alpha-chain in an immature thymocyte cell line." J Immunol 152(5): 2148-56. Lacorazza, H. D., H. E. Porritt, et al. (2001). "Dysregulated expression of pre-Talpha reveals the opposite effects of pre-TCR at successive stages of T cell development." J Immunol 167(10): 5689-96. Lacorazza, H. D., C. Tucek-Szabo, et al. (2001). "Premature TCR alpha beta expression and signaling in early thymocytes impair thymocyte expansion and partially block their development." J Immunol 166(5): 3184-93. Ladi, E., X. Yin, et al. (2006). "Thymic microenvironments for T cell differentiation and selection." Nat Immunol 7(4): 338-43. Lambolez, F., M. L. Arcangeli, et al. (2006). "The thymus exports long-lived fully committed T cell precursors that can colonize primary lymphoid organs." Nat Immunol 7(1): 76-82. Laurent, J., N. Bosco, et al. (2004). "New insights into the proliferation and differentiation of early mouse thymocytes." Int Immunol 16(8): 1069-80. Lin, K., N. S. Longo, et al. (2000). "Lck domains differentially contribute to pre-T cell receptor (TCR)- and TCR-alpha/beta-regulated developmental transitions." J Exp Med 191(4): 703-16. Liu, C. P., R. Ueda, et al. (1993). "Abnormal T cell development in CD3-zeta-/- mutant mice and identification of a novel T cell population in the intestine." Embo J 12(12): 4863-75. Livak, F., M. Tourigny, et al. (1999). "Characterization of TCR gene rearrangements during adult murine T cell development." J Immunol 162(5): 2575-80. Livak, F., A. Wilson, et al. (1997). "Alpha beta lineage-committed thymocytes can be rescued by the gamma delta T cell receptor (TCR) in the absence of TCR beta chain." Eur J Immunol 27(11): 2948-58. Ma, A., J. C. Pena, et al. (1995). "Bclx regulates the survival of double-positive thymocytes." Proc Natl Acad Sci U S A 92(11): 4763-7. Maillard, I., L. Tu, et al. (2006). "The requirement for Notch signaling at the beta-selection checkpoint in vivo is absolute and independent of the pre-T cell receptor." J Exp Med 203(10): 2239-45. Mancini, S., S. M. Candeias, et al. (1999). "TCR alpha-chain repertoire in pTalpha-deficient mice is diverse and developmentally regulated: implications for pre-TCR functions and TCRA gene rearrangement." J Immunol 163(11): 6053-9. Mancini, S. J., S. M. Candeias, et al. (2001). "TCRA gene rearrangement in immature thymocytes in absence of CD3, pre-TCR, and TCR signaling." J Immunol 167(8): 4485-93. Mandal, M., C. Borowski, et al. (2005). "The BCL2A1 gene as a pre-T cell receptor-induced regulator of thymocyte survival." J Exp Med 201(4): 603-14. Mao, C., E. G. Tili, et al. (2007). "Unequal contribution of Akt isoforms in the double-negative to double-positive thymocyte transition." J Immunol 178(9): 5443-53. Marciniak, S. J., C. Y. Yun, et al. (2004). "CHOP induces death by promoting protein synthesis and oxidation in the stressed endoplasmic reticulum." Genes Dev 18(24): 3066-77.
89
Marshansky, V., X. Wang, et al. (2001). "Proteasomes modulate balance among proapoptotic and antiapoptotic Bcl-2 family members and compromise functioning of the electron transport chain in leukemic cells." J Immunol 166(5): 3130-42. McCarty, N., M. L. Shinohara, et al. (2004). "Detailed analysis of gene expression during development of T cell lineages in the thymus." Proc Natl Acad Sci U S A 101(25): 9339-44. Mee, P. J., M. Turner, et al. (1999). "Greatly reduced efficiency of both positive and negative selection of thymocytes in CD45 tyrosine phosphatase-deficient mice." Eur J Immunol 29(9): 2923-33. Melichar, H. J., K. Narayan, et al. (2007). "Regulation of gammadelta versus alphabeta T lymphocyte differentiation by the transcription factor SOX13." Science 315(5809): 230-3. Michie, A. M., S. Trop, et al. (1999). "Extracellular signal-regulated kinase (ERK) activation by the pre-T cell receptor in developing thymocytes in vivo." J Exp Med 190(11): 1647-56. Michie, A. M. and J. C. Zuniga-Pflucker (2002). "Regulation of thymocyte differentiation: pre-TCR signals and beta-selection." Semin Immunol 14(5): 311-23. Mohtashami, M. and J. C. Zuniga-Pflucker (2006). "Three-dimensional architecture of the thymus is required to maintain delta-like expression necessary for inducing T cell development." J Immunol 176(2): 730-4. Mombaerts, P., J. Iacomini, et al. (1992). "RAG-1-deficient mice have no mature B and T lymphocytes." Cell 68(5): 869-77. Murata, S., K. Sasaki, et al. (2007). "Regulation of CD8+ T cell development by thymus-specific proteasomes." Science 316(5829): 1349-53. Murga, C. and D. F. Barber (2002). "Molecular mechanisms of pre-T cell receptor-induced survival." J Biol Chem 277(42): 39156-62. Narayan, K. and J. Kang (2007). "Molecular events that regulate alphabeta versus gammadelta T cell lineage commitment: old suspects, new players and different game plans." Curr Opin Immunol 19(2): 169-75. Newton, K., A. W. Harris, et al. (2000). "FADD/MORT1 regulates the pre-TCR checkpoint and can function as a tumour suppressor." Embo J 19(5): 931-41. O'Shea, C. C., A. P. Thornell, et al. (1997). "Exit of the pre-TCR from the ER/cis-Golgi is necessary for signaling differentiation, proliferation, and allelic exclusion in immature thymocytes." Immunity 7(5): 591-9. Osterloh, P., K. Linkemann, et al. (2006). "Proteasomes shape the repertoire of T cells participating in antigen-specific immune responses." Proc Natl Acad Sci U S A 103(13): 5042-7. Palacios, E. H. and A. Weiss (2007). "Distinct roles for Syk and ZAP-70 during early thymocyte development." J Exp Med 204(7): 1703-15. Palombella, V. J., O. J. Rando, et al. (1994). "The ubiquitin-proteasome pathway is required for processing the NF-kappa B1 precursor protein and the activation of NF-kappa B." Cell 78(5): 773-85. Paludan, C., D. Schmid, et al. (2005). "Endogenous MHC class II processing of a viral nuclear antigen after autophagy." Science 307(5709): 593-6. Panigada, M., S. Porcellini, et al. (2002). "Constitutive endocytosis and degradation of the pre-T cell receptor." J Exp Med 195(12): 1585-97.
90
Park, S. H., N. Bolender, et al. (2007). "The cytoplasmic Hsp70 chaperone machinery subjects misfolded and endoplasmic reticulum import-incompetent proteins to degradation via the ubiquitin-proteasome system." Mol Biol Cell 18(1): 153-65. Pearson, R. and K. Weston (2000). "c-Myb regulates the proliferation of immature thymocytes following beta-selection." Embo J 19(22): 6112-20. Pennington, D. J., B. Silva-Santos, et al. (2003). "The inter-relatedness and interdependence of mouse T cell receptor gammadelta+ and alphabeta+ cells." Nat Immunol 4(10): 991-8. Pennington, D. J., B. Silva-Santos, et al. (2006). "Early events in the thymus affect the balance of effector and regulatory T cells." Nature 444(7122): 1073-7. Petrie, H. T., M. Tourigny, et al. (2000). "Precursor thymocyte proliferation and differentiation are controlled by signals unrelated to the pre-TCR." J Immunol 165(6): 3094-8. Petrie, H. T. and J. C. Zuniga-Pflucker (2007). "Zoned out: functional mapping of stromal signaling microenvironments in the thymus." Annu Rev Immunol 25: 649-79. Rathmell, J. C., T. Lindsten, et al. (2002). "Deficiency in Bak and Bax perturbs thymic selection and lymphoid homeostasis." Nat Immunol 3(10): 932-9. Reschly, E. J., C. Spaulding, et al. (2006). "Notch1 promotes survival of E2A-deficient T cell lymphomas through pre-T cell receptor-dependent and -independent mechanisms." Blood 107(10): 4115-21. Riera-Sans, L. and A. Behrens (2007). "Regulation of {alpha}beta/{gamma}{delta} T Cell Development by the Activator Protein 1 Transcription Factor c-Jun." J Immunol 178(9): 5690-5700. Rincon, M. and R. A. Flavell (1996). "Regulation of AP-1 and NFAT transcription factors during thymic selection of T cells." Mol Cell Biol 16(3): 1074-84. Ron, D. and P. Walter (2007). "Signal integration in the endoplasmic reticulum unfolded protein response." Nat Rev Mol Cell Biol 8(7): 519-29. Roose, J. P., M. Diehn, et al. (2003). "T cell receptor-independent basal signaling via Erk and Abl kinases suppresses RAG gene expression." PLoS Biol 1(2): E53. Rutkowski, D. T., S. M. Arnold, et al. (2006). "Adaptation to ER stress is mediated by differential stabilities of pro-survival and pro-apoptotic mRNAs and proteins." PLoS Biol 4(11): e374. Saint-Ruf, C., M. Panigada, et al. (2000). "Different initiation of pre-TCR and gammadeltaTCR signalling." Nature 406(6795): 524-7. Salmena, L., B. Lemmers, et al. (2003). "Essential role for caspase 8 in T-cell homeostasis and T-cell-mediated immunity." Genes Dev 17(7): 883-95. Satou, Y., K. Nosaka, et al. (2004). "Proteasome inhibitor, bortezomib, potently inhibits the growth of adult T-cell leukemia cells both in vivo and in vitro." Leukemia 18(8): 1357-63. Schnell, S., C. Demolliere, et al. (2006). "Constitutive expression of the pre-TCR enables development of mature T cells." Int Immunol 18(6): 911-20. Schuh, W., S. Meister, et al. (2003). "Cutting edge: signaling and cell surface expression of a mu H chain in the absence of lambda 5: a paradigm revisited." J Immunol 171(7): 3343-7. Serra, P., A. Amrani, et al. (2002). "RAG-dependent peripheral T cell receptor diversification in CD8+ T lymphocytes." Proc Natl Acad Sci U S A 99(24): 15566-71.
91
Shinkai, Y., S. Koyasu, et al. (1993). "Restoration of T cell development in RAG-2-deficient mice by functional TCR transgenes." Science 259(5096): 822-5. Sicinska, E., I. Aifantis, et al. (2003). "Requirement for cyclin D3 in lymphocyte development and T cell leukemias." Cancer Cell 4(6): 451-61. Silva-Santos, B., D. J. Pennington, et al. (2005). "Lymphotoxin-mediated regulation of gammadelta cell differentiation by alphabeta T cell progenitors." Science 307(5711): 925-8. Spain, L. M. and P. Liu (2002). "TCRbeta transmembrane tyrosines are required for pre-TCR function." J Immunol 168(1): 127-33. Starr, T. K., S. C. Jameson, et al. (2003). "Positive and negative selection of T cells." Annu Rev Immunol 21: 139-76. Steff, A. M., S. Trop, et al. (2001). "Opposite ability of pre-TCR and alpha beta TCR to induce apoptosis." J Immunol 166(8): 5044-50. Sun, Z., C. W. Arendt, et al. (2000). "PKC-theta is required for TCR-induced NF-kappaB activation in mature but not immature T lymphocytes." Nature 404(6776): 402-7. Swat, W., V. Montgrain, et al. (2006). "Essential role of PI3Kdelta and PI3Kgamma in thymocyte survival." Blood 107(6): 2415-22. Szegezdi, E., S. E. Logue, et al. (2006). "Mediators of endoplasmic reticulum stress-induced apoptosis." EMBO Rep 7(9): 880-5. Taghon, T., M. A. Yui, et al. (2006). "Developmental and molecular characterization of emerging beta- and gammadelta-selected pre-T cells in the adult mouse thymus." Immunity 24(1): 53-64. Takahama, Y. (2006). "Journey through the thymus: stromal guides for T-cell development and selection." Nat Rev Immunol 6(2): 127-35. Takahashi, I., H. Iijima, et al. (1999). "Clonal expansion of CD4+ TCRbetabeta+ T cells in TCR alpha-chain- deficient mice by gut-derived antigens." J Immunol 162(3): 1843-50. Touma, M., Z. Y. Sun, et al. (2007). "Importance of the CD3gamma ectodomain terminal beta-strand and membrane proximal stalk in thymic development and receptor assembly." J Immunol 178(6): 3668-79. Tourigny, M. R., S. Mazel, et al. (1997). "T cell receptor (TCR)-beta gene recombination: dissociation from cell cycle regulation and developmental progression during T cell ontogeny." J Exp Med 185(9): 1549-56. Trop, S., M. Rhodes, et al. (2000). "Competitive displacement of pT alpha by TCR-alpha during TCR assembly prevents surface coexpression of pre-TCR and alpha beta TCR." J Immunol 165(10): 5566-72. Vacca, A., M. P. Felli, et al. (2006). "Notch3 and pre-TCR interaction unveils distinct NF-kappaB pathways in T-cell development and leukemia." Embo J 25(5): 1000-8. van Ewijk, W., G. Hollander, et al. (2000). "Stepwise development of thymic microenvironments in vivo is regulated by thymocyte subsets." Development 127(8): 1583-91. van Oers, N. S., H. von Boehmer, et al. (1995). "The pre-T cell receptor (TCR) complex is functionally coupled to the TCR-zeta subunit." J Exp Med 182(5): 1585-90. Vespa, G. N., L. A. Lewis, et al. (1999). "Galectin-1 specifically modulates TCR signals to enhance TCR apoptosis but inhibit IL-2 production and proliferation." J Immunol 162(2): 799-806.
92
Voll, R. E. and S. Ghosh (1999). "Role of NF-kappa B in T-lymphocyte development." Cold Spring Harb Symp Quant Biol 64: 485-90. Voll, R. E., E. Jimi, et al. (2000). "NF-kappa B activation by the pre-T cell receptor serves as a selective survival signal in T lymphocyte development." Immunity 13(5): 677-89. von Boehmer, H., I. Aifantis, et al. (1999). "Pleiotropic changes controlled by the pre-T-cell receptor." Curr Opin Immunol 11(2): 135-42. von Boehmer, H. and H. J. Fehling (1997). "Structure and function of the pre-T cell receptor." Annu Rev Immunol 15: 433-52. Wakabayashi, Y., H. Watanabe, et al. (2003). "Bcl11b is required for differentiation and survival of alphabeta T lymphocytes." Nat Immunol 4(6): 533-9. Wang, X., H. Luo, et al. (1998). "Role of proteasomes in T cell activation and proliferation." J Immunol 160(2): 788-801. Wang, X. Z., B. Lawson, et al. (1996). "Signals from the stressed endoplasmic reticulum induce C/EBP-homologous protein (CHOP/GADD153)." Mol Cell Biol 16(8): 4273-80. Werlen, G., B. Hausmann, et al. (2003). "Signaling life and death in the thymus: timing is everything." Science 299(5614): 1859-63. Williams, J. A., K. S. Hathcock, et al. (2005). "Regulated costimulation in the thymus is critical for T cell development: dysregulated CD28 costimulation can bypass the pre-TCR checkpoint." J Immunol 175(7): 4199-207. Williams, O., T. Norton, et al. (1998). "The action of Bax and bcl-2 on T cell selection." J Exp Med 188(6): 1125-33. Wilson, A. and H. R. MacDonald (1995). "Expression of genes encoding the pre-TCR and CD3 complex during thymus development." Int Immunol 7(10): 1659-64. Wilson, A., C. Marechal, et al. (2001). "Biased V beta usage in immature thymocytes is independent of DJ beta proximity and pT alpha pairing." J Immunol 166(1): 51-7. Winandy, S., L. Wu, et al. (1999). "Pre-T cell receptor (TCR) and TCR-controlled checkpoints in T cell differentiation are set by Ikaros." J Exp Med 190(8): 1039-48. Wolfer, A., A. Wilson, et al. (2002). "Inactivation of Notch1 impairs VDJbeta rearrangement and allows pre-TCR-independent survival of early alpha beta Lineage Thymocytes." Immunity 16(6): 869-79. Xi, H. and G. J. Kersh (2004). "Early growth response gene 3 regulates thymocyte proliferation during the transition from CD4-CD8- to CD4+CD8+." J Immunol 172(2): 964-71. Xi, H., R. Schwartz, et al. (2006). "Interplay between RORgammat, Egr3, and E proteins controls proliferation in response to pre-TCR signals." Immunity 24(6): 813-26. Xu, Y., L. Davidson, et al. (1996). "Function of the pre-T-cell receptor alpha chain in T-cell development and allelic exclusion at the T-cell receptor beta locus." Proc Natl Acad Sci U S A 93(5): 2169-73. Yamasaki, S., E. Ishikawa, et al. (2006). "Mechanistic basis of pre-T cell receptor-mediated autonomous signaling critical for thymocyte development." Nat Immunol 7(1): 67-75. Yu, H., G. Kaung, et al. (1997). "Cytosolic degradation of T-cell receptor alpha chains by the proteasome." J Biol Chem 272(33): 20800-4.
93

Zamoyska, R. and M. Lovatt (2004). "Signalling in T-lymphocyte development: integration of signalling pathways is the key." Curr Opin Immunol 16(2): 191-6. Zhang, N., M. H. Ahsan, et al. (2005). "Regulation of IkappaBalpha expression involves both NF-kappaB and the MAP kinase signaling pathways." J Inflamm (Lond) 2: 10. Zhang, W., C. L. Sommers, et al. (1999). "Essential role of LAT in T cell development." Immunity 10(3): 323-32. Zheng, X., J. X. Gao, et al. (2004). "B7-CD28 interaction promotes proliferation and survival but suppresses differentiation of CD4-CD8- T cells in the thymus." J Immunol 173(4): 2253-61. Zuniga-Pflucker, J. C. (2004). "T-cell development made simple." Nat Rev Immunol 4(1): 67-72.
94
9. Acknowledgements
First of all I would like to profoundly thank my mentor Reinhard Voll for giving me the
opportunity to join his team, offering me an exciting PhD thesis theme, the guidance and teaching
me good science in so many ways.
Thanks as well to Prof. Dr. Thomas Winkler and Prof. Dr. Gisa Tiegs as members of my
supervision committee and thesis committee for their patience, support and time. Your comments
and disposition were always most appreciated by me.
Very special thanks to Prof. Dr. H.M Jäck, speaker and „papa“ of the GK592, for his sacrifice
and success in having achieved such a marvelous training grant program. You are a model of the
fascination someone can have for science.
My most meaningful thanks to the IZKF-Nachwuchsgruppe 2 (AG Voll) Barbara Fürnrohr,
Vilma Urbonaviciute, Silke Meister, Eva Gueckel and Kirsten Neubert for the continuous help,
the team work and for being there always when I arrived late. We have shared very intense
moments and have not only survived but grown stronger altogether. May the NF-kB be with us
(or better not?).
Thanks to the Graduiertenkolleg-592 “Lymphozyten”: To all members for the wonderful
moments shared, the camaraderie, the laughs, the professional and not so professional talks and
discussions and so many things I cannot list here. Exceptional thanks to my colleagues
Alexandros Theodoridis, Stephan Schierer, Jens Henig, Ruzica Pulzic, Sandra Franz, Kai
Hermann, Benjamin Frey, Michael Schwemmlein and Annette Erhardt for being there when I
needed them, demonstrating how you can make good friends out of working comrades and the
immeasurable human quality they have shown. Very special thanks also to the project leaders
Dirk Mielenz, Lars Nitschke and Martin Herrmann for demonstrating their constructive critical
capacities with ease and their will to share their knowledge. Thanks as well to the new
“Graduiertenkollegs” for keeping the GK-592 spirit alive.
My deepest thanks deserve all my friends and family here in Germany, in Spain and spread
around the world for believing in me and supporting me always. Germany would have been much
harder to me if I did not get to know Hedwig Seidl and Brigitte Zähringer (Danke für alles
95

“Mädls”). Erlangen was a much nicer place to live thanks to Milenko Bugueño, Jerome Jean-
Joseph, Sultan Haider and Diego San-Andrés. Especial thanks to my father and friend, for the
education, his “fatherness”, supporting me always and giving me marvelous advices.
Thanks as well to my former colleagues and mentors from Spain M.M. Beffa, J. Becerra and J.C.
Medina and the whole Cell Biology and Genetics Department in Málaga University for the first
steps in my scientific career. Thanks also to all my former fellows during my biology studies,
especially J. Llanso, N. Acosta and J.J. Arquero. I would like to thank Maria Cascalho from the
Mayo Clinic in Minnesota for the trainee period at her laboratory and Mercedes Rincon from the
University Vermont for the critical reading and support.
I cannot forget everyone at the Nikolaus-Fiebiger Zentrum for Molecular Medicine, the
Department of Internal Medicine III and all the Erlangen scientific community for the wonderful
working and professional ambient.
“Traveller, there is no road; you make your path as you walk”
Antonio Machado, Spanish Poet
“Zwei Sachen sind unendlich, das Universum und die menschliche Dummheit. Nur beim
Universum bin ich mir nicht ganz sicher”
Albert Einstein, German Scientist
„If there is a problem and there is a solution..... Why do you worry about it? And if there is
no solution..... Why do you worry about it?
Popular Zen citation
96