Embed Size (px)
Citation preview
ALBERT-LUDWIGS-UNIVERSITÄT FREIBURG IM BREISGAU
Composition and efficacy of cytotoxic
T cell responses determine virus elimination
and immunopathology after virus infections
INAUGURAL-DISSERTATION
zur Erlangung der Doktorwürde der Fakultät für
Biologie und der Fakultät für Medizin
der Albert-Ludwigs-Universität
Freiburg im Breisgau
vorgelegt von
Birthe Jessen
aus Bad Neustadt/Saale
September 2010
Dekan der Biologischen Fakultät: Prof. Dr. rer. nat. Ad Aertsen
Dekan der Medizinischen Fakultät: Prof. Dr. med. Christoph Peters
Betreuer der Arbeit/Doktorvater: Prof. Dr. Hanspeter Pircher
Betreuer der Arbeit: Prof. Dr. Stephan Ehl
Koreferent: Prof. Dr. Peter Stäheli
Promotionsvorsitzender: Prof. Dr. Samuel Rossel
Tag der Verkündigung des Prüfungsergebnisses: 30.11.2010
Diese Arbeit wurde am Centrum für Chronische Immundefizienz (CCI) des
Universitätsklinikums Freiburg - Albert-Ludwigs-Universität Freiburg - erstellt.

‘Nothing shocks me. I'm a scientist.’
- Harrison Ford as Indiana Jones
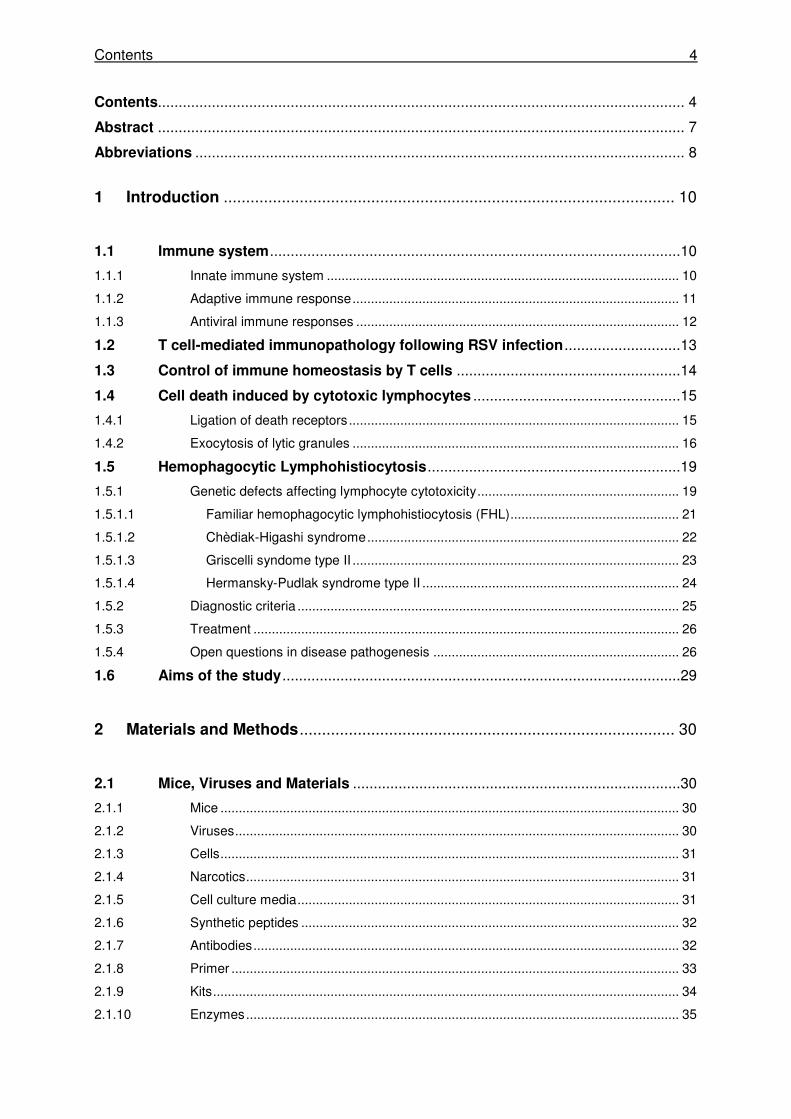
Contents 4
Contents............................................................................................................................... 4
Abstract ............................................................................................................................... 7
Abbreviations ...................................................................................................................... 8
1 Introduction ..................................................................................................... 10
1.1 Immune system...................................................................................................10
1.1.1 Innate immune system ................................................................................................ 10
1.1.2 Adaptive immune response......................................................................................... 11
1.1.3 Antiviral immune responses ........................................................................................ 12
1.2 T cell-mediated immunopathology following RSV infection ............................13
1.3 Control of immune homeostasis by T cells ......................................................14
1.4 Cell death induced by cytotoxic lymphocytes ..................................................15
1.4.1 Ligation of death receptors.......................................................................................... 15
1.4.2 Exocytosis of lytic granules ......................................................................................... 16
1.5 Hemophagocytic Lymphohistiocytosis.............................................................19
1.5.1 Genetic defects affecting lymphocyte cytotoxicity....................................................... 19
1.5.1.1 Familiar hemophagocytic lymphohistiocytosis (FHL).............................................. 21
1.5.1.2 Chèdiak-Higashi syndrome..................................................................................... 22
1.5.1.3 Griscelli syndome type II ......................................................................................... 23
1.5.1.4 Hermansky-Pudlak syndrome type II ...................................................................... 24
1.5.2 Diagnostic criteria ........................................................................................................ 25
1.5.3 Treatment .................................................................................................................... 26
1.5.4 Open questions in disease pathogenesis ................................................................... 26
1.6 Aims of the study................................................................................................29
2 Materials and Methods.................................................................................... 30
2.1 Mice, Viruses and Materials ...............................................................................30
2.1.1 Mice ............................................................................................................................. 30
2.1.2 Viruses......................................................................................................................... 30
2.1.3 Cells............................................................................................................................. 31
2.1.4 Narcotics...................................................................................................................... 31
2.1.5 Cell culture media........................................................................................................ 31
2.1.6 Synthetic peptides ....................................................................................................... 32
2.1.7 Antibodies.................................................................................................................... 32
2.1.8 Primer .......................................................................................................................... 33
2.1.9 Kits............................................................................................................................... 34
2.1.10 Enzymes...................................................................................................................... 35
Contents 5
2.1.11 Chemicals, buffers and solutions ................................................................................ 35
2.1.12 Plastic materials .......................................................................................................... 37
2.1.13 Instruments.................................................................................................................. 38
2.2 Methods ...............................................................................................................39
2.2.1 Viruses......................................................................................................................... 39
2.2.2 Hybridoma ................................................................................................................... 39
2.2.3 Mice ............................................................................................................................. 39
2.2.5 Treatment of mice........................................................................................................ 43
2.2.6 Preparation of mice ..................................................................................................... 44
2.2.7 In vitro activation of T cells .......................................................................................... 44
2.2.8 Determination of virus titers......................................................................................... 45
2.2.9 Flow cytometry ............................................................................................................ 46
2.2.10 Magnetic Activated Cell Separation ............................................................................ 47
2.2.11 Blood count.................................................................................................................. 47
2.2.12 Proliferation assay....................................................................................................... 47
2.2.13 Cytotoxicity Assay ....................................................................................................... 47
2.2.14 Determination of cytokine levels.................................................................................. 48
2.2.15 Analysis of liver enzymes, triglycerides and ferritin serum levels ............................... 49
2.2.16 Histology...................................................................................................................... 49
2.2.17 Statistical analysis ....................................................................................................... 49
3 Results ............................................................................................................. 50
3.1 Strain-specific disease susceptibility after RSV infection in the mouse is
determined by MHC dependent CTL responsiveness ......................................50
3.1.1 The MHC haplotype is an important determinant of disease susceptibility following
RSV infection. .............................................................................................................. 50
3.1.2 RSV induced disease is not determined by peak virus titers or virus elimination
kinetics. ........................................................................................................................ 51
3.1.3 The pulmonary CTL response is of similar magnitude in MHC congenic mice........... 52
3.1.4 Neither regulatory nor IL-17-producing CD4+ T cells influence the different outcomes
of disease..................................................................................................................... 53
3.1.5 Vβ skewing of pulmonary CTL is more pronounced in BALB/c and C57BL/6- H-2d
mice than in C57BL/6 mice.......................................................................................... 53
3.1.6 The epitope-specific pulmonary CTL response is more focused in H-2d mice
compared with H-2b mice............................................................................................. 54
3.1.7 H-2b-restricted M187-specific CTLs have a higher avidity than H-2d-restricted M2-1
82-specific CTLs. ......................................................................................................... 56
3.1.8 The Vβ 8.2+ M2-1 82-specific CTL response is responsible for the RSV-nduced
disease in H-2d mice .................................................................................................... 56
Contents 6
3.2 Hermansky-Pudlak Syndrome Type II confers a risk for hemophagocytic
lymphohistiocytosis ...........................................................................................58
3.2.1 Pearl mice develop transient HLH following LCMV infection. ..................................... 58
3.2.2 Pearl mice show a delay in virus control after LCMV WE infection. ........................... 61
3.2.3 Pearl CTLs have a reduced capacity to proliferate in vitro and in vivo ....................... 62
3.2.4 Pearl CTLs have a defect in degranulation and cytotoxicity. ...................................... 63
3.2.5 The cytotoxicity defect of pearl CTLs is relevant for virus control in vivo.................... 65
3.2.6 An additional heterozygous Rab27a mutation does not influence the outcome of
disease in pearl mice. .................................................................................................. 66
3.3 Impact of viral and host parameters on the pathogenesis of hemophagocytic
syndrome in beige mice - a mouse model of Chèdiak-Higashi Syndrome .....68
3.3.1 Beige mice carry a mutation in the WD40 domain of the Lyst protein. ....................... 68
3.3.2 Beige mice do not develop HLH after low dose LCMV WE infection.......................... 69
3.3.3 An increased T cell frequency does not change the outcome of disease in beige mice.
..................................................................................................................................... 70
3.3.4 Changing virus dose induces transient disease in beige mice. .................................. 71
3.3.5 The souris mutation confers a risk for developing severe HLH following low dose
LCMV WE infection...................................................................................................... 73
3.3.6 HLH in souris mice is associated with virus persistence............................................. 74
3.3.7 CTL activity rather than NK cell activity determines the risk for HLH.......................... 74
4 Discussion ....................................................................................................... 77
4.1 Disease susceptibility after RSV infection is favored by a highly focused, low
avidity, MHC-dependent CTL response.............................................................77
4.2 HLH in mouse models for Hermansky-Pudlak syndrome type II and the
Chèdiak-Higashi syndrome ................................................................................79
4.2.1 Hermansky-Pudlak syndrome type II confers a risk for HLH ...................................... 80
4.2.2 AP-3 deficiency - more than a defect in cytotoxicity.................................................... 81
4.2.3 Geno-phenotype correlation in the mouse models for CHS ....................................... 82
4.2.4 HLH in mice is associated with antigen persistence ................................................... 84
4.2.5 CTL rather than NK cell cytotoxicity determines the risk for HLH. .............................. 85
5 References ....................................................................................................... 87
Acknowledgement/Danksagung.........................................................................................97
Abstract 7
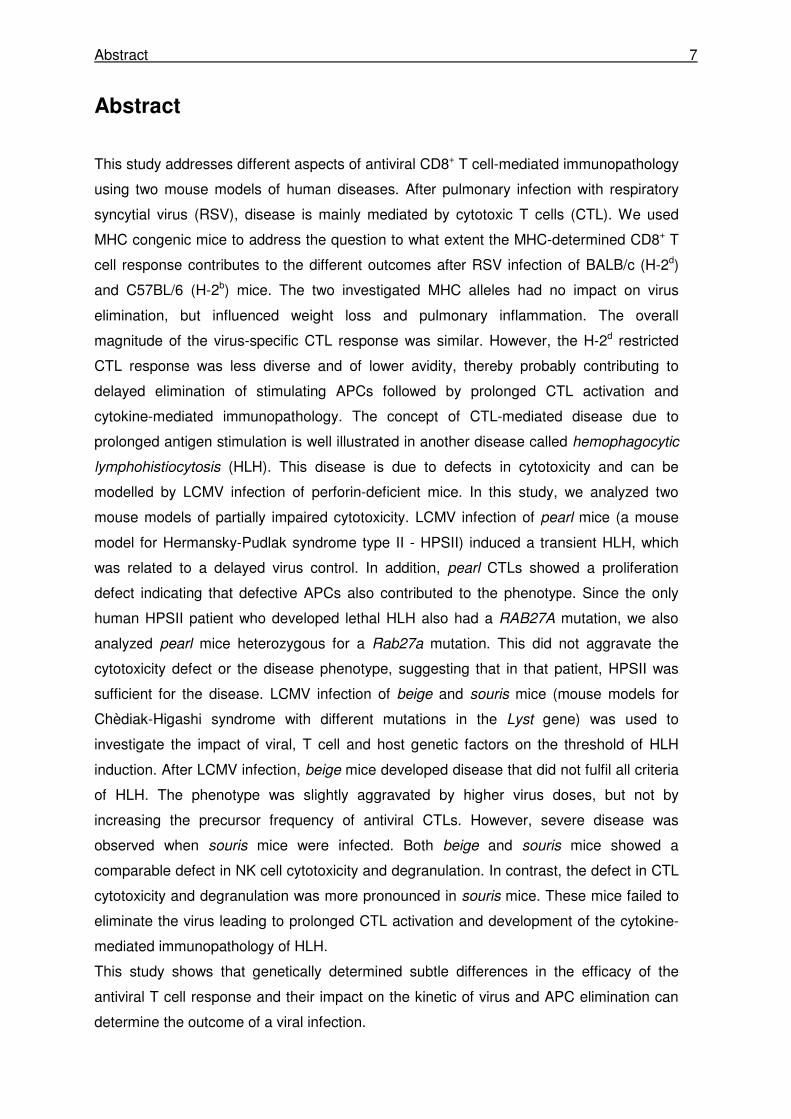
Abstract
This study addresses different aspects of antiviral CD8+ T cell-mediated immunopathology
using two mouse models of human diseases. After pulmonary infection with respiratory
syncytial virus (RSV), disease is mainly mediated by cytotoxic T cells (CTL). We used
MHC congenic mice to address the question to what extent the MHC-determined CD8+ T
cell response contributes to the different outcomes after RSV infection of BALB/c (H-2d)
and C57BL/6 (H-2b) mice. The two investigated MHC alleles had no impact on virus
elimination, but influenced weight loss and pulmonary inflammation. The overall
magnitude of the virus-specific CTL response was similar. However, the H-2d restricted
CTL response was less diverse and of lower avidity, thereby probably contributing to
delayed elimination of stimulating APCs followed by prolonged CTL activation and
cytokine-mediated immunopathology. The concept of CTL-mediated disease due to
prolonged antigen stimulation is well illustrated in another disease called hemophagocytic
lymphohistiocytosis (HLH). This disease is due to defects in cytotoxicity and can be
modelled by LCMV infection of perforin-deficient mice. In this study, we analyzed two
mouse models of partially impaired cytotoxicity. LCMV infection of pearl mice (a mouse
model for Hermansky-Pudlak syndrome type II - HPSII) induced a transient HLH, which
was related to a delayed virus control. In addition, pearl CTLs showed a proliferation
defect indicating that defective APCs also contributed to the phenotype. Since the only
human HPSII patient who developed lethal HLH also had a RAB27A mutation, we also
analyzed pearl mice heterozygous for a Rab27a mutation. This did not aggravate the
cytotoxicity defect or the disease phenotype, suggesting that in that patient, HPSII was
sufficient for the disease. LCMV infection of beige and souris mice (mouse models for
Chèdiak-Higashi syndrome with different mutations in the Lyst gene) was used to
investigate the impact of viral, T cell and host genetic factors on the threshold of HLH
induction. After LCMV infection, beige mice developed disease that did not fulfil all criteria
of HLH. The phenotype was slightly aggravated by higher virus doses, but not by
increasing the precursor frequency of antiviral CTLs. However, severe disease was
observed when souris mice were infected. Both beige and souris mice showed a
comparable defect in NK cell cytotoxicity and degranulation. In contrast, the defect in CTL
cytotoxicity and degranulation was more pronounced in souris mice. These mice failed to
eliminate the virus leading to prolonged CTL activation and development of the cytokine-
mediated immunopathology of HLH.
This study shows that genetically determined subtle differences in the efficacy of the
antiviral T cell response and their impact on the kinetic of virus and APC elimination can
determine the outcome of a viral infection.

Abbreviations 8
Abbreviations AP adaptor protein APC antigen presenting cell ALPS autoimmune lymphoproliferative syndrome BAL(F) bronchoalveolar lavage (fluid) BCR B cell receptor bp base pair CHS Chédiak-Higashi syndrome CTL cytotoxic T lymphocyte DNA desoxyribonucleic acid EBV Epstein-Barr virus ELISA enzyme-linked immunosorbent assay FACS fluorescence activated cell sorter FADD FAS associated via death domain FCS fetal calf serum FHL familial hemophagocytic lymphohistiocytosis GLDH glutamate dehydrogenase GPT gutamate pyruvate transaminase GSII Griscelli syndrome type II HBV hepatitis B virus HIV human immunodeficiency virus HPSII Hermansky-Pudlak syndrome type 2 HRS hepatocyte growth factor-regulated tyrosine kinase substrate HSCT hematopoietic stem cell transplantation HVH herpesvirus hominis (herpes simplex virus) ICAM intracellular adhesion molecule IFN interferon IL interleukin ILT immunoglobulin like transcripts i.n. intranasal i.p. intraperitoneal i.v. intraveneous KIR killer immunoglobulin-like receptors LAMP lysosom associated membrane protein LAT linker for activation of T cells LCMV lymphocytic choriomeningitis virus LDH lactate dehydrogenase LFA lymphocyte function-associated antigen LILR leukocyte immunoglobulin-like receptors MCP macrophage chemoattractant protein MHC major histocompatibility complex MIP macrophage inflammatory protein moi multiplicity of infection MTOC microtubule-reorganization center NK Natural Killer pfu plaque forming units RANTES regulated upon activation, normal T cell expressed and secreted RNA ribonucleic acid RSV respiratory syncytial virus RT room temperature SD standard deviation SLP Scr homology 2 domain containing leukocyte protein SNAP soluble N-ethylmaleimide sensitive factor attachment protein SNARE SNAP receptor TCR T cell receptor
Abbreviations 9
TH T helper TNF(R) tumor necrosis factor (receptor) Treg T regulatory TRAIL TNF-related apoptosis inducing ligand ZAP zeta-associated protein
Nomenclature of genes and proteins:
Gene symbols are italicized. Human origin is indicated by using uppercase letters and for
murine genes only the first letter is capitalized. Protein designations follow the same rules as
gene symbols, but protein symbols are not italicized.
Introduction 10
1 Introduction
1.1 Immune system
The human organism is challenged daily by microorganisms that only occasionally cause
disease. Most of them are detected and destroyed by the immune system within hours after
entering the body while the clearance of others requires more time. The immune system can
be divided into two parts: the innate and the adaptive immune system.
1.1.1 Innate immune system
The first contact between a microorganism and its host usually occurs at epithelial surfaces
followed by colonization or penetration before replication occurs. At this stage the innate
immune system responds to invading pathogens while the adaptive immune response
requires several days to develop [1-3].
After breaking the epithelial barrier and replicating in the tissue, the first line of defense
consists of macrophages and granulocytes, especially neutrophils [4]. Cells of the innate
immune system use a variety of germline-encoded receptors to discriminate between normal
or uninfected and transformed or infected cells. These pattern-recognition receptors
recognize highly conserved motifs that are shared by many pathogens, the pathogen-
associated molecular patterns [5].
Macrophages carry e.g. mannose-receptors, scavenger receptors, and CD14 [6-8]. After
recognition of the pathogen via one of these receptors, it is ingested through phagocytosis
and destroyed intracellularly. Macrophages and neutrophils have a variety of toxic
mechanisms to kill microorganism. Following phagocytosis, the phagosome fuses with
lysosomes and the pathogen is killed by toxic substances (nitric oxide, reactive oxygen
species) and degraded by various enzymes. In addition, macrophages release
proinflammatory cytokines (e.g. IL-1β, IL-6, IL-12, TNF-α, MCP-1, MIP-1β) and chemokines
(e.g. CXCL8) and other mediators (e.g. complement components, prostaglandins,
leukotriene, platelet-activating factor) to recruit inflammatory cells to the site of infection and
induce expression of co-stimulatory molecules on macrophages and dendritic cells [9].
The secretion of type I IFNs by infected cells and cyokines derived from macrophages (e.g.
IL-12) leads to the activation of Natural Killer (NK) cells. NK cells exhibit a wide range of
inhibitory and activating surface receptors that have been grouped in: C-type lectin receptors
(CD94 and NKG2D family), immunoglobulin like transcripts (ILTs) or leukocyte
Introduction 11
immunoglobulin-like receptors (LILRs) and Killer immunoglobulin-like receptors (KIRs) [10,
11]. Using these receptors, NK cells can detect reduced or absent expression of classical
and non classical MHC class I molecules on target cells and destroy them. NK cells kill
infected cells via release of cytotoxic granules. In addition, they produce IFN-γ upon
stimulation with IL-12 and TNF-α. IFN-γ then activates macrophages to kill intracellular
pathogens [2, 12].
This innate immune response can prevent an infection from being established or can prevent
its spreading until the adaptive immune response has developed.
1.1.2 Adaptive immune response
To induce an adaptive immune response, activated professional antigen-presenting cells
(APCs) that reside in most tissues leave the site of infection to enter peripheral lymphoid
tissues such as draining lymph nodes, where they get in contact with naïve CD4+ and CD8+ T
cells [3, 13]. These T cells can specifically recognize processed peptide antigens derived
from pathogens in context of MHC molecules using their specific antigen-receptors (T cell
receptor, TCR). During T cell development, gene segments (V(D)J) of the α-, β-, γ-, and δ-
chains of the TCRs are rearranged to create genes that encode for the huge variety of
antigen-specific receptors carried by the available pool of T lymphocytes. The αβ T cells
account for most of the T cells and only a small proportion of the T lymphocytes express the
γδ TCR that recognizes antigen in the context of non-classical MHC molecules [13].
Following activation, T cells begin to proliferate and mature into effector T cells that migrate
back to the site of infection [14]. Proliferation and differentiation are driven by IL-2 that is
produced by activated T cells themselves. The differentiation of CD4 T cells into TH1 or TH2
cells determines whether a humoral or cell-mediated immunity will predominate. Under the
influence of IL-12, IFN-γ, and the T-box expressed in T cells transcription factor (T-bet), naïve
CD4 T cells differentiate into TH1 cells with the capacity to produce IL-2 and IFN-γ. In
contrast, the development of TH2 cells that can produce IL-4, IL-5, IL-10, and IL-13, is driven
by IL-4 and the transcription factor GATA-3.[15]
While cytotoxic CD8 T cells (CTL) have to leave the lymphoid organs in order to exert their
effector function in the inflamed tissue, the most important function of T helper cells
(predominantly TH2 cells) is to interact with B cells in the lymphoid tissues. Following binding
of antigen with their antigen-specific receptor (B cell receptor, BCR) and co-stimulation, B
cells are activated. They proliferate and migrate to the primary follicles to form germinal
centers [16]. Here B cells interact with helper T cells to undergo isotype switching and affinity
maturation of their BCR before becoming either memory cells or antibody-secreting plasma
cells that leave the germinal center. Depending on the infectious agent T cells -cytotoxic and
Introduction 12
helper T cells- together with specific antibodies produced by B cells are able to clear an
infection and build up immunological memory to prevent reinfection [13].
1.1.3 Antiviral immune responses
Primary antiviral immune responses are mainly mediated by T cells. CD8+ T cells play a key
role in the elimination of certain viruses [17, 18]. In this study two viruses were used to
induce local or systemic infections in order to analyze different aspects of the T cell-
dependent immune response and T cell-mediated immunopathology in the mouse model.
The virus used for a local infection is the human Respiratory Syncytial Virus A2 (RSV)
belonging to the genus Pneumovirus of the family of Paramyxoviridae. RSV is a negative-
sense, single-stranded RNA virus that upon intranasal application infects and predominantly
replicates in the epithelial cells of the respiratory tract. BALB/c mice and C57BL/6 mice
exhibit different susceptibilities to infection and virus-induced pathology, but the reason for
these differences is unknown [19, 20]. To establish a systemic infection, mice were infected
intravenously with Lymphocytic choriomeningitis virus WE (LCMV WE). LCMV is an
Arenavirus with a bisegmented negative-strand RNA genome and is a natural pathogen of
mice [21].
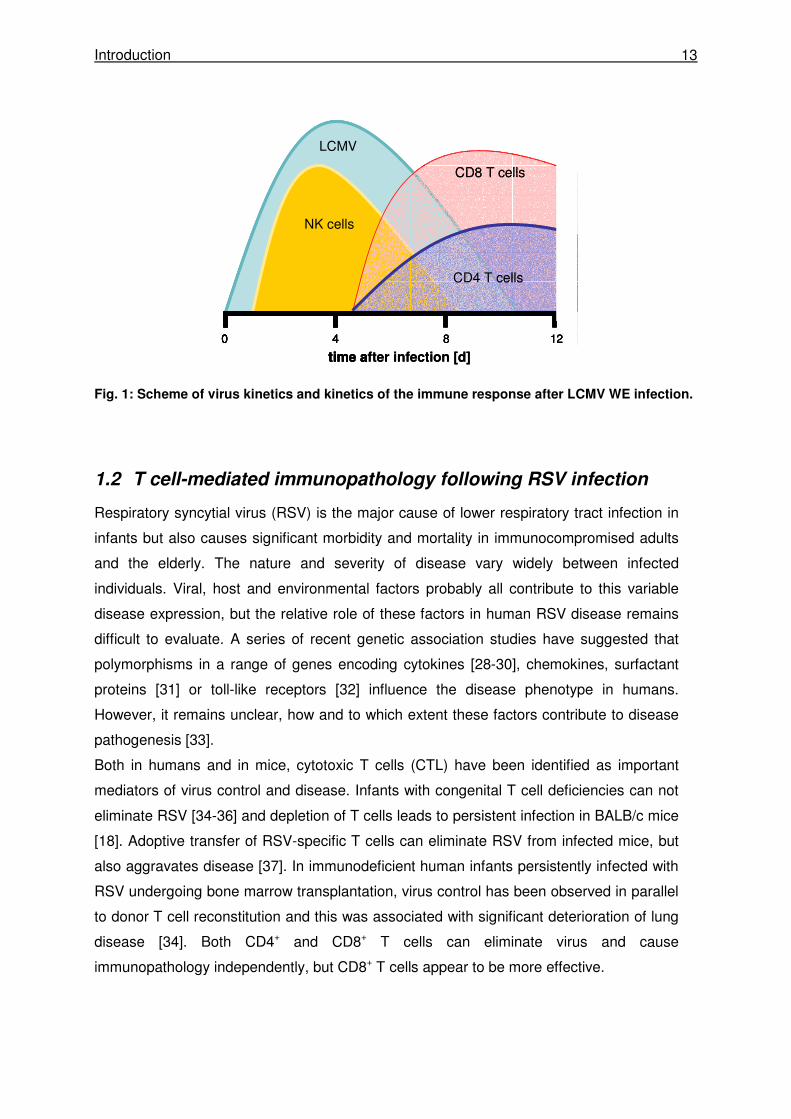
Following infection, both viruses replicate to maximal titers four days after infection [19, 21]
(Fig. 1). During this time NK cells are activated and reach their maximal activity about three
days after infection [22-24]. NK cells are not sufficient for virus control but contribute to the
induction of T cell responses. After NK cell activation in the lymph node, T cells are activated,
proliferate and reach their maximum in numbers and activity seven to eight days after
infection (Fig. 1). Both CD4 and CD8 T cells contribute to virus clearance, but CD8+ cytotoxic
T cells play the major role in eliminating the virus [18]. In LCMV infected mice, CTLs
massively expand until -at the peak of expansion- more than 80% of spleen cells are LCMV-
specific [17, 25]. In contrast, following RSV infection only about 20% of total pulmonary CTL
are specific for RSV [26, 27]. Following RSV infection the virus is cleared until day seven
after infection. The kinetics for virus replication and T cell expansion are very similar in LCMV
and RSV infection but after infection LCMV is cleared until day ten [21] (Fig. 1).
Introduction 13
Fig. 1: Scheme of virus kinetics and kinetics of the immune response after LCMV WE infection.
1.2 T cell-mediated immunopathology following RSV infection
Respiratory syncytial virus (RSV) is the major cause of lower respiratory tract infection in
infants but also causes significant morbidity and mortality in immunocompromised adults
and the elderly. The nature and severity of disease vary widely between infected
individuals. Viral, host and environmental factors probably all contribute to this variable
disease expression, but the relative role of these factors in human RSV disease remains
difficult to evaluate. A series of recent genetic association studies have suggested that
polymorphisms in a range of genes encoding cytokines [28-30], chemokines, surfactant
proteins [31] or toll-like receptors [32] influence the disease phenotype in humans.
However, it remains unclear, how and to which extent these factors contribute to disease
pathogenesis [33].
Both in humans and in mice, cytotoxic T cells (CTL) have been identified as important
mediators of virus control and disease. Infants with congenital T cell deficiencies can not
eliminate RSV [34-36] and depletion of T cells leads to persistent infection in BALB/c mice
[18]. Adoptive transfer of RSV-specific T cells can eliminate RSV from infected mice, but
also aggravates disease [37]. In immunodeficient human infants persistently infected with
RSV undergoing bone marrow transplantation, virus control has been observed in parallel
to donor T cell reconstitution and this was associated with significant deterioration of lung
disease [34]. Both CD4+ and CD8+ T cells can eliminate virus and cause
immunopathology independently, but CD8+ T cells appear to be more effective.
LCMV
NK cells
CD4 T cells
0 4 8 12
time after infection [d]
CD8 T cells
LCMV
NK cells
CD4 T cells
0 4 8 12
time after infection [d]
CD8 T cells
LCMV
NK cells
CD4 T cells
0 4 8 12
time after infection [d]
0 4 8 120 4 8 12
time after infection [d]
CD8 T cells

Introduction 14
The strength and composition of the CTL response to viruses is determined by the MHC
haplotype. An important contribution of the MHC to susceptibility to viral infections has
been documented in murine HVH-1 [38] and LCMV infection [39] and has been linked to
the impact of the MHC on the T cell repertoire and T cell avidity [38]. In murine RSV
infection a varying permissiveness to viral replication was shown in different mouse
strains [19]. Analysis of virus titers and disease susceptibility revealed that “resistant”
mice, e.g. C57BL/6 mice, exhibited low permissiveness to viral replication and no disease.
In contrast, for “susceptible” mouse strains, such as AKR, 129P3 and BALB/c mice, higher
virus load and a more pronounced disease was reported [20, 40]. The differences in viral
replication and weight loss between BALB/c and C57BL/6 mice were confirmed in further
studies [41, 42], although airway obstruction and airway hyperresponsiveness were
similar [41]. Higher viral replication is a reasonable explanation for the different outcomes
of infection in the two strains, but this has not been formally proven and may not be the
only relevant factor. Furthermore, the contribution of MHC to disease susceptibility in RSV
infection is not very well characterized by now and is further analyzed in this study.
1.3 Control of immune homeostasis by T cells
Once an infection is cleared, control mechanisms are required to maintain immune
homeostasis to avoid unnecessary inflammatory responses and damage of healthy tissues.
At the end of an antiviral immune response especially the activity of CTLs needs to be strictly
controlled. Defects in the control mechanisms may result in overactivation of CTLs and
immunopathology caused by inflammatory cytokines and uncontrolled CTL-mediated effector
functions [43]. The termination of immune responses to viruses is mainly mediated by
cytotoxic T cells. The first mechanism for termination of the immune response involves
programmed cell death induced by death receptors. CTLs express both FAS ligand and its
receptor FAS. Ligation of the FAS receptor by FAS ligand on neighboring T cells (“fratricide”)
is thought to contribute to contraction of the CTL pool at the end of an immune response [44].
Defects in FAS or the FAS receptor lead to a lymphoproliferative syndrome accompanied by
severe autoimmunity, i.e. the autoimmune lymphoproliferative syndrome (ALPS) [45].
Expansion of CTLs can also be limited by CTL-mediated perforin-dependent killing of
neighboring T cells. During the killing of target cells CTLs are in close contact with the target
cell membrane at the immunological synapse. Here CTLs can transiently acquire
peptide:MHCI complexes from target cells [46-48] making them susceptible to killing by other
CTLs. This self-regulating mechanism for downregulation of the immune response can also
contribute to contraction of the CTL pool.
Introduction 15
The third mechanism is dependent on perforin-mediated lysis of stimulating APCs. CTLs are
activated via APCs, proliferate and acquire effector function. They migrate out into infected
tissues to exert their antiviral activity. At the same time, they also re-encounter APCs, which
are now recognized as targets and are therefore killed in a perforin-dependent manner. This
terminates CTL activation and is therefore a negative feedback mechanism to avoid
overstimulation of the CTL response [49]. Defects in perforin or in the lytic granule exocytosis
pathway cause hemophagocytic lymphohistiocytosis (HLH). In this syndrome CTLs are not
able to terminate the stimulation via APCs [50-52]. Data from perforin-deficient mice confirm
this concept by showing increased activation of CTLs and therefore an increased IFN-γ
production as a result of elevated or prolonged antigen presentation [49]. This prolonged
contact between CTLs and APCs may also rescue activated CTLs from undergoing
apoptosis. The pathogenetic concepts of hemophagocytic lymphohistiocytosis are further
explained in chapter 1.5.
Another manifestation of the failure to control immune responses is immunopathology [53]
following virus infections. This occurs e.g. after liver infection with non-cytopathic viruses
(e.g. hepatitis B virus, HBV [54]) or after lung infection with respiratory viruses (e.g.
respiratory syncytial virus, RSV [55]). Here the pathology is not exclusively caused by virus-
induced tissue damage but also by a not properly controlled CTL response. CTLs not only
destroy infected cells but can also cause damage in the surrounding healthy tissue by
attracting additional inflammatory cells.
1.4 Cell death induced by cytotoxic lymphocytes
Cytotoxic lymphocytes -NK cells and CTLs- detect and destroy infected and transformed
cells to eliminate pathogens and tumor cells and to maintain immune homeostasis. The two
cell populations differ in the way of recognizing their target cells and in activation. However,
their cytotoxic effector function is carried out in the same way with the final consequence of
inducing apoptosis of the target cells [44, 56]. To eliminate virus-infected and transformed
cells, CTLs and NK cells are able to induce programmed cell death via two major pathways:
ligation of death receptors and exocytosis of lytic granules [57].
1.4.1 Ligation of death receptors
One mechanism of CTLs and NK cells to induce apoptosis in target cell is the ligation of
death receptors expressed in the membrane of target cells. Aggregation of death receptors -
FAS, TNF receptor (tumor necrosis factor) and TRAIL (TNF-related apoptosis inducing
ligand) receptor- on target cells through binding of their cognate ligands -FAS, TNF and
Introduction 16
TRAIL- that are expressed on the cytotoxic effector cells- leads to an intracellular signaling
cascade finally inducing target cell death [56]. Interaction of FAS ligand with the FAS
receptor represents the most important death receptor system, but TNF and TRAIL and their
receptors (TNFR-I and TRAILR) can act in a similar fashion.
FAS and its ligand must aggregate in trimers to become biologically active. Binding of the
homotrimeric FAS ligand to the receptor induces conformational changes of the trimeric
receptor. Adaptor proteins like FADD (FAS associated via death domain) can bind to the
clustered death domains in the cytoplasmic tails of the receptors. FADD interacts via a
second death domain with caspase-8. Caspases are cysteine proteases that upon activation
cleave protein chains on the C-terminal side of aspartic acid residues. Clustered caspase-8
can activate and cleave capase-8 in trans so that an active domain is released leading to a
cascade of cleaving and activating downstream caspases. At the end of this cascade a
caspase-activated DNase is released from its inhibitory protein, enters the nucleus and
cleaves DNA. This DNA fragmentation is characteristic for apoptosis. [44]
Congenital defects in these pathways cause dysregulation of immune homeostasis and
autoimmunity rather than increased susceptibility to infection [44]. These clinical
observations support the idea that the function of FAS-FAS ligand interactions rather serve to
terminate the immune response after elimination of the initiating pathogen than to contribute
to pathogen elimination.
1.4.2 Exocytosis of lytic granules
A major pathway of CTL- and NK cell-mediated killing involves the exocytosis of lytic
granules into the immunological synapse, which is the contact site between effector and
target cell [58]. These granules are modified lysosomes that contain distinct cytotoxic effector
proteins like perforin, granzymes and granulysin. In the lysosomal membrane, proteins such
as LAMP-1 (lysosom associated membrane protein-1; CD107a), LAMP-2 and LAMP-3 [59]
are expressed. This pathway accounts for most of the cytotoxic activity of CD8 effector cells
as shown by the loss of most of the killing activity in perforin-deficient mice [60, 61].
1.4.2.1 Perforin
Perforin is a pore forming protein of ~67kDa that is found in a soluble monomeric form within
lytic granules. After its release it is anchored in the target cell membrane and begins to
polymerize in the presence of Ca2+ to form cylindric pores. Currently three mechanisms are
discussed by which perforin support granzymes in entering the target cell. The first
mechanism is based on the theory that perforin forms pores into target cell membrane so
that granzymes can diffuse from the immunological synapse into the target cell [62, 63]. An
Introduction 17
alternative theory suggests that perforin and granzymes bind to the target cell membrane via
electrostatic adhesion or receptor interactions, and then both are taken up by endocytosis.
Perforin is then thought to disrupt the endosomal membrane thereby releasing granzymes
into the cytosol of the target cell [63]. The most recent theory is a combination of both. It is
thought that perforin introduced pores into the target cell membrane causing an ion flux
(Ca2+). During an attempt to repair such lesions, perforin and granzymes are internalized [43,
44, 56]. When discussing these concepts, it is important to keep in mind that perforin is
needed for granzyme-dependent cytotoxicity as shown in perforin-deficient mice and
perforin-deficient patients [43, 64-66].
1.4.2.2 Granzymes
Granzymes belong to a family of serine proteases. Granzymes A-G, K, L, M, and N are found
in lytic granules of mice, while CTL and NK cell granules of humans only contain granzymes
A, B, H, K, and M. Both in humans and mice granzymes A and B are the most abundant [67].
Granzyme B preferentially cleaves substrates after aspartic residues. There are two main
pathways of granzyme B-dependent killing, one involving the direct activation of caspases
while the other pathway is mediated through promotion of mitochondrial permeabilization.
Here, granzyme B indirectly promotes caspase activation via the cytochrome c/Apaf-1
pathway in which the BH-3 only protein BID is activated by granzyme B, leading to the
opening of the BAX/BAK channels in the outer membrane of mitochondria. Cytochrome c
released into the cytosol binds and activates the so called apoptosome that promotes
downstream caspase activation and cell death [68]. Granzyme A can induce apoptosis via
multiple pathways. The main mechanism involves proteolysis of components of the
endoplasmatic reticulum-associated SET complex [69]. The cleaved components translocate
to the nucleus where they activate a nuclease causing multiple DNA nicks [43, 70]. Recent
work implicates other roles for granzymes beside cytotoxicity, in particular a role as
proinflammatory extracellular mediators. [62]
1.4.2.3 Granulysin
Granulysin is a cytolytic and proinflammatory protein expressed in human CTLs and NK cells
[71, 72] and until now no mouse homologue has been found. It is synthesized in a 15-kDa
form that partially is cleaved into a 9-kDa form. Both forms of granulysin exist in equal
amounts in CTLs and NK cells with only the 9-kDa form being sequestered in lytic granules.
The 15-kDa form is secreted constitutively but until now the function of this form is unknown.
The 9-kDa form binds to the cell surface without a specific receptor. There it causes
membrane disruption allowing ion fluxes and finally inducing apoptosis of the target cell.
Introduction 18
Granulysin also acts as a chemoattractant for T cells and monocytes and activates the
expression of cytokines like RANTES (regulated upon activation, normal T cell expressed
and secreted), MCP-1 (macrophage chemoattractant protein 1), MCP-3, MIP-1α
(macrophage inflammatory protein), interleukin (IL)-10, IL-1,IL -6 and IFN-α [71].
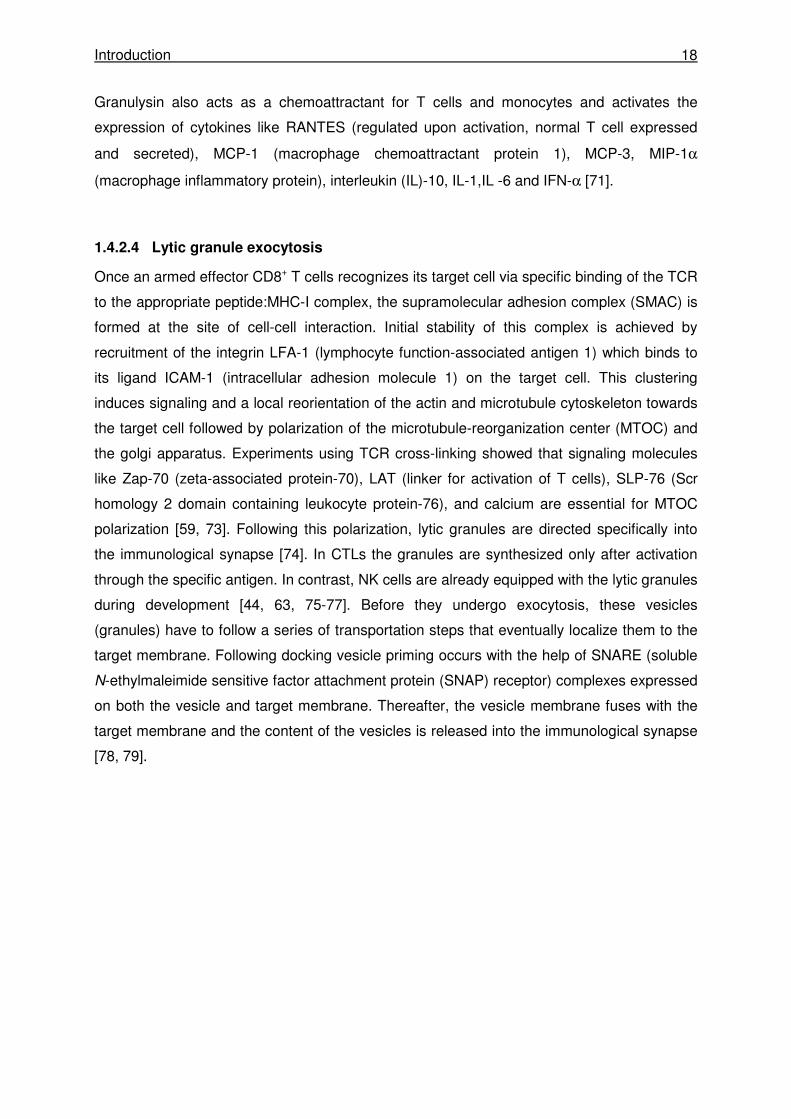
1.4.2.4 Lytic granule exocytosis
Once an armed effector CD8+ T cells recognizes its target cell via specific binding of the TCR
to the appropriate peptide:MHC-I complex, the supramolecular adhesion complex (SMAC) is
formed at the site of cell-cell interaction. Initial stability of this complex is achieved by
recruitment of the integrin LFA-1 (lymphocyte function-associated antigen 1) which binds to
its ligand ICAM-1 (intracellular adhesion molecule 1) on the target cell. This clustering
induces signaling and a local reorientation of the actin and microtubule cytoskeleton towards
the target cell followed by polarization of the microtubule-reorganization center (MTOC) and
the golgi apparatus. Experiments using TCR cross-linking showed that signaling molecules
like Zap-70 (zeta-associated protein-70), LAT (linker for activation of T cells), SLP-76 (Scr
homology 2 domain containing leukocyte protein-76), and calcium are essential for MTOC
polarization [59, 73]. Following this polarization, lytic granules are directed specifically into
the immunological synapse [74]. In CTLs the granules are synthesized only after activation
through the specific antigen. In contrast, NK cells are already equipped with the lytic granules
during development [44, 63, 75-77]. Before they undergo exocytosis, these vesicles
(granules) have to follow a series of transportation steps that eventually localize them to the
target membrane. Following docking vesicle priming occurs with the help of SNARE (soluble
N-ethylmaleimide sensitive factor attachment protein (SNAP) receptor) complexes expressed
on both the vesicle and target membrane. Thereafter, the vesicle membrane fuses with the
target membrane and the content of the vesicles is released into the immunological synapse
[78, 79].
Introduction 19
Figure 2: Scheme of the immunological synapse between a CTL and a target cell. Stabilization of the immunological synapse via LFA-1 and ICAM following T cell activation via TCR-peptide:MHC binding is shown. After reorientation and polarization of the MTOC and the microtubule cytoskeleton, vesicles are transported to the immunological synapse, degranulate and release perforin, granzymes and granulysin into the cleft between effector and target cells. Modified from [43]
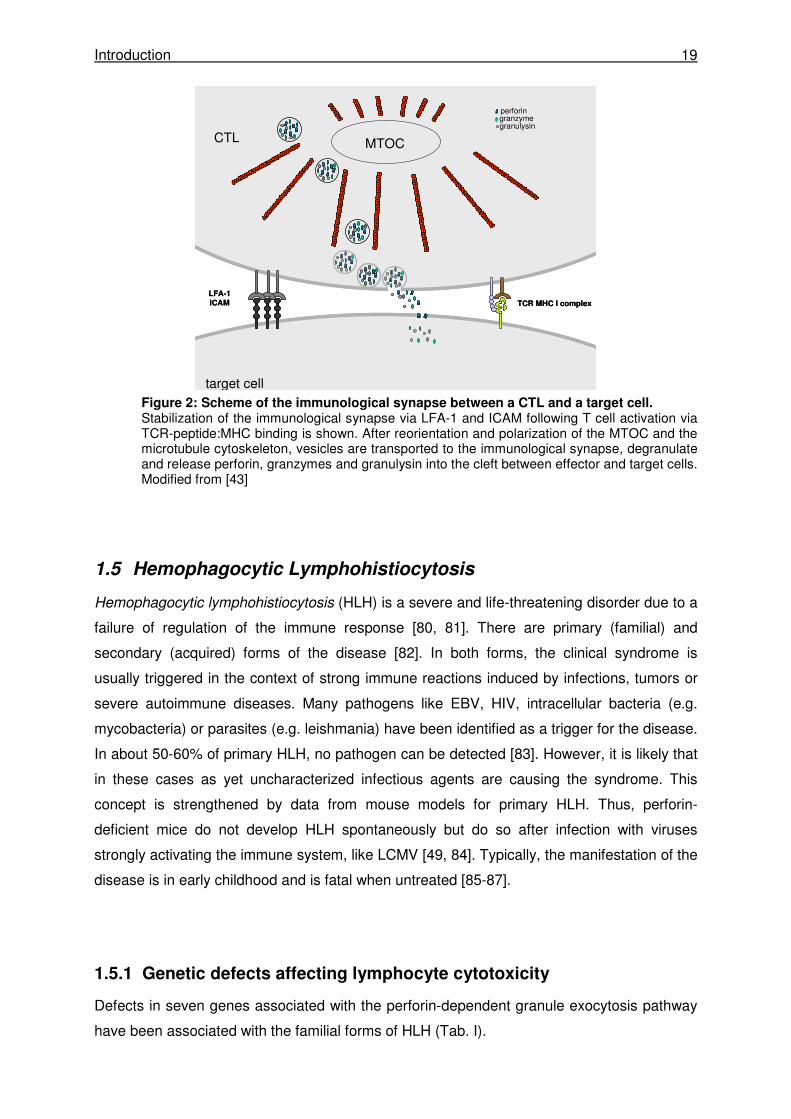
1.5 Hemophagocytic Lymphohistiocytosis
Hemophagocytic lymphohistiocytosis (HLH) is a severe and life-threatening disorder due to a
failure of regulation of the immune response [80, 81]. There are primary (familial) and
secondary (acquired) forms of the disease [82]. In both forms, the clinical syndrome is
usually triggered in the context of strong immune reactions induced by infections, tumors or
severe autoimmune diseases. Many pathogens like EBV, HIV, intracellular bacteria (e.g.
mycobacteria) or parasites (e.g. leishmania) have been identified as a trigger for the disease.
In about 50-60% of primary HLH, no pathogen can be detected [83]. However, it is likely that
in these cases as yet uncharacterized infectious agents are causing the syndrome. This
concept is strengthened by data from mouse models for primary HLH. Thus, perforin-
deficient mice do not develop HLH spontaneously but do so after infection with viruses
strongly activating the immune system, like LCMV [49, 84]. Typically, the manifestation of the
disease is in early childhood and is fatal when untreated [85-87].
1.5.1 Genetic defects affecting lymphocyte cytotoxicity
Defects in seven genes associated with the perforin-dependent granule exocytosis pathway
have been associated with the familial forms of HLH (Tab. I).
MTOC
TCR MHC I complex
LFA-1ICAM
CTL
target cell
perforingranzymegranulysin
MTOC
TCR MHC I complex
LFA-1ICAM
CTL
target cell
perforingranzymegranulysin
Introduction 20
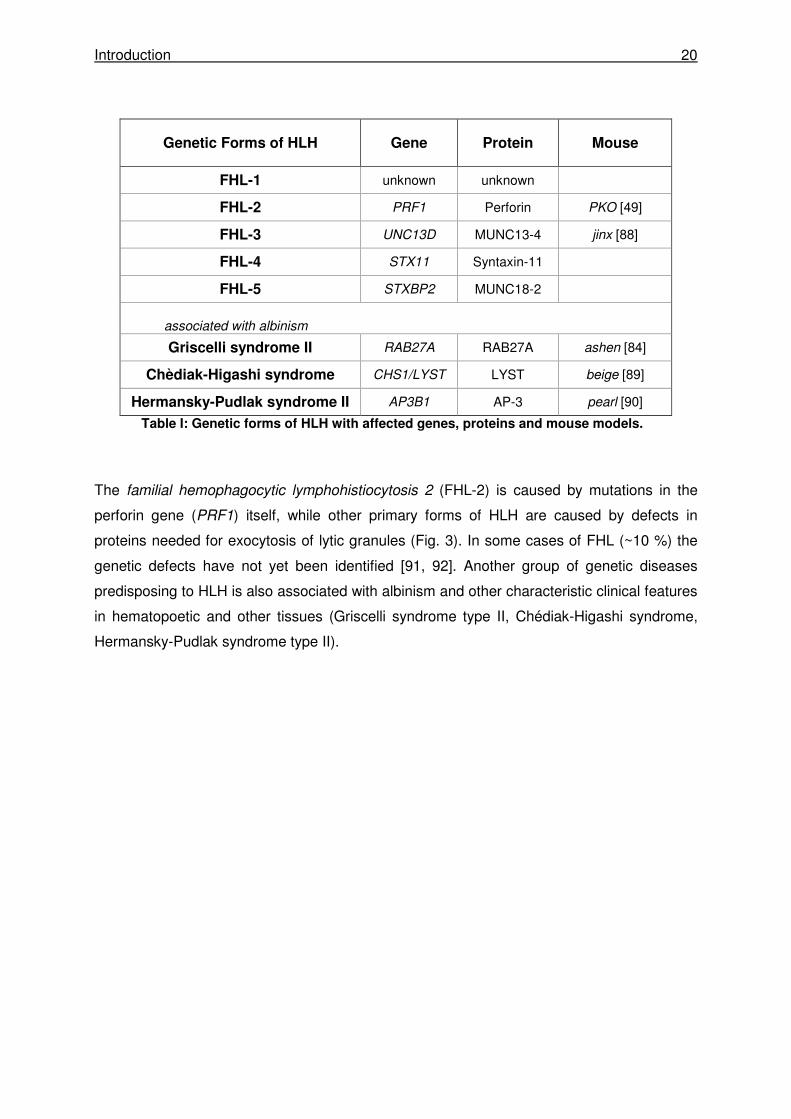
Genetic Forms of HLH Gene Protein Mouse
FHL-1 unknown unknown
FHL-2 PRF1 Perforin PKO [49]
FHL-3 UNC13D MUNC13-4 jinx [88]
FHL-4 STX11 Syntaxin-11
FHL-5 STXBP2 MUNC18-2
associated with albinism
Griscelli syndrome II RAB27A RAB27A ashen [84]
Chèdiak-Higashi syndrome CHS1/LYST LYST beige [89]
Hermansky-Pudlak syndrome II AP3B1 AP-3 pearl [90]
Table I: Genetic forms of HLH with affected genes, proteins and mouse models.
The familial hemophagocytic lymphohistiocytosis 2 (FHL-2) is caused by mutations in the
perforin gene (PRF1) itself, while other primary forms of HLH are caused by defects in
proteins needed for exocytosis of lytic granules (Fig. 3). In some cases of FHL (~10 %) the
genetic defects have not yet been identified [91, 92]. Another group of genetic diseases
predisposing to HLH is also associated with albinism and other characteristic clinical features
in hematopoetic and other tissues (Griscelli syndrome type II, Chédiak-Higashi syndrome,
Hermansky-Pudlak syndrome type II).
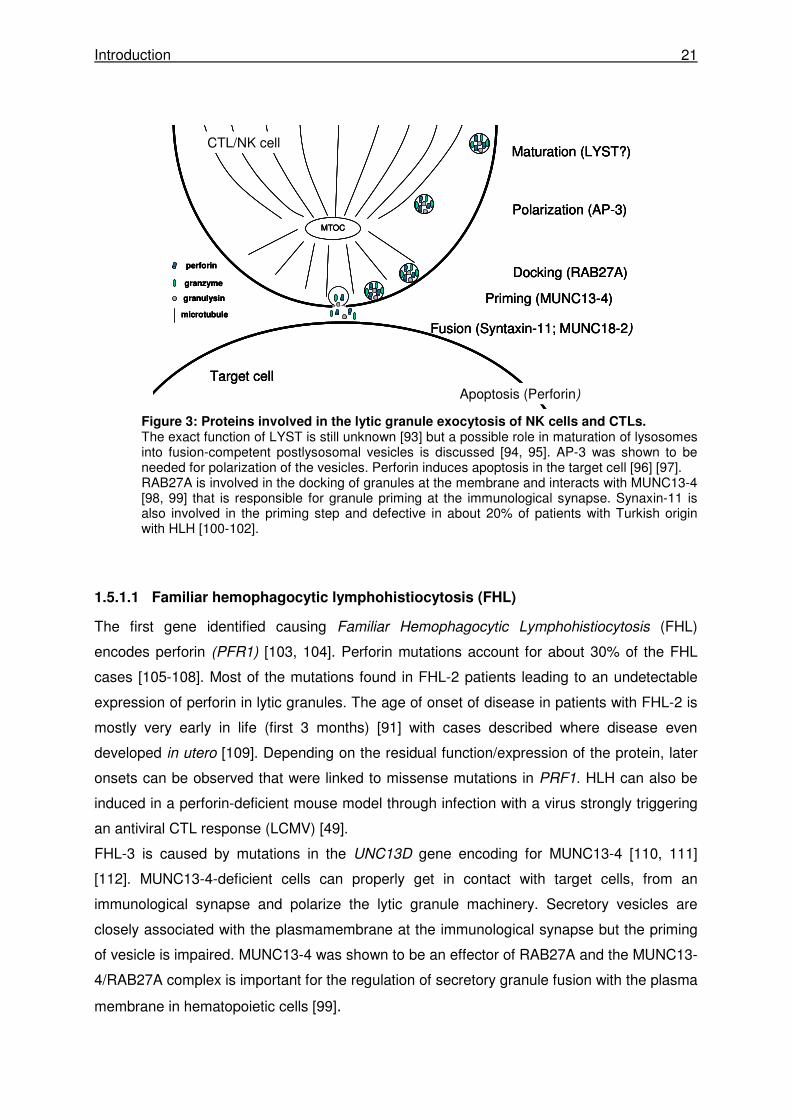
Introduction 21
Figure 3: Proteins involved in the lytic granule exocytosis of NK cells and CTLs. The exact function of LYST is still unknown [93] but a possible role in maturation of lysosomes into fusion-competent postlysosomal vesicles is discussed [94, 95]. AP-3 was shown to be needed for polarization of the vesicles. Perforin induces apoptosis in the target cell [96] [97]. RAB27A is involved in the docking of granules at the membrane and interacts with MUNC13-4 [98, 99] that is responsible for granule priming at the immunological synapse. Synaxin-11 is also involved in the priming step and defective in about 20% of patients with Turkish origin with HLH [100-102].
1.5.1.1 Familiar hemophagocytic lymphohistiocytosis (FHL)
The first gene identified causing Familiar Hemophagocytic Lymphohistiocytosis (FHL)
encodes perforin (PFR1) [103, 104]. Perforin mutations account for about 30% of the FHL
cases [105-108]. Most of the mutations found in FHL-2 patients leading to an undetectable
expression of perforin in lytic granules. The age of onset of disease in patients with FHL-2 is
mostly very early in life (first 3 months) [91] with cases described where disease even
developed in utero [109]. Depending on the residual function/expression of the protein, later
onsets can be observed that were linked to missense mutations in PRF1. HLH can also be
induced in a perforin-deficient mouse model through infection with a virus strongly triggering
an antiviral CTL response (LCMV) [49].
FHL-3 is caused by mutations in the UNC13D gene encoding for MUNC13-4 [110, 111]
[112]. MUNC13-4-deficient cells can properly get in contact with target cells, from an
immunological synapse and polarize the lytic granule machinery. Secretory vesicles are
closely associated with the plasmamembrane at the immunological synapse but the priming
of vesicle is impaired. MUNC13-4 was shown to be an effector of RAB27A and the MUNC13-
4/RAB27A complex is important for the regulation of secretory granule fusion with the plasma
membrane in hematopoietic cells [99].
CTL/NK cell
Target cell
Maturation (LYST?)
Polarization (AP-3)
Docking (RAB27A)
Priming (MUNC13-4)
Apoptosis (Perforin)
MTOC
Fusion (Syntaxin-11; MUNC18-2)
perforin
granzyme
granulysin
microtubule
CTL/NK cell
Target cell
Maturation (LYST?)
Polarization (AP-3)
Docking (RAB27A)
Priming (MUNC13-4)
Apoptosis (Perforin)
MTOC
Fusion (Syntaxin-11; MUNC18-2)
CTL/NK cell
Target cell
Maturation (LYST?)
Polarization (AP-3)
Docking (RAB27A)
Priming (MUNC13-4)
Apoptosis (Perforin)
MTOC
Fusion (Syntaxin-11; MUNC18-2)
perforin
granzyme
granulysin
microtubule
perforin
granzyme
granulysin
microtubule
Introduction 22
FHL-4 is caused by mutations in the STX11 gene [102, 113]. Syntaxin-11 is expressed in
resting T cells and NK cells. The t-SNARE syntaxin-11 interacts with vesical SNARES (v-
SNARE) [113] and this interaction is needed for the docking and fusion process of vesicles.
FHL-5 is due to mutations in the syntaxin binding protein 2 (STXBP2) also called MUNC18-2
[114, 115]. MUNC18-2 interacts with the SNARE proteins syntaxin-11 and syntaxin-3 and
this interaction was shown to be disturbed in patients with FHL-5 causing instability of both
proteins. [116].
1.5.1.2 Chèdiak-Higashi syndrome
Chèdaik-Higashi syndrome (CHS) -first described by Beguez-Cesar in 1943 followed by
Steinbrinck (1948) and Chèdiak (1952) and Higashi (1954)- is a rare autosomal recessive
disorder characterized by hypopigmentation and a defective cytotoxicity of NK and T cells
[117] with a high risk for developing HLH.
A striking characteristic of CHS is the presence of giant granules in the cytoplasm of
melanocytes and hematopoietic cells as a result of excessive fusion and inability to
degranulate. Most of the patients (~85%) are diagnosed in early childhood (during the first 10
years of life) and present with severe clinical manifestations [118]. Those children suffer from
recurrent life-threatening infections as a result of a pronounced neutropenia and a defective
NK cell activity. Patients with the childhood form of CHS have a high risk to develop HLH that
is usually fatal unless they are bone marrow transplanted. About 10-15% of patients with
CHS show a much milder clinical phenotype [118]. They have no or very few severe
infections and do not develop HLH. Patients with this adult form of CHS survive to adulthood
but they are predisposed to develop peripheral neuropathy as adults. The minority of patients
with CHS (~5%) have an intermediate phenotype with recurrent severe infection in childhood
[118]. Those patients do not develop HLH and by adolescence they have few or no severe
infections anymore.
The defective protein causing CHS (and the beige mouse phenotype) is the 419kDa
CHS1/LYST protein [89, 119] with the length of 13.5 kb. The exact function of the protein is
still unknown. In patients with CHS, a missorting of proteins from the trans-golgi or the early
endosomes to the late endosomes was observed [120]. Additionally the LYST protein is
thought to be involved in the regulation of organelle fusion [121]. One of the identified
partners of the CHS/LYST protein is the HRS (hepatocyte growth factor-regulated tyrosine
kinase substrate) that inhibits exocytosis by its interaction with the t-SNARE SNAP-25,
supporting a role for LYST in the regulation of transmembrane interactions. The giant
granules observed in CTLs do not polarize at the immunological synapse leading to their
impaired secretion [122, 123]. In patients with the classical (childhood) form of CHS
nonsense and frameshift mutations have been identified leading to an early truncation of the
Introduction 23
protein. Patients with milder (adolescent or adult) forms of CHS more often showed
missense mutations in LYST [118, 124]. So far, no studies have been performed correlating
the genetic and clinical findings with immunological studies of lymphocyte degranulation and
cytotoxicity.
The mouse model for CHS is the beige mouse. By now there a several strains of beige mice
carrying different mutations in the Lyst gene, but a common feature of those mice is the
diluted coat color and the giant granule formation that can be observed in hematopoietic cells
and melanocytes. Beige mice are often used as a model for defective NK cell activity.
However, so far these mice have not been used for the study of the pathogenesis of HLH.
1.5.1.3 Griscelli syndome type II
Griscelli syndrome type II (GSII) -first described by Griscelli et al. 1978 [125]- is an
autosomal recessive disorder characterized by a pigmentary dilution with silver gray sheen of
the hair that can be observed under the light microscope as an uneven distribution of
pigment with large pigment granules [126]. GSII is frequently associated with neurological
manifestations cause by infiltration of lymphocytes and macrophages in the CNS. GSII
results from mutations in the RAB27A gene located in the 15q21 chromosomal region [126,
127]. RAB27A belongs to a family of small GTPases that cycle between the cytosol and the
membrane and are inactive in the GDP-bound form and active when GTP is bound. Its active
form is able to bind its specific effectors [128].
Patients with a mutation in RAB27A show an impaired cytotoxicity of NK and T cells.
RAB27A-deficient T cells can form stable complexes with target cells and polarize their
granule exocytosis machinery, but the granules are unable to dock to the plasma membrane
at the immunological synapse. A direct interaction of RAB27A and MUNC13-4 has been
demonstrated [129] in platelets indicating that RAB27A may also be involved in the priming
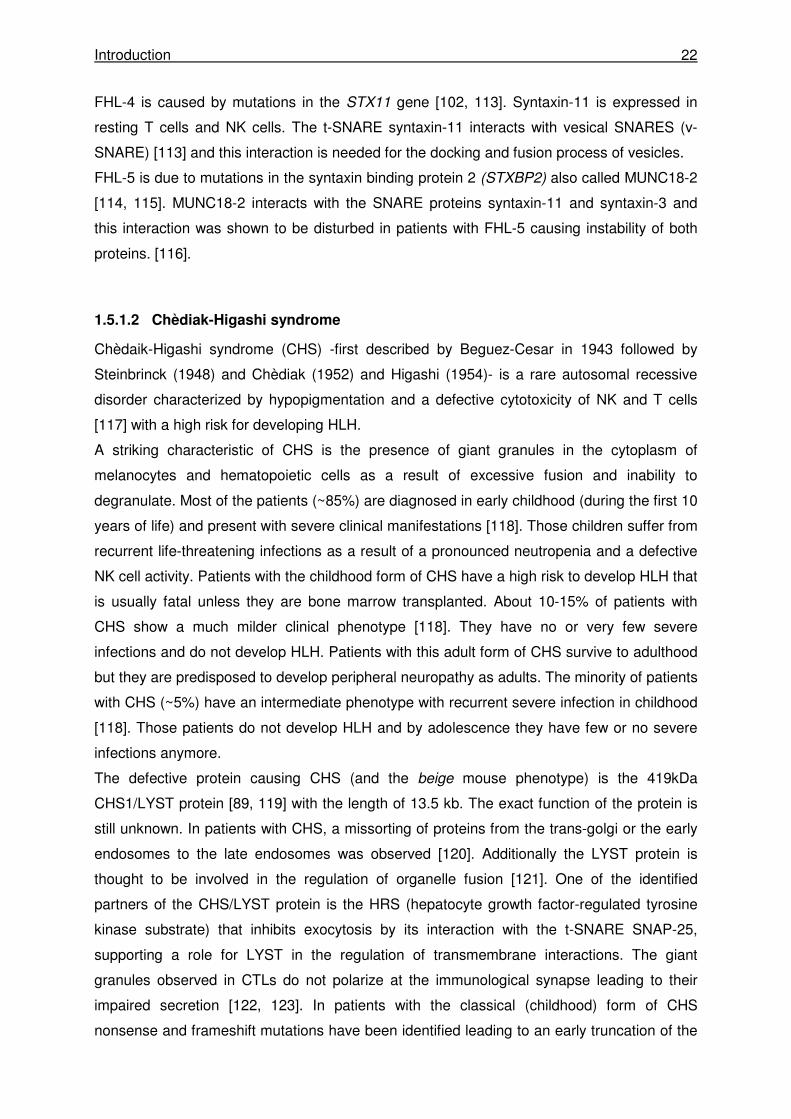
Figure 4: Mouse model for Chèdiak-Higashi syndrome: the beige mouse. In contrast to wildtype C57BL/6 mice (left panel), beige mice (right panel) show a diluted coat color associated with a disturbed pigment contribution in the hair shaft that can be observed via light microscopy. In blood smears, hematopoietic cells of beige mice -especially neutrophils- display giant granule formation in the cytoplasm, characteristic for CHS.
Introduction 24
step of lytic granules [130]. Patients with Griscelli syndrome type II have a high risk of
developing HLH.
The mouse model for Griscelli Syndrome II is the ashen mouse. Cells from ashen mice have
been used as models for the analysis of the cell biology of lysosomal transport. An impaired
CTL cytotoxicity has been demonstrated and recent studies have described that ashen mice
develop all clinical features of HLH following LCMV infection [84]. However, the phenotype is
not as pronounced as in PKO mice, since the clinical course of LCMV-infected ashen mice is
not lethal, at least after low dose infection.
1.5.1.4 Hermansky-Pudlak syndrome type II
Hermansky-Pudlak syndrome type II (Hermansky and Pudlak 1959 [131]) is a rare
autosomal recessive disorder caused by mutations in the gene encoding the β3A subunit of
the adaptor protein 3 (AP-3) complex. The AP-3 complex is a heterotetramer containing a δ
subunit shared with other AP complexes and AP-3 specific β3-, µ3-, σ3 subunits. There are
two different AP-3 complexes –one expressed ubiquitously [132] comprising δ-, β3A-, µ3A-,
σ3 (A or B) subunits and another brain-specific complex containing δ-, β3B-, µ3B-, σ3 (A or
B) subunits mostly expressed in cells of neuronal origin. [133-136] The AP-3 complex is
involved in the biogenesis of lysosome-related organelles and in protein trafficking to
lysosomes or to specialized endosomal-lysosomal organelles such as pigment granules,
melanosomes, and platelet dense granules [137, 138]. The AP-3 complex was described to
interact with the scaffolding protein clathrin but the physiological relevance is still discussed
[139]. In CTLs AP-3 was shown to be essential for polarized secretion of lytic granules [140].
Patients with HPSII show oculocutaneous albinism and platelet defects. They also suffer
from immunodeficiency with an increased susceptibility to infections due to congenital
neutropenia [141]. By now, only one of the eleven described HPSII patients developed the
full clinical picture of HLH with a lethal course [142]. A severe cytotoxicity defect was noted in
that patient. However, since he also carried a heterozygous mutation in RAB27A, it remains
unclear whether the cytotoxicity defect presumably leading to the lethal HLH in this particular
patient can be explained by the AP-3 mutations alone or by an additional contribution of the
RAB27A mutation. This is of obvious clinical importance because preemptive stem cell
transplantation is an important consideration in patients with a high risk of developing HLH.
Meanwhile, a second HPSII patient has been described who developed transient HLH [143],
but data on cytotoxicity were variable and no possible additional genetic lesions has been
presented.
The mouse model for HPSII is the pearl mouse that also carries a mutation in the β3A
subunit of the AP-3 complex and shows a diluted coat color (Fig. 5). Again, the mouse has
Introduction 25
mostly been studied in a cell biological context. Decreased CTL cytotoxicity has been shown,
but the mouse has not been analyzed in a disease model of HLH.
1.5.2 Diagnostic criteria
HLH is characterized by an uncontrolled activation of T cells and macrophages accompanied
by an excessive cytokine production, massive infiltration of tissues and hemophagocytosis.
Histological demonstration of hemophagocytosis is one of the cardinal clinical features of the
syndrome. Because the initial signs of the syndrome are unspecific and are difficult to
differentiate from those of infectious diseases, diagnostic criteria for HLH have been
proposed [80, 81, 144]. These include prolonged fever, cytopenia, hepatosplenomegaly,
elevated serum levels of ferritin and soluble IL2-receptor α chain (sCD25), elevated serum
levels of triglycerides or reduced levels of fibrinogen, histological demonstration of
hemophagocytosis and reduced or absent NK cell cytotoxicity. At least 5 of these 8 criteria
must be fulfilled in order to establish the clinical diagnosis. In some cases, central nervous
system lesions are observed [145] that can support the diagnosis. Moreover, elevated
transaminases, bilirubin and LDH [80] are frequently observed as a sign of liver damage.
Prolonged fever is a consequence of the massive cytokine production, especially the
interleukins (e.g. IL-1). The cytopenia is attributed to high levels of cytokines like IFN-γ and
TNF-α and partially to bone marrow infiltration by highly activated phagocytosing
macrophages. Hepatosplenomegaly is also due to infiltrating macrophages and lymphocytes.
Elevated levels of triglycerides result from increased levels of TNF-α leading to an increased
activity of the lipoprotein lipase. Ferritin is secreted by activated macrophages, whereas
activated T cells massively secrete the soluble IL2-receptor α chain (sCD25). In FHL, the
reduced or absent NK cell cytotoxicity is due to mutations affecting perforin or parts of the
lytic granule exocytosis machinery [81, 146].
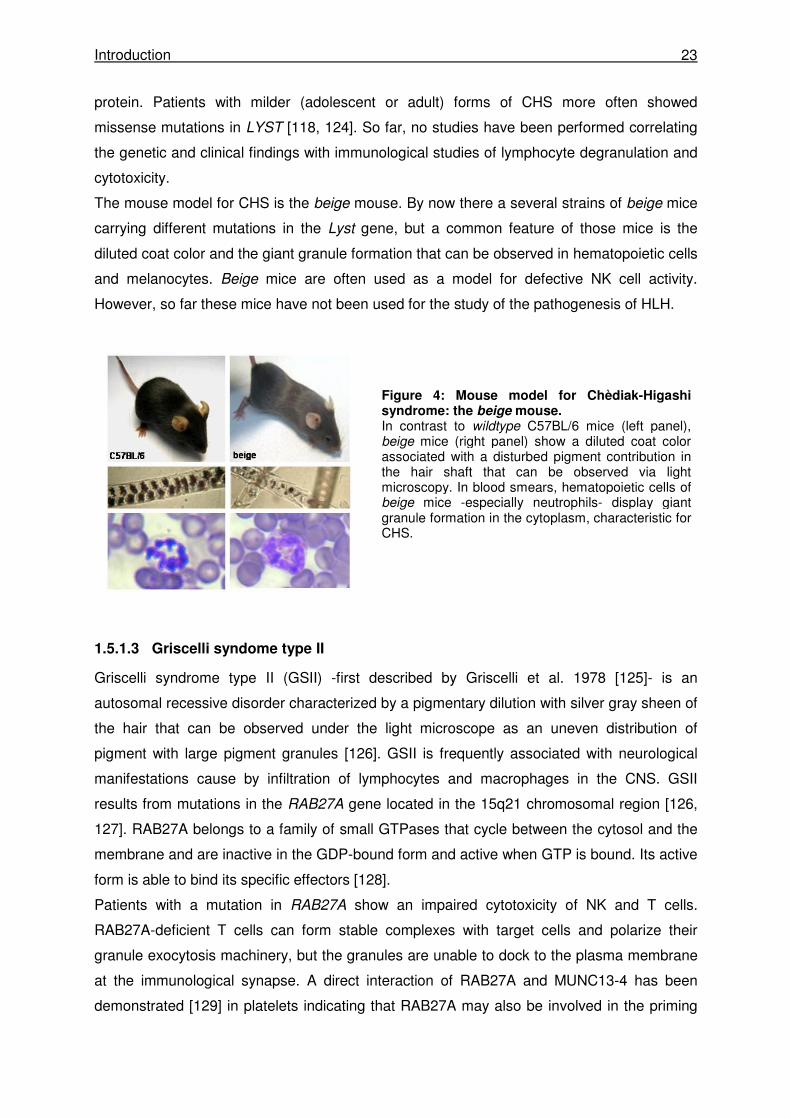
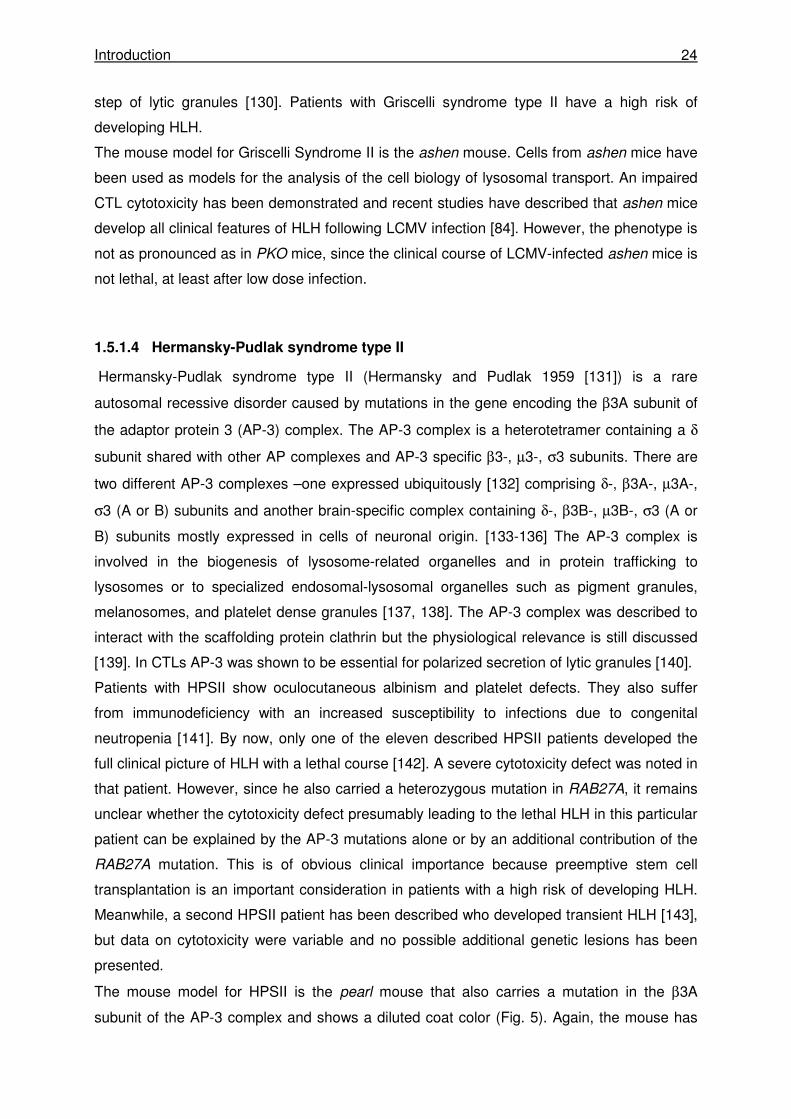
Figure 5: Mouse model of Hermansky-Pudlak Syndrome Type II: pearl mice. Compared to wildtype C57BL/6 mice (left panel), pearl mice (right panel) have a diluted coat color with pigment unevenly distributed in hair shafts that can be observed under the light microscope.
Introduction 26
1.5.3 Treatment
HLH is a life-threatening disease and requires intensive immunological treatment. If a
microbial trigger can be identified, antimicrobial therapy is crucial to remove the antigenic
trigger. However, in most cases immunosupression is required, usually as a combination of
dexamethasone, etoposide, and cyclosporin A or anti-thymocyte globulin. While this
treatment can induce stable remission in most secondary forms of the disease, it is not
enough to induce long-term remission in patients with genetic disease. In these cases,
allogenic hematopoietic stem cell transplantation (HSCT) is needed. [144, 147-150]
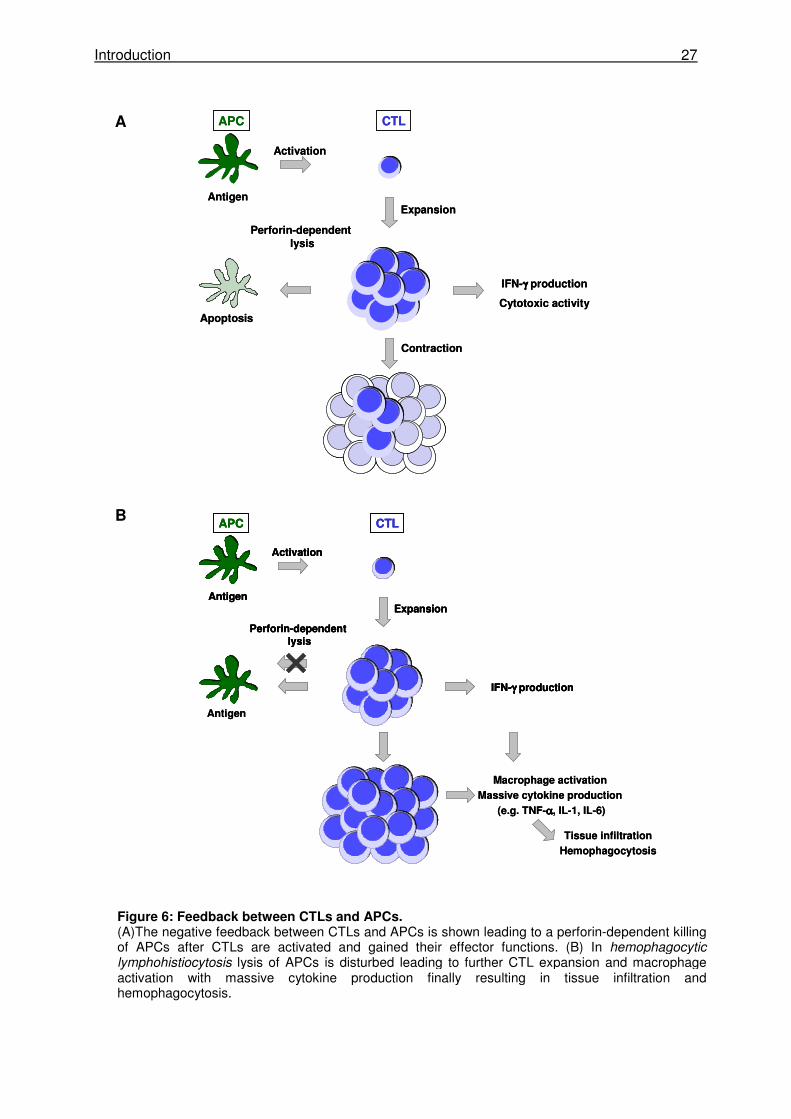
1.5.4 Open questions in disease pathogenesis
The current model of HLH pathogenesis is based on the concept that a defect in the negative
“feedback” provided by the killing of APCs by CTLs is the cause for the development of the
disease. It is postulated, that one major function of CTLs apart from the killing of virus-
infected target cells is the killing of APCs. This mechanism evolved to avoid overactivation of
CTLs by reducing the antigenic stimulus. If this negative feedback loop is reduced or absent,
CTLs are continuously stimulated and expand and produce massive amounts of IFN-γ and
other proinflammatory cytokines (Fig. 6). This ongoing cytokine release leads to continuous
macrophage activation leading to additional cytokine production. These highly activated
lymphocytes and macrophages infiltrate multiple organs tissues causing tissue damage. The
organ infiltration together with the overproduction of multiple cytokines, such as IFN-γ, TNF-
α, IL-1β, IL-6 and IL-18 [151-155], are likely responsible for symptoms observed in patients
with HLH.
Introduction 27
APC CTL
Activation
Perforin-dependentlysis
Expansion
IFN-γγγγ production
Antigen
Antigen
Macrophage activation
Massive cytokine production
(e.g. TNF-αααα, IL-1, IL-6)
Tissue infiltration
Hemophagocytosis
APC CTL
Activation
Perforin-dependentlysis
Expansion
IFN-γγγγ production
Antigen
APC CTL
Activation
Perforin-dependentlysis
Expansion
IFN-γγγγ production
Antigen
Antigen
Macrophage activation
Massive cytokine production
(e.g. TNF-αααα, IL-1, IL-6)
Tissue infiltration
Hemophagocytosis
APC CTL
Activation
Perforin-dependent lysis
Expansion
IFN-γγγγ production
Cytotoxic activity
Antigen
Apoptosis
Contraction
APC CTL
Activation
Perforin-dependent lysis
Expansion
IFN-γγγγ production
Cytotoxic activity
Antigen
Apoptosis
Contraction
B
A
Figure 6: Feedback between CTLs and APCs. (A)The negative feedback between CTLs and APCs is shown leading to a perforin-dependent killing of APCs after CTLs are activated and gained their effector functions. (B) In hemophagocytic lymphohistiocytosis lysis of APCs is disturbed leading to further CTL expansion and macrophage activation with massive cytokine production finally resulting in tissue infiltration and hemophagocytosis.
Introduction 28
Despite recent advances that have led to the elaboration of that concept, many questions
remain unanswered. It Is clear that genetic defects leading to defects in lymphocyte
cytotoxicity are causally linked to the disease. Furthermore, it is likely, that an antigenic
trigger is needed to kick off the pathogenetic sequence of events leading to HLH. This is
particularly well illustrated in mice with perforin deficiency which remain perfectly healthy
unless infected with LCMV. Once infected with LCMV, the mice can not control the virus and
develop the full picture of HLH. It is not clear at the moment, whether -once triggered-
ongoing disease follows an autonomous course or whether antigen (in particular viral)
persistence is needed for development of the lethal course of the disease. This also raises
the question, to which extent an alteration of viral parameters (infection doses, replicative
capacity) can influence disease susceptibility. Experiments with perforin-deficient mice have
shown that CTLs and not NK cells are the critical mediators of disease in the LCMV model.
However, whether this is also true for other microbial triggers of the disease is unknown.
Given the key role of CTLs, it is likely, that increased CTL responsiveness may also
contribute to a lower threshold for disease. However, this has not yet been addressed
experimentally.
Aims of the study 29
1.6 Aims of the study
This study addressed different aspects of CD8 T cell-mediated pathology. The first part of
this study used a model of respiratory virus infection, in which cytotoxic T cells are crucial
for virus elimination following infection, but also augment immunopathology. In the second
part of the study two different mouse models for hemophagocytic lymphohistiocytosis
were analyzed, in which disease is mediated by an uncontrolled CTL activation
accompanied by hypercytokinemia and overactivation of macrophages. The following
issues were investigated:
1. RSV-induced immunopathology is observed following infection of BALB/c mice but
not after infection of C57BL/6 mice. To evaluate the role of the MHC in this
pathology, MHC congenic C57BL/6 mice carrying the H-2d haplotype were
analyzed. Because CD8 T cells are known to be the main mediators of RSV-
induced disease, we particularly focused on different parameters of the CTL
response following RSV infection.
2. LCMV infection is eliminated within 10 days after infection and causes little
pathology in wild-type mice, while it causes chronic infection and severe CD8 T
cell-mediated immunopathology in mice with defects in perforin-dependent
cytotoxicity. We used two different mouse models of partially impaired cytotoxicity,
pearl mice (a model for Hermansky-Pudlak syndrome type II) and beige mice (a
model for Chèdiak-Higashi syndrome) to address the following questions:
2.1 Do pearl mice and beige mice develop HLH after LCMV infection?
2.2 How does the extent of the cytotoxicity defect correlate with susceptibility to HLH?
2.3 What is the impact of different virus doses on disease induction?
2.4 What is the impact of variations in the CTL precursor frequency on disease
induction?
2.5 How do genetic factors (different mutations) influence the susceptibility to HLH?
Material and Methods 30
2 Materials and Methods
2.1 Mice, Viruses and Materials
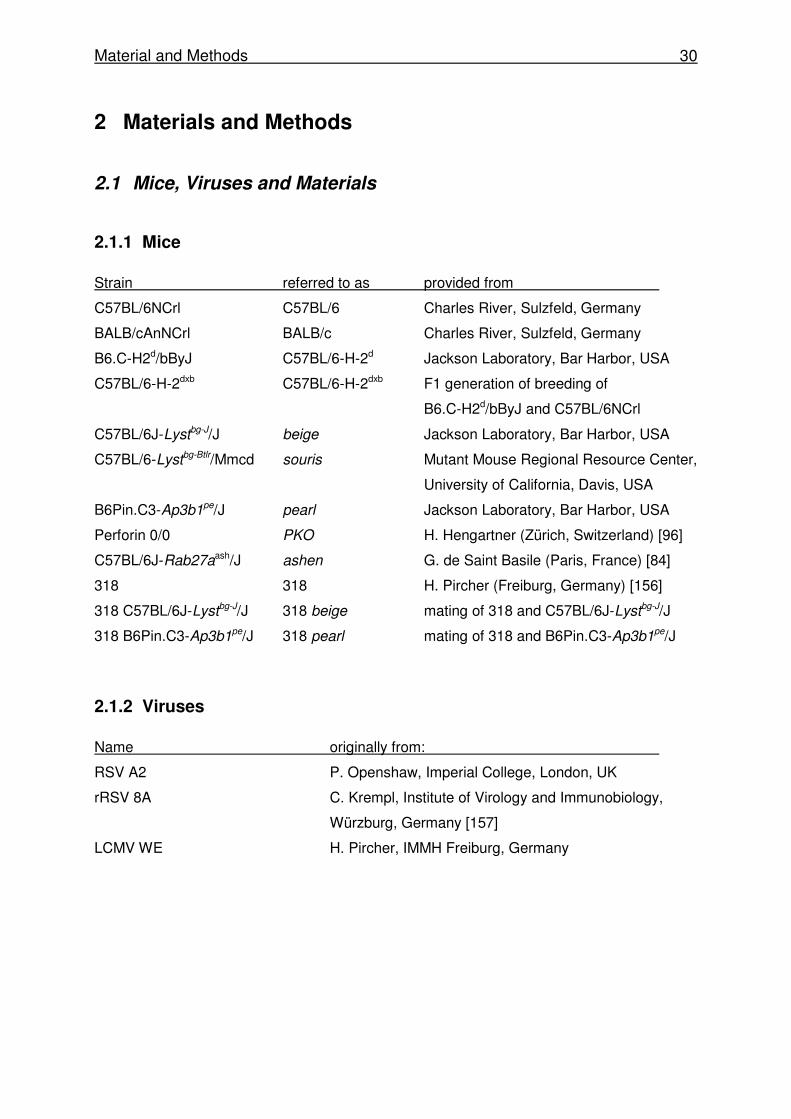
2.1.1 Mice
Strain referred to as provided from
C57BL/6NCrl C57BL/6 Charles River, Sulzfeld, Germany
BALB/cAnNCrl BALB/c Charles River, Sulzfeld, Germany
B6.C-H2d/bByJ C57BL/6-H-2d Jackson Laboratory, Bar Harbor, USA
C57BL/6-H-2dxb C57BL/6-H-2dxb F1 generation of breeding of
B6.C-H2d/bByJ and C57BL/6NCrl
C57BL/6J-Lystbg-J/J beige Jackson Laboratory, Bar Harbor, USA
C57BL/6-Lystbg-Btlr/Mmcd souris Mutant Mouse Regional Resource Center,
University of California, Davis, USA
B6Pin.C3-Ap3b1pe/J pearl Jackson Laboratory, Bar Harbor, USA
Perforin 0/0 PKO H. Hengartner (Zürich, Switzerland) [96]
C57BL/6J-Rab27aash/J ashen G. de Saint Basile (Paris, France) [84]
318 318 H. Pircher (Freiburg, Germany) [156]
318 C57BL/6J-Lystbg-J/J 318 beige mating of 318 and C57BL/6J-Lystbg-J/J
318 B6Pin.C3-Ap3b1pe/J 318 pearl mating of 318 and B6Pin.C3-Ap3b1pe/J
2.1.2 Viruses
Name originally from:
RSV A2 P. Openshaw, Imperial College, London, UK
rRSV 8A C. Krempl, Institute of Virology and Immunobiology,
Würzburg, Germany [157]
LCMV WE H. Pircher, IMMH Freiburg, Germany
Material and Methods 31
2.1.3 Cells
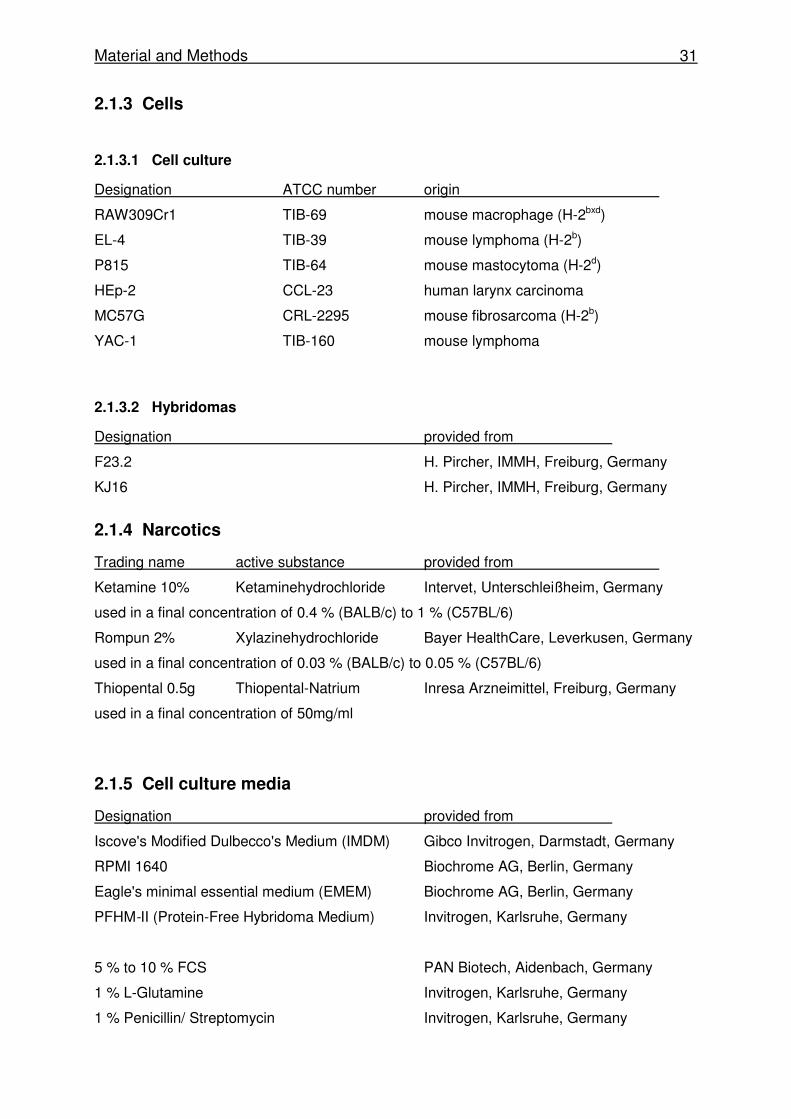
2.1.3.1 Cell culture
Designation ATCC number origin
RAW309Cr1 TIB-69 mouse macrophage (H-2bxd)
EL-4 TIB-39 mouse lymphoma (H-2b)
P815 TIB-64 mouse mastocytoma (H-2d)
HEp-2 CCL-23 human larynx carcinoma
MC57G CRL-2295 mouse fibrosarcoma (H-2b)
YAC-1 TIB-160 mouse lymphoma
2.1.3.2 Hybridomas
Designation provided from
F23.2 H. Pircher, IMMH, Freiburg, Germany
KJ16 H. Pircher, IMMH, Freiburg, Germany
2.1.4 Narcotics
Trading name active substance provided from
Ketamine 10% Ketaminehydrochloride Intervet, Unterschleißheim, Germany
used in a final concentration of 0.4 % (BALB/c) to 1 % (C57BL/6)
Rompun 2% Xylazinehydrochloride Bayer HealthCare, Leverkusen, Germany
used in a final concentration of 0.03 % (BALB/c) to 0.05 % (C57BL/6)
Thiopental 0.5g Thiopental-Natrium Inresa Arzneimittel, Freiburg, Germany
used in a final concentration of 50mg/ml
2.1.5 Cell culture media
Designation provided from
Iscove's Modified Dulbecco's Medium (IMDM) Gibco Invitrogen, Darmstadt, Germany
RPMI 1640 Biochrome AG, Berlin, Germany
Eagle's minimal essential medium (EMEM) Biochrome AG, Berlin, Germany
PFHM-II (Protein-Free Hybridoma Medium) Invitrogen, Karlsruhe, Germany
5 % to 10 % FCS PAN Biotech, Aidenbach, Germany
1 % L-Glutamine Invitrogen, Karlsruhe, Germany
1 % Penicillin/ Streptomycin Invitrogen, Karlsruhe, Germany
Material and Methods 32
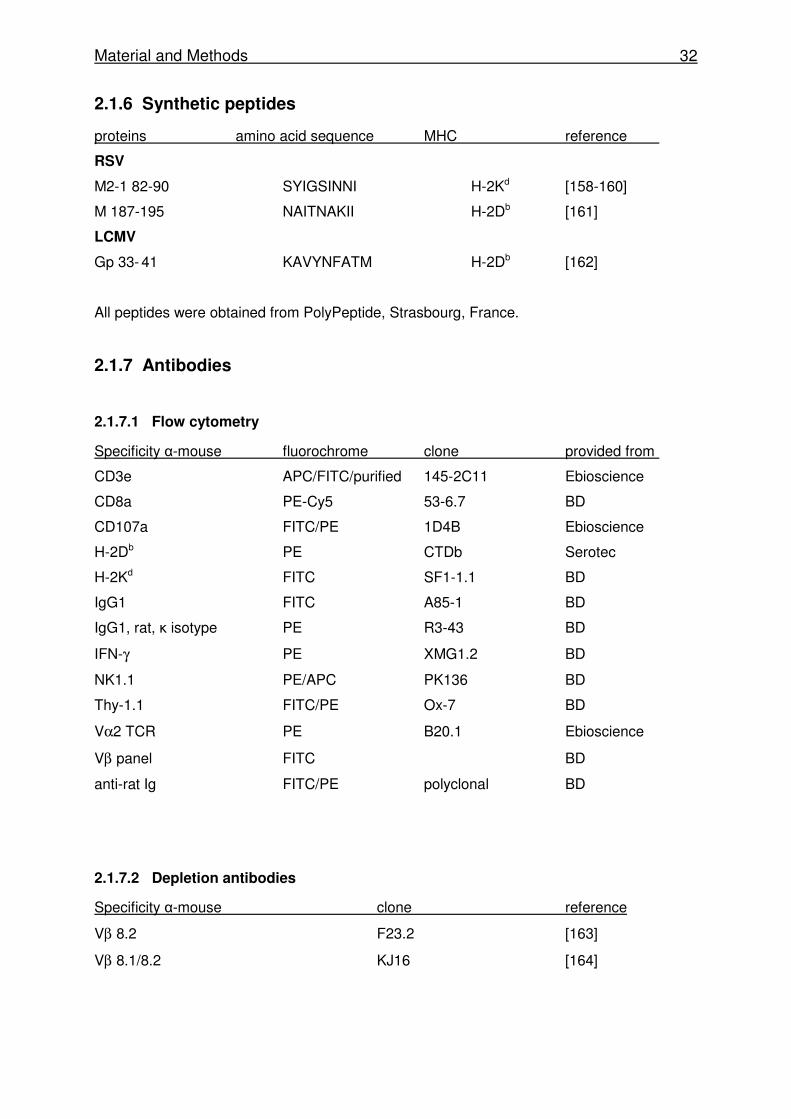
2.1.6 Synthetic peptides
proteins amino acid sequence MHC reference
RSV
M2-1 82-90 SYIGSINNI H-2Kd [158-160]
M 187-195 NAITNAKII H-2Db [161]
LCMV
Gp 33- 41 KAVYNFATM H-2Db [162]
All peptides were obtained from PolyPeptide, Strasbourg, France.
2.1.7 Antibodies
2.1.7.1 Flow cytometry
Specificity α-mouse fluorochrome clone provided from
CD3e APC/FITC/purified 145-2C11 Ebioscience
CD8a PE-Cy5 53-6.7 BD
CD107a FITC/PE 1D4B Ebioscience
H-2Db PE CTDb Serotec
H-2Kd FITC SF1-1.1 BD
IgG1 FITC A85-1 BD
IgG1, rat, κ isotype PE R3-43 BD
IFN-γ PE XMG1.2 BD
NK1.1 PE/APC PK136 BD
Thy-1.1 FITC/PE Ox-7 BD
Vα2 TCR PE B20.1 Ebioscience
Vβ panel FITC BD
anti-rat Ig FITC/PE polyclonal BD
2.1.7.2 Depletion antibodies
Specificity α-mouse clone reference
Vβ 8.2 F23.2 [163]
Vβ 8.1/8.2 KJ16 [164]
Material and Methods 33
2.1.7.3 Antibodies for virus detection
Specificity provided from
goat-anti RSV Biotin AbD Serotec, Düsseldorf, Germany
rat anti-LCMV-NP monoclonal Ab (VL-4) H. Pircher, IMMH, Freiburg, Germany
Peroxidase-conjugated goat anti-rat IgG Dianova, Hamburg, Germany
2.1.7.4 IFN-γγγγ ELISA
Specificity provided from
purified rat α-mouse IFN-γ BD Pharmingen, Heidelberg, Germany
biotinylated rat α-mouse IFN-γ BD Pharmingen, Heidelberg, Germany
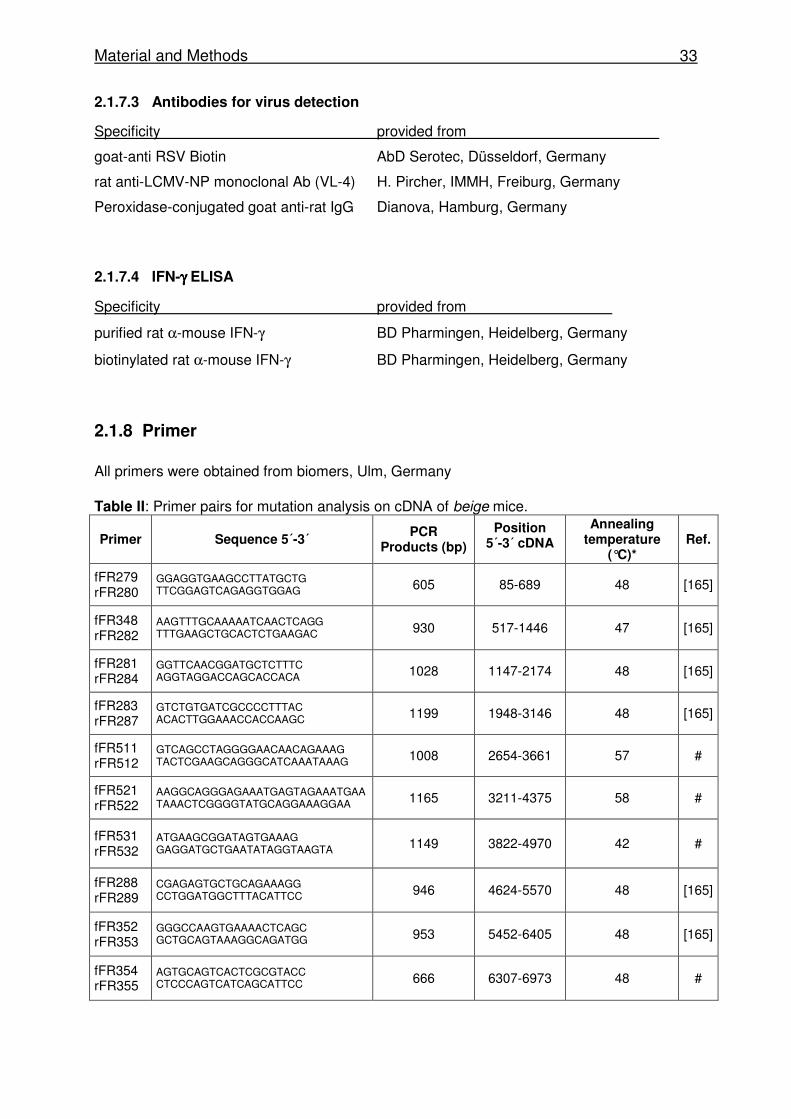
2.1.8 Primer
All primers were obtained from biomers, Ulm, Germany Table II: Primer pairs for mutation analysis on cDNA of beige mice.
Primer Sequence 5´-3´ PCR
Products (bp)
Position 5´-3´ cDNA
Annealing temperature
(°C)* Ref.
fFR279 rFR280
GGAGGTGAAGCCTTATGCTG TTCGGAGTCAGAGGTGGAG 605 85-689 48 [165]
fFR348 rFR282
AAGTTTGCAAAAATCAACTCAGG TTTGAAGCTGCACTCTGAAGAC 930 517-1446 47 [165]
fFR281 rFR284
GGTTCAACGGATGCTCTTTC AGGTAGGACCAGCACCACA 1028 1147-2174 48 [165]
fFR283 rFR287
GTCTGTGATCGCCCCTTTAC ACACTTGGAAACCACCAAGC 1199 1948-3146 48 [165]
fFR511 rFR512
GTCAGCCTAGGGGAACAACAGAAAG TACTCGAAGCAGGGCATCAAATAAAG 1008 2654-3661 57 #
fFR521 rFR522
AAGGCAGGGAGAAATGAGTAGAAATGAA TAAACTCGGGGTATGCAGGAAAGGAA 1165 3211-4375 58 #
fFR531 rFR532
ATGAAGCGGATAGTGAAAG GAGGATGCTGAATATAGGTAAGTA 1149 3822-4970 42 #
fFR288 rFR289
CGAGAGTGCTGCAGAAAGG CCTGGATGGCTTTACATTCC 946 4624-5570 48 [165]
fFR352 rFR353
GGGCCAAGTGAAAACTCAGC GCTGCAGTAAAGGCAGATGG 953 5452-6405 48 [165]
fFR354 rFR355
AGTGCAGTCACTCGCGTACC CTCCCAGTCATCAGCATTCC 666 6307-6973 48 #
Material and Methods 34
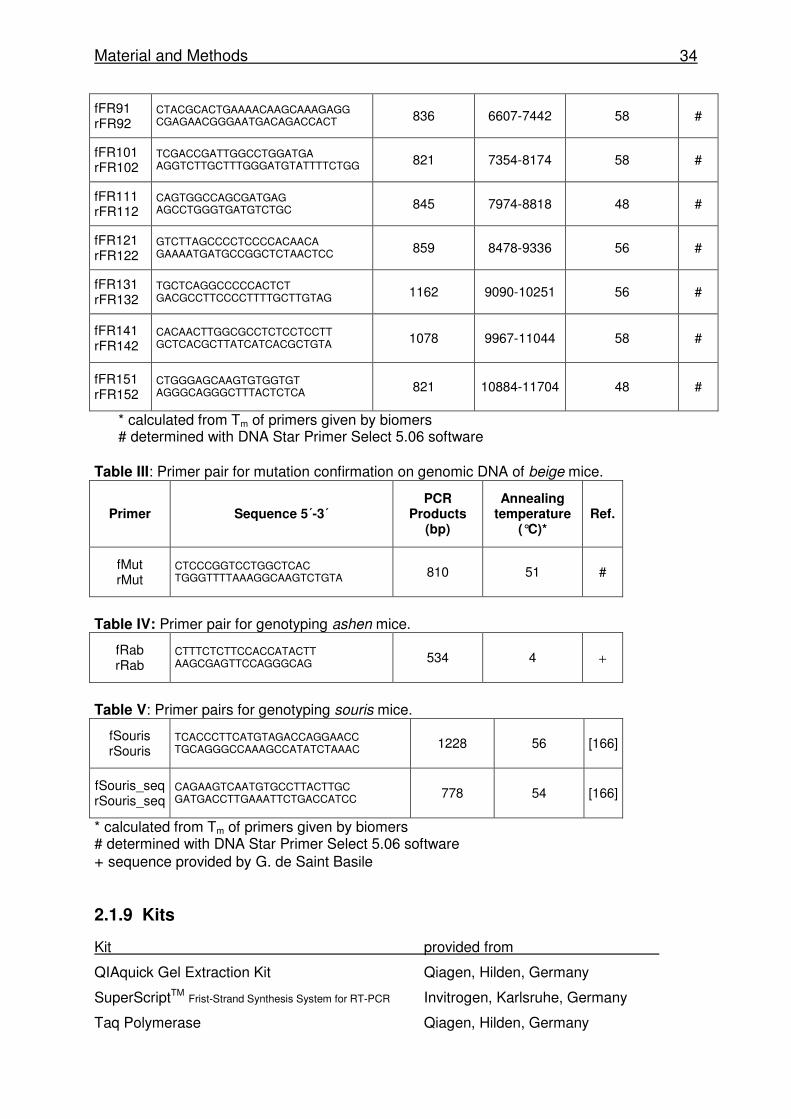
fFR91 rFR92
CTACGCACTGAAAACAAGCAAAGAGG CGAGAACGGGAATGACAGACCACT 836 6607-7442 58 #
fFR101 rFR102
TCGACCGATTGGCCTGGATGA AGGTCTTGCTTTGGGATGTATTTTCTGG 821 7354-8174 58 #
fFR111 rFR112
CAGTGGCCAGCGATGAG AGCCTGGGTGATGTCTGC 845 7974-8818 48 #
fFR121 rFR122
GTCTTAGCCCCTCCCCACAACA GAAAATGATGCCGGCTCTAACTCC 859 8478-9336 56 #
fFR131 rFR132
TGCTCAGGCCCCCACTCT GACGCCTTCCCCTTTTGCTTGTAG 1162 9090-10251 56 #
fFR141 rFR142
CACAACTTGGCGCCTCTCCTCCTT GCTCACGCTTATCATCACGCTGTA 1078 9967-11044 58 #
fFR151 rFR152
CTGGGAGCAAGTGTGGTGT AGGGCAGGGCTTTACTCTCA 821 10884-11704 48 #
* calculated from Tm of primers given by biomers # determined with DNA Star Primer Select 5.06 software
Table III: Primer pair for mutation confirmation on genomic DNA of beige mice.
Table IV: Primer pair for genotyping ashen mice.
fRab rRab
CTTTCTCTTCCACCATACTT AAGCGAGTTCCAGGGCAG 534 4 +
Table V: Primer pairs for genotyping souris mice.
fSouris rSouris
TCACCCTTCATGTAGACCAGGAACC TGCAGGGCCAAAGCCATATCTAAAC 1228 56 [166]
fSouris_seq rSouris_seq
CAGAAGTCAATGTGCCTTACTTGC GATGACCTTGAAATTCTGACCATCC 778 54 [166]
* calculated from Tm of primers given by biomers # determined with DNA Star Primer Select 5.06 software + sequence provided by G. de Saint Basile
2.1.9 Kits
Kit provided from
QIAquick Gel Extraction Kit Qiagen, Hilden, Germany
SuperScriptTM Frist-Strand Synthesis System for RT-PCR Invitrogen, Karlsruhe, Germany
Taq Polymerase Qiagen, Hilden, Germany
Primer Sequence 5´-3´ PCR
Products (bp)
Annealing temperature
(°C)* Ref.
fMut rMut
CTCCCGGTCCTGGCTCAC TGGGTTTTAAAGGCAAGTCTGTA 810 51 #
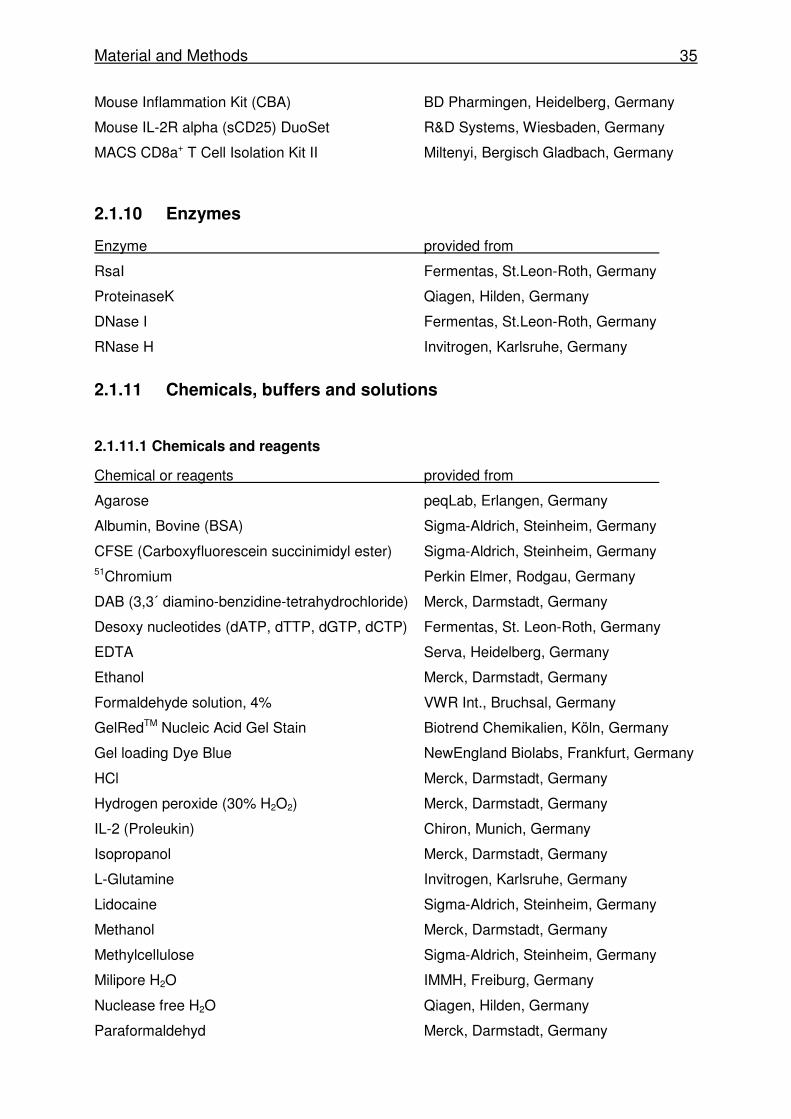
Material and Methods 35
Mouse Inflammation Kit (CBA) BD Pharmingen, Heidelberg, Germany
Mouse IL-2R alpha (sCD25) DuoSet R&D Systems, Wiesbaden, Germany
MACS CD8a+ T Cell Isolation Kit II Miltenyi, Bergisch Gladbach, Germany
2.1.10 Enzymes
Enzyme provided from
RsaI Fermentas, St.Leon-Roth, Germany
ProteinaseK Qiagen, Hilden, Germany
DNase I Fermentas, St.Leon-Roth, Germany
RNase H Invitrogen, Karlsruhe, Germany
2.1.11 Chemicals, buffers and solutions
2.1.11.1 Chemicals and reagents
Chemical or reagents provided from
Agarose peqLab, Erlangen, Germany
Albumin, Bovine (BSA) Sigma-Aldrich, Steinheim, Germany
CFSE (Carboxyfluorescein succinimidyl ester) Sigma-Aldrich, Steinheim, Germany 51Chromium Perkin Elmer, Rodgau, Germany
DAB (3,3´ diamino-benzidine-tetrahydrochloride) Merck, Darmstadt, Germany
Desoxy nucleotides (dATP, dTTP, dGTP, dCTP) Fermentas, St. Leon-Roth, Germany
EDTA Serva, Heidelberg, Germany
Ethanol Merck, Darmstadt, Germany
Formaldehyde solution, 4% VWR Int., Bruchsal, Germany
GelRedTM Nucleic Acid Gel Stain Biotrend Chemikalien, Köln, Germany
Gel loading Dye Blue NewEngland Biolabs, Frankfurt, Germany
HCl Merck, Darmstadt, Germany
Hydrogen peroxide (30% H2O2) Merck, Darmstadt, Germany
IL-2 (Proleukin) Chiron, Munich, Germany
Isopropanol Merck, Darmstadt, Germany
L-Glutamine Invitrogen, Karlsruhe, Germany
Lidocaine Sigma-Aldrich, Steinheim, Germany
Methanol Merck, Darmstadt, Germany
Methylcellulose Sigma-Aldrich, Steinheim, Germany
Milipore H2O IMMH, Freiburg, Germany
Nuclease free H2O Qiagen, Hilden, Germany
Paraformaldehyd Merck, Darmstadt, Germany
Material and Methods 36
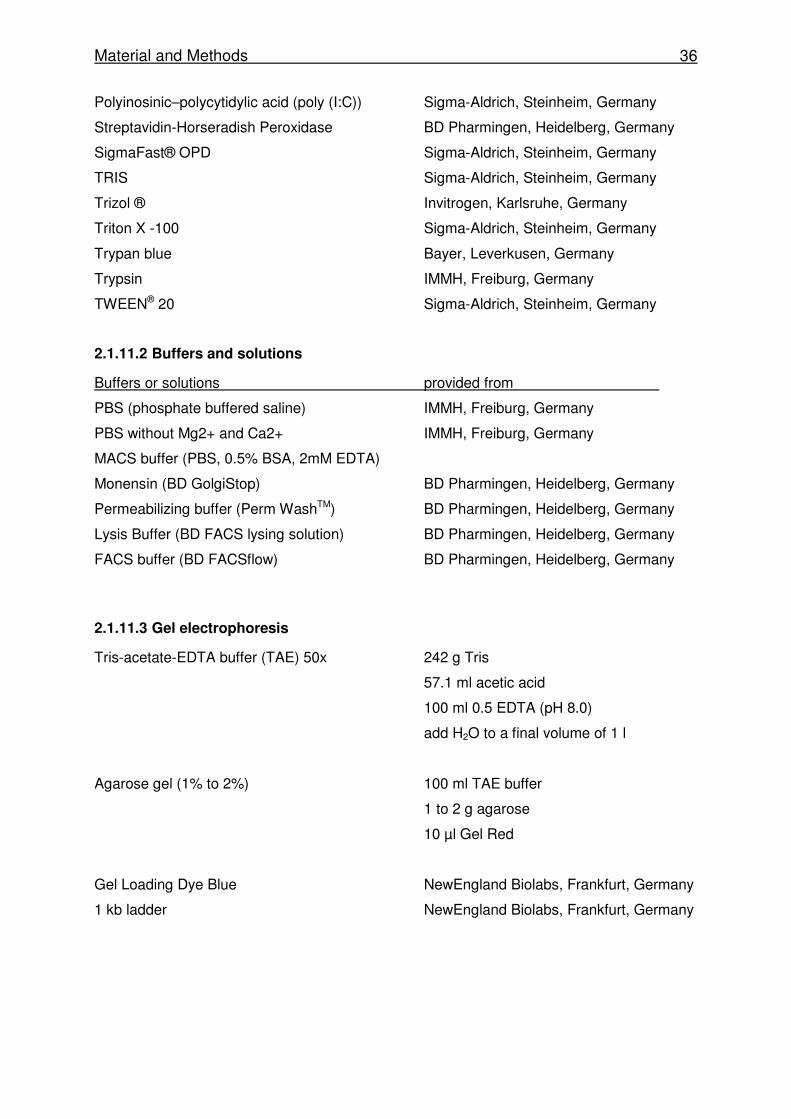
Polyinosinic–polycytidylic acid (poly (I:C)) Sigma-Aldrich, Steinheim, Germany
Streptavidin-Horseradish Peroxidase BD Pharmingen, Heidelberg, Germany
SigmaFast® OPD Sigma-Aldrich, Steinheim, Germany
TRIS Sigma-Aldrich, Steinheim, Germany
Trizol ® Invitrogen, Karlsruhe, Germany
Triton X -100 Sigma-Aldrich, Steinheim, Germany
Trypan blue Bayer, Leverkusen, Germany
Trypsin IMMH, Freiburg, Germany
TWEEN® 20 Sigma-Aldrich, Steinheim, Germany
2.1.11.2 Buffers and solutions
Buffers or solutions provided from
PBS (phosphate buffered saline) IMMH, Freiburg, Germany
PBS without Mg2+ and Ca2+ IMMH, Freiburg, Germany
MACS buffer (PBS, 0.5% BSA, 2mM EDTA)
Monensin (BD GolgiStop) BD Pharmingen, Heidelberg, Germany
Permeabilizing buffer (Perm WashTM) BD Pharmingen, Heidelberg, Germany
Lysis Buffer (BD FACS lysing solution) BD Pharmingen, Heidelberg, Germany
FACS buffer (BD FACSflow) BD Pharmingen, Heidelberg, Germany
2.1.11.3 Gel electrophoresis
Tris-acetate-EDTA buffer (TAE) 50x 242 g Tris
57.1 ml acetic acid
100 ml 0.5 EDTA (pH 8.0)
add H2O to a final volume of 1 l
Agarose gel (1% to 2%) 100 ml TAE buffer
1 to 2 g agarose
10 µl Gel Red
Gel Loading Dye Blue NewEngland Biolabs, Frankfurt, Germany
1 kb ladder NewEngland Biolabs, Frankfurt, Germany
Material and Methods 37
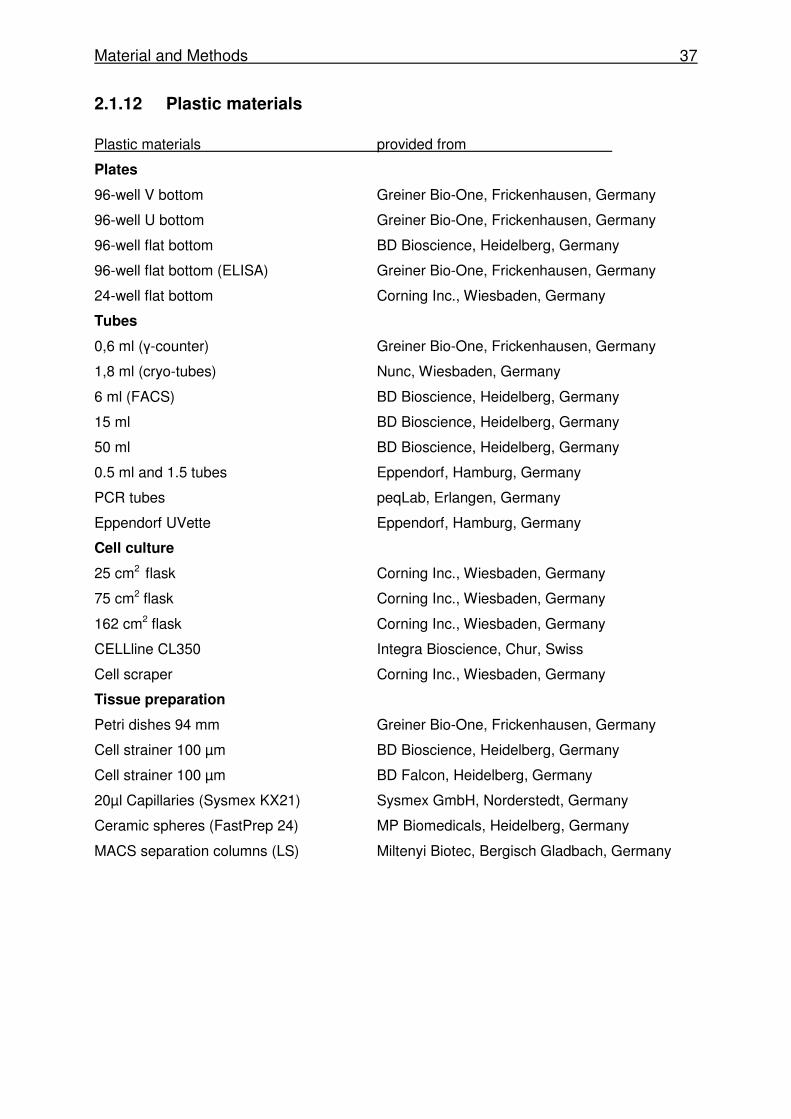
2.1.12 Plastic materials
Plastic materials provided from
Plates
96-well V bottom Greiner Bio-One, Frickenhausen, Germany
96-well U bottom Greiner Bio-One, Frickenhausen, Germany
96-well flat bottom BD Bioscience, Heidelberg, Germany
96-well flat bottom (ELISA) Greiner Bio-One, Frickenhausen, Germany
24-well flat bottom Corning Inc., Wiesbaden, Germany
Tubes
0,6 ml (γ-counter) Greiner Bio-One, Frickenhausen, Germany
1,8 ml (cryo-tubes) Nunc, Wiesbaden, Germany
6 ml (FACS) BD Bioscience, Heidelberg, Germany
15 ml BD Bioscience, Heidelberg, Germany
50 ml BD Bioscience, Heidelberg, Germany
0.5 ml and 1.5 tubes Eppendorf, Hamburg, Germany
PCR tubes peqLab, Erlangen, Germany
Eppendorf UVette Eppendorf, Hamburg, Germany
Cell culture
25 cm2 flask Corning Inc., Wiesbaden, Germany
75 cm2 flask Corning Inc., Wiesbaden, Germany
162 cm2 flask Corning Inc., Wiesbaden, Germany
CELLline CL350 Integra Bioscience, Chur, Swiss
Cell scraper Corning Inc., Wiesbaden, Germany
Tissue preparation
Petri dishes 94 mm Greiner Bio-One, Frickenhausen, Germany
Cell strainer 100 µm BD Bioscience, Heidelberg, Germany
Cell strainer 100 µm BD Falcon, Heidelberg, Germany
20µl Capillaries (Sysmex KX21) Sysmex GmbH, Norderstedt, Germany
Ceramic spheres (FastPrep 24) MP Biomedicals, Heidelberg, Germany
MACS separation columns (LS) Miltenyi Biotec, Bergisch Gladbach, Germany
Material and Methods 38
2.1.13 Instruments
Instruments provided from
CO2 incubator Hereaus Instruments, Hanau, Germany
Cobra II auto-gamma Perkin Elmer, Waltham, USA
Eppendorf Centrifuge 5417R Eppendorf, Hamburg, Germany
Eppendorf BioPhotometer Eppendorf, Hamburg, Germany
FACSsort BD Bioscience, Heidelberg, Germany
FastPrep 24 MP Biomedicals, Heidelberg, Germany
LaminAIR HB2448 Hereaus Instruments, Hanau, Germany
Microflow® Biological Safety Cabinets Bioquell, Andover, UK
Mastercycler ep gradient S Eppendorf, Hamburg, Germany
Multifuge 1S-R Hereaus, Hanau, Germany
Microscope Carl Zeiss, Jena, Germany
Roche Modular Analytics Evo Roche Diagnostics, Mannheim, Germany
Sysmex KX21 Sysmex GmbH, Norderstedt, Germany
Titertek Mulatiskan MCC/340 Berthold Detection System, Pforzheim, Germany
ThermoScan IRT 4520 Braun, Kronberg, Germany
Venti-rack BioZone, Kent, UK
Material and Methods 39
2.2 Methods
2.2.1 Viruses
The Lymphocytic choriomeningitis virus WE (LCMV WE) was kindly provided by Hanspeter
Pircher (IMMH Freiburg, Germany) and stored at -80°C until use.
Human RSV A2 strain was kindly provided by P. Openshaw (Imperial College, London, UK),
grown on HEp-2 cells and stored at -80°C until use. The recombinant RSV - rRSV 8A - with a
single amino acid exchange (Asn� Ala) at position 8 of the immunodominant epitope M2-1
82-90 was generated and kindly provided by Christine Krempl (Institute of Virology and
Immunobiology, Würzburg, Germany, [157]).
2.2.2 Hybridoma
F23.2 and KJ16 cells were cultivated in IMDM supplemented with 10% FCS and 1%
Penicillin/Streptomycin and 1% Glutamine. To adapt the cells to the serum-free and protein-
free Hybridoma medium (PFHM II), the direct adaptation protocol was used according to the
manufacturer’s protocol. Cells were directly transferred into PFHM II and cell growth was
monitored until a cell density of 1x10⁶/ml was reached. 1-2x10⁵/ml cells were subcultured in
fresh serum free medium for 5 passages. After this, the CELLline CL 350 bioreactor was
used to cultivate cells and gain high protein expression levels in the supernatant. 8x10⁶ cells
were inoculated into the cell compartment and cultivated with 350ml medium in the medium
compartment. While monitoring the culture every 3 days, cells were harvested once every
week, splitted 1:5 back into the culture flask and supernatant was stored at -20°C. Protein
concentration in the supernatant was determined with the Bio-Rad Protein Assay based on
the method of Bradford, which uses a differential color change after adding an acidic dye to
the protein solution. Absorbance was measured at 595 nm using the eppendorf
BioPhotometer.
2.2.3 Mice
C57BL/6 and BALB/c mice were purchased from Charles River Laboratories (Sulzfeld,
Germany) and the MHC congenic mouse strain B6.C-H2d/bByJ (C57BL/6-H-2d) from Jackson
Laboratory (Bar Harbor, USA). C57BL/6-H-2dxb mice were obtained by mating C57BL/6 mice
(H-2b) with C57BL/6-H-2d mice. Mice were kept in an individual ventilated cage (IVC) unit
(BioZone, Kent, UK) and infected intranasally with RSV at the age of 6-12 weeks.
Peforin deficient (PKO) and 318 mice were kindly provided by H. Pircher (IMMH, Freiburg,
Germany). Beige and pearl mice were purchased from Jackson Laboratory (Ben Harbor,
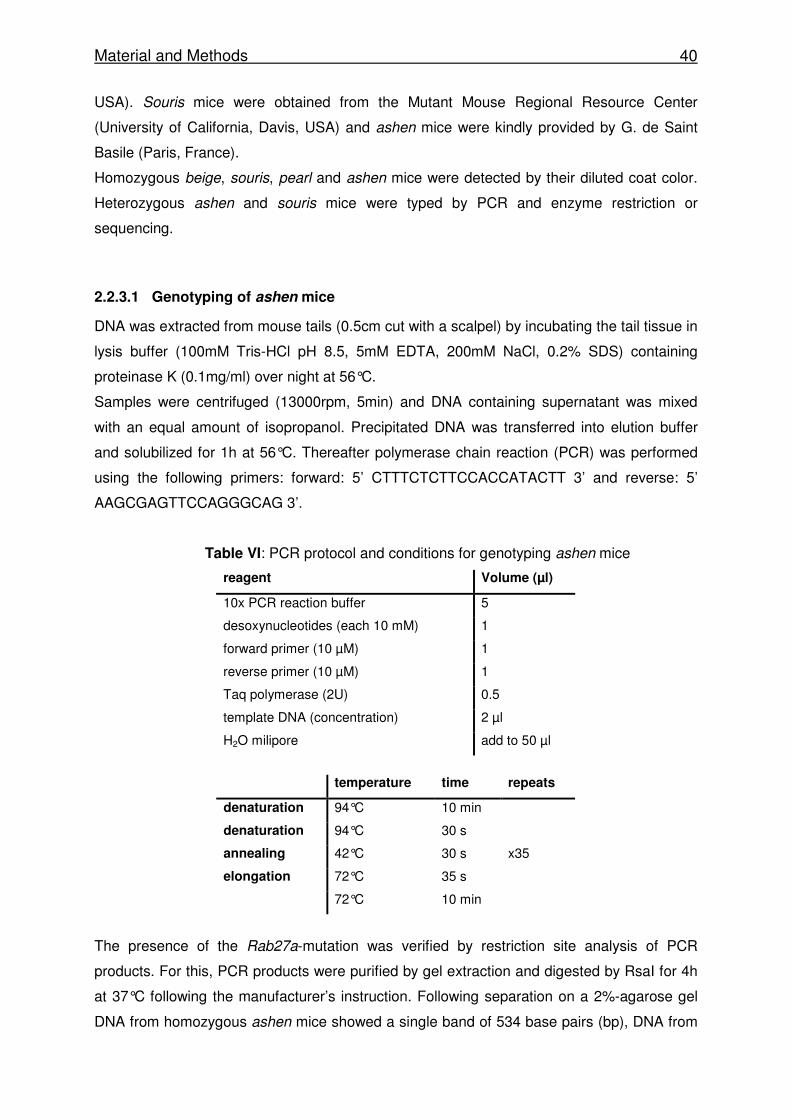
Material and Methods 40
USA). Souris mice were obtained from the Mutant Mouse Regional Resource Center
(University of California, Davis, USA) and ashen mice were kindly provided by G. de Saint
Basile (Paris, France).
Homozygous beige, souris, pearl and ashen mice were detected by their diluted coat color.
Heterozygous ashen and souris mice were typed by PCR and enzyme restriction or
sequencing.
2.2.3.1 Genotyping of ashen mice
DNA was extracted from mouse tails (0.5cm cut with a scalpel) by incubating the tail tissue in
lysis buffer (100mM Tris-HCl pH 8.5, 5mM EDTA, 200mM NaCl, 0.2% SDS) containing
proteinase K (0.1mg/ml) over night at 56°C.
Samples were centrifuged (13000rpm, 5min) and DNA containing supernatant was mixed
with an equal amount of isopropanol. Precipitated DNA was transferred into elution buffer
and solubilized for 1h at 56°C. Thereafter polymerase chain reaction (PCR) was performed
using the following primers: forward: 5’ CTTTCTCTTCCACCATACTT 3’ and reverse: 5’
AAGCGAGTTCCAGGGCAG 3’.
Table VI: PCR protocol and conditions for genotyping ashen mice
reagent Volume (µl)
10x PCR reaction buffer 5
desoxynucleotides (each 10 mM) 1
forward primer (10 µM) 1
reverse primer (10 µM) 1
Taq polymerase (2U) 0.5
template DNA (concentration) 2 µl
H2O milipore add to 50 µl
The presence of the Rab27a-mutation was verified by restriction site analysis of PCR
products. For this, PCR products were purified by gel extraction and digested by RsaI for 4h
at 37°C following the manufacturer’s instruction. Following separation on a 2%-agarose gel
DNA from homozygous ashen mice showed a single band of 534 base pairs (bp), DNA from
temperature time repeats
denaturation 94°C 10 min
denaturation 94°C 30 s
annealing 42°C 30 s x35
elongation 72°C 35 s
72°C 10 min
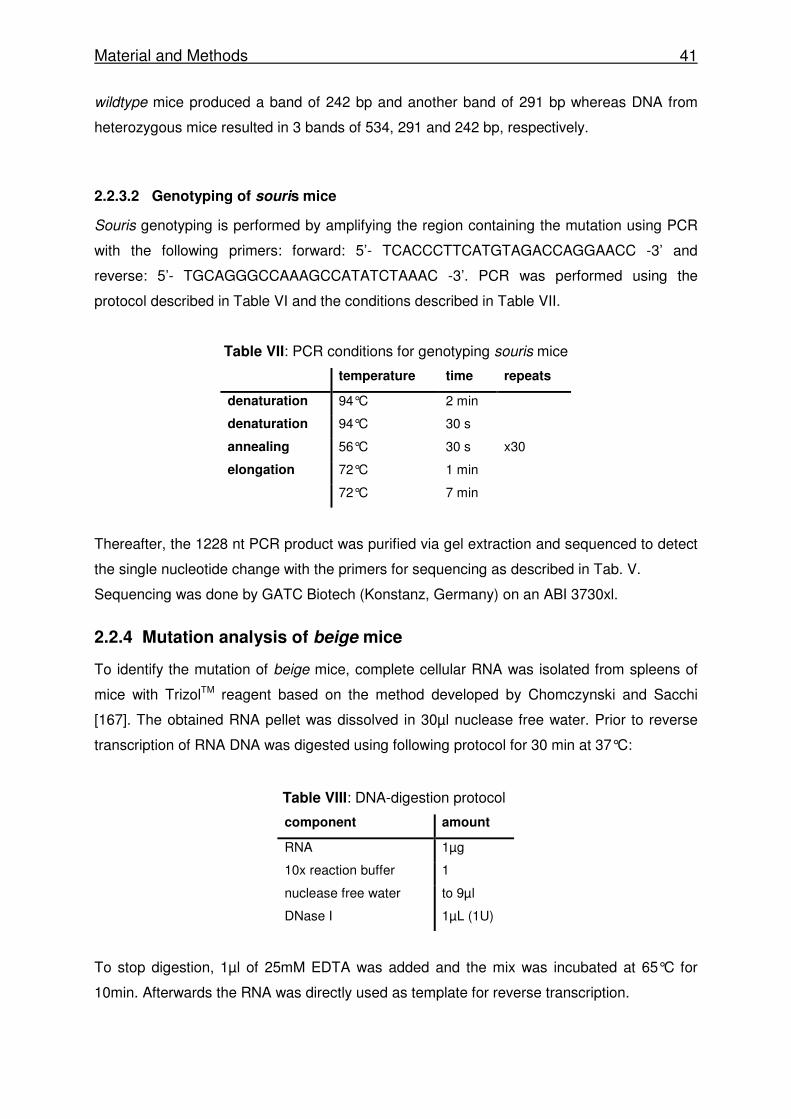
Material and Methods 41
wildtype mice produced a band of 242 bp and another band of 291 bp whereas DNA from
heterozygous mice resulted in 3 bands of 534, 291 and 242 bp, respectively.
2.2.3.2 Genotyping of souris mice
Souris genotyping is performed by amplifying the region containing the mutation using PCR
with the following primers: forward: 5’- TCACCCTTCATGTAGACCAGGAACC -3’ and
reverse: 5’- TGCAGGGCCAAAGCCATATCTAAAC -3’. PCR was performed using the
protocol described in Table VI and the conditions described in Table VII.
Table VII: PCR conditions for genotyping souris mice
temperature time repeats
denaturation 94°C 2 min
denaturation 94°C 30 s
annealing 56°C 30 s x30
elongation 72°C 1 min
72°C 7 min
Thereafter, the 1228 nt PCR product was purified via gel extraction and sequenced to detect
the single nucleotide change with the primers for sequencing as described in Tab. V.
Sequencing was done by GATC Biotech (Konstanz, Germany) on an ABI 3730xl.
2.2.4 Mutation analysis of beige mice
To identify the mutation of beige mice, complete cellular RNA was isolated from spleens of
mice with TrizolTM reagent based on the method developed by Chomczynski and Sacchi
[167]. The obtained RNA pellet was dissolved in 30µl nuclease free water. Prior to reverse
transcription of RNA DNA was digested using following protocol for 30 min at 37°C:
Table VIII: DNA-digestion protocol
component amount
RNA 1µg
10x reaction buffer 1
nuclease free water to 9µl
DNase I 1µL (1U)
To stop digestion, 1µl of 25mM EDTA was added and the mix was incubated at 65°C for
10min. Afterwards the RNA was directly used as template for reverse transcription.
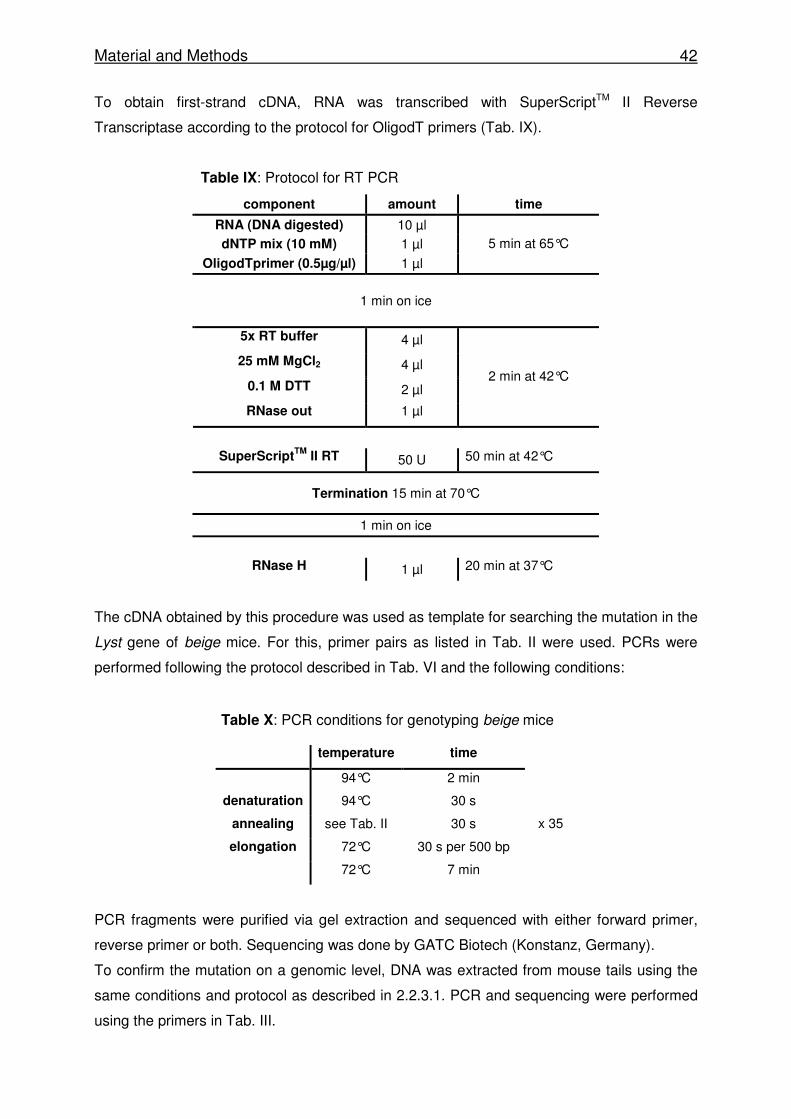
Material and Methods 42
To obtain first-strand cDNA, RNA was transcribed with SuperScriptTM II Reverse
Transcriptase according to the protocol for OligodT primers (Tab. IX).
Table IX: Protocol for RT PCR
component amount time
RNA (DNA digested) 10 µl
dNTP mix (10 mM) 1 µl
OligodTprimer (0.5µg/µl) 1 µl
5 min at 65°C
1 min on ice
5x RT buffer 4 µl
25 mM MgCl2 4 µl
0.1 M DTT 2 µl
RNase out 1 µl
2 min at 42°C
SuperScriptTM
II RT 50 U 50 min at 42°C
Termination 15 min at 70°C
1 min on ice
RNase H 1 µl 20 min at 37°C
The cDNA obtained by this procedure was used as template for searching the mutation in the
Lyst gene of beige mice. For this, primer pairs as listed in Tab. II were used. PCRs were
performed following the protocol described in Tab. VI and the following conditions:
Table X: PCR conditions for genotyping beige mice
PCR fragments were purified via gel extraction and sequenced with either forward primer,
reverse primer or both. Sequencing was done by GATC Biotech (Konstanz, Germany).
To confirm the mutation on a genomic level, DNA was extracted from mouse tails using the
same conditions and protocol as described in 2.2.3.1. PCR and sequencing were performed
using the primers in Tab. III.
temperature time
94°C 2 min
denaturation 94°C 30 s
annealing see Tab. II 30 s
elongation 72°C 30 s per 500 bp
x 35
72°C 7 min
Material and Methods 43
2.2.5 Treatment of mice
2.2.5.1 Virus infection
For infection with LCMV WE, mice were injected intravenously (i.v.) with either 200 pfu (low
dose), 1x10⁴ or with 2 x 10⁴ pfu (intermediate dose).
For infection with RSV A2 or the recombinant RSV 8A, mice were anesthetized
intraperitoneally (i.p.) with ketamin and rompun and inoculated with 1-2x10⁶ pfu intranasally
(i.n.).
2.2.5.2 Poly (I:C) treatment
To activated NK cells without virus infection, mice were injected i.p. with 100-200µg of
poly(I:C) 24 hrs prior to the experiment.
2.2.5.3 Depletion of T cell populations
To selectively deplete T cells bearing TCRs with the Vβ 8.2 (F23.2 [163]) or Vβ 8.1/8.2 (KJ16
[164]) chains, mice were injected i.p. with 100µg of F23.2 or KJ16 in 200 µl PBS one day
prior to and two and five days after infection [168]. Efficiency of depletion was determined by
flow cytometry.
2.2.5.4 Adoptive transfer of T cells
Spleen cells from either transgenic 318 donor mice (Thy1.1+) -expressing an LCMV gp33-
specific TCR on about 50% of their CTLs (P14 T cells)- or d8 spleen cells of LCMV-infected
mice were used. Spleen cells were isolated and counted. Naïve P14 T cells were stained for
T cell populations expressing a TCR specific for the LCMV gp33 epitope using αCD3, αCD8,
αThy1.1, and αVα2 antibodies. In some experiments CTLs obtained from donor mice 8 days
after LCMV infection were purified via MACS separation.
Either defined numbers of total splenocytes or calculated T cell populations were transfused
in a volume up to 300µl of IMDM i.v. into sex-matched naïve recipients or recipients that
were infected with 1x10⁴ pfu LCMV 10h before.
Material and Methods 44
2.2.6 Preparation of mice
2.2.6.1 LCMV-infected mice
Mice were anesthetized with ketamin and rompun for blood sampling from the retro-orbital
plexus followed by sacrificing mice by cervical dislocation. To isolate splenocytes, spleens
were removed and dissociated into single cell suspensions by mashing them through a cell
strainer. Cell debris was removed by short centrifugation.
Kidneys, lungs, and parts of spleen and liver were removed and kept in PBS with 5% FCS at
-80°C for virus titer determination or in 4% formaldehyde solution at room temperature for
histological analysis.
2.2.6.2 RSV-infected mice
Mice were injected i.p. with 10mg thiopental and exsanguinated via the femoral arteries. The
diaphragm was removed to open the thorax without injuring the lung. The trachea was
exposed in order to make a small incision allowing passage of a lavage tube into the trachea.
This lavage tube was attached directly to a syringe filled with 1ml PBS containing 0.3%
Lidocain. PBS was injected and aspirated from the animals’ lungs five times. The procedure
was repeated with IMDM three times and the obtained fluids were pooled.
For analysing cytokines, BAL fluid yielded during the first of the 5 washing steps was stored
in a separate tube, centrifuged and analysis was performed by taking an aliquot of the
supernatant.
For virus titer determination, lungs were removed and kept in 1.5ml SF RPMI in liquid
nitrogen until further analysis.
2.2.7 In vitro activation of T cells
Spleen cells from 318 mice containing 4x10⁵ TCR transgenic T cells (P14) were seeded into
a 24 well plate in 1ml medium with or without recombinant human interleukin-2 (IL-2). GP33
peptide was added to a final concentration 10-7M and cells were kept in culture for 72 to 96h.
Material and Methods 45
2.2.8 Determination of virus titers
2.2.8.1 Quantification of RSV with an immunological focus assay
Lungs kept in 1.5ml SF RPMI were homogenized manually and after a short centrifugation,
3.3-fold serial dilutions from supernatants were made using SF RPMI medium in a 96-well
plate. From each dilution an aliquot was transferred to a ~90% confluent monolayer of Hep-2
cells in a 96-well flat bottom plate which had been seeded 24 hours before. Virus was
allowed to infect the cells for 3h at 37°C prior to washing and incubating the cell layer for
additional 24h with RPMI containing 10% FCS. After this incubation period, plates were
washed and fixed with 100% methanol containing 2% H2O2 for 20min at room temperature
(RT). After washing, fixed cells were incubated with RSV goat-anti mouse biotin polyclonal
antibody (1:400 in PBS with 1%FCS) for 30min at RT. Streptavidin HRP was added (1:2000)
for 30min and finally, to visualize RSV infected cells, a DAB solution (each tablet solved in
10ml H2O with 10µl H2O2) was added for another 20min at RT. Plates were washed twice
with PBS between each step. Viral titers were determined by counting visible infected cell
foci under the light microscope.
2.2.8.2 Quantification of LCMV with an immunological focus assay [169]
Organs from LCMV infected mice were homogenized in 1ml PBS with 5% FCS with ceramic
spheres using a FastPrep machine. Organ debris was removed by centrifugation for 5min at
10000rpm and supernatant was used to detect virus titers. Ten fold serial dilutions were
made and mixed with 8x10⁵ MC57 cells per well in a 24 well plate in a total volume of 400µl.
After letting the virus infect the cells for 5h, cells were incubated for 48h under a
methylcellulose overlay. After this, cell monolayers were fixed with 4% formaldehyde for
20min and permeabilized with 0.5% Triton X-100 in PBS for 30min. After washing with PBS
and blocking with 10% FCS in PBS, cells were stained with a monoclonal rat anti-LCMV-NP
antibody (VL-4) followed by washing with PBS and staining with a peroxidase-labeled second
stage anti-rat IgG antibody. Virus infected cell were detected by adding OPD until foci
became visible. Viral titers were determined by macroscopically counting stained foci.
Material and Methods 46
2.2.9 Flow cytometry
Numbers of live cells were determined by counting cells under the light microscope excluding
dead cells by trypan blue staining. For determination of absolute cell counts of particular cell
populations, live cell counts as determined by microscopy were put equal with cells identified
in the live gate in forward and side scatter as determined by flow cytometry.
Cells were analysed on a FACSort cytometer using CellquestPro v4.02 software.
2.2.9.1 Surface Staining
For surface staining, 1x10⁵ to 1x10⁶ cells were incubated with the appropriate antibodies for
30min at 4°C.
2.2.9.2 Intracellular cytokine staining
To determine the frequency of IFN-γ producing CTLs, 1-5x10⁵ lymphocytes were
restimulated in vitro with the respective peptides or medium as a control for 3h at 37°C in a
96 well V-bottom plate in the presence of monensin in a total volume of 150µl. Peptides were
added to a final concentration of 10-6M. Following surface staining, cells were fixed with 4%
PFA and permeabilized and stained either with an anti-IFN-γ antibody or an IgG isotype
control diluted in Perm/Wash buffer.
In some experiments 1x10⁵ cells were restimulated with 4x10⁴ RAW macrophages that had
been infected with RSV at a moi of 5 24h prior to the experiment.
2.2.9.3 Degranulation
To test the ability of CTLs to degranulate, 5x10⁵ spleen cells were restimulated with the
respective peptides in the presence of a fluorescence labelled anti-CD107a antibody for one
hour without monensin. After this incubation period, monensin was added and restimulation
was continued for additional 3h. Thereafter, cells were treated as described in 2.2.9.3.
NK cell degranulation was determined by incubating 5x10⁵ spleen cells with 5x10⁵ YAC-1 cell
for 2h in the presence of anti-CD107a without monensin. Following restimulation, cells were
stained with anti-CD3, anti-NK 1.1 and anti-CD107a antibodies and analyzed by flow
cytometry.
Material and Methods 47
2.2.10 Magnetic Activated Cell Separation
To isolate CD8 T cells, a MACS CD8a+ T cell isolation Kit was used following manufacturer's
instructions. Non CD8+ T cells were labelled by using a cocktail of biotin-labelled antibodies
against CD4, CD11b, CD11c, CD19, CD45R (B220), CD49b (DX5), CD105, MHC-class II,
and Ter-119. Thereafter, cells were incubated with anti-biotin micro-beads and magnetic cell
separation was performed using LS MACS columns. The effluent contained enriched CD8+ T
cells. Cell purity achieved was more than 90 %.
2.2.11 Blood count
White blood cell counts, haemoglobin, and thrombocyte counts were determined by taking a
blood sample of 20µl with a capillary from mice via retro-orbital bleeding. Samples were
diluted in 500µl EDTA and measured using a Sysmex KX-21 hematology analyzer.
2.2.12 Proliferation assay
T cell proliferation was quantified in a carboxyfluorescein diacetate succinimidyl ester (CFSE)
proliferation assay. Membranes of cells were stained with CFSE dye (0.5µM in PBS) for
10min at 37°C. Thereafter FCS was added to a final concentration of 5% to stop staining and
cells were washed twice with ice cold PBS. Stained spleen cells from 318 mice containing
4x10⁵ TCR transgenic T cells were seeded into a 24 well plate in 1ml medium. GP33 peptide
was added to a final concentration 10-7M and cells were kept in culture for 72h. Proliferation
was determined by flow cytometry.
2.2.13 Cytotoxicity Assay
2.2.13.1 “Mini Killer” conditions for BAL cells
To determine the cytotoxicity of T cells, P815, EL-4 or RAW cells were loaded with peptide
(2x10⁻⁵M to 2x10-13) and 51chromium for 2h at 37°C. In some experiments RAW cells were
loaded with 51chromium that had been infected with RSV at a moi of 5 for 24h.
Target cells were incubated with BAL cells at different effector to target ratios starting with
25:1 (1x10⁴ effector cells, 2x10³ target cells) in a total volume of 100µl followed by five 2-fold
serial dilutions of effector cells for 5h at 37°C. After this, 50µl of the supernatant was
removed and the radioactivity released to the supernatant during the incubation period was
measured in an γ-counter. Chromium spontaneously released from target cells incubated
with medium was measured (S) and total release (T) was determined by lysing target cells
with 2N HCl.
Material and Methods 48
2.2.13.2 “Maxi Killer” conditions for spleen cells
Cytotoxicity of spleen cells was determined by incubating peptide-loaded (gp33) chromium-
labeled target cells with spleen cells starting with an effector to target ratio of 100:1 (1x10⁶
effector cells, 1x10⁴ target cells) in a total volume of 150µl followed by five 3-fold serial
dilutions of effector cells. After 5h incubation at 37°C, 70µl of supernatant was removed and
analyzed in a γ-counter. Spontaneous and total release was determined as described above.
In some experiments LCMV-infected MC57G cells were used as target cells. The MC57G
cells were infected before with LCMV WE at a moi of 0.01 for 48h.
For analyzing NK cell cytotoxicity YAC-1 cells were labeled with 51Cr and spleen cells were
incubated with target cells at an initial effector to target ratio of 200:1.
In all experiments percentage of specific lysis was determined as follows:
specific lysis = [(cpmE-cpmS) x100] / [cpmT-cpmS]
cpm= counts per minute; E = effector release; S = spontaneous release; T = total release
Spontaneous 51Cr release was below 20% in all experiments.
2.2.14 Determination of cytokine levels
2.2.14.1 ELISA
IFN-γ serum levels were determined by ELISA. For this, 96-well plates were coated with
purified anti-IFN-γ antibody (1µg/ml) overnight at 4°C. After washing with PBS containing
0.05% Tween, unspecific binding was blocked by incubating the plates with 10%FCS in PBS
at RT for 1h. Serum samples were diluted 1:2 to 1:10 and a serial dilution of the IFN-γ
standard was made from 200ng/ml to 0,09 ng/ml. Samples were incubated on the plate for
2.5h. Then, a biotin labelled anti-IFN-γ antibody (0.5µg/ml) was added for 1h followed by
Streptavidin-Peroxidase incubation for 30min. The plate was washed after each step. The
bound Streptavidin-Peroxidase was detected by adding OPD. To stop the reaction 2N HCl
was added and absorbance was measured using the Titertek Multiskan MCC/340 plate
reader at 492 nm.
To determine serum levels of sCD25, the Mouse IL-2 R alpha DuoSet kit was used. 96-well
plates were coated with the capture antibody (0.4µg/ml in PBS) overnight. Plates were
washed as recommended between each step. Blocking was performed by using 1% BSA in
PBS. A serial dilution of the sCD25 standard was made starting from 4ng/ml to 0,03 ng/ml.
Material and Methods 49
Samples diluted 1:2 to 1:10 and standards were incubated on the plate for 2h at RT followed
by the addition of a detection antibody (0.4µg/ml) for additional 2h. Finally Streptavidin-HRP
was added and the bound Streptavidin-HRP was detected by incubating with OPD. Reaction
was stopped by adding 2N HCl and absorption was measured using the Titertek Multiskan
MCC/340 plate reader at 492 nm.
2.2.14.2 Cytometric bead array – mouse inflammation kit
To analyze cytokine levels in BAL, fluid samples were treated as described in 2.2.6.2. 50µl of
BAL supernatants were used for analysis of levels of IL-6, IL-10, MCP-1, IFN-γ, TNF-α and
IL12p70, using the CBA Mouse Inflammation Kit following the manufacturer’s instructions.
Data were analysed by flow cytometry using CBA software.
2.2.15 Analysis of liver enzymes, triglycerides and ferritin serum levels
Serum levels of LDH (lactate dehydrogenase), GLDH (glutamate dehydrogenase), GPT
(glutamate pyruvate transaminase or alanine transaminase), triglycerides and ferritin were
determined by the central laboratory of the University Hospital Freiburg. Analysis was
performed with Roche diagnostic reagents using the Roche Modular Analytics Evo.
2.2.16 Histology
Organs were kept in 4% formaldehyde until they were embedded in paraffin. Sections were
made using a standard microtome and stained with hematoxylin and eosin (HE). Tissue
processing and staining was performed at the Institute of Pathology, University Hospital
Freiburg, and analysis and of the sections was done by A. Schmitt-Gräff.
2.2.17 Statistical analysis
Data were analysed by using GaphPad InStat software version 3.06.
The comparison between data was evaluated with Student`s t test if data were sampled from
populations that followed Gaussian distribution and had equal standard deviations (SD). If
the difference between SDs was significant, the alternate (Welch) t test was used. To
compare more than two groups a one-way ANOVA (ANalysis Of Variance) with post test was
used. Differences were considered being significant at a p value below 0.05.
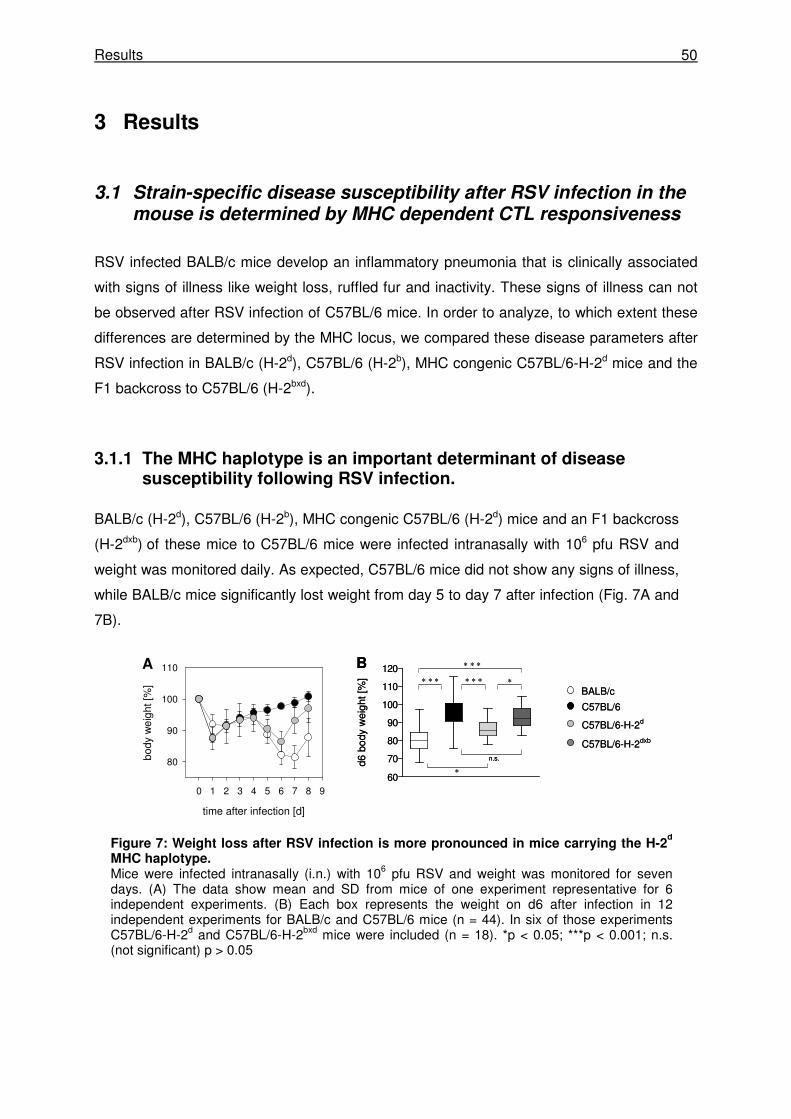
Results 50
3 Results
3.1 Strain-specific disease susceptibility after RSV infection in the mouse is determined by MHC dependent CTL responsiveness
RSV infected BALB/c mice develop an inflammatory pneumonia that is clinically associated
with signs of illness like weight loss, ruffled fur and inactivity. These signs of illness can not
be observed after RSV infection of C57BL/6 mice. In order to analyze, to which extent these
differences are determined by the MHC locus, we compared these disease parameters after
RSV infection in BALB/c (H-2d), C57BL/6 (H-2b), MHC congenic C57BL/6-H-2d mice and the
F1 backcross to C57BL/6 (H-2bxd).
3.1.1 The MHC haplotype is an important determinant of disease susceptibility following RSV infection.
BALB/c (H-2d), C57BL/6 (H-2b), MHC congenic C57BL/6 (H-2d) mice and an F1 backcross
(H-2dxb) of these mice to C57BL/6 mice were infected intranasally with 106 pfu RSV and
weight was monitored daily. As expected, C57BL/6 mice did not show any signs of illness,
while BALB/c mice significantly lost weight from day 5 to day 7 after infection (Fig. 7A and
7B).
time after infection [d]
0 1 2 3 4 5 6 7 8 9
bod
y w
eig
ht [
%]
80
90
100
110A
n.s.
∗∗ ∗ ∗∗ ∗ ∗
∗
∗ ∗ ∗B
BALB/c
C57BL/6
C57BL/6-H-2d
C57BL/6-H-2dxb
60
70
80
90
100
110
120
d6 b
ody
wei
ght [
%]
time after infection [d]
0 1 2 3 4 5 6 7 8 9
bod
y w
eig
ht [
%]
80
90
100
110A
n.s.
∗∗ ∗ ∗∗ ∗ ∗
∗
∗ ∗ ∗B
BALB/c
C57BL/6
C57BL/6-H-2d
C57BL/6-H-2dxb
60
70
80
90
100
110
120
d6 b
ody
wei
ght [
%]
Figure 7: Weight loss after RSV infection is more pronounced in mice carrying the H-2d
MHC haplotype. Mice were infected intranasally (i.n.) with 106 pfu RSV and weight was monitored for seven days. (A) The data show mean and SD from mice of one experiment representative for 6 independent experiments. (B) Each box represents the weight on d6 after infection in 12 independent experiments for BALB/c and C57BL/6 mice (n = 44). In six of those experiments C57BL/6-H-2d and C57BL/6-H-2bxd mice were included (n = 18). *p < 0.05; ***p < 0.001; n.s. (not significant) p > 0.05
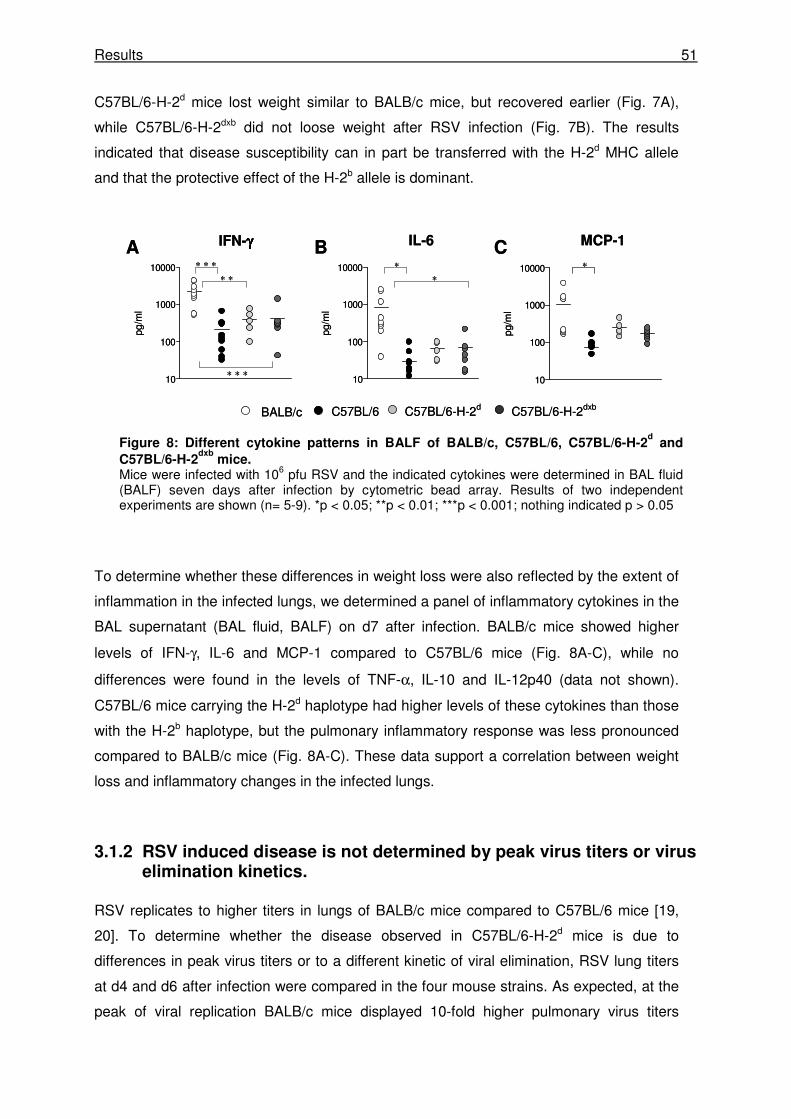
Results 51
C57BL/6-H-2d mice lost weight similar to BALB/c mice, but recovered earlier (Fig. 7A),
while C57BL/6-H-2dxb did not loose weight after RSV infection (Fig. 7B). The results
indicated that disease susceptibility can in part be transferred with the H-2d MHC allele
and that the protective effect of the H-2b allele is dominant.
To determine whether these differences in weight loss were also reflected by the extent of
inflammation in the infected lungs, we determined a panel of inflammatory cytokines in the
BAL supernatant (BAL fluid, BALF) on d7 after infection. BALB/c mice showed higher
levels of IFN-γ, IL-6 and MCP-1 compared to C57BL/6 mice (Fig. 8A-C), while no
differences were found in the levels of TNF-α, IL-10 and IL-12p40 (data not shown).
C57BL/6 mice carrying the H-2d haplotype had higher levels of these cytokines than those
with the H-2b haplotype, but the pulmonary inflammatory response was less pronounced
compared to BALB/c mice (Fig. 8A-C). These data support a correlation between weight
loss and inflammatory changes in the infected lungs.
3.1.2 RSV induced disease is not determined by peak virus titers or virus elimination kinetics.
RSV replicates to higher titers in lungs of BALB/c mice compared to C57BL/6 mice [19,
20]. To determine whether the disease observed in C57BL/6-H-2d mice is due to
differences in peak virus titers or to a different kinetic of viral elimination, RSV lung titers
at d4 and d6 after infection were compared in the four mouse strains. As expected, at the
peak of viral replication BALB/c mice displayed 10-fold higher pulmonary virus titers
10
100
1000
10000
pg/m
l
A B C
BALB/c C57BL/6 C57BL/6-H-2d C57BL/6-H-2dxb
IFN-γγγγ IL-6 MCP-1
10
100
1000
10000
pg/m
l
10
100
1000
10000
pg/m
l
∗
∗
∗ ∗ ∗
∗ ∗
∗ ∗ ∗
∗
10
100
1000
10000
pg/m
l
A B C
BALB/c C57BL/6 C57BL/6-H-2d C57BL/6-H-2dxb
IFN-γγγγ IL-6 MCP-1
10
100
1000
10000
pg/m
l
10
100
1000
10000
pg/m
l
∗
∗
∗ ∗ ∗
∗ ∗
∗ ∗ ∗
∗
Figure 8: Different cytokine patterns in BALF of BALB/c, C57BL/6, C57BL/6-H-2d and
C57BL/6-H-2dxb
mice. Mice were infected with 106 pfu RSV and the indicated cytokines were determined in BAL fluid (BALF) seven days after infection by cytometric bead array. Results of two independent experiments are shown (n= 5-9). *p < 0.05; **p < 0.01; ***p < 0.001; nothing indicated p > 0.05
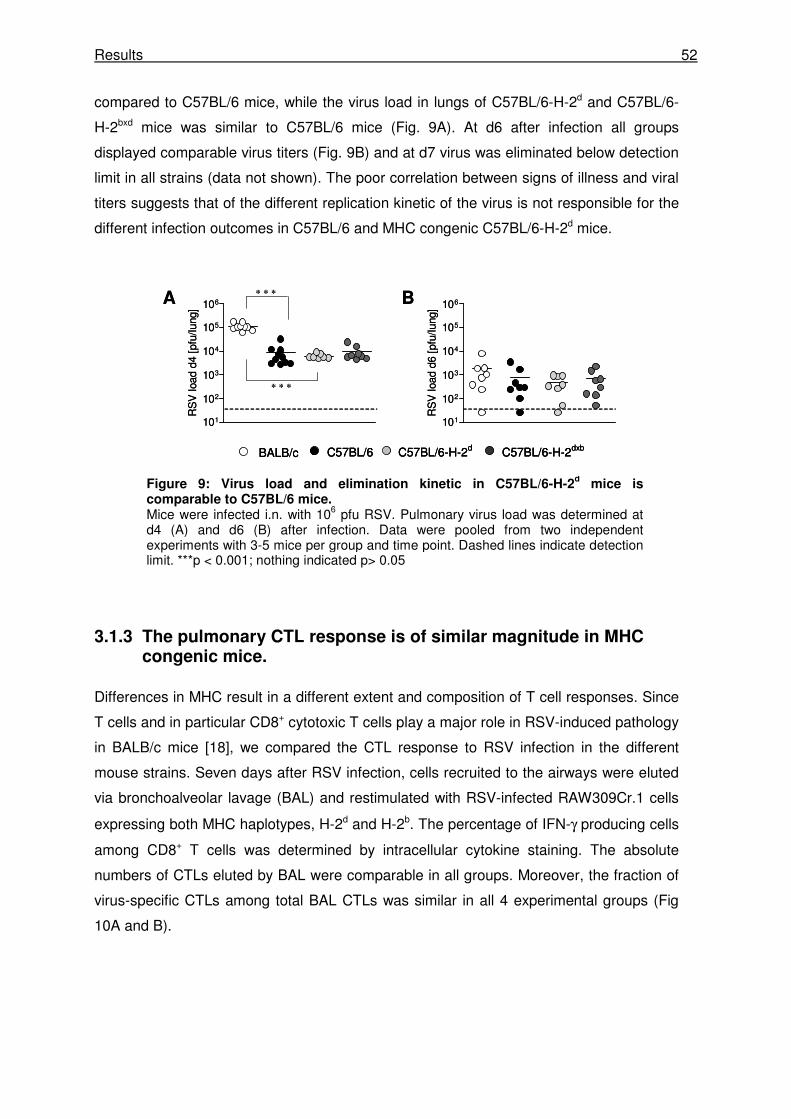
Results 52
compared to C57BL/6 mice, while the virus load in lungs of C57BL/6-H-2d and C57BL/6-
H-2bxd mice was similar to C57BL/6 mice (Fig. 9A). At d6 after infection all groups
displayed comparable virus titers (Fig. 9B) and at d7 virus was eliminated below detection
limit in all strains (data not shown). The poor correlation between signs of illness and viral
titers suggests that of the different replication kinetic of the virus is not responsible for the
different infection outcomes in C57BL/6 and MHC congenic C57BL/6-H-2d mice.
3.1.3 The pulmonary CTL response is of similar magnitude in MHC congenic mice.
Differences in MHC result in a different extent and composition of T cell responses. Since
T cells and in particular CD8+ cytotoxic T cells play a major role in RSV-induced pathology
in BALB/c mice [18], we compared the CTL response to RSV infection in the different
mouse strains. Seven days after RSV infection, cells recruited to the airways were eluted
via bronchoalveolar lavage (BAL) and restimulated with RSV-infected RAW309Cr.1 cells
expressing both MHC haplotypes, H-2d and H-2b. The percentage of IFN-γ producing cells
among CD8+ T cells was determined by intracellular cytokine staining. The absolute
numbers of CTLs eluted by BAL were comparable in all groups. Moreover, the fraction of
virus-specific CTLs among total BAL CTLs was similar in all 4 experimental groups (Fig
10A and B).
101
102
103
104
105
106
RS
V lo
ad d
4 [p
fu/lu
ng]
A B
BALB/c C57BL/6 C57BL/6-H-2d C57BL/6-H-2dxb
101
102
103
104
105
106
RS
V lo
ad d
6 [p
fu/lu
ng]
∗ ∗ ∗
∗ ∗ ∗
101
102
103
104
105
106
RS
V lo
ad d
4 [p
fu/lu
ng]
A B
BALB/c C57BL/6 C57BL/6-H-2d C57BL/6-H-2dxbBALB/c C57BL/6 C57BL/6-H-2d C57BL/6-H-2dxb
101
102
103
104
105
106
RS
V lo
ad d
6 [p
fu/lu
ng]
∗ ∗ ∗
∗ ∗ ∗
Figure 9: Virus load and elimination kinetic in C57BL/6-H-2d mice is
comparable to C57BL/6 mice. Mice were infected i.n. with 106 pfu RSV. Pulmonary virus load was determined at d4 (A) and d6 (B) after infection. Data were pooled from two independent experiments with 3-5 mice per group and time point. Dashed lines indicate detection limit. ***p < 0.001; nothing indicated p> 0.05
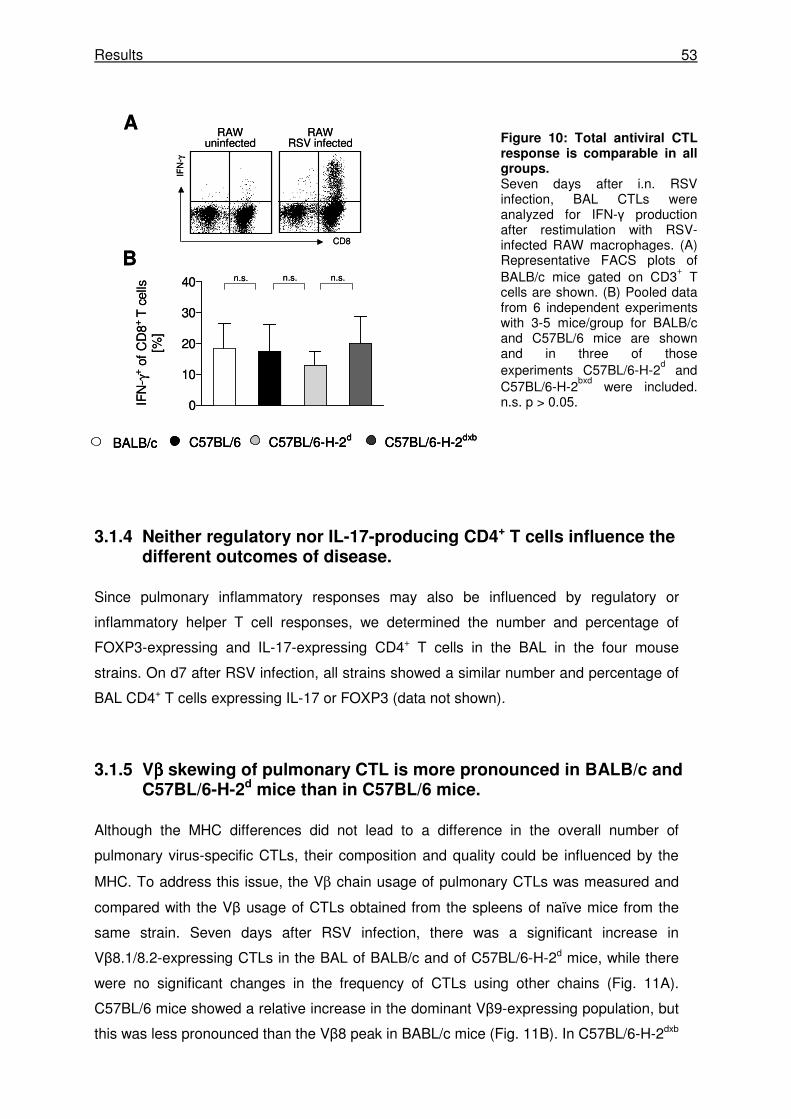
Results 53
Figure 10: Total antiviral CTL response is comparable in all groups. Seven days after i.n. RSV infection, BAL CTLs were analyzed for IFN-γ production after restimulation with RSV-infected RAW macrophages. (A) Representative FACS plots of BALB/c mice gated on CD3
+ T
cells are shown. (B) Pooled data from 6 independent experiments with 3-5 mice/group for BALB/c and C57BL/6 mice are shown and in three of those experiments C57BL/6-H-2
d and
C57BL/6-H-2bxd
were included. n.s. p > 0.05.
3.1.4 Neither regulatory nor IL-17-producing CD4+ T cells influence the different outcomes of disease.
Since pulmonary inflammatory responses may also be influenced by regulatory or
inflammatory helper T cell responses, we determined the number and percentage of
FOXP3-expressing and IL-17-expressing CD4+ T cells in the BAL in the four mouse
strains. On d7 after RSV infection, all strains showed a similar number and percentage of
BAL CD4+ T cells expressing IL-17 or FOXP3 (data not shown).
3.1.5 Vββββ skewing of pulmonary CTL is more pronounced in BALB/c and C57BL/6-H-2d mice than in C57BL/6 mice.
Although the MHC differences did not lead to a difference in the overall number of
pulmonary virus-specific CTLs, their composition and quality could be influenced by the
MHC. To address this issue, the Vβ chain usage of pulmonary CTLs was measured and
compared with the Vβ usage of CTLs obtained from the spleens of naïve mice from the
same strain. Seven days after RSV infection, there was a significant increase in
Vβ8.1/8.2-expressing CTLs in the BAL of BALB/c and of C57BL/6-H-2d mice, while there
were no significant changes in the frequency of CTLs using other chains (Fig. 11A).
C57BL/6 mice showed a relative increase in the dominant Vβ9-expressing population, but
this was less pronounced than the Vβ8 peak in BABL/c mice (Fig. 11B). In C57BL/6-H-2dxb
0
10
20
30
40
IFN
- γ+ o
f C
D8+
T c
ells
[%]
n.s. n.s.
IFN
-γ
CD8
RAWuninfected
RAWRSV infected
n.s.
A
B
BALB/c C57BL/6 C57BL/6-H-2d C57BL/6-H-2dxb
0
10
20
30
40
IFN
- γ+ o
f C
D8+
T c
ells
[%]
n.s. n.s.
IFN
-γ
CD8
RAWuninfected
RAWRSV infected
n.s.
A
B
BALB/c C57BL/6 C57BL/6-H-2d C57BL/6-H-2dxbBALB/c C57BL/6 C57BL/6-H-2d C57BL/6-H-2dxb
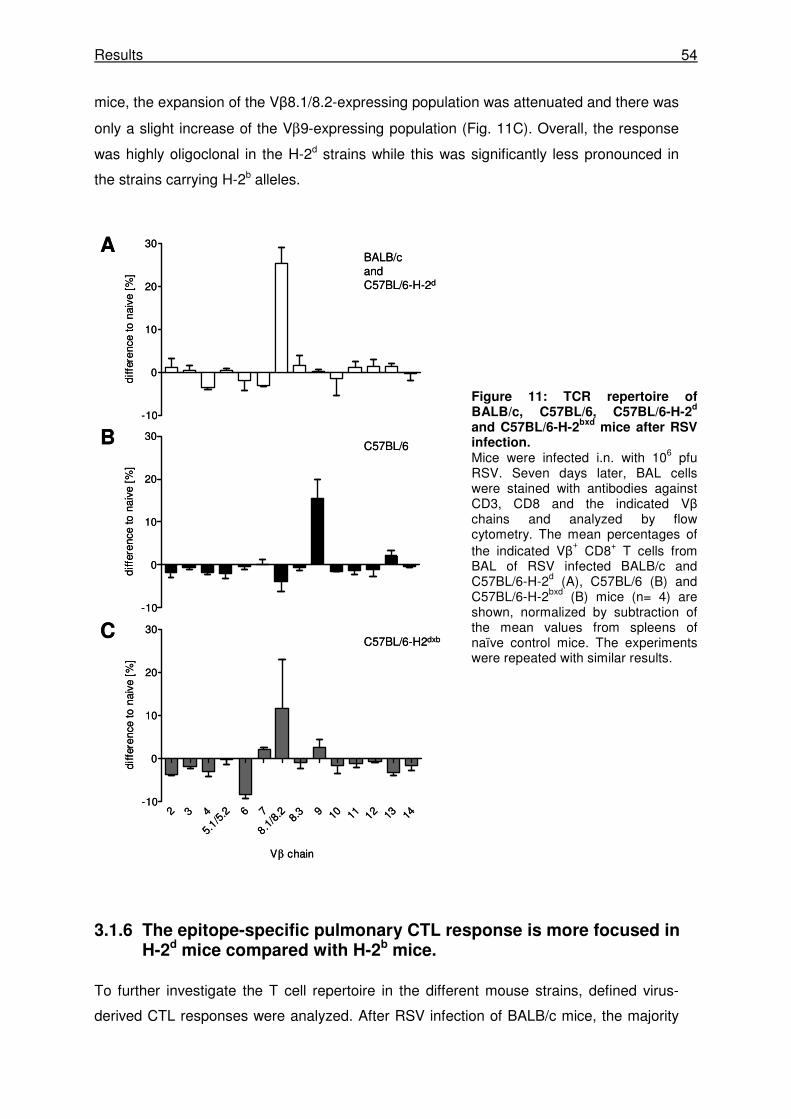
Results 54
mice, the expansion of the Vβ8.1/8.2-expressing population was attenuated and there was
only a slight increase of the Vβ9-expressing population (Fig. 11C). Overall, the response
was highly oligoclonal in the H-2d strains while this was significantly less pronounced in
the strains carrying H-2b alleles.
Figure 11: TCR repertoire of BALB/c, C57BL/6, C57BL/6-H-2
d
and C57BL/6-H-2bxd
mice after RSV infection. Mice were infected i.n. with 106 pfu RSV. Seven days later, BAL cells were stained with antibodies against CD3, CD8 and the indicated Vβ chains and analyzed by flow cytometry. The mean percentages of the indicated Vβ
+ CD8+ T cells from
BAL of RSV infected BALB/c and C57BL/6-H-2d (A), C57BL/6 (B) and C57BL/6-H-2bxd (B) mice (n= 4) are shown, normalized by subtraction of the mean values from spleens of naïve control mice. The experiments were repeated with similar results.
3.1.6 The epitope-specific pulmonary CTL response is more focused in H-2d mice compared with H-2b mice.
To further investigate the T cell repertoire in the different mouse strains, defined virus-
derived CTL responses were analyzed. After RSV infection of BALB/c mice, the majority
-10
0
10
20
30
diff
eren
ce t
o na
ive
[%]
-10
0
10
20
30
diff
eren
ce t
o na
ive
[%]
2 3 4
5.1/5
.2 6 7
8.1/8
.2 8.3 9 10 11 12 13 14
-10
0
10
20
30
Vβ chain
diff
eren
ce t
o na
ive
[%]
BALB/cand C57BL/6-H-2d
C57BL/6
C57BL/6-H2dxb
A
B
C
-10
0
10
20
30
diff
eren
ce t
o na
ive
[%]
-10
0
10
20
30
diff
eren
ce t
o na
ive
[%]
2 3 4
5.1/5
.2 6 7
8.1/8
.2 8.3 9 10 11 12 13 14
-10
0
10
20
30
Vβ chain
diff
eren
ce t
o na
ive
[%]
BALB/cand C57BL/6-H-2d
C57BL/6
C57BL/6-H2dxb
A
B
C
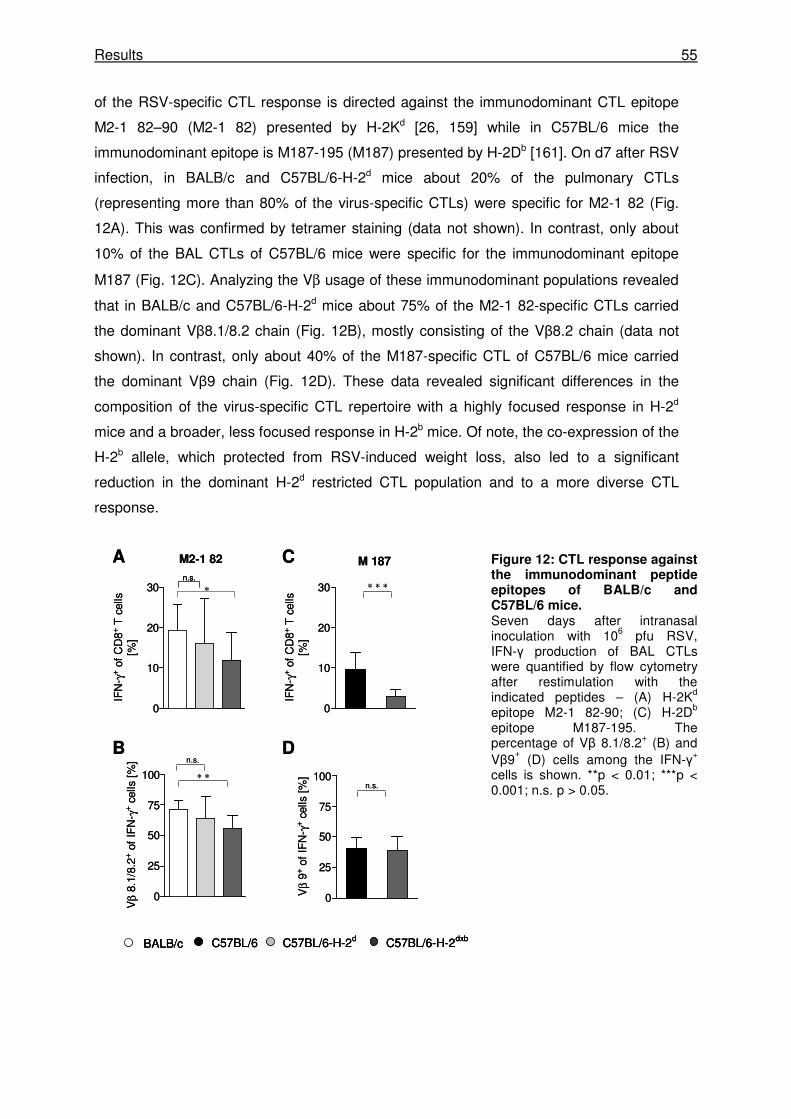
Results 55
of the RSV-specific CTL response is directed against the immunodominant CTL epitope
M2-1 82–90 (M2-1 82) presented by H-2Kd [26, 159] while in C57BL/6 mice the
immunodominant epitope is M187-195 (M187) presented by H-2Db [161]. On d7 after RSV
infection, in BALB/c and C57BL/6-H-2d mice about 20% of the pulmonary CTLs
(representing more than 80% of the virus-specific CTLs) were specific for M2-1 82 (Fig.
12A). This was confirmed by tetramer staining (data not shown). In contrast, only about
10% of the BAL CTLs of C57BL/6 mice were specific for the immunodominant epitope
M187 (Fig. 12C). Analyzing the Vβ usage of these immunodominant populations revealed
that in BALB/c and C57BL/6-H-2d mice about 75% of the M2-1 82-specific CTLs carried
the dominant Vβ8.1/8.2 chain (Fig. 12B), mostly consisting of the Vβ8.2 chain (data not
shown). In contrast, only about 40% of the M187-specific CTL of C57BL/6 mice carried
the dominant Vβ9 chain (Fig. 12D). These data revealed significant differences in the
composition of the virus-specific CTL repertoire with a highly focused response in H-2d
mice and a broader, less focused response in H-2b mice. Of note, the co-expression of the
H-2b allele, which protected from RSV-induced weight loss, also led to a significant
reduction in the dominant H-2d restricted CTL population and to a more diverse CTL
response.
Figure 12: CTL response against the immunodominant peptide epitopes of BALB/c and C57BL/6 mice. Seven days after intranasal inoculation with 106 pfu RSV, IFN-γ production of BAL CTLs were quantified by flow cytometry after restimulation with the indicated peptides – (A) H-2Kd epitope M2-1 82-90; (C) H-2Db epitope M187-195. The percentage of Vβ 8.1/8.2+ (B) and Vβ9
+ (D) cells among the IFN-γ+
cells is shown. **p < 0.01; ***p < 0.001; n.s. p > 0.05.
0
25
50
75
100
Vβ 9
+ of
IF
N- γ
+ ce
lls [
%]
0
25
50
75
100
Vβ 8
.1/8
.2+ o
f IF
N- γ
+ cel
ls [
%]
0
10
20
30
IFN
- γ+
of C
D8+
T c
ells
[%]
0
10
20
30
IFN
- γ+
of C
D8+
T c
ells
[%]
M 187M2-1 82
∗ ∗ ∗
n.s.
n.s.∗ ∗
A
B
C
D
BALB/c C57BL/6 C57BL/6-H-2d C57BL/6-H-2dxb
n.s.
∗
0
25
50
75
100
Vβ 9
+ of
IF
N- γ
+ ce
lls [
%]
0
25
50
75
100
Vβ 8
.1/8
.2+ o
f IF
N- γ
+ cel
ls [
%]
0
10
20
30
IFN
- γ+
of C
D8+
T c
ells
[%]
0
10
20
30
IFN
- γ+
of C
D8+
T c
ells
[%]
M 187M2-1 82
∗ ∗ ∗
n.s.
n.s.∗ ∗
A
B
C
D
BALB/c C57BL/6 C57BL/6-H-2d C57BL/6-H-2dxbBALB/c C57BL/6 C57BL/6-H-2d C57BL/6-H-2dxb
n.s.n.s.
∗
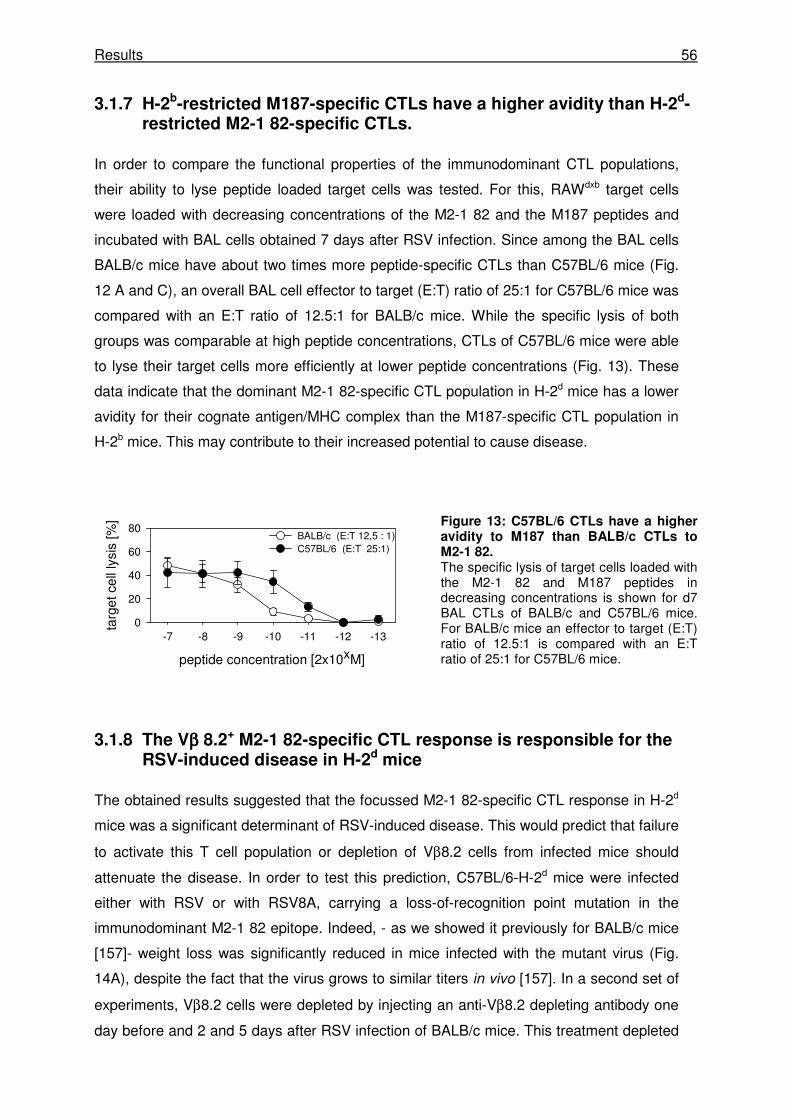
Results 56
3.1.7 H-2b-restricted M187-specific CTLs have a higher avidity than H-2d-restricted M2-1 82-specific CTLs.
In order to compare the functional properties of the immunodominant CTL populations,
their ability to lyse peptide loaded target cells was tested. For this, RAWdxb target cells
were loaded with decreasing concentrations of the M2-1 82 and the M187 peptides and
incubated with BAL cells obtained 7 days after RSV infection. Since among the BAL cells
BALB/c mice have about two times more peptide-specific CTLs than C57BL/6 mice (Fig.
12 A and C), an overall BAL cell effector to target (E:T) ratio of 25:1 for C57BL/6 mice was
compared with an E:T ratio of 12.5:1 for BALB/c mice. While the specific lysis of both
groups was comparable at high peptide concentrations, CTLs of C57BL/6 mice were able
to lyse their target cells more efficiently at lower peptide concentrations (Fig. 13). These
data indicate that the dominant M2-1 82-specific CTL population in H-2d mice has a lower
avidity for their cognate antigen/MHC complex than the M187-specific CTL population in
H-2b mice. This may contribute to their increased potential to cause disease.
Figure 13: C57BL/6 CTLs have a higher avidity to M187 than BALB/c CTLs to M2-1 82. The specific lysis of target cells loaded with the M2-1 82 and M187 peptides in decreasing concentrations is shown for d7 BAL CTLs of BALB/c and C57BL/6 mice. For BALB/c mice an effector to target (E:T) ratio of 12.5:1 is compared with an E:T ratio of 25:1 for C57BL/6 mice.
3.1.8 The Vββββ 8.2+ M2-1 82-specific CTL response is responsible for the RSV-induced disease in H-2d mice
The obtained results suggested that the focussed M2-1 82-specific CTL response in H-2d
mice was a significant determinant of RSV-induced disease. This would predict that failure
to activate this T cell population or depletion of Vβ8.2 cells from infected mice should
attenuate the disease. In order to test this prediction, C57BL/6-H-2d mice were infected
either with RSV or with RSV8A, carrying a loss-of-recognition point mutation in the
immunodominant M2-1 82 epitope. Indeed, - as we showed it previously for BALB/c mice
[157]- weight loss was significantly reduced in mice infected with the mutant virus (Fig.
14A), despite the fact that the virus grows to similar titers in vivo [157]. In a second set of
experiments, Vβ8.2 cells were depleted by injecting an anti-Vβ8.2 depleting antibody one
day before and 2 and 5 days after RSV infection of BALB/c mice. This treatment depleted
peptide concentration [2x10xM]
-7 -8 -9 -10 -11 -12 -13
targ
et c
ell l
ysis
[%]
0
20
40
60
80BALB/c (E:T 12,5 : 1)C57BL/6 (E:T 25:1)
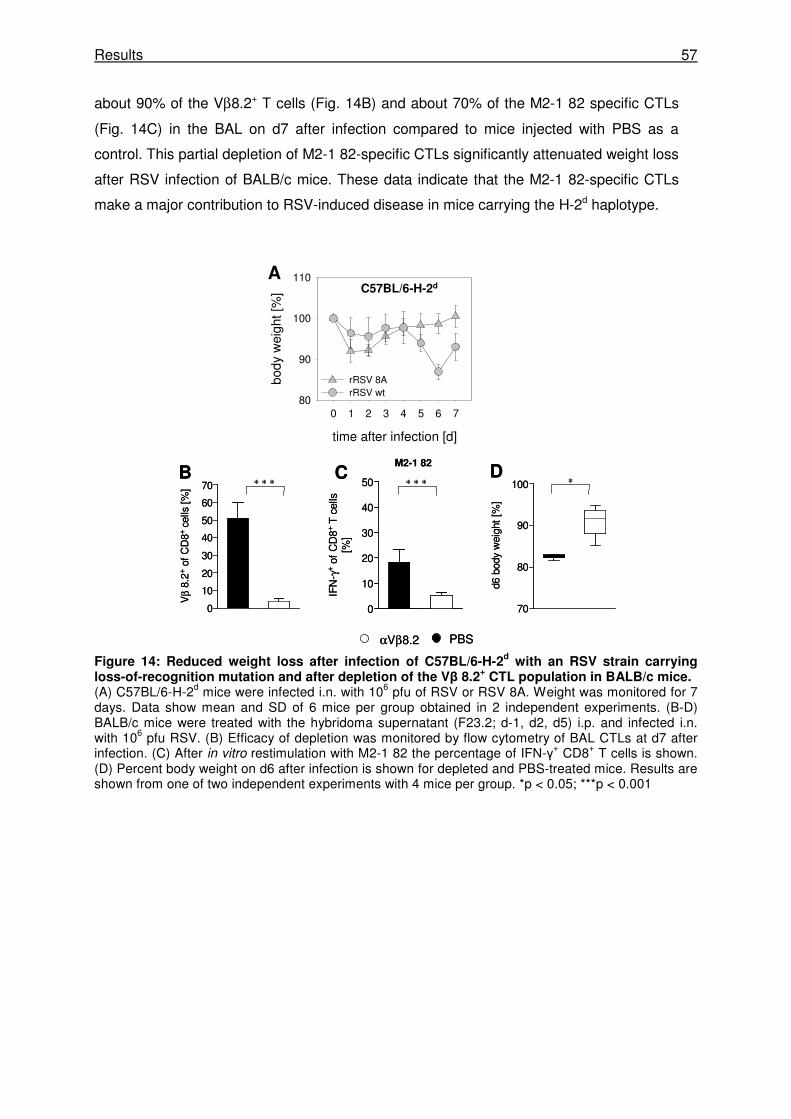
Results 57
about 90% of the Vβ8.2+ T cells (Fig. 14B) and about 70% of the M2-1 82 specific CTLs
(Fig. 14C) in the BAL on d7 after infection compared to mice injected with PBS as a
control. This partial depletion of M2-1 82-specific CTLs significantly attenuated weight loss
after RSV infection of BALB/c mice. These data indicate that the M2-1 82-specific CTLs
make a major contribution to RSV-induced disease in mice carrying the H-2d haplotype.
Figure 14: Reduced weight loss after infection of C57BL/6-H-2d with an RSV strain carrying
loss-of-recognition mutation and after depletion of the Vβ 8.2+ CTL population in BALB/c mice.
(A) C57BL/6-H-2d mice were infected i.n. with 106 pfu of RSV or RSV 8A. Weight was monitored for 7 days. Data show mean and SD of 6 mice per group obtained in 2 independent experiments. (B-D) BALB/c mice were treated with the hybridoma supernatant (F23.2; d-1, d2, d5) i.p. and infected i.n. with 106 pfu RSV. (B) Efficacy of depletion was monitored by flow cytometry of BAL CTLs at d7 after infection. (C) After in vitro restimulation with M2-1 82 the percentage of IFN-γ+ CD8+ T cells is shown. (D) Percent body weight on d6 after infection is shown for depleted and PBS-treated mice. Results are shown from one of two independent experiments with 4 mice per group. *p < 0.05; ***p < 0.001
time after infection [d]
0 1 2 3 4 5 6 7
body
wei
ght [
%]
80
90
100
110
rRSV 8ArRSV wt
C57BL/6-H-2d
∗∗ ∗ ∗ ∗ ∗ ∗
M2-1 82DB C
A
0
10
20
30
40
50
60
70
Vβ 8
.2+
of C
D8+
cells
[%
]
0
10
20
30
40
50
IFN
- γ+
of C
D8+
T c
ells
[%]
70
80
90
100d6
bod
y w
eigh
t [%
]
αVβ8.2 PBS
time after infection [d]
0 1 2 3 4 5 6 7
body
wei
ght [
%]
80
90
100
110
rRSV 8ArRSV wt
C57BL/6-H-2d
∗∗ ∗ ∗ ∗ ∗ ∗
M2-1 82DB C
A
0
10
20
30
40
50
60
70
Vβ 8
.2+
of C
D8+
cells
[%
]
0
10
20
30
40
50
IFN
- γ+
of C
D8+
T c
ells
[%]
70
80
90
100d6
bod
y w
eigh
t [%
]
αVβ8.2 PBS
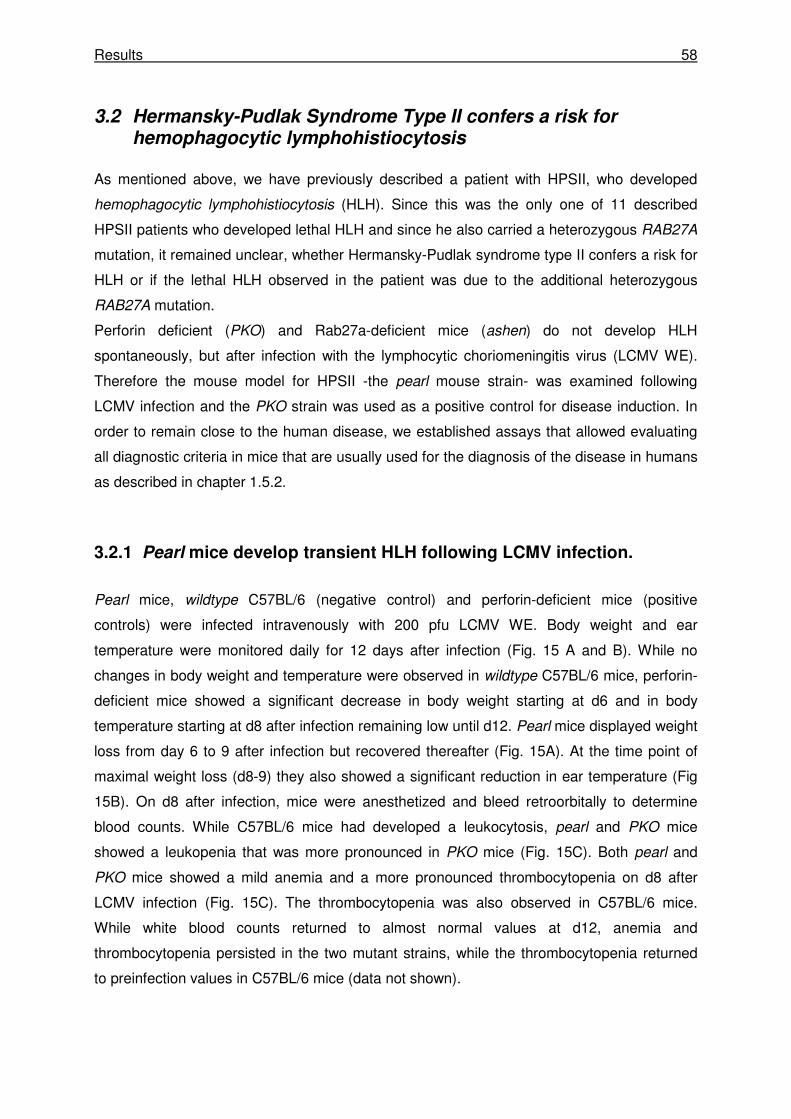
Results 58
3.2 Hermansky-Pudlak Syndrome Type II confers a risk for hemophagocytic lymphohistiocytosis
As mentioned above, we have previously described a patient with HPSII, who developed
hemophagocytic lymphohistiocytosis (HLH). Since this was the only one of 11 described
HPSII patients who developed lethal HLH and since he also carried a heterozygous RAB27A
mutation, it remained unclear, whether Hermansky-Pudlak syndrome type II confers a risk for
HLH or if the lethal HLH observed in the patient was due to the additional heterozygous
RAB27A mutation.
Perforin deficient (PKO) and Rab27a-deficient mice (ashen) do not develop HLH
spontaneously, but after infection with the lymphocytic choriomeningitis virus (LCMV WE).
Therefore the mouse model for HPSII -the pearl mouse strain- was examined following
LCMV infection and the PKO strain was used as a positive control for disease induction. In
order to remain close to the human disease, we established assays that allowed evaluating
all diagnostic criteria in mice that are usually used for the diagnosis of the disease in humans
as described in chapter 1.5.2.
3.2.1 Pearl mice develop transient HLH following LCMV infection.
Pearl mice, wildtype C57BL/6 (negative control) and perforin-deficient mice (positive
controls) were infected intravenously with 200 pfu LCMV WE. Body weight and ear
temperature were monitored daily for 12 days after infection (Fig. 15 A and B). While no
changes in body weight and temperature were observed in wildtype C57BL/6 mice, perforin-
deficient mice showed a significant decrease in body weight starting at d6 and in body
temperature starting at d8 after infection remaining low until d12. Pearl mice displayed weight
loss from day 6 to 9 after infection but recovered thereafter (Fig. 15A). At the time point of
maximal weight loss (d8-9) they also showed a significant reduction in ear temperature (Fig
15B). On d8 after infection, mice were anesthetized and bleed retroorbitally to determine
blood counts. While C57BL/6 mice had developed a leukocytosis, pearl and PKO mice
showed a leukopenia that was more pronounced in PKO mice (Fig. 15C). Both pearl and
PKO mice showed a mild anemia and a more pronounced thrombocytopenia on d8 after
LCMV infection (Fig. 15C). The thrombocytopenia was also observed in C57BL/6 mice.
While white blood counts returned to almost normal values at d12, anemia and
thrombocytopenia persisted in the two mutant strains, while the thrombocytopenia returned
to preinfection values in C57BL/6 mice (data not shown).
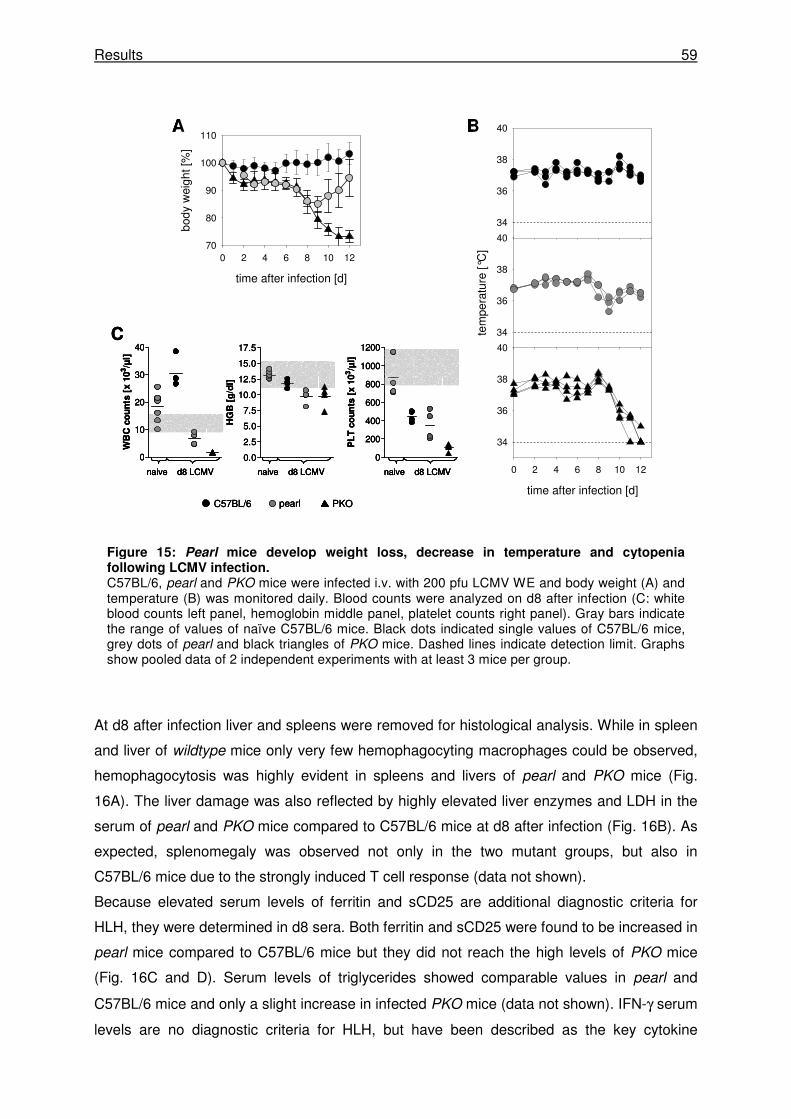
Results 59
At d8 after infection liver and spleens were removed for histological analysis. While in spleen
and liver of wildtype mice only very few hemophagocyting macrophages could be observed,
hemophagocytosis was highly evident in spleens and livers of pearl and PKO mice (Fig.
16A). The liver damage was also reflected by highly elevated liver enzymes and LDH in the
serum of pearl and PKO mice compared to C57BL/6 mice at d8 after infection (Fig. 16B). As
expected, splenomegaly was observed not only in the two mutant groups, but also in
C57BL/6 mice due to the strongly induced T cell response (data not shown).
Because elevated serum levels of ferritin and sCD25 are additional diagnostic criteria for
HLH, they were determined in d8 sera. Both ferritin and sCD25 were found to be increased in
pearl mice compared to C57BL/6 mice but they did not reach the high levels of PKO mice
(Fig. 16C and D). Serum levels of triglycerides showed comparable values in pearl and
C57BL/6 mice and only a slight increase in infected PKO mice (data not shown). IFN-γ serum
levels are no diagnostic criteria for HLH, but have been described as the key cytokine
Figure 15: Pearl mice develop weight loss, decrease in temperature and cytopenia following LCMV infection. C57BL/6, pearl and PKO mice were infected i.v. with 200 pfu LCMV WE and body weight (A) and temperature (B) was monitored daily. Blood counts were analyzed on d8 after infection (C: white blood counts left panel, hemoglobin middle panel, platelet counts right panel). Gray bars indicate the range of values of naïve C57BL/6 mice. Black dots indicated single values of C57BL/6 mice, grey dots of pearl and black triangles of PKO mice. Dashed lines indicate detection limit. Graphs show pooled data of 2 independent experiments with at least 3 mice per group.
time after infection [d]
0 2 4 6 8 10 12
body
wei
ght [
%]
70
80
90
100
110
time after infection [d]
0 2 4 6 8 10 12
34
36
38
40
tem
pera
ture
[°C
]
34
36
38
40
34
36
38
40
0.0
2.5
5.0
7.5
10.0
12.5
15.0
17.5
HG
B [
g/d
l]
0
10
20
30
40
WB
C c
ou
nts
[x 1
03/µ
l]
0
200
400
600
800
1000
1200P
LT
co
un
ts [
x 1
03/µ
l]
A B
C
naive d8 LCMV
C57BL/6 PKOpearl
naive d8 LCMV naive d8 LCMV
time after infection [d]
0 2 4 6 8 10 12
body
wei
ght [
%]
70
80
90
100
110
time after infection [d]
0 2 4 6 8 10 12
34
36
38
40
tem
pera
ture
[°C
]
34
36
38
40
34
36
38
40
0.0
2.5
5.0
7.5
10.0
12.5
15.0
17.5
HG
B [
g/d
l]
0
10
20
30
40
WB
C c
ou
nts
[x 1
03/µ
l]
0
200
400
600
800
1000
1200P
LT
co
un
ts [
x 1
03/µ
l]
A B
C
naive d8 LCMVnaive d8 LCMV
C57BL/6 PKOpearl
naive d8 LCMVnaive d8 LCMV naive d8 LCMVnaive d8 LCMV
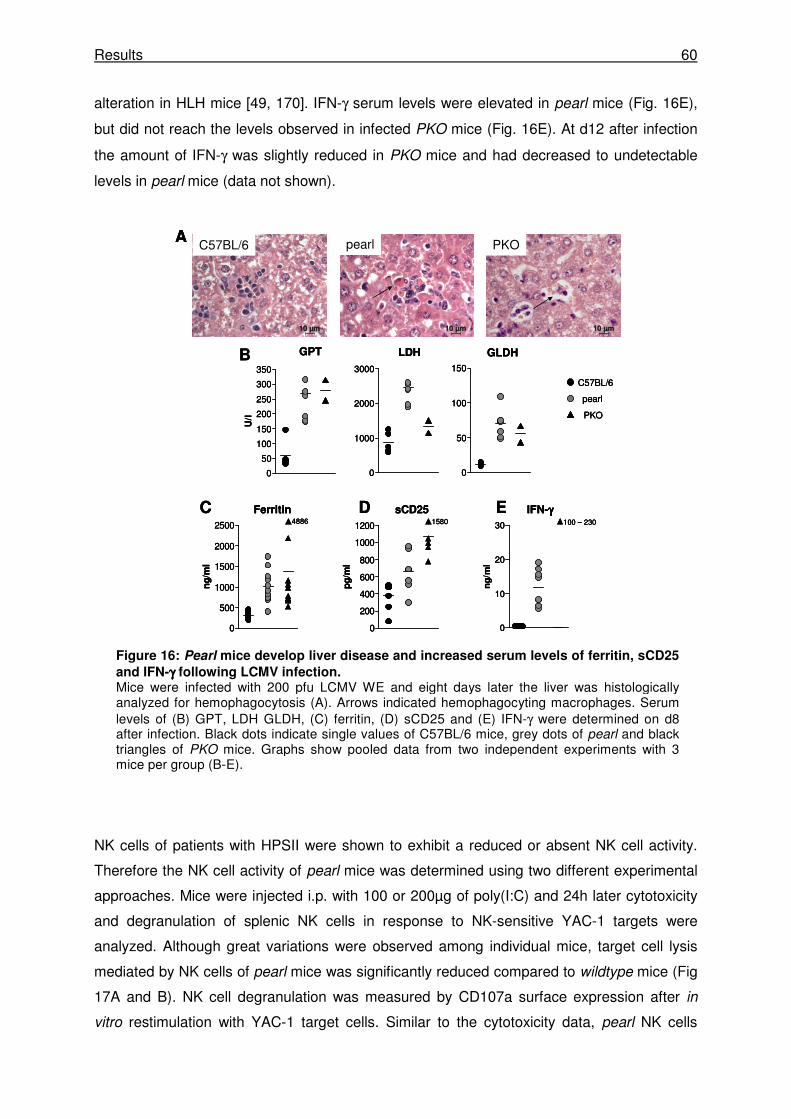
Results 60
alteration in HLH mice [49, 170]. IFN-γ serum levels were elevated in pearl mice (Fig. 16E),
but did not reach the levels observed in infected PKO mice (Fig. 16E). At d12 after infection
the amount of IFN-γ was slightly reduced in PKO mice and had decreased to undetectable
levels in pearl mice (data not shown).
NK cells of patients with HPSII were shown to exhibit a reduced or absent NK cell activity.
Therefore the NK cell activity of pearl mice was determined using two different experimental
approaches. Mice were injected i.p. with 100 or 200µg of poly(I:C) and 24h later cytotoxicity
and degranulation of splenic NK cells in response to NK-sensitive YAC-1 targets were
analyzed. Although great variations were observed among individual mice, target cell lysis
mediated by NK cells of pearl mice was significantly reduced compared to wildtype mice (Fig
17A and B). NK cell degranulation was measured by CD107a surface expression after in
vitro restimulation with YAC-1 target cells. Similar to the cytotoxicity data, pearl NK cells
GLDH
0
50
100
150
LDH
0
1000
2000
3000
GPT
0
50
100
150
200
250
300
350
U/l
C57BL/6
PKO
pearl
B
4886
Ferritin
0
500
1000
1500
2000
2500
ng
/ml
C1580
sCD25
0
200
400
600
800
1000
1200
pg
/ml
D100 – 230
IFN-γγγγ
0
10
20
30
ng
/ml
E
PKOpearlC57BL/6A
10 µm 10 µm10 µm
GLDH
0
50
100
150
GLDH
0
50
100
150
LDH
0
1000
2000
3000
LDH
0
1000
2000
3000
GPT
0
50
100
150
200
250
300
350
U/l
GPT
0
50
100
150
200
250
300
350
U/l
C57BL/6
PKO
pearl
C57BL/6
PKO
pearl
B
4886
Ferritin
0
500
1000
1500
2000
2500
ng
/ml
C4886
Ferritin
0
500
1000
1500
2000
2500
ng
/ml
C1580
sCD25
0
200
400
600
800
1000
1200
pg
/ml
D1580
sCD25
0
200
400
600
800
1000
1200
pg
/ml
D100 – 230
IFN-γγγγ
0
10
20
30
ng
/ml
E100 – 230
IFN-γγγγ
0
10
20
30
ng
/ml
E
PKOpearlC57BL/6A
10 µm 10 µm10 µm
PKOpearlC57BL/6A
10 µm10 µm 10 µm10 µm10 µm10 µm
Figure 16: Pearl mice develop liver disease and increased serum levels of ferritin, sCD25
and IFN-γγγγ following LCMV infection. Mice were infected with 200 pfu LCMV WE and eight days later the liver was histologically analyzed for hemophagocytosis (A). Arrows indicated hemophagocyting macrophages. Serum levels of (B) GPT, LDH GLDH, (C) ferritin, (D) sCD25 and (E) IFN-γ were determined on d8 after infection. Black dots indicate single values of C57BL/6 mice, grey dots of pearl and black triangles of PKO mice. Graphs show pooled data from two independent experiments with 3 mice per group (B-E).
Results 61
showed a significantly reduced capacity to degranulate compared to wildtype NK cells (Fig.
17C and D).
Taken together, pearl mice fulfilled 7 of the 8 criteria for HLH on d8 after LCMV infection and
thus clearly developed the disease. However, disease manifestations were transient and did
not progress to a lethal disorder as observed in PKO mice.
3.2.2 Pearl mice show a delay in virus control after LCMV WE infection.
HLH manifestations in PKO and ashen mice were shown to be associated with virus
persistence. We therefore analyzed the virus elimination kinetics in the different strains.
LCMV titers were analyzed in spleen, liver and lung at different time points after infection.
Viral titers were comparable in spleens of pearl, C57BL/6 and PKO on day 4 after infection
and no spreading to peripheral organs was detectable (Fig. 18B). While C57BL/6 mice had
significantly reduced the virus titers in the spleen on d8 after infection, pearl mice still had
significant titers although they were about 1.5 log lower than in PKO mice (Fig. 18A). At this
time point virus spread to lungs and livers was observed both in PKO as well as in pearl mice
(Fig. 18A). However, in contrast to PKO mice that show long-term virus persistence, pearl
mice were able to reduce LCMV titers below detection limit until d12 in all investigated
organs (Fig. 18C).
Figure 17: Pearl mice have a defect in NK cell cytotoxicity and degranulation. NK cell cytotoxicity was determined in a 5h chromium release assay on YAC-1 target cells. C57BL/6 and pearl mice were injected i.p. with 100µg (A) or 200µg (B-D) poly(I:C) and 24h later cytotoxicity of splenic NK cells was analyzed (A,B). NK to target ratio was determined by calculating percentage of NK cells among total spleen cells by FACS analysis. NK cell degranulation was measured after 2h restimulation with YAC-1 cells. (C) Representative FACS plots are shown for degranulation of NK cells after restimuation with medium or YAC-1 cells. (D) Degranulation is shown as ∆CD107
+ in
percent representing the differences between values of restimulation with YAC-1 cells compared to medium control. Black dots indicated single values of C57BL/6 mice and grey dots of pearl mice. Data shown are representative for 2 independent experiments.
NK:T ratio
0,010,1110
targ
et c
ell l
ysis
[%]
0
10
20
30
40
50
NK:T ratio
0,010,1110
targ
et c
ell l
ysis
[%]
0
10
20
30
40
50
CD107a
NK
1.1
C57BL/6 pearl
med
ium
YA
C-1
A B
C D
C57BL/6 pearl
0
10
20
30
40
∆∆ ∆∆C
D107
+ [
%]
NK:T ratio
0,010,1110
targ
et c
ell l
ysis
[%]
0
10
20
30
40
50
NK:T ratio
0,010,1110
targ
et c
ell l
ysis
[%]
0
10
20
30
40
50
CD107a
NK
1.1
C57BL/6 pearl
med
ium
YA
C-1
A B
C D
C57BL/6 pearl
0
10
20
30
40
∆∆ ∆∆C
D107
+ [
%]
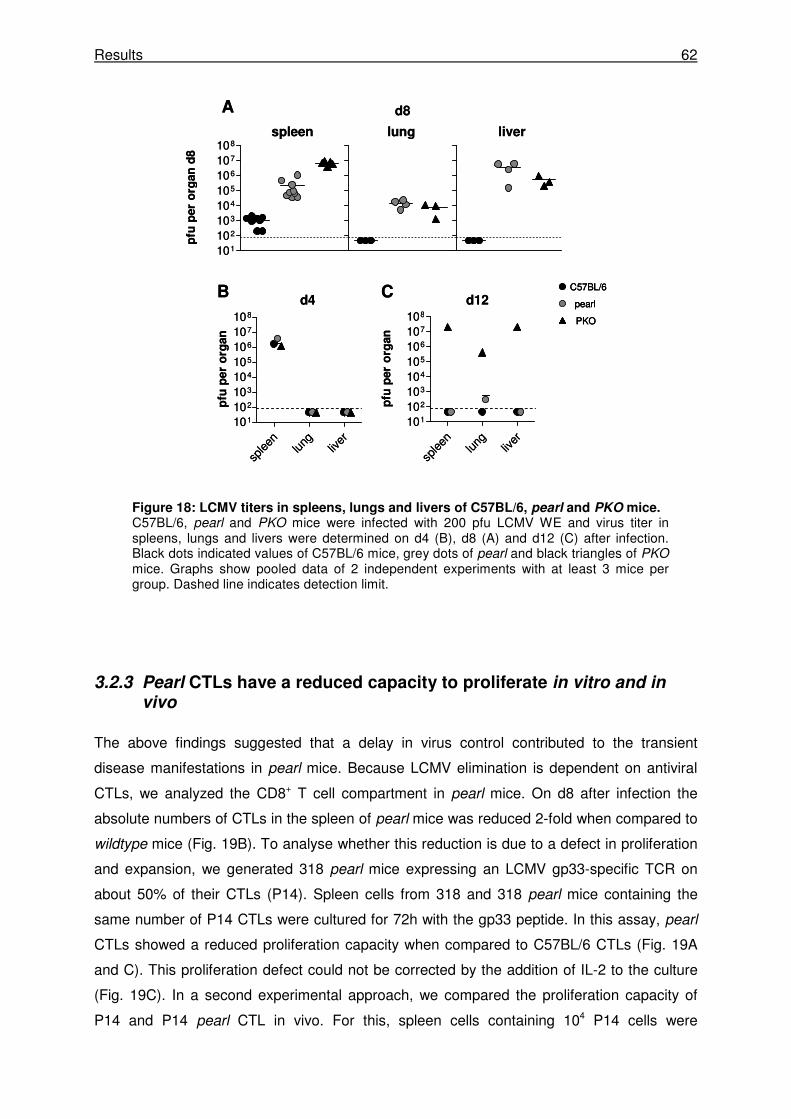
Results 62
3.2.3 Pearl CTLs have a reduced capacity to proliferate in vitro and in vivo
The above findings suggested that a delay in virus control contributed to the transient
disease manifestations in pearl mice. Because LCMV elimination is dependent on antiviral
CTLs, we analyzed the CD8+ T cell compartment in pearl mice. On d8 after infection the
absolute numbers of CTLs in the spleen of pearl mice was reduced 2-fold when compared to
wildtype mice (Fig. 19B). To analyse whether this reduction is due to a defect in proliferation
and expansion, we generated 318 pearl mice expressing an LCMV gp33-specific TCR on
about 50% of their CTLs (P14). Spleen cells from 318 and 318 pearl mice containing the
same number of P14 CTLs were cultured for 72h with the gp33 peptide. In this assay, pearl
CTLs showed a reduced proliferation capacity when compared to C57BL/6 CTLs (Fig. 19A
and C). This proliferation defect could not be corrected by the addition of IL-2 to the culture
(Fig. 19C). In a second experimental approach, we compared the proliferation capacity of
P14 and P14 pearl CTL in vivo. For this, spleen cells containing 104 P14 cells were
Figure 18: LCMV titers in spleens, lungs and livers of C57BL/6, pearl and PKO mice. C57BL/6, pearl and PKO mice were infected with 200 pfu LCMV WE and virus titer in spleens, lungs and livers were determined on d4 (B), d8 (A) and d12 (C) after infection. Black dots indicated values of C57BL/6 mice, grey dots of pearl and black triangles of PKO mice. Graphs show pooled data of 2 independent experiments with at least 3 mice per group. Dashed line indicates detection limit.
C57BL/6
PKO
pearld4 d12B
splee
nlun
gliv
er101
102
103
104
105
106
107
108
pfu
per
org
an
splee
nlun
gliv
er101
102
103
104
105
106
107
108
pfu
per
org
an
101
102
103
104
105
106
107
108
pfu
per
org
an
d8
spleen lung liver
A
C
d8
C57BL/6
PKO
pearl
C57BL/6
PKO
pearld4 d12B
splee
nlun
gliv
er101
102
103
104
105
106
107
108
pfu
per
org
an
splee
nlun
gliv
er101
102
103
104
105
106
107
108
pfu
per
org
an
101
102
103
104
105
106
107
108
pfu
per
org
an
d8
spleen lung liver
A
C
d8
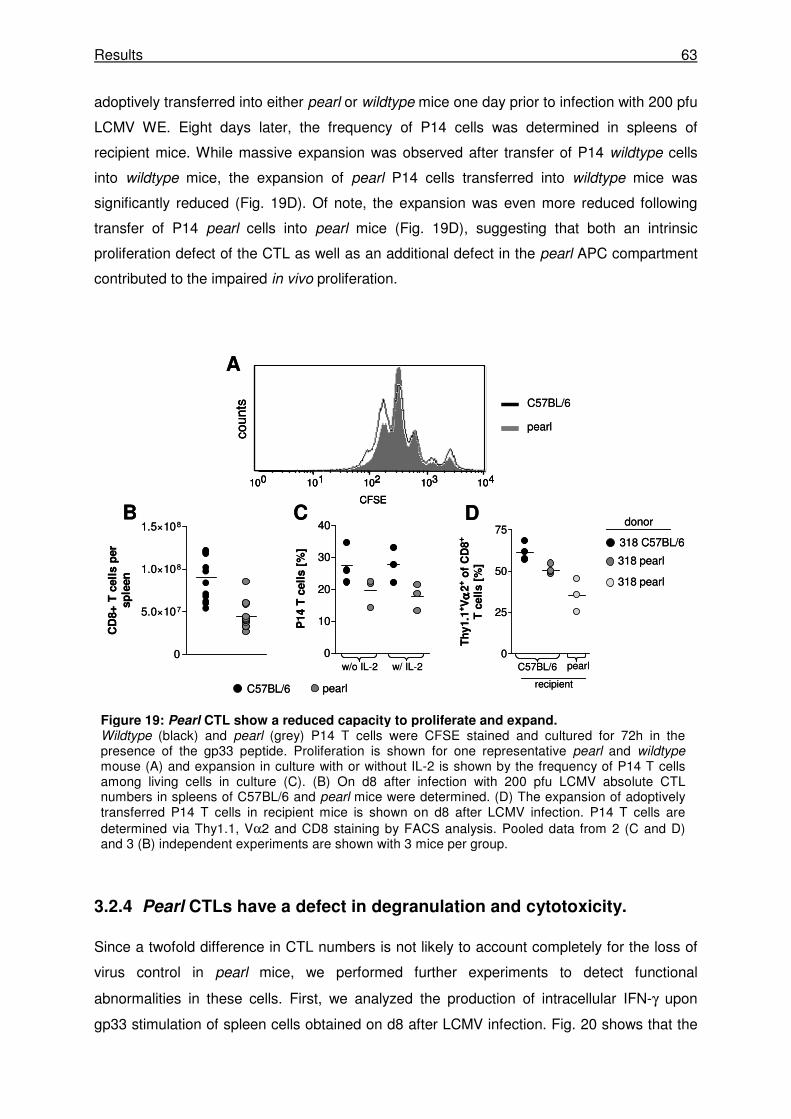
Results 63
adoptively transferred into either pearl or wildtype mice one day prior to infection with 200 pfu
LCMV WE. Eight days later, the frequency of P14 cells was determined in spleens of
recipient mice. While massive expansion was observed after transfer of P14 wildtype cells
into wildtype mice, the expansion of pearl P14 cells transferred into wildtype mice was
significantly reduced (Fig. 19D). Of note, the expansion was even more reduced following
transfer of P14 pearl cells into pearl mice (Fig. 19D), suggesting that both an intrinsic
proliferation defect of the CTL as well as an additional defect in the pearl APC compartment
contributed to the impaired in vivo proliferation.
3.2.4 Pearl CTLs have a defect in degranulation and cytotoxicity.
Since a twofold difference in CTL numbers is not likely to account completely for the loss of
virus control in pearl mice, we performed further experiments to detect functional
abnormalities in these cells. First, we analyzed the production of intracellular IFN-γ upon
gp33 stimulation of spleen cells obtained on d8 after LCMV infection. Fig. 20 shows that the
Figure 19: Pearl CTL show a reduced capacity to proliferate and expand. Wildtype (black) and pearl (grey) P14 T cells were CFSE stained and cultured for 72h in the presence of the gp33 peptide. Proliferation is shown for one representative pearl and wildtype mouse (A) and expansion in culture with or without IL-2 is shown by the frequency of P14 T cells among living cells in culture (C). (B) On d8 after infection with 200 pfu LCMV absolute CTL numbers in spleens of C57BL/6 and pearl mice were determined. (D) The expansion of adoptively transferred P14 T cells in recipient mice is shown on d8 after LCMV infection. P14 T cells are determined via Thy1.1, Vα2 and CD8 staining by FACS analysis. Pooled data from 2 (C and D) and 3 (B) independent experiments are shown with 3 mice per group.
C57BL/6
pearl
w/o IL-2 w/ IL-2
A
B C
C57BL/6 pearl
0
10
20
30
40
P14 T
cell
s [
%]
D
100 101 102 103 104
CFSE
coun
ts
318 C57BL/6
318 pearl
318 pearl
donor
C57BL/6 pearl
recipient
0
25
50
75
Th
y1.1
+V
αα αα2
+ o
f C
D8
+
T c
ell
s [
%]
0
5.0×10⁷
1.0×10⁸
1.5×10⁸
CD
8+
T c
ell
s p
er
sp
leen
C57BL/6
pearl
w/o IL-2 w/ IL-2
A
B C
C57BL/6 pearl
0
10
20
30
40
P14 T
cell
s [
%]
D
100 101 102 103 104
CFSE
coun
ts
100 101 102 103 104
CFSE
coun
ts
318 C57BL/6
318 pearl
318 pearl
donor
C57BL/6 pearl
recipient
0
25
50
75
Th
y1.1
+V
αα αα2
+ o
f C
D8
+
T c
ell
s [
%]
0
5.0×10⁷
1.0×10⁸
1.5×10⁸
CD
8+
T c
ell
s p
er
sp
leen

Results 64
frequency of gp33-specfic CTLs was similar in spleens of wildtype, PKO and pearl mice (Fig.
20A and B). Interestingly, although the total frequency of IFN-γ producing CTLs was similar,
the relative frequency of IFN-γhigh CD8+ T cells was lower in pearl and PKO mice (squares in
Fig. 20A). This probably reflected virus persistence, since at d12, the IFN-γ staining pattern
returned to normal in pearl mice -that had by then eliminated the virus-, but not in PKO mice -
where virus still persisted (data not shown).
CTL:T ratio
0,1110100
targ
et c
ell l
ysis
[%]
0
20
40
60
80
100
89,2 76,0
***
CD107a
IFN
-γ
C57BL/6 pearl
med
ium
gp33
E F
0
25
50
75
100
CD
107a
+ o
f IF
N- γγ γγ
+C
D8
+
cell
s [
%]
C
CTL:T ratio
0,1110100
targ
et c
ell l
ysis
[%]
0
20
40
60
80
100
D
B
0
10
20
30
40
IFN
- γγ γγ+ o
f C
D8
+T
cell
s[%
]
C57BL/6 pearl
PKO
CD8
IFN
-γ
A
C57BL/6
PKO
pearl
CTL:T ratio
0,1110100
targ
et c
ell l
ysis
[%]
0
20
40
60
80
100
89,2 76,0
***
CD107a
IFN
-γ
C57BL/6 pearl
med
ium
gp33
E F
0
25
50
75
100
CD
107a
+ o
f IF
N- γγ γγ
+C
D8
+
cell
s [
%]
C
CTL:T ratio
0,1110100
targ
et c
ell l
ysis
[%]
0
20
40
60
80
100
D
B
0
10
20
30
40
IFN
- γγ γγ+ o
f C
D8
+T
cell
s[%
]
C57BL/6 pearl
PKO
CD8
IFN
-γ
A
CTL:T ratio
0,1110100
targ
et c
ell l
ysis
[%]
0
20
40
60
80
100
89,2 76,0
***
CD107a
IFN
-γ
C57BL/6 pearl
med
ium
gp33
E F
0
25
50
75
100
CD
107a
+ o
f IF
N- γγ γγ
+C
D8
+
cell
s [
%]
C
CTL:T ratio
0,1110100
targ
et c
ell l
ysis
[%]
0
20
40
60
80
100
D
CTL:T ratio
0,1110100
targ
et c
ell l
ysis
[%]
0
20
40
60
80
100
89,2 76,076,0
***
CD107a
IFN
-γ
C57BL/6 pearl
med
ium
gp33
E F
0
25
50
75
100
CD
107a
+ o
f IF
N- γγ γγ
+C
D8
+
cell
s [
%]
C
CTL:T ratio
0,1110100
targ
et c
ell l
ysis
[%]
0
20
40
60
80
100
D
B
0
10
20
30
40
IFN
- γγ γγ+ o
f C
D8
+T
cell
s[%
]
C57BL/6 pearl
PKO
CD8
IFN
-γ
A
C57BL/6
PKO
pearl
C57BL/6
PKO
pearl
Figure 20: Pearl CTLs have a defect in degranulation and cytotoxicity. Wildtype and pearl CTL were analyzed 8 days after infection with 200 pfu LCMV WE. The frequencies of IFN-γ producing CTLs were determined by intracellular cytokine staining after in vitro restimulation with the gp33 peptide. Representative FACS plots (A) and pooled data from 2 independent experiments (B) are shown. IFN-γhi population is indicated in squares (A). Ex vivo cytotoxicity was tested in a 5h 51cr-release assay on (C) either target cells (MC57) infected with LCMV WE 2 days before or (D) target cells (EL-4) loaded with a gp33 peptide concentration of 10
-10M. Degranulation -measured by CD107a
surface expression of IFN-γ+ CTLs- was examined following 4h of in vitro restimulation with gp33 peptide. (E) Representative FACS plots and (F) percentage of degranulating cells among gp33-specific CTLs are shown. Black dots indicated single values of C57BL/6, grey dots of pearl and black triangles of PKO mice. Data from one representative experiment are shown in C and D and pooled data from 3 independent experiments are shown in F. ***p < 0.001
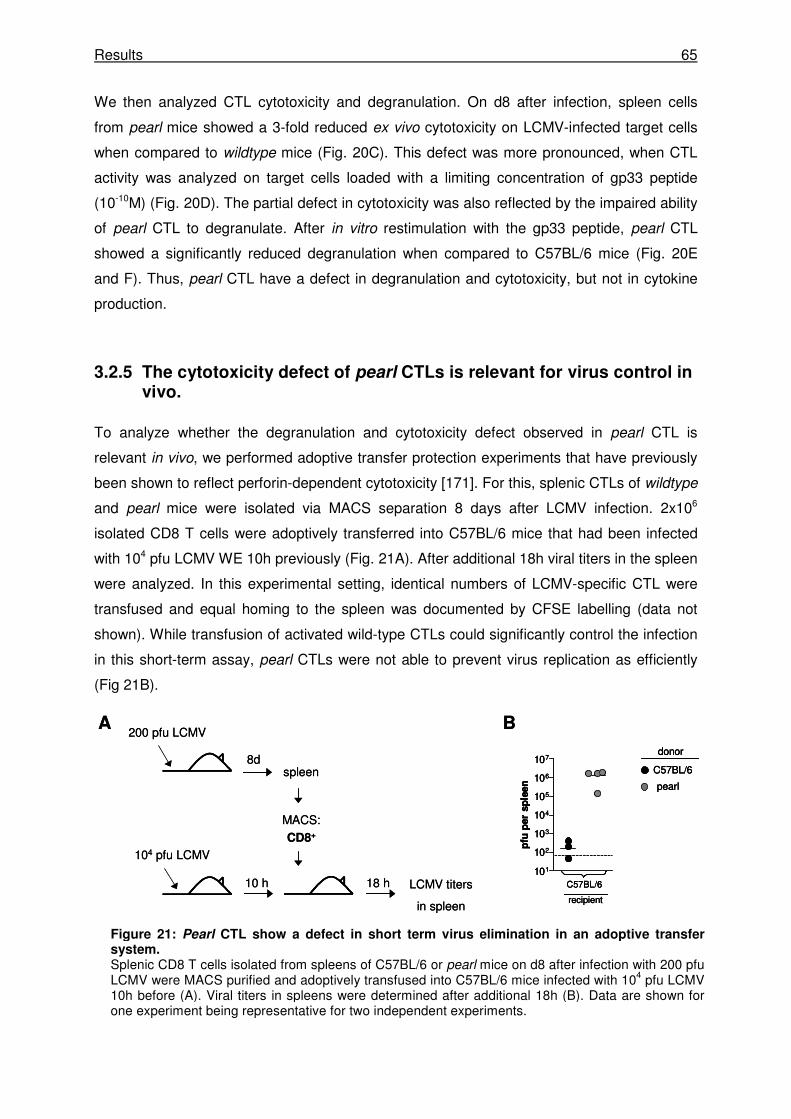
Results 65
We then analyzed CTL cytotoxicity and degranulation. On d8 after infection, spleen cells
from pearl mice showed a 3-fold reduced ex vivo cytotoxicity on LCMV-infected target cells
when compared to wildtype mice (Fig. 20C). This defect was more pronounced, when CTL
activity was analyzed on target cells loaded with a limiting concentration of gp33 peptide
(10-10M) (Fig. 20D). The partial defect in cytotoxicity was also reflected by the impaired ability
of pearl CTL to degranulate. After in vitro restimulation with the gp33 peptide, pearl CTL
showed a significantly reduced degranulation when compared to C57BL/6 mice (Fig. 20E
and F). Thus, pearl CTL have a defect in degranulation and cytotoxicity, but not in cytokine
production.
3.2.5 The cytotoxicity defect of pearl CTLs is relevant for virus control in vivo.
To analyze whether the degranulation and cytotoxicity defect observed in pearl CTL is
relevant in vivo, we performed adoptive transfer protection experiments that have previously
been shown to reflect perforin-dependent cytotoxicity [171]. For this, splenic CTLs of wildtype
and pearl mice were isolated via MACS separation 8 days after LCMV infection. 2x10⁶
isolated CD8 T cells were adoptively transferred into C57BL/6 mice that had been infected
with 104 pfu LCMV WE 10h previously (Fig. 21A). After additional 18h viral titers in the spleen
were analyzed. In this experimental setting, identical numbers of LCMV-specific CTL were
transfused and equal homing to the spleen was documented by CFSE labelling (data not
shown). While transfusion of activated wild-type CTLs could significantly control the infection
in this short-term assay, pearl CTLs were not able to prevent virus replication as efficiently
(Fig 21B).
C57BL/6
pearl
donor
101
102
103
104
105
106
107
pfu
per
sp
leen
C57BL/6
recipient
BA200 pfu LCMV
8dspleen
10 h
MACS:
CD8+
18 h LCMV titers
in spleen
104 pfu LCMV
C57BL/6
pearl
donor
C57BL/6
pearl
donor
101
102
103
104
105
106
107
pfu
per
sp
leen
C57BL/6
recipient
101
102
103
104
105
106
107
pfu
per
sp
leen
C57BL/6
recipient
BA200 pfu LCMV
8dspleen
10 h
MACS:
CD8+
18 h LCMV titers
in spleen
104 pfu LCMV
Figure 21: Pearl CTL show a defect in short term virus elimination in an adoptive transfer system. Splenic CD8 T cells isolated from spleens of C57BL/6 or pearl mice on d8 after infection with 200 pfu LCMV were MACS purified and adoptively transfused into C57BL/6 mice infected with 104 pfu LCMV 10h before (A). Viral titers in spleens were determined after additional 18h (B). Data are shown for one experiment being representative for two independent experiments.
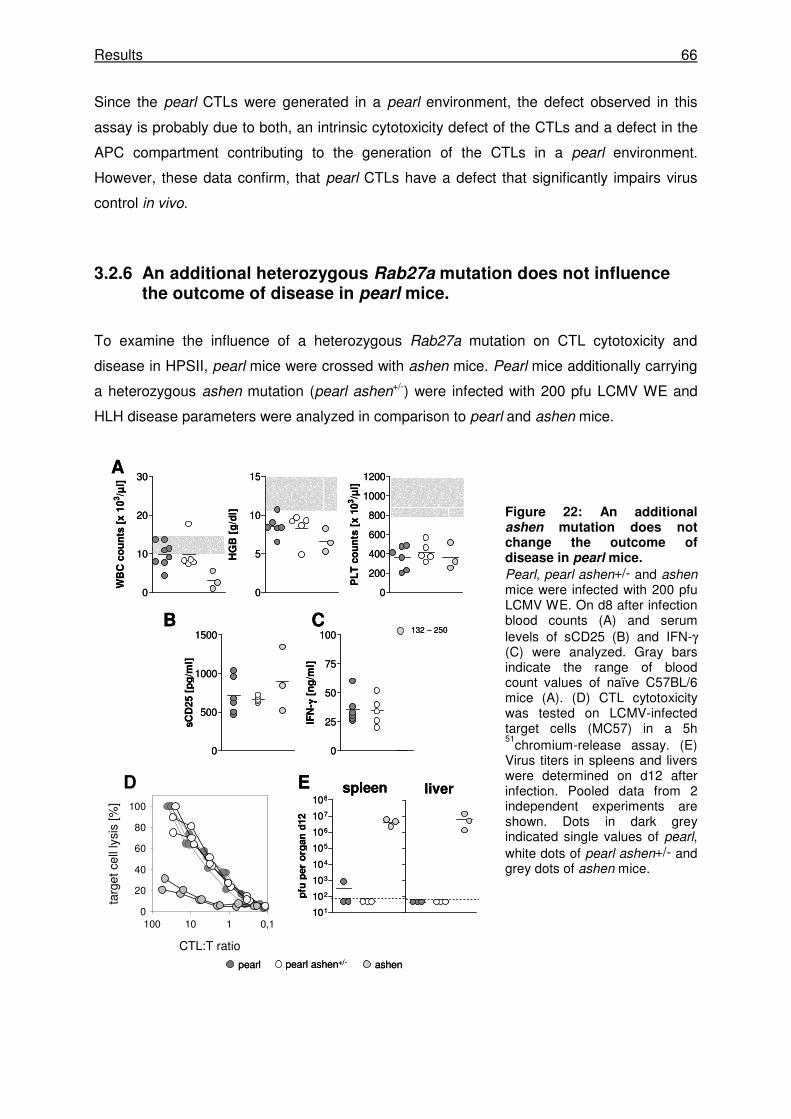
Results 66
Since the pearl CTLs were generated in a pearl environment, the defect observed in this
assay is probably due to both, an intrinsic cytotoxicity defect of the CTLs and a defect in the
APC compartment contributing to the generation of the CTLs in a pearl environment.
However, these data confirm, that pearl CTLs have a defect that significantly impairs virus
control in vivo.
3.2.6 An additional heterozygous Rab27a mutation does not influence the outcome of disease in pearl mice.
To examine the influence of a heterozygous Rab27a mutation on CTL cytotoxicity and
disease in HPSII, pearl mice were crossed with ashen mice. Pearl mice additionally carrying
a heterozygous ashen mutation (pearl ashen+/-) were infected with 200 pfu LCMV WE and
HLH disease parameters were analyzed in comparison to pearl and ashen mice.
Figure 22: An additional ashen mutation does not change the outcome of disease in pearl mice.
Pearl, pearl ashen+/- and ashen mice were infected with 200 pfu LCMV WE. On d8 after infection blood counts (A) and serum levels of sCD25 (B) and IFN-γ (C) were analyzed. Gray bars indicate the range of blood count values of naïve C57BL/6 mice (A). (D) CTL cytotoxicity was tested on LCMV-infected target cells (MC57) in a 5h 51
chromium-release assay. (E) Virus titers in spleens and livers were determined on d12 after infection. Pooled data from 2 independent experiments are shown. Dots in dark grey indicated single values of pearl, white dots of pearl ashen+/- and grey dots of ashen mice.
0
5
10
15
HG
B [
g/d
l]
0
10
20
30
WB
C c
ou
nts
[x
10
3/µ
l]
0
200
400
600
800
1000
1200
PL
T c
ou
nts
[x 1
03/µ
l]
0
25
50
75
100
IFN
- γγ γγ [
ng
/ml]
0
500
1000
1500
sC
D25 [
pg
/ml]
1
2
3
4
5
6
7
8
101
102
103
104
105
106
107
108
pfu
per
org
an
d12
spleen liver
A
CTL:T ratio
0,1110100
targ
et c
ell l
ysis
[%]
0
20
40
60
80
100
CB
D E
132 – 250
pearl ashenpearl ashen+/-
0
5
10
15
HG
B [
g/d
l]
0
10
20
30
WB
C c
ou
nts
[x
10
3/µ
l]
0
200
400
600
800
1000
1200
PL
T c
ou
nts
[x 1
03/µ
l]
0
25
50
75
100
IFN
- γγ γγ [
ng
/ml]
0
500
1000
1500
sC
D25 [
pg
/ml]
1
2
3
4
5
6
7
8
101
102
103
104
105
106
107
108
pfu
per
org
an
d12
spleen liver
A
CTL:T ratio
0,1110100
targ
et c
ell l
ysis
[%]
0
20
40
60
80
100
CB
D E
132 – 250
pearl ashenpearl ashen+/-
Results 67
While ashen mice displayed a significant persistent weight loss and decrease in ear
temperature, pearl ashen+/- mice showed no differences in body weight or temperature when
compared to pearl mice (data not shown). Analysis of blood counts on d8 after infection also
did not reveal any difference between pearl mice with and without the heterozygous ashen
mutation, while ashen mice displayed a more pronounced leukopenia and anemia than the
two other strains (Fig. 22A). As described, serum levels of IFN-γ and sCD25 were highly
elevated in ashen mice, while they were lower and similar in pearl ashen+/- and pearl mice
(Fig. 22B and C). The additional heterozygous ashen mutation did also not influence the CTL
cytotoxicity measured on LCMV-infected target cells whereas ashen mice showed a
dramatically reduced CTL cytotoxicity (Fig. 22D). This was also reflected in the virus load in
livers and spleens twelve days after LCMV infection. While pearl and pearl ashen+/- mice
were able to eliminate the virus until d12, ashen mice still showed high virus titers (Fig. 22E).
These data show that a heterozygous ashen mutation, that in homozygous form leads to a
significant reduction in cytotoxicity and virus control and predisposes to HLH, does not
influence the outcome of disease in pearl mice. Altogether this suggests that the pearl
mutation alone confers a certain risk for HLH which is not significantly increase by a
heterozygous Rab27a mutation. .
Results 68
3.3 Impact of viral and host parameters on the pathogenesis of hemophagocytic syndrome in beige mice - a mouse model of Chèdiak-Higashi Syndrome
Current pathogenetic concepts on HLH postulate that three major factors determine the
threshold for disease induction. First, even in the presence of a genetic predisposition, a
trigger is required to induce the disease, in most cases an infection. Thus, it is likely, that
changes in infection parameters such as the pathogen itself, but also the infection dose or
the replication behavior of the viral isolate can influence the disease threshold. Second, the
key cells mediating disease are CTLs and therefore a difference in CTL responsiveness
should influence the disease threshold. And third, different mutations in genes required for
cytotoxicity cause different degrees of impairment. This may have an impact on virus control
and on the disease threshold. To investigate the relative role of these parameters in the
pathogenesis of HLH, we analyzed two different mouse strains of Chèdiak-Higashi
syndrome. Initial experiments showed that C57BL/6J-Lystbg-J mice, hereafter referred to as
beige mice, show a partial cytotoxicity defect, but remain below the threshold of HLH
induction in the LCMV model. We therefore used this strain and the C57BL/6-Lystbg-Btlr strain,
referred to as souris mice, in order to study the role of different viral and host parameters in
HLH induction.
3.3.1 Beige mice carry a mutation in the WD40 domain of the Lyst protein.
The mutation in the Lyst gene of souris mice was described as a donor splice site mutation in
intron 27 with a T to A transversion. The mutation is predicted to cause skipping of exon 27,
thereby destroying the reading frame. This finally creates a premature stop codon that would
truncate the protein after amino acid 2482 (Fig. 23A and B).The exact mutation of the beige
mouse was not known when this study was initiated and therefore mutation analysis was
performed via primer walking using cDNA from beige and wildtype C57BL/6 mice (also
compared with NCBI Reference Sequence: NM_010748.2) and sequencing. Only the PCR
product using of primers fFR151 and rFR152 (Tab. II) revealed differences in the cDNA
sequence of beige and wildtype mice. Here, a deletion of 3 nucleotides was found leading to
an inframe deletion of one amino acid -isoleucin- at position 3741 in the WD40 domain (Fig
23A and C) [172]. This 3 nucleotide deletion was confirmed by sequencing of the appropriate
region on genomic DNA of beige mice. The WD40 domain is thought to mediate protein-
protein interactions that might be disturbed by this mutation.
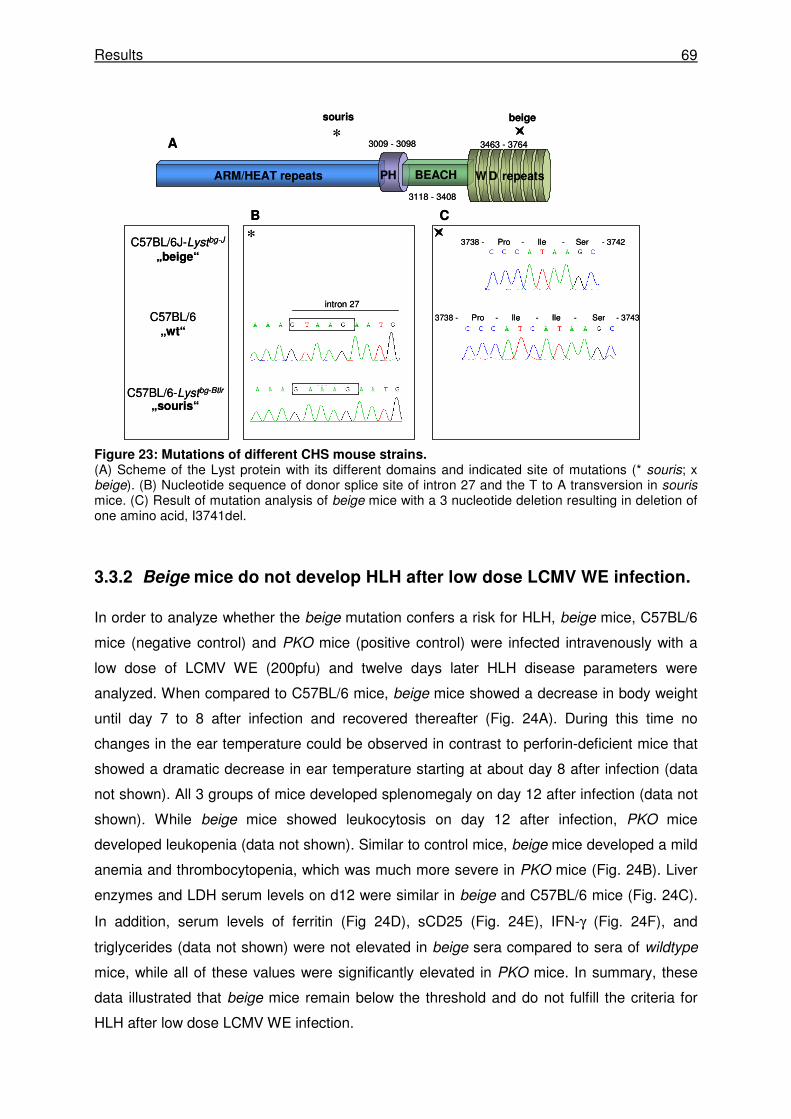
Results 69
Figure 23: Mutations of different CHS mouse strains. (A) Scheme of the Lyst protein with its different domains and indicated site of mutations (* souris; x beige). (B) Nucleotide sequence of donor splice site of intron 27 and the T to A transversion in souris mice. (C) Result of mutation analysis of beige mice with a 3 nucleotide deletion resulting in deletion of one amino acid, I3741del.
3.3.2 Beige mice do not develop HLH after low dose LCMV WE infection.
In order to analyze whether the beige mutation confers a risk for HLH, beige mice, C57BL/6
mice (negative control) and PKO mice (positive control) were infected intravenously with a
low dose of LCMV WE (200pfu) and twelve days later HLH disease parameters were
analyzed. When compared to C57BL/6 mice, beige mice showed a decrease in body weight
until day 7 to 8 after infection and recovered thereafter (Fig. 24A). During this time no
changes in the ear temperature could be observed in contrast to perforin-deficient mice that
showed a dramatic decrease in ear temperature starting at about day 8 after infection (data
not shown). All 3 groups of mice developed splenomegaly on day 12 after infection (data not
shown). While beige mice showed leukocytosis on day 12 after infection, PKO mice
developed leukopenia (data not shown). Similar to control mice, beige mice developed a mild
anemia and thrombocytopenia, which was much more severe in PKO mice (Fig. 24B). Liver
enzymes and LDH serum levels on d12 were similar in beige and C57BL/6 mice (Fig. 24C).
In addition, serum levels of ferritin (Fig 24D), sCD25 (Fig. 24E), IFN-γ (Fig. 24F), and
triglycerides (data not shown) were not elevated in beige sera compared to sera of wildtype
mice, while all of these values were significantly elevated in PKO mice. In summary, these
data illustrated that beige mice remain below the threshold and do not fulfill the criteria for
HLH after low dose LCMV WE infection.
ARM/HEAT repeats BEACHPH
3738 - Pro - Ile - Ile - Ser - 3743C57BL/6„wt“
C57BL/6J-Lystbg-J
„beige“
3738 - Pro - Ile - Ser - 3742
3009 - 3098
3118 - 3408
3463 - 3764
W D repeats
beige
*
souris
intron 27
*
A
B C
C57BL/6-Lystbg-Btlr
„souris“
ARM/HEAT repeats BEACHPH
3738 - Pro - Ile - Ile - Ser - 3743C57BL/6„wt“
C57BL/6J-Lystbg-J
„beige“
3738 - Pro - Ile - Ser - 3742
3009 - 3098
3118 - 3408
3463 - 3764
W D repeats
beige
*
souris
intron 27
*
A
B C
C57BL/6-Lystbg-Btlr
„souris“
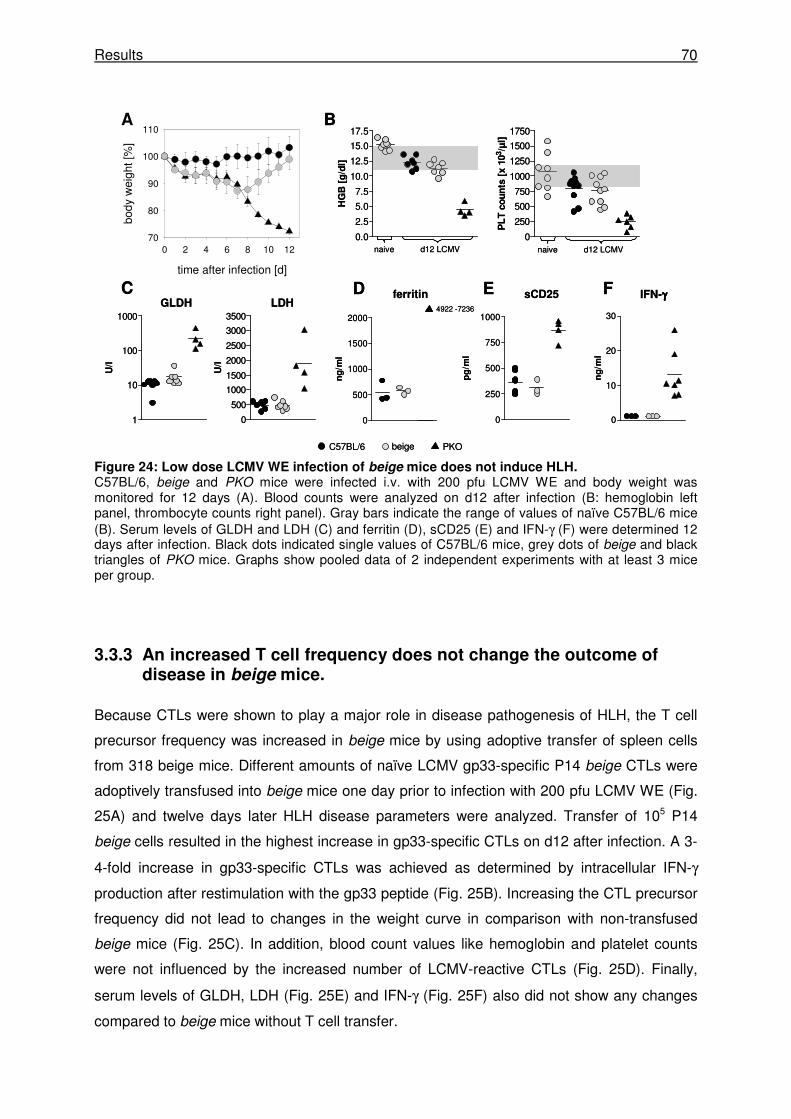
Results 70
Figure 24: Low dose LCMV WE infection of beige mice does not induce HLH. C57BL/6, beige and PKO mice were infected i.v. with 200 pfu LCMV WE and body weight was monitored for 12 days (A). Blood counts were analyzed on d12 after infection (B: hemoglobin left panel, thrombocyte counts right panel). Gray bars indicate the range of values of naïve C57BL/6 mice (B). Serum levels of GLDH and LDH (C) and ferritin (D), sCD25 (E) and IFN-γ (F) were determined 12 days after infection. Black dots indicated single values of C57BL/6 mice, grey dots of beige and black triangles of PKO mice. Graphs show pooled data of 2 independent experiments with at least 3 mice per group.
3.3.3 An increased T cell frequency does not change the outcome of disease in beige mice.
Because CTLs were shown to play a major role in disease pathogenesis of HLH, the T cell
precursor frequency was increased in beige mice by using adoptive transfer of spleen cells
from 318 beige mice. Different amounts of naïve LCMV gp33-specific P14 beige CTLs were
adoptively transfused into beige mice one day prior to infection with 200 pfu LCMV WE (Fig.
25A) and twelve days later HLH disease parameters were analyzed. Transfer of 105 P14
beige cells resulted in the highest increase in gp33-specific CTLs on d12 after infection. A 3-
4-fold increase in gp33-specific CTLs was achieved as determined by intracellular IFN-γ
production after restimulation with the gp33 peptide (Fig. 25B). Increasing the CTL precursor
frequency did not lead to changes in the weight curve in comparison with non-transfused
beige mice (Fig. 25C). In addition, blood count values like hemoglobin and platelet counts
were not influenced by the increased number of LCMV-reactive CTLs (Fig. 25D). Finally,
serum levels of GLDH, LDH (Fig. 25E) and IFN-γ (Fig. 25F) also did not show any changes
compared to beige mice without T cell transfer.
time after infection [d]
0 2 4 6 8 10 12
body
wei
ght [
%]
70
80
90
100
110
0.0
2.5
5.0
7.5
10.0
12.5
15.0
17.5
HG
B [
g/d
l]
0
250
500
750
1000
1250
1500
1750
PL
T c
ou
nts
[x 1
03/µ
l]
naive d12 LCMV naive d12 LCMV
A B
CGLDH LDH
1
10
100
1000
U/l
0
500
1000
1500
2000
2500
3000
3500
U/l
ferritin
0
250
500
750
1000
pg
/ml
sCD25
0
10
20
30
ng
/ml
IFN-γγγγ
0
500
1000
1500
2000
ng
/ml
4922 -7236
D E F
C57BL/6 PKObeige
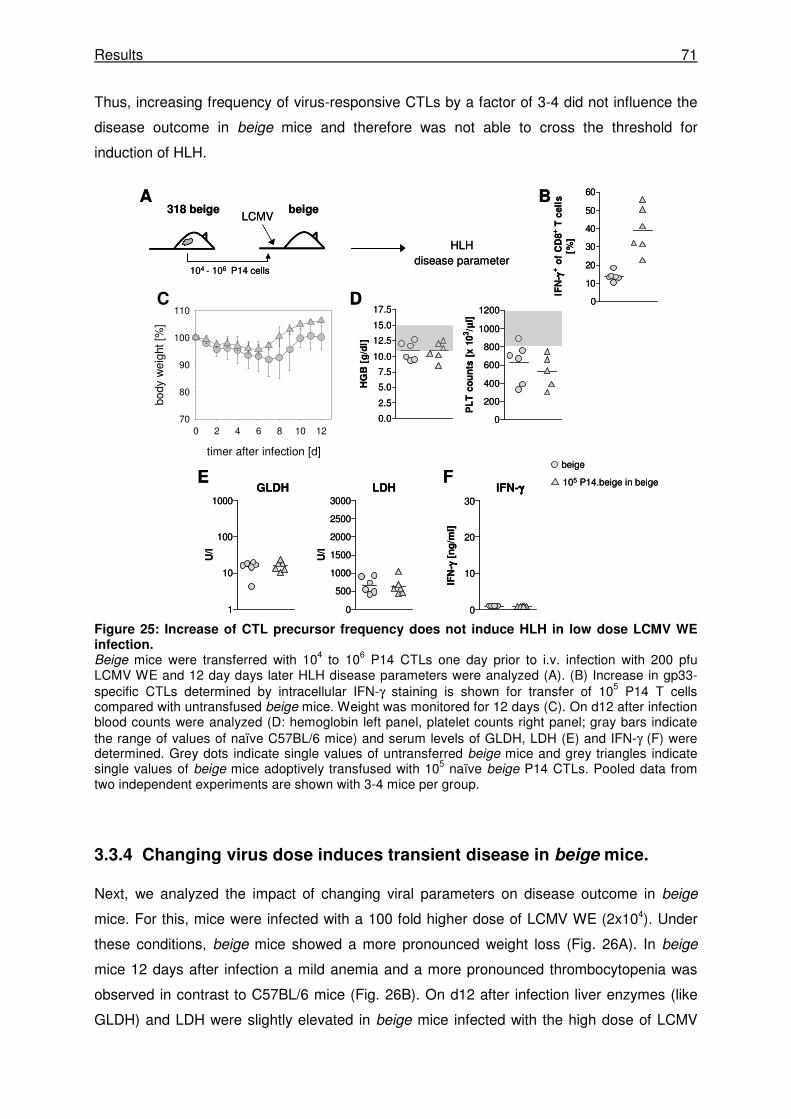
Results 71
Thus, increasing frequency of virus-responsive CTLs by a factor of 3-4 did not influence the
disease outcome in beige mice and therefore was not able to cross the threshold for
induction of HLH.
Figure 25: Increase of CTL precursor frequency does not induce HLH in low dose LCMV WE infection. Beige mice were transferred with 104 to 106 P14 CTLs one day prior to i.v. infection with 200 pfu LCMV WE and 12 day days later HLH disease parameters were analyzed (A). (B) Increase in gp33-specific CTLs determined by intracellular IFN-γ staining is shown for transfer of 105 P14 T cells compared with untransfused beige mice. Weight was monitored for 12 days (C). On d12 after infection blood counts were analyzed (D: hemoglobin left panel, platelet counts right panel; gray bars indicate the range of values of naïve C57BL/6 mice) and serum levels of GLDH, LDH (E) and IFN-γ (F) were determined. Grey dots indicate single values of untransferred beige mice and grey triangles indicate single values of beige mice adoptively transfused with 105 naïve beige P14 CTLs. Pooled data from two independent experiments are shown with 3-4 mice per group.
3.3.4 Changing virus dose induces transient disease in beige mice.
Next, we analyzed the impact of changing viral parameters on disease outcome in beige
mice. For this, mice were infected with a 100 fold higher dose of LCMV WE (2x10⁴). Under
these conditions, beige mice showed a more pronounced weight loss (Fig. 26A). In beige
mice 12 days after infection a mild anemia and a more pronounced thrombocytopenia was
observed in contrast to C57BL/6 mice (Fig. 26B). On d12 after infection liver enzymes (like
GLDH) and LDH were slightly elevated in beige mice infected with the high dose of LCMV
0.0
2.5
5.0
7.5
10.0
12.5
15.0
17.5
HG
B [
g/d
l]
0
200
400
600
800
1000
1200
PL
T c
ou
nts
[x 1
03/µ
l]
0
10
20
30
40
50
60
IFN
- γγ γγ+ o
f C
D8
+ T
cell
s[%
]
D
A B
E 105 P14.beige in beige
beige
318 beige
HLH disease parameter
beigeLCMV
0
500
1000
1500
2000
2500
3000
U/l
1
10
100
1000
U/l
0
10
20
30
IFN
- γγ γγ [
ng
/ml]
F
timer after infection [d]
0 2 4 6 8 10 12
body
wei
ght
[%]
70
80
90
100
110C
GLDH LDH IFN-γγγγ
104 - 106 P14 cells
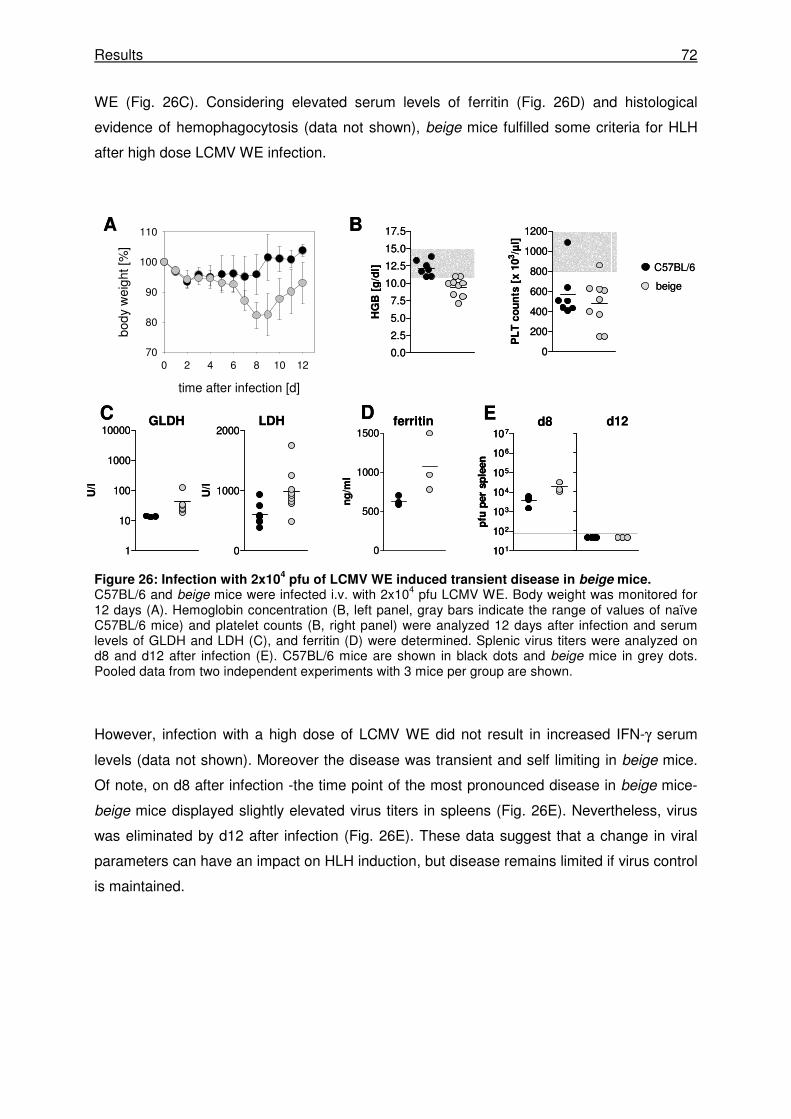
Results 72
WE (Fig. 26C). Considering elevated serum levels of ferritin (Fig. 26D) and histological
evidence of hemophagocytosis (data not shown), beige mice fulfilled some criteria for HLH
after high dose LCMV WE infection.
Figure 26: Infection with 2x10⁴ pfu of LCMV WE induced transient disease in beige mice.
C57BL/6 and beige mice were infected i.v. with 2x10⁴ pfu LCMV WE. Body weight was monitored for 12 days (A). Hemoglobin concentration (B, left panel, gray bars indicate the range of values of naïve C57BL/6 mice) and platelet counts (B, right panel) were analyzed 12 days after infection and serum levels of GLDH and LDH (C), and ferritin (D) were determined. Splenic virus titers were analyzed on d8 and d12 after infection (E). C57BL/6 mice are shown in black dots and beige mice in grey dots. Pooled data from two independent experiments with 3 mice per group are shown.
However, infection with a high dose of LCMV WE did not result in increased IFN-γ serum
levels (data not shown). Moreover the disease was transient and self limiting in beige mice.
Of note, on d8 after infection -the time point of the most pronounced disease in beige mice-
beige mice displayed slightly elevated virus titers in spleens (Fig. 26E). Nevertheless, virus
was eliminated by d12 after infection (Fig. 26E). These data suggest that a change in viral
parameters can have an impact on HLH induction, but disease remains limited if virus control
is maintained.
101
102
103
104
105
106
107
pfu
per
sp
leen
GLDH LDH
B
C D
C57BL/6
beige
0.0
2.5
5.0
7.5
10.0
12.5
15.0
17.5
HG
B [
g/d
l]
0
200
400
600
800
1000
1200
PL
T c
ou
nts
[x 1
03/µ
l]
time after infection [d]
0 2 4 6 8 10 12
body
wei
ght [
%]
70
80
90
100
110A
0
500
1000
1500
ng
/ml
ferritin Ed8
0
1000
2000
U/l
1
10
100
1000
10000
U/l
d12
101
102
103
104
105
106
107
pfu
per
sp
leen
101
102
103
104
105
106
107
pfu
per
sp
leen
GLDH LDH
B
C D
C57BL/6
beige
0.0
2.5
5.0
7.5
10.0
12.5
15.0
17.5
HG
B [
g/d
l]
0
200
400
600
800
1000
1200
PL
T c
ou
nts
[x 1
03/µ
l]
time after infection [d]
0 2 4 6 8 10 12
body
wei
ght [
%]
70
80
90
100
110A
0
500
1000
1500
ng
/ml
ferritin Ed8
0
1000
2000
U/l
1
10
100
1000
10000
U/l
d12
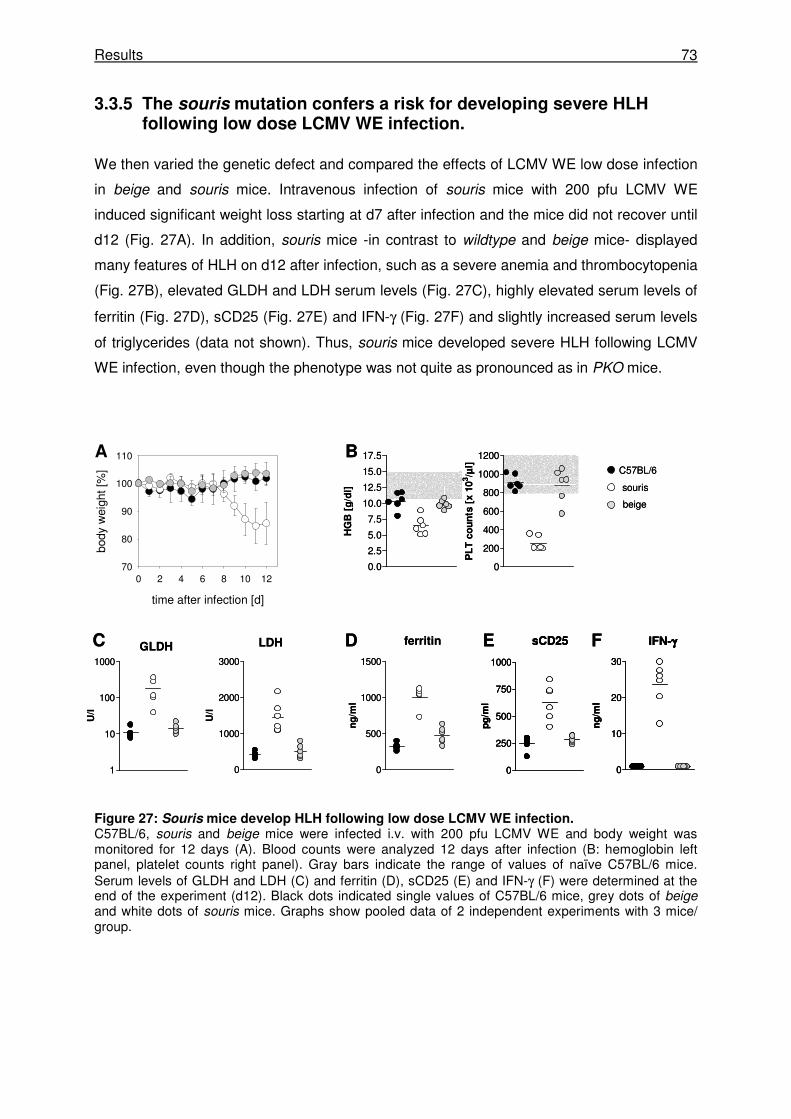
Results 73
3.3.5 The souris mutation confers a risk for developing severe HLH following low dose LCMV WE infection.
We then varied the genetic defect and compared the effects of LCMV WE low dose infection
in beige and souris mice. Intravenous infection of souris mice with 200 pfu LCMV WE
induced significant weight loss starting at d7 after infection and the mice did not recover until
d12 (Fig. 27A). In addition, souris mice -in contrast to wildtype and beige mice- displayed
many features of HLH on d12 after infection, such as a severe anemia and thrombocytopenia
(Fig. 27B), elevated GLDH and LDH serum levels (Fig. 27C), highly elevated serum levels of
ferritin (Fig. 27D), sCD25 (Fig. 27E) and IFN-γ (Fig. 27F) and slightly increased serum levels
of triglycerides (data not shown). Thus, souris mice developed severe HLH following LCMV
WE infection, even though the phenotype was not quite as pronounced as in PKO mice.
Figure 27: Souris mice develop HLH following low dose LCMV WE infection. C57BL/6, souris and beige mice were infected i.v. with 200 pfu LCMV WE and body weight was monitored for 12 days (A). Blood counts were analyzed 12 days after infection (B: hemoglobin left panel, platelet counts right panel). Gray bars indicate the range of values of naïve C57BL/6 mice. Serum levels of GLDH and LDH (C) and ferritin (D), sCD25 (E) and IFN-γ (F) were determined at the end of the experiment (d12). Black dots indicated single values of C57BL/6 mice, grey dots of beige and white dots of souris mice. Graphs show pooled data of 2 independent experiments with 3 mice/ group.
0.0
2.5
5.0
7.5
10.0
12.5
15.0
17.5
HG
B [
g/d
l]
0
200
400
600
800
1000
1200P
LT
co
un
ts [
x 1
03/µ
l]
0
500
1000
1500
ng
/ml
B
FD EC ferritin
0
250
500
750
1000
pg
/ml
sCD25
0
10
20
30
ng
/ml
IFN-γγγγ
1
10
100
1000
U/l
0
1000
2000
3000
U/l
GLDH LDH
time after infection [d]
0 2 4 6 8 10 12
body
wei
ght [
%]
70
80
90
100
110A
souris
beige
C57BL/6
0.0
2.5
5.0
7.5
10.0
12.5
15.0
17.5
HG
B [
g/d
l]
0
200
400
600
800
1000
1200P
LT
co
un
ts [
x 1
03/µ
l]
0
500
1000
1500
ng
/ml
B
FD EC ferritin
0
250
500
750
1000
pg
/ml
sCD25
0
250
500
750
1000
pg
/ml
sCD25
0
10
20
30
ng
/ml
IFN-γγγγ
0
10
20
30
ng
/ml
IFN-γγγγ
1
10
100
1000
U/l
0
1000
2000
3000
U/l
GLDH LDH
time after infection [d]
0 2 4 6 8 10 12
body
wei
ght [
%]
70
80
90
100
110A
souris
beige
C57BL/6
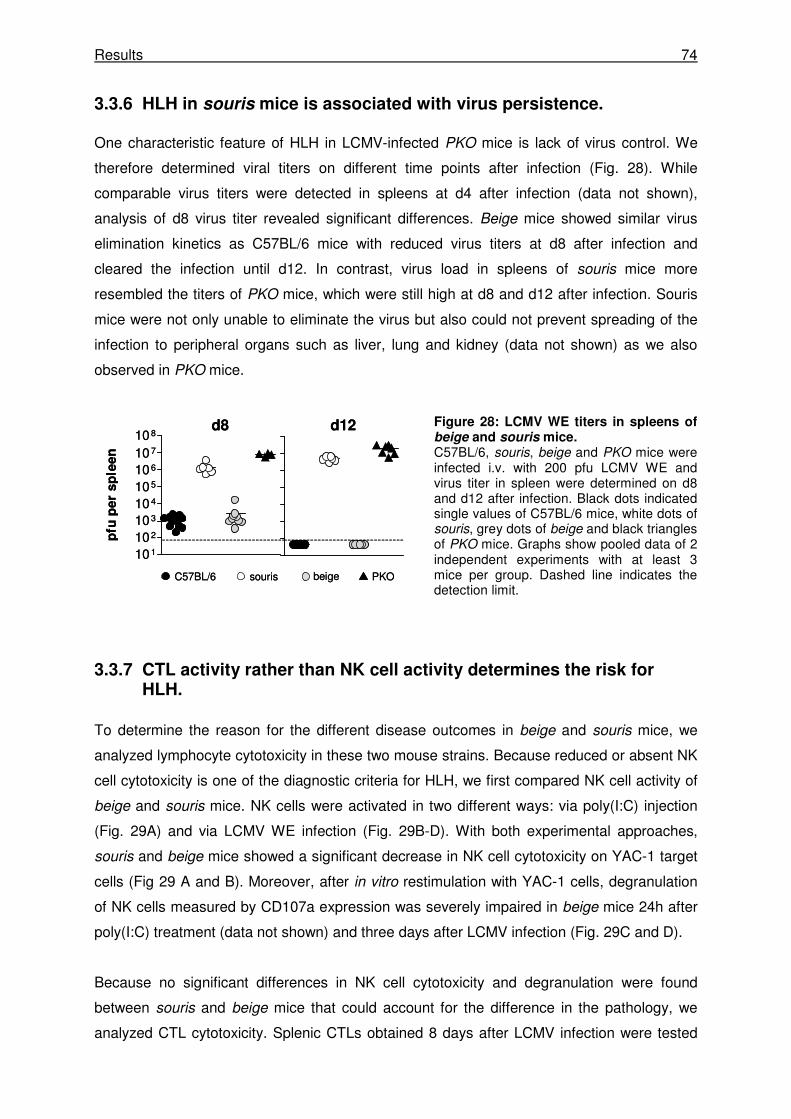
Results 74
3.3.6 HLH in souris mice is associated with virus persistence.
One characteristic feature of HLH in LCMV-infected PKO mice is lack of virus control. We
therefore determined viral titers on different time points after infection (Fig. 28). While
comparable virus titers were detected in spleens at d4 after infection (data not shown),
analysis of d8 virus titer revealed significant differences. Beige mice showed similar virus
elimination kinetics as C57BL/6 mice with reduced virus titers at d8 after infection and
cleared the infection until d12. In contrast, virus load in spleens of souris mice more
resembled the titers of PKO mice, which were still high at d8 and d12 after infection. Souris
mice were not only unable to eliminate the virus but also could not prevent spreading of the
infection to peripheral organs such as liver, lung and kidney (data not shown) as we also
observed in PKO mice.
Figure 28: LCMV WE titers in spleens of beige and souris mice. C57BL/6, souris, beige and PKO mice were infected i.v. with 200 pfu LCMV WE and virus titer in spleen were determined on d8 and d12 after infection. Black dots indicated single values of C57BL/6 mice, white dots of souris, grey dots of beige and black triangles of PKO mice. Graphs show pooled data of 2 independent experiments with at least 3 mice per group. Dashed line indicates the detection limit.
3.3.7 CTL activity rather than NK cell activity determines the risk for HLH.
To determine the reason for the different disease outcomes in beige and souris mice, we
analyzed lymphocyte cytotoxicity in these two mouse strains. Because reduced or absent NK
cell cytotoxicity is one of the diagnostic criteria for HLH, we first compared NK cell activity of
beige and souris mice. NK cells were activated in two different ways: via poly(I:C) injection
(Fig. 29A) and via LCMV WE infection (Fig. 29B-D). With both experimental approaches,
souris and beige mice showed a significant decrease in NK cell cytotoxicity on YAC-1 target
cells (Fig 29 A and B). Moreover, after in vitro restimulation with YAC-1 cells, degranulation
of NK cells measured by CD107a expression was severely impaired in beige mice 24h after
poly(I:C) treatment (data not shown) and three days after LCMV infection (Fig. 29C and D).
Because no significant differences in NK cell cytotoxicity and degranulation were found
between souris and beige mice that could account for the difference in the pathology, we
analyzed CTL cytotoxicity. Splenic CTLs obtained 8 days after LCMV infection were tested
d8 d12
souris PKObeigeC57BL/6
101
102
103
104
105
106
107
108
pfu
pe
r s
ple
en
d8 d12
souris PKObeigeC57BL/6
101
102
103
104
105
106
107
108
pfu
pe
r s
ple
en
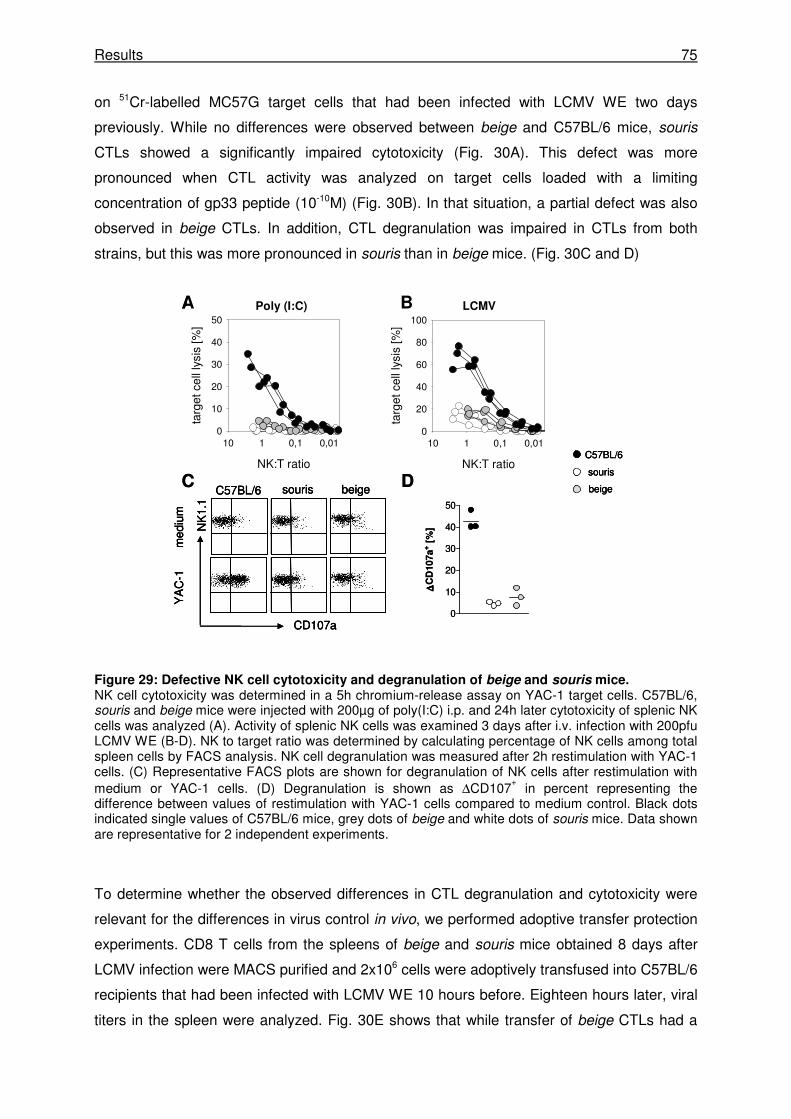
Results 75
on 51Cr-labelled MC57G target cells that had been infected with LCMV WE two days
previously. While no differences were observed between beige and C57BL/6 mice, souris
CTLs showed a significantly impaired cytotoxicity (Fig. 30A). This defect was more
pronounced when CTL activity was analyzed on target cells loaded with a limiting
concentration of gp33 peptide (10-10M) (Fig. 30B). In that situation, a partial defect was also
observed in beige CTLs. In addition, CTL degranulation was impaired in CTLs from both
strains, but this was more pronounced in souris than in beige mice. (Fig. 30C and D)
Figure 29: Defective NK cell cytotoxicity and degranulation of beige and souris mice. NK cell cytotoxicity was determined in a 5h chromium-release assay on YAC-1 target cells. C57BL/6, souris and beige mice were injected with 200µg of poly(I:C) i.p. and 24h later cytotoxicity of splenic NK cells was analyzed (A). Activity of splenic NK cells was examined 3 days after i.v. infection with 200pfu LCMV WE (B-D). NK to target ratio was determined by calculating percentage of NK cells among total spleen cells by FACS analysis. NK cell degranulation was measured after 2h restimulation with YAC-1 cells. (C) Representative FACS plots are shown for degranulation of NK cells after restimulation with medium or YAC-1 cells. (D) Degranulation is shown as ∆CD107
+ in percent representing the
difference between values of restimulation with YAC-1 cells compared to medium control. Black dots indicated single values of C57BL/6 mice, grey dots of beige and white dots of souris mice. Data shown are representative for 2 independent experiments.
To determine whether the observed differences in CTL degranulation and cytotoxicity were
relevant for the differences in virus control in vivo, we performed adoptive transfer protection
experiments. CD8 T cells from the spleens of beige and souris mice obtained 8 days after
LCMV infection were MACS purified and 2x10⁶ cells were adoptively transfused into C57BL/6
recipients that had been infected with LCMV WE 10 hours before. Eighteen hours later, viral
titers in the spleen were analyzed. Fig. 30E shows that while transfer of beige CTLs had a
NK:T ratio
0,010,1110
targ
et c
ell l
ysis
[%]
0
10
20
30
40
50
NK:T ratio
0,010,1110
targ
et c
ell l
ysis
[%]
0
20
40
60
80
100LCMVPoly (I:C)A B
C D
0
10
20
30
40
50
∆∆ ∆∆C
D107a
+ [
%]
CD107a
NK
1.1
C57BL/6 souris
med
ium
YA
C-1
beige
souris
beige
C57BL/6NK:T ratio
0,010,1110
targ
et c
ell l
ysis
[%]
0
10
20
30
40
50
NK:T ratio
0,010,1110
targ
et c
ell l
ysis
[%]
0
20
40
60
80
100LCMVPoly (I:C)A B
C D
0
10
20
30
40
50
∆∆ ∆∆C
D107a
+ [
%]
CD107a
NK
1.1
C57BL/6 souris
med
ium
YA
C-1
beige
CD107a
NK
1.1
C57BL/6 souris
med
ium
YA
C-1
beige
souris
beige
C57BL/6
souris
beige
C57BL/6
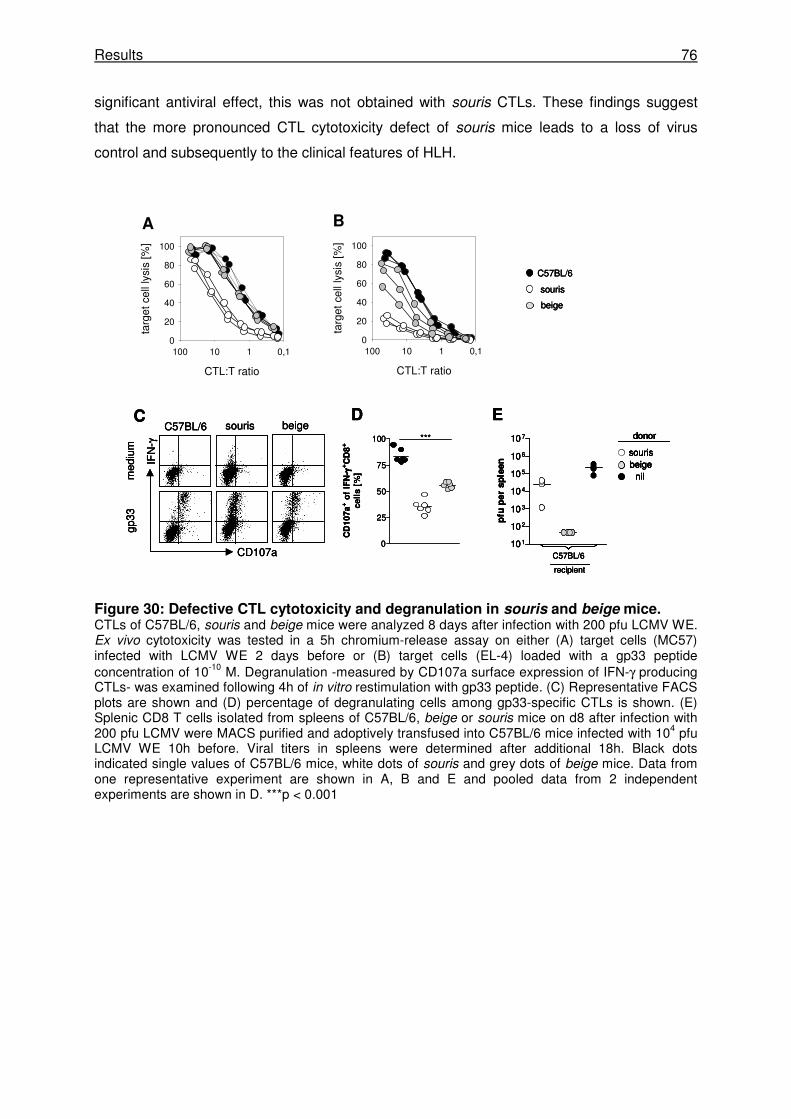
Results 76
significant antiviral effect, this was not obtained with souris CTLs. These findings suggest
that the more pronounced CTL cytotoxicity defect of souris mice leads to a loss of virus
control and subsequently to the clinical features of HLH.
Figure 30: Defective CTL cytotoxicity and degranulation in souris and beige mice. CTLs of C57BL/6, souris and beige mice were analyzed 8 days after infection with 200 pfu LCMV WE. Ex vivo cytotoxicity was tested in a 5h chromium-release assay on either (A) target cells (MC57) infected with LCMV WE 2 days before or (B) target cells (EL-4) loaded with a gp33 peptide concentration of 10-10 M. Degranulation -measured by CD107a surface expression of IFN-γ producing CTLs- was examined following 4h of in vitro restimulation with gp33 peptide. (C) Representative FACS plots are shown and (D) percentage of degranulating cells among gp33-specific CTLs is shown. (E) Splenic CD8 T cells isolated from spleens of C57BL/6, beige or souris mice on d8 after infection with 200 pfu LCMV were MACS purified and adoptively transfused into C57BL/6 mice infected with 104 pfu LCMV WE 10h before. Viral titers in spleens were determined after additional 18h. Black dots indicated single values of C57BL/6 mice, white dots of souris and grey dots of beige mice. Data from one representative experiment are shown in A, B and E and pooled data from 2 independent experiments are shown in D. ***p < 0.001
0
25
50
75
100
CD
10
7a
+ o
f IF
N- γγ γγ
+C
D8
+
ce
lls
[%
]
CTL:T ratio
0,1110100
targ
et c
ell l
ysis
[%]
0
20
40
60
80
100
D
CD107a
IFN
-γ
C57BL/6 souris
med
ium
gp33
Cbeige
CTL:T ratio
0,1110100
targ
et c
ell l
ysis
[%]
0
20
40
60
80
100
BA
***
E
101
102
103
104
105
106
107
pfu
per
sp
leen
C57BL/6
recipient
sourisbeige
donor
nil
souris
beige
C57BL/6
0
25
50
75
100
CD
10
7a
+ o
f IF
N- γγ γγ
+C
D8
+
ce
lls
[%
]
CTL:T ratio
0,1110100
targ
et c
ell l
ysis
[%
]0
20
40
60
80
100
D
CD107a
IFN
-γ
C57BL/6 souris
med
ium
gp33
Cbeige
CTL:T ratio
0,1110100
targ
et c
ell l
ysis
[%]
0
20
40
60
80
100
BA
***
E
101
102
103
104
105
106
107
pfu
per
sp
leen
C57BL/6
recipient
sourisbeige
donor
nil
0
25
50
75
100
CD
10
7a
+ o
f IF
N- γγ γγ
+C
D8
+
ce
lls
[%
]
CTL:T ratio
0,1110100
targ
et c
ell l
ysis
[%
]0
20
40
60
80
100
D
CD107a
IFN
-γ
C57BL/6 souris
med
ium
gp33
Cbeige
CTL:T ratio
0,1110100
targ
et c
ell l
ysis
[%]
0
20
40
60
80
100
BA
***
E
101
102
103
104
105
106
107
pfu
per
sp
leen
C57BL/6
recipient
sourisbeige
donor
nil
101
102
103
104
105
106
107
pfu
per
sp
leen
C57BL/6
recipient
sourisbeige
donor
nil
sourisbeige
donor
nil
souris
beige
C57BL/6
souris
beige
C57BL/6
Discussion 77
4 Discussion
This study used two different experimental models to show that genetically determined
subtle differences in the efficacy of the antiviral T cell response and their impact on the
kinetic of virus and APC elimination can determine the outcome of a viral infection.
4.1 Disease susceptibility after RSV infection is favored by a highly focused, low avidity, MHC-dependent CTL response
Our experiments in the mouse model of RSV infection showed that the MHC-dependent
determination of the antiviral CTL repertoire can contribute to disease severity after a
respiratory viral infection. Starting from the observation that RSV-induced weight loss and the
pulmonary inflammatory response is more pronounced in BALB/c (H-2d) versus C57BL/6 (H-
2b) mice, the current study analyzed the contribution of the MHC and therefore the CTL
response to the differences in disease susceptibility.
The critical contribution of the MHC to disease susceptibility (mainly assessed by weight
loss) was determined in MHC congenic mice. The disease observed in BALB/c mice was in
part transferred with the H-2d allele on the C57BL/6 background. In contrast, C57BL/6 mice
carrying both MHC haplotypes -H-2d and H-2b- were found to be less susceptible to disease,
indicating that the H-2b haplotype confers resistance to RSV-induced disease. Disease
observed in BALB/c mice was accompanied by increased levels of IFN-γ, IL-6 and MCP-1
levels in the BAL fluids. While IFN-γ was shown before to play a critical role in mediating
immunopathology in the mouse model [173], serum level of IL-6 was described as a marker
for severity in patients with lower respiratory tract infections caused by RSV [174, 175]. The
absence of IL-10 was recently correlated with an increased protection against influenza
infection [176]. IL-10 levels in the BAL fluids of RSV infected mice were low and comparable
in all groups (data not shown), rendering a significant contribution of IL-10 to disease unlikely
in this model.
Because RSV replicates to higher titers in BALB/c mice compared with C57BL/6 mice [20,
41, 42], we analyzed peak virus titers and virus elimination kinetics as causes for RSV-
induced pathology. While BALB/c mice exhibited higher virus titers than C57BL/6 mice at the
peak of replication at day 4 after infection, the pulmonary virus load of C57BL/6-H-2d mice
was comparable to C57BL/6 mice, suggesting that peak virus titers were not the only
determinant of disease. Furthermore all groups showed similar virus elimination kinetics.
T cells -especially CD8 T cells- were shown to be the main mediators of immunopathology in
BALB/c mice [18, 177]. However, differences in MHC will not only lead to differences in the
CTL response, but also in the T helper cell response. We therefore also addressed the
Discussion 78
contribution of CD4 T cells to disease development. Overall CD4+ T cell numbers recruited to
the lung were similar in all strains. Recently, regulatory T cells were shown to promote an
early pulmonary CD8 T cell influx and therefore to limit immunopathology following RSV
infection [178, 179]. In our experiments, we could not detect a difference in Treg numbers in
the lungs of BALB/c and C57BL/6 mice (data not shown). In influenza infection a critical role
for IL-17 and IL-17RA in disease development was observed [180] and CD8+ IL-17 producing
T cells -Tc17 cells- were described to protect against a lethal influenza infection [181]. In our
RSV model, we found comparable amounts of pulmonary IL-17-producing CD4 and CD8 T
cells (data not shown) in BALB/c and C57BL/6 mice, rendering a key role for IL-17 in RSV-
induced pathology unlikely.
We then analyzed the RSV-specific CTL response in H-2d versus H-2b mice on the same
C57BL/6 background in order to address the question, whether differences in the CTL
response could account for the differences in disease susceptibility. No significant
differences in numbers of total CD8 T cells (data not shown) and in the RSV-specific CTL
responses were observed. However, analysis of the immunodominant CTL populations
revealed several differences in H-2d versus H-2b mice. Among RSV-specific CTLs in BALB/c
mice, there was a particular dominance of M2-1 82-specific cells, showing a Vβ usage that
was strongly skewed to Vβ8.2. Analysis of C57BL/6 mice also revealed an oligoclonal CTL
response to RSV, but it was less pronounced. The dominant M187-specific population
represented a smaller part of the total RSV-specific response and the Vβ usage of these
cells was more variable. In particular, while about 80% of the total RSV-specific CTLs were
M2-1 82-specific, Vβ8.2+ T cells in BALB/c mice, about 30% of the total RSV-specific CTLs
were Vβ9+ T cells specific for M187. The immunodominant CTL population carrying the
Vβ8.2 chain was responsible for the RSV-induced disease in H-2d mice as shown in two
different experimental setups. First, infection with a mutant virus carrying a loss-of-
recognition mutation in the immunodominant epitope failed to induce pathology in C57BL/6-
H-2d mice as it was shown before for BALB/c mice [157]. Second, deletion of the Vβ8.2+ CTL
population also resulted in a markedly reduced pathology in BALB/c mice.
These observations suggest that the dominant M2-1 82-specific Vβ8.2+ CTL population
makes a major contribution to disease in H-2d mice. It is not completely clear, how this T cell
population contributes to disease and what makes it different from the M187-specific CTL
response. Interestingly, the ability to lyse target cells at lower, more physiological peptide
concentrations was reduced in M2-1 82-specific CTLs compared to M187-specific CTLs.
These data indicate a lower avidity of the TCR specific for the M2-1 82-H-2d complex
compared to the TCR specific for the M187-H-2b complex, leading to the following
hypothesis:
Discussion 79
The less efficient target cell lysis may result in a prolonged stimulation of CTLs via APCs as it
was shown for LCMV-infected PKO mice [49]. As it will be discussed in the following
chapters, this reduced efficiency in target cell lysis does not necessarily impair virus
clearance. This is also illustrated by the fact, that BALB/c mice can eliminate RSV infection
despite the lack of the immunodominant CTL population (comprising about 80% of the total
RSV-specific CTL response), although virus clearance was slightly delayed [157]. Inefficient
target cell lysis can contribute to disease e.g. a prolonged stimulation of virus-specific CTLs
by their APCs with subsequent inflammatory cytokine production, in particular IFN-γ, and
disease [49, 173]. This concept is also well illustrated by a disease called hemophagocytic
lymphohistiocytosis (HLH) that will be further discussed in the next chapter.
In how far this study has implications for human RSV infection, remains to be determined as
infection of mice with high doses of a non species-conform pathogen may not mirror the
human disease. Murine RSV infection may thus rather represent a model situation, in which
easily accessible parameters –such as weight loss and the increase in pulmonary cytokines–
reflecting some pathological consequences of a respiratory viral infection can be monitored
under controlled conditions rather than an optimal model for a human disease.
4.2 HLH in mouse models for Hermansky-Pudlak syndrome type II and the Chèdiak-Higashi syndrome
In the second part of the study, we analyzed two mouse models of partially impaired
cytotoxicity with two different genetic diseases predisposing to HLH: the Hermansky-Pudlak
syndrome type II and the Chèdiak-Higashi syndrome. Mice were tested for developing
hemophagocytic lymphohistiocytosis following LCMV infection according to the human
diagnostic criteria for HLH [80, 81, 144]: fever, splenomegaly, cytopenia, histological proof of
hemophagocytosis, elevated serum levels of ferritin, triglycerides, and sCD25, and reduced
or absent NK cell cytotoxicity. As proposed for the diagnosis of HLH in humans, mice were
considered to have HLH if they fulfilled 5 out of the 8 criteria. Furthermore, the cytotoxic
activity of NK cells and cytotoxic T cells was characterized and the ability of mice to control
and eliminate the LCMV infection was determined. LCMV WE was used as an infectious
trigger, because this virus is a potent inducer of disease in different mouse models for HLH:
perforin-deficient mice (a mouse model for FHL-2) [49], ashen mice (a mouse model for
Griscelli syndrome 2) [84] and jinx mice (a mouse model for FHL-3) [88].
We used pearl mice, carrying mutations in the gene encoding Ap3b1, as a model for HPSII,
and beige and souris mice, carrying different mutations in the gene encoding Lyst, as two
different models for CHS.
Discussion 80
4.2.1 Hermansky-Pudlak syndrome type II confers a risk for HLH
The mouse model of HPSII -the pearl mice- were found to develop HLH following LCMV
infection defined by: weight loss, decrease in temperature measured in the ear, histological
proof of hemophagocytosis in liver and spleen, splenomegaly, and elevated ferritin and
sCD25 serum levels. The disease was transient and mice recovered eventually. At the time
point of the most obvious disease, additional features underlining the diagnosis of HLH were
found. IFN-γ serum levels, resembling the hallmark cytokine of HLH in humans [151, 153,
154, 182, 183] and mice [49, 84, 88, 184], were highly elevated after infection. In addition,
liver damage was detectable by increased serum levels of GPT, GLDH and LDH.
These data indicate that HPSII confers a risk for HLH. However, disease was transient in this
mouse model. One of the 11 patients so far described with HPSII (Tab. XI) also developed a
transient disease with two episodes of hemophagocytic syndrome following common viral
infections [143]. Only one HPSII patient so far developed a fulminant lethal HLH. He carried
an additional heterozygous mutation in RAB27A [142]. Homozygous mutations in RAB27A
cause Griscelli Syndrome type II (GSII) with a cytotoxicity defect predisposing to HLH [126,
127]. However, the functional influence of this additional mutation was not evaluated.
In this study, we analyzed the influence of a heterozygous ashen (GSII) mutation in pearl
mice (HPSII). Pearl ashen+/- mice developed a transient disease in which all parameters
tested resembled those of pearl mice. This indicated that an additional GSII mutation that
causes a severe cytotoxicity defect in a homozygous state does not enhance the cytotoxicity
defect or influence susceptibility to disease in pearl mice.
The pearl mice used in this study carry a mutation in the Ap3b1 gene, encoding the β3A
subunit of the AP-3 complex. Pearl mice were shown to have a tandem duplication of 793 bp
starting at nucleotide 2135 in the Ap3b1 gene that alters the reading frame. In consequence,
a stop codon develops at the duplication junction and therefore the protein is predicted to be
truncated 130 amino acids from the C-terminus [185, 186]. Though there are conflicting data
about residual expression of the β3A subunit in pearl mice [185-189], it is very likely that
there is residual expression of the truncated β3A protein missing the C-terminal end
containing the so called “ear” domain [190]. This domain was described to interact with
proteins such as scaffolding proteins, proteins of the cytoskeleton or proteins involved in the
vesicle fusion machinery [190, 191]. Peden et al. described a possible formation of the AP-3
complex lacking the ear domain of the β3A subunit. This complex is probably degraded
faster but may account for residual function of the AP-3 complex [187]. Thus, the AP-3
mutation in the pearl mice used in this study is probably rather a hypomorphic mutation than
a functional null mutation.
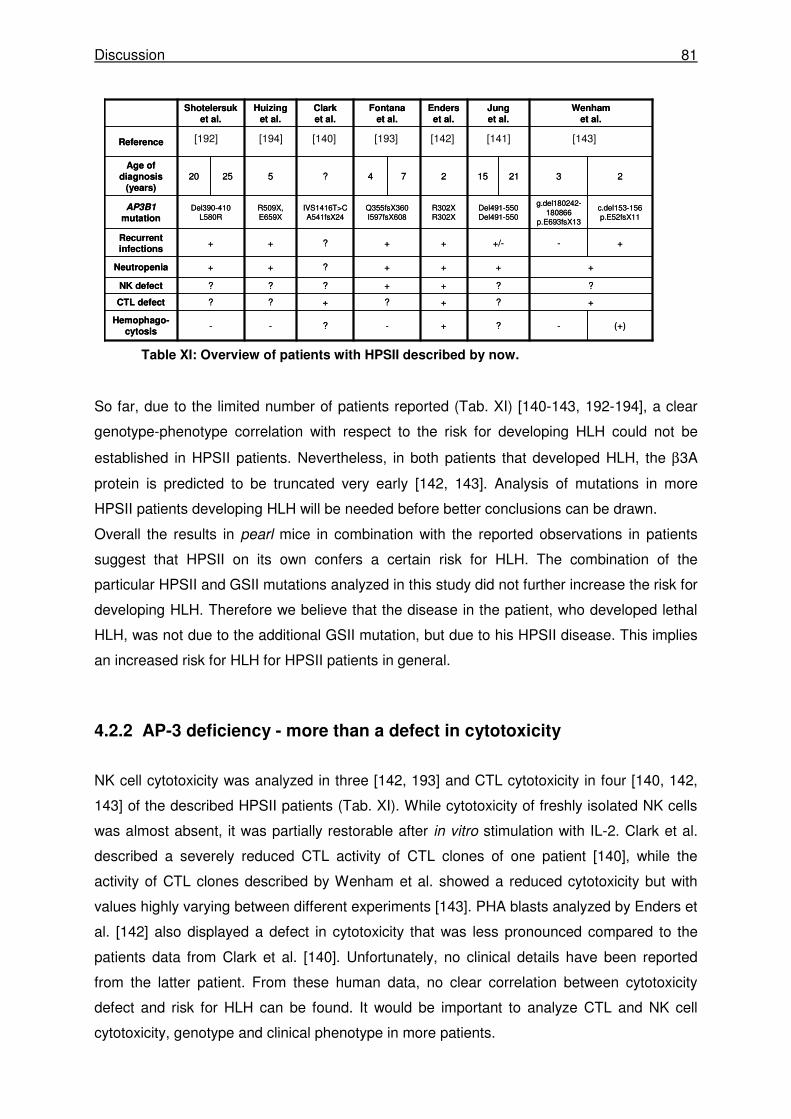
Discussion 81
Table XI: Overview of patients with HPSII described by now.
So far, due to the limited number of patients reported (Tab. XI) [140-143, 192-194], a clear
genotype-phenotype correlation with respect to the risk for developing HLH could not be
established in HPSII patients. Nevertheless, in both patients that developed HLH, the β3A
protein is predicted to be truncated very early [142, 143]. Analysis of mutations in more
HPSII patients developing HLH will be needed before better conclusions can be drawn.
Overall the results in pearl mice in combination with the reported observations in patients
suggest that HPSII on its own confers a certain risk for HLH. The combination of the
particular HPSII and GSII mutations analyzed in this study did not further increase the risk for
developing HLH. Therefore we believe that the disease in the patient, who developed lethal
HLH, was not due to the additional GSII mutation, but due to his HPSII disease. This implies
an increased risk for HLH for HPSII patients in general.
4.2.2 AP-3 deficiency - more than a defect in cytotoxicity
NK cell cytotoxicity was analyzed in three [142, 193] and CTL cytotoxicity in four [140, 142,
143] of the described HPSII patients (Tab. XI). While cytotoxicity of freshly isolated NK cells
was almost absent, it was partially restorable after in vitro stimulation with IL-2. Clark et al.
described a severely reduced CTL activity of CTL clones of one patient [140], while the
activity of CTL clones described by Wenham et al. showed a reduced cytotoxicity but with
values highly varying between different experiments [143]. PHA blasts analyzed by Enders et
al. [142] also displayed a defect in cytotoxicity that was less pronounced compared to the
patients data from Clark et al. [140]. Unfortunately, no clinical details have been reported
from the latter patient. From these human data, no clear correlation between cytotoxicity
defect and risk for HLH can be found. It would be important to analyze CTL and NK cell
cytotoxicity, genotype and clinical phenotype in more patients.
(+)-?+-?--Hemophago-
cytosis
+?+?+??CTL defect
??++???NK defect
++++?++Neutropenia
+-+/-++?++Recurrent infections
c.del153-156p.E52fsX11
g.del180242-180866
p.E693fsX13
Del491-550Del491-550
R302XR302X
Q355fsX360I597fsX608
IVS1416T>CA541fsX24
R509X,E659X
Del390-410L580R
AP3B1mutation
232115274?52520Age of
diagnosis (years)
Reference
Wenhamet al.
Junget al.
Enderset al.
Fontanaet al.
Clarket al.
Huizinget al.
Shotelersuket al.
[192] [194] [140] [193] [142] [141] [143]
Discussion 82
Even though mice with Ap3b1 null alleles exist, neither cytotoxicity nor HLH development in
those mice were analyzed by now [195]. As described later in more detail, our experiments
with pearl mice with a presumably hypomorphic mutation revealed both a reduction in NK cell
and CTL cytotoxicity. This is in contrast to previous reports describing normal NK cell
cytotoxicity in pearl mice but here tests were performed without previous activation of NK
cells [196]. Importantly, the influence on the immune system of the defective AP-3 complex is
not restricted to a disturbed cytotoxicity. Pearl mice were shown to develop lung pathology
with pulmonary inflammatory dysregulation and constitutive alveolar macrophage activation
[197-199]. Furthermore, trafficking and antigen presentation by CD1 was shown to be
defective and therefore NKT cell development was disturbed [200-202]. Reduced numbers of
NKT cells were also observed in one patient with HPSII [141]. Although it was shown that
MHC class II traffics normally in AP-3 deficient cells [202], our results suggest, that AP-3
deficiency also leads to an APC problem. Thus, we observed a proliferation defect in pearl
CTLs that was obvious in combination with wildtype APCs but most pronounced in
combination with pearl APCs.
In conclusion, AP-3 deficiency leads to a complex phenotype that is not limited to cytotoxicity
defects. Further studies are needed to understand the contribution of the multiple defects to
the phenotype of pearl mice.
4.2.3 Geno-phenotype correlation in the mouse models for CHS
Analysis of beige and souris mice as models for Chèdiak-Higashi syndrome revealed an
apparent geno-phenotype correlation. The nature of the mutation influenced the CTL and NK
cell cytotoxicity and therefore determined the risk for HLH in CHS.
Souris mice developed severe disease following low dose LCMV infection fulfilling all
diagnostic criteria for HLH. In contrast, low dose LCMV infection of beige mice did not induce
disease. Both mice carry a mutation in the Lyst gene, the homologue of the human
CHS1/LYST gene and both mice show the typical inclusion bodies on blood cell morphology
and dilution of coat color that is slightly more pronounced in souris mice. While the mutation
of souris mice was described to truncate the protein after amino acid 2482 and therefore the
PH, BEACH and WD domains are missing, mutation analysis of the beige mice revealed an
inframe deletion of one amino acid at position 3741 in the WD40 domain. These genetic
differences had important consequences for disease susceptibility.
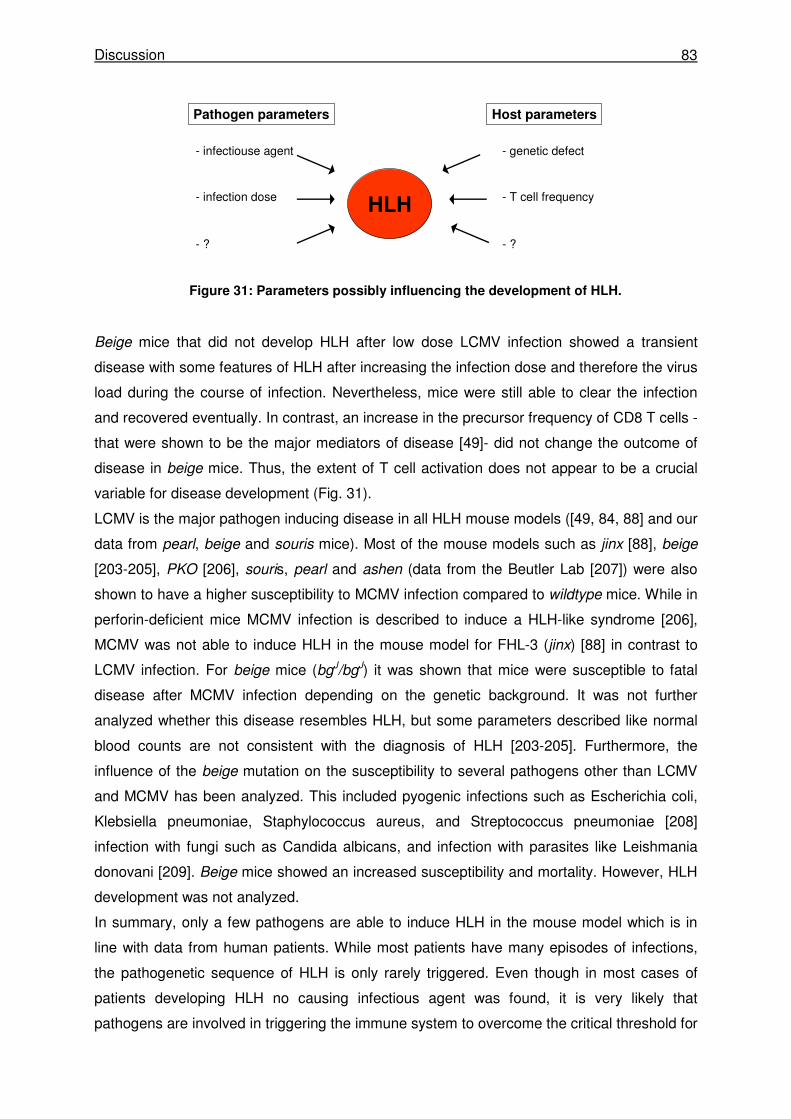
Discussion 83
Figure 31: Parameters possibly influencing the development of HLH.
Beige mice that did not develop HLH after low dose LCMV infection showed a transient
disease with some features of HLH after increasing the infection dose and therefore the virus
load during the course of infection. Nevertheless, mice were still able to clear the infection
and recovered eventually. In contrast, an increase in the precursor frequency of CD8 T cells -
that were shown to be the major mediators of disease [49]- did not change the outcome of
disease in beige mice. Thus, the extent of T cell activation does not appear to be a crucial
variable for disease development (Fig. 31).
LCMV is the major pathogen inducing disease in all HLH mouse models ([49, 84, 88] and our
data from pearl, beige and souris mice). Most of the mouse models such as jinx [88], beige
[203-205], PKO [206], souris, pearl and ashen (data from the Beutler Lab [207]) were also
shown to have a higher susceptibility to MCMV infection compared to wildtype mice. While in
perforin-deficient mice MCMV infection is described to induce a HLH-like syndrome [206],
MCMV was not able to induce HLH in the mouse model for FHL-3 (jinx) [88] in contrast to
LCMV infection. For beige mice (bgJ/bgJ) it was shown that mice were susceptible to fatal
disease after MCMV infection depending on the genetic background. It was not further
analyzed whether this disease resembles HLH, but some parameters described like normal
blood counts are not consistent with the diagnosis of HLH [203-205]. Furthermore, the
influence of the beige mutation on the susceptibility to several pathogens other than LCMV
and MCMV has been analyzed. This included pyogenic infections such as Escherichia coli,
Klebsiella pneumoniae, Staphylococcus aureus, and Streptococcus pneumoniae [208]
infection with fungi such as Candida albicans, and infection with parasites like Leishmania
donovani [209]. Beige mice showed an increased susceptibility and mortality. However, HLH
development was not analyzed.
In summary, only a few pathogens are able to induce HLH in the mouse model which is in
line with data from human patients. While most patients have many episodes of infections,
the pathogenetic sequence of HLH is only rarely triggered. Even though in most cases of
patients developing HLH no causing infectious agent was found, it is very likely that
pathogens are involved in triggering the immune system to overcome the critical threshold for
HLH
Pathogen parameters
- infectiouse agent
- infection dose
- ?
Host parameters
- genetic defect
- T cell frequency
- ?
Discussion 84
developing HLH. It is not clear whether, once established HLH requires the presence of an
infectious agent. In support of this concept, our data obtained with LCMV in a variety of
model situations showed that disease was in all cases associated with failure to eliminate the
pathogen.
In conclusion, pathogen parameters as well as host parameters have an influence on
disease development. The data from this study using the strongest HLH trigger in mice -
LCMV- indicate that in CHS the nature of the mutation plays the critical role in determining
the risk for HLH. Both mouse models for CHS analyzed in this study conferred a risk for
developing HLH, but with different thresholds. While a low dose LCMV infection is sufficient
to overcome the threshold for souris mice and PKO mice, beige mice only showed transient
features of HLH even after increasing the infection dose.
Geno-phenotype studies of patients with CHS revealed a correlation between the nature of
the mutation and the severity of the clinical picture [118]. While most of the patients with CHS
(~85%) show a severe and often fatal phenotype in early childhood, there are some cases
(~15%) that do not develop HLH and survive to adulthood but with progressive and often
fatal neurological dysfunction. A minority of CHS patients show an intermediate phenotype
with recurrent infections in childhood without developing HLH. Mutation analysis revealed
that functionally null -especially nonsense- mutations are predominantly found in the severe
childhood forms. Missense mutations, probably allowing residual function of the LYST protein
were found to be the cause of the milder adulthood form of CHS [118, 124, 210, 211].
Beige mice -analyzed in this study- displayed a high threshold for developing disease and
were also observed to develop neurological problems over time [212] and could therefore
resemble a model for the adult form of HLH. Another mouse model for CHS carrying a
missense mutation in the same protein domain as beige mice, the WD40 domain, displayed
a predominant neurodegenerative phenotype and lacked severe impairment of the immune
system [213]. In contrast, souris mice with a mutation resulting in an early truncation of the
Lyst protein could resemble a mouse model for the severe childhood form of CHS early
developing severe HLH.
4.2.4 HLH in mice is associated with antigen persistence
As described above, souris mice did not develop HLH spontaneously but after infection with
LCMV as was previously shown for perforin-deficient and ashen mice [49, 84]. In this study,
we observed that HLH in mice was invariably associated with impaired virus elimination.
Souris mice -like PKO and ashen mice- were not able to eliminate the virus at all. In beige
mice, a transient disease was only induced by an increased infection dose and therefore an
increased virus load. Pearl mice showed virus persistence at the time point of most severe

Discussion 85
disease and disease symptoms waned when virus was eventually eliminated. Moreover mice
with features of disease also showed a spread of virus to peripheral organs that was never
observed in wildtype mice. These data lead to the conclusion that in the mouse model, HLH
pathology is directly linked to virus, i.e. antigen persistence. Presumably, the continued
stimulation of CTLs is the basis for maintenance of the disease.
4.2.5 CTL rather than NK cell cytotoxicity determines the risk for HLH
Patients with FHL either show mutations in the gene encoding for perforin or in genes
involved in the exocytosis pathway of lytic granules containing cytotoxic proteins like perforin
and granzymes. As a consequence, cytotoxicity of NK cells is affected. In fact, defective NK
cell cytotoxicity is a diagnostic criterion of HLH.
We found that NK cell cytotoxicity and degranulation are significantly reduced in HPSII mice
compared to wildtype mice. Both CHS mouse strains showed a comparable, almost absent
NK cell activity. However, while souris mice developed HLH, beige mice did not. Hence, the
NK cell function does not seem to be the major factor determining the development of HLH in
mice.
Cytotoxic CD8 T cells are crucial for the elimination of LCMV infection [17, 214] but they
were also shown to be the main mediators of HLH in perforin-deficient mice [49]. The virus
control in mice in this study ranged from unaffected virus elimination in beige mice and a
delayed virus control in pearl mice to an absent virus control in souris and ashen mice. We
found that these differences in virus control correlated well with the activity of CTLs
determined by degranulation and cytotoxicity. Pearl CTLs showed a reduced cytotoxicity on
LCMV-infected target cells and on target cells loaded with limiting peptide concentrations that
was also associated with a significant decrease in CTL degranulation. In CHS mice, the
difference in CTL activity probably explains the differences between those two mouse strains
in virus control and development of HLH. Souris CTLs showed a significantly reduced
cytotoxicity on LCMV-infected target cells while beige CTLs showed no defect in this
experimental setup. Using limiting peptide concentrations, lysis of target cells was obviously
defective in beige CTLs and almost absent in souris CTLs. Furthermore, ashen mice -
susceptible to HLH- also displayed an almost absent CTL cytotoxicity in both experimental
settings.
The physiological relevance of these defects was reflected in the LCMV elimination. The
direct link between CTL defects and the failure to control the infection was evidenced in our T
cell adoptive transfer model. Virus control in that model was previously shown to be perforin
dependent [171]. It was impressive to see that small differences in cytotoxicity in vitro (in
particular under saturating peptide conditions) led to such large differences in virus control in
Discussion 86
vivo. These results clearly demonstrate the following: First, the degree of the CTL cytotoxicity
defect determines virus control. Small in vitro differences lead to large effects in vivo.
Second, the more pronounced the defect in CTL cytotoxicity, the higher is the risk for
developing severe HLH. These findings emphasize that the methods how to assess
cytotoxicity in vitro are crucial. They must be sensitive enough to detect subtle differences. In
our experimental setup, none of the cytotoxicity defects were visible when target cells were
loaded with normally used saturating peptide concentrations (data not shown). These
methodological considerations can also explain some of the discrepancies in the literature.
While beige NK cell activity was described to be defective in all setting such as poly(I:C)
activation [215, 216], infection with VSV [215], LCMV WE and Armstrong [217-222], MHV
[217] and MCMV [218], data for CTL activity were not as consistent. Beige CTLs were
reported to mediate normal cytotoxicity following VSV infection [215] or in vivo
alloimmunisation [216, 219, 220], while other groups reported an impaired CTL cytotoxicity
following LCMV infection [23, 223] or in vivo alloimmunization [221, 222]. In contrast,
cytotoxicity of CTLs from CHS patients were consistently described to be reduced [117, 211,
224-226]. This discrepancy is probably in part due to different sensitivity of the cytotoxicity
assays.
Overall, the results of this study show that rather CTL than NK cell cytotoxicity determines
the risk for HLH and therefore should be studied when performing diagnostic evaluations for
HLH. Further investigations are required to evaluate the optimal in vitro assay conditions, in
particular for humans. Data obtained in larger cohorts of patients with severe and mild forms
of HLH may help to validate the predictive value of these assays concerning the risk for HLH
development.
References 87
5 References 1. Janeway, C.A., Jr. and R. Medzhitov, Innate immune recognition. Annu Rev Immunol,
2002. 20: p. 197-216. 2. Koyama, S., et al., Innate immune response to viral infection. Cytokine, 2008. 43(3): p.
336-41. 3. Iwasaki, A. and R. Medzhitov, Regulation of adaptive immunity by the innate immune
system. Science, 2010. 327(5963): p. 291-5. 4. Iwasaki, A. and R. Medzhitov, Toll-like receptor control of the adaptive immune
responses. Nat Immunol, 2004. 5(10): p. 987-95. 5. Mogensen, T.H., Pathogen recognition and inflammatory signaling in innate immune
defenses. Clin Microbiol Rev, 2009. 22(2): p. 240-73, Table of Contents. 6. Dunne, D.W., et al., The type I macrophage scavenger receptor binds to gram-positive
bacteria and recognizes lipoteichoic acid. Proc Natl Acad Sci U S A, 1994. 91(5): p. 1863-7.
7. Schiff, D.E., et al., Phagocytosis of gram-negative bacteria by a unique CD14-dependent mechanism. J Leukoc Biol, 1997. 62(6): p. 786-94.
8. Stahl, P.D. and R.A. Ezekowitz, The mannose receptor is a pattern recognition receptor involved in host defense. Curr Opin Immunol, 1998. 10(1): p. 50-5.
9. Underhill, D.M. and A. Ozinsky, Phagocytosis of microbes: complexity in action. Annu Rev Immunol, 2002. 20: p. 825-52.
10. Huntington, N.D., C.A. Vosshenrich, and J.P. Di Santo, Developmental pathways that generate natural-killer-cell diversity in mice and humans. Nat Rev Immunol, 2007. 7(9): p. 703-14.
11. Lanier, L.L., Evolutionary struggles between NK cells and viruses. Nat Rev Immunol, 2008. 8(4): p. 259-68.
12. Biron, C.A., K.B. Nguyen, and G.C. Pien, Innate immune responses to LCMV infections: natural killer cells and cytokines. Curr Top Microbiol Immunol, 2002. 263: p. 7-27.
13. Bonilla, F.A. and H.C. Oettgen, Adaptive immunity. J Allergy Clin Immunol, 2010. 125(2 Suppl 2): p. S33-40.
14. Nurieva, R.I. and Y. Chung, Understanding the development and function of T follicular helper cells. Cell Mol Immunol, 2010. 7(3): p. 190-7.
15. Zhu, J., H. Yamane, and W.E. Paul, Differentiation of effector CD4 T cell populations (*). Annu Rev Immunol. 28: p. 445-89.
16. Vinuesa, C.G., et al., T cells and follicular dendritic cells in germinal center B-cell formation and selection. Immunol Rev, 2010. 237(1): p. 72-89.
17. Zinkernagel, R.M. and R.M. Welsh, H-2 compatibility requirement for virus-specific T cell-mediated effector functions in vivo. I. Specificity of T cells conferring antiviral protection against lymphocytic choriomeningitis virus is associated with H-2K and H-2D. J Immunol, 1976. 117(5 Pt 1): p. 1495-502.
18. Graham, B.S., et al., Role of T lymphocyte subsets in the pathogenesis of primary infection and rechallenge with respiratory syncytial virus in mice. J Clin Invest, 1991. 88(3): p. 1026-33.
19. Prince, G.A., et al., Respiratory syncytial virus infection in inbred mice. Infect Immun, 1979. 26(2): p. 764-6.
20. Stark, J.M., et al., Genetic susceptibility to respiratory syncytial virus infection in inbred mice. J Med Virol, 2002. 67(1): p. 92-100.
21. Buchmeier, M.J., et al., The virology and immunobiology of lymphocytic choriomeningitis virus infection. Adv Immunol, 1980. 30: p. 275-331.
22. Welsh, R.M., Jr., Cytotoxic cells induced during lymphocytic choriomeningitis virus infection of mice. I. Characterization of natural killer cell induction. J Exp Med, 1978. 148(1): p. 163-81.
References 88
23. Welsh, R.M., Jr. and R.W. Kiessling, Natural killer cell response to lymphocytic choriomeningitis virus in beige mice. Scand J Immunol, 1980. 11(4): p. 363-7.
24. Hussell, T. and P.J. Openshaw, Intracellular IFN-gamma expression in natural killer cells precedes lung CD8+ T cell recruitment during respiratory syncytial virus infection. J Gen Virol, 1998. 79 ( Pt 11): p. 2593-601.
25. Masopust, D., K. Murali-Krishna, and R. Ahmed, Quantitating the magnitude of the lymphocytic choriomeningitis virus-specific CD8 T-cell response: it is even bigger than we thought. J Virol, 2007. 81(4): p. 2002-11.
26. Kulkarni, A.B., et al., The cytolytic activity of pulmonary CD8+ lymphocytes, induced by infection with a vaccinia virus recombinant expressing the M2 protein of respiratory syncytial virus (RSV), correlates with resistance to RSV infection in mice. J Virol, 1993. 67(2): p. 1044-9.
27. Nicholas, J.A., et al., Cytolytic T-lymphocyte responses to respiratory syncytial virus: effector cell phenotype and target proteins. J Virol, 1990. 64(9): p. 4232-41.
28. Choi, E.H., et al., A common haplotype of interleukin-4 gene IL4 is associated with severe respiratory syncytial virus disease in Korean children. J Infect Dis, 2002. 186(9): p. 1207-11.
29. Forton, J.T., et al., Genetic association study for RSV bronchiolitis in infancy at the 5q31 cytokine cluster. Thorax, 2009. 64(4): p. 345-52.
30. Wilson, J., et al., Genetic variation at the IL10 gene locus is associated with severity of respiratory syncytial virus bronchiolitis. J Infect Dis, 2005. 191(10): p. 1705-9.
31. El Saleeby, C.M., et al., Surfactant protein A2 polymorphisms and disease severity in a respiratory syncytial virus-infected population. J Pediatr, 2010. 156(3): p. 409-14.
32. Klein Klouwenberg, P., et al., The role of Toll-like receptors in regulating the immune response against respiratory syncytial virus. Crit Rev Immunol, 2009. 29(6): p. 531-50.
33. Miyairi, I. and J.P. DeVincenzo, Human genetic factors and respiratory syncytial virus disease severity. Clin Microbiol Rev, 2008. 21(4): p. 686-703.
34. El Saleeby, C.M., et al., Quantitative effects of palivizumab and donor-derived T cells on chronic respiratory syncytial virus infection, lung disease, and fusion glycoprotein amino acid sequences in a patient before and after bone marrow transplantation. Clin Infect Dis, 2004. 39(2): p. e17-20.
35. Fishaut, M., D. Tubergen, and K. McIntosh, Cellular response to respiratory viruses with particular reference to children with disorders of cell-mediated immunity. J Pediatr, 1980. 96(2): p. 179-86.
36. Hall, C.B., et al., Respiratory syncytial viral infection in children with compromised immune function. N Engl J Med, 1986. 315(2): p. 77-81.
37. Cannon, M.J., P.J. Openshaw, and B.A. Askonas, Cytotoxic T cells clear virus but augment lung pathology in mice infected with respiratory syncytial virus. J Exp Med, 1988. 168(3): p. 1163-8.
38. Messaoudi, I., et al., Direct link between mhc polymorphism, T cell avidity, and diversity in immune defense. Science, 2002. 298(5599): p. 1797-800.
39. Leist, T., et al., Major histocompatibility complex-linked susceptibility or resistance to disease caused by a noncytopathic virus varies with the disease parameter evaluated. J Exp Med, 1989. 170(1): p. 269-77.
40. Stark, J.M., et al., Genomewide association analysis of respiratory syncytial virus infection in mice. J Virol, 2010. 84(5): p. 2257-69.
41. Chavez-Bueno, S., et al., Respiratory syncytial virus-induced acute and chronic airway disease is independent of genetic background: an experimental murine model. Virol J, 2005. 2: p. 46.
42. Rutigliano, J.A., et al., Relative dominance of epitope-specific CD8+ T cell responses in an F1 hybrid mouse model of respiratory syncytial virus infection. Virology, 2007. 362(2): p. 314-9.
43. Lieberman, J., The ABCs of granule-mediated cytotoxicity: new weapons in the arsenal. Nat Rev Immunol, 2003. 3(5): p. 361-70.
44. Voskoboinik, I., M.J. Smyth, and J.A. Trapani, Perforin-mediated target-cell death and immune homeostasis. Nat Rev Immunol, 2006. 6(12): p. 940-52.
References 89
45. Turbyville, J.C. and V.K. Rao, The autoimmune lymphoproliferative syndrome: A rare disorder providing clues about normal tolerance. Autoimmun Rev, 2010. 9(7): p. 488-93.
46. Hwang, I., et al., T cells can use either T cell receptor or CD28 receptors to absorb and internalize cell surface molecules derived from antigen-presenting cells. J Exp Med, 2000. 191(7): p. 1137-48.
47. Stinchcombe, J.C., et al., The immunological synapse of CTL contains a secretory domain and membrane bridges. Immunity, 2001. 15(5): p. 751-61.
48. Hudrisier, D., et al., Cutting edge: CTLs rapidly capture membrane fragments from target cells in a TCR signaling-dependent manner. J Immunol, 2001. 166(6): p. 3645-9.
49. Jordan, M.B., et al., An animal model of hemophagocytic lymphohistiocytosis (HLH): CD8+ T cells and interferon gamma are essential for the disorder. Blood, 2004. 104(3): p. 735-43.
50. Badovinac, V.P., A.R. Tvinnereim, and J.T. Harty, Regulation of antigen-specific CD8+ T cell homeostasis by perforin and interferon-gamma. Science, 2000. 290(5495): p. 1354-8.
51. de Saint Basile, G. and A. Fischer, Defective cytotoxic granule-mediated cell death pathway impairs T lymphocyte homeostasis. Curr Opin Rheumatol, 2003. 15(4): p. 436-45.
52. Badovinac, V.P., B.B. Porter, and J.T. Harty, Programmed contraction of CD8(+) T cells after infection. Nat Immunol, 2002. 3(7): p. 619-26.
53. Frebel, H., K. Richter, and A. Oxenius, How chronic viral infections impact on antigen-specific T-cell responses. Eur J Immunol, 2010. 40(3): p. 654-63.
54. Guidotti, L.G. and F.V. Chisari, Immunobiology and pathogenesis of viral hepatitis. Annu Rev Pathol, 2006. 1: p. 23-61.
55. Olson, M.R. and S.M. Varga, Pulmonary immunity and immunopathology: lessons from respiratory syncytial virus. Expert Rev Vaccines, 2008. 7(8): p. 1239-55.
56. Chavez-Galan, L., et al., Cell death mechanisms induced by cytotoxic lymphocytes. Cell Mol Immunol, 2009. 6(1): p. 15-25.
57. Lowin, B., et al., Cytolytic T-cell cytotoxicity is mediated through perforin and Fas lytic pathways. Nature, 1994. 370(6491): p. 650-2.
58. Russell, J.H. and T.J. Ley, Lymphocyte-mediated cytotoxicity. Annu Rev Immunol, 2002. 20: p. 323-70.
59. Jenkins, M.R. and G.M. Griffiths, The synapse and cytolytic machinery of cytotoxic T cells. Curr Opin Immunol, 2010. 22(3): p. 308-13.
60. Walsh, C.M., et al., Immune function in mice lacking the perforin gene. Proc Natl Acad Sci U S A, 1994. 91(23): p. 10854-8.
61. Lowin, B., et al., A null mutation in the perforin gene impairs cytolytic T lymphocyte- and natural killer cell-mediated cytotoxicity. Proc Natl Acad Sci U S A, 1994. 91(24): p. 11571-5.
62. Cullen, S.P., M. Brunet, and S.J. Martin, Granzymes in cancer and immunity. Cell Death Differ, 2010. 17(4): p. 616-23.
63. Cullen, S.P. and S.J. Martin, Mechanisms of granule-dependent killing. Cell Death Differ, 2008. 15(2): p. 251-62.
64. Bolitho, P., et al., Apoptosis induced by the lymphocyte effector molecule perforin. Curr Opin Immunol, 2007. 19(3): p. 339-47.
65. Voskoboinik, I. and J.A. Trapani, Addressing the mysteries of perforin function. Immunol Cell Biol, 2006. 84(1): p. 66-71.
66. Zhou, F., Perforin: more than just a pore-forming protein. Int Rev Immunol, 2010. 29(1): p. 56-76.
67. Chowdhury, D. and J. Lieberman, Death by a thousand cuts: granzyme pathways of programmed cell death. Annu Rev Immunol, 2008. 26: p. 389-420.
68. Afonina, I.S., S.P. Cullen, and S.J. Martin, Cytotoxic and non-cytotoxic roles of the CTL/NK protease granzyme B. Immunol Rev, 2010. 235(1): p. 105-16.
References 90
69. Fan, Z., et al., HMG2 interacts with the nucleosome assembly protein SET and is a target of the cytotoxic T-lymphocyte protease granzyme A. Mol Cell Biol, 2002. 22(8): p. 2810-20.
70. Lieberman, J. and Z. Fan, Nuclear war: the granzyme A-bomb. Curr Opin Immunol, 2003. 15(5): p. 553-9.
71. Krensky, A.M. and C. Clayberger, Biology and clinical relevance of granulysin. Tissue Antigens, 2009. 73(3): p. 193-8.
72. Pena, S.V. and A.M. Krensky, Granulysin, a new human cytolytic granule-associated protein with possible involvement in cell-mediated cytotoxicity. Semin Immunol, 1997. 9(2): p. 117-25.
73. Kuhne, M.R., et al., Linker for activation of T cells, zeta-associated protein-70, and Src homology 2 domain-containing leukocyte protein-76 are required for TCR-induced microtubule-organizing center polarization. J Immunol, 2003. 171(2): p. 860-6.
74. Griffiths, G.M., A. Tsun, and J.C. Stinchcombe, The immunological synapse: a focal point for endocytosis and exocytosis. J Cell Biol, 2010. 189(3): p. 399-406.
75. Shresta, S., et al., How do cytotoxic lymphocytes kill their targets? Curr Opin Immunol, 1998. 10(5): p. 581-7.
76. Bryceson, Y.T., et al., Cytolytic granule polarization and degranulation controlled by different receptors in resting NK cells. J Exp Med, 2005. 202(7): p. 1001-12.
77. Stinchcombe, J.C., et al., Centrosome polarization delivers secretory granules to the immunological synapse. Nature, 2006. 443(7110): p. 462-5.
78. Rizo, J. and C. Rosenmund, Synaptic vesicle fusion. Nat Struct Mol Biol, 2008. 15(7): p. 665-74.
79. Blott, E.J. and G.M. Griffiths, Secretory lysosomes. Nat Rev Mol Cell Biol, 2002. 3(2): p. 122-31.
80. Janka, G.E., Hemophagocytic syndromes. Blood Rev, 2007. 21(5): p. 245-53. 81. Janka, G.E., Familial and acquired hemophagocytic lymphohistiocytosis. Eur J Pediatr,
2007. 166(2): p. 95-109. 82. Janka, G., et al., Infection- and malignancy-associated hemophagocytic syndromes.
Secondary hemophagocytic lymphohistiocytosis. Hematol Oncol Clin North Am, 1998. 12(2): p. 435-44.
83. Sung, L., et al., The role of infections in primary hemophagocytic lymphohistiocytosis: a case series and review of the literature. Clin Infect Dis, 2001. 33(10): p. 1644-8.
84. Pachlopnik Schmid, J., et al., A Griscelli syndrome type 2 murine model of hemophagocytic lymphohistiocytosis (HLH). Eur J Immunol, 2008. 38(11): p. 3219-25.
85. Arico, M., et al., Hemophagocytic lymphohistiocytosis. Report of 122 children from the International Registry. FHL Study Group of the Histiocyte Society. Leukemia, 1996. 10(2): p. 197-203.
86. Janka, G.E., Familial hemophagocytic lymphohistiocytosis. Eur J Pediatr, 1983. 140(3): p. 221-30.
87. Imashuku, S., et al., Occurrence of haemophagocytic lymphohistiocytosis at less than 1 year of age: analysis of 96 patients. Eur J Pediatr, 2005. 164(5): p. 315-9.
88. Crozat, K., et al., Jinx, an MCMV susceptibility phenotype caused by disruption of Unc13d: a mouse model of type 3 familial hemophagocytic lymphohistiocytosis. J Exp Med, 2007. 204(4): p. 853-63.
89. Barbosa, M.D., et al., Identification of the homologous beige and Chediak-Higashi syndrome genes. Nature, 1996. 382(6588): p. 262-5.
90. Swank, R.T., et al., Abnormal vesicular trafficking in mouse models of Hermansky-Pudlak syndrome. Pigment Cell Res, 2000. 13 Suppl 8: p. 59-67.
91. Zur Stadt, U., et al., Mutation spectrum in children with primary hemophagocytic lymphohistiocytosis: molecular and functional analyses of PRF1, UNC13D, STX11, and RAB27A. Hum Mutat, 2006. 27(1): p. 62-8.
92. Horne, A., et al., Characterization of PRF1, STX11 and UNC13D genotype-phenotype correlations in familial hemophagocytic lymphohistiocytosis. Br J Haematol, 2008. 143(1): p. 75-83.
References 91
93. Stinchcombe, J., G. Bossi, and G.M. Griffiths, Linking albinism and immunity: the secrets of secretory lysosomes. Science, 2004. 305(5680): p. 55-9.
94. Arceci, R.J., When T cells and macrophages do not talk: the hemophagocytic syndromes. Curr Opin Hematol, 2008. 15(4): p. 359-67.
95. Charette, S.J. and P. Cosson, A LYST/beige homolog is involved in biogenesis of Dictyostelium secretory lysosomes. J Cell Sci, 2007. 120(Pt 14): p. 2338-43.
96. Kagi, D., et al., Cytotoxicity mediated by T cells and natural killer cells is greatly impaired in perforin-deficient mice. Nature, 1994. 369(6475): p. 31-7.
97. Kagi, D., et al., The roles of perforin- and Fas-dependent cytotoxicity in protection against cytopathic and noncytopathic viruses. Eur J Immunol, 1995. 25(12): p. 3256-62.
98. Menasche, G., et al., Primary hemophagocytic syndromes point to a direct link between lymphocyte cytotoxicity and homeostasis. Immunol Rev, 2005. 203: p. 165-79.
99. Neeft, M., et al., Munc13-4 is an effector of rab27a and controls secretion of lysosomes in hematopoietic cells. Mol Biol Cell, 2005. 16(2): p. 731-41.
100. Bryceson, Y.T., et al., Defective cytotoxic lymphocyte degranulation in syntaxin-11 deficient familial hemophagocytic lymphohistiocytosis 4 (FHL4) patients. Blood, 2007. 110(6): p. 1906-15.
101. Rudd, E., et al., Spectrum and clinical implications of syntaxin 11 gene mutations in familial haemophagocytic lymphohistiocytosis: association with disease-free remissions and haematopoietic malignancies. J Med Genet, 2006. 43(4): p. e14.
102. zur Stadt, U., et al., Linkage of familial hemophagocytic lymphohistiocytosis (FHL) type-4 to chromosome 6q24 and identification of mutations in syntaxin 11. Hum Mol Genet, 2005. 14(6): p. 827-34.
103. Stepp, S.E., et al., Perforin gene defects in familial hemophagocytic lymphohistiocytosis. Science, 1999. 286(5446): p. 1957-9.
104. Dufourcq-Lagelouse, R., et al., Linkage of familial hemophagocytic lymphohistiocytosis to 10q21-22 and evidence for heterogeneity. Am J Hum Genet, 1999. 64(1): p. 172-9.
105. Goransdotter Ericson, K., et al., Spectrum of perforin gene mutations in familial hemophagocytic lymphohistiocytosis. Am J Hum Genet, 2001. 68(3): p. 590-7.
106. Suga, N., et al., Perforin defects of primary haemophagocytic lymphohistiocytosis in Japan. Br J Haematol, 2002. 116(2): p. 346-9.
107. Clementi, R., et al., Six novel mutations in the PRF1 gene in children with haemophagocytic lymphohistiocytosis. J Med Genet, 2001. 38(9): p. 643-6.
108. Molleran Lee, S., et al., Characterisation of diverse PRF1 mutations leading to decreased natural killer cell activity in North American families with haemophagocytic lymphohistiocytosis. J Med Genet, 2004. 41(2): p. 137-44.
109. Malloy, C.A., et al., Hemophagocytic lymphohistiocytosis presenting with nonimmune hydrops fetalis. J Perinatol, 2004. 24(7): p. 458-60.
110. Feldmann, J., et al., Munc13-4 is essential for cytolytic granules fusion and is mutated in a form of familial hemophagocytic lymphohistiocytosis (FHL3). Cell, 2003. 115(4): p. 461-73.
111. Yamamoto, K., et al., Identification of novel MUNC13-4 mutations in familial haemophagocytic lymphohistiocytosis and functional analysis of MUNC13-4-deficient cytotoxic T lymphocytes. J Med Genet, 2004. 41(10): p. 763-7.
112. Menager, M.M., et al., Secretory cytotoxic granule maturation and exocytosis require the effector protein hMunc13-4. Nat Immunol, 2007. 8(3): p. 257-67.
113. Arneson, L.N., et al., Cutting edge: syntaxin 11 regulates lymphocyte-mediated secretion and cytotoxicity. J Immunol, 2007. 179(6): p. 3397-401.
114. Cote, M., et al., Munc18-2 deficiency causes familial hemophagocytic lymphohistiocytosis type 5 and impairs cytotoxic granule exocytosis in patient NK cells. J Clin Invest, 2009. 119(12): p. 3765-73.
115. zur Stadt, U., et al., Familial hemophagocytic lymphohistiocytosis type 5 (FHL-5) is caused by mutations in Munc18-2 and impaired binding to syntaxin 11. Am J Hum Genet, 2009. 85(4): p. 482-92.
References 92
116. Meeths, M., et al., Spectrum of clinical presentations in familial hemophagocytic lymphohistiocytosis (FHL) type 5 patients with mutations in STXBP2. Blood, 2010.
117. Baetz, K., S. Isaaz, and G.M. Griffiths, Loss of cytotoxic T lymphocyte function in Chediak-Higashi syndrome arises from a secretory defect that prevents lytic granule exocytosis. J Immunol, 1995. 154(11): p. 6122-31.
118. Karim, M.A., et al., Apparent genotype-phenotype correlation in childhood, adolescent, and adult Chediak-Higashi syndrome. Am J Med Genet, 2002. 108(1): p. 16-22.
119. Nagle, D.L., et al., Identification and mutation analysis of the complete gene for Chediak-Higashi syndrome. Nat Genet, 1996. 14(3): p. 307-11.
120. Faigle, W., et al., Deficient peptide loading and MHC class II endosomal sorting in a human genetic immunodeficiency disease: the Chediak-Higashi syndrome. J Cell Biol, 1998. 141(5): p. 1121-34.
121. Perou, C.M., et al., The Beige/Chediak-Higashi syndrome gene encodes a widely expressed cytosolic protein. J Biol Chem, 1997. 272(47): p. 29790-4.
122. Barrat, F.J., et al., Defective CTLA-4 cycling pathway in Chediak-Higashi syndrome: a possible mechanism for deregulation of T lymphocyte activation. Proc Natl Acad Sci U S A, 1999. 96(15): p. 8645-50.
123. Stinchcombe, J.C., L.J. Page, and G.M. Griffiths, Secretory lysosome biogenesis in cytotoxic T lymphocytes from normal and Chediak Higashi syndrome patients. Traffic, 2000. 1(5): p. 435-44.
124. Certain, S., et al., Protein truncation test of LYST reveals heterogenous mutations in patients with Chediak-Higashi syndrome. Blood, 2000. 95(3): p. 979-83.
125. Griscelli, C., et al., A syndrome associating partial albinism and immunodeficiency. Am J Med, 1978. 65(4): p. 691-702.
126. Menasche, G., et al., Mutations in RAB27A cause Griscelli syndrome associated with haemophagocytic syndrome. Nat Genet, 2000. 25(2): p. 173-6.
127. Meeths, M., et al., Clinical presentation of Griscelli syndrome type 2 and spectrum of RAB27A mutations. Pediatr Blood Cancer, 2010. 54(4): p. 563-72.
128. Chavrier, P. and B. Goud, The role of ARF and Rab GTPases in membrane transport. Curr Opin Cell Biol, 1999. 11(4): p. 466-75.
129. Shirakawa, R., et al., Munc13-4 is a GTP-Rab27-binding protein regulating dense core granule secretion in platelets. J Biol Chem, 2004. 279(11): p. 10730-7.
130. Stinchcombe, J.C., et al., Rab27a is required for regulated secretion in cytotoxic T lymphocytes. J Cell Biol, 2001. 152(4): p. 825-34.
131. Hermansky, F. and P. Pudlak, Albinism associated with hemorrhagic diathesis and unusual pigmented reticular cells in the bone marrow: report of two cases with histochemical studies. Blood, 1959. 14(2): p. 162-9.
132. Dell'Angelica, E.C., et al., AP-3: an adaptor-like protein complex with ubiquitous expression. Embo J, 1997. 16(5): p. 917-28.
133. Newell-Litwa, K., et al., Neuronal and non-neuronal functions of the AP-3 sorting machinery. J Cell Sci, 2007. 120(Pt 4): p. 531-41.
134. Odorizzi, G., C.R. Cowles, and S.D. Emr, The AP-3 complex: a coat of many colours. Trends Cell Biol, 1998. 8(7): p. 282-8.
135. Starcevic, M., R. Nazarian, and E.C. Dell'Angelica, The molecular machinery for the biogenesis of lysosome-related organelles: lessons from Hermansky-Pudlak syndrome. Semin Cell Dev Biol, 2002. 13(4): p. 271-8.
136. Danglot, L. and T. Galli, What is the function of neuronal AP-3? Biol Cell, 2007. 99(7): p. 349-61.
137. Dell'Angelica, E.C., et al., Association of the AP-3 adaptor complex with clathrin. Science, 1998. 280(5362): p. 431-4.
138. Dell'Angelica, E.C., et al., Altered trafficking of lysosomal proteins in Hermansky-Pudlak syndrome due to mutations in the beta 3A subunit of the AP-3 adaptor. Mol Cell, 1999. 3(1): p. 11-21.
139. Dell'Angelica, E.C., AP-3-dependent trafficking and disease: the first decade. Curr Opin Cell Biol, 2009. 21(4): p. 552-9.
References 93
140. Clark, R.H., et al., Adaptor protein 3-dependent microtubule-mediated movement of lytic granules to the immunological synapse. Nat Immunol, 2003. 4(11): p. 1111-20.
141. Jung, J., et al., Identification of a homozygous deletion in the AP3B1 gene causing Hermansky-Pudlak syndrome, type 2. Blood, 2006. 108(1): p. 362-9.
142. Enders, A., et al., Lethal hemophagocytic lymphohistiocytosis in Hermansky-Pudlak syndrome type II. Blood, 2006. 108(1): p. 81-7.
143. Wenham, M., et al., Two patients with Hermansky Pudlak syndrome type 2 and novel mutations in AP3B1. Haematologica, 2010. 95(2): p. 333-7.
144. Henter, J.I., et al., HLH-2004: Diagnostic and therapeutic guidelines for hemophagocytic lymphohistiocytosis. Pediatr Blood Cancer, 2007. 48(2): p. 124-31.
145. Haddad, E., et al., Frequency and severity of central nervous system lesions in hemophagocytic lymphohistiocytosis. Blood, 1997. 89(3): p. 794-800.
146. Marcenaro, S., et al., Analysis of natural killer-cell function in familial hemophagocytic lymphohistiocytosis (FHL): defective CD107a surface expression heralds Munc13-4 defect and discriminates between genetic subtypes of the disease. Blood, 2006. 108(7): p. 2316-23.
147. Henter, J.I., et al., Treatment of hemophagocytic lymphohistiocytosis with HLH-94 immunochemotherapy and bone marrow transplantation. Blood, 2002. 100(7): p. 2367-73.
148. Stephan, J.L., et al., Treatment of familial hemophagocytic lymphohistiocytosis with antithymocyte globulins, steroids, and cyclosporin A. Blood, 1993. 82(8): p. 2319-23.
149. Ouachee-Chardin, M., et al., Hematopoietic stem cell transplantation in hemophagocytic lymphohistiocytosis: a single-center report of 48 patients. Pediatrics, 2006. 117(4): p. e743-50.
150. Horne, A., et al., Haematopoietic stem cell transplantation in haemophagocytic lymphohistiocytosis. Br J Haematol, 2005. 129(5): p. 622-30.
151. Henter, J.I., et al., Hypercytokinemia in familial hemophagocytic lymphohistiocytosis. Blood, 1991. 78(11): p. 2918-22.
152. Ishii, E., et al., Prognosis of children with virus-associated hemophagocytic syndrome and malignant histiocytosis: correlation with levels of serum interleukin-1 and tumor necrosis factor. Acta Haematol, 1991. 85(2): p. 93-9.
153. Mazodier, K., et al., Severe imbalance of IL-18/IL-18BP in patients with secondary hemophagocytic syndrome. Blood, 2005. 106(10): p. 3483-9.
154. Osugi, Y., et al., Cytokine production regulating Th1 and Th2 cytokines in hemophagocytic lymphohistiocytosis. Blood, 1997. 89(11): p. 4100-3.
155. Takada, H., et al., Interleukin-18 in hemophagocytic lymphohistiocytosis. Leuk Lymphoma, 2001. 42(1-2): p. 21-8.
156. Pircher, H., et al., Tolerance induction in double specific T-cell receptor transgenic mice varies with antigen. Nature, 1989. 342(6249): p. 559-61.
157. Vallbracht, S., et al., Influence of a single viral epitope on T cell response and disease after infection of mice with respiratory syncytial virus. J Immunol, 2007. 179(12): p. 8264-73.
158. Connors, M., et al., Resistance to respiratory syncytial virus (RSV) challenge induced by infection with a vaccinia virus recombinant expressing the RSV M2 protein (Vac-M2) is mediated by CD8+ T cells, while that induced by Vac-F or Vac-G recombinants is mediated by antibodies. J Virol, 1992. 66(2): p. 1277-81.
159. Kulkarni, A.B., et al., Cytotoxic T cells specific for a single peptide on the M2 protein of respiratory syncytial virus are the sole mediators of resistance induced by immunization with M2 encoded by a recombinant vaccinia virus. J Virol, 1995. 69(2): p. 1261-4.
160. Openshaw, P.J., et al., The 22,000-kilodalton protein of respiratory syncytial virus is a major target for Kd-restricted cytotoxic T lymphocytes from mice primed by infection. J Virol, 1990. 64(4): p. 1683-9.
161. Rutigliano, J.A., et al., Identification of an H-2D(b)-restricted CD8+ cytotoxic T lymphocyte epitope in the matrix protein of respiratory syncytial virus. Virology, 2005. 337(2): p. 335-43.
References 94
162. Pircher, H., et al., Viral escape by selection of cytotoxic T cell-resistant virus variants in vivo. Nature, 1990. 346(6285): p. 629-33.
163. Kappler, J.W., et al., Self-tolerance eliminates T cells specific for Mls-modified products of the major histocompatibility complex. Nature, 1988. 332(6159): p. 35-40.
164. Haskins, K., et al., The antigen-specific, major histocompatibility complex-restricted receptor on T cells. VI. An antibody to a receptor allotype. J Exp Med, 1984. 160(2): p. 452-71.
165. Runkel, F., et al., Grey, a novel mutation in the murine Lyst gene, causes the beige phenotype by skipping of exon 25. Mamm Genome, 2006. 17(3): p. 203-10.
166. Rutschmann, S., C. Eidenschenk, and B. Beutler, Souris is an allele of Lyst and is a model for Chediak-Higashi Syndrome. MGI Direct Data Submission, 2008.
167. Chomczynski, P. and N. Sacchi, Single-step method of RNA isolation by acid guanidinium thiocyanate-phenol-chloroform extraction. Anal Biochem, 1987. 162(1): p. 156-9.
168. Johnson, T.R., et al., Vbeta14(+) T cells mediate the vaccine-enhanced disease induced by immunization with respiratory syncytial virus (RSV) G glycoprotein but not with formalin-inactivated RSV. J Virol, 2004. 78(16): p. 8753-60.
169. Battegay, M., et al., Quantification of lymphocytic choriomeningitis virus with an immunological focus assay in 24- or 96-well plates. J Virol Methods, 1991. 33(1-2): p. 191-8.
170. Pachlopnik Schmid, J., et al., Neutralization of IFNgamma defeats haemophagocytosis in LCMV-infected perforin- and Rab27a-deficient mice. EMBO Mol Med, 2009. 1(2): p. 112-24.
171. Ehl, S., et al., A functional and kinetic comparison of antiviral effector and memory cytotoxic T lymphocyte populations in vivo and in vitro. Eur J Immunol, 1997. 27(12): p. 3404-13.
172. Trantow, C.M., et al., Lyst mutation in mice recapitulates iris defects of human exfoliation syndrome. Invest Ophthalmol Vis Sci, 2009. 50(3): p. 1205-14.
173. Ostler, T., W. Davidson, and S. Ehl, Virus clearance and immunopathology by CD8(+) T cells during infection with respiratory syncytial virus are mediated by IFN-gamma. Eur J Immunol, 2002. 32(8): p. 2117-23.
174. Juntti, H., et al., Cytokine responses in cord blood predict the severity of later respiratory syncytial virus infection. J Allergy Clin Immunol, 2009. 124(1): p. 52-58 e1-2.
175. Vieira, R.A., E.M. Diniz, and M.E. Ceccon, Correlation between inflammatory mediators in the nasopharyngeal secretion and in the serum of children with lower respiratory tract infection caused by respiratory syncytial virus and disease severity. J Bras Pneumol, 2010. 36(1): p. 59-66.
176. Sun, K., L. Torres, and D.W. Metzger, A detrimental effect of interleukin-10 on protective pulmonary humoral immunity during primary influenza A virus infection. J Virol, 2010. 84(10): p. 5007-14.
177. Graham, B.S., T.R. Johnson, and R.S. Peebles, Immune-mediated disease pathogenesis in respiratory syncytial virus infection. Immunopharmacology, 2000. 48(3): p. 237-47.
178. Fulton, R.B., D.K. Meyerholz, and S.M. Varga, Foxp3+ CD4 Regulatory T Cells Limit Pulmonary Immunopathology by Modulating the CD8 T Cell Response during Respiratory Syncytial Virus Infection. J Immunol, 2010. 185(4): p. 2382-92.
179. Ruckwardt, T.J., et al., Regulatory T cells promote early influx of CD8+ T cells in the lungs of respiratory syncytial virus-infected mice and diminish immunodominance disparities. J Virol, 2009. 83(7): p. 3019-28.
180. Crowe, C.R., et al., Critical role of IL-17RA in immunopathology of influenza infection. J Immunol, 2009. 183(8): p. 5301-10.
181. Hamada, H., et al., Tc17, a unique subset of CD8 T cells that can protect against lethal influenza challenge. J Immunol, 2009. 182(6): p. 3469-81.
182. Nagasawa, M., et al., Soluble TWEAK is markedly elevated in hemophagocytic lymphohistiocytosis. Am J Hematol, 2008. 83(3): p. 222-5.
References 95
183. Takada, H., et al., Increased serum levels of interferon-gamma-inducible protein 10 and monokine induced by gamma interferon in patients with haemophagocytic lymphohistiocytosis. Clin Exp Immunol, 2003. 133(3): p. 448-53.
184. Czar, M.J., et al., Altered lymphocyte responses and cytokine production in mice deficient in the X-linked lymphoproliferative disease gene SH2D1A/DSHP/SAP. Proc Natl Acad Sci U S A, 2001. 98(13): p. 7449-54.
185. Feng, L., et al., Genomic structure of the mouse Ap3b1 gene in normal and pearl mice. Genomics, 2000. 69(3): p. 370-9.
186. Feng, L., et al., The beta3A subunit gene (Ap3b1) of the AP-3 adaptor complex is altered in the mouse hypopigmentation mutant pearl, a model for Hermansky-Pudlak syndrome and night blindness. Hum Mol Genet, 1999. 8(2): p. 323-30.
187. Peden, A.A., et al., Assembly and function of AP-3 complexes in cells expressing mutant subunits. J Cell Biol, 2002. 156(2): p. 327-36.
188. Salazar, G., et al., BLOC-1 complex deficiency alters the targeting of adaptor protein complex-3 cargoes. Mol Biol Cell, 2006. 17(9): p. 4014-26.
189. Zhen, L., et al., Abnormal expression and subcellular distribution of subunit proteins of the AP-3 adaptor complex lead to platelet storage pool deficiency in the pearl mouse. Blood, 1999. 94(1): p. 146-55.
190. Badolato, R. and S. Parolini, Novel insights from adaptor protein 3 complex deficiency. J Allergy Clin Immunol, 2007. 120(4): p. 735-41; quiz 742-3.
191. Robinson, M.S., Adaptable adaptors for coated vesicles. Trends Cell Biol, 2004. 14(4): p. 167-74.
192. Shotelersuk, V., et al., A new variant of Hermansky-Pudlak syndrome due to mutations in a gene responsible for vesicle formation. Am J Med, 2000. 108(5): p. 423-7.
193. Fontana, S., et al., Innate immunity defects in Hermansky-Pudlak type 2 syndrome. Blood, 2006. 107(12): p. 4857-64.
194. Huizing, M., et al., Nonsense mutations in ADTB3A cause complete deficiency of the beta3A subunit of adaptor complex-3 and severe Hermansky-Pudlak syndrome type 2. Pediatr Res, 2002. 51(2): p. 150-8.
195. Yang, W., et al., Defective organellar membrane protein trafficking in Ap3b1-deficient cells. J Cell Sci, 2000. 113 ( Pt 22): p. 4077-86.
196. Clark, E.A., L.D. Shultz, and S.B. Pollack, Mutations in mice that influence natural killer (NK) cell activity. Immunogenetics, 1981. 12(5-6): p. 601-13.
197. McGarry, M.P., et al., Survival and lung pathology of mouse models of Hermansky-Pudlak syndrome and Chediak-Higashi syndrome. Proc Soc Exp Biol Med, 1999. 220(3): p. 162-8.
198. Young, L.R., et al., Lung-restricted macrophage activation in the pearl mouse model of Hermansky-Pudlak syndrome. J Immunol, 2006. 176(7): p. 4361-8.
199. Young, L.R., et al., Susceptibility of Hermansky-Pudlak mice to bleomycin-induced type II cell apoptosis and fibrosis. Am J Respir Cell Mol Biol, 2007. 37(1): p. 67-74.
200. Cernadas, M., et al., Lysosomal localization of murine CD1d mediated by AP-3 is necessary for NK T cell development. J Immunol, 2003. 171(8): p. 4149-55.
201. Elewaut, D., et al., The adaptor protein AP-3 is required for CD1d-mediated antigen presentation of glycosphingolipids and development of Valpha14i NKT cells. J Exp Med, 2003. 198(8): p. 1133-46.
202. Sugita, M., et al., Failure of trafficking and antigen presentation by CD1 in AP-3-deficient cells. Immunity, 2002. 16(5): p. 697-706.
203. Papadimitriou, J.M., G.R. Shellam, and J.E. Allan, The effect of the beige mutation on infection with murine cytomegalovirus: histopathologic studies. Am J Pathol, 1982. 108(3): p. 299-309.
204. Shellam, G.R., et al., Increased susceptibility to cytomegalovirus infection in beige mutant mice. Proc Natl Acad Sci U S A, 1981. 78(8): p. 5104-8.
205. Shellam, G.R., et al., The genetic background modulates the effect of the beige gene on susceptibility to cytomegalovirus infection in mice. Scand J Immunol, 1985. 22(2): p. 147-55.
References 96
206. van Dommelen, S.L., et al., Perforin and granzymes have distinct roles in defensive immunity and immunopathology. Immunity, 2006. 25(5): p. 835-48.
207. Beutler, B., http://mutagenetix.scripps.edu. 208. Elin, R.J., J.B. Edelin, and S.M. Wolff, Infection and immunoglobulin concentrations in
Chediak-Higashi mice. Infect Immun, 1974. 10(1): p. 88-91. 209. Kirkpatrick, C.E. and J.P. Farrell, Leishmaniasis in beige mice. Infect Immun, 1982.
38(3): p. 1208-16. 210. Westbroek, W., et al., Cellular defects in Chediak-Higashi syndrome correlate with the
molecular genotype and clinical phenotype. J Invest Dermatol, 2007. 127(11): p. 2674-7.
211. Zarzour, W., et al., Two novel CHS1 (LYST) mutations: clinical correlations in an infant with Chediak-Higashi syndrome. Mol Genet Metab, 2005. 85(2): p. 125-32.
212. Murphy, E. and J. Roths, Purkinje cell degeneration, a late effect of beige mutations in mice. Jackson Lab Ann Rep 1978. 49: p. 108-109.
213. Rudelius, M., et al., A missense mutation in the WD40 domain of murine Lyst is linked to severe progressive Purkinje cell degeneration. Acta Neuropathol, 2006. 112(3): p. 267-76.
214. Marker, O. and M. Volkert, Studies on cell-mediated immunity to lymphocytic choriomeningitis virus in mice. J Exp Med, 1973. 137(6): p. 1511-25.
215. McKinnon, K.P., A.H. Hale, and M.J. Ruebush, Elicitation of natural killer cells in beige mice by infection with vesicular stomatitis virus. Infect Immun, 1981. 32(1): p. 204-10.
216. Roder, J. and A. Duwe, The beige mutation in the mouse selectively impairs natural killer cell function. Nature, 1979. 278(5703): p. 451-3.
217. McIntyre, K.W. and R.M. Welsh, Accumulation of natural killer and cytotoxic T large granular lymphocytes in the liver during virus infection. J Exp Med, 1986. 164(5): p. 1667-81.
218. Okada, M. and Y. Minamishima, The efficacy of biological response modifiers against murine cytomegalovirus infection in normal and immunodeficient mice. Microbiol Immunol, 1987. 31(1): p. 45-57.
219. Roder, J.C., The beige mutation in the mouse. I. A stem cell predetermined impairment in natural killer cell function. J Immunol, 1979. 123(5): p. 2168-73.
220. Roder, J.C., et al., The beige mutation in the mouse. II. Selectivity of the natural killer (NK) cell defect. J Immunol, 1979. 123(5): p. 2174-81.
221. Baca, M.E., A.M. Mowat, and D.M. Parrott, Immunological studies of NK cell-deficient beige mice. II. Analysis of T-lymphocyte functions in beige mice. Immunology, 1989. 66(1): p. 131-7.
222. Saxena, R.K., Q.B. Saxena, and W.H. Adler, Defective T-cell response in beige mutant mice. Nature, 1982. 295(5846): p. 240-1.
223. Biron, C.A., K.F. Pedersen, and R.M. Welsh, Aberrant T cells in beige mutant mice. J Immunol, 1987. 138(7): p. 2050-6.
224. Haliotis, T., et al., Chediak-Higashi gene in humans I. Impairment of natural-killer function. J Exp Med, 1980. 151(5): p. 1039-48.
225. Klein, M., et al., Chediak-Higashi gene in humans. II. The selectivity of the defect in natural-killer and antibody-dependent cell-mediated cytotoxicity function. J Exp Med, 1980. 151(5): p. 1049-58.
226. Stinchcombe, J.C. and G.M. Griffiths, Regulated secretion from hemopoietic cells. J Cell Biol, 1999. 147(1): p. 1-6.
Danksagung 97
Acknowledgement/Danksagung Mein besonderer Dank gilt Prof. Dr. Stephan Ehl für die Bereitstellung dieses Themas und
die tolle Betreuung während meiner Doktorarbeit auch in stressigen Zeiten.
Außerdem möchte ich mich bei Prof. Dr. Hanspeter Pircher bedanken, der nicht nur meine
Arbeit betreut hat, sondern unserer kleinen Maus-Arbeitsgruppe auch ein neues Zuhause
gegeben hat.
Ich möchte mich bei ihm, allen in seiner Arbeitsgruppe und Dr. Peter Aichlele mit Gruppe
danken für die Diskussionen und Anregungen in Seminaren und die Zusammenarbeit und
Hilfsbereitschaft im 4. Stock.
Prof. Dr. Anette Schmitt-Gräff möchte ich für die Hilfe bei der Histologie danken.
Mein Dank gilt auch allen aus der AG Ehl, insbesondere Jan Rohr, Carsten Speckmann,
Andrea Maul-Pavicic, Nadja Goos und auch den ehemaligen Kollegen Stefanie Frey und
Simone Faller.
Den Mitarbeitern des Mausstalls möchte ich für die gute Pflege unserer Versuchstiere und
gute Laune im Mausstall danken.
Meiner Familie und meinen Freunden danke ich für die tolle Unterstützung, ohne die diese
Arbeit niemals möglich gewesen wäre, insbesondere Maike, die immer bereit war mit mir
über meine Arbeit zu diskutieren.