Embed Size (px)
Citation preview
TECHNISCHE UNIVERSITÄT MÜNCHEN
Klinik für Kinderkardiologie und angeborene Herzfehler des
Deutschen Herzzentrums München des Freistaates Bayern
Comparison of Accuracy of Axial Slices versus Short-Axis Slices for Measuring
Ventricular Volumes by Cardiac Magnetic Resonance in Patients with
Corrected Fallot’s Tetralogy
Annika Renate Christina Schuhbäck
Vollständiger Abdruck der von der Fakultät für Medizin der Technischen Universität
München zur Erlangung des akademischen Grades eines
Doktors der Medizin
genehmigten Dissertation.
Vorsitzender: Univ.-Prof. Dr. D. Neumeier
Prüfer der Dissertation: 1. Univ.-Prof. Dr. J. Hess, Ph. D.
2. Univ.-Prof. Dr. E. J. Rummeny
Die Dissertation wurde am 17.02.2010 bei der Technischen Universität München eingereicht
und durch die Fakultät für Medizin am 28.09.2011 angenommen.
Contents
2
Contents
Abbreviations ........................................................................................................................ 4
1 Introduction ........................................................................................................................ 6
1.1 Historical Background .................................................................................................. 6
1.2 Epidemiology ................................................................................................................ 6
1.2.1 Incidence ............................................................................................................... 7
1.2.2 Prevalence ............................................................................................................. 8
1.3 Predisposing Factors .................................................................................................... 9
1.3.1 Non-inherited Factors .......................................................................................... 10
1.3.2 Inherited Factors .................................................................................................. 10
1.4 Anatomy ...................................................................................................................... 12
1.5 Pathophysiology and Clinical Presentations .............................................................. 12
1.6 Surgical Management ................................................................................................. 16
1.7 Tools for Follow-up Examinations .............................................................................. 18
1.8 Aim of this Study ......................................................................................................... 20
2 Patients and Methods ....................................................................................................... 23
2.1 Description of the Patients .......................................................................................... 23
2.2 Methods ...................................................................................................................... 28
2.2.1 Acquisition Protocol ............................................................................................ 28
2.2.2 Image Analysis .................................................................................................... 29
2.2.3 Statistical Analysis .............................................................................................. 40
3 Results ............................................................................................................................... 43
3.1 Intraobserver Variance ............................................................................................... 43
3.1.1 Axial Slices.......................................................................................................... 43
3.1.2 Short-axis Slices .................................................................................................. 45
3.1.3 Axial vs. Short-axis Slices ................................................................................... 47
3.2 Interobserver Variance ............................................................................................... 48
3.2.1 Axial Slices.......................................................................................................... 48
3.2.2 Short-axis Slices .................................................................................................. 49
3.2.3 Axial vs. Short-axis Slices ................................................................................... 50
3.3 Intra- vs. Interobserver Variance ................................................................................ 51
3.4 Axial vs. Short-axis Orientation (median values) ................................................................... 52
Contents
3
3.5 Number of Breath Holds ............................................................................................. 54
3.6 Blood Flow Measurements.......................................................................................... 54
4 Discussion ......................................................................................................................... 56
4.1 Patient Group ............................................................................................................. 56
4.2 Methodical Aspects ..................................................................................................... 57
4.2.1 Limitations in the Image Analysis: Volume Measurement .................................. 57
4.2.2 Limitations in the Image Analysis: Blood Flow Measurement .................................... 60
4.3 Results......................................................................................................................... 61
4.3.1 Comparison of Axial and Short-axis Slices for Routine Clinical Measurement
of RV and LV Volumes in Patients with Corrected TOF/VSD+PA ................... 61
4.3.2 Comparison of Blood Flow Measurements .......................................................... 64
4.4 Concluding Remarks ................................................................................................... 66
5 Summary........................................................................................................................... 67
6 Zusammenfassung ............................................................................................................ 68
7 References ......................................................................................................................... 70
8 Figures .............................................................................................................................. 79
9 Tables ................................................................................................................................ 81
Acknowledgements.............................................................................................................. 82

Abbreviations
4
Abbreviations
BSA body surface area
CHD congenital heart disease
cm centimeter
ECG electrocardiogram
ED end-diastolic
EDV end-diastolic volume
EF ejection fraction
e.g. for example
etc. et cetera
ES end-systolic
ESV end-systolic volume
kg kilogram
LPA left pulmonary artery
LV left ventricle
LVOT left ventricular outflow tract
m meter
m² meters squared
ml milliliter
mm millimeter
MPA main pulmonary artery
MRI magnetic resonance imaging
MRT Magnetresonanztomographie
msec millisecond

Abbreviations
5
p. page
PA pulmonary atresia
PV phase-velocity
R² regression coefficient
RPA right pulmonary artery
RV right ventricle
RVOT right ventricular outflow tract
sax short-axis
SDD standard deviation of the differences
sec second
SV stroke volume
TE time to echo
TOF Tetralogy of Fallot
TR time of repetition
tric. reg. tricuspid regurgitation
vs. versus
VSD ventricular septal defect
yrs years
Introduction
6
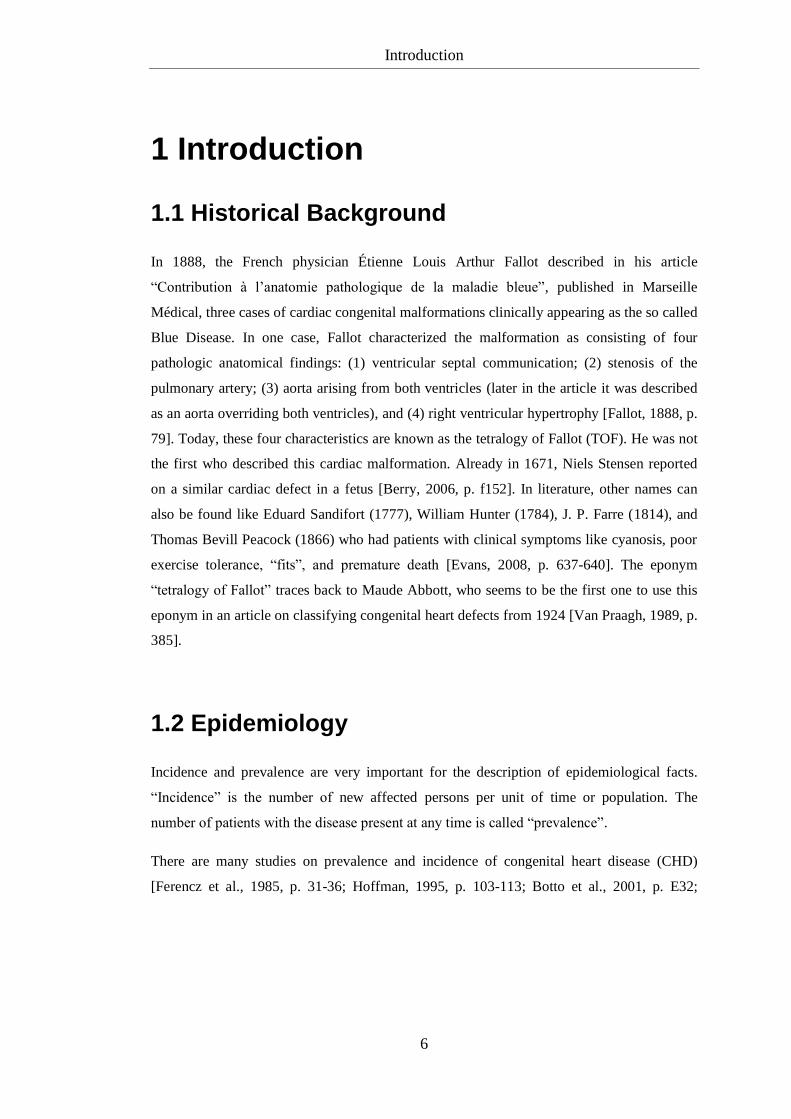
1 Introduction
1.1 Historical Background
In 1888, the French physician Étienne Louis Arthur Fallot described in his article
“Contribution à l’anatomie pathologique de la maladie bleue”, published in Marseille
Médical, three cases of cardiac congenital malformations clinically appearing as the so called
Blue Disease. In one case, Fallot characterized the malformation as consisting of four
pathologic anatomical findings: (1) ventricular septal communication; (2) stenosis of the
pulmonary artery; (3) aorta arising from both ventricles (later in the article it was described
as an aorta overriding both ventricles), and (4) right ventricular hypertrophy [Fallot, 1888, p.
79]. Today, these four characteristics are known as the tetralogy of Fallot (TOF). He was not
the first who described this cardiac malformation. Already in 1671, Niels Stensen reported
on a similar cardiac defect in a fetus [Berry, 2006, p. f152]. In literature, other names can
also be found like Eduard Sandifort (1777), William Hunter (1784), J. P. Farre (1814), and
Thomas Bevill Peacock (1866) who had patients with clinical symptoms like cyanosis, poor
exercise tolerance, “fits”, and premature death [Evans, 2008, p. 637-640]. The eponym
“tetralogy of Fallot” traces back to Maude Abbott, who seems to be the first one to use this
eponym in an article on classifying congenital heart defects from 1924 [Van Praagh, 1989, p.
385].
1.2 Epidemiology
Incidence and prevalence are very important for the description of epidemiological facts.
“Incidence” is the number of new affected persons per unit of time or population. The
number of patients with the disease present at any time is called “prevalence”.
There are many studies on prevalence and incidence of congenital heart disease (CHD)
[Ferencz et al., 1985, p. 31-36; Hoffman, 1995, p. 103-113; Botto et al., 2001, p. E32;
Introduction
7
Warnes et al., 2001, p. 1170-1175; Hoffman and Kaplan, 2002, p. 1890-1900; Hoffman et
al., 2004, p. 425-439; Schwedler et al., 2005; Marelli et al., 2007, p. 163-172].
1.2.1 Incidence
The incidence of CHD varies from study to study. Usually, the total incidence and the
proportions of different CHDs are estimated, but often only one result is presented [Hoffman
and Kaplan, 2002, p. 1890]. In 1995, Hoffman analyzed 29 studies on the incidence of CHD.
In early studies, the incidence ranges between 4 to 5 per 1,000 live births and 12 per 1,000
live births [Hoffman, 1995, p. 105]. Even incidence of 14 per 1,000 live births was reported
by Hoffman in 2002 [Hoffman and Kaplan, 2002, p. 1891]. The lower incidence may be due
to a considerable under-ascertainment of CHD because of the fact that only patients with
severe CHD were included. The higher incidence data probably result from an unusually
high incidence, the inclusion of more mild forms of CHD, localized region findings
[Hoffman, 1995, p. 106], or the access to better diagnostic methods like better
echocardiography and color-Doppler echocardiography [Hoffman and Kaplan, 2002, p.
1891]. Another problem in estimating the incidence is that in some patients with CHD
symptoms become clinically relevant in later years and not shortly after birth. Others with
severe critical CHD may die within the first few days after birth. Without autopsy, a true
diagnosis cannot be made and therefore, those patients may not be included in the incidence
of CHD. [Hoffman and Kaplan, 2002, p. 1891] But generally it can be said, that the
incidence of CHD remains in general similar all over the world [Hoffman et al., 2004, p.
426].
The incidence of tetralogy of Fallot (TOF) is about 3 to 4 per 10,000 live births [Hoffman
and Kaplan, 2002, p. 1896].
Introduction
8
1.2.2 Prevalence
As prevalence is related to the survival rate, it must be noted that actual data on the
prevalence of patients with a corrected or uncorrected lesion depend on how many of these
patients had been treated surgically [Hoffman et al., 2004, p. 426] and when. In 1939,
surgical treatment of CHD began with the closure of a patent ductus arteriosus [Gross and
Hubbard, 1984, p.729-731]. Alfred Blalock and Helen Taussig were the first ones who
reported on an aortopulmonary shunt procedure in 1945 [Blalock and Taussig, 1984, p. 189-
202]. With the invention of the heart-lung machine by John Gibbon, open-heart surgery with
cardio-pulmonary bypass became possible. His first open-heart surgery was the closure of an
atrial septal defect in 1953 [DeBakey, 2003, p. S2190]. It is important to know, that the right
moment for surgery must be chosen as surgical outcomes are down to the age at the time of
surgery. Surgical results in older patients are often less favorable than at younger age.
Information on the number of patients who had been or had not been surgically treated in the
earlier years is difficult to obtain. Therefore, only estimation of actual prevalence can be
made, which can be assumed to lie between the proportion of patients with treated and
untreated lesions, moving closer to the proportion that had had surgery in the later years.
[Hoffman et al., 2004, p. 426]
„The reported prevalence of congenital heart disease varies between 4 and 10 per 1,000 live
births.” [Ferencz et al., 1985, p. 36; Warnes et al., 2001, p. 1170; Marelli et al., 2007, p. 163]
This variation may be due to different inclusion and exclusion criteria [Warnes et al., 2001,
p. 1170] and the period of time the study was performed. Another reported fact is that the
prevalence of CHD seems to be increasing [Botto et al., 2001, p. E32 p. 3; Hoffman et al.,
2004, p. 436; Marelli et al., 2007, p. 166]. Reasons for that may be changes in the
distribution of risk factors [Botto et al., 2001, p. E32 p. 1], better diagnostic procedures such
as the prenatal diagnosis of heart defects with an earlier diagnosis rate and better availability
of 2-dimensional and color-Doppler echocardiography [Botto et al., 2001, p. E32 p. 3-7],
better therapy possibilities [Hoffman and Kaplan, 2002, p. 1890; Schwedler et al., 2005] and
surgical treatment.
In 2005, Schwedler et al. from the German Competence Network for Congenital Heart
Disease published their data for the time period 2000 to 2004. There were 8,117 registered
Introduction
9
patients (3,932 female and 4,185 male) alive with a CHD in Germany in March in 2005
representing 0.5 persons per 1,000 live births with a CHD. As this data is lower than data
described in literature, it must be assumed that the data collection is incomplete and
therefore, predictions of the general population cannot be obtained at the moment.
Furthermore, the registered data vary from region to region. [Schwedler et al., 2005]
In the studies, the data is often divided into three categories: simple or mild CHD, moderate
CHD and severe or complex CHD. TOF as a cyanotic CHD is usually categorized as severe
or complex CHD. [Botto et al., 2001, p. E32; Hoffman and Kaplan, 2002, p. 1890-1900;
Hoffman et al., 2004, p. 425-439; Marelli et al., 2007, p. 163-172] Only Warnes and
Liberthson categorized TOF as moderate CHD [Warnes et al., 2001, p. 1170-1175]. In
literature, the prevalence of TOF is also increasing. Botto et al. reported a prevalence of 3.8
per 10,000 births for the time period 1968 to 1997 [Botto et al., 2001, p. E32 p.2]. The
Baltimore-Washington Infant Study collected data of the years 1981 to 1982. Prevalence for
this period was 2.62 per 10,000 live births [Ferencz et al., 1985, p. 32]. For the period from
1995 to 1997, this rate is quoted with 4.7 per 10,000 births [Botto et al., 2001, p. E32 p. 2].
In 2007, Marelli et al. published prevalence data of the population of Quebec (Canada) for
the year 2000. There were 6.6 of 10,000 persons in the general population of Quebec alive
with TOF (1.7 per 10,000 adults and 4.9 per 10,000 children) [Marelli et al., 2007, p. 166].
According to Schwedler et al., 7.5 % of all CHDs in the entire German birth cohort (2000 –
2004) were cases with TOF.
1.3 Predisposing Factors
There are many factors involved in the development of CHD and they can be distinguished
between non-inherited and inherited factors.
Introduction
10
1.3.1 Non-inherited Factors
In 2007, Jenkins et al. summarized the current state of knowledge of non-inherited risk
factors for the development of CHDs. Looking for factors especially in conjunction with
TOF, it can be mentioned, that maternal phenylketonuria, organic solvents, cigarette
smoking, carbon monoxide in the air, reproductive problems, and the paternal age play a role
in the formation of TOF. Of course, these risk factors are not alone associated with TOF but
also with other CHDs, and there is often skepticism regarding the study design with possible
methodological issues or the limited number of studies on that topic. It must be kept in mind
that results may be due to chance, bias or, confounding. [Jenkins et al., 2007, p. 2995-3014]
The risk of maternal phenylketonuria can be reduced by a strict diet control before
conception and during pregnancy. Organic solvents tend to be a risk factor for multiple
CHDs like TOF. The same can be said for cigarette smoking and in the authors’ opinion
more research is needed. There are studies, which emphasize the role of carbon monoxide in
the air in the formation of TOF, but further studies are needed to determine whether these
associations are true or due to chance or bias. There is an association between reproductive
problems and the development of TOF, but it remains uncertain if this is the result of
teratogenic exposures or of inherent increased susceptibility. Paternal age may also be of
importance for the development of CHDs, and especially for TOF, there seems to be an
increased risk for men ≥ 25 years. [Jenkins et al., 2007, p. 2997, 3005-3007]
An intake of multivitamins containing folic acid can reduce the risk of CHDs by ≈ 25 % to
≈ 60 %. The intake should ideally be started periconceptionally. [Jenkins et al., 2007, p.
2996f]
1.3.2 Inherited Factors
The current knowledge (2007) of the genetic basis of CHDs was summarized by Pierpont et
al., but it should be remembered that human cardiovascular genetics is a very young field of
research and is changing rapidly. So far, some genes have been found to be linked to TOF:
ZFPM2/FOG2, NKX2.5 and JAG1. There are not only single gene mutations, but there are
Introduction
11
also chromosomal disorders, which can be associated with CHDs. [Pierpont et al., 2007, p.
3015-3038]
Mutations of ZFPM2/FOG2 gene on chromosome 8q22 are found in sporadic cases of TOF.
The mechanism by which the mutations impair the ZFPM2/FOG2 function is not clear at the
moment. Pizzuti et al. suggest that the structural change due to the mutations alters the
protein-protein contacts made by ZFPM2/FOG2, or reduces its stability. [Pizzuti et al., 2003,
p. 375] Goldmuntz et al. screened patients with sporadic TOF for gene mutations of the
transcription factor NKX2.5. The gene is located on chromosome 5q34-q35. They concluded
that these mutations occur in ≈ 4 % of all patients with TOF. Results of the study are limited
to a small number of mutation-positive patients. Therefore, a genotype/phenotype correlation
is of restricted significance. [Goldmuntz et al., 2001, p. 2565-2568] McElhinney et al. found
JAG1 mutations in patients with TOF and Alagille syndrome. JAG1 is located on
chromosome 20p12 and encodes a ligand in the Notch signaling pathway. In this study,
patients with TOF had more severe forms like TOF with pulmonary atresia or major
aortopulmonary collateral arteries, but it must be pointed out that there were only a limited
number of patients. As JAG1 mutations also occur in patients with Alagille syndrome and
other cardiovascular anomalies, it is most likely that additional epigenetic factors or genetic
background influencing the final cardiac phenotype exist. [McElhinney et al., 2002, p. 2567-
2574]
Known chromosomal disorders, which can be found in patients with TOF are: deletion 4p
(Wolf-Hirschhorn syndrome), deletion 8p syndrome, trisomy 9, trisomy 18 (Edwards
syndrome), trisomy 21 (Down syndrome), deletion 20p12 (Alagille syndrome), and deletion
22q11 (DiGeorge syndrome) [Pierpont et al., 2007, p. 3028].
Testing patients with TOF for their genetic pattern is relevant for the clinician as this could
be of importance because of other organ system involvement, prognostic information for
clinical outcomes, reproductive risks the family should know about, and the possibility to
test other family members [Pierpont et al., 2007, p. 3016].
Introduction
12
1.4 Anatomy
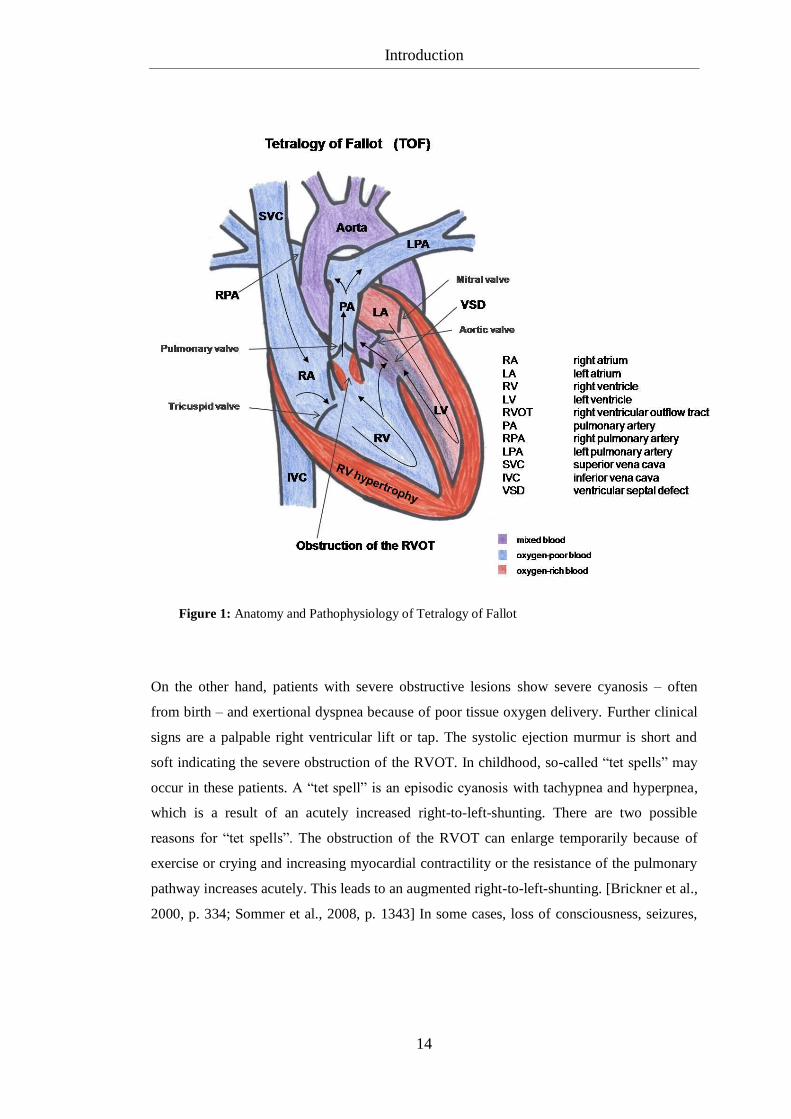
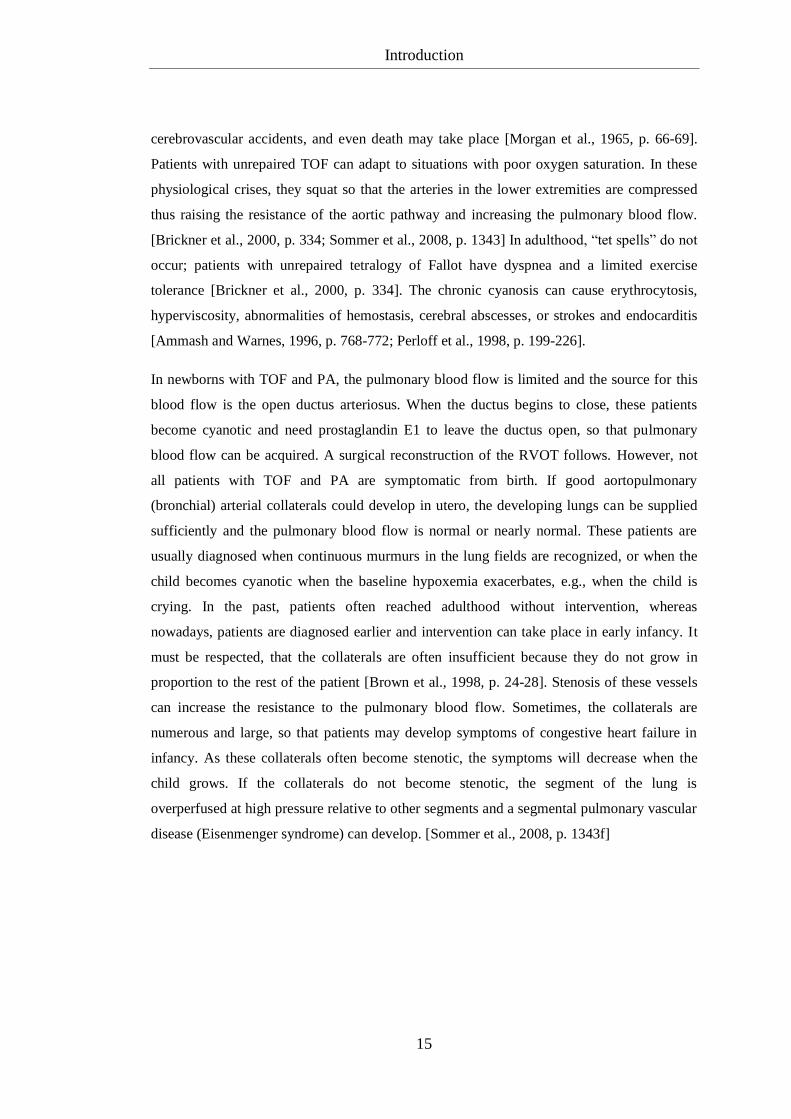
The tetralogy of Fallot consists of four characteristic components as described in 1.1: a
ventricular septal defect (VSD), an overriding aorta, an obstruction of the right ventricular
outflow tract (RVOT) because of a stenosis of the pulmonary artery (subvalvular, valvular,
or supravalvular), and a resulting right ventricular hypertrophy (figure 1, p. 14). Variants
with a pulmonary atresia (PA) or an absent pulmonary valve also exist. Anatomic
abnormalities like a right aortic arch, an atrial septal defect (so-called pentalogy of Fallot)
[Rao et al., 1971, p. 361-371], and coronary arterial anomalies [Dabizzi et al., 1990, p. 692-
704] can also occur in patients with TOF.
The terminal portion of the spiral septum seems to play a fundamental role in the formation
of this congenital heart defect during the embryological development. This septum divides
the primitive truncus arteriosus from the pulmonary artery. Because of a rightward and
anterior displacement of this muscle bundle, the correct fusion with the growing muscular
ventricular septum is not possible and as a result the RVOT is narrowed. However, the aortic
root can extend over the RVOT, which is described as the “overriding aorta”. Due to an
enlarged afterload, the right ventricle begins to hypertrophy. [Sommer et al., 2008, p. 1342f]
The spiral septum malalignement of patients with a tetralogy of Fallot with Pulmonary
Atresia (PA) is so severe, that the pulmonary valve may be atretic or the main pulmonary
artery trunk may not form [Sommer et al., 2008, p. 1343].
1.5 Pathophysiology and Clinical Presentations
As a consequence of the anatomy, in patients with tetralogy of Fallot, the blood ejected from
the right ventricle can flow through its anatomically aligned outflow tract and into the main
pulmonary artery (MPA) or through the VSD to the left outflow tract and then through the
aorta. The blood of the left ventricle can flow through the aorta or through the VSD and then
into the MPA. The flow through the VSD is called “shunting”. The shunting direction
depends on the relative resistance of each pathway and the fact, that a large VSD creates an
Introduction
13
almost equal pressure in both ventricles. [Brickner et al., 2000, p. 334; Sommer et al., 2008,
p. 1343]
Most patients with TOF have a right-to-left shunting because of the obstruction of the
RVOT, which leads to a high resistance pathway from the right ventricle (RV) to the lungs.
Hence, the greater part of the systemic venous blood crosses to the aorta and the smaller part
flows into the MPA. As a result, the blood in the aorta consists of oxygen saturated
pulmonary venous blood and systemic venous blood which causes the systemic arterial
desaturation. [Sommer et al., 2008, p. 1343] This is illustrated in figure 1 on the next page.
The resistance of the pulmonary path varies from patient to patient, as obstructive lesions can
be mild or severe.
On the one hand, patients with mild obstructive lesions will show lesser cyanotic symptoms
or may even be without any symptoms at all. Almost all blood of the RV flows into the
MPA, only a small part flows through the VSD into the aorta. Systemic and pulmonary
blood flow will be nearly equal. As the obstruction of the RVOT causes flow turbulences, a
systolic ejection murmur can be audible along the left sternal border. These patients are often
detected by this murmur. [Brickner et al., 2000, p. 334; Sommer et al., 2008, p. 1343]
Introduction
14
On the other hand, patients with severe obstructive lesions show severe cyanosis – often
from birth – and exertional dyspnea because of poor tissue oxygen delivery. Further clinical
signs are a palpable right ventricular lift or tap. The systolic ejection murmur is short and
soft indicating the severe obstruction of the RVOT. In childhood, so-called “tet spells” may
occur in these patients. A “tet spell” is an episodic cyanosis with tachypnea and hyperpnea,
which is a result of an acutely increased right-to-left-shunting. There are two possible
reasons for “tet spells”. The obstruction of the RVOT can enlarge temporarily because of
exercise or crying and increasing myocardial contractility or the resistance of the pulmonary
pathway increases acutely. This leads to an augmented right-to-left-shunting. [Brickner et al.,
2000, p. 334; Sommer et al., 2008, p. 1343] In some cases, loss of consciousness, seizures,
Figure 1: Anatomy and Pathophysiology of Tetralogy of Fallot
Introduction
15
cerebrovascular accidents, and even death may take place [Morgan et al., 1965, p. 66-69].
Patients with unrepaired TOF can adapt to situations with poor oxygen saturation. In these
physiological crises, they squat so that the arteries in the lower extremities are compressed
thus raising the resistance of the aortic pathway and increasing the pulmonary blood flow.
[Brickner et al., 2000, p. 334; Sommer et al., 2008, p. 1343] In adulthood, “tet spells” do not
occur; patients with unrepaired tetralogy of Fallot have dyspnea and a limited exercise
tolerance [Brickner et al., 2000, p. 334]. The chronic cyanosis can cause erythrocytosis,
hyperviscosity, abnormalities of hemostasis, cerebral abscesses, or strokes and endocarditis
[Ammash and Warnes, 1996, p. 768-772; Perloff et al., 1998, p. 199-226].
In newborns with TOF and PA, the pulmonary blood flow is limited and the source for this
blood flow is the open ductus arteriosus. When the ductus begins to close, these patients
become cyanotic and need prostaglandin E1 to leave the ductus open, so that pulmonary
blood flow can be acquired. A surgical reconstruction of the RVOT follows. However, not
all patients with TOF and PA are symptomatic from birth. If good aortopulmonary
(bronchial) arterial collaterals could develop in utero, the developing lungs can be supplied
sufficiently and the pulmonary blood flow is normal or nearly normal. These patients are
usually diagnosed when continuous murmurs in the lung fields are recognized, or when the
child becomes cyanotic when the baseline hypoxemia exacerbates, e.g., when the child is
crying. In the past, patients often reached adulthood without intervention, whereas
nowadays, patients are diagnosed earlier and intervention can take place in early infancy. It
must be respected, that the collaterals are often insufficient because they do not grow in
proportion to the rest of the patient [Brown et al., 1998, p. 24-28]. Stenosis of these vessels
can increase the resistance to the pulmonary blood flow. Sometimes, the collaterals are
numerous and large, so that patients may develop symptoms of congestive heart failure in
infancy. As these collaterals often become stenotic, the symptoms will decrease when the
child grows. If the collaterals do not become stenotic, the segment of the lung is
overperfused at high pressure relative to other segments and a segmental pulmonary vascular
disease (Eisenmenger syndrome) can develop. [Sommer et al., 2008, p. 1343f]
Introduction
16
Regarding the heart sounds, the first heart sound is normal whereas the second is single as
the pulmonary component is inaudible. Because of the overriding and dilated aorta, an aortic
ejection click can sometimes be heard. [Brickner et al., 2000, p. 334]
On chest X-rays, the heart is of normal or small size, and the lung markings are diminished.
The classical form is a so-called “boot-shaped” heart, the right ventricular apex is upturned
and the segment of the MPA is concave. The aortic arch may be right-sided. [Brickner et al.,
2000, p. 334]
In the electrocardiogram (ECG), the sign for right ventricular hypertrophy is a right-axis
deviation of the heart position [Brickner et al., 2000, p. 334].
Diagnosis, presence of associated abnormalities, the level and severity of the obstruction of
the RVOT, the anatomical features of the MPA with right pulmonary artery (RPA) and left
pulmonary artery (LPA), and the number and location of VSDs can be illustrated with
echocardiography [Tworetzky et al., 1999, p. 228-233], and nowadays also with magnetic
resonance imaging (MRI). The shunting can also be shown with both methods.
Catheterization can confirm the diagnosis, show the anatomical features and obtain further
information on hemodynamics [Soto and McConnell, 1990, p. 851-857]. Especially for the
preoperative management, it is important to check for anatomical variants like a conus
branch right coronary artery over the RVOT complicating the surgical repair.
1.6 Surgical Management
At the moment, patients with an unrepaired tetralogy of Fallot should undergo surgical
correction with closure of the VSD and removal of the RVOT obstruction.
Ideally, surgical repair should be done as early as possible in infancy if anatomy is suitable
[Presbitero et al., 1996, p. 1873; Rammohan et al., 1998, p. 126; Pigula et al., 1999, p. II-
157]. The mortality associated with surgery is less than 3.0 percent in children [Touati et al.,
1990, p. 396-402]. Early anatomic correction is advantageous as the stimulus for right
ventricular hypertrophy is removed, the cyanosis can decrease and thus the myocardial
Introduction
17
function is preserved [Pigula et al., 1999, p. II-157]. Kaulitz et al. described in their study
that with the restoration of normal pressures and flows, the development of the proximal
pulmonary arterial system was normal in most of their patients [Kaulitz et al., 2001, p. 391-
398]. Patients who underwent surgery in infancy often need to be operated again later. The
need for reoperation depends on the anatomy. Patients with TOF and PA need earlier
reoperations because a homograft had been implanted to restore the right ventricle to the
pulmonary artery continuity and this homograft needs changing after some years. [Pigula et
al., 1999, p. II-160] Moreover, these operated patients need long-term follow-up
examinations to keep an eye on possibly occurring complications like arrhythmias, decrease
in right ventricular function [Pigula et al., 1999, p. II-160], and regurgitation of the
pulmonary artery [Kirklin et al., 1989, p. 783-791].
Adults with uncorrected TOF can be operated, and the surgical repair also shows good
results. The mortality associated with surgery is between 2.5 and 8.5 percent [Presbitero et
al., 1996, p. 1870-1873; Rammohan et al., 1998, p. 121-128]. After surgical repair, these
patients must be followed up to take care of possibly occurring complications –
hemodynamic abnormalities and significant rhythm disturbances – which are almost the
same as in patients who had been corrected in infancy [Presbitero et al., 1996, p. 1872f].
Besides the complete surgical correction, palliative procedures such as aorta-to-pulmonary
artery shunts and balloon pulmonary valvuloplasty also exist. These procedures are only
performed in patients with severe forms of TOF where a total correction is not possible.
With these palliative methods, patients get an increased pulmonary blood flow and the
pulmonary arteries can enlarge. Complete surgical correction may be done later. For the
moment, arterial saturation can be improved, and symptoms can be reduced. However, it
must be kept in mind that experiences with these palliations only exist for children and not
for adults. An acute increase of the pulmonary blood flow implies an increase of the
pulmonary venous return. This leads to an acute volume load on the left ventricle (LV),
which may be less compliant in adults and therefore may lead to problems in handling the
volume load as easily as the pediatric ventricle. As a consequence, symptoms of congestive
heart failure may occur in these adult patients. [Sluysmans et al., 1995, p. 1506-1511;
Brickner et al., 2000, p. 335; Sommer et al., 2008, p. 1343]
Introduction
18
Patients with corrected TOF can develop complications years after surgical repair. This can
be pulmonary regurgitation resulting from surgical correction of the RVOT [Zahka et al.,
1988, p. Suppl. III: III-14-19; Rowe et al., 1991, p. 461-466]. This regurgitation can be
tolerated for a long time, but the right ventricle begins to enlarge after some time possibly
leading to tricuspid regurgitation and right ventricular dysfunction. Patients will be reduced
in their exercise tolerance. At this moment, the pulmonary valve might need to be repaired or
replaced [Finck et al., 1988, p. 610-613]. Other complications are an aneurysm which may
form at the site where the RVOT was repaired, recurrent obstruction of the RVOT, residual
defects, arrhythmias, very rarely regurgitation of the aorta and decrease in left ventricular
function [Presbitero et al., 1996, p. 1872f; Brickner et al., 2000, p. 336]. Therefore, all
patients with TOF – corrected or not – should undergo periodic follow-up examinations as
the most important question for intervention and reoperation is the exact timing.
1.7 Tools for Follow-up Examinations
Due to an improvement in the surgical technique over the last decades, approximately 85 %
of all children born with cardiovascular anomalies can reach adulthood today and this
number will probably increase in the next years [Moller et al., 1994, p. 923-930]. Patients
with CHDs need periodic follow-up examinations in order to diagnose possibly occurring
complications. Complications (e.g., significant arrhythmias, ventricular dysfunction,
significant valve regurgitation, and infective endocarditis [Landzberg et al., 2001, p. 1191])
are a result of the underlying anatomic abnormalities, chamber dilation and progressive
fibrosis, previous surgical incisions, and a compromised hemodynamic status [Warnes et al.,
2001, p. 1174]. Patients with simple lesions should receive follow-up examinations every
three to five years, whereas patients with moderate or complex lesions (TOF belongs to this
group) every 12 to 24 months and patients with a complex anatomy and physiology every 6
to 12 months [Landzberg et al., 2001, p. 1191f]. Adult patients often do not feel
symptomatic, as they have adapted to their chronic condition and do not exercise beyond
their limits. Therefore, patients with CHD should be tested and critically evaluated regarding
their functional class and their ventricular function. This will help to determine when
Introduction
19
intervention is needed and to estimate risk and success. Tools for follow-up examinations
are: cardiac catherization, transthoracic and transesophageal echocardiography,
electrophysiological examinations, spiroergometry, computed tomography and magnetic
resonance imaging. [Warnes et al., 2001, p. 1173]
For the past 50 years, the “gold standard” for diagnosing CHDs has been cardiac
catheterization. Since the last 20 years, this technique has been complemented by
noninvasive diagnostic alternatives such as echocardiography, and more recently by
computed tomography and magnetic resonance imaging. Nowadays, cardiac catheterization
is used to resolve specific issues concerning operative interventions. Among these are the
preoperative evaluation of the coronary arteries, the assessment of pulmonary vascular
disease and its response to vasoactive agents, and additionally the assessment of morphology
and function. [Warnes et al., 2001, p. 1175] However, the measurement of RV volumes is
not possible with cardiac catheterization.
Due to improvements in echocardiography, this tool is often used to provide information on
cardiac function at follow-up examinations either as transthoracic echocardiography in most
of the cases or as transesophageal echocardiography in special cases. As a high rate of
diagnostic errors in pediatric echocardiograms exists [Stanger et al., 1999, p. 908-914], this
method depends on the expertise of the interpreting physician and the technology used.
[Warnes et al., 2001, p. 1175] The measurement of RV volumes is also not possible with
echocardiography.
Electrophysiological examinations play a role in the localization of atrial or ventricular
arrhythmias, which often occur in patients with CHD years after surgical repair. Arrhythmias
seem to be responsible for the increased morbidity and mortality in these patients. [Warnes et
al., 2001, p. 1174]
Magnetic resonance imaging is a relatively new technique for the determination of the
ventricular volumes and the cardiac function in follow-up examinations. This method allows
the measurement of both ventricular volumes, particularly the RV volume playing an
important role in the long-term follow-up of patients with TOF.
Introduction
20
1.8 Aim of this Study
RV and LV volumes and function need to be reliably measured in the long-term follow-up of
patients with CHD [Lorenz et al., 1995, p. II-233-239; Pattynama et al., 1995, p. 53-63;
Discigil et al., 2001, p. 344-351; Hazekamp et al., 2001, p. 667-670]. Magnetic resonance
imaging is considered to be the best method available to measure RV and LV volumes
[Sechtem et al., 1987, p. 697-702; Mogelvang et al., 1988, p. 529-533; Mackey et al., 1990,
p. 529-532; Pattynama et al., 1995, p. 53-63]. However, to date no standard protocol to
measure RV volumes by MRI exists. A standard protocol only exists for the LV [Ostrzega et
al., 1989, p. 444-452; Sakuma et al., 1993, p. 377-380; Gutberlet et al., 2003, p. 942-951;
Hendel et al., 2006, p. 1475-1497; Kramer et al., 2008, p. 1-10]. It measures LV volumes
acquired from a stack of short-axis images parallel to the mitral valve and covering the entire
heart [Rominger et al., 1999, p. 908-918; Alfakih et al., 2004, p. 1813-1822]. The RV
volume data are available as a by-product of the LV volume short-axis acquisition [Alfakih
et al., 2004, p. 1813-1822]. However, these slices are not RV short-axis slices. Due to the
complex shape of the RV, true RV short-axis slices do not exist. Therefore, using these slices
to measure RV volumes comes with potential problems. The main problem is that the
pulmonary and tricuspid valves cannot be clearly identified making the basal boundary of the
RV difficult to trace. Because the basal slice has a large area, this can be a significant source
of error. This problem becomes larger the more complex the RV morphology and pathology
becomes.
Some have suggested an alternative simple method to measure RV volumes. This alternative
method uses axial slices through the patient´s chest from the valves of the great arteries to
the diaphragm [Helbing et al., 1995, p. 828-837; Niwa et al., 1996, p. 567-575; Alfakih et al.,
2003, p. 323-329; Oosterhof et al., 2005, p. 383-389]. In normal individuals, RV volume
measurements made from axial slices are feasible [Sechtem et al., 1987, p. 697-702; Helbing
et al., 1995, p. 828-837] and have a superior reproducibility [Alfakih et al., 2003, p. 25-32]
compared to conventional short-axis slices. Patients with CHD often have a complex
anatomy and in these cases axial slices are easier to plan and can often obtain valuable
morphologic information without need for further scans. However, the reproducibility of
Introduction
21
measuring LV volumes from axial slices has never been studied, to the best of our
knowledge, neither in normal individuals nor in patients with CHD.
In summary, the best slice orientation for routine clinical measurement of RV and LV
volumes remains unknown in patients with TOF/VSD+PA.
Phase velocity cine MRI is an accurate technique to measure blood flow volumes and has
been studied previously [Bogren et al., 1989, p. 990-999; Rees et al., 1989, p. 953-956;
Caputo et al., 1991, p. 693-698; Kondo et al., 1992, p. 751-758; Rebergen et al., 1993, p.
123-131; Rebergen et al., 1993, p. 1439-1456; Rebergen et al., 1993, p. 2257-2266;
Rebergen et al., 1996, p. 467-481; Powell et al., 2000, p. 104-110]. Some important
advantages compared to echocardiography have been described in several studies, e.g.,
independence of image quality from operator finesse and body habitus of patients and a
wider field of view [Higgins et al., 1988, p. 21-28; Rebergen et al., 1993, p. 2263; Rebergen
et al., 1993, p. 1439-1456; Task Force of the European Society of Cardiology, in
Collaboration with the Association of European Paediatric Cardiologists, 1998, p. 19-39].
Establishing blood flow parameters for patients with corrected TOF/VSD+PA is a relevant
part of follow-up examinations, as pulmonary regurgitation is a common complication after
surgical correction [Jones et al., 1973, p. 11-18; Kirklin et al., 1989, p. 783-791; Rebergen et
al., 1993, p. 2257-2266; Niezen et al., 1996, p. 135-140; Discigil et al., 2001, p. 344-351;
Kang et al., 2003, p. 2938-2943]. In 1993, Rebergen et al. emphasized the use of MRI
velocity mapping as an accurate non-invasive method for volumetric quantitation of
pulmonary regurgitation in patients with TOF [Rebergen et al., 1993, p. 2262]. In 1996,
Niezen et al. demonstrated that the forward pulmonary blood flow closely corresponds to the
RV and LV stroke volume (SV) measured in transverse plane orientation in patients with
corrected TOF [Niezen et al., 1996, p. 137]. Kang et al. found that differential regurgitation
is common in the branch pulmonary arteries and showed that regurgitation seems to be
higher in the LPA than in the RPA [Kang et al., 2003, p. 2938-2943]. However, until now, to
the best of our knowledge, no one has compared the blood flow volume of the MPA with the
RV SV, the blood flow volume of the aorta with the LV SV measured in axial as well as in
short-axis slice orientation for patients with corrected TOF/VSD+PA. Powell et al. presented
a good correlation between the velocity blood flow volumes of MPA and aorta in a small and
Introduction
22
very heterogeneous group of patients with CHD [Powell et al., 2000, p. 104-110], but
without patients with TOF. Therefore, until now, to the best of our knowledge, no one has
compared the net forward blood flow of the MPA with the net forward blood flow of the
aorta and the net forward blood flow of the MPA with the sum of the net forward blood flow
of RPA and LPA in patients with TOF/VSD+PA.
In summary, blood flow parameters for the net and forward blood flow of aorta, MPA, RPA
and LPA have never been studied systematically in patients with TOF/VSD+PA.
Therefore, the first aim of this study was to determine whether short-axis or axial slices
should be the method of choice for the routine clinical measurement of RV and LV volumes
in patients with TOF. Therefore, RV and LV volumes were measured by two investigators,
and intra- and interobserver variances were analyzed.
The second aim was to compare the net forward blood flow of the MPA with that of the
aorta and with the sum of the net forward blood flow of the RPA and the LPA and to study
the blood flow volumes of the MPA and the aorta in comparison to the corresponding
ventricular stroke volumes measured in both slice orientations.
Patients and Methods
23
2 Patients and Methods
2.1 Description of the Patients
Cardiac MRI data of 84 consecutive patients (40 female and 44 male) with corrected TOF
(72 patients) or corrected combination of VSD and PA with no residual VSD (12 patients)
who underwent routine clinical MRI after having given informed consent at the Department
of Paediatric Cardiology and Congenital Heart Disease at the German Heart Center Munich
were collected between September, 1st, 2006 and January, 31
st, 2008. Data collection was
planned prior to the performance of the cardiac MRI study (prospective study). The study
protocol was approved by the institutional review board and the ethics committee of the
Technical University Munich. Patients with a tricuspid regurgitation higher than grade two in
the echocardiography were excluded. Other exclusion criteria included missing MRI data
(e.g., incomplete data sets for the volume measurements or missing data for blood flow
measurements) due to aborted examination because of claustrophobia or bad condition of the
patient and bad image quality due to massive problems in the ECG triggering because of
cardiac arrhythmia (too many extrasystoles, bundle branch block, atrial fibrillation, etc.) or
extreme changes of heart rate during the examination making the feasibility of the MRI
study impossible.
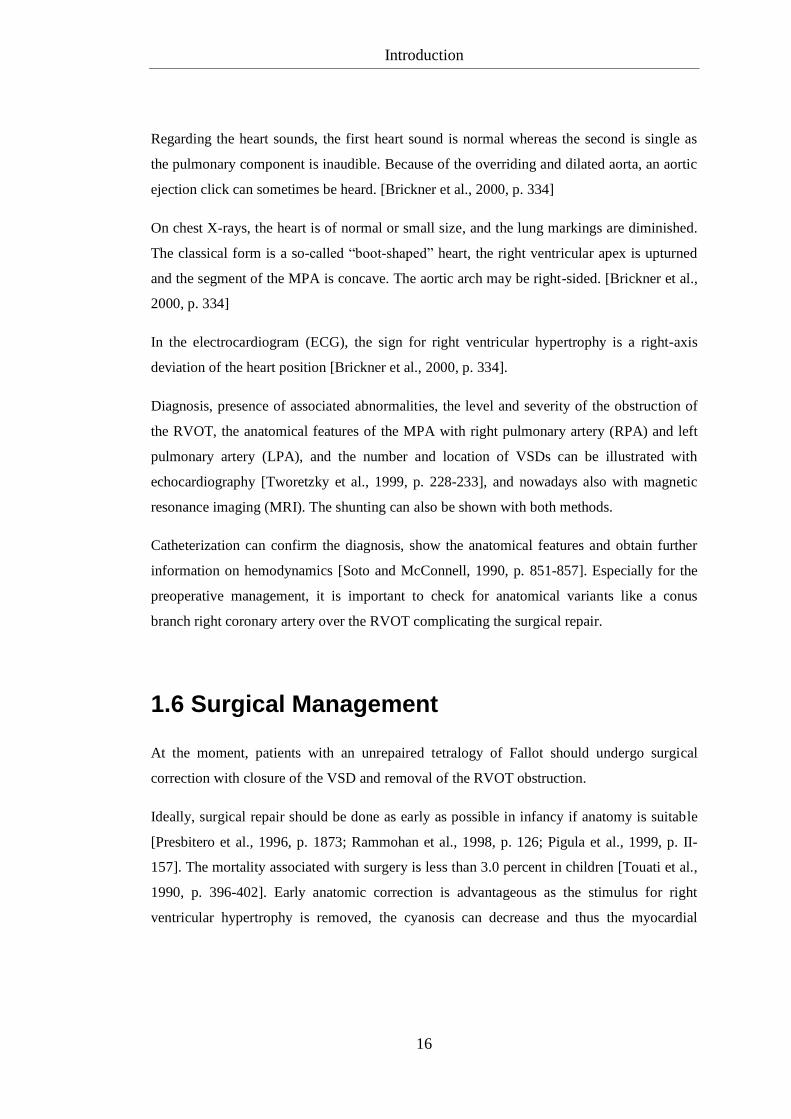
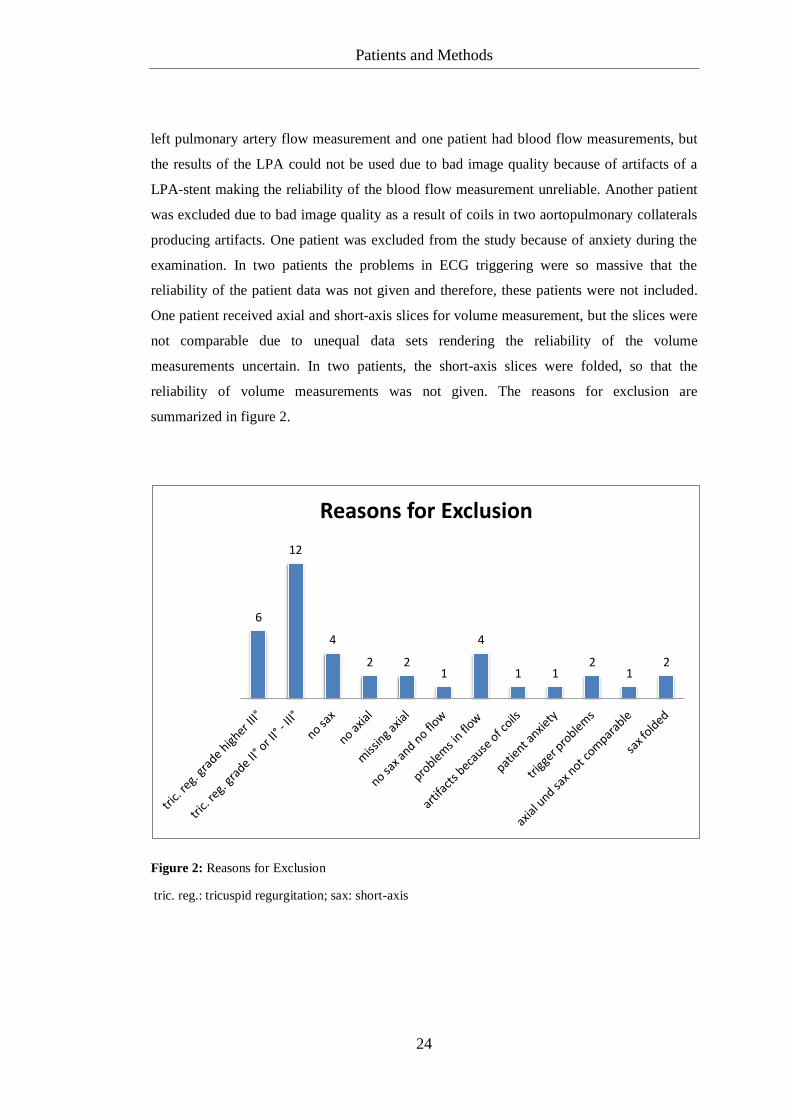
38 patients (17 female and 21 male) were excluded from the study. Of these 38 patients, 32
patients had a corrected TOF and six patients had a corrected combination of VSD and PA.
18 patients had a tricuspid regurgitation higher than grade two (twelve patients had a
tricuspid regurgitation grade two or two up to three and six patients had a tricuspid
regurgitation grade higher than three). There were missing MRI data in 15 cases. The data
sets of eight patients were incomplete for the volume measurements: in four patients no
short-axis slices and in two patients no axial slices could be obtained. Furthermore, in two
patients not enough axial slices were obtained. In one patient, neither short-axis slices nor
flow measurements were acquired. In four patients, the data for blood flow measurements
were incomplete: for one patient there were no data for the aortic flow measurement, for one
patient no data for the pulmonary artery flow measurement, for one patient no data for the
Patients and Methods
24
left pulmonary artery flow measurement and one patient had blood flow measurements, but
the results of the LPA could not be used due to bad image quality because of artifacts of a
LPA-stent making the reliability of the blood flow measurement unreliable. Another patient
was excluded due to bad image quality as a result of coils in two aortopulmonary collaterals
producing artifacts. One patient was excluded from the study because of anxiety during the
examination. In two patients the problems in ECG triggering were so massive that the
reliability of the patient data was not given and therefore, these patients were not included.
One patient received axial and short-axis slices for volume measurement, but the slices were
not comparable due to unequal data sets rendering the reliability of the volume
measurements uncertain. In two patients, the short-axis slices were folded, so that the
reliability of volume measurements was not given. The reasons for exclusion are
summarized in figure 2.
Figure 2: Reasons for Exclusion
6
12
4
2 2 1
4
1 1 2
1 2
Reasons for Exclusion
tric. reg.: tricuspid regurgitation; sax: short-axis

Patients and Methods
25
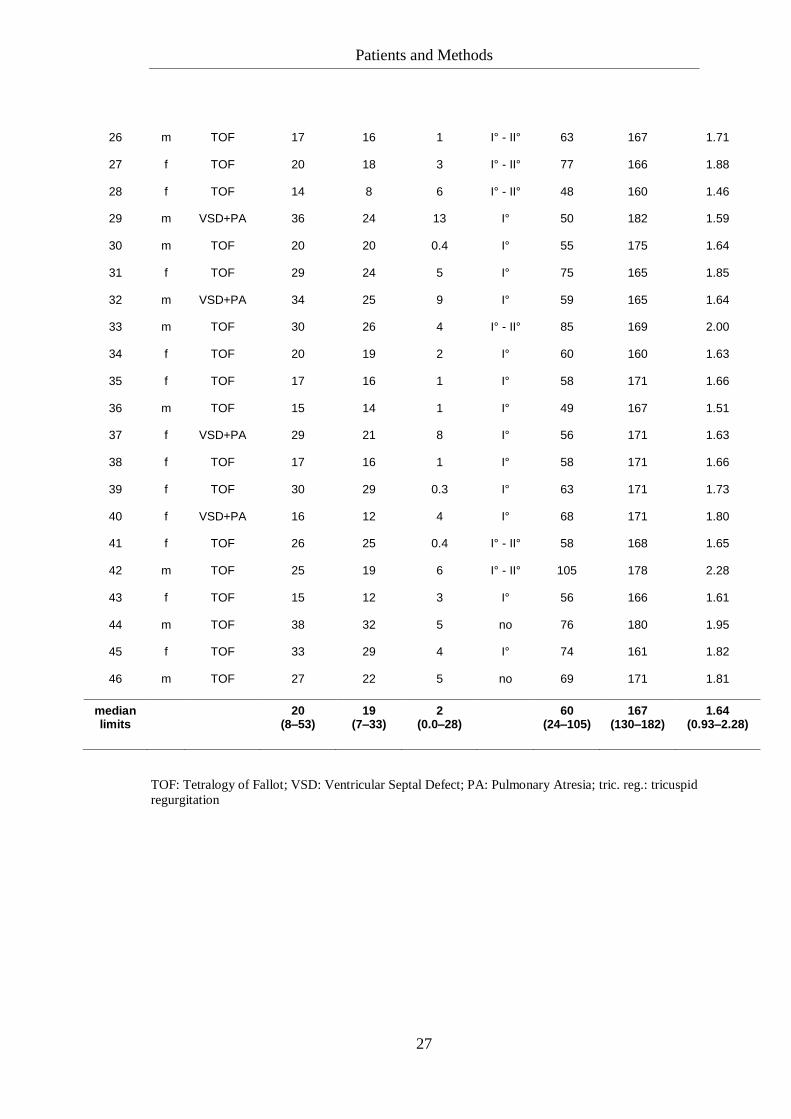
46 patients were included (23 female and 23 male, TOF: 20 female and 20 male, VSD+PA: 3
female and 3 male). The median age was 20 years and ranged from eight to 53 years. The
median age at corrective surgery was two years (range: 0.0 – 28 years) and the median time
after corrective surgery was 19 years (range: 7 – 33 years). The median weight was 60
kilograms (kg) (range: 24 – 105 kg) and the median height was 167 centimeters (cm) (range:
130 – 182 cm). The median Body Surface Area (BSA) was 1.64 m² and ranged from 0.93 to
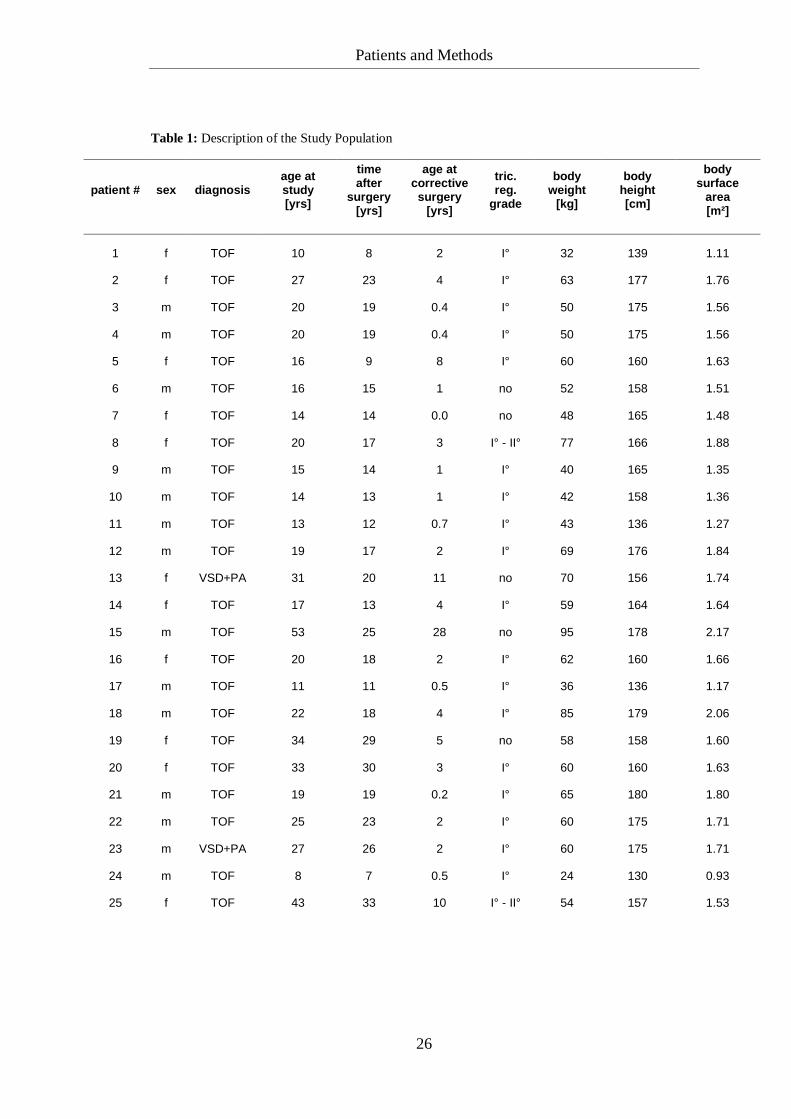
2.28 m². Detailed data are shown in table 1 on the next two pages.
Patients and Methods
26
Table 1: Description of the Study Population
patient # sex diagnosis age at study [yrs]
time after
surgery [yrs]
age at corrective surgery
[yrs]
tric. reg.
grade
body weight
[kg]
body height [cm]
body surface
area [m²]
1 f TOF 10 8 2 I° 32 139 1.11
2 f TOF 27 23 4 I° 63 177 1.76
3 m TOF 20 19 0.4 I° 50 175 1.56
4 m TOF 20 19 0.4 I° 50 175 1.56
5 f TOF 16 9 8 I° 60 160 1.63
6 m TOF 16 15 1 no 52 158 1.51
7 f TOF 14 14 0.0 no 48 165 1.48
8 f TOF 20 17 3 I° - II° 77 166 1.88
9 m TOF 15 14 1 I° 40 165 1.35
10 m TOF 14 13 1 I° 42 158 1.36
11 m TOF 13 12 0.7 I° 43 136 1.27
12 m TOF 19 17 2 I° 69 176 1.84
13 f VSD+PA 31 20 11 no 70 156 1.74
14 f TOF 17 13 4 I° 59 164 1.64
15 m TOF 53 25 28 no 95 178 2.17
16 f TOF 20 18 2 I° 62 160 1.66
17 m TOF 11 11 0.5 I° 36 136 1.17
18 m TOF 22 18 4 I° 85 179 2.06
19 f TOF 34 29 5 no 58 158 1.60
20 f TOF 33 30 3 I° 60 160 1.63
21 m TOF 19 19 0.2 I° 65 180 1.80
22 m TOF 25 23 2 I° 60 175 1.71
23 m VSD+PA 27 26 2 I° 60 175 1.71
24 m TOF 8 7 0.5 I° 24 130 0.93
25 f TOF 43 33 10 I° - II° 54 157 1.53
Patients and Methods
27
26 m TOF 17 16 1 I° - II° 63 167 1.71
27 f TOF 20 18 3 I° - II° 77 166 1.88
28 f TOF 14 8 6 I° - II° 48 160 1.46
29 m VSD+PA 36 24 13 I° 50 182 1.59
30 m TOF 20 20 0.4 I° 55 175 1.64
31 f TOF 29 24 5 I° 75 165 1.85
32 m VSD+PA 34 25 9 I° 59 165 1.64
33 m TOF 30 26 4 I° - II° 85 169 2.00
34 f TOF 20 19 2 I° 60 160 1.63
35 f TOF 17 16 1 I° 58 171 1.66
36 m TOF 15 14 1 I° 49 167 1.51
37 f VSD+PA 29 21 8 I° 56 171 1.63
38 f TOF 17 16 1 I° 58 171 1.66
39 f TOF 30 29 0.3 I° 63 171 1.73
40 f VSD+PA 16 12 4 I° 68 171 1.80
41 f TOF 26 25 0.4 I° - II° 58 168 1.65
42 m TOF 25 19 6 I° - II° 105 178 2.28
43 f TOF 15 12 3 I° 56 166 1.61
44 m TOF 38 32 5 no 76 180 1.95
45 f TOF 33 29 4 I° 74 161 1.82
46 m TOF 27 22 5 no 69 171 1.81
median limits
20
(8–53) 19
(7–33) 2
(0.0–28)
60 (24–105)
167 (130–182)
1.64 (0.93–2.28)
TOF: Tetralogy of Fallot; VSD: Ventricular Septal Defect; PA: Pulmonary Atresia; tric. reg.: tricuspid
regurgitation
Patients and Methods
28
2.2 Methods
2.2.1 Acquisition Protocol
A standard cardiac 1.5 Tesla MRI-scanner was used (MAGNETOM Avanto®, Siemens
Healthcare, Erlangen, Germany).
Imaging for volume measurements was performed as previously described [Eicken et al.,
2003, p. 1061-1065; Fratz et al., 2006, p. 1673-1677; Fratz et al., 2008, p. 1130-1135]. In
brief, patients were imaged in the supine position using a twelve-element cardiac phased
array coil with breath-holding in expiration, and vectorcardiographic method for ECG-
gating. The sessions were initiated with steady state free precession localizing views in three
orthogonal planes to determine the position of the ventricles followed by a two-chamber
localiser, a four-chamber localiser, a short-axis localiser and a four-chamber multiphase
slice.
The order of the sequence of axial and short-axis acquisition was assigned randomly for each
patient. Axial slices were obtained from the coronal and sagittal localizing images by
planning a stack of orthogonal slices to cover the heart from a level just below the diaphragm
to the pulmonary bifurcation [Alfakih et al., 2004, p. 1813-1822]. Short-axis slices were
acquired from the four-chamber multiphase slice by planning a stack of short-axis slices
parallel to the mitral valve and covering the entire heart. Axial and short-axis multiphase
steady state free precession images were acquired with a slice thickness of 4.5 mm, 6 mm, or
8 mm depending on body weight, 25 phases/cardiac cycle, with one slice per 8 – 12 second
breath-hold.
For the blood flow measurements, phase velocity (PV) MRI in non-breath-hold acquistions
was used. This common technique was performed as previously described [Rebergen et al.,
1993, p. 2259; Fratz et al., 2002, p. 1511; Schreiber et al., 2007, p. 27]. In short, a
conventional phase sensitive gradient echo sequence was used in a double-oblique plane
perpendicular to the dominant flow direction in the ascending aorta at the level of the
sinotubular junction, in the MPA, in the RPA and LPA to measure antegrade, retrograde, and
total blood flow volumes. The following acquisition parameters were used for PV-MRI:
Patients and Methods
29
TR/TE, 36.7/3.09 msec (Aorta and MPA) and 39.85/3.39 msec (RPA and LPA); slice
thickness, 6 mm (Aorta and MPA) and 5 mm (RPA and LPA); flip angle, 30 degrees;
rectangular field of view, 320 to 500 mm (depending on the patient); matrix, 256 x 256; and
number of excitations, 2. At the beginning of each study, velocity encoding (VENC)
according to our experience was chosen. Usually it was 2.0 m/sec for the aorta and 2.5 m/sec
for the MPA, RPA and LPA. A higher VENC was used if an anatomic stenosis of the right
or left pulmonary artery was detected in the pilot scans. After the first flow maps were
acquired, they were checked for aliasing. If aliasing was detected, the scan was repeated
using a higher VENC. This approach resulted in VENCs between 2.0 and 4.0 m/sec.
Respiratory and flow compensation was used in subjects to minimize ghosting artifacts. Data
were reconstructed to provide 30 magnitude (anatomic) and phase (velocity-mapped) images
per cardiac cycle.
2.2.2 Image Analysis
Volume Measurements
The RV and LV volumes were calculated for the axial and the short-axis slices by using
standard analysis software (Argus®, Siemens Healthcare, Erlangen, Germany). The phase of
both the end-diastole and the end-systole was defined for each LV and RV independently.
The program always selected the first phase as the end-diastole. However, in this study, the
observer chose the phase of the end-diastole as the phase with the visually largest volume.
The phase of the end-systole was visually defined by the observer as the phase with the
smallest volume [Sechtem et al., 1987, p. 698; Helbing et al., 1995, p. 830; Helbing et al.,
1995, p. 591; Pattynama et al., 1995, p. 54; Rominger et al., 1999, p. 911; Alfakih et al.,
2003, p. 324; Alfakih et al., 2003, p. 26; Alfakih et al., 2004, p. 1815]. Sometimes the phase
of the end-systole was different for LV or RV volume. The observer manually traced the
endocardial contours of the RV and LV in every slice where the ventricle was visible. For
the axial data sets, contours were traced without using information from the short-axis data
sets and vice versa. For the short-axis data sets, contours were traced by using the
information from the four-chamber multiphase cine view. Contour tracing was facilitated by
Patients and Methods
30
reviewing the multiple phase scans in movie mode [Alfakih et al., 2003, p. 26]. Papillary
muscles were considered as part of the myocardium and therefore excluded from the
ventricular volume as depicted by several authors [Helbing et al., 1995, p. 830; Helbing et
al., 1995, p. 591; Pattynama et al., 1995, p. 54; Alfakih et al., 2003, p. 324; Alfakih et al.,
2003, p. 26; Alfakih et al., 2004, p. 1815]. They were not included like Rominger et al. did in
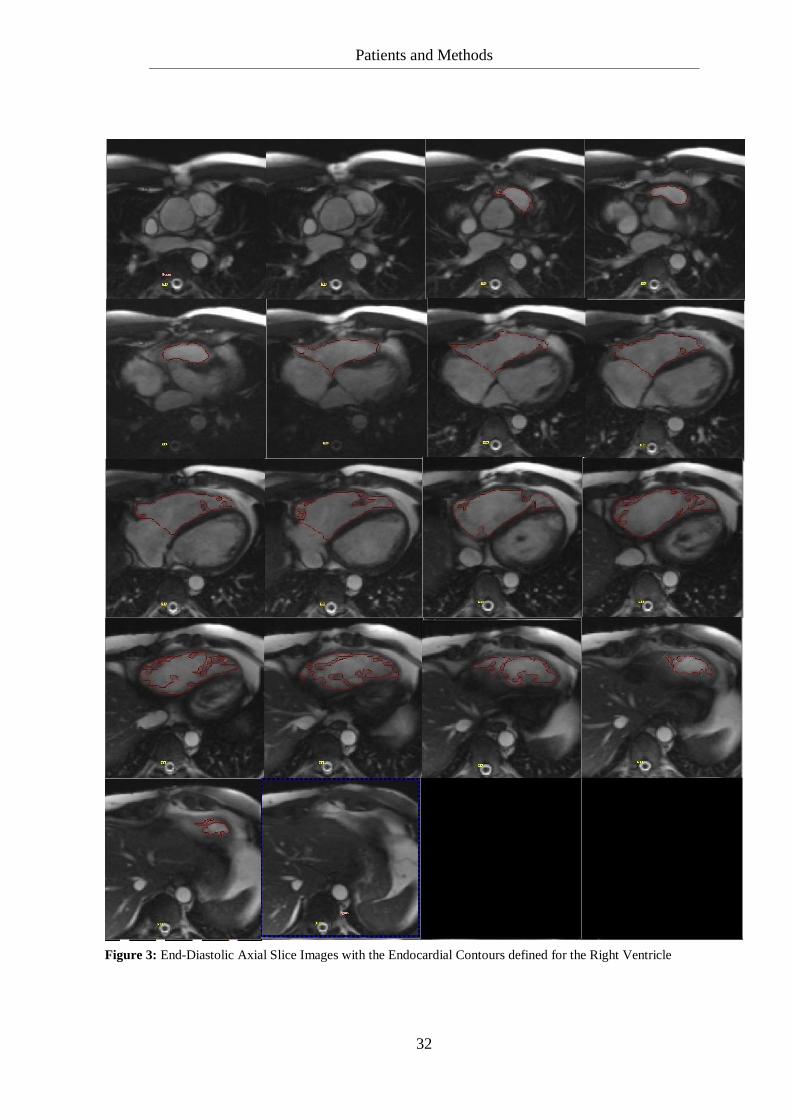
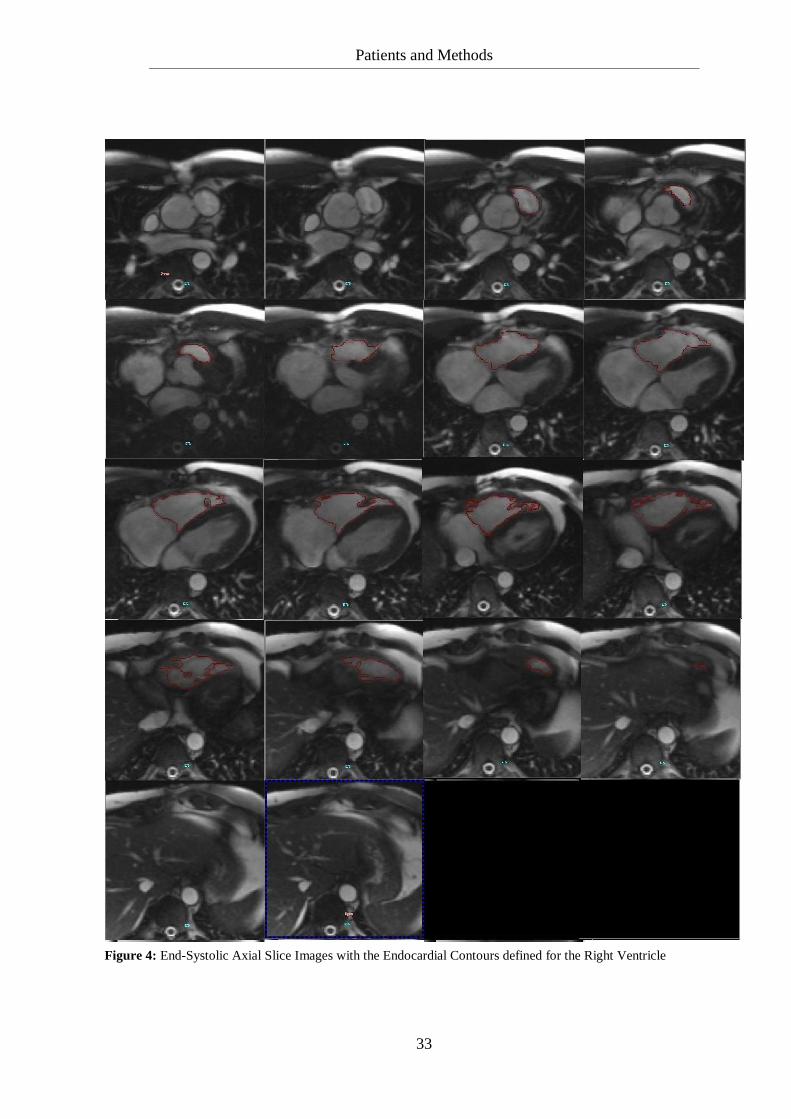
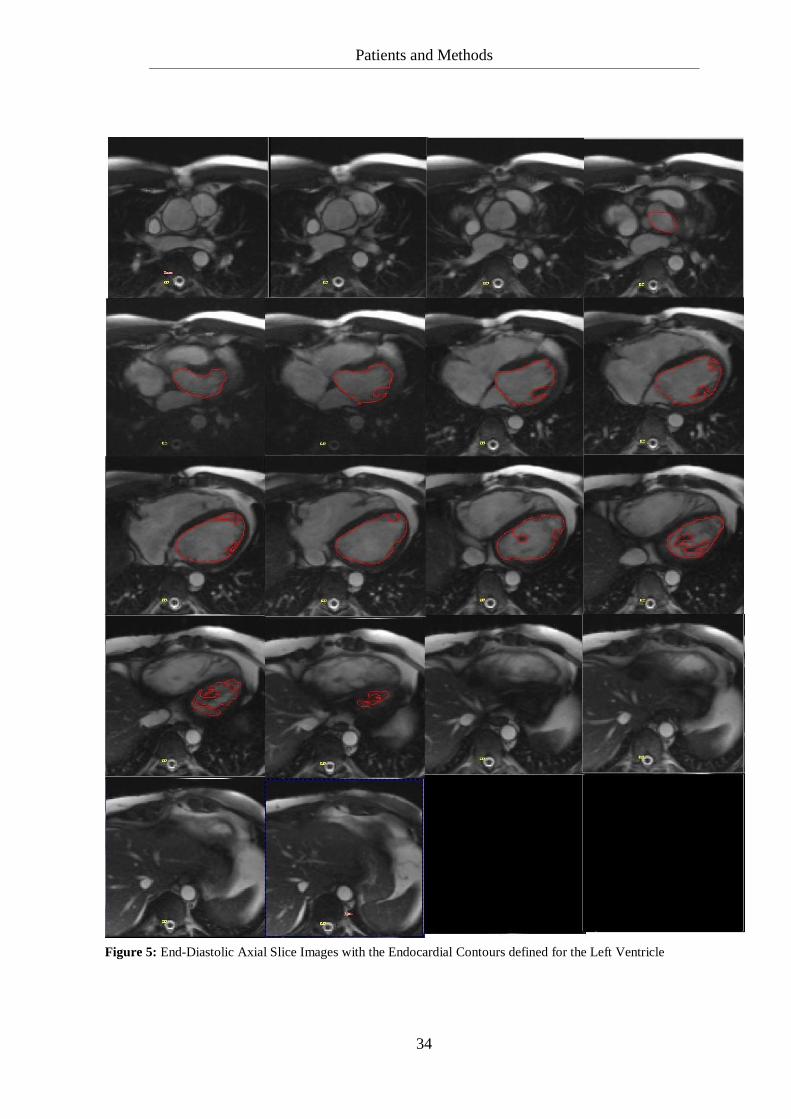
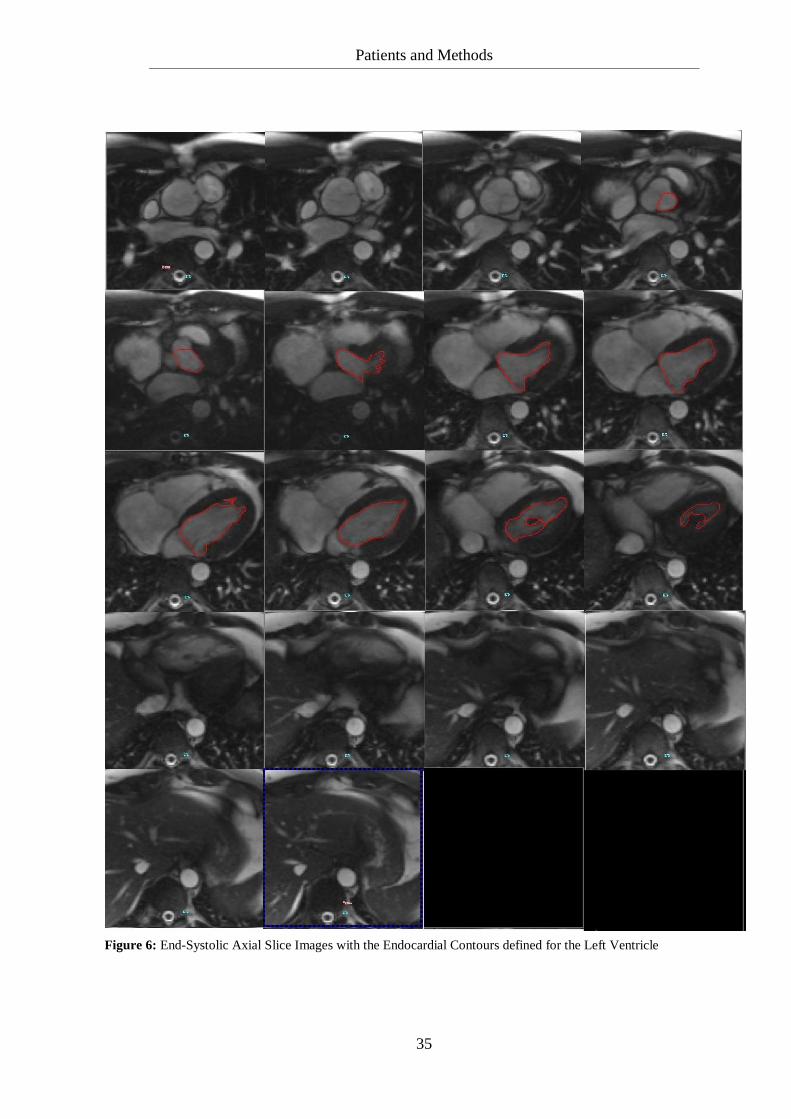
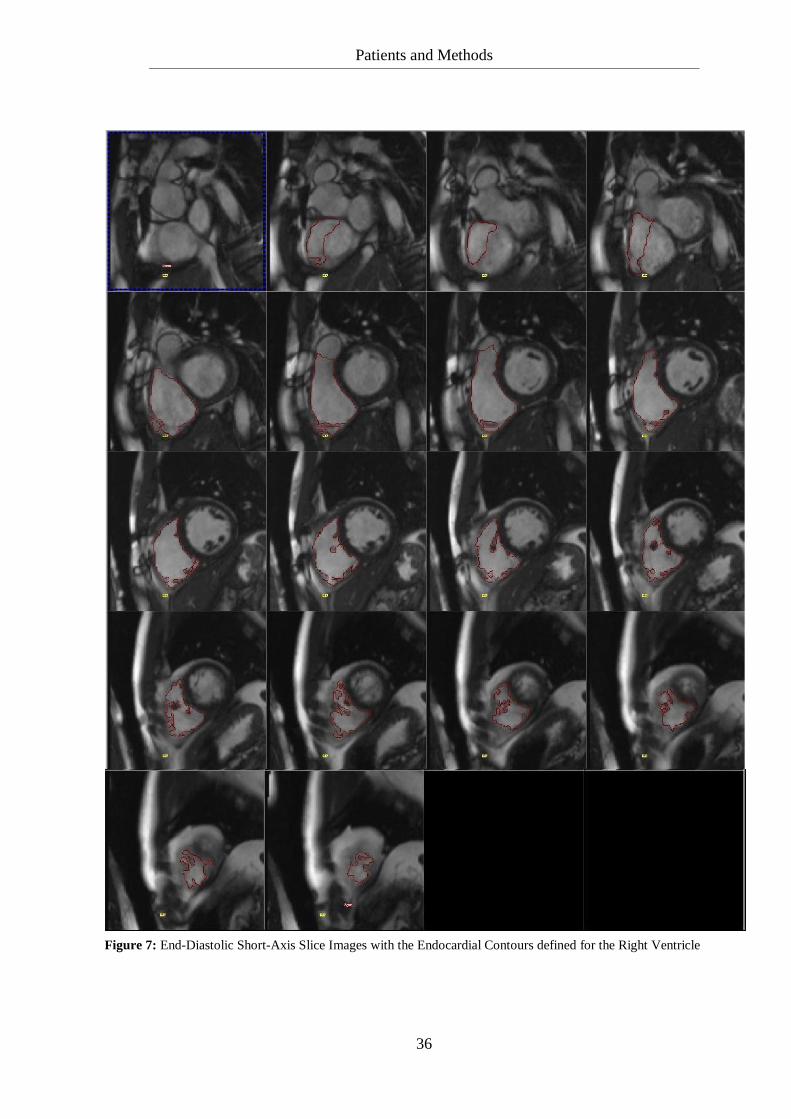
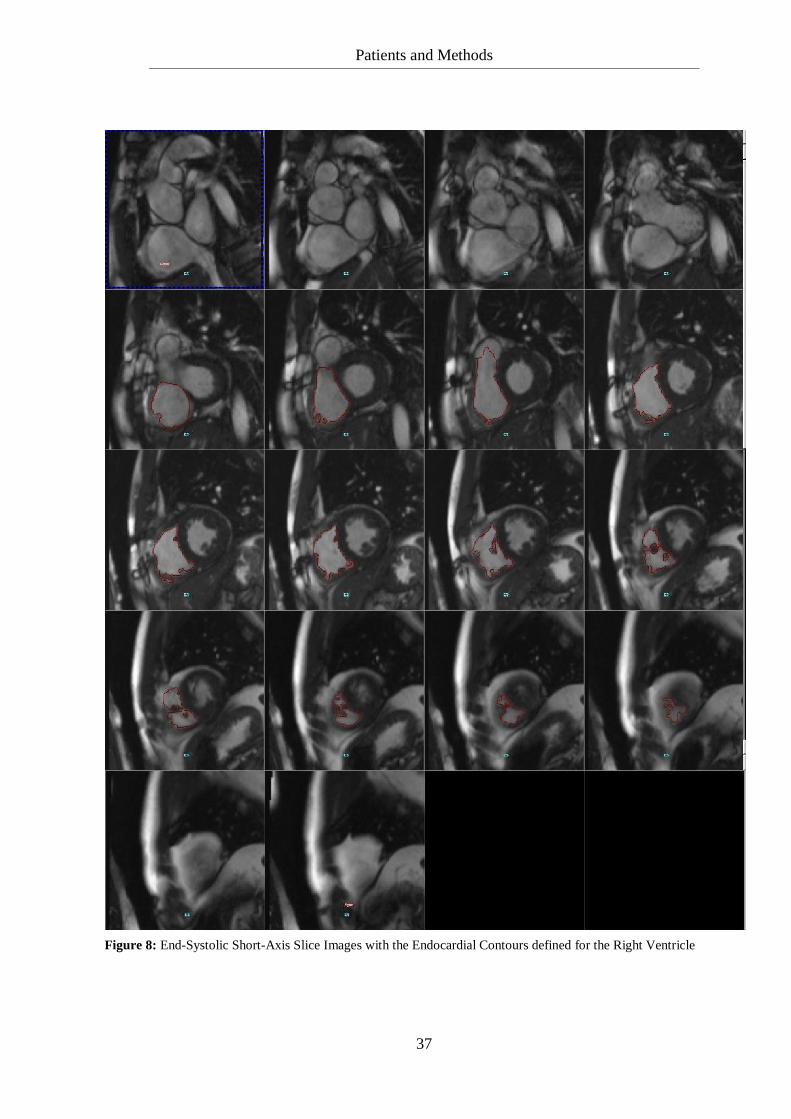
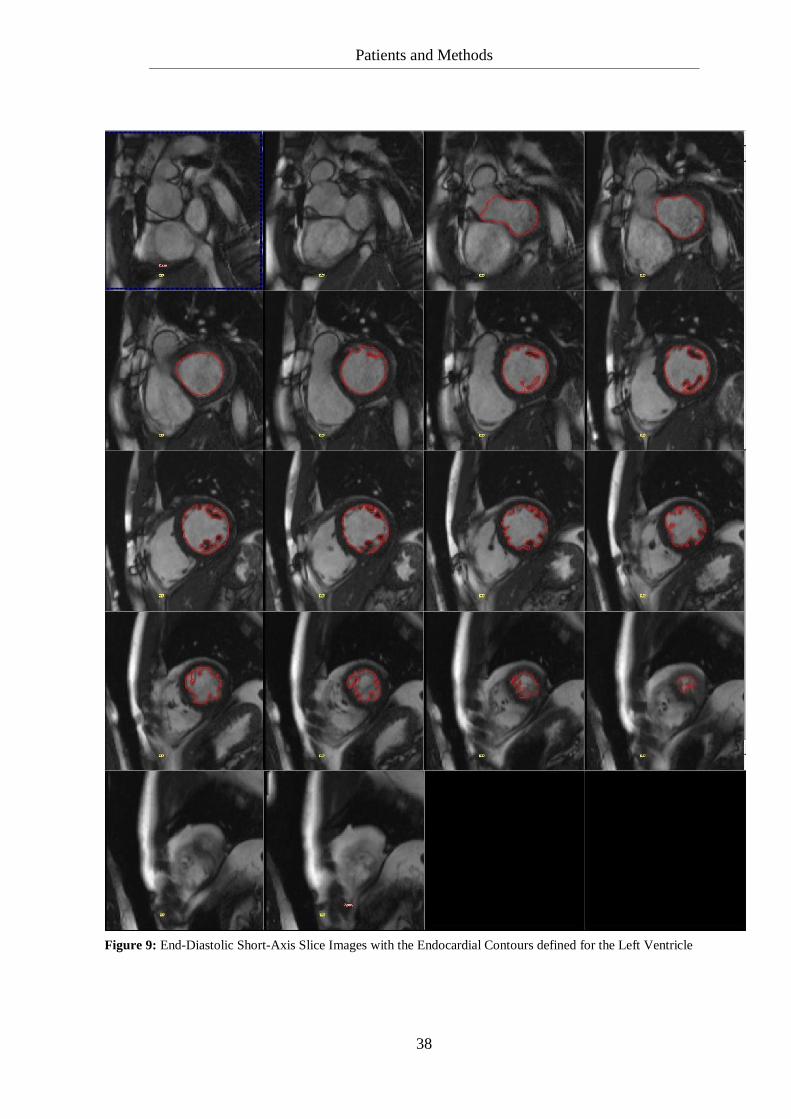
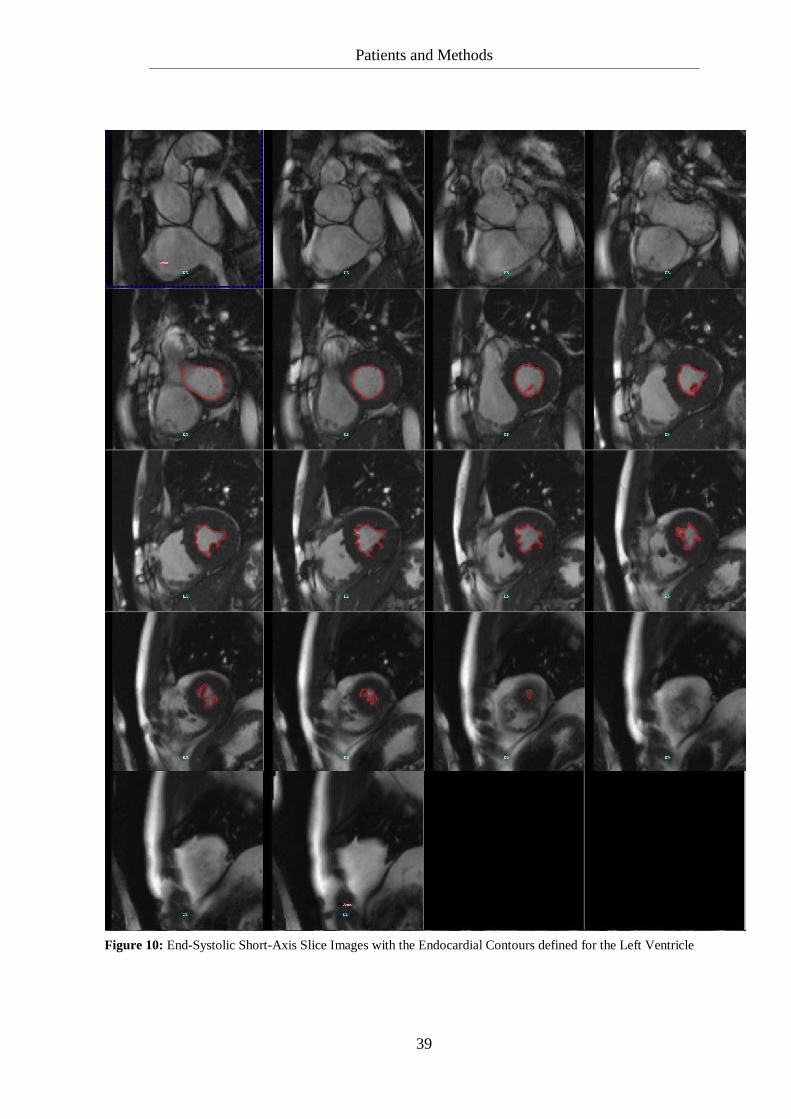
1999 [Rominger et al., 1999, p. 911]. Figures 3 – 10 (p. 32-39) show an example for contour
tracing of one patient in axial and short-axis slices for both ventricles in the end-diastole and
the end-systole. Ejection fraction (EF), the end-diastolic volume (EDV), the end-systolic
volume (ESV) and the stroke volume (SV) were calculated from all endocardial contours in
end-diastolic and end-systolic slices for both ventricles. Ejection fraction was calculated as
the stroke volume divided by the end-diastolic volume. Stroke volume was defined as end-
diastolic volume minus end-systolic volume. To obtain intra- and interobserver variance of
the volume measurements the image analysis was repeated three times. The first
measurement was done by an observer with over 10 years of experience in MRI imaging.
The second and third measurements were rendered by an observer who learned MRI image
analysis from the first observer for nine months before measuring the data set for this study.
The time lag between two measurements was always long enough for the observer to not
remember the first measurement.
Number of Breath Holds
To compare the number of breath holds needed per patient for the axial and the short-axis
data sets, the number of slices where endocardial end-diastolic contours were drawn was
counted per patient for each of the two slice orientations. For the short-axis slices, this
number was added to one, because for planning the short-axis data set a four-chamber view
in breath hold needs to be obtained first.
Patients and Methods
31
Blood Flow Measurements
The blood flow parameters for the Aorta, MPA, LPA and RPA were calculated from the
velocity maps by using the standard analysis software (Argus®, Siemens Healthcare,
Erlangen, Germany). In brief, the observer traced the contour of the vessel wall for each of
the four arteries in all phases. Flow volumes for the Aorta, MPA, LPA and RPA were
calculated by the computer. “The intensity of each pixel within the lumen corresponds to the
velocity of blood flow at that location” [Powell et al., 2000, p. 104]. Multiplying the pixel
areas with their pixel velocity determines the flow for all pixels inside the vessel. The sum of
this quantity for all pixels results in a flow volume for the vessel of interest. [Magnetic
Resonance – Technology Information Portal, www.mr-tip.com, 2009] Net forward blood
flow was calculated as total forward blood flow minus regurgitant blood flow. The
regurgitation fraction was calculated as the ratio of regurgitant blood flow to total forward
blood flow. The analysis of the blood flow measurements was made once.
Patients and Methods
32
Figure 3: End-Diastolic Axial Slice Images with the Endocardial Contours defined for the Right Ventricle
Patients and Methods
33
Figure 4: End-Systolic Axial Slice Images with the Endocardial Contours defined for the Right Ventricle
Patients and Methods
34
Figure 5: End-Diastolic Axial Slice Images with the Endocardial Contours defined for the Left Ventricle
Patients and Methods
35
Figure 6: End-Systolic Axial Slice Images with the Endocardial Contours defined for the Left Ventricle
Patients and Methods
36
Figure 7: End-Diastolic Short-Axis Slice Images with the Endocardial Contours defined for the Right Ventricle
Patients and Methods
37
Figure 8: End-Systolic Short-Axis Slice Images with the Endocardial Contours defined for the Right Ventricle
Patients and Methods
38
Figure 9: End-Diastolic Short-Axis Slice Images with the Endocardial Contours defined for the Left Ventricle
Patients and Methods
39
Figure 10: End-Systolic Short-Axis Slice Images with the Endocardial Contours defined for the Left Ventricle
Patients and Methods
40
2.2.3 Statistical Analysis
Statistical Analysis of the Volume Measurements
The statistical analysis for the intra- and interobserver variance was assessed for all patients
using the Bland and Altman method in Microsoft Excel tables. The reason for this is that the
true value remains unknown and the mean of the two measurements is the best estimate
[Bland and Altman, 1986, p. 308].
Intraobserver Variance
The first step was to plot the data of the results of the second measurement against those of
the third measurement. In a second step, the absolute difference between the two
measurements, their mean and the absolute difference relating to the mean expressed as a
percentage (difference in [%]) were calculated for all data. Then mean and standard
deviation of the differences (SDD) and the limits of agreement within which 95 % of the
differences lie, were assessed. These limits of agreement were estimated as the mean
difference plus or minus twice the SDD. The next step was to plot the absolute difference
against mean and then the difference in [%] against mean with their corresponding limits of
agreement. However, the second plot is more informative as the difference in [%] considers
the dimensions of the heart. The Bland and Altman method was assessed for the RV EDV,
RV ESV, LV EDV and LV ESV for the axial and the short-axis orientation. Variance was
calculated as the square of the standard deviation. For comparison of the variance of the
axial with the short-axis slice orientation, the f-test [Lomax RG, 2007] was used.
Interobserver Variance
For the interobserver variance the same method as described in Intraobserver Variance was
used. The results of the first measurement were plotted against the results of the second or
third one. For patients with an uneven number the results of the second measurement were
used and for patients with an even number the results of the third measurement were used.
Patients and Methods
41
The absolute difference between the measurements, their mean and the absolute difference
relating to the mean expressed as a percentage were calculated analogically. The mean, SDD
and limits of agreements were estimated and the plots of the absolute difference against
mean and the absolute difference relating to the mean expressed as a percentage against
mean with their corresponding limits of agreement were made. This was done for the RV
EDV, RV ESV, LV EDV and LV ESV for the axial and the short-axis orientation. Variance
was defined as the square of the standard deviation. Then the variance of both methods was
compared to each other using the f-test [Lomax RG, 2007].
Axial Slices vs. Short-axis Orientation
In order to compare the two methods and to check for a bias, the median value of the three
measurements of RV EDV, RV ESV, LV EDV and LV ESV of the axial and short-axis
slices were calculated. Then, the median value of the volume in axial slices was compared to
the median value in the short-axis slices by using the Bland and Altman method as described
above. Plots for regression, plots of the absolute difference against mean, and the absolute
difference relating to the mean expressed as a percentage against mean with their
corresponding limits of agreement were performed. Therefore, if the mean difference was
negative, the volumes in the short-axis slices were larger and vice versa. The median
volumes in the short-axis slices were compared to the median volumes in the axial slices
using a two-tailed t-test for paired samples.
Statistical Analysis of the Number of Breath Holds
The number of breath holds needed per patient for the axial and the short-axis data sets were
compared by using a two-tailed t-test for paired samples.
Patients and Methods
42
Statistical Analysis of the Blood Flow Measurements
The parameters for the net forward flow of the aorta were compared to those of the MPA for
all patients. The net forward flow parameters of the MPA were matched to the sum of LPA
and RPA for all patients. The total forward flow of the MPA was compared to the mean RV
SV of all three RV measurements of the axial slices and the short-axis slices. Analogously,
the total flow of the aorta was matched to the mean LV SV measurements of the axial slices
and the short-axis slices. To get an impression of the comparability and the reliability of the
volume measurements and the blood flow measurements, the regression analysis and the
Bland-Altman analysis were assessed. For the Bland-Altman analysis the absolute numerical
values of the blood flow volumes were used. Then, the variance was calculated as the square
of the standard deviation. In order to test the variances for statistical significance, the f-test
[Lomax RG, 2007] was used.
Results
43
3 Results
3.1 Intraobserver Variance
3.1.1 Axial Slices
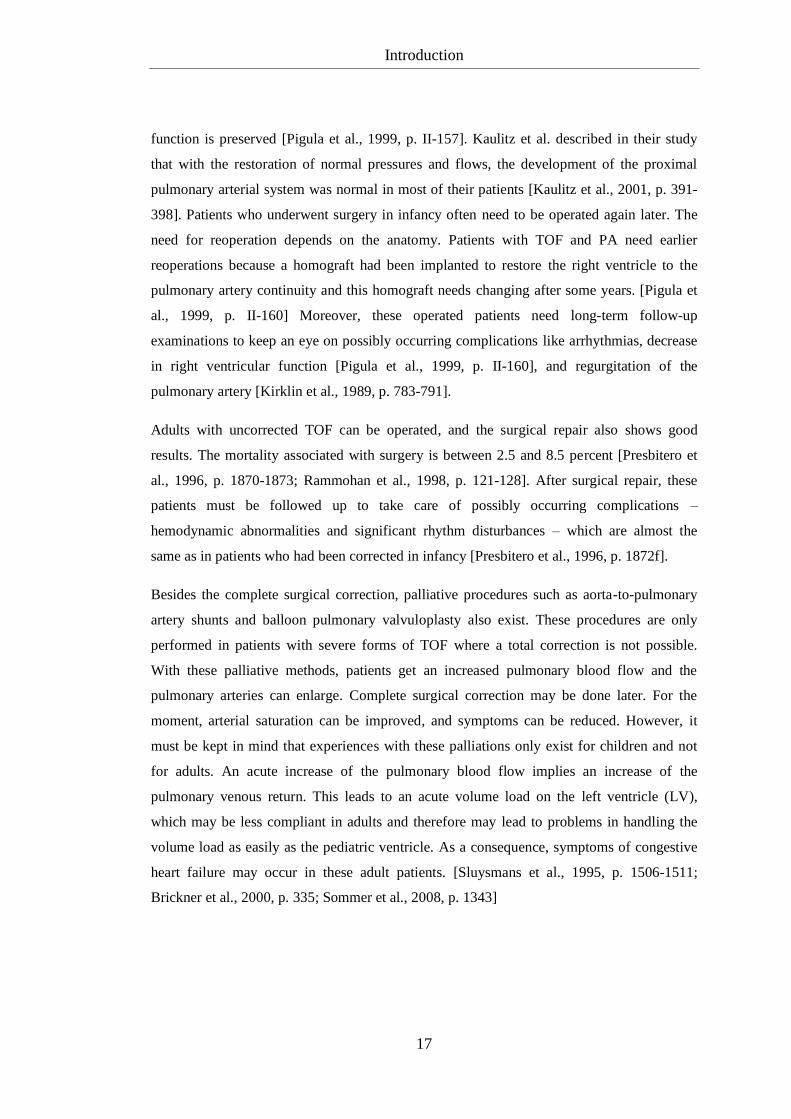
The Bland and Altman method for the RV EDV is shown step by step. The results for the
other volumes together with the results of the RV EDV are summarized in table 2 (p. 45).
The first step is the regression analysis in Microsoft Excel. The results of the second
measurement for the RV EDV are plotted against the results of the third measurement. Then,
the regression line and equation can be displayed in the graph together with the coefficient of
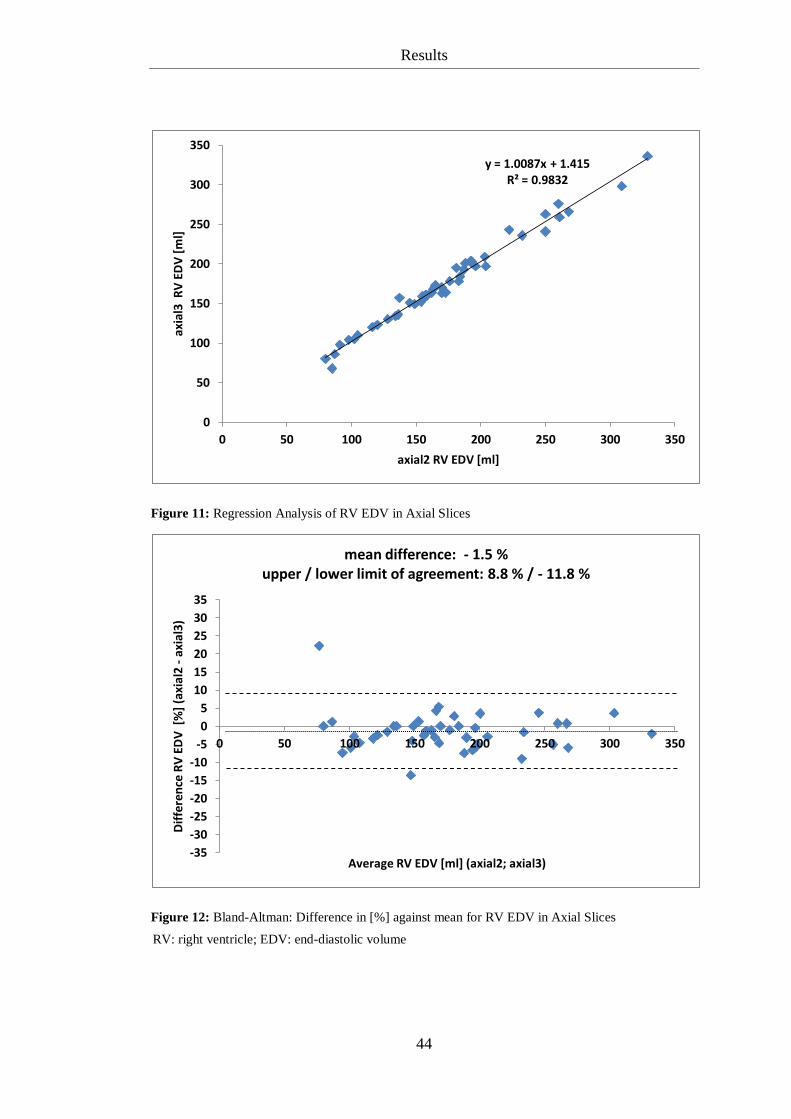
determination. Figure 11 on the following page shows the results for the RV EDV. The
degree of agreement (R² = 0.9831) demonstrates a good agreement between the two
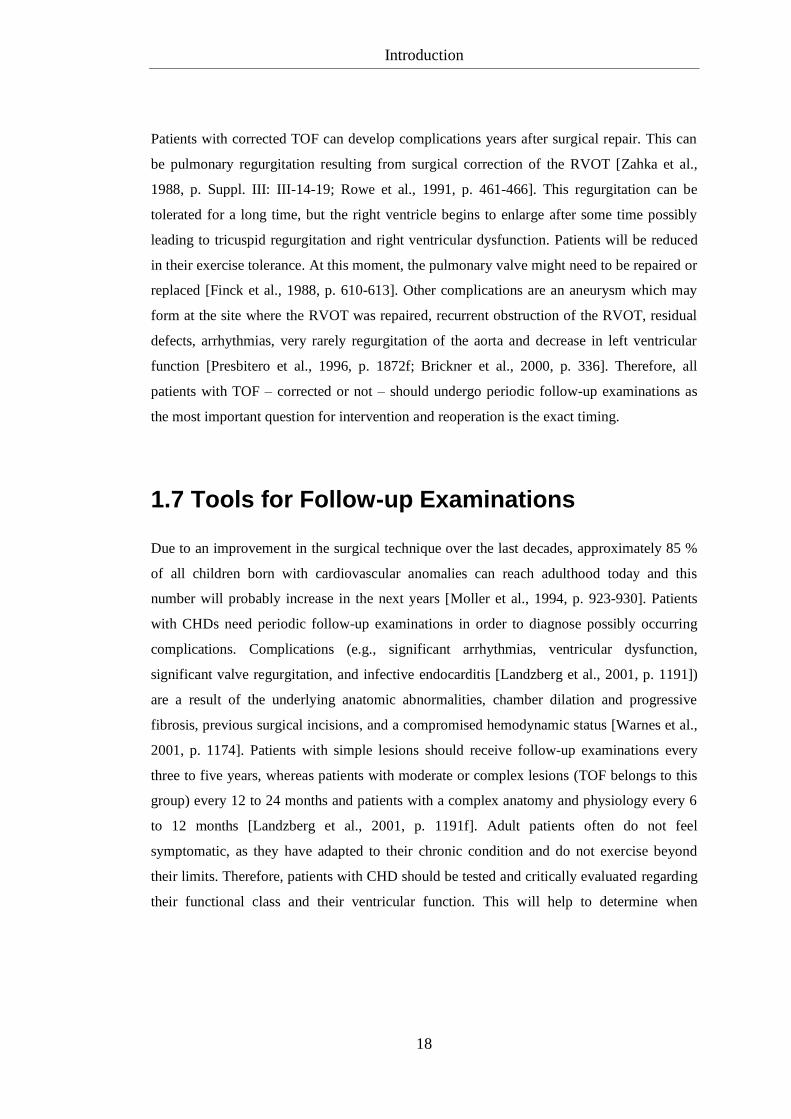
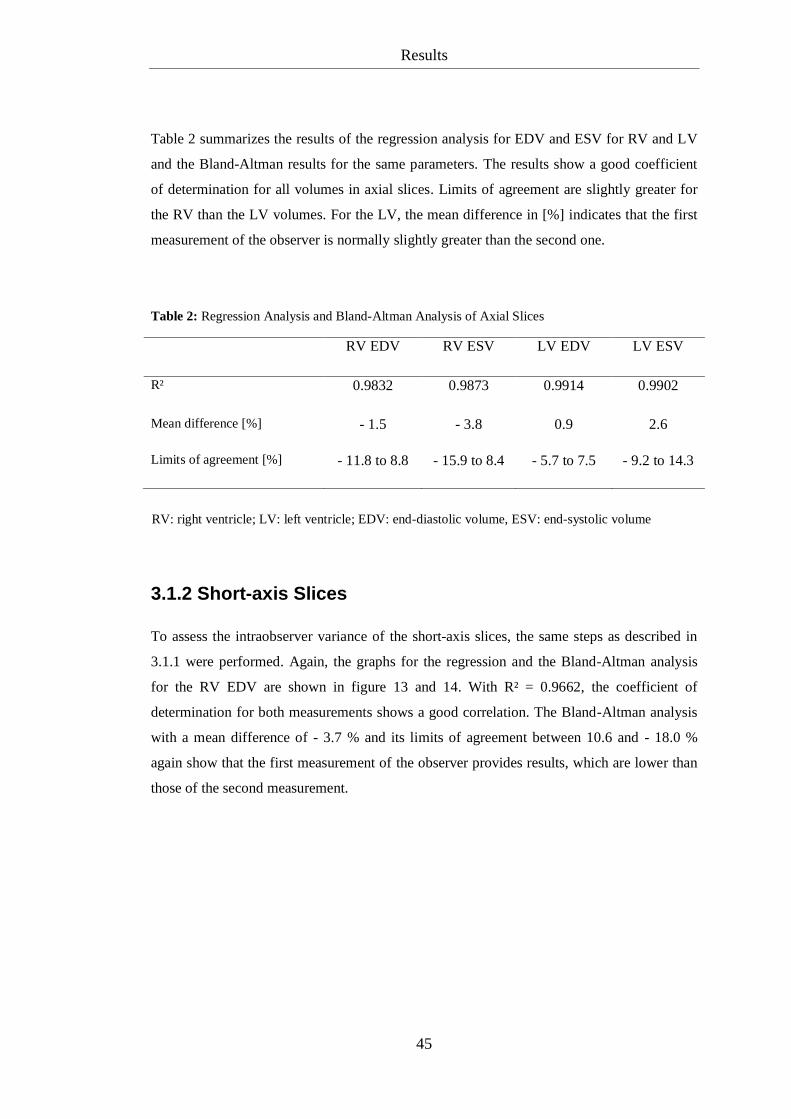
measurements. The next step is the Bland-Altman analysis, which is also more informative
for the intraobserver variance. Figure 12 shows this analysis of the difference in [%].
The Bland-Altman analysis indicates a mean difference of - 1.5 % between the two
measurements indicating that the results of the second measurement are normally lower than
the ones of the third measurement. 95 % of the difference in [%] lies between 8.8 and
- 11.8 %.
Results
44
Figure 11: Regression Analysis of RV EDV in Axial Slices
Figure 12: Bland-Altman: Difference in [%] against mean for RV EDV in Axial Slices
y = 1.0087x + 1.415 R² = 0.9832
0
50
100
150
200
250
300
350
0 50 100 150 200 250 300 350
axia
l3 R
V E
DV
[m
l]
axial2 RV EDV [ml]
-35
-30
-25
-20
-15
-10
-5
0
5
10
15
20
25
30
35
0 50 100 150 200 250 300 350
Dif
fere
nce
RV
ED
V [
%]
(axi
al2
- ax
ial3
)
Average RV EDV [ml] (axial2; axial3)
mean difference: - 1.5 % upper / lower limit of agreement: 8.8 % / - 11.8 %
RV: right ventricle; EDV: end-diastolic volume
Results
45
Table 2 summarizes the results of the regression analysis for EDV and ESV for RV and LV
and the Bland-Altman results for the same parameters. The results show a good coefficient
of determination for all volumes in axial slices. Limits of agreement are slightly greater for
the RV than the LV volumes. For the LV, the mean difference in [%] indicates that the first
measurement of the observer is normally slightly greater than the second one.
Table 2: Regression Analysis and Bland-Altman Analysis of Axial Slices
RV EDV RV ESV LV EDV LV ESV
R² 0.9832 0.9873 0.9914 0.9902
Mean difference [%] - 1.5 - 3.8 0.9 2.6
Limits of agreement [%] - 11.8 to 8.8 - 15.9 to 8.4 - 5.7 to 7.5 - 9.2 to 14.3
3.1.2 Short-axis Slices
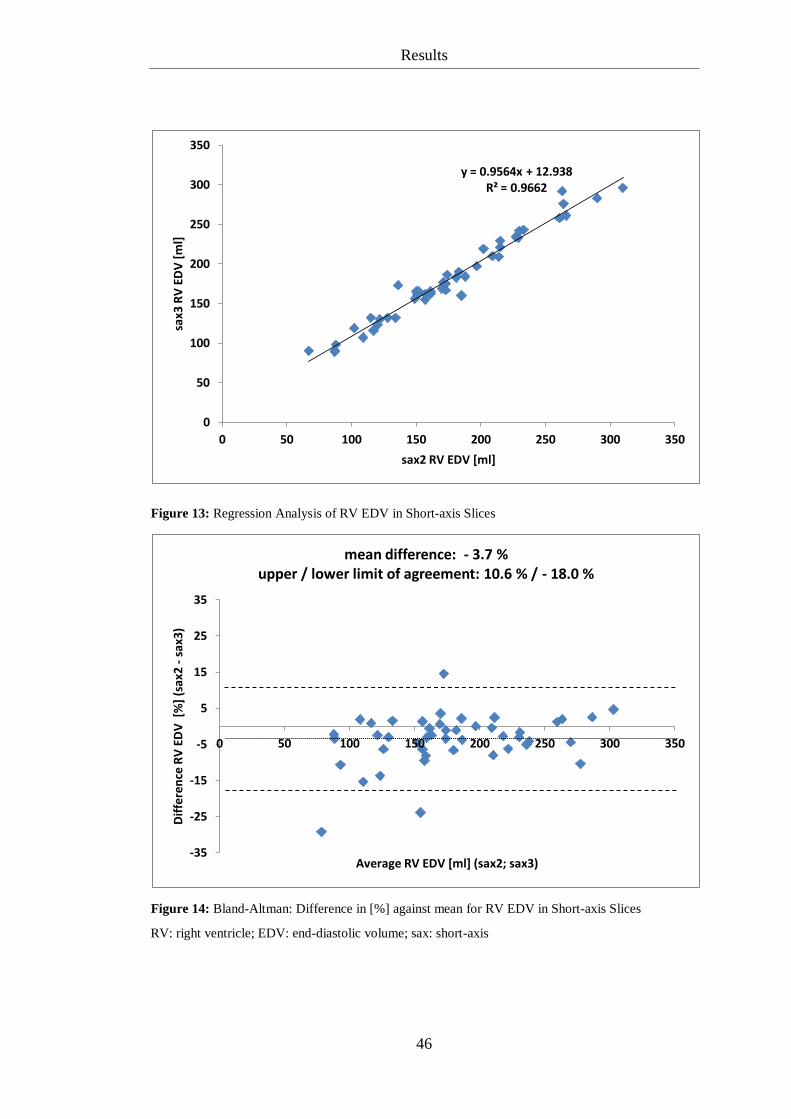
To assess the intraobserver variance of the short-axis slices, the same steps as described in
3.1.1 were performed. Again, the graphs for the regression and the Bland-Altman analysis
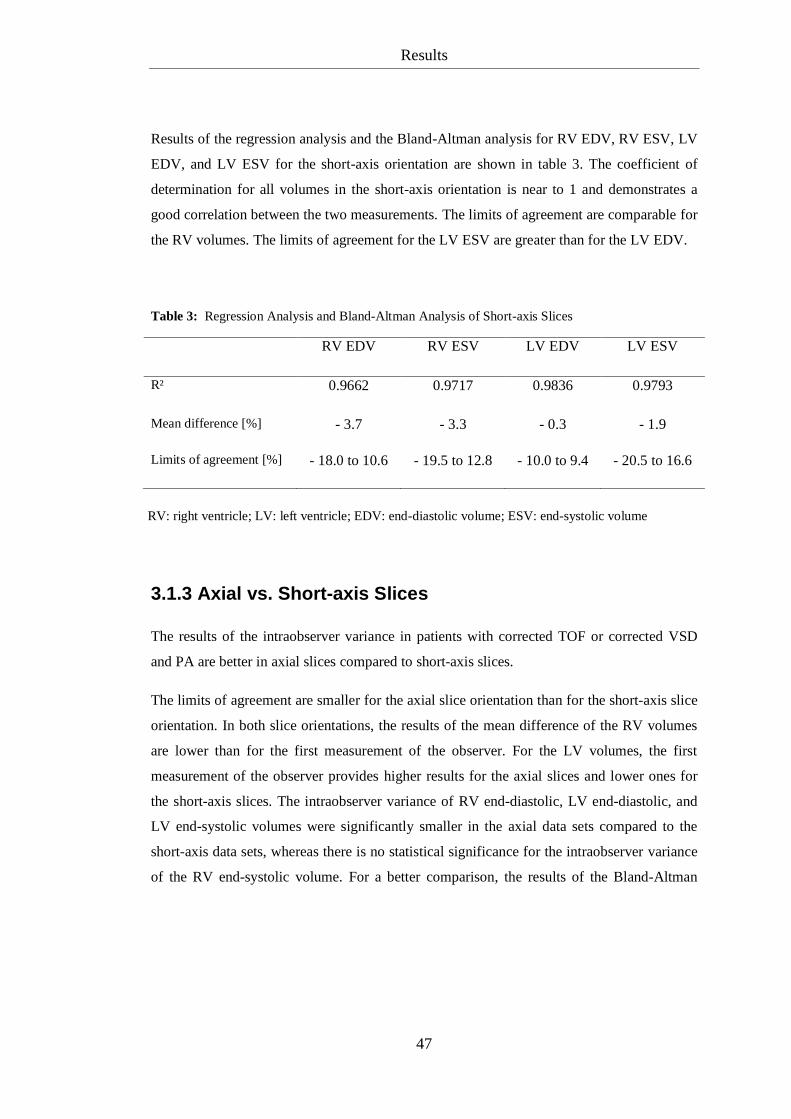
for the RV EDV are shown in figure 13 and 14. With R² = 0.9662, the coefficient of
determination for both measurements shows a good correlation. The Bland-Altman analysis
with a mean difference of - 3.7 % and its limits of agreement between 10.6 and - 18.0 %
again show that the first measurement of the observer provides results, which are lower than
those of the second measurement.
RV: right ventricle; LV: left ventricle; EDV: end-diastolic volume, ESV: end-systolic volume
Results
46
Figure 13: Regression Analysis of RV EDV in Short-axis Slices
Figure 14: Bland-Altman: Difference in [%] against mean for RV EDV in Short-axis Slices
y = 0.9564x + 12.938 R² = 0.9662
0
50
100
150
200
250
300
350
0 50 100 150 200 250 300 350
sax3
RV
ED
V [
ml]
sax2 RV EDV [ml]
-35
-25
-15
-5
5
15
25
35
0 50 100 150 200 250 300 350
Dif
fere
nce
RV
ED
V [
%]
(sax
2 -
sax
3)
Average RV EDV [ml] (sax2; sax3)
mean difference: - 3.7 % upper / lower limit of agreement: 10.6 % / - 18.0 %
RV: right ventricle; EDV: end-diastolic volume; sax: short-axis
Results
47
Results of the regression analysis and the Bland-Altman analysis for RV EDV, RV ESV, LV
EDV, and LV ESV for the short-axis orientation are shown in table 3. The coefficient of
determination for all volumes in the short-axis orientation is near to 1 and demonstrates a
good correlation between the two measurements. The limits of agreement are comparable for
the RV volumes. The limits of agreement for the LV ESV are greater than for the LV EDV.
Table 3: Regression Analysis and Bland-Altman Analysis of Short-axis Slices
RV EDV RV ESV LV EDV LV ESV
R² 0.9662 0.9717 0.9836 0.9793
Mean difference [%] - 3.7 - 3.3 - 0.3 - 1.9
Limits of agreement [%] - 18.0 to 10.6 - 19.5 to 12.8 - 10.0 to 9.4 - 20.5 to 16.6
3.1.3 Axial vs. Short-axis Slices
The results of the intraobserver variance in patients with corrected TOF or corrected VSD
and PA are better in axial slices compared to short-axis slices.
The limits of agreement are smaller for the axial slice orientation than for the short-axis slice
orientation. In both slice orientations, the results of the mean difference of the RV volumes
are lower than for the first measurement of the observer. For the LV volumes, the first
measurement of the observer provides higher results for the axial slices and lower ones for
the short-axis slices. The intraobserver variance of RV end-diastolic, LV end-diastolic, and
LV end-systolic volumes were significantly smaller in the axial data sets compared to the
short-axis data sets, whereas there is no statistical significance for the intraobserver variance
of the RV end-systolic volume. For a better comparison, the results of the Bland-Altman
RV: right ventricle; LV: left ventricle; EDV: end-diastolic volume; ESV: end-systolic volume
Results
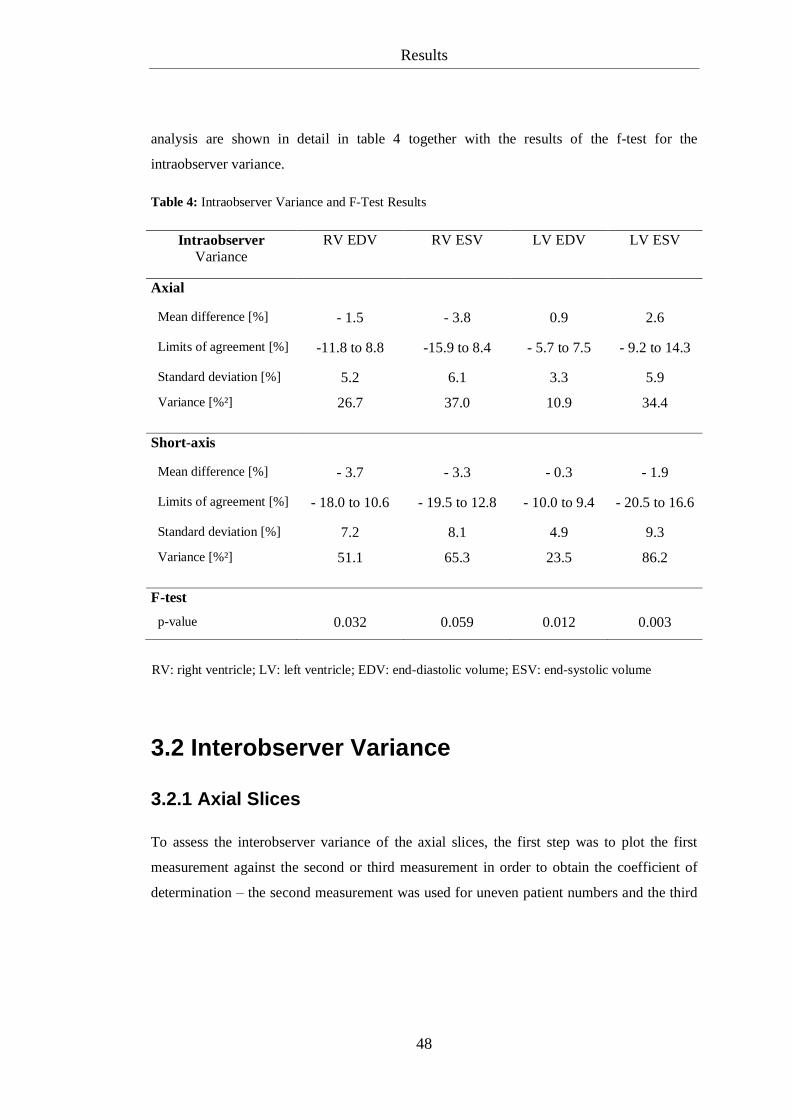
48
analysis are shown in detail in table 4 together with the results of the f-test for the
intraobserver variance.
Table 4: Intraobserver Variance and F-Test Results
Intraobserver
Variance
RV EDV RV ESV LV EDV LV ESV
Axial
Mean difference [%] - 1.5 - 3.8 0.9 2.6
Limits of agreement [%] -11.8 to 8.8 -15.9 to 8.4 - 5.7 to 7.5 - 9.2 to 14.3
Standard deviation [%] 5.2 6.1 3.3 5.9
Variance [%²] 26.7 37.0 10.9 34.4
Short-axis
Mean difference [%] - 3.7 - 3.3 - 0.3 - 1.9
Limits of agreement [%] - 18.0 to 10.6 - 19.5 to 12.8 - 10.0 to 9.4 - 20.5 to 16.6
Standard deviation [%] 7.2 8.1 4.9 9.3
Variance [%²] 51.1 65.3 23.5 86.2
F-test
p-value 0.032 0.059 0.012 0.003
3.2 Interobserver Variance
3.2.1 Axial Slices
To assess the interobserver variance of the axial slices, the first step was to plot the first
measurement against the second or third measurement in order to obtain the coefficient of
determination – the second measurement was used for uneven patient numbers and the third
RV: right ventricle; LV: left ventricle; EDV: end-diastolic volume; ESV: end-systolic volume
Results
49
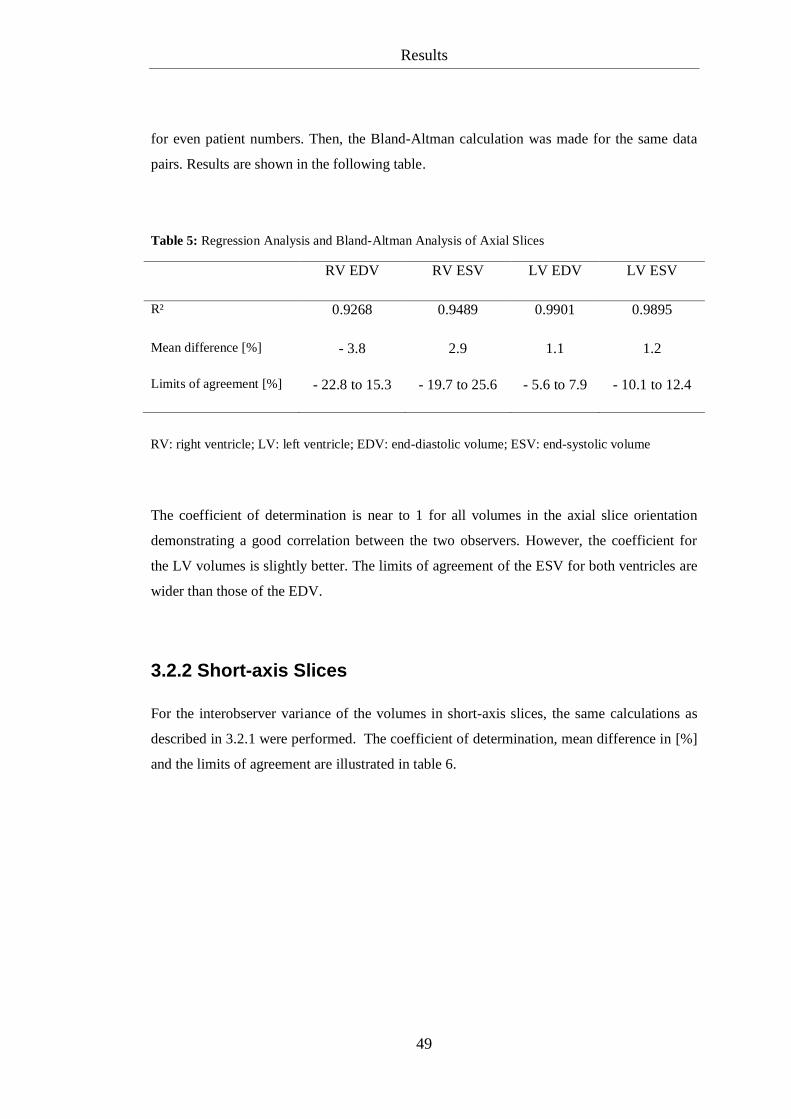
for even patient numbers. Then, the Bland-Altman calculation was made for the same data
pairs. Results are shown in the following table.
Table 5: Regression Analysis and Bland-Altman Analysis of Axial Slices
RV EDV RV ESV LV EDV LV ESV
R² 0.9268 0.9489 0.9901 0.9895
Mean difference [%] - 3.8 2.9 1.1 1.2
Limits of agreement [%] - 22.8 to 15.3 - 19.7 to 25.6 - 5.6 to 7.9 - 10.1 to 12.4
The coefficient of determination is near to 1 for all volumes in the axial slice orientation
demonstrating a good correlation between the two observers. However, the coefficient for
the LV volumes is slightly better. The limits of agreement of the ESV for both ventricles are
wider than those of the EDV.
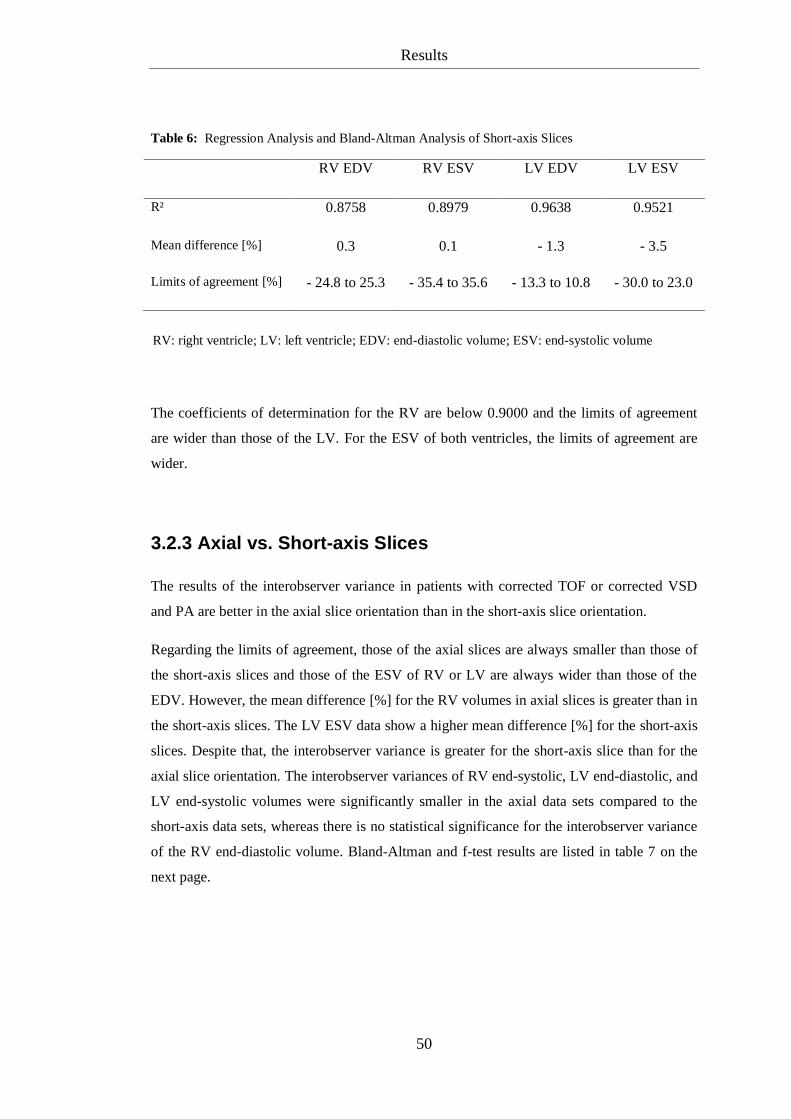
3.2.2 Short-axis Slices
For the interobserver variance of the volumes in short-axis slices, the same calculations as
described in 3.2.1 were performed. The coefficient of determination, mean difference in [%]
and the limits of agreement are illustrated in table 6.
RV: right ventricle; LV: left ventricle; EDV: end-diastolic volume; ESV: end-systolic volume
Results
50
Table 6: Regression Analysis and Bland-Altman Analysis of Short-axis Slices
RV EDV RV ESV LV EDV LV ESV
R² 0.8758 0.8979 0.9638 0.9521
Mean difference [%] 0.3 0.1 - 1.3 - 3.5
Limits of agreement [%] - 24.8 to 25.3 - 35.4 to 35.6 - 13.3 to 10.8 - 30.0 to 23.0
The coefficients of determination for the RV are below 0.9000 and the limits of agreement
are wider than those of the LV. For the ESV of both ventricles, the limits of agreement are
wider.
3.2.3 Axial vs. Short-axis Slices
The results of the interobserver variance in patients with corrected TOF or corrected VSD
and PA are better in the axial slice orientation than in the short-axis slice orientation.
Regarding the limits of agreement, those of the axial slices are always smaller than those of
the short-axis slices and those of the ESV of RV or LV are always wider than those of the
EDV. However, the mean difference [%] for the RV volumes in axial slices is greater than in
the short-axis slices. The LV ESV data show a higher mean difference [%] for the short-axis
slices. Despite that, the interobserver variance is greater for the short-axis slice than for the
axial slice orientation. The interobserver variances of RV end-systolic, LV end-diastolic, and
LV end-systolic volumes were significantly smaller in the axial data sets compared to the
short-axis data sets, whereas there is no statistical significance for the interobserver variance
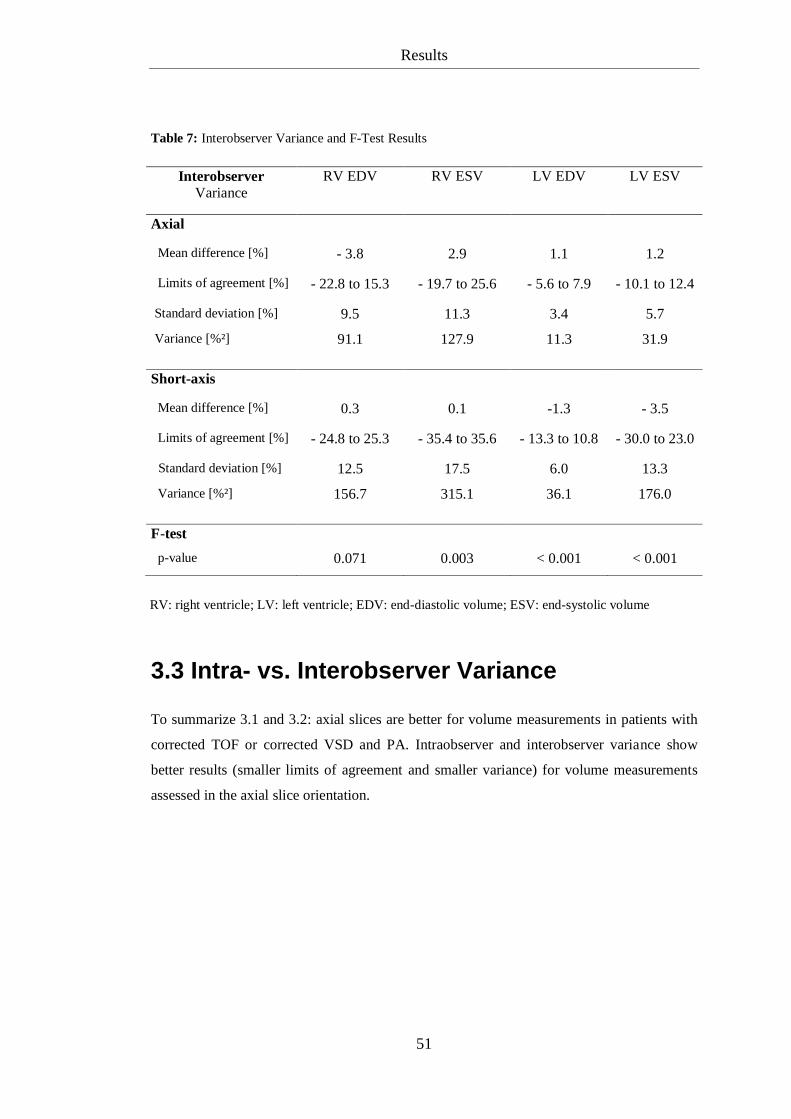
of the RV end-diastolic volume. Bland-Altman and f-test results are listed in table 7 on the
next page.
RV: right ventricle; LV: left ventricle; EDV: end-diastolic volume; ESV: end-systolic volume
Results
51
Table 7: Interobserver Variance and F-Test Results
Interobserver
Variance
RV EDV RV ESV LV EDV LV ESV
Axial
Mean difference [%] - 3.8 2.9 1.1 1.2
Limits of agreement [%] - 22.8 to 15.3 - 19.7 to 25.6 - 5.6 to 7.9 - 10.1 to 12.4
Standard deviation [%] 9.5 11.3 3.4 5.7
Variance [%²] 91.1 127.9 11.3 31.9
Short-axis
Mean difference [%] 0.3 0.1 -1.3 - 3.5
Limits of agreement [%] - 24.8 to 25.3 - 35.4 to 35.6 - 13.3 to 10.8 - 30.0 to 23.0
Standard deviation [%] 12.5 17.5 6.0 13.3
Variance [%²] 156.7 315.1 36.1 176.0
F-test
p-value 0.071 0.003 < 0.001 < 0.001
3.3 Intra- vs. Interobserver Variance
To summarize 3.1 and 3.2: axial slices are better for volume measurements in patients with
corrected TOF or corrected VSD and PA. Intraobserver and interobserver variance show
better results (smaller limits of agreement and smaller variance) for volume measurements
assessed in the axial slice orientation.
RV: right ventricle; LV: left ventricle; EDV: end-diastolic volume; ESV: end-systolic volume
Results
52
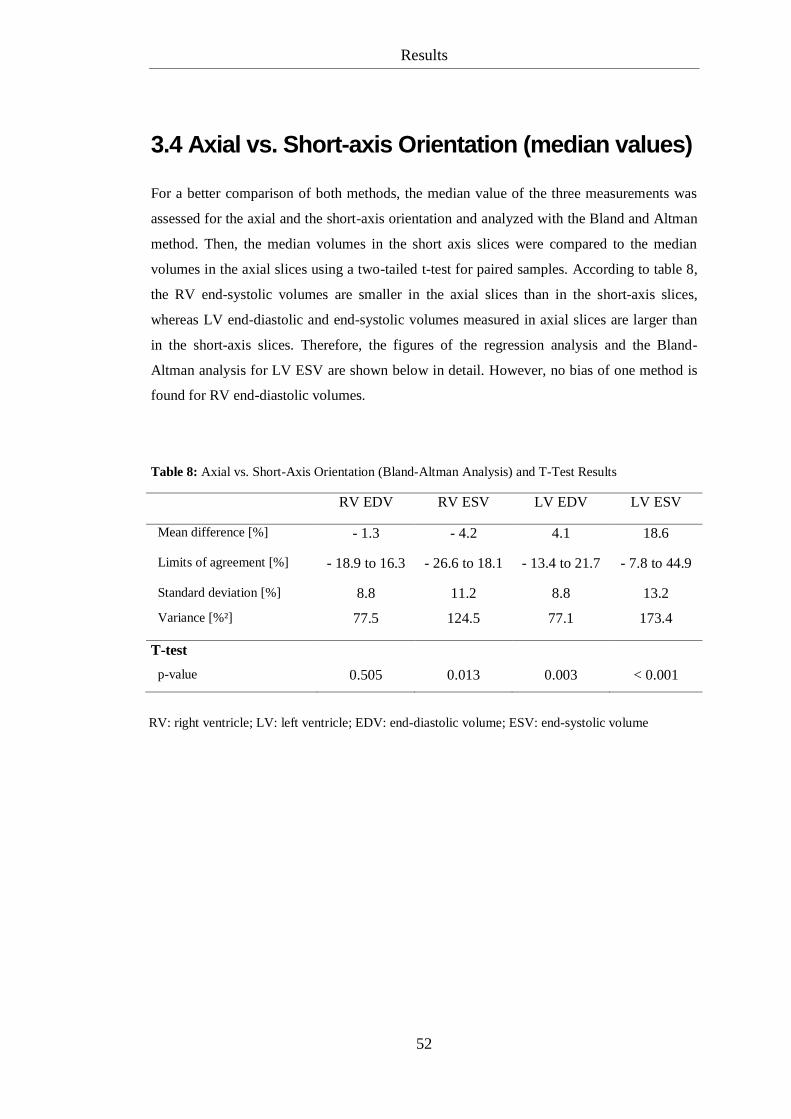
3.4 Axial vs. Short-axis Orientation (median values)
For a better comparison of both methods, the median value of the three measurements was
assessed for the axial and the short-axis orientation and analyzed with the Bland and Altman
method. Then, the median volumes in the short axis slices were compared to the median
volumes in the axial slices using a two-tailed t-test for paired samples. According to table 8,
the RV end-systolic volumes are smaller in the axial slices than in the short-axis slices,
whereas LV end-diastolic and end-systolic volumes measured in axial slices are larger than
in the short-axis slices. Therefore, the figures of the regression analysis and the Bland-
Altman analysis for LV ESV are shown below in detail. However, no bias of one method is
found for RV end-diastolic volumes.
Table 8: Axial vs. Short-Axis Orientation (Bland-Altman Analysis) and T-Test Results
RV EDV RV ESV LV EDV LV ESV
Mean difference [%] - 1.3 - 4.2 4.1 18.6
Limits of agreement [%] - 18.9 to 16.3 - 26.6 to 18.1 - 13.4 to 21.7 - 7.8 to 44.9
Standard deviation [%] 8.8 11.2 8.8 13.2
Variance [%²]
77.5 124.5 77.1 173.4
T-test
p-value 0.505 0.013 0.003 < 0.001
RV: right ventricle; LV: left ventricle; EDV: end-diastolic volume; ESV: end-systolic volume
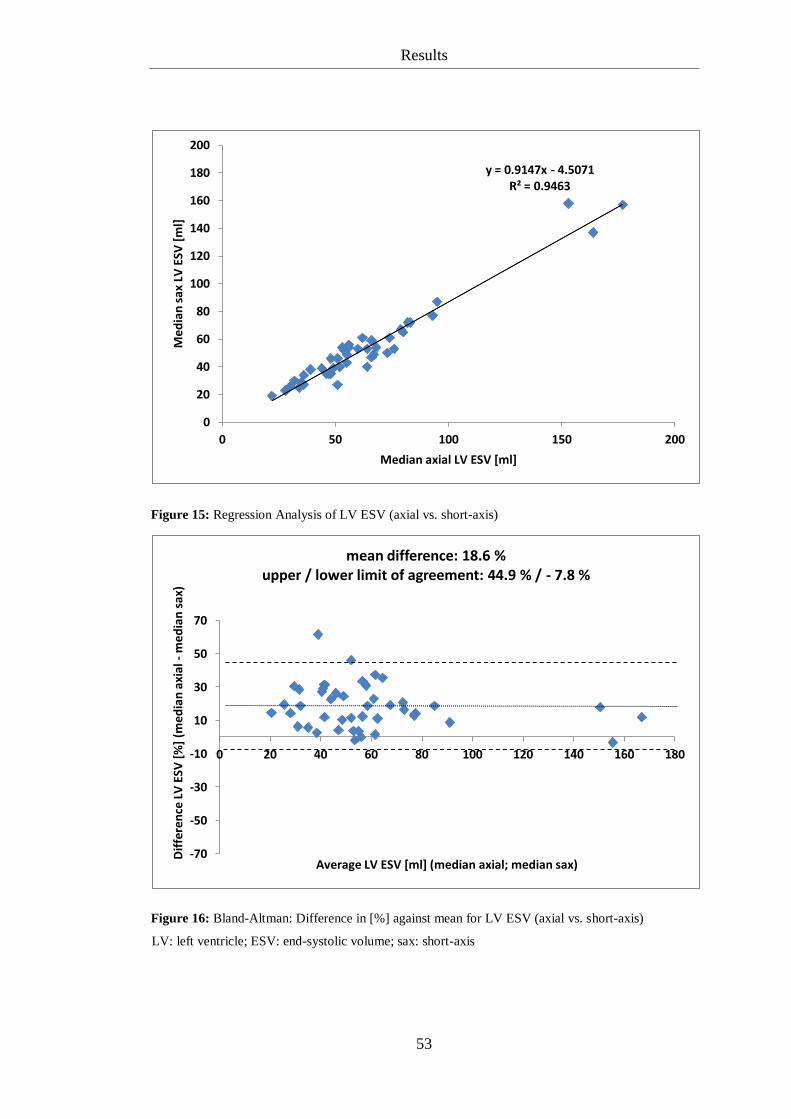
Results
53
Figure 15: Regression Analysis of LV ESV (axial vs. short-axis)
Figure 16: Bland-Altman: Difference in [%] against mean for LV ESV (axial vs. short-axis)
y = 0.9147x - 4.5071 R² = 0.9463
0
20
40
60
80
100
120
140
160
180
200
0 50 100 150 200
Med
ian
sax
LV
ESV
[m
l]
Median axial LV ESV [ml]
-70
-50
-30
-10
10
30
50
70
0 20 40 60 80 100 120 140 160 180
Dif
fere
nce
LV
ESV
[%
] (m
edia
n a
xial
- m
edia
n s
ax)
Average LV ESV [ml] (median axial; median sax)
mean difference: 18.6 % upper / lower limit of agreement: 44.9 % / - 7.8 %
LV: left ventricle; ESV: end-systolic volume; sax: short-axis
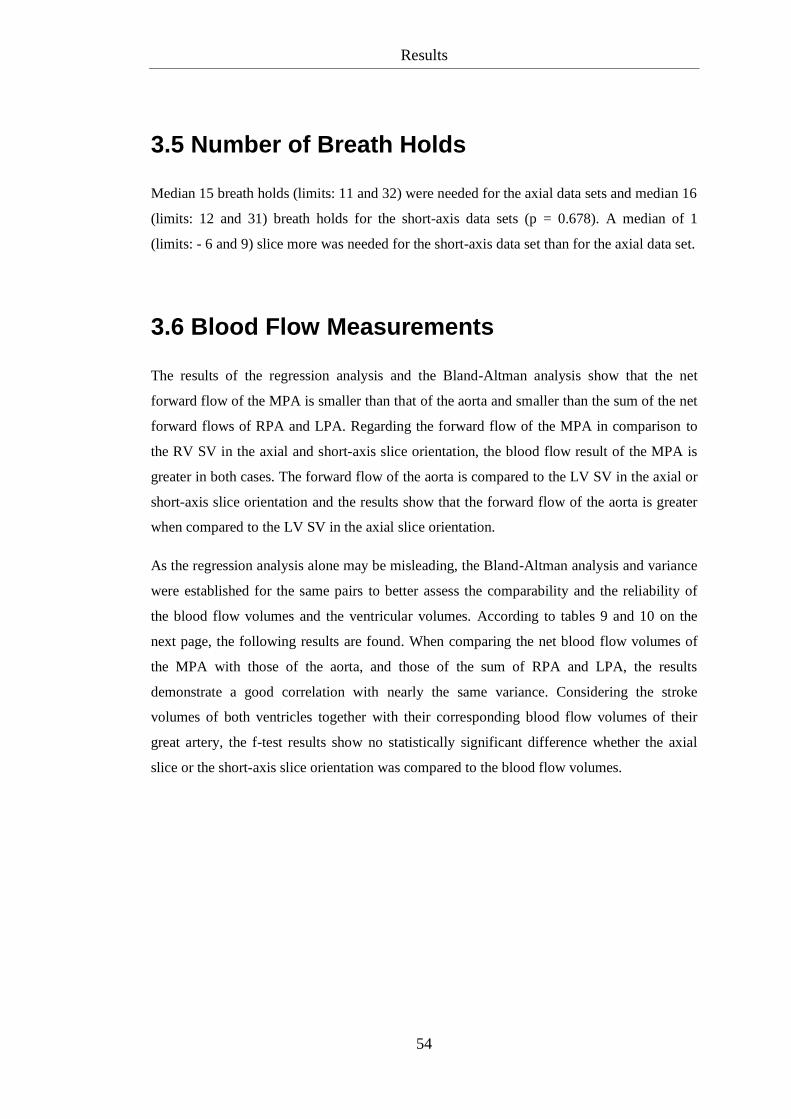
Results
54
3.5 Number of Breath Holds
Median 15 breath holds (limits: 11 and 32) were needed for the axial data sets and median 16
(limits: 12 and 31) breath holds for the short-axis data sets (p = 0.678). A median of 1
(limits: - 6 and 9) slice more was needed for the short-axis data set than for the axial data set.
3.6 Blood Flow Measurements
The results of the regression analysis and the Bland-Altman analysis show that the net
forward flow of the MPA is smaller than that of the aorta and smaller than the sum of the net
forward flows of RPA and LPA. Regarding the forward flow of the MPA in comparison to
the RV SV in the axial and short-axis slice orientation, the blood flow result of the MPA is
greater in both cases. The forward flow of the aorta is compared to the LV SV in the axial or
short-axis slice orientation and the results show that the forward flow of the aorta is greater
when compared to the LV SV in the axial slice orientation.
As the regression analysis alone may be misleading, the Bland-Altman analysis and variance
were established for the same pairs to better assess the comparability and the reliability of
the blood flow volumes and the ventricular volumes. According to tables 9 and 10 on the
next page, the following results are found. When comparing the net blood flow volumes of
the MPA with those of the aorta, and those of the sum of RPA and LPA, the results
demonstrate a good correlation with nearly the same variance. Considering the stroke
volumes of both ventricles together with their corresponding blood flow volumes of their
great artery, the f-test results show no statistically significant difference whether the axial
slice or the short-axis slice orientation was compared to the blood flow volumes.
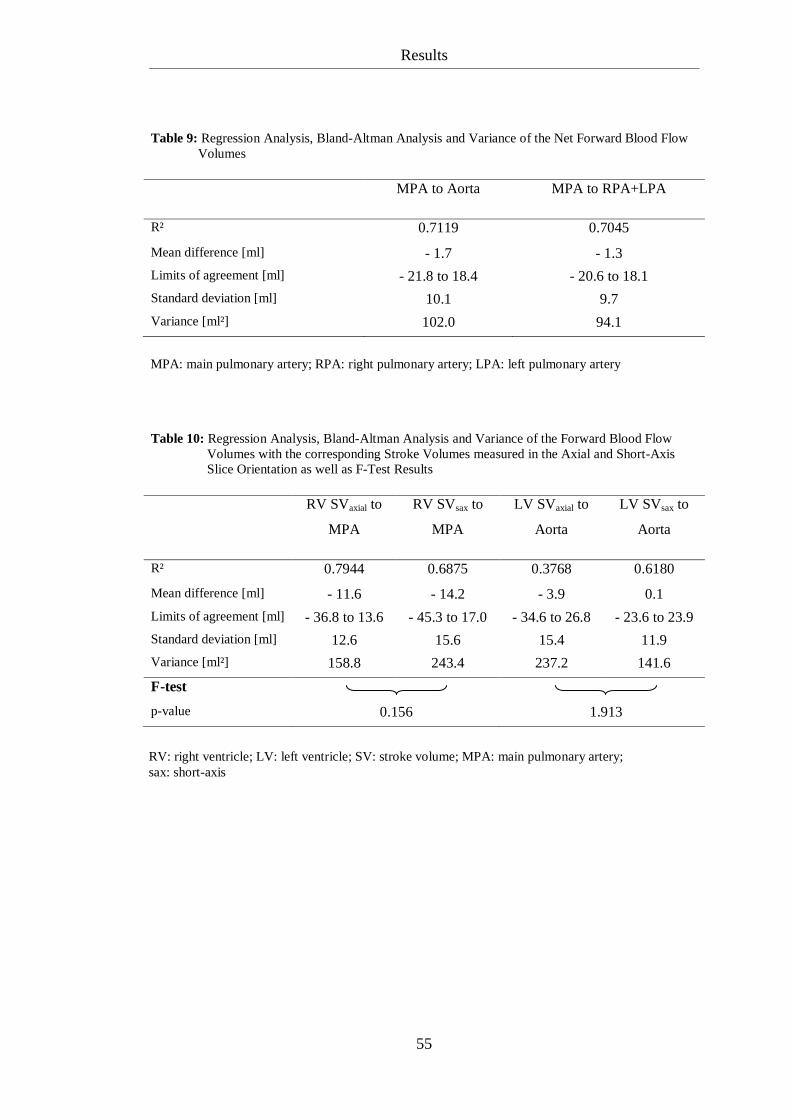
Results
55
Table 9: Regression Analysis, Bland-Altman Analysis and Variance of the Net Forward Blood Flow
Volumes
MPA to Aorta MPA to RPA+LPA
R² 0.7119 0.7045
Mean difference [ml] - 1.7 - 1.3
Limits of agreement [ml] - 21.8 to 18.4 - 20.6 to 18.1
Standard deviation [ml] 10.1 9.7
Variance [ml²] 102.0 94.1
Table 10: Regression Analysis, Bland-Altman Analysis and Variance of the Forward Blood Flow
Volumes with the corresponding Stroke Volumes measured in the Axial and Short-Axis
Slice Orientation as well as F-Test Results
RV SVaxial to
MPA
RV SVsax to
MPA
LV SVaxial to
Aorta
LV SVsax to
Aorta
R² 0.7944 0.6875 0.3768 0.6180
Mean difference [ml] - 11.6 - 14.2 - 3.9 0.1
Limits of agreement [ml] - 36.8 to 13.6 - 45.3 to 17.0 - 34.6 to 26.8 - 23.6 to 23.9
Standard deviation [ml] 12.6 15.6 15.4 11.9
Variance [ml²] 158.8 243.4 237.2 141.6
F-test
p-value 0.156 1.913
MPA: main pulmonary artery; RPA: right pulmonary artery; LPA: left pulmonary artery
RV: right ventricle; LV: left ventricle; SV: stroke volume; MPA: main pulmonary artery;
sax: short-axis
Discussion
56
4 Discussion
4.1 Patient Group
The present study on 46 patients with corrected TOF/VSD+PA (40 TOF, 6 VSD+PA)
presents a relative big group of patients with one special CHD for a MRI based study on
ventricular volume and phase velocity blood flow volume measurements. First, the majority
of studies on ventricular volumes measured by MRI are generated in healthy volunteers
[Sechtem et al., 1987, p. 697-702; Ostrzega et al., 1989, p. 444-452; Sakuma et al., 1993, p.
377-380; Pattynama et al., 1995, p. 53-63; Alfakih et al., 2003, p. 25-32; Alfakih et al., 2003,
p. 323-329; Alfakih et al., 2004, p. 1813-1822]. Second, there are studies with a mixed group
of cardiovascular affected patients, patients with different CHDs or comparisons between
healthy volunteers and the ones mentioned above [Mogelvang et al., 1988, p. 529-533;
Helbing et al., 1995, p. 828-837; Helbing et al., 1995, p. 589-594; Niwa et al., 1996, p. 567-
575; Rominger et al., 1999, p. 908-918; Nesser et al., 2006, p. 666-680]. Studies on this
topic, especially on patients with corrected TOF or Fallot-like hemodynamics, do not exist to
the best of our knowledge. In a study by Helbing et al. from 1995, 6 of 16 patients with CHD
had a corrected TOF [Helbing et al., 1995, p. 589-594]. In another study by Helbing et al.
from 1995, 8 of 21 patients with CHD had a corrected TOF [Helbing et al., 1995, p. 828-
837]. According to Niwa et al., 9 of 45 patients with CHD showed TOF [Niwa et al., 1996,
p. 567-575]. Therefore, this is the first study that analyzes ventricular volumes measured by
MRI only for one specific CHD, namely the tetralogy of Fallot/VSD+PA.
Regarding phase velocity cine MRI, there are many studies dealing with the technical
aspects [Higgins et al., 1988, p. 21-28; Rees et al., 1989, p. 953-956; Rebergen et al., 1993,
p. 1439-1456; Rebergen et al., 1996, p. 467-481]. There are three studies on PV MRI in
patients with pulmonary hypertension [Bogren et al., 1989, p. 990-999; Caputo et al., 1991,
p. 693-698; Kondo et al., 1992, p. 751-758]. Powell et al. investigated patients with CHD,
but there was no patient with TOF/VSD+PA [Powell et al., 2000, p. 104-110]. Three studies
on PV MRI include patients with corrected TOF. Two of these studies examined the
regurgitation of the MPA [Rebergen et al., 1993, p. 2257-2266] or the MPA, LPA and RPA
Discussion
57
[Kang et al., 2003, p. 2938-2943]. Niezen et al. evaluated the effect of pulmonary
regurgitation on the biventricular function in patients with corrected TOF and found that the
pulmonary blood flow volume corresponded closely to the RV SV and the net pulmonary
blood flow volume corresponded closely to the LV SV [Niezen et al., 1996, p. 135-140].
Therefore, the second aim of this study was to determine blood flow volumes of the aorta,
MPA, RPA and LPA, in order to compare the net forward flow of the MPA with that of the
aorta, the sum of the net forward flow of the RPA and LPA and to study the blood flow
volumes of the MPA and aorta in comparison to the corresponding ventricular stroke
volumes to assess the comparability and the reliability of the volume measurements as well
as the blood flow measurements.
Paying attention to this special CHD is of great interest, as patients with TOF seem to be the
largest patient group being studied in a cardiac MRI-scanner dedicated to a pediatric
cardiology department [Fratz et al., 2008, p. (1-6)].
4.2 Methodical Aspects
Both volume measurement and blood flow velocity mapping have some methodical
limitations, which must be taken into account.
4.2.1 Limitations in the Image Analysis: Volume Measurement
The image analysis starts with the definition of the end-diastole and end-systole. Standard
analysis software (Argus®, Siemens Healthcare, Erlangen, Germany) selects the first phase
as the end-diastole. The end-systole is visually defined by the observer as the phase with the
smallest ventricular volume as previously described [Sechtem et al., 1987, p. 698; Helbing et
al., 1995, p. 830; Helbing et al., 1995, p. 591; Pattynama et al., 1995, p. 54; Rominger et al.,
1999, p. 911; Alfakih et al., 2003, p. 324; Alfakih et al., 2003, p. 26; Alfakih et al., 2004, p.
1815]. Limitations in the reliability of this method may be due to minimal problems in ECG-
triggering. If ECG-triggering is not really accurate, the end-diastole may not be in the first
Discussion
58
phase as suggested by the analysis software. Therefore, in this study the two observers
checked the end-diastole, especially in cases where ECG-triggering seemed not to be
accurate, but the image quality was accurate. In the case of four patients, the end-diastole
was at least changed once. Finding the end-systole as the phase with the smallest ventricular
volume can also be problematic in patients with a bad ventricular function. In these patients,
the ventricle contracts minimally and it is difficult to visually detect the phase where the
ventricle volume is smallest. Hence, in this study, in these complex cases, the phase where
the tricuspid or mitral valve was visually closed before opening was selected as the end-
systole.
Contour tracing knows its limitations in the upper and lower slices where the often
mentioned partial volume effect plays an important role [Sechtem et al., 1987, p. 701;
Sakuma et al., 1993, p. 380; Helbing et al., 1995, p. 835; Niwa et al., 1996, p. 574; Alfakih et
al., 2003, p. 25, Alfakih et al., 2003, p. 324; Kramer et al., 2008, p. 1-10]. Partial volume
effect exists in axial and short-axis slices [Sechtem et al., 1987, p. 701].
Partial volume effect becomes obvious for the RV in short-axis slices which are used in
routine clinical practice to measure the ventricular volumes [Rominger et al., 1999, p. 908-
918; Alfakih et al., 2004, p. 1813-1822]. Pulmonary and tricuspid valves cannot be clearly
identified making the basal boundary of the RV difficult to trace. Because the basal slice has
a large area, this can be a significant source of error. This problem becomes larger the more
complex the RV morphology and pathology become. Therefore, in routine clinical practice
of patients with CHD, RV volumes are difficult to evaluate by means of LV short-axis slices.
In contrast to the short-axis slices, in the axial slices, the pulmonary and tricuspid valves are
imaged in profile and the RV can be easily distinguished from the right atrium [Helbing et
al., 1995, p. 835; Niwa et al., 1996, p. 574; Alfakih et al., 2003, p. 26; Alfakih et al., 2004, p.
1816]. The RVOT in the uppermost slices has a smaller cross sectional area and the partial
volume effect on the final RV volume is relatively small in cases with difficult to identify
pulmonary valves [Alfakih et al., 2003, p. 26]. Generally, the last axial slice with a contour is
the one below the first slice where all pulmonary cusps are visibly closed [Alfakih et al.,
2004, p. 1815]. In the short-axis slices, contours were drawn in the RVOT up to the margins
of the cusps of the pulmonary valve, even if the right atrium was mapped. Alfakih et al.
Discussion
59
excluded slices in the short-axis slice orientation where the pulmonary valve was visible
[Alfakih et al., 2004, p. 1816]. In the lower slices, partial volume effect influences axial as
well as short-axis slices. Trabeculations of the RV accumulate in both slice orientations and
the blood-myocardium boundary is more difficult to identify [Pattynama et al., 1995, p. 58].
In axial slices, it can also be difficult to separate myocardium from the diaphragm. However,
this seems to have less important influence on the ventricular volume [Helbing et al., 1995,
p. 835]. In short-axis slices it can be difficult to separate the myocardium-fat boundary
[Pattynama et al., 1995, p. 58].
As mentioned above, the partial volume effect is also relevant for the LV. The aortic valve
can be clearly identified in both slice orientations, whereas the mitral valve can be better
identified in axial slices. In short-axis slices, it is difficult to separate the left ventricle from
the left atrium in the upper slices because one part of the blood pool is surrounded by clearly
visible ventricular myocardium and the other part by a thin wall, which certainly belongs to
the left atrium. As the left ventricular outflow tract (LVOT) is also shown, we decided to
trace the contour of the LV in these slices up to the visible cusps of the aortic valve, unlike
Alfakih et al. who drew in this case up to the junction of the atrium and the ventricle and
then they drew a straight line through the blood pool [Alfakih et al., 2003, p. 324f; Alfakih et
al., 2004, p. 1815]. In slices with predominantly thin walled atrium and where the movie
mode showed better agreement with the atrium, no LV contour was drawn as the slice was
regarded as atrium. Like in the basal slices, areas for contour tracing are important
dimensions presenting a significant source of error. In axial slices, the mitral valve is shown
in profile and the identification of atrium and ventricle is easier. The uppermost slices with
the LVOT have smaller cross sectional areas and therefore, the effect on the final LV volume
is relatively small. Also for the LV in the lower axial slices, the separation of left
myocardium and diaphragm can be problematic. However, the same problem of identifying
the myocardium-fat boundary is found in short-axis slices. [Pattynama et al., 1995, p. 58]
In summary, axial slices are superior to short-axis slices in contour tracing, and as mentioned
below, intra- and interobserver variance is better for axial slice than for short-axis slice
orientation (see 4.3.1). Partial volume effect has an influence on both slice orientations, but
Discussion
60
the influence on axial slices seems to be smaller in comparison to the short-axis slice
orientation.
4.2.2 Limitations in the Image Analysis: Blood Flow Measurement
Phase velocity cine MRI is also affected by some technical limitations, which are still not
solved [Chernobelsky et al., 2007, p. 681-685; Kilner et al., 2007, p. 723-728].
Planning for the PV cine MRI sequences can be difficult due to corrective surgery or
complex anatomy. Therefore, in some patients, it is impossible to hit the vessel orthogonally
for the blood flow measurement. If the PV cine flow sequence is not orientated perpendicular
to the vessel of interest, the results may be different to how they are in reality [Rebergen et
al., 1993, p. 2259; Kilner et al., 2007, p. 725f]. Especially, planning the RPA and LPA can
be problematic in some patients, and the PV cine MRI measurement may be planned in a
segment of the vessel after small vessel outlets. As a consequence blood flow volume is
reduced because of these outlets. Besides this, technical problems like inhomogeneity of the
magnetic field, spatial misregistration or patient movement during the measurement can
change the true blood flow volumes as well [Rebergen et al., 1993, p. 2259; Rebergen et al.,
1993, p. 1444].
Another troubling fact is aliasing which occurs when the flow velocity of the vessel of
interest is underestimated [Rebergen et al., 1993, p. 1444; Rebergen et al., 1996, p. 469]. If
this was the case, the scan was repeated using a higher velocity encoding. Patients with
inaccurate PV cine MRI scans were excluded. Difficulties in contour tracing are very low,
only in cases with arrhythmias, changes in heart rate and patient’s movement, blurring of the
images can make it tricky to distinguish the blood-vessel wall-boundary, and blood flow
volume may differ from ventricular stroke volumes [Rebergen et al., 1993, p. 1442; Powell
et al., 2000, p. 108]. Therefore, patients with bad image quality due to arrhythmias were not
included.
The movement of the heart valves depends on the chest wall and the magnet. After surgical
correction in patients with CHD, this movement during the cardiac cycle may be reduced
Discussion
61
leading to an underestimation of the regurgitant volume or the regurgitant fraction. Kilner et
al. reported that in cases where the root is dilated and mobile, the underestimation of the
regurgitant fraction could account to 10 or 15 % of the forward blood flow volume. [Kilner
et al., 2007, p. 726]
Further errors in the flow quantification can occur caused by the automatic correction of the
concomitant gradient effects (uncorrected Maxwell gradients), which is performed by the
analysis software. Besides these gradient effects, the so called eddy-current-induced fields
are not compensated by the analysis software. Errors due to eddy-current-induced fields
result in a baseline shift of the velocity vs. time curve. This shift is up to the imaging
parameters as the place of the vessel relative to the magnet isocenter, the imaging plane
angles and the VENC gradient strength. Therefore, some purposes to compensate these
errors by using information on a background region of interest are placed in stationary tissue,
others are in favor of using information of a phantom acquisition to correct the flow
measurements. However, non-breath-hold acquisitions seem to be lesser affected by these
effects. [Chernobelsky et al., 2007, p. 681f; Kilner et al., 2007, p. 724, Johansson et al.,
2009, p. (9)]
4.3 Results
4.3.1 Comparison of Axial and Short-axis Slices for Routine
Clinical Measurement of RV and LV Volumes in Patients
with Corrected TOF/VSD+PA
The results of this study show that axial and not short-axis slices should be the method of
choice for the routine clinical measurement of RV and LV volumes in patients with
corrected tetralogy of Fallot or VSD+PA. Axial slices were superior to short-axis slices for
all measured volumes of the RV and LV. In particular, the intra- and interobserver variances
of axial slices were superior to short axis slices for six out of eight measured volumes of the
RV and LV.
Discussion
62
These results are important, because during the last few years routine clinical cardiac MRI
has become a vital component for the multidisciplinary management of CHD [Pennell et al.,
2004, p. 1940-1965]. However, virtually all cardiac MRI protocols used worldwide focus on
adult patients with ischemic heart disease, and no specific protocols for patients with CHD
exist [Hendel et al., 2006, p. 1475-1497; Kramer et al., 2008, p. 1-10]. Although general
guidelines of MRI of patients with CHD have been developed [Task force of the European
Society of Cardiology, in Collaboration with the Association of European Paediatric
Cardiologists, 1998, p. 19-39; Pennell et al., 2004, p. 1940-1965; Kramer et al., 2008, p. 1-
10], specific guidelines addressing different types of CHD are not available. In particular,
MRI is considered the method of choice for the evaluation of ventricular volumes [Pennell et
al., 2004, p. 1940-1965], although the exact way to measure these volumes has not been
studied. This study compared two methods in patients with corrected TOF/VSD+PA. Now,
there is a method of choice to measure ventricular volumes in the routine clinical setting in
patients with corrected TOF/VSD+PA, the largest group of patients with CHD in
cardiovascular MRI [Fratz et al., 2008, p. (1-6)].
Furthermore, it must be suggested, that axial slices should also be the method of choice for
routine clinical measurement of RV and LV volumes in all other forms of CHD. Although
this remains to be proven, routine use of axial slices for all other forms of CHD is suggested
because of two more important potential further benefits. First, axial slices are very easy to
plan. Even in complex anatomy (e.g. in various forms of univentricular heart circulation,
transposition of the great arteries, congenitally corrected transposition of the great arteries,
criss-cross-heart, heterotaxy syndrome, dextrocardia, or mesocardia) axial slices can be
planned without any knowledge of the anatomy. Moreover, in many forms of complex CHD,
it is very difficult or not at all possible to obtain short-axis slices (e.g., in hypoplastic left
heart syndrome, double outlet right ventricle, transposition of the great arteries after atrial
switch operation, congenitally corrected transposition of the great arteries, criss-cross-heart,
heterotaxy syndrome, dextrocardia, or mesocardia). Second, by routinely using axial slices
for volume analysis of the ventricles potentially valuable morphologic information is
obtained without any need for further scans. In particular, the morphology of veno-atrial
connections, atrio-ventricular connections, and atrio-ventricular valves, ventriculo-arterial
Discussion
63
connections and atrial morphology is obtained without any need for further scans. By using
short-axis slices in CHD, all this potentially valuable information is not acquired.
Nevertheless, there are possible arguments against the routine use of axial slices for the
measurement of RV and LV volumes in all forms of CHD. First, more axial slices and
therefore more breath holds may be needed than short-axis slices. However, this was not the
case in this study. The median number of slices for the two methods did not differ. Some
patients even needed less axial slices than short-axis slices. Second, it might be possible that
axial slices lead to a bias of the RV volumes due to a partial volume effect of blood and
myocardium on the inferior wall making it difficult to identify the blood-myocardial
boundary [Sechtem et al., 1987, p. 701; Sakuma et al., 1993, p. 380; Helbing et al., 1995, p.
835; Alfakih et al., 2003, p. 25, Alfakih et al., 2003, p. 324; Kramer et al., 2008, p. 1-10].
This also was not the case in this study. Although no bias of one method was found for RV
end-diastolic volumes (table 8, p. 52), it is difficult to give a definite answer to this problem
when looking at the other three volumes studied. That is because the measured RV end-
systolic volumes were larger when using short-axis slices compared to axial slices, whereas
measured LV end-diastolic and end-systolic volumes were larger when using axial slices
compared to short-axis slices.
The most important limitation of this study is that measurement results could not be
compared with the true volume of the ventricles. The reason for this is that no method exists
to reliably measure in vivo the volume of the ventricles. Boxt et al. made a comparison
between the volume of water filled balloons and casts of right and left ventricles of excised
beef hearts determined by MRI and water displacement. They found that the volume
measured by MRI showed good correlation even so, the MRI volumes were slightly higher
than those obtained by water displacement. [Boxt et al., 1992, p. 1511] It is often said, that
MRI is the gold standard for measurement of the volume of the ventricles [Sechtem et al.,
1987, p. 687-702; Mogelvang et al., 1988, p. 529-533; Sakuma et al., 1993, p. 377-380;
Pattynama et al., 1995, p. II-233-239; Deanfield et al., 2003, p. 1035-1084]. However,
looking at the relatively large intra- and interobserver limits of agreements and variances in
this patient based study, it must be concluded, that in the routine clinical setting, volume
measurements of patients with CHD by MRI is far from being perfect. Variances may be
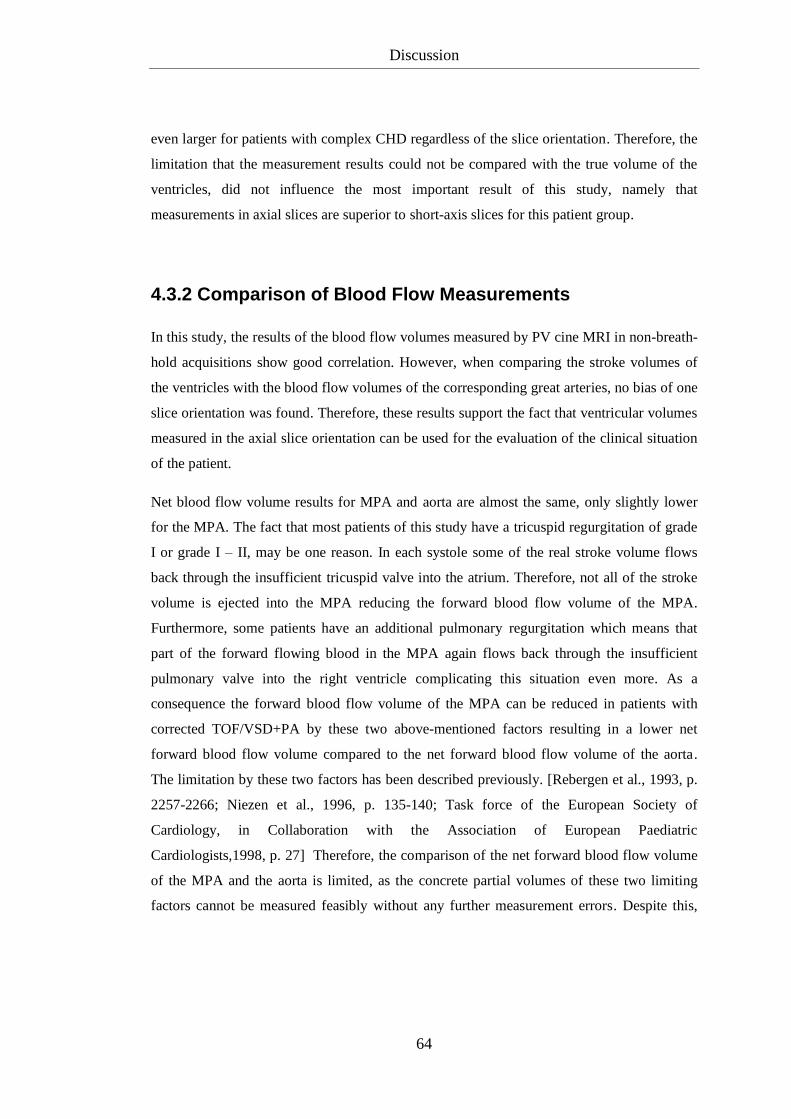
Discussion
64
even larger for patients with complex CHD regardless of the slice orientation. Therefore, the
limitation that the measurement results could not be compared with the true volume of the
ventricles, did not influence the most important result of this study, namely that
measurements in axial slices are superior to short-axis slices for this patient group.
4.3.2 Comparison of Blood Flow Measurements
In this study, the results of the blood flow volumes measured by PV cine MRI in non-breath-
hold acquisitions show good correlation. However, when comparing the stroke volumes of
the ventricles with the blood flow volumes of the corresponding great arteries, no bias of one
slice orientation was found. Therefore, these results support the fact that ventricular volumes
measured in the axial slice orientation can be used for the evaluation of the clinical situation
of the patient.
Net blood flow volume results for MPA and aorta are almost the same, only slightly lower
for the MPA. The fact that most patients of this study have a tricuspid regurgitation of grade
I or grade I – II, may be one reason. In each systole some of the real stroke volume flows
back through the insufficient tricuspid valve into the atrium. Therefore, not all of the stroke
volume is ejected into the MPA reducing the forward blood flow volume of the MPA.
Furthermore, some patients have an additional pulmonary regurgitation which means that
part of the forward flowing blood in the MPA again flows back through the insufficient
pulmonary valve into the right ventricle complicating this situation even more. As a
consequence the forward blood flow volume of the MPA can be reduced in patients with
corrected TOF/VSD+PA by these two above-mentioned factors resulting in a lower net
forward blood flow volume compared to the net forward blood flow volume of the aorta.
The limitation by these two factors has been described previously. [Rebergen et al., 1993, p.
2257-2266; Niezen et al., 1996, p. 135-140; Task force of the European Society of
Cardiology, in Collaboration with the Association of European Paediatric
Cardiologists,1998, p. 27] Therefore, the comparison of the net forward blood flow volume
of the MPA and the aorta is limited, as the concrete partial volumes of these two limiting
factors cannot be measured feasibly without any further measurement errors. Despite this,
Discussion
65
blood flow measurements can be used to quantify the forward and net forward blood flow
volume. If they are not only regarded on their own, but also in conjunction with the stroke
volumes which can feasibly be measured with volumetry by MRI [Sechtem et al., 1987, p.
697-702; Mogelvang et al., 1988, p. 529-533; Mackey et al., 1990, p. 529-532; Pattynama et
al., 1995, p. 53-63; Pennell et al., 2004, p. 1940-1965], the blood flow parameters show an
adequate relation between the net forward blood flows of the MPA and the aorta.
Net blood flow volume of the MPA and the sum of net flow volumes of RPA and LPA also
show almost the same results. Here, the net blood flow volume of the MPA is slightly lower
than the sum of the net flow volumes of RPA and LPA. Reasons for that could be additional
measurement errors and the fact that there is differential regurgitation in the branch arteries
[Kang et al., 2003, p. 2938-2943] complicating the expressiveness of this comparison.
Whereas, the results of the net forward blood flow of RPA and LPA together give deeper
insight in the net forward blood flow volume of the MPA, which attains the lung.
As mentioned above, it is important to know the accurate stroke volume of both ventricles
when the blood flow volumes of the great arteries are regarded. This study provides the
stroke volumes for both ventricles in the two most used slice orientations (axial and short-
axis slice orientation). Stroke volumes measured in both slice orientations show good
correlation with the forward flow of the corresponding great artery. However, today, there is
no statistically significant difference whether the axial or the short-axis slice orientation was
used to measure the stroke volumes. But, it should be kept in mind that in this study stroke
volume was calculated as the end-diastolic volume minus the end-systolic volume.
Therefore, the stroke volume is influenced by the measurement results of these two volumes.
As shown in table 8 on page 52 variances of the ventricular end-systolic volumes are larger
and could be one explanation for the large variances of the stroke volumes compared to the
corresponding artery. A further limitation of this study is that the reproducibility of
measuring LV volumes from axial slices has never been studied before and hence, there are
no other data available to compare with these data.
General limitations for the interpretation of blood flow volumes with ventricular volumes
exist due to technical aspects which are still not solved making flow mapping a sometimes
unreliable method [Chernobelsky et al., 2007, p. 681-685; Kilner et al., 2007, p. 723-728]. In
Discussion
66
this study, the slices for the measurement of ventricular volumes were always acquired prior
to PV cine MRI measurements of the blood flows. Patients are often nervous at the
beginning of the examination and the heart rate may differ during the examination. As
ventricular volumes and PV blood flow measurements depend on the heart rate, the
difference of the heart rate is also an important factor to consider as has been described by
several authors before [Rebergen et al., 1993, p. 1442f; Rebergen et al., 1993, p. 2264;
Rebergen et al., 1996, p. 469; Powell et al., 2000, p. 109]. Furthermore, problems in planning
the PV cine MRI sequence and other technical problems as mentioned in 4.2.2 can influence
the outcome of the blood flow volume parameters.
As already mentioned in 4.3.1, the measurement results could not be compared with the true
blood flow volumes and the true ventricular volumes, because no method exists to reliably
measure in vivo these volumes.
In summary, blood flow volumes measured by PV cine MRI provide additional information
and should be compared with the ventricular volumes to give an accurate interpretation of
the patient’s situation. Regurgitation in the vessels, valve insufficiencies and technical
problems complicate the comparability of the ventricular and blood flow volumes so that the
measurements in the routine clinical setting are still far from being perfect.
4.4 Concluding Remarks
Routine clinical measurement of RV and LV volumes by cardiac MRI in patients with
corrected tetralogy of Fallot/VSD+PA should be acquired from a data set of axial slices and
not short-axis slices. Furthermore it can be suggested that axial slices should also be the
method of choice for the routine clinical measurement of RV and LV volumes in all other
forms of CHD.
Regarding ventricular volumes and blood flow volumes measured by MRI, the combination
of both data can give accurate information for the interpretation of the patient’s clinical
situation and should be considered in conjunction with other clinical examination methods
like e.g., echocardiography.
Summary
67
5 Summary
Tetralogy of Fallot (TOF), the most common form of cyanotic congenital heart disease
(CHD), consisting of a ventricular septal defect, an overriding aorta, an obstruction of the
right ventricular outflow tract, and a resulting right ventricular hypertrophy can be surgically
corrected in early infancy today. Complications like pulmonary regurgitation and decrease in
ventricular function may occur years after corrective surgery. That is why patients undergo
periodic follow-up examinations to check the clinical situation, so that it is possible to act in
time to prevent consequential damage. Cardiac magnetic resonance imaging (MRI) – non-
invasive and without the use of ionizing radiation – will play an increasingly important role
in the evaluation of cardiac function in the long-term follow-up of patients with CHD. There
are several studies on the measurement of ventricular volumes in different slice orientations
in healthy volunteers and patients with CHD. However, the best slice orientation for the
routine clinical measurement of right and left ventricular volumes in patients with TOF still
remains unknown. As blood flow parameters of the aorta, main, right and left pulmonary
arteries have never been studied in conjunction with the ventricular volumes in patients with
corrected TOF, this study presents data on this topic as well.
This study shows that axial slice orientation provides a better reliability with smaller intra-
and interobserver variance in patients with corrected TOF for both right and left ventricular
volumes than the frequently used short-axis slice orientation. As a consequence, axial slices
and not short-axis slices should be the method of choice for the routine clinical measurement
of ventricular volumes. For an accurate interpretation of the patient’s clinical situation, blood
flow volumes measured by phase velocity cine MRI should be compared with the measured
ventricular volumes and should be considered in conjunction with other clinical examination
methods like the momentarily gold standard, the echocardiography.
Furthermore, it can be suggested that axial slices should also be the method of choice for the
routine clinical measurement of right and left ventricular volumes in all other forms of CHD.
Zusammenfassung
68
6 Zusammenfassung
Die Fallotsche Tetralogie, der häufigste angeborene zyanotische Herzfehler, der mit einem
Ventrikelseptumdefekt, einer überreitenden Aorta, einer Obstruktion des rechtsventrikulären
Ausflusstraktes und einer daraus resultierenden rechtsventrikulären Hypertrophie einhergeht,
kann heutzutage in früher Kindheit operativ korrigiert werden. Komplikationen wie eine
Pulmonalklappeninsuffizienz und Abnahme der ventrikulären Funktion können Jahre nach
der Korrekturoperation auftreten. Deshalb werden diese Patienten regelmäßig zur
Überprüfung der klinischen Situation nachuntersucht, damit möglichst rechtzeitig
eingegriffen und Folgeschäden vorgebeugt werden kann. Die kardiale
Magnetresonanztomographie (MRT) – nicht-invasiv und ohne die Verwendung von
ionisierender Strahlung – spielt eine immer wichtigere Rolle bei der Erhebung der kardialen
Funktion in Nachsorgeuntersuchungen bei Patienten mit angeborenen Herzfehlern. Es gibt
einige Studien über die Erhebung der ventrikulären Volumina in unterschiedlichen
Schichtorientierungen an gesunden Menschen und an Patienten mit angeborenen
Herzfehlern. Die beste Schichtorientierung für die Erhebung von rechts- und
linksventrikulären Volumina in der klinischen Routine bei Patienten mit Fallotscher
Tetralogie ist jedoch noch nicht bekannt. Da Blutflussparameter der Aorta, des
Pulmonalarterien-Hauptstammes, der rechten und der linken Pulmonalarterie noch nie in
Verbindung mit den ventrikulären Volumina bei Patienten mit korrigierter Fallotscher
Tetralogie untersucht wurden, präsentiert diese Studie auch Daten zu dieser Thematik.
Die vorliegende Studie zeigt, dass die axiale Schichtorientierung eine bessere Reliabilität mit
geringerer Intra- und Interobserver Varianz sowohl für rechts- als auch linksventrikuläre
Volumina bei Patienten mit Fallotscher Tetralogie bereitstellt, im Vergleich zu der sonst
üblichen Darstellung in den kurzen Achsen. Folglich sollten axiale Schichten und nicht kurze
Achsen in der klinischen Routine als Methode der Wahl eingesetzt werden um die
ventrikulären Volumina zu erheben. Damit die klinische Situation des Patienten akkurat
erfasst werden kann, sollten die mit Phase Velocity cine MRT erhobenen Blutflussparameter
mit den gemessenen ventrikulären Volumina verglichen werden und in Zusammenhang mit

Zusammenfassung
69
anderen klinischen Untersuchungsmethoden, wie dem derzeitigen Goldstandard, der
Echokardiographie, betrachtet werden.
Des Weiteren kann man empfehlen, dass axiale Schichten als Methode der Wahl in der
klinischen Routine zur Erhebung der rechts- und linksventrikulären Volumina auch bei allen
anderen angeborenen Herzfehlern eingesetzt werden sollten.
References
70
7 References
The clinical role of magnetic resonance in cardiovascular disease. Task force of the european
society of cardiology, in collaboration with the association of european paediatric
cardiologists. Eur Heart J. 19 (1998) 19-39
Alfakih, K., Plein, S., Bloomer, T., Jones, T., Ridgway, J. and Sivananthan, M. Comparison
of right ventricular volume measurements between axial and short axis orientation using
steady-state free precession magnetic resonance imaging. J Magn Reson Imaging. 18 (2003)
25-32
Alfakih, K., Plein, S., Thiele, H., Jones, T., Ridgway, J.P. and Sivananthan, M.U. Normal
human left and right ventricular dimensions for mri as assessed by turbo gradient echo and
steady-state free precession imaging sequences. J Magn Reson Imaging. 17 (2003) 323-329
Alfakih, K., Reid, S., Jones, T. and Sivananthan, M. Assessment of ventricular function and
mass by cardiac magnetic resonance imaging. Eur Radiol. 14 (2004) 1813-1822
Ammash, N. and Warnes, C.A. Cerebrovascular events in adult patients with cyanotic
congenital heart disease. J Am Coll Cardiol. 28 (1996) 768-772
Berry, D. History of cardiology: Etienne-louis fallot, md. Circulation. 114 (2006) f152
Blalock, A. and Taussig, H.B. Landmark article may 19, 1945: The surgical treatment of
malformations of the heart in which there is pulmonary stenosis or pulmonary atresia. By
alfred blalock and helen b. Taussig. Jama. 251 (1984) 2123-2138
Bland, J.M. and Altman, D.G. Statistical methods for assessing agreement between two
methods of clinical measurement. Lancet. 1 (1986) 307-310
Bogren, H.G., Klipstein, R.H., Mohiaddin, R.H., Firmin, D.N., Underwood, S.R., Rees, R.S.
and Longmore, D.B. Pulmonary artery distensibility and blood flow patterns: A magnetic
resonance study of normal subjects and of patients with pulmonary arterial hypertension. Am
Heart J. 118 (1989) 990-999
Botto, L.D., Correa, A. and Erickson, J.D. Racial and temporal variations in the prevalence
of heart defects. Pediatrics. 107 (2001) E32
Boxt, L.M., Katz, J., Kolb, T., Czegledy, F.P. and Barst, R.J. Direct quantitation of right and
left ventricular volumes with nuclear magnetic resonance imaging in patients with primary
pulmonary hypertension. J Am Coll Cardiol. 19 (1992) 1508-1515
Brickner, M.E., Hillis, L.D. and Lange, R.A. Congenital heart disease in adults. Second of
two parts. N Engl J Med. 342 (2000) 334-342
References
71
Brown, S.C., Eyskens, B., Mertens, L., Dumoulin, M. and Gewillig, M. Percutaneous
treatment of stenosed major aortopulmonary collaterals with balloon dilatation and stenting:
What can be achieved? Heart. 79 (1998) 24-28
Caputo, G.R., Kondo, C., Masui, T., Geraci, S.J., Foster, E., O'Sullivan, M.M. and Higgins,
C.B. Right and left lung perfusion: In vitro and in vivo validation with oblique-angle,
velocity-encoded cine mr imaging. Radiology. 180 (1991) 693-698
Chernobelsky, A., Shubayev, O., Comeau, C.R. and Wolff, S.D. Baseline correction of phase
contrast images improves quantification of blood flow in the great vessels. J Cardiovasc
Magn Reson. 9 (2007) 681-685
Dabizzi, R.P., Teodori, G., Barletta, G.A., Caprioli, G., Baldrighi, G. and Baldrighi, V.
Associated coronary and cardiac anomalies in the tetralogy of fallot. An angiographic study.
Eur Heart J. 11 (1990) 692-704
Deanfield, J., Thaulow, E., Warnes, C., Webb, G., Kolbel, F., Hoffman, A., Sorenson, K.,
Kaemmer, H., Thilen, U., Bink-Boelkens, M., Iserin, L., Daliento, L., Silove, E., Redington,
A., Vouhe, P., Priori, S., Alonso, M.A., Blanc, J.J., Budaj, A., Cowie, M., Deckers, J.,
Fernandez Burgos, E., Lekakis, J., Lindahl, B., Mazzotta, G., Morais, J., Oto, A., Smiseth,
O., Trappe, H.J., Klein, W., Blomstrom-Lundqvist, C., de Backer, G., Hradec, J., Mazzotta,
G., Parkhomenko, A., Presbitero, P. and Torbicki, A. Management of grown up congenital
heart disease. Eur Heart J. 24 (2003) 1035-1084
DeBakey, M.E. John gibbon and the heart-lung machine: A personal encounter and his
import for cardiovascular surgery. Ann Thorac Surg. 76 (2003) S2188-2194
Discigil, B., Dearani, J.A., Puga, F.J., Schaff, H.V., Hagler, D.J., Warnes, C.A. and
Danielson, G.K. Late pulmonary valve replacement after repair of tetralogy of fallot. J
Thorac Cardiovasc Surg. 121 (2001) 344-351
Eicken, A., Fratz, S., Gutfried, C., Balling, G., Schwaiger, M., Lange, R., Busch, R., Hess, J.
and Stern, H. Hearts late after fontan operation have normal mass, normal volume, and
reduced systolic function: A magnetic resonance imaging study. J Am Coll Cardiol. 42
(2003) 1061-1065
Evans, W.N. "Tetralogy of fallot" And etienne-louis arthur fallot. Pediatr Cardiol. 29 (2008)
637-640
Fallot, ELA. Contribution à l'anatomie pathologique de la maladie bleue (cyanose
cardiaque). Marseille médical 25 (1888) 77-93, 138-158, 207-223, 341-354, 370-386, 403-
420
Ferencz, C., Rubin, J.D., McCarter, R.J., Brenner, J.I., Neill, C.A., Perry, L.W., Hepner, S.I.
and Downing, J.W. Congenital heart disease: Prevalence at livebirth. The baltimore-
washington infant study. Am J Epidemiol. 121 (1985) 31-36
References
72
Finck, S.J., Puga, F.J. and Danielson, G.K. Pulmonary valve insertion during reoperation for
tetralogy of fallot. Ann Thorac Surg. 45 (1988) 610-613
Fratz, S., Hager, A., Busch, R., Kaemmerer, H., Schwaiger, M., Lange, R., Hess, J. and
Stern, H.C. Patients after atrial switch operation for transposition of the great arteries can not
increase stroke volume under dobutamine stress as opposed to patients with congenitally
corrected transposition. Circ J. 72 (2008) 1130-1135
Fratz, S., Hauser, M., Bengel, F.M., Hager, A., Kaemmerer, H., Schwaiger, M., Hess, J. and
Stern, H.C. Myocardial scars determined by delayed-enhancement magnetic resonance
imaging and positron emission tomography are not common in right ventricles with systemic
function in long-term follow up. Heart. 92 (2006) 1673-1677
Fratz, S., Hess, J., Schuhbaeck, A., Buchner, C., Hendrich, E., Martinoff, S. and Stern, H.
Routine clinical cardiovascular magnetic resonance in paediatric and adult congenital heart
disease: Patients, protocols, questions asked and contributions made. J Cardiovasc Magn
Reson. 10 (2008) 46
Fratz, S., Hess, J., Schwaiger, M., Martinoff, S. and Stern, H.C. More accurate quantification
of pulmonary blood flow by magnetic resonance imaging than by lung perfusion
scintigraphy in patients with fontan circulation. Circulation. 106 (2002) 1510-1513
Goldmuntz, E., Geiger, E. and Benson, D.W. Nkx2.5 mutations in patients with tetralogy of
fallot. Circulation. 104 (2001) 2565-2568
Gross, R.E. and Hubbard, J.P. Landmark article feb 25, 1939: Surgical ligation of a patent
ductus arteriosus. Report of first successful case. By robert e. Gross and john p. Hubbard.
Jama. 251 (1984) 1201-1202
Gutberlet, M., Abdul-Khaliq, H., Grothoff, M., Schroter, J., Schmitt, B., Rottgen, R., Lange,
P., Vogel, M. and Felix, R. [evaluation of left ventricular volumes in patients with congenital
heart disease and abnormal left ventricular geometry. Comparison of mri and transthoracic 3-
dimensional echocardiography]. Rofo. 175 (2003) 942-951
Hazekamp, M.G., Kurvers, M.M., Schoof, P.H., Vliegen, H.W., Mulder, B.M., Roest, A.A.,
Ottenkamp, J. and Dion, R.A. Pulmonary valve insertion late after repair of fallot's tetralogy.
Eur J Cardiothorac Surg. 19 (2001) 667-670
Helbing, W.A., Bosch, H.G., Maliepaard, C., Rebergen, S.A., van der Geest, R.J., Hansen,
B., Ottenkamp, J., Reiber, J.H. and de Roos, A. Comparison of echocardiographic methods
with magnetic resonance imaging for assessment of right ventricular function in children.
Am J Cardiol. 76 (1995) 589-594
Helbing, W.A., Rebergen, S.A., Maliepaard, C., Hansen, B., Ottenkamp, J., Reiber, J.H. and
de Roos, A. Quantification of right ventricular function with magnetic resonance imaging in
children with normal hearts and with congenital heart disease. Am Heart J. 130 (1995) 828-
837
References
73
Hendel, R.C., Patel, M.R., Kramer, C.M., Poon, M., Hendel, R.C., Carr, J.C., Gerstad, N.A.,
Gillam, L.D., Hodgson, J.M., Kim, R.J., Kramer, C.M., Lesser, J.R., Martin, E.T., Messer,
J.V., Redberg, R.F., Rubin, G.D., Rumsfeld, J.S., Taylor, A.J., Weigold, W.G., Woodard,
P.K., Brindis, R.G., Hendel, R.C., Douglas, P.S., Peterson, E.D., Wolk, M.J., Allen, J.M. and
Patel, M.R. Accf/acr/scct/scmr/asnc/nasci/scai/sir 2006 appropriateness criteria for cardiac
computed tomography and cardiac magnetic resonance imaging: A report of the american
college of cardiology foundation quality strategic directions committee appropriateness
criteria working group, american college of radiology, society of cardiovascular computed
tomography, society for cardiovascular magnetic resonance, american society of nuclear
cardiology, north american society for cardiac imaging, society for cardiovascular
angiography and interventions, and society of interventional radiology. J Am Coll Cardiol.
48 (2006) 1475-1497
Higgins, C.B., Sechtem, U.P. and Pflugfelder, P. Cine mr: Evaluation of cardiac ventricular
function and valvular function. Int J Card Imaging. 3 (1988) 21-28
Hoffman, J.I. Incidence of congenital heart disease: I. Postnatal incidence. Pediatr Cardiol.
16 (1995) 103-113
Hoffman, J.I. and Kaplan, S. The incidence of congenital heart disease. J Am Coll Cardiol.
39 (2002) 1890-1900
Hoffman, J.I., Kaplan, S. and Liberthson, R.R. Prevalence of congenital heart disease. Am
Heart J. 147 (2004) 425-439
Jenkins, K.J., Correa, A., Feinstein, J.A., Botto, L., Britt, A.E., Daniels, S.R., Elixson, M.,
Warnes, C.A. and Webb, C.L. Noninherited risk factors and congenital cardiovascular
defects: Current knowledge: A scientific statement from the american heart association
council on cardiovascular disease in the young: Endorsed by the american academy of
pediatrics. Circulation. 115 (2007) 2995-3014
Johansson, B., Babu-Narayan, S.V. and Kilner, P.J. The effects of breath-holding on
pulmonary regurgitation measured by cardiovascular magnetic resonance velocity mapping.
J Cardiovasc Magn Reson. 11 (2009) 1
Jones, E.L., Conti, C.R., Neill, C.A., Gott, V.L., Brawley, R.K. and Haller, J.A., Jr. Long-
term evaluation of tetralogy patients with pulmonary valvular insufficiency resulting from
outflow-patch correction across the pulmonic annulus. Circulation. 48 (1973) III11-18
Kang, I.S., Redington, A.N., Benson, L.N., Macgowan, C., Valsangiacomo, E.R., Roman,
K., Kellenberger, C.J. and Yoo, S.J. Differential regurgitation in branch pulmonary arteries
after repair of tetralogy of fallot: A phase-contrast cine magnetic resonance study.
Circulation. 107 (2003) 2938-2943
Kaulitz, R., Jux, C., Bertram, H., Paul, T., Ziemer, G. and Hausdorf, G. Primary repair of
tetralogy of fallot in infancy--the effect on growth of the pulmonary arteries and the risk for
late reinterventions. Cardiol Young. 11 (2001) 391-398
References
74
Kilner, P.J., Gatehouse, P.D. and Firmin, D.N. Flow measurement by magnetic resonance: A
unique asset worth optimising. J Cardiovasc Magn Reson. 9 (2007) 723-728
Kirklin, J.K., Kirklin, J.W., Blackstone, E.H., Milano, A. and Pacifico, A.D. Effect of
transannular patching on outcome after repair of tetralogy of fallot. Ann Thorac Surg. 48
(1989) 783-791
Kondo, C., Caputo, G.R., Masui, T., Foster, E., O'Sullivan, M., Stulbarg, M.S., Golden, J.,
Catterjee, K. and Higgins, C.B. Pulmonary hypertension: Pulmonary flow quantification and
flow profile analysis with velocity-encoded cine mr imaging. Radiology. 183 (1992) 751-758
Kramer, C.M., Barkhausen, J., Flamm, S.D., Kim, R.J. and Nagel, E. Standardized
cardiovascular magnetic resonance imaging (cmr) protocols, society for cardiovascular
magnetic resonance: Board of trustees task force on standardized protocols. J Cardiovasc
Magn Reson. 10 (2008) 35
Landzberg, M.J., Murphy, D.J., Jr., Davidson, W.R., Jr., Jarcho, J.A., Krumholz, H.M.,
Mayer, J.E., Jr., Mee, R.B., Sahn, D.J., Van Hare, G.F., Webb, G.D. and Williams, R.G.
Task force 4: Organization of delivery systems for adults with congenital heart disease. J Am
Coll Cardiol. 37 (2001) 1187-1193
Lomax R. G. "Statistical Concepts: A Second Course for Education and the Behavioral
Sciences". Lawrence Erlbaum Associates Inc, US 10, 2007
Lorenz, C.H., Walker, E.S., Graham, T.P., Jr. and Powers, T.A. Right ventricular
performance and mass by use of cine mri late after atrial repair of transposition of the great
arteries. Circulation. 92 (1995) II233-239
Mackey, E.S., Sandler, M.P., Campbell, R.M., Graham, T.P., Jr., Atkinson, J.B., Price, R.
and Moreau, G.A. Right ventricular myocardial mass quantification with magnetic resonance
imaging. Am J Cardiol. 65 (1990) 529-532
Magnetic Resonance - Technology Information Portal. Flow Quantification. (http://www.mr-
tip.com/serv1.php?type=db1&dbs=Flow%20Quantification) status: 12/28/09
Marelli, A.J., Mackie, A.S., Ionescu-Ittu, R., Rahme, E. and Pilote, L. Congenital heart
disease in the general population: Changing prevalence and age distribution. Circulation. 115
(2007) 163-172
McElhinney, D.B., Krantz, I.D., Bason, L., Piccoli, D.A., Emerick, K.M., Spinner, N.B. and
Goldmuntz, E. Analysis of cardiovascular phenotype and genotype-phenotype correlation in
individuals with a jag1 mutation and/or alagille syndrome. Circulation. 106 (2002) 2567-
2574
Mogelvang, J., Stubgaard, M., Thomsen, C. and Henriksen, O. Evaluation of right
ventricular volumes measured by magnetic resonance imaging. Eur Heart J. 9 (1988) 529-
533
References
75
Moller, J.H., Taubert, K.A., Allen, H.D., Clark, E.B. and Lauer, R.M. Cardiovascular health
and disease in children: Current status. A special writing group from the task force on
children and youth, american heart association. Circulation. 89 (1994) 923-930
Morgan, B.C., Guntheroth, W.G., Bloom, R.S. and Fyler, D.C. A clinical profile of
paroxysmal hyperpnea in cyanotic congenital heart disease. Circulation. 31 (1965) 66-69
Nesser, H.J., Tkalec, W., Patel, A.R., Masani, N.D., Niel, J., Markt, B. and Pandian, N.G.
Quantitation of right ventricular volumes and ejection fraction by three-dimensional
echocardiography in patients: Comparison with magnetic resonance imaging and
radionuclide ventriculography. Echocardiography. 23 (2006) 666-680
Niezen, R.A., Helbing, W.A., van der Wall, E.E., van der Geest, R.J., Rebergen, S.A. and de
Roos, A. Biventricular systolic function and mass studied with mr imaging in children with
pulmonary regurgitation after repair for tetralogy of fallot. Radiology. 201 (1996) 135-140
Niwa, K., Uchishiba, M., Aotsuka, H., Tobita, K., Matsuo, K., Fujiwara, T., Tateno, S. and
Hamada, H. Measurement of ventricular volumes by cine magnetic resonance imaging in
complex congenital heart disease with morphologically abnormal ventricles. Am Heart J.
131 (1996) 567-575
Oosterhof, T., Tulevski, II, Roest, A.A., Steendijk, P., Vliegen, H.W., van der Wall, E.E., de
Roos, A., Tijssen, J.G. and Mulder, B.J. Disparity between dobutamine stress and physical
exercise magnetic resonance imaging in patients with an intra-atrial correction for
transposition of the great arteries. J Cardiovasc Magn Reson. 7 (2005) 383-389
Ostrzega, E., Maddahi, J., Honma, H., Crues, J.V., 3rd, Resser, K.J., Charuzi, Y. and
Berman, D.S. Quantification of left ventricular myocardial mass in humans by nuclear
magnetic resonance imaging. Am Heart J. 117 (1989) 444-452
Pattynama, P.M., Lamb, H.J., Van der Velde, E.A., Van der Geest, R.J., Van der Wall, E.E.
and De Roos, A. Reproducibility of mri-derived measurements of right ventricular volumes
and myocardial mass. Magn Reson Imaging. 13 (1995) 53-63
Pennell, D.J., Sechtem, U.P., Higgins, C.B., Manning, W.J., Pohost, G.M., Rademakers,
F.E., van Rossum, A.C., Shaw, L.J. and Yucel, E.K. Clinical indications for cardiovascular
magnetic resonance (cmr): Consensus panel report. Eur Heart J. 25 (2004) 1940-1965
Pierpont, M.E., Basson, C.T., Benson, D.W., Jr., Gelb, B.D., Giglia, T.M., Goldmuntz, E.,
McGee, G., Sable, C.A., Srivastava, D. and Webb, C.L. Genetic basis for congenital heart
defects: Current knowledge: A scientific statement from the american heart association
congenital cardiac defects committee, council on cardiovascular disease in the young:
Endorsed by the american academy of pediatrics. Circulation. 115 (2007) 3015-3038
Pigula, F.A., Khalil, P.N., Mayer, J.E., del Nido, P.J. and Jonas, R.A. Repair of tetralogy of
fallot in neonates and young infants. Circulation. 100 (1999) II157-161
References
76
Pizzuti, A., Sarkozy, A., Newton, A.L., Conti, E., Flex, E., Digilio, M.C., Amati, F., Gianni,
D., Tandoi, C., Marino, B., Crossley, M. and Dallapiccola, B. Mutations of zfpm2/fog2 gene
in sporadic cases of tetralogy of fallot. Hum Mutat. 22 (2003) 372-377
Powell, A.J., Maier, S.E., Chung, T. and Geva, T. Phase-velocity cine magnetic resonance
imaging measurement of pulsatile blood flow in children and young adults: In vitro and in
vivo validation. Pediatr Cardiol. 21 (2000) 104-110
Presbitero, P., Prever, S.B., Contrafatto, I. and Morea, M. As originally published in 1988:
Results of total correction of tetralogy of fallot performed in adults. Updated in 1996. Ann
Thorac Surg. 61 (1996) 1870-1873
Rammohan, M., Airan, B., Bhan, A., Sharma, R., Srivastava, S., Saxena, A., Sampath, K.A.
and Venugopal, P. Total correction of tetralogy of fallot in adults--surgical experience. Int J
Cardiol. 63 (1998) 121-128
Rao, B.N., Anderson, R.C. and Edwards, J.E. Anatomic variations in the tetralogy of fallot.
Am Heart J. 81 (1971) 361-371
Rebergen, S.A., Chin, J.G., Ottenkamp, J., van der Wall, E.E. and de Roos, A. Pulmonary
regurgitation in the late postoperative follow-up of tetralogy of fallot. Volumetric
quantitation by nuclear magnetic resonance velocity mapping. Circulation. 88 (1993) 2257-
2266
Rebergen, S.A., Niezen, R.A., Helbing, W.A., van der Wall, E.E. and de Roos, A. Cine
gradient-echo mr imaging and mr velocity mapping in the evaluation of congenital heart
disease. Radiographics. 16 (1996) 467-481
Rebergen, S.A., Ottenkamp, J., Doornbos, J., van der Wall, E.E., Chin, J.G. and de Roos, A.
Postoperative pulmonary flow dynamics after fontan surgery: Assessment with nuclear
magnetic resonance velocity mapping. J Am Coll Cardiol. 21 (1993) 123-131
Rebergen, S.A., van der Wall, E.E., Doornbos, J. and de Roos, A. Magnetic resonance
measurement of velocity and flow: Technique, validation, and cardiovascular applications.
Am Heart J. 126 (1993) 1439-1456
Rees, S., Firmin, D., Mohiaddin, R., Underwood, R. and Longmore, D. Application of flow
measurements by magnetic resonance velocity mapping to congenital heart disease. Am J
Cardiol. 64 (1989) 953-956
Rominger, M.B., Bachmann, G.F., Pabst, W. and Rau, W.S. Right ventricular volumes and
ejection fraction with fast cine mr imaging in breath-hold technique: Applicability, normal
values from 52 volunteers, and evaluation of 325 adult cardiac patients. J Magn Reson
Imaging. 10 (1999) 908-918
References
77
Rowe, S.A., Zahka, K.G., Manolio, T.A., Horneffer, P.J. and Kidd, L. Lung function and
pulmonary regurgitation limit exercise capacity in postoperative tetralogy of fallot. J Am
Coll Cardiol. 17 (1991) 461-466
Sakuma, H., Fujita, N., Foo, T.K., Caputo, G.R., Nelson, S.J., Hartiala, J., Shimakawa, A.
and Higgins, C.B. Evaluation of left ventricular volume and mass with breath-hold cine mr
imaging. Radiology. 188 (1993) 377-380
Schreiber, C., Horer, J., Vogt, M., Fratz, S., Kunze, M., Galm, C., Eicken, A. and Lange, R.
A new treatment option for pulmonary valvar insufficiency: First experiences with
implantation of a self-expanding stented valve without use of cardiopulmonary bypass. Eur J
Cardiothorac Surg. 31 (2007) 26-30
Schwedler, G., Bauer U., Hense, H.W. (2005) Angeborene Herzfehler bei Kindern der
Geburtsjahrgänge 2000 bis 2004 - Erste Ergebnisse des Nationalen Registers für angeborene
Herzfehler. (http://www.egms.de/en/meetings/gmds2005/05gmds062.shtml) status: 05/10/08
Sechtem, U., Pflugfelder, P.W., Gould, R.G., Cassidy, M.M. and Higgins, C.B.
Measurement of right and left ventricular volumes in healthy individuals with cine mr
imaging. Radiology. 163 (1987) 697-702
Sluysmans, T., Neven, B., Rubay, J., Lintermans, J., Ovaert, C., Mucumbitsi, J., Shango, P.,
Stijns, M. and Vliers, A. Early balloon dilatation of the pulmonary valve in infants with
tetralogy of fallot. Risks and benefits. Circulation. 91 (1995) 1506-1511
Sommer, R.J., Hijazi, Z.M. and Rhodes, J.F. Pathophysiology of congenital heart disease in
the adult: Part iii: Complex congenital heart disease. Circulation. 117 (2008) 1340-1350
Soto, B. and McConnell, M.E. Tetralogy of fallot: Angiographic and pathological
correlation. Semin Thorac Cardiovasc Surg. 2 (1990) 12-26
Stanger, P., Silverman, N.H. and Foster, E. Diagnostic accuracy of pediatric
echocardiograms performed in adult laboratories. Am J Cardiol. 83 (1999) 908-914
Touati, G.D., Vouhe, P.R., Amodeo, A., Pouard, P., Mauriat, P., Leca, F. and Neveux, J.Y.
Primary repair of tetralogy of fallot in infancy. J Thorac Cardiovasc Surg. 99 (1990) 396-
402; discussion 402-393
Tworetzky, W., McElhinney, D.B., Brook, M.M., Reddy, V.M., Hanley, F.L. and Silverman,
N.H. Echocardiographic diagnosis alone for the complete repair of major congenital heart
defects. J Am Coll Cardiol. 33 (1999) 228-233
Van Praagh, R. Etienne-louis arthur fallot and his tetralogy: A new translation of fallot's
summary and a modern reassessment of this anomaly. Eur J Cardiothorac Surg. 3 (1989)
381-386

References
78
Warnes, C.A., Liberthson, R., Danielson, G.K., Dore, A., Harris, L., Hoffman, J.I.,
Somerville, J., Williams, R.G. and Webb, G.D. Task force 1: The changing profile of
congenital heart disease in adult life. J Am Coll Cardiol. 37 (2001) 1170-1175
Zahka, K.G., Horneffer, P.J., Rowe, S.A., Neill, C.A., Manolio, T.A., Kidd, L. and Gardner,
T.J. Long-term valvular function after total repair of tetralogy of fallot. Relation to
ventricular arrhythmias. Circulation. 78 (1988) III14-19
Figures
79
8 Figures
Figure 1: Anatomy and Pathophysiology of Tetralogy of Fallot...…………………………14
Figure 2: Reasons for Exclusion…….……………………………………………………...24
Figure 3: End-Diastolic Axial Slice Images with the Endocardial Contours defined
for the Right Ventricle…........................................................................................32
Figure 4: End-Systolic Axial Slice Images with the Endocardial Contours defined
for the Right Ventricle……....................................................................................33
Figure 5: End-Diastolic Axial Slice Images with the Endocardial Contours defined
for the Left Ventricle……......................................................................................34
Figure 6: End-Systolic Axial Slice Images with the Endocardial Contours defined
for the Left Ventricle……......................................................................................35
Figure 7: End-Diastolic Short-Axis Slice Images with the Endocardial Contours
defined for the Right Ventricle…………………………………………………...36
Figure 8: End-Systolic Short-Axis Slice Images with the Endocardial Contours
defined for the Right Ventricle…………………………………………………...37
Figure 9: End-Diastolic Short-Axis Slice Images with the Endocardial Contours
defined for the Left Ventricle…………………………………………………….38
Figure 10: End-Systolic Short-Axis Slice Images with the Endocardial Contours
defined for the Left Ventricle…………………………………………………..39
Figure 11: Regression Analysis of RV EDV in Axial Slices……………………………….44
Figure 12: Bland-Altman: Difference in [%] against mean for RV EDV in Axial Slices….44
Figure 13: Regression Analysis of RV EDV in Short-axis Slices………………………….46

Figures
80
Figure 14: Bland-Altman: Difference in [%] against mean for RV EDV in
Short-axis Slices………………………………………………………………..46
Figure 15: Regression Analysis of LV ESV (axial vs. short-axis)…………….....................53
Figure 16: Bland-Altman: Difference in [%] against mean for LV ESV
(axial vs. short-axis)……………….…………………………………………...53
Tables
81
9 Tables
Table 1: Description of the Study Population………………………………………………26
Table 2: Regression Analysis and Bland-Altman Analysis of Axial Slices………………...45
Table 3: Regression Analysis and Bland-Altman Analysis of Short-axis Slices…………...47
Table 4: Intraobserver Variance and F-Test Results ……………………………………….48
Table 5: Regression Analysis and Bland-Altman Analysis of Axial Slices………………...49
Table 6: Regression Analysis and Bland-Altman Analysis of Short-axis Slices…………...50
Table 7: Interobserver Variance and F-Test Results………………………………………..51
Table 8: Axial vs. Short-Axis Orientation (Bland-Altman Analysis) and T-Test Results….52
Table 9: Regression Analysis, Bland-Altman Analysis and Variance of the Net
Forward Blood Flow Volumes……………………….……………………………55
Table 10: Regression Analysis, Bland-Altman Analysis and Variance of the Forward
Blood Flow Volumes with the corresponding Stroke Volumes measured in
the Axial and Short-Axis Slice Orientation as well as F-Test Results…………..55
Acknowledgements
82
Acknowledgements
I would like to thank all the following persons for their support and help in completing this
dissertation:
Prof. Dr. med. John Hess for giving me the opportunity to work on this dissertation in the
Department of Paediatric Cardiology and Congenital Heart Disease at the German Heart
Centre Munich
PD Dr. med. Sohrab Fratz for his patience, medical and statistical expertise, teaching of the
contour tracing, guidance, friendliness and continuous support
PD Dr. med. Heiko Stern for his medical and statistical expertise and his friendliness
Dr. med. Stefan Martinoff, director of the Institute of Radiology and Nuclear Medicine, as
well as the whole team of this department, especially the assistant medical technicians of the
MRI team for their friendliness and patience in providing images with an accurate image
quality and the assistant medical technicians from the archive for their friendly help in
problems with the archive
Raymonde Busch from the Institut für Medizinische Statistik und Epidemiologie in Munich
for her expertise in statistics
Last but not least, my parents whose continuous support enabled me to study medicine and
helped me to complete this dissertation and my brothers and my sister for their assistance.