Embed Size (px)
Citation preview
Effects of impurities on an industrial crystallization process of
ammonium sulfate
Dissertation
zur Erlangung des akademischen Grades
Doktoringenieur (Dr.-Ing.)
vorgelegt dem
Zentrum für Ingenieurwissenschaften
der Martin-Luther-Universität Halle-Wittenberg
als organisatorische Grundeinheit für Forschung und Lehre im Range einer Fakultät
(§ 75 Abs. 1 HSG LSA, § 1 Abs. 1 Grundordnung)
von
Herrn Dipl.-Ing. Robert Buchfink
geboren am 18.04.1983
Gutachter: 1. Prof. Dr.-Ing. Dr. h.c. Joachim Ulrich
2. Prof. Dr. rer. nat. habil. Axel König
Datum der Verteidigung: 02.05.2011
Halle (Saale), den 01.06.2011


Acknowledgment
First of all I want to thank my family including my parents Gunter und Sigrid, my sister
Lydia and my grandfather Walter. I wished my grandmother Hanni could have seen
me getting a PhD degree. All of them gave me a great support, both financial and
moral, over the long period of study and up to now we have a fantastic relationship.
Furthermore, I want to acknowledge the support of my girlfriend Elli who was always
there for me in good and in bad times.
No PhD thesis without a supervisor, an institute and a topic. In this context I want to
thank Prof. Dr.-Ing. Dr. h.c. Joachim Ulrich who gave me the great opportunity to
work at his institute and who supervised my research in the interesting field of
crystallization. Moreover, I also want to thank Prof. Ulrich for creating the institute as
a melting pot of international students which opened my mind in many ways and
gave me the opportunity to get close friendships and learn much about the culture of
different nations.
Moreover I want to thank Prof. Dr. Axel König for his willingness to be the second
examiner for this work and my special thanks also go to all the members of the
examination committee.
Concerning the life at “TVT” I, especially, want to thank the four musketeers Mr.
Weißbarth, Canerinho, Angus and Püpp for the nice days full of laughing, the
afternoons full of sports and the evenings full of “scientific stuff”.
Mr. Weißbarth was and he still is irreplaceable concerning his work as technician, for
interesting discussions on science and as a fellow for after work activities. Over the
years I had so much fun with my colleagues at TVT, so thank you Essa, Javetti, Claudi,
Christiane, Patrugi, Isabell, Yi, Anika, Danovitsch, Kesarinho, Chilli, Vivi, Jingfei,
Mehrdad, James, Lydi, Micha, Torsten, Frau Höser and Claudia K. for making the work
at TVT unforgettable.
I think this thesis would not be possible without the hard work of the students I
supervised during my time at TVT. With this in mind I want to thank Bernd, Rene,
Sebastian, Agnes, Christiane, Omar, Steffen² and Iwona for their help and the friendly
collaboration.
In addition, I would like to thank SKW Piesteritz for giving me the topic of this work.
Therefore I acknowledge Prof. Dr. Dr. h.c. Niclas for the helpful discussions and the
promotion of the status seminars, Dr. Niendorf and his lab stuff for performing the

ICP measurements and being the first contact person at SKW Piesteritz, Dr. Geisler
and all the others I met during my time working together with SKW Piesteritz.
Thanks to the team of AIP e.V. for the administrative support, my special thanks go to
Mrs. Schweizer, Mrs. Bähr and Dr. Weber for the friendly atmosphere and the help
concerning organization problems.
In this context I want to thank the EU, the federal state Saxony-Anhalt, the AIP e.V.
and SKW Piesteritz for the finance of my PhD student position.
Last but not least I want to thank my flatmate René for the long time of living
together without any big conflicts and the countless crazy and funny things we did
together during the study. Special thanks to all the other close friends, especially
Muh, Mucks, Markus, Oli und David, for the nice times at the weekends and on
vacation which recharged my batteries and spent me the power to go on.
Robert Buchfink
Table of Contents
1. Introduction ................................................................................................................ 7
2. Basics of Crystallization ............................................................................................... 9
2.1 Crystal State ..................................................................................................... 9
2.2 Phase Diagram ................................................................................................ 10
2.2.1 Solubility ............................................................................................. 10
2.2.2 Supersolubility and Metastable Zone Width (MZW) ......................... 11
2.3 Nucleation ...................................................................................................... 12
2.3.1 Basic and Energetic Considerations ................................................... 12
2.3.2 Effect of Impurities ............................................................................. 15
2.4 Crystal Growth ................................................................................................ 16
2.4.1 Theories on Crystal Growth ................................................................ 16
2.4.2 Effect of Impurities on Crystal Growth............................................... 19
2.5 Crystal Habit and Effect of Impurities ............................................................ 21
2.6 Metal Ions in Aqueous Solution ..................................................................... 23
3. Aim of the Work ........................................................................................................ 27
4. Materials and Methods ............................................................................................. 29
4.1 Chemicals ....................................................................................................... 29
4.2 Microscope Cell .............................................................................................. 31
4.3 Fluidized Bed .................................................................................................. 32
4.4 Ultrasonic Speed Measurements ................................................................... 35
4.5 Batch Crystallization ....................................................................................... 38
4.6 Metal ion concentration -ICP ......................................................................... 39
4.7 Computer based Simulations ......................................................................... 39
4.7.1 Hyss ..................................................................................................... 39
4.7.2 Molecular Modeling ........................................................................... 39
5. Results ....................................................................................................................... 41
5.1 Interactions Impurity – pH Value ................................................................... 41
5.2 Morphology – Microscopy Cell ...................................................................... 42
5.3 Metastable Zone Width ................................................................................. 46
5.3.1 Effect of Impurities on the MZW (pH 4) ............................................. 46
5.3.2 Influence of the pH Value on the Effect of Trivalent Metal Ions on
MZW ............................................................................................................ 48
5.3.3 Synergy Effects of Fe3+ and Al3+ Ions on MZW .................................... 50
5.3.4 Removing Effect of Oxalic Acid ........................................................... 51
5.4 Crystal Growth and Dissolution Rate ............................................................. 52
5.5 Morphology – Batch Crystallization ............................................................... 56
5.5.1 Effect of Metal Ions on the Morphology ............................................ 56
5.5.2 The Removing Effect of Oxalic Acid .................................................... 60
5.6 Integration Experiments................................................................................. 62
6.Discussion ................................................................................................................... 65
6.1 Impurity Adsorption and Consequences........................................................ 65
6.1.1 Changes in Crystal Growth Rate ......................................................... 65
6.1.2 Changes in Metastable Zone Width ................................................... 68
6.1.3 Changes in Morphology ...................................................................... 72
6.1.4 Concluding Focus on Impurity Adsorption ......................................... 76
6.2 Influence of the pH value ............................................................................... 81
6.3 Removing Effect of Oxalic Acid ...................................................................... 84
6.4 Incorporation of Impurities ............................................................................ 88
6.5 Consequences for industrial crystallization processes .................................. 90
7. Conclusions and Outlook .......................................................................................... 93
8. Summary ................................................................................................................... 95
Introduction
7
1. Introduction
In general, crystallization is a process including a liquid-solid phase transition. This
process was used for a very long time by mankind and one famous example is the
production of the so-called “white gold”, the sodium chloride. The Martin Luther
University is situated in Halle at the river Saale which is famous for its history in the
production of food grade salt. Archaeological findings of tools for the salt production
at the “Hallmarkt” close to river Saale from the year 2000 before Christ are evidence
for a considerable salt production of Celtic, German and Slavic tribes. In 13th century
saltwater was taken from springs and was brought to so-called boiling houses, where
the water was evaporated and therefore salt was produced. Afterwards the wet salt
was dried in big baskets and the final product table salt could be sold. From this
example for early and simple evaporation crystallizations there was a steep
development and today crystallization processes are highly efficient and generate
very pure products with high yields.
These industrial crystallization processes for the production of inorganic salts like
ammonium sulfate are large scale processes. By taking a look at the crystallization
unit of such a process and fading out all upstream or downstream process operations
like centrifugation, filtration, drying or storage, the dimension become clear.
The most important criterion for the success of the process is the product stream
which contains the desired crystalline product. This product should have specified
properties after leaving the crystallizer. On the one hand the quantity (yield) of the
crystallization should be as high as possible to make the process profitable. On the
other hand there is the product quality which includes parameters like crystal size
and crystal size distribution, the shape of the product crystals and their purity. All of
these parameters depend on the design of the crystallizer (and process conditions)
and on the properties of the feed stream.
Common types of crystallizers are the FC (Forced Circulation) crystallizer, the DTB
(Draft Tube Baffle) crystallizer or the Oslo-type crystallizer [Hof04]. All of these types
are continuous crystallizers which are often used for mass products like inorganic
salts. Already by choosing the one or the other type of crystallizer the size of the
product crystals is fixed into a defined range.
Introduction
8
So with the FC crystallizer crystal sizes from 0.2-0.8 mm can be produced, whereas
the Oslo-type crystallizer is used to achieve crystals in the size range of >1.5-5 mm
[Hof04].
Up to this point there is no problem, but also the feed stream can affect the
properties of the product. Industrial mass productions of inorganic compounds like
ammonium sulfate need a production which leads to the desired properties of the
product at low costs. Therefore, often waste streams of other chemical reaction
pathways are used as feed stream which can contain different impurities in various
concentrations. These impurities can be e.g. metal ions like Fe3+, Al3+ or Cr3+
originating from the previous process, the transport or from storage. Since the
process is continuous these impurities can get enriched within the mother liquor. If
their concentrations reach a critical level, the undesired ions have to be removed
from time to time by renewing the mother liquor (time and money consuming
process).
If the critical concentrations are exceeded this would have a strong effect on the
following parameters. The most important effects are the influences on the
nucleation and metastable zone width (MZW), the crystal growth rates and the
crystal morphology. If the nucleation is affected, this would have a direct influence on
the crystal size distribution which is an important parameter for the crystal quality. If
the growth rate of the crystals is reduced by impurities the yield or the retention time
of the crystallization will decrease or increase, respectively, and therefore the
profitability of the process. Another important parameter for the product quality is
the morphology of the crystals because these will directly affect the downstream
processes namely centrifugation and filtration on the one hand and also transport
and storage problems could be created on the other hand.
It is therefore essential to know the critical concentrations for the impurities which
might be present in the feed streams of a process. Furthermore, the concentrations
should be controlled within the process and suitable action should be taken if these
critical values are exceeded.
So one major task of this work is to define process windows for the common
impurities Fe3+, Cr3+, Al3+, Zn2+,K+ and Na+ concerning their effect on growth rates,
MZW/nucleation and crystal morphology of ammonium sulfate. Furthermore, a proof
of concept should be carried out for the treatment of contaminated solutions by the
help of oxalic acid as suggested already long time ago [Mes70].
Basics of Crystallization
9
2. Basics of Crystallization
2.1 Crystal State
By definition a crystal is a solid which contains periodically arranged units (e.g. atoms,
ions or molecules) into all three dimensions. A simple model for crystals is a point
lattice in which every point is characterized by the three dimensions a, b and c and by
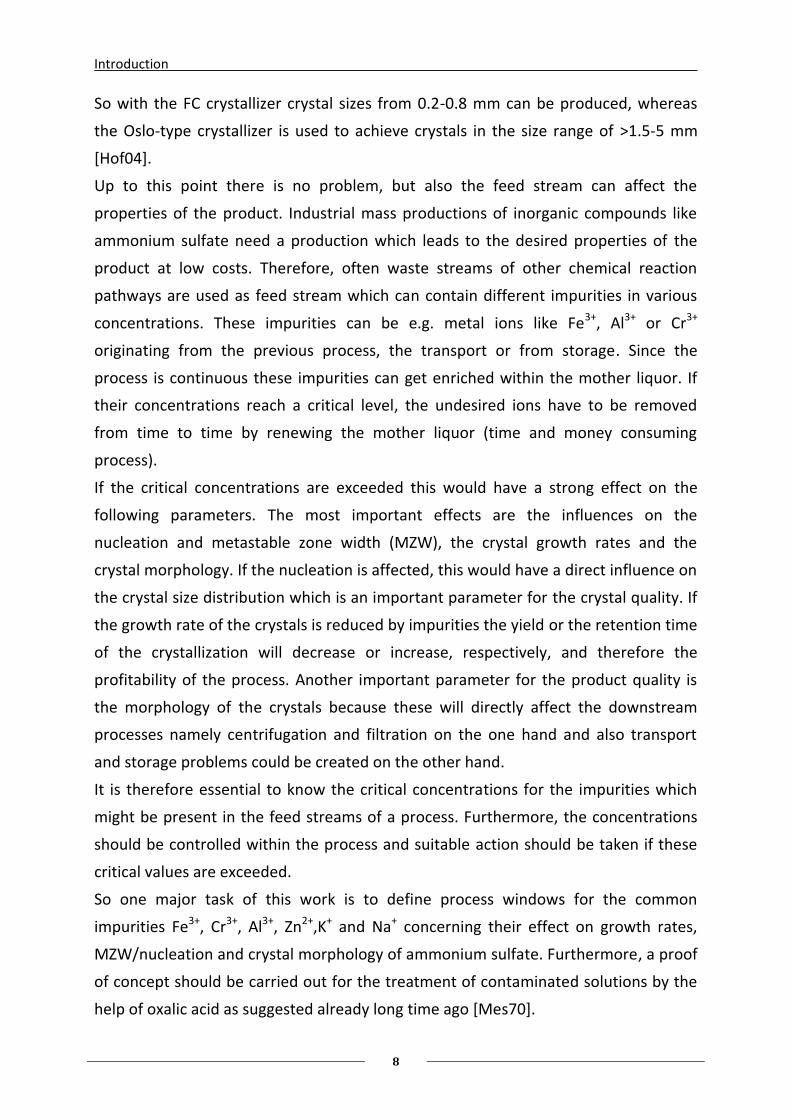
three angles α, β and γ. From these parameters an unit cell can be created. Figure 2.1
shows a schematic unit cell.
α
b
a
γ
β
c
Fig. 2.1: Schematic unit cell (see e.g. [Mul93])
Using the parameters of the unit cell one can define seven crystal systems called
cubic, tetragonal, orthorhombic, rhombohedral, hexagonal, monoclinic and triclinic.
These systems can be refined into 13 Bravais lattices. Detailed information can be
achieved from the literature (e.g. [Mul93, Mye02]). Ammonium sulfate crystallizes in
an orthorhombic crystal system.
All these facts give information on the internal structure of crystals including the
arrangement of growth units, but a crystal also shows an external appearance which
is called the crystal habit. The habit of a crystal is defined by the internal structure on
the one hand, but also on factors like growth rate, used solvent and presence or
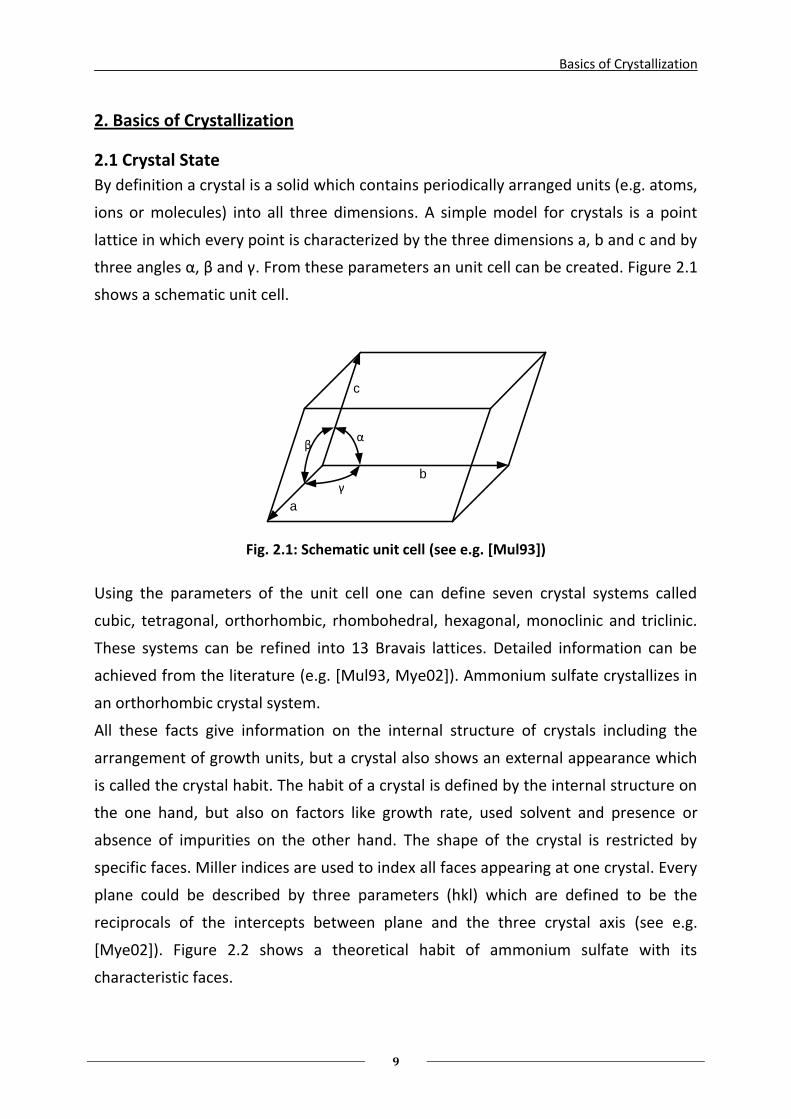
absence of impurities on the other hand. The shape of the crystal is restricted by
specific faces. Miller indices are used to index all faces appearing at one crystal. Every
plane could be described by three parameters (hkl) which are defined to be the
reciprocals of the intercepts between plane and the three crystal axis (see e.g.
[Mye02]). Figure 2.2 shows a theoretical habit of ammonium sulfate with its
characteristic faces.
Basics of Crystallization
10
Fig. 2.2: Characteristic crystal habit of ammonium sulfate [Mul93]
2.2 Phase Diagram
2.2.1 Solubility
Per definition the solubility gives information on the amount of a compound which
can be dissolved within a specific solvent under defined conditions (see e.g. [Sch04]).
The correct term for the definition is the equality of chemical potentials of the solute
within the solution and the species in the solid phase – a solid-liquid-equilibrium
[Mye01].
In literature there are long lists of different expressions and units for the solubility
and also on how to translate one into another (e.g. [Mul93]). Within this work
solubility will be expressed as [g/L] which means the mass of a salt in [g] is dissolved
in 1 L of solvent, in this case distilled water or as [Ma%] which means the percentage
of the mass of salt based on total mass of the solution.
The thermodynamically fixed solubility only depends on pressure, temperature and
concentration. For the most commercially used crystallization processes the pressure
only plays a minor role. Hence the phase equilibrium can be reduced to a
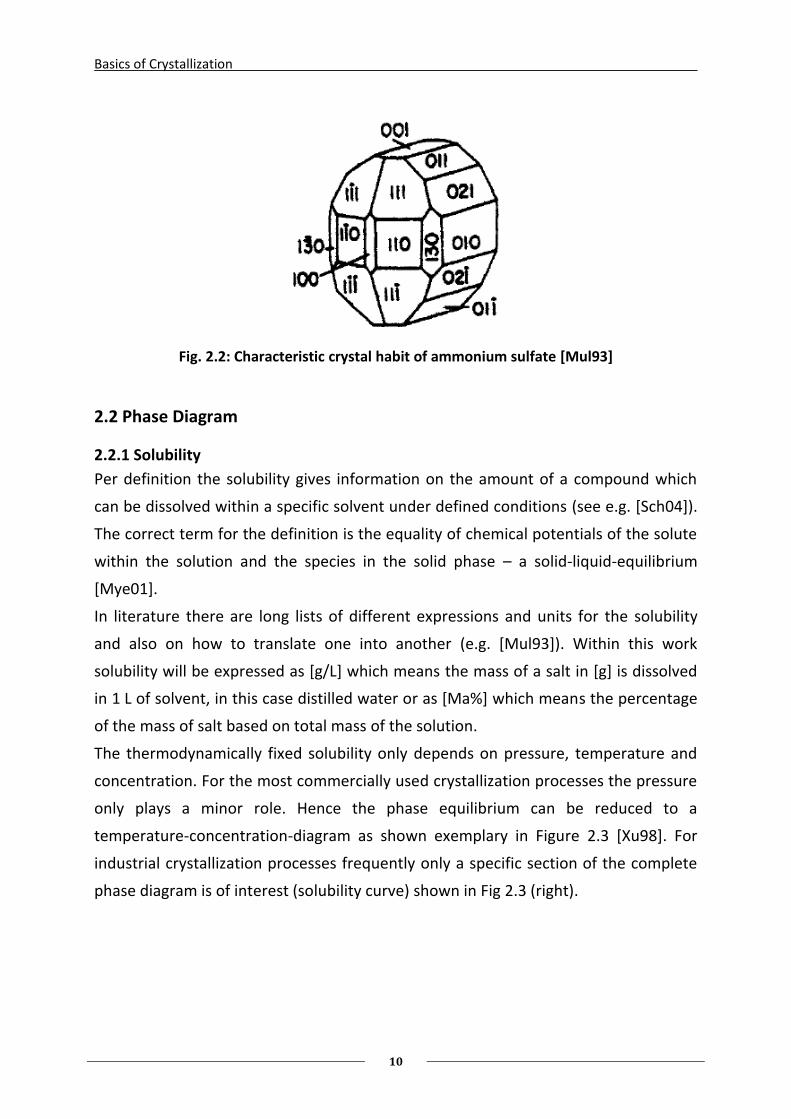
temperature-concentration-diagram as shown exemplary in Figure 2.3 [Xu98]. For
industrial crystallization processes frequently only a specific section of the complete
phase diagram is of interest (solubility curve) shown in Fig 2.3 (right).
Basics of Crystallization
11
41 42 43 44 45 46
0
10
20
30
40
50
tem
pe
ratu
re /
°C
concentration (NH4)
2SO
4 / Ma%
Fig. 2.3: Phase diagram of ammonium sulfate (left) [Xu 98] and solubility curve as a part of it (right)
(data taken from [Mul93])
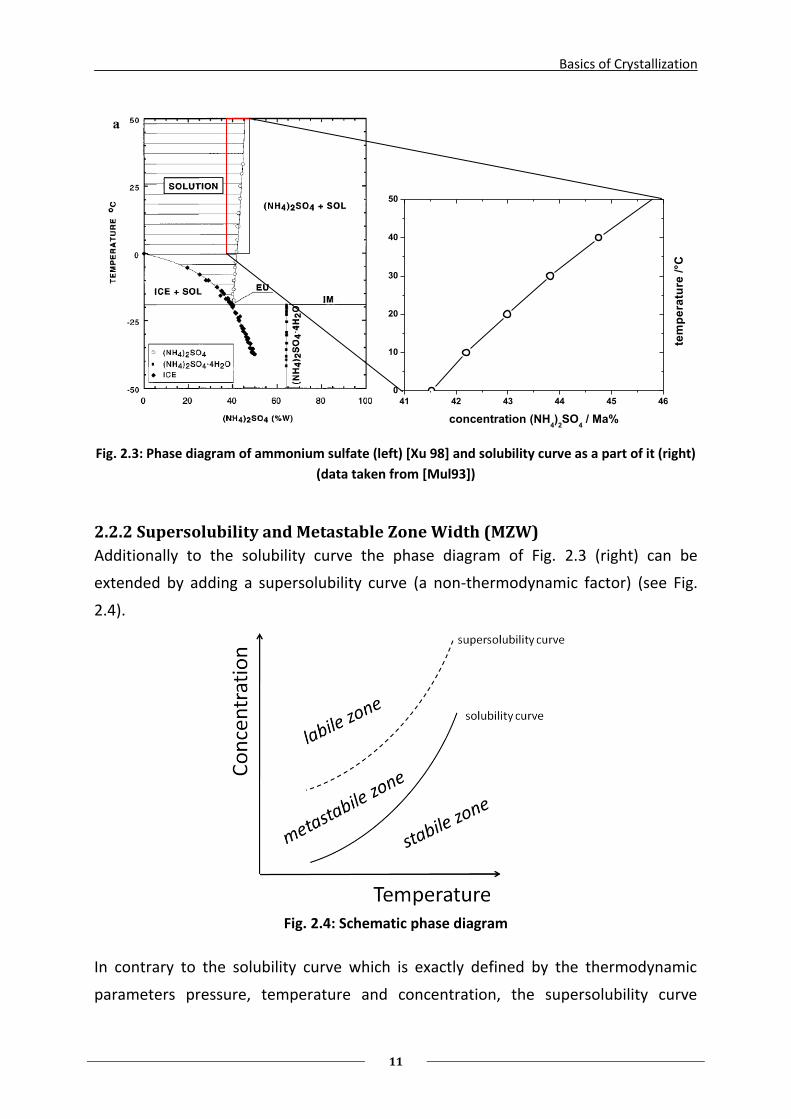
2.2.2 Supersolubility and Metastable Zone Width (MZW)
Additionally to the solubility curve the phase diagram of Fig. 2.3 (right) can be
extended by adding a supersolubility curve (a non-thermodynamic factor) (see Fig.
2.4).
Fig. 2.4: Schematic phase diagram
In contrary to the solubility curve which is exactly defined by the thermodynamic
parameters pressure, temperature and concentration, the supersolubility curve
Basics of Crystallization
12
always depends on process parameters like presence or absence of crystals, stirrer
speed, rate of achieving the supersaturation and presence of impurity.
Both, solubility and supersolubility curve, separate the phase diagram into three
zones (see Fig. 2.4). At the stable zone the solution is unsaturated which means
crystallization is not possible and existing crystals will be dissolved. Within the
metastable zone the solution is supersaturated. Existing crystals grow, but no primary
nucleation will occur in the metastable zone. If the solution gets further
supersaturated, e.g. by cooling or evaporation of the solvent, the supersolubility
curve will be crossed and nucleation will appear instantly [Mul93].
2.3 Nucleation
2.3.1 Basic and Energetic Considerations
For crystal growth two main conditions have to be given within a system, a
supersaturated solution or supercooled melt on the one hand and first very small
crystals, the so-called nuclei, on the other hand. These nuclei can be formed during
different processes and therefore different classes of nucleation can be defined.
Primary Nucleation can be divided into two sub items, homogeneous and
heterogeneous nucleation. While in case of homogeneous nucleation the nuclei are
formed from absolute pure solution, in case of heterogeneous nucleation foreign
particles give base for inducing nucleation. For industrial crystallization processes as
well as scientific studies absolutely pure conditions cannot be achieved which means
homogeneous nucleation is more a theoretical term.
Secondary Nucleation always implies the presence of crystals. In practice new nuclei
can appear by attrition or breakage of the existing crystals when there are collisions
between crystals and stirrer, crystals and reactor walls or internals and also crystal
and crystal. Secondary nucleation can be also induced by seed crystals or the dust on
their surfaces.
For the different nucleation mechanisms the supersolubility curve will change and
hence there is also a difference in the metastable zone width. Therefore the
supersolubility curve for secondary nucleation will be closer to the solubility curve
than for primary heterogeneous nucleation. An even higher supersaturation would be
needed to induce primary homogeneous nucleation.
Basics of Crystallization
13
The nucleation process itself can be explained as a stochastic gathering of molecules
or ions within the solution or melt. This process can be reduced to an energetic level
and can be expressed by Equation 2.1.
(2.1)
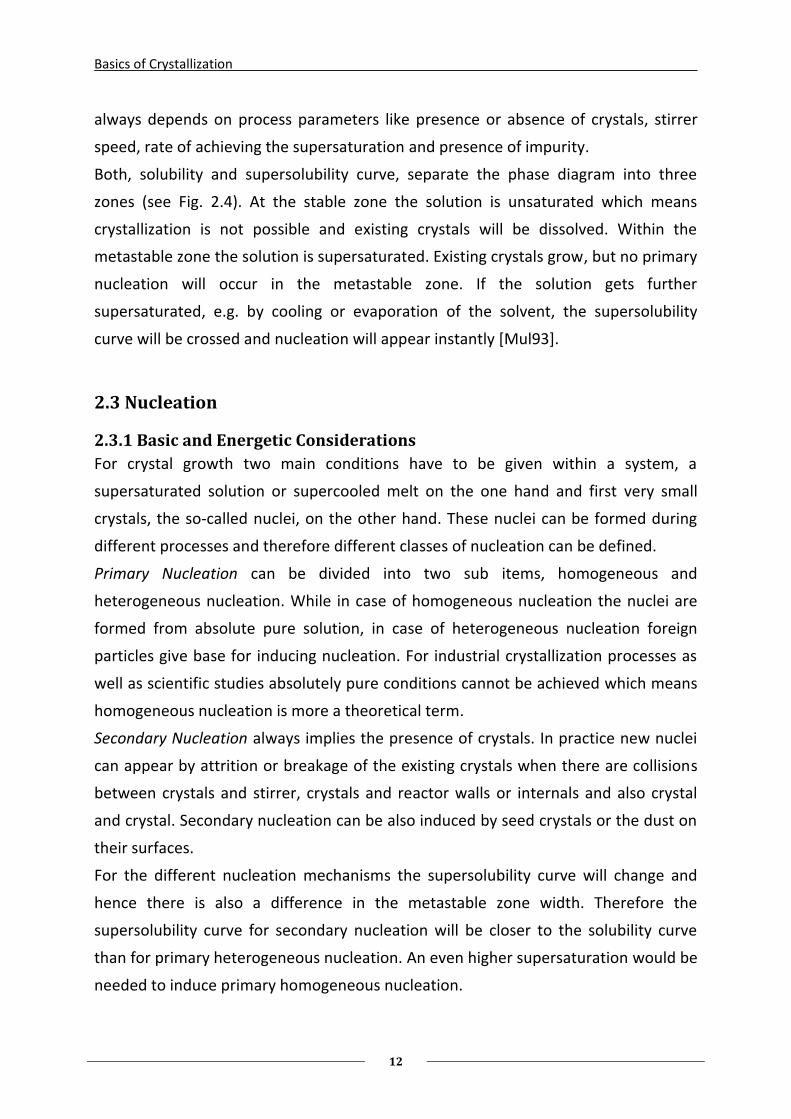
The total excess free energy ΔG is the sum of surface excess free energy ΔGS and
volume excess free energy ΔGV. Both, ΔGS and ΔGV depend on the particle radius r as
can be seen in Equation 2.2.
(2.2)
Plotting Equation 2.2 into a ΔG – r – diagram (see Fig. 3.5) opens the possibility to
understand the energetically point of view on nucleation processes. For very small
nuclei it is energetically more favorable that nuclei dissolve again, while once a
critical size rc is reached the free energy will decrease with increasing size which
makes the growth process energetically favorable. The critical size and critical free
energy level could be calculated from Equations 2.3 and 2.4, respectively.
γ
(2.3)
γ
(2.4)
Fig. 2.5: Diagram of free energy vs. radius of nucleus (taken from [San07b])
Basics of Crystallization
14
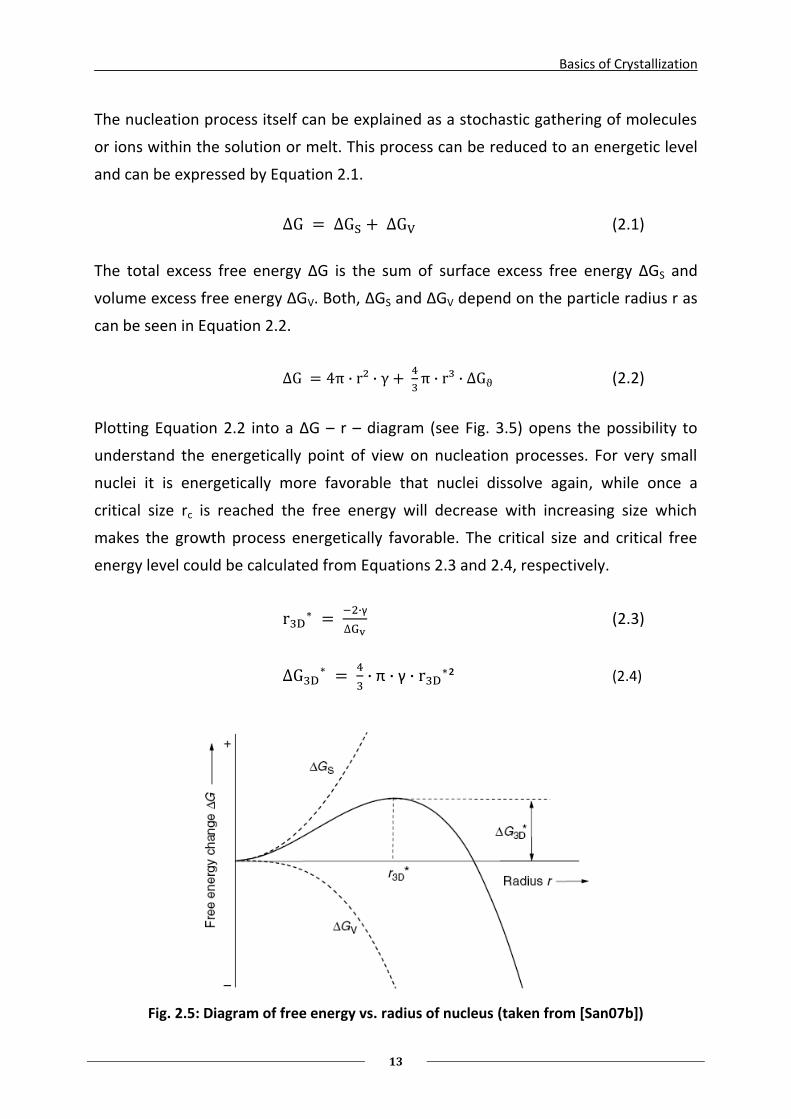
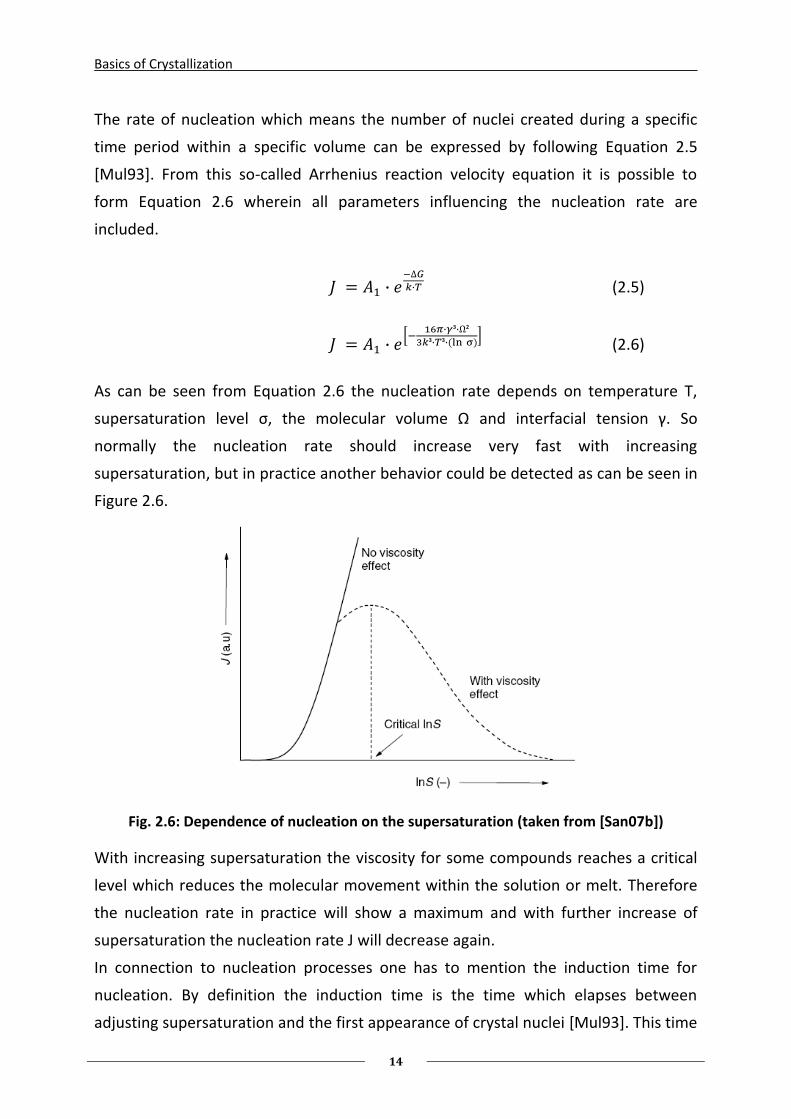
The rate of nucleation which means the number of nuclei created during a specific
time period within a specific volume can be expressed by following Equation 2.5
[Mul93]. From this so-called Arrhenius reaction velocity equation it is possible to
form Equation 2.6 wherein all parameters influencing the nucleation rate are
included.
(2.5)
(2.6)
As can be seen from Equation 2.6 the nucleation rate depends on temperature T,
supersaturation level σ, the molecular volume Ω and interfacial tension γ. So
normally the nucleation rate should increase very fast with increasing
supersaturation, but in practice another behavior could be detected as can be seen in
Figure 2.6.
Fig. 2.6: Dependence of nucleation on the supersaturation (taken from [San07b])
With increasing supersaturation the viscosity for some compounds reaches a critical
level which reduces the molecular movement within the solution or melt. Therefore
the nucleation rate in practice will show a maximum and with further increase of
supersaturation the nucleation rate J will decrease again.
In connection to nucleation processes one has to mention the induction time for
nucleation. By definition the induction time is the time which elapses between
adjusting supersaturation and the first appearance of crystal nuclei [Mul93]. This time
Basics of Crystallization
15
depends on various parameters like supersaturation level, agitation, viscosity or the
presence of impurities.
Induction time tind could be divided into different parts which are based on
theoretically considerations, but cannot easily be investigated separately from each
other (see Eq. 2.7).
(2.7)
Thereby tr is the so-called relaxation time which is needed by the system to reach a
quasi-steady-state distribution of molecular clusters, tn is the time which is needed to
form a stable nucleus and tg is the time for the growth of the nucleus to a detectable
size.
2.3.2 Effect of Impurities
In the past decades many works were published concerning the influence of
impurities on the nucleation rates and kinetics of nucleation. But unfortunately up to
now and based on the available data no general relationships can be formulated.
However, it is known that especially trivalent metal ions show an effect on the
nucleation of inorganic compounds like e.g. ammonium sulfate.
The possible effects could be explained by taking a closer look at Eq. 2.6 where all
parameters concerning the nucleation rates are included. Sangwal [San07b] specified
two possible mechanisms of the impurity effects. The first includes the effect of
impurities on the solid-liquid interfacial energy γ which could be reduced by impurity
adsorption at the crystal surface. Thereby the nucleation rate J is increased (see Eq.
2.6). The other possible mechanism is also based on impurity adsorption, but in this
case at relevant growth sites which leads to a blockage and thus to a change in the
rate of the growth of the nuclei. So J is decreased by a decreasing A1 which is the
kinetic parameter of the nucleation process (Eq. 2.6) [San07b]. However, the very
short life time of the first nuclei (nano- to microseconds) sometimes does not allow
any impurity adsorption onto the surface of the nuclei, because impurity molecules
cannot reach the surface by diffusion. In this case no effect of the impurities can be
expected [Kas02].
Another imaginable reason could be the indirect effect of impurities on the
nucleation by changing the solubility and thus supersaturation level σ which is a
Basics of Crystallization
16
thermodynamic effect. If σ is increased by the impurity, the nucleation rate J will also
be increased (Eq. 2.6). Even small amounts of additives can cause strong changes in
the solubility of a compound (see Chapter 3.2.1).
2.4 Crystal Growth
2.4.1 Theories on Crystal Growth
During the long term of research on crystallization processes a multitude of different
theories and models for crystal growth were defined. Within this chapter an overview
on the most important models will be given.
Crystal growth can be explained as a three-step process which includes the transport
of solute molecules, so called growth units, from the bulk solution to the crystal
surface (diffusion step), the integration of these units into the crystal lattice (reaction
step) and the transfer of arising crystallization heat from the surface into the bulk.
The slowest of these steps always is the limiting step of a crystallization process
[Kru93].
Heat transfer: Often the third step can be neglected, as proven e.g. by Kruse [Kru93],
but Matzuoka et al. [Mat91] gave a critical parameter for which negligence is not
valid anymore. Especially, for heat transfer effects in aqueous solutions the third step
could be neglected if the criteria –ΔH/(1-wb) < 700 J/g is fulfilled [Hay73]. The heat of
solution -ΔH for ammonium sulfate is 6.57 kJ/mol (at 30 °C) [Ull05] what is 49.74 J/g.
The solubility of ammonium sulfate at 20 °C is 754 g/L and therefore the
concentration of ammonium sulfate in solution wb is 43 %(w/w). The criteria –ΔH/(1-
wb) = 87.26 J/g < 700 J/g is fulfilled and the heat transfer could be assumed to show
no influence on the crystal growth.
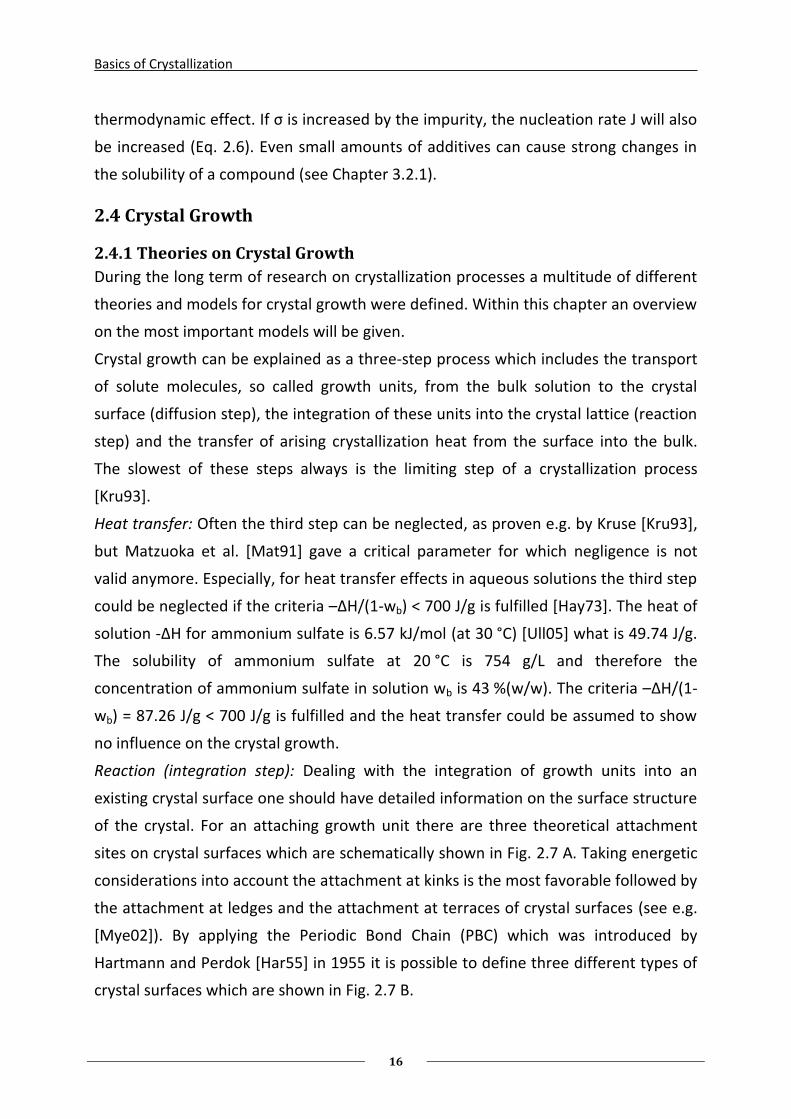
Reaction (integration step): Dealing with the integration of growth units into an
existing crystal surface one should have detailed information on the surface structure
of the crystal. For an attaching growth unit there are three theoretical attachment
sites on crystal surfaces which are schematically shown in Fig. 2.7 A. Taking energetic
considerations into account the attachment at kinks is the most favorable followed by
the attachment at ledges and the attachment at terraces of crystal surfaces (see e.g.
[Mye02]). By applying the Periodic Bond Chain (PBC) which was introduced by
Hartmann and Perdok [Har55] in 1955 it is possible to define three different types of
crystal surfaces which are shown in Fig. 2.7 B.
Basics of Crystallization
17
A B
Fig.2.7: A: different attachment sites - kinks (K), ledges (L) and terraces (T) [San07]
B: Crystal including flat (F), stepped (S) and kinked (K) faces [Boi88]
The so called K faces contain only kinks which enable them to grow by direct
incorporation of growth units. In contrary to the K faces the F faces contain no or
nearly no kink sites (Fig. 2.8). These F faces show other growth mechanisms like two-
dimensional surface nucleation. The S faces show e.g. spiral growth as shown in Fig.
2.9.
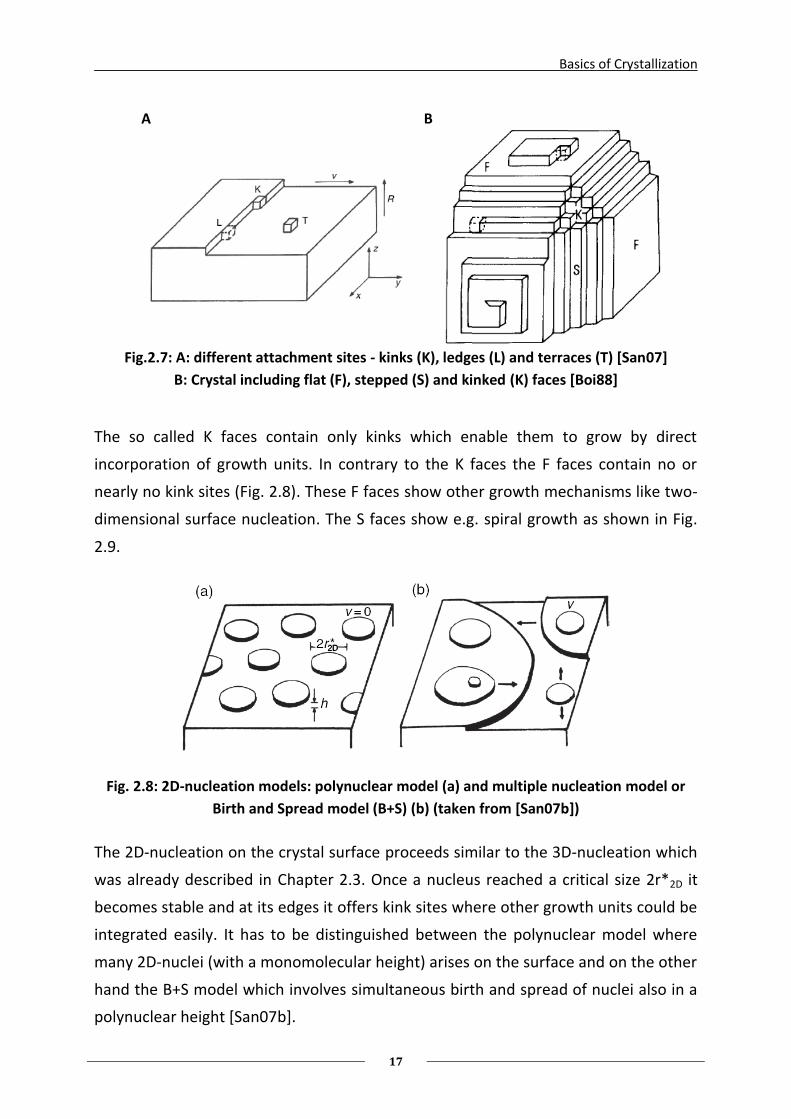
Fig. 2.8: 2D-nucleation models: polynuclear model (a) and multiple nucleation model or
Birth and Spread model (B+S) (b) (taken from [San07b])
The 2D-nucleation on the crystal surface proceeds similar to the 3D-nucleation which
was already described in Chapter 2.3. Once a nucleus reached a critical size 2r*2D it
becomes stable and at its edges it offers kink sites where other growth units could be
integrated easily. It has to be distinguished between the polynuclear model where
many 2D-nuclei (with a monomolecular height) arises on the surface and on the other
hand the B+S model which involves simultaneous birth and spread of nuclei also in a
polynuclear height [San07b].
Basics of Crystallization
18
The B+S model could be described by the following face growth rate –
supersaturation relationship (see Eq. 2.8).
(2.8)
A2 and A3 are constants related to the system, v is the face growth rate and σ
describes the supersaturation within the system.
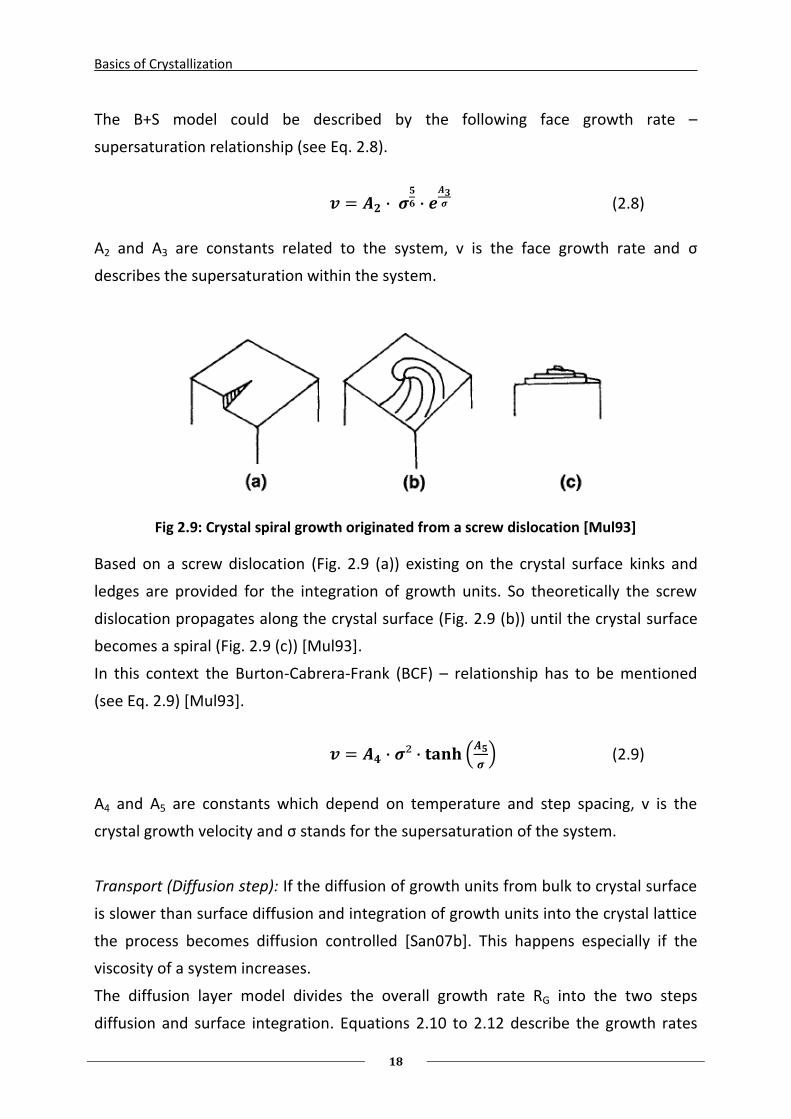
Fig 2.9: Crystal spiral growth originated from a screw dislocation [Mul93]
Based on a screw dislocation (Fig. 2.9 (a)) existing on the crystal surface kinks and
ledges are provided for the integration of growth units. So theoretically the screw
dislocation propagates along the crystal surface (Fig. 2.9 (b)) until the crystal surface
becomes a spiral (Fig. 2.9 (c)) [Mul93].
In this context the Burton-Cabrera-Frank (BCF) – relationship has to be mentioned
(see Eq. 2.9) [Mul93].
(2.9)
A4 and A5 are constants which depend on temperature and step spacing, v is the
crystal growth velocity and σ stands for the supersaturation of the system.
Transport (Diffusion step): If the diffusion of growth units from bulk to crystal surface
is slower than surface diffusion and integration of growth units into the crystal lattice
the process becomes diffusion controlled [San07b]. This happens especially if the
viscosity of a system increases.
The diffusion layer model divides the overall growth rate RG into the two steps
diffusion and surface integration. Equations 2.10 to 2.12 describe the growth rates
Basics of Crystallization
19
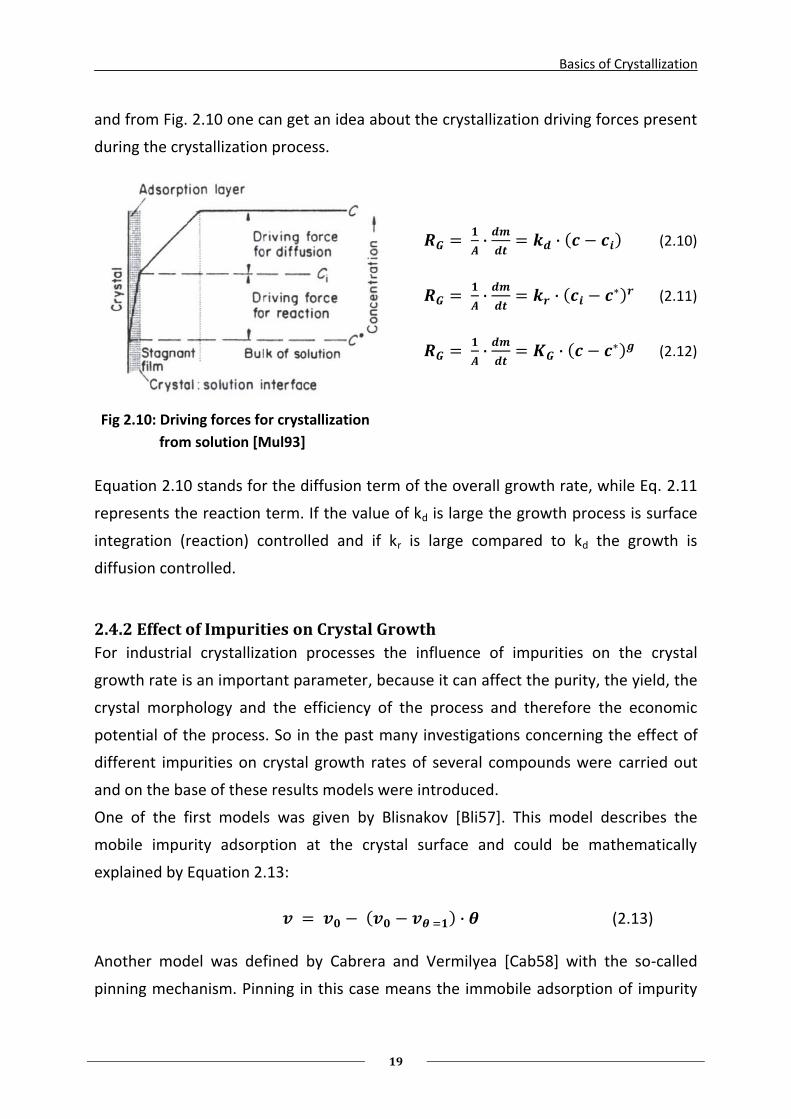
and from Fig. 2.10 one can get an idea about the crystallization driving forces present
during the crystallization process.
(2.10)
(2.11)
(2.12)
Fig 2.10: Driving forces for crystallization
from solution [Mul93]
Equation 2.10 stands for the diffusion term of the overall growth rate, while Eq. 2.11
represents the reaction term. If the value of kd is large the growth process is surface
integration (reaction) controlled and if kr is large compared to kd the growth is
diffusion controlled.
2.4.2 Effect of Impurities on Crystal Growth
For industrial crystallization processes the influence of impurities on the crystal
growth rate is an important parameter, because it can affect the purity, the yield, the
crystal morphology and the efficiency of the process and therefore the economic
potential of the process. So in the past many investigations concerning the effect of
different impurities on crystal growth rates of several compounds were carried out
and on the base of these results models were introduced.
One of the first models was given by Blisnakov [Bli57]. This model describes the
mobile impurity adsorption at the crystal surface and could be mathematically
explained by Equation 2.13:
(2.13)
Another model was defined by Cabrera and Vermilyea [Cab58] with the so-called
pinning mechanism. Pinning in this case means the immobile adsorption of impurity
Basics of Crystallization
20
molecules on the crystal surface which reduces the step velocity (see Equation 2.14)
within the growing face.
(2.14)
Later other models based on the original model of Cabrera and Vermilyea tried to
imply the influence of impurity concentration on crystal surface and within the bulk
solution. So the model of Davey and Mullin [Dav74] was introduced which uses
adsorption isotherms to describe the amount of adsorbed impurity molecules
(Equation 2.15) [Dav74].
(2.15)
In this case the Langmuir isotherm was used to describe the impurity adsorption Θeq
at the crystal surface, but also other common isotherms like Freundlich isotherms
and Tempkin isotherm could be used connected to this model [San07b].
Another parameter for the impurity effect was introduced by Kubota and Mullin
[Kub95a] which is called the impurity effectiveness factor α. This model (Equation
2.16) contains two parameters, the fractional surface coverage Θeq on the one hand
which stands for the quantity of adsorbed impurity and the impurity effectiveness
factor α on the other hand which stands for the quality of effect caused by an
impurity [Kub95a].
(2.16)
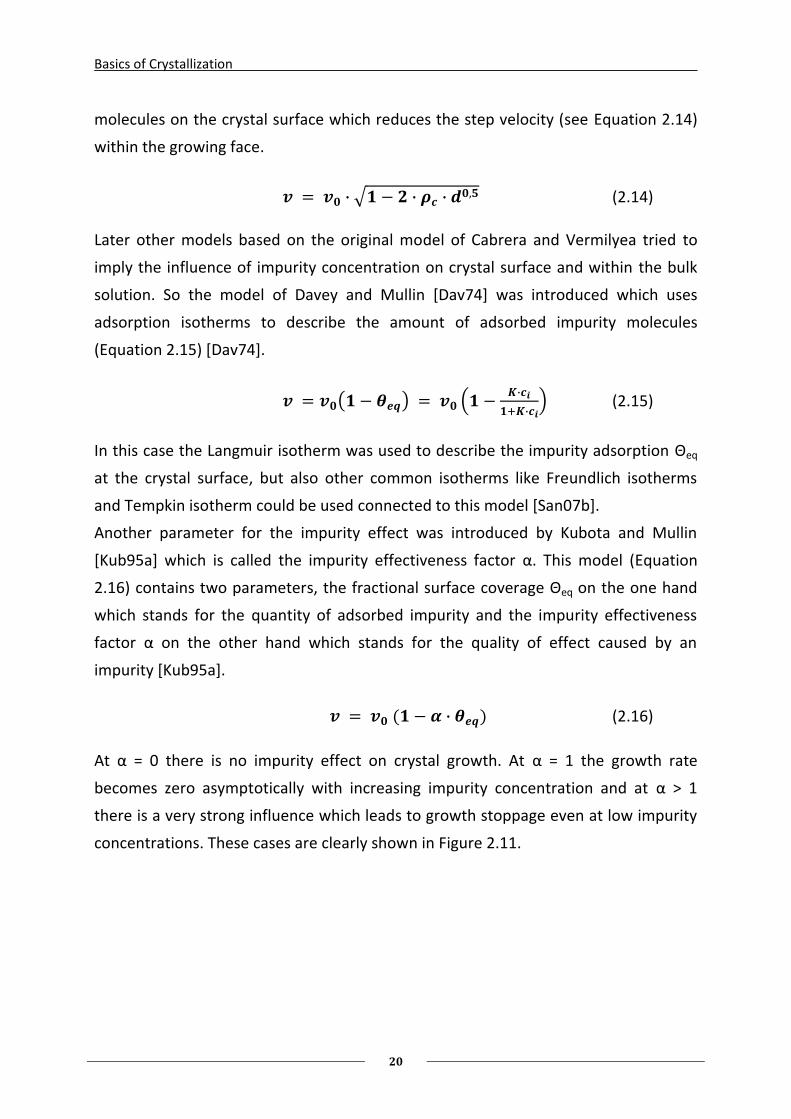
At α = 0 there is no impurity effect on crystal growth. At α = 1 the growth rate
becomes zero asymptotically with increasing impurity concentration and at α > 1
there is a very strong influence which leads to growth stoppage even at low impurity
concentrations. These cases are clearly shown in Figure 2.11.
Basics of Crystallization
21
Fig. 2.11: Effect of impurity effectiveness factor on crystal growth rate [Kub95a]
Thereby the relative step velocity v/v0 is the growth rate of the contaminated system
normalized to the pure system and Kx is the dimensionless impurity concentration
which means the adsorption constant multiplied with the impurity concentration.
2.5 Crystal Habit and Effect of Impurities
Especially, for industrial crystallization processes the morphology of the product is a
very important parameter of quality. Often a product with a special habit is required
to optimize the efficiency of the following process steps like centrifugation or
filtration.
The crystal habit is the term for the external appearance of the crystal. As mentioned
before (Chapter 2.1) the appearance of a crystal is influenced by both, the internal
structure defined by the unit cell and the external factors like supersaturation level or
concentration of impurities.
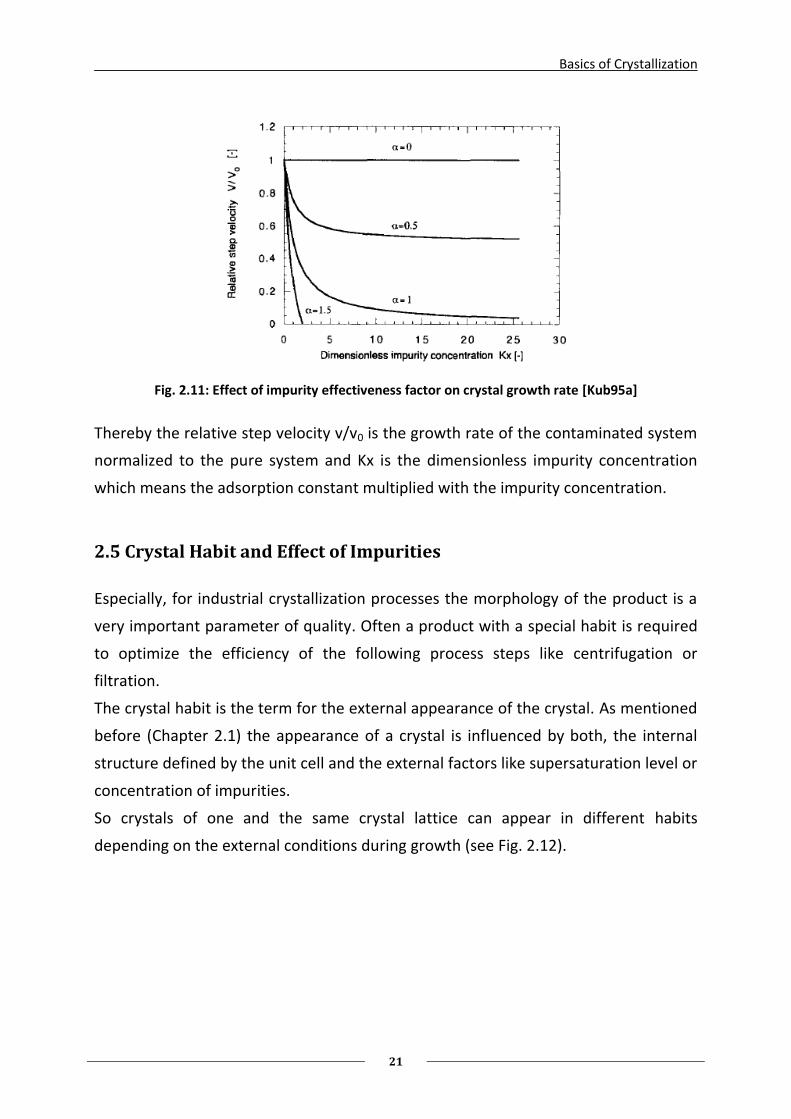
So crystals of one and the same crystal lattice can appear in different habits
depending on the external conditions during growth (see Fig. 2.12).
Basics of Crystallization
22
Fig. 2.12: Different crystal habits of hexagonal crystal system [Mul93]
In order to change or manipulate the habit of the product crystals the concentration
of impurities should be controlled. In the literature the effect of different amounts of
various impurities on the morphology of organic and inorganic compounds is
described. One common example from a long list of effects of impurities on the
crystal morphology is gypsum (CaSO4). Gypsum crystallizes as long thin needles from
pure solution, but with the addition of 50 ppm polymaleate spherical crystals are
formed [VDL89].
But how can these changes in morphology be explained?
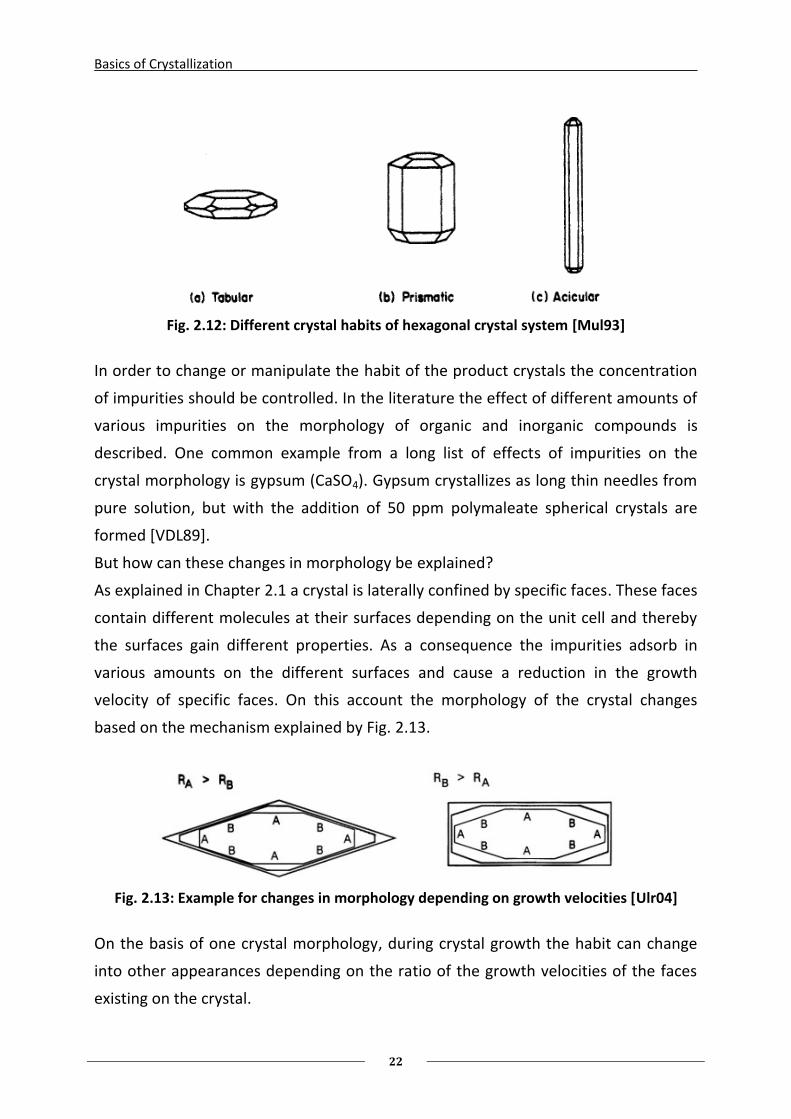
As explained in Chapter 2.1 a crystal is laterally confined by specific faces. These faces
contain different molecules at their surfaces depending on the unit cell and thereby
the surfaces gain different properties. As a consequence the impurities adsorb in
various amounts on the different surfaces and cause a reduction in the growth
velocity of specific faces. On this account the morphology of the crystal changes
based on the mechanism explained by Fig. 2.13.
Fig. 2.13: Example for changes in morphology depending on growth velocities [Ulr04]
On the basis of one crystal morphology, during crystal growth the habit can change
into other appearances depending on the ratio of the growth velocities of the faces
existing on the crystal.
Basics of Crystallization
23
2.6 Metal Ions in Aqueous Solution
In order to understand the effect of metal ions on the crystallization parameters of an
inorganic salt like ammonium sulfate one should know the basics of the chemistry of
metal ions in aqueous solution.
If a salt like e.g. NH4Fe(SO4)2 is dissolved in an aqueous solution, the arising Fe3+ ions
will not appear as bare metal ions, but they will be coordinated by different kinds and
numbers of ligands and form complexes. In aqueous solutions often water molecules
are these ligands and therefore metal-aquo-complexes are formed. Normally di- and
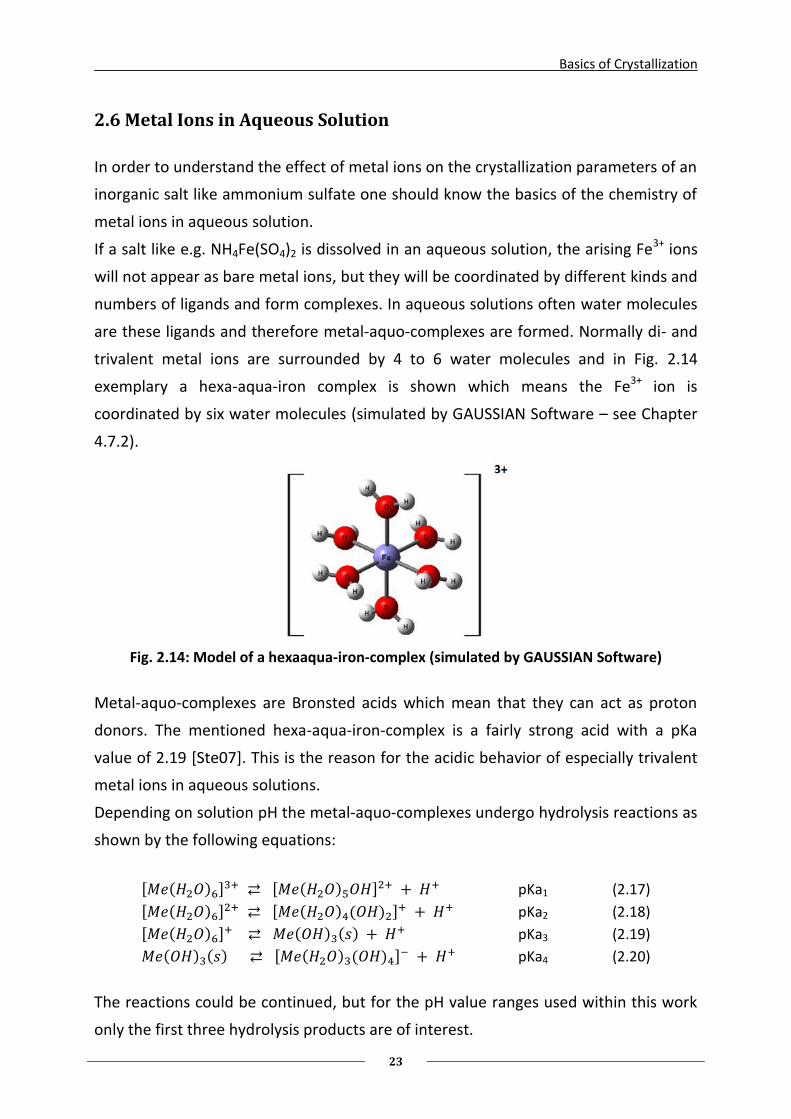
trivalent metal ions are surrounded by 4 to 6 water molecules and in Fig. 2.14
exemplary a hexa-aqua-iron complex is shown which means the Fe3+ ion is
coordinated by six water molecules (simulated by GAUSSIAN Software – see Chapter
4.7.2).
Fig. 2.14: Model of a hexaaqua-iron-complex (simulated by GAUSSIAN Software)
Metal-aquo-complexes are Bronsted acids which mean that they can act as proton
donors. The mentioned hexa-aqua-iron-complex is a fairly strong acid with a pKa
value of 2.19 [Ste07]. This is the reason for the acidic behavior of especially trivalent
metal ions in aqueous solutions.
Depending on solution pH the metal-aquo-complexes undergo hydrolysis reactions as
shown by the following equations:
pKa1 (2.17)
pKa2 (2.18)
pKa3 (2.19)
pKa4 (2.20)
The reactions could be continued, but for the pH value ranges used within this work
only the first three hydrolysis products are of interest.
Basics of Crystallization
24
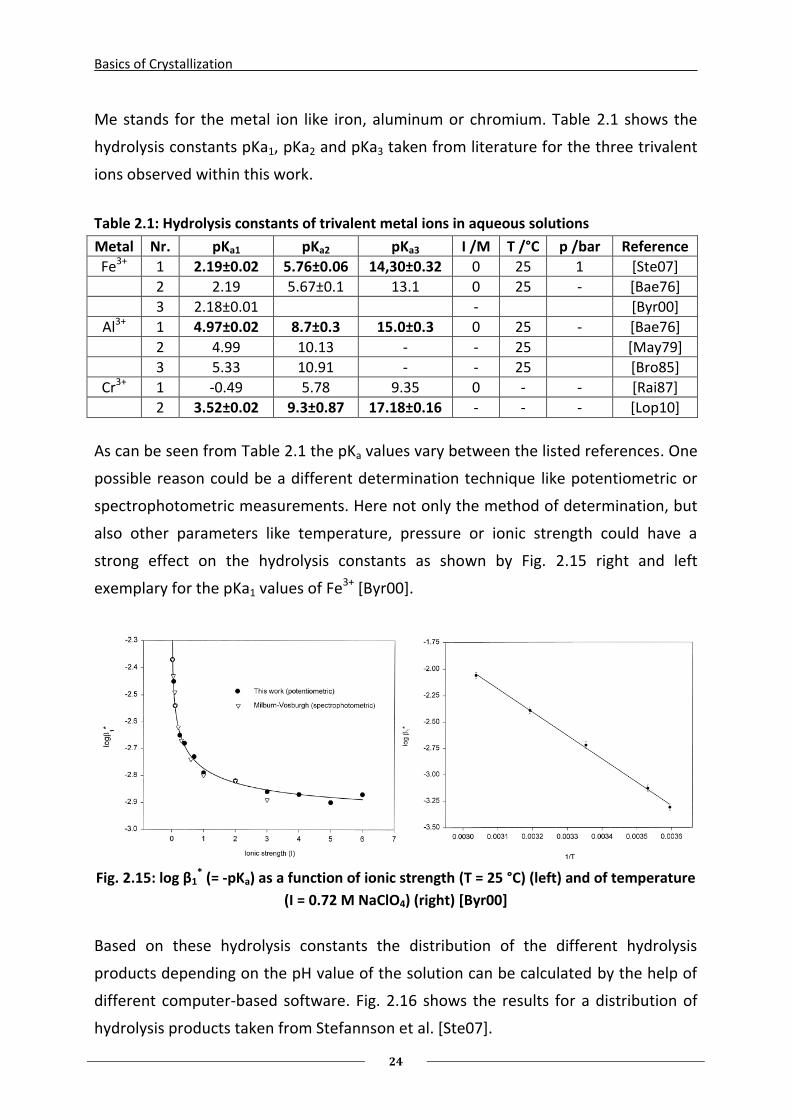
Me stands for the metal ion like iron, aluminum or chromium. Table 2.1 shows the
hydrolysis constants pKa1, pKa2 and pKa3 taken from literature for the three trivalent
ions observed within this work.
Table 2.1: Hydrolysis constants of trivalent metal ions in aqueous solutions
Metal Nr. pKa1 pKa2 pKa3 I /M T /°C p /bar Reference
Fe3+ 1 2.19±0.02 5.76±0.06 14,30±0.32 0 25 1 [Ste07]
2 2.19 5.67±0.1 13.1 0 25 - [Bae76]
3 2.18±0.01 - [Byr00]
Al3+ 1 4.97±0.02 8.7±0.3 15.0±0.3 0 25 - [Bae76]
2 4.99 10.13 - - 25 [May79]
3 5.33 10.91 - - 25 [Bro85]
Cr3+ 1 -0.49 5.78 9.35 0 - - [Rai87]
2 3.52±0.02 9.3±0.87 17.18±0.16 - - - [Lop10]
As can be seen from Table 2.1 the pKa values vary between the listed references. One
possible reason could be a different determination technique like potentiometric or
spectrophotometric measurements. Here not only the method of determination, but
also other parameters like temperature, pressure or ionic strength could have a
strong effect on the hydrolysis constants as shown by Fig. 2.15 right and left
exemplary for the pKa1 values of Fe3+ [Byr00].
Fig. 2.15: log β1
* (= -pKa) as a function of ionic strength (T = 25 °C) (left) and of temperature
(I = 0.72 M NaClO4) (right) [Byr00]
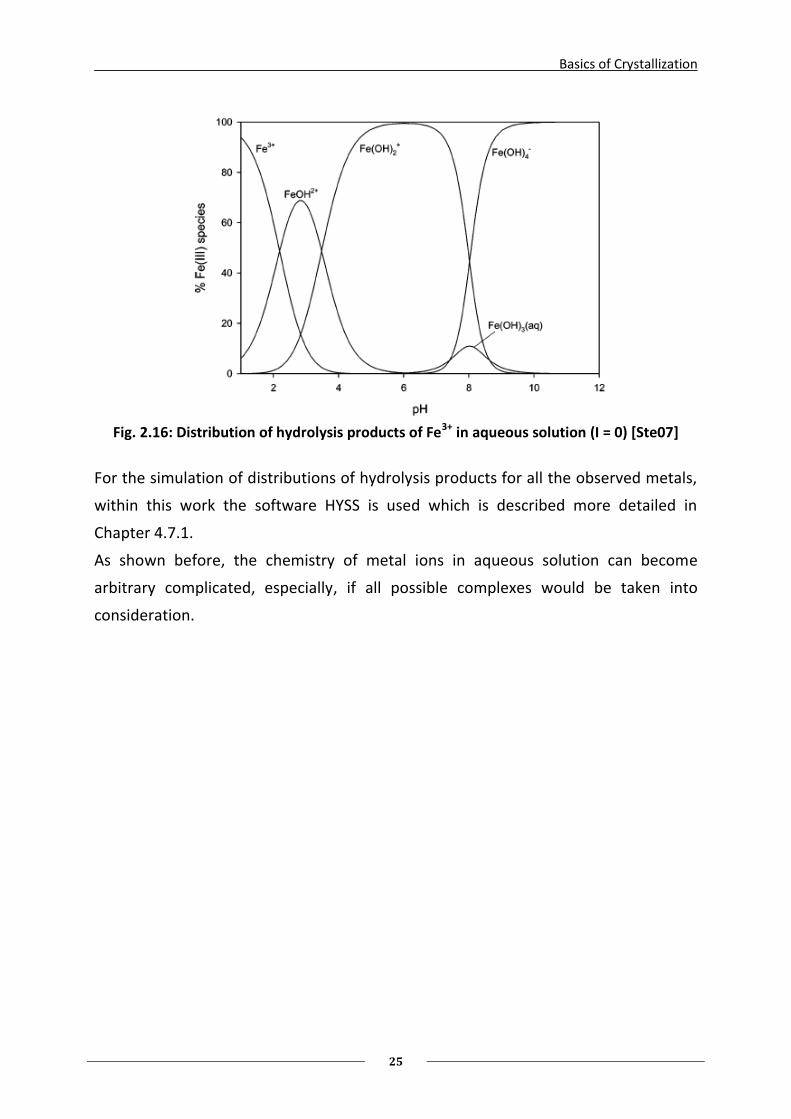
Based on these hydrolysis constants the distribution of the different hydrolysis
products depending on the pH value of the solution can be calculated by the help of
different computer-based software. Fig. 2.16 shows the results for a distribution of
hydrolysis products taken from Stefannson et al. [Ste07].
Basics of Crystallization
25
Fig. 2.16: Distribution of hydrolysis products of Fe3+ in aqueous solution (I = 0) [Ste07]
For the simulation of distributions of hydrolysis products for all the observed metals,
within this work the software HYSS is used which is described more detailed in
Chapter 4.7.1.
As shown before, the chemistry of metal ions in aqueous solution can become
arbitrary complicated, especially, if all possible complexes would be taken into
consideration.

Basics of Crystallization
26
Aim of the Work
27
3. Aim of the Work
The previous Chapter 2 showed the actual state of the art concerning the
crystallization of inorganic compounds. In recent years a huge number of papers,
books and reviews were published concerning the crystallization of inorganic
compounds and especially ammonium sulfate as a model substance (e.g. [Mul70],
[Lar73], [Tav92], [Kit92], [Rau00]). The well-disposed reader would now think why
there is another PhD thesis on the crystallization of ammonium sulfate. The simple
answer is that in comparison to other common separation techniques like distillation,
extraction or adsorption the crystallization process is a little bit more like a “black
box” due to phenomena like nucleation (primary and secondary), attrition,
agglomeration, polymorphism, growth rate dispersion and the complex effects
caused by impurities. There are no reliable simulation tools for a complete
crystallization process and up to now in industry the experience in connection with
the own process is the most important foundation of a successful crystallization and a
high quality product.
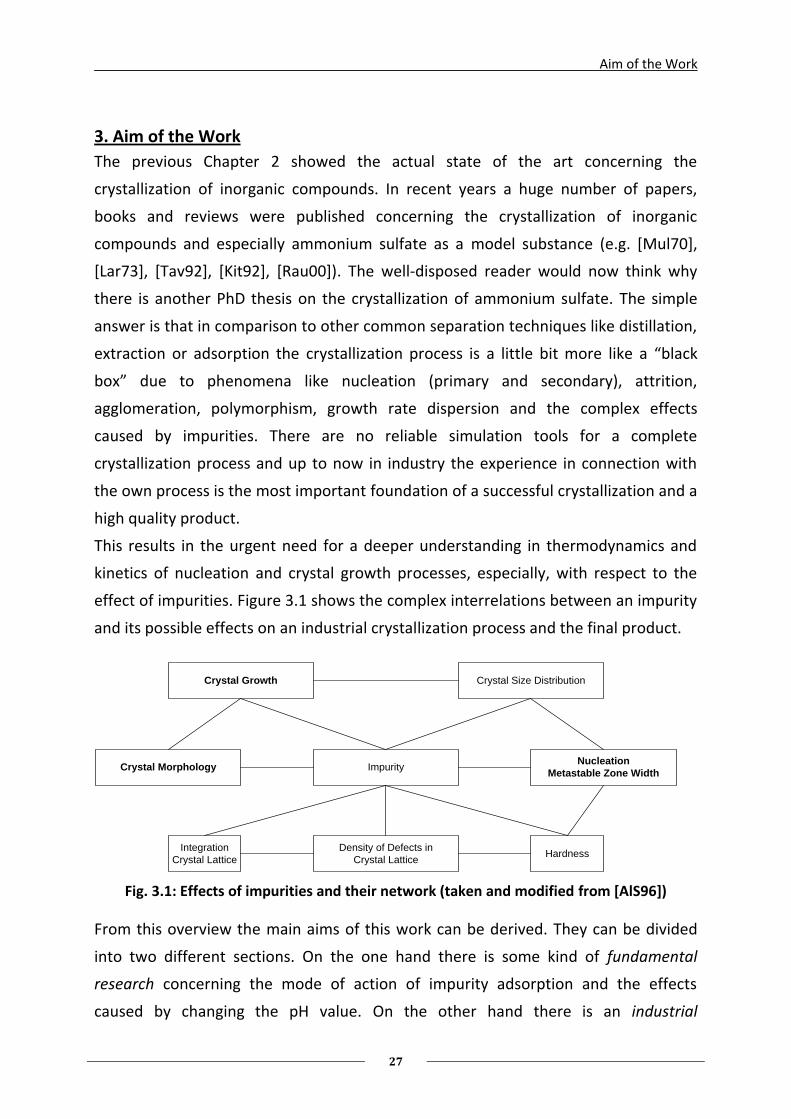
This results in the urgent need for a deeper understanding in thermodynamics and
kinetics of nucleation and crystal growth processes, especially, with respect to the
effect of impurities. Figure 3.1 shows the complex interrelations between an impurity
and its possible effects on an industrial crystallization process and the final product.
Crystal Growth Crystal Size Distribution
ImpurityNucleation
Metastable Zone WidthCrystal Morphology
Density of Defects in
Crystal Lattice
Integration
Crystal LatticeHardness
Fig. 3.1: Effects of impurities and their network (taken and modified from [AlS96])
From this overview the main aims of this work can be derived. They can be divided
into two different sections. On the one hand there is some kind of fundamental
research concerning the mode of action of impurity adsorption and the effects
caused by changing the pH value. On the other hand there is an industrial
Aim of the Work
28
crystallization process affected by impurities, where there is actually no clear strategy
how to deal with this in literature.
In general it can be stated that the effects on crystallization caused by different
impurities is not completely understood with respect to the complexity of the topic
although there are many different theories and models as explained in the previous
Chapter.
Within this work a further step in order to gain a deeper understanding in the
mechanisms should be performed which stand behind the impurity effects:
Where is the influence of the pH value based on?
Why different impurities cause different effects – main influencing parameter?
Which impurity species in aqueous solution are responsible for what effects?
Can the observed effects be referred to impurity adsorption?
Is molecular modeling an appropriate tool to explain the effects of impurities
on the crystallization of an inorganic compound like ammonium sulfate?
Answering these questions on the effects of several impurities in the case study of
crystallization of ammonium sulfate is a contribution to a general understanding in
terms of the mechanisms of impurity impact. If once the problem is completely
understood, the knowledge can be used to optimize existing industrial crystallization
processes regarding the undesired effect of impurities. Up to date it is essential, at
least, to know about the effects caused by certain amounts of impurities and to
define critical impurity concentrations which allow a stable crystallization process and
desired product quality.
In the available literature no recommendations can be found in terms of critical
impurity concentrations regarding an industrial crystallization process of ammonium
sulfate. For the industrial crystallization process an overview on the effects of
commonly appearing impurities on the most important crystallization parameters
(mentioned in Fig. 3.1) has to be performed since up to now there is no satisfying
overview available in the literature. Based on the results of the fundamental studies,
operational windows of critical impurity concentrations have to be defined which,
once exceeded, lead to lower productivity or an undesired product quality.
Furthermore, the applicability of oxalic acid to reduce the effects of impurities has to
be proved and discussed since there is a lack of information obtainable from
literature.
Materials and Methods
29
4. Materials and Methods
4.1 Chemicals
Ammonium sulfate as the main compound of this work was provided by SKW
Piesteritz. It has a purity of 99.9 % and Table 4.1 shows the impurities present in the
ammonium sulfate (the analysis was done by SKW Piesteritz).
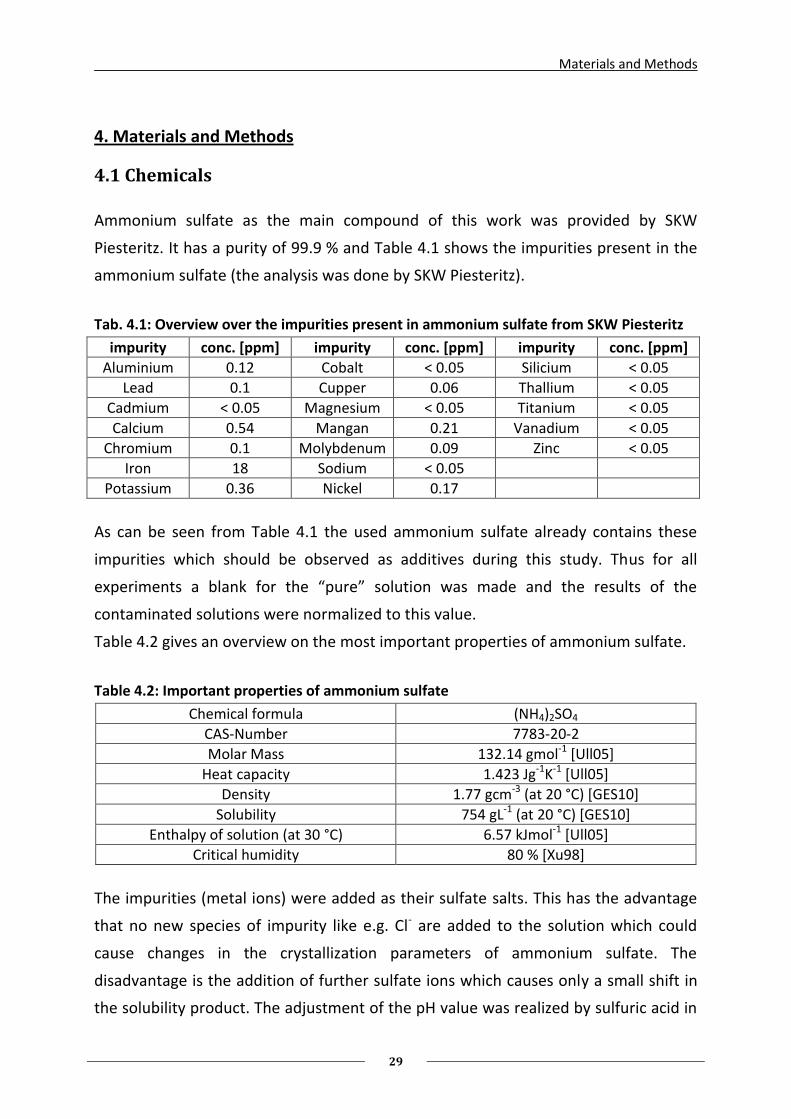
Tab. 4.1: Overview over the impurities present in ammonium sulfate from SKW Piesteritz
impurity conc. [ppm] impurity conc. [ppm] impurity conc. [ppm]
Aluminium 0.12 Cobalt < 0.05 Silicium < 0.05
Lead 0.1 Cupper 0.06 Thallium < 0.05
Cadmium < 0.05 Magnesium < 0.05 Titanium < 0.05
Calcium 0.54 Mangan 0.21 Vanadium < 0.05
Chromium 0.1 Molybdenum 0.09 Zinc < 0.05
Iron 18 Sodium < 0.05
Potassium 0.36 Nickel 0.17
As can be seen from Table 4.1 the used ammonium sulfate already contains these
impurities which should be observed as additives during this study. Thus for all
experiments a blank for the “pure” solution was made and the results of the
contaminated solutions were normalized to this value.
Table 4.2 gives an overview on the most important properties of ammonium sulfate.
Table 4.2: Important properties of ammonium sulfate
Chemical formula (NH4)2SO4
CAS-Number 7783-20-2
Molar Mass 132.14 gmol-1 [Ull05]
Heat capacity 1.423 Jg-1K-1 [Ull05]
Density 1.77 gcm-3 (at 20 °C) [GES10]
Solubility 754 gL-1 (at 20 °C) [GES10]
Enthalpy of solution (at 30 °C) 6.57 kJmol-1 [Ull05]
Critical humidity 80 % [Xu98]
The impurities (metal ions) were added as their sulfate salts. This has the advantage
that no new species of impurity like e.g. Cl- are added to the solution which could
cause changes in the crystallization parameters of ammonium sulfate. The
disadvantage is the addition of further sulfate ions which causes only a small shift in
the solubility product. The adjustment of the pH value was realized by sulfuric acid in
Materials and Methods
30
terms of lowering the pH value and by ammonium hydroxide in terms of raising the
pH value. This results in a further addition of ammonium ions or sulfate ions.
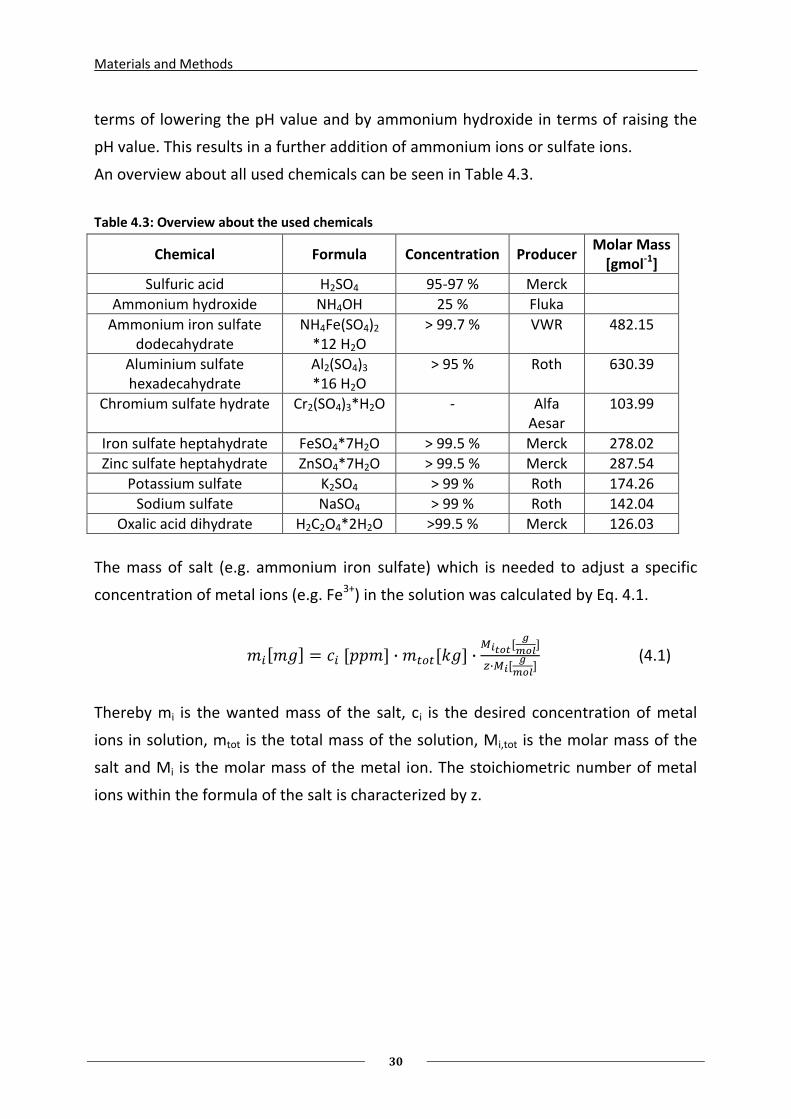
An overview about all used chemicals can be seen in Table 4.3.
Table 4.3: Overview about the used chemicals
Chemical Formula Concentration Producer Molar Mass
[gmol-1]
Sulfuric acid H2SO4 95-97 % Merck
Ammonium hydroxide NH4OH 25 % Fluka
Ammonium iron sulfate dodecahydrate
NH4Fe(SO4)2
*12 H2O > 99.7 % VWR 482.15
Aluminium sulfate hexadecahydrate
Al2(SO4)3 *16 H2O
> 95 % Roth 630.39
Chromium sulfate hydrate Cr2(SO4)3*H2O - Alfa Aesar
103.99
Iron sulfate heptahydrate FeSO4*7H2O > 99.5 % Merck 278.02
Zinc sulfate heptahydrate ZnSO4*7H2O > 99.5 % Merck 287.54
Potassium sulfate K2SO4 > 99 % Roth 174.26
Sodium sulfate NaSO4 > 99 % Roth 142.04
Oxalic acid dihydrate H2C2O4*2H2O >99.5 % Merck 126.03
The mass of salt (e.g. ammonium iron sulfate) which is needed to adjust a specific
concentration of metal ions (e.g. Fe3+) in the solution was calculated by Eq. 4.1.
(4.1)
Thereby mi is the wanted mass of the salt, ci is the desired concentration of metal
ions in solution, mtot is the total mass of the solution, Mi,tot is the molar mass of the
salt and Mi is the molar mass of the metal ion. The stoichiometric number of metal
ions within the formula of the salt is characterized by z.
Materials and Methods
31
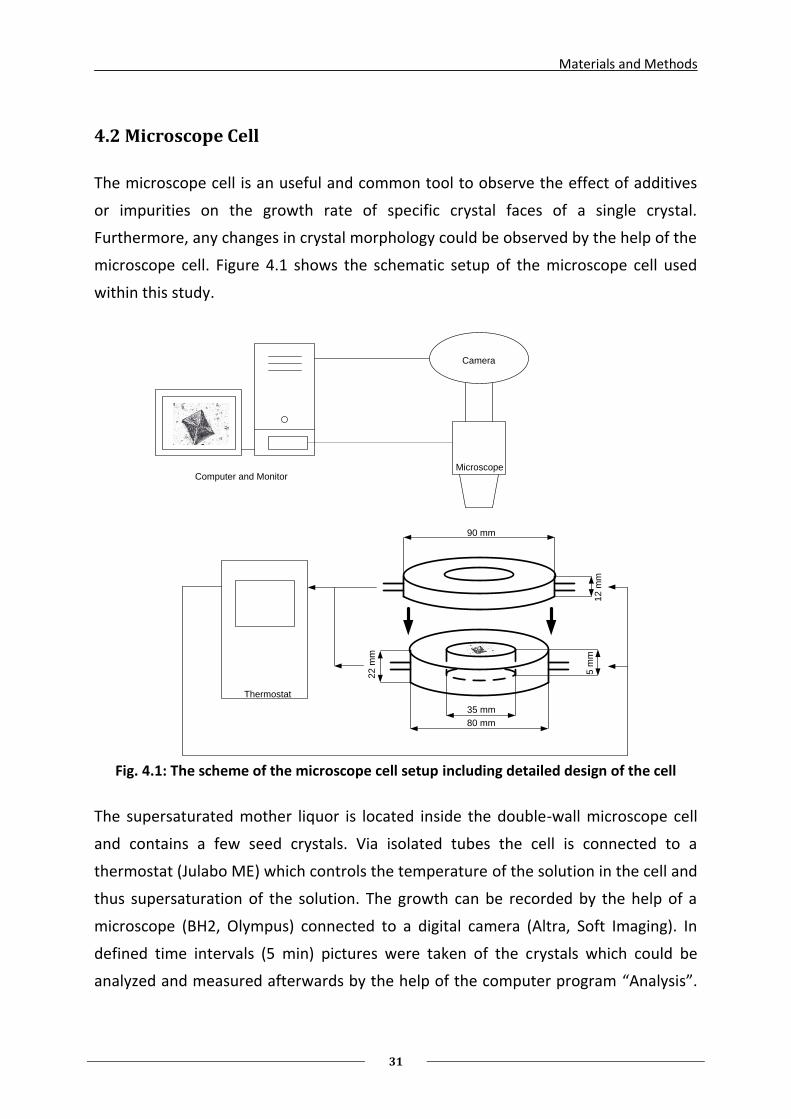
4.2 Microscope Cell
The microscope cell is an useful and common tool to observe the effect of additives
or impurities on the growth rate of specific crystal faces of a single crystal.
Furthermore, any changes in crystal morphology could be observed by the help of the
microscope cell. Figure 4.1 shows the schematic setup of the microscope cell used
within this study.
Thermostat
Microscope
Camera
Computer and Monitor
35 mm
5 m
m
80 mm
90 mm
22
mm
12
mm
Fig. 4.1: The scheme of the microscope cell setup including detailed design of the cell
The supersaturated mother liquor is located inside the double-wall microscope cell
and contains a few seed crystals. Via isolated tubes the cell is connected to a
thermostat (Julabo ME) which controls the temperature of the solution in the cell and
thus supersaturation of the solution. The growth can be recorded by the help of a
microscope (BH2, Olympus) connected to a digital camera (Altra, Soft Imaging). In
defined time intervals (5 min) pictures were taken of the crystals which could be
analyzed and measured afterwards by the help of the computer program “Analysis”.
Materials and Methods
32
13
,55
cm
15
cm
4,8
cm
4,6 cm
3,8 cm
Further information concerning the use of the microscope cell could be taken from
literature (see e.g. ([Nie95] and [Gou09]).
One major disadvantage of a microscope cell is that only stagnant solutions could be
observed during growth which sometimes leads to a desupersaturated zone around
the crystals, especially, if the diffusion is hindered e.g. by a high viscosity of the
mother liquor.
The results concerning those microscope cell experiments could be found in Chapter
5.2.
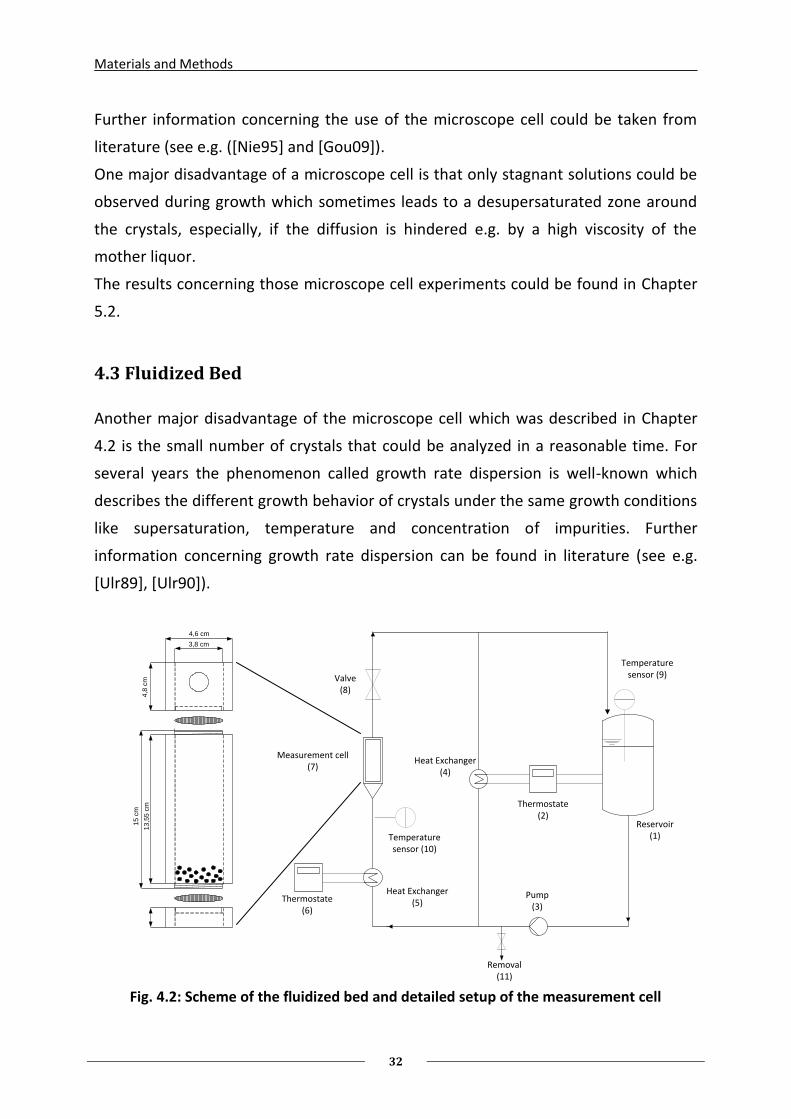
4.3 Fluidized Bed
Another major disadvantage of the microscope cell which was described in Chapter
4.2 is the small number of crystals that could be analyzed in a reasonable time. For
several years the phenomenon called growth rate dispersion is well-known which
describes the different growth behavior of crystals under the same growth conditions
like supersaturation, temperature and concentration of impurities. Further
information concerning growth rate dispersion can be found in literature (see e.g.
[Ulr89], [Ulr90]).
Valve (8)
Pump (3)
Removal(11)
Heat Exchanger (5)
Heat Exchanger (4)
Thermostate (6)
Thermostate(2)
Measurement cell (7)
Temperature sensor (10)
Temperature sensor (9)
Reservoir (1)
Fig. 4.2: Scheme of the fluidized bed and detailed setup of the measurement cell
Materials and Methods
33
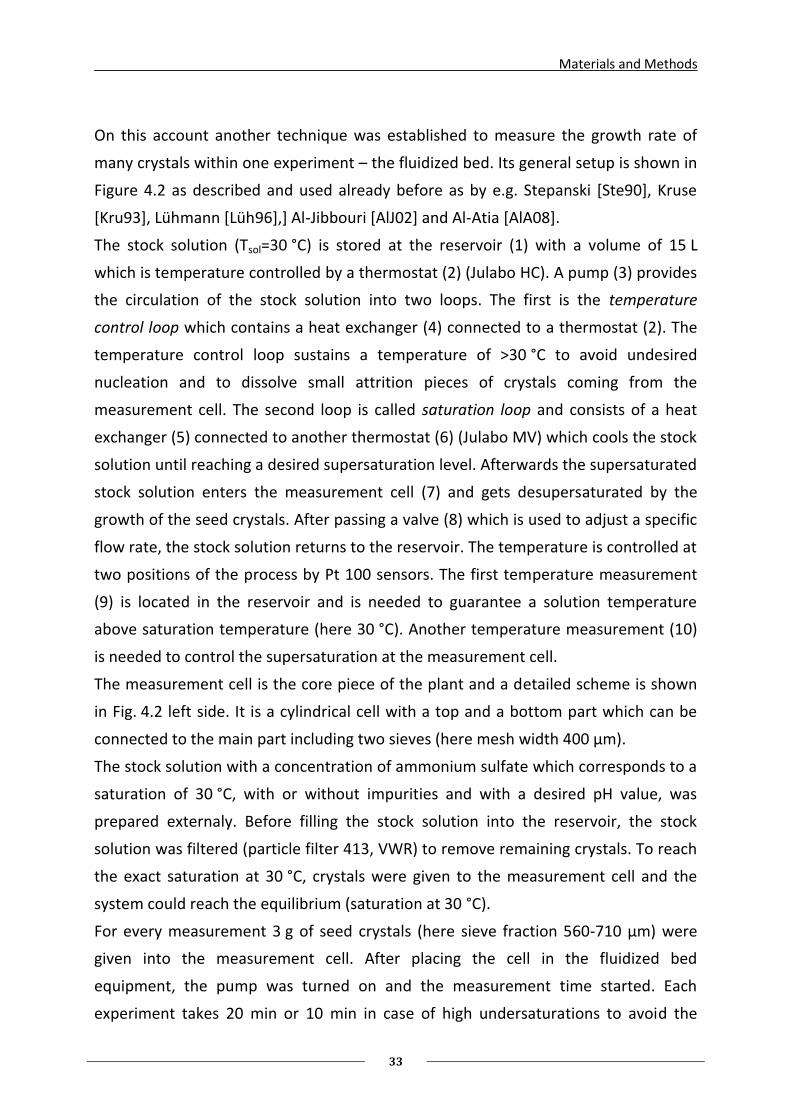
On this account another technique was established to measure the growth rate of
many crystals within one experiment – the fluidized bed. Its general setup is shown in
Figure 4.2 as described and used already before as by e.g. Stepanski [Ste90], Kruse
[Kru93], Lühmann [Lüh96],] Al-Jibbouri [AlJ02] and Al-Atia [AlA08].
The stock solution (Tsol=30 °C) is stored at the reservoir (1) with a volume of 15 L
which is temperature controlled by a thermostat (2) (Julabo HC). A pump (3) provides
the circulation of the stock solution into two loops. The first is the temperature
control loop which contains a heat exchanger (4) connected to a thermostat (2). The
temperature control loop sustains a temperature of >30 °C to avoid undesired
nucleation and to dissolve small attrition pieces of crystals coming from the
measurement cell. The second loop is called saturation loop and consists of a heat
exchanger (5) connected to another thermostat (6) (Julabo MV) which cools the stock
solution until reaching a desired supersaturation level. Afterwards the supersaturated
stock solution enters the measurement cell (7) and gets desupersaturated by the
growth of the seed crystals. After passing a valve (8) which is used to adjust a specific
flow rate, the stock solution returns to the reservoir. The temperature is controlled at
two positions of the process by Pt 100 sensors. The first temperature measurement
(9) is located in the reservoir and is needed to guarantee a solution temperature
above saturation temperature (here 30 °C). Another temperature measurement (10)
is needed to control the supersaturation at the measurement cell.
The measurement cell is the core piece of the plant and a detailed scheme is shown
in Fig. 4.2 left side. It is a cylindrical cell with a top and a bottom part which can be
connected to the main part including two sieves (here mesh width 400 µm).
The stock solution with a concentration of ammonium sulfate which corresponds to a
saturation of 30 °C, with or without impurities and with a desired pH value, was
prepared externaly. Before filling the stock solution into the reservoir, the stock
solution was filtered (particle filter 413, VWR) to remove remaining crystals. To reach
the exact saturation at 30 °C, crystals were given to the measurement cell and the
system could reach the equilibrium (saturation at 30 °C).
For every measurement 3 g of seed crystals (here sieve fraction 560-710 µm) were
given into the measurement cell. After placing the cell in the fluidized bed
equipment, the pump was turned on and the measurement time started. Each
experiment takes 20 min or 10 min in case of high undersaturations to avoid the
Materials and Methods
34
crystals dissolving to a size below 400 µm. Afterwards the crystals were removed
from the cell by washing with saturated ammonium sulfate solution into a filter
funnel (particle filter 413, VWR). The filter paper then was dried overnight at 50 °C in
an oven and the dried crystals were weight. From the mass difference between start
and end of the measurement, the averaged growth rate could be calculated by Eq.
4.2.
(4.2)
mstart is the crystal mass at the beginning of the experiment and mend is the mass of
the dried crystals after growth or dissolution. L1 is the arithmetic average of the sieve
fraction and t is the duration of the experiment. Detailed information for the
derivation of Eq. 4.2 can be taken from literature (e.g. [Ste90] and [vBr92]).
The mass of the crystals after the drying process contains an error caused by
adherent mother liquor or washing solution after the washing process and
crystallization during the drying. Therefore a correction factor was introduced which
was subtracted from the mass of the end mend. This correction factor was determined
by washing and drying 3 g of seed crystals (560-710 µm) and controlling the change in
mass (average of 10 tests).
For each analyzed combination of solution properties (super- or undersaturation,
concentration of impurities) one saturation test was made which means a run at
30 °C and after adjusting the correct super- or understauration three repetitions were
carried out.
The results of the fluidized bed experiments are shown and discussed in Chapter 5.3.
Materials and Methods
35
4.4 Ultrasonic Speed Measurements
Within this work an ultrasonic speed measurement device was used to observe the
effect of impurities on the metastable zone width (see Chapter 2.2.2) of ammonium
sulfate. In former times the MZW was observed by the visibility method described
e.g. by Mullin [Mul93]. This method had big disadvantages, namely that the observer
has to monitor the experiment in order to detect and note the nucleation
temperature and time of visible nucleation. In recent years different other methods
were established to observe the MZW of various compounds. An example is the
FBRM (Focused Beam Reflectance Method) technology which uses a light beam to
detect nucleation and solubility [Bar02], other techniques observe changes in density
or conductivity of the mother solution caused by nucleation (changes in
concentration). The ultrasonic technology uses changes in the ultrasonic velocity
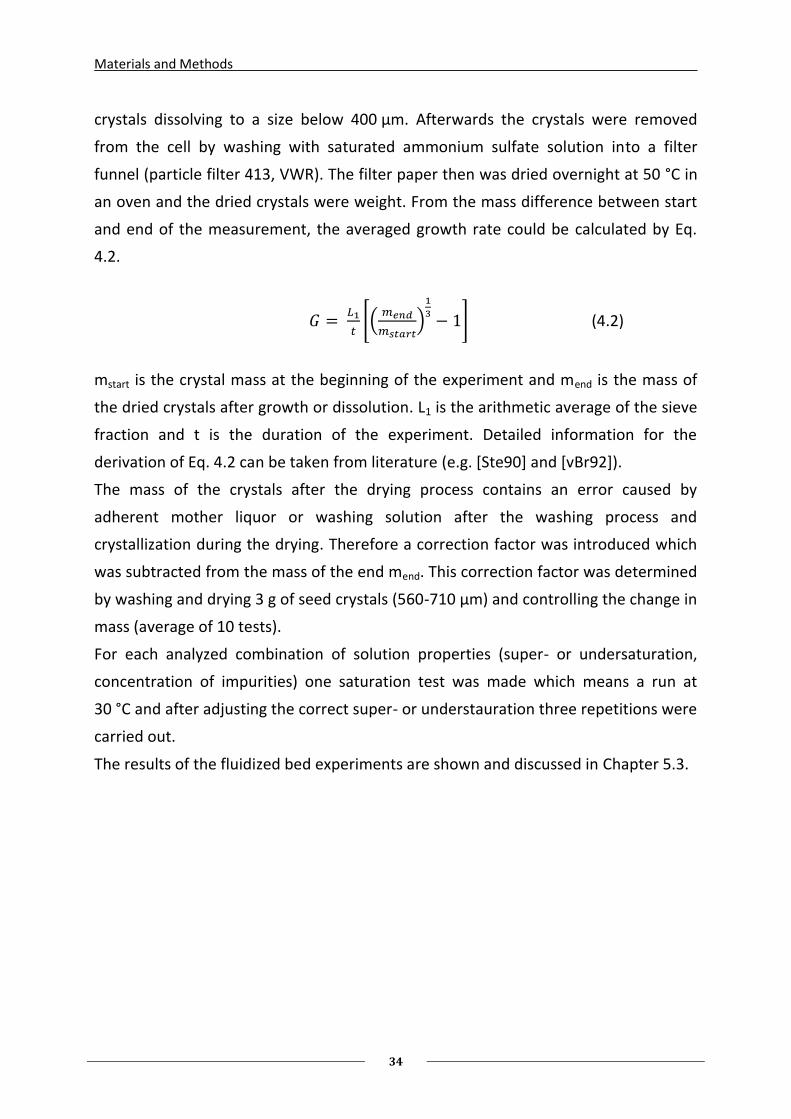
induced by changes in concentration of the ammonium sulfate in solution. Fig. 4.3
shows the principle of the ultrasonic probe which is based on simple time-measuring.
s
Transmitter Receiver
Time measurement
Fig. 4.3: Ultrasonic measuring principle [Sen10]
An ultrasonic signal is emitted by a piezo transmitter in periodic intervals. With a
characteristic velocity the ultrasonic signal then passes the media and is detected by
a receiver. From the duration of the passage and the known distance between
transmitter and receiver the ultrasonic velocity could be calculated.
In liquids the ultrasonic velocity vUS is a temperature and concentration dependent
physical property. Therefore it depends on the density ρ and the adiabatic
compressibility βad. A very simple relationship was given by Urick [Uri48] and is shown
in Eq. 4.3.
Materials and Methods
36
(4.3)
The precision of the system for ultrasonic velocity and temperature is ±0.01 m/s and
±0.01 °C, respectively.
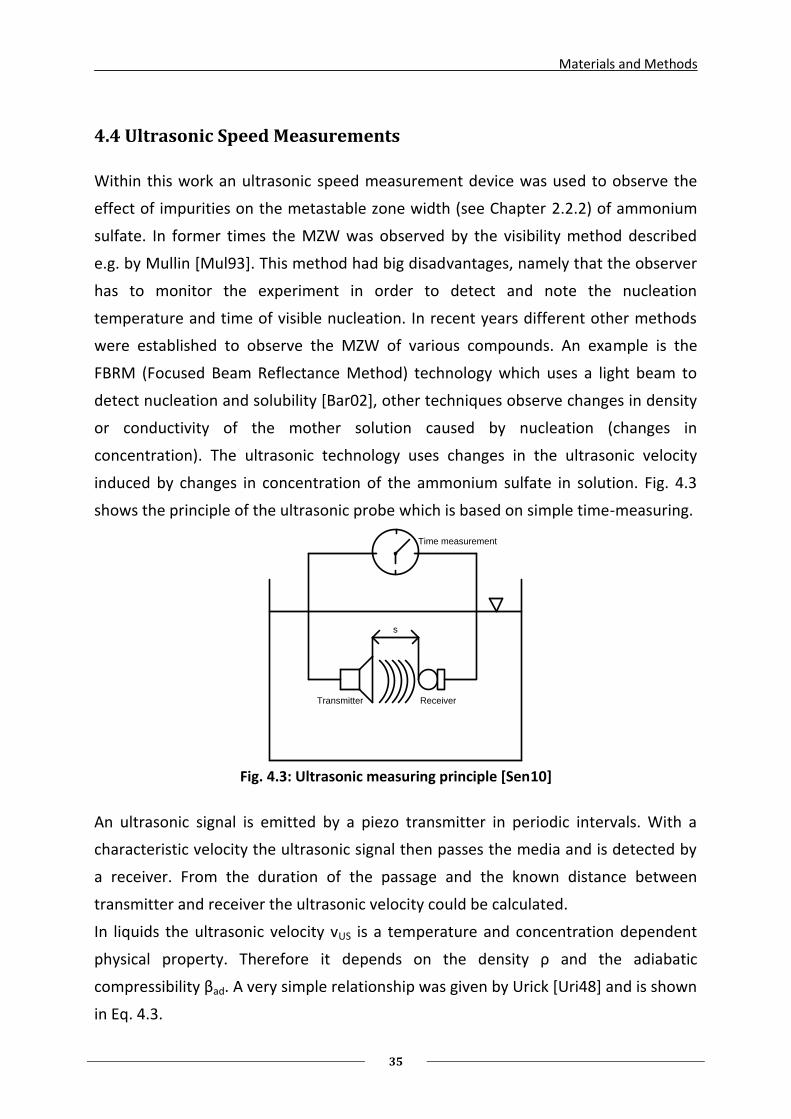
Figure 4.4 shows the scheme of the setup used here for the determination of the
MZW.
Fig. 4.4: Experimental setup of ultrasonic measurement device [Tit03]
A double-wall beaker with a volume of 300 mL (diameter 58 mm) was temperature-
controlled by a thermostat. Cooling and heating rates were adjusted to 5 K/h. Stirring
was realized by a magnetic stirrer (diameter 7 mm and length 30 mm) with a rotation
speed of 500 rpm in each experiment. The ultrasonic probe was immersed into the AS
solution and the signal was processed by a controller which is connected to a
computer. The ultrasonic speed probe gives information on ultrasonic speed and
temperature of the medium. Further information for this experimental setup could
be achieved from literature [Tit02, Tit03].
The solution which should be observed concerning nucleation temperature and
solubility and therefore MZW was prepared externally. A specific ammonium sulfate
concentration was realized by adding appropriate amounts of ammonium sulfate to
100 g of distilled water, impurities were added based on the calculations of Eq. 4.1
and the pH value was set to a desired value by adding sulfuric acid or ammonium
hydroxide, respectively.
Materials and Methods
37
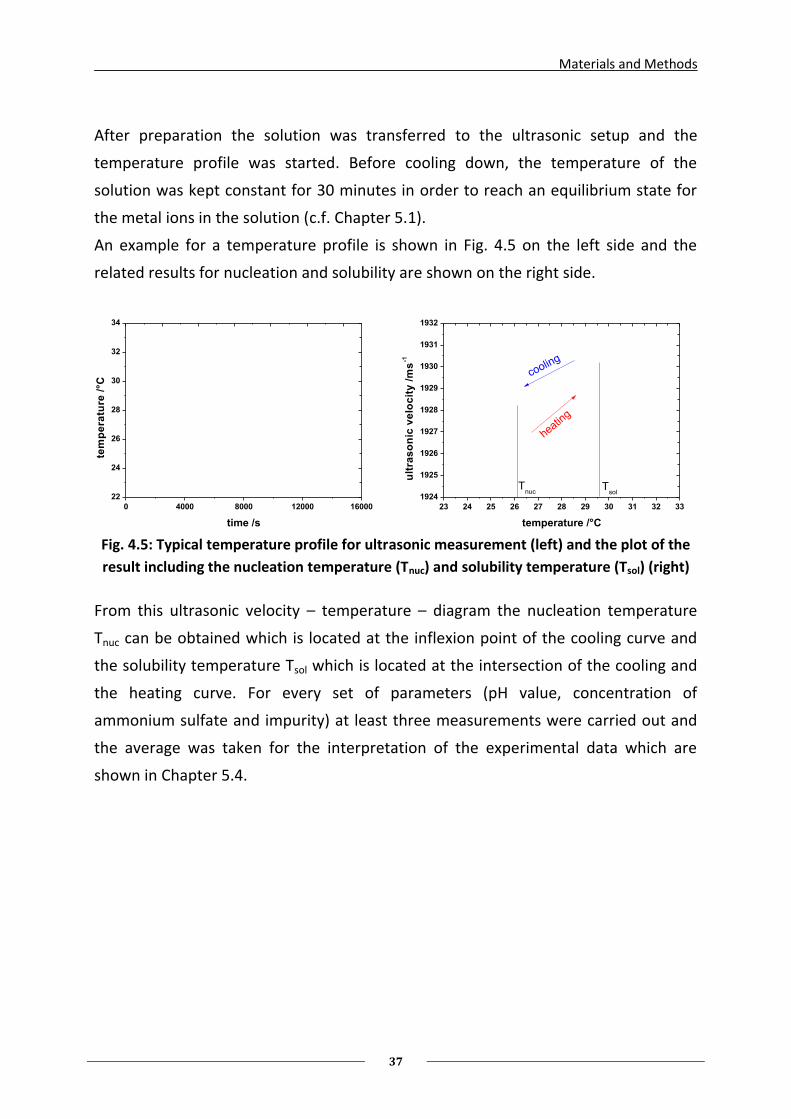
After preparation the solution was transferred to the ultrasonic setup and the
temperature profile was started. Before cooling down, the temperature of the
solution was kept constant for 30 minutes in order to reach an equilibrium state for
the metal ions in the solution (c.f. Chapter 5.1).
An example for a temperature profile is shown in Fig. 4.5 on the left side and the
related results for nucleation and solubility are shown on the right side.
0 4000 8000 12000 16000
22
24
26
28
30
32
34
tem
pe
ratu
re /
°C
time /s
23 24 25 26 27 28 29 30 31 32 33
1924
1925
1926
1927
1928
1929
1930
1931
1932
ult
ras
on
ic v
elo
cit
y /
ms
-1
temperature /°C
heating
Tsol
Tnuc
cooling
Fig. 4.5: Typical temperature profile for ultrasonic measurement (left) and the plot of the
result including the nucleation temperature (Tnuc) and solubility temperature (Tsol) (right)
From this ultrasonic velocity – temperature – diagram the nucleation temperature
Tnuc can be obtained which is located at the inflexion point of the cooling curve and
the solubility temperature Tsol which is located at the intersection of the cooling and
the heating curve. For every set of parameters (pH value, concentration of
ammonium sulfate and impurity) at least three measurements were carried out and
the average was taken for the interpretation of the experimental data which are
shown in Chapter 5.4.
Materials and Methods
38
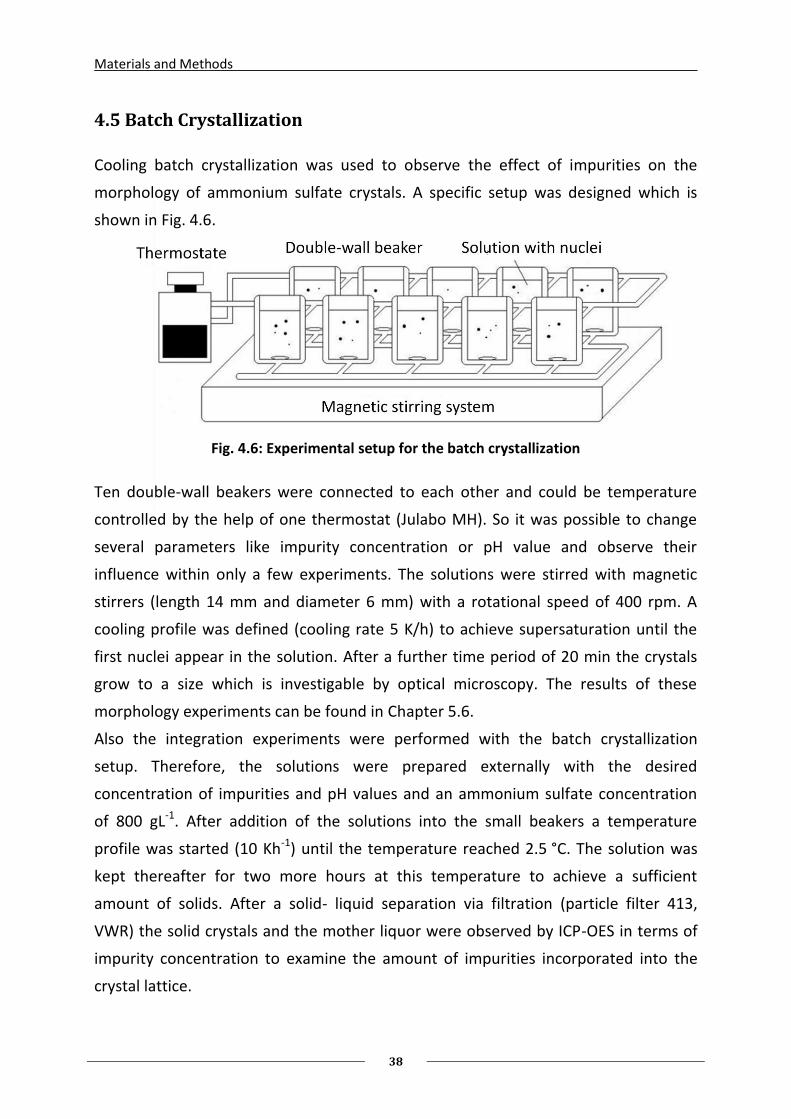
4.5 Batch Crystallization
Cooling batch crystallization was used to observe the effect of impurities on the
morphology of ammonium sulfate crystals. A specific setup was designed which is
shown in Fig. 4.6.
Fig. 4.6: Experimental setup for the batch crystallization
Ten double-wall beakers were connected to each other and could be temperature
controlled by the help of one thermostat (Julabo MH). So it was possible to change
several parameters like impurity concentration or pH value and observe their
influence within only a few experiments. The solutions were stirred with magnetic
stirrers (length 14 mm and diameter 6 mm) with a rotational speed of 400 rpm. A
cooling profile was defined (cooling rate 5 K/h) to achieve supersaturation until the
first nuclei appear in the solution. After a further time period of 20 min the crystals
grow to a size which is investigable by optical microscopy. The results of these
morphology experiments can be found in Chapter 5.6.
Also the integration experiments were performed with the batch crystallization
setup. Therefore, the solutions were prepared externally with the desired
concentration of impurities and pH values and an ammonium sulfate concentration
of 800 gL-1. After addition of the solutions into the small beakers a temperature
profile was started (10 Kh-1) until the temperature reached 2.5 °C. The solution was
kept thereafter for two more hours at this temperature to achieve a sufficient
amount of solids. After a solid- liquid separation via filtration (particle filter 413,
VWR) the solid crystals and the mother liquor were observed by ICP-OES in terms of
impurity concentration to examine the amount of impurities incorporated into the
crystal lattice.
Materials and Methods
39
4.6 Metal ion concentration –ICP
The ICP-OES experiments were performed in cooperation with SKW Piesteritz who
analyzed the samples by using a Cirros CCD (SPECTRO Analytic Instruments GmbH,
Kleve). ICP-OES stands for “Inductively Coupled Plasma - Optical Emission
Spectrometry” which is a very sensitive analyzing tool especially for metal ions in
solution and therefore a very useful tool to observe the integration of impurity
molecules into the lattice.
In both, industry and research, the ICP-OES became a standard analyzing tool and will
not be explained further here. For detailed information concerning method,
functionality or setup it is advised to go to the relevant literature (e.g. [Nöl02]).
4.7 Computer based Simulations
4.7.1 Hyss
Calculating the distribution of species in chemical equilibrium is an important feature
for a wide variety of applications. For this work it is important to gain some
information concerning complex formation of metal ions in aqueous solution. Certain
computer-based programs like RAMESES [Leu89] or HYPHEN [Gan96] were
established in recent years and for this work the program HySS (Hyperquad
Simulation and Speciation) was chosen, which was developed based on the program
HYPHEN [Ald99]. It can be used to simulate the distribution of metal-aquo-complexes
depending on the pH value of the solution by using the hydrolysis constants taken
from literature (see also Chapter 3.6). Detailed information concerning the structure
of the used program can be taken from literature [Ald99] and the program can be
downloaded as free ware from internet [Hys10].
4.7.2 Molecular Modeling
In recent years an increasing number of publications concerning molecular modeling
of organic compounds can be found (see e.g. [Lu03], [Fie07], [Yür10]). Up to now,
however, it is still impossible to predict the effect of impurities on the growth or
crystal shape of inorganic crystal systems. This work does not claim to improve
existing ideas of molecular modeling of inorganic compounds, but some basics of
molecular modeling are already useful tools to help to understand and describe

Materials and Methods
40
observed phenomena. Two commercially available computer programs for molecular
modeling were used within the scope of this work. The first program is GAUSSIAN and
the second is SERIUS².
Results
41
5. Results
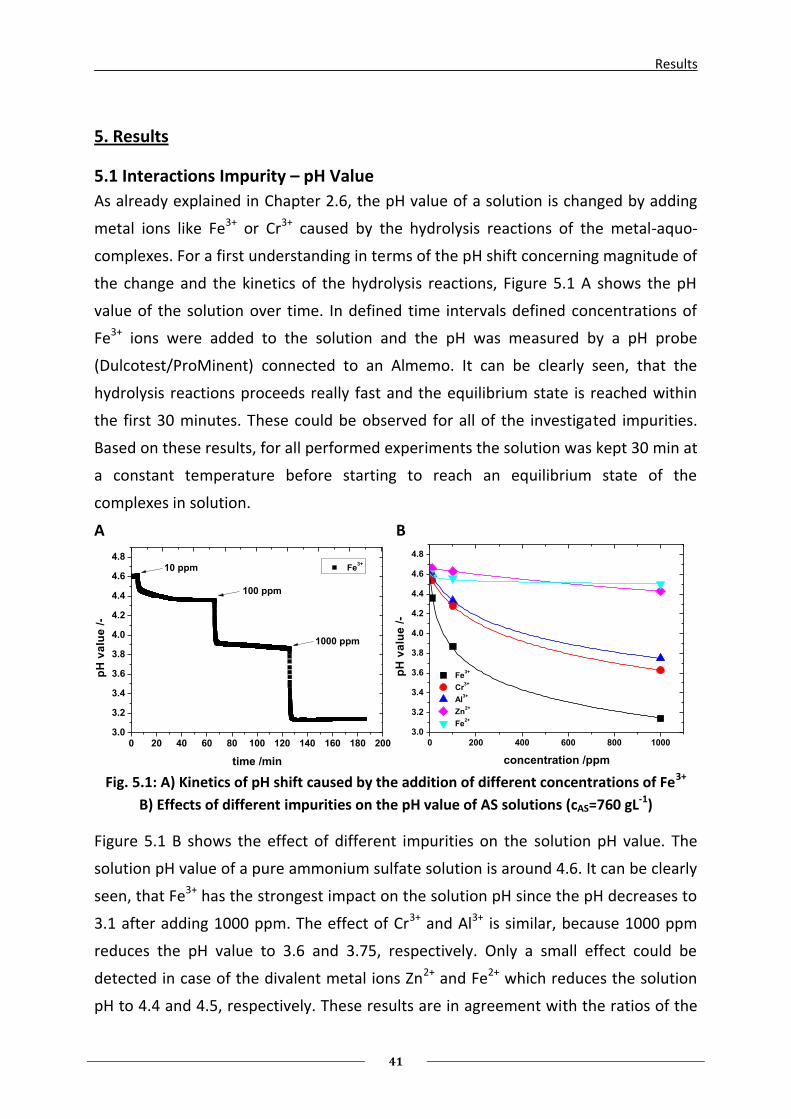
5.1 Interactions Impurity – pH Value
As already explained in Chapter 2.6, the pH value of a solution is changed by adding
metal ions like Fe3+ or Cr3+ caused by the hydrolysis reactions of the metal-aquo-
complexes. For a first understanding in terms of the pH shift concerning magnitude of
the change and the kinetics of the hydrolysis reactions, Figure 5.1 A shows the pH
value of the solution over time. In defined time intervals defined concentrations of
Fe3+ ions were added to the solution and the pH was measured by a pH probe
(Dulcotest/ProMinent) connected to an Almemo. It can be clearly seen, that the
hydrolysis reactions proceeds really fast and the equilibrium state is reached within
the first 30 minutes. These could be observed for all of the investigated impurities.
Based on these results, for all performed experiments the solution was kept 30 min at
a constant temperature before starting to reach an equilibrium state of the
complexes in solution.
A B
0 20 40 60 80 100 120 140 160 180 2003.0
3.2
3.4
3.6
3.8
4.0
4.2
4.4
4.6
4.8
1000 ppm
100 ppm
Fe3+
pH
va
lue
/-
time /min
10 ppm
0 200 400 600 800 1000
3.0
3.2
3.4
3.6
3.8
4.0
4.2
4.4
4.6
4.8
Fe3+
Cr3+
Al3+
Zn2+
Fe2+
pH
va
lue
/-
concentration /ppm Fig. 5.1: A) Kinetics of pH shift caused by the addition of different concentrations of Fe3+
B) Effects of different impurities on the pH value of AS solutions (cAS=760 gL-1)
Figure 5.1 B shows the effect of different impurities on the solution pH value. The
solution pH value of a pure ammonium sulfate solution is around 4.6. It can be clearly
seen, that Fe3+ has the strongest impact on the solution pH since the pH decreases to
3.1 after adding 1000 ppm. The effect of Cr3+ and Al3+ is similar, because 1000 ppm
reduces the pH value to 3.6 and 3.75, respectively. Only a small effect could be
detected in case of the divalent metal ions Zn2+ and Fe2+ which reduces the solution
pH to 4.4 and 4.5, respectively. These results are in agreement with the ratios of the
Results
42
hydrolysis constants of the different metal ions (see Chapter 2.6). The monovalent
metal ions Na+ and K+ do not cause any change in the pH value of an ammonium
sulfate solutions even up to concentrations of 1000 ppm.
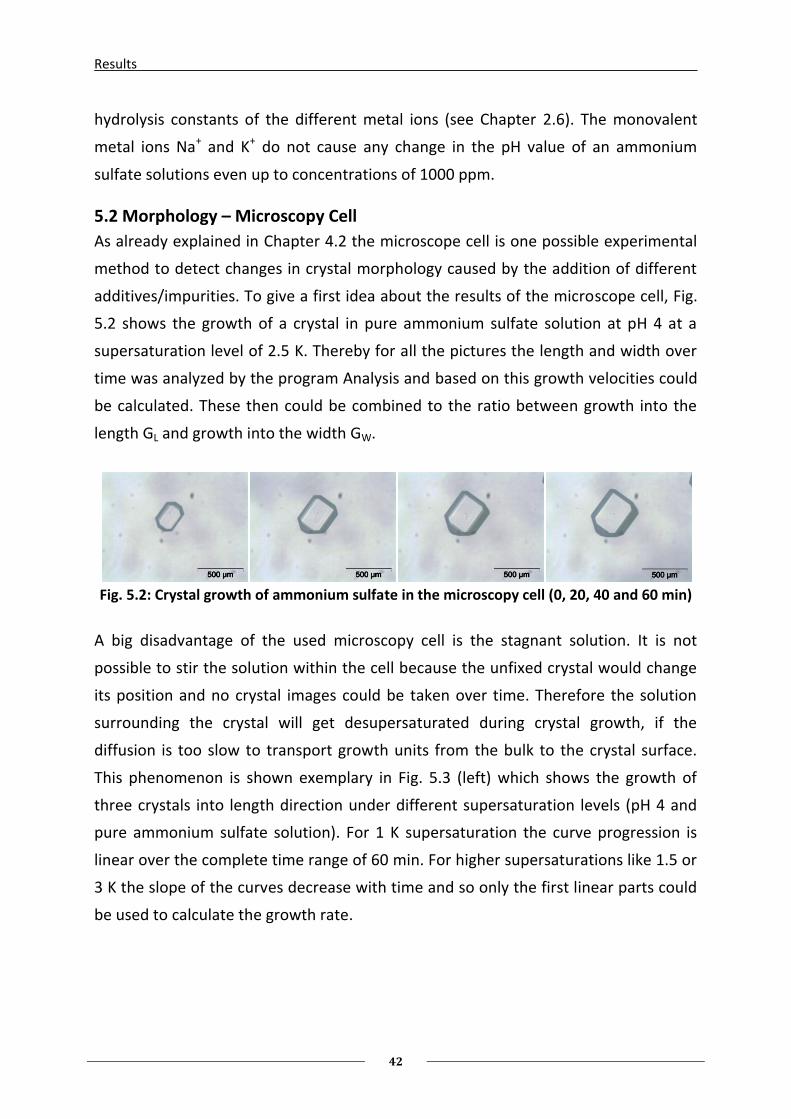
5.2 Morphology – Microscopy Cell
As already explained in Chapter 4.2 the microscope cell is one possible experimental
method to detect changes in crystal morphology caused by the addition of different
additives/impurities. To give a first idea about the results of the microscope cell, Fig.
5.2 shows the growth of a crystal in pure ammonium sulfate solution at pH 4 at a
supersaturation level of 2.5 K. Thereby for all the pictures the length and width over
time was analyzed by the program Analysis and based on this growth velocities could
be calculated. These then could be combined to the ratio between growth into the
length GL and growth into the width GW.
Fig. 5.2: Crystal growth of ammonium sulfate in the microscopy cell (0, 20, 40 and 60 min)
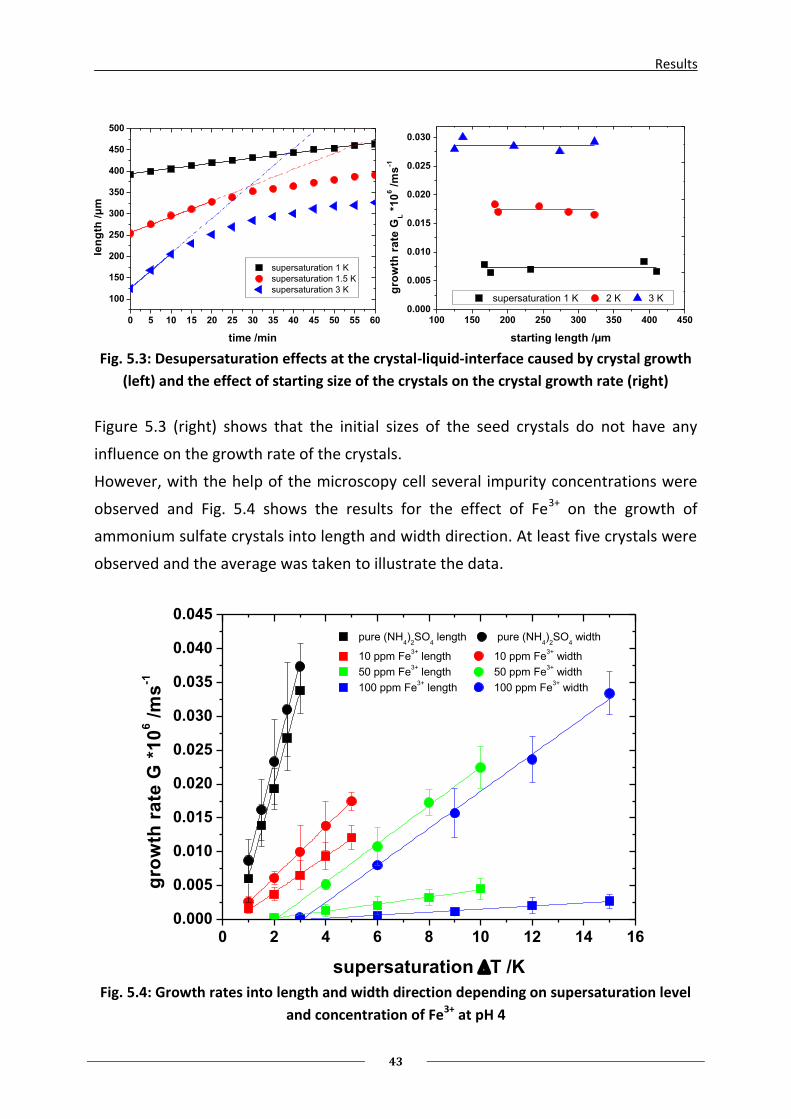
A big disadvantage of the used microscopy cell is the stagnant solution. It is not
possible to stir the solution within the cell because the unfixed crystal would change
its position and no crystal images could be taken over time. Therefore the solution
surrounding the crystal will get desupersaturated during crystal growth, if the
diffusion is too slow to transport growth units from the bulk to the crystal surface.
This phenomenon is shown exemplary in Fig. 5.3 (left) which shows the growth of
three crystals into length direction under different supersaturation levels (pH 4 and
pure ammonium sulfate solution). For 1 K supersaturation the curve progression is
linear over the complete time range of 60 min. For higher supersaturations like 1.5 or
3 K the slope of the curves decrease with time and so only the first linear parts could
be used to calculate the growth rate.
Results
43
0 5 10 15 20 25 30 35 40 45 50 55 60
100
150
200
250
300
350
400
450
500
supersaturation 1 K
supersaturation 1.5 K
supersaturation 3 K
len
gth
/µ
m
time /min
100 150 200 250 300 350 400 4500.000
0.005
0.010
0.015
0.020
0.025
0.030
supersaturation 1 K 2 K 3 K
gro
wth
ra
te G
L *
10
6 /
ms
-1
starting length /µm Fig. 5.3: Desupersaturation effects at the crystal-liquid-interface caused by crystal growth
(left) and the effect of starting size of the crystals on the crystal growth rate (right)
Figure 5.3 (right) shows that the initial sizes of the seed crystals do not have any
influence on the growth rate of the crystals.
However, with the help of the microscopy cell several impurity concentrations were
observed and Fig. 5.4 shows the results for the effect of Fe3+ on the growth of
ammonium sulfate crystals into length and width direction. At least five crystals were
observed and the average was taken to illustrate the data.
0 2 4 6 8 10 12 14 160.000
0.005
0.010
0.015
0.020
0.025
0.030
0.035
0.040
0.045
pure (NH4)
2SO
4 length pure (NH
4)
2SO
4 width
10 ppm Fe3+
length 10 ppm Fe3+
width
50 ppm Fe3+
length 50 ppm Fe3+
width
100 ppm Fe3+
length 100 ppm Fe3+
width
gro
wth
ra
te G
*1
06 /
ms
-1
supersaturation T /K Fig. 5.4: Growth rates into length and width direction depending on supersaturation level
and concentration of Fe3+ at pH 4
Results
44
It can be concluded that Fe3+ has a strong effect on the growth rates of ammonium
sulfate crystals, both into length and into width direction, even at low concentrations
of 10 ppm. This is absolutely in accord with the results of fluidized bed results, which
are summarized in Chapter 5.3.
But the key information of Fig. 5.4 is that Fe3+ affects the growth rate of ammonium
sulfate crystals into length and into width in different ways. While in the pure
solution GL and GW are nearly parallel curves over the observed range of
supersaturation, with increasing Fe3+ concentration the angle between both curves
increases. This means the crystal morphology changes from compact cubic crystals to
needle-like crystals. In Chapter 5.5 some vivid pictures of crystals grown under
different Fe3+ concentration will emphasize these results. 50 ppm Fe3+ nearly stops
the growth of the crystals into the width direction (see Fig. 5.4) even at high
supersaturation levels.
There are two reasons for the different ranges of supersaturation used during these
experiments. The first is the small metastable zone width of pure ammonium sulfate
solutions which does not allow adjusting higher supersaturation without inducing
primary nucleation along with fast desupersaturation within the microscope cell. The
metastable zone width is increased by impurities (e.g. Fe3+) as can be seen in Chapter
5.4 which opens the possibility to set higher supersaturations and therefore reach
faster growth rates.
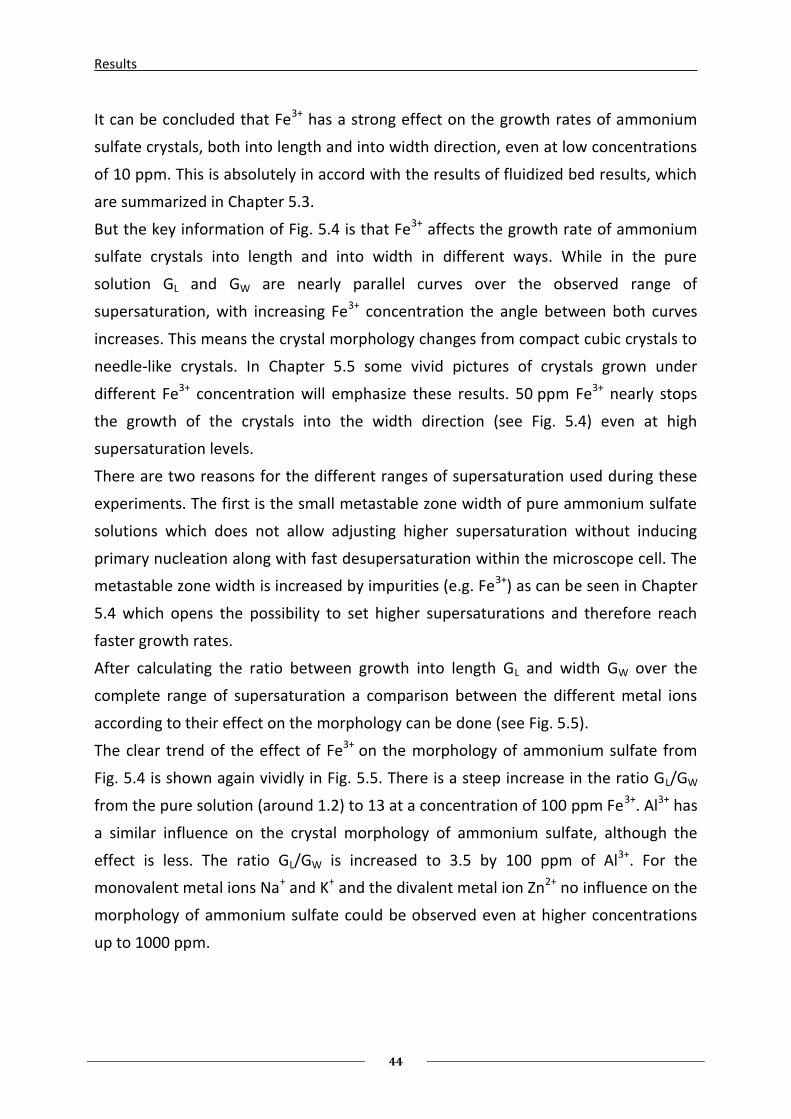
After calculating the ratio between growth into length GL and width GW over the
complete range of supersaturation a comparison between the different metal ions
according to their effect on the morphology can be done (see Fig. 5.5).
The clear trend of the effect of Fe3+ on the morphology of ammonium sulfate from
Fig. 5.4 is shown again vividly in Fig. 5.5. There is a steep increase in the ratio GL/GW
from the pure solution (around 1.2) to 13 at a concentration of 100 ppm Fe3+. Al3+ has
a similar influence on the crystal morphology of ammonium sulfate, although the
effect is less. The ratio GL/GW is increased to 3.5 by 100 ppm of Al3+. For the
monovalent metal ions Na+ and K+ and the divalent metal ion Zn2+ no influence on the
morphology of ammonium sulfate could be observed even at higher concentrations
up to 1000 ppm.
Results
45
200 400 600 800 10000
2
4
6
8
10
12
14
16
Fe3+
Al3+
Na+
K+
Zn2+
rati
o G
L/G
W /
-
log. concentration /ppm Fig. 5.5: Effect of impurities on the ratio GL/GW at pH 4
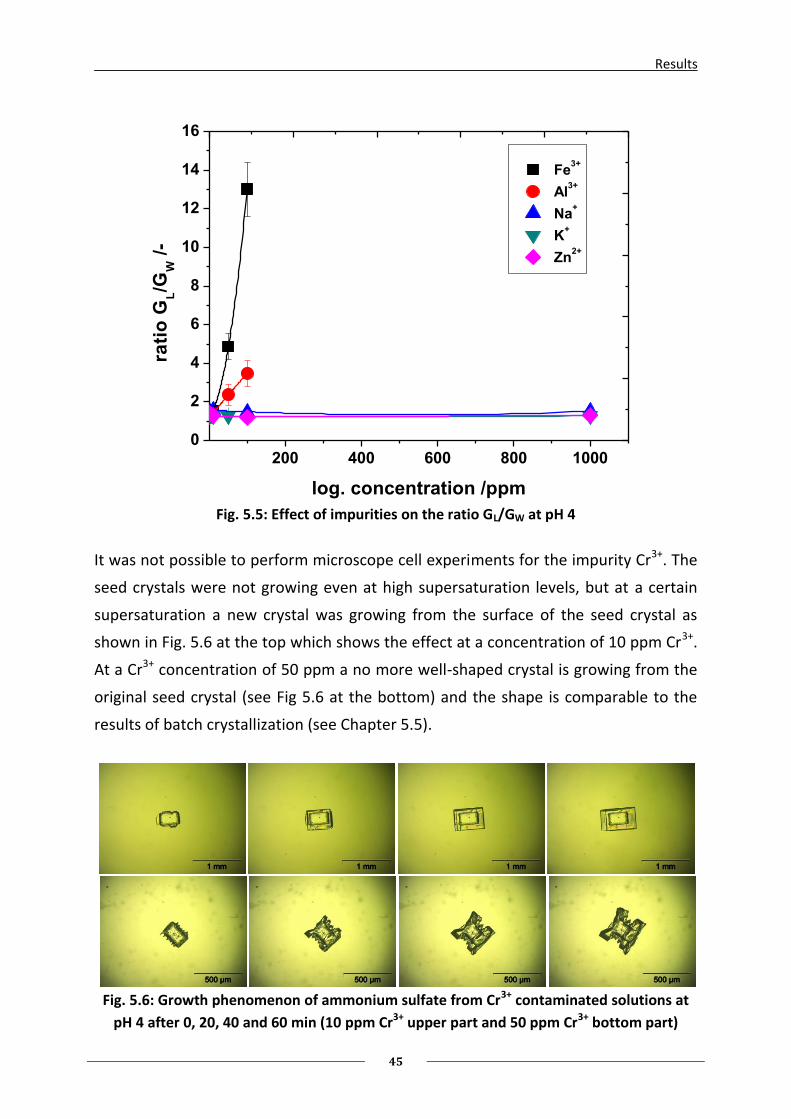
It was not possible to perform microscope cell experiments for the impurity Cr3+. The
seed crystals were not growing even at high supersaturation levels, but at a certain
supersaturation a new crystal was growing from the surface of the seed crystal as
shown in Fig. 5.6 at the top which shows the effect at a concentration of 10 ppm Cr3+.
At a Cr3+ concentration of 50 ppm a no more well-shaped crystal is growing from the
original seed crystal (see Fig 5.6 at the bottom) and the shape is comparable to the
results of batch crystallization (see Chapter 5.5).
Fig. 5.6: Growth phenomenon of ammonium sulfate from Cr3+ contaminated solutions at
pH 4 after 0, 20, 40 and 60 min (10 ppm Cr3+ upper part and 50 ppm Cr3+ bottom part)
Results
46
5.3 Metastable Zone Width
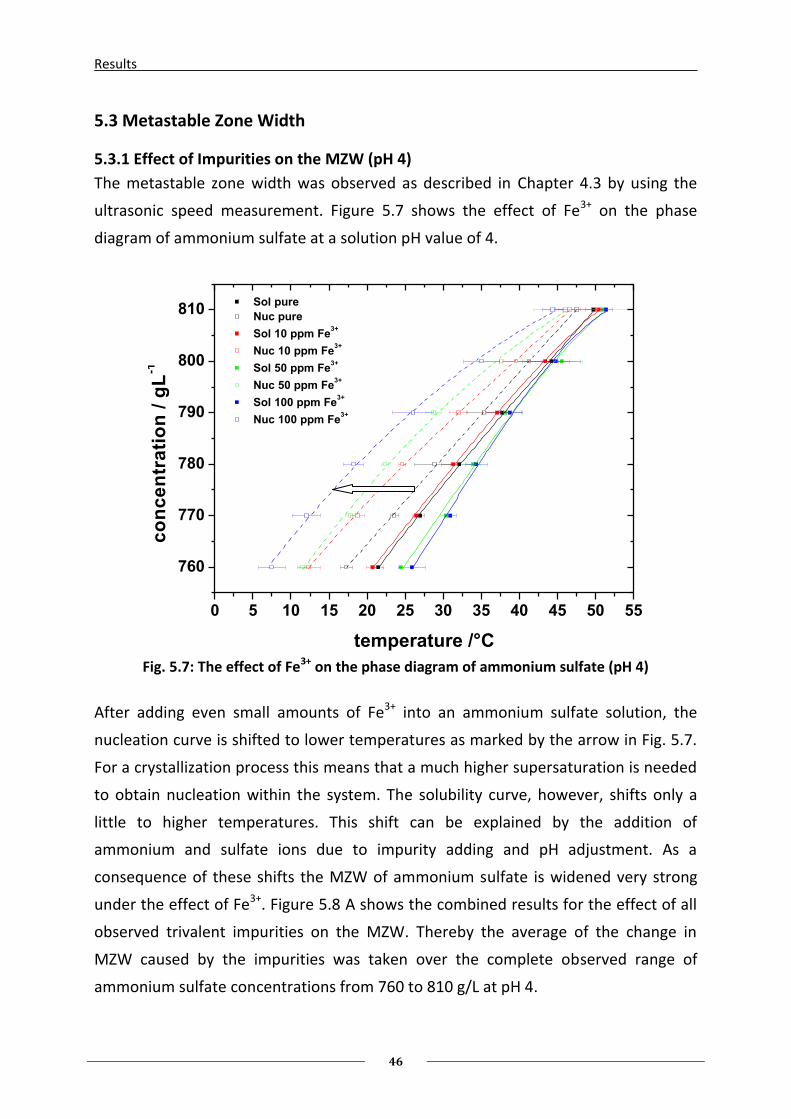
5.3.1 Effect of Impurities on the MZW (pH 4)
The metastable zone width was observed as described in Chapter 4.3 by using the
ultrasonic speed measurement. Figure 5.7 shows the effect of Fe3+ on the phase
diagram of ammonium sulfate at a solution pH value of 4.
0 5 10 15 20 25 30 35 40 45 50 55
760
770
780
790
800
810 Sol pure
Nuc pure
Sol 10 ppm Fe3+
Nuc 10 ppm Fe3+
Sol 50 ppm Fe3+
Nuc 50 ppm Fe3+
Sol 100 ppm Fe3+
Nuc 100 ppm Fe3+
co
nc
en
tra
tio
n /
gL
-1
temperature /°C Fig. 5.7: The effect of Fe3+ on the phase diagram of ammonium sulfate (pH 4)
After adding even small amounts of Fe3+ into an ammonium sulfate solution, the
nucleation curve is shifted to lower temperatures as marked by the arrow in Fig. 5.7.
For a crystallization process this means that a much higher supersaturation is needed
to obtain nucleation within the system. The solubility curve, however, shifts only a
little to higher temperatures. This shift can be explained by the addition of
ammonium and sulfate ions due to impurity adding and pH adjustment. As a
consequence of these shifts the MZW of ammonium sulfate is widened very strong
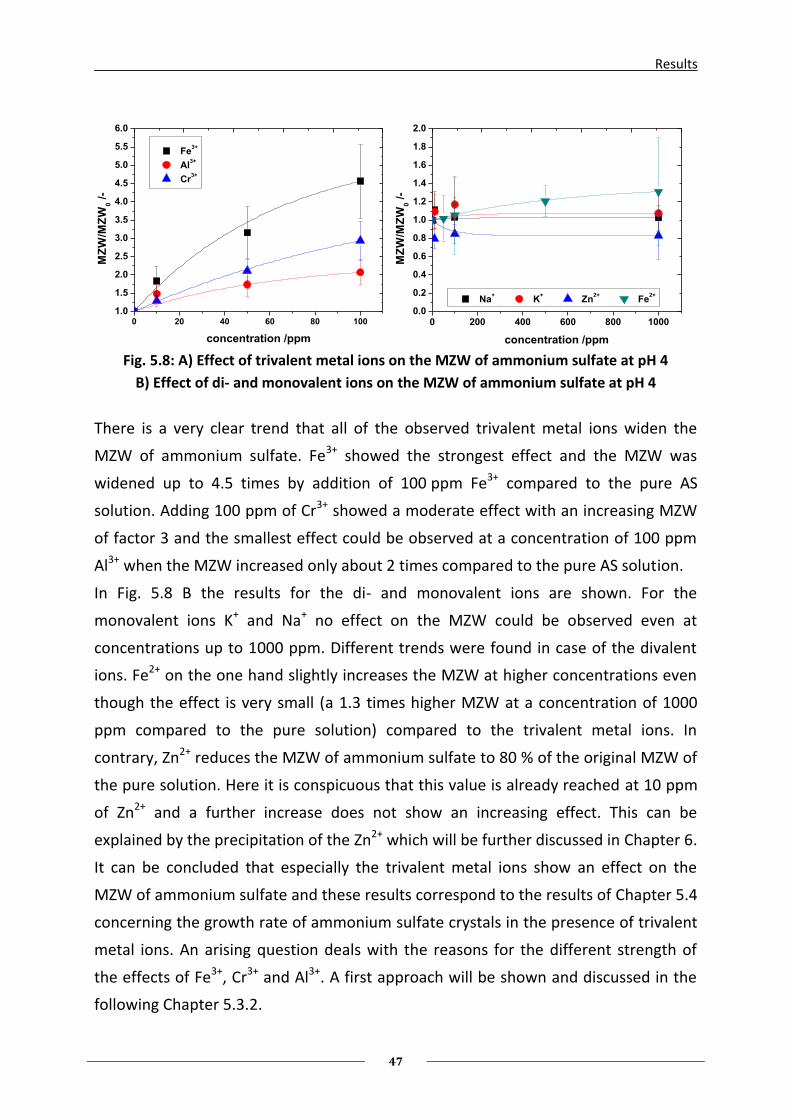
under the effect of Fe3+. Figure 5.8 A shows the combined results for the effect of all
observed trivalent impurities on the MZW. Thereby the average of the change in
MZW caused by the impurities was taken over the complete observed range of
ammonium sulfate concentrations from 760 to 810 g/L at pH 4.
Results
47
0 20 40 60 80 100
1.0
1.5
2.0
2.5
3.0
3.5
4.0
4.5
5.0
5.5
6.0
Fe3+
Al3+
Cr3+
MZ
W/M
ZW
0 /
-
concentration /ppm
0 200 400 600 800 10000.0
0.2
0.4
0.6
0.8
1.0
1.2
1.4
1.6
1.8
2.0
Na+ K
+ Zn
2+ Fe
2+
MZ
W/M
ZW
0 /
-
concentration /ppm Fig. 5.8: A) Effect of trivalent metal ions on the MZW of ammonium sulfate at pH 4
B) Effect of di- and monovalent ions on the MZW of ammonium sulfate at pH 4
There is a very clear trend that all of the observed trivalent metal ions widen the
MZW of ammonium sulfate. Fe3+ showed the strongest effect and the MZW was
widened up to 4.5 times by addition of 100 ppm Fe3+ compared to the pure AS
solution. Adding 100 ppm of Cr3+ showed a moderate effect with an increasing MZW
of factor 3 and the smallest effect could be observed at a concentration of 100 ppm
Al3+ when the MZW increased only about 2 times compared to the pure AS solution.
In Fig. 5.8 B the results for the di- and monovalent ions are shown. For the
monovalent ions K+ and Na+ no effect on the MZW could be observed even at
concentrations up to 1000 ppm. Different trends were found in case of the divalent
ions. Fe2+ on the one hand slightly increases the MZW at higher concentrations even
though the effect is very small (a 1.3 times higher MZW at a concentration of 1000
ppm compared to the pure solution) compared to the trivalent metal ions. In
contrary, Zn2+ reduces the MZW of ammonium sulfate to 80 % of the original MZW of
the pure solution. Here it is conspicuous that this value is already reached at 10 ppm
of Zn2+ and a further increase does not show an increasing effect. This can be
explained by the precipitation of the Zn2+ which will be further discussed in Chapter 6.
It can be concluded that especially the trivalent metal ions show an effect on the
MZW of ammonium sulfate and these results correspond to the results of Chapter 5.4
concerning the growth rate of ammonium sulfate crystals in the presence of trivalent
metal ions. An arising question deals with the reasons for the different strength of
the effects of Fe3+, Cr3+ and Al3+. A first approach will be shown and discussed in the
following Chapter 5.3.2.
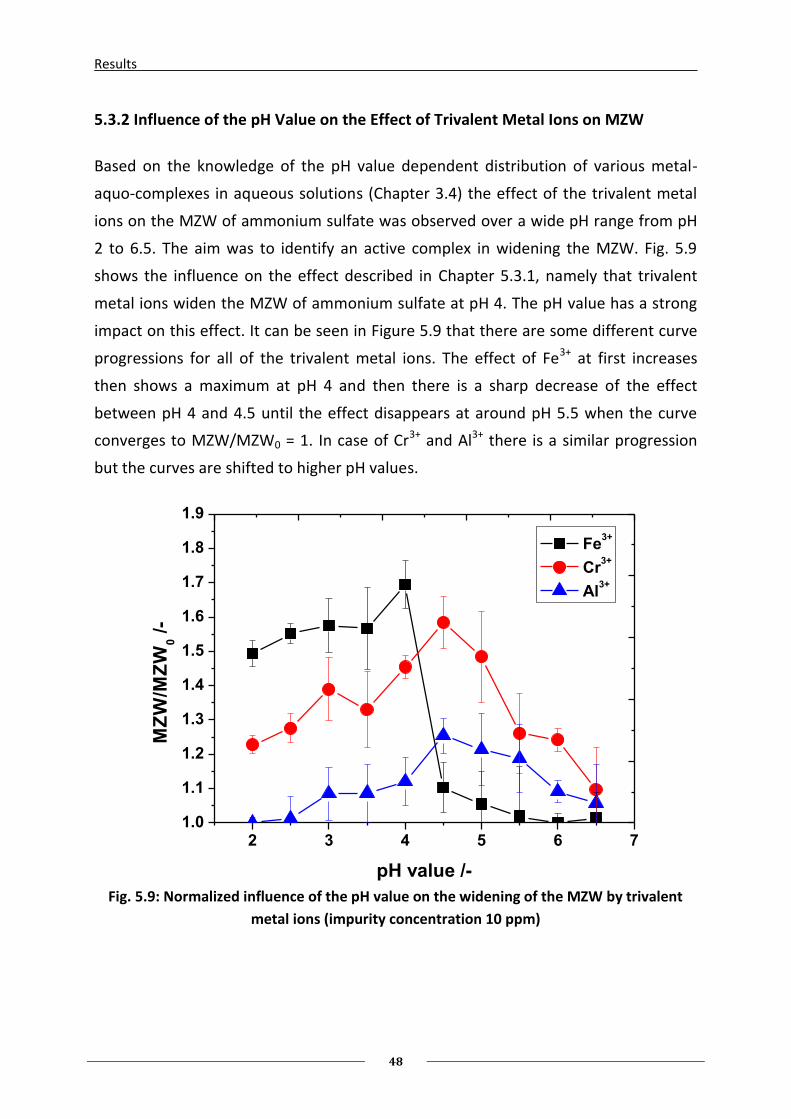
Results
48
5.3.2 Influence of the pH Value on the Effect of Trivalent Metal Ions on MZW
Based on the knowledge of the pH value dependent distribution of various metal-
aquo-complexes in aqueous solutions (Chapter 3.4) the effect of the trivalent metal
ions on the MZW of ammonium sulfate was observed over a wide pH range from pH
2 to 6.5. The aim was to identify an active complex in widening the MZW. Fig. 5.9
shows the influence on the effect described in Chapter 5.3.1, namely that trivalent
metal ions widen the MZW of ammonium sulfate at pH 4. The pH value has a strong
impact on this effect. It can be seen in Figure 5.9 that there are some different curve
progressions for all of the trivalent metal ions. The effect of Fe3+ at first increases
then shows a maximum at pH 4 and then there is a sharp decrease of the effect
between pH 4 and 4.5 until the effect disappears at around pH 5.5 when the curve
converges to MZW/MZW0 = 1. In case of Cr3+ and Al3+ there is a similar progression
but the curves are shifted to higher pH values.
2 3 4 5 6 71.0
1.1
1.2
1.3
1.4
1.5
1.6
1.7
1.8
1.9
Fe3+
Cr3+
Al3+
MZ
W/M
ZW
0 /
-
pH value /- Fig. 5.9: Normalized influence of the pH value on the widening of the MZW by trivalent
metal ions (impurity concentration 10 ppm)
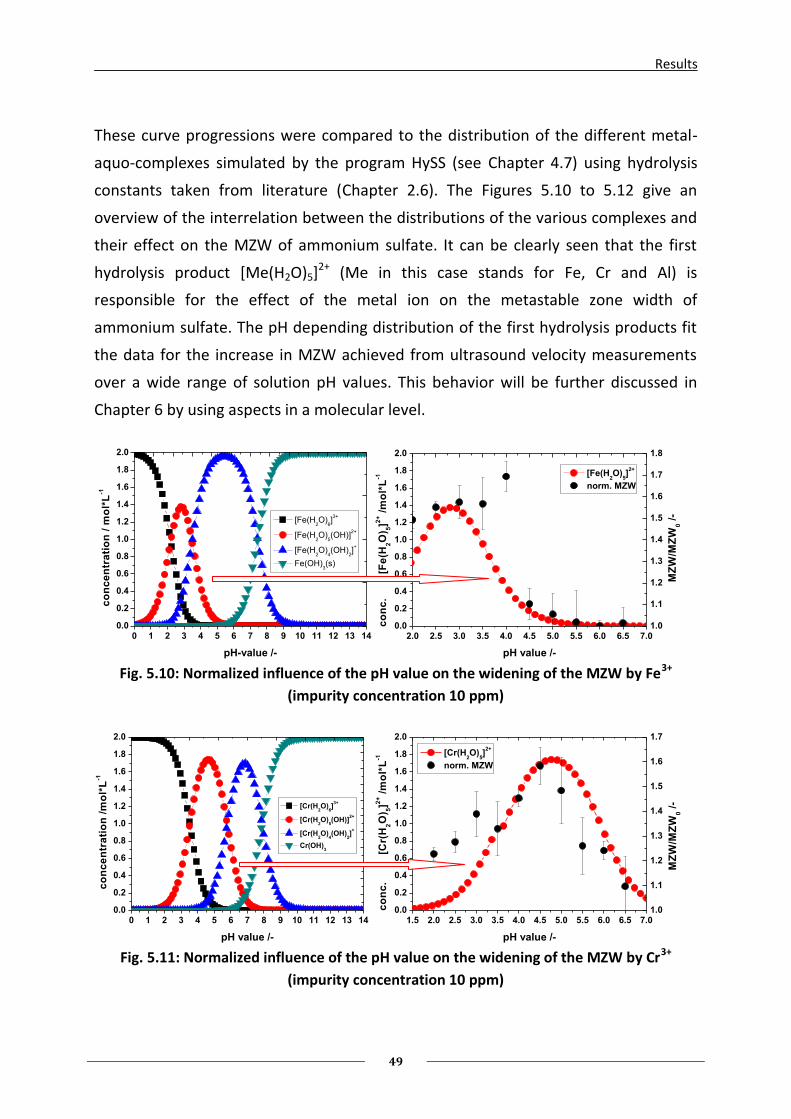
Results
49
These curve progressions were compared to the distribution of the different metal-
aquo-complexes simulated by the program HySS (see Chapter 4.7) using hydrolysis
constants taken from literature (Chapter 2.6). The Figures 5.10 to 5.12 give an
overview of the interrelation between the distributions of the various complexes and
their effect on the MZW of ammonium sulfate. It can be clearly seen that the first
hydrolysis product [Me(H2O)5]2+ (Me in this case stands for Fe, Cr and Al) is
responsible for the effect of the metal ion on the metastable zone width of
ammonium sulfate. The pH depending distribution of the first hydrolysis products fit
the data for the increase in MZW achieved from ultrasound velocity measurements
over a wide range of solution pH values. This behavior will be further discussed in
Chapter 6 by using aspects in a molecular level.
0 1 2 3 4 5 6 7 8 9 10 11 12 13 140.0
0.2
0.4
0.6
0.8
1.0
1.2
1.4
1.6
1.8
2.0
[Fe(H2O)
6]3+
[Fe(H2O)
5(OH)]
2+
[Fe(H2O)
4(OH)
2]+
Fe(OH)3(s)
co
nc
en
tra
tio
n /
mo
l*L
-1
pH-value /-
2.0 2.5 3.0 3.5 4.0 4.5 5.0 5.5 6.0 6.5 7.00.0
0.2
0.4
0.6
0.8
1.0
1.2
1.4
1.6
1.8
2.0
MZ
W/M
ZW
0 /
-
[Fe(H2O)
5]
2+
co
nc
.
[F
e(H
2O
) 5]2
+ /
mo
l*L
-1
pH value /-
1.0
1.1
1.2
1.3
1.4
1.5
1.6
1.7
1.8
norm. MZW
Fig. 5.10: Normalized influence of the pH value on the widening of the MZW by Fe3+
(impurity concentration 10 ppm)
0 1 2 3 4 5 6 7 8 9 10 11 12 13 140.0
0.2
0.4
0.6
0.8
1.0
1.2
1.4
1.6
1.8
2.0
[Cr(H2O)
6]3+
[Cr(H2O)
5(OH)]
2+
[Cr(H2O)
4(OH)
2]+
Cr(OH)3
co
nc
en
tra
tio
n /
mo
l*L
-1
pH value /-
1.5 2.0 2.5 3.0 3.5 4.0 4.5 5.0 5.5 6.0 6.5 7.00.0
0.2
0.4
0.6
0.8
1.0
1.2
1.4
1.6
1.8
2.0
MZ
W/M
ZW
0 /
-
[Cr(H2O)
5]
2+
co
nc
.
[C
r(H
2O
) 5]2
+ /
mo
l*L
-1
pH value /-
1.0
1.1
1.2
1.3
1.4
1.5
1.6
1.7
norm. MZW
Fig. 5.11: Normalized influence of the pH value on the widening of the MZW by Cr3+
(impurity concentration 10 ppm)
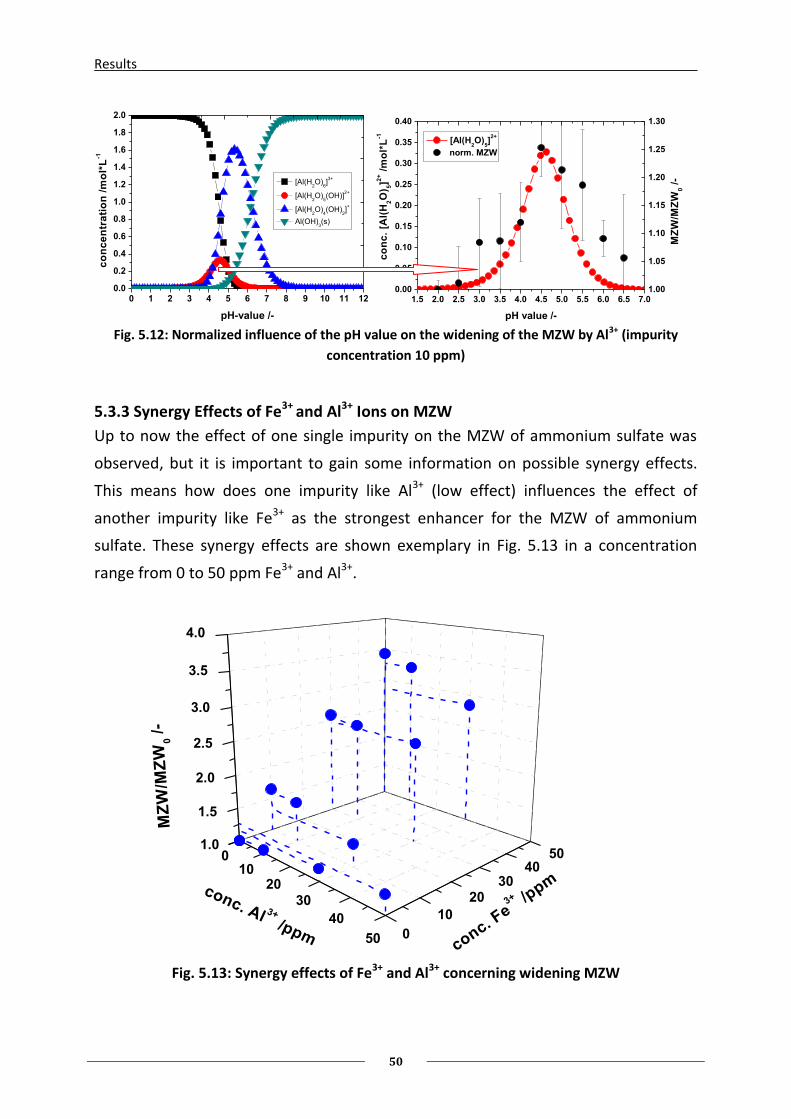
Results
50
0 1 2 3 4 5 6 7 8 9 10 11 120.0
0.2
0.4
0.6
0.8
1.0
1.2
1.4
1.6
1.8
2.0
[Al(H2O)
6]3+
[Al(H2O)
5(OH)]
2+
[Al(H2O)
4(OH)
2]+
Al(OH)3(s)
co
nc
en
tra
tio
n /
mo
l*L
-1
pH-value /-
1.5 2.0 2.5 3.0 3.5 4.0 4.5 5.0 5.5 6.0 6.5 7.00.00
0.05
0.10
0.15
0.20
0.25
0.30
0.35
0.40
MZ
W/M
ZW
0 /
-
[Al(H2O)
5]
2+
co
nc
. [A
l(H
2O
) 5]2
+ /
mo
l*L
-1
pH value /-
1.00
1.05
1.10
1.15
1.20
1.25
1.30
norm. MZW
Fig. 5.12: Normalized influence of the pH value on the widening of the MZW by Al3+ (impurity
concentration 10 ppm)
5.3.3 Synergy Effects of Fe3+ and Al3+ Ions on MZW
Up to now the effect of one single impurity on the MZW of ammonium sulfate was
observed, but it is important to gain some information on possible synergy effects.
This means how does one impurity like Al3+ (low effect) influences the effect of
another impurity like Fe3+ as the strongest enhancer for the MZW of ammonium
sulfate. These synergy effects are shown exemplary in Fig. 5.13 in a concentration
range from 0 to 50 ppm Fe3+ and Al3+.
010
2030
40
50
1.0
1.5
2.0
2.5
3.0
3.5
4.0
0
10
2030
4050
MZ
W/M
ZW
0 /
-
conc. Fe3+ /p
pmconc. Al 3+ /ppm
Fig. 5.13: Synergy effects of Fe3+ and Al3+ concerning widening MZW
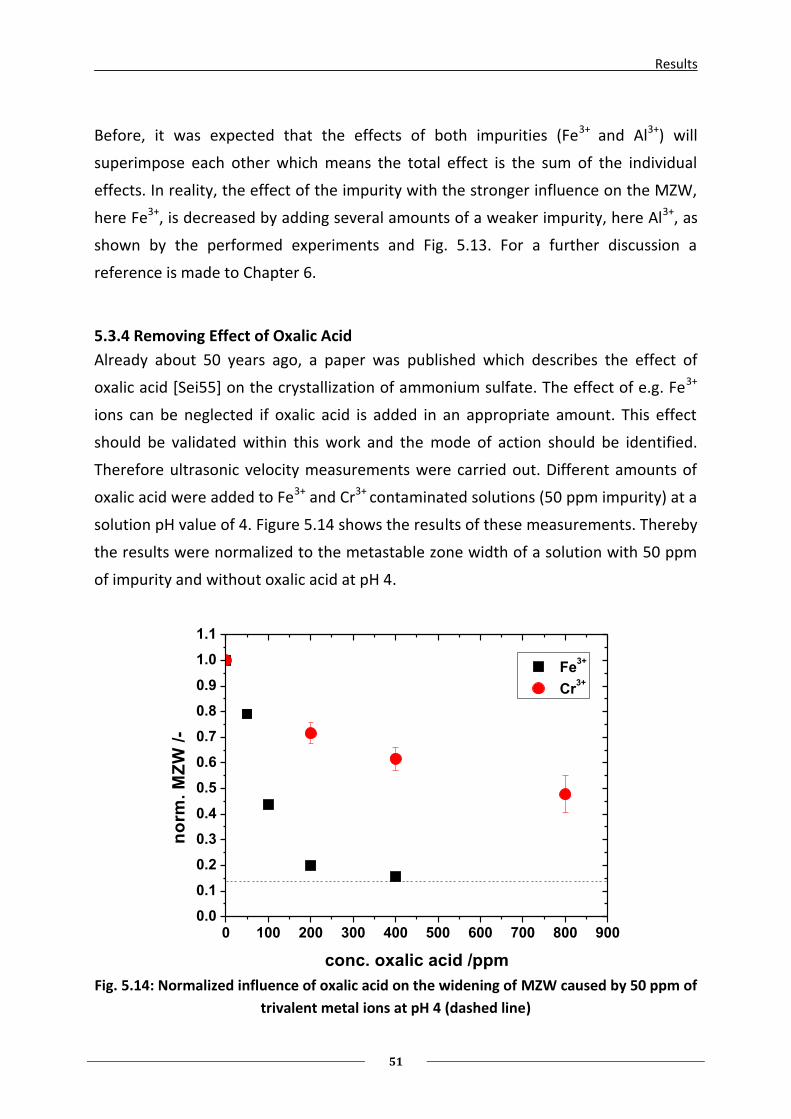
Results
51
Before, it was expected that the effects of both impurities (Fe3+ and Al3+) will
superimpose each other which means the total effect is the sum of the individual
effects. In reality, the effect of the impurity with the stronger influence on the MZW,
here Fe3+, is decreased by adding several amounts of a weaker impurity, here Al3+, as
shown by the performed experiments and Fig. 5.13. For a further discussion a
reference is made to Chapter 6.
5.3.4 Removing Effect of Oxalic Acid
Already about 50 years ago, a paper was published which describes the effect of
oxalic acid [Sei55] on the crystallization of ammonium sulfate. The effect of e.g. Fe3+
ions can be neglected if oxalic acid is added in an appropriate amount. This effect
should be validated within this work and the mode of action should be identified.
Therefore ultrasonic velocity measurements were carried out. Different amounts of
oxalic acid were added to Fe3+ and Cr3+ contaminated solutions (50 ppm impurity) at a
solution pH value of 4. Figure 5.14 shows the results of these measurements. Thereby
the results were normalized to the metastable zone width of a solution with 50 ppm
of impurity and without oxalic acid at pH 4.
0 100 200 300 400 500 600 700 800 9000.0
0.1
0.2
0.3
0.4
0.5
0.6
0.7
0.8
0.9
1.0
1.1
Fe3+
Cr3+
no
rm.
MZ
W /
-
conc. oxalic acid /ppm Fig. 5.14: Normalized influence of oxalic acid on the widening of MZW caused by 50 ppm of
trivalent metal ions at pH 4 (dashed line)
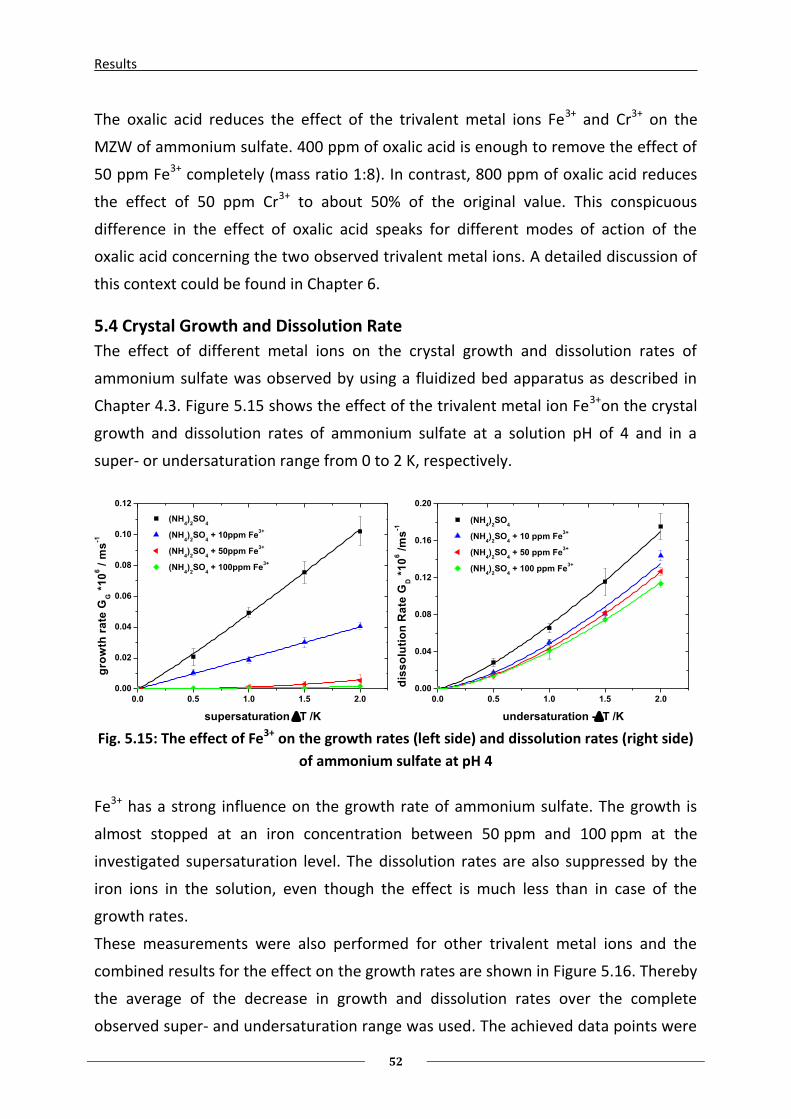
Results
52
The oxalic acid reduces the effect of the trivalent metal ions Fe3+ and Cr3+ on the
MZW of ammonium sulfate. 400 ppm of oxalic acid is enough to remove the effect of
50 ppm Fe3+ completely (mass ratio 1:8). In contrast, 800 ppm of oxalic acid reduces
the effect of 50 ppm Cr3+ to about 50% of the original value. This conspicuous
difference in the effect of oxalic acid speaks for different modes of action of the
oxalic acid concerning the two observed trivalent metal ions. A detailed discussion of
this context could be found in Chapter 6.
5.4 Crystal Growth and Dissolution Rate
The effect of different metal ions on the crystal growth and dissolution rates of
ammonium sulfate was observed by using a fluidized bed apparatus as described in
Chapter 4.3. Figure 5.15 shows the effect of the trivalent metal ion Fe3+on the crystal
growth and dissolution rates of ammonium sulfate at a solution pH of 4 and in a
super- or undersaturation range from 0 to 2 K, respectively.
0.0 0.5 1.0 1.5 2.0
0.00
0.02
0.04
0.06
0.08
0.10
0.12
(NH4)
2SO
4
(NH4)
2SO
4 + 10ppm Fe
3+
(NH4)
2SO
4 + 50ppm Fe
3+
(NH4)
2SO
4 + 100ppm Fe
3+
gro
wth
ra
te G
G *
10
6 /
ms
-1
supersaturation T /K
0.0 0.5 1.0 1.5 2.0
0.00
0.04
0.08
0.12
0.16
0.20
(NH4)
2SO
4
(NH4)
2SO
4 + 10 ppm Fe
3+
(NH4)
2SO
4 + 50 ppm Fe
3+
(NH4)
2SO
4 + 100 ppm Fe
3+
dis
so
luti
on
Ra
te G
D *
10
6 /
ms
-1
undersaturation -T /K Fig. 5.15: The effect of Fe3+ on the growth rates (left side) and dissolution rates (right side)
of ammonium sulfate at pH 4
Fe3+ has a strong influence on the growth rate of ammonium sulfate. The growth is
almost stopped at an iron concentration between 50 ppm and 100 ppm at the
investigated supersaturation level. The dissolution rates are also suppressed by the
iron ions in the solution, even though the effect is much less than in case of the
growth rates.
These measurements were also performed for other trivalent metal ions and the
combined results for the effect on the growth rates are shown in Figure 5.16. Thereby
the average of the decrease in growth and dissolution rates over the complete
observed super- and undersaturation range was used. The achieved data points were
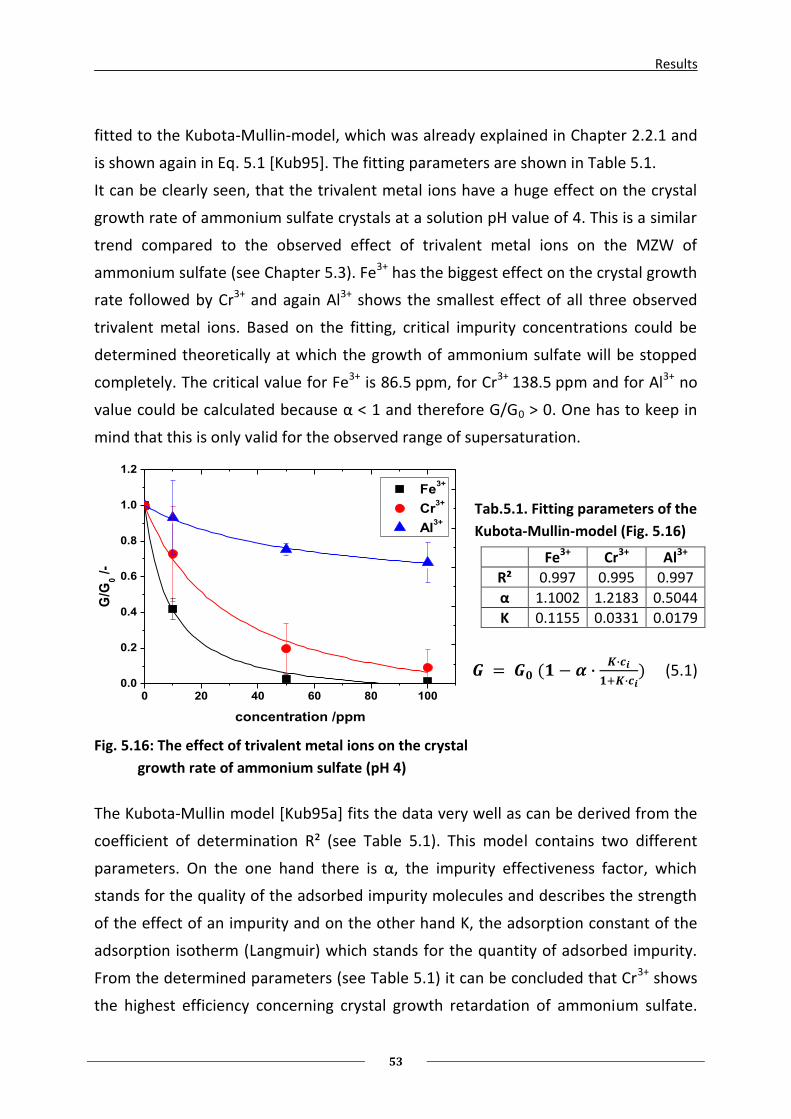
Results
53
0 20 40 60 80 1000.0
0.2
0.4
0.6
0.8
1.0
1.2
Fe3+
Cr3+
Al3+
G/G
0 /
-
concentration /ppm
fitted to the Kubota-Mullin-model, which was already explained in Chapter 2.2.1 and
is shown again in Eq. 5.1 [Kub95]. The fitting parameters are shown in Table 5.1.
It can be clearly seen, that the trivalent metal ions have a huge effect on the crystal
growth rate of ammonium sulfate crystals at a solution pH value of 4. This is a similar
trend compared to the observed effect of trivalent metal ions on the MZW of
ammonium sulfate (see Chapter 5.3). Fe3+ has the biggest effect on the crystal growth
rate followed by Cr3+ and again Al3+ shows the smallest effect of all three observed
trivalent metal ions. Based on the fitting, critical impurity concentrations could be
determined theoretically at which the growth of ammonium sulfate will be stopped
completely. The critical value for Fe3+ is 86.5 ppm, for Cr3+ 138.5 ppm and for Al3+ no
value could be calculated because α < 1 and therefore G/G0 > 0. One has to keep in
mind that this is only valid for the observed range of supersaturation.
Tab.5.1. Fitting parameters of the
Kubota-Mullin-model (Fig. 5.16)
(5.1)
Fig. 5.16: The effect of trivalent metal ions on the crystal
growth rate of ammonium sulfate (pH 4)
The Kubota-Mullin model [Kub95a] fits the data very well as can be derived from the
coefficient of determination R² (see Table 5.1). This model contains two different
parameters. On the one hand there is α, the impurity effectiveness factor, which
stands for the quality of the adsorbed impurity molecules and describes the strength
of the effect of an impurity and on the other hand K, the adsorption constant of the
adsorption isotherm (Langmuir) which stands for the quantity of adsorbed impurity.
From the determined parameters (see Table 5.1) it can be concluded that Cr3+ shows
the highest efficiency concerning crystal growth retardation of ammonium sulfate.
Fe3+ Cr3+ Al3+
R² 0.997 0.995 0.997
α 1.1002 1.2183 0.5044
K 0.1155 0.0331 0.0179
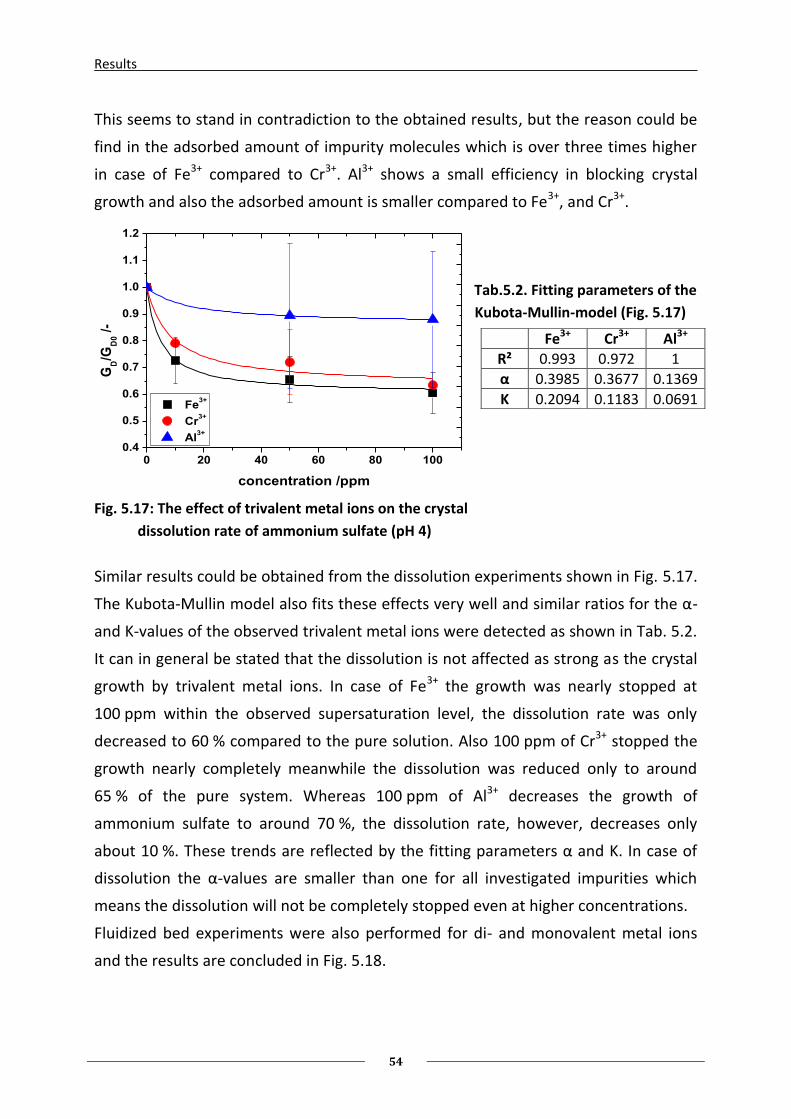
Results
54
0 20 40 60 80 1000.4
0.5
0.6
0.7
0.8
0.9
1.0
1.1
1.2
Fe3+
Cr3+
Al3+
GD/G
D0 /
-
concentration /ppm
This seems to stand in contradiction to the obtained results, but the reason could be
find in the adsorbed amount of impurity molecules which is over three times higher
in case of Fe3+ compared to Cr3+. Al3+ shows a small efficiency in blocking crystal
growth and also the adsorbed amount is smaller compared to Fe3+, and Cr3+.
Tab.5.2. Fitting parameters of the
Kubota-Mullin-model (Fig. 5.17)
Fig. 5.17: The effect of trivalent metal ions on the crystal
dissolution rate of ammonium sulfate (pH 4)
Similar results could be obtained from the dissolution experiments shown in Fig. 5.17.
The Kubota-Mullin model also fits these effects very well and similar ratios for the α-
and K-values of the observed trivalent metal ions were detected as shown in Tab. 5.2.
It can in general be stated that the dissolution is not affected as strong as the crystal
growth by trivalent metal ions. In case of Fe3+ the growth was nearly stopped at
100 ppm within the observed supersaturation level, the dissolution rate was only
decreased to 60 % compared to the pure solution. Also 100 ppm of Cr3+ stopped the
growth nearly completely meanwhile the dissolution was reduced only to around
65 % of the pure system. Whereas 100 ppm of Al3+ decreases the growth of
ammonium sulfate to around 70 %, the dissolution rate, however, decreases only
about 10 %. These trends are reflected by the fitting parameters α and K. In case of
dissolution the α-values are smaller than one for all investigated impurities which
means the dissolution will not be completely stopped even at higher concentrations.
Fluidized bed experiments were also performed for di- and monovalent metal ions
and the results are concluded in Fig. 5.18.
Fe3+ Cr3+ Al3+
R² 0.993 0.972 1
α 0.3985 0.3677 0.1369
K 0.2094 0.1183 0.0691
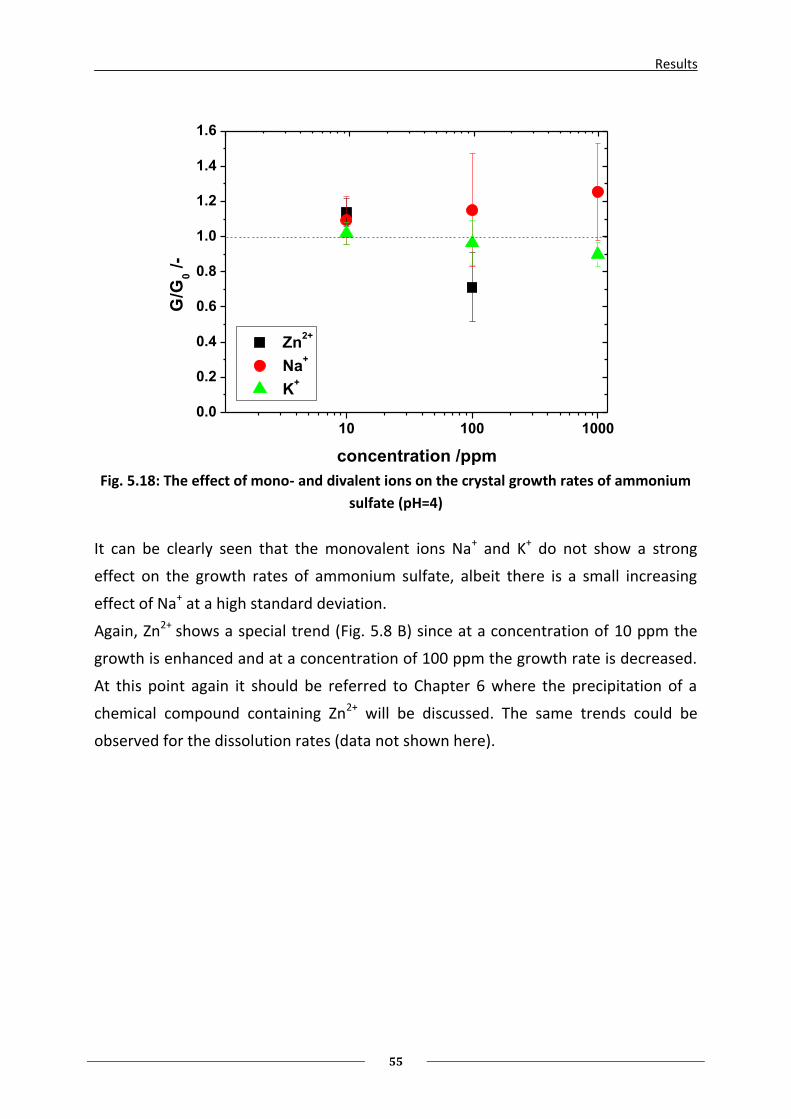
Results
55
10 100 10000.0
0.2
0.4
0.6
0.8
1.0
1.2
1.4
1.6
Zn2+
Na+
K+
G/G
0 /
-
concentration /ppm Fig. 5.18: The effect of mono- and divalent ions on the crystal growth rates of ammonium
sulfate (pH=4)
It can be clearly seen that the monovalent ions Na+ and K+ do not show a strong
effect on the growth rates of ammonium sulfate, albeit there is a small increasing
effect of Na+ at a high standard deviation.
Again, Zn2+ shows a special trend (Fig. 5.8 B) since at a concentration of 10 ppm the
growth is enhanced and at a concentration of 100 ppm the growth rate is decreased.
At this point again it should be referred to Chapter 6 where the precipitation of a
chemical compound containing Zn2+ will be discussed. The same trends could be
observed for the dissolution rates (data not shown here).
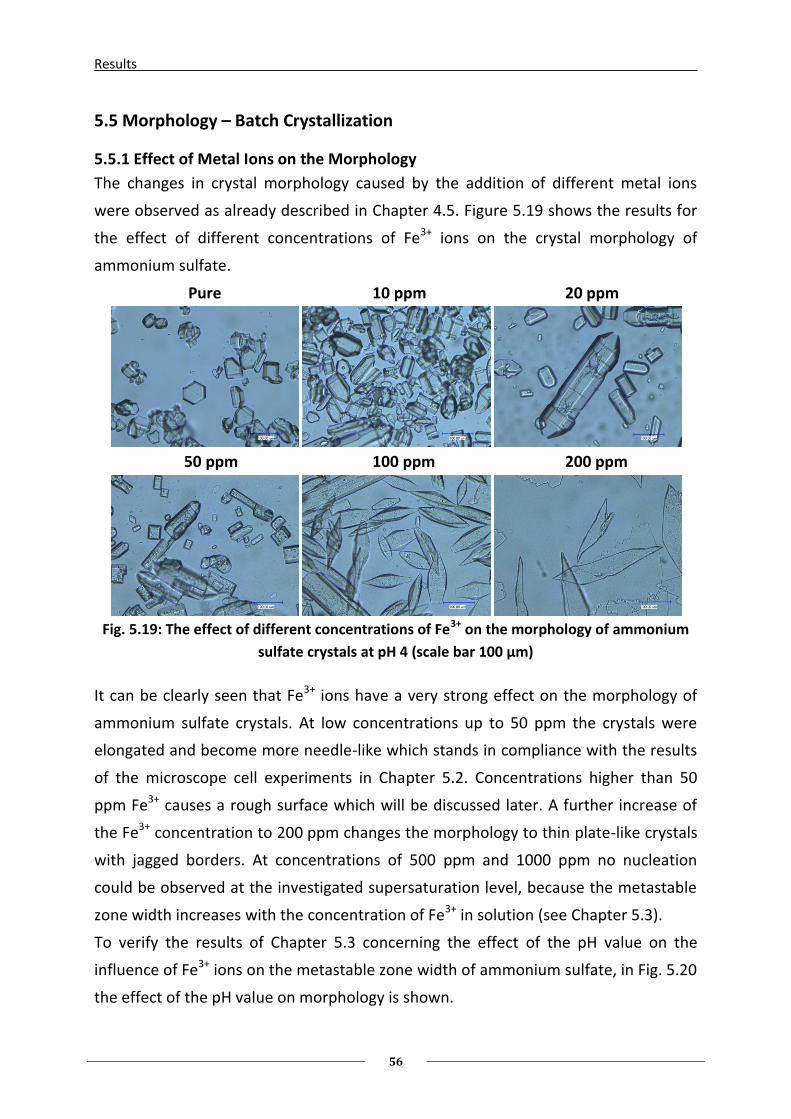
Results
56
5.5 Morphology – Batch Crystallization
5.5.1 Effect of Metal Ions on the Morphology
The changes in crystal morphology caused by the addition of different metal ions
were observed as already described in Chapter 4.5. Figure 5.19 shows the results for
the effect of different concentrations of Fe3+ ions on the crystal morphology of
ammonium sulfate.
Pure 10 ppm 20 ppm
50 ppm 100 ppm 200 ppm
Fig. 5.19: The effect of different concentrations of Fe3+ on the morphology of ammonium
sulfate crystals at pH 4 (scale bar 100 µm)
It can be clearly seen that Fe3+ ions have a very strong effect on the morphology of
ammonium sulfate crystals. At low concentrations up to 50 ppm the crystals were
elongated and become more needle-like which stands in compliance with the results
of the microscope cell experiments in Chapter 5.2. Concentrations higher than 50
ppm Fe3+ causes a rough surface which will be discussed later. A further increase of
the Fe3+ concentration to 200 ppm changes the morphology to thin plate-like crystals
with jagged borders. At concentrations of 500 ppm and 1000 ppm no nucleation
could be observed at the investigated supersaturation level, because the metastable
zone width increases with the concentration of Fe3+ in solution (see Chapter 5.3).
To verify the results of Chapter 5.3 concerning the effect of the pH value on the
influence of Fe3+ ions on the metastable zone width of ammonium sulfate, in Fig. 5.20
the effect of the pH value on morphology is shown.
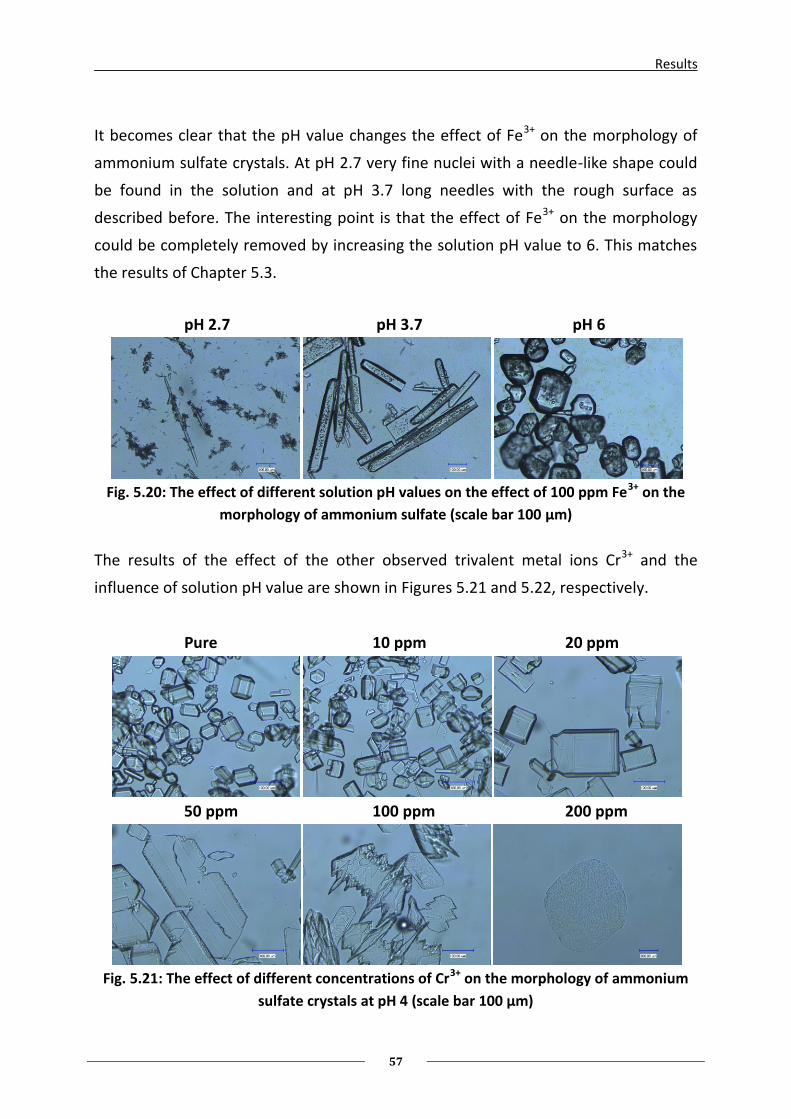
Results
57
It becomes clear that the pH value changes the effect of Fe3+ on the morphology of
ammonium sulfate crystals. At pH 2.7 very fine nuclei with a needle-like shape could
be found in the solution and at pH 3.7 long needles with the rough surface as
described before. The interesting point is that the effect of Fe3+ on the morphology
could be completely removed by increasing the solution pH value to 6. This matches
the results of Chapter 5.3.
pH 2.7 pH 3.7 pH 6
Fig. 5.20: The effect of different solution pH values on the effect of 100 ppm Fe3+ on the
morphology of ammonium sulfate (scale bar 100 µm)
The results of the effect of the other observed trivalent metal ions Cr3+ and the
influence of solution pH value are shown in Figures 5.21 and 5.22, respectively.
Pure 10 ppm 20 ppm
50 ppm 100 ppm 200 ppm
Fig. 5.21: The effect of different concentrations of Cr3+ on the morphology of ammonium
sulfate crystals at pH 4 (scale bar 100 µm)
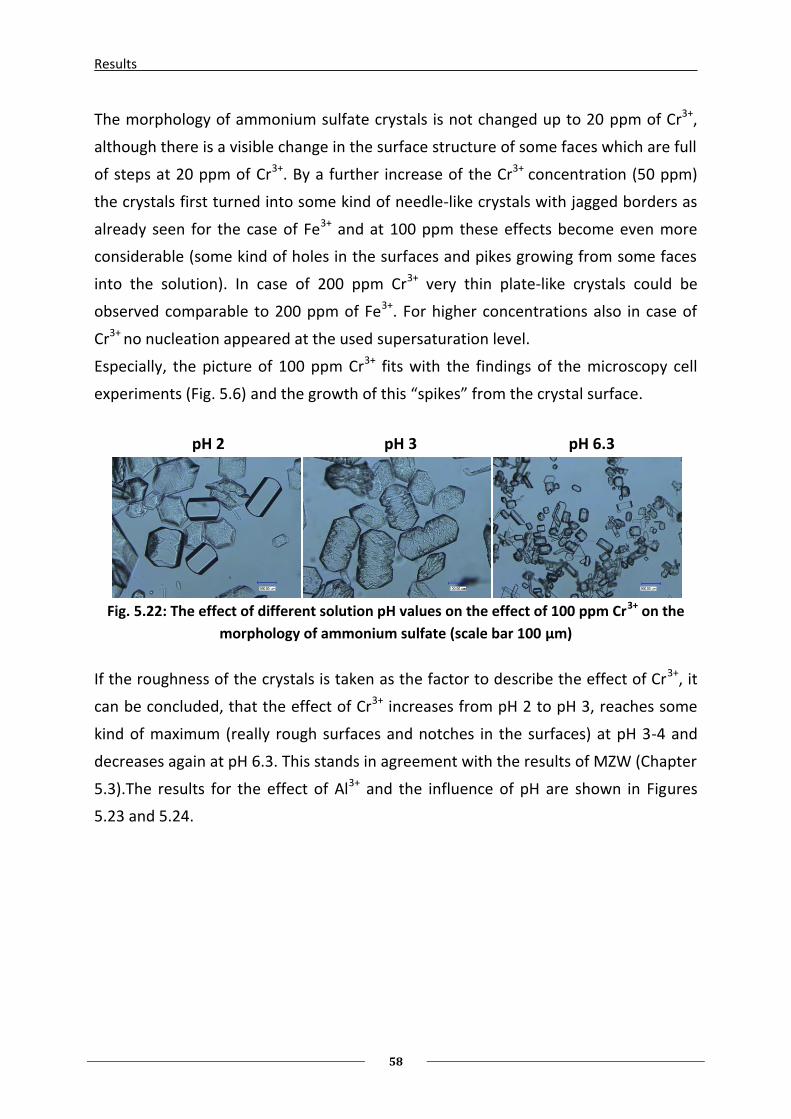
Results
58
The morphology of ammonium sulfate crystals is not changed up to 20 ppm of Cr3+,
although there is a visible change in the surface structure of some faces which are full
of steps at 20 ppm of Cr3+. By a further increase of the Cr3+ concentration (50 ppm)
the crystals first turned into some kind of needle-like crystals with jagged borders as
already seen for the case of Fe3+ and at 100 ppm these effects become even more
considerable (some kind of holes in the surfaces and pikes growing from some faces
into the solution). In case of 200 ppm Cr3+ very thin plate-like crystals could be
observed comparable to 200 ppm of Fe3+. For higher concentrations also in case of
Cr3+ no nucleation appeared at the used supersaturation level.
Especially, the picture of 100 ppm Cr3+ fits with the findings of the microscopy cell
experiments (Fig. 5.6) and the growth of this “spikes” from the crystal surface.
pH 2 pH 3 pH 6.3
Fig. 5.22: The effect of different solution pH values on the effect of 100 ppm Cr3+ on the
morphology of ammonium sulfate (scale bar 100 µm)
If the roughness of the crystals is taken as the factor to describe the effect of Cr3+, it
can be concluded, that the effect of Cr3+ increases from pH 2 to pH 3, reaches some
kind of maximum (really rough surfaces and notches in the surfaces) at pH 3-4 and
decreases again at pH 6.3. This stands in agreement with the results of MZW (Chapter
5.3).The results for the effect of Al3+ and the influence of pH are shown in Figures
5.23 and 5.24.
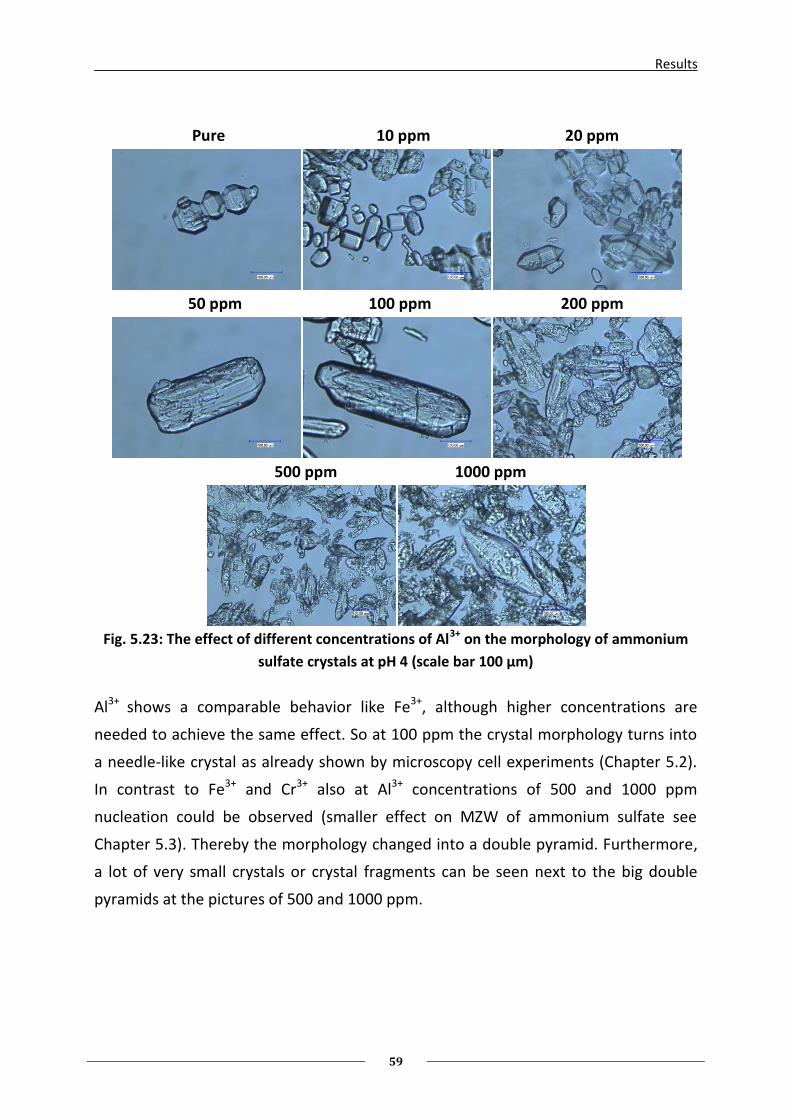
Results
59
Pure 10 ppm 20 ppm
50 ppm 100 ppm 200 ppm
500 ppm 1000 ppm
Fig. 5.23: The effect of different concentrations of Al3+ on the morphology of ammonium
sulfate crystals at pH 4 (scale bar 100 µm)
Al3+ shows a comparable behavior like Fe3+, although higher concentrations are
needed to achieve the same effect. So at 100 ppm the crystal morphology turns into
a needle-like crystal as already shown by microscopy cell experiments (Chapter 5.2).
In contrast to Fe3+ and Cr3+ also at Al3+ concentrations of 500 and 1000 ppm
nucleation could be observed (smaller effect on MZW of ammonium sulfate see
Chapter 5.3). Thereby the morphology changed into a double pyramid. Furthermore,
a lot of very small crystals or crystal fragments can be seen next to the big double
pyramids at the pictures of 500 and 1000 ppm.
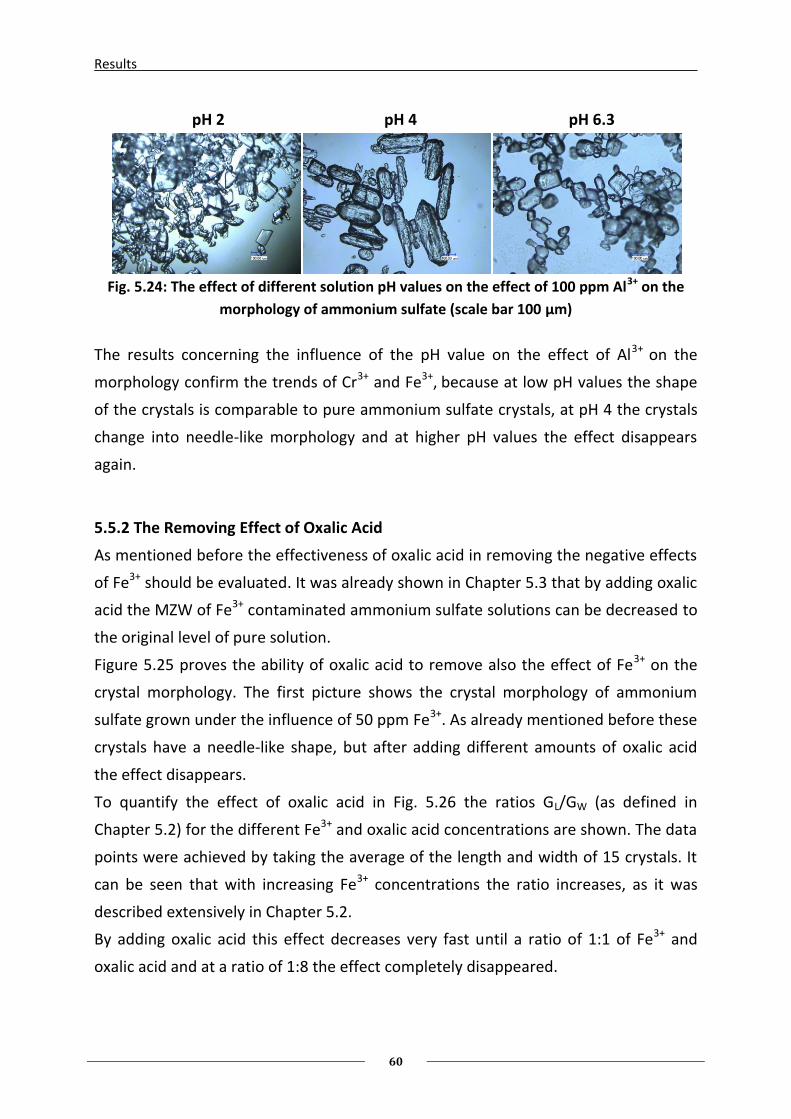
Results
60
pH 2 pH 4 pH 6.3
Fig. 5.24: The effect of different solution pH values on the effect of 100 ppm Al3+ on the
morphology of ammonium sulfate (scale bar 100 µm)
The results concerning the influence of the pH value on the effect of Al3+ on the
morphology confirm the trends of Cr3+ and Fe3+, because at low pH values the shape
of the crystals is comparable to pure ammonium sulfate crystals, at pH 4 the crystals
change into needle-like morphology and at higher pH values the effect disappears
again.
5.5.2 The Removing Effect of Oxalic Acid
As mentioned before the effectiveness of oxalic acid in removing the negative effects
of Fe3+ should be evaluated. It was already shown in Chapter 5.3 that by adding oxalic
acid the MZW of Fe3+ contaminated ammonium sulfate solutions can be decreased to
the original level of pure solution.
Figure 5.25 proves the ability of oxalic acid to remove also the effect of Fe3+ on the
crystal morphology. The first picture shows the crystal morphology of ammonium
sulfate grown under the influence of 50 ppm Fe3+. As already mentioned before these
crystals have a needle-like shape, but after adding different amounts of oxalic acid
the effect disappears.
To quantify the effect of oxalic acid in Fig. 5.26 the ratios GL/GW (as defined in
Chapter 5.2) for the different Fe3+ and oxalic acid concentrations are shown. The data
points were achieved by taking the average of the length and width of 15 crystals. It
can be seen that with increasing Fe3+ concentrations the ratio increases, as it was
described extensively in Chapter 5.2.
By adding oxalic acid this effect decreases very fast until a ratio of 1:1 of Fe3+ and
oxalic acid and at a ratio of 1:8 the effect completely disappeared.
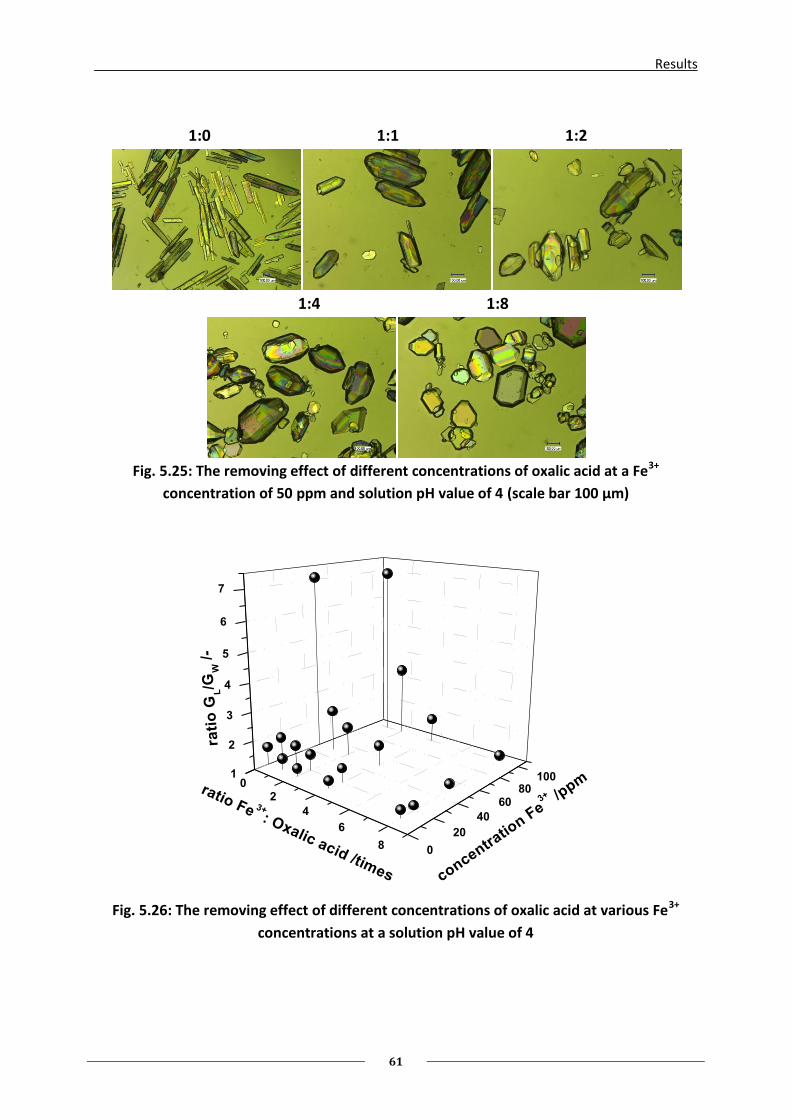
Results
61
1:0 1:1 1:2
1:4 1:8
Fig. 5.25: The removing effect of different concentrations of oxalic acid at a Fe3+
concentration of 50 ppm and solution pH value of 4 (scale bar 100 µm)
02
4
6
8
1
2
3
4
5
6
7
0
20
40
6080
100
rati
o G
L/G
W /
-
concentratio
n Fe3+ /p
pmratio Fe 3+: Oxalic acid /times
Fig. 5.26: The removing effect of different concentrations of oxalic acid at various Fe3+
concentrations at a solution pH value of 4
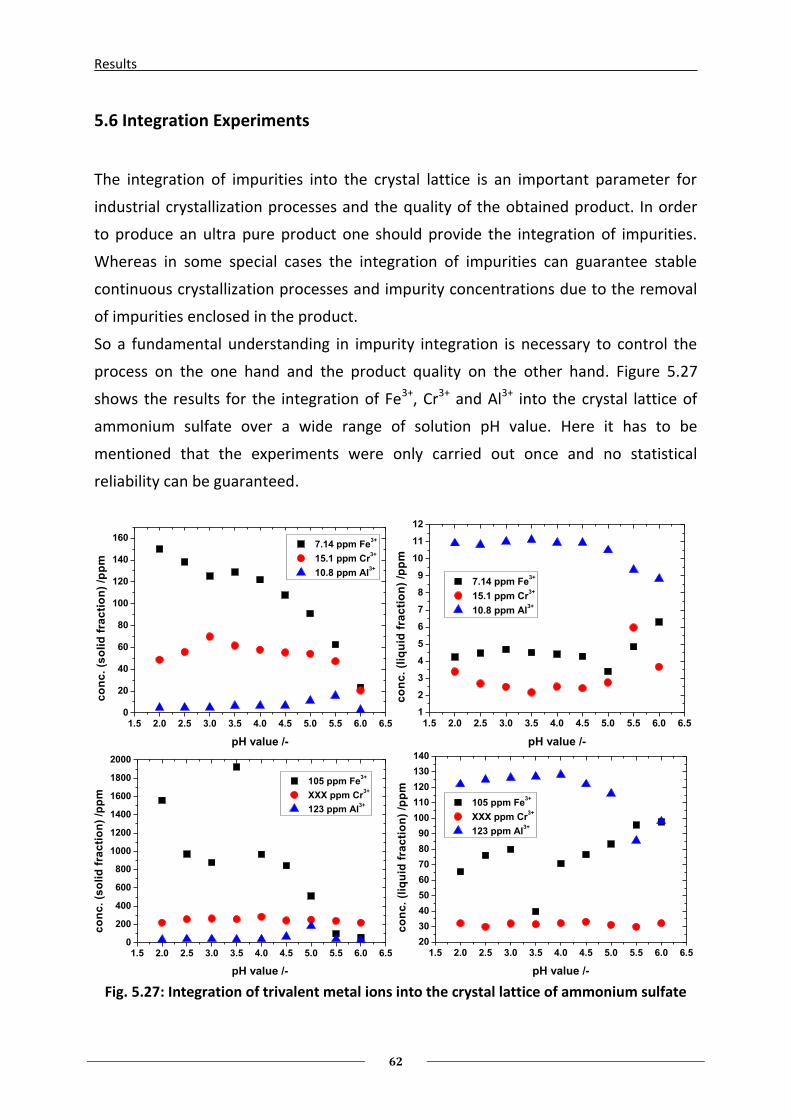
Results
62
5.6 Integration Experiments
The integration of impurities into the crystal lattice is an important parameter for
industrial crystallization processes and the quality of the obtained product. In order
to produce an ultra pure product one should provide the integration of impurities.
Whereas in some special cases the integration of impurities can guarantee stable
continuous crystallization processes and impurity concentrations due to the removal
of impurities enclosed in the product.
So a fundamental understanding in impurity integration is necessary to control the
process on the one hand and the product quality on the other hand. Figure 5.27
shows the results for the integration of Fe3+, Cr3+ and Al3+ into the crystal lattice of
ammonium sulfate over a wide range of solution pH value. Here it has to be
mentioned that the experiments were only carried out once and no statistical
reliability can be guaranteed.
1.5 2.0 2.5 3.0 3.5 4.0 4.5 5.0 5.5 6.0 6.50
20
40
60
80
100
120
140
160 7.14 ppm Fe
3+
15.1 ppm Cr3+
10.8 ppm Al3+
co
nc
. (s
oli
d f
rac
tio
n)
/pp
m
pH value /-
1.5 2.0 2.5 3.0 3.5 4.0 4.5 5.0 5.5 6.0 6.51
2
3
4
5
6
7
8
9
10
11
12
7.14 ppm Fe3+
15.1 ppm Cr3+
10.8 ppm Al3+
co
nc
. (l
iqu
id f
rac
tio
n)
/pp
m
pH value /-
1.5 2.0 2.5 3.0 3.5 4.0 4.5 5.0 5.5 6.0 6.50
200
400
600
800
1000
1200
1400
1600
1800
2000
105 ppm Fe3+
XXX ppm Cr3+
123 ppm Al3+
co
nc
. (s
oli
d f
rac
tio
n)
/pp
m
pH value /-
1.5 2.0 2.5 3.0 3.5 4.0 4.5 5.0 5.5 6.0 6.520
30
40
50
60
70
80
90
100
110
120
130
140
105 ppm Fe3+
XXX ppm Cr3+
123 ppm Al3+
co
nc
. (l
iqu
id f
rac
tio
n)
/pp
m
pH value /- Fig. 5.27: Integration of trivalent metal ions into the crystal lattice of ammonium sulfate
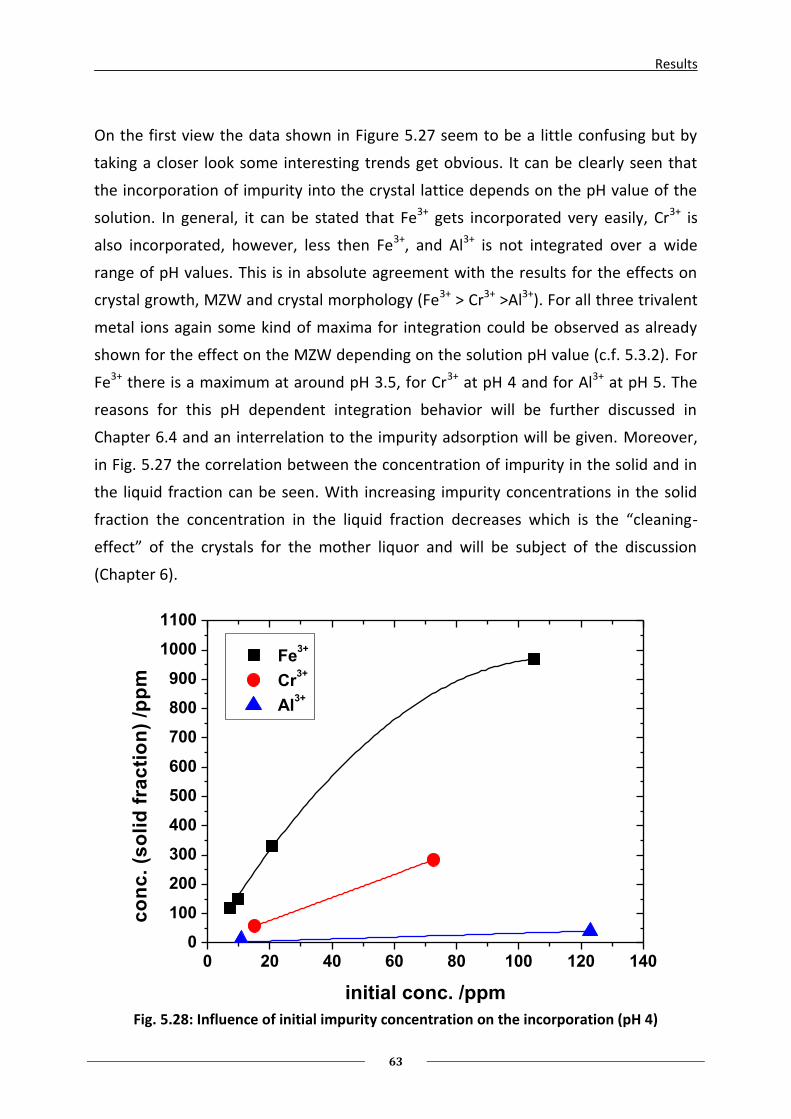
Results
63
On the first view the data shown in Figure 5.27 seem to be a little confusing but by
taking a closer look some interesting trends get obvious. It can be clearly seen that
the incorporation of impurity into the crystal lattice depends on the pH value of the
solution. In general, it can be stated that Fe3+ gets incorporated very easily, Cr3+ is
also incorporated, however, less then Fe3+, and Al3+ is not integrated over a wide
range of pH values. This is in absolute agreement with the results for the effects on
crystal growth, MZW and crystal morphology (Fe3+ > Cr3+ >Al3+). For all three trivalent
metal ions again some kind of maxima for integration could be observed as already
shown for the effect on the MZW depending on the solution pH value (c.f. 5.3.2). For
Fe3+ there is a maximum at around pH 3.5, for Cr3+ at pH 4 and for Al3+ at pH 5. The
reasons for this pH dependent integration behavior will be further discussed in
Chapter 6.4 and an interrelation to the impurity adsorption will be given. Moreover,
in Fig. 5.27 the correlation between the concentration of impurity in the solid and in
the liquid fraction can be seen. With increasing impurity concentrations in the solid
fraction the concentration in the liquid fraction decreases which is the “cleaning-
effect” of the crystals for the mother liquor and will be subject of the discussion
(Chapter 6).
0 20 40 60 80 100 120 1400
100
200
300
400
500
600
700
800
900
1000
1100
Fe3+
Cr3+
Al3+
co
nc
. (s
oli
d f
rac
tio
n)
/pp
m
initial conc. /ppm Fig. 5.28: Influence of initial impurity concentration on the incorporation (pH 4)
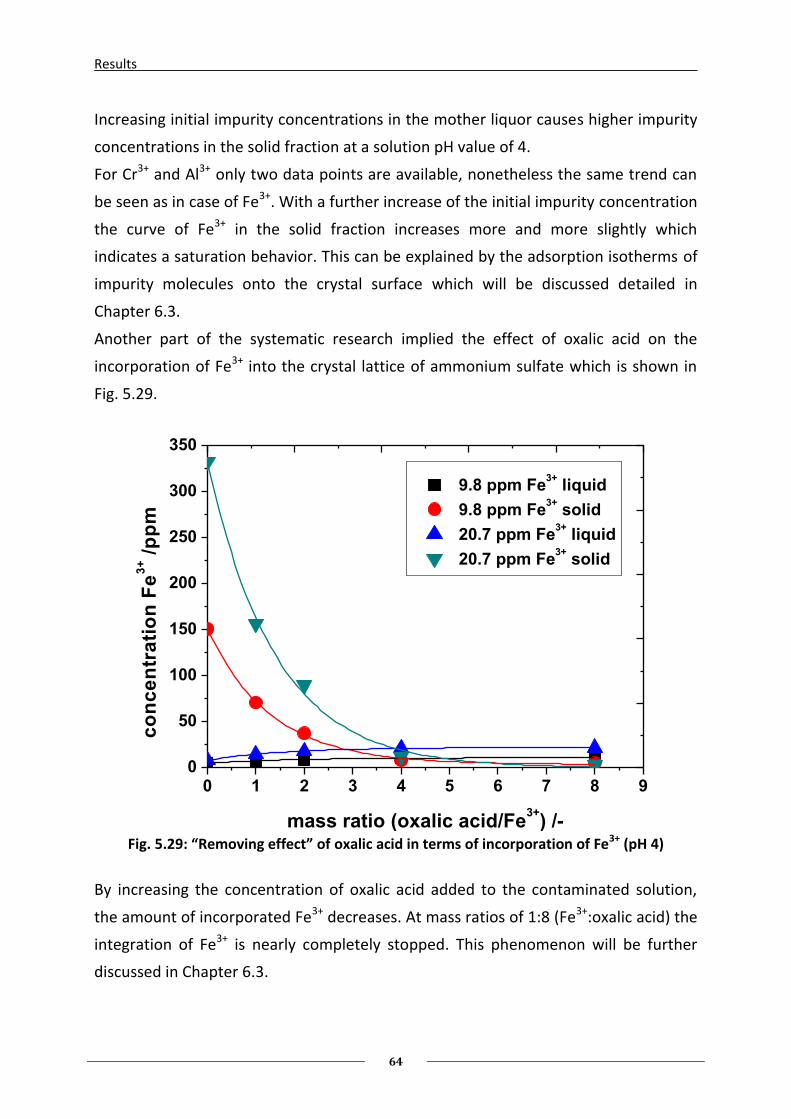
Results
64
Increasing initial impurity concentrations in the mother liquor causes higher impurity
concentrations in the solid fraction at a solution pH value of 4.
For Cr3+ and Al3+ only two data points are available, nonetheless the same trend can
be seen as in case of Fe3+. With a further increase of the initial impurity concentration
the curve of Fe3+ in the solid fraction increases more and more slightly which
indicates a saturation behavior. This can be explained by the adsorption isotherms of
impurity molecules onto the crystal surface which will be discussed detailed in
Chapter 6.3.
Another part of the systematic research implied the effect of oxalic acid on the
incorporation of Fe3+ into the crystal lattice of ammonium sulfate which is shown in
Fig. 5.29.
0 1 2 3 4 5 6 7 8 90
50
100
150
200
250
300
350
9.8 ppm Fe3+
liquid
9.8 ppm Fe3+
solid
20.7 ppm Fe3+
liquid
20.7 ppm Fe3+
solid
co
nc
en
tra
tio
n F
e3
+ /
pp
m
mass ratio (oxalic acid/Fe3+
) /- Fig. 5.29: “Removing effect” of oxalic acid in terms of incorporation of Fe3+ (pH 4)
By increasing the concentration of oxalic acid added to the contaminated solution,
the amount of incorporated Fe3+ decreases. At mass ratios of 1:8 (Fe3+:oxalic acid) the
integration of Fe3+ is nearly completely stopped. This phenomenon will be further
discussed in Chapter 6.3.
Discussion
65
6.Discussion
In Chapter 5 the effects of different metal ions and the influence of the pH value on
the crystallization parameters growth rate, metastable zone width and crystal
morphology of ammonium sulfate were presented. Within the following discussion a
comparison to the existing literature will be made, the reasons for the observed
effects will be given and discussed, and the connection to an industrial crystallization
process of ammonium sulfate will be shown.
6.1 Impurity Adsorption and Consequences
6.1.1 Changes in Crystal Growth Rate
In Chapter 5.4 the results for the effects of different metal ions on the growth and
dissolution rates of ammonium sulfate were presented. For the pure ammonium
sulfate–water system, growth rates in a magnitude of 0.5*10-7 m/s were detected at
a undercooling of 1 K which is a relative supersaturation of 0.0035. This is in
agreement with the results of Kitamura et al. [Kit92] who observed similar growth
rates of 1*10-7 to 1.5*10-7 m/s depending on the different faces at a supersaturation
σ=0.003 (the small deviations can be contributed to a different experimental setup)
[Kit92]. For the dissolution kinetics they observed dissolution rates of 1*10-7 to 2*10-7
m/s at a relative undersaturation of 0.003 [Kit92] which is similar to the results of this
work (0.7*10-7 m/s at a relative undersaturation of 0.003). Also the shape of the
curves of growth and dissolution rates depending on relative super- or
undersaturation are comparable, since they appear as nearly linear curves which
indicates a linear relationship between driving force and growth or dissolution rates
at the observed super- or undersaturation level.
The differences between crystal growth and dissolution rates which could be
detected can be contributed to a theoretical approach which was already discussed in
Chapter 2.4.1. In case of crystal growth the growth units face an additional resistance,
namely the integration step of the growth unit into the crystal lattice. From the
difference between growth and dissolution at comparable driving forces one can
decide, if the growth is integration or diffusion controlled. If the diffusion resistance
of growth is assumed to be equal to the diffusion resistance of the dissolution, the
integration resistance could directly be calculated from the difference between
growth and dissolution rates [Gar71].
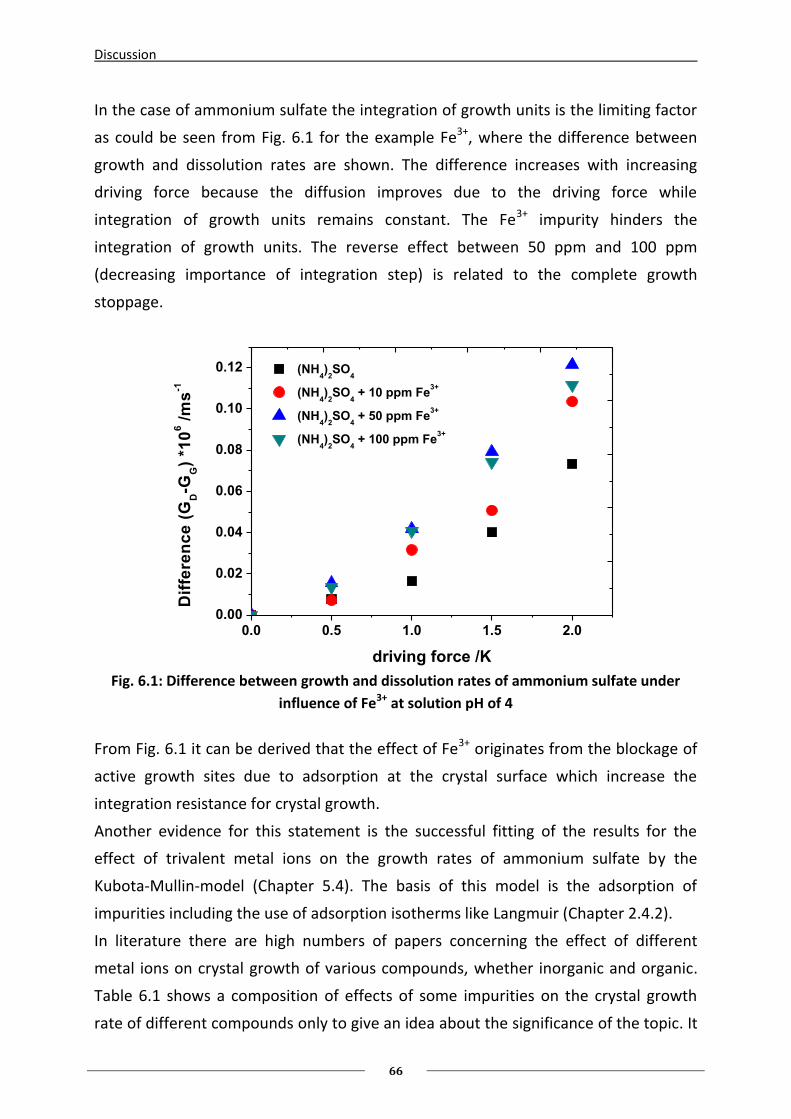
Discussion
66
In the case of ammonium sulfate the integration of growth units is the limiting factor
as could be seen from Fig. 6.1 for the example Fe3+, where the difference between
growth and dissolution rates are shown. The difference increases with increasing
driving force because the diffusion improves due to the driving force while
integration of growth units remains constant. The Fe3+ impurity hinders the
integration of growth units. The reverse effect between 50 ppm and 100 ppm
(decreasing importance of integration step) is related to the complete growth
stoppage.
0.0 0.5 1.0 1.5 2.00.00
0.02
0.04
0.06
0.08
0.10
0.12 (NH4)
2SO
4
(NH4)
2SO
4 + 10 ppm Fe
3+
(NH4)
2SO
4 + 50 ppm Fe
3+
(NH4)
2SO
4 + 100 ppm Fe
3+
Dif
fere
nc
e (
GD-G
G)
*10
6 /
ms
-1
driving force /K Fig. 6.1: Difference between growth and dissolution rates of ammonium sulfate under
influence of Fe3+ at solution pH of 4
From Fig. 6.1 it can be derived that the effect of Fe3+ originates from the blockage of
active growth sites due to adsorption at the crystal surface which increase the
integration resistance for crystal growth.
Another evidence for this statement is the successful fitting of the results for the
effect of trivalent metal ions on the growth rates of ammonium sulfate by the
Kubota-Mullin-model (Chapter 5.4). The basis of this model is the adsorption of
impurities including the use of adsorption isotherms like Langmuir (Chapter 2.4.2).
In literature there are high numbers of papers concerning the effect of different
metal ions on crystal growth of various compounds, whether inorganic and organic.
Table 6.1 shows a composition of effects of some impurities on the crystal growth
rate of different compounds only to give an idea about the significance of the topic. It
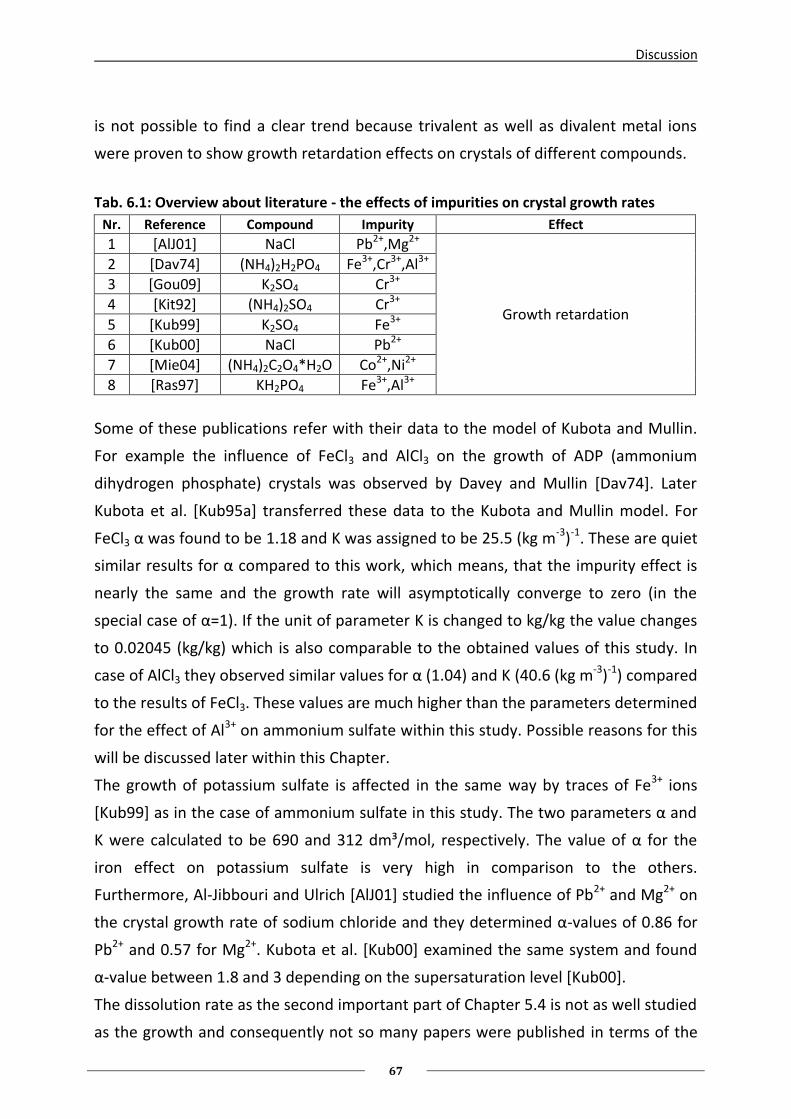
Discussion
67
is not possible to find a clear trend because trivalent as well as divalent metal ions
were proven to show growth retardation effects on crystals of different compounds.
Tab. 6.1: Overview about literature - the effects of impurities on crystal growth rates
Nr. Reference Compound Impurity Effect
1 [AlJ01] NaCl Pb2+,Mg2+
Growth retardation
2 [Dav74] (NH4)2H2PO4 Fe3+,Cr3+,Al3+
3 [Gou09] K2SO4 Cr3+
4 [Kit92] (NH4)2SO4 Cr3+
5 [Kub99] K2SO4 Fe3+
6 [Kub00] NaCl Pb2+
7 [Mie04] (NH4)2C2O4*H2O Co2+,Ni2+
8 [Ras97] KH2PO4 Fe3+,Al3+
Some of these publications refer with their data to the model of Kubota and Mullin.
For example the influence of FeCl3 and AlCl3 on the growth of ADP (ammonium
dihydrogen phosphate) crystals was observed by Davey and Mullin [Dav74]. Later
Kubota et al. [Kub95a] transferred these data to the Kubota and Mullin model. For
FeCl3 α was found to be 1.18 and K was assigned to be 25.5 (kg m-3)-1. These are quiet
similar results for α compared to this work, which means, that the impurity effect is
nearly the same and the growth rate will asymptotically converge to zero (in the
special case of α=1). If the unit of parameter K is changed to kg/kg the value changes
to 0.02045 (kg/kg) which is also comparable to the obtained values of this study. In
case of AlCl3 they observed similar values for α (1.04) and K (40.6 (kg m-3)-1) compared
to the results of FeCl3. These values are much higher than the parameters determined
for the effect of Al3+ on ammonium sulfate within this study. Possible reasons for this
will be discussed later within this Chapter.
The growth of potassium sulfate is affected in the same way by traces of Fe3+ ions
*Kub99+ as in the case of ammonium sulfate in this study. The two parameters α and
K were calculated to be 690 and 312 dm /mol, respectively. The value of α for the
iron effect on potassium sulfate is very high in comparison to the others.
Furthermore, Al-Jibbouri and Ulrich [AlJ01] studied the influence of Pb2+ and Mg2+ on
the crystal growth rate of sodium chloride and they determined α-values of 0.86 for
Pb2+ and 0.57 for Mg2+. Kubota et al. [Kub00] examined the same system and found
α-value between 1.8 and 3 depending on the supersaturation level [Kub00].
The dissolution rate as the second important part of Chapter 5.4 is not as well studied
as the growth and consequently not so many papers were published in terms of the
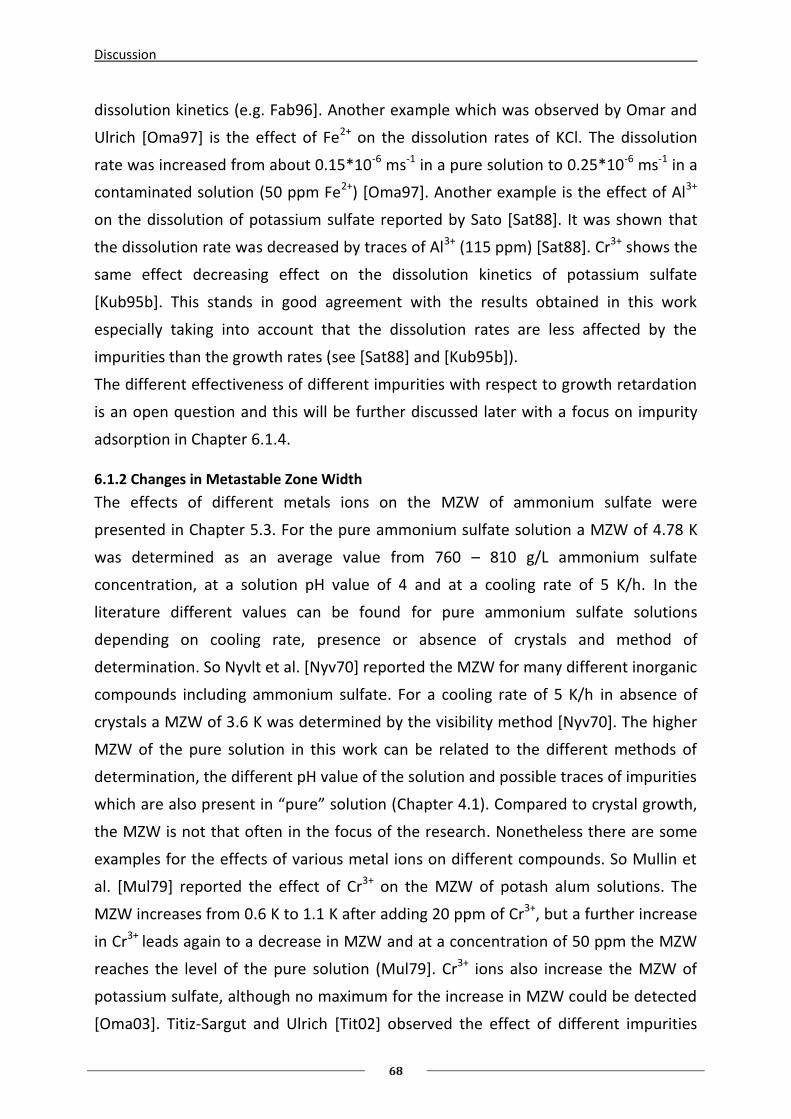
Discussion
68
dissolution kinetics (e.g. Fab96]. Another example which was observed by Omar and
Ulrich [Oma97] is the effect of Fe2+ on the dissolution rates of KCl. The dissolution
rate was increased from about 0.15*10-6 ms-1 in a pure solution to 0.25*10-6 ms-1 in a
contaminated solution (50 ppm Fe2+) [Oma97]. Another example is the effect of Al3+
on the dissolution of potassium sulfate reported by Sato [Sat88]. It was shown that
the dissolution rate was decreased by traces of Al3+ (115 ppm) [Sat88]. Cr3+ shows the
same effect decreasing effect on the dissolution kinetics of potassium sulfate
[Kub95b]. This stands in good agreement with the results obtained in this work
especially taking into account that the dissolution rates are less affected by the
impurities than the growth rates (see [Sat88] and [Kub95b]).
The different effectiveness of different impurities with respect to growth retardation
is an open question and this will be further discussed later with a focus on impurity
adsorption in Chapter 6.1.4.
6.1.2 Changes in Metastable Zone Width
The effects of different metals ions on the MZW of ammonium sulfate were
presented in Chapter 5.3. For the pure ammonium sulfate solution a MZW of 4.78 K
was determined as an average value from 760 – 810 g/L ammonium sulfate
concentration, at a solution pH value of 4 and at a cooling rate of 5 K/h. In the
literature different values can be found for pure ammonium sulfate solutions
depending on cooling rate, presence or absence of crystals and method of
determination. So Nyvlt et al. [Nyv70] reported the MZW for many different inorganic
compounds including ammonium sulfate. For a cooling rate of 5 K/h in absence of
crystals a MZW of 3.6 K was determined by the visibility method [Nyv70]. The higher
MZW of the pure solution in this work can be related to the different methods of
determination, the different pH value of the solution and possible traces of impurities
which are also present in “pure” solution (Chapter 4.1). Compared to crystal growth,
the MZW is not that often in the focus of the research. Nonetheless there are some
examples for the effects of various metal ions on different compounds. So Mullin et
al. [Mul79] reported the effect of Cr3+ on the MZW of potash alum solutions. The
MZW increases from 0.6 K to 1.1 K after adding 20 ppm of Cr3+, but a further increase
in Cr3+ leads again to a decrease in MZW and at a concentration of 50 ppm the MZW
reaches the level of the pure solution (Mul79]. Cr3+ ions also increase the MZW of
potassium sulfate, although no maximum for the increase in MZW could be detected
[Oma03]. Titiz-Sargut and Ulrich [Tit02] observed the effect of different impurities
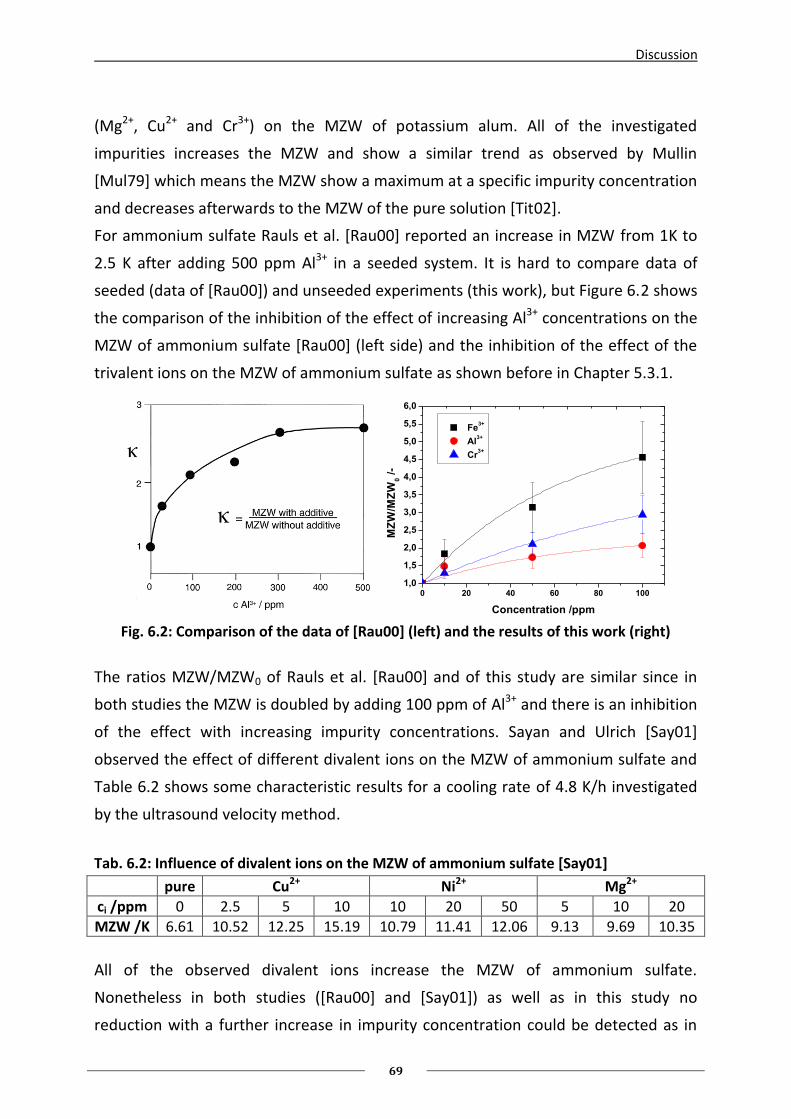
Discussion
69
(Mg2+, Cu2+ and Cr3+) on the MZW of potassium alum. All of the investigated
impurities increases the MZW and show a similar trend as observed by Mullin
[Mul79] which means the MZW show a maximum at a specific impurity concentration
and decreases afterwards to the MZW of the pure solution [Tit02].
For ammonium sulfate Rauls et al. [Rau00] reported an increase in MZW from 1K to
2.5 K after adding 500 ppm Al3+ in a seeded system. It is hard to compare data of
seeded (data of [Rau00]) and unseeded experiments (this work), but Figure 6.2 shows
the comparison of the inhibition of the effect of increasing Al3+ concentrations on the
MZW of ammonium sulfate [Rau00] (left side) and the inhibition of the effect of the
trivalent ions on the MZW of ammonium sulfate as shown before in Chapter 5.3.1.
0 20 40 60 80 100
1,0
1,5
2,0
2,5
3,0
3,5
4,0
4,5
5,0
5,5
6,0
Fe3+
Al3+
Cr3+
MZ
W/M
ZW
0 /
-
Concentration /ppm Fig. 6.2: Comparison of the data of [Rau00] (left) and the results of this work (right)
The ratios MZW/MZW0 of Rauls et al. [Rau00] and of this study are similar since in
both studies the MZW is doubled by adding 100 ppm of Al3+ and there is an inhibition
of the effect with increasing impurity concentrations. Sayan and Ulrich [Say01]
observed the effect of different divalent ions on the MZW of ammonium sulfate and
Table 6.2 shows some characteristic results for a cooling rate of 4.8 K/h investigated
by the ultrasound velocity method.
Tab. 6.2: Influence of divalent ions on the MZW of ammonium sulfate [Say01]
pure Cu2+ Ni2+ Mg2+
ci /ppm 0 2.5 5 10 10 20 50 5 10 20
MZW /K 6.61 10.52 12.25 15.19 10.79 11.41 12.06 9.13 9.69 10.35
All of the observed divalent ions increase the MZW of ammonium sulfate.
Nonetheless in both studies ([Rau00] and [Say01]) as well as in this study no
reduction with a further increase in impurity concentration could be detected as in
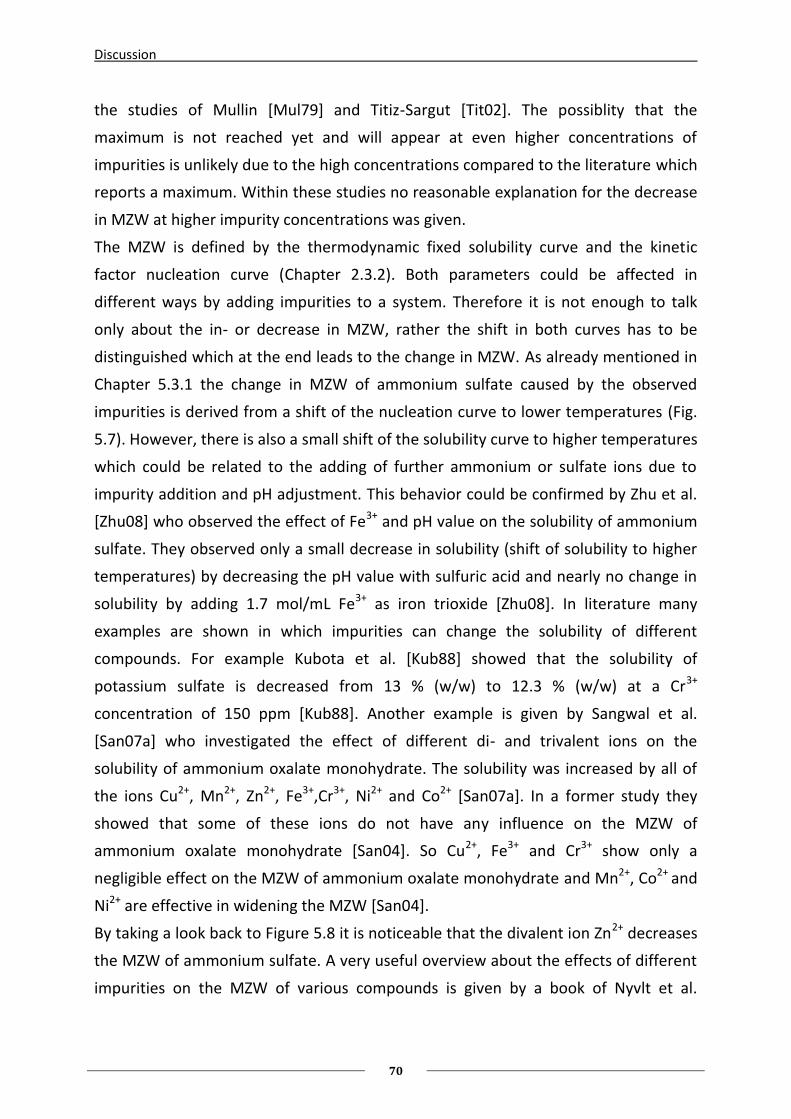
Discussion
70
the studies of Mullin [Mul79] and Titiz-Sargut [Tit02]. The possiblity that the
maximum is not reached yet and will appear at even higher concentrations of
impurities is unlikely due to the high concentrations compared to the literature which
reports a maximum. Within these studies no reasonable explanation for the decrease
in MZW at higher impurity concentrations was given.
The MZW is defined by the thermodynamic fixed solubility curve and the kinetic
factor nucleation curve (Chapter 2.3.2). Both parameters could be affected in
different ways by adding impurities to a system. Therefore it is not enough to talk
only about the in- or decrease in MZW, rather the shift in both curves has to be
distinguished which at the end leads to the change in MZW. As already mentioned in
Chapter 5.3.1 the change in MZW of ammonium sulfate caused by the observed
impurities is derived from a shift of the nucleation curve to lower temperatures (Fig.
5.7). However, there is also a small shift of the solubility curve to higher temperatures
which could be related to the adding of further ammonium or sulfate ions due to
impurity addition and pH adjustment. This behavior could be confirmed by Zhu et al.
[Zhu08] who observed the effect of Fe3+ and pH value on the solubility of ammonium
sulfate. They observed only a small decrease in solubility (shift of solubility to higher
temperatures) by decreasing the pH value with sulfuric acid and nearly no change in
solubility by adding 1.7 mol/mL Fe3+ as iron trioxide [Zhu08]. In literature many
examples are shown in which impurities can change the solubility of different
compounds. For example Kubota et al. [Kub88] showed that the solubility of
potassium sulfate is decreased from 13 % (w/w) to 12.3 % (w/w) at a Cr3+
concentration of 150 ppm [Kub88]. Another example is given by Sangwal et al.
[San07a] who investigated the effect of different di- and trivalent ions on the
solubility of ammonium oxalate monohydrate. The solubility was increased by all of
the ions Cu2+, Mn2+, Zn2+, Fe3+,Cr3+, Ni2+ and Co2+ [San07a]. In a former study they
showed that some of these ions do not have any influence on the MZW of
ammonium oxalate monohydrate [San04]. So Cu2+, Fe3+ and Cr3+ show only a
negligible effect on the MZW of ammonium oxalate monohydrate and Mn2+, Co2+ and
Ni2+ are effective in widening the MZW [San04].
By taking a look back to Figure 5.8 it is noticeable that the divalent ion Zn2+ decreases
the MZW of ammonium sulfate. A very useful overview about the effects of different
impurities on the MZW of various compounds is given by a book of Nyvlt et al.
Discussion
71
[Nyv85]. Therein it is shown that 0.1 % (wt/wt) Zn2+ reduces the MZW from 3.61 to
2.93 K at a cooling rate of 10 K/h which is in agreement with the data of this work.
By concluding all these examples and facts for the influence of different ions on the
MZW of various compounds and comparing them to the data achieved during this
study it is hard to see any clear trend. This makes the prediction for the effects on the
MZW caused by different impurities nearly impossible without performing
experiments.
If it is hard to predict the effect of one impurity, how complex is it then to predict the
effects of two impurities or even a mixture of different impurities. In Chapter 5.3.3
the synergy effect of two impurities are shown. Thereby Fe3+ as the strongest
enhancer in MZW and Al3+ as the trivalent impurity with the lowest effect on the
MZW of ammonium sulfate were chosen. Before it was expected that the influences
of both are simply added to each other to show an even higher effect on the MZW,
but in reality another phenomenon is observed. Al3+ decreases the effect of Fe3+ and
the only logical explanation could be the competition of both impurities for the
limited adsorption sites at the surface of the crystal or the nucleus. In the literature
there is a lack of information concerning the effects of impurity mixtures. Sangwal
[San07b] made some theoretical approaches towards this topic and Equation 6.1
shows the growth rate from a solution containing two impurities A and B.
(6.1)
Therefore the effect of one impurity (A) is increased by the adsorption of another
impurity as suggested before and shown clearly in Fig. 6.3.
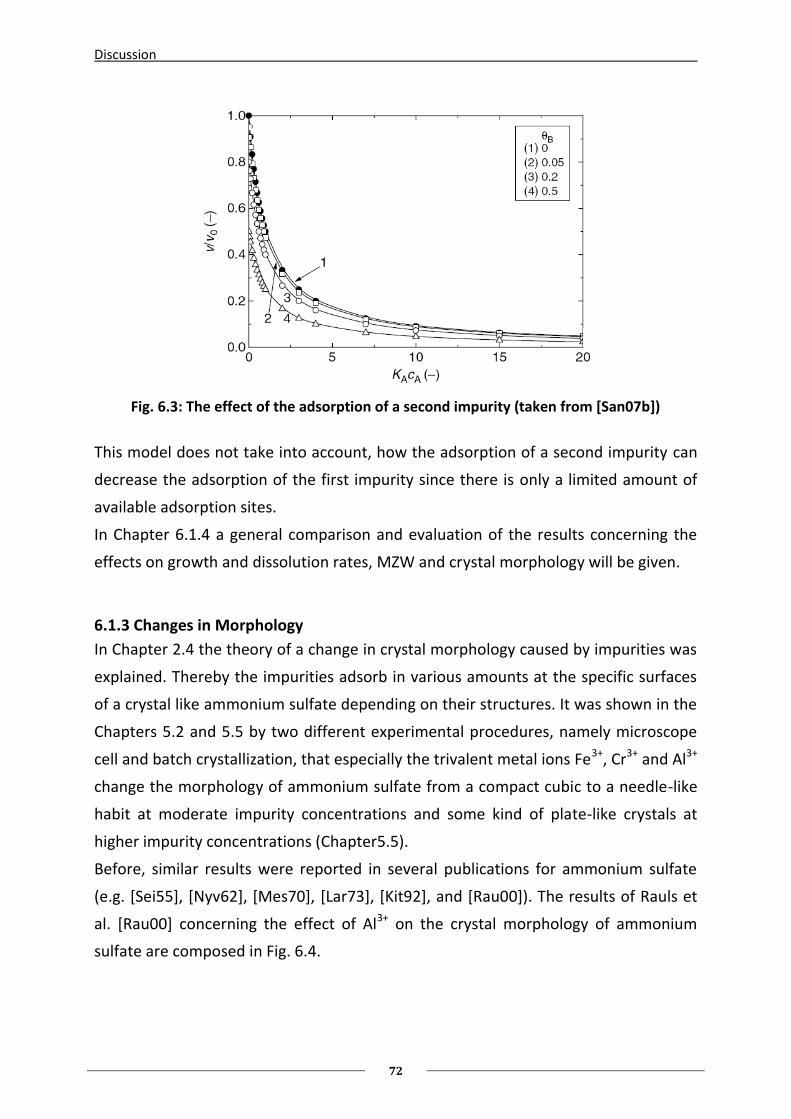
Discussion
72
Fig. 6.3: The effect of the adsorption of a second impurity (taken from [San07b])
This model does not take into account, how the adsorption of a second impurity can
decrease the adsorption of the first impurity since there is only a limited amount of
available adsorption sites.
In Chapter 6.1.4 a general comparison and evaluation of the results concerning the
effects on growth and dissolution rates, MZW and crystal morphology will be given.
6.1.3 Changes in Morphology
In Chapter 2.4 the theory of a change in crystal morphology caused by impurities was
explained. Thereby the impurities adsorb in various amounts at the specific surfaces
of a crystal like ammonium sulfate depending on their structures. It was shown in the
Chapters 5.2 and 5.5 by two different experimental procedures, namely microscope
cell and batch crystallization, that especially the trivalent metal ions Fe3+, Cr3+ and Al3+
change the morphology of ammonium sulfate from a compact cubic to a needle-like
habit at moderate impurity concentrations and some kind of plate-like crystals at
higher impurity concentrations (Chapter5.5).
Before, similar results were reported in several publications for ammonium sulfate
(e.g. [Sei55], [Nyv62], [Mes70], [Lar73], [Kit92], and [Rau00]). The results of Rauls et
al. [Rau00] concerning the effect of Al3+ on the crystal morphology of ammonium
sulfate are composed in Fig. 6.4.
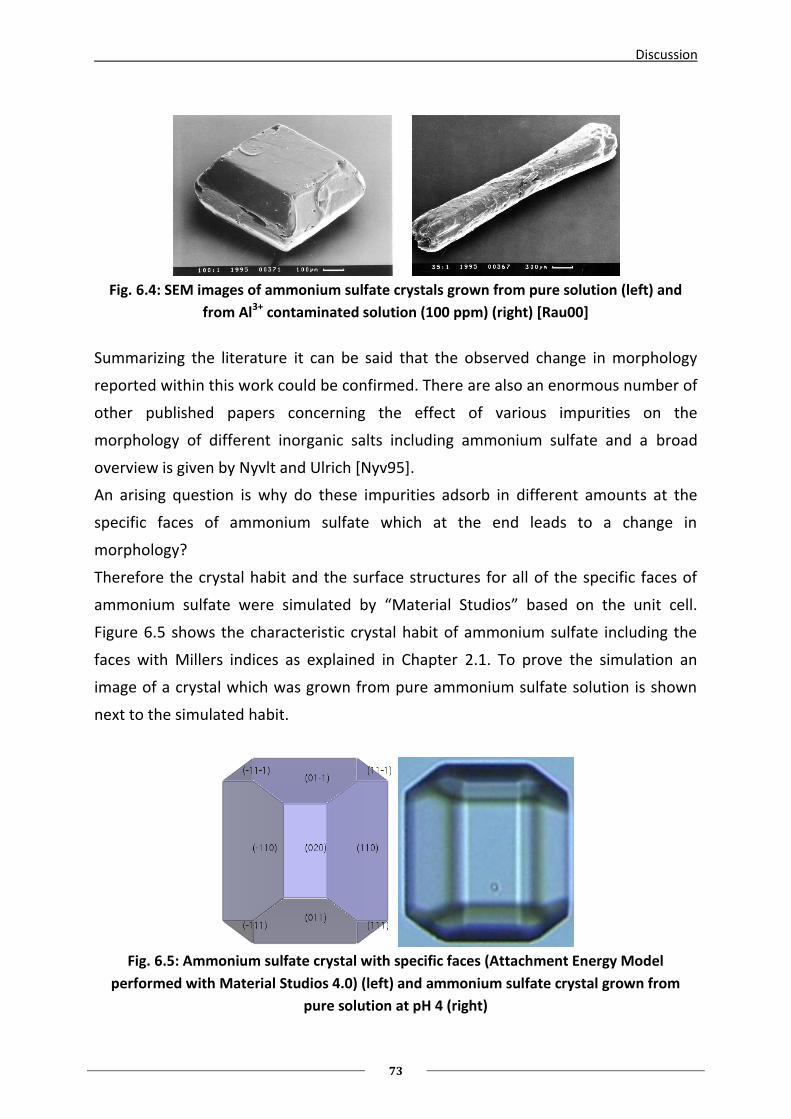
Discussion
73
Fig. 6.4: SEM images of ammonium sulfate crystals grown from pure solution (left) and
from Al3+ contaminated solution (100 ppm) (right) [Rau00]
Summarizing the literature it can be said that the observed change in morphology
reported within this work could be confirmed. There are also an enormous number of
other published papers concerning the effect of various impurities on the
morphology of different inorganic salts including ammonium sulfate and a broad
overview is given by Nyvlt and Ulrich [Nyv95].
An arising question is why do these impurities adsorb in different amounts at the
specific faces of ammonium sulfate which at the end leads to a change in
morphology?
Therefore the crystal habit and the surface structures for all of the specific faces of
ammonium sulfate were simulated by “Material Studios” based on the unit cell.
Figure 6.5 shows the characteristic crystal habit of ammonium sulfate including the
faces with Millers indices as explained in Chapter 2.1. To prove the simulation an
image of a crystal which was grown from pure ammonium sulfate solution is shown
next to the simulated habit.
Fig. 6.5: Ammonium sulfate crystal with specific faces (Attachment Energy Model
performed with Material Studios 4.0) (left) and ammonium sulfate crystal grown from
pure solution at pH 4 (right)
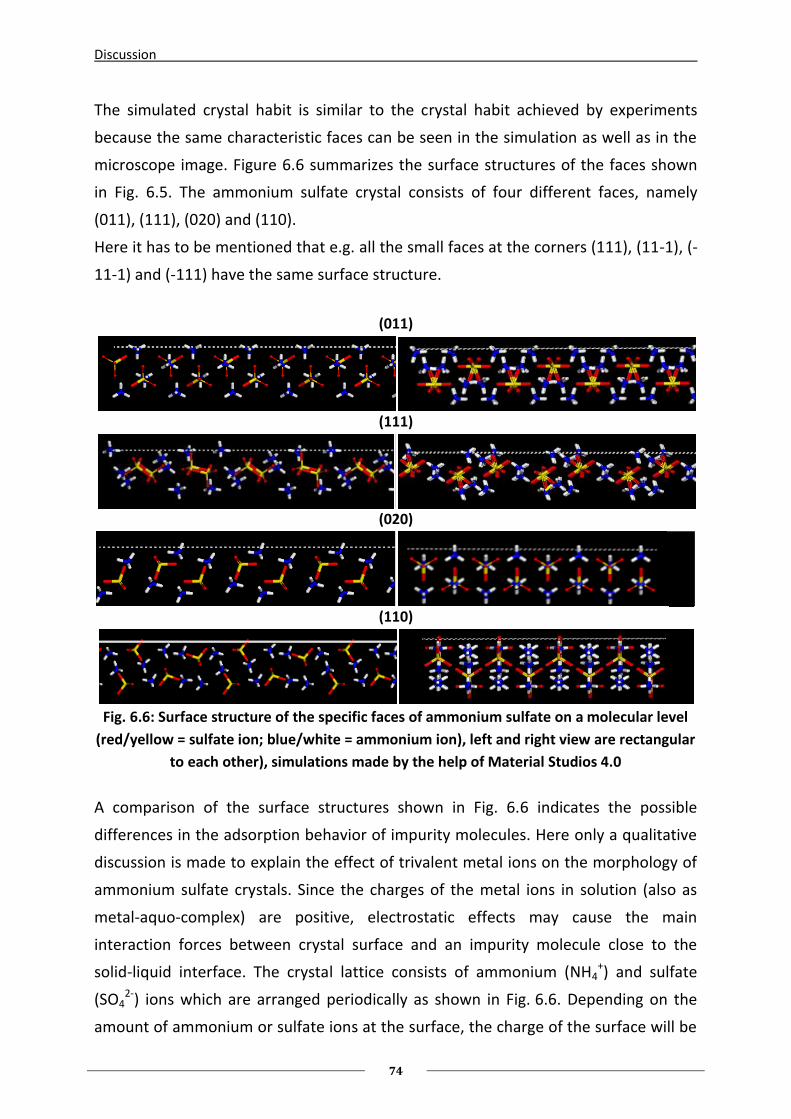
Discussion
74
The simulated crystal habit is similar to the crystal habit achieved by experiments
because the same characteristic faces can be seen in the simulation as well as in the
microscope image. Figure 6.6 summarizes the surface structures of the faces shown
in Fig. 6.5. The ammonium sulfate crystal consists of four different faces, namely
(011), (111), (020) and (110).
Here it has to be mentioned that e.g. all the small faces at the corners (111), (11-1), (-
11-1) and (-111) have the same surface structure.
(011)
(111)
(020)
(110)
Fig. 6.6: Surface structure of the specific faces of ammonium sulfate on a molecular level
(red/yellow = sulfate ion; blue/white = ammonium ion), left and right view are rectangular
to each other), simulations made by the help of Material Studios 4.0
A comparison of the surface structures shown in Fig. 6.6 indicates the possible
differences in the adsorption behavior of impurity molecules. Here only a qualitative
discussion is made to explain the effect of trivalent metal ions on the morphology of
ammonium sulfate crystals. Since the charges of the metal ions in solution (also as
metal-aquo-complex) are positive, electrostatic effects may cause the main
interaction forces between crystal surface and an impurity molecule close to the
solid-liquid interface. The crystal lattice consists of ammonium (NH4+) and sulfate
(SO42-) ions which are arranged periodically as shown in Fig. 6.6. Depending on the
amount of ammonium or sulfate ions at the surface, the charge of the surface will be
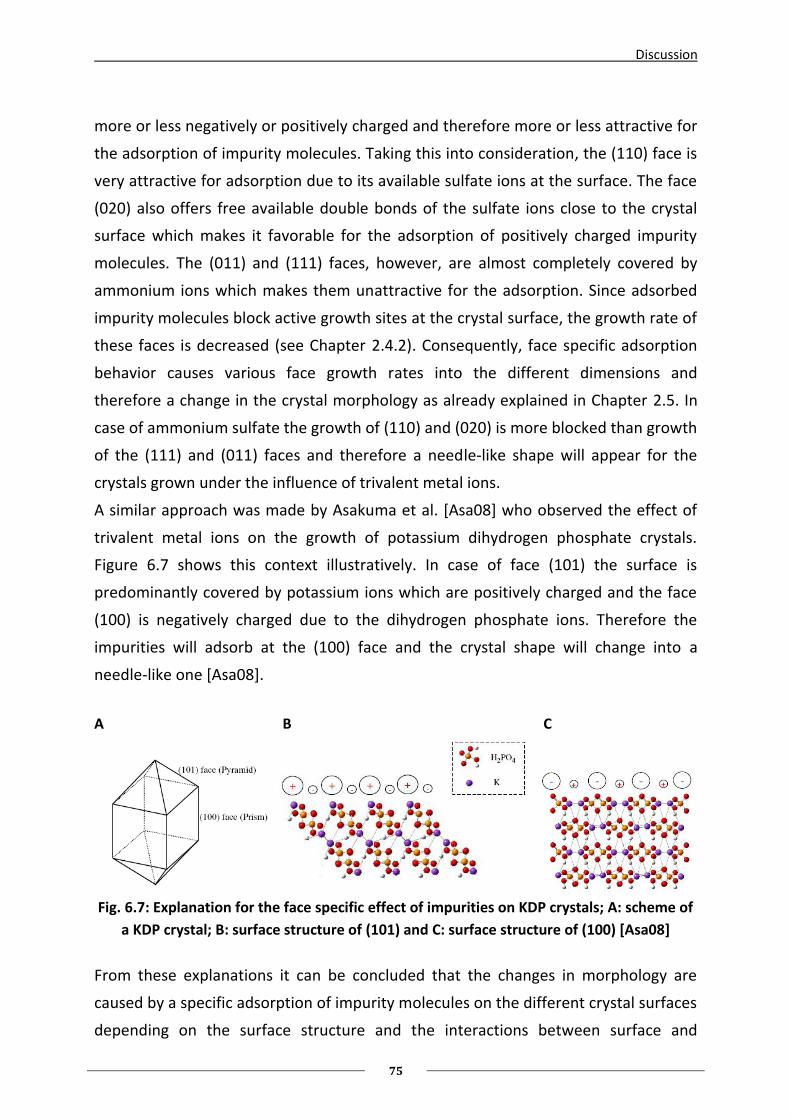
Discussion
75
more or less negatively or positively charged and therefore more or less attractive for
the adsorption of impurity molecules. Taking this into consideration, the (110) face is
very attractive for adsorption due to its available sulfate ions at the surface. The face
(020) also offers free available double bonds of the sulfate ions close to the crystal
surface which makes it favorable for the adsorption of positively charged impurity
molecules. The (011) and (111) faces, however, are almost completely covered by
ammonium ions which makes them unattractive for the adsorption. Since adsorbed
impurity molecules block active growth sites at the crystal surface, the growth rate of
these faces is decreased (see Chapter 2.4.2). Consequently, face specific adsorption
behavior causes various face growth rates into the different dimensions and
therefore a change in the crystal morphology as already explained in Chapter 2.5. In
case of ammonium sulfate the growth of (110) and (020) is more blocked than growth
of the (111) and (011) faces and therefore a needle-like shape will appear for the
crystals grown under the influence of trivalent metal ions.
A similar approach was made by Asakuma et al. [Asa08] who observed the effect of
trivalent metal ions on the growth of potassium dihydrogen phosphate crystals.
Figure 6.7 shows this context illustratively. In case of face (101) the surface is
predominantly covered by potassium ions which are positively charged and the face
(100) is negatively charged due to the dihydrogen phosphate ions. Therefore the
impurities will adsorb at the (100) face and the crystal shape will change into a
needle-like one [Asa08].
A B C
Fig. 6.7: Explanation for the face specific effect of impurities on KDP crystals; A: scheme of
a KDP crystal; B: surface structure of (101) and C: surface structure of (100) [Asa08]
From these explanations it can be concluded that the changes in morphology are
caused by a specific adsorption of impurity molecules on the different crystal surfaces
depending on the surface structure and the interactions between surface and
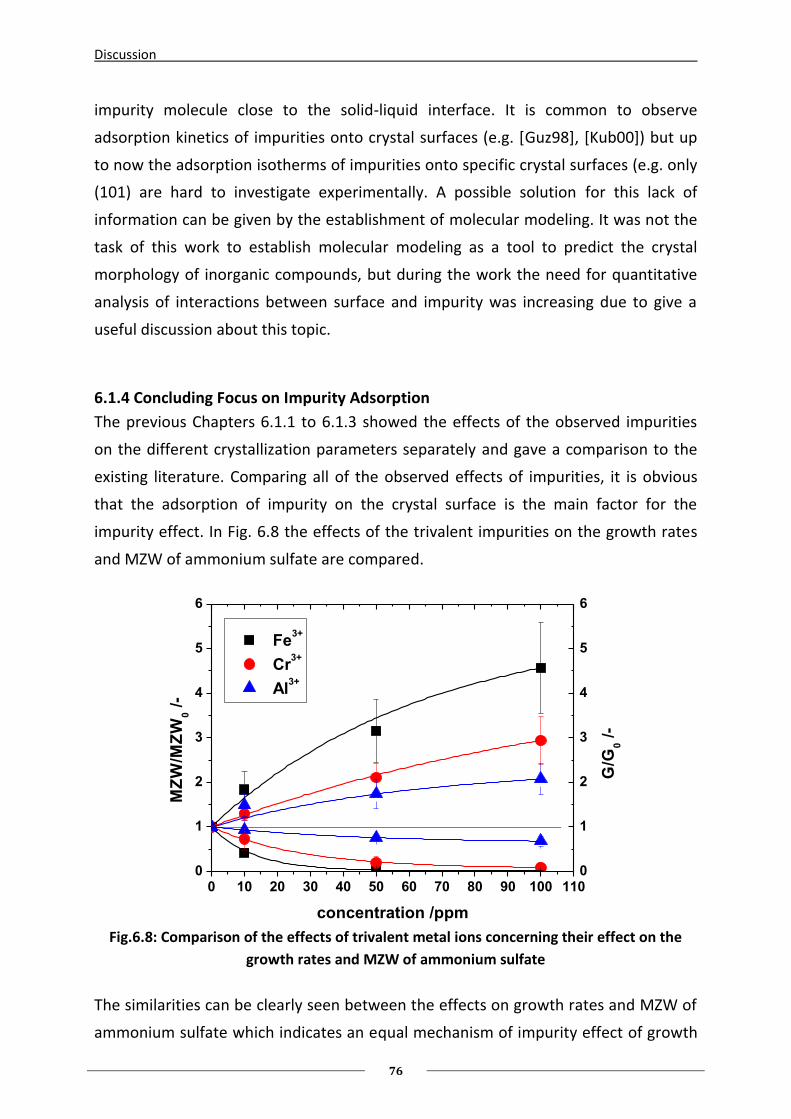
Discussion
76
impurity molecule close to the solid-liquid interface. It is common to observe
adsorption kinetics of impurities onto crystal surfaces (e.g. [Guz98], [Kub00]) but up
to now the adsorption isotherms of impurities onto specific crystal surfaces (e.g. only
(101) are hard to investigate experimentally. A possible solution for this lack of
information can be given by the establishment of molecular modeling. It was not the
task of this work to establish molecular modeling as a tool to predict the crystal
morphology of inorganic compounds, but during the work the need for quantitative
analysis of interactions between surface and impurity was increasing due to give a
useful discussion about this topic.
6.1.4 Concluding Focus on Impurity Adsorption
The previous Chapters 6.1.1 to 6.1.3 showed the effects of the observed impurities
on the different crystallization parameters separately and gave a comparison to the
existing literature. Comparing all of the observed effects of impurities, it is obvious
that the adsorption of impurity on the crystal surface is the main factor for the
impurity effect. In Fig. 6.8 the effects of the trivalent impurities on the growth rates
and MZW of ammonium sulfate are compared.
0 10 20 30 40 50 60 70 80 90 100 1100
1
2
3
4
5
6G
/G0 /
-
Fe3+
Cr3+
Al3+
MZ
W/M
ZW
0 /
-
concentration /ppm
0
1
2
3
4
5
6
_____________________________________________________________________________
Fig.6.8: Comparison of the effects of trivalent metal ions concerning their effect on the
growth rates and MZW of ammonium sulfate
The similarities can be clearly seen between the effects on growth rates and MZW of
ammonium sulfate which indicates an equal mechanism of impurity effect of growth
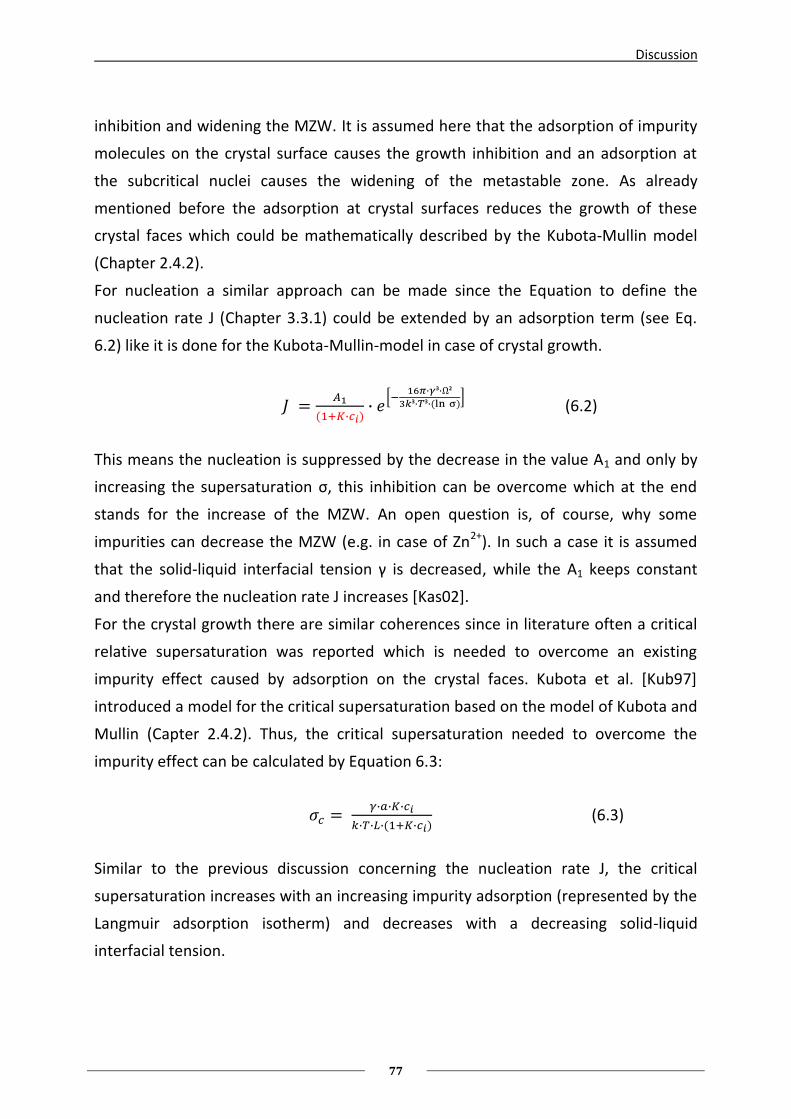
Discussion
77
inhibition and widening the MZW. It is assumed here that the adsorption of impurity
molecules on the crystal surface causes the growth inhibition and an adsorption at
the subcritical nuclei causes the widening of the metastable zone. As already
mentioned before the adsorption at crystal surfaces reduces the growth of these
crystal faces which could be mathematically described by the Kubota-Mullin model
(Chapter 2.4.2).
For nucleation a similar approach can be made since the Equation to define the
nucleation rate J (Chapter 3.3.1) could be extended by an adsorption term (see Eq.
6.2) like it is done for the Kubota-Mullin-model in case of crystal growth.
(6.2)
This means the nucleation is suppressed by the decrease in the value A1 and only by
increasing the supersaturation σ, this inhibition can be overcome which at the end
stands for the increase of the MZW. An open question is, of course, why some
impurities can decrease the MZW (e.g. in case of Zn2+). In such a case it is assumed
that the solid-liquid interfacial tension γ is decreased, while the A1 keeps constant
and therefore the nucleation rate J increases [Kas02].
For the crystal growth there are similar coherences since in literature often a critical
relative supersaturation was reported which is needed to overcome an existing
impurity effect caused by adsorption on the crystal faces. Kubota et al. [Kub97]
introduced a model for the critical supersaturation based on the model of Kubota and
Mullin (Capter 2.4.2). Thus, the critical supersaturation needed to overcome the
impurity effect can be calculated by Equation 6.3:
(6.3)
Similar to the previous discussion concerning the nucleation rate J, the critical
supersaturation increases with an increasing impurity adsorption (represented by the
Langmuir adsorption isotherm) and decreases with a decreasing solid-liquid
interfacial tension.
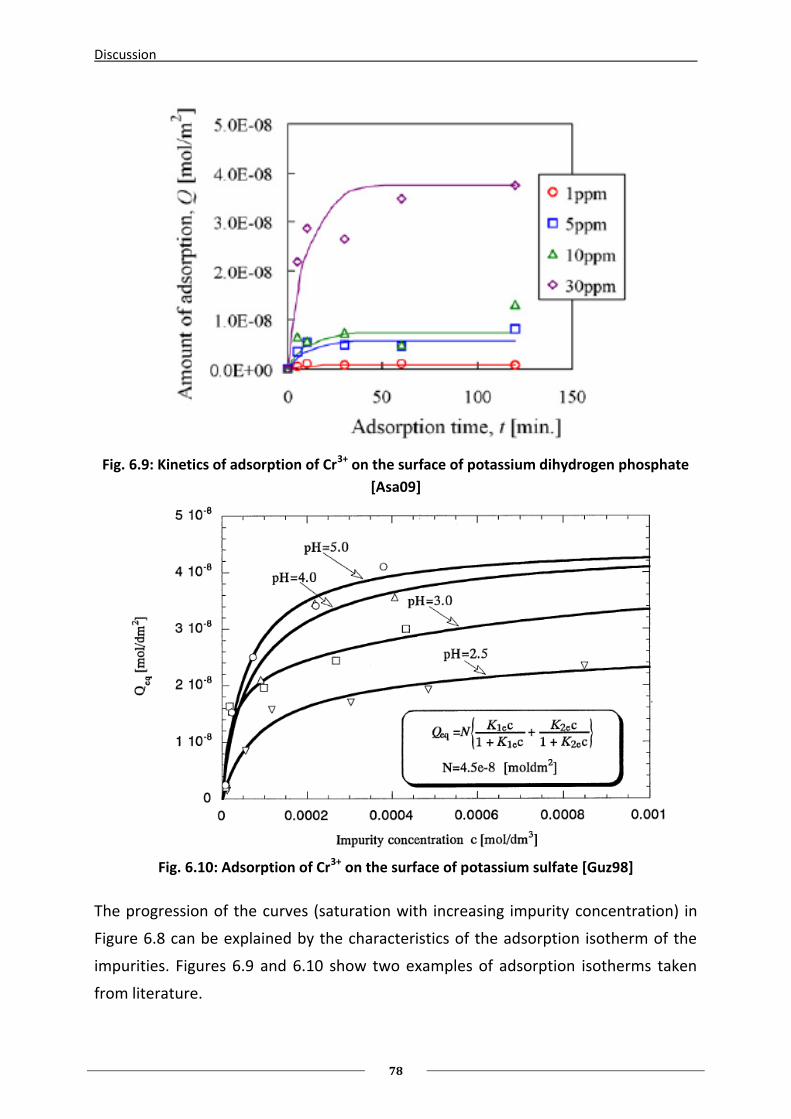
Discussion
78
Fig. 6.9: Kinetics of adsorption of Cr3+ on the surface of potassium dihydrogen phosphate
[Asa09]
Fig. 6.10: Adsorption of Cr3+ on the surface of potassium sulfate [Guz98]
The progression of the curves (saturation with increasing impurity concentration) in
Figure 6.8 can be explained by the characteristics of the adsorption isotherm of the
impurities. Figures 6.9 and 6.10 show two examples of adsorption isotherms taken
from literature.
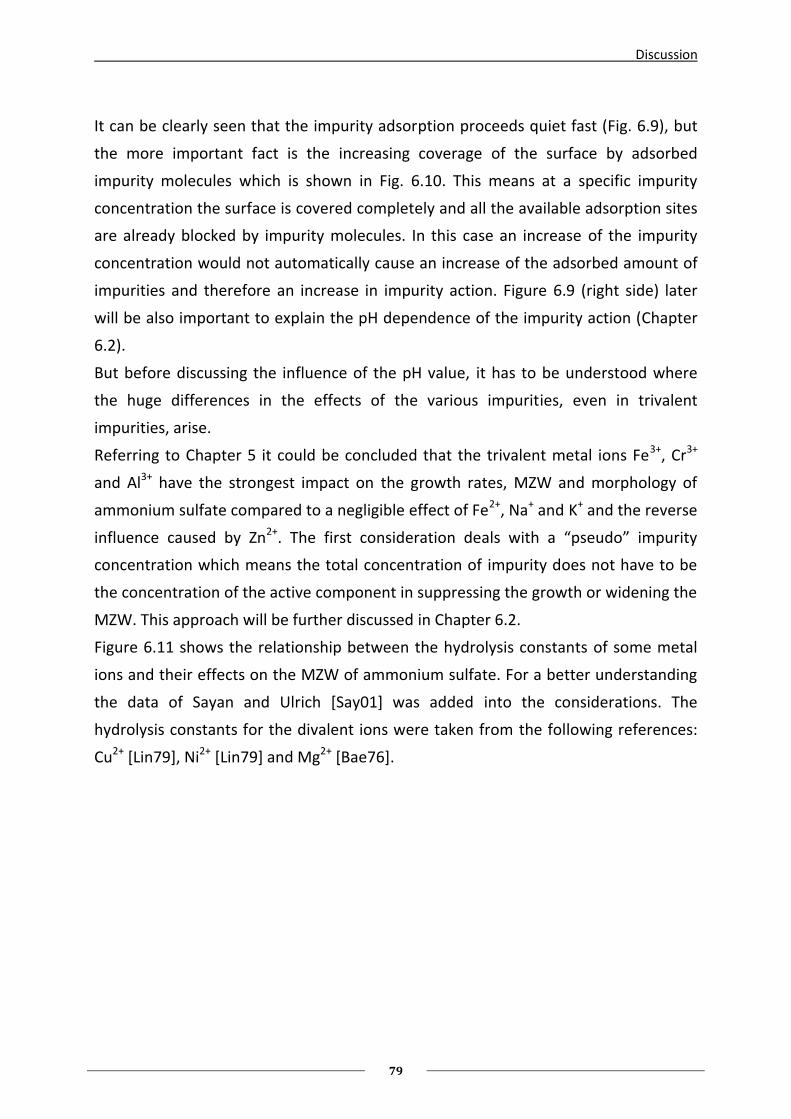
Discussion
79
It can be clearly seen that the impurity adsorption proceeds quiet fast (Fig. 6.9), but
the more important fact is the increasing coverage of the surface by adsorbed
impurity molecules which is shown in Fig. 6.10. This means at a specific impurity
concentration the surface is covered completely and all the available adsorption sites
are already blocked by impurity molecules. In this case an increase of the impurity
concentration would not automatically cause an increase of the adsorbed amount of
impurities and therefore an increase in impurity action. Figure 6.9 (right side) later
will be also important to explain the pH dependence of the impurity action (Chapter
6.2).
But before discussing the influence of the pH value, it has to be understood where
the huge differences in the effects of the various impurities, even in trivalent
impurities, arise.
Referring to Chapter 5 it could be concluded that the trivalent metal ions Fe3+, Cr3+
and Al3+ have the strongest impact on the growth rates, MZW and morphology of
ammonium sulfate compared to a negligible effect of Fe2+, Na+ and K+ and the reverse
influence caused by Zn2+. The first consideration deals with a “pseudo” impurity
concentration which means the total concentration of impurity does not have to be
the concentration of the active component in suppressing the growth or widening the
MZW. This approach will be further discussed in Chapter 6.2.
Figure 6.11 shows the relationship between the hydrolysis constants of some metal
ions and their effects on the MZW of ammonium sulfate. For a better understanding
the data of Sayan and Ulrich [Say01] was added into the considerations. The
hydrolysis constants for the divalent ions were taken from the following references:
Cu2+ [Lin79], Ni2+ [Lin79] and Mg2+ [Bae76].
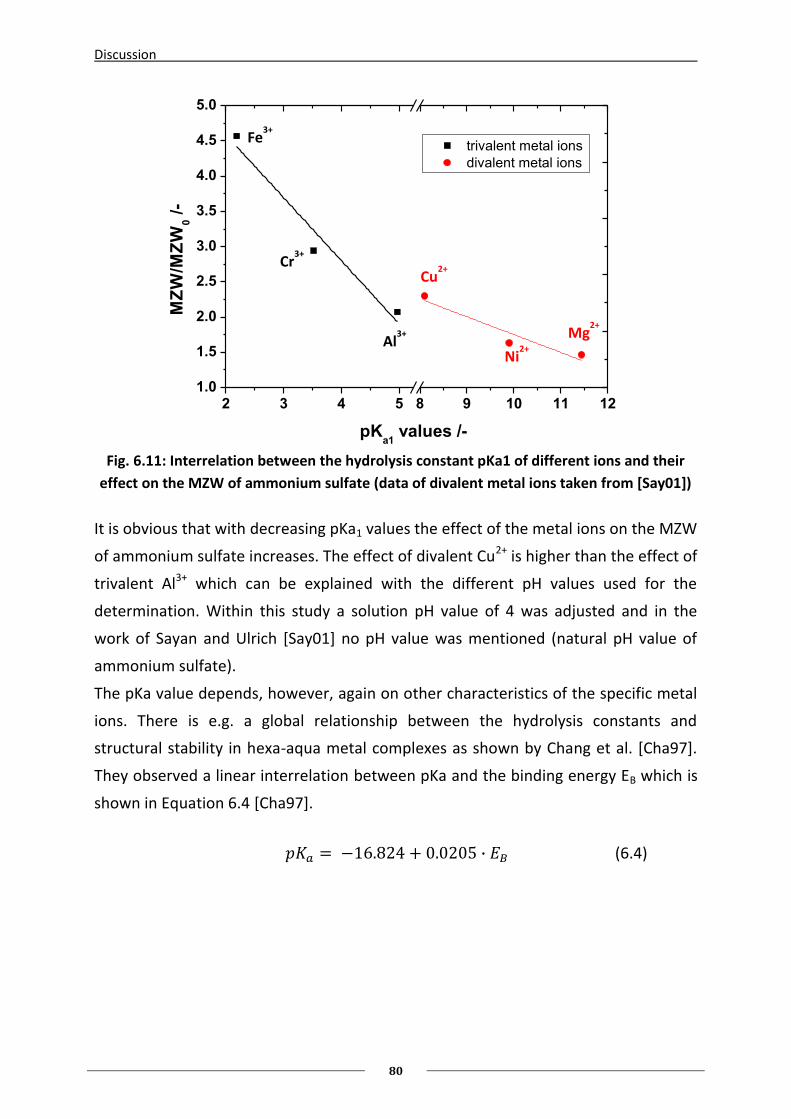
Discussion
80
2 3 4 5 8 9 10 11 121.0
1.5
2.0
2.5
3.0
3.5
4.0
4.5
5.0
Mg2+
Ni2+
Cu2+
Al3+
Cr3+
trivalent metal ions
divalent metal ionsM
ZW
/MZ
W0 /
-
pKa1
values /-
Fe3+
Fig. 6.11: Interrelation between the hydrolysis constant pKa1 of different ions and their
effect on the MZW of ammonium sulfate (data of divalent metal ions taken from [Say01])
It is obvious that with decreasing pKa1 values the effect of the metal ions on the MZW
of ammonium sulfate increases. The effect of divalent Cu2+ is higher than the effect of
trivalent Al3+ which can be explained with the different pH values used for the
determination. Within this study a solution pH value of 4 was adjusted and in the
work of Sayan and Ulrich [Say01] no pH value was mentioned (natural pH value of
ammonium sulfate).
The pKa value depends, however, again on other characteristics of the specific metal
ions. There is e.g. a global relationship between the hydrolysis constants and
structural stability in hexa-aqua metal complexes as shown by Chang et al. [Cha97].
They observed a linear interrelation between pKa and the binding energy EB which is
shown in Equation 6.4 [Cha97].
(6.4)
Discussion
81
6.2 Influence of the pH value
As shown in Chapters 5.3.2 and 5.5.1 the pH value of the mother liquor can affect the
influence of trivalent metal ions on MZW and crystal morphology of ammonium
sulfate. Furthermore, the adsorption of impurity molecules on the crystal surface was
identified to be responsible for the effects caused by trivalent metal ions (Chapter
6.1). By combining both facts, a theory for the influence of the pH value on the
effects of trivalent metal ions should be compiled.
One possible reason for the effect of the solution pH was already mentioned in
Chapter 2.5. Metal ions do not exist as bare ions in aqueous solution, but in reality,
they always form complexes e.g. with water molecules. Depending on the pH value,
an equilibrium of different species can be found in a solution contaminated by
trivalent metal ions. Figures 5.10 to 5.12 in Chapter 5.3.2 gave a relationship between
the distribution of different metal-aqua-complexes in solution and their effect on the
MZW of ammonium sulfate. Thereby the second hydrolysis product [Me(H2O)5OH]2+
could be identified to be active in widening the MZW. What are the differences in the
structure of the various metal-aqua-complexes? As mentioned before, the trivalent
metal ions are surrounded by 6 water molecules as ligands at very low pH values. If
the pH is increased, some of the water molecules get dehydrated and form hydroxyl
groups. So e.g. the surface charges of the impurity molecule changes over the
observed pH range (from 2 to 6). Figure 6.12 shows the surface charges of the metal-
aqua-complexes [Fe(H2O)3]3+, [Fe(H2O)5OH]2+ and [Fe(H2O)4(OH)2]+ simulated by the
software GAUSSIAN. The hexa-aqua-iron-complex [Fe(H2O)3]3+ is positively charged all
over its surface, but by dehydration the surface gets more negative close to the
appearing hydroxyl group ([Fe(H2O)5OH]2+). The second hydrolysis product
[Fe(H2O)4(OH)2]+ is even less positively charged. This has a major influence on the
adsorption of the complexes on the ammonium sulfate crystal surfaces as explained
in Chapter 6.1.
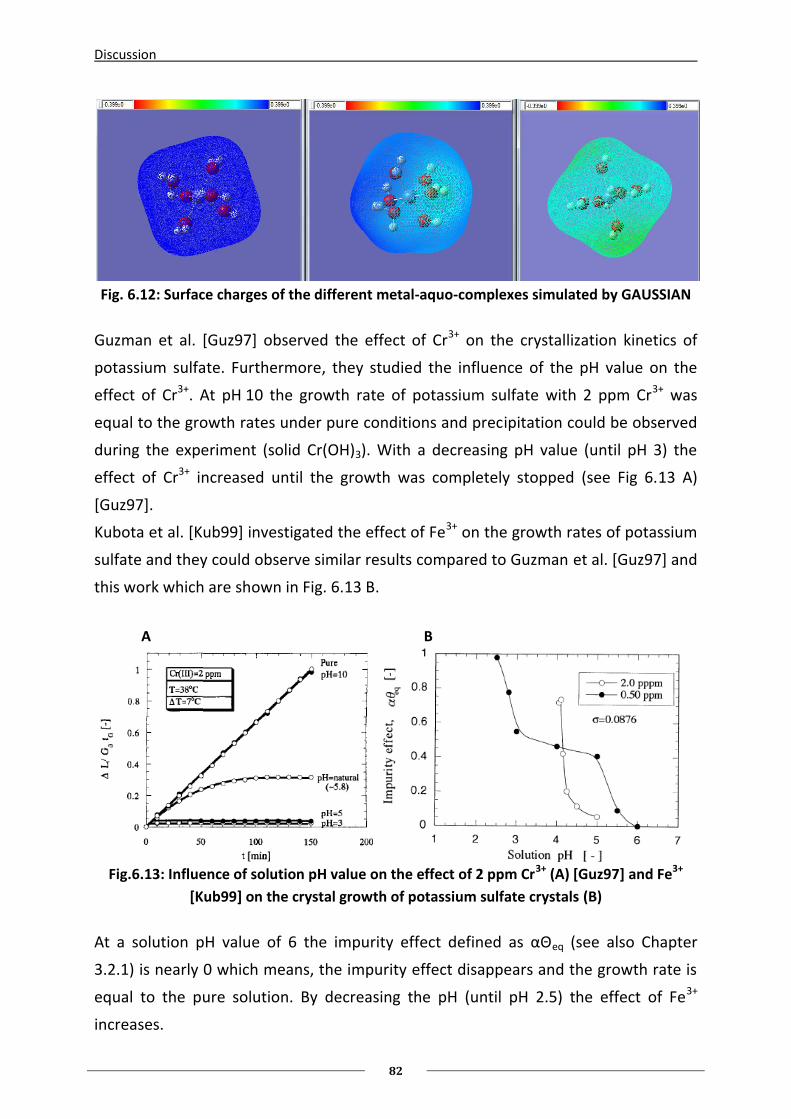
Discussion
82
Fig. 6.12: Surface charges of the different metal-aquo-complexes simulated by GAUSSIAN
Guzman et al. [Guz97] observed the effect of Cr3+ on the crystallization kinetics of
potassium sulfate. Furthermore, they studied the influence of the pH value on the
effect of Cr3+. At pH 10 the growth rate of potassium sulfate with 2 ppm Cr3+ was
equal to the growth rates under pure conditions and precipitation could be observed
during the experiment (solid Cr(OH)3). With a decreasing pH value (until pH 3) the
effect of Cr3+ increased until the growth was completely stopped (see Fig 6.13 A)
[Guz97].
Kubota et al. [Kub99] investigated the effect of Fe3+ on the growth rates of potassium
sulfate and they could observe similar results compared to Guzman et al. [Guz97] and
this work which are shown in Fig. 6.13 B.
A B
Fig.6.13: Influence of solution pH value on the effect of 2 ppm Cr3+ (A) [Guz97] and Fe3+
[Kub99] on the crystal growth of potassium sulfate crystals (B)
At a solution pH value of 6 the impurity effect defined as αΘeq (see also Chapter
3.2.1) is nearly 0 which means, the impurity effect disappears and the growth rate is
equal to the pure solution. By decreasing the pH (until pH 2.5) the effect of Fe3+
increases.
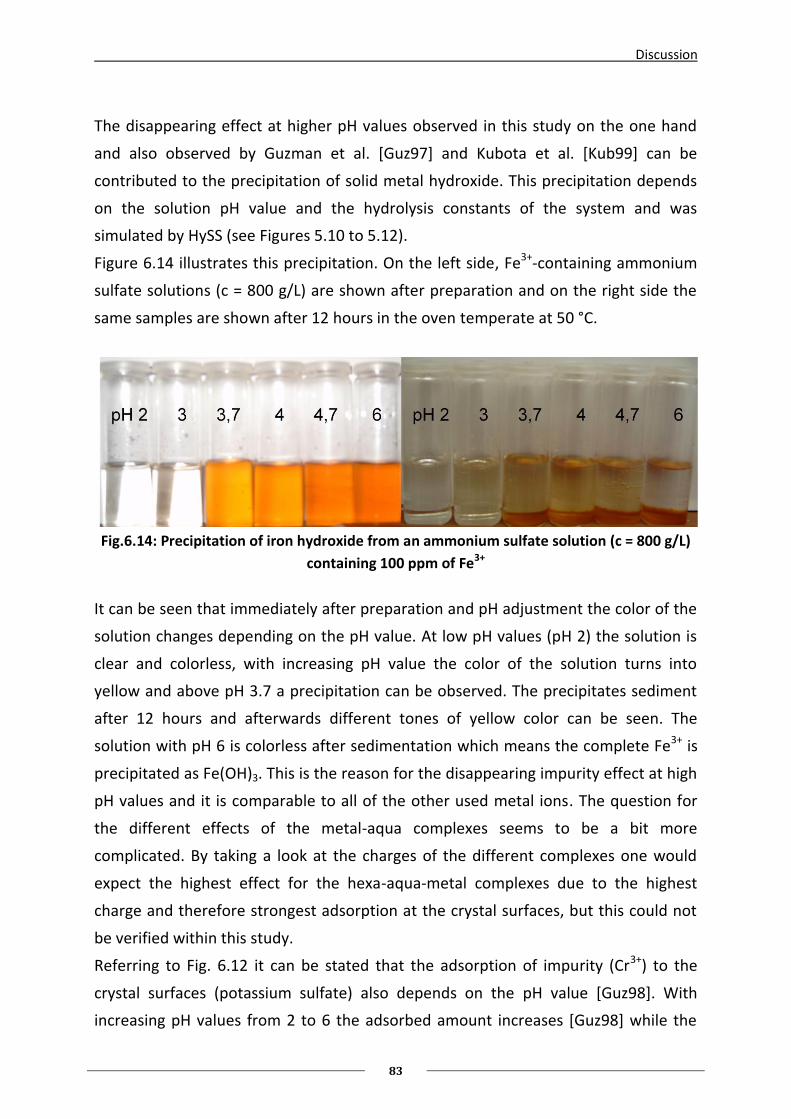
Discussion
83
The disappearing effect at higher pH values observed in this study on the one hand
and also observed by Guzman et al. [Guz97] and Kubota et al. [Kub99] can be
contributed to the precipitation of solid metal hydroxide. This precipitation depends
on the solution pH value and the hydrolysis constants of the system and was
simulated by HySS (see Figures 5.10 to 5.12).
Figure 6.14 illustrates this precipitation. On the left side, Fe3+-containing ammonium
sulfate solutions (c = 800 g/L) are shown after preparation and on the right side the
same samples are shown after 12 hours in the oven temperate at 50 °C.
Fig.6.14: Precipitation of iron hydroxide from an ammonium sulfate solution (c = 800 g/L)
containing 100 ppm of Fe3+
It can be seen that immediately after preparation and pH adjustment the color of the
solution changes depending on the pH value. At low pH values (pH 2) the solution is
clear and colorless, with increasing pH value the color of the solution turns into
yellow and above pH 3.7 a precipitation can be observed. The precipitates sediment
after 12 hours and afterwards different tones of yellow color can be seen. The
solution with pH 6 is colorless after sedimentation which means the complete Fe3+ is
precipitated as Fe(OH)3. This is the reason for the disappearing impurity effect at high
pH values and it is comparable to all of the other used metal ions. The question for
the different effects of the metal-aqua complexes seems to be a bit more
complicated. By taking a look at the charges of the different complexes one would
expect the highest effect for the hexa-aqua-metal complexes due to the highest
charge and therefore strongest adsorption at the crystal surfaces, but this could not
be verified within this study.
Referring to Fig. 6.12 it can be stated that the adsorption of impurity (Cr3+) to the
crystal surfaces (potassium sulfate) also depends on the pH value [Guz98]. With
increasing pH values from 2 to 6 the adsorbed amount increases [Guz98] while the
Discussion
84
effect decreases with increasing pH values (from pH 3 to pH 10) as shown before in
Fig.6.13 A [Guz97]. On the first view this seems to be in contradiction to each other,
but by taking a closer look to the distribution of the complexes of Cr3+ shown in Fig.
5.11 it supports the phenomenon observed in this work. The maximum in the active
complex [Cr(H2O)5OH]2+ is at around pH 5 and it is conceivable that the absorbed
amount will decrease again by increasing the pH about pH 5. Furthermore, both, pH 3
and 5 lead to a complete growth stoppage (Fig 6.10) and so it is hard to distinguish
the effects at both pH values since at pH 3 there is still a high enough concentration
of the active complex (Fig.5.11).
It is necessary to observe adsorption kinetics of different metal ions over a wide
range of pH values and compare them to the distribution of the different metal-aqua
complexes in aqueous solution. A first relationship can be defined by taking the
performed integration experiments into consideration which are shown in Chapter
5.6.
6.3 Removing Effect of Oxalic Acid
In Chapters 5.3.2 and 5.5.2 the so-called removing effect of oxalic acid was shown for
the case of trivalent ions on MZW and crystal morphology of ammonium sulfate,
respectively. As already mentioned, this effect is known for a long time, since a
publication reported this effect in 1955 [Sei55]. It was reported that oxalic acid
reduces the effect of Fe3+ by the formation of complex Fe3+-oxalate-complexes which
do not show the same effect [Sei55]. For industrial crystallization processes this
seems to be a promising tool (additive) to avoid undesired effects of trivalent metal
ions during crystallization which will be discussed controversially later.
But up to now there are no more information about the exact mechanism behind the
effect of oxalic acid. In this Chapter possible mechanisms will be shown and
discussed.
Figure 5.14 showed the effect of different amounts of oxalic acid on the effect of 50
ppm Fe3+ and Cr3+ on the MZW of ammonium sulfate. It could be clearly seen, that
the oxalic acid reduced the effect of both trivalent metal ions. Noticeable are the
strong differences in the efficiency. For Fe3+ the effect completely disappeared at a
mass ratio of 4:1 to 8:1 (oxalic acid:Fe3+) and for Cr3+ the effect only could be reduced
to half at a ratio of 16:1. The open question is about the origin of these obvious
differences. One possible explanation is a different mechanism behind the effect on
both metal ions, Fe3+ and Cr3+. It is well known from literature that oxalic acid is a
Discussion
85
quiet strong reducing agent. So the preferred mechanism for the effect of oxalic acid
on Fe3+ would be the reduction from Fe3+ to Fe2+ as shown in Eq. 6.7:
Reduction: E0 = +0.77 V (6.5)
Oxidation: E0 = -0.47 V (6.6)
(6.7)
By adding oxalic acid to an ammonium sulfate solution contaminated by Fe3+ ions, the
color of the solution changes from yellow/pale orange to pale green which is a
further evidence for the reduction. It was already shown in Chapter 5.3.1 that Fe2+
ions have only a negligible influence on the MZW of ammonium sulfate even at high
concentrations up to 1000 ppm (Fig 5.8 B). Summarizing these facts it can be said that
the effect of oxalic acid on the effect of Fe3+ is caused by a reduction.
But this is not a sufficient prove for the effect of oxalic acid on Cr3+ since there is no
possible reduction of Cr3+ ions. Consequently, another mechanism has to be
responsible. In the literature a ligand exchange reaction as shown by Equations 6.8
and 6.9 (taken from [Ham53] was reported by several authors (e.g. [Ham53] and
[Ban66]).
(6.8)
(6.9)
Thereby one water ligand is exchanged by an oxalate ion and a so-called mono-
oxalato-penta-aquo-chromium complex is built. This reaction is accompanied with a
color shift from green to reddish-purple [Ham53]. A look at Equations 6.9 to 6.11
indicates the equilibrium to be pH value dependent due to the two H+ ions on the
right side of the equation. It is also possible that more water molecules are
exchanged by an oxalate ion and a bis-oxalato-chromium complex (see Eq. 6.10) or a
tris-oxalato-chromium complex is built (Eq. 6.11):
(6.10)
(6.11)
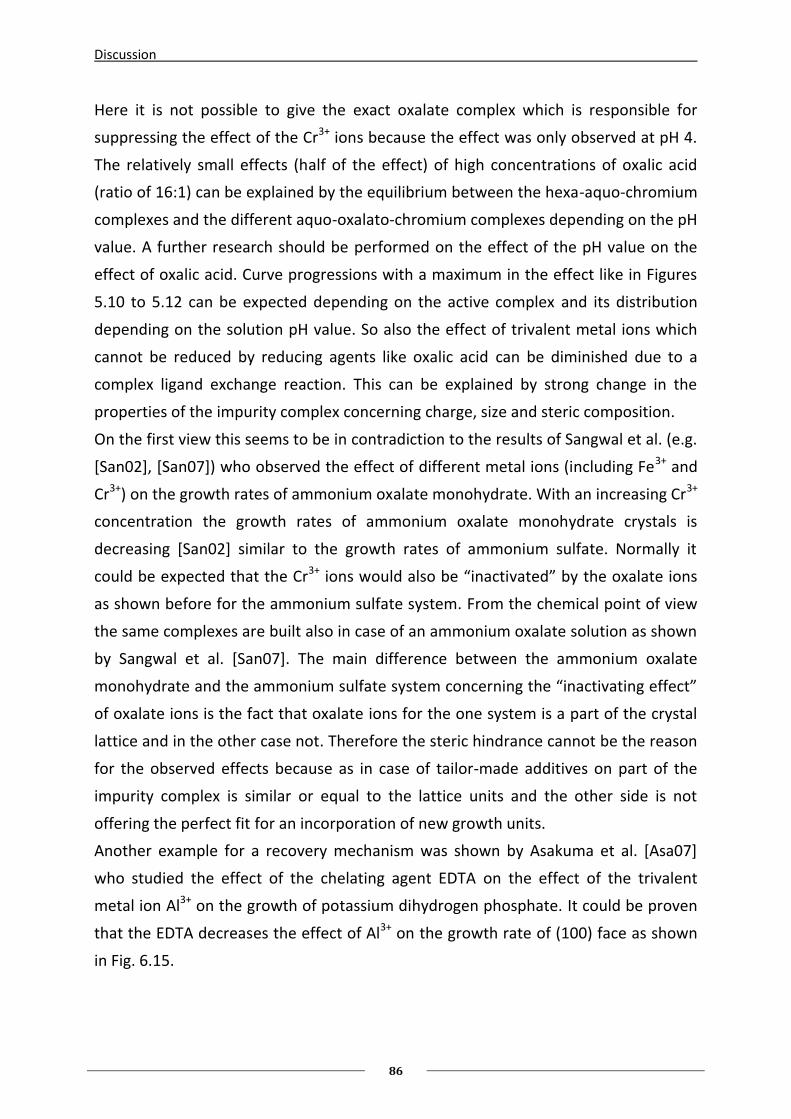
Discussion
86
Here it is not possible to give the exact oxalate complex which is responsible for
suppressing the effect of the Cr3+ ions because the effect was only observed at pH 4.
The relatively small effects (half of the effect) of high concentrations of oxalic acid
(ratio of 16:1) can be explained by the equilibrium between the hexa-aquo-chromium
complexes and the different aquo-oxalato-chromium complexes depending on the pH
value. A further research should be performed on the effect of the pH value on the
effect of oxalic acid. Curve progressions with a maximum in the effect like in Figures
5.10 to 5.12 can be expected depending on the active complex and its distribution
depending on the solution pH value. So also the effect of trivalent metal ions which
cannot be reduced by reducing agents like oxalic acid can be diminished due to a
complex ligand exchange reaction. This can be explained by strong change in the
properties of the impurity complex concerning charge, size and steric composition.
On the first view this seems to be in contradiction to the results of Sangwal et al. (e.g.
[San02], [San07]) who observed the effect of different metal ions (including Fe3+ and
Cr3+) on the growth rates of ammonium oxalate monohydrate. With an increasing Cr3+
concentration the growth rates of ammonium oxalate monohydrate crystals is
decreasing [San02] similar to the growth rates of ammonium sulfate. Normally it
could be expected that the Cr3+ ions would also be “inactivated” by the oxalate ions
as shown before for the ammonium sulfate system. From the chemical point of view
the same complexes are built also in case of an ammonium oxalate solution as shown
by Sangwal et al. [San07]. The main difference between the ammonium oxalate
monohydrate and the ammonium sulfate system concerning the “inactivating effect”
of oxalate ions is the fact that oxalate ions for the one system is a part of the crystal
lattice and in the other case not. Therefore the steric hindrance cannot be the reason
for the observed effects because as in case of tailor-made additives on part of the
impurity complex is similar or equal to the lattice units and the other side is not
offering the perfect fit for an incorporation of new growth units.
Another example for a recovery mechanism was shown by Asakuma et al. [Asa07]
who studied the effect of the chelating agent EDTA on the effect of the trivalent
metal ion Al3+ on the growth of potassium dihydrogen phosphate. It could be proven
that the EDTA decreases the effect of Al3+ on the growth rate of (100) face as shown
in Fig. 6.15.
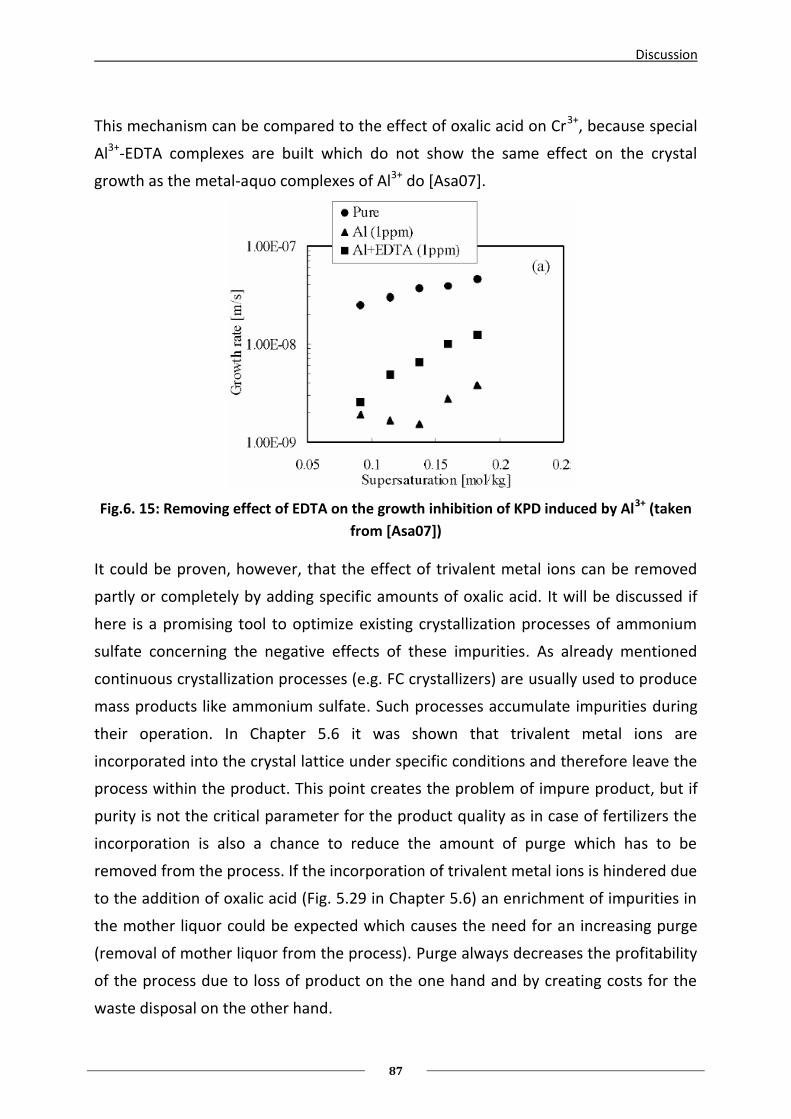
Discussion
87
This mechanism can be compared to the effect of oxalic acid on Cr3+, because special
Al3+-EDTA complexes are built which do not show the same effect on the crystal
growth as the metal-aquo complexes of Al3+ do [Asa07].
Fig.6. 15: Removing effect of EDTA on the growth inhibition of KPD induced by Al3+ (taken
from [Asa07])
It could be proven, however, that the effect of trivalent metal ions can be removed
partly or completely by adding specific amounts of oxalic acid. It will be discussed if
here is a promising tool to optimize existing crystallization processes of ammonium
sulfate concerning the negative effects of these impurities. As already mentioned
continuous crystallization processes (e.g. FC crystallizers) are usually used to produce
mass products like ammonium sulfate. Such processes accumulate impurities during
their operation. In Chapter 5.6 it was shown that trivalent metal ions are
incorporated into the crystal lattice under specific conditions and therefore leave the
process within the product. This point creates the problem of impure product, but if
purity is not the critical parameter for the product quality as in case of fertilizers the
incorporation is also a chance to reduce the amount of purge which has to be
removed from the process. If the incorporation of trivalent metal ions is hindered due
to the addition of oxalic acid (Fig. 5.29 in Chapter 5.6) an enrichment of impurities in
the mother liquor could be expected which causes the need for an increasing purge
(removal of mother liquor from the process). Purge always decreases the profitability
of the process due to loss of product on the one hand and by creating costs for the
waste disposal on the other hand.
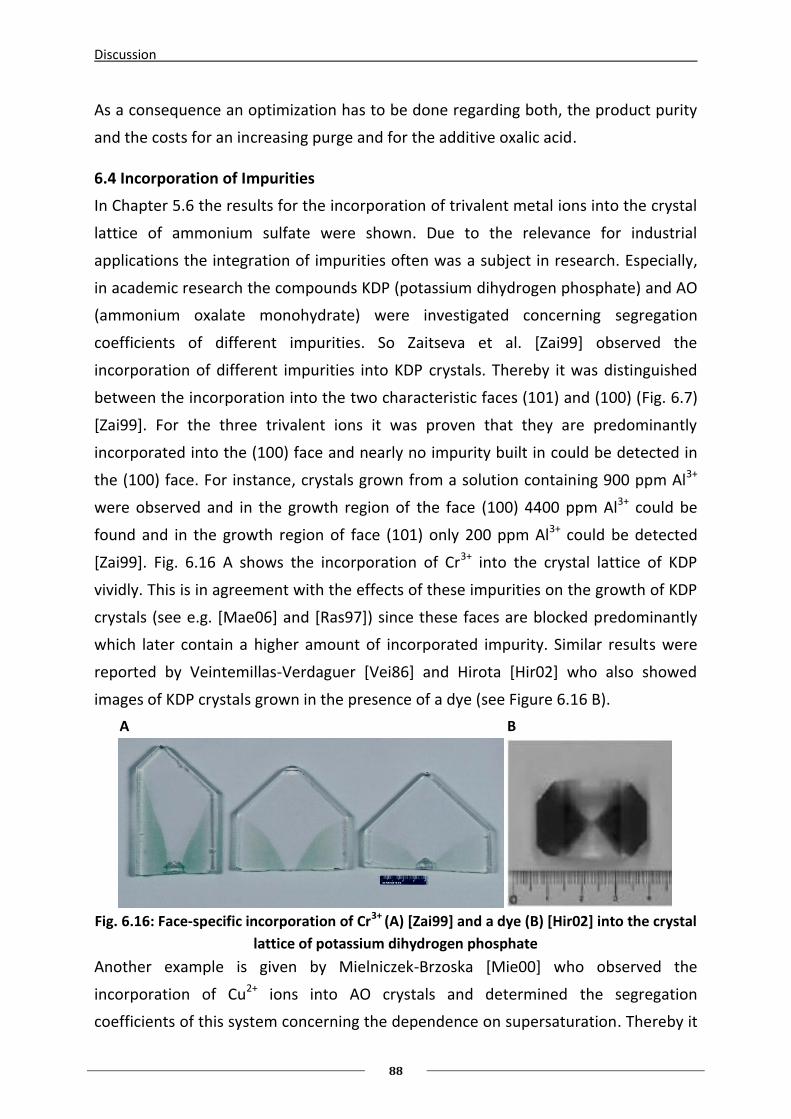
Discussion
88
As a consequence an optimization has to be done regarding both, the product purity
and the costs for an increasing purge and for the additive oxalic acid.
6.4 Incorporation of Impurities
In Chapter 5.6 the results for the incorporation of trivalent metal ions into the crystal
lattice of ammonium sulfate were shown. Due to the relevance for industrial
applications the integration of impurities often was a subject in research. Especially,
in academic research the compounds KDP (potassium dihydrogen phosphate) and AO
(ammonium oxalate monohydrate) were investigated concerning segregation
coefficients of different impurities. So Zaitseva et al. [Zai99] observed the
incorporation of different impurities into KDP crystals. Thereby it was distinguished
between the incorporation into the two characteristic faces (101) and (100) (Fig. 6.7)
[Zai99]. For the three trivalent ions it was proven that they are predominantly
incorporated into the (100) face and nearly no impurity built in could be detected in
the (100) face. For instance, crystals grown from a solution containing 900 ppm Al3+
were observed and in the growth region of the face (100) 4400 ppm Al3+ could be
found and in the growth region of face (101) only 200 ppm Al3+ could be detected
[Zai99]. Fig. 6.16 A shows the incorporation of Cr3+ into the crystal lattice of KDP
vividly. This is in agreement with the effects of these impurities on the growth of KDP
crystals (see e.g. [Mae06] and [Ras97]) since these faces are blocked predominantly
which later contain a higher amount of incorporated impurity. Similar results were
reported by Veintemillas-Verdaguer [Vei86] and Hirota [Hir02] who also showed
images of KDP crystals grown in the presence of a dye (see Figure 6.16 B).
A B
Fig. 6.16: Face-specific incorporation of Cr3+ (A) [Zai99] and a dye (B) [Hir02] into the crystal
lattice of potassium dihydrogen phosphate
Another example is given by Mielniczek-Brzoska [Mie00] who observed the
incorporation of Cu2+ ions into AO crystals and determined the segregation
coefficients of this system concerning the dependence on supersaturation. Thereby it
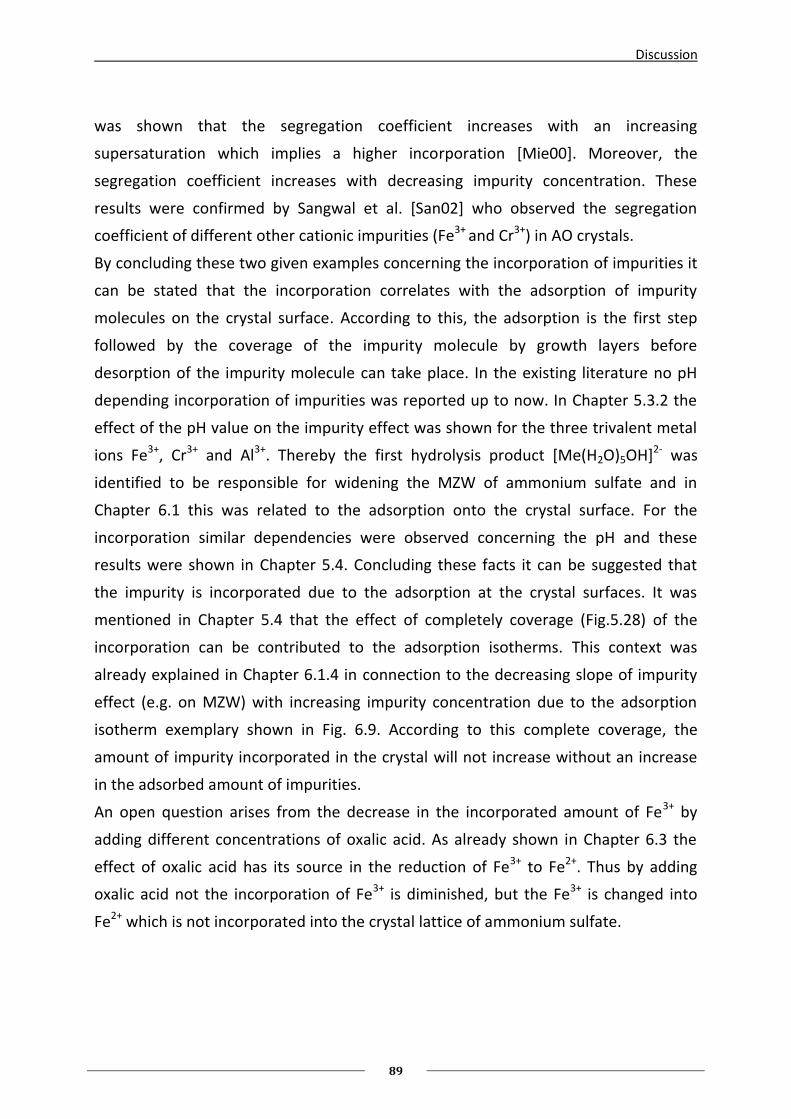
Discussion
89
was shown that the segregation coefficient increases with an increasing
supersaturation which implies a higher incorporation [Mie00]. Moreover, the
segregation coefficient increases with decreasing impurity concentration. These
results were confirmed by Sangwal et al. [San02] who observed the segregation
coefficient of different other cationic impurities (Fe3+ and Cr3+) in AO crystals.
By concluding these two given examples concerning the incorporation of impurities it
can be stated that the incorporation correlates with the adsorption of impurity
molecules on the crystal surface. According to this, the adsorption is the first step
followed by the coverage of the impurity molecule by growth layers before
desorption of the impurity molecule can take place. In the existing literature no pH
depending incorporation of impurities was reported up to now. In Chapter 5.3.2 the
effect of the pH value on the impurity effect was shown for the three trivalent metal
ions Fe3+, Cr3+ and Al3+. Thereby the first hydrolysis product [Me(H2O)5OH]2- was
identified to be responsible for widening the MZW of ammonium sulfate and in
Chapter 6.1 this was related to the adsorption onto the crystal surface. For the
incorporation similar dependencies were observed concerning the pH and these
results were shown in Chapter 5.4. Concluding these facts it can be suggested that
the impurity is incorporated due to the adsorption at the crystal surfaces. It was
mentioned in Chapter 5.4 that the effect of completely coverage (Fig.5.28) of the
incorporation can be contributed to the adsorption isotherms. This context was
already explained in Chapter 6.1.4 in connection to the decreasing slope of impurity
effect (e.g. on MZW) with increasing impurity concentration due to the adsorption
isotherm exemplary shown in Fig. 6.9. According to this complete coverage, the
amount of impurity incorporated in the crystal will not increase without an increase
in the adsorbed amount of impurities.
An open question arises from the decrease in the incorporated amount of Fe3+ by
adding different concentrations of oxalic acid. As already shown in Chapter 6.3 the
effect of oxalic acid has its source in the reduction of Fe3+ to Fe2+. Thus by adding
oxalic acid not the incorporation of Fe3+ is diminished, but the Fe3+ is changed into
Fe2+ which is not incorporated into the crystal lattice of ammonium sulfate.
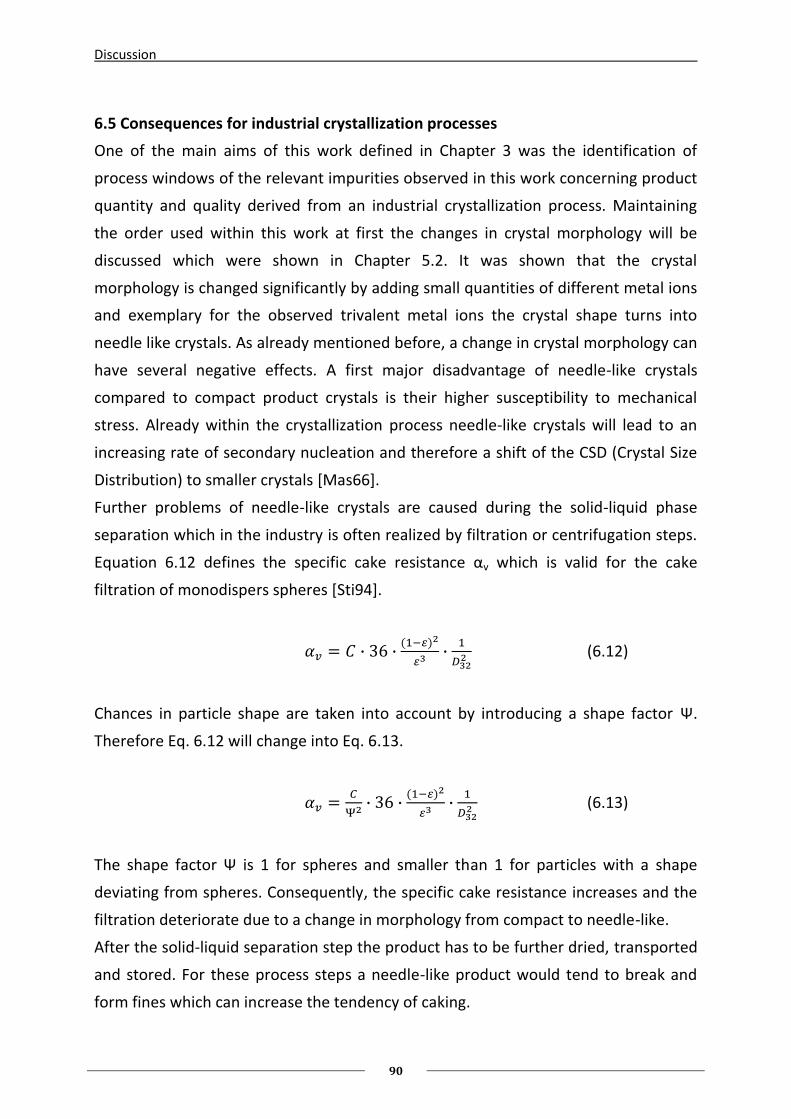
Discussion
90
6.5 Consequences for industrial crystallization processes
One of the main aims of this work defined in Chapter 3 was the identification of
process windows of the relevant impurities observed in this work concerning product
quantity and quality derived from an industrial crystallization process. Maintaining
the order used within this work at first the changes in crystal morphology will be
discussed which were shown in Chapter 5.2. It was shown that the crystal
morphology is changed significantly by adding small quantities of different metal ions
and exemplary for the observed trivalent metal ions the crystal shape turns into
needle like crystals. As already mentioned before, a change in crystal morphology can
have several negative effects. A first major disadvantage of needle-like crystals
compared to compact product crystals is their higher susceptibility to mechanical
stress. Already within the crystallization process needle-like crystals will lead to an
increasing rate of secondary nucleation and therefore a shift of the CSD (Crystal Size
Distribution) to smaller crystals [Mas66].
Further problems of needle-like crystals are caused during the solid-liquid phase
separation which in the industry is often realized by filtration or centrifugation steps.
Equation 6.12 defines the specific cake resistance αv which is valid for the cake
filtration of monodispers spheres [Sti94].
(6.12)
Chances in particle shape are taken into account by introducing a shape factor Ψ.
Therefore Eq. 6.12 will change into Eq. 6.13.
(6.13)
The shape factor Ψ is 1 for spheres and smaller than 1 for particles with a shape
deviating from spheres. Consequently, the specific cake resistance increases and the
filtration deteriorate due to a change in morphology from compact to needle-like.
After the solid-liquid separation step the product has to be further dried, transported
and stored. For these process steps a needle-like product would tend to break and
form fines which can increase the tendency of caking.
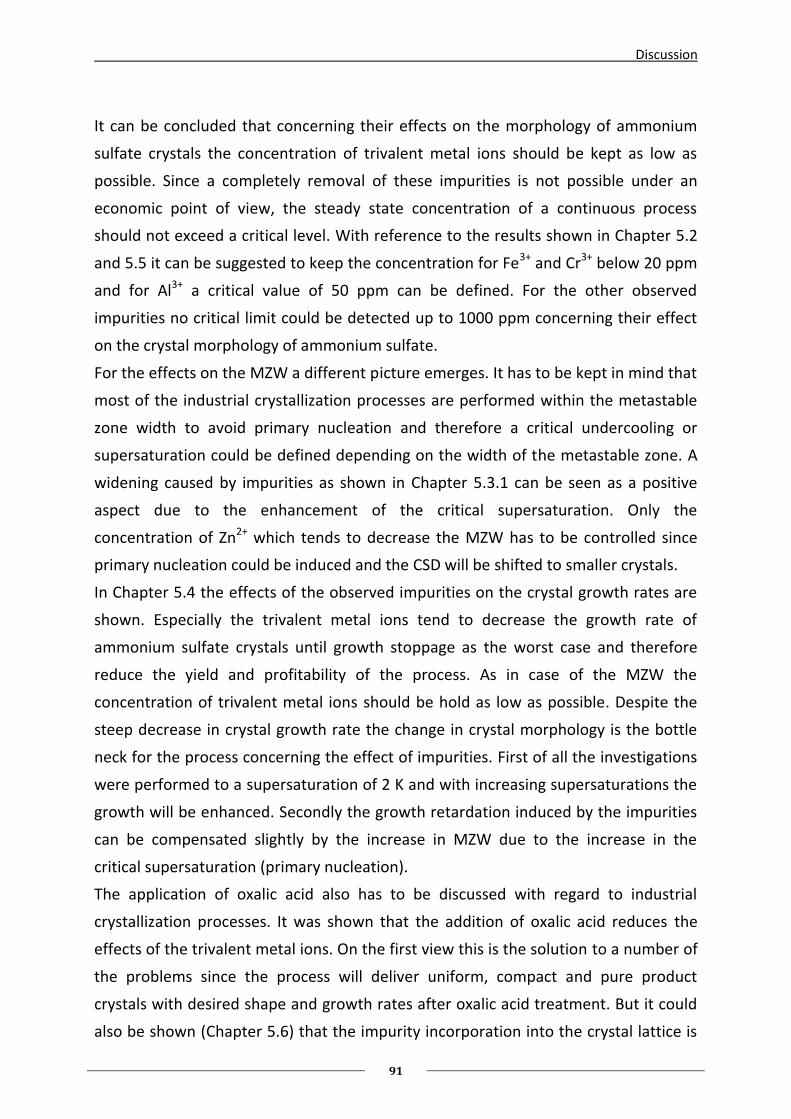
Discussion
91
It can be concluded that concerning their effects on the morphology of ammonium
sulfate crystals the concentration of trivalent metal ions should be kept as low as
possible. Since a completely removal of these impurities is not possible under an
economic point of view, the steady state concentration of a continuous process
should not exceed a critical level. With reference to the results shown in Chapter 5.2
and 5.5 it can be suggested to keep the concentration for Fe3+ and Cr3+ below 20 ppm
and for Al3+ a critical value of 50 ppm can be defined. For the other observed
impurities no critical limit could be detected up to 1000 ppm concerning their effect
on the crystal morphology of ammonium sulfate.
For the effects on the MZW a different picture emerges. It has to be kept in mind that
most of the industrial crystallization processes are performed within the metastable
zone width to avoid primary nucleation and therefore a critical undercooling or
supersaturation could be defined depending on the width of the metastable zone. A
widening caused by impurities as shown in Chapter 5.3.1 can be seen as a positive
aspect due to the enhancement of the critical supersaturation. Only the
concentration of Zn2+ which tends to decrease the MZW has to be controlled since
primary nucleation could be induced and the CSD will be shifted to smaller crystals.
In Chapter 5.4 the effects of the observed impurities on the crystal growth rates are
shown. Especially the trivalent metal ions tend to decrease the growth rate of
ammonium sulfate crystals until growth stoppage as the worst case and therefore
reduce the yield and profitability of the process. As in case of the MZW the
concentration of trivalent metal ions should be hold as low as possible. Despite the
steep decrease in crystal growth rate the change in crystal morphology is the bottle
neck for the process concerning the effect of impurities. First of all the investigations
were performed to a supersaturation of 2 K and with increasing supersaturations the
growth will be enhanced. Secondly the growth retardation induced by the impurities
can be compensated slightly by the increase in MZW due to the increase in the
critical supersaturation (primary nucleation).
The application of oxalic acid also has to be discussed with regard to industrial
crystallization processes. It was shown that the addition of oxalic acid reduces the
effects of the trivalent metal ions. On the first view this is the solution to a number of
the problems since the process will deliver uniform, compact and pure product
crystals with desired shape and growth rates after oxalic acid treatment. But it could
also be shown (Chapter 5.6) that the impurity incorporation into the crystal lattice is

Discussion
92
diminished or removed by adding oxalic acid. This causes the problem of impurity
enrichment within the continuous process and induces the need for an increasing
purge of mother liquor. Hence, for every process the optimal balance between purity,
crystal morphology and growth rates (yield) on the one hand and costs for the
additive oxalic acid and the loss through mother liquor discharge has to be found.
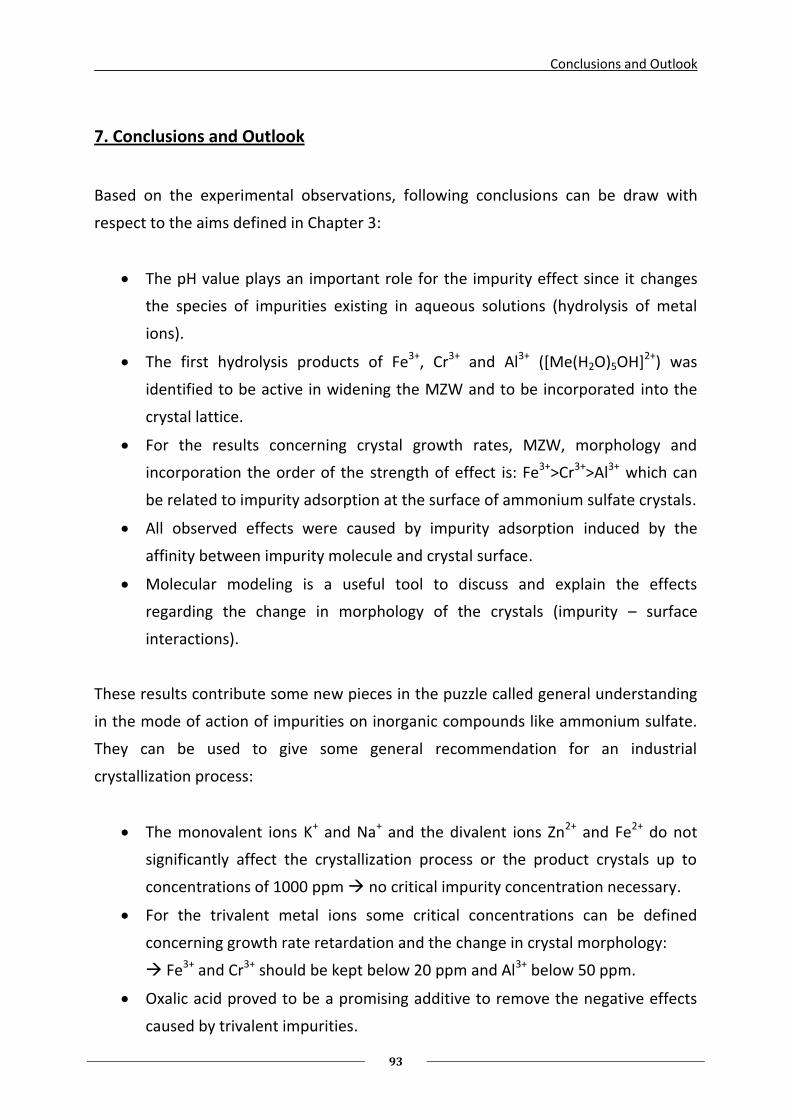
Conclusions and Outlook
93
7. Conclusions and Outlook
Based on the experimental observations, following conclusions can be draw with
respect to the aims defined in Chapter 3:
The pH value plays an important role for the impurity effect since it changes
the species of impurities existing in aqueous solutions (hydrolysis of metal
ions).
The first hydrolysis products of Fe3+, Cr3+ and Al3+ ([Me(H2O)5OH]2+) was
identified to be active in widening the MZW and to be incorporated into the
crystal lattice.
For the results concerning crystal growth rates, MZW, morphology and
incorporation the order of the strength of effect is: Fe3+>Cr3+>Al3+ which can
be related to impurity adsorption at the surface of ammonium sulfate crystals.
All observed effects were caused by impurity adsorption induced by the
affinity between impurity molecule and crystal surface.
Molecular modeling is a useful tool to discuss and explain the effects
regarding the change in morphology of the crystals (impurity – surface
interactions).
These results contribute some new pieces in the puzzle called general understanding
in the mode of action of impurities on inorganic compounds like ammonium sulfate.
They can be used to give some general recommendation for an industrial
crystallization process:
The monovalent ions K+ and Na+ and the divalent ions Zn2+ and Fe2+ do not
significantly affect the crystallization process or the product crystals up to
concentrations of 1000 ppm no critical impurity concentration necessary.
For the trivalent metal ions some critical concentrations can be defined
concerning growth rate retardation and the change in crystal morphology:
Fe3+ and Cr3+ should be kept below 20 ppm and Al3+ below 50 ppm.
Oxalic acid proved to be a promising additive to remove the negative effects
caused by trivalent impurities.
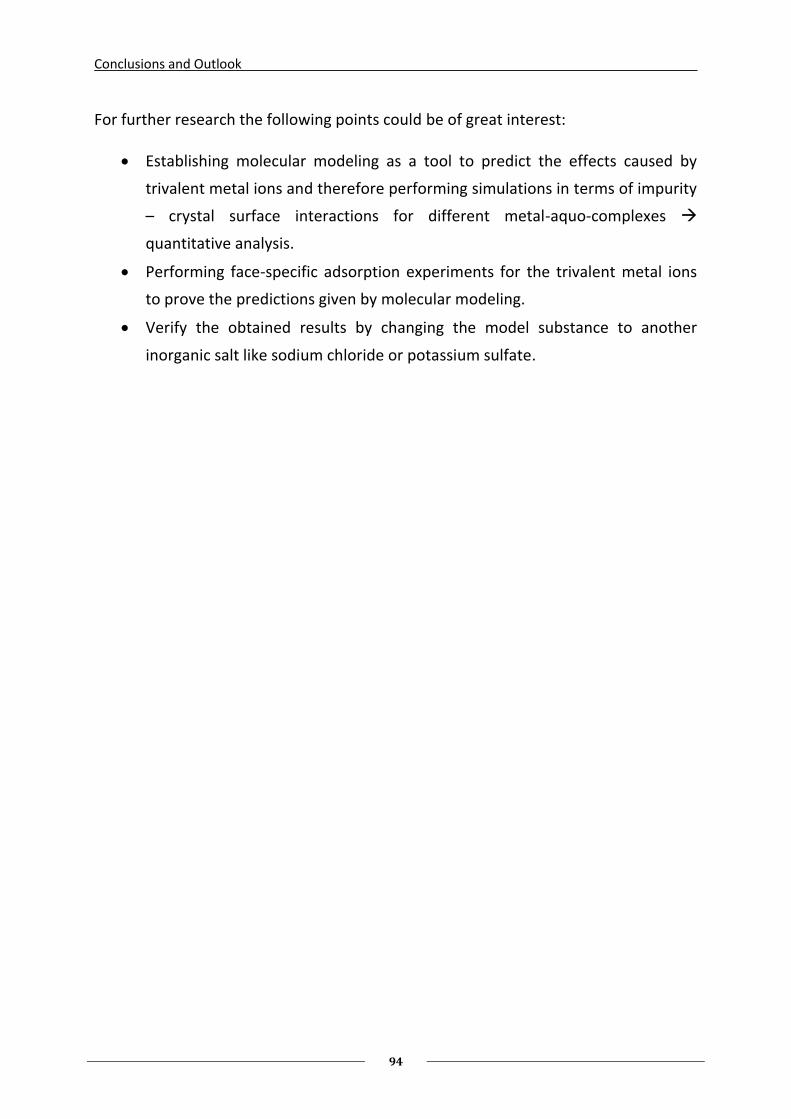
Conclusions and Outlook
94
For further research the following points could be of great interest:
Establishing molecular modeling as a tool to predict the effects caused by
trivalent metal ions and therefore performing simulations in terms of impurity
– crystal surface interactions for different metal-aquo-complexes
quantitative analysis.
Performing face-specific adsorption experiments for the trivalent metal ions
to prove the predictions given by molecular modeling.
Verify the obtained results by changing the model substance to another
inorganic salt like sodium chloride or potassium sulfate.
Summary
95
8. Summary
Industrial crystallization processes of inorganic mass products like ammonium sulfate
are often continuous, large scale and use waste streams of other chemical reaction
pathways as raw materials in order to reduce costs. Therefore a critical problem
arises due to the impurities present in these feed streams. Impurities can affect the
crystallization at important points such as crystal growth rate, MZW, crystal
morphology or crystal purity.
In the available literature there is a lack of coherent information concerning the
effects of frequently occurring impurities like e.g. Fe3+, Cr3+, and Al3+ on the
crystallization as mentioned above. Therefore systematic research on these effects
was conducted by using established measurement techniques and instrumentation:
fluidized bed crystallizer, batch crystallization, microscope cell and ultrasound
velocity measurements. Both, the impurity concentration and the pH value of the
solution were varied throughout the experiments.
It was proven that mono- and divalent ions do not significantly influence any of the
observed parameters. In the contrary, the trivalent metal ions affected considerable
the MZW, the growth rates and the crystal morphology of ammonium sulfate. The
MZW of ammonium sulfate was increased by traces of trivalent metal ions due to a
shift of the nucleation curve. Furthermore, the growth rates were decreased by
adding even small amounts of trivalent metal ions until the growth was completely
stopped at a critical concentration. The obtained data were successfully fitted to the
Kubota-Mullin-model. The growth retarding effect was identified to be face specific
which led to a change in crystal morphology from compact to needle-like crystals. In
general, the order of effectiveness was identified to be Fe3+>Cr3+>Al3+ at a pH value of
4.
Moreover, it was noted that the pH value has a substantial influence on the effect of
the trivalent metal ions. Impurity specific curve shapes including maxima were
reported. Similar results with regard to the curve shapes were obtained for the
incorporation of trivalent metal ions into the product crystals. Based on the
hydrolysis of metal ions in aqueous solution which depend on the pH, a distribution
of metal-aquo-complexes was simulated and compared to the pH dependent effect
on the MZW and the impurity incorporation. Thereon the first hydrolysis product
Summary
96
[Me(H2O)5OH]2+ was identified to be active in terms of widening the MZW and
changing the morphology of the crystals. The application of oxalic acid as an additive
to prevent the effects of trivalent metal ions was proven successfully. The mode of
action was discussed based on the chemistry in an aqueous solution including the
reduction of Fe3+ to Fe2+ and the formation of chromium-oxalate-complexes.
All effects described above were discussed with regard to an adsorption of the
impurities onto the crystal surface and a first approach was made concerning a
molecular modeling as an useful tool to explain the observed results.
The concluded findings were finally discussed with respect to an industrial
crystallization process of ammonium sulfate, critical impurity concentrations for the
trivalent metal ions were defined and some open questions concerning impurity
adsorption and molecular modeling were pointed out which have to be observed
further in future.
Symbols
97
Symbols
Latin Symbols
Symbol Unit Description
ci (x) ppm concentration of the impurity
kd - constant for diffusion term
kr - constant for reaction term
mi mg mass of the salt to achieve a desired ci
mtot kg total mass of the solution
mstart, mend g mass before and after fluidized bed experiment
p bar pressure
pKa - hydrolysis constant
r m radius of the nuclei
r*2D m critical radius for two-dimensional nucleation
r*3D m critical radius for three-dimensional nucleation
t s time
tind s induction time for nucleation
tr s relaxation time
tn s time to form stable nuclei
tg s time to grow to a detectable size
v (R) ms-1 crystal growth velocity
v0 ms-1 crystal growth velocity at pure conditions
vUS ms-1 ultrasound velocity
z - stoichiometric number
A m² area
A1 - constant for nucleation rate
A2 and A3 - constants for the B+S model
A4 and A5 - constants for the BCF model
GL and GW ms-1 growth rate into length and into width
GG and GD ms-1 growth rate and dissolution rate
I M ionic strength
J #*m-3*s-1 nucleation rate
K ppm-1 adsorption constant (e.g. Langmuir)
L1 µm arithmetic average of the sieve fraction
Symbols
98
Mi and Mi,tot gmol-1 molar mass of the impurity ion and total molar mass of the
salt
T °C temperature
Greek Symbols
Symbol Unit Description
α - impurity effectiveness factor
βad adiabatic compressibility
γ J*m² solid-liquid interfacial energy
ρ kg*m-3 density
σ (S) - supersaturation level
ΔG J total free energy
ΔGS J surface excess free energy
ΔGV J volume excess free energy
ΔH kJ*mol-1 heat of solution
Κ - ratio of MZW with to MZW without impurities
Θeq - equilibrium surface coverage
Ω m³*mol-1 molecular volume
Abbreviations
Abbreviation Description
AO ammonium oxalate
conc. concentration
EU eutectic
KDP potassium dihydrogen phosphate
Me metal
MZW metastable zone width
ppm parts per million
SOL solution
Tnuc nucleation temperature
Tsol solubility temperature
References
99
References
[AlA08] A. Al-Atia: Crystallization of Inorganic Compounds – Scaling in Seawater
Desalination. PhD thesis (2008), Martin-Luther University Halle-
Wittenberg, published online:
http://sundoc.bibliothek.uni-halle.de/diss-online/08/09H003/index.htm
[Ald99] L. Alderighi, P. Gans, A. Ienco, D. Peters, A. Sabatini, A. Vacca:
Hyperquad simulation and speciation(HySS): a utility program for the
investigation of equilibria involving soluble and partially soluble species.
Coord. Chem. Rev. 184 (1999), 311-318
[AlJ01] S. Al-Jibbouri, J. Ulrich: The influence of impurities on crystallization
kinetics of sodium chloride. Cryst. Res. Technol. 36 (2001) 12, 1365-
1375
[AlJ02] S. Al-Jibbouri: Effects of Additives in Solution Crystallization, PhD thesis
(2002), Martin-Luther University Halle-Wittenberg, published online:
http://sundoc.bibliothek.uni-halle.de/diss-online/02/03H046/index.htm
[AlS96] A. Al-Sabbagh: Zur KCl- und NaCl-Kristallisation in Anwesenheit von
Fremdstoffen. PhD thesis (1996), RWTH Aachen
[Asa07] Y. Asakuma, M. Nishimura, M. Kimura, H.M. Ang, M.O. Tade, K. Maeda,
K. Fukui: Experimental and theoretical study of recovery mechanism of
impurity effect by the addition of EDTA. Cryst. Res. Technol. 42 (2007) 5,
424-431
[Asa08] Y. Asakuma, L. Jee, M. Nishimura, H. Ming Ang, M. Tade, K. Maeda, K.
Fukui: Quantum estimation of impurity effect for KDP crystal growth. J.
Mol. Struct. 851 (2008) 225-231
[Asa09] Y. Asakuma, S. Takeda, K. Maeda, K. Fukui: Kinetic and theoretical
studies of metal ion adsorption in KDP solution. Appl. Surf. Sci. 255
(2009) 4140-4144
[Bli56] G. Blisnakov, E. Kirkova: Der Einfluss der Adsorption auf das
Kristallwachstum. Z. Phys. Chem. 206 (1957), 271-280
[Bae76] C. Baes, R.E. Mesmer: The hydrolysis of cations. Wiley, New York, 1976
References
100
[Ban66] D. Banerjea, M.S. Mohan: Kinetics and Mechanism of formation of Cis-
diaquo-bis-oxalato-chromate(ɪɪɪ) from the Mono-oxalato Complex and
Oxalate Ions. ZAAC 347 (1966) 107-112
[Bar02] P. Barrett, B. Glennon: Characterizing the metastable zone width and
solubility curve using lasentec FBRM and PVM. Trans IChemE 80 (2002)
799-805
[Boi88] R. Boistelle, J. P. Astier: Crystallization mechanism in solution. J. Cryst.
Growth 90 (1988) 14-30
[Bro85] P.L. Brown, R.N. Sylva, G.E. Batley, J. Ellis. The hydrolysis of metal ions.
Part 8 Aluminum(ɪɪɪ). J. Chem. Soc. Dalton Trans. (1967-1970)
[Byr00] R.H. Byrne, Y.-R. Luo, R.W. Young: Iron hydrolysis and solubility
revisited: observations and comments on iron hydrolysis
characterizations. Mar. Chem. 70 (2000) 23-35
[Cab58] N. Cabrera, D. A. Vermilyea: The growth of crystals from solution, in R.H.
Doremus et al. (Eds.), Perfection of Crystals, Wiley, New York, 1958,
393-407
[Cha97] C.M. Chang, M.K. Wang: Global relationship between the acitidy
constants and structural stability in hexaaqua metal complexes. J. Mol.
Struct. 417 (1997) 237-240
[Dav74] R.J. Davey, J.W. Mullin: Growth of the {100} faces of ammonium
dihydrogen phosphate crystals in the presence of ionic species. J. Cryst.
Growth 26 (1974) 203-208
[Fab96] J. Fabian: Untersuchungen zur Auflösungskinetik in der
Lösungskristallisation. PhD thesis (1996), University Bremen
[Fie07] A. Fiebig: Prediction of Crystal Morphology for a Limited Range of
Impurity Concentrations. PhD thesis (2007), Martin-Luther University
Halle-Wittenberg, Shaker Verlag, Aachen, 2008
[Gan96] P. Gans, A. Sabatini, A. Vacca: Investigation of equilibria in solution.
Determination of equilibrium constants with the HYPERQUAD suite of
programs. Talanta 43 (1996) 10, 1739-1753
[Gar71] J. Garside: The concept of effectiveness factors in crystal growth. Chem.
Eng. Sci. 26 (1971) 1425-1431
[GES10] GESTIS Stoffdatenbank des IFA downloaded at 29.09.2010
(http://biade.itrust.de/biade/lpext.dll?f=templates&fn=main-h.htm)
References
101
[Gou09] M. Gougazeh, W. Omar, J. Ulrich: Growth and dissolution kinetics of
potassium sulfate in pure solutions and in presence of Cr3+ ions. Cryst.
Res. Technol. 44 (2009) 11, 1205-1210
[Guz97] L.A. Guzman, K. Maeda, S. Hirota, M. Yokota, N. Kubota: Unsteady-state
impurity effect of chromium (ɪɪɪ) on the growth rate of potassium
sulfate crystal in aqueous solution. J. Cryst. Growth 181 (1997) 272-280
[Guz98] L.A. Guzman, K. Maeda, S. Hirota, N. Kubota: Adsorption of growth
suppressor chromium (ɪɪɪ) on potassium sulfate crystals in aqueous
solution. J. Cryst. Growth 186 (1998) 438-445
[Ham53] R.E. Hamm, R.E. Davis: Complex Ions of Chromium. 3. Reactions
between Hexaquochromium(ɪɪɪ) and Oxalate Ions. J. Amer. Chem. Soc.
75 (1953) 3085-3089
[Har55] P. Hartmann, W.G. Perdok: On the relations between structure and
morphology of crystals. Acta. Cryst. 8 (1955) 525-529
[Hay73] T. Hayakawa, M. Matsuoka: Effect of heat transfer on crystal growth
rate for inorganic salt-water systems. Japanese Research 2 (1973) 104-
115
[Hir02] S. Hirota, H. Miki, K. Fukui, K. Maeda: Coloring and habit modification of
dyed KDP crystals as functions of supersaturation and dye
concentration. J. Cryst. Growth 235 (2002) 541-546
[Hof04] G. Hofmann: Kristallisation in der industriellen Praxis. Wiley-VCH,
Weinheim, 2004
[Hys10] Program HySS downloaded for free of charge from internet at
11.03.2009 http://www.chim1.unifi.it/group/vacsab/hyss.htm
[Kas02] D. Kashchiev, A. Firoozabadi: Nucleation of gas hydrates. J. Cryst.
Growth 243 (2002) 3-4, 476-489
[Kit92] M. Kitamura, K. Ikemoto, Y. Kawamura, T. Nakai: Effect of Impurity of
Cr3+ on Crystal-Growth Process of Ammonium Sulfate. Intern. Chem. Eng
32 (1992) 157-163
[Kru93] M. Kruse: Zur Modellierung der Wachstumskinetik in der
Lösungskristallisation. PhD thesis (1993), University Bremen, VDI Verlag,
Reihe 3, Nr. 309, Düsseldorf, 1993
References
102
[Kub88] N.Kubota, I. Uchiyama, K. Nakai, K. Shimizu: Change of solubility of
potassium sulfate in water caused by traces of chromium (ɪɪɪ). Ind. Eng.
Chem. Res. 27 (1988) 930-934
[Kub95a] N. Kubota, J. W. Mullin: A Kinetic Model for Crystal Growth from Aqeous
Solution in the Presence of Impurity. J. Cryst. Growth 152 (1995) 203-
208
[Kub95b] N. Kubota, J. Fukazawa, H. Yashiro, J.W. Mullin: Impurity effect of
chromium (ɪɪɪ) on the growth and dissolution rates of potassium sulfate
crystals. J. Cryst. Gowth 149 (1995) 113-119
[Kub97] N. Kubota, M. Yokota, J.W. Mullin: Supersaturation dependence of
crystal growth in solutions in presence of impurity. J. Cryst. Growth 182
(1997) 86-94
[Kub99] N. Kubota, K. Katagiri, M. Yokota, A. Sato, H. Yashiro, K. Itai: Impurity
effect of iron(ɪɪɪ) on the growth of potassium sulfate crystal in aqueous
solution. J. Cryst. Growth 196 (1999) 156-163
[Kub00] N. Kubota, H. Otosaka, N. Doki, M. Yokota, A. Sato: Effect of lead
impurity on the growth of sodium chloride crystals. J. Cryst. Growth 220
(2000) 135-139
[Lar73] M.A. Larson, J.W. Mullin: Crystallization kinetics of ammonium sulphate.
J. Cryst. Growth 20 (1973) 183-191
[Leu89] V.W.-H. Leung, B.W. Darwell, A.P.-C. Chan: A rapid algorithm for
solution of the equations of multiple equilibrium systems – RAMEDES.
Talanta 35 (1989) 9, 713-718
[Lin79] W.L. Lindsay: Chemical Equilibria in Soils. Wiley Interscience, New York,
1979, 385-422
[Lu03] J.J. Lu: Predicting Crystal Morhology in the Presence of Additives by
Molecular Modeling. PhD thesis (2003), Martin-Luther University Halle-
Wittenberg, Shaker Verlag, Aachen, 2004
[Lüh96] J. Lühmann: Optische on-line Meßtechnik zur Bestimmung der Kristall-
wachstumsgeschwindigkeit. PhD thesis (1996), University Bremen,
Verlag Mainz, Aachen, 1996
[Mae06] K. Maeda, R. Tabuchi, Y. Asakuma, K. Fukui: Distribution of metallic ions
in a single KDP crystal grown from aqueous solution. Cryst. Res. Technol.
41 (2006) 10, 955-960
References
103
[Mas66] R.E.A. Mason, R.F. Strickland-Constable: Breeding of crystal nuclei.
Trans. Faraday Soc. 62 (1966) 455-461
[Mat91] M. Matsuoka, J. Garside: Non-Isothermal effectiveness factors and the
role of heat transfer in crystal growth from solutions and melts. Chem.
Eng. Sci 46 (1991) 1, 183-192
[May79] H.M. May, P.A. Helmke, M.L. Jackson. Gibbsite solubility and
thermodynamic properties of hydroxyl-aluminum ions in aqueous
solution at 25 °C. Geochim. Cosmochim. Acta 43 (1979), 861-868
[Mes70] Th. Messing: Probleme und ihre Lösung bei der Massenkristallisation.
Chem. Ing. Tech. 42 (1970) 1141-1148
[Mul70] J.W. Mullin, M. Chakraborty, K. Mehta: Nucleation and growth of
ammonium sulfate crystals from aqueous solution. J. appl. Chem. 20
(1970) 367-371
[Mul79] J.W. Mullin, S.J. Jancic: Interpretation of metastable zone width. IChemE
59 (1979) 188-193
[Mul93] J.W. Mullin: Crystallization. 3th edition, Butterworth-Heinemann, Oxford,
1993
[Mye02] A.S. Myerson: Handbook of Industrial Crystallization. 2nd edition,
Butterworth-Heinemann, Woburn, 2002
[Nie95] S. Niehörster, J. Ulrich: Designing Crystal Morphology by a Simple
Approach. Cryst. Res. Technol. 30 (1995) 3, 389-395
[Nöl02] J. Nölte: ICP Emissionsspektrometrie für Praktiker. Wiley-VCH ,
Weinheim, 2002
[Nyv62] J. Nývlt: Der Einfluss von Additiven auf die Kristallisation von
Ammoniumsulfat. Chemický Prumysl 12 (1962) 170-174
[Nyv70] J. Nývlt, R. Rychlý, J. Gottfried, J. Wurzelová: Metastable zone width of
some aqueous solutions. J. Cryst. Growth 6 (1970) 151-162
[Nyv85] J. Nývlt, O. Söhnel, M. Matuchova, M. Broul: The kinetics of ndustrial
crystallization. Elsevier, Amsterdam, 1985
[Nyv95] J. Nývlt, J. Ulrich: Admixtures in Crystallization. Wiley-VCH, Weinheim
(1995)
[Oma97] W. Omar, J. Ulrich: Influence of the Fe2+ Ions on the Dissolution Rate of
Potassium Chloride. Cryst. Res. Technol. 32 (1997) 6, 789-797
References
104
[Oma03] W. Omar, J. Ulrich: Influence of crystallization conditions on the
mechanism and rate of crystal growth of potassium sulfate. Cryst. Res.
Technol. 38 (2003) 1, 34-41
[Ras97] L.N. Rashkovich, N.V. Kronsky: Influence of Fe3+ and Al3+ ions on the
kinetics of steps on the {100} faces of KDP. J. Cryst. Growth 182 (1997)
434-441
[Rau00] M. Rauls, K. Bartosch, M. Kind, St. Kuch, R. Lacmann, A. Mersmann, The
influence of impurities on crystallization kinetics – a case study on
ammonium sulfate, J. Cryst. Growth 213 (2000) 116-128
[San02a] K. Sangwal, E. Mielniczek-Brzóska: Effect of Cr (ɪɪɪ) ions on the growth
kinetics of ammonium oxalate monohydrate crystals from aqueous
solutions. J. Cryst. Growth 242 (2002) 421-434
[San02b] K. Sangwal, E. Mielniczek-Brzóska, J. Borc: Study of segregation
coefficient of cationic impurities in ammonium oxalate monohydrate
crystals during growth from aqueous solutions. J. Cryst. Growth 244
(2002) 183-193
[San04] K. Sangwal, E. Mielniczek-Brzóska: Effect of impurities on metastable
zone width for the growth of ammonium oxalate monohydrate crystals
from aqueous solutions. J. Cryst. Growth 267 (2004) 662-675
[San07a] K. Sangwal, E. Mielniczek-Brzóska: Effect of cationic impurities on
solubility and crystal growth processes of ammonium oxalate
monohydrate: Role of formation of metal-oxalato-complexes. Cryst. Res.
Technol. 42 (2007) 6, 531-543
[San07b] K. Sangwal: Additives and Crystallization Processes. Wiley&Sons, New
York, 2007
[Sat88] A. Sato, Y. Umetsu, N. Kubota: Effect of Traces of Al(ɪɪɪ) on the growth
and dissolution Processes of Potassium Sulfate Crystal. Iwate Daigaku
Kogakubu Kenkyu Hokoku 41 (1988), 119-123
[Say01] P. Sayan, J. Ulrich: Determination of the metastable zone width of
ammonium sulfate in the presence of impurities by an ultrasound
technique, in 8th International Workshop on Industrial Crystallization,
BIWIC, Eds. P. Jansens, H. Kramer, M. Roelands,. Doc Vision Delft, Delft,
Netherland, 2001, 269-276.
References
105
[Sch04] H. Scherzberg, J. Bach, R. Schmitz: Gleichgewichtsdiagramme für die
Kristallisation aus Lösungen und Schmelzen. In G. Hofmann:
Kristallisation in der industriellen Praxis. Wiley-VCH, Weinheim, 2004
[Sei55] H. Seifert: The problem of crystal shape and its industrial importance.
Chem. Ing. Tech. (1955) 27, 135-142
[Sen10] SensoTech GmbH, LiquiSonic 30 Users Manual, D-39179 Magdeburg-
Barleben
[Ste07] A. Stefansson: Iron (ɪɪɪ) hydrolysis and solubility at 25 °C. Environ. Sci.
Technol 41 (2007) 6117-6123
[Ste90] M. Stepanski: Zur Wachstumskinetik in der Lösungskristallisation. PhD
thesis, University Bremen, Verlag Mainz, Aachen 1990
[Sti94] M. Stieß: Mechanische Verfahrenstechnik 2. Springer Verlag, Berlin,
1994
[Tav92] N.S. Tavare: Ammonium sulfate crystallization in a cooling batch
crystallizer. Sep. Sci. Technol. 27 (1992) 11, 1469-1487
[Tit02] S. Titiz-Sargut, J. Ulrich: Influence of additives on the width of the
Metastable Zone. Cryst. Growth Des. 2 (2002) 5, 371-374
[Tit03] S. Titiz-Sargut: Application of a protected ultrasound sensor for the
determination of the width of the metastable zone. Chem. Eng. and
Proc. 42 (2003) 841-846
[Ulr89] J. Ulrich: Growth Rate Dispersion – A Review. Cryst. Res. Technol. 24
(1989) 3, 249-257
[Ulr90] J. Ulrich: Kristallwachstumsgeschwindigkeiten bei der Kornkristallisation
- Einflussgrößen und Messtechniken. Habilitation, University Bremen,
Shaker, Aachen, 1993
[Ulr04] J. Ulrich: Fremdstoffbeeinflussung in der Kristallisation. In G. Hofmann:
Kristallisation in der industriellen Praxis. Wiley-VCH, Weinheim, 2004
[Ull05] K.H. Zapp: Ammonium Compounds. in Ullmann´s Encyclopedia of
Industrial Chemistry, 6th Edition, Wiley-VCH, Weinheim, 2005, 1-29
[Uri48] R.J. Urick: The Adsorption of sound in suspension of irregular Particles. J.
Acoust. Soc. Am. 20 (1948) 283–289.
References
106
[vBr92] G. von Brachel: Zur Beeinflussung der Kristallwachstumskinetik durch
Fremdsalze. PhD thesis (1992), RWTH Aachen, Shaker Verlag, Aachen,
1992
[VDL89] M. van der Leeden, G. van Rosmalem, K. de Vreugd, G. Witkamp:
Einfluss von Additiven und Verunreinigungen auf
Kristallisationsprozesse. Chem.-Ing.-Tech. 61 (1989) 5, 385-395
[Vei86] S. Veintemillas Verdaguer, R. Rodriguez Clemente: Crystal growth of
KDP from boiling solutions in the presence of impurities. J. Cryst.
Growth 79 (1986), 198-204
[Xu98] J. Xu, D. Imre, R. McGraw, I. Tang: Ammonium sulfate – Equilibrium and
Metastability Phase Diagrams from 40 to -50 °C. J. Phys. Chem. B (1998)
102, 7462-7469
[Zai99] N. Zaitseva, L. Carman, I. Smolsky, R. Torres, M. Yan: The effect of
impurities and supersaturation on the rapid growth of KDP crystals. J.
Cryst. Growth 204 (1999) 521-524
[Zhu08] Z. Zhu, Z. Zhu, P. Yin: Influence of Solubility of ammonium sulfate caused
by decreasing pH or addin Fe3+ from 288.15 K to 359.15 K. J. Eng. Data
53 (2008) 564-565
Statement of Authorship
107
Statement of Authorship
I declare that this document and the accompanying code have been composed by
myself, and describe my own work, unless otherwise acknowledged in the text. It has
not been entered in any previous application for a degree. All verbatim extracts have
been distinguished by quotation marks, and all sources of information have been
specifically acknowledged.
Halle/Saale, the 01.06.2011
Robert Buchfink

Curriculum Vitae
108
Curriculum Vitae
Personal Details
Born at 18. April in 1983 in Oschatz, Germany
unmarried
Internships
03/2007 – 09/2007 Sanofi-Aventis, Frankfurt/M.
02/2006 – 03/2006 Fraunhofer Institute, Halle (Saale)
Education
05/2008 – 12/2010 PhD thesis, Thermal Process Technology, Halle (Saale)
Stipendiary of the AIP e.V.
09/2007 – 03/2008 Diploma thesis, Thermal Process Technology, Halle (Saale)
09/2002 – 03/2008 Study, Engineering, Martin-Luther-University Halle-
Wittenberg
08/1993 – 06/2001 Gymnasium, Oschatz
08/1989 – 08/1993 Primary school, Borna
Community Service
08/2001 – 05/2002 Saxony Hospital Hubertusburg, Wermsdorf
Professional Life
Since 01/2011 Sales Manager, GEA Messo PT, Duisburg
Halle (Saale), the 01.06.2011
List of Publications
109
List of Publications
[1] R. Buchfink, A. Tischer, G. Patil, R. Rudolph, C. Lange: Ionic liquids as refolding
additives: Variation of the anion. J. Biotechnol. (2010), doi:10.1016/
j.biotec.2010.07.003
[2] R. Buchfink, C. Schmidt, J. Ulrich: Fe3+ as an example of the effect of trivalent
additives on the crystallization of inorganic compounds, here ammonium
sulfate. Cryst. Eng. Comm. (2010), doi:10.1039/C0CE00107D
[3] R. Buchfink, J. Ulrich: The influence of trivalent metal ions on the metastable
zone width of ammonium sulfate. Chem. Eng. Technol. (2010), under review
[4] R. Buchfink, J. Ulrich: The influence of trivalent metal ions on the metastable
zone width of ammonium sulfate. Poster presentation, proceedings, BIWIC
2010, Halle/Saale, September 2010
[5] D. Pertig, R. Buchfink, S. Petersen, T. Stelzer, J. Ulrich: In-line analyzing of
industrial crystallization processes by innovative ultrasonic probe technique.
Poster presentation, proceedings, BIWIC 2010, Halle/Saale, Cuvillier Verlag,
Göttingen, September 2010
[6] D. Pertig, R. Buchfink, S. Petersen, T. Stelzer, J. Ulrich: In-line analyzing of
industrial crystallization processes by innovative ultrasonic probe technique.
Chem. Eng. Technol. (2010), submitted
[7] R. Buchfink, J. Ulrich: Einfluss von Fremdstoffen auf wichtige Kristallisations-
parameter von Düngemittelkomponenten. Poster presentation, Fachausschuss
Kristallisation, Magdeburg, March 2010
[8] R. Buchfink, J. Ulrich: The importance of additives and the pH on crystalline
product qualities. Oral presentation, Achema 2009, Frankfurt, May 2009