Embed Size (px)
Citation preview
Eingereicht vonNikolaus Fink
Angefertigt amDepartment of Eco-nomics
ErstbeurteilerinUniv. Prof. Dr. Chris-tine Zulehner
Zweitbeurteilera. Univ. Prof. Dr.Franz Hackl
February 2016
JOHANNES KEPLERUNIVERSITAT LINZAltenbergerstraße 694040 Linz, Osterreichwww.jku.atDVR 0093696
Essays on Legal Cartels
Dissertation
zur Erlangung des akademischen Grades
Doktor der Sozial- und Wirtschaftswissenschaften
im Doktoratsstudium der
Sozial- und Wirtschaftswissenschaften
2
AbstractThe following thesis is a compilation of several papers that analyze the inner workings and theeffects of legal cartels.
Chapter 2 studies the legal sugar cartel in Austria-Hungary in 1891-1914. I analyze thecartel formation prior to 1891 that was enabled by an excise tax. The cartel started withsimple annual quotas and—despite breakdowns—learned to adapt to inventory demand, entry,internal coordination problems and lowered import protection. Detailed qualitative evidenceon the inner workings and prices, opportunity costs and sales data on a monthly basis arediscussed. The success of the cartel at subsequent stages is evaluated.
Chapter 3 and chapter 4 are joint work with Philipp Schmidt-Dengler, Konrad Stahl andChristine Zulehner. Cartels were legal to a large extent in Austria until the country’s EU acces-sion in 1995. We examine archival material on registered horizontal cartels to learn about theirinner working. Chapter 3 presents the detailed procedure of coding the data from the scanneddocuments. In chapter 4, we apply content analysis to legally binding cartel contracts andwe comprehensively document different collusion methods along the lines described by Stigler(1964). Quota cartels employ regular reporting schemes and use compensation mechanismsfor departures from set quotas. Specialization cartels divide markets and rely the least on in-formation exchange and punishment. Price and payment condition cartels primarily aim toprevent secret price cuts, requiring information provision upon request, allow for discretionarydecision-taking and (sometimes immediate) punishment. These stylized facts on the contractualarrangements suggest that the possibility to write legally binding agreements was employed toaddress the usual obstacles to sustaining collusion.
Chapter 5 evaluates the role of social partnership during the cartel registration proceedings.I analyze whether social partners used their powers as parties of the proceedings and requesteda review in order to limit damaging cartels.
Chapter 6 studies the Austrian registered cement cartel and its deregulation when Austriaacceded the European Union in 1995. Based on aggregate data on revenues, cost, employmentand industry structure, I find that the liberalization reduced average prices, profits, employmentand led to exit. However, consumer list prices for cement bags increased markedly and negativelyaffected the accuracy of several price indices.
JEL Classification: L13, L41, D43, N83, L66, L61, L51Keywords: Cartel, Collusion, Sugar Industry, Storage, Antitrust, Cement Industry, Oligopoly,
Competition Policy, Deregulation, Cartel Registry
ZusammenfassungBei der vorgelegten Arbeit handelt es um eine kumulative Dissertation, deren einzelne Teile deninneren Aufbau oder die Auswirkungen von legalen Kartellen untersuchen.
Kapitel 2 behandelt das legale Zuckerkartell in Österreich-Ungarn in der Zeit von 1891-1914. Ich untersuche die Kartellbildung vor 1891, die durch die Einführung einer Mengensteuerermöglicht wurde. Das Kartell begann mit einfachen Jahresquoten und lernte - trotz zwis-chenzeitlicher Zusammenbrüche - mit Lagerhaltungsnachfrage, Markteintritten, internen Koor-dinationsproblemen und einem verringerten Importschutz umzugehen. Detaillierte qualitativeInformationen zur inneren Arbeitsweise und Preise, Opportunitätskosten und Verkaufsdatenauf monatlicher Basis werden dazu erörtert und der Erfolg des Kartell in den verschiedenenEntwicklungsstufen wird abgeschätzt.
Kapitel 3 und Kapitel 4 entstanden in Zusammenarbeit mit Philipp Schmidt-Dengler, Kon-rad Stahl und Christine Zulehner. Registrierte Kartelle waren in Österreich bis zum EU Beitritt1995 größtenteils legal. Das Archivmaterial über die registrierten horizontalen Kartelle wird un-tersucht um über deren inneren Aufbau zu lernen. Kapitel 3 beschreibt im Detail das Verfahrenzur Kodierung der Klauseln und anderer Daten aus den gescannten Kartellverträgen. Im Kapitel4 wird eine Inhaltsanalyse der rechtlich verbindlichen Kartellverträge gemacht. UnterschiedlicheMethoden der Kollusion werden ausgehend von Stigler (1964) umfassend beschrieben. Quoten-kartelle verfügen über ein regelmäßiges Berichtswesen und Kompensationsmechanismen für Ab-weichungen von den vereinbarten Quoten. Spezialisierungskartelle teilen Märkte auf und ver-fügen am Wenigsten oft über einen internen Informationaustausch oder Strafbestimmungen.Preis- und Zahlungskonditionenkartelle versuchen den geheimen Preiswettbewerb zu verhin-dern. Sie enthalten oft eine Auskunftspflicht bei Nachfrage, erlauben Entscheidungen nach demErmessen und verfügen über unmittelbare Strafbestimmungen. Diese empirisch beobachtetenRegelmäßigkeiten der Vertragsausgestaltungen legen nahe, dass die Möglichkeit, rechtlich ver-bindliche Verträge niederzuschreiben, genutzt wurde, um die bekannten Schwierigkeiten in derAufrechterhaltung von Kollusion zu lösen.
Kapitel 5 untersucht die Rolle der Sozialpartnerschaft im Verfahren zur Registrierung derKartelle. Es wird untersucht, ob die Sozialpartner ihre Befugnisse als Verfahrensparteien genutzthaben und Untersuchungen beantragt haben, um den Schaden der Kartelle zu begrenzen.
Kapitel 6 behandelt das österreichische, registrierte Zementkartell und dessen Deregulierungdurch den EU-Beitritt 1995. Auf Basis von aggregierten, industrieweiten Daten zu Umsätzen,Kosten, Beschäftigung und der Industriestruktur wird gezeigt, dass die Liberalisierung diedurchschnittlichen Preise, die Gewinne und die Beschäftigung verringerte und zu Marktaus-tritten führte. Allerdings gab es einen markanten Anstieg der Listenpreise für Zementsäcke.Dieser Anstieg hat auch die Angemessenheit mehrere Preisindizes negativ beeinflusst.
Schlagwörter: Kartell, Kollusion, Zuckerindustrie, Lagerhaltung, Antitrust, Zementindus-trie, Oligopol, Wettbewerbspolitik, Deregulierung, Kartellregister
4
Eidesstattliche Erklärung
Ich erkläre an Eides statt, dass ich die vorliegende Dissertation selbstständig und ohne fremde
Hilfe verfasst, andere als die angegebenen Quellen und Hilfsmittel nicht benutzt bzw. die
wörtlich oder sinngemäß entnommenen Stellen als solche kenntlich gemacht habe. Die vor-
liegende Dissertation ist mit dem elektronisch übermittelten Textdokument identisch.
5
Acknowledgements
Many people contributed to this project. My first supervisor Christine Zulehner enabled andadministered the project, gave help, support and feedback whenever I asked for. My secondsupervisor Franz Hackl gave feedback on the manuscript. A part of the dissertation was jointwork with Philipp Schmidt-Dengler, Konrad Stahl and Christine Zulehner. Stefan Weingärtnerrepeated the coding of the agreements. Martina Fink gave support in accessing the ASSDdatabase.
Half-time employment and financial support to outsource some work was granted by the Ju-bilaeumsfonds of the Oesterreichische Nationalbank (Austria’s central bank, Anniversary Fund,project number:14449) for three years. For a few months, I was employed at the Vienna Uni-versity of Business and Economics (Institute Head: Klaus Gugler) and at the University ofMannheim (SFB TR-15, Konrad Stahl). The ZEW Mannheim under the SEEK project pro-vided funding for some traveling. The Österreichisches Institut für Wirtschaftsforschung (Aus-trian Institute of Economic Research, WIFO) provided for the major part of the project thenecessary infrastructure—the space to work as a guest researcher, the library, the copying andscanning services and access to its database. I benefited from the atmosphere at the WIFO,especially at the “Zubau”, the “Kaffeerunde”, the tennis court and the soccer games.
For my work, I received specific documents and data from Andreas Resch, David Genesove,the Vereinigung Deutscher Zementindustrie, the Fachverband Steine und Keramik and the Ze-mentverband. The work on the cement industry benefited from talks with industry expertsrepresenting the employers as well as the employees.
The Austrian Federal Competition Authority (Director General Theodor Thanner)—myformer employer—enabled the reduction to part-time work and gave further support. TheAustrian Federal Cartel Prosecutor (Alfred Mair) supported the project, especially in accessingand scanning the archives of the cartel registry at the cartel court.
Large parts of my work relied on freeware (RStudio Team (2015), R Core Team (2012b),Leifeld (2013), Zeileis (2004), R Core Team (2012a), Zeileis and Grothendieck (2005), Zeileis(2011), Pfaff (2008), Zeileis and Hothorn (2002), Fox and Weisberg (2011), Kleiber et al. (2002),Kleiber and Zeileis (2008), Henningsen and Hamann (2007)).
My work benefited from comments of and discussions with many people, in particular Do-minik Erharter, Dieter Fink, Philipp Hergovich, Elena Hudzikova, Ulrich Laitenberger, UlrichMorawetz, Christian Müllner, Philipp Schmidt-Dengler, Konrad Stahl and Michael Weichsel-baumer. My research also benefited from discussions with participants at various conferencesand workshops: BECCLE in Bergen (2015), SEEK-BRUEGEL Workshop on “Legal and Ille-gal Cartels” in Brussels (2014), “Economist’s meeting” of the Austrian competition authorities(2012-2013), Workshop on Legal Cartels in Mannheim (2012-2015), EARIE in Milano (2014), in-ternal seminars at the WIFO (2012-2014) and the Vienna University of Business and Economics(2016) and the seminars at the Johannes Kepler University in Linz and Neufelden (2013-2015).
At last, beyond this project and most essential during these years were all those people howkept in touch—in particular my friends and my family.
I thank you all for your support.
Contents
1 Introduction 11
2 Formation and Adaptation of the Sugar Cartel in Austria-Hungary 122.1 Introduction . . . . . . . . . . . . . . . . . . . . . . . . . . . . . . . . . . . . . . . 122.2 Background on Industry, History, Trade and Tax . . . . . . . . . . . . . . . . . . 142.3 Evidence on Cartel Behavior . . . . . . . . . . . . . . . . . . . . . . . . . . . . . 16
2.3.1 Failures to cartelize before 1888 . . . . . . . . . . . . . . . . . . . . . . . . 172.3.2 Excise Tax as a Basis for Cartel Formation . . . . . . . . . . . . . . . . . 182.3.3 Cartelization during the Protective Duty Regime . . . . . . . . . . . . . . 182.3.4 The Cartel after the Brussels Convention . . . . . . . . . . . . . . . . . . 232.3.5 Review of Agreed Cartel Rules . . . . . . . . . . . . . . . . . . . . . . . . 25
2.4 Data . . . . . . . . . . . . . . . . . . . . . . . . . . . . . . . . . . . . . . . . . . . 262.4.1 Price and Cost Data . . . . . . . . . . . . . . . . . . . . . . . . . . . . . . 262.4.2 Quantities . . . . . . . . . . . . . . . . . . . . . . . . . . . . . . . . . . . . 292.4.3 Macroeconomic Variables . . . . . . . . . . . . . . . . . . . . . . . . . . . 32
2.5 Demand Estimation . . . . . . . . . . . . . . . . . . . . . . . . . . . . . . . . . . 332.5.1 Instruments . . . . . . . . . . . . . . . . . . . . . . . . . . . . . . . . . . . 332.5.2 Frequency . . . . . . . . . . . . . . . . . . . . . . . . . . . . . . . . . . . . 332.5.3 Estimation Results . . . . . . . . . . . . . . . . . . . . . . . . . . . . . . . 352.5.4 Further Insights on Storage . . . . . . . . . . . . . . . . . . . . . . . . . . 37
2.6 Estimation of Cartel Overcharges . . . . . . . . . . . . . . . . . . . . . . . . . . . 392.7 Summary and Discussion . . . . . . . . . . . . . . . . . . . . . . . . . . . . . . . 402.8 Appendix . . . . . . . . . . . . . . . . . . . . . . . . . . . . . . . . . . . . . . . . 43
2.8.1 First Stage of Demand Estimation . . . . . . . . . . . . . . . . . . . . . . 432.8.2 Cartel Pricing Regression . . . . . . . . . . . . . . . . . . . . . . . . . . . 43
3 Registered Cartels in Austria - Coding Protocol 463.1 Introduction . . . . . . . . . . . . . . . . . . . . . . . . . . . . . . . . . . . . . . . 463.2 Data Generating Process and Coding Procedure . . . . . . . . . . . . . . . . . . 46
3.2.1 Institutional Background . . . . . . . . . . . . . . . . . . . . . . . . . . . 473.2.2 Data Sources . . . . . . . . . . . . . . . . . . . . . . . . . . . . . . . . . . 473.2.3 Procedure . . . . . . . . . . . . . . . . . . . . . . . . . . . . . . . . . . . . 473.2.4 Variable Types . . . . . . . . . . . . . . . . . . . . . . . . . . . . . . . . . 48
3.3 Summary Information on Cartels and Cartel Agreements . . . . . . . . . . . . . 483.3.1 Cartel and Contract Identification . . . . . . . . . . . . . . . . . . . . . . 483.3.2 Relevant Products and Geographical Area . . . . . . . . . . . . . . . . . . 493.3.3 Cartel Participants and Length of Agreement . . . . . . . . . . . . . . . . 493.3.4 Start and End Dates of an Agreement . . . . . . . . . . . . . . . . . . . . 503.3.5 Entries, Exits, and Mergers Involving Cartel Members . . . . . . . . . . . 503.3.6 Industry Information . . . . . . . . . . . . . . . . . . . . . . . . . . . . . . 51
3.4 Institutional Detail, Cartelists’ Justifications, Procedural Aspects in Cartel For-mation . . . . . . . . . . . . . . . . . . . . . . . . . . . . . . . . . . . . . . . . . . 523.4.1 Institutional Detail . . . . . . . . . . . . . . . . . . . . . . . . . . . . . . . 52
6
CONTENTS 7
3.4.2 Economic Justification for Cartel Formation . . . . . . . . . . . . . . . . . 533.4.3 Cartel Review . . . . . . . . . . . . . . . . . . . . . . . . . . . . . . . . . . 54
3.5 Economics of the Cartel . . . . . . . . . . . . . . . . . . . . . . . . . . . . . . . . 553.5.1 Cartel Type . . . . . . . . . . . . . . . . . . . . . . . . . . . . . . . . . . . 553.5.2 Collusion Clauses . . . . . . . . . . . . . . . . . . . . . . . . . . . . . . . . 553.5.3 Organization . . . . . . . . . . . . . . . . . . . . . . . . . . . . . . . . . . 583.5.4 Information Exchange . . . . . . . . . . . . . . . . . . . . . . . . . . . . . 603.5.5 Compensation Schemes . . . . . . . . . . . . . . . . . . . . . . . . . . . . 613.5.6 Penalties . . . . . . . . . . . . . . . . . . . . . . . . . . . . . . . . . . . . 623.5.7 Entry into, and Exit from the Cartel . . . . . . . . . . . . . . . . . . . . . 63
4 Registered Cartels in Austria - An Overview 644.1 Introduction . . . . . . . . . . . . . . . . . . . . . . . . . . . . . . . . . . . . . . . 644.2 Institutional Background . . . . . . . . . . . . . . . . . . . . . . . . . . . . . . . . 664.3 The Austrian Cartel Registry . . . . . . . . . . . . . . . . . . . . . . . . . . . . . 694.4 Collusion Methods and Contract Characteristics . . . . . . . . . . . . . . . . . . 70
4.4.1 Main Collusive Instruments: An Overview . . . . . . . . . . . . . . . . . . 704.4.2 Auxiliary Collusive Clauses . . . . . . . . . . . . . . . . . . . . . . . . . . 784.4.3 Cartel Governance . . . . . . . . . . . . . . . . . . . . . . . . . . . . . . . 81
4.5 Key Findings by Collusion Method . . . . . . . . . . . . . . . . . . . . . . . . . . 934.6 Summary and Conclusion . . . . . . . . . . . . . . . . . . . . . . . . . . . . . . . 944.7 Appendix: Tables . . . . . . . . . . . . . . . . . . . . . . . . . . . . . . . . . . . . 96
5 Registered Cartels and their Political Economy 1035.1 Introduction . . . . . . . . . . . . . . . . . . . . . . . . . . . . . . . . . . . . . . . 1035.2 Data and Descriptives . . . . . . . . . . . . . . . . . . . . . . . . . . . . . . . . . 1035.3 Empirical Model on Review Requests . . . . . . . . . . . . . . . . . . . . . . . . . 1045.4 Summary and Discussion . . . . . . . . . . . . . . . . . . . . . . . . . . . . . . . 1065.5 Appendix . . . . . . . . . . . . . . . . . . . . . . . . . . . . . . . . . . . . . . . . 107
6 A registered Cartel and its End. Cementing Industry Structure 1086.1 Introduction . . . . . . . . . . . . . . . . . . . . . . . . . . . . . . . . . . . . . . . 1086.2 Background on the Industry and the Cartel . . . . . . . . . . . . . . . . . . . . . 109
6.2.1 Background on the Cement Industry . . . . . . . . . . . . . . . . . . . . . 1106.2.2 Inner Workings of the Cement Cartel in Austria . . . . . . . . . . . . . . 110
6.3 Hypothesis . . . . . . . . . . . . . . . . . . . . . . . . . . . . . . . . . . . . . . . 1126.4 Data and Descriptives . . . . . . . . . . . . . . . . . . . . . . . . . . . . . . . . . 1136.5 Empirical Models . . . . . . . . . . . . . . . . . . . . . . . . . . . . . . . . . . . . 118
6.5.1 Evaluation of the Price Approval Procedure . . . . . . . . . . . . . . . . . 1186.5.2 Evaluation of the Institutional Shift . . . . . . . . . . . . . . . . . . . . . 120
6.6 Pricing past 1995 . . . . . . . . . . . . . . . . . . . . . . . . . . . . . . . . . . . . 1246.7 Summary and Discussion . . . . . . . . . . . . . . . . . . . . . . . . . . . . . . . 129
6.7.1 Summary . . . . . . . . . . . . . . . . . . . . . . . . . . . . . . . . . . . . 1296.7.2 Discussion . . . . . . . . . . . . . . . . . . . . . . . . . . . . . . . . . . . . 130
6.8 Appendix . . . . . . . . . . . . . . . . . . . . . . . . . . . . . . . . . . . . . . . . 1306.8.1 Data Sources . . . . . . . . . . . . . . . . . . . . . . . . . . . . . . . . . . 1306.8.2 Additional Tables . . . . . . . . . . . . . . . . . . . . . . . . . . . . . . . . 132
List of Figures
2.1 Austria-Hungary . . . . . . . . . . . . . . . . . . . . . . . . . . . . . . . . . . . . 152.2 Timeline of Cartel Behavior . . . . . . . . . . . . . . . . . . . . . . . . . . . . . . 172.3 Prices in Vienna and Trieste, Tax and Export Bounty . . . . . . . . . . . . . . . 282.4 Decomposition of Sales into Seasonal, Trend and Remainder . . . . . . . . . . . . 31
4.1 Institutional Set-Up (KartG 1972 and Farnleitner (1977)) . . . . . . . . . . . . . 68
6.1 Domestic Cement Prices and Costs (Euro/ton) . . . . . . . . . . . . . . . . . . . 1156.2 Consumption, Production, Foreign Trade (in 1000 tons), 1973-2011 . . . . . . . . 1166.3 Employment, Plants and Productivity (1962-2011) . . . . . . . . . . . . . . . . . 1176.4 Price Differentials . . . . . . . . . . . . . . . . . . . . . . . . . . . . . . . . . . . . 125
8
List of Tables
2.1 Agreed Rules on Sales of Consumable Sugar . . . . . . . . . . . . . . . . . . . . . 262.2 Share of Austria-Hungary in World Production of Refined Sugar . . . . . . . . . 292.3 Estimated Net-Inventorying for Cartel/Tax Events (in tons) . . . . . . . . . . . . 322.4 Estimation of Demand Elasticity . . . . . . . . . . . . . . . . . . . . . . . . . . . 362.5 Seasonal Dummies . . . . . . . . . . . . . . . . . . . . . . . . . . . . . . . . . . . 382.6 Estimate for Cartel Mark-up . . . . . . . . . . . . . . . . . . . . . . . . . . . . . 392.7 First Stage of 2SLS explaining the logarithmic real Price in Vienna . . . . . . . . 432.8 Regression, Dependent Variable: Price in Vienna . . . . . . . . . . . . . . . . . . 44
3.1 Identifiers for Cartels and Agreements . . . . . . . . . . . . . . . . . . . . . . . . 483.2 Relevant Product(s) and Markets . . . . . . . . . . . . . . . . . . . . . . . . . . . 493.3 Number of Participants and Length of Cartel Agreement . . . . . . . . . . . . . . 493.4 Start and End Dates . . . . . . . . . . . . . . . . . . . . . . . . . . . . . . . . . . 503.5 Voluntary Entry/Exit: Duration of the contract . . . . . . . . . . . . . . . . . . . 503.6 Entries, Exits and Mergers . . . . . . . . . . . . . . . . . . . . . . . . . . . . . . . 513.7 Cartel Market Share . . . . . . . . . . . . . . . . . . . . . . . . . . . . . . . . . . 513.8 Competitive Fringe Market Share . . . . . . . . . . . . . . . . . . . . . . . . . . . 523.9 Import Share . . . . . . . . . . . . . . . . . . . . . . . . . . . . . . . . . . . . . . 523.10 Institutional Details . . . . . . . . . . . . . . . . . . . . . . . . . . . . . . . . . . 533.11 Economic Justification . . . . . . . . . . . . . . . . . . . . . . . . . . . . . . . . . 543.12 Cartel Review: Requests by . . . . . . . . . . . . . . . . . . . . . . . . . . . . . . 543.13 Cartel Review: Assessment and Changes required . . . . . . . . . . . . . . . . . . 553.14 Cartel Type . . . . . . . . . . . . . . . . . . . . . . . . . . . . . . . . . . . . . . . 553.15 Clauses: Market Segmentation . . . . . . . . . . . . . . . . . . . . . . . . . . . . 563.16 Clauses: Prices and Discounts . . . . . . . . . . . . . . . . . . . . . . . . . . . . . 563.17 Clauses: Capacity . . . . . . . . . . . . . . . . . . . . . . . . . . . . . . . . . . . 573.18 Clauses: Vertical Exclusivity Restraints to Outsiders . . . . . . . . . . . . . . . . 573.19 Clauses: Norms . . . . . . . . . . . . . . . . . . . . . . . . . . . . . . . . . . . . . 573.20 Clauses: Other cooperation . . . . . . . . . . . . . . . . . . . . . . . . . . . . . . 573.21 Clauses: Entry prevention . . . . . . . . . . . . . . . . . . . . . . . . . . . . . . . 583.22 Organization: Decision-Making Bodies . . . . . . . . . . . . . . . . . . . . . . . . 583.23 Organization: Internal day-to-day Management . . . . . . . . . . . . . . . . . . . 593.24 Organization: External support . . . . . . . . . . . . . . . . . . . . . . . . . . . . 593.25 Organization: Responsibilities . . . . . . . . . . . . . . . . . . . . . . . . . . . . . 593.26 Organization: Voting Rules (Required Majority in %) . . . . . . . . . . . . . . . 603.27 Organization: Voting Weights for the Cartel Object . . . . . . . . . . . . . . . . 603.28 Information Exchange: Cartel-internal Auditing . . . . . . . . . . . . . . . . . . . 603.29 Information Exchange: Annual Internal Reporting Frequency . . . . . . . . . . . 613.30 Information Exchange: Ex-ante Notification . . . . . . . . . . . . . . . . . . . . . 613.31 Information Exchange: Ex-post Notification . . . . . . . . . . . . . . . . . . . . . 613.32 Information Exchange: Sales vs. Exports . . . . . . . . . . . . . . . . . . . . . . 613.33 Compensation Schemes . . . . . . . . . . . . . . . . . . . . . . . . . . . . . . . . 623.34 Non-Monetary Penalties . . . . . . . . . . . . . . . . . . . . . . . . . . . . . . . . 62
9
LIST OF TABLES 10
3.35 Absolute Penalties . . . . . . . . . . . . . . . . . . . . . . . . . . . . . . . . . . . 623.36 Relative penalties (Upper Limits, in percent of) . . . . . . . . . . . . . . . . . . . 623.37 Penalties: Security deposits . . . . . . . . . . . . . . . . . . . . . . . . . . . . . . 633.38 Voluntary Entry/Exit: Rules for Entry . . . . . . . . . . . . . . . . . . . . . . . . 633.39 Voluntary Entry/Exit: Rules for Exit . . . . . . . . . . . . . . . . . . . . . . . . . 63
4.1 Cartel clauses and combinations thereof . . . . . . . . . . . . . . . . . . . . . . . 724.2 Instruments across sectors . . . . . . . . . . . . . . . . . . . . . . . . . . . . . . . 734.3 Cartel Orientation . . . . . . . . . . . . . . . . . . . . . . . . . . . . . . . . . . . 744.4 Cartel size (Number of participants) . . . . . . . . . . . . . . . . . . . . . . . . . 754.5 Censored duration (in years) . . . . . . . . . . . . . . . . . . . . . . . . . . . . . 754.6 Cartel complexity (Number of pages) . . . . . . . . . . . . . . . . . . . . . . . . . 764.7 Economic justification . . . . . . . . . . . . . . . . . . . . . . . . . . . . . . . . . 774.8 Cartel Review . . . . . . . . . . . . . . . . . . . . . . . . . . . . . . . . . . . . . . 784.9 Prices and Discounts: Additional Variables . . . . . . . . . . . . . . . . . . . . . 794.10 Capacity restrictions . . . . . . . . . . . . . . . . . . . . . . . . . . . . . . . . . . 804.11 Norms . . . . . . . . . . . . . . . . . . . . . . . . . . . . . . . . . . . . . . . . . . 814.12 Joint ventures . . . . . . . . . . . . . . . . . . . . . . . . . . . . . . . . . . . . . . 824.13 Decision making bodies . . . . . . . . . . . . . . . . . . . . . . . . . . . . . . . . 834.14 Key decisions: Explicit decision takers . . . . . . . . . . . . . . . . . . . . . . . . 834.15 Required majorities . . . . . . . . . . . . . . . . . . . . . . . . . . . . . . . . . . . 844.16 Decision Making Bodies: Day-to-day management . . . . . . . . . . . . . . . . . 854.17 Reporting and Auditing Rules . . . . . . . . . . . . . . . . . . . . . . . . . . . . . 864.18 Regular Reports . . . . . . . . . . . . . . . . . . . . . . . . . . . . . . . . . . . . 874.19 Reports upon Request . . . . . . . . . . . . . . . . . . . . . . . . . . . . . . . . . 884.20 Compensation Schemes . . . . . . . . . . . . . . . . . . . . . . . . . . . . . . . . 894.21 Forms of Punishment . . . . . . . . . . . . . . . . . . . . . . . . . . . . . . . . . . 904.22 Reasons for Monetary Penalties . . . . . . . . . . . . . . . . . . . . . . . . . . . . 904.23 Maximal Penalties (in 2014 Euro) . . . . . . . . . . . . . . . . . . . . . . . . . . . 914.24 Security Deposits . . . . . . . . . . . . . . . . . . . . . . . . . . . . . . . . . . . . 914.25 Rules on Voluntary Entry and Exit . . . . . . . . . . . . . . . . . . . . . . . . . . 924.26 Cartels across 2-digit industries . . . . . . . . . . . . . . . . . . . . . . . . . . . . 964.27 Cartels across 4-digit industries (1/3) . . . . . . . . . . . . . . . . . . . . . . . . 974.27 Cartels across 4-digit industries (2/3) . . . . . . . . . . . . . . . . . . . . . . . . 984.27 Cartels across 4-digit industries (3/3) . . . . . . . . . . . . . . . . . . . . . . . . 994.28 Verbal Description of Cartels(1/3) . . . . . . . . . . . . . . . . . . . . . . . . . . 1004.28 Verbal Description of Cartels(2/3) . . . . . . . . . . . . . . . . . . . . . . . . . . 1014.28 Verbal Description of Cartels(3/3) . . . . . . . . . . . . . . . . . . . . . . . . . . 102
5.1 Correlation between Review Request and Collusive Clauses . . . . . . . . . . . . 1045.2 Explaining the Review Requests . . . . . . . . . . . . . . . . . . . . . . . . . . . 1055.3 Explaining the Review Requests—all variables . . . . . . . . . . . . . . . . . . . 107
6.1 Cement Quotas (in %) . . . . . . . . . . . . . . . . . . . . . . . . . . . . . . . . . 1126.2 Descriptive Statistics 1973-2011 . . . . . . . . . . . . . . . . . . . . . . . . . . . . 1146.3 Pricing during Regulatory Regime . . . . . . . . . . . . . . . . . . . . . . . . . . 1196.4 Results . . . . . . . . . . . . . . . . . . . . . . . . . . . . . . . . . . . . . . . . . . 1226.5 Price Differentiation based on available prices . . . . . . . . . . . . . . . . . . . . 1286.6 Weight of WPI of Cement Bags in Construction Cost Indices . . . . . . . . . . . 1296.7 Cement Bag Prices (Euro/ton) . . . . . . . . . . . . . . . . . . . . . . . . . . . . 132
Chapter 1
Introduction
This thesis studies legal cartels in order to learn about their inner workings and the effects ofcartels. With the exception of the sugar cartel in Austria-Hungary, all cartel are taken from theAustrian cartel register that allowed cartels to operate as long as the registered their collusiveagreement.
Chapter 2 studies the legal sugar cartel in Austria-Hungary in 1891-1914. I analyze thecartel formation prior to 1891 that was enabled by an excise tax. The cartel started withsimple annual quotas and—despite breakdowns—learned to adapt to inventory demand, entry,internal coordination problems and lowered import protection. Detailed qualitative evidenceon the inner workings and prices, opportunity costs and sales data on a monthly basis arediscussed. The success of the cartel at subsequent stages is evaluated.
Chapter 3 and chapter 4 is joint work with Philipp Schmidt-Dengler, Konrad Stahl andChristine Zulehner. Cartels were legal to a large extent in Austria until the country’s EU acces-sion in 1995. We examine archival material on registered horizontal cartels to learn about theirinner working. Chapter 3 presents the detailed procedure of coding the data from the scanneddocuments. In chapter 4, we apply content analysis to legally binding cartel contracts andwe comprehensively document different collusion methods along the lines described by Stigler(1964). Quota cartels employ regular reporting schemes and use compensation mechanismsfor departures from set quotas. Specialization cartels divide markets and rely the least on in-formation exchange and punishment. Price and payment condition cartels primarily aim toprevent secret price cuts, requiring information provision upon request, allow for discretionarydecision-taking and (sometimes immediate) punishment. These stylized facts on the contractualarrangements suggest that the possibility to write legally binding agreements was employed toaddress the usual obstacles to sustaining collusion.
Chapter 5 evaluates the role of social partnership during the cartel registration proceedings.I analyze whether social partners used their powers as parties of the proceedings and requesteda review in order to limit damaging cartels.
Chapter 6 studies the Austrian registered cement cartel and its deregulation when Austriaacceded the European Union in 1995. Based on aggregate data on revenues, cost, employmentand industry structure, I find that the liberalization reduced average prices, profits, employmentand led to exit. However, consumer list prices for cement bags increased markedly and negativelyaffected the accuracy of several price indices.
11
Chapter 2
Formation and Adaptation of theSugar Cartel in Austria-Hungary
This chapter is identical to Fink (2016).
2.1 IntroductionThis paper studies a unique combination of narrative and quantitative evidence on forma-tion and organizational learning of a cartel under varying conditions—the sugar industry inAustria-Hungary. I present a sequence of events on failures to collude followed by successfulcollusion, errors in optimal collusion followed by more profitable collusive strategies and reac-tions to changes in the external environment that kept collusion stable despite larger incentivesto deviate.
The industry failed to cartelize in 1864, 1873/74 and 1884-1886, but succeeded from 1891onwards with breakdowns in 1894/95 and 1903-1906. At subsequent stages, the cartel learned tofix monthly quotas, integrate upstream raw sugar factories, centralize sales and impede outsidersand imports via retroactive exclusivity rebates. Empirical evidence is based on commoditymarket prices and monthly sales data measured and taxed at the gate of the sugar refineries.I decompose the sales data into trend consumption, seasonal as well as demand anticipatinginventory demand. Sophisticated but simple aggregation essentially smoothes sales data closerto actual consumption. I find an inelastic demand and I am able to relate the cartels’ pricingpower to the internal and supply-side based challenges the cartel often addressed later on. Interms of the threat of imports—the competitive constraint essentially outside Austria-Hungary’sdirect influence due to a multilateral trade agreement limiting the import duty—the cartelsteadily improved.
The sequence of events also includes the interaction with the government—the introductionof the excise tax, the failure of the first draft antitrust laws, the Brussels Convention as thefirst multilateral trade agreement and the failed state-supported cartel in 1903 all affected theindustries’ organization. Reverse, the cartel lobbied in order to influence the media and thegovernment.
The sugar industry was so well documented since it was the most important single industryin the late 19th century. Already Menger’s second chapter of “Grundsätze der Volkswirth-schaftslehre” (1871) refers to sugar inventories, worldwide production areas, expected yields,weather conditions, number of raw sugar factories and refineries, technological progress, traffic
12
CHAPTER 2. SUGAR CARTEL IN AUSTRIA-HUNGARY 13
hold-ups and delivery times when talking about forecasts on available quantities to fulfil de-mand. Market reports, the archive of the sugar taxing Austrian ministry of finance, industryand economic journals (Griffin (1902), for example), newspapers, most of the cartel agreementsthemselves and other publications that provide extremely well-documented evidence on taxationand cartelization.
I contribute to the literature on the inner workings of cartels in several ways. First, I showhow the introduction of the excise tax enabled collusion. Second, I present unique long-termevidence on cartel formation and adaptation and on its interaction with the government. Third,I relate empirical data on sales and different inferred storage patterns as well as estimated cartelovercharges to a cartel at subsequent stages. In general, such evidence and variation is rare oreven non-existent in today’s world of antitrust laws and also in the existing literature andtherefore interesting in itself. Real world examples may help to refine and reassess the theoryon collusion. And a better understanding of cartels may improve antitrust practice.
The existing literature is summarized by Levenstein and Suslow (2006). Cartels invest in theorganizational structure in order to implement an individually rational and collusive strategy,to detect and deter deviations and to prevent competition from outsiders. But information ondynamic organizational learning of cartels is limited and confined to a small number of casestudies. Parts of the literature are specifically relevant to understand the inner workings of thesugar cartel in Austria-Hungary: On the monitoring within cartels, Harrington and Skrzypacz(2007) and more recently Harrington and Skrzypacz (2011) develop models where deviators andnon-deviators are treated asymmetrically; within the latter model, sustaining collusion requirestruthful reports of cartel members—wrong reporting ultimately leads to reversion to competitiveprices. Genesove and Mullin (2001) analyze the US Sugar Institute that solely fixed businesspractices from 1927 to 1936. The cartel relied on ex-ante notification of conduct and frequent(weekly) meetings and reports in order to detect secret actions with minimal delay. Retaliationwas limited to verifiable deviations in order to minimize improper punishment. Often, deviatingpractices were simple matched. Genesove and Mullin do not observe renegotiations of punish-ments, the frequent meetings were rather used to adapt the collusive agreement. One of themain problems was that external sales agents with high powered incentives did often cheat anddeviate from the institute’s collusive rules. In summary, they argue that the Sugar Institutepursuit the common goal of collusion; but each member was well aware of their incentives tocheat; thus the inner workings’ main aim was to solve the contracting problem. Anton andDasVarma (2005) analyze equilibria in markets with storable goods and find that an oligopolis-tic market structure may lead to an increasing price path and rational in-advance purchasesby buyers. Dudine et al. (2006) study a monopoly selling a storable good and find that amonopolist who credibly announces current and future prices does not induce storage, whereasfor a monopolist without commitment consumers anticipate a price increase in the future andengage in storage. Asker and Bar-Isaac (2014) study vertical practices and find equilibria withexclusionary practices and rewarding kick-back transfers. Hyytinen et al. (2015) and chapter4 study a cross section of different cartels and present facts how these collusive strategies wereimplemented and which level of information exchange was required. Salvo (2010) empiricallyfinds that potential entry limited market power of Brazilian cement producers.
The paper is organized as follows. Section 2.2 presents the required background informationon sugar, the Austro-Hungarian Empire and the trade and tax regime. A central part of thearticle is section 2.3 that presents evidence on industry and cartel behavior. Starting in 1864,I describe the origin of the tax reform in 1888 and the emerging structure of the industrial
CHAPTER 2. SUGAR CARTEL IN AUSTRIA-HUNGARY 14
organization of the sugar industry until 1914. Section 2.4 documents the available quantitativeinformation—basically prices and sales data. In section 2.5 I estimate a demand elasticity anddocument different patterns in stock-piling and demand anticipation. In Section 2.6 I presentsimple estimated means for the cartel overcharge for different kinds of cartels. Finally, I discussthe central results and relate my findings to the existing literature.
2.2 Background on Industry, History, Trade and TaxHere I present the properties of sugar and basics of its production technique, information onAustria-Hungary and some basic information on industry concentration and importance of theindustry.
Industry and production technique. Refined sugar is a relatively homogenous productmade of sugar beets or sugar cane. Sugar is not perishable and of little bulk so that transportcosts are sufficiently low. In Europe, sugar beets were planted in the spring and harvested in theautumn. After the harvest beets were hauled to a raw sugar factory. Beets were superposablefor some time, but then would loose sugar content. Therefore, mostly from October untilJanuary, sugar beets had to be processed to raw sugar. Raw sugar was superposable andcontained around 88-92% of sucrose. Due to a peculiar and not so pleasant taste, it was notdirectly consumable. However, raw sugar was traded worldwide. In order to create consumablesugar, it was necessary to refine the raw product. This was done within sugar refineries mainlyfrom October to April but also to a small degree during May to September. Inventories ofrefined sugar normally peaked in February and reached a trough in September. As a finalproduct, refined sugar was white and contained nearly 100% sucrose. Refined sugar was tradedworldwide, too; but to a lesser degree than raw sugar, since the refineries were often located inthe countries that consumed sugar such as the United Kingdom.1
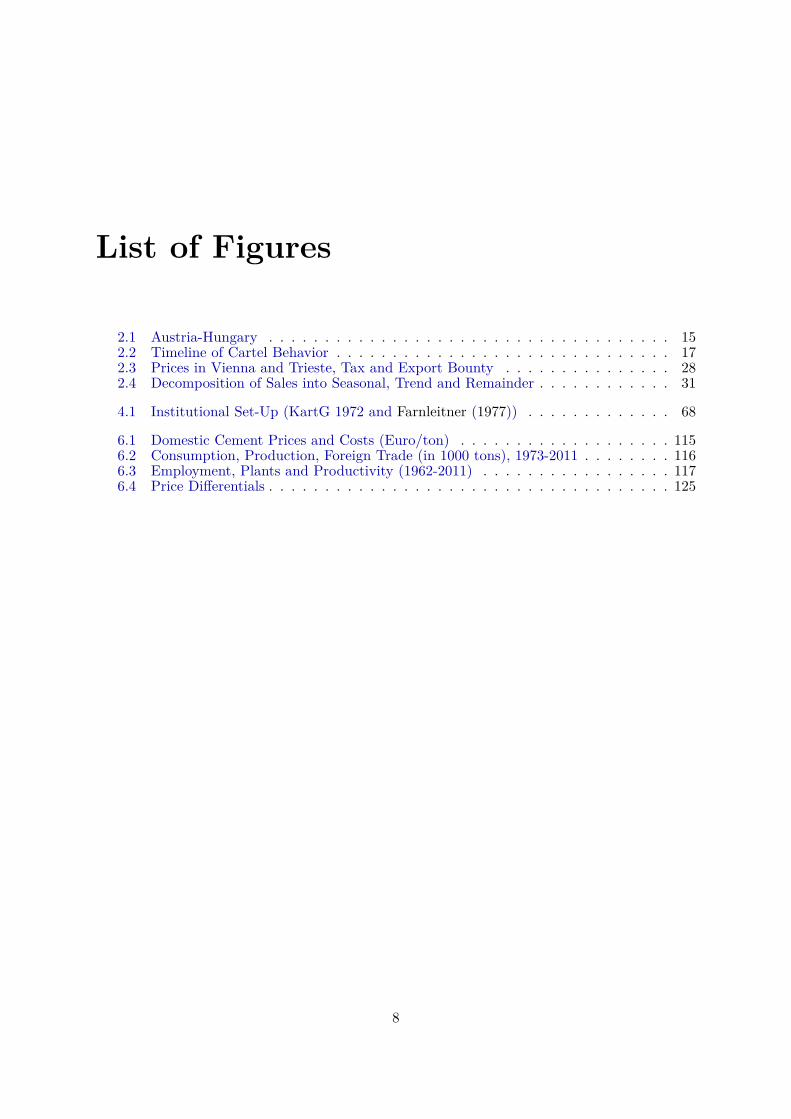
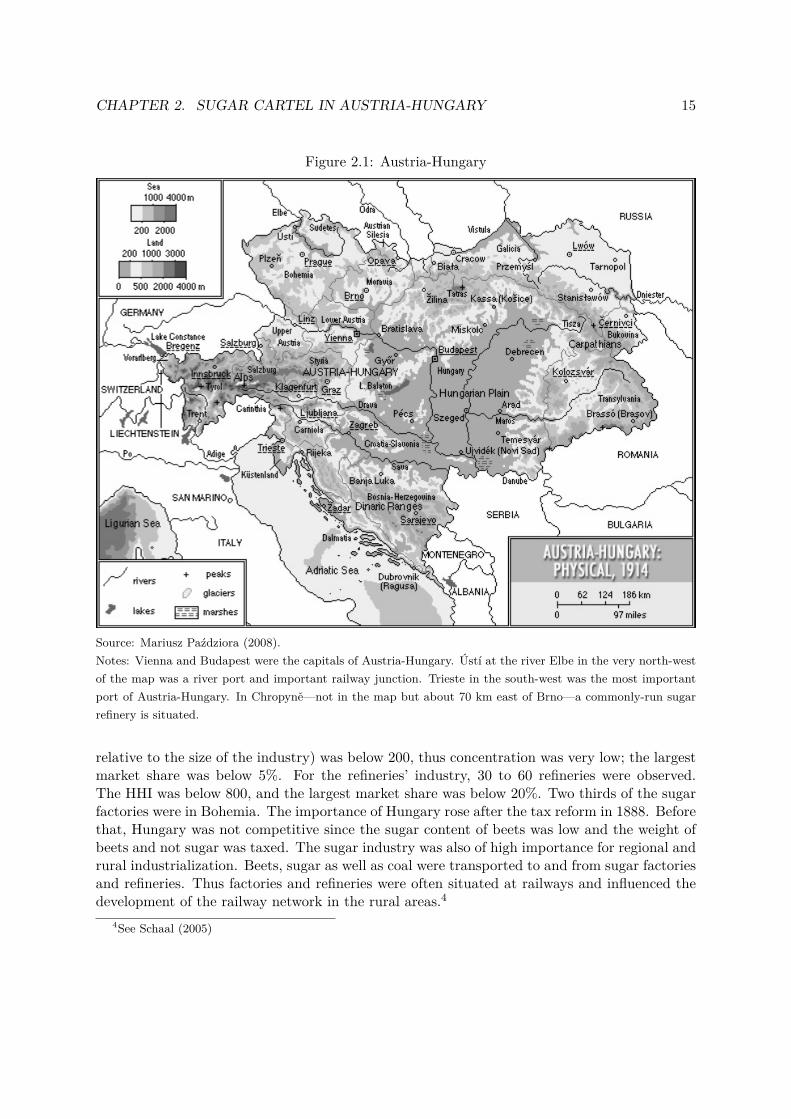
Political and general economic background. Austria-Hungary is depicted in Figure2.1. It was a constitutional monarchic union between the Crown of the Austrian Empire andthe Kingdom of Hungary in Central Europe, that existed from 1867 to October 1918. It was amultinational realm, and, after the Russian empire, geographically the second largest countryin Europe, and the third most populous. Modern-day nation states that formerly belonged tothe empire include Austria, Hungary, Slovenia, Bosnia and Herzegovina, Croatia, the CzechRepublic, Slovakia, large parts of Serbia and Romania, and smaller parts of Italy, Montenegro,Poland and Ukraine. Austria-Hungary adapted the gold standard in 1892 and introduced theKrone (K) as a currency.2
The sugar industry was the single most important industry during that time. The exportof sugar amounted to 7.5-10% of total foreign trade between 1885 and 1910.3 The first factoryin Austria had been established in 1828. The industry association was established in 1854.Sugar consumption rose from 1 kilo per capita in 1852 to 13 kilo in 1913. In the early phase,the industry was highly competitive. For the relevant period, there existed 150 to 200 rawsugar factories. The empire-wide Herfindahl-Hirschman Index (HHI—a measure of size of firms
1See Stammer (1887) for the historical production technology.2Before the gold standard, the florin was the domestic currency. Since the analysis covers the period from
1888 to 1914 on, the Krone is chosen as a currency.3Rudolph (1973)
CHAPTER 2. SUGAR CARTEL IN AUSTRIA-HUNGARY 15
Figure 2.1: Austria-Hungary
Source: Mariusz Paździora (2008).Notes: Vienna and Budapest were the capitals of Austria-Hungary. Ústí at the river Elbe in the very north-westof the map was a river port and important railway junction. Trieste in the south-west was the most importantport of Austria-Hungary. In Chropyně—not in the map but about 70 km east of Brno—a commonly-run sugarrefinery is situated.
relative to the size of the industry) was below 200, thus concentration was very low; the largestmarket share was below 5%. For the refineries’ industry, 30 to 60 refineries were observed.The HHI was below 800, and the largest market share was below 20%. Two thirds of the sugarfactories were in Bohemia. The importance of Hungary rose after the tax reform in 1888. Beforethat, Hungary was not competitive since the sugar content of beets was low and the weight ofbeets and not sugar was taxed. The sugar industry was also of high importance for regional andrural industrialization. Beets, sugar as well as coal were transported to and from sugar factoriesand refineries. Thus factories and refineries were often situated at railways and influenced thedevelopment of the railway network in the rural areas.4
4See Schaal (2005)
CHAPTER 2. SUGAR CARTEL IN AUSTRIA-HUNGARY 16
Industry protection and taxation. My analysis mainly focuses on the period August1888 to July 1914. On August 1st, 1888 there was a change of the trade and tax regime. Anexcise tax amounting to 22 K per 100 kg was introduced and the export bounty for refinedsugar was fixed at 4.6 K per 100 kg, for raw sugar at 3.2 K. For the production of 100 kg ofrefined sugar 111 kg of raw sugar were necessary.5 Thus the export of 100 kg of refined sugarwas subsidized with 4.6 K whereas the export of the equivalent amount of raw sugar (111 kg)was subsidized only with 3.552 K.6 The export of refined sugar was thus favored relative to theexport of raw sugar by an additional bounty of 1.048 K. The import duty was kept at 24.12 Kper 100 kg for refined sugar. In order to give a rough feeling for the size of the tax, the bountyand the duty, the price at the export market for refined sugar was within the range of 20 and60 K for 100 kg for the analyzed period. The tax increased in July 1896 to 26 K and to 38 Kin August 1899—thus the tax often surpassed 100% of the export price on the world market.
The sugar industry was highly protected. Already in 1849 there was a tariff on importedsugar.7 In 1859, the industry successfully lobbied for an export bounty that was granted from1860 onwards.8 Internationally, a trade war on sugar was ongoing already at that time. Forsome years, multilateral trade agreements temporarily adjourned the trade war—but Austria-Hungary did not participate and kept its protective regime. Finally, a multilateral agreementfor sugar was signed on March 5th, 1902. The so called Brussels Convention took effect onSeptember 1st, 1903. All main European producers and the United Kingdom took part in theconvention. The treaty prohibited all sugar bounties and limited the import duties to 6 FrenchFrancs which is 5.7 K per 100 kg for Austria-Hungary.9 The Brussels Convention was prolongedand continued to exist until World War I broke out in 1914.10 Thus, imports as a discipliningcompetitive force limited the leeway for the exercise of market power on the domestic market.Furthermore, the subsidies in favor of exporting refined sugar were abolished. There was nofurther switch in the tax and trade regime until the beginning of World War I in late July 1914.
2.3 Evidence on Cartel BehaviorIn this section I present the evidence on cartel behavior in an overview. The 50th anniversarypublication of the sugar industry association in 1904 provides information stretching back to1854. The main focus is on the years 1888 to 1914, where I rely on detailed sources such as theweekly industry journal, daily newspapers of that time11 and specific publications on the sugarindustry such as a dissertation or a formal investigation in parliament in 1912.12 Genesove(2015) surveys the use of history in industrial organization and stresses some potential biases—which documents have survived, which communication and information was documented by theindustry or its observers (for example, media subject to bribes) and what the historian deemedrelevant. In order to address these risks, I rely on documents both supporting and opposing thecartel.
5Hromada (1911, p. 54)63.2 times 0.111/0.1 = 3.552 K.7Centralverein (1904, p. 73)8Centralverein (1904, p. 79)9Due to the gold standard, 1 Austrian Krone (K) was 1.05 French Francs.
10Pigman (1997)11anno.onb.ac.at offers a rich archive on historical newspapers.12Resch (2002) provides a recent survey on cartels at that time that includes a chapter on the sugar cartel.
Kohl and Steiger-Moser (2014) provide a broad collection of stories and evidence on the sugar industry in Austria.
CHAPTER 2. SUGAR CARTEL IN AUSTRIA-HUNGARY 17
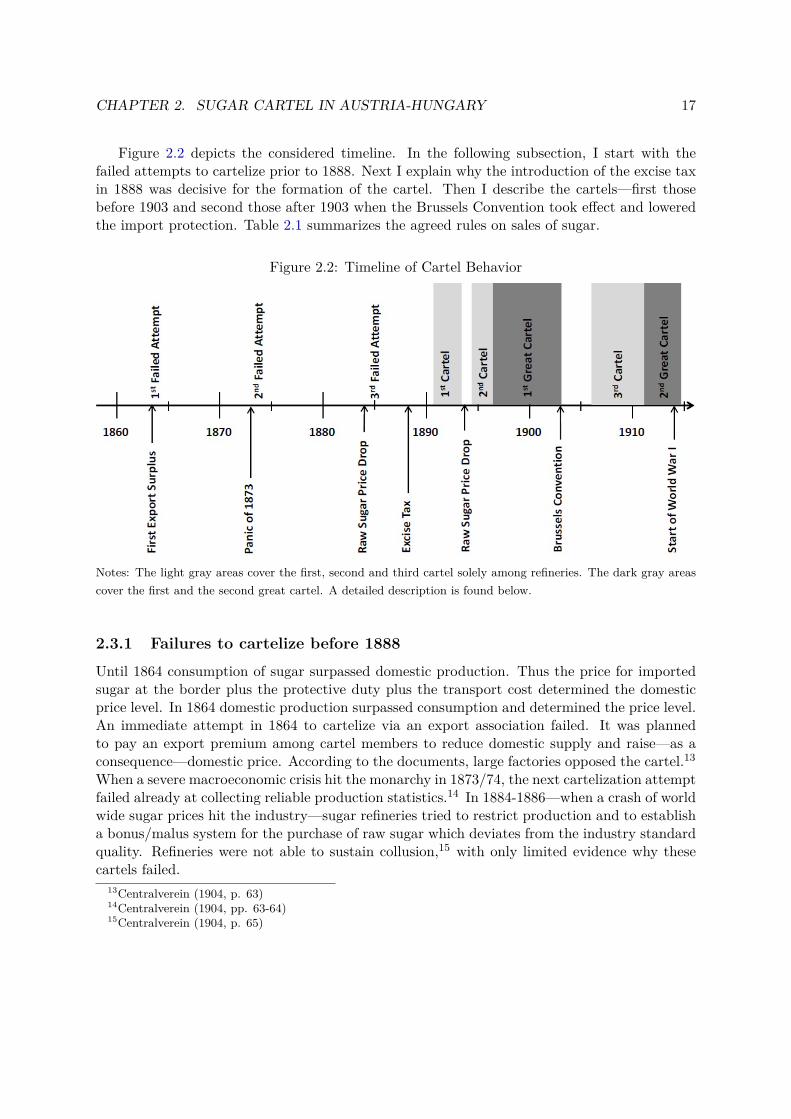
Figure 2.2 depicts the considered timeline. In the following subsection, I start with thefailed attempts to cartelize prior to 1888. Next I explain why the introduction of the excise taxin 1888 was decisive for the formation of the cartel. Then I describe the cartels—first thosebefore 1903 and second those after 1903 when the Brussels Convention took effect and loweredthe import protection. Table 2.1 summarizes the agreed rules on sales of sugar.
Figure 2.2: Timeline of Cartel Behavior
Notes: The light gray areas cover the first, second and third cartel solely among refineries. The dark gray areascover the first and the second great cartel. A detailed description is found below.
2.3.1 Failures to cartelize before 1888
Until 1864 consumption of sugar surpassed domestic production. Thus the price for importedsugar at the border plus the protective duty plus the transport cost determined the domesticprice level. In 1864 domestic production surpassed consumption and determined the price level.An immediate attempt in 1864 to cartelize via an export association failed. It was plannedto pay an export premium among cartel members to reduce domestic supply and raise—as aconsequence—domestic price. According to the documents, large factories opposed the cartel.13When a severe macroeconomic crisis hit the monarchy in 1873/74, the next cartelization attemptfailed already at collecting reliable production statistics.14 In 1884-1886—when a crash of worldwide sugar prices hit the industry—sugar refineries tried to restrict production and to establisha bonus/malus system for the purchase of raw sugar which deviates from the industry standardquality. Refineries were not able to sustain collusion,15 with only limited evidence why thesecartels failed.
13Centralverein (1904, p. 63)14Centralverein (1904, pp. 63-64)15Centralverein (1904, p. 65)
CHAPTER 2. SUGAR CARTEL IN AUSTRIA-HUNGARY 18
2.3.2 Excise Tax as a Basis for Cartel Formation
The tax reform in 1888 was decisive for cartelization. The monitoring mechanisms of all suc-cessful sugar cartels were based on the excise tax. Excise taxes are selective taxes on the saleor use of specific goods and services, such as alcohol and gasoline (Hines, 2008).
Before the tax reform 1888 The cartelization attempt in 1873/74 failed as there wasno reliable information on the production quotas of the competitors. Sugar producers had notdisclosed their true production because they were afraid to pay higher taxes: From 1865 on,sugar taxation was based on capacity. A certain utilization was assumed to estimate productionas a tax base. The effective utilization surpassed the assumed one, so effective taxation was be-low the planned one. A disclosure of true production to the cartel would have increased the riskthat tax authorities learned about true production and thus the risk of a sugar tax reform obli-gating the industry to pay higher taxes. Thus, in 1873/74, true sugar production of individualrefineries’ was private information both to cartel management as well as tax authorities.
Eduard Siegl was the main proponent of cartelization in 1873/74. He failed due to lack ofpublic production data and the low willingness to provide private data. In 1880, he joined thetax administration. One year earlier, he had proposed the reform towards an excise tax onthe sold quantity of sugar and promised beneficial effects for the ministry of finance as well asthe industry.16 When the excise tax took effect in 1888, he had become director general forsugar taxation.17 The industry itself had asked for strict control supported by fines based oncriminal law18 and it had accepted the necessary investment to secure effective taxation—forexample, two meter tall walls had to be built around sugar factories. Tax authorities werestaffed with former sugar industry experts. Sugar tax administration was effective from 1888onwards—tax evasion and avoidance ended.19 To sum up, the industry and the governmenthad identified their common interest in verified production data as a base for cartelization andtaxation—implementation was effective and represented a success for both. The explanatoryremarks of the law explicitly stated that the excise tax helped to put the tax burden on theconsumer and that the exact and reliable statistics could not be achieved with another taxationsystem.20 Upon request of the industry, aggregate sales were published on the 10th of eachmonth for the preceding month.21 In order to further improve monitoring, daily reporting ofprices at the commodity exchanges was introduced in 1888.22
2.3.3 Cartelization during the Protective Duty Regime
Steps to the first quota agreement. The excise tax enabled monitoring from 1888onwards. It took some time to organize the sugar industry and to form the cartel. Ideas toform a cartel had been expressed regularly. For example, in March 1888 an article in the weeklyindustry journal pointed out the low margin of refineries and cartels in other countries as role
16Siegl (1879)17His career was remarkable—especially given the fact that he was imprisoned for five years as a young man
for participating in revolutionary riots against the emperor in 1848 (Öst.Akad.d.Wissenschaften, 2005).18Centralverein (1885, Nr. 24)19Auspitz (1904)20w/o (1886, p. 469)21Centralverein (1888, Nr. 39)22Hromada (1911, p. 53)
CHAPTER 2. SUGAR CARTEL IN AUSTRIA-HUNGARY 19
models.23In April 1888 sugar refineries agreed on two rules in order to limit production and support
higher prices: First, refineries stopped operating in May. Second, sales below the current priceand forward trading were banned.24 In the 1870s and 1880s, it was common practice to sellrefined sugar on the basis of forward trading agreements for the whole year, thus until Augustor September—just before the new season started.25 In February 1889 another meeting ofsugar refineries took place. Rudolf Auspitz—an economist26, a sugar producer and a memberof parliament—wrote that there was a plan to form a sugar cartel among refineries in order tosecure a stable margin. He pointed to the threat of entry by raw sugar factories with low qualityrefined sugar that limited hypothetical pricing power of a cartel among refineries.27 In July1890, sugar refineries exchanged production data in order to identify the necessary restrictionon domestic supply.28 In April 1891, an association of sugar refineries (“Verein oesterr-ungar.Zuckerraffineure”) was formed. The association held a meeting of all members. Again, it wasagreed to stop forward trading.29
First quota agreement in 1891. On July 8th, 1891, a first cartel among all refinerieswithin the monarchy—organized within the association of sugar refineries—was signed for Oc-tober 1st, 1891, to September 30th, 1892. Total sales to the domestic market were restricted to230,000 tons for the whole period and allocated to the 31 refineries in three regions—Bohemia,other sugar refineries in the rest of Austria, and Hungary. Until March 1st, 1892, the cartel hadto decide whether the planned sales were to be increased further. Any additional sales had tobe distributed to outsider refineries and all cartel members except Hungarian refineries.30 Suchchanges in the total production quota required a two-thirds majority in the plenary meeting ofthe association. Refineries had to report their output—including shipments to warehouses—based on the tax bill on the third of each month. For surveillance, the cartel had the rightto access the tax books of individual members. As a compensation payment for an excess orshortfall of individual sales, 20 K per 100 kg of sugar (exceeding the realized cartel overcharge)had to be payed to / were returned by the cartel.31 In order to support the quantity fixing,the refineries had also agreed on common sales terms and seemingly the price was informallyfixed, too. The agreement was prolonged until September 30th, 1894. One source says that theagreement was taken seriously by all members only in the last year (1893/94).32
Break-down in 1894/95. The first cartel broke down in the period of 1894/95 due toa number of reasons. New refineries were in the process of being built. Existing refineriesthat were specialized on the export of refined sugar asked for a quota on the domestic market.Some raw sugar factories planned to establish their own sugar refinery. Some other raw sugarfactories started to produce low-quality refined sugar called crystal. That kind of sugar was a
23Centralverein (1888, pp. 211-212). The article explicitly referred to the American Sugar Trust. Accordingto Genesove and Mullin (1998) the American Sugar Refining Company was formed in December 1887.
24Centralverein (1888, Nr. 15)25Handels- und Gewerbekammer Prag (1896, p. 82)26Auspitz and Lieben (1889) is regularly cited for the Auspitz-Lieben-Edgeworth-Pareto complementarity.27Centralverein (1889, pp. 177-178)28Centralverein (1890, p. 393)29Centralverein (1891, pp. 210-211)30Hungarian refineries had received a larger share in the initial allocation plan.31k.k. Handelsministerium (1912a, pp. 164-165)32Hromada (1911, pp. 55-56)
CHAPTER 2. SUGAR CARTEL IN AUSTRIA-HUNGARY 20
viable substitute in some segments like candy-manufacturing and wine production. In summary,the entry of outsiders into refining was the decisive additional competitive pressure for the firstdomestic refinery cartel that caused the temporary breakdown.33
Second refinery cartel 1895. On November 1st, 1895, a second cartel among refineriesstarted to operate for the season 1895/96.34 In addition to the former fixing of total salesfor the whole year, the monthly release of sugar was now fixed by the cartel management35in order to impede the accumulation of inventories.36 The second cartel operated successfully.However, the higher margin of refineries faced steady competitive pressure by entering raw sugarfactories.37
Cooperation of raw sugar factories. Already when the first cartel ended in 1894, it wasknown that limiting access to raw sugar was necessary to impede entry of outsiders. First plansto form a greater cartel—including the raw sugar factories—were made public in the summerof 1894. It was important that all raw sugar factories—178 in 1897—cooperated in order tosupport the cartel of the refineries. In order to impede entry on the refinery market, raw sugarfactories should supply only refineries within the cartel with raw sugar and thus refuse to dealwith outsiders. In return, refineries should give part of their profit to the raw sugar factories.38
How can 178 raw sugar factories cooperate? The raw sugar factories acted on two markets.Due to low transport costs, all 178 existing raw sugar factories competed in exporting or sellingraw sugar to the refineries. On a much more local scale, in each case a few sugar factoriescompeted in purchasing sugar beets from beet farmers. The crisis on the world sugar marketand the price drop in 1894/95 exerted significant pressure on the margins of raw sugar factories.They could not afford to pay the prices for sugar beets they had agreed on in early 1894.39Higher margins for raw sugar factories thus required restraints on competition in the purchaseof beets as well as in sales of raw sugar.
In December 1896, all 178 raw sugar factories established a common cooperative. Smallgroups were formed that agreed on purchasing sugar beets from local farmers. Different collusiveforms were exclusive purchase territories, purchasing quotas within a territory or a combinationof both. The local price and purchasing conditions for sugar beets were fixed with simplemajority or by a leading firm. For the case of an entering outsider in local beet purchasing,the local cartel was able to approve collective predatory pricing. Disputes—often locally—wereresolved by an internal arbitration panel. The cooperative had a plenary meeting, a supervisoryand a management board located in Vienna. Regional representations were established in Brno,
33Another source—written 17 years latter—says that the drop of raw sugar prices was the decisive shockthat caused the breakdown. According to that theory, raw sugar factories faced low prices for raw sugar onthe world market but observed high margins in the downstream sugar refining market. Thus some raw sugarfactories entered the refining market (Hromada, 1911, pp. 57-58). However, already in early 1894 when rawsugar prices were not significantly lower than the five preceding years, it was clear that entry had occurredand that the first cartel would not continue to operate during the season of 1894/95 (Neue Freie Presse, 1914,1894/3/6;3/7;3/10;3/16;4/7;5/3).
34For this agreement I solely rely on secondary sources. The next available agreement among refineries datesfrom 1906. Thus some clauses in the 1906 agreement might have already been used in the 1895 agreement.
35Hromada (1911, pp. 57-58)36Hlawitschka (1902, p. 6)37Hromada (1911, p. 59)38Neue Freie Presse (1894/7/20)39Hromada (1911, p. 64)
CHAPTER 2. SUGAR CARTEL IN AUSTRIA-HUNGARY 21
Prague and Budapest. The cartel duration was ten years, the exit notice was a year and theexit was forbidden for the first four years—except for an unaccepted change of the agreement.Members had to provide a security deposit.40
The formation of the raw sugar cooperative was central to enable centralized negotiationsbetween the refineries’ cartel and the raw sugar factories.
First great cartel in 1897. On July 26th, 1897, the so-called great sugar cartel—including all 178 raw sugar factories and all 58 refineries—was signed.
Trade with raw and refined sugar had to be done within the cartel. In order to limit entryinto the refinery market, raw sugar factories were not allowed to produce refined sugar or tosupport or establish an outsider refinery. In order to limit entry into the raw sugar market,refineries had to purchase the raw sugar from member raw sugar factories and were not allowedto support or establish an outsider raw sugar factory.
Sales of refined sugar on the domestic market were limited by a quota system. The threatof entry by existing raw sugar factories on the market for refined sugar was eliminated—all rawsugar factories were additionally paid a premium to the export price for raw sugar according totheir quotas.
In order to finance this premium, the refineries had to compensate for raw sugar prices below30 K based on the raw sugar they processed and sold as refined sugar within the domesticcartel. But compensation was limited to 8 K per 100 kg raw sugar—prices below 22 K per100 kg were absorbed by raw sugar factories. The redistribution of this compensation paymentwas based on historical production of raw sugar. The maximum production of the last nineyears (1888/89-1896/97) served as a basis for redistribution. For Hungary, the on-going year(1897/98)—in which beets were already growing—was included, too. Smaller factories—withless than 3,500 tons production of raw sugar per year—received a quota according to theirmaximum production. All other factories received a pro rata quota so that total historicalproduction eligable for compensation was limited to 1,050,000 tons of raw sugar. This centralcompensation clause became effective on November 1st, 1897 (w/o, 1897, p. 4), thus I date thestart of the first great cartel with November 1st, 1897.
Monitoring of the raw sugar factories was based on the following rules: Contract notes thatshowed the sugar’s origin and its destination for all trades were obligatory. All individual sales—including exports—had to be reported within ten days after each month to a joint committee.Controlling bodies had the right to inspect raw sugar factories. Raw sugar producers were liablefor sales agents, too. Trades without a contract note and outside the cartel were penalized with20 K per 100 kg (but penalties were limited to 50% of the transaction value at market prices).For raw sugar factories, exclusion was another sanction. Even late notification of informationwas sanctioned with up to 400 K.
Banning exit from the cartel was a central element: An immediate exit was only possible incase of a change of the excise tax or the import duty. Refineries could leave the cartel if a newrefinery entered the domestic market or if an infringement surpassed 10,000 tons. However, anexit never occurred.
Decision-making and management was delegated to a joint committee consisting of threerepresentatives of refineries and raw sugar factories. For refineries as well as raw sugar facto-ries, the three representants came from Bohemia, Moravia and Hungary representing the main
40Hromada (1911, pp. 65-68)
CHAPTER 2. SUGAR CARTEL IN AUSTRIA-HUNGARY 22
producing regions. This six person committee decided with a two-thirds-majority. Dispute res-olution and the imposition of larger penalties was delegated to an arbitration panel. The panelconsisted of two arbitrators chosen by the two parties and a third, jointly chosen arbitrator.Parties had a right to be heard. The panel was allowed to summon witnesses and to consultwith experts. Decisions were made with simple majority. The procedure was similar to civillaw proceedings.
As to the financing of the cartel, costs were split evenly between refineries and raw sugarfactories on a pro rata basis relative to the quota.41 For lobbying activities, the joint committeehad a right to ask for up to 0.2 K per 100 kg—about 0.5% of the net of tax sales price—withoutbeing billed. This extra money was spent for the media and other lobbying activities.42
The refinery market was still managed by the quota agreement among refineries. Additionally—from July 1897 on—the price was fixed, too. In order to ensure the minimum price, thecommonly-run refinery had to buy all sugar below the respective quota at the fixed price dis-counted by 1,5%. A first cartel fee amounting to 1 K per 100 kg was introduced to cover variousexpenses of the commonly-run refinery.43
The first great cartel successfully operated until August 1903. All active raw sugar factoriesand refineries within Austria-Hungary adhered to the clauses of the agreement.44
Dealing with politics and the media. Meanwhile, the success of the first great cartelled to massive price increases and damages to consumers. Neither elastic demand nor en-trants limited the cartel’s pricing power which led to political opposition. Political concernsand protests in the media against the various cartels were already expressed in July 1891 inthe parliament when the first refinery cartel formed. Renewed concerns led to a draft lawagainst cartels in industries with indirect taxes in 1897/1898.45 However, it was never passedby parliament. Because the monarchy was not a democracy with equal voting rights, sugarindustrialists—Kraus called them “Zuckerbarone” (sugar barons)—were strongly represented inparliament (Kraus (Vol 129, 1903, pp. 4): “In other countries members of parliament resignas a member, if their personal interests are involved. The sugar refiner Auspitz resigned as amember, since his party did not elect him into the sugar committee and since he did not acceptthat his right for corruption was diminished.”) Anecdotal evidence suggests that parts of themedia were bribed.46
Furthermore, the government and the industry backed each other. For example, the cartellimited the release of sugar before the second large tax increase in August 1899 in order to limitdemand anticipation.47 In August 1897—when prices rose due to the advent of the first greatcartel—the imports of the substitute saccharin started to threaten sales of sugar as well as sugartax revenues.48 In 1898, imports of saccharin were prohibited.49 The industry even asked—butwithout success—for a higher protective duty when the world market prices dropped in 1902and some minor imports occurred.50
41w/o (1897)42Hromada (1911, pp. 69-76)43Hromada (1911, p. 58)44Hromada (1911, p. 58)45Hanreich (1989, pp.144-166) surveys the intentions within Austria-Hungary to legislate cartels.46Hlawitschka (1902, p. 76-81)47Kraus (Vol. 13, 1899, pp. 1-4)48Neue Freie Presse (1897/08/28)49See Roth and Lück (2011).50Hlawitschka (1902, p. 35)
CHAPTER 2. SUGAR CARTEL IN AUSTRIA-HUNGARY 23
Collusion with a foreseeable end. The year before the Brussels Convention came intoforce, a renewed agreement was formed until October 31st 1903. Prepurchase and presaleswere again forbidden before September 1st, 1903—when the convention came into force.51 Therefinery cartel faced the risk that firms would leave the cartel in order to gain an outsiderprofit for the last months before the protective duties would be lifted. This corresponds toeconomic theory that suggests that a game with finite repetitions may only have a non-collusiveequilibrium.52
On March 20th, 1903—before the Brussels Convention came into force—the cartel formed anexclusive joint sales company located at the commonly-run refinery in Chropyně.53 Refinerieswere allowed to sell up to 3% of their quota in the local surroundings at centrally fixed prices. Acommittee consisting of 13 refineries was in charge of the joint sales company and fixed the priceand freight for each place within the monarchy. Price differences for different grades of refinedsugar were fixed, too. Deliveries and invoicing was done by the individual refineries based on acentral contract note. The individual refineries conferred treaties with sales agents to the jointsales company. Orders, contract notes and bills had to be immediately reported to the jointsales company. On a weekly basis, freight costs, internal consumption, sugar donations, and aregister of outstanding bills had to be reported.54
Thus the refinery cartel centralized sales in an exclusive joint sales company to cope withthe expected break-down of the cartel in the near future.
2.3.4 The Cartel after the Brussels Convention
Break-down in September 1903. On September 1st, 1903, the first great cartel brokedown due to the Brussels Convention. This multilateral trade agreement banned export bountiesand limited import duties to 5.7 K. The agreement between refineries and raw sugar factoriesincluded a sunset clause for such an event—the first great cartel was dissolved.
State-run cartel incompatible with Brussels Convention. The industry and thegovernment tried to maintain the industry organization via a law similar to the preceding cartelagreement. The ministry of finance headed by the Austrian economist Eugen von Boehm-Bawerk proposed the draft law. In the bill, output of raw sugar factories as well as refineries wasregulated by a quota. Refineries had to make a compensation payment to the raw sugar factoriesamounting to 3.5 K per 100 kg. Despite heavy opposition—the redistribution from consumersto the industry was obvious—parliament approved the law.55 But the law never took effect:The Brussels Convention had a permanent commission in Brussels to monitor the convention.The law was declared incompatible with the Brussels Convention on June 20th, 1903, since theregulated cartel was an indirect export bounty.56 Thus the emperor had to withdraw the law andcartelization was not maintained. Finally, a duty within the dual monarchy was introduced toat least be able to separate the Hungarian and the Austrian market. Sugar imports to Hungarysurpassing a certain amount were charged a duty of 3.5 K in order to protect the Hungarian
51Hromada (1911, pp. 76-80)52See, for instance, Ivaldi et al. (2003).53Hromada (1911, p. 60)54Kartell-Rundschau (1903, pp. 318-321)55For a detailed documentation on the literally fights on the law in parliament, see Arbeiterzeitung
(1903/01/31).56Hromada (1911, p.142) and Walker (1903).
CHAPTER 2. SUGAR CARTEL IN AUSTRIA-HUNGARY 24
industry. Already in July 1903, the industry started to lobby for discriminatory freight ratesthat favored exports and impeded imports.57
Dissolution of the joint sales company in August 1904. The Brussels Conventiondid not prohibit private cartels. Thus, the majority of refineries tried to maintain the cartelamong refineries, but due to some outsiders the joint sales company was finally dissolved inAugust 1904.58 Due to these outsiders, prices for refined sugar returned to export parity andthus soon the competitive level. For some years, the sugar industry faced competition on thenew domestic market. Plans to cartelize could not be implemented within the next three years.
Third refinery cartel 1906-1911. On September 24th, 1906, refineries signed the nextagreement that became effective on October 1st, 1906. It solely included refineries within theAustrian part of the monarchy. Within Hungary, a separate agreement had been formed—thetwo cartels agreed to refrain from competing with each other. Austrian sales to Hungary werelimited to 25,000 tons.59 The third refinery cartel fixed quotas for refined sugar. However, salesof raw sugar and crystal sugar were not included in the agreement.60 In 1906, an offer to forma privately organized great cartel in the spirit of the 1903 law was not successful.61
The measurement of the quotas was done with respect to the payment of the tax. Refinerieswere able to postpone the payment of taxes by selling to tax free warehouses, which had to paythe taxes not until they sold the sugar to the customers. The agreement made refineries liablefor the sales of their sugar when the tax was paid—thus also for sales from the free warehouses.Quotas were allocated to individual refineries for specific periods.62 I stress this point sinceit allowed a stricter control of the monthly release of sugar. Sales outside the contract werepenalized with 10 K per 100 kg. The committee recommended a margin and thus the retailprice at least on a monthly basis. Entry of outsiders required approval by all members. In orderto prevent imports or expansion of producers of crystal sugar, the third cartel started to offerretroactive exclusivity rebates: Customers with exclusive purchases at the cartel above 60 or240 tons a year got a refund paid out by a central office of 0.25 or 0.5 K per 100 kg. In orderto monitor each customer the refineries had to report individual sales to this central office. Theduty to report included name and residence of the customer, date of the contract and delivery,type of sugar, price and freight for sales delivered by the seller. So the office was able to keepindividual accounts for all sales to each customer. A contract note was recommended.63
In 1909, the 1906 agreement was renewed. Some adaptations were made in order to improvethe prevention of entry and expansion of outsiders as well as the export restriction to Hungary:The contract note was made obligatory for sales above one ton. The exclusivity rebate wasrestricted to 240 tons. The contract note also included the clause that breaches of the exclusivityclause were penalized with 1 K per 100 kg and that sales to Hungary or Bosnia were penalizedwith 5 K per 100 kg. In order to avoid an abuse of the exclusivity rebate and a circumvention ofthe regional restriction, even resellers—the second hand—had to use the contract note. These
57See Centralverein (1904, pp. 119)58Centralverein (1905, p. 128)59Hromada (1911, p. 139)60k.k. Handelsministerium (1912a, p. 115)61Prager Zuckermarkt (1906, 1906/10/16)62It cannot be excluded that the refineries’ agreement in 1895 already included such a clause.63k.k. Handelsministerium (1912a, pp. 114-120)
CHAPTER 2. SUGAR CARTEL IN AUSTRIA-HUNGARY 25
resellers were obliged to push the claim against another reseller—the third hand—or assign itto the selling refinery. All refineries within the third cartel were liable for the rebates.64
Renewed negotiations with raw sugar factories. Meanwhile, raw sugar factories sup-plied crystal sugar that was of lower quality. From 1908 on, crystal sugar was listed and tradedat the Vienna product exchange.65 This indicates that the importance of crystal sugar rose.66Another relevant factor for the formation of the second great cartel was the stronger organiza-tion of sugar beet farmers. Farmers started to organize themselves in order to improve theirbargaining power in the negotiations with raw sugar factories. They established a cooperativeand rented a raw sugar factory to process the sugar beets on their own.67 In 1909 there wasa new draft for a great cartel; a somehow similar draft was sent to the raw sugar factories onMarch 18th, 1911.68
In the negotiations for a joint, great cartel, the central parameter was the price for raw sugarrelative to the price for refined sugar since it distributed the cartel profit between refineries andraw sugar producers.69 Some smaller refineries—each of them had less than half the averagequota and presumably higher marginal cost—asked for a higher profit. On the other hand,17 raw sugar factories in Bohemia with well-respected owners unanimously agreed to build acommonly-run large sugar refinery next to a streamway.70
Second great cartel. On April 29th 1911, a second great cartel was formed. Refinerieshad to pay additional 3.5 K per 100 kg of sold refined sugar—exactly the same amount as inthe 1903 draft law—to a common fund that was payed out to the raw sugar factories. Thepayment was obligatory for all sales realized after September 30th, 1911,71 thus I set October1st, 1911, as the effective beginning of the second great cartel. The main rules were the same asfor the first great cartel: Vertical integration was forbidden for refineries as well as for raw sugarfactories. Trade of raw sugar had to be made exclusively within the cartel based on contractnotes, deviations were penalized with 10 K per 100 kg. The information exchange and auditingduties for raw sugar factories were similar to the refineries’ system. The decision-making wasdelegated to a joint committee with eight members, a two-thirds majority was necessary fordecisions. An arbitration panel was responsible for dispute resolution.72 The second greatcartel was still active when World War I broke out in late July 1914.
2.3.5 Review of Agreed Cartel Rules
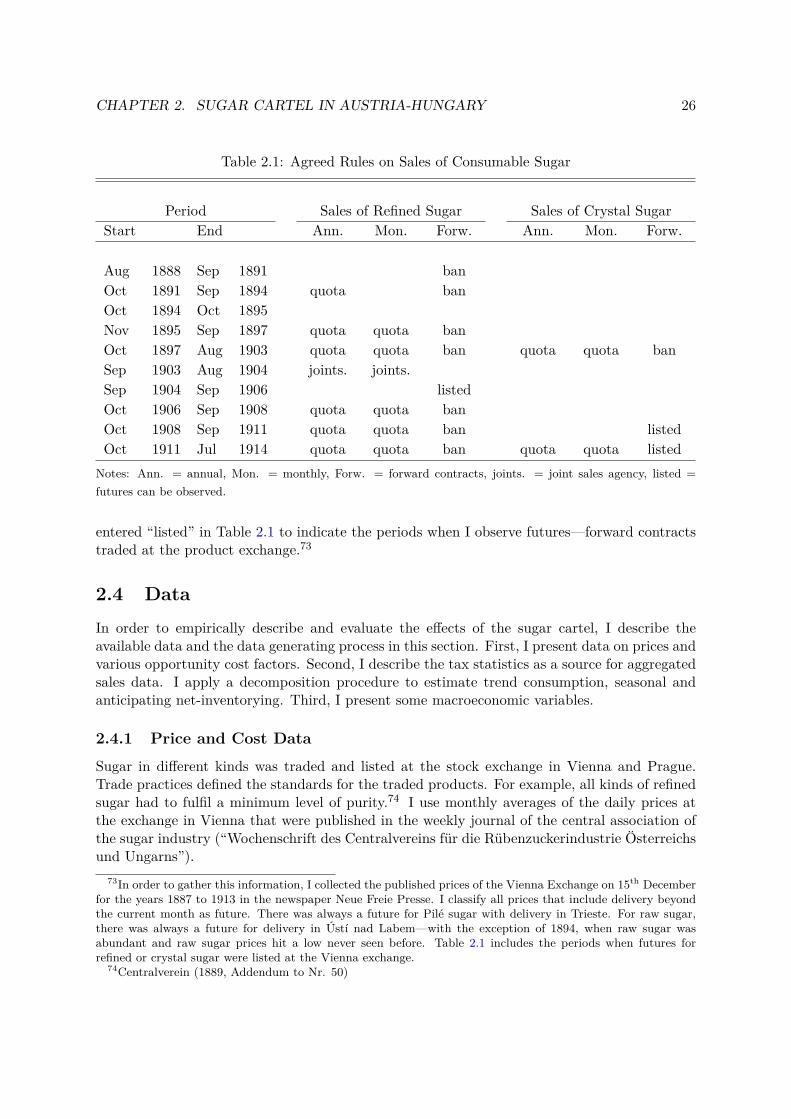
Table 2.1 lists the observed agreed rules for the sales of refined and crystal sugar and whetherannual sales, monthly sales or forward contracts were regulated by the industry. For sometime periods information is not available whether forward contracts existed. Therefore, I have
64k.k. Handelsministerium (1912a, pp. 125-127)65Neue Freie Presse (1908/12/15)66Unfortunately, sugar tax data do not distinguish between crystal and refined sugar.67Hromada (1911, pp. 146-171)68Kartell-Rundschau (1911, pp. 322-324)69In Hungary, the existing refinery cartel after the Brussels convention was renewed. A second great cartel
like in Austria was not realized (Kartell-Rundschau (1911, p. 819)). There was another renewal for five years(Kartell-Rundschau (1912, p. 939)).
70Kartell-Rundschau (1911, pp. 242-245)71k.k. Handelsministerium (1912a, p. 136)72k.k. Handelsministerium (1912a, pp. 132-145)
CHAPTER 2. SUGAR CARTEL IN AUSTRIA-HUNGARY 26
Table 2.1: Agreed Rules on Sales of Consumable Sugar
Period Sales of Refined Sugar Sales of Crystal SugarStart End Ann. Mon. Forw. Ann. Mon. Forw.
Aug 1888 Sep 1891 banOct 1891 Sep 1894 quota banOct 1894 Oct 1895Nov 1895 Sep 1897 quota quota banOct 1897 Aug 1903 quota quota ban quota quota banSep 1903 Aug 1904 joints. joints.Sep 1904 Sep 1906 listedOct 1906 Sep 1908 quota quota banOct 1908 Sep 1911 quota quota ban listedOct 1911 Jul 1914 quota quota ban quota quota listed
Notes: Ann. = annual, Mon. = monthly, Forw. = forward contracts, joints. = joint sales agency, listed =futures can be observed.
entered “listed” in Table 2.1 to indicate the periods when I observe futures—forward contractstraded at the product exchange.73
2.4 DataIn order to empirically describe and evaluate the effects of the sugar cartel, I describe theavailable data and the data generating process in this section. First, I present data on prices andvarious opportunity cost factors. Second, I describe the tax statistics as a source for aggregatedsales data. I apply a decomposition procedure to estimate trend consumption, seasonal andanticipating net-inventorying. Third, I present some macroeconomic variables.
2.4.1 Price and Cost Data
Sugar in different kinds was traded and listed at the stock exchange in Vienna and Prague.Trade practices defined the standards for the traded products. For example, all kinds of refinedsugar had to fulfil a minimum level of purity.74 I use monthly averages of the daily prices atthe exchange in Vienna that were published in the weekly journal of the central association ofthe sugar industry (“Wochenschrift des Centralvereins für die Rübenzuckerindustrie Österreichsund Ungarns”).
73In order to gather this information, I collected the published prices of the Vienna Exchange on 15th Decemberfor the years 1887 to 1913 in the newspaper Neue Freie Presse. I classify all prices that include delivery beyondthe current month as future. There was always a future for Pilé sugar with delivery in Trieste. For raw sugar,there was always a future for delivery in Ústí nad Labem—with the exception of 1894, when raw sugar wasabundant and raw sugar prices hit a low never seen before. Table 2.1 includes the periods when futures forrefined or crystal sugar were listed at the Vienna exchange.
74Centralverein (1889, Addendum to Nr. 50)
CHAPTER 2. SUGAR CARTEL IN AUSTRIA-HUNGARY 27
For the domestic price level I use the spot market price for Viennese refined sugar, prime,delivered in Vienna (“W. Raffinade, Prima, prompt ab Wien”). “Prime” refined sugar was thefirst product during the repeated refining process. This product had the highest purity and thusquality. It was sold in the form of sugar loaves and packaged in barrels. Packaging of up to 3.5%of the total weight was included in the price. The price in Vienna included the domestic excisetax. For the foreign price level, I use the spot market price for Pilé Centrifugal, prime, deliveredin Trieste (“Pilés Centrifugal, Prima, prompt, ab Triest”). Trieste was the main export harborof Austria-Hungary and the main export trading place for refined sugar. The quality of Pilédiffered from refined sugar in the following aspects that were documented. First, Pilé was sold inbroken pieces and the content of powdered sugar was limited for Pilé in Trieste to the maximumof 20%, whereas for refined in Vienna the upper bound is 10%. Second, Pilé was sold in bags.Third, packaging was included only up to 1,5% of total weight. Fourth, the seller in Trieste hadto pay for the customs handling but he received the export bounty. In sum, there were onlyminor differences with respect to the documented product characteristics. Due to the lack ofinformation, it cannot be excluded that there were other differences in product characteristicsthan mentioned above. Sugar was sold in many different varieties—like for instance as loaves,pieces or cubes. Since most of the refineries produced for the domestic and the foreign marketat the same time, it is justified to assume flexibility of production and to estimate a constantin a regression to control for any remaining unobserved product characteristics. Finally, loavesin Vienna could easily be broken to pieces, packaging could be changed and the sugar could beexported via Trieste.75 The price that was received in Trieste was thus an opportunity cost ofnot selling in Vienna.
There is only fragmented evidence on costs of transportation available. In 1890, for example,the transport from stations in Moravia or Bohemia to Trieste amounted to 3.7 K per 100 kgin 1890 and to 1.12-1.64 K per 100 kg to Vienna if at least 10 tons were transported. Thus,the additional opportunity freight cost was 2.04-2.58 K per 100 kg for exporting via Triesteinstead of selling in Vienna.76 The railway company (Suedbahn) reported during some subsidynegotiations that it received on average 1.31 K per 100 kg in 1903 for the transport relationVienna to Trieste.77
Descriptive Analysis of Prices
Figure 2.3 gives information on the prices observed.To understand the factors that influence the domestic price, it is essential to know the
alternative—exports. Trieste served as export harbor for the monarchy. Sugar was sold mainlyduring the last quarter of the year. The destination countries were mainly situated in theMediterranean Area. India was the largest buyer in the East. Small amounts were exportedto far-distant countries like Japan or Argentina. Market reports estimated yields in Europeanbeet sugar markets, worldwide inventories and analyzed the actions of England, France, India,Russia, Cuba and North-America on the world sugar market. Foreign prices for sugar werepublished in the weekly journal for Magdeburg, Hamburg, Amsterdam, Paris, London and NewYork. Data on quantities were published for the main production and consumption countries
75See also Handels- und Gewerbekammer Prag (1896, p. 82) that states that most of the refineries producedfor the domestic and the export market as well.
76Centralverein (1890, p. 81)77Neue Freie Presse (1903/08/11)
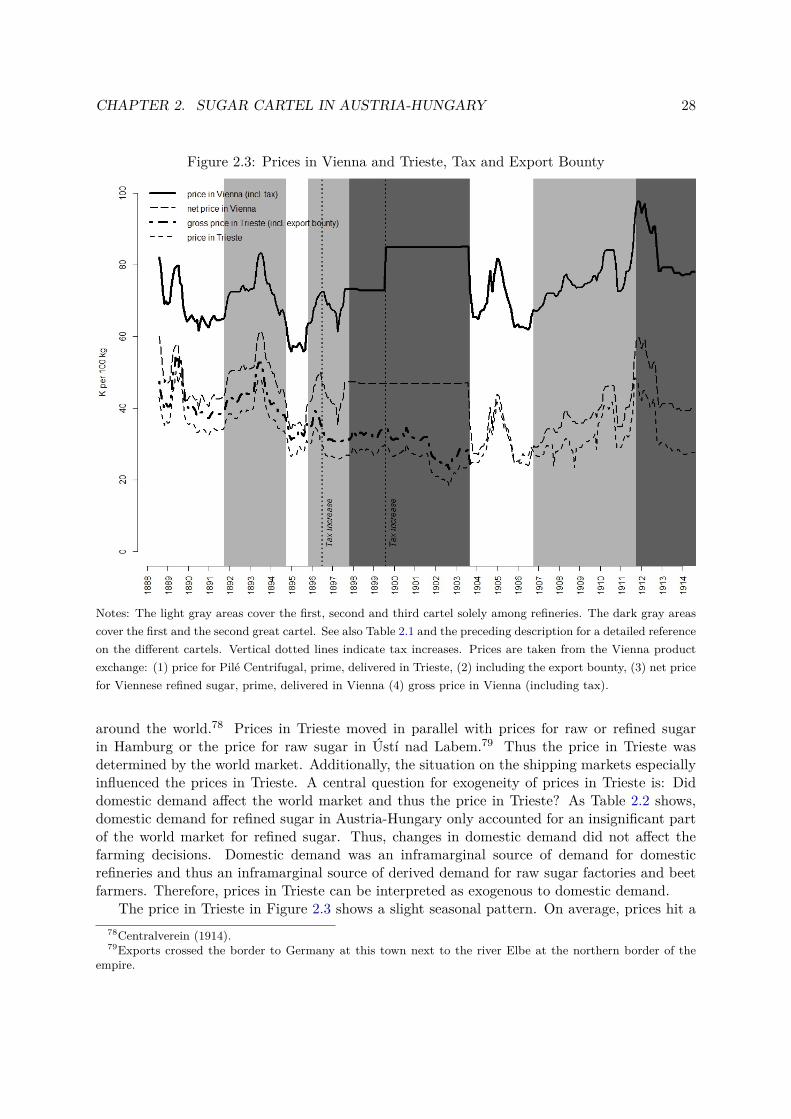
CHAPTER 2. SUGAR CARTEL IN AUSTRIA-HUNGARY 28
Figure 2.3: Prices in Vienna and Trieste, Tax and Export Bounty
Notes: The light gray areas cover the first, second and third cartel solely among refineries. The dark gray areascover the first and the second great cartel. See also Table 2.1 and the preceding description for a detailed referenceon the different cartels. Vertical dotted lines indicate tax increases. Prices are taken from the Vienna productexchange: (1) price for Pilé Centrifugal, prime, delivered in Trieste, (2) including the export bounty, (3) net pricefor Viennese refined sugar, prime, delivered in Vienna (4) gross price in Vienna (including tax).
around the world.78 Prices in Trieste moved in parallel with prices for raw or refined sugarin Hamburg or the price for raw sugar in Ústí nad Labem.79 Thus the price in Trieste wasdetermined by the world market. Additionally, the situation on the shipping markets especiallyinfluenced the prices in Trieste. A central question for exogeneity of prices in Trieste is: Diddomestic demand affect the world market and thus the price in Trieste? As Table 2.2 shows,domestic demand for refined sugar in Austria-Hungary only accounted for an insignificant partof the world market for refined sugar. Thus, changes in domestic demand did not affect thefarming decisions. Domestic demand was an inframarginal source of demand for domesticrefineries and thus an inframarginal source of derived demand for raw sugar factories and beetfarmers. Therefore, prices in Trieste can be interpreted as exogenous to domestic demand.
The price in Trieste in Figure 2.3 shows a slight seasonal pattern. On average, prices hit a78Centralverein (1914).79Exports crossed the border to Germany at this town next to the river Elbe at the northern border of the
empire.
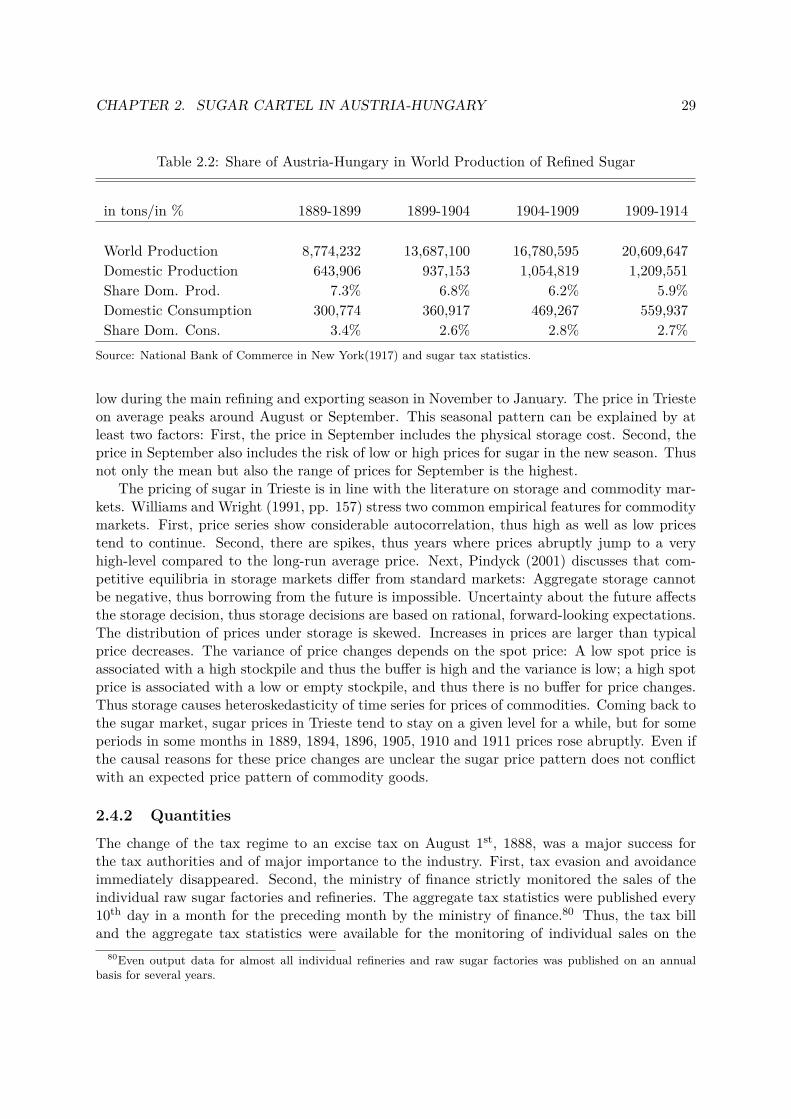
CHAPTER 2. SUGAR CARTEL IN AUSTRIA-HUNGARY 29
Table 2.2: Share of Austria-Hungary in World Production of Refined Sugar
in tons/in % 1889-1899 1899-1904 1904-1909 1909-1914
World Production 8,774,232 13,687,100 16,780,595 20,609,647Domestic Production 643,906 937,153 1,054,819 1,209,551Share Dom. Prod. 7.3% 6.8% 6.2% 5.9%Domestic Consumption 300,774 360,917 469,267 559,937Share Dom. Cons. 3.4% 2.6% 2.8% 2.7%
Source: National Bank of Commerce in New York(1917) and sugar tax statistics.
low during the main refining and exporting season in November to January. The price in Triesteon average peaks around August or September. This seasonal pattern can be explained by atleast two factors: First, the price in September includes the physical storage cost. Second, theprice in September also includes the risk of low or high prices for sugar in the new season. Thusnot only the mean but also the range of prices for September is the highest.
The pricing of sugar in Trieste is in line with the literature on storage and commodity mar-kets. Williams and Wright (1991, pp. 157) stress two common empirical features for commoditymarkets. First, price series show considerable autocorrelation, thus high as well as low pricestend to continue. Second, there are spikes, thus years where prices abruptly jump to a veryhigh-level compared to the long-run average price. Next, Pindyck (2001) discusses that com-petitive equilibria in storage markets differ from standard markets: Aggregate storage cannotbe negative, thus borrowing from the future is impossible. Uncertainty about the future affectsthe storage decision, thus storage decisions are based on rational, forward-looking expectations.The distribution of prices under storage is skewed. Increases in prices are larger than typicalprice decreases. The variance of price changes depends on the spot price: A low spot price isassociated with a high stockpile and thus the buffer is high and the variance is low; a high spotprice is associated with a low or empty stockpile, and thus there is no buffer for price changes.Thus storage causes heteroskedasticity of time series for prices of commodities. Coming back tothe sugar market, sugar prices in Trieste tend to stay on a given level for a while, but for someperiods in some months in 1889, 1894, 1896, 1905, 1910 and 1911 prices rose abruptly. Even ifthe causal reasons for these price changes are unclear the sugar price pattern does not conflictwith an expected price pattern of commodity goods.
2.4.2 Quantities
The change of the tax regime to an excise tax on August 1st, 1888, was a major success forthe tax authorities and of major importance to the industry. First, tax evasion and avoidanceimmediately disappeared. Second, the ministry of finance strictly monitored the sales of theindividual raw sugar factories and refineries. The aggregate tax statistics were published every10th day in a month for the preceding month by the ministry of finance.80 Thus, the tax billand the aggregate tax statistics were available for the monitoring of individual sales on the
80Even output data for almost all individual refineries and raw sugar factories was published on an annualbasis for several years.
CHAPTER 2. SUGAR CARTEL IN AUSTRIA-HUNGARY 30
domestic market within the cartel. Furthermore—central for the analysis of this paper—anexact measure of sales of consumable sugar on the domestic market became available as well.
It is crucial to understand what the official statistics for sales of refined sugar exactly mea-sure. Sugar was superposable, thus sugar factories, refineries, tax-free warehouses, wholesalers,downstream manufacturers, retailers as well as final consumers were able to store sugar. Sugarwas taxed at the gate of the factory, the refinery or the tax-free warehouse. Official statisticsthus published the flow of refined sugar out of the refinery or tax-free warehouse.81 Thus theactual amount of consumption is not directly observable since sales measured at the point oftaxation consist of the actual consumption as well as the net flow into the taxed stocks ofwholesalers, downstream manufacturers, retailers and final consumers.
Decomposition of Sales
In order to provide a first univariate descriptive analysis into these effects, I apply a struc-tural time series decomposition procedure initially presented by Cleveland et al. (1990). Thisprocedure allows a decomposition of the sales Qt series into a trend component Tt, a seasonalcomponent St and a remainder component Rt.
Qt = Tt + St +Rt (2.1)
I choose this procedure due to the relatively flexible modeling of changes in the seasonal patternand due to the robustness against outliers. Central for smoothing the time series are locallyweighted regressions for each individual data point. The weights are based on the distance tothe estimated data point. The procedure consists of two loops. The inner loop detrends theseries in the first step. The second step smooths the 12 monthly cycle subseries individually.The third step applies a filter to each data point received by the 12 monthly subseries for thelength of the period. The fourth step creates the seasonal component. It detrends the 12monthly cycle subseries received in the second step by the filter received in the third step. Inthe fifth step, the original series is deseasonalized by the seasonal component in step four. Inthe sixth step, the deseasonalized series is detrended once more to decompose the series furtherinto a trend and a remainder series. The outer loop is used only for robust analysis and weighsthe data points according to the extremeness of the remainder. For the application, severalparameters have to be specified. Some parameters are chosen by the procedure. What I had tochoose is the number of included observations for seasonal smoothing in step two and whetherI would use the outer loop for a robust estimation. Based on the changing and thus evolvingseasonal pattern due to different cartel behavior I chose the minimal length of seven data pointsfor the monthly cycle subseries that is not affected by the demand anticipation before tax orcartel changes. Thus three data points in the monthly subseries before and after the estimateddata point are the input for the locally weighted regressions. I also had to choose the robustestimation method. The demand anticipation effects—net inventorying—is decomposed intothe remainder, the robust estimation gives these data points a lower weight. The procedureautomatically chooses how many observations are used for the trend. The parameter is 23, thus11 future months are also used for the trend. This leads to an estimated trend that anticipatesthe actual sales data.
81Furthermore, the monthly production of refined sugar, the untaxed stocks of refineries and warehouses, theamount of exports as well as imports was published.
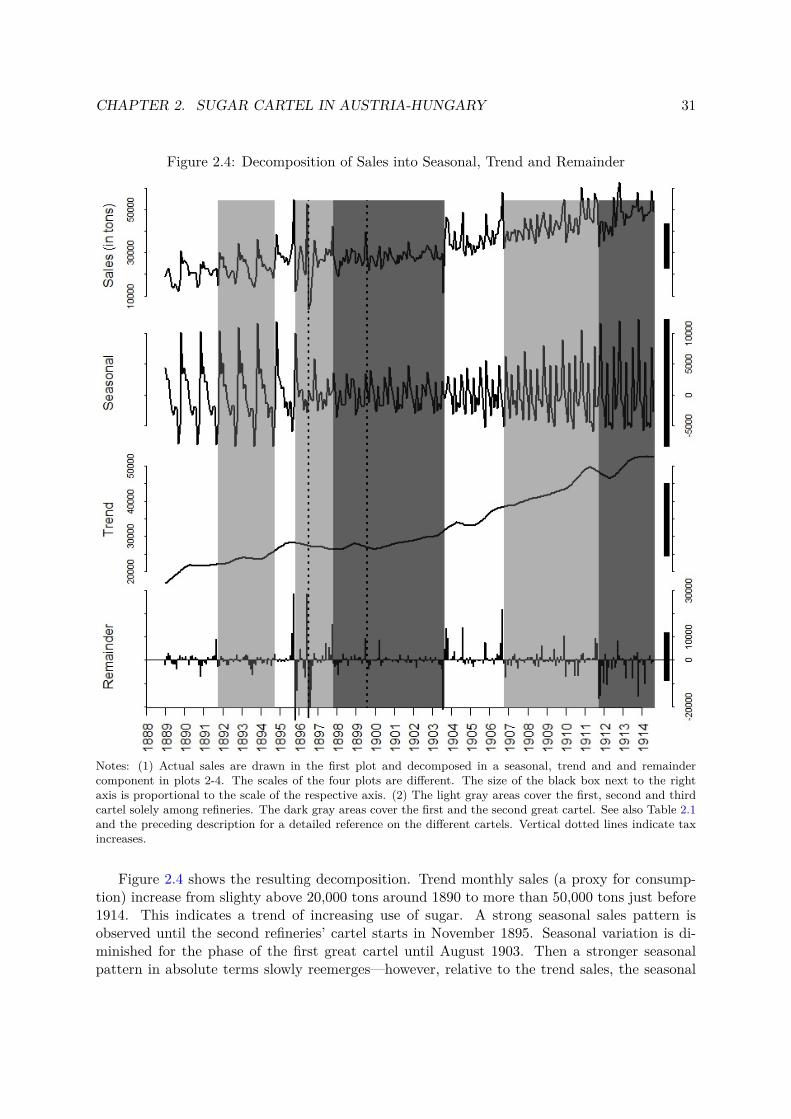
CHAPTER 2. SUGAR CARTEL IN AUSTRIA-HUNGARY 31
Figure 2.4: Decomposition of Sales into Seasonal, Trend and Remainder
Notes: (1) Actual sales are drawn in the first plot and decomposed in a seasonal, trend and and remaindercomponent in plots 2-4. The scales of the four plots are different. The size of the black box next to the rightaxis is proportional to the scale of the respective axis. (2) The light gray areas cover the first, second and thirdcartel solely among refineries. The dark gray areas cover the first and the second great cartel. See also Table 2.1and the preceding description for a detailed reference on the different cartels. Vertical dotted lines indicate taxincreases.
Figure 2.4 shows the resulting decomposition. Trend monthly sales (a proxy for consump-tion) increase from slighty above 20,000 tons around 1890 to more than 50,000 tons just before1914. This indicates a trend of increasing use of sugar. A strong seasonal sales pattern isobserved until the second refineries’ cartel starts in November 1895. Seasonal variation is di-minished for the phase of the first great cartel until August 1903. Then a stronger seasonalpattern in absolute terms slowly reemerges—however, relative to the trend sales, the seasonal
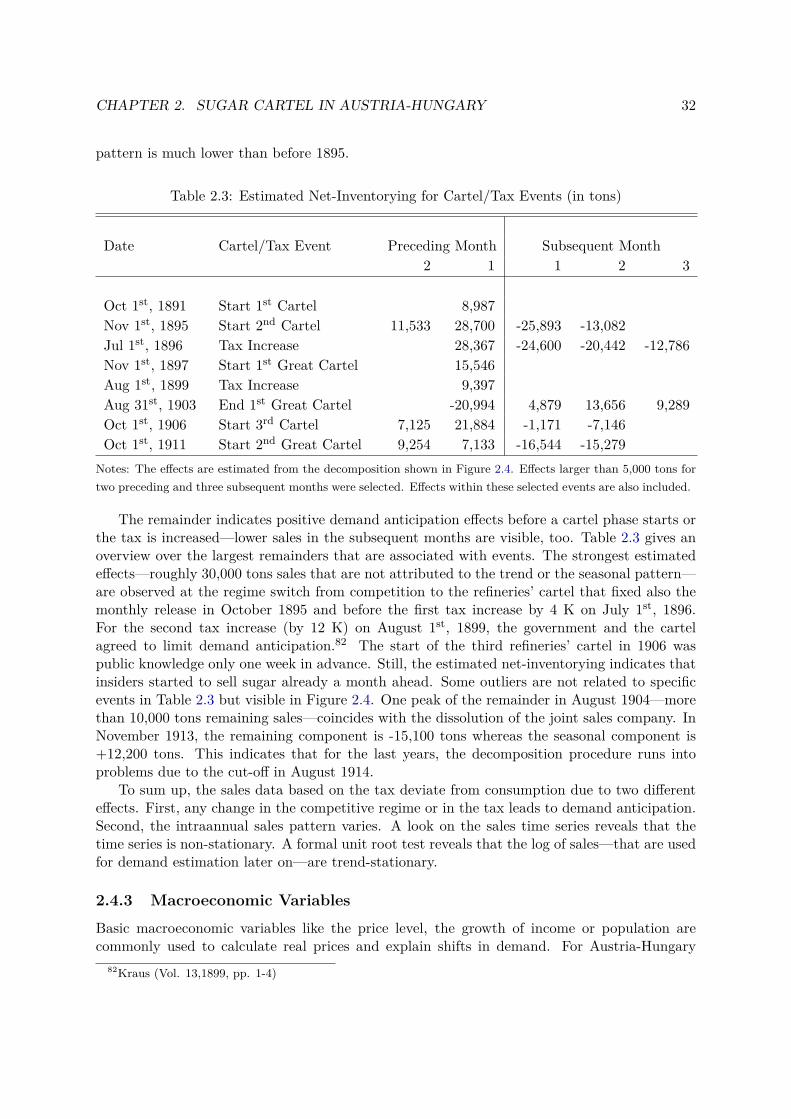
CHAPTER 2. SUGAR CARTEL IN AUSTRIA-HUNGARY 32
pattern is much lower than before 1895.
Table 2.3: Estimated Net-Inventorying for Cartel/Tax Events (in tons)
Date Cartel/Tax Event Preceding Month Subsequent Month2 1 1 2 3
Oct 1st, 1891 Start 1st Cartel 8,987Nov 1st, 1895 Start 2nd Cartel 11,533 28,700 -25,893 -13,082Jul 1st, 1896 Tax Increase 28,367 -24,600 -20,442 -12,786Nov 1st, 1897 Start 1st Great Cartel 15,546Aug 1st, 1899 Tax Increase 9,397Aug 31st, 1903 End 1st Great Cartel -20,994 4,879 13,656 9,289Oct 1st, 1906 Start 3rd Cartel 7,125 21,884 -1,171 -7,146Oct 1st, 1911 Start 2nd Great Cartel 9,254 7,133 -16,544 -15,279
Notes: The effects are estimated from the decomposition shown in Figure 2.4. Effects larger than 5,000 tons fortwo preceding and three subsequent months were selected. Effects within these selected events are also included.
The remainder indicates positive demand anticipation effects before a cartel phase starts orthe tax is increased—lower sales in the subsequent months are visible, too. Table 2.3 gives anoverview over the largest remainders that are associated with events. The strongest estimatedeffects—roughly 30,000 tons sales that are not attributed to the trend or the seasonal pattern—are observed at the regime switch from competition to the refineries’ cartel that fixed also themonthly release in October 1895 and before the first tax increase by 4 K on July 1st, 1896.For the second tax increase (by 12 K) on August 1st, 1899, the government and the cartelagreed to limit demand anticipation.82 The start of the third refineries’ cartel in 1906 waspublic knowledge only one week in advance. Still, the estimated net-inventorying indicates thatinsiders started to sell sugar already a month ahead. Some outliers are not related to specificevents in Table 2.3 but visible in Figure 2.4. One peak of the remainder in August 1904—morethan 10,000 tons remaining sales—coincides with the dissolution of the joint sales company. InNovember 1913, the remaining component is -15,100 tons whereas the seasonal component is+12,200 tons. This indicates that for the last years, the decomposition procedure runs intoproblems due to the cut-off in August 1914.
To sum up, the sales data based on the tax deviate from consumption due to two differenteffects. First, any change in the competitive regime or in the tax leads to demand anticipation.Second, the intraannual sales pattern varies. A look on the sales time series reveals that thetime series is non-stationary. A formal unit root test reveals that the log of sales—that are usedfor demand estimation later on—are trend-stationary.
2.4.3 Macroeconomic Variables
Basic macroeconomic variables like the price level, the growth of income or population arecommonly used to calculate real prices and explain shifts in demand. For Austria-Hungary
82Kraus (Vol. 13,1899, pp. 1-4)
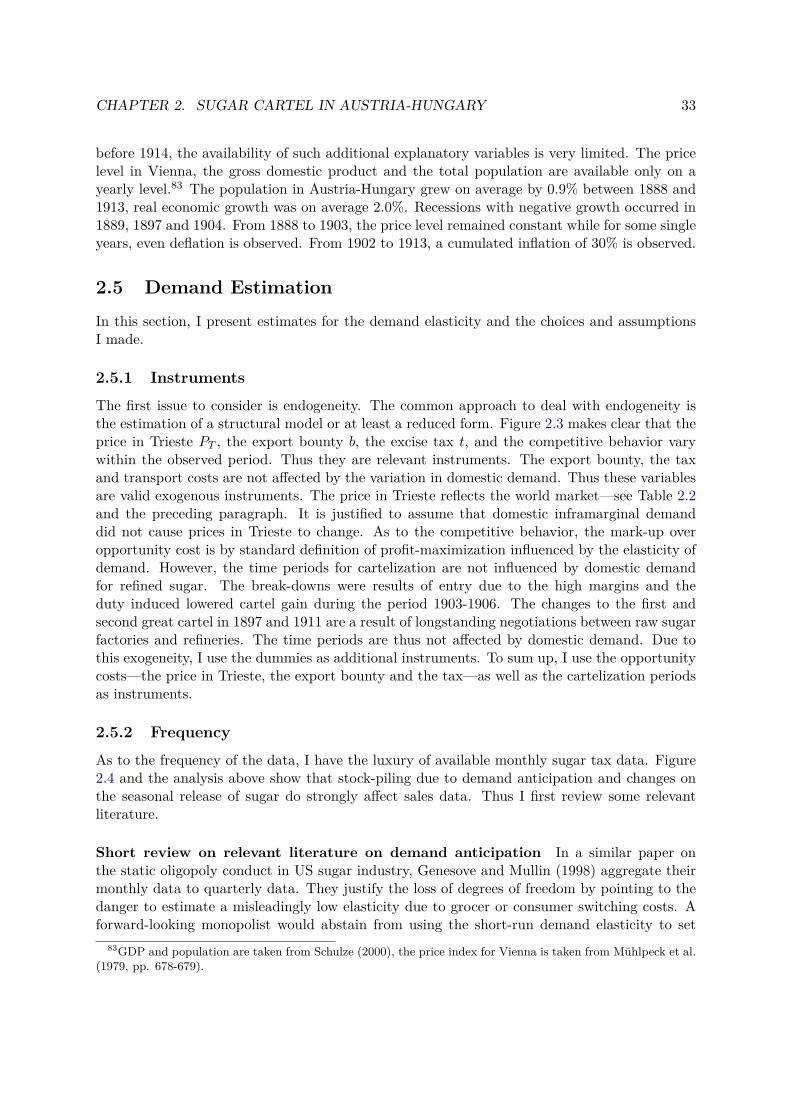
CHAPTER 2. SUGAR CARTEL IN AUSTRIA-HUNGARY 33
before 1914, the availability of such additional explanatory variables is very limited. The pricelevel in Vienna, the gross domestic product and the total population are available only on ayearly level.83 The population in Austria-Hungary grew on average by 0.9% between 1888 and1913, real economic growth was on average 2.0%. Recessions with negative growth occurred in1889, 1897 and 1904. From 1888 to 1903, the price level remained constant while for some singleyears, even deflation is observed. From 1902 to 1913, a cumulated inflation of 30% is observed.
2.5 Demand EstimationIn this section, I present estimates for the demand elasticity and the choices and assumptionsI made.
2.5.1 Instruments
The first issue to consider is endogeneity. The common approach to deal with endogeneity isthe estimation of a structural model or at least a reduced form. Figure 2.3 makes clear that theprice in Trieste PT , the export bounty b, the excise tax t, and the competitive behavior varywithin the observed period. Thus they are relevant instruments. The export bounty, the taxand transport costs are not affected by the variation in domestic demand. Thus these variablesare valid exogenous instruments. The price in Trieste reflects the world market—see Table 2.2and the preceding paragraph. It is justified to assume that domestic inframarginal demanddid not cause prices in Trieste to change. As to the competitive behavior, the mark-up overopportunity cost is by standard definition of profit-maximization influenced by the elasticity ofdemand. However, the time periods for cartelization are not influenced by domestic demandfor refined sugar. The break-downs were results of entry due to the high margins and theduty induced lowered cartel gain during the period 1903-1906. The changes to the first andsecond great cartel in 1897 and 1911 are a result of longstanding negotiations between raw sugarfactories and refineries. The time periods are thus not affected by domestic demand. Due tothis exogeneity, I use the dummies as additional instruments. To sum up, I use the opportunitycosts—the price in Trieste, the export bounty and the tax—as well as the cartelization periodsas instruments.
2.5.2 Frequency
As to the frequency of the data, I have the luxury of available monthly sugar tax data. Figure2.4 and the analysis above show that stock-piling due to demand anticipation and changes onthe seasonal release of sugar do strongly affect sales data. Thus I first review some relevantliterature.
Short review on relevant literature on demand anticipation In a similar paper onthe static oligopoly conduct in US sugar industry, Genesove and Mullin (1998) aggregate theirmonthly data to quarterly data. They justify the loss of degrees of freedom by pointing to thedanger to estimate a misleadingly low elasticity due to grocer or consumer switching costs. Aforward-looking monopolist would abstain from using the short-run demand elasticity to set
83GDP and population are taken from Schulze (2000), the price index for Vienna is taken from Mühlpeck et al.(1979, pp. 678-679).
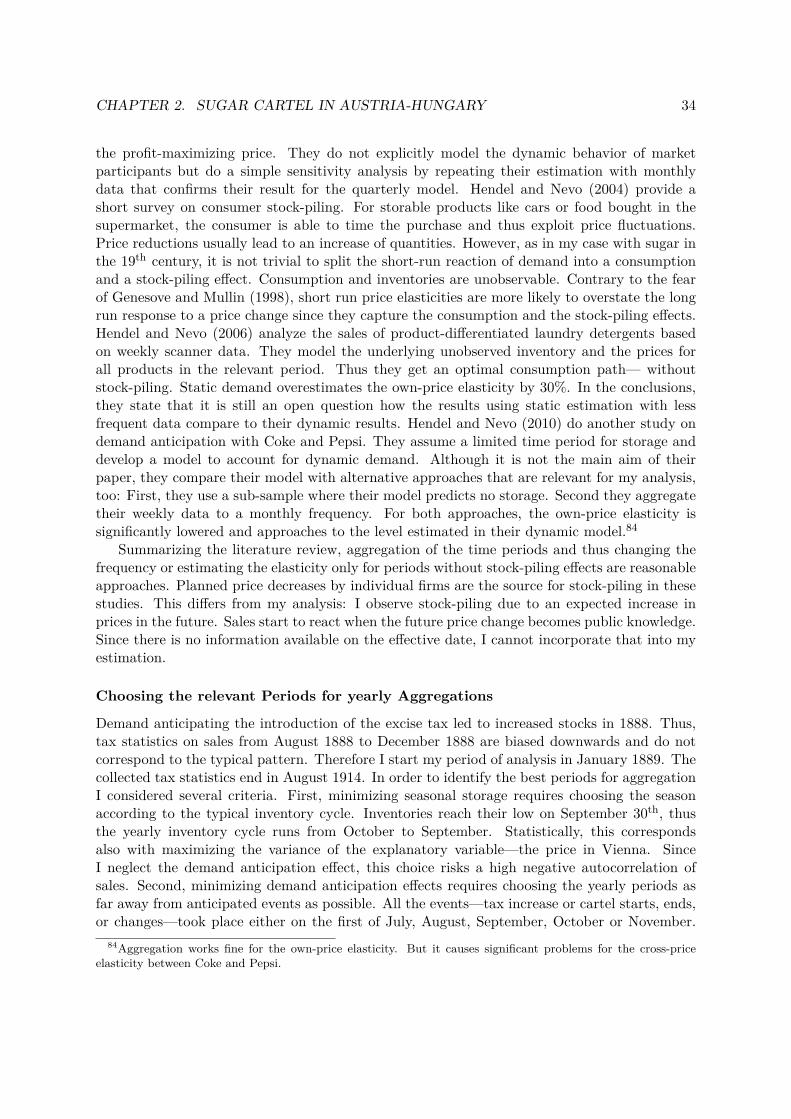
CHAPTER 2. SUGAR CARTEL IN AUSTRIA-HUNGARY 34
the profit-maximizing price. They do not explicitly model the dynamic behavior of marketparticipants but do a simple sensitivity analysis by repeating their estimation with monthlydata that confirms their result for the quarterly model. Hendel and Nevo (2004) provide ashort survey on consumer stock-piling. For storable products like cars or food bought in thesupermarket, the consumer is able to time the purchase and thus exploit price fluctuations.Price reductions usually lead to an increase of quantities. However, as in my case with sugar inthe 19th century, it is not trivial to split the short-run reaction of demand into a consumptionand a stock-piling effect. Consumption and inventories are unobservable. Contrary to the fearof Genesove and Mullin (1998), short run price elasticities are more likely to overstate the longrun response to a price change since they capture the consumption and the stock-piling effects.Hendel and Nevo (2006) analyze the sales of product-differentiated laundry detergents basedon weekly scanner data. They model the underlying unobserved inventory and the prices forall products in the relevant period. Thus they get an optimal consumption path— withoutstock-piling. Static demand overestimates the own-price elasticity by 30%. In the conclusions,they state that it is still an open question how the results using static estimation with lessfrequent data compare to their dynamic results. Hendel and Nevo (2010) do another study ondemand anticipation with Coke and Pepsi. They assume a limited time period for storage anddevelop a model to account for dynamic demand. Although it is not the main aim of theirpaper, they compare their model with alternative approaches that are relevant for my analysis,too: First, they use a sub-sample where their model predicts no storage. Second they aggregatetheir weekly data to a monthly frequency. For both approaches, the own-price elasticity issignificantly lowered and approaches to the level estimated in their dynamic model.84
Summarizing the literature review, aggregation of the time periods and thus changing thefrequency or estimating the elasticity only for periods without stock-piling effects are reasonableapproaches. Planned price decreases by individual firms are the source for stock-piling in thesestudies. This differs from my analysis: I observe stock-piling due to an expected increase inprices in the future. Sales start to react when the future price change becomes public knowledge.Since there is no information available on the effective date, I cannot incorporate that into myestimation.
Choosing the relevant Periods for yearly Aggregations
Demand anticipating the introduction of the excise tax led to increased stocks in 1888. Thus,tax statistics on sales from August 1888 to December 1888 are biased downwards and do notcorrespond to the typical pattern. Therefore I start my period of analysis in January 1889. Thecollected tax statistics end in August 1914. In order to identify the best periods for aggregationI considered several criteria. First, minimizing seasonal storage requires choosing the seasonaccording to the typical inventory cycle. Inventories reach their low on September 30th, thusthe yearly inventory cycle runs from October to September. Statistically, this correspondsalso with maximizing the variance of the explanatory variable—the price in Vienna. SinceI neglect the demand anticipation effect, this choice risks a high negative autocorrelation ofsales. Second, minimizing demand anticipation effects requires choosing the yearly periods asfar away from anticipated events as possible. All the events—tax increase or cartel starts, ends,or changes—took place either on the first of July, August, September, October or November.
84Aggregation works fine for the own-price elasticity. But it causes significant problems for the cross-priceelasticity between Coke and Pepsi.
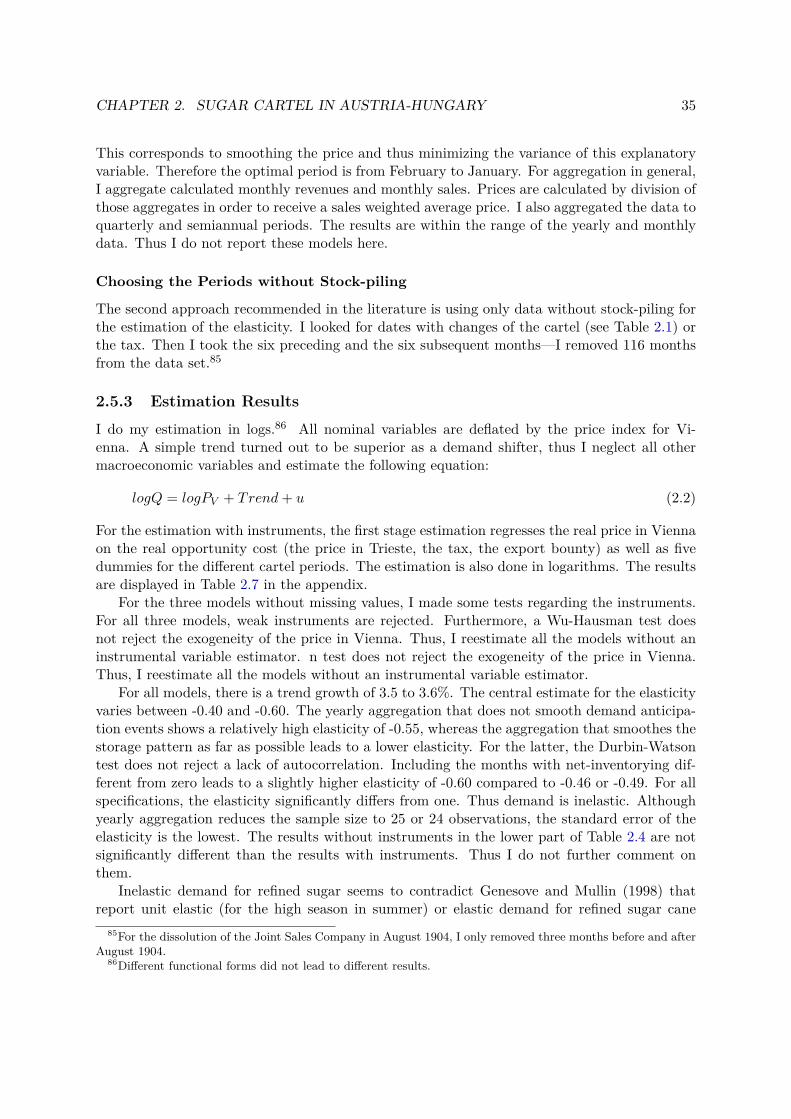
CHAPTER 2. SUGAR CARTEL IN AUSTRIA-HUNGARY 35
This corresponds to smoothing the price and thus minimizing the variance of this explanatoryvariable. Therefore the optimal period is from February to January. For aggregation in general,I aggregate calculated monthly revenues and monthly sales. Prices are calculated by division ofthose aggregates in order to receive a sales weighted average price. I also aggregated the data toquarterly and semiannual periods. The results are within the range of the yearly and monthlydata. Thus I do not report these models here.
Choosing the Periods without Stock-piling
The second approach recommended in the literature is using only data without stock-piling forthe estimation of the elasticity. I looked for dates with changes of the cartel (see Table 2.1) orthe tax. Then I took the six preceding and the six subsequent months—I removed 116 monthsfrom the data set.85
2.5.3 Estimation Results
I do my estimation in logs.86 All nominal variables are deflated by the price index for Vi-enna. A simple trend turned out to be superior as a demand shifter, thus I neglect all othermacroeconomic variables and estimate the following equation:
logQ = logPV + Trend+ u (2.2)
For the estimation with instruments, the first stage estimation regresses the real price in Viennaon the real opportunity cost (the price in Trieste, the tax, the export bounty) as well as fivedummies for the different cartel periods. The estimation is also done in logarithms. The resultsare displayed in Table 2.7 in the appendix.
For the three models without missing values, I made some tests regarding the instruments.For all three models, weak instruments are rejected. Furthermore, a Wu-Hausman test doesnot reject the exogeneity of the price in Vienna. Thus, I reestimate all the models without aninstrumental variable estimator. n test does not reject the exogeneity of the price in Vienna.Thus, I reestimate all the models without an instrumental variable estimator.
For all models, there is a trend growth of 3.5 to 3.6%. The central estimate for the elasticityvaries between -0.40 and -0.60. The yearly aggregation that does not smooth demand anticipa-tion events shows a relatively high elasticity of -0.55, whereas the aggregation that smoothes thestorage pattern as far as possible leads to a lower elasticity. For the latter, the Durbin-Watsontest does not reject a lack of autocorrelation. Including the months with net-inventorying dif-ferent from zero leads to a slightly higher elasticity of -0.60 compared to -0.46 or -0.49. For allspecifications, the elasticity significantly differs from one. Thus demand is inelastic. Althoughyearly aggregation reduces the sample size to 25 or 24 observations, the standard error of theelasticity is the lowest. The results without instruments in the lower part of Table 2.4 are notsignificantly different than the results with instruments. Thus I do not further comment onthem.
Inelastic demand for refined sugar seems to contradict Genesove and Mullin (1998) thatreport unit elastic (for the high season in summer) or elastic demand for refined sugar cane
85For the dissolution of the Joint Sales Company in August 1904, I only removed three months before and afterAugust 1904.
86Different functional forms did not lead to different results.
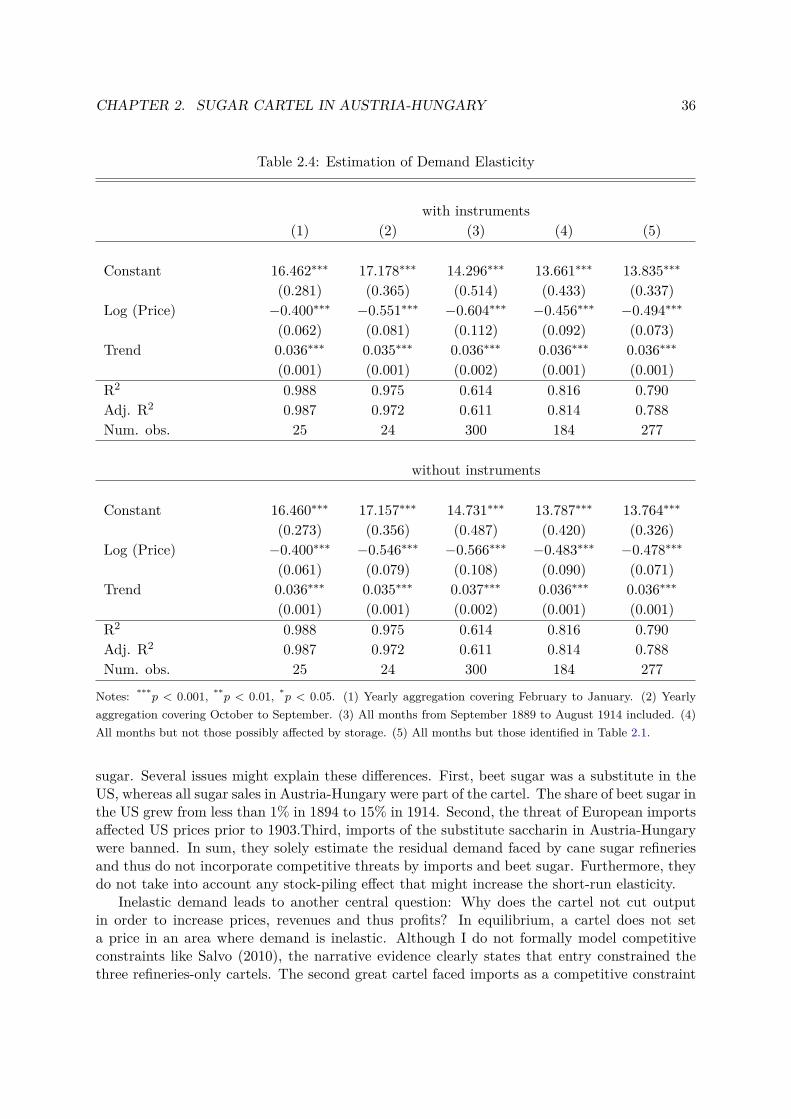
CHAPTER 2. SUGAR CARTEL IN AUSTRIA-HUNGARY 36
Table 2.4: Estimation of Demand Elasticity
with instruments(1) (2) (3) (4) (5)
Constant 16.462∗∗∗ 17.178∗∗∗ 14.296∗∗∗ 13.661∗∗∗ 13.835∗∗∗
(0.281) (0.365) (0.514) (0.433) (0.337)Log (Price) −0.400∗∗∗ −0.551∗∗∗ −0.604∗∗∗ −0.456∗∗∗ −0.494∗∗∗
(0.062) (0.081) (0.112) (0.092) (0.073)Trend 0.036∗∗∗ 0.035∗∗∗ 0.036∗∗∗ 0.036∗∗∗ 0.036∗∗∗
(0.001) (0.001) (0.002) (0.001) (0.001)R2 0.988 0.975 0.614 0.816 0.790Adj. R2 0.987 0.972 0.611 0.814 0.788Num. obs. 25 24 300 184 277
without instruments
Constant 16.460∗∗∗ 17.157∗∗∗ 14.731∗∗∗ 13.787∗∗∗ 13.764∗∗∗
(0.273) (0.356) (0.487) (0.420) (0.326)Log (Price) −0.400∗∗∗ −0.546∗∗∗ −0.566∗∗∗ −0.483∗∗∗ −0.478∗∗∗
(0.061) (0.079) (0.108) (0.090) (0.071)Trend 0.036∗∗∗ 0.035∗∗∗ 0.037∗∗∗ 0.036∗∗∗ 0.036∗∗∗
(0.001) (0.001) (0.002) (0.001) (0.001)R2 0.988 0.975 0.614 0.816 0.790Adj. R2 0.987 0.972 0.611 0.814 0.788Num. obs. 25 24 300 184 277
Notes: ***p < 0.001, **p < 0.01, *p < 0.05. (1) Yearly aggregation covering February to January. (2) Yearlyaggregation covering October to September. (3) All months from September 1889 to August 1914 included. (4)All months but not those possibly affected by storage. (5) All months but those identified in Table 2.1.
sugar. Several issues might explain these differences. First, beet sugar was a substitute in theUS, whereas all sugar sales in Austria-Hungary were part of the cartel. The share of beet sugar inthe US grew from less than 1% in 1894 to 15% in 1914. Second, the threat of European importsaffected US prices prior to 1903.Third, imports of the substitute saccharin in Austria-Hungarywere banned. In sum, they solely estimate the residual demand faced by cane sugar refineriesand thus do not incorporate competitive threats by imports and beet sugar. Furthermore, theydo not take into account any stock-piling effect that might increase the short-run elasticity.
Inelastic demand leads to another central question: Why does the cartel not cut outputin order to increase prices, revenues and thus profits? In equilibrium, a cartel does not seta price in an area where demand is inelastic. Although I do not formally model competitiveconstraints like Salvo (2010), the narrative evidence clearly states that entry constrained thethree refineries-only cartels. The second great cartel faced imports as a competitive constraint
CHAPTER 2. SUGAR CARTEL IN AUSTRIA-HUNGARY 37
and the first great cartel did neither renegotiate nor adjust the net price during its six years’existence. It remains an open question whether problems in renegotiation, morality or politicalpressure led to this stable pricing.
2.5.4 Further Insights on Storage
Up to now, I have not taken into account the insights from the seasonal pattern of storage. Inthis section, I review some theory that relates to storage and the observed market structure.Then, I will estimate the storage effects based on seasonal dummies.
Initially, it is interesting to know why storage occurs. On the one hand, storage is costly:It has a physical storage cost, it binds capital and it carries the risk of depreciation of theinventory due to a change in price. On the other hand, there are some benefits. First, a certainamount of storage is the everyday business of retailers and wholesalers. Second, storage is aninsurance against price volatility.87 Third—and this is the most important point—storage allowsintertemporal substitution of purchases which is especially relevant for all anticipated domesticprice changes due to tax or cartel changes. This intertemporal substitution also interacts withthe supply side: For 1889 to September 1891, I observe competition within an oligopolisticstructure and a ban on presales. According to Anton and DasVarma (2005), each firm triesto capture future demand and thereby induces storage. If such initial competition for futuredemand exists, prices decrease and stronger sales occur early in the season.
For the period of the first cartel—October 1891 to September 1894—I observe a cartel thatlimits yearly sales but does not commit to a monthly release and decides in February whetherthe planned amount of sales shall be increased. Dudine et al. (2006) analyze such a situationwhere a monopolist does not commit to future prices and thus induces storage. In that model,the buyer rationally anticipates the equilibrium in the second period in which the monopolistwill increase future prices to the monopoly level—thus buyers store already in the first periodso that a future price that ignores the intertemporal substitution is not profitable anymore.According to that theory, I also expect higher sales in the earlier period—and thus storage.
For the period of the first great cartel, the cartel decides on the monthly release of allsugar. The cartel releases a sufficient amount to supply current consumption but to preventaccumulation of inventories. This is in line with the monopolist who commits also to futureprices and thus prevents social wasteful storage (Dudine et al., 2006). Under this theory and forthe great cartel fixing the monthly release, I would expect a seasonal pattern that correspondsto consumption—if such a seasonal pattern in consumption exists.
From the end of the joint sales company to the start of the refinery cartel in 1906, I observefuture contracts that enable a separation between the insurance against price changes and thephysical storage service. For such a market structure, social wasteful storage is avoided (Antonand DasVarma, 2005). For the period of the refinery cartel from 1906 on, the cartel fixes themonthly release for refined sugar. However, there is competition for the sales of crystal sugar.Furthermore, for some years futures for crystal sugar are observed on the exchange. Thus Iexpect a sales pattern that corresponds to consumption but is somehow affected by competitivemarket structure for crystal sugar that might induce storage.
87However, there is no reason why storage after the point of taxation should be a prefered insurance againstprice volatility that stems from world markets fluctuations—untaxed inventories of refineries are a better placeto bet on higher world market prices, since only untaxed sugar can be exported. Thus only an insurance againstvolatility on the domestic mark-up above world market prices is desirable.
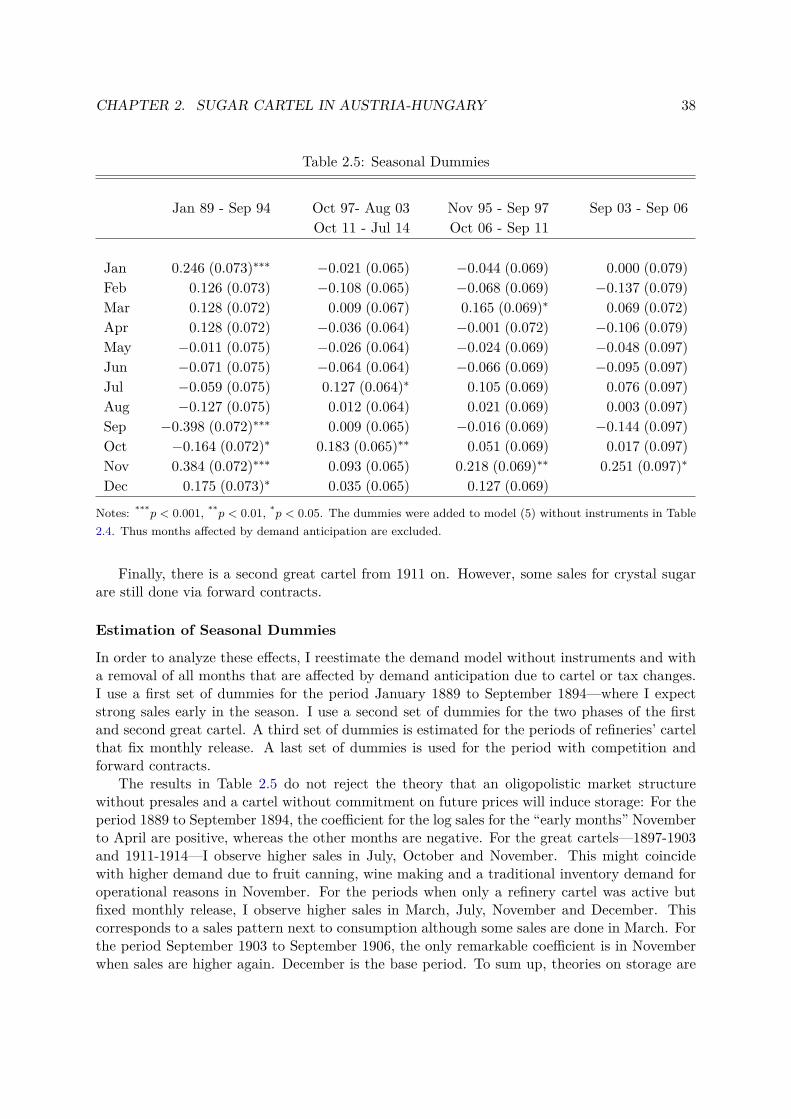
CHAPTER 2. SUGAR CARTEL IN AUSTRIA-HUNGARY 38
Table 2.5: Seasonal Dummies
Jan 89 - Sep 94 Oct 97- Aug 03 Nov 95 - Sep 97 Sep 03 - Sep 06Oct 11 - Jul 14 Oct 06 - Sep 11
Jan 0.246 (0.073)∗∗∗ −0.021 (0.065) −0.044 (0.069) 0.000 (0.079)Feb 0.126 (0.073) −0.108 (0.065) −0.068 (0.069) −0.137 (0.079)Mar 0.128 (0.072) 0.009 (0.067) 0.165 (0.069)∗ 0.069 (0.072)Apr 0.128 (0.072) −0.036 (0.064) −0.001 (0.072) −0.106 (0.079)May −0.011 (0.075) −0.026 (0.064) −0.024 (0.069) −0.048 (0.097)Jun −0.071 (0.075) −0.064 (0.064) −0.066 (0.069) −0.095 (0.097)Jul −0.059 (0.075) 0.127 (0.064)∗ 0.105 (0.069) 0.076 (0.097)Aug −0.127 (0.075) 0.012 (0.064) 0.021 (0.069) 0.003 (0.097)Sep −0.398 (0.072)∗∗∗ 0.009 (0.065) −0.016 (0.069) −0.144 (0.097)Oct −0.164 (0.072)∗ 0.183 (0.065)∗∗ 0.051 (0.069) 0.017 (0.097)Nov 0.384 (0.072)∗∗∗ 0.093 (0.065) 0.218 (0.069)∗∗ 0.251 (0.097)∗
Dec 0.175 (0.073)∗ 0.035 (0.065) 0.127 (0.069)
Notes: ***p < 0.001, **p < 0.01, *p < 0.05. The dummies were added to model (5) without instruments in Table2.4. Thus months affected by demand anticipation are excluded.
Finally, there is a second great cartel from 1911 on. However, some sales for crystal sugarare still done via forward contracts.
Estimation of Seasonal Dummies
In order to analyze these effects, I reestimate the demand model without instruments and witha removal of all months that are affected by demand anticipation due to cartel or tax changes.I use a first set of dummies for the period January 1889 to September 1894—where I expectstrong sales early in the season. I use a second set of dummies for the two phases of the firstand second great cartel. A third set of dummies is estimated for the periods of refineries’ cartelthat fix monthly release. A last set of dummies is used for the period with competition andforward contracts.
The results in Table 2.5 do not reject the theory that an oligopolistic market structurewithout presales and a cartel without commitment on future prices will induce storage: For theperiod 1889 to September 1894, the coefficient for the log sales for the “early months” Novemberto April are positive, whereas the other months are negative. For the great cartels—1897-1903and 1911-1914—I observe higher sales in July, October and November. This might coincidewith higher demand due to fruit canning, wine making and a traditional inventory demand foroperational reasons in November. For the periods when only a refinery cartel was active butfixed monthly release, I observe higher sales in March, July, November and December. Thiscorresponds to a sales pattern next to consumption although some sales are done in March. Forthe period September 1903 to September 1906, the only remarkable coefficient is in Novemberwhen sales are higher again. December is the base period. To sum up, theories on storage are
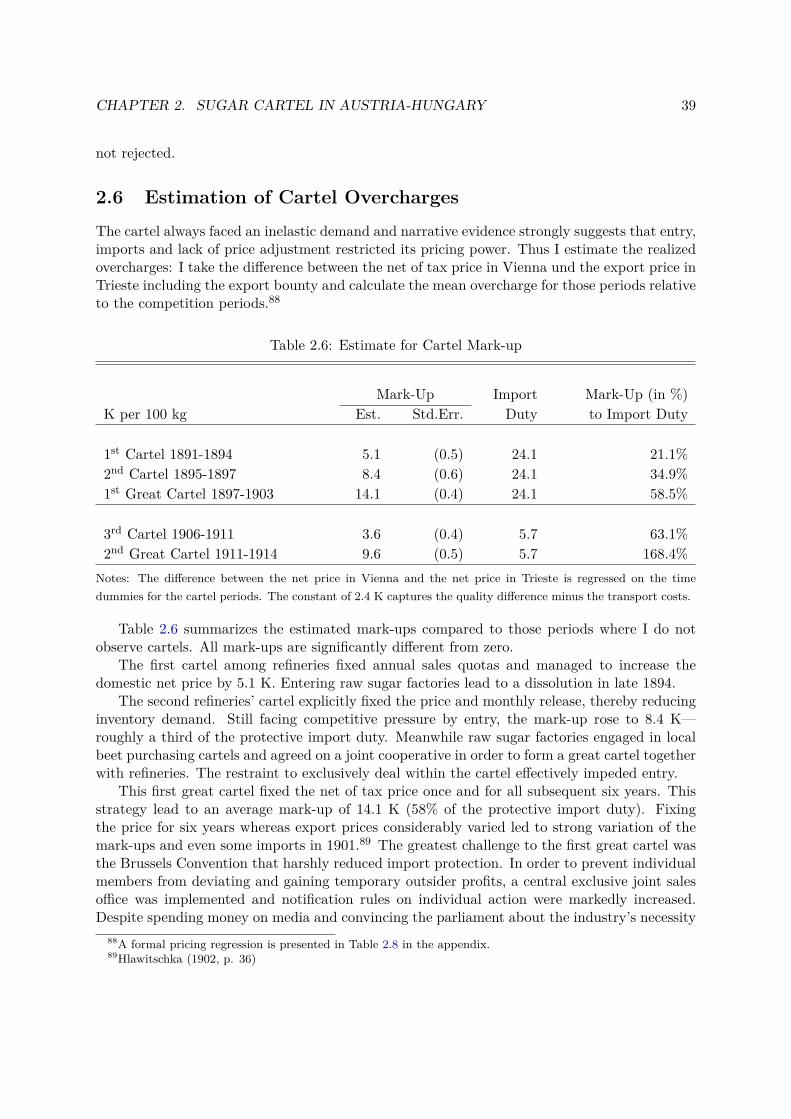
CHAPTER 2. SUGAR CARTEL IN AUSTRIA-HUNGARY 39
not rejected.
2.6 Estimation of Cartel OverchargesThe cartel always faced an inelastic demand and narrative evidence strongly suggests that entry,imports and lack of price adjustment restricted its pricing power. Thus I estimate the realizedovercharges: I take the difference between the net of tax price in Vienna und the export price inTrieste including the export bounty and calculate the mean overcharge for those periods relativeto the competition periods.88
Table 2.6: Estimate for Cartel Mark-up
Mark-Up Import Mark-Up (in %)K per 100 kg Est. Std.Err. Duty to Import Duty
1st Cartel 1891-1894 5.1 (0.5) 24.1 21.1%2nd Cartel 1895-1897 8.4 (0.6) 24.1 34.9%1st Great Cartel 1897-1903 14.1 (0.4) 24.1 58.5%
3rd Cartel 1906-1911 3.6 (0.4) 5.7 63.1%2nd Great Cartel 1911-1914 9.6 (0.5) 5.7 168.4%
Notes: The difference between the net price in Vienna and the net price in Trieste is regressed on the timedummies for the cartel periods. The constant of 2.4 K captures the quality difference minus the transport costs.
Table 2.6 summarizes the estimated mark-ups compared to those periods where I do notobserve cartels. All mark-ups are significantly different from zero.
The first cartel among refineries fixed annual sales quotas and managed to increase thedomestic net price by 5.1 K. Entering raw sugar factories lead to a dissolution in late 1894.
The second refineries’ cartel explicitly fixed the price and monthly release, thereby reducinginventory demand. Still facing competitive pressure by entry, the mark-up rose to 8.4 K—roughly a third of the protective import duty. Meanwhile raw sugar factories engaged in localbeet purchasing cartels and agreed on a joint cooperative in order to form a great cartel togetherwith refineries. The restraint to exclusively deal within the cartel effectively impeded entry.
This first great cartel fixed the net of tax price once and for all subsequent six years. Thisstrategy lead to an average mark-up of 14.1 K (58% of the protective import duty). Fixingthe price for six years whereas export prices considerably varied led to strong variation of themark-ups and even some imports in 1901.89 The greatest challenge to the first great cartel wasthe Brussels Convention that harshly reduced import protection. In order to prevent individualmembers from deviating and gaining temporary outsider profits, a central exclusive joint salesoffice was implemented and notification rules on individual action were markedly increased.Despite spending money on media and convincing the parliament about the industry’s necessity
88A formal pricing regression is presented in Table 2.8 in the appendix.89Hlawitschka (1902, p. 36)
CHAPTER 2. SUGAR CARTEL IN AUSTRIA-HUNGARY 40
to regulate the industry in a cartel style manner, the Brussels Convention set an end to the firstgreat cartel and to Eugen von Boehm Bawerk’s law on industry regulation.
It took the industry three years to form another cartel among refineries—supported by anempire-internal trade barrier between Austria and Hungary. In order to deal with competitivepressure from domestic crystal sugar and imports, the cartel started to offer retroactive ex-clusivity rebates for individual customers. Monitoring of sales and imports outside the cartelwas increased in 1909 when contract notes were made obligatory for resellers. This cartel hadthe lowest mark-up of on average 3.6 K—but in terms of the import protection, the mark-upincreased further to roughly two thirds.
The final stage of cartelization was reached in 1911 when a great cartel was reestablishedthat kept accounts on individual customers in order to grant retroactive exclusivity rebates.Supported by lobbying on protective freight rates, the cartel was able to increase the domesticprice level in Vienna to 170% of the protective import duty.
2.7 Summary and DiscussionThis paper presented a sequence of events on the sugar industry’s failures and successes tocartelize, improvements in the collusive strategy and (anticipating) reactions to sustain collusionwhen external circumstances changed.
The introduction of the excise tax solved the monitoring problem in 1888. The first refineries’cartel suffered from excessive storage and entry, until the monthly release was fixed and enteringraw sugar factories were integrated. A joint sales agency helped to sustain collusion for theremaining limited period of protective duties until the Brussels Convention took effect in 1903.After some years of competition, the cartel was reestablished in 1906. Retroactive exclusivityrebates impeded competing imports and sales of crystal sugar. The most sophisticated greatcartel started in 1911 and reintegrated raw sugar factories. The cartel overcharge relative tothe protecting import duty increased from 21.1% for the first cartel to 168.4% for the secondgreat cartel (although the absolute maximum was reached during the first great cartel when theprotective import duty still existed).
The study aims to reassess and refine existing economic theory and current antitrust practice.Based on my personal knowledge of the literature and antitrust practice, some issues stick out.
Excise tax enables collusion. The failure to form a cartel due to the lack of publicinformation on production data in 1873/74 is in line with Harrington and Skrzypacz (2011) whofind that sustainable collusion in a quota cartel requires truthful reporting of private informationon sales. The introduction of the excise tax served as a monitoring tool for the cartels lateron. The industry requests reveal a preference for strict control and almost immediate release ofinformation on aggregate sales.
To the best of my knowledge, current economic literature does not find that a specific excisetax increases market power by improving information exchange. The case of the sugar cartelshows that the tax incidence for a new specific excise tax and an inelastic demand might put morethan 100% of the burden on consumers. Already late 19th century draft antitrust legislation inAustria-Hungary aimed to monitor industries with excise taxes and was supported by economiccommon sense expressed by Menger (1897) who supported the draft law as beneficial for thegovernment and the consumer. Recent anticartel activity also addresses this issue. In Koreain 1991-2005, three sugar producers jointly determined their share of supply in the domestic
CHAPTER 2. SUGAR CARTEL IN AUSTRIA-HUNGARY 41
market. The cartel exchanged information on the payment of a special excise tax in order tomonitor compliance with the agreed-upon supply restrictions. When the special excise tax wasabolished, cheating occurred.90 Recent research (Kopczuk et al., 2013) finds for state dieseltaxes that moving the point of tax collection from the retail station closer to the prime supplierraises the pass-through of diesel taxes as well as tax revenues. As an explanation, less tax evasionis suggested. The sugar excise tax enabling a cartel suggests a complemetary explanation: Acollusive strategy among more concentrated prime suppliers or distributors may increase theirinterest in strict control of sales in order to enhance monitoring capabilities.
Organizational learning and inner workings. Within five legal subsequent cartels, thesugar industry learned to overcome all central challenges that cartels face—monitoring, internalcoordination and entry (Levenstein and Suslow, 2006). The learning was in line with currentmodels on inner workings of cartels. The first challenge was cheating (Harrington and Skrzypacz,2011)—the introduction of the excise tax in 1888 enabled perfect monitoring of sales. The firstcartel faced storage inducing competition for future demand (Anton and DasVarma (2005) andDudine et al. (2006))—the second cartel fixed monthly sales to suppress storage outside thecartel and the first great cartel committed to a fixed future price. The first and second cartelfaced entry of raw sugar factories—the first great cartel integrated raw sugar factories andpaid compensations to foreclose entry. This is in line with Asker and Bar-Isaac (2014) whoidentify exclusionary practice and rewarding kick-back transfers as essential conditions for somedamaging vertical practices. Centralizing sales and stronger notification duties were requiredto prevent deviations when the collusion game changed to finite repetitions due to the BrusselsConvention. The harsh reduction of the import protection lowered the overall cartel gain insuch a way that competition took place for some years—until a more sophisticated cartel wasformed. This third refineries’ cartel started to keep accounts on individual customers in orderto grant retroactive exclusivity rebates—another compensation to downstream customers toimpede entry via imports (Asker and Bar-Isaac, 2014). Faced again with entry, the secondgreat cartel re-integrated raw sugar factories.
The sheer size of the cartel—the refineries’ cartel included more than 30 refineries—confirmsthe idea put forward by Farrell (2000): Large cartels exist in an environment where explicitcollusion is legal, central parameters as rival’s costs and the demand elasticity are known andrenegotiations need not to be secret.
As in the US Sugar Institute (Genesove and Mullin, 2001), I observe efforts to increasetransparency by early notification and obligatory documentation as well as dispute resolutionmechanisms to legally verify deviating behavior. Furthermore, sales agents with high poweredincentives to deviate were controlled by the central joint sales agency when the cartel anticipatedincreased instability due to the foreseeable end in 1903. In line with Genesove and Mullin, Ifound neither evidence on reversion to competition as a punishment device, nor any indicationson problems with renegotiations of cartel rules after deviations occurred.
Empirical evaluation of market power. Empirically, demand turned out to be in-elastic and did not constrain pricing power of the cartel. Aggregation to periods covering aninventorying cycle turned out to be useful for demand estimation—even when the number ofobservations is cut to a twelfth.
90Ku and Lee (2012, p.3)
CHAPTER 2. SUGAR CARTEL IN AUSTRIA-HUNGARY 42
Narrative evidence and inelastic demand show that the threat of entry and imports and thelack of price adjustment did restrict pricing power of the cartel. The former corresponds toSalvo (2010) who finds entry censored market power of Brazilian cement producers. Identifyingcompetitive pressure from entry, imports and internal coordination within the cartel explainspricing power better than demand estimation.
Market power in terms of the limiting import constraint increased steadily. When theimport protection was reduced, the cartel developed more sophisticated methods to foreclosecompetitors. The more time and experience the sugar cartel had, the better was the collusivestrategy and its practical implementation.
Policy conclusions. Specific excise taxes deserve severe skepticism. For already existingtaxes of this kind, the ministry of finances might review their information release policy towardsthe industry to reduce support for immediate monitoring of individual behavior. From aninstitution-building point of view, the excise tax supported by the industry initially solved thetax administration problem for sugar and helped to establish sound and stable financing for agovernment that resembles more a developing country in today’s world. However, specificallywithin the first great cartel, the excise tax seemed more like a pandora’s box hurting consumersas well as the government when high prices not only damaged consumers but also reducedsugar consumption and thus sugar tax revenues—to the detriment of the government.91 Onlyan outside interference—the Brussels Convention—was able to put an end to massive cartelgains by the industry.
The success of various markers for cartel detection depends on the specific organizationalform of the cartel. Whereas the first great cartel did not pass on costs and the variance ofprices was set to zero, the threat of entry or imports limited the other cartels’ pricing powerand affected both cost pass-on as well as the variance of prices.
At last, the real world case of the sugar cartel shows that vertical exclusionary practicesmatter. The collusion with upstream raw sugar factories as well as the exclusionary retroactiverebates to downstream customers increased the pricing power of the cartel.
91The cartel increased the price during the first great cartel to 84 K per 100 kg. Assuming a competitive priceof 70 K per 100 kg and an elasticity of -0.4, the price increase was 20% and the decrease in tax revenues was 8%.
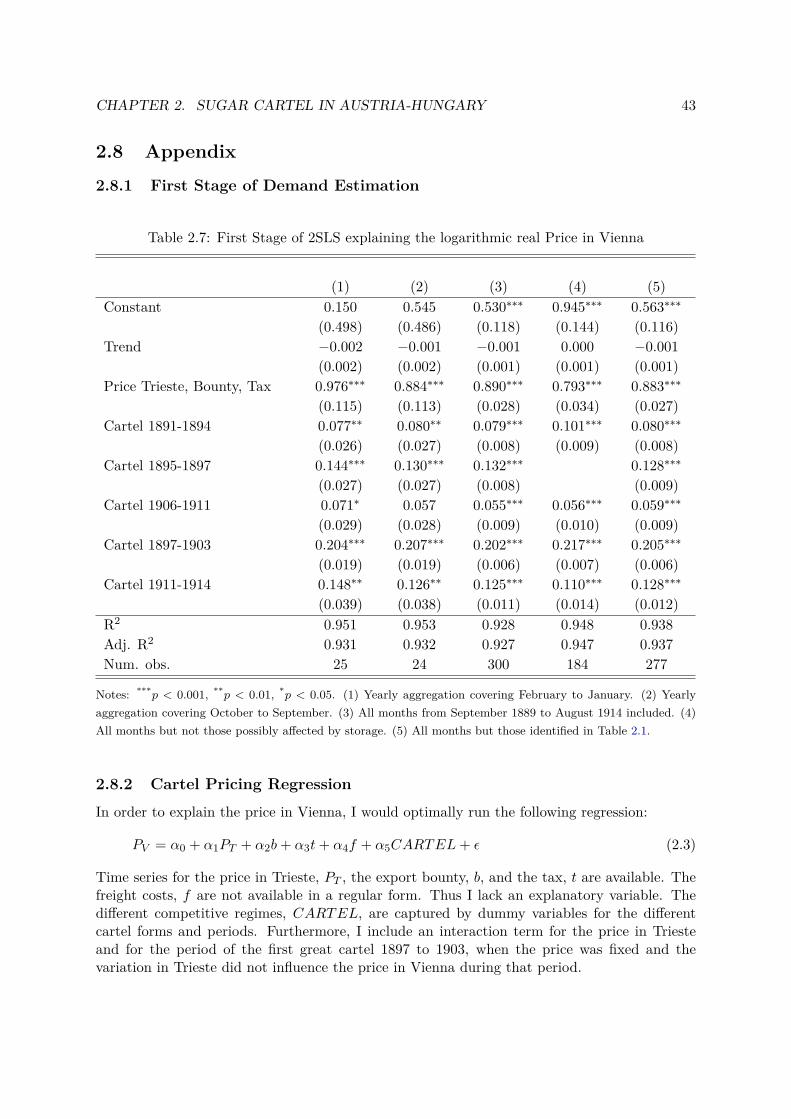
CHAPTER 2. SUGAR CARTEL IN AUSTRIA-HUNGARY 43
2.8 Appendix
2.8.1 First Stage of Demand Estimation
Table 2.7: First Stage of 2SLS explaining the logarithmic real Price in Vienna
(1) (2) (3) (4) (5)Constant 0.150 0.545 0.530∗∗∗ 0.945∗∗∗ 0.563∗∗∗
(0.498) (0.486) (0.118) (0.144) (0.116)Trend −0.002 −0.001 −0.001 0.000 −0.001
(0.002) (0.002) (0.001) (0.001) (0.001)Price Trieste, Bounty, Tax 0.976∗∗∗ 0.884∗∗∗ 0.890∗∗∗ 0.793∗∗∗ 0.883∗∗∗
(0.115) (0.113) (0.028) (0.034) (0.027)Cartel 1891-1894 0.077∗∗ 0.080∗∗ 0.079∗∗∗ 0.101∗∗∗ 0.080∗∗∗
(0.026) (0.027) (0.008) (0.009) (0.008)Cartel 1895-1897 0.144∗∗∗ 0.130∗∗∗ 0.132∗∗∗ 0.128∗∗∗
(0.027) (0.027) (0.008) (0.009)Cartel 1906-1911 0.071∗ 0.057 0.055∗∗∗ 0.056∗∗∗ 0.059∗∗∗
(0.029) (0.028) (0.009) (0.010) (0.009)Cartel 1897-1903 0.204∗∗∗ 0.207∗∗∗ 0.202∗∗∗ 0.217∗∗∗ 0.205∗∗∗
(0.019) (0.019) (0.006) (0.007) (0.006)Cartel 1911-1914 0.148∗∗ 0.126∗∗ 0.125∗∗∗ 0.110∗∗∗ 0.128∗∗∗
(0.039) (0.038) (0.011) (0.014) (0.012)R2 0.951 0.953 0.928 0.948 0.938Adj. R2 0.931 0.932 0.927 0.947 0.937Num. obs. 25 24 300 184 277
Notes: ***p < 0.001, **p < 0.01, *p < 0.05. (1) Yearly aggregation covering February to January. (2) Yearlyaggregation covering October to September. (3) All months from September 1889 to August 1914 included. (4)All months but not those possibly affected by storage. (5) All months but those identified in Table 2.1.
2.8.2 Cartel Pricing Regression
In order to explain the price in Vienna, I would optimally run the following regression:
PV = α0 + α1PT + α2b+ α3t+ α4f + α5CARTEL+ ε (2.3)
Time series for the price in Trieste, PT , the export bounty, b, and the tax, t are available. Thefreight costs, f are not available in a regular form. Thus I lack an explanatory variable. Thedifferent competitive regimes, CARTEL, are captured by dummy variables for the differentcartel forms and periods. Furthermore, I include an interaction term for the price in Triesteand for the period of the first great cartel 1897 to 1903, when the price was fixed and thevariation in Trieste did not influence the price in Vienna during that period.
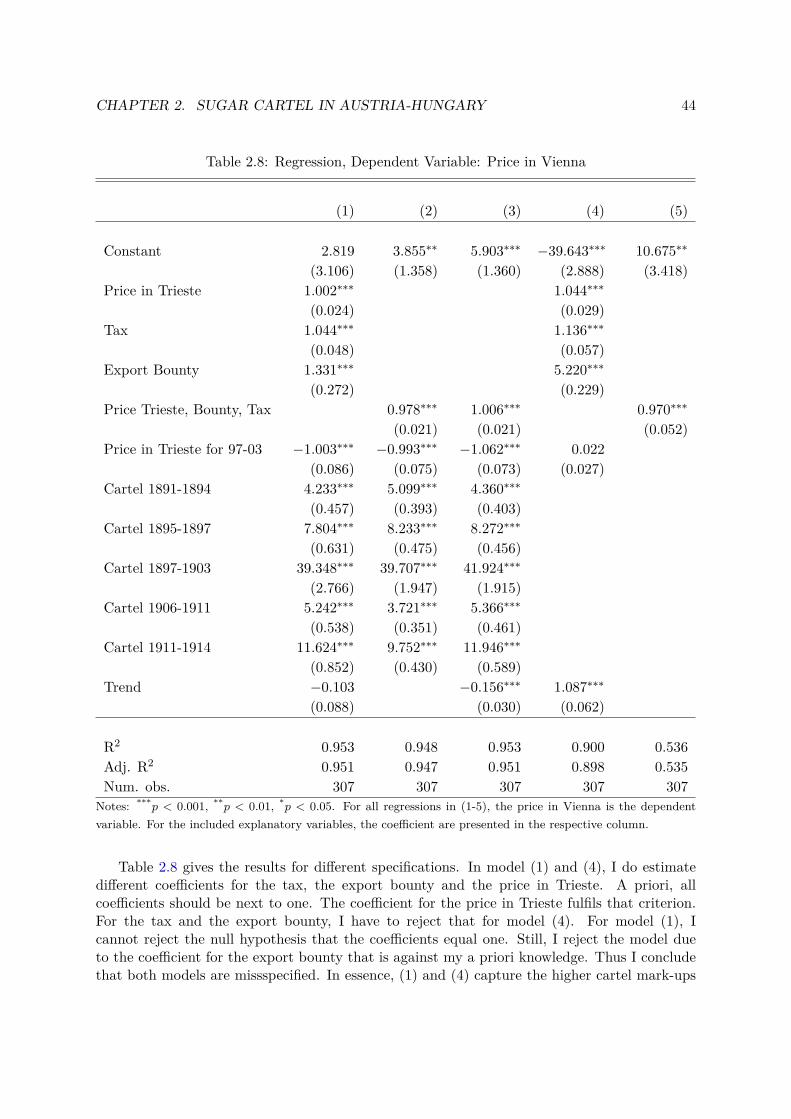
CHAPTER 2. SUGAR CARTEL IN AUSTRIA-HUNGARY 44
Table 2.8: Regression, Dependent Variable: Price in Vienna
(1) (2) (3) (4) (5)
Constant 2.819 3.855∗∗ 5.903∗∗∗ −39.643∗∗∗ 10.675∗∗
(3.106) (1.358) (1.360) (2.888) (3.418)Price in Trieste 1.002∗∗∗ 1.044∗∗∗
(0.024) (0.029)Tax 1.044∗∗∗ 1.136∗∗∗
(0.048) (0.057)Export Bounty 1.331∗∗∗ 5.220∗∗∗
(0.272) (0.229)Price Trieste, Bounty, Tax 0.978∗∗∗ 1.006∗∗∗ 0.970∗∗∗
(0.021) (0.021) (0.052)Price in Trieste for 97-03 −1.003∗∗∗ −0.993∗∗∗ −1.062∗∗∗ 0.022
(0.086) (0.075) (0.073) (0.027)Cartel 1891-1894 4.233∗∗∗ 5.099∗∗∗ 4.360∗∗∗
(0.457) (0.393) (0.403)Cartel 1895-1897 7.804∗∗∗ 8.233∗∗∗ 8.272∗∗∗
(0.631) (0.475) (0.456)Cartel 1897-1903 39.348∗∗∗ 39.707∗∗∗ 41.924∗∗∗
(2.766) (1.947) (1.915)Cartel 1906-1911 5.242∗∗∗ 3.721∗∗∗ 5.366∗∗∗
(0.538) (0.351) (0.461)Cartel 1911-1914 11.624∗∗∗ 9.752∗∗∗ 11.946∗∗∗
(0.852) (0.430) (0.589)Trend −0.103 −0.156∗∗∗ 1.087∗∗∗
(0.088) (0.030) (0.062)
R2 0.953 0.948 0.953 0.900 0.536Adj. R2 0.951 0.947 0.951 0.898 0.535Num. obs. 307 307 307 307 307
Notes: ***p < 0.001, **p < 0.01, *p < 0.05. For all regressions in (1-5), the price in Vienna is the dependentvariable. For the included explanatory variables, the coefficient are presented in the respective column.
Table 2.8 gives the results for different specifications. In model (1) and (4), I do estimatedifferent coefficients for the tax, the export bounty and the price in Trieste. A priori, allcoefficients should be next to one. The coefficient for the price in Trieste fulfils that criterion.For the tax and the export bounty, I have to reject that for model (4). For model (1), Icannot reject the null hypothesis that the coefficients equal one. Still, I reject the model dueto the coefficient for the export bounty that is against my a priori knowledge. Thus I concludethat both models are missspecified. In essence, (1) and (4) capture the higher cartel mark-ups
CHAPTER 2. SUGAR CARTEL IN AUSTRIA-HUNGARY 45
before the Brussels Convention due to the higher import duty. The export bounty was abolishedwhen the Brussels Convention came into force, thus it also captures the variation due to thelowered import duty. Due to arising collinearity, I cannot add another dummy for the BrusselsConvention. To deal with this problem, I add up the observed opportunity costs—the price inTrieste, the tax and the export bounty—and thus restrict them to one coefficient. In model (5),I regress the price simply on the observed opportunity cost. The coefficient is not significantlydifferent from one, thus this model works fine. However, I do not estimate the cartel mark-ups, thus only 53.6% of the variance is explained. Model (2) and (3) have both an R-Square ofaround 95%. The restriction to one coefficient for the opportunity cost does not—as expected—lead to a significant loss of information, since an F-Test comparing the models (1) and (3) isnot significant. All coefficients in (2) and (3) confirm the knowledge on price formation. Theopportunity cost is not different from one, the price in Trieste is subtracted with a coefficientnot different from one for 1897-1903, all cartels have significant mark-ups. The mark-up forthe first great cartel 1897-1903 is so large since the price is fixed and thus the price in Triesteis subtracted from the opportunity cost. The only difference is the significant trend of -0.156.This says that the price in Vienna declined by 3.75 K relative to Trieste over 25 years. I donot have any indications that support such a strong decline—thus I choose model (2) as myfavorite model. The coefficient of 0.978 is slightly smaller than one. Due to lower net weight inVienna and a tax credit, this seems realistic.92 The constant of 3.855 K can be interpreted as anaverage higher price in Vienna that results from higher quality in Vienna minus the additionaltransport cost to Trieste.
92k.k. Handelsministerium (1912a, p. 189)
Chapter 3
Registered Cartels in Austria -Coding Protocol
This chapter is joint work with Konrad Stahl, Philipp Schmidt-Dengler and Christine Zulehner(Fink et al., 2014).
3.1 IntroductionFrom 1951 on, Austrian law foresaw that cartels were legalized by notification to a cartel registry.The cartels were legal once the registration was approved. With Austria’s accession to theEuropean Community, European competition law had to be applied. Thus, from 1995 on,the approval of cartels was restricted to comply with E.U. competition law and the EuropeanCommission started to ensure the application.
The first entries into the cartel registry we found are from 1973.1 The last entry into theregistry was in 2002.
We developed a coding protocol to format the information available mainly from the con-tracts archived in the cartel registry. In Section 2 we describe the institutional background, thedata sources and how we proceeded. In the ensuing Sections 3-5 we specify and explain thecategories we have chosen. In Section 3, we categorize general descriptives; in Section 4 theeconomic justifications given by the cartelists when applying for registration, and proceduralaspects related to the latter; and in Section 5 the main economic characteristics.
3.2 Data Generating Process and Coding ProcedureCartels had to be approved upon an application, including a justification of the initiative tocreate a cartel, and the proposed cartel contract. Also, prices were monitored, and in mostsectors, price changes had to be approved by public authorities. Here we briefly describe theprocedures involved, and the data available on the cartels. Then we explain how we developedthe categories for coding the data.
1Older entries no longer exist.
46
CHAPTER 3. REGISTERED CARTELS - CODING PROTOCOL 47
3.2.1 Institutional Background
The Cartel Court (CC) had to approve any application to form, and to continue a cartel. Asmuch as we know of, it always did so when the recommendation by the ’Parity Committee onCartel Matters’, consisting of representatives of companies and labor ("Paritätischer Ausschussfür Kartellangelegenheiten"), was positive.
In order to understand economic policy in Austria in the relevant time period, it is centralto know that interest group influence in Austria was institutionalized via the chambers ofcommerce, labor and agriculture that, respectively, represent companies, workers and farmers.Membership was compulsory. These three chambers and the Austrian Trade Union Federationform the so-called social partners. The chambers represent membership interests at all levels ofgovernment. For the relevant time period, social partners had a decisive influence on economicpolicy in general. Consensus-decision making was the rule. Thus even an informal commonposition of the social partners was taken seriously by industry.
In addition to the right of the chambers of labor and commerce to appoint the members of theParity Committee, all three chambers as well as the Federal Financial Agency ("Finanzproku-ratur") were parties of the proceedings.2 This included the right to ask for an in-depth reviewof the application and for additional information on each cartel.
Distinct from the Parity Committee, a ’Parity Commission’ ("Paritätische Kommission")consisting of all four social partners was in charge of monitoring prices, and with this at least inpart also monitored the cartelists’ price formation. Typically industry representatives submitteda proposed price increase and provided cost data to justify that price increase. The ParityCommission then approved or rejected the price increase.3 A common position of all membersof the Parity Commission was taken seriously by the companies, and prices were not increasedabove the approved levels.4 In effect, the proceedings leading to the application for price hikesallowed for collusive pricing arrangements, as long as these arrangements were stable and thusdid not require more elaborate clauses such as punishment in case of downward deviation fromthe agreed upon price.
3.2.2 Data Sources
All documents archived in the Cartel Court were made available to us. These documents includethe cartel contracts as proposed by the participants, as well as additional documentation.5 Thescope of the archived additional documents varies and includes applications to form, to continue,and to terminate a cartel as well as judicial approval decrees. Also available are the annualreports of the Parity Committee that summarize its activity and its most important decisions.
3.2.3 Procedure
We scanned the material available in some 125 folders archived in the Cartel Court’s registry,including additional documentation on entries, mergers and exits and on economic data on the
2The Federal Financial Agency represents the federal government in a court of law.3Effectively the Subcommittee for Prices ("Preisunterausschuss") was in charge of monitoring prices.4Some cartels were explicitly formed to maintain prices at the approved level.5According to officials, the archive is not complete. Some agreements and additional documents were taken
out and not returned.
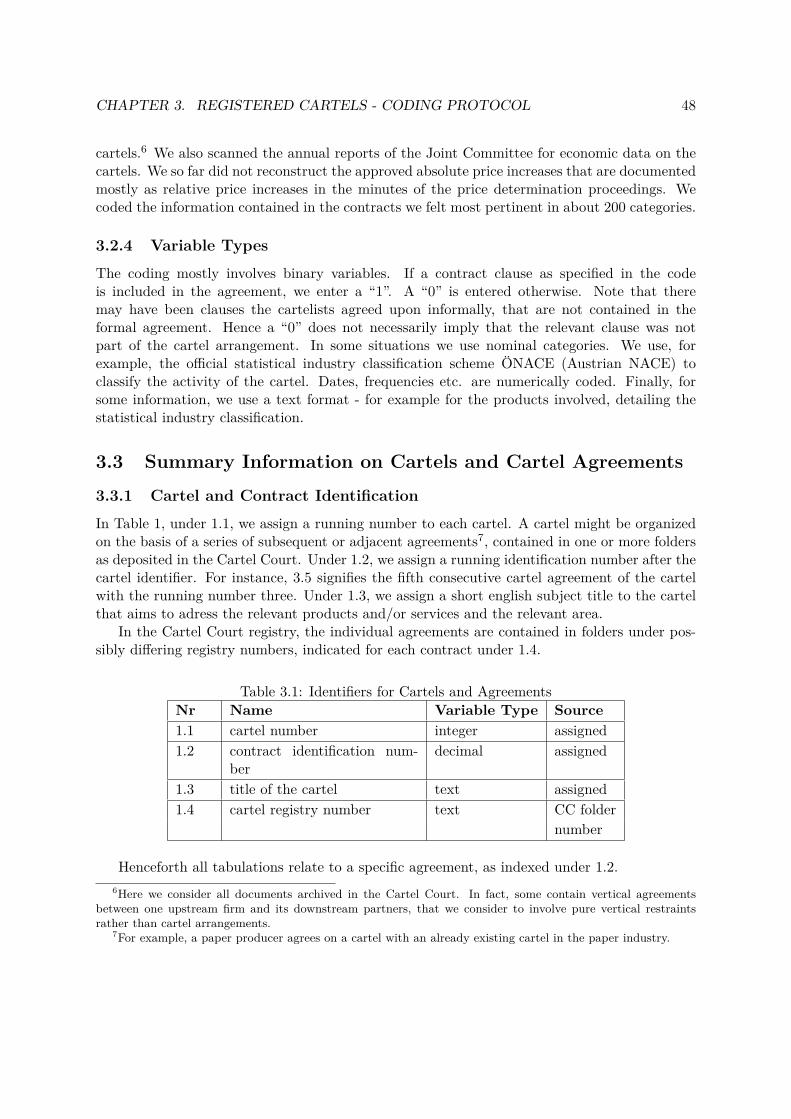
CHAPTER 3. REGISTERED CARTELS - CODING PROTOCOL 48
cartels.6 We also scanned the annual reports of the Joint Committee for economic data on thecartels. We so far did not reconstruct the approved absolute price increases that are documentedmostly as relative price increases in the minutes of the price determination proceedings. Wecoded the information contained in the contracts we felt most pertinent in about 200 categories.
3.2.4 Variable Types
The coding mostly involves binary variables. If a contract clause as specified in the codeis included in the agreement, we enter a “1”. A “0” is entered otherwise. Note that theremay have been clauses the cartelists agreed upon informally, that are not contained in theformal agreement. Hence a “0” does not necessarily imply that the relevant clause was notpart of the cartel arrangement. In some situations we use nominal categories. We use, forexample, the official statistical industry classification scheme ÖNACE (Austrian NACE) toclassify the activity of the cartel. Dates, frequencies etc. are numerically coded. Finally, forsome information, we use a text format - for example for the products involved, detailing thestatistical industry classification.
3.3 Summary Information on Cartels and Cartel Agreements
3.3.1 Cartel and Contract Identification
In Table 1, under 1.1, we assign a running number to each cartel. A cartel might be organizedon the basis of a series of subsequent or adjacent agreements7, contained in one or more foldersas deposited in the Cartel Court. Under 1.2, we assign a running identification number after thecartel identifier. For instance, 3.5 signifies the fifth consecutive cartel agreement of the cartelwith the running number three. Under 1.3, we assign a short english subject title to the cartelthat aims to adress the relevant products and/or services and the relevant area.
In the Cartel Court registry, the individual agreements are contained in folders under pos-sibly differing registry numbers, indicated for each contract under 1.4.
Table 3.1: Identifiers for Cartels and AgreementsNr Name Variable Type Source1.1 cartel number integer assigned1.2 contract identification num-
berdecimal assigned
1.3 title of the cartel text assigned1.4 cartel registry number text CC folder
number
Henceforth all tabulations relate to a specific agreement, as indexed under 1.2.6Here we consider all documents archived in the Cartel Court. In fact, some contain vertical agreements
between one upstream firm and its downstream partners, that we consider to involve pure vertical restraintsrather than cartel arrangements.
7For example, a paper producer agrees on a cartel with an already existing cartel in the paper industry.
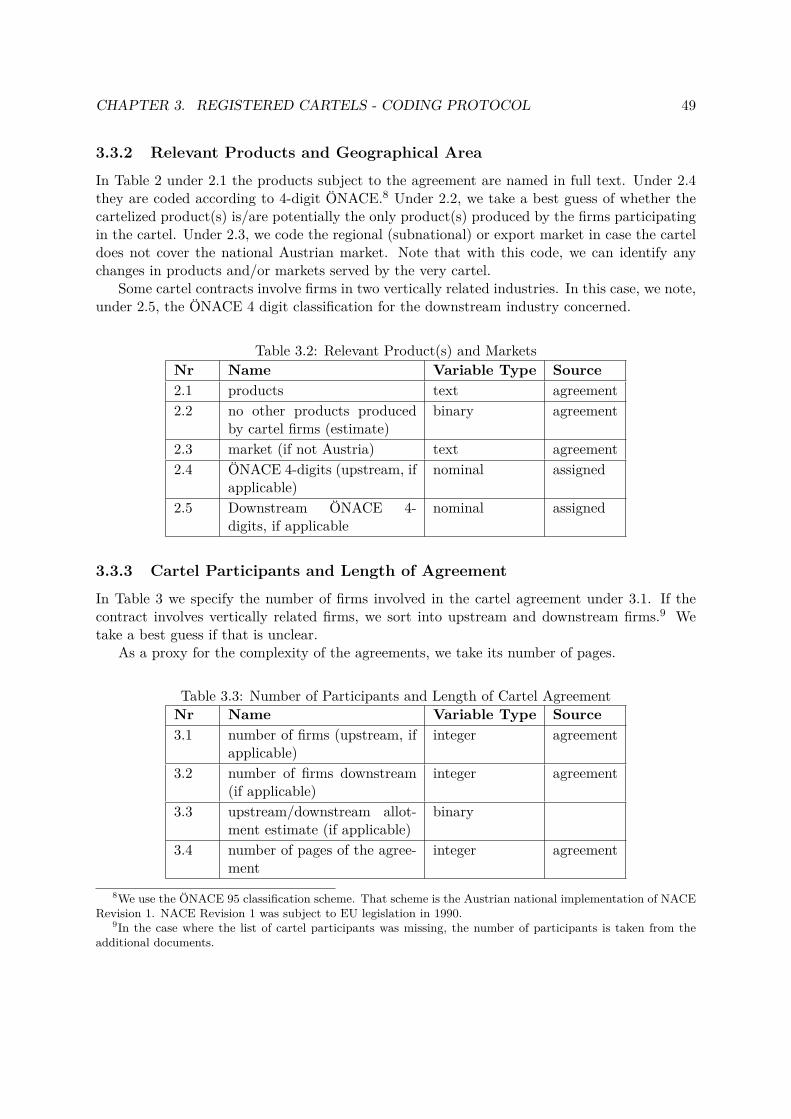
CHAPTER 3. REGISTERED CARTELS - CODING PROTOCOL 49
3.3.2 Relevant Products and Geographical Area
In Table 2 under 2.1 the products subject to the agreement are named in full text. Under 2.4they are coded according to 4-digit ÖNACE.8 Under 2.2, we take a best guess of whether thecartelized product(s) is/are potentially the only product(s) produced by the firms participatingin the cartel. Under 2.3, we code the regional (subnational) or export market in case the carteldoes not cover the national Austrian market. Note that with this code, we can identify anychanges in products and/or markets served by the very cartel.
Some cartel contracts involve firms in two vertically related industries. In this case, we note,under 2.5, the ÖNACE 4 digit classification for the downstream industry concerned.
Table 3.2: Relevant Product(s) and MarketsNr Name Variable Type Source2.1 products text agreement2.2 no other products produced
by cartel firms (estimate)binary agreement
2.3 market (if not Austria) text agreement2.4 ÖNACE 4-digits (upstream, if
applicable)nominal assigned
2.5 Downstream ÖNACE 4-digits, if applicable
nominal assigned
3.3.3 Cartel Participants and Length of Agreement
In Table 3 we specify the number of firms involved in the cartel agreement under 3.1. If thecontract involves vertically related firms, we sort into upstream and downstream firms.9 Wetake a best guess if that is unclear.
As a proxy for the complexity of the agreements, we take its number of pages.
Table 3.3: Number of Participants and Length of Cartel AgreementNr Name Variable Type Source3.1 number of firms (upstream, if
applicable)integer agreement
3.2 number of firms downstream(if applicable)
integer agreement
3.3 upstream/downstream allot-ment estimate (if applicable)
binary
3.4 number of pages of the agree-ment
integer agreement
8We use the ÖNACE 95 classification scheme. That scheme is the Austrian national implementation of NACERevision 1. NACE Revision 1 was subject to EU legislation in 1990.
9In the case where the list of cartel participants was missing, the number of participants is taken from theadditional documents.
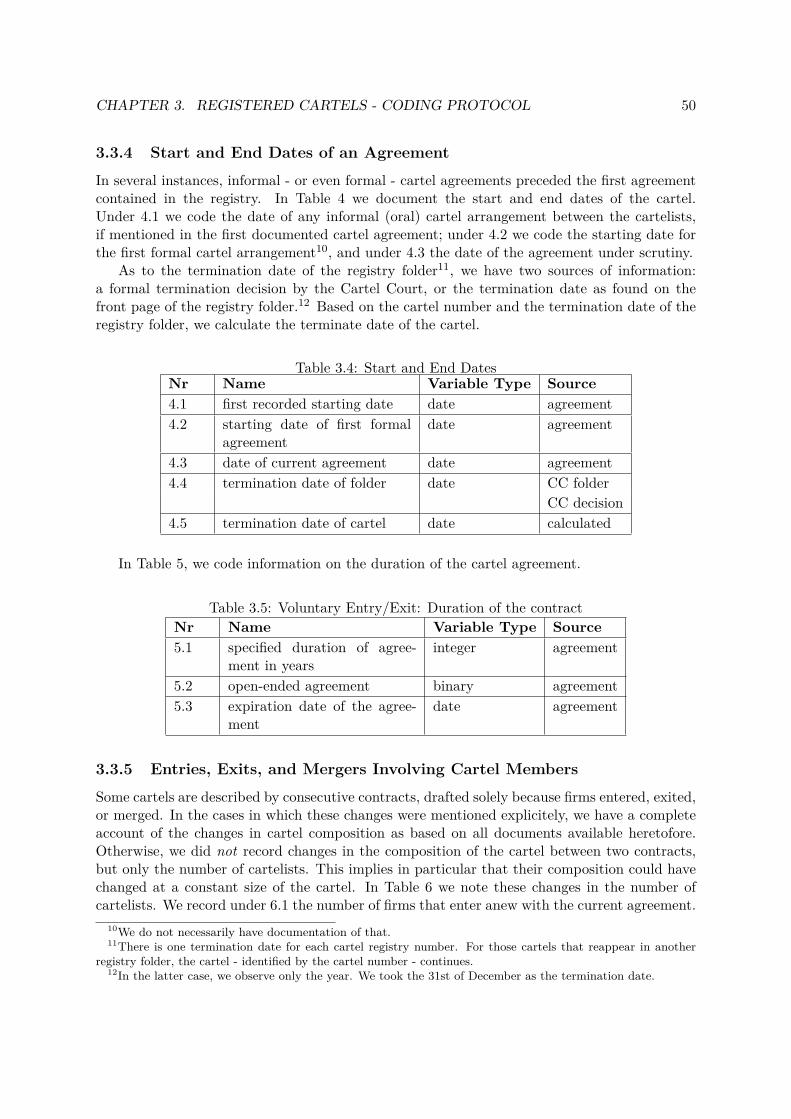
CHAPTER 3. REGISTERED CARTELS - CODING PROTOCOL 50
3.3.4 Start and End Dates of an Agreement
In several instances, informal - or even formal - cartel agreements preceded the first agreementcontained in the registry. In Table 4 we document the start and end dates of the cartel.Under 4.1 we code the date of any informal (oral) cartel arrangement between the cartelists,if mentioned in the first documented cartel agreement; under 4.2 we code the starting date forthe first formal cartel arrangement10, and under 4.3 the date of the agreement under scrutiny.
As to the termination date of the registry folder11, we have two sources of information:a formal termination decision by the Cartel Court, or the termination date as found on thefront page of the registry folder.12 Based on the cartel number and the termination date of theregistry folder, we calculate the terminate date of the cartel.
Table 3.4: Start and End DatesNr Name Variable Type Source4.1 first recorded starting date date agreement4.2 starting date of first formal
agreementdate agreement
4.3 date of current agreement date agreement4.4 termination date of folder date CC folder
CC decision4.5 termination date of cartel date calculated
In Table 5, we code information on the duration of the cartel agreement.
Table 3.5: Voluntary Entry/Exit: Duration of the contractNr Name Variable Type Source5.1 specified duration of agree-
ment in yearsinteger agreement
5.2 open-ended agreement binary agreement5.3 expiration date of the agree-
mentdate agreement
3.3.5 Entries, Exits, and Mergers Involving Cartel Members
Some cartels are described by consecutive contracts, drafted solely because firms entered, exited,or merged. In the cases in which these changes were mentioned explicitely, we have a completeaccount of the changes in cartel composition as based on all documents available heretofore.Otherwise, we did not record changes in the composition of the cartel between two contracts,but only the number of cartelists. This implies in particular that their composition could havechanged at a constant size of the cartel. In Table 6 we note these changes in the number ofcartelists. We record under 6.1 the number of firms that enter anew with the current agreement.
10We do not necessarily have documentation of that.11There is one termination date for each cartel registry number. For those cartels that reappear in another
registry folder, the cartel - identified by the cartel number - continues.12In the latter case, we observe only the year. We took the 31st of December as the termination date.
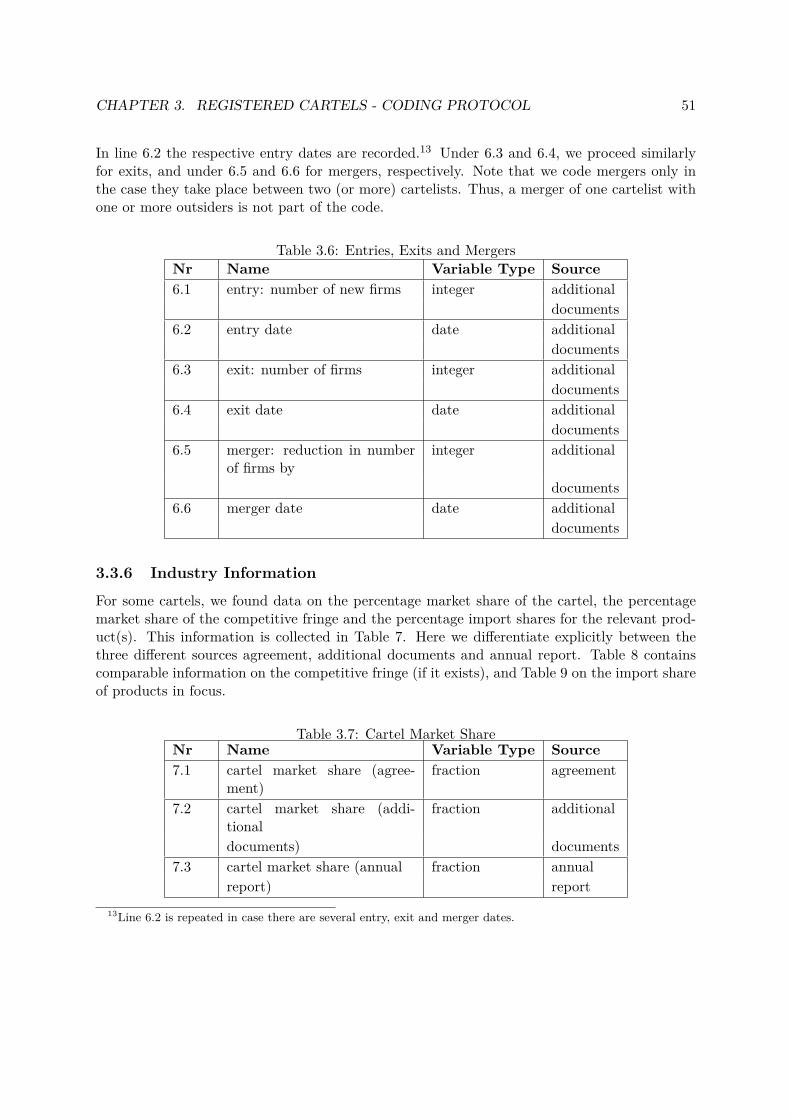
CHAPTER 3. REGISTERED CARTELS - CODING PROTOCOL 51
In line 6.2 the respective entry dates are recorded.13 Under 6.3 and 6.4, we proceed similarlyfor exits, and under 6.5 and 6.6 for mergers, respectively. Note that we code mergers only inthe case they take place between two (or more) cartelists. Thus, a merger of one cartelist withone or more outsiders is not part of the code.
Table 3.6: Entries, Exits and MergersNr Name Variable Type Source6.1 entry: number of new firms integer additional
documents6.2 entry date date additional
documents6.3 exit: number of firms integer additional
documents6.4 exit date date additional
documents6.5 merger: reduction in number
of firms byinteger additional
documents6.6 merger date date additional
documents
3.3.6 Industry Information
For some cartels, we found data on the percentage market share of the cartel, the percentagemarket share of the competitive fringe and the percentage import shares for the relevant prod-uct(s). This information is collected in Table 7. Here we differentiate explicitly between thethree different sources agreement, additional documents and annual report. Table 8 containscomparable information on the competitive fringe (if it exists), and Table 9 on the import shareof products in focus.
Table 3.7: Cartel Market ShareNr Name Variable Type Source7.1 cartel market share (agree-
ment)fraction agreement
7.2 cartel market share (addi-tional
fraction additional
documents) documents7.3 cartel market share (annual fraction annual
report) report13Line 6.2 is repeated in case there are several entry, exit and merger dates.
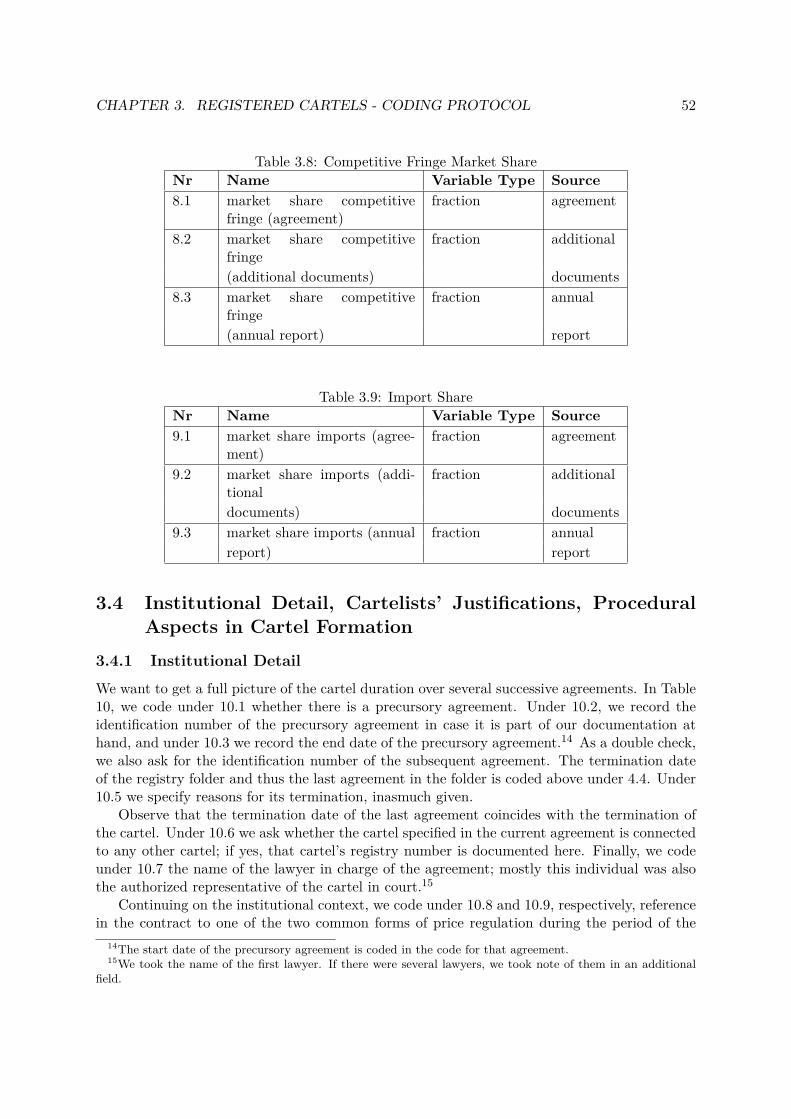
CHAPTER 3. REGISTERED CARTELS - CODING PROTOCOL 52
Table 3.8: Competitive Fringe Market ShareNr Name Variable Type Source8.1 market share competitive
fringe (agreement)fraction agreement
8.2 market share competitivefringe
fraction additional
(additional documents) documents8.3 market share competitive
fringefraction annual
(annual report) report
Table 3.9: Import ShareNr Name Variable Type Source9.1 market share imports (agree-
ment)fraction agreement
9.2 market share imports (addi-tional
fraction additional
documents) documents9.3 market share imports (annual fraction annual
report) report
3.4 Institutional Detail, Cartelists’ Justifications, ProceduralAspects in Cartel Formation
3.4.1 Institutional Detail
We want to get a full picture of the cartel duration over several successive agreements. In Table10, we code under 10.1 whether there is a precursory agreement. Under 10.2, we record theidentification number of the precursory agreement in case it is part of our documentation athand, and under 10.3 we record the end date of the precursory agreement.14 As a double check,we also ask for the identification number of the subsequent agreement. The termination dateof the registry folder and thus the last agreement in the folder is coded above under 4.4. Under10.5 we specify reasons for its termination, inasmuch given.
Observe that the termination date of the last agreement coincides with the termination ofthe cartel. Under 10.6 we ask whether the cartel specified in the current agreement is connectedto any other cartel; if yes, that cartel’s registry number is documented here. Finally, we codeunder 10.7 the name of the lawyer in charge of the agreement; mostly this individual was alsothe authorized representative of the cartel in court.15
Continuing on the institutional context, we code under 10.8 and 10.9, respectively, referencein the contract to one of the two common forms of price regulation during the period of the
14The start date of the precursory agreement is coded in the code for that agreement.15We took the name of the first lawyer. If there were several lawyers, we took note of them in an additional
field.
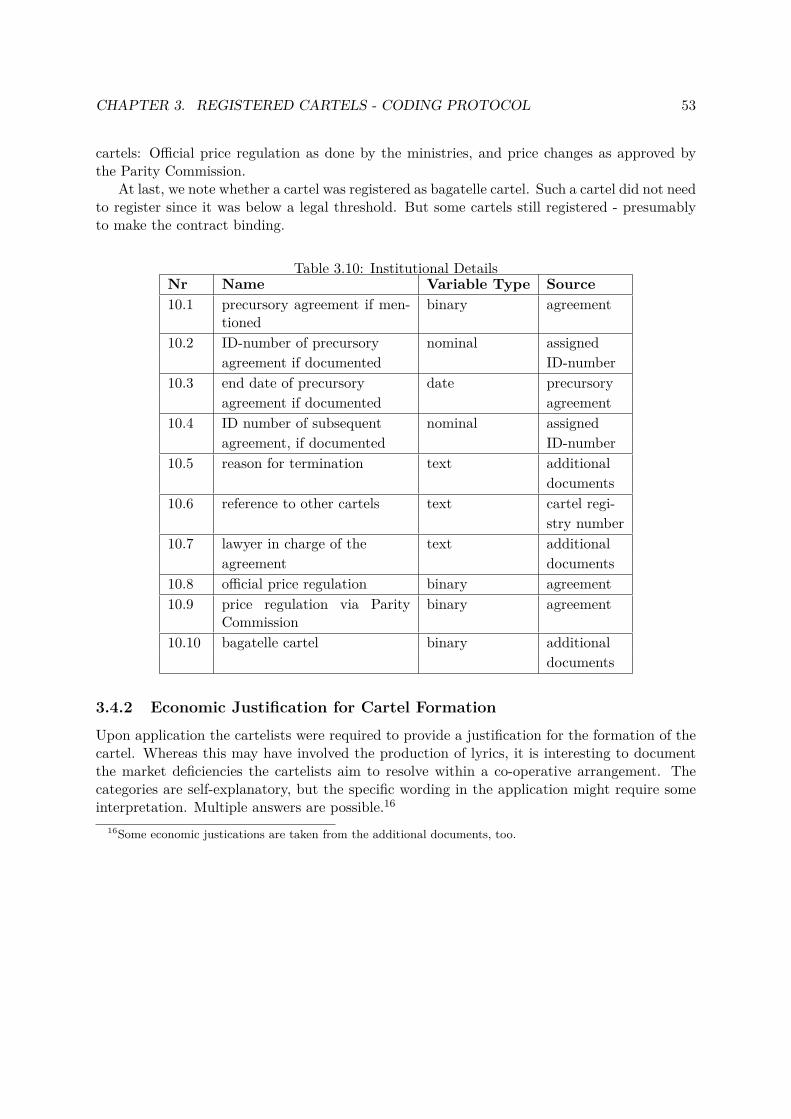
CHAPTER 3. REGISTERED CARTELS - CODING PROTOCOL 53
cartels: Official price regulation as done by the ministries, and price changes as approved bythe Parity Commission.
At last, we note whether a cartel was registered as bagatelle cartel. Such a cartel did not needto register since it was below a legal threshold. But some cartels still registered - presumablyto make the contract binding.
Table 3.10: Institutional DetailsNr Name Variable Type Source10.1 precursory agreement if men-
tionedbinary agreement
10.2 ID-number of precursory nominal assignedagreement if documented ID-number
10.3 end date of precursory date precursoryagreement if documented agreement
10.4 ID number of subsequent nominal assignedagreement, if documented ID-number
10.5 reason for termination text additionaldocuments
10.6 reference to other cartels text cartel regi-stry number
10.7 lawyer in charge of the text additionalagreement documents
10.8 official price regulation binary agreement10.9 price regulation via Parity
Commissionbinary agreement
10.10 bagatelle cartel binary additionaldocuments
3.4.2 Economic Justification for Cartel Formation
Upon application the cartelists were required to provide a justification for the formation of thecartel. Whereas this may have involved the production of lyrics, it is interesting to documentthe market deficiencies the cartelists aim to resolve within a co-operative arrangement. Thecategories are self-explanatory, but the specific wording in the application might require someinterpretation. Multiple answers are possible.16
16Some economic justications are taken from the additional documents, too.
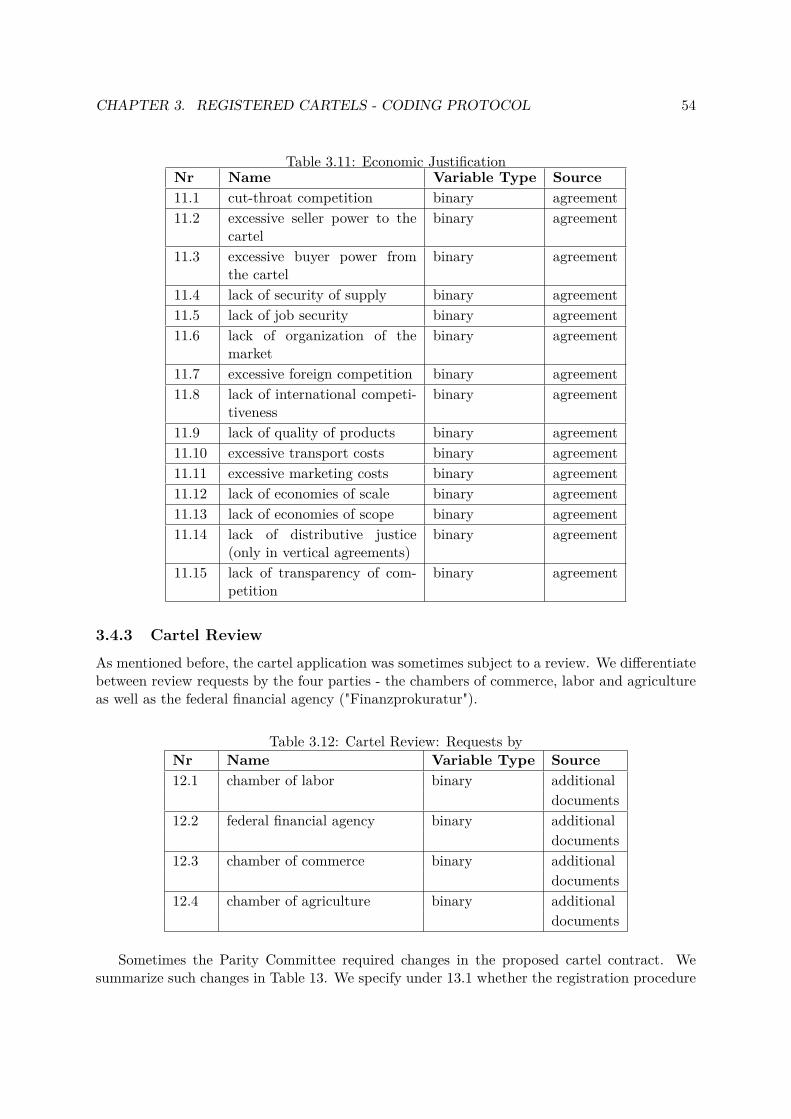
CHAPTER 3. REGISTERED CARTELS - CODING PROTOCOL 54
Table 3.11: Economic JustificationNr Name Variable Type Source11.1 cut-throat competition binary agreement11.2 excessive seller power to the
cartelbinary agreement
11.3 excessive buyer power fromthe cartel
binary agreement
11.4 lack of security of supply binary agreement11.5 lack of job security binary agreement11.6 lack of organization of the
marketbinary agreement
11.7 excessive foreign competition binary agreement11.8 lack of international competi-
tivenessbinary agreement
11.9 lack of quality of products binary agreement11.10 excessive transport costs binary agreement11.11 excessive marketing costs binary agreement11.12 lack of economies of scale binary agreement11.13 lack of economies of scope binary agreement11.14 lack of distributive justice
(only in vertical agreements)binary agreement
11.15 lack of transparency of com-petition
binary agreement
3.4.3 Cartel Review
As mentioned before, the cartel application was sometimes subject to a review. We differentiatebetween review requests by the four parties - the chambers of commerce, labor and agricultureas well as the federal financial agency ("Finanzprokuratur").
Table 3.12: Cartel Review: Requests byNr Name Variable Type Source12.1 chamber of labor binary additional
documents12.2 federal financial agency binary additional
documents12.3 chamber of commerce binary additional
documents12.4 chamber of agriculture binary additional
documents
Sometimes the Parity Committee required changes in the proposed cartel contract. Wesummarize such changes in Table 13. We specify under 13.1 whether the registration procedure
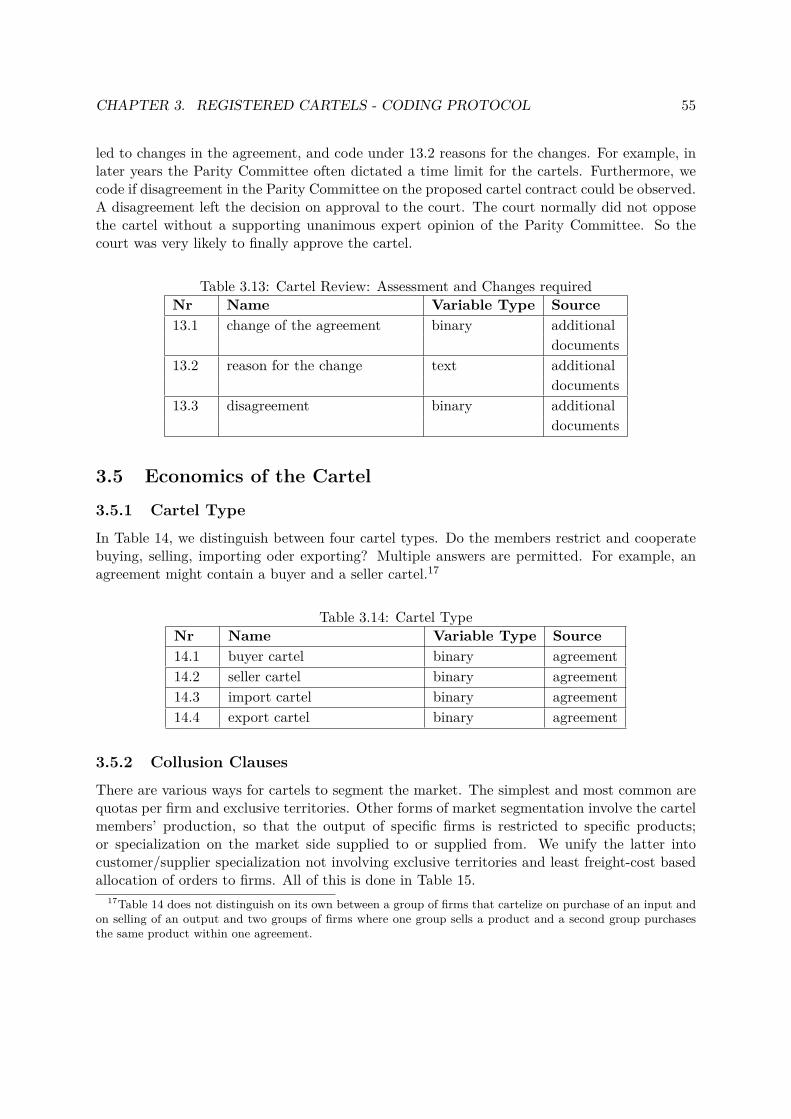
CHAPTER 3. REGISTERED CARTELS - CODING PROTOCOL 55
led to changes in the agreement, and code under 13.2 reasons for the changes. For example, inlater years the Parity Committee often dictated a time limit for the cartels. Furthermore, wecode if disagreement in the Parity Committee on the proposed cartel contract could be observed.A disagreement left the decision on approval to the court. The court normally did not opposethe cartel without a supporting unanimous expert opinion of the Parity Committee. So thecourt was very likely to finally approve the cartel.
Table 3.13: Cartel Review: Assessment and Changes requiredNr Name Variable Type Source13.1 change of the agreement binary additional
documents13.2 reason for the change text additional
documents13.3 disagreement binary additional
documents
3.5 Economics of the Cartel
3.5.1 Cartel Type
In Table 14, we distinguish between four cartel types. Do the members restrict and cooperatebuying, selling, importing oder exporting? Multiple answers are permitted. For example, anagreement might contain a buyer and a seller cartel.17
Table 3.14: Cartel TypeNr Name Variable Type Source14.1 buyer cartel binary agreement14.2 seller cartel binary agreement14.3 import cartel binary agreement14.4 export cartel binary agreement
3.5.2 Collusion Clauses
There are various ways for cartels to segment the market. The simplest and most common arequotas per firm and exclusive territories. Other forms of market segmentation involve the cartelmembers’ production, so that the output of specific firms is restricted to specific products;or specialization on the market side supplied to or supplied from. We unify the latter intocustomer/supplier specialization not involving exclusive territories and least freight-cost basedallocation of orders to firms. All of this is done in Table 15.
17Table 14 does not distinguish on its own between a group of firms that cartelize on purchase of an input andon selling of an output and two groups of firms where one group sells a product and a second group purchasesthe same product within one agreement.
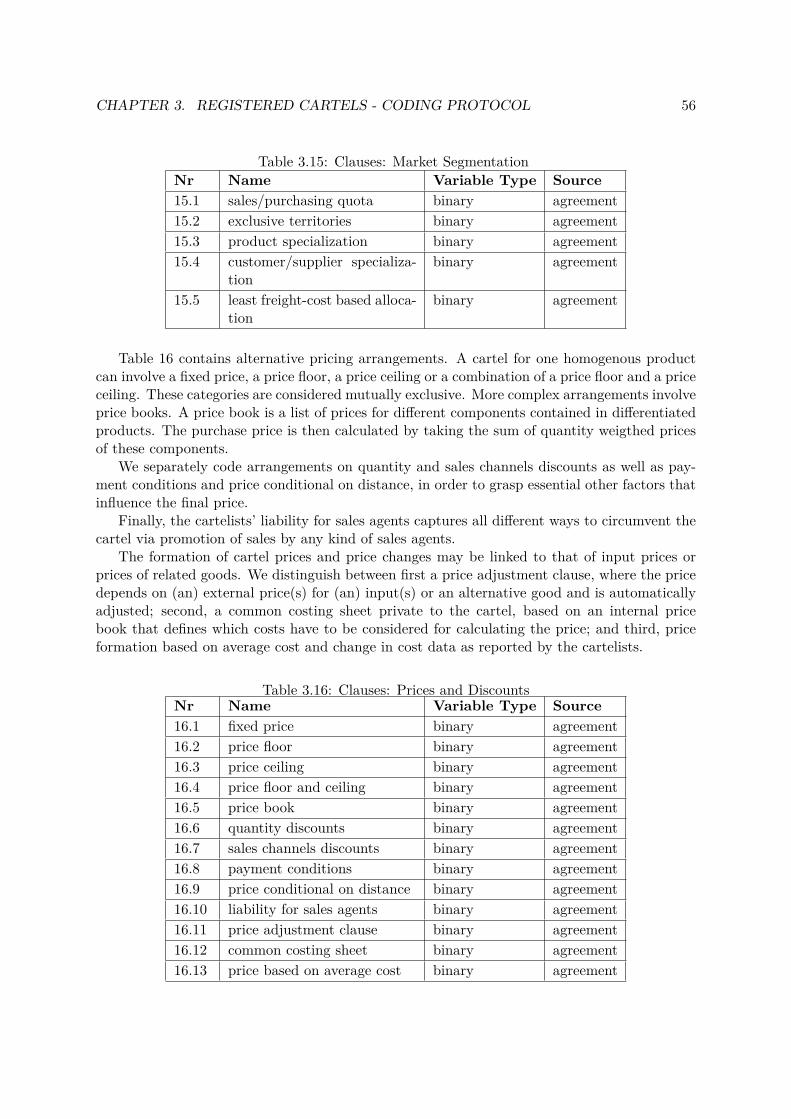
CHAPTER 3. REGISTERED CARTELS - CODING PROTOCOL 56
Table 3.15: Clauses: Market SegmentationNr Name Variable Type Source15.1 sales/purchasing quota binary agreement15.2 exclusive territories binary agreement15.3 product specialization binary agreement15.4 customer/supplier specializa-
tionbinary agreement
15.5 least freight-cost based alloca-tion
binary agreement
Table 16 contains alternative pricing arrangements. A cartel for one homogenous productcan involve a fixed price, a price floor, a price ceiling or a combination of a price floor and a priceceiling. These categories are considered mutually exclusive. More complex arrangements involveprice books. A price book is a list of prices for different components contained in differentiatedproducts. The purchase price is then calculated by taking the sum of quantity weigthed pricesof these components.
We separately code arrangements on quantity and sales channels discounts as well as pay-ment conditions and price conditional on distance, in order to grasp essential other factors thatinfluence the final price.
Finally, the cartelists’ liability for sales agents captures all different ways to circumvent thecartel via promotion of sales by any kind of sales agents.
The formation of cartel prices and price changes may be linked to that of input prices orprices of related goods. We distinguish between first a price adjustment clause, where the pricedepends on (an) external price(s) for (an) input(s) or an alternative good and is automaticallyadjusted; second, a common costing sheet private to the cartel, based on an internal pricebook that defines which costs have to be considered for calculating the price; and third, priceformation based on average cost and change in cost data as reported by the cartelists.
Table 3.16: Clauses: Prices and DiscountsNr Name Variable Type Source16.1 fixed price binary agreement16.2 price floor binary agreement16.3 price ceiling binary agreement16.4 price floor and ceiling binary agreement16.5 price book binary agreement16.6 quantity discounts binary agreement16.7 sales channels discounts binary agreement16.8 payment conditions binary agreement16.9 price conditional on distance binary agreement16.10 liability for sales agents binary agreement16.11 price adjustment clause binary agreement16.12 common costing sheet binary agreement16.13 price based on average cost binary agreement
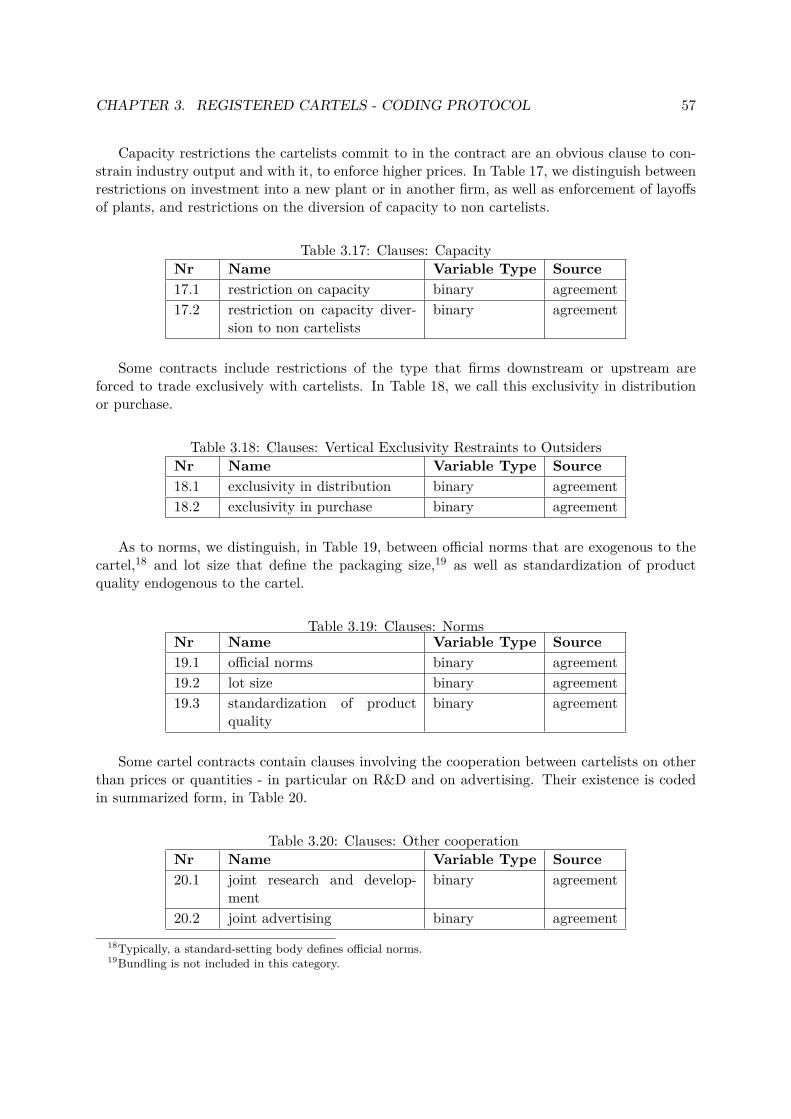
CHAPTER 3. REGISTERED CARTELS - CODING PROTOCOL 57
Capacity restrictions the cartelists commit to in the contract are an obvious clause to con-strain industry output and with it, to enforce higher prices. In Table 17, we distinguish betweenrestrictions on investment into a new plant or in another firm, as well as enforcement of layoffsof plants, and restrictions on the diversion of capacity to non cartelists.
Table 3.17: Clauses: CapacityNr Name Variable Type Source17.1 restriction on capacity binary agreement17.2 restriction on capacity diver-
sion to non cartelistsbinary agreement
Some contracts include restrictions of the type that firms downstream or upstream areforced to trade exclusively with cartelists. In Table 18, we call this exclusivity in distributionor purchase.
Table 3.18: Clauses: Vertical Exclusivity Restraints to OutsidersNr Name Variable Type Source18.1 exclusivity in distribution binary agreement18.2 exclusivity in purchase binary agreement
As to norms, we distinguish, in Table 19, between official norms that are exogenous to thecartel,18 and lot size that define the packaging size,19 as well as standardization of productquality endogenous to the cartel.
Table 3.19: Clauses: NormsNr Name Variable Type Source19.1 official norms binary agreement19.2 lot size binary agreement19.3 standardization of product
qualitybinary agreement
Some cartel contracts contain clauses involving the cooperation between cartelists on otherthan prices or quantities - in particular on R&D and on advertising. Their existence is codedin summarized form, in Table 20.
Table 3.20: Clauses: Other cooperationNr Name Variable Type Source20.1 joint research and develop-
mentbinary agreement
20.2 joint advertising binary agreement18Typically, a standard-setting body defines official norms.19Bundling is not included in this category.
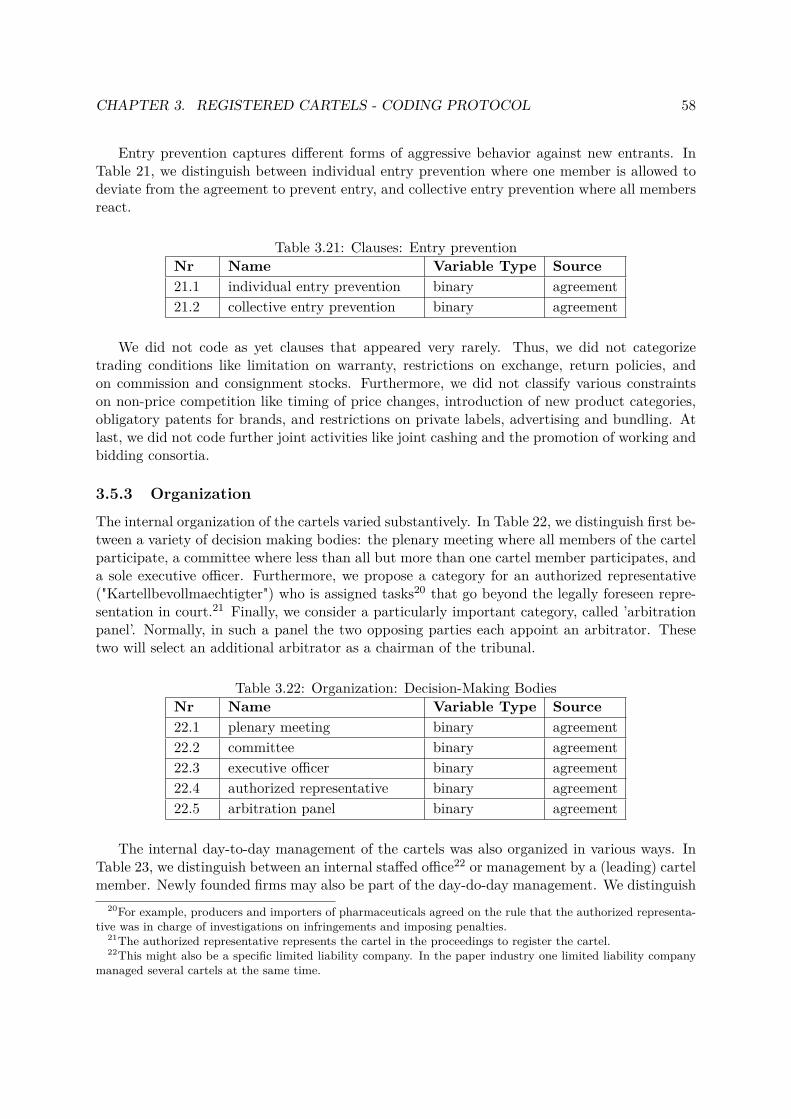
CHAPTER 3. REGISTERED CARTELS - CODING PROTOCOL 58
Entry prevention captures different forms of aggressive behavior against new entrants. InTable 21, we distinguish between individual entry prevention where one member is allowed todeviate from the agreement to prevent entry, and collective entry prevention where all membersreact.
Table 3.21: Clauses: Entry preventionNr Name Variable Type Source21.1 individual entry prevention binary agreement21.2 collective entry prevention binary agreement
We did not code as yet clauses that appeared very rarely. Thus, we did not categorizetrading conditions like limitation on warranty, restrictions on exchange, return policies, andon commission and consignment stocks. Furthermore, we did not classify various constraintson non-price competition like timing of price changes, introduction of new product categories,obligatory patents for brands, and restrictions on private labels, advertising and bundling. Atlast, we did not code further joint activities like joint cashing and the promotion of working andbidding consortia.
3.5.3 Organization
The internal organization of the cartels varied substantively. In Table 22, we distinguish first be-tween a variety of decision making bodies: the plenary meeting where all members of the cartelparticipate, a committee where less than all but more than one cartel member participates, anda sole executive officer. Furthermore, we propose a category for an authorized representative("Kartellbevollmaechtigter") who is assigned tasks20 that go beyond the legally foreseen repre-sentation in court.21 Finally, we consider a particularly important category, called ’arbitrationpanel’. Normally, in such a panel the two opposing parties each appoint an arbitrator. Thesetwo will select an additional arbitrator as a chairman of the tribunal.
Table 3.22: Organization: Decision-Making BodiesNr Name Variable Type Source22.1 plenary meeting binary agreement22.2 committee binary agreement22.3 executive officer binary agreement22.4 authorized representative binary agreement22.5 arbitration panel binary agreement
The internal day-to-day management of the cartels was also organized in various ways. InTable 23, we distinguish between an internal staffed office22 or management by a (leading) cartelmember. Newly founded firms may also be part of the day-do-day management. We distinguish
20For example, producers and importers of pharmaceuticals agreed on the rule that the authorized representa-tive was in charge of investigations on infringements and imposing penalties.
21The authorized representative represents the cartel in the proceedings to register the cartel.22This might also be a specific limited liability company. In the paper industry one limited liability company
managed several cartels at the same time.
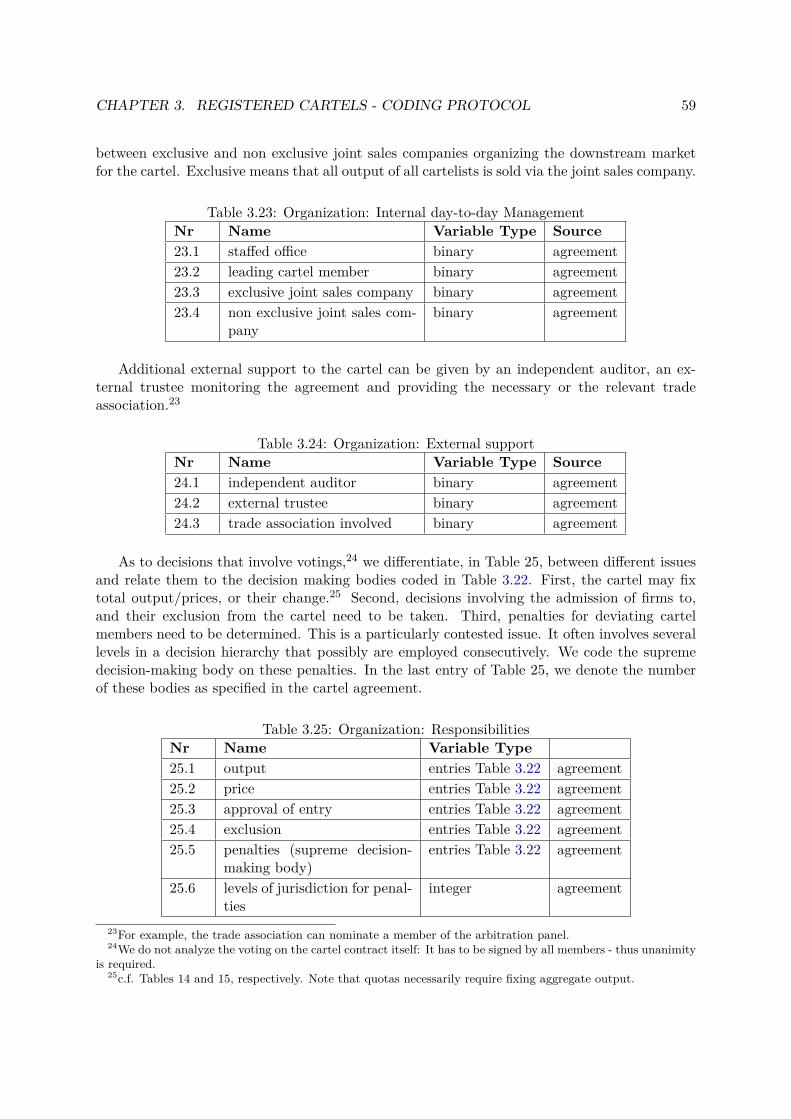
CHAPTER 3. REGISTERED CARTELS - CODING PROTOCOL 59
between exclusive and non exclusive joint sales companies organizing the downstream marketfor the cartel. Exclusive means that all output of all cartelists is sold via the joint sales company.
Table 3.23: Organization: Internal day-to-day ManagementNr Name Variable Type Source23.1 staffed office binary agreement23.2 leading cartel member binary agreement23.3 exclusive joint sales company binary agreement23.4 non exclusive joint sales com-
panybinary agreement
Additional external support to the cartel can be given by an independent auditor, an ex-ternal trustee monitoring the agreement and providing the necessary or the relevant tradeassociation.23
Table 3.24: Organization: External supportNr Name Variable Type Source24.1 independent auditor binary agreement24.2 external trustee binary agreement24.3 trade association involved binary agreement
As to decisions that involve votings,24 we differentiate, in Table 25, between different issuesand relate them to the decision making bodies coded in Table 3.22. First, the cartel may fixtotal output/prices, or their change.25 Second, decisions involving the admission of firms to,and their exclusion from the cartel need to be taken. Third, penalties for deviating cartelmembers need to be determined. This is a particularly contested issue. It often involves severallevels in a decision hierarchy that possibly are employed consecutively. We code the supremedecision-making body on these penalties. In the last entry of Table 25, we denote the numberof these bodies as specified in the cartel agreement.
Table 3.25: Organization: ResponsibilitiesNr Name Variable Type25.1 output entries Table 3.22 agreement25.2 price entries Table 3.22 agreement25.3 approval of entry entries Table 3.22 agreement25.4 exclusion entries Table 3.22 agreement25.5 penalties (supreme decision-
making body)entries Table 3.22 agreement
25.6 levels of jurisdiction for penal-ties
integer agreement
23For example, the trade association can nominate a member of the arbitration panel.24We do not analyze the voting on the cartel contract itself: It has to be signed by all members - thus unanimity
is required.25c.f. Tables 14 and 15, respectively. Note that quotas necessarily require fixing aggregate output.
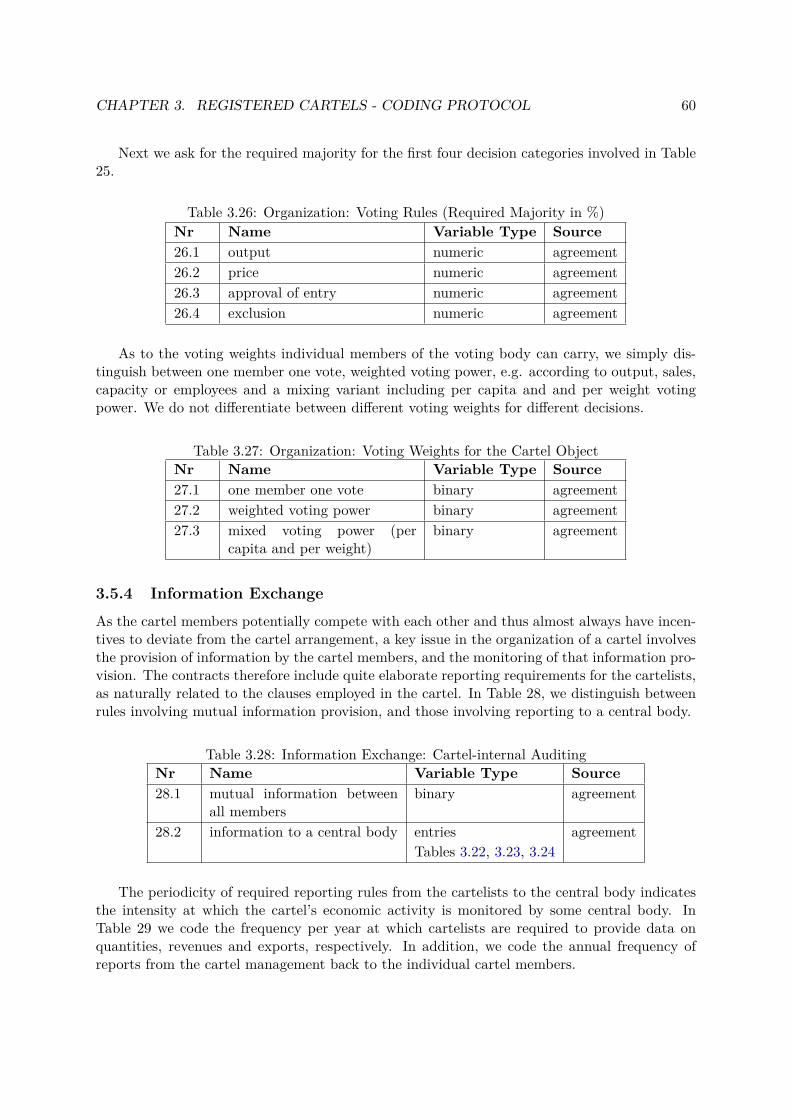
CHAPTER 3. REGISTERED CARTELS - CODING PROTOCOL 60
Next we ask for the required majority for the first four decision categories involved in Table25.
Table 3.26: Organization: Voting Rules (Required Majority in %)Nr Name Variable Type Source26.1 output numeric agreement26.2 price numeric agreement26.3 approval of entry numeric agreement26.4 exclusion numeric agreement
As to the voting weights individual members of the voting body can carry, we simply dis-tinguish between one member one vote, weighted voting power, e.g. according to output, sales,capacity or employees and a mixing variant including per capita and and per weight votingpower. We do not differentiate between different voting weights for different decisions.
Table 3.27: Organization: Voting Weights for the Cartel ObjectNr Name Variable Type Source27.1 one member one vote binary agreement27.2 weighted voting power binary agreement27.3 mixed voting power (per
capita and per weight)binary agreement
3.5.4 Information Exchange
As the cartel members potentially compete with each other and thus almost always have incen-tives to deviate from the cartel arrangement, a key issue in the organization of a cartel involvesthe provision of information by the cartel members, and the monitoring of that information pro-vision. The contracts therefore include quite elaborate reporting requirements for the cartelists,as naturally related to the clauses employed in the cartel. In Table 28, we distinguish betweenrules involving mutual information provision, and those involving reporting to a central body.
Table 3.28: Information Exchange: Cartel-internal AuditingNr Name Variable Type Source28.1 mutual information between
all membersbinary agreement
28.2 information to a central body entries agreementTables 3.22, 3.23, 3.24
The periodicity of required reporting rules from the cartelists to the central body indicatesthe intensity at which the cartel’s economic activity is monitored by some central body. InTable 29 we code the frequency per year at which cartelists are required to provide data onquantities, revenues and exports, respectively. In addition, we code the annual frequency ofreports from the cartel management back to the individual cartel members.
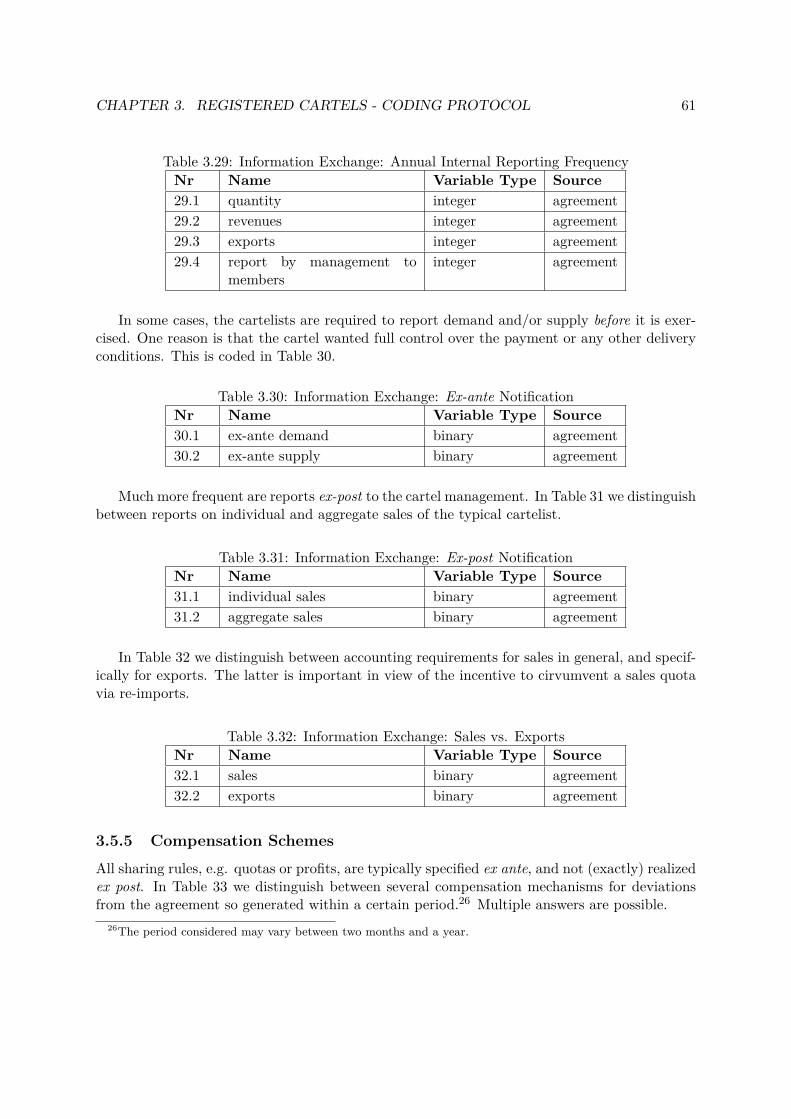
CHAPTER 3. REGISTERED CARTELS - CODING PROTOCOL 61
Table 3.29: Information Exchange: Annual Internal Reporting FrequencyNr Name Variable Type Source29.1 quantity integer agreement29.2 revenues integer agreement29.3 exports integer agreement29.4 report by management to
membersinteger agreement
In some cases, the cartelists are required to report demand and/or supply before it is exer-cised. One reason is that the cartel wanted full control over the payment or any other deliveryconditions. This is coded in Table 30.
Table 3.30: Information Exchange: Ex-ante NotificationNr Name Variable Type Source30.1 ex-ante demand binary agreement30.2 ex-ante supply binary agreement
Much more frequent are reports ex-post to the cartel management. In Table 31 we distinguishbetween reports on individual and aggregate sales of the typical cartelist.
Table 3.31: Information Exchange: Ex-post NotificationNr Name Variable Type Source31.1 individual sales binary agreement31.2 aggregate sales binary agreement
In Table 32 we distinguish between accounting requirements for sales in general, and specif-ically for exports. The latter is important in view of the incentive to cirvumvent a sales quotavia re-imports.
Table 3.32: Information Exchange: Sales vs. ExportsNr Name Variable Type Source32.1 sales binary agreement32.2 exports binary agreement
3.5.5 Compensation Schemes
All sharing rules, e.g. quotas or profits, are typically specified ex ante, and not (exactly) realizedex post. In Table 33 we distinguish between several compensation mechanisms for deviationsfrom the agreement so generated within a certain period.26 Multiple answers are possible.
26The period considered may vary between two months and a year.
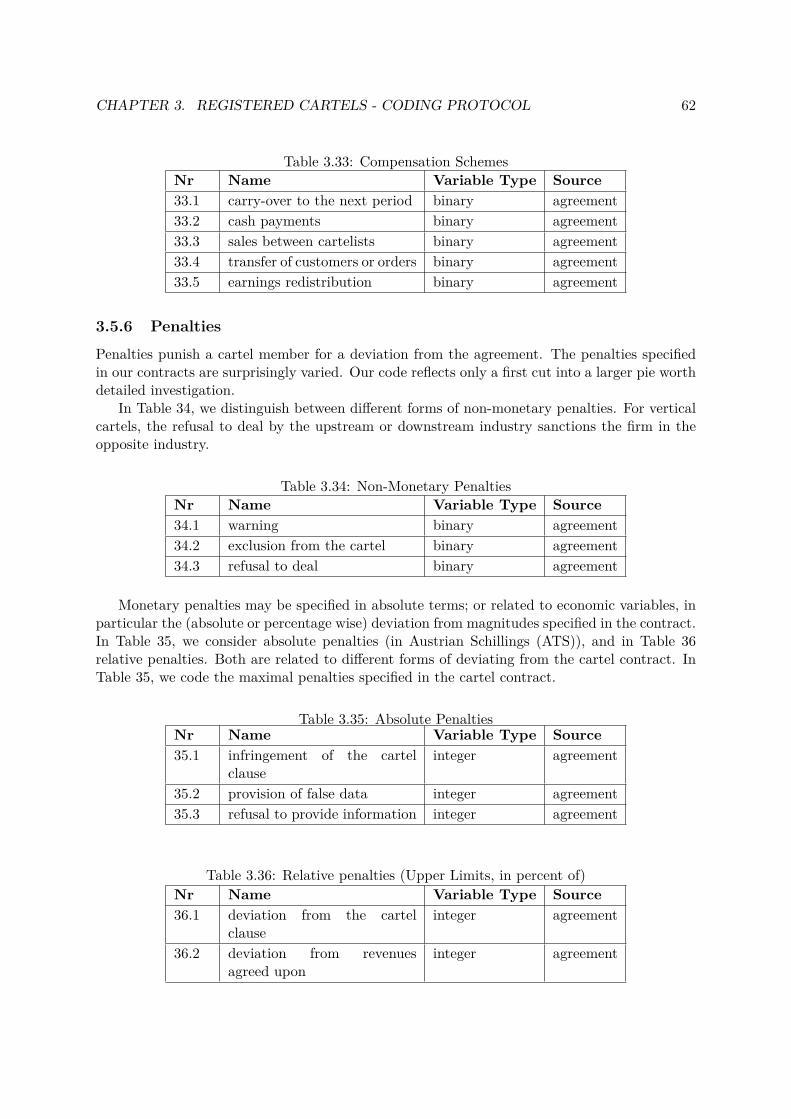
CHAPTER 3. REGISTERED CARTELS - CODING PROTOCOL 62
Table 3.33: Compensation SchemesNr Name Variable Type Source33.1 carry-over to the next period binary agreement33.2 cash payments binary agreement33.3 sales between cartelists binary agreement33.4 transfer of customers or orders binary agreement33.5 earnings redistribution binary agreement
3.5.6 Penalties
Penalties punish a cartel member for a deviation from the agreement. The penalties specifiedin our contracts are surprisingly varied. Our code reflects only a first cut into a larger pie worthdetailed investigation.
In Table 34, we distinguish between different forms of non-monetary penalties. For verticalcartels, the refusal to deal by the upstream or downstream industry sanctions the firm in theopposite industry.
Table 3.34: Non-Monetary PenaltiesNr Name Variable Type Source34.1 warning binary agreement34.2 exclusion from the cartel binary agreement34.3 refusal to deal binary agreement
Monetary penalties may be specified in absolute terms; or related to economic variables, inparticular the (absolute or percentage wise) deviation from magnitudes specified in the contract.In Table 35, we consider absolute penalties (in Austrian Schillings (ATS)), and in Table 36relative penalties. Both are related to different forms of deviating from the cartel contract. InTable 35, we code the maximal penalties specified in the cartel contract.
Table 3.35: Absolute PenaltiesNr Name Variable Type Source35.1 infringement of the cartel
clauseinteger agreement
35.2 provision of false data integer agreement35.3 refusal to provide information integer agreement
Table 3.36: Relative penalties (Upper Limits, in percent of)Nr Name Variable Type Source36.1 deviation from the cartel
clauseinteger agreement
36.2 deviation from revenuesagreed upon
integer agreement
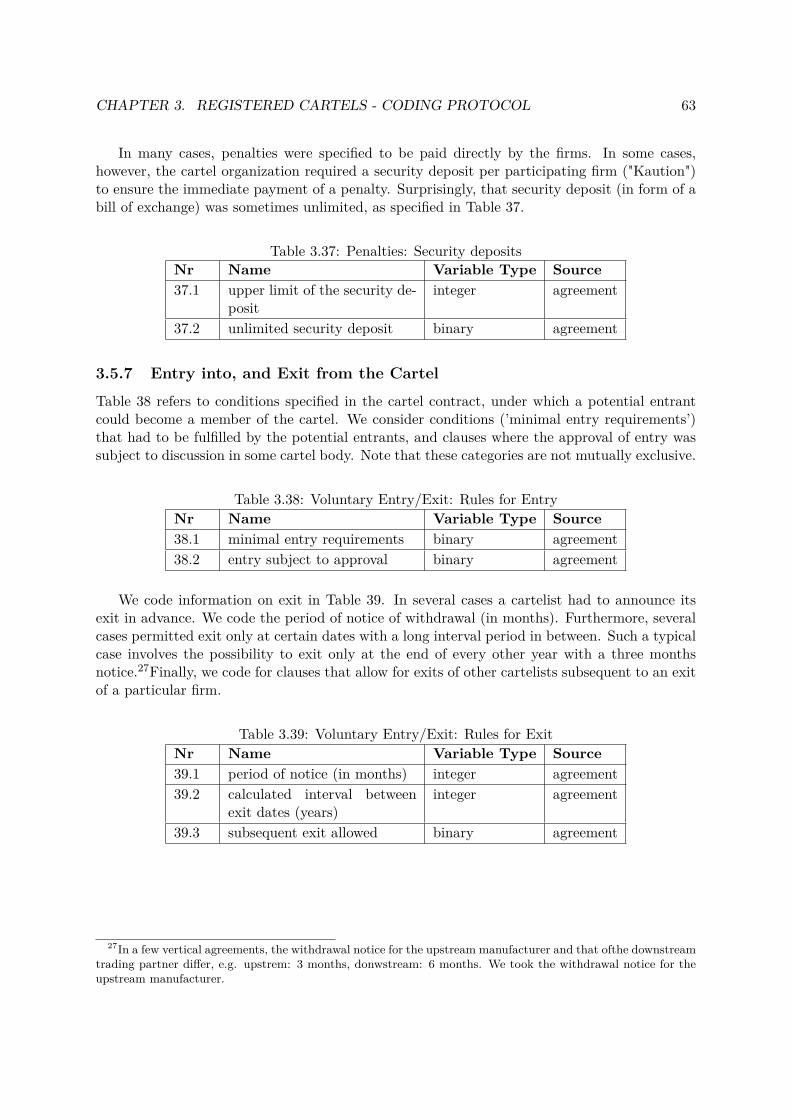
CHAPTER 3. REGISTERED CARTELS - CODING PROTOCOL 63
In many cases, penalties were specified to be paid directly by the firms. In some cases,however, the cartel organization required a security deposit per participating firm ("Kaution")to ensure the immediate payment of a penalty. Surprisingly, that security deposit (in form of abill of exchange) was sometimes unlimited, as specified in Table 37.
Table 3.37: Penalties: Security depositsNr Name Variable Type Source37.1 upper limit of the security de-
positinteger agreement
37.2 unlimited security deposit binary agreement
3.5.7 Entry into, and Exit from the Cartel
Table 38 refers to conditions specified in the cartel contract, under which a potential entrantcould become a member of the cartel. We consider conditions (’minimal entry requirements’)that had to be fulfilled by the potential entrants, and clauses where the approval of entry wassubject to discussion in some cartel body. Note that these categories are not mutually exclusive.
Table 3.38: Voluntary Entry/Exit: Rules for EntryNr Name Variable Type Source38.1 minimal entry requirements binary agreement38.2 entry subject to approval binary agreement
We code information on exit in Table 39. In several cases a cartelist had to announce itsexit in advance. We code the period of notice of withdrawal (in months). Furthermore, severalcases permitted exit only at certain dates with a long interval period in between. Such a typicalcase involves the possibility to exit only at the end of every other year with a three monthsnotice.27Finally, we code for clauses that allow for exits of other cartelists subsequent to an exitof a particular firm.
Table 3.39: Voluntary Entry/Exit: Rules for ExitNr Name Variable Type Source39.1 period of notice (in months) integer agreement39.2 calculated interval between
exit dates (years)integer agreement
39.3 subsequent exit allowed binary agreement
27In a few vertical agreements, the withdrawal notice for the upstream manufacturer and that ofthe downstreamtrading partner differ, e.g. upstrem: 3 months, donwstream: 6 months. We took the withdrawal notice for theupstream manufacturer.
Chapter 4
Registered Cartels in Austria - AnOverview
This chapter is joint work with Konrad Stahl, Philipp Schmidt-Dengler and Christine Zulehner(Fink et al., 2015).
4.1 IntroductionWe study archival materials from registered cartels in Austria to learn about the inner workingsof cartels. Many countries allowed firms to engage in non-competitive practices, by registeringagreements with a government authority. This was the case in several European countries,such as Austria, Denmark, Finland, Norway, and Sweden, after World War II, or in the UnitedStates during the National Industrial Recovery Act (NIRA). In Austria, this episode ended inthe mid-1990s with the country’s accession to the European Union.
To grasp the widespread activities and rules cartels stick to, we follow a descriptive approach.This enables us to present stylized facts that take into account theoretical insights and realworld observations at once. Davis and Fletcher (2013) call for a better understanding of themechanisms that firms employ to overcome the difficulties inherent in agreeing to collude. Wehope to contribute to this understanding using the following approach. Based on establishedwisdom summarized exceptionally well in Stigler (1964) and in-depth content analysis of cartelcontracts, we developed a coding scheme1 capturing contract characteristics according to fourmethods of collusion: quotas, specialization, price fixing and payment conditions. Using aflexible and content-sensitive approach we developed categories to provide a broad descriptionof these cartels.
Our main findings can be summarized as follows. Registered cartels included only a smallsubset of firms active in the Austrian economy. More than half of the cartels used more thanone method of collusion. For instance, roughly one third of the cartels combine price and pay-ment condition clauses. In quota cartels, the prevalence of provisions for information exchangeand compensation mechanisms is in line with ideas put forward by Stigler (1964) and recenttheory developed by Harrington and Skrzypacz (2011). Almost all quota cartels belong to themanufacturing sector. On average, quota cartels have fewer members compared to price andspecialization cartels. Specialization agreements (allocating the market either regionally, by
1For details see chapter 3.
64
CHAPTER 4. REGISTERED CARTELS - AN OVERVIEW 65
product, or by customer) stand out in terms of their simplicity, hardly specifying informationprovision requirements and or punishment rules. Cartels fixing prices are comparatively largeand often employ other methods of collusion as well. They more often use norms to preventcompetition along dimensions other than price. Payment condition agreements primarily in-crease transparency, indicating an attempt to prevent secret price cuts. They tend to be themost complex agreements, relying more on information provision upon request and explicit pun-ishment schemes. Almost three quarters of all agreements specify some form of punishment forcontract violation. We emphasize that legal cartels and their registration were part of the Aus-trian version of corporatism called “Social Partnership,” in which price ceilings (increases) wereeffectively regulated. Cartel contracts thus primarily served as a tool to realize the permittedmaximum price avoiding its undercutting. Overall, we find that the agreements tend to addressissues that the literature (see for instance Stigler (1964)) has raised as potential obstacles tosustaining collusion: they use compensation schemes, reporting requirements, rules for entryand exit, and ensure quick and credible punishment.
We contribute to an emerging body of literature comparing the details of inner workings ofseveral cartels within a specific institutional environment. Levenstein and Suslow (2006) surveythe literature on domestic and international cartels in different legal environments. Harrington(2006) describes the practices of 20 detected cartels, based on European Commission decisionsover 2000-2004. Levenstein and Suslow (2011) focuses on the factors influencing duration ofdetected international cartels. Connor (2003) analyses the duration, the welfare impact andantitrust fines for international cartels discovered after 1990. While the aforementioned papersfocus on environments were cartels were illegal, several studies focus on settings were cartels werelegal. Taylor (2007) studies 66 cartels during the NIRA episode 1933-1935 when cartels werelegal in the United States. He examines which industries were successful in achieving collusiveoutcomes and which provisions in cartel contracts led to successful cartelization. Chicu et al.(2013) and Vickers and Ziebarth (2014) study the cement industry during the NIRA episode.Most closely related to our paper is the study of Finnish legal cartels by Hyytinen et al. (2015),identifying common patterns across cartel contracts within a specific legal environment. We relyon insights from detailed case studies and empirical analysis of individual cartels in both legaland illegal environments including Genesove and Mullin (2001), Asker (2010) and Röller andSteen (2006) to develop the categories used to describe the cartels. While the contract clausesused by legal cartels may offer useful insights for the detection of illegal cartels, we emphasizethat comparing cartels in legal and illegal environments is not straightforward. Cross-sectionalstudies of detected illegal cartels contain information on the actual practices of the cartels, butmay suffer from detection bias. Our study contains all legal cartels, but cartel practices mayhave differed from the contractual clauses. Legal cartels could openly engage in practices suchas compensation, punishment, and information transfers, which illegal cartels must hide. Legalcartels can openly instruct all employees to behave according to the agreement, whereas inillegal cartels it is less clear who is informed and bound by the agreement. Finally, we do notobserve clauses specifying rules for bidding rings, which are often among detected cartels (seefor instance Harrington (2006)). Bidding rings were illegal in Austria.
The remainder of the paper is organized as follows. The next section presents the insti-tutional background, describing how cartel registration worked and its place in the Austriansystem of “Social Partnership.” Section 4.3 describes the archived cartel registry and the con-struction of our sample, as well as which industries are represented. Section 4.4 presents thecontract characteristics. We first give an overview of the different collusion methods, the mul-
CHAPTER 4. REGISTERED CARTELS - AN OVERVIEW 66
tiple use thereof, and the corresponding cartel and contract characteristics. We then go intomore detail outlining the presence of additional clauses across the different collusion methods.Next we examine governance structures, like decision making bodies and their voting rules,cartel management, rules for information exchange, compensation and punishment schemes, aswell as the regulations on entry and exit. Section 5 summarizes the key findings by collusionmethod. Section 6 concludes.
4.2 Institutional BackgroundIn this section we explain why and how registered cartels existed in Austria. First, we explainthe economic and historic background for the Austrian cartel law. Next, we describe the limitsfor registered cartels and incentives to registers. At last, we present information on cartelproceedings and the regulatory background that was dominated by social partnership.
Cartel Law in Austria
The legal environment in Austria had always been rather favorable towards cooperative behav-ior. We focus on the post World War II period.2 Although part of the Allied Council (bothSoviet and United States elements) were opposed (see Johnstone (1951)), the first cartel lawwas passed in 1951. To understand the positive attitude towards cartelization at the time, itis necessary to bear in mind the Austrian macroeconomic conditions. Austria had no access toexternal finance on the capital market and relied on economic aid from abroad accounting forup to 20% of GDP in the late 1940s. Cartels were considered to be a stabilizing force in theeconomy.3 Explanatory remarks to the 1951 law state that cartels are “not necessarily causingdamage to the economy.” Instead, they may be “useful in their market stabilizing function” and“essential in foreign trade” (Tüchler, 2003, p. 131).
The 1951 law did not prohibit cartels. Instead it required cartel agreements to be registeredat court, thus providing a legal basis for cartelized activities. This law experienced severalamendments but no fundamental changes. In 1972, a new law was passed, which remained inforce until 1988.4
Since we had access to registry files from 1973 on, the 1972 law is the most relevant forour purposes. According to the 1972 law, cartel agreements were defined as all binding agree-ments aiming at “regulation or limitation of competition, in particular with respect to produc-tion, sales, or prices” (KartG 1972, §1). The law included a separate provision for “concertedpractices”—cartel like behavior without explicit agreement—and “cartels by effect”(KartG 1972,§1). Registration of such cartelized activity was required upon notification by the chairman ofthe cartel court (KartG 1972, §16). Conversely, it was not required to register concerted prac-tices and cartels by effect, as long as there was no such request. Such a request occurred onlyonce.5 Finally, de minimis cartels (where the companies involved had less than 5% national and25% local market share) were not obliged to register, although some did.
2See Resch (2002) for the situation before 1914.3See Seidel (2005) and Butschek (2011) for a detailed documentation.4The 1988 law differed in one major aspect, namely that contracts could only be approved (or renewed) for a
maximum length of five years at a time.5See Tüchler (2003). The resulting registration request was actually declined. Therefore our registry involves
no cartel registered upon request.
CHAPTER 4. REGISTERED CARTELS - AN OVERVIEW 67
Firms had to write a contract defining their cartel arrangement, as well as providing aneconomic justification thereof. Upon approval, the contract along with possible supplements(price lists, calculation schemes, etc.) was then filed in the cartel register.
The decision as to whether a cartel agreement was registered was to be made by a three-judgepanel at the cartel court. Registration required that the cartel was economically justified. Thejudicature never formally nor materially clarified its interpretation of “economic justification,”since it did not prohibit cartels based on the lack of it. Yet individual cartels were prohibited,when the contract on which they were based was deemed immoral according to the Austriancivil code. For example, a bidding ring was declared illegal in 1975. Consequently, there areno bidding rings among the registered cartels. Furthermore, the cartel law intended to containthe pressure both on members to stay within the cartel and to non-members to be part of thecartel. Hence, the period of notice for exit was limited to six months and penalties for an exitwere forbidden.
In principle, unregistered cartel agreements were subject to criminal law. Criminal law needsenforcement by the government. Official conviction statistics show impositions only in 1976,1980 and from 2000 onwards, suggesting that the fear of being caught and fined for operatingan illegal cartel was not the main incentive to register a cartel.
A registered contract constituted a legally binding agreement. The cartel could thereby beenforced either through fines and arbitration proceedings as specified in the contract, or throughlegal action in the courts.6 The legally binding character of the agreements distinguishes theAustrian case from other environments where collusive agreements may have been legal, butwere not enforceable in court, for example in the U.S. during the NIRA episode.
Cartel Registration within Austrian System of “Social Partnership”
To understand the cartel activities in Austria it is important to keep in mind the institutionalstructure governing economic activities in the period of study. Economic agents were representedin central organizations.
The Chamber of Labor (“Arbeiterkammer”) represented the interests of all dependent em-ployees in Austria, and the Economic Chamber (“Wirtschaftskammer”) those of business. Mem-bership in the respective chamber was mandatory for all dependent employees and firms (andstill is). In addition, employees were represented by the Trade Union Federation, and farmers bythe Chamber of Agriculture (“Landwirtschaftskammer”). These four major interest groups weremembers of the “Parity Commission” which was an informal body seeking to find compromiseson price and wage issues.
The institutional set-up at the court and within this system of “Social Partnership” isparticularly relevant for the study of cartelization activities. Figure 4.1 illustrates the cartelregistration process and the involvement of social partners.
First, the three chambers (Agriculture, Labor, and Commerce) were parties in the cartelapplication proceedings. Additionally, the federal financial agency was party of the proceedingsas an attorney general for the federal government. The parties were eligible to request a reviewof an application as well as to appeal to the cartel court’s decision.7
6Fines were subject to the judge’s discretion and could be lowered relative to the fines specified in the cartelcontract.
7The observed review requests are documented below in Table 4.8. The Chamber of Labor requested reviewssignificantly more often in quota cartels of what Stigler (1964) considered the most efficient form of coordinatedbehavior. The federal financing agency was more active in legal issues.
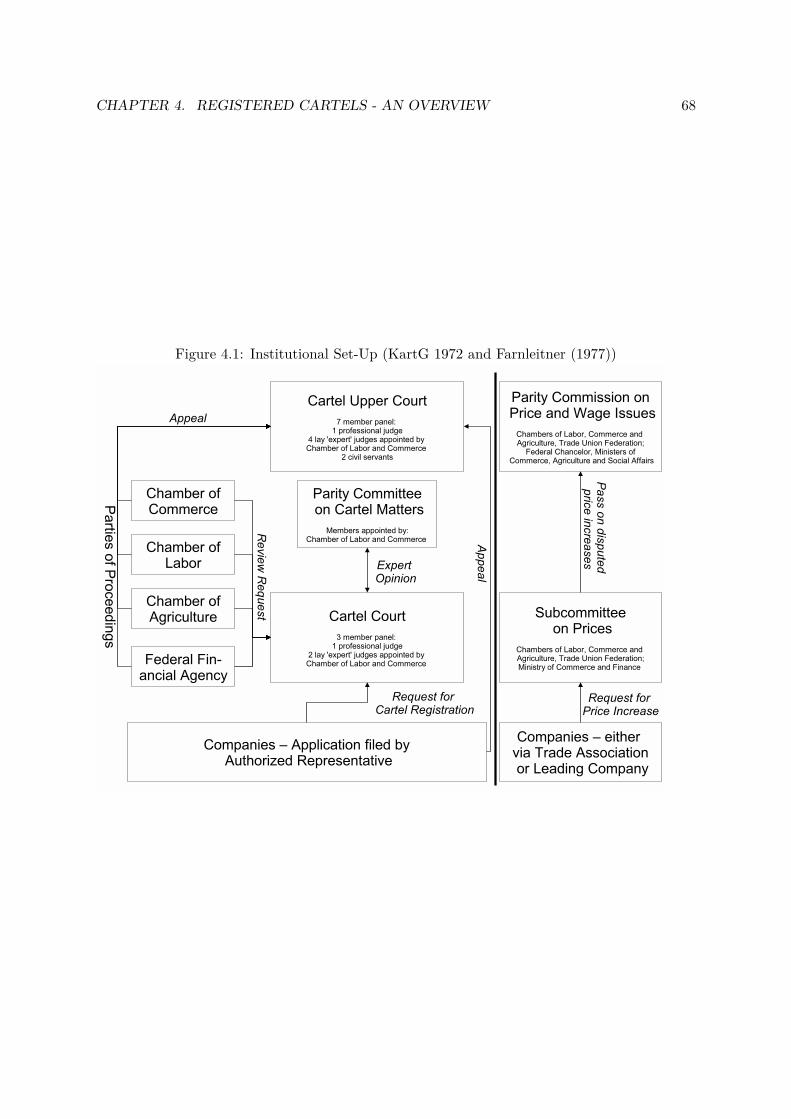
CHAPTER 4. REGISTERED CARTELS - AN OVERVIEW 68
Figure 4.1: Institutional Set-Up (KartG 1972 and Farnleitner (1977))
CHAPTER 4. REGISTERED CARTELS - AN OVERVIEW 69
Second, there was the “Parity Committee on Cartel Matters” that prepared the expertopinion for the court. It consisted of six members and two executive secretaries. The Chambersof Commerce and Labor each proposed three members and jointly appointed the two secretaries.The committee had to prepare an expert opinion on every cartel application, in particular onthe economic justification of the agreement. Decisions were taken by a three member panelof the cartel court. The panel consisted of a professional judge as well as two lay judges,appointed by the Chambers of Commerce and Labor respectively. The panel normally reliedonly on unanimous expert opinions by the Parity Committee. Representing both consumersand workers in this institutional setup, the Chamber of Labor often accepted cartels as partof greater compromise. This significantly weakened cartel review capabilities and explains thatcartels were never denied registration due to lack of economic justification.
Third, the Parity Commission’s Subcommittee on Prices reviewed applications for price in-creases, as illustrated on the right panel of Figure 4.1. Applications came either from individualcompanies or trade associations representing a specific sector. Applications had to be justifiedwith cost increases which could not be compensated by improvements in efficiency. Clearly, thiscentralized mechanism for realizing price adjustments could serve as a coordination device incollusive activities. Most of the registered cartels were part of this regime.
With Austria’s accession to the European Community, European competition law had tobe applied and was enforced by the European Commission. Thus, from Jan 1st, 1995 on, theapproval of cartels that may affect trade was restricted to comply with E.U. competition lawand—for the first time—subject to enforcement by the European Commission.8
4.3 The Austrian Cartel RegistryThe registry lists about 125 cartel folders. A typical cartel folder includes an overview summa-rizing the list of events pertaining to an agreement. Every change in the agreement requiredre-approval by the cartel court. These could be a change in the contract due to a new firmjoining the cartel or as simple as the representative of the cartel had changed. In addition tothis overview, the folder includes the contract and amendments to the contract. The 125 filesin the registry contain in total 149 agreements. We consolidated consecutive (for instance in-volving extending the duration of a contract) and add-on agreements (adding another memberto an existing contract) into one contract each, and removed contracts that actually resembleda merger. We classified the remaining 99 contracts into three groups: pure vertical agreementsthat also included 12 vertical restraints originating from single upstream producers, 7 horizontalagreements with vertical elements, and 80 pure horizontal agreements.9 In the ensuing presen-tation, we concentrate on these 80 pure horizontal agreements. Most of the cartels were initiallyregistered in the 1950s. In 1973, continuing cartels were required to register again. We observethe cartel agreements that were (re-)registered in 1973 or later.
Industries covered by the cartel registry
To examine which industries were covered by cartel registration, we classify the observed regis-tered cartels according to a two digit industry classification. The details are reported in Table
8A major reform of the institutional set-up occurred in 2002 and 2005 when powers of social partners wererestricted and the cartel registry was finally closed by end of 2006.
9We treat cartels as purely horizontal when they involved collective vertical restraints orchestrated by severalupstream firms but without participation of downstream firms.
CHAPTER 4. REGISTERED CARTELS - AN OVERVIEW 70
4.26 in the Appendix. For many industries, we do not observe any registered cartels. Thisincludes the construction industry which we probably do not observe because the cartel lawexplicitly prohibited bidding rings.
Based on the 2-digit classification which typically includes several product markets, thenumber of firms participating in cartels is small relative to the total number of firms. Thisindicates that formal cartels were not as widespread as one might have expected. Severalexplanations can be offered for this, given the legal environment and weak enforcement describedin Section 4.2. One possible reason is the strong concentration in individual product markets.Further, arrangements serving to raise prices could be implemented easily without invoking anyformal agreement, via price regulation by application of the industry associations to the ParityCommission. After all, administering and implementing a cartel agreement was a costly andtime consuming enterprise. In addition, de minimis cartels were exempt from the registrationrequirement. Cartels by effect and concerted practices were only required to register uponrequest. Commentators state that cartels consequently often operated informally and avoidedthe publicity of the cartel register (Tüchler, 2003, p. 134). In Table 4.27 in the Appendix, wematch our cartels into the 4-digit NACE classification. This is done only for manufacturingon the basis of the 1995 Statistics of Manufacturing, as we lack details on the service sector atthe 4-digit level. The match of products addressed in the cartels into the 4-digit NACE code iscloser than the 2-digit NACE code but still imperfect. Yet the comparison of total number ofcartelized firms with the firms at the 4-digit level is indicative of the coverage of the cartels.10
4.4 Collusion Methods and Contract CharacteristicsIn this section, we describe the cartels for which we found contracts in the Austrian CartelCourt’s register. We employ a coding protocol to format the information contained in thecontracts as archived in the cartel registry. Based on this protocol we describe each cartelcontract by a vector of contract clauses. In total, we coded 109 different contract clauses asspecified in the contracts. However the average contract includes only 25 clauses. Includingdates, classifications etc., we specified 200 categories in total.
Most of the contract clauses are coded as binary variables describing whether or not a specificcontract clause is part of the agreement. For variables like the industry classification we usenominal categories. Dates, frequencies etc. are numerically coded. For other information, e.g.the products involved we resort to text format.11
In the first subsection, we survey the cartels by main method of collusion and broad cartelcharacteristics. In the second subsection, we discuss auxiliary collusive clauses. In the thirdsubsection, we look at cartel governance.
4.4.1 Main Collusive Instruments: An Overview
Here we introduce the main contract clauses we consider and their frequency of appearancein cartel contracts. We present marginal distributions in terms of cartel size, duration, and
10The number of firms in the cartels sometimes exceeds the number of firms indicated in the 1995 statistics.This includes sugar (15.83), beer (15.96), and manufacturing of basic iron and steel (27.10). Altogether, thenumber of firms in manufacturing cartels exceeds the number of firms in the 1995 official statistics in 9 out of63 manufacturing cartels. The reason is apparently a considerable consolidation in these industries before 1995.Further, for beer four different cartels with overlapping participants are observed in the registry.
11For a detailed description of our procedure see chapter 3.
CHAPTER 4. REGISTERED CARTELS - AN OVERVIEW 71
complexity. Finally, we describe economic justification provided by cartel applicants and towhat extent cartel applications were subject to reviews requested by the Parity Committee.
Instruments to influence market outcome
We start by defining the contract clauses to describe the main instrument(s) a cartel used toinfluence the market outcome. We base the selection of our main collusion instruments on Stigler(1964) who compares different methods of collusion with respect to their effectiveness againstsecret price cuts—the strongest impediment to cartel stability. This impediment is shared bylegal cartels as well. Most comprehensive is a merger, followed by a joint sales agency. For allother methods, Stigler argues that secret violations of the agreement are profitable. Thus thesemethods need enforcement: Significant deviations need to be detected. The faster and the morecomplete detection is, the more stable is the cartel.
Stigler singles out quota agreements as the most efficient way of preventing secret price cuts,but emphasizes that they require output inspection and appropriate formulas for redistributionfor departures from quotas. Harrington and Skrzypacz (2011) show that collusion in such aquota cartel can be sustained with truthful reporting of private information on sales.
The direct allocation of customers is the next most effective method according to Stigler,as long as demand growth of the custom of various cartel members does not diverge too much.Customer allocation can also be achieved via exclusive territories.
Finally Stigler identifies pure price fixing cartels as the ones prone most to destabilizingaction by the cartel members. It requires obtaining the transaction prices from the buyersto detect secret price cutting—although an oligopolist would make secret price cuts only forbuyers beyond a certain size. He finally states that there are many different ways for secretprice cutting that are difficult to grasp.
In order to identify these methods in our cartel registry, we distinguish between the main in-struments listed by Stigler: quotas, specialization, price. We add the separate category paymentconditions, which is the most frequent clause indicating the risk of secret price cuts:
• quota includes agreements on sales, output, or purchases of the participating firms relativeto each other, typically on the basis of expected aggregate output.
• specialization includes agreements on products, customers, suppliers or territories. Prod-uct specialization cartels assign one group of products to one firm and another group ofproducts to the next firm. Customer or supplier specialization agreements assign eithercustomers or suppliers to cartel members. Territorial specialization refers to agreementson exclusive territories or an allocation of customers based on least-freight.12
• price includes agreements on at least one of the following categories: fixed price, pricefloor, price book, common costing sheet, price adjustment.13
• payment conditions include agreements on the terms of payments, such as cash discounts,early payment discounts, and deferred payment.
12We observe 13 product specializations, 13 customer/supplier allocations, four exclusive territories and fiveleast freight cost based allocations.
13We observe 27 fixed prices, six price floors, 25 price books, 14 price adjustment clauses and 16 commoncosting sheets.
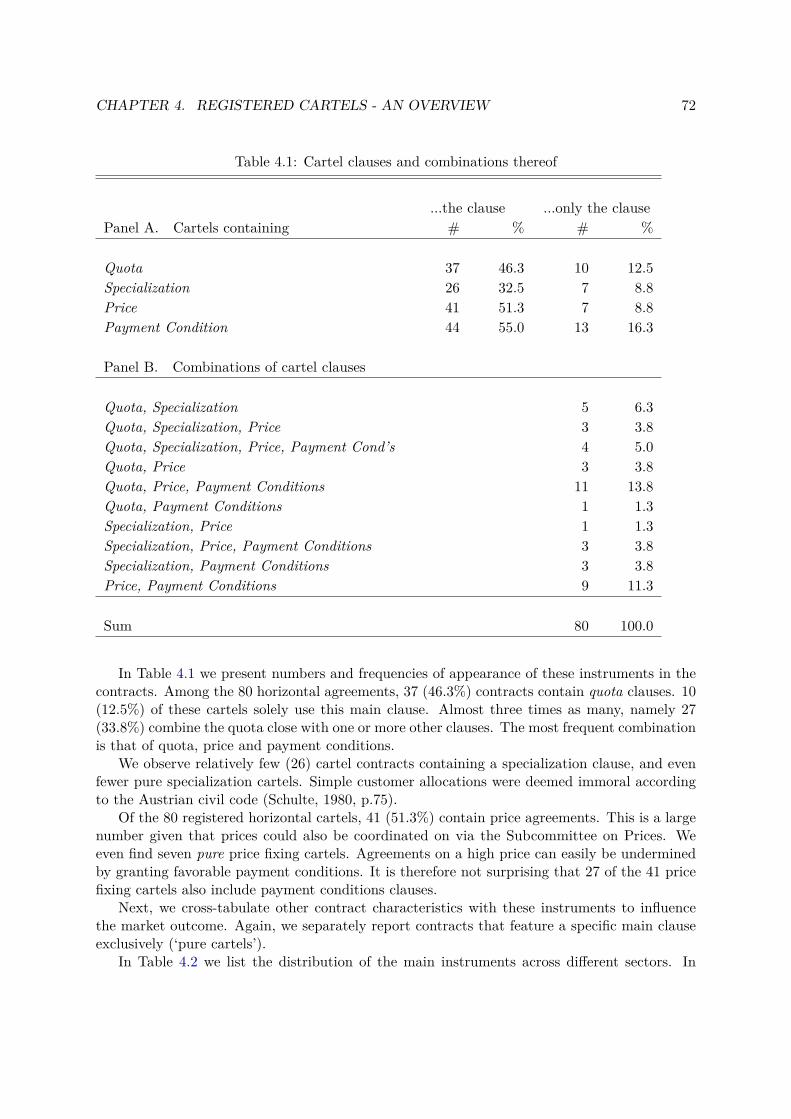
CHAPTER 4. REGISTERED CARTELS - AN OVERVIEW 72
Table 4.1: Cartel clauses and combinations thereof
...the clause ...only the clausePanel A. Cartels containing # % # %
Quota 37 46.3 10 12.5Specialization 26 32.5 7 8.8Price 41 51.3 7 8.8Payment Condition 44 55.0 13 16.3
Panel B. Combinations of cartel clauses
Quota, Specialization 5 6.3Quota, Specialization, Price 3 3.8Quota, Specialization, Price, Payment Cond’s 4 5.0Quota, Price 3 3.8Quota, Price, Payment Conditions 11 13.8Quota, Payment Conditions 1 1.3Specialization, Price 1 1.3Specialization, Price, Payment Conditions 3 3.8Specialization, Payment Conditions 3 3.8Price, Payment Conditions 9 11.3
Sum 80 100.0
In Table 4.1 we present numbers and frequencies of appearance of these instruments in thecontracts. Among the 80 horizontal agreements, 37 (46.3%) contracts contain quota clauses. 10(12.5%) of these cartels solely use this main clause. Almost three times as many, namely 27(33.8%) combine the quota close with one or more other clauses. The most frequent combinationis that of quota, price and payment conditions.
We observe relatively few (26) cartel contracts containing a specialization clause, and evenfewer pure specialization cartels. Simple customer allocations were deemed immoral accordingto the Austrian civil code (Schulte, 1980, p.75).
Of the 80 registered horizontal cartels, 41 (51.3%) contain price agreements. This is a largenumber given that prices could also be coordinated on via the Subcommittee on Prices. Weeven find seven pure price fixing cartels. Agreements on a high price can easily be underminedby granting favorable payment conditions. It is therefore not surprising that 27 of the 41 pricefixing cartels also include payment conditions clauses.
Next, we cross-tabulate other contract characteristics with these instruments to influencethe market outcome. Again, we separately report contracts that feature a specific main clauseexclusively (‘pure cartels’).
In Table 4.2 we list the distribution of the main instruments across different sectors. In
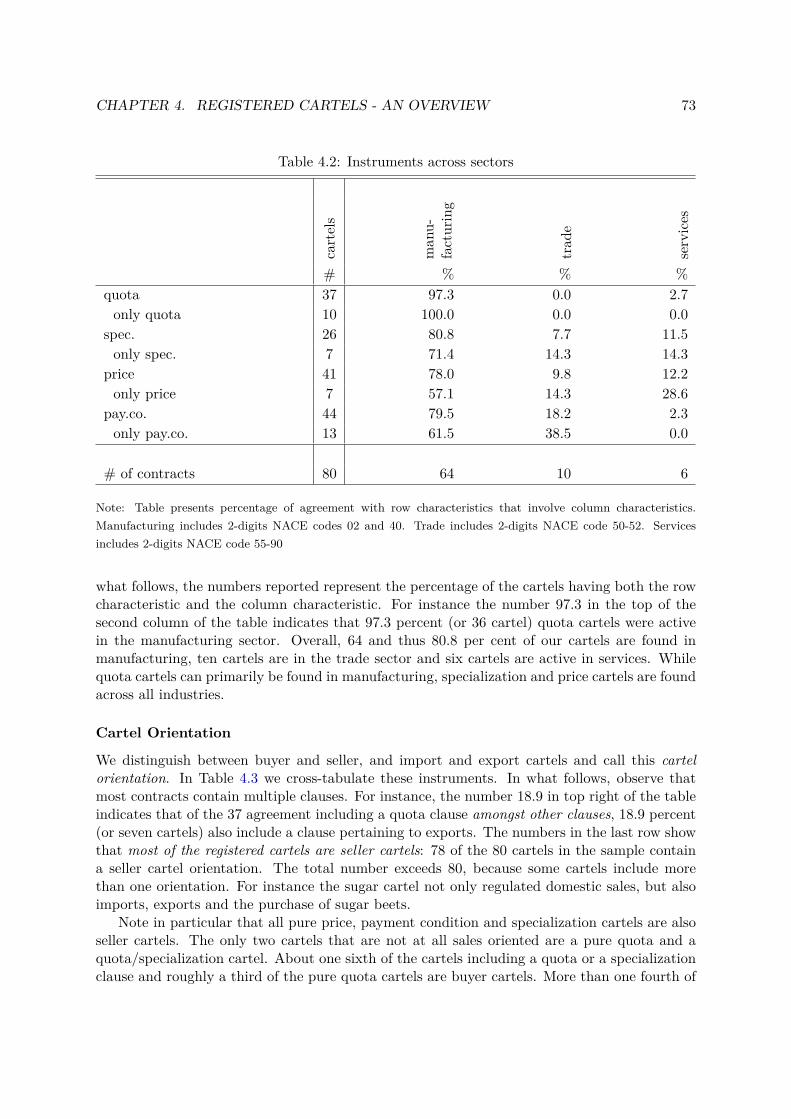
CHAPTER 4. REGISTERED CARTELS - AN OVERVIEW 73
Table 4.2: Instruments across sectors
cartels
man
u-facturing
trad
e
services
# % % %quota 37 97.3 0.0 2.7only quota 10 100.0 0.0 0.0
spec. 26 80.8 7.7 11.5only spec. 7 71.4 14.3 14.3
price 41 78.0 9.8 12.2only price 7 57.1 14.3 28.6
pay.co. 44 79.5 18.2 2.3only pay.co. 13 61.5 38.5 0.0
# of contracts 80 64 10 6
Note: Table presents percentage of agreement with row characteristics that involve column characteristics.Manufacturing includes 2-digits NACE codes 02 and 40. Trade includes 2-digits NACE code 50-52. Servicesincludes 2-digits NACE code 55-90
what follows, the numbers reported represent the percentage of the cartels having both the rowcharacteristic and the column characteristic. For instance the number 97.3 in the top of thesecond column of the table indicates that 97.3 percent (or 36 cartel) quota cartels were activein the manufacturing sector. Overall, 64 and thus 80.8 per cent of our cartels are found inmanufacturing, ten cartels are in the trade sector and six cartels are active in services. Whilequota cartels can primarily be found in manufacturing, specialization and price cartels are foundacross all industries.
Cartel Orientation
We distinguish between buyer and seller, and import and export cartels and call this cartelorientation. In Table 4.3 we cross-tabulate these instruments. In what follows, observe thatmost contracts contain multiple clauses. For instance, the number 18.9 in top right of the tableindicates that of the 37 agreement including a quota clause amongst other clauses, 18.9 percent(or seven cartels) also include a clause pertaining to exports. The numbers in the last row showthat most of the registered cartels are seller cartels: 78 of the 80 cartels in the sample containa seller cartel orientation. The total number exceeds 80, because some cartels include morethan one orientation. For instance the sugar cartel not only regulated domestic sales, but alsoimports, exports and the purchase of sugar beets.
Note in particular that all pure price, payment condition and specialization cartels are alsoseller cartels. The only two cartels that are not at all sales oriented are a pure quota and aquota/specialization cartel. About one sixth of the cartels including a quota or a specializationclause and roughly a third of the pure quota cartels are buyer cartels. More than one fourth of
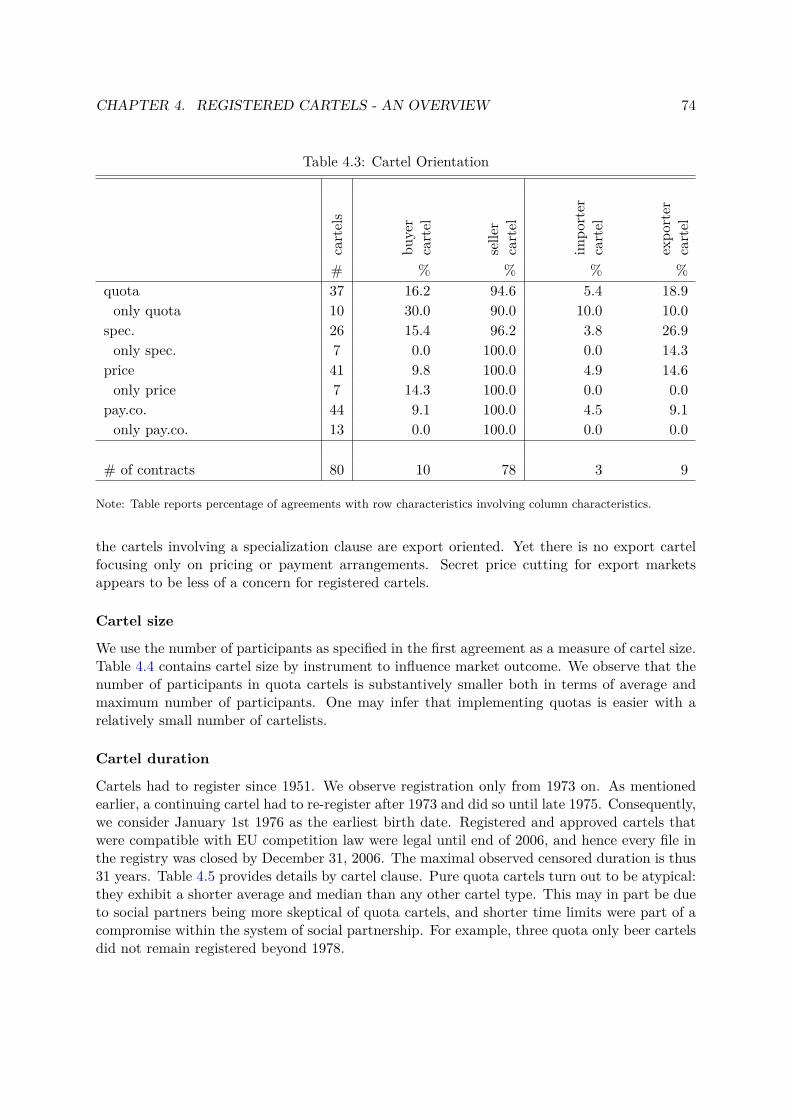
CHAPTER 4. REGISTERED CARTELS - AN OVERVIEW 74
Table 4.3: Cartel Orientation
cartels
buyer
cartel
selle
rcartel
impo
rter
cartel
expo
rter
cartel
# % % % %quota 37 16.2 94.6 5.4 18.9only quota 10 30.0 90.0 10.0 10.0
spec. 26 15.4 96.2 3.8 26.9only spec. 7 0.0 100.0 0.0 14.3
price 41 9.8 100.0 4.9 14.6only price 7 14.3 100.0 0.0 0.0
pay.co. 44 9.1 100.0 4.5 9.1only pay.co. 13 0.0 100.0 0.0 0.0
# of contracts 80 10 78 3 9
Note: Table reports percentage of agreements with row characteristics involving column characteristics.
the cartels involving a specialization clause are export oriented. Yet there is no export cartelfocusing only on pricing or payment arrangements. Secret price cutting for export marketsappears to be less of a concern for registered cartels.
Cartel size
We use the number of participants as specified in the first agreement as a measure of cartel size.Table 4.4 contains cartel size by instrument to influence market outcome. We observe that thenumber of participants in quota cartels is substantively smaller both in terms of average andmaximum number of participants. One may infer that implementing quotas is easier with arelatively small number of cartelists.
Cartel duration
Cartels had to register since 1951. We observe registration only from 1973 on. As mentionedearlier, a continuing cartel had to re-register after 1973 and did so until late 1975. Consequently,we consider January 1st 1976 as the earliest birth date. Registered and approved cartels thatwere compatible with EU competition law were legal until end of 2006, and hence every file inthe registry was closed by December 31, 2006. The maximal observed censored duration is thus31 years. Table 4.5 provides details by cartel clause. Pure quota cartels turn out to be atypical:they exhibit a shorter average and median than any other cartel type. This may in part be dueto social partners being more skeptical of quota cartels, and shorter time limits were part of acompromise within the system of social partnership. For example, three quota only beer cartelsdid not remain registered beyond 1978.
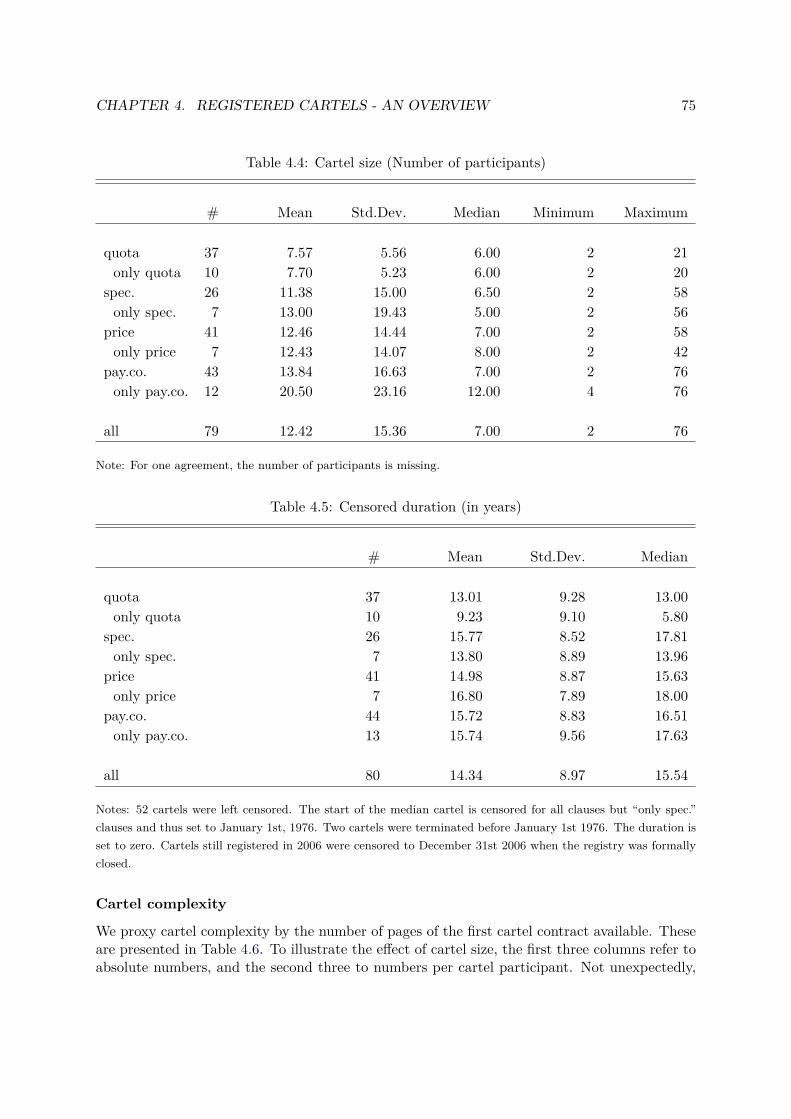
CHAPTER 4. REGISTERED CARTELS - AN OVERVIEW 75
Table 4.4: Cartel size (Number of participants)
# Mean Std.Dev. Median Minimum Maximum
quota 37 7.57 5.56 6.00 2 21only quota 10 7.70 5.23 6.00 2 20
spec. 26 11.38 15.00 6.50 2 58only spec. 7 13.00 19.43 5.00 2 56
price 41 12.46 14.44 7.00 2 58only price 7 12.43 14.07 8.00 2 42
pay.co. 43 13.84 16.63 7.00 2 76only pay.co. 12 20.50 23.16 12.00 4 76
all 79 12.42 15.36 7.00 2 76
Note: For one agreement, the number of participants is missing.
Table 4.5: Censored duration (in years)
# Mean Std.Dev. Median
quota 37 13.01 9.28 13.00only quota 10 9.23 9.10 5.80
spec. 26 15.77 8.52 17.81only spec. 7 13.80 8.89 13.96
price 41 14.98 8.87 15.63only price 7 16.80 7.89 18.00
pay.co. 44 15.72 8.83 16.51only pay.co. 13 15.74 9.56 17.63
all 80 14.34 8.97 15.54
Notes: 52 cartels were left censored. The start of the median cartel is censored for all clauses but “only spec.”clauses and thus set to January 1st, 1976. Two cartels were terminated before January 1st 1976. The duration isset to zero. Cartels still registered in 2006 were censored to December 31st 2006 when the registry was formallyclosed.
Cartel complexity
We proxy cartel complexity by the number of pages of the first cartel contract available. Theseare presented in Table 4.6. To illustrate the effect of cartel size, the first three columns refer toabsolute numbers, and the second three to numbers per cartel participant. Not unexpectedly,
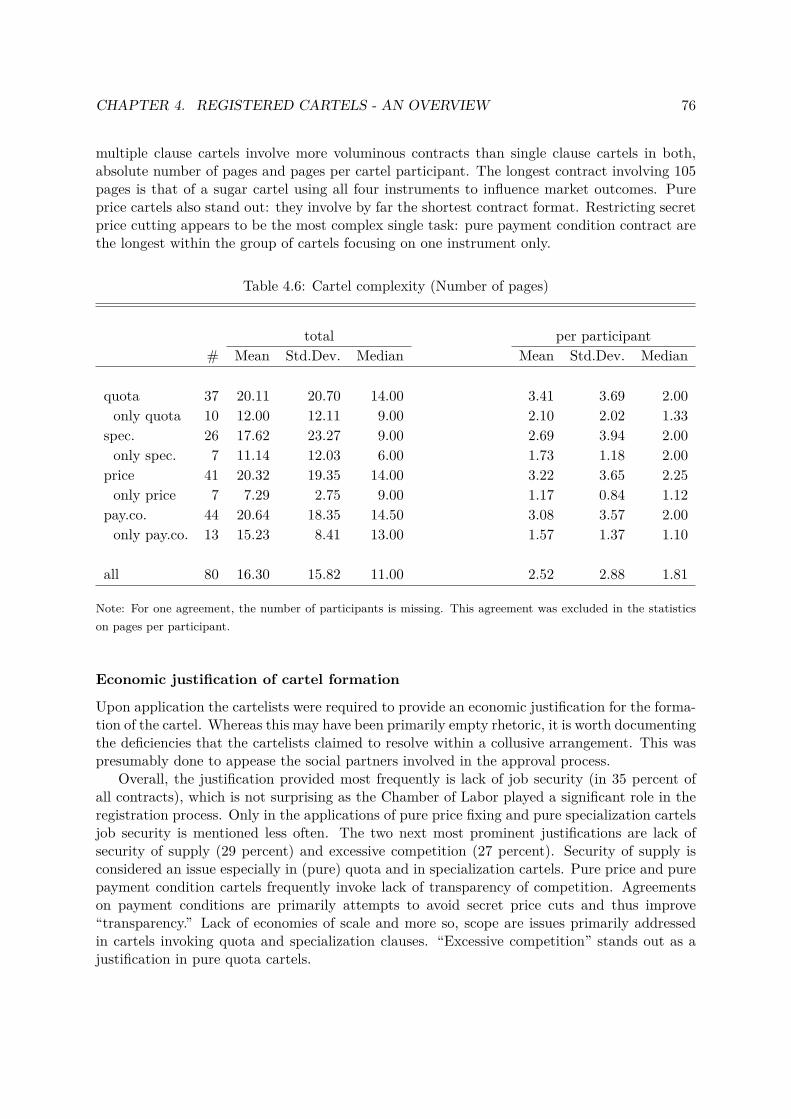
CHAPTER 4. REGISTERED CARTELS - AN OVERVIEW 76
multiple clause cartels involve more voluminous contracts than single clause cartels in both,absolute number of pages and pages per cartel participant. The longest contract involving 105pages is that of a sugar cartel using all four instruments to influence market outcomes. Pureprice cartels also stand out: they involve by far the shortest contract format. Restricting secretprice cutting appears to be the most complex single task: pure payment condition contract arethe longest within the group of cartels focusing on one instrument only.
Table 4.6: Cartel complexity (Number of pages)
total per participant# Mean Std.Dev. Median Mean Std.Dev. Median
quota 37 20.11 20.70 14.00 3.41 3.69 2.00only quota 10 12.00 12.11 9.00 2.10 2.02 1.33
spec. 26 17.62 23.27 9.00 2.69 3.94 2.00only spec. 7 11.14 12.03 6.00 1.73 1.18 2.00
price 41 20.32 19.35 14.00 3.22 3.65 2.25only price 7 7.29 2.75 9.00 1.17 0.84 1.12
pay.co. 44 20.64 18.35 14.50 3.08 3.57 2.00only pay.co. 13 15.23 8.41 13.00 1.57 1.37 1.10
all 80 16.30 15.82 11.00 2.52 2.88 1.81
Note: For one agreement, the number of participants is missing. This agreement was excluded in the statisticson pages per participant.
Economic justification of cartel formation
Upon application the cartelists were required to provide an economic justification for the forma-tion of the cartel. Whereas this may have been primarily empty rhetoric, it is worth documentingthe deficiencies that the cartelists claimed to resolve within a collusive arrangement. This waspresumably done to appease the social partners involved in the approval process.
Overall, the justification provided most frequently is lack of job security (in 35 percent ofall contracts), which is not surprising as the Chamber of Labor played a significant role in theregistration process. Only in the applications of pure price fixing and pure specialization cartelsjob security is mentioned less often. The two next most prominent justifications are lack ofsecurity of supply (29 percent) and excessive competition (27 percent). Security of supply isconsidered an issue especially in (pure) quota and in specialization cartels. Pure price and purepayment condition cartels frequently invoke lack of transparency of competition. Agreementson payment conditions are primarily attempts to avoid secret price cuts and thus improve“transparency.” Lack of economies of scale and more so, scope are issues primarily addressedin cartels invoking quota and specialization clauses. “Excessive competition” stands out as ajustification in pure quota cartels.
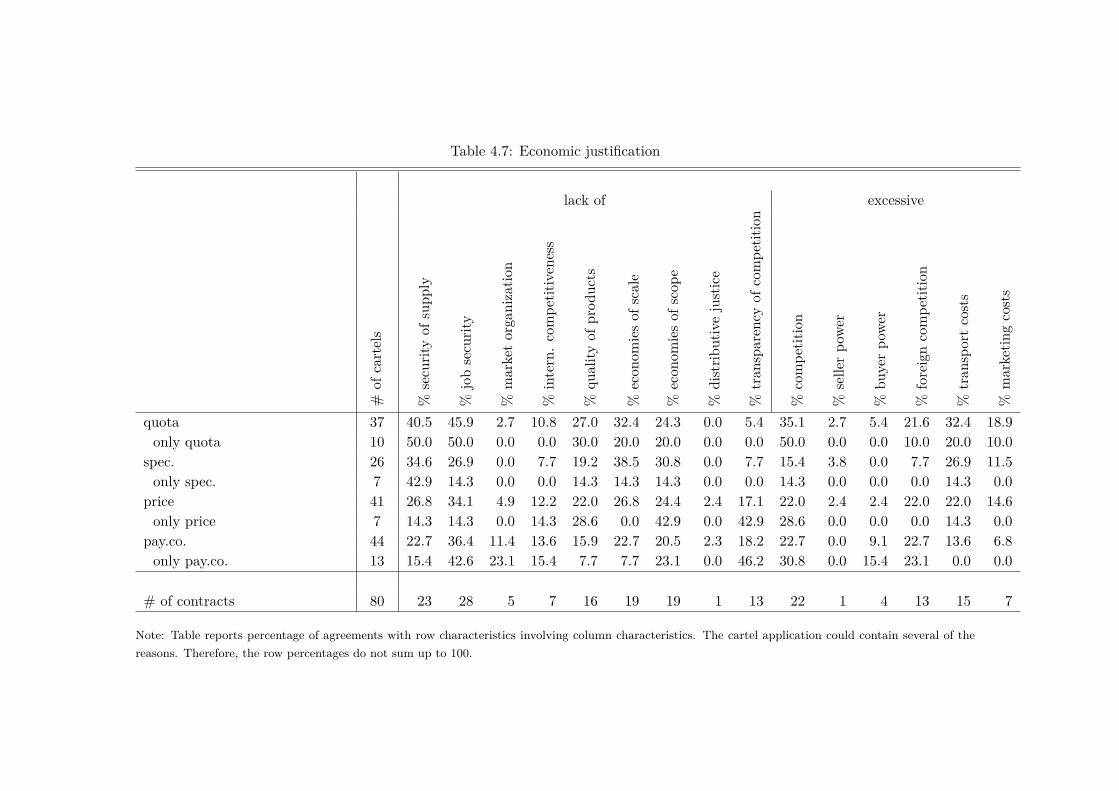
Table 4.7: Economic justification
lack of excessive
#of
cartels
%secu
rityof
supp
ly
%jobsecu
rity
%marketorga
nizatio
n
%intern.compe
titiven
ess
%qu
ality
ofprod
ucts
%econ
omiesof
scale
%econ
omiesof
scop
e
%distrib
utivejustice
%tran
sparen
cyof
compe
tition
%compe
tition
%selle
rpo
wer
%bu
yerpo
wer
%foreigncompe
tition
%tran
sportcosts
%marketin
gcosts
quota 37 40.5 45.9 2.7 10.8 27.0 32.4 24.3 0.0 5.4 35.1 2.7 5.4 21.6 32.4 18.9only quota 10 50.0 50.0 0.0 0.0 30.0 20.0 20.0 0.0 0.0 50.0 0.0 0.0 10.0 20.0 10.0
spec. 26 34.6 26.9 0.0 7.7 19.2 38.5 30.8 0.0 7.7 15.4 3.8 0.0 7.7 26.9 11.5only spec. 7 42.9 14.3 0.0 0.0 14.3 14.3 14.3 0.0 0.0 14.3 0.0 0.0 0.0 14.3 0.0
price 41 26.8 34.1 4.9 12.2 22.0 26.8 24.4 2.4 17.1 22.0 2.4 2.4 22.0 22.0 14.6only price 7 14.3 14.3 0.0 14.3 28.6 0.0 42.9 0.0 42.9 28.6 0.0 0.0 0.0 14.3 0.0
pay.co. 44 22.7 36.4 11.4 13.6 15.9 22.7 20.5 2.3 18.2 22.7 0.0 9.1 22.7 13.6 6.8only pay.co. 13 15.4 42.6 23.1 15.4 7.7 7.7 23.1 0.0 46.2 30.8 0.0 15.4 23.1 0.0 0.0
# of contracts 80 23 28 5 7 16 19 19 1 13 22 1 4 13 15 7
Note: Table reports percentage of agreements with row characteristics involving column characteristics. The cartel application could contain several of thereasons. Therefore, the row percentages do not sum up to 100.
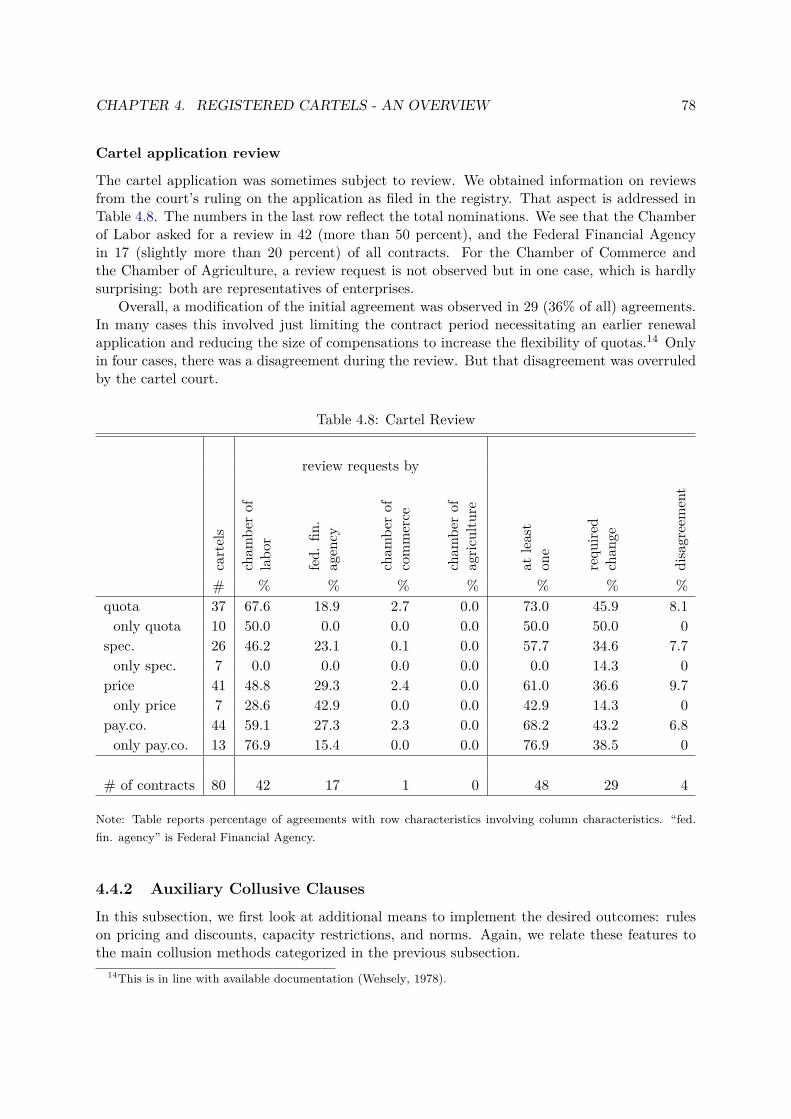
CHAPTER 4. REGISTERED CARTELS - AN OVERVIEW 78
Cartel application review
The cartel application was sometimes subject to review. We obtained information on reviewsfrom the court’s ruling on the application as filed in the registry. That aspect is addressed inTable 4.8. The numbers in the last row reflect the total nominations. We see that the Chamberof Labor asked for a review in 42 (more than 50 percent), and the Federal Financial Agencyin 17 (slightly more than 20 percent) of all contracts. For the Chamber of Commerce andthe Chamber of Agriculture, a review request is not observed but in one case, which is hardlysurprising: both are representatives of enterprises.
Overall, a modification of the initial agreement was observed in 29 (36% of all) agreements.In many cases this involved just limiting the contract period necessitating an earlier renewalapplication and reducing the size of compensations to increase the flexibility of quotas.14 Onlyin four cases, there was a disagreement during the review. But that disagreement was overruledby the cartel court.
Table 4.8: Cartel Review
review requests by
cartels
cham
berof
labo
r
fed.
fin.
agen
cy
cham
berof
commerce
cham
berof
agric
ulture
atleast
one
requ
ired
chan
ge
disagreement
# % % % % % % %quota 37 67.6 18.9 2.7 0.0 73.0 45.9 8.1only quota 10 50.0 0.0 0.0 0.0 50.0 50.0 0
spec. 26 46.2 23.1 0.1 0.0 57.7 34.6 7.7only spec. 7 0.0 0.0 0.0 0.0 0.0 14.3 0
price 41 48.8 29.3 2.4 0.0 61.0 36.6 9.7only price 7 28.6 42.9 0.0 0.0 42.9 14.3 0
pay.co. 44 59.1 27.3 2.3 0.0 68.2 43.2 6.8only pay.co. 13 76.9 15.4 0.0 0.0 76.9 38.5 0
# of contracts 80 42 17 1 0 48 29 4
Note: Table reports percentage of agreements with row characteristics involving column characteristics. “fed.fin. agency” is Federal Financial Agency.
4.4.2 Auxiliary Collusive Clauses
In this subsection, we first look at additional means to implement the desired outcomes: ruleson pricing and discounts, capacity restrictions, and norms. Again, we relate these features tothe main collusion methods categorized in the previous subsection.
14This is in line with available documentation (Wehsely, 1978).
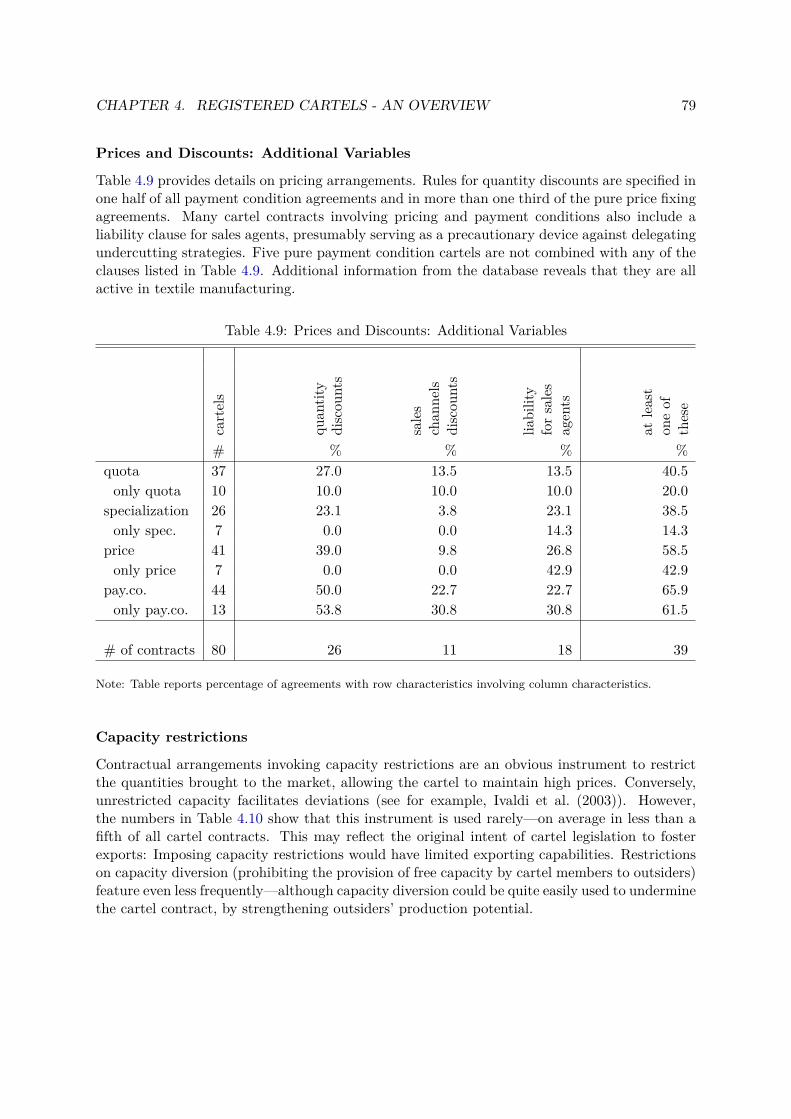
CHAPTER 4. REGISTERED CARTELS - AN OVERVIEW 79
Prices and Discounts: Additional Variables
Table 4.9 provides details on pricing arrangements. Rules for quantity discounts are specified inone half of all payment condition agreements and in more than one third of the pure price fixingagreements. Many cartel contracts involving pricing and payment conditions also include aliability clause for sales agents, presumably serving as a precautionary device against delegatingundercutting strategies. Five pure payment condition cartels are not combined with any of theclauses listed in Table 4.9. Additional information from the database reveals that they are allactive in textile manufacturing.
Table 4.9: Prices and Discounts: Additional Variables
cartels
quan
tity
discou
nts
sales
chan
nels
discou
nts
liability
forsales
agents
atleast
oneof
these
# % % % %quota 37 27.0 13.5 13.5 40.5only quota 10 10.0 10.0 10.0 20.0
specialization 26 23.1 3.8 23.1 38.5only spec. 7 0.0 0.0 14.3 14.3
price 41 39.0 9.8 26.8 58.5only price 7 0.0 0.0 42.9 42.9
pay.co. 44 50.0 22.7 22.7 65.9only pay.co. 13 53.8 30.8 30.8 61.5
# of contracts 80 26 11 18 39
Note: Table reports percentage of agreements with row characteristics involving column characteristics.
Capacity restrictions
Contractual arrangements invoking capacity restrictions are an obvious instrument to restrictthe quantities brought to the market, allowing the cartel to maintain high prices. Conversely,unrestricted capacity facilitates deviations (see for example, Ivaldi et al. (2003)). However,the numbers in Table 4.10 show that this instrument is used rarely—on average in less than afifth of all cartel contracts. This may reflect the original intent of cartel legislation to fosterexports: Imposing capacity restrictions would have limited exporting capabilities. Restrictionson capacity diversion (prohibiting the provision of free capacity by cartel members to outsiders)feature even less frequently—although capacity diversion could be quite easily used to underminethe cartel contract, by strengthening outsiders’ production potential.
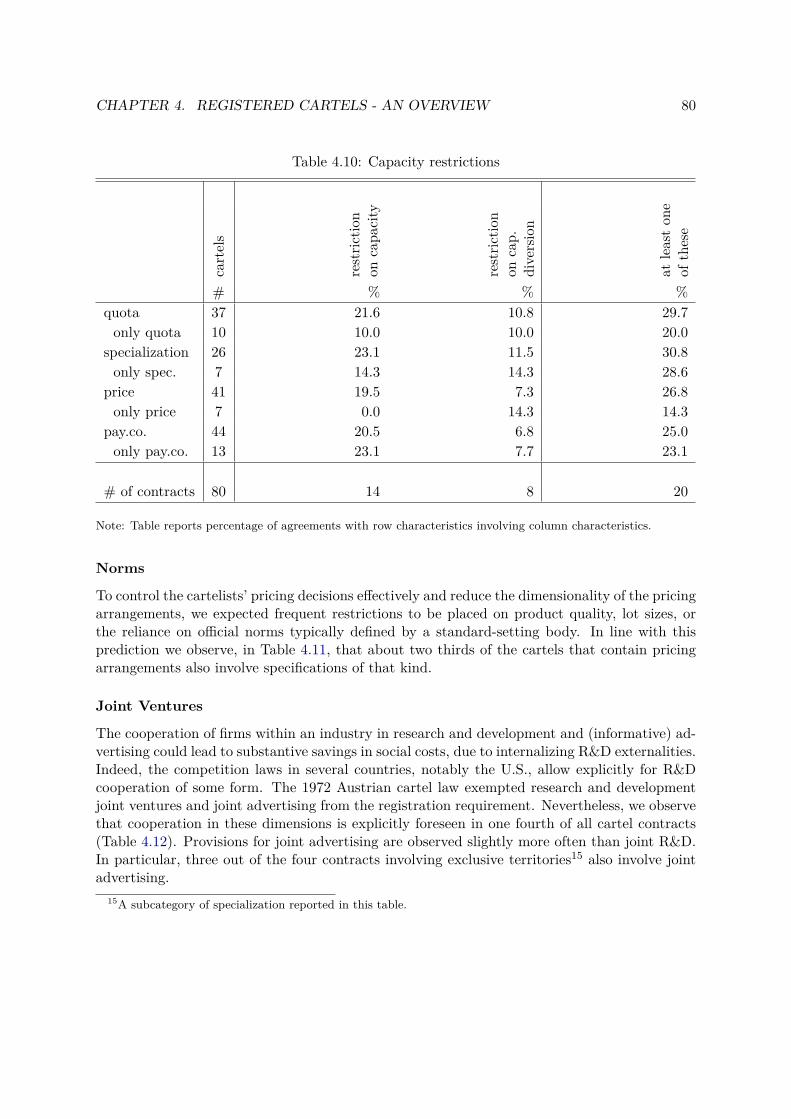
CHAPTER 4. REGISTERED CARTELS - AN OVERVIEW 80
Table 4.10: Capacity restrictions
cartels
restric
tion
oncapa
city
restric
tion
oncap.
diversion
atleaston
eof
these
# % % %quota 37 21.6 10.8 29.7only quota 10 10.0 10.0 20.0
specialization 26 23.1 11.5 30.8only spec. 7 14.3 14.3 28.6
price 41 19.5 7.3 26.8only price 7 0.0 14.3 14.3
pay.co. 44 20.5 6.8 25.0only pay.co. 13 23.1 7.7 23.1
# of contracts 80 14 8 20
Note: Table reports percentage of agreements with row characteristics involving column characteristics.
Norms
To control the cartelists’ pricing decisions effectively and reduce the dimensionality of the pricingarrangements, we expected frequent restrictions to be placed on product quality, lot sizes, orthe reliance on official norms typically defined by a standard-setting body. In line with thisprediction we observe, in Table 4.11, that about two thirds of the cartels that contain pricingarrangements also involve specifications of that kind.
Joint Ventures
The cooperation of firms within an industry in research and development and (informative) ad-vertising could lead to substantive savings in social costs, due to internalizing R&D externalities.Indeed, the competition laws in several countries, notably the U.S., allow explicitly for R&Dcooperation of some form. The 1972 Austrian cartel law exempted research and developmentjoint ventures and joint advertising from the registration requirement. Nevertheless, we observethat cooperation in these dimensions is explicitly foreseen in one fourth of all cartel contracts(Table 4.12). Provisions for joint advertising are observed slightly more often than joint R&D.In particular, three out of the four contracts involving exclusive territories15 also involve jointadvertising.
15A subcategory of specialization reported in this table.
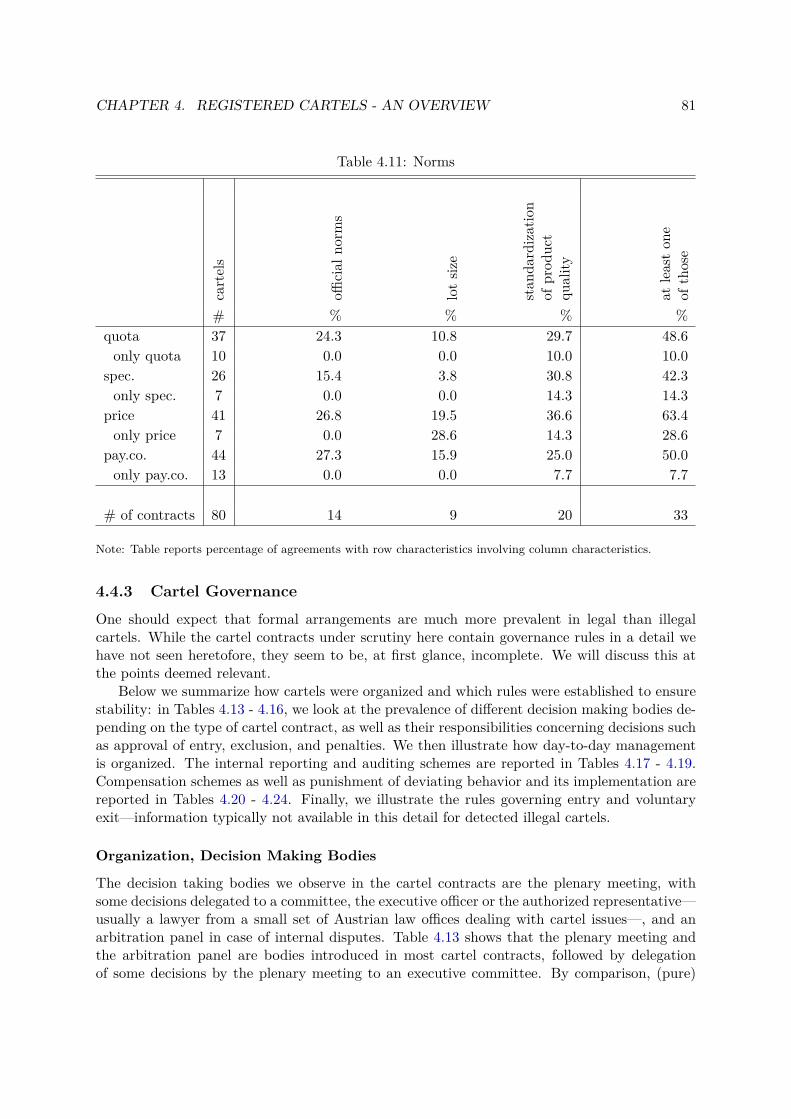
CHAPTER 4. REGISTERED CARTELS - AN OVERVIEW 81
Table 4.11: Norms
cartels
official
norm
s
lotsiz
e
stan
dardization
ofprod
uct
quality
atleaston
eof
those
# % % % %quota 37 24.3 10.8 29.7 48.6only quota 10 0.0 0.0 10.0 10.0
spec. 26 15.4 3.8 30.8 42.3only spec. 7 0.0 0.0 14.3 14.3
price 41 26.8 19.5 36.6 63.4only price 7 0.0 28.6 14.3 28.6
pay.co. 44 27.3 15.9 25.0 50.0only pay.co. 13 0.0 0.0 7.7 7.7
# of contracts 80 14 9 20 33
Note: Table reports percentage of agreements with row characteristics involving column characteristics.
4.4.3 Cartel Governance
One should expect that formal arrangements are much more prevalent in legal than illegalcartels. While the cartel contracts under scrutiny here contain governance rules in a detail wehave not seen heretofore, they seem to be, at first glance, incomplete. We will discuss this atthe points deemed relevant.
Below we summarize how cartels were organized and which rules were established to ensurestability: in Tables 4.13 - 4.16, we look at the prevalence of different decision making bodies de-pending on the type of cartel contract, as well as their responsibilities concerning decisions suchas approval of entry, exclusion, and penalties. We then illustrate how day-to-day managementis organized. The internal reporting and auditing schemes are reported in Tables 4.17 - 4.19.Compensation schemes as well as punishment of deviating behavior and its implementation arereported in Tables 4.20 - 4.24. Finally, we illustrate the rules governing entry and voluntaryexit—information typically not available in this detail for detected illegal cartels.
Organization, Decision Making Bodies
The decision taking bodies we observe in the cartel contracts are the plenary meeting, withsome decisions delegated to a committee, the executive officer or the authorized representative—usually a lawyer from a small set of Austrian law offices dealing with cartel issues—, and anarbitration panel in case of internal disputes. Table 4.13 shows that the plenary meeting andthe arbitration panel are bodies introduced in most cartel contracts, followed by delegationof some decisions by the plenary meeting to an executive committee. By comparison, (pure)
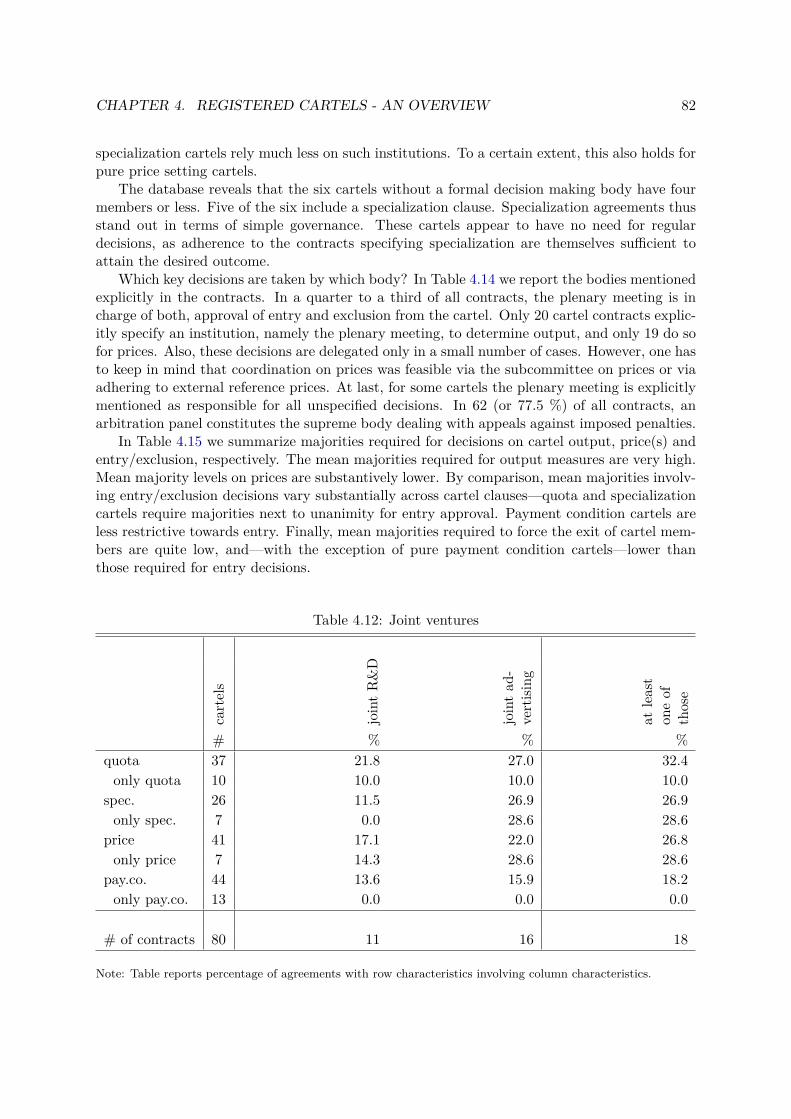
CHAPTER 4. REGISTERED CARTELS - AN OVERVIEW 82
specialization cartels rely much less on such institutions. To a certain extent, this also holds forpure price setting cartels.
The database reveals that the six cartels without a formal decision making body have fourmembers or less. Five of the six include a specialization clause. Specialization agreements thusstand out in terms of simple governance. These cartels appear to have no need for regulardecisions, as adherence to the contracts specifying specialization are themselves sufficient toattain the desired outcome.
Which key decisions are taken by which body? In Table 4.14 we report the bodies mentionedexplicitly in the contracts. In a quarter to a third of all contracts, the plenary meeting is incharge of both, approval of entry and exclusion from the cartel. Only 20 cartel contracts explic-itly specify an institution, namely the plenary meeting, to determine output, and only 19 do sofor prices. Also, these decisions are delegated only in a small number of cases. However, one hasto keep in mind that coordination on prices was feasible via the subcommittee on prices or viaadhering to external reference prices. At last, for some cartels the plenary meeting is explicitlymentioned as responsible for all unspecified decisions. In 62 (or 77.5 %) of all contracts, anarbitration panel constitutes the supreme body dealing with appeals against imposed penalties.
In Table 4.15 we summarize majorities required for decisions on cartel output, price(s) andentry/exclusion, respectively. The mean majorities required for output measures are very high.Mean majority levels on prices are substantively lower. By comparison, mean majorities involv-ing entry/exclusion decisions vary substantially across cartel clauses—quota and specializationcartels require majorities next to unanimity for entry approval. Payment condition cartels areless restrictive towards entry. Finally, mean majorities required to force the exit of cartel mem-bers are quite low, and—with the exception of pure payment condition cartels—lower thanthose required for entry decisions.
Table 4.12: Joint ventures
cartels
jointR&D
jointad
-vertising
atleast
oneof
those
# % % %quota 37 21.8 27.0 32.4only quota 10 10.0 10.0 10.0
spec. 26 11.5 26.9 26.9only spec. 7 0.0 28.6 28.6
price 41 17.1 22.0 26.8only price 7 14.3 28.6 28.6
pay.co. 44 13.6 15.9 18.2only pay.co. 13 0.0 0.0 0.0
# of contracts 80 11 16 18
Note: Table reports percentage of agreements with row characteristics involving column characteristics.
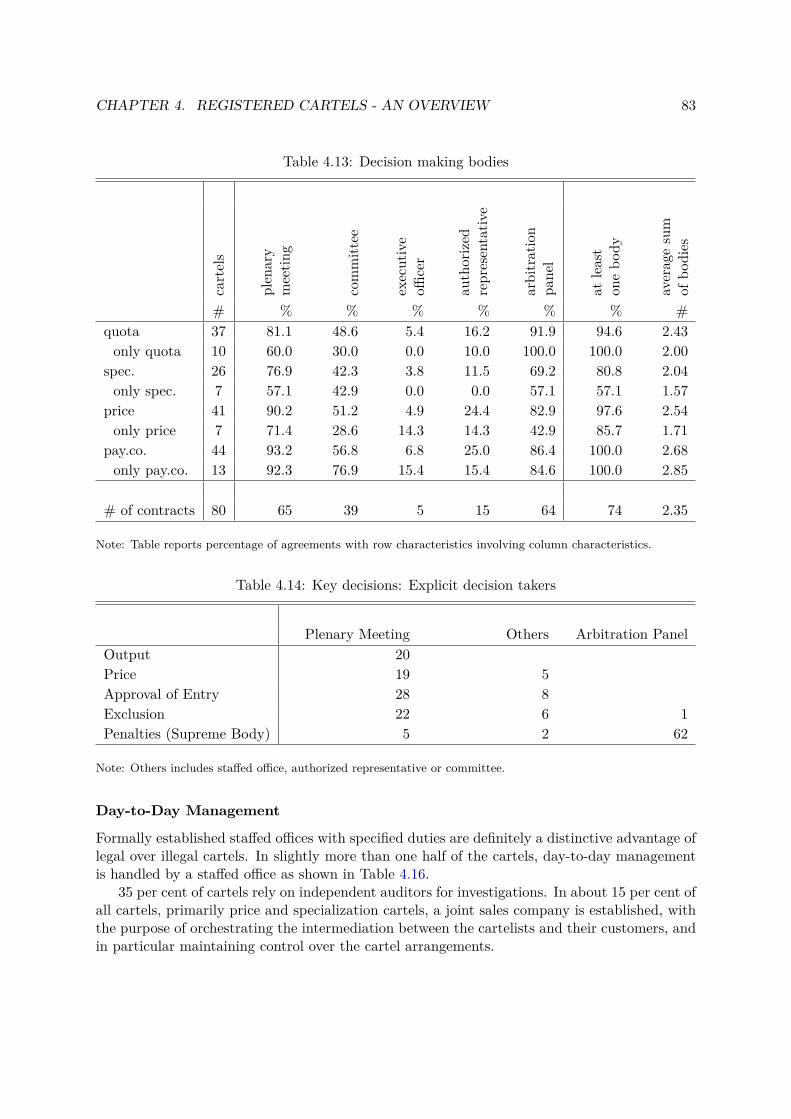
CHAPTER 4. REGISTERED CARTELS - AN OVERVIEW 83
Table 4.13: Decision making bodies
cartels
plen
ary
meetin
g
committ
ee
executive
officer
authorized
representativ
e
arbitration
pane
l
atleast
onebo
dy
averag
esum
ofbo
dies
# % % % % % % #quota 37 81.1 48.6 5.4 16.2 91.9 94.6 2.43only quota 10 60.0 30.0 0.0 10.0 100.0 100.0 2.00
spec. 26 76.9 42.3 3.8 11.5 69.2 80.8 2.04only spec. 7 57.1 42.9 0.0 0.0 57.1 57.1 1.57
price 41 90.2 51.2 4.9 24.4 82.9 97.6 2.54only price 7 71.4 28.6 14.3 14.3 42.9 85.7 1.71
pay.co. 44 93.2 56.8 6.8 25.0 86.4 100.0 2.68only pay.co. 13 92.3 76.9 15.4 15.4 84.6 100.0 2.85
# of contracts 80 65 39 5 15 64 74 2.35
Note: Table reports percentage of agreements with row characteristics involving column characteristics.
Table 4.14: Key decisions: Explicit decision takers
Plenary Meeting Others Arbitration PanelOutput 20Price 19 5Approval of Entry 28 8Exclusion 22 6 1Penalties (Supreme Body) 5 2 62
Note: Others includes staffed office, authorized representative or committee.
Day-to-Day Management
Formally established staffed offices with specified duties are definitely a distinctive advantage oflegal over illegal cartels. In slightly more than one half of the cartels, day-to-day managementis handled by a staffed office as shown in Table 4.16.
35 per cent of cartels rely on independent auditors for investigations. In about 15 per cent ofall cartels, primarily price and specialization cartels, a joint sales company is established, withthe purpose of orchestrating the intermediation between the cartelists and their customers, andin particular maintaining control over the cartel arrangements.
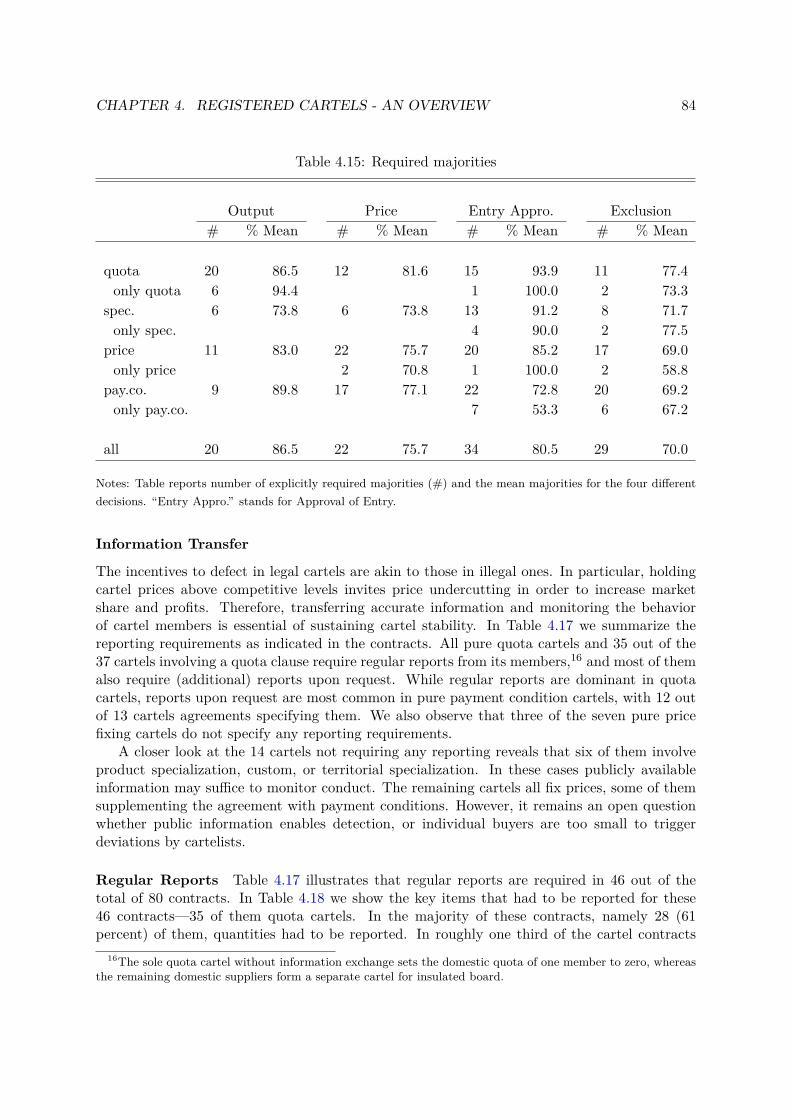
CHAPTER 4. REGISTERED CARTELS - AN OVERVIEW 84
Table 4.15: Required majorities
Output Price Entry Appro. Exclusion# % Mean # % Mean # % Mean # % Mean
quota 20 86.5 12 81.6 15 93.9 11 77.4only quota 6 94.4 1 100.0 2 73.3
spec. 6 73.8 6 73.8 13 91.2 8 71.7only spec. 4 90.0 2 77.5
price 11 83.0 22 75.7 20 85.2 17 69.0only price 2 70.8 1 100.0 2 58.8
pay.co. 9 89.8 17 77.1 22 72.8 20 69.2only pay.co. 7 53.3 6 67.2
all 20 86.5 22 75.7 34 80.5 29 70.0
Notes: Table reports number of explicitly required majorities (#) and the mean majorities for the four differentdecisions. “Entry Appro.” stands for Approval of Entry.
Information Transfer
The incentives to defect in legal cartels are akin to those in illegal ones. In particular, holdingcartel prices above competitive levels invites price undercutting in order to increase marketshare and profits. Therefore, transferring accurate information and monitoring the behaviorof cartel members is essential of sustaining cartel stability. In Table 4.17 we summarize thereporting requirements as indicated in the contracts. All pure quota cartels and 35 out of the37 cartels involving a quota clause require regular reports from its members,16 and most of themalso require (additional) reports upon request. While regular reports are dominant in quotacartels, reports upon request are most common in pure payment condition cartels, with 12 outof 13 cartels agreements specifying them. We also observe that three of the seven pure pricefixing cartels do not specify any reporting requirements.
A closer look at the 14 cartels not requiring any reporting reveals that six of them involveproduct specialization, custom, or territorial specialization. In these cases publicly availableinformation may suffice to monitor conduct. The remaining cartels all fix prices, some of themsupplementing the agreement with payment conditions. However, it remains an open questionwhether public information enables detection, or individual buyers are too small to triggerdeviations by cartelists.
Regular Reports Table 4.17 illustrates that regular reports are required in 46 out of thetotal of 80 contracts. In Table 4.18 we show the key items that had to be reported for these46 contracts—35 of them quota cartels. In the majority of these contracts, namely 28 (61percent) of them, quantities had to be reported. In roughly one third of the cartel contracts
16The sole quota cartel without information exchange sets the domestic quota of one member to zero, whereasthe remaining domestic suppliers form a separate cartel for insulated board.
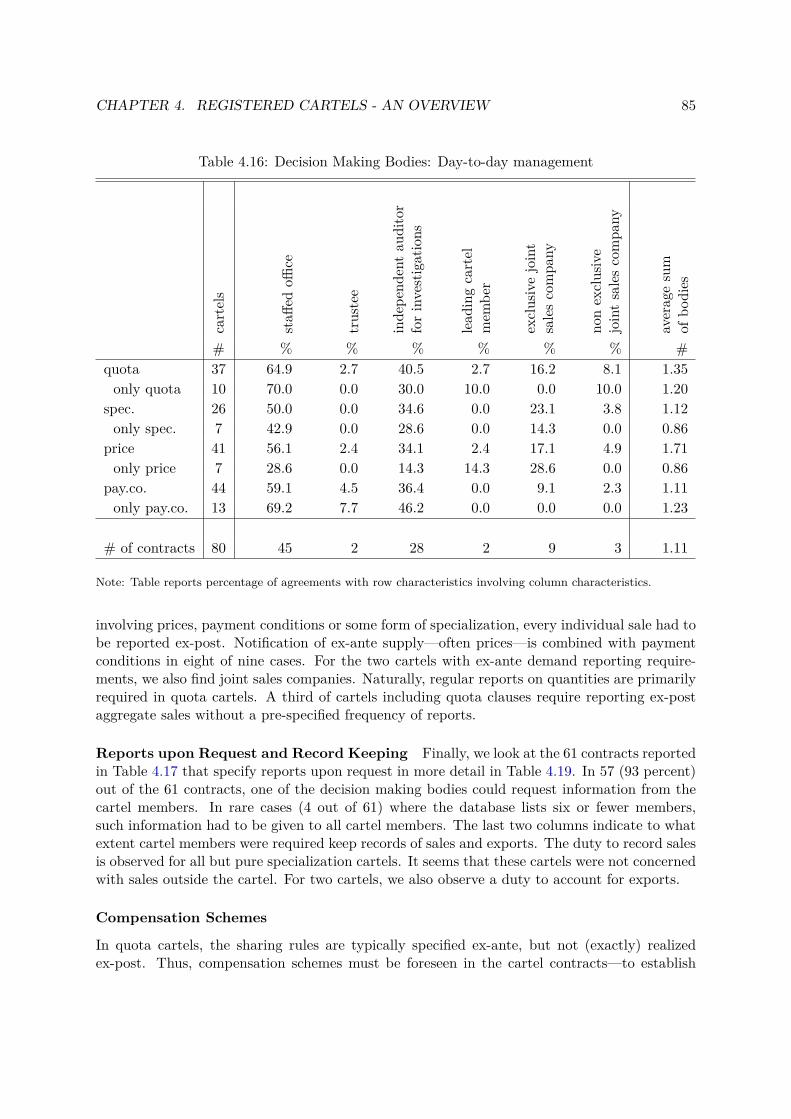
CHAPTER 4. REGISTERED CARTELS - AN OVERVIEW 85
Table 4.16: Decision Making Bodies: Day-to-day management
cartels
staff
edoffi
ce
trustee
inde
pend
entau
ditor
forinvestigations
lead
ingcartel
mem
ber
exclusivejoint
salescompa
ny
nonexclusive
jointsalescompa
ny
averag
esum
ofbo
dies
# % % % % % % #quota 37 64.9 2.7 40.5 2.7 16.2 8.1 1.35only quota 10 70.0 0.0 30.0 10.0 0.0 10.0 1.20
spec. 26 50.0 0.0 34.6 0.0 23.1 3.8 1.12only spec. 7 42.9 0.0 28.6 0.0 14.3 0.0 0.86
price 41 56.1 2.4 34.1 2.4 17.1 4.9 1.71only price 7 28.6 0.0 14.3 14.3 28.6 0.0 0.86
pay.co. 44 59.1 4.5 36.4 0.0 9.1 2.3 1.11only pay.co. 13 69.2 7.7 46.2 0.0 0.0 0.0 1.23
# of contracts 80 45 2 28 2 9 3 1.11
Note: Table reports percentage of agreements with row characteristics involving column characteristics.
involving prices, payment conditions or some form of specialization, every individual sale had tobe reported ex-post. Notification of ex-ante supply—often prices—is combined with paymentconditions in eight of nine cases. For the two cartels with ex-ante demand reporting require-ments, we also find joint sales companies. Naturally, regular reports on quantities are primarilyrequired in quota cartels. A third of cartels including quota clauses require reporting ex-postaggregate sales without a pre-specified frequency of reports.
Reports upon Request and Record Keeping Finally, we look at the 61 contracts reportedin Table 4.17 that specify reports upon request in more detail in Table 4.19. In 57 (93 percent)out of the 61 contracts, one of the decision making bodies could request information from thecartel members. In rare cases (4 out of 61) where the database lists six or fewer members,such information had to be given to all cartel members. The last two columns indicate to whatextent cartel members were required keep records of sales and exports. The duty to record salesis observed for all but pure specialization cartels. It seems that these cartels were not concernedwith sales outside the cartel. For two cartels, we also observe a duty to account for exports.
Compensation Schemes
In quota cartels, the sharing rules are typically specified ex-ante, but not (exactly) realizedex-post. Thus, compensation schemes must be foreseen in the cartel contracts—to establish
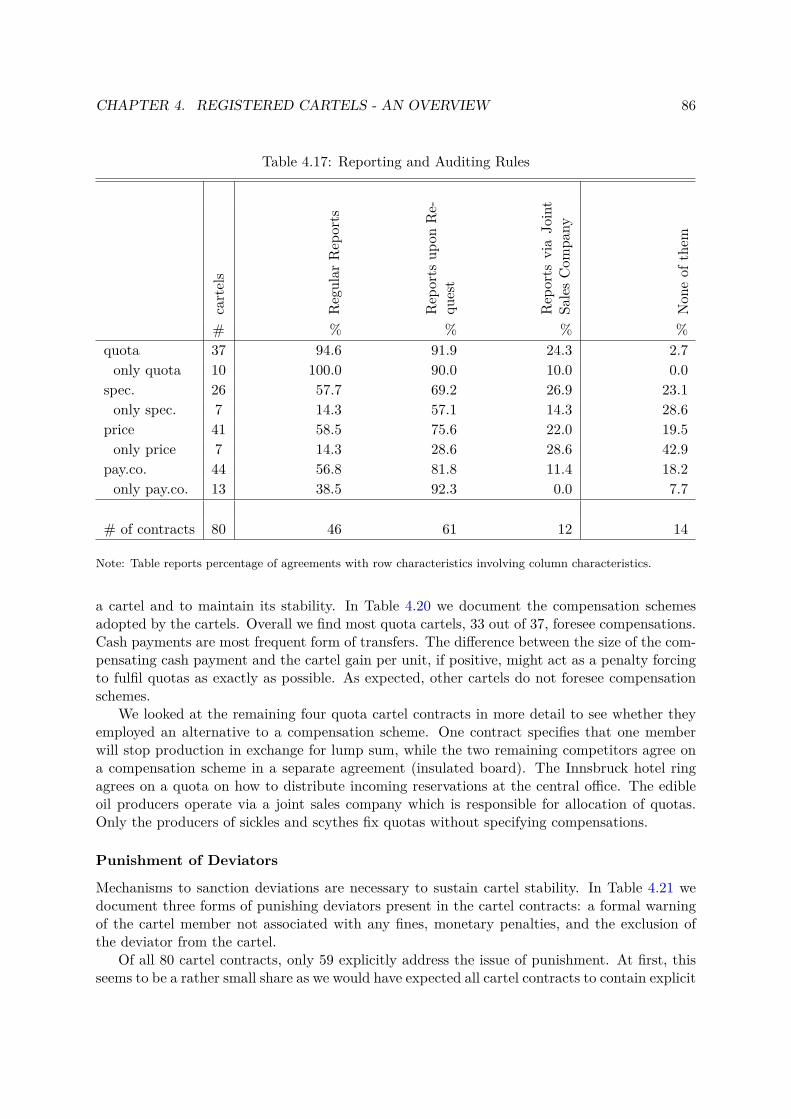
CHAPTER 4. REGISTERED CARTELS - AN OVERVIEW 86
Table 4.17: Reporting and Auditing Rules
cartels
Regular
Rep
orts
Rep
orts
upon
Re-
quest
Rep
orts
viaJo
int
SalesCom
pany
Non
eof
them
# % % % %quota 37 94.6 91.9 24.3 2.7only quota 10 100.0 90.0 10.0 0.0
spec. 26 57.7 69.2 26.9 23.1only spec. 7 14.3 57.1 14.3 28.6
price 41 58.5 75.6 22.0 19.5only price 7 14.3 28.6 28.6 42.9
pay.co. 44 56.8 81.8 11.4 18.2only pay.co. 13 38.5 92.3 0.0 7.7
# of contracts 80 46 61 12 14
Note: Table reports percentage of agreements with row characteristics involving column characteristics.
a cartel and to maintain its stability. In Table 4.20 we document the compensation schemesadopted by the cartels. Overall we find most quota cartels, 33 out of 37, foresee compensations.Cash payments are most frequent form of transfers. The difference between the size of the com-pensating cash payment and the cartel gain per unit, if positive, might act as a penalty forcingto fulfil quotas as exactly as possible. As expected, other cartels do not foresee compensationschemes.
We looked at the remaining four quota cartel contracts in more detail to see whether theyemployed an alternative to a compensation scheme. One contract specifies that one memberwill stop production in exchange for lump sum, while the two remaining competitors agree ona compensation scheme in a separate agreement (insulated board). The Innsbruck hotel ringagrees on a quota on how to distribute incoming reservations at the central office. The edibleoil producers operate via a joint sales company which is responsible for allocation of quotas.Only the producers of sickles and scythes fix quotas without specifying compensations.
Punishment of Deviators
Mechanisms to sanction deviations are necessary to sustain cartel stability. In Table 4.21 wedocument three forms of punishing deviators present in the cartel contracts: a formal warningof the cartel member not associated with any fines, monetary penalties, and the exclusion ofthe deviator from the cartel.
Of all 80 cartel contracts, only 59 explicitly address the issue of punishment. At first, thisseems to be a rather small share as we would have expected all cartel contracts to contain explicit
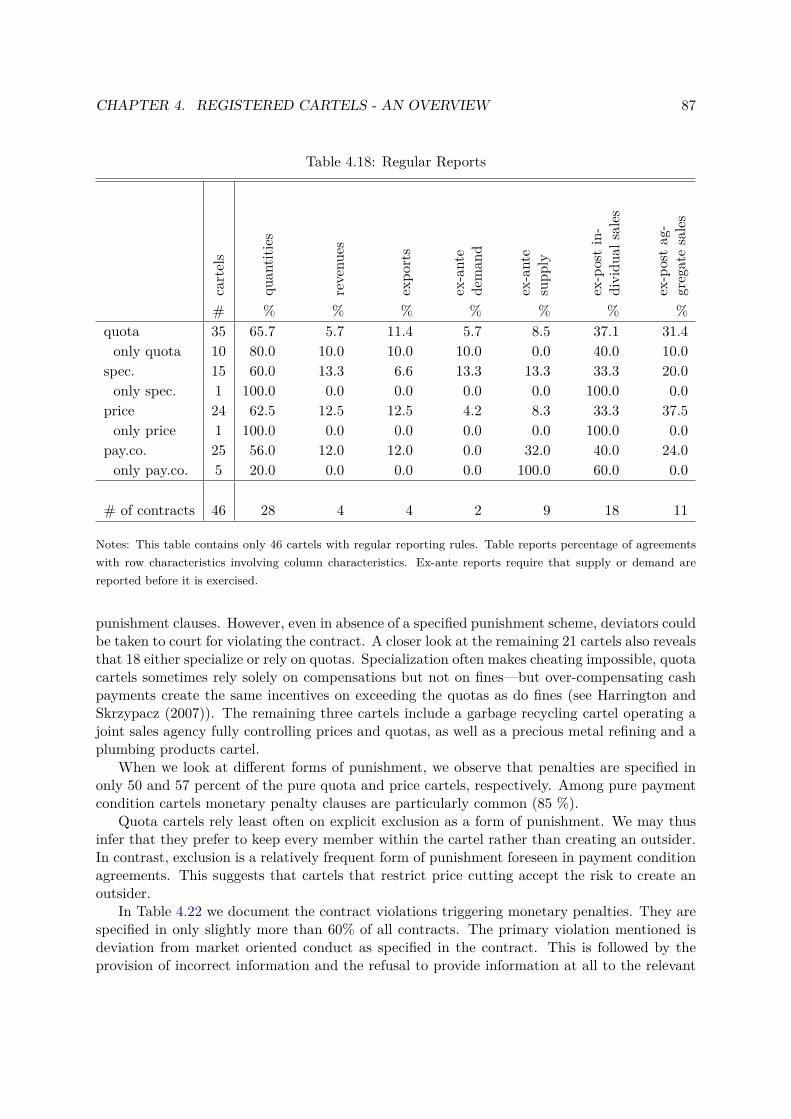
CHAPTER 4. REGISTERED CARTELS - AN OVERVIEW 87
Table 4.18: Regular Reports
cartels
quan
tities
revenu
es
expo
rts
ex-ante
deman
d
ex-ante
supp
ly
ex-postin-
dividu
alsales
ex-postag
-gregatesales
# % % % % % % %quota 35 65.7 5.7 11.4 5.7 8.5 37.1 31.4only quota 10 80.0 10.0 10.0 10.0 0.0 40.0 10.0
spec. 15 60.0 13.3 6.6 13.3 13.3 33.3 20.0only spec. 1 100.0 0.0 0.0 0.0 0.0 100.0 0.0
price 24 62.5 12.5 12.5 4.2 8.3 33.3 37.5only price 1 100.0 0.0 0.0 0.0 0.0 100.0 0.0
pay.co. 25 56.0 12.0 12.0 0.0 32.0 40.0 24.0only pay.co. 5 20.0 0.0 0.0 0.0 100.0 60.0 0.0
# of contracts 46 28 4 4 2 9 18 11
Notes: This table contains only 46 cartels with regular reporting rules. Table reports percentage of agreementswith row characteristics involving column characteristics. Ex-ante reports require that supply or demand arereported before it is exercised.
punishment clauses. However, even in absence of a specified punishment scheme, deviators couldbe taken to court for violating the contract. A closer look at the remaining 21 cartels also revealsthat 18 either specialize or rely on quotas. Specialization often makes cheating impossible, quotacartels sometimes rely solely on compensations but not on fines—but over-compensating cashpayments create the same incentives on exceeding the quotas as do fines (see Harrington andSkrzypacz (2007)). The remaining three cartels include a garbage recycling cartel operating ajoint sales agency fully controlling prices and quotas, as well as a precious metal refining and aplumbing products cartel.
When we look at different forms of punishment, we observe that penalties are specified inonly 50 and 57 percent of the pure quota and price cartels, respectively. Among pure paymentcondition cartels monetary penalty clauses are particularly common (85 %).
Quota cartels rely least often on explicit exclusion as a form of punishment. We may thusinfer that they prefer to keep every member within the cartel rather than creating an outsider.In contrast, exclusion is a relatively frequent form of punishment foreseen in payment conditionagreements. This suggests that cartels that restrict price cutting accept the risk to create anoutsider.
In Table 4.22 we document the contract violations triggering monetary penalties. They arespecified in only slightly more than 60% of all contracts. The primary violation mentioned isdeviation from market oriented conduct as specified in the contract. This is followed by theprovision of incorrect information and the refusal to provide information at all to the relevant
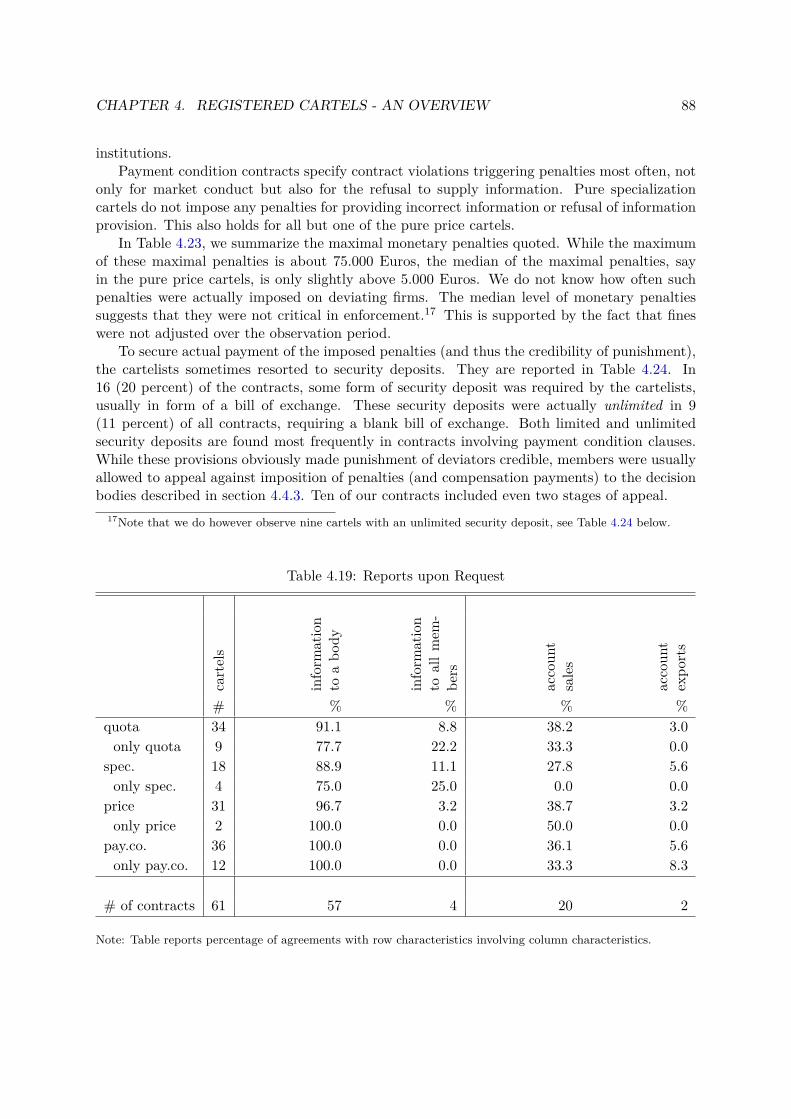
CHAPTER 4. REGISTERED CARTELS - AN OVERVIEW 88
institutions.Payment condition contracts specify contract violations triggering penalties most often, not
only for market conduct but also for the refusal to supply information. Pure specializationcartels do not impose any penalties for providing incorrect information or refusal of informationprovision. This also holds for all but one of the pure price cartels.
In Table 4.23, we summarize the maximal monetary penalties quoted. While the maximumof these maximal penalties is about 75.000 Euros, the median of the maximal penalties, sayin the pure price cartels, is only slightly above 5.000 Euros. We do not know how often suchpenalties were actually imposed on deviating firms. The median level of monetary penaltiessuggests that they were not critical in enforcement.17 This is supported by the fact that fineswere not adjusted over the observation period.
To secure actual payment of the imposed penalties (and thus the credibility of punishment),the cartelists sometimes resorted to security deposits. They are reported in Table 4.24. In16 (20 percent) of the contracts, some form of security deposit was required by the cartelists,usually in form of a bill of exchange. These security deposits were actually unlimited in 9(11 percent) of all contracts, requiring a blank bill of exchange. Both limited and unlimitedsecurity deposits are found most frequently in contracts involving payment condition clauses.While these provisions obviously made punishment of deviators credible, members were usuallyallowed to appeal against imposition of penalties (and compensation payments) to the decisionbodies described in section 4.4.3. Ten of our contracts included even two stages of appeal.
17Note that we do however observe nine cartels with an unlimited security deposit, see Table 4.24 below.
Table 4.19: Reports upon Request
cartels
inform
ation
toabo
dy
inform
ation
toallm
em-
bers
accoun
tsales
accoun
texpo
rts
# % % % %quota 34 91.1 8.8 38.2 3.0only quota 9 77.7 22.2 33.3 0.0
spec. 18 88.9 11.1 27.8 5.6only spec. 4 75.0 25.0 0.0 0.0
price 31 96.7 3.2 38.7 3.2only price 2 100.0 0.0 50.0 0.0
pay.co. 36 100.0 0.0 36.1 5.6only pay.co. 12 100.0 0.0 33.3 8.3
# of contracts 61 57 4 20 2
Note: Table reports percentage of agreements with row characteristics involving column characteristics.
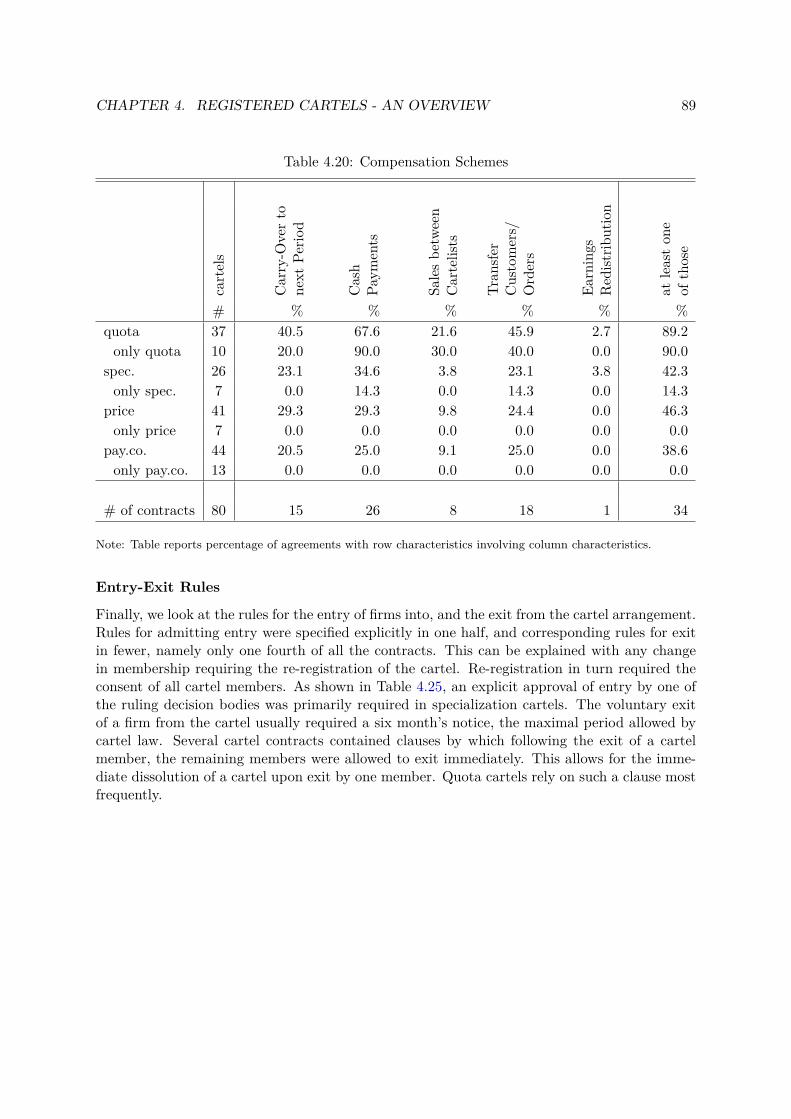
CHAPTER 4. REGISTERED CARTELS - AN OVERVIEW 89
Table 4.20: Compensation Schemes
cartels
Carry-O
verto
next
Perio
d
Cash
Paym
ents
Salesbe
tween
Cartelists
Tran
sfer
Customers/
Orders
Earnings
Red
istrib
ution
atleaston
eof
those
# % % % % % %quota 37 40.5 67.6 21.6 45.9 2.7 89.2only quota 10 20.0 90.0 30.0 40.0 0.0 90.0
spec. 26 23.1 34.6 3.8 23.1 3.8 42.3only spec. 7 0.0 14.3 0.0 14.3 0.0 14.3
price 41 29.3 29.3 9.8 24.4 0.0 46.3only price 7 0.0 0.0 0.0 0.0 0.0 0.0
pay.co. 44 20.5 25.0 9.1 25.0 0.0 38.6only pay.co. 13 0.0 0.0 0.0 0.0 0.0 0.0
# of contracts 80 15 26 8 18 1 34
Note: Table reports percentage of agreements with row characteristics involving column characteristics.
Entry-Exit Rules
Finally, we look at the rules for the entry of firms into, and the exit from the cartel arrangement.Rules for admitting entry were specified explicitly in one half, and corresponding rules for exitin fewer, namely only one fourth of all the contracts. This can be explained with any changein membership requiring the re-registration of the cartel. Re-registration in turn required theconsent of all cartel members. As shown in Table 4.25, an explicit approval of entry by one ofthe ruling decision bodies was primarily required in specialization cartels. The voluntary exitof a firm from the cartel usually required a six month’s notice, the maximal period allowed bycartel law. Several cartel contracts contained clauses by which following the exit of a cartelmember, the remaining members were allowed to exit immediately. This allows for the imme-diate dissolution of a cartel upon exit by one member. Quota cartels rely on such a clause mostfrequently.
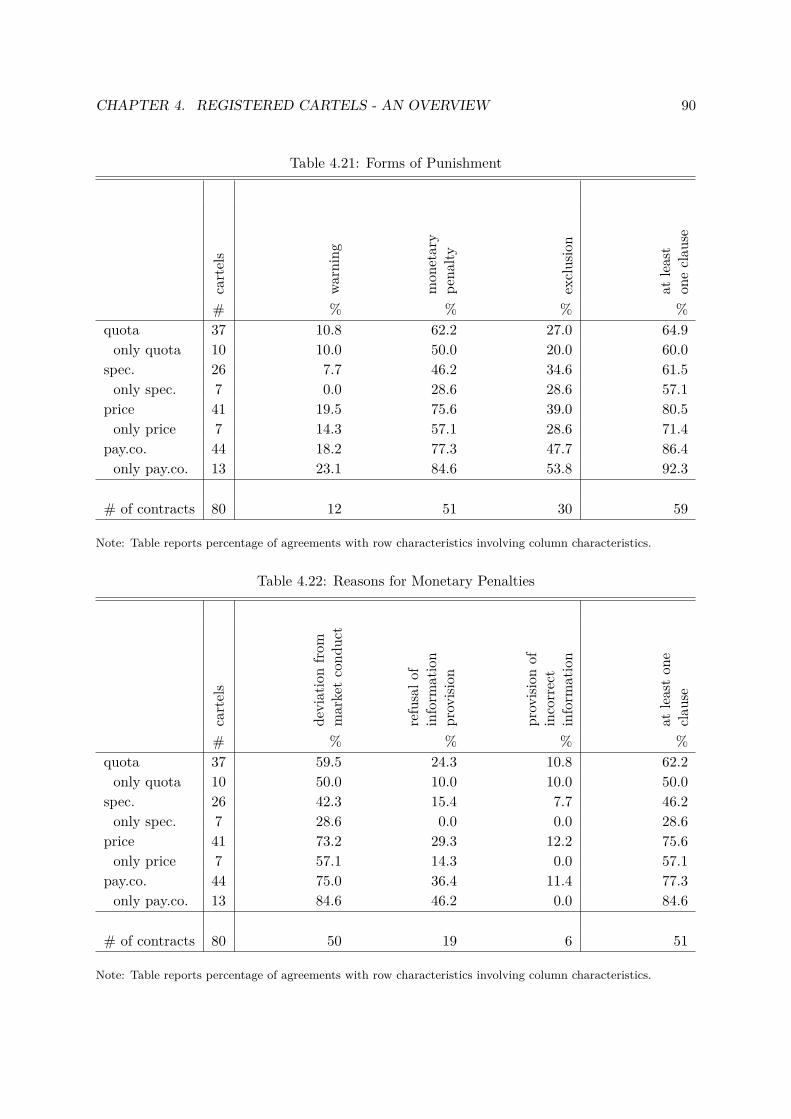
CHAPTER 4. REGISTERED CARTELS - AN OVERVIEW 90
Table 4.21: Forms of Punishment
cartels
warning
mon
etary
pena
lty
exclusion
atleast
oneclau
se
# % % % %quota 37 10.8 62.2 27.0 64.9only quota 10 10.0 50.0 20.0 60.0
spec. 26 7.7 46.2 34.6 61.5only spec. 7 0.0 28.6 28.6 57.1
price 41 19.5 75.6 39.0 80.5only price 7 14.3 57.1 28.6 71.4
pay.co. 44 18.2 77.3 47.7 86.4only pay.co. 13 23.1 84.6 53.8 92.3
# of contracts 80 12 51 30 59
Note: Table reports percentage of agreements with row characteristics involving column characteristics.
Table 4.22: Reasons for Monetary Penalties
cartels
deviationfro
mmarketcond
uct
refusalo
finform
ation
provision
provision
ofincorrect
inform
ation
atleaston
eclau
se
# % % % %quota 37 59.5 24.3 10.8 62.2only quota 10 50.0 10.0 10.0 50.0
spec. 26 42.3 15.4 7.7 46.2only spec. 7 28.6 0.0 0.0 28.6
price 41 73.2 29.3 12.2 75.6only price 7 57.1 14.3 0.0 57.1
pay.co. 44 75.0 36.4 11.4 77.3only pay.co. 13 84.6 46.2 0.0 84.6
# of contracts 80 50 19 6 51
Note: Table reports percentage of agreements with row characteristics involving column characteristics.
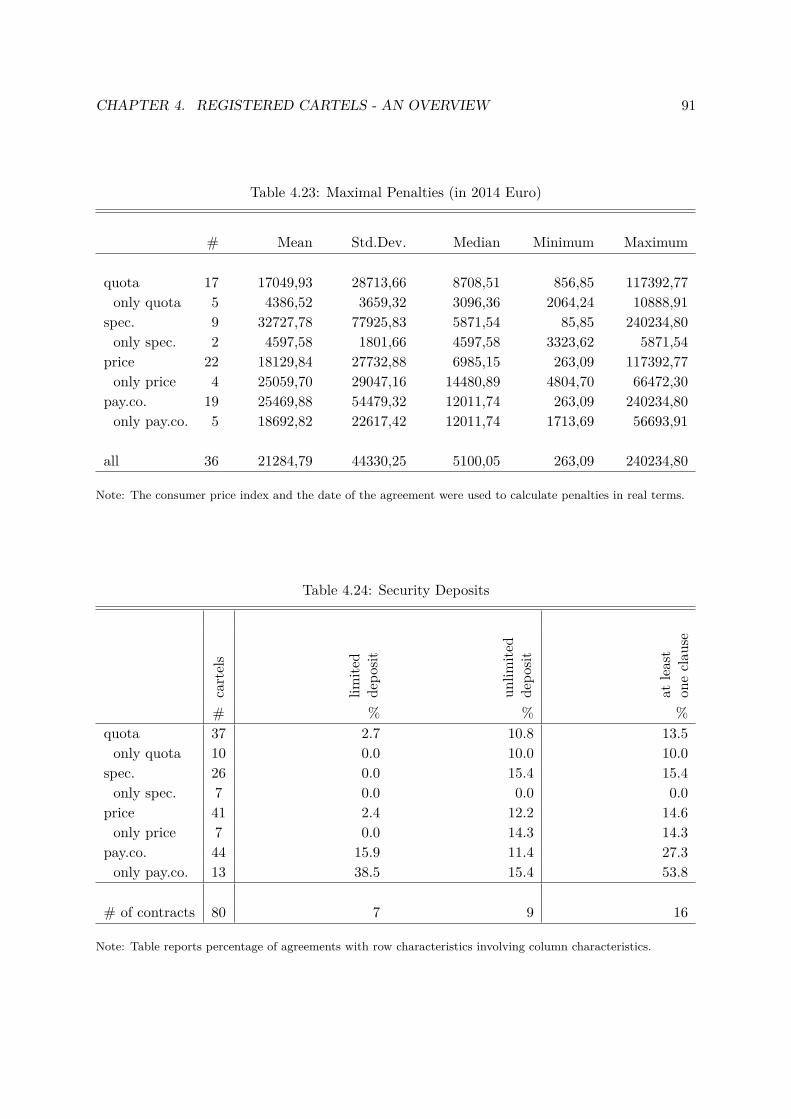
CHAPTER 4. REGISTERED CARTELS - AN OVERVIEW 91
Table 4.23: Maximal Penalties (in 2014 Euro)
# Mean Std.Dev. Median Minimum Maximum
quota 17 17049,93 28713,66 8708,51 856,85 117392,77only quota 5 4386,52 3659,32 3096,36 2064,24 10888,91
spec. 9 32727,78 77925,83 5871,54 85,85 240234,80only spec. 2 4597,58 1801,66 4597,58 3323,62 5871,54
price 22 18129,84 27732,88 6985,15 263,09 117392,77only price 4 25059,70 29047,16 14480,89 4804,70 66472,30
pay.co. 19 25469,88 54479,32 12011,74 263,09 240234,80only pay.co. 5 18692,82 22617,42 12011,74 1713,69 56693,91
all 36 21284,79 44330,25 5100,05 263,09 240234,80
Note: The consumer price index and the date of the agreement were used to calculate penalties in real terms.
Table 4.24: Security Deposits
cartels
limite
dde
posit
unlim
ited
depo
sit
atleast
oneclau
se
# % % %quota 37 2.7 10.8 13.5only quota 10 0.0 10.0 10.0
spec. 26 0.0 15.4 15.4only spec. 7 0.0 0.0 0.0
price 41 2.4 12.2 14.6only price 7 0.0 14.3 14.3
pay.co. 44 15.9 11.4 27.3only pay.co. 13 38.5 15.4 53.8
# of contracts 80 7 9 16
Note: Table reports percentage of agreements with row characteristics involving column characteristics.
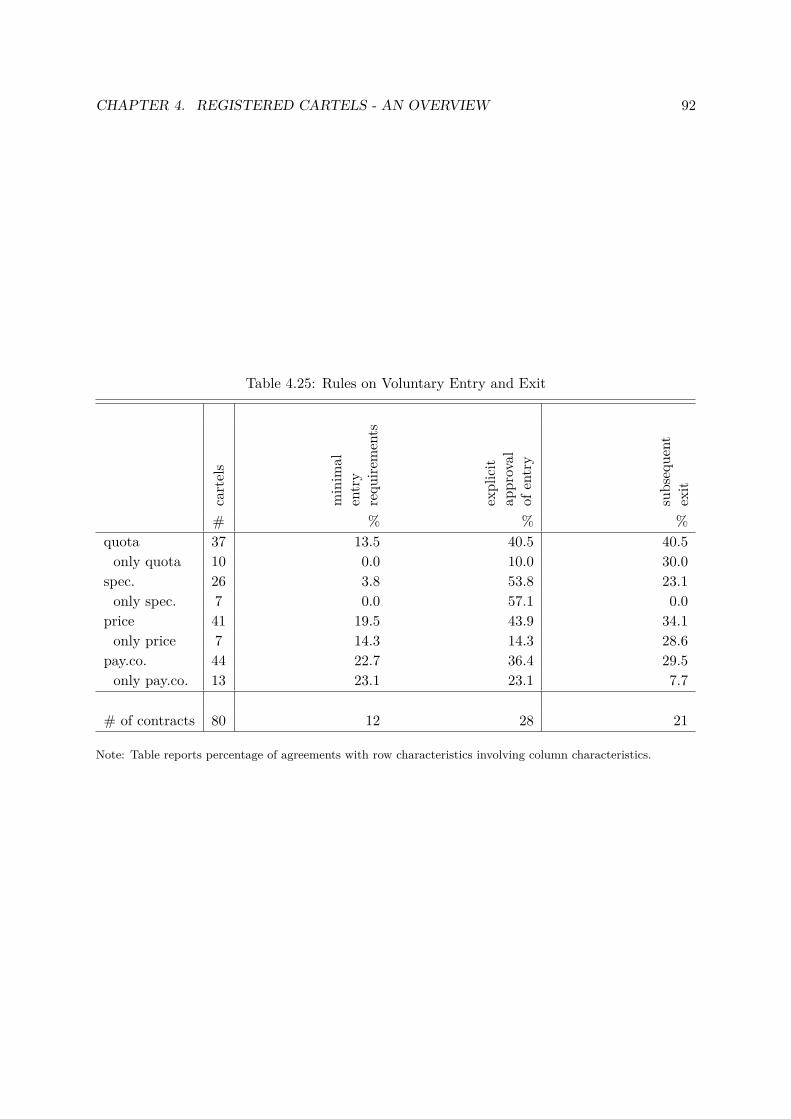
CHAPTER 4. REGISTERED CARTELS - AN OVERVIEW 92
Table 4.25: Rules on Voluntary Entry and Exit
cartels
minim
alentry
requ
irements
explicit
approval
ofentry
subseque
ntexit
# % % %quota 37 13.5 40.5 40.5only quota 10 0.0 10.0 30.0
spec. 26 3.8 53.8 23.1only spec. 7 0.0 57.1 0.0
price 41 19.5 43.9 34.1only price 7 14.3 14.3 28.6
pay.co. 44 22.7 36.4 29.5only pay.co. 13 23.1 23.1 7.7
# of contracts 80 12 28 21
Note: Table reports percentage of agreements with row characteristics involving column characteristics.
CHAPTER 4. REGISTERED CARTELS - AN OVERVIEW 93
4.5 Key Findings by Collusion MethodWe categorized the agreements found in the cartel registry into four different methods of col-lusion: quota, specialization, price, and payment conditions. The majority of contracts usedmore than just one of the four instruments. In particular, the cartels combining quota, priceand payment conditions (11 contracts) and price and payment conditions (9 contracts) accountfor a quarter of all agreements.
Quota cartels
Quota cartels—36 out of 37 are in manufacturing—are often combined with other collusiveinstruments, but least often with payment condition cartels. They are smallest in terms ofmembers, never including more than 21 members. Quota cartels often require unanimity amongmembers on the admission of new members into the cartel and output decisions. Voting by lessefficient cartel members could therefore lead to prices above monopoly prices as argued in Caveand Salant (1995). They often rely on a staffed office for internal management.
Regular reporting requirements are typical for quota cartels. Cash payments are the cen-tral mechanism to compensate for not exactly realized quotas, followed by transfer of orders orcustomers and sales between cartelists. Some quota cartels punish not only for deviating con-duct, but also for failure to provide (correct) information. The provisions for regular reportingmechanisms as well as compensation schemes allowing for asymmetric treatment of deviatorsand non-deviators are in line with the theoretical work on quota cartels as in Harrington andSkrzypacz (2007) and more recently Harrington and Skrzypacz (2011).
If a member leaves the cartel, quota cartels allow, more often than others, immediate exitby the remaining members, indicating the possibility of Nash reversion as a threat. As inHarrington (2006) allocated market shares are remarkably stable over cartel duration, with onlyentry triggering an adjustment. We do not observe adjustments of market shares in responseto capacity investments as in Harrington (2006). The ease of use of cash payments in a legalcollusive environment may have further added to the stability of market shares.
Specialization cartels
Specialization cartels are the 26 agreements specifying the allocation of products, customers,suppliers and territories. More than a quarter of them are export cartels. Pure specializationcartels are less concerned with avoiding secret price cuts such as favorable payment conditions ordiscounts. Three out of the four agreements specifying exclusive territories also engage in jointadvertising. They are most simple in terms of internal decision making bodies, some managingwithout any. However, about one quarter of them rely on joint sales agencies.
Only one of the seven pure specialization cartel relies on regular member reports. In general,specialization cartels are the ones least reliant on information exchange and internal punish-ments. Specialization cartels stand out in terms of explicitly regulating entry into the cartel.Unanimous approval by existing members is regularly required to accept a new member. Wealso observed the lowest rate of reviews of such cartels in the registration process, suggestingthat they were considered as the least damaging. In the few instances of direct customer al-location, historical precedent plays an important role as also observed by Harrington (2006).Overall the nature of the observed contracts confirms Stigler’s (1964) view of the simplicity
CHAPTER 4. REGISTERED CARTELS - AN OVERVIEW 94
of this collusion method, although it is an option only for specific and easily divisible narrowmarkets.
Price cartels
The 41 price cartels use clauses such as a fixed price, price floors, price books, common cost-ing sheets or price adjustments. Only seven cartels are pure price cartels. These pure priceagreements are the simplest as reflected by the fact that the contracts are the shortest. Mostoften these price agreements use further clauses to prevent secret price cutting. These includespecific rules on payment conditions and the liability of sales agents to prevent resellers fromundermining cartel objectives (a problem often faced by illegal cartels (Harrington (2006) andGenesove and Mullin (2001)). Norms on quality and lot size are most common for such cartels,apparently to avoid non-price competition. Some price cartels agree to an external referenceprice instead of fixing prices themselves. Decision taking is sometimes delegated to a body wherenot all members are represented, required majorities are on average lower than for decisions onoutput in quota cartels. On average these cartels have more members than quota cartels. Onefifth of price cartels manage without any information exchange. Penalties are quite common.
Payment condition cartels
We have 44 agreements regulating payment conditions. They aim at preventing secret pricecuts and are mainly combined with price clauses, often including clear rules on quantity or saleschannels discounts and liability for sales agents. Payment condition cartels stand out by thesheer size in terms of number of members, as well as contract length and number of decisionbodies as measures of complexity. About two thirds have a central staffed office for management.In these cartels information provision upon request is most prominent. Some even require noti-fication of supply—often price—ex-ante, i.e. before a transaction takes place. Non-compliancewith information exchange rule is often penalized. Punishment—be it a simple warning, amonetary penalty or exclusion—is most frequently specified in payment condition cartels. Halfof them even require (sometimes unlimited) security deposits for immediate enforcement. The13 pure payment condition cartels are reminiscent of the Sugar Institute (Genesove and Mullin(2001)), homogenizing business practices and specifying reporting schemes to make pricing moretransparent.
4.6 Summary and ConclusionWe have provided descriptive evidence on registered legal cartels in Austria. We find that firmsused the possibility to write legally binding cartel contracts to prevent secret price cuts, themain impediment to attain a collusive outcome according to Stigler (1964). We find contractualarrangements requiring regular reporting in quota cartels to avoid information lags. Legalcartels make use of cash payments between cartelists to compensate for departures from theagreed outcome, allowing the cartel to efficiently respond to asymmetric developments in costand demand.
Rather than just relying on the opportunity to take a party to court when violating thecontract, the majority of cartels agreements specify penalties for deviating behavior (both interms of market behavior and information provision). This is sometimes supplemented withrequiring cash deposits, ensuring that punishment for deviating behavior is not only quick but
CHAPTER 4. REGISTERED CARTELS - AN OVERVIEW 95
also credible. Compensation payments and penalties enable them to treat deviators and non-deviators differently, which has been shown to be often necessary to sustain collusion (Harringtonand Skrzypacz (2007)).
Non-price competition is prevented by agreeing on product norms and delivery conditions.In line with Genesove and Mullin (2001) we find that also legal cartels delegate discretionarypower to bodies to cope with the inevitable incompleteness of contracts. The legally bindingnature of contracts allow the parties to bestow decision making authority to these bodies onissues including prices, quantities, entry and in particular penalties.
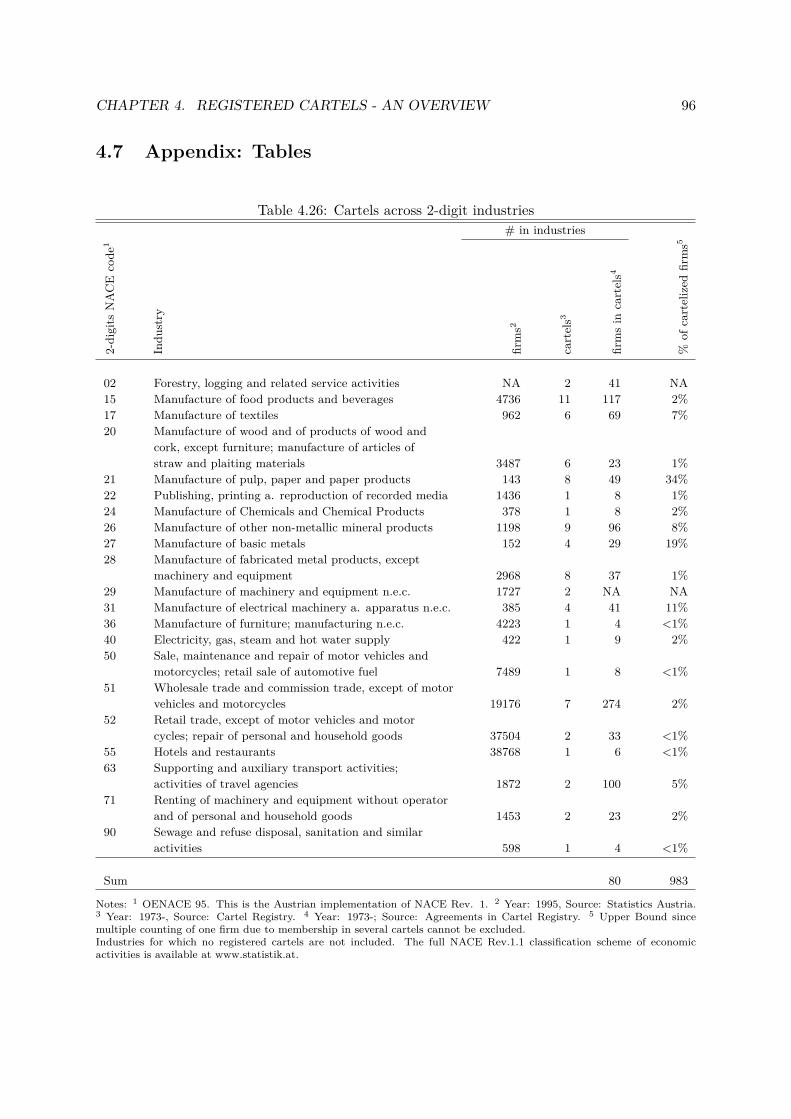
CHAPTER 4. REGISTERED CARTELS - AN OVERVIEW 96
4.7 Appendix: Tables
Table 4.26: Cartels across 2-digit industries# in industries
2-digits
NACE
code
1
Indu
stry
firms2
cartels3
firmsin
cartels4
%of
cartelized
firms5
02 Forestry, logging and related service activities NA 2 41 NA15 Manufacture of food products and beverages 4736 11 117 2%17 Manufacture of textiles 962 6 69 7%20 Manufacture of wood and of products of wood and
cork, except furniture; manufacture of articles ofstraw and plaiting materials 3487 6 23 1%
21 Manufacture of pulp, paper and paper products 143 8 49 34%22 Publishing, printing a. reproduction of recorded media 1436 1 8 1%24 Manufacture of Chemicals and Chemical Products 378 1 8 2%26 Manufacture of other non-metallic mineral products 1198 9 96 8%27 Manufacture of basic metals 152 4 29 19%28 Manufacture of fabricated metal products, except
machinery and equipment 2968 8 37 1%29 Manufacture of machinery and equipment n.e.c. 1727 2 NA NA31 Manufacture of electrical machinery a. apparatus n.e.c. 385 4 41 11%36 Manufacture of furniture; manufacturing n.e.c. 4223 1 4 <1%40 Electricity, gas, steam and hot water supply 422 1 9 2%50 Sale, maintenance and repair of motor vehicles and
motorcycles; retail sale of automotive fuel 7489 1 8 <1%51 Wholesale trade and commission trade, except of motor
vehicles and motorcycles 19176 7 274 2%52 Retail trade, except of motor vehicles and motor
cycles; repair of personal and household goods 37504 2 33 <1%55 Hotels and restaurants 38768 1 6 <1%63 Supporting and auxiliary transport activities;
activities of travel agencies 1872 2 100 5%71 Renting of machinery and equipment without operator
and of personal and household goods 1453 2 23 2%90 Sewage and refuse disposal, sanitation and similar
activities 598 1 4 <1%
Sum 80 983
Notes: 1 OENACE 95. This is the Austrian implementation of NACE Rev. 1. 2 Year: 1995, Source: Statistics Austria.3 Year: 1973-, Source: Cartel Registry. 4 Year: 1973-; Source: Agreements in Cartel Registry. 5 Upper Bound sincemultiple counting of one firm due to membership in several cartels cannot be excluded.Industries for which no registered cartels are not included. The full NACE Rev.1.1 classification scheme of economicactivities is available at www.statistik.at.
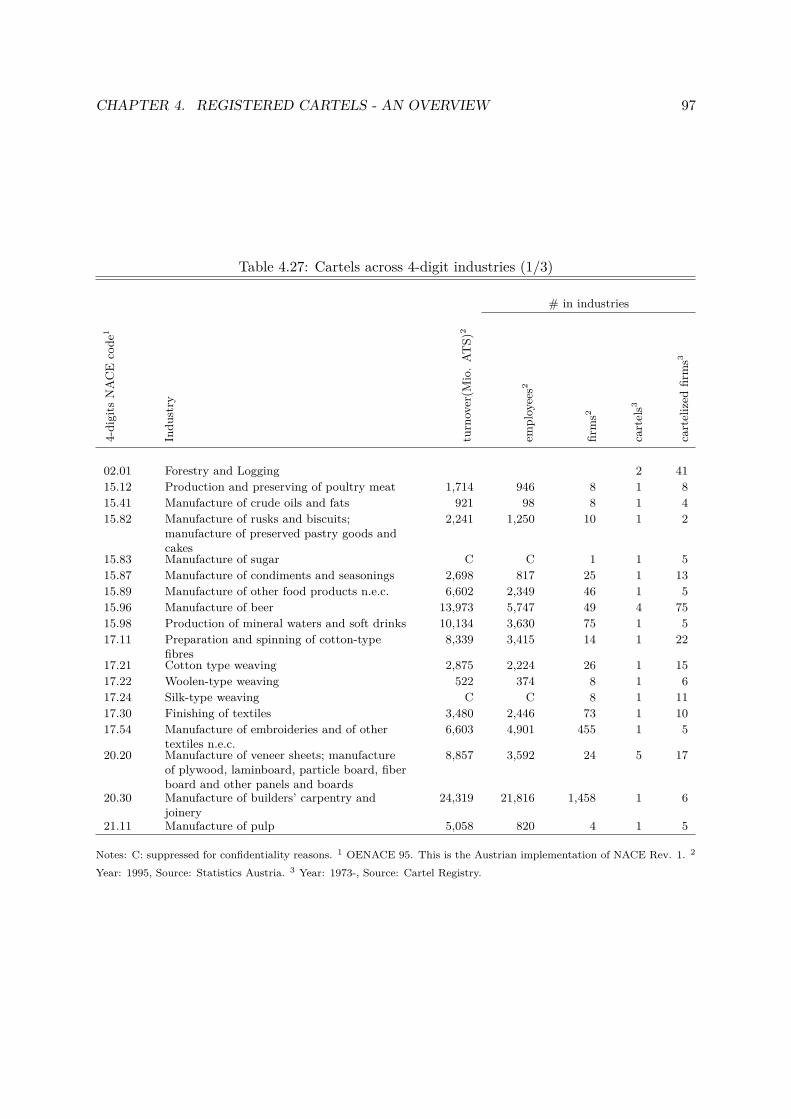
CHAPTER 4. REGISTERED CARTELS - AN OVERVIEW 97
Table 4.27: Cartels across 4-digit industries (1/3)
# in industries
4-digits
NACE
code
1
Indu
stry
turnover(M
io.AT
S)2
employees2
firms2
cartels3
cartelized
firms3
02.01 Forestry and Logging 2 4115.12 Production and preserving of poultry meat 1,714 946 8 1 815.41 Manufacture of crude oils and fats 921 98 8 1 415.82 Manufacture of rusks and biscuits;
manufacture of preserved pastry goods andcakes
2,241 1,250 10 1 2
15.83 Manufacture of sugar C C 1 1 515.87 Manufacture of condiments and seasonings 2,698 817 25 1 1315.89 Manufacture of other food products n.e.c. 6,602 2,349 46 1 515.96 Manufacture of beer 13,973 5,747 49 4 7515.98 Production of mineral waters and soft drinks 10,134 3,630 75 1 517.11 Preparation and spinning of cotton-type
fibres8,339 3,415 14 1 22
17.21 Cotton type weaving 2,875 2,224 26 1 1517.22 Woolen-type weaving 522 374 8 1 617.24 Silk-type weaving C C 8 1 1117.30 Finishing of textiles 3,480 2,446 73 1 1017.54 Manufacture of embroideries and of other
textiles n.e.c.6,603 4,901 455 1 5
20.20 Manufacture of veneer sheets; manufactureof plywood, laminboard, particle board, fiberboard and other panels and boards
8,857 3,592 24 5 17
20.30 Manufacture of builders’ carpentry andjoinery
24,319 21,816 1,458 1 6
21.11 Manufacture of pulp 5,058 820 4 1 5
Notes: C: suppressed for confidentiality reasons. 1 OENACE 95. This is the Austrian implementation of NACE Rev. 1. 2
Year: 1995, Source: Statistics Austria. 3 Year: 1973-, Source: Cartel Registry.
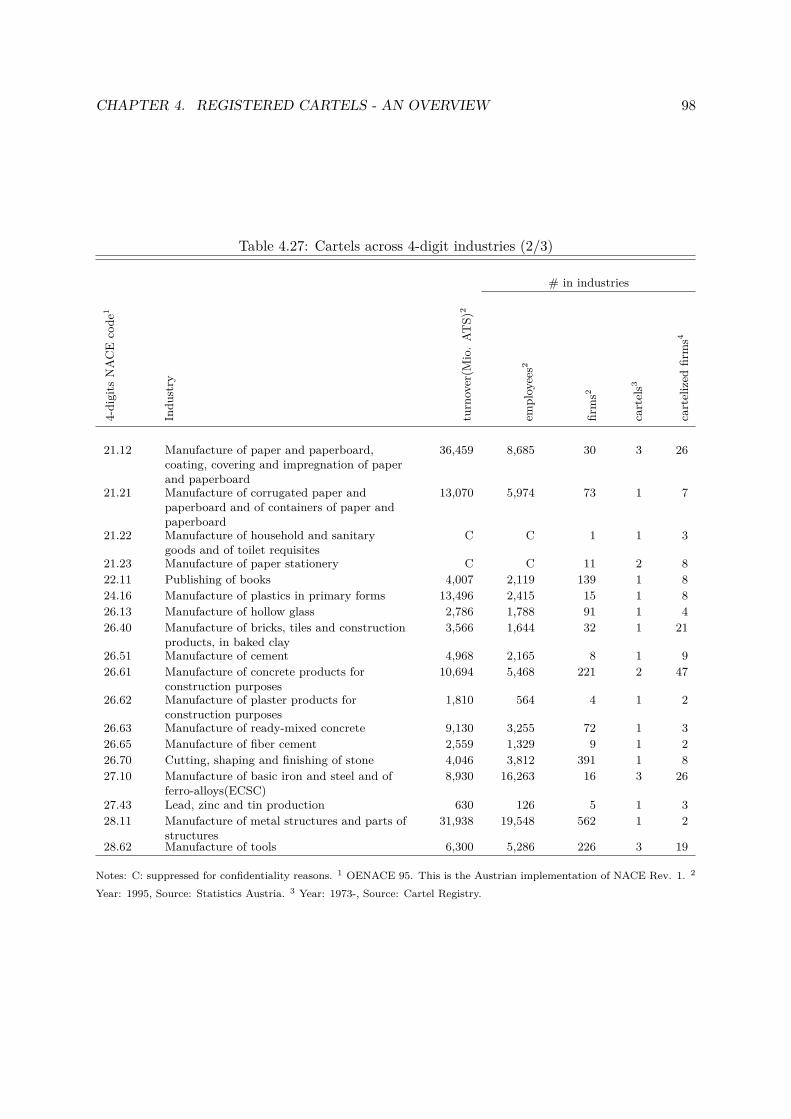
CHAPTER 4. REGISTERED CARTELS - AN OVERVIEW 98
Table 4.27: Cartels across 4-digit industries (2/3)
# in industries
4-digits
NACE
code
1
Indu
stry
turnover(M
io.AT
S)2
employees2
firms2
cartels3
cartelized
firms4
21.12 Manufacture of paper and paperboard,coating, covering and impregnation of paperand paperboard
36,459 8,685 30 3 26
21.21 Manufacture of corrugated paper andpaperboard and of containers of paper andpaperboard
13,070 5,974 73 1 7
21.22 Manufacture of household and sanitarygoods and of toilet requisites
C C 1 1 3
21.23 Manufacture of paper stationery C C 11 2 822.11 Publishing of books 4,007 2,119 139 1 824.16 Manufacture of plastics in primary forms 13,496 2,415 15 1 826.13 Manufacture of hollow glass 2,786 1,788 91 1 426.40 Manufacture of bricks, tiles and construction
products, in baked clay3,566 1,644 32 1 21
26.51 Manufacture of cement 4,968 2,165 8 1 926.61 Manufacture of concrete products for
construction purposes10,694 5,468 221 2 47
26.62 Manufacture of plaster products forconstruction purposes
1,810 564 4 1 2
26.63 Manufacture of ready-mixed concrete 9,130 3,255 72 1 326.65 Manufacture of fiber cement 2,559 1,329 9 1 226.70 Cutting, shaping and finishing of stone 4,046 3,812 391 1 827.10 Manufacture of basic iron and steel and of
ferro-alloys(ECSC)8,930 16,263 16 3 26
27.43 Lead, zinc and tin production 630 126 5 1 328.11 Manufacture of metal structures and parts of
structures31,938 19,548 562 1 2
28.62 Manufacture of tools 6,300 5,286 226 3 19
Notes: C: suppressed for confidentiality reasons. 1 OENACE 95. This is the Austrian implementation of NACE Rev. 1. 2
Year: 1995, Source: Statistics Austria. 3 Year: 1973-, Source: Cartel Registry.
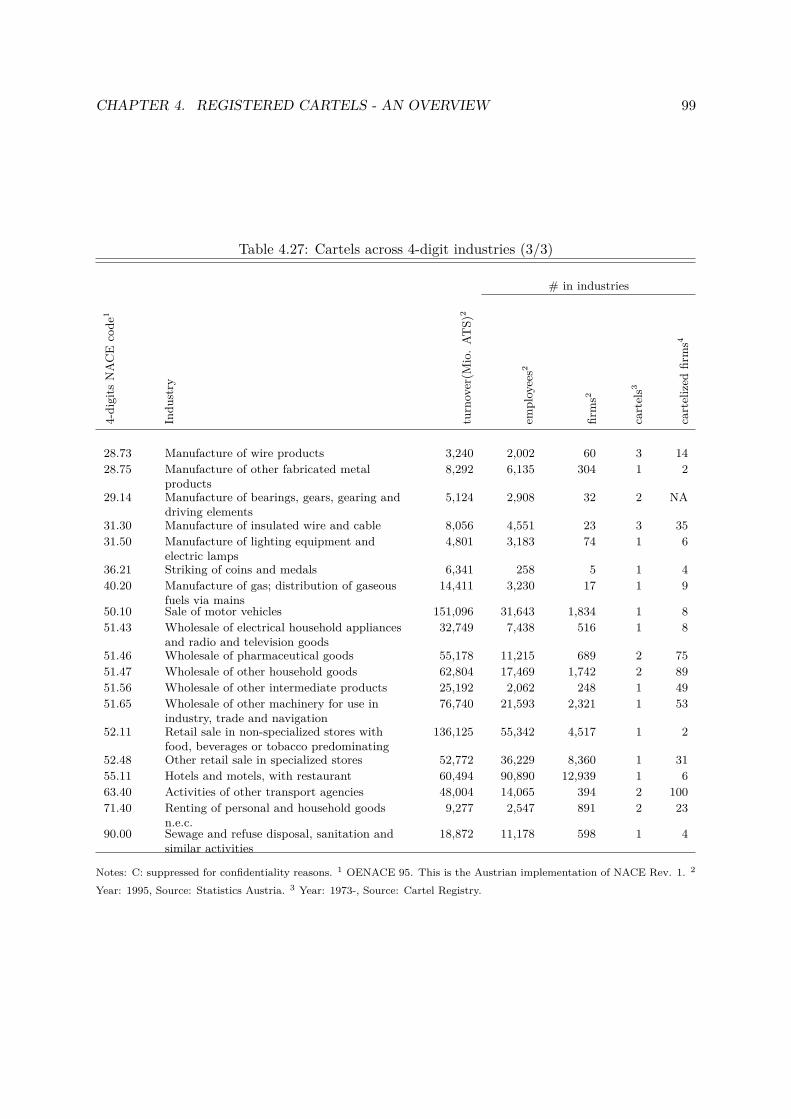
CHAPTER 4. REGISTERED CARTELS - AN OVERVIEW 99
Table 4.27: Cartels across 4-digit industries (3/3)
# in industries
4-digits
NACE
code
1
Indu
stry
turnover(M
io.AT
S)2
employees2
firms2
cartels3
cartelized
firms4
28.73 Manufacture of wire products 3,240 2,002 60 3 1428.75 Manufacture of other fabricated metal
products8,292 6,135 304 1 2
29.14 Manufacture of bearings, gears, gearing anddriving elements
5,124 2,908 32 2 NA
31.30 Manufacture of insulated wire and cable 8,056 4,551 23 3 3531.50 Manufacture of lighting equipment and
electric lamps4,801 3,183 74 1 6
36.21 Striking of coins and medals 6,341 258 5 1 440.20 Manufacture of gas; distribution of gaseous
fuels via mains14,411 3,230 17 1 9
50.10 Sale of motor vehicles 151,096 31,643 1,834 1 851.43 Wholesale of electrical household appliances
and radio and television goods32,749 7,438 516 1 8
51.46 Wholesale of pharmaceutical goods 55,178 11,215 689 2 7551.47 Wholesale of other household goods 62,804 17,469 1,742 2 8951.56 Wholesale of other intermediate products 25,192 2,062 248 1 4951.65 Wholesale of other machinery for use in
industry, trade and navigation76,740 21,593 2,321 1 53
52.11 Retail sale in non-specialized stores withfood, beverages or tobacco predominating
136,125 55,342 4,517 1 2
52.48 Other retail sale in specialized stores 52,772 36,229 8,360 1 3155.11 Hotels and motels, with restaurant 60,494 90,890 12,939 1 663.40 Activities of other transport agencies 48,004 14,065 394 2 10071.40 Renting of personal and household goods
n.e.c.9,277 2,547 891 2 23
90.00 Sewage and refuse disposal, sanitation andsimilar activities
18,872 11,178 598 1 4
Notes: C: suppressed for confidentiality reasons. 1 OENACE 95. This is the Austrian implementation of NACE Rev. 1. 2
Year: 1995, Source: Statistics Austria. 3 Year: 1973-, Source: Cartel Registry.
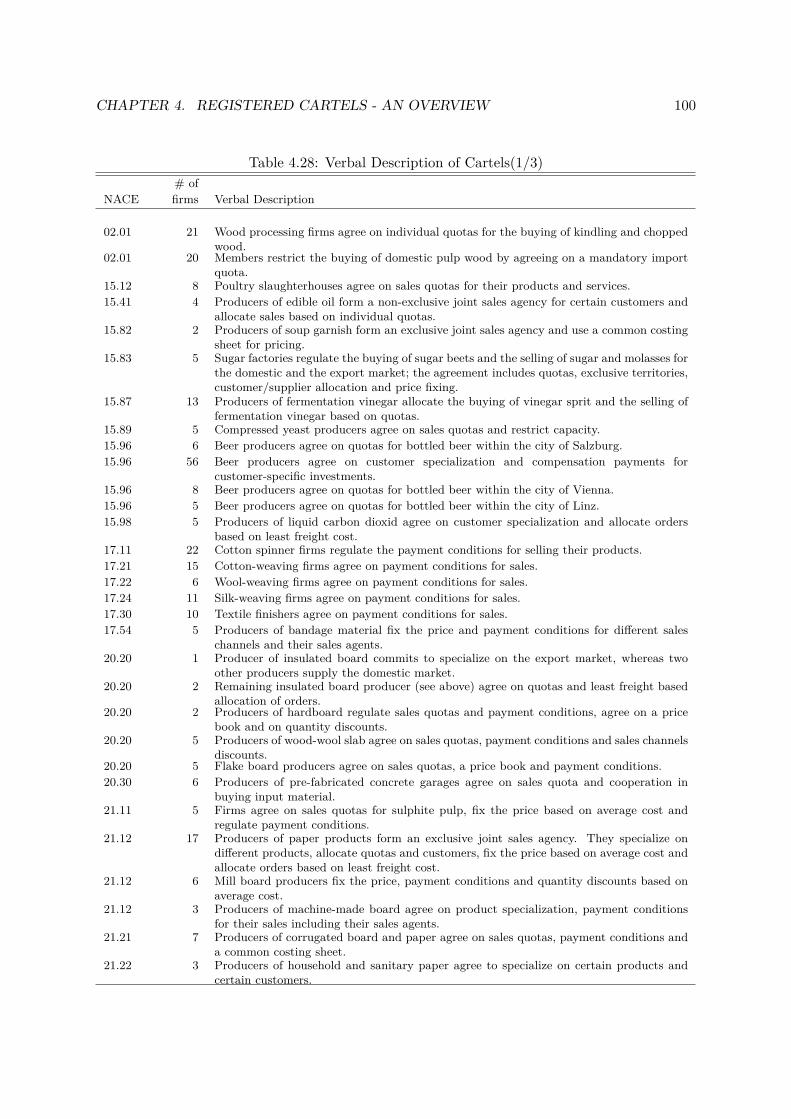
CHAPTER 4. REGISTERED CARTELS - AN OVERVIEW 100
Table 4.28: Verbal Description of Cartels(1/3)# of
NACE firms Verbal Description
02.01 21 Wood processing firms agree on individual quotas for the buying of kindling and choppedwood.
02.01 20 Members restrict the buying of domestic pulp wood by agreeing on a mandatory importquota.
15.12 8 Poultry slaughterhouses agree on sales quotas for their products and services.15.41 4 Producers of edible oil form a non-exclusive joint sales agency for certain customers and
allocate sales based on individual quotas.15.82 2 Producers of soup garnish form an exclusive joint sales agency and use a common costing
sheet for pricing.15.83 5 Sugar factories regulate the buying of sugar beets and the selling of sugar and molasses for
the domestic and the export market; the agreement includes quotas, exclusive territories,customer/supplier allocation and price fixing.
15.87 13 Producers of fermentation vinegar allocate the buying of vinegar sprit and the selling offermentation vinegar based on quotas.
15.89 5 Compressed yeast producers agree on sales quotas and restrict capacity.15.96 6 Beer producers agree on quotas for bottled beer within the city of Salzburg.15.96 56 Beer producers agree on customer specialization and compensation payments for
customer-specific investments.15.96 8 Beer producers agree on quotas for bottled beer within the city of Vienna.15.96 5 Beer producers agree on quotas for bottled beer within the city of Linz.15.98 5 Producers of liquid carbon dioxid agree on customer specialization and allocate orders
based on least freight cost.17.11 22 Cotton spinner firms regulate the payment conditions for selling their products.17.21 15 Cotton-weaving firms agree on payment conditions for sales.17.22 6 Wool-weaving firms agree on payment conditions for sales.17.24 11 Silk-weaving firms agree on payment conditions for sales.17.30 10 Textile finishers agree on payment conditions for sales.17.54 5 Producers of bandage material fix the price and payment conditions for different sales
channels and their sales agents.20.20 1 Producer of insulated board commits to specialize on the export market, whereas two
other producers supply the domestic market.20.20 2 Remaining insulated board producer (see above) agree on quotas and least freight based
allocation of orders.20.20 2 Producers of hardboard regulate sales quotas and payment conditions, agree on a price
book and on quantity discounts.20.20 5 Producers of wood-wool slab agree on sales quotas, payment conditions and sales channels
discounts.20.20 5 Flake board producers agree on sales quotas, a price book and payment conditions.20.30 6 Producers of pre-fabricated concrete garages agree on sales quota and cooperation in
buying input material.21.11 5 Firms agree on sales quotas for sulphite pulp, fix the price based on average cost and
regulate payment conditions.21.12 17 Producers of paper products form an exclusive joint sales agency. They specialize on
different products, allocate quotas and customers, fix the price based on average cost andallocate orders based on least freight cost.
21.12 6 Mill board producers fix the price, payment conditions and quantity discounts based onaverage cost.
21.12 3 Producers of machine-made board agree on product specialization, payment conditionsfor their sales including their sales agents.
21.21 7 Producers of corrugated board and paper agree on sales quotas, payment conditions anda common costing sheet.
21.22 3 Producers of household and sanitary paper agree to specialize on certain products andcertain customers.
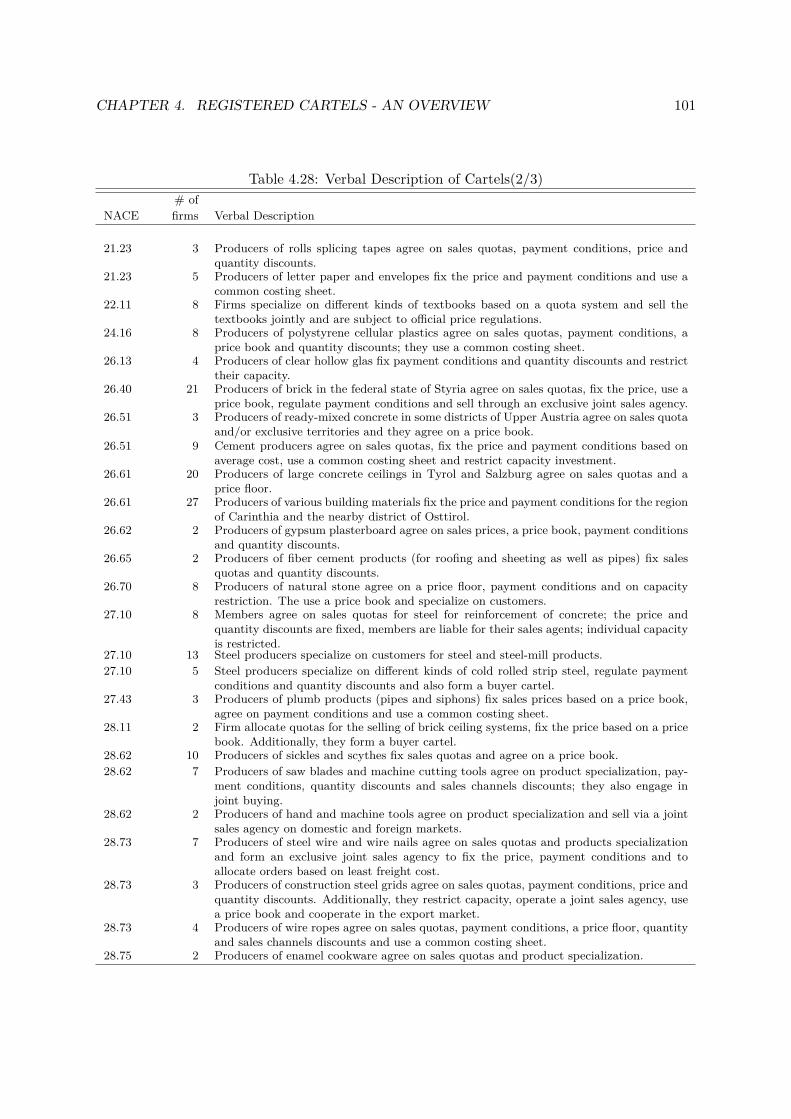
CHAPTER 4. REGISTERED CARTELS - AN OVERVIEW 101
Table 4.28: Verbal Description of Cartels(2/3)# of
NACE firms Verbal Description
21.23 3 Producers of rolls splicing tapes agree on sales quotas, payment conditions, price andquantity discounts.
21.23 5 Producers of letter paper and envelopes fix the price and payment conditions and use acommon costing sheet.
22.11 8 Firms specialize on different kinds of textbooks based on a quota system and sell thetextbooks jointly and are subject to official price regulations.
24.16 8 Producers of polystyrene cellular plastics agree on sales quotas, payment conditions, aprice book and quantity discounts; they use a common costing sheet.
26.13 4 Producers of clear hollow glas fix payment conditions and quantity discounts and restricttheir capacity.
26.40 21 Producers of brick in the federal state of Styria agree on sales quotas, fix the price, use aprice book, regulate payment conditions and sell through an exclusive joint sales agency.
26.51 3 Producers of ready-mixed concrete in some districts of Upper Austria agree on sales quotaand/or exclusive territories and they agree on a price book.
26.51 9 Cement producers agree on sales quotas, fix the price and payment conditions based onaverage cost, use a common costing sheet and restrict capacity investment.
26.61 20 Producers of large concrete ceilings in Tyrol and Salzburg agree on sales quotas and aprice floor.
26.61 27 Producers of various building materials fix the price and payment conditions for the regionof Carinthia and the nearby district of Osttirol.
26.62 2 Producers of gypsum plasterboard agree on sales prices, a price book, payment conditionsand quantity discounts.
26.65 2 Producers of fiber cement products (for roofing and sheeting as well as pipes) fix salesquotas and quantity discounts.
26.70 8 Producers of natural stone agree on a price floor, payment conditions and on capacityrestriction. The use a price book and specialize on customers.
27.10 8 Members agree on sales quotas for steel for reinforcement of concrete; the price andquantity discounts are fixed, members are liable for their sales agents; individual capacityis restricted.
27.10 13 Steel producers specialize on customers for steel and steel-mill products.27.10 5 Steel producers specialize on different kinds of cold rolled strip steel, regulate payment
conditions and quantity discounts and also form a buyer cartel.27.43 3 Producers of plumb products (pipes and siphons) fix sales prices based on a price book,
agree on payment conditions and use a common costing sheet.28.11 2 Firm allocate quotas for the selling of brick ceiling systems, fix the price based on a price
book. Additionally, they form a buyer cartel.28.62 10 Producers of sickles and scythes fix sales quotas and agree on a price book.28.62 7 Producers of saw blades and machine cutting tools agree on product specialization, pay-
ment conditions, quantity discounts and sales channels discounts; they also engage injoint buying.
28.62 2 Producers of hand and machine tools agree on product specialization and sell via a jointsales agency on domestic and foreign markets.
28.73 7 Producers of steel wire and wire nails agree on sales quotas and products specializationand form an exclusive joint sales agency to fix the price, payment conditions and toallocate orders based on least freight cost.
28.73 3 Producers of construction steel grids agree on sales quotas, payment conditions, price andquantity discounts. Additionally, they restrict capacity, operate a joint sales agency, usea price book and cooperate in the export market.
28.73 4 Producers of wire ropes agree on sales quotas, payment conditions, a price floor, quantityand sales channels discounts and use a common costing sheet.
28.75 2 Producers of enamel cookware agree on sales quotas and product specialization.
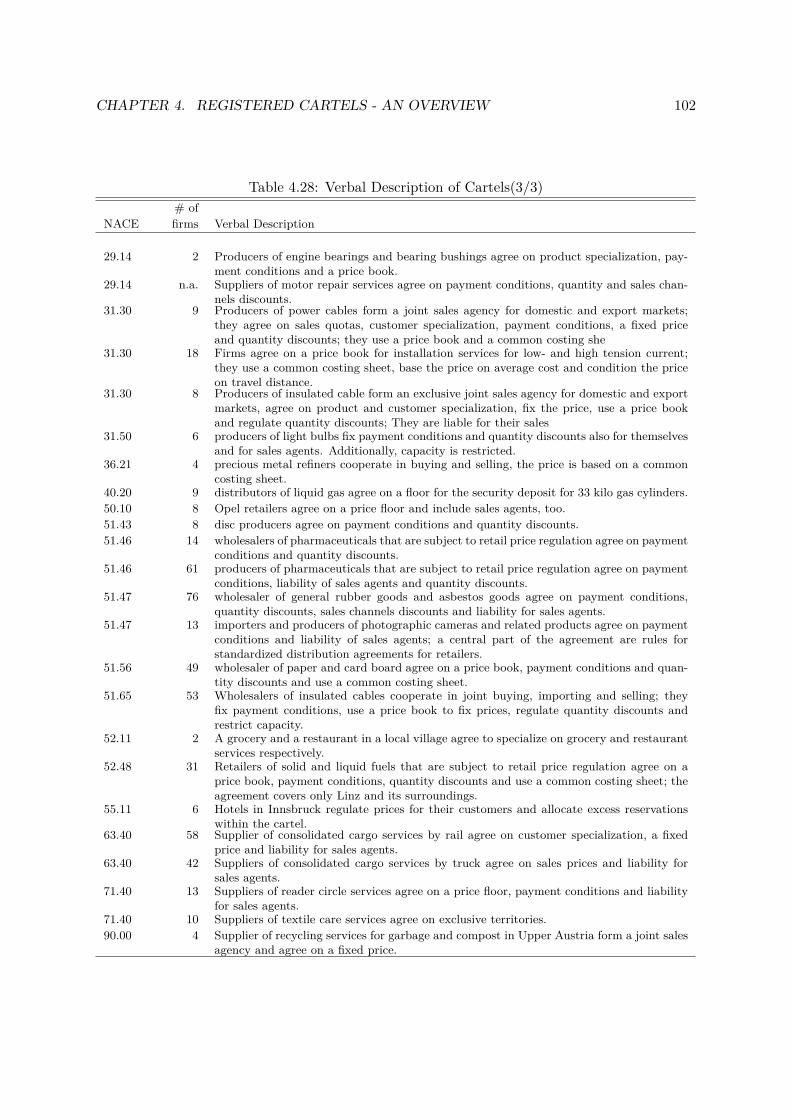
CHAPTER 4. REGISTERED CARTELS - AN OVERVIEW 102
Table 4.28: Verbal Description of Cartels(3/3)# of
NACE firms Verbal Description
29.14 2 Producers of engine bearings and bearing bushings agree on product specialization, pay-ment conditions and a price book.
29.14 n.a. Suppliers of motor repair services agree on payment conditions, quantity and sales chan-nels discounts.
31.30 9 Producers of power cables form a joint sales agency for domestic and export markets;they agree on sales quotas, customer specialization, payment conditions, a fixed priceand quantity discounts; they use a price book and a common costing she
31.30 18 Firms agree on a price book for installation services for low- and high tension current;they use a common costing sheet, base the price on average cost and condition the priceon travel distance.
31.30 8 Producers of insulated cable form an exclusive joint sales agency for domestic and exportmarkets, agree on product and customer specialization, fix the price, use a price bookand regulate quantity discounts; They are liable for their sales
31.50 6 producers of light bulbs fix payment conditions and quantity discounts also for themselvesand for sales agents. Additionally, capacity is restricted.
36.21 4 precious metal refiners cooperate in buying and selling, the price is based on a commoncosting sheet.
40.20 9 distributors of liquid gas agree on a floor for the security deposit for 33 kilo gas cylinders.50.10 8 Opel retailers agree on a price floor and include sales agents, too.51.43 8 disc producers agree on payment conditions and quantity discounts.51.46 14 wholesalers of pharmaceuticals that are subject to retail price regulation agree on payment
conditions and quantity discounts.51.46 61 producers of pharmaceuticals that are subject to retail price regulation agree on payment
conditions, liability of sales agents and quantity discounts.51.47 76 wholesaler of general rubber goods and asbestos goods agree on payment conditions,
quantity discounts, sales channels discounts and liability for sales agents.51.47 13 importers and producers of photographic cameras and related products agree on payment
conditions and liability of sales agents; a central part of the agreement are rules forstandardized distribution agreements for retailers.
51.56 49 wholesaler of paper and card board agree on a price book, payment conditions and quan-tity discounts and use a common costing sheet.
51.65 53 Wholesalers of insulated cables cooperate in joint buying, importing and selling; theyfix payment conditions, use a price book to fix prices, regulate quantity discounts andrestrict capacity.
52.11 2 A grocery and a restaurant in a local village agree to specialize on grocery and restaurantservices respectively.
52.48 31 Retailers of solid and liquid fuels that are subject to retail price regulation agree on aprice book, payment conditions, quantity discounts and use a common costing sheet; theagreement covers only Linz and its surroundings.
55.11 6 Hotels in Innsbruck regulate prices for their customers and allocate excess reservationswithin the cartel.
63.40 58 Supplier of consolidated cargo services by rail agree on customer specialization, a fixedprice and liability for sales agents.
63.40 42 Suppliers of consolidated cargo services by truck agree on sales prices and liability forsales agents.
71.40 13 Suppliers of reader circle services agree on a price floor, payment conditions and liabilityfor sales agents.
71.40 10 Suppliers of textile care services agree on exclusive territories.90.00 4 Supplier of recycling services for garbage and compost in Upper Austria form a joint sales
agency and agree on a fixed price.
Chapter 5
Registered Cartels and theirPolitical Economy
5.1 IntroductionChapter 4 describes the institutional set-up and the role of social partners during the periodof registered cartels. Schneider and Wagner (2001) view social partnership as an institution-alized conflict management institution with two possible effects: First, cooperation might beproduction-enhancing. Second, social partner may act as rent-seeking institutions. In orderto evaluate the role of social partnership during the cartel registration proceedings, I analyzewhether social partners used their powers as parties of the proceedings and requested a reviewin order to limit damaging cartels. If they did, they acted in accordance with general economicgoals. If not, they acted as solely as rent-seekers within the cartel registration proceedings.
5.2 Data and DescriptivesThe registry contains 80 horizontal registered different cartels that vary with respect to the waycollusion is organized.1 Stigler (1964) finds that secret price cutting is the greatest danger toorganize collusion. Mergers, joint sales agencies, fixing market shares, allocation of customersand territories and other forms that remove secret price cutting are most efficient methods tocollude and thus most damaging to the society. To the contrary, cartels that do not restrictsecret price cutting are less damaging. In order to operationalize different methods on collusion,chapter 3 provides categories for 29 different collusion clauses.
All cartels had to re-register in 1973, when a new cartel law took effect. I rely on the requestsfor reviews of all 80 horizontal cartels that were registered—either to prolong an existing cartelor to establish a new one. Review requests concerned a cartel in general that includes severalclauses.
The Chamber of Commerce requested a review for one out of 80 cartels, the Chamber ofAgriculture for none at all. Clearly, these two social partners did not use their power to fosteroverall economic welfare but remained inactive. The Chamber of Labor reviewed 41 out of 80cartels, the Federal Financial Agency 21 cartels.
1See chapter 4.
103
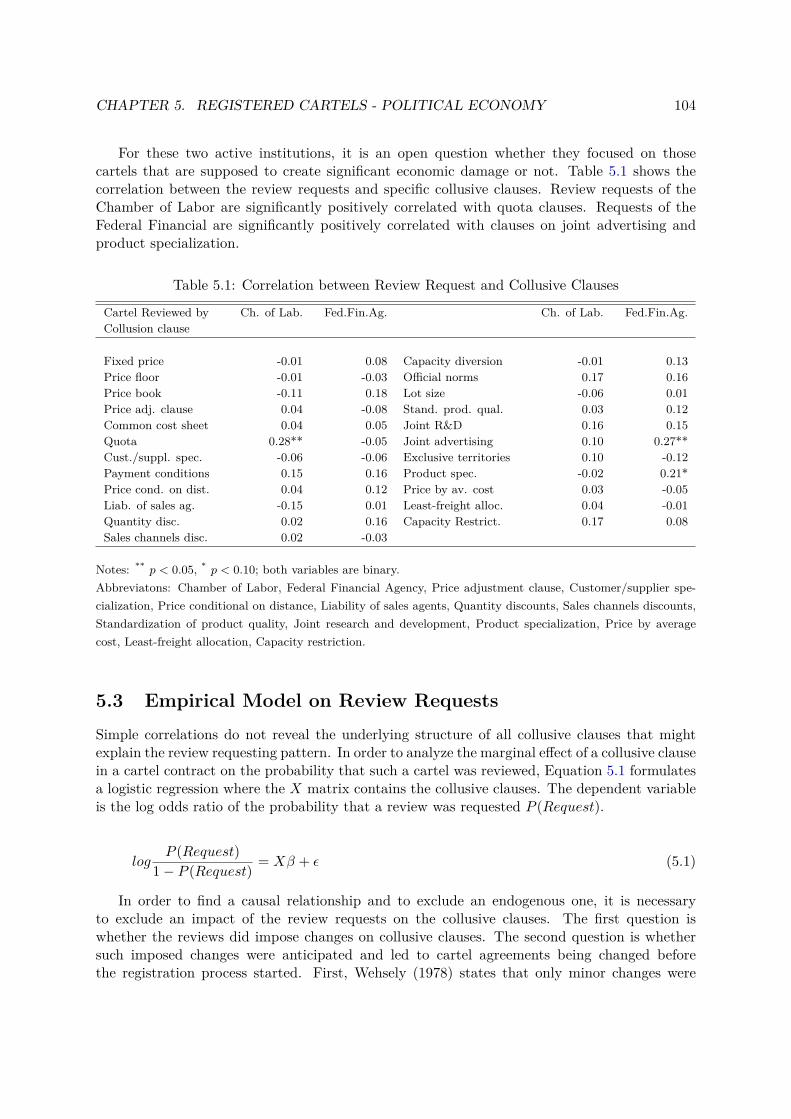
CHAPTER 5. REGISTERED CARTELS - POLITICAL ECONOMY 104
For these two active institutions, it is an open question whether they focused on thosecartels that are supposed to create significant economic damage or not. Table 5.1 shows thecorrelation between the review requests and specific collusive clauses. Review requests of theChamber of Labor are significantly positively correlated with quota clauses. Requests of theFederal Financial are significantly positively correlated with clauses on joint advertising andproduct specialization.
Table 5.1: Correlation between Review Request and Collusive Clauses
Cartel Reviewed by Ch. of Lab. Fed.Fin.Ag. Ch. of Lab. Fed.Fin.Ag.Collusion clause
Fixed price -0.01 0.08 Capacity diversion -0.01 0.13Price floor -0.01 -0.03 Official norms 0.17 0.16Price book -0.11 0.18 Lot size -0.06 0.01Price adj. clause 0.04 -0.08 Stand. prod. qual. 0.03 0.12Common cost sheet 0.04 0.05 Joint R&D 0.16 0.15Quota 0.28** -0.05 Joint advertising 0.10 0.27**Cust./suppl. spec. -0.06 -0.06 Exclusive territories 0.10 -0.12Payment conditions 0.15 0.16 Product spec. -0.02 0.21*Price cond. on dist. 0.04 0.12 Price by av. cost 0.03 -0.05Liab. of sales ag. -0.15 0.01 Least-freight alloc. 0.04 -0.01Quantity disc. 0.02 0.16 Capacity Restrict. 0.17 0.08Sales channels disc. 0.02 -0.03
Notes: ** p < 0.05, * p < 0.10; both variables are binary.Abbreviatons: Chamber of Labor, Federal Financial Agency, Price adjustment clause, Customer/supplier spe-cialization, Price conditional on distance, Liability of sales agents, Quantity discounts, Sales channels discounts,Standardization of product quality, Joint research and development, Product specialization, Price by averagecost, Least-freight allocation, Capacity restriction.
5.3 Empirical Model on Review RequestsSimple correlations do not reveal the underlying structure of all collusive clauses that mightexplain the review requesting pattern. In order to analyze the marginal effect of a collusive clausein a cartel contract on the probability that such a cartel was reviewed, Equation 5.1 formulatesa logistic regression where the X matrix contains the collusive clauses. The dependent variableis the log odds ratio of the probability that a review was requested P (Request).
logP (Request)
1− P (Request) = Xβ + ε (5.1)
In order to find a causal relationship and to exclude an endogenous one, it is necessaryto exclude an impact of the review requests on the collusive clauses. The first question iswhether the reviews did impose changes on collusive clauses. The second question is whethersuch imposed changes were anticipated and led to cartel agreements being changed beforethe registration process started. First, Wehsely (1978) states that only minor changes were
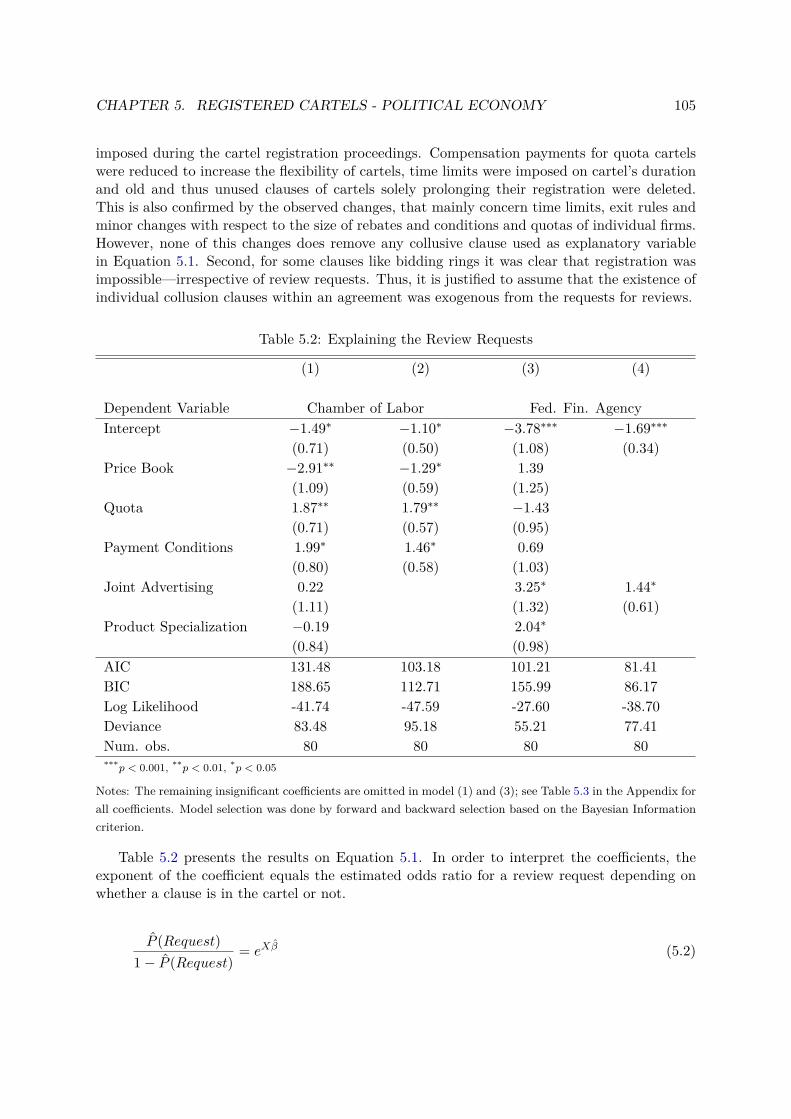
CHAPTER 5. REGISTERED CARTELS - POLITICAL ECONOMY 105
imposed during the cartel registration proceedings. Compensation payments for quota cartelswere reduced to increase the flexibility of cartels, time limits were imposed on cartel’s durationand old and thus unused clauses of cartels solely prolonging their registration were deleted.This is also confirmed by the observed changes, that mainly concern time limits, exit rules andminor changes with respect to the size of rebates and conditions and quotas of individual firms.However, none of this changes does remove any collusive clause used as explanatory variablein Equation 5.1. Second, for some clauses like bidding rings it was clear that registration wasimpossible—irrespective of review requests. Thus, it is justified to assume that the existence ofindividual collusion clauses within an agreement was exogenous from the requests for reviews.
Table 5.2: Explaining the Review Requests
(1) (2) (3) (4)
Dependent Variable Chamber of Labor Fed. Fin. AgencyIntercept −1.49∗ −1.10∗ −3.78∗∗∗ −1.69∗∗∗
(0.71) (0.50) (1.08) (0.34)Price Book −2.91∗∗ −1.29∗ 1.39
(1.09) (0.59) (1.25)Quota 1.87∗∗ 1.79∗∗ −1.43
(0.71) (0.57) (0.95)Payment Conditions 1.99∗ 1.46∗ 0.69
(0.80) (0.58) (1.03)Joint Advertising 0.22 3.25∗ 1.44∗
(1.11) (1.32) (0.61)Product Specialization −0.19 2.04∗
(0.84) (0.98)AIC 131.48 103.18 101.21 81.41BIC 188.65 112.71 155.99 86.17Log Likelihood -41.74 -47.59 -27.60 -38.70Deviance 83.48 95.18 55.21 77.41Num. obs. 80 80 80 80***p < 0.001, **p < 0.01, *p < 0.05
Notes: The remaining insignificant coefficients are omitted in model (1) and (3); see Table 5.3 in the Appendix forall coefficients. Model selection was done by forward and backward selection based on the Bayesian Informationcriterion.
Table 5.2 presents the results on Equation 5.1. In order to interpret the coefficients, theexponent of the coefficient equals the estimated odds ratio for a review request depending onwhether a clause is in the cartel or not.
P (Request)1− P (Request)
= eXβ (5.2)
CHAPTER 5. REGISTERED CARTELS - POLITICAL ECONOMY 106
Model (1) and (2) aim to explain the review requests of the Chamber of Labor. Model (1)includes all clauses whereas a model selection procedure based on the BIC (Bayesian InformationCriterion) drops all other insignificant variables in model (2). For cartels including a price bookclause, the Chamber of Labor requested a review about three times (e−1.29 = 0.3) less oftenthan for other cartels. Quota cartels were reviewed six times (e1.79 = 6.0) more often thannon-quota cartels, and payment condition cartels were reviewed four times (e1.46 = 4.3) moreoften than cartels without such a clause. These results are significant in the full model (1), too.
The review requests of the Federal Financial Agency that represents the federal governmentare the dependent variable in model (3) and (4). In the full model, review requests are foundmore often for joint advertising and product specialization. A BIC based model selection solelyselects joint advertising with a significant positive effect on the probability of a review request.
For the Chamber of Labor, the review request pattern can be interpreted as a specificinterest on most damaging cartels according to Stigler (1964). Quotas are an efficient way torestrict secret price cutting. Rules on payment conditions directly address a specific form ofsecret price cutting. On the other hand, the price book clause only complements the alreadyprice regulated cartels and does not further increase the restriction on competition. Thus, theChamber of Labor was well aware of the effects of different cartels.
For the Federal Financial Agency, there is no immediate interpretation. The Federal Finan-cial Agency requested reviews of cartels including a clause on joint advertising although jointadvertising itself was exempted from the requirement to register. Since 23 different clauses areanalyzed, the significance of one variable at the 5% level may also be a simple result by chance.
The observed review requests within the institutional set-up of registered cartels confirmthat the Chambers of Commerce and Agriculture did not actively exercise their powers asparty of proceedings during the cartel application proceedings. Such a passive behavior can berationalized by simple rent-seeking for their members and thus accepting cartels in order to gainrents. For the Chamber of Labor, such a passive behavior has to be rejected since the Chamberof Labor was actively engaged in reviewing specifically those cartels that create larger damages.The Federal Financial Agency that represented the government as an attorney general was alsoactive in reviewing cartels, but its review requests were not recognizably driven by the damageof different cartel types.
5.4 Summary and DiscussionIn summary, this analysis suggests that the damage of cartels was well known but acceptedas part of a greater (macroeconomic) compromise. Wehsely (1979)—a member of the Paritycommittee on cartel matters appointed by the Chamber of Labor—stresses that the approvalof registered cartels instead of prohibition was a necessity for social partner’s macro-orientedmanagement of wages and prices in the Parity Commission. So, within the system of registeredcartels, rent-seeking among social partners was the dominant strategy. However—as also Wieserand Kitzmantel (1989) point out—this microeconomic policy failure was part of a larger com-promise on macroeconomic policy goals that contributed to Austria’s excellent macroeconomicperformance after World War II until the 1980s.
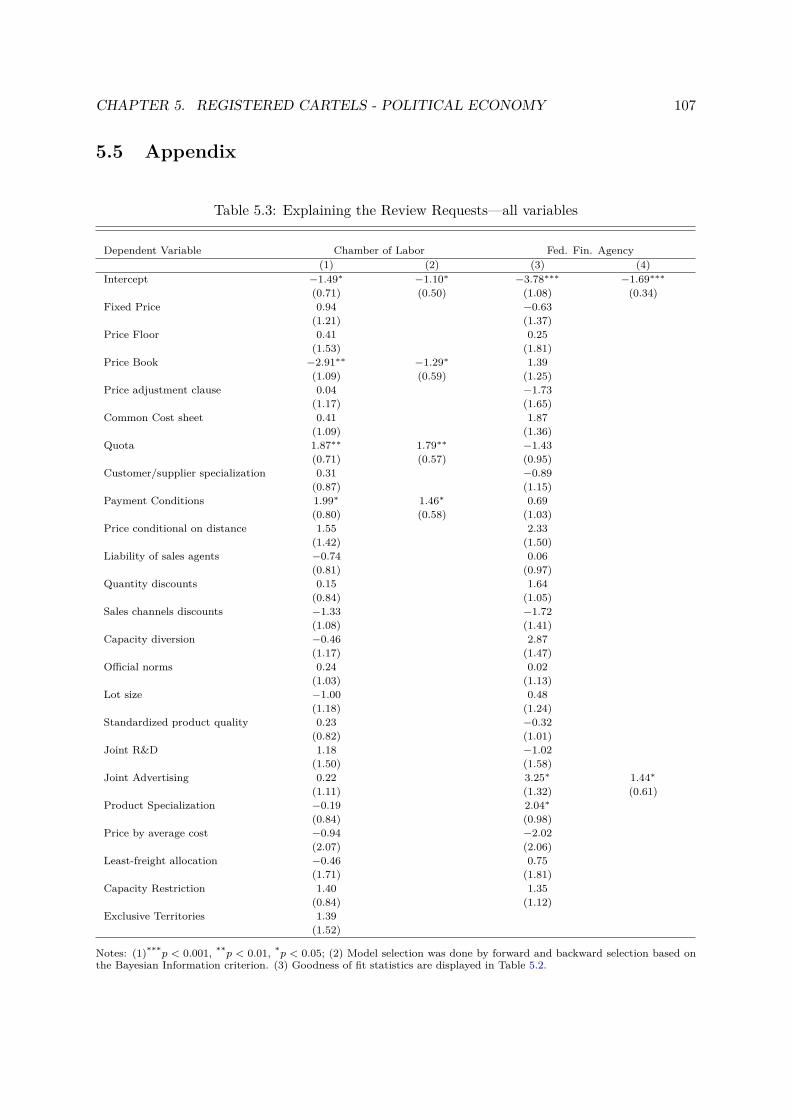
CHAPTER 5. REGISTERED CARTELS - POLITICAL ECONOMY 107
5.5 Appendix
Table 5.3: Explaining the Review Requests—all variables
Dependent Variable Chamber of Labor Fed. Fin. Agency(1) (2) (3) (4)
Intercept −1.49∗ −1.10∗ −3.78∗∗∗ −1.69∗∗∗
(0.71) (0.50) (1.08) (0.34)Fixed Price 0.94 −0.63
(1.21) (1.37)Price Floor 0.41 0.25
(1.53) (1.81)Price Book −2.91∗∗ −1.29∗ 1.39
(1.09) (0.59) (1.25)Price adjustment clause 0.04 −1.73
(1.17) (1.65)Common Cost sheet 0.41 1.87
(1.09) (1.36)Quota 1.87∗∗ 1.79∗∗ −1.43
(0.71) (0.57) (0.95)Customer/supplier specialization 0.31 −0.89
(0.87) (1.15)Payment Conditions 1.99∗ 1.46∗ 0.69
(0.80) (0.58) (1.03)Price conditional on distance 1.55 2.33
(1.42) (1.50)Liability of sales agents −0.74 0.06
(0.81) (0.97)Quantity discounts 0.15 1.64
(0.84) (1.05)Sales channels discounts −1.33 −1.72
(1.08) (1.41)Capacity diversion −0.46 2.87
(1.17) (1.47)Official norms 0.24 0.02
(1.03) (1.13)Lot size −1.00 0.48
(1.18) (1.24)Standardized product quality 0.23 −0.32
(0.82) (1.01)Joint R&D 1.18 −1.02
(1.50) (1.58)Joint Advertising 0.22 3.25∗ 1.44∗
(1.11) (1.32) (0.61)Product Specialization −0.19 2.04∗
(0.84) (0.98)Price by average cost −0.94 −2.02
(2.07) (2.06)Least-freight allocation −0.46 0.75
(1.71) (1.81)Capacity Restriction 1.40 1.35
(0.84) (1.12)Exclusive Territories 1.39
(1.52)
Notes: (1)***p < 0.001, **p < 0.01, *p < 0.05; (2) Model selection was done by forward and backward selection based onthe Bayesian Information criterion. (3) Goodness of fit statistics are displayed in Table 5.2.
Chapter 6
A registered Cartel and its End.Cementing Industry Structure
6.1 IntroductionAustria entered the EU on January 1st, 1995. The long-lasting practice of simply registering acartel became illegal. This paper describes and evaluates the shift in Austria’s economic policydue to EU accession with respect to the cement industry. First, I describe and analyze whetherand—if so—how the institutional set-up prior to EU accession was able to limit the marketpower of the cement industry. Second, I discuss the effects of the institutional shift on demand,prices, profits, employment, industry structure and price discrimination and its effect on theaccuracy of price indices.
In a review of Austrian economic policy prior to the application to become a member of theEuropean communities in 1988, Wieser and Kitzmantel (1989) argue that Austria’s macroeco-nomic performance was excellent. Macroeconomic policies benefited from the ability of socialpartners (an Austrian specific form of corporatism) to compromise. Contrary to the excellentmacroeconomic performance, social partners’ compromises exerted often decisive influence ondetailed legislation as distributional consequences and specific interests of specific social partnerswere much clearer. This led to a lack of microeconomic policy reform. The ossified institutionalset-up impeded reforms.
EU accession was seen as a remedy. The representants of workers expected to close the wagegap towards higher wages in neighboring south Germany and to reduce rent-seeking by increas-ing competition among Austrian firms. Industry representatives on the other hand perceivedaccession as a deregulation in favor of the industry.
A specifically ossified example was competition policy where the cartel law required cartelssolely to register and price increases were approved by social partners. Pollan (1992) describesthat social partner’s price regulation lacked manpower and knowledge to sufficiently restrictprice increases solely to cost increases. Furthermore, combined pressure from firms and workersto increase prices in specific industries led to higher prices where these interests were efficientlyorganized. Reverse, a procedure how to reduce prices did not even exist (Farnleitner, 1977).
A specific industry example is the Austrian cement industry. Fersterer (1996) studies themarket power of the Austrian cement industry and presents some estimates that the industrypriced above cost but within an area of inelastic demand. Aiginger and Pfaffermayr (1997)study the European cement and the pulp/paper industries including Austria and decompose
108
CHAPTER 6. A REGISTERED CARTEL AND ITS END: CEMENT 109
the total welfare loss due to imperfectly competitive markets into a deadweight loss triangle anda cost side inefficiency effect. According to them, not all firms utilized the lowest cost techniquebut continued to exist and the deadweight loss was smaller than the cost inefficiency effect.
In a recent study on the cement industry in the US Southwest, Miller and Osborne (2014)show that there is spatial differentiation in the cement market and that isolated plants are able tosell at higher mill prices to nearby customers. Accordingly, disallowing for price discriminationwould increase consumer surplus. Salvo (2010) reveals that limit pricing relative to the threatof imports explains the pricing of Brazil’s cement industry. Fink and Frübing (2015) comparecollusion in the cement industry in legal and illegal settings and present similarities in monitoringbut differences in allocation of customers, pricing and compensation mechanisms for deviations.Röller and Steen (2006) illustrate that the inner workings of the Norwegian cement cartel createdan incentive for each member to expand capacity for exports in order to receive a larger sharewithin the domestic cartel. Harrington Jr et al. (2015) study the German cement cartel from1991-2002 and argue that an expanding cartel member started to cheat when demand growthdisappeared and finally caused the collapse of the cartel.
Normann and Tan (2013) analyze the German power-cabel industry and present an empiricalevaluation that exempting its cartel from the general prohibition policy raised the industry’sprofits. Crandall and Winston (2003) argue that there is no clear evidence that the prosecutionof cartels has systemically led to a non-transitory decrease in consumer prices. Contrarily,Werden (2003) and Connor (2014) point out the impressive evidence on price-raising effect ofcartels. Baker (2003) argues that antitrust enforcement is vital to promote economic growth,innovation and prosperity. Levenstein and Suslow (2006) survey the literature on cartel successand stress the need to evaluate the effects of cartels on investment and productivity. Symeonidis(2002) studies the end of British legal cartels and finds that intensified competition increasedindustry concentration.
The remainder of this chapter is organized as follows. Section 6.2 presents the relevantfacts on the cement industry and describes the institutional set-up and the inner workings ofthe cartel. Section 6.3 develops some hypothesis how the institutional set-up prior to 1995and the shift due to the EU accession affected the industry. Section 6.4 presents the availabledata and provides some descriptives tables and figures on the relevant questions. Section 6.5tests whether the price regulation regime succeeded in limiting prices close to cost and howthe institutional shift affected prices, profits, employment and entry/exit decisions. Section 6.6describes the emergence of price discrimination with respect to cement bag prices and its effecton price indices used for price adjustment. Section 6.7 summarizes the results and relates themto the literature and concludes.
6.2 Background on the Industry and the CartelIn this section, I present the relevant background on the cement industry and summarize theinner workings of the cement cartel, where all domestic cement suppliers took part from 1951to 1995.
CHAPTER 6. A REGISTERED CARTEL AND ITS END: CEMENT 110
6.2.1 Background on the Cement Industry
Cement is a hydraulic binder.1 It is a homogenous product, national or international standardsguarantee product quality. It is cheap to produce but heavy and dispatched in bulk or bagged.The storability is limited to a few months because cement attracts water from the surroundingenvironment and then it starts lumping.
The most common type—portland cement—consists of about 70% clinker. Clinker is theessential and main constituent of most different kinds of cement. The mixing of additiveswith clinker produces different kinds of cement. Easy mixing and thus supply side substitutionamong different kinds of cement including different additives ensures competition among allcement producers. Cement clinker is produced in rotary kilns out of limestone at temperaturesof 1400-1450 °Celsius which requires about 2.8 gigajoule of thermal energy per ton of cement(Berger and Hoenig, 2010). The duration of operating times of a kiln is the main adjustmentparameter for output because kilns normally operate at peak capacity (Miller and Osborne,2014). The raw material and the clinker need to be grinded. These mechanical and otherprocesses require about 0.4 gigajoule of electricity per ton of cement (Berger and Hoenig, 2010).The production is capital-intensive, the main three variable cost components are thermal energy,electricity and labor. Further variable cost components are material and maintenance. Carbondioxide is liberated during the chemical process of clinker production. If a carbon tradingsystem exists and additional emission certificates are required, certificates are another variablecost component. In order to establish a new cement plant, capital, access to raw materials andhandling environmental concerns is essential. Recently, Riccardi et al. (2012) found that theAustrian cement industry is one of the most efficient with respect to low emissions of carbondioxide.
Cement is an essential but low cost input (2% of total cost (d’Aspremont et al., 2000)) inthe construction industry. In Austria in 2010, 60% of cement are used to produce ready-mixedconcrete, 20% is used by producers of precast concrete elements, 10% of cement is sold in bulkfor other uses and another 10% is sold in bags (Berger and Hoenig, 2010).
Empirical demand estimations often find an inelastic demand (Fersterer (1996) for Austria).There are strong economies of scale in logistics. For example, d’Aspremont et al. (2000) statethat a truck may carry 25 tons for up to 200 kilometers, a train may carry up to 1300 tons onup to 800 kilometers and a ship may carry 10000 tons to almost any distance. A second issuein purchase logistics of cement is quality control. At least for Austria, some customers requirecement that fulfills an official norm.
Today, customer negotiate privately with cement producers. Essential for the bargainingpower of customers is the ability to substitute towards alternative cement produced by competi-tors. Due to the economies of scale in logistics, larger customers have larger bargaining power(Miller and Osborne, 2014).
Due to the high barriers to entry and the localized competition with a limited number ofsuppliers, the cement industry is cartel-prone (d’Aspremont et al., 2000).
6.2.2 Inner Workings of the Cement Cartel in Austria
The first cartels in the Austrian cement industry formed already in Austria-Hungary before1914 (k.k. Handelsministerium, 1912b). In 1951, the first Austrian cartel law required cartels
1See Verein Betonmarketing (2012) as a basic reference for this section.
CHAPTER 6. A REGISTERED CARTEL AND ITS END: CEMENT 111
to register.2 The cement cartel registered in 1951 and continued to exist until it had to leavethe registry in 1995 when Austria joined the European Union. The written cartel agreementfrom 1980 that is available in the registry regulated the inner workings of the cement cartel inthe manner described below.
Collusive strategy. The cartel fixed prices. The reference product was standard baggedcement, delivered at a railway station with full car-load. The range of surcharges and discountsfor different quantities ranged from +3% surcharge for small quantities to a 6.1% discount forlarge buyers. Bulk cement was sold at a 3% discount, payment conditions were regulated andan offical quality standard was obligatory. The regulated cartel left no room for individual bar-gaining or price discrimination. Competition in quantities as well as capacities was prohibited.Individual quantities were fixed by a quota system (Table 6.1). Excess sales led to compensationpayments in cash or transfers of customers or orders. An investment in additional capacity oran exchange of quotas was forbidden.
Monitoring. In order to restrict secret price cutting or any other cheating, rules weremonitored closely. The cartel relied on a detailed weekly reporting scheme for domestic sales aswell as exports and on an independent auditor for verification. Even non-compliance with theinformation exchange rules like non reporting was subject to punishment.
Entry. The cartel did not impede entry because the cartel law did not allow such limitationof outside competition. Entry occurred in 1962, 1964 and 1980, the entrants were integrated intothe legal cartel—existing quotas were adjusted in order to grant sufficiently large productionquotas to the new entrants.3
Decision taking on output, prices and entry. Decisions on output, price and entryrequired unanimity. Pricing decisions were subject to a formal procedure based on a detailedcalculation scheme that consisted of fixed and variable cost. Fixed cost according to the cartelagreement consisted of 70% of blue collar and all white collar wages, non-variable energy costlike lighting, maintenance cost, freight for input material, depreciation and other cost—thelatter included such diverse expenses like net cost of apartments or donations. Fixed cost wereallocated to the expected total production on a pro rata basis. Variable cost included rawmaterial, energy, packaging cost, overhead cost, freight cost, cost for rebates, a 3% surchargefor technical and commercial risk and finally an 8% profit surcharge. The final cartel price wasdetermined on a weighted average of costs of all cartel members.
Applications for price increases. Social partners4 reviewed the cement industry’s ap-plications for price increases. Applications included cost increases composed of materials, wagesand other cost and their respective weight in cement production. Reverse, there was no proce-dure how to reduce prices (Farnleitner, 1977).
2Chapter 4 provides a detailed description on the legal and political background and the institutional set-up.3For the integration of the last entrant, see the quotas in 1979, 1980 and 1987 in Table 6.1.4The Parity Commission on Price and Wage Issues and, more specifically, its Subcommittee on Prices was
responsible for the review. For details on the composition and powers of these institutions, see chapter 4.
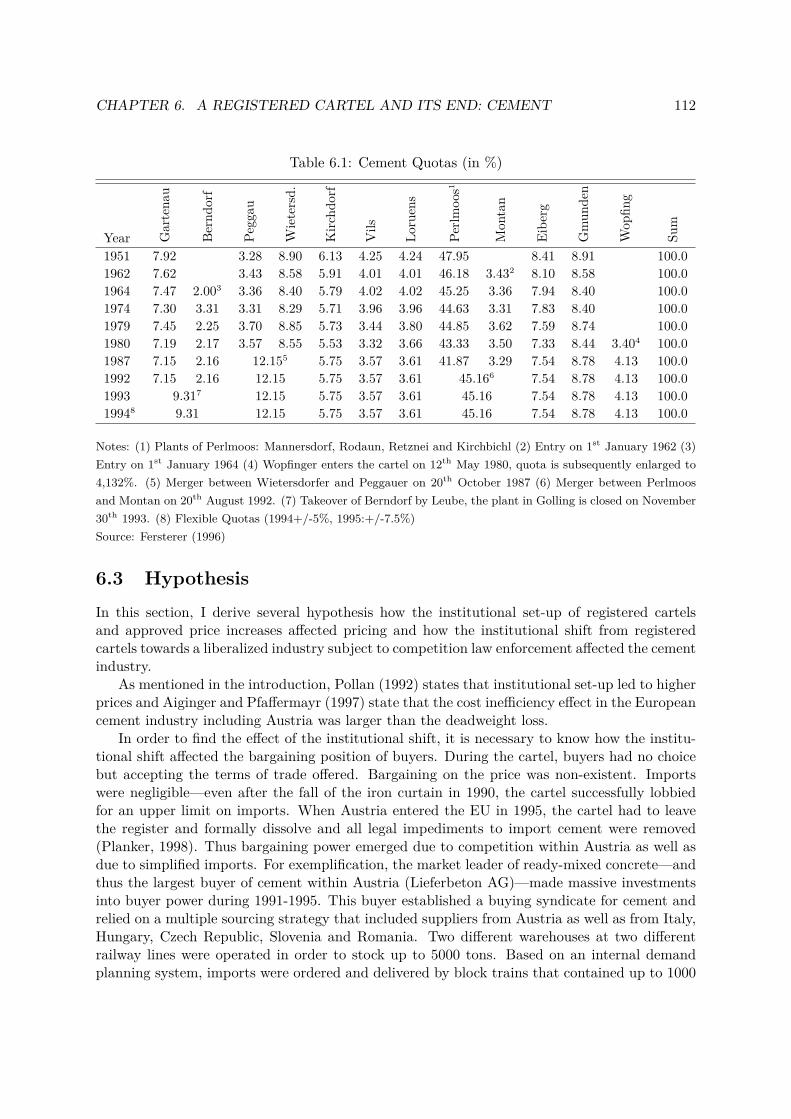
CHAPTER 6. A REGISTERED CARTEL AND ITS END: CEMENT 112
Table 6.1: Cement Quotas (in %)
Year Gartena
u
Berndo
rf
Peggau
Wietersd.
Kirc
hdorf
Vils
Loruens
Perlm
oos1
Mon
tan
Eibe
rg
Gmun
den
Wop
fing
Sum
1951 7.92 3.28 8.90 6.13 4.25 4.24 47.95 8.41 8.91 100.01962 7.62 3.43 8.58 5.91 4.01 4.01 46.18 3.432 8.10 8.58 100.01964 7.47 2.003 3.36 8.40 5.79 4.02 4.02 45.25 3.36 7.94 8.40 100.01974 7.30 3.31 3.31 8.29 5.71 3.96 3.96 44.63 3.31 7.83 8.40 100.01979 7.45 2.25 3.70 8.85 5.73 3.44 3.80 44.85 3.62 7.59 8.74 100.01980 7.19 2.17 3.57 8.55 5.53 3.32 3.66 43.33 3.50 7.33 8.44 3.404 100.01987 7.15 2.16 12.155 5.75 3.57 3.61 41.87 3.29 7.54 8.78 4.13 100.01992 7.15 2.16 12.15 5.75 3.57 3.61 45.166 7.54 8.78 4.13 100.01993 9.317 12.15 5.75 3.57 3.61 45.16 7.54 8.78 4.13 100.019948 9.31 12.15 5.75 3.57 3.61 45.16 7.54 8.78 4.13 100.0
Notes: (1) Plants of Perlmoos: Mannersdorf, Rodaun, Retznei and Kirchbichl (2) Entry on 1st January 1962 (3)Entry on 1st January 1964 (4) Wopfinger enters the cartel on 12th May 1980, quota is subsequently enlarged to4,132%. (5) Merger between Wietersdorfer and Peggauer on 20th October 1987 (6) Merger between Perlmoosand Montan on 20th August 1992. (7) Takeover of Berndorf by Leube, the plant in Golling is closed on November30th 1993. (8) Flexible Quotas (1994+/-5%, 1995:+/-7.5%)Source: Fersterer (1996)
6.3 HypothesisIn this section, I derive several hypothesis how the institutional set-up of registered cartelsand approved price increases affected pricing and how the institutional shift from registeredcartels towards a liberalized industry subject to competition law enforcement affected the cementindustry.
As mentioned in the introduction, Pollan (1992) states that institutional set-up led to higherprices and Aiginger and Pfaffermayr (1997) state that the cost inefficiency effect in the Europeancement industry including Austria was larger than the deadweight loss.
In order to find the effect of the institutional shift, it is necessary to know how the institu-tional shift affected the bargaining position of buyers. During the cartel, buyers had no choicebut accepting the terms of trade offered. Bargaining on the price was non-existent. Importswere negligible—even after the fall of the iron curtain in 1990, the cartel successfully lobbiedfor an upper limit on imports. When Austria entered the EU in 1995, the cartel had to leavethe register and formally dissolve and all legal impediments to import cement were removed(Planker, 1998). Thus bargaining power emerged due to competition within Austria as well asdue to simplified imports. For exemplification, the market leader of ready-mixed concrete—andthus the largest buyer of cement within Austria (Lieferbeton AG)—made massive investmentsinto buyer power during 1991-1995. This buyer established a buying syndicate for cement andrelied on a multiple sourcing strategy that included suppliers from Austria as well as from Italy,Hungary, Czech Republic, Slovenia and Romania. Two different warehouses at two differentrailway lines were operated in order to stock up to 5000 tons. Based on an internal demandplanning system, imports were ordered and delivered by block trains that contained up to 1000
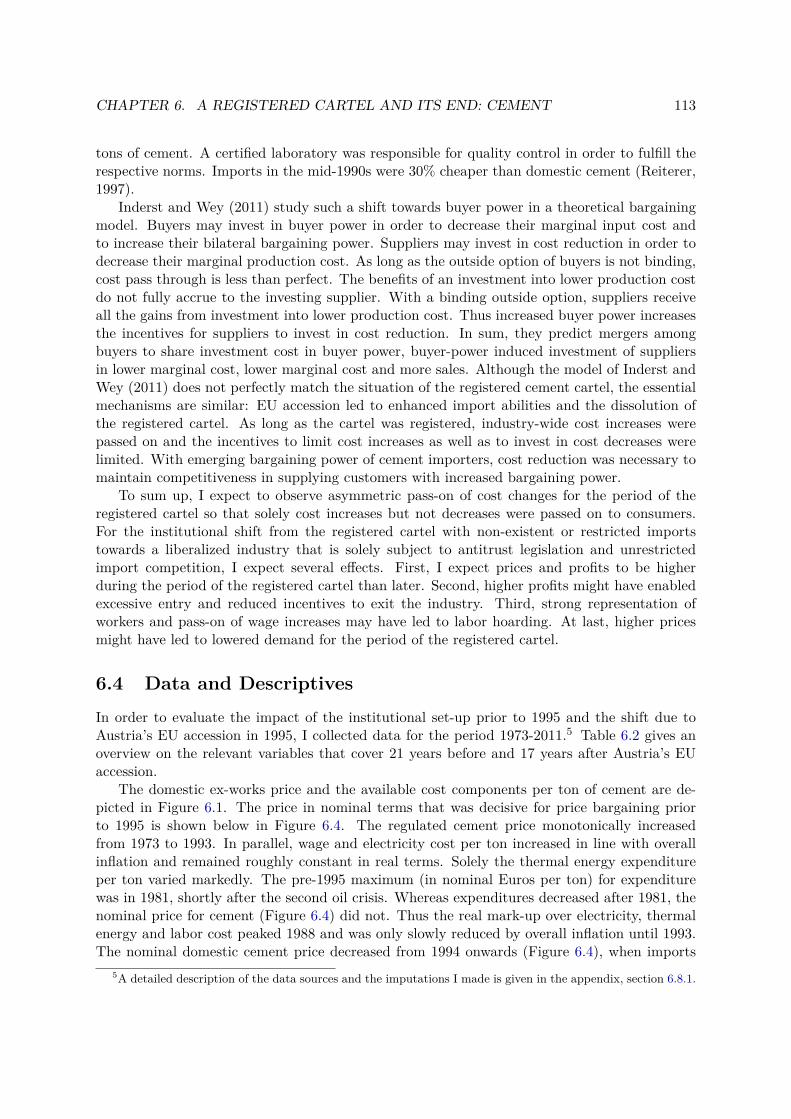
CHAPTER 6. A REGISTERED CARTEL AND ITS END: CEMENT 113
tons of cement. A certified laboratory was responsible for quality control in order to fulfill therespective norms. Imports in the mid-1990s were 30% cheaper than domestic cement (Reiterer,1997).
Inderst and Wey (2011) study such a shift towards buyer power in a theoretical bargainingmodel. Buyers may invest in buyer power in order to decrease their marginal input cost andto increase their bilateral bargaining power. Suppliers may invest in cost reduction in order todecrease their marginal production cost. As long as the outside option of buyers is not binding,cost pass through is less than perfect. The benefits of an investment into lower production costdo not fully accrue to the investing supplier. With a binding outside option, suppliers receiveall the gains from investment into lower production cost. Thus increased buyer power increasesthe incentives for suppliers to invest in cost reduction. In sum, they predict mergers amongbuyers to share investment cost in buyer power, buyer-power induced investment of suppliersin lower marginal cost, lower marginal cost and more sales. Although the model of Inderst andWey (2011) does not perfectly match the situation of the registered cement cartel, the essentialmechanisms are similar: EU accession led to enhanced import abilities and the dissolution ofthe registered cartel. As long as the cartel was registered, industry-wide cost increases werepassed on and the incentives to limit cost increases as well as to invest in cost decreases werelimited. With emerging bargaining power of cement importers, cost reduction was necessary tomaintain competitiveness in supplying customers with increased bargaining power.
To sum up, I expect to observe asymmetric pass-on of cost changes for the period of theregistered cartel so that solely cost increases but not decreases were passed on to consumers.For the institutional shift from the registered cartel with non-existent or restricted importstowards a liberalized industry that is solely subject to antitrust legislation and unrestrictedimport competition, I expect several effects. First, I expect prices and profits to be higherduring the period of the registered cartel than later. Second, higher profits might have enabledexcessive entry and reduced incentives to exit the industry. Third, strong representation ofworkers and pass-on of wage increases may have led to labor hoarding. At last, higher pricesmight have led to lowered demand for the period of the registered cartel.
6.4 Data and DescriptivesIn order to evaluate the impact of the institutional set-up prior to 1995 and the shift due toAustria’s EU accession in 1995, I collected data for the period 1973-2011.5 Table 6.2 gives anoverview on the relevant variables that cover 21 years before and 17 years after Austria’s EUaccession.
The domestic ex-works price and the available cost components per ton of cement are de-picted in Figure 6.1. The price in nominal terms that was decisive for price bargaining priorto 1995 is shown below in Figure 6.4. The regulated cement price monotonically increasedfrom 1973 to 1993. In parallel, wage and electricity cost per ton increased in line with overallinflation and remained roughly constant in real terms. Solely the thermal energy expenditureper ton varied markedly. The pre-1995 maximum (in nominal Euros per ton) for expenditurewas in 1981, shortly after the second oil crisis. Whereas expenditures decreased after 1981, thenominal price for cement (Figure 6.4) did not. Thus the real mark-up over electricity, thermalenergy and labor cost peaked 1988 and was only slowly reduced by overall inflation until 1993.The nominal domestic cement price decreased from 1994 onwards (Figure 6.4), when imports
5A detailed description of the data sources and the imputations I made is given in the appendix, section 6.8.1.
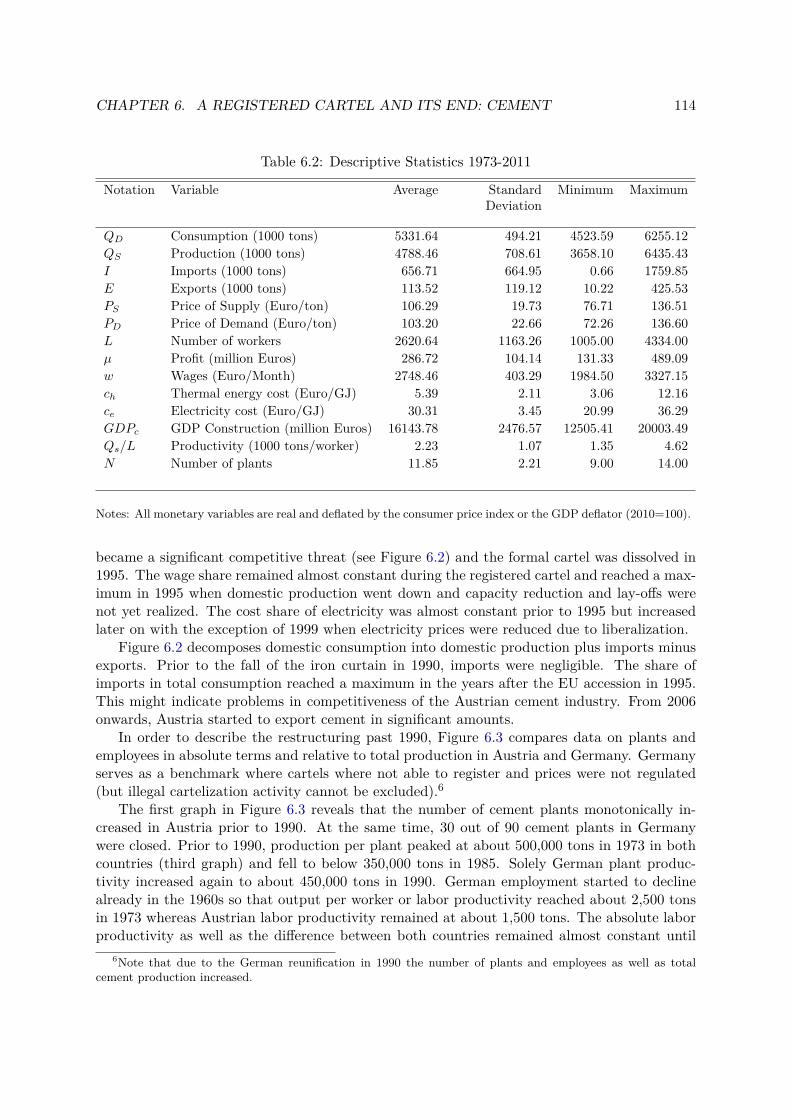
CHAPTER 6. A REGISTERED CARTEL AND ITS END: CEMENT 114
Table 6.2: Descriptive Statistics 1973-2011
Notation Variable Average StandardDeviation
Minimum Maximum
QD Consumption (1000 tons) 5331.64 494.21 4523.59 6255.12QS Production (1000 tons) 4788.46 708.61 3658.10 6435.43I Imports (1000 tons) 656.71 664.95 0.66 1759.85E Exports (1000 tons) 113.52 119.12 10.22 425.53PS Price of Supply (Euro/ton) 106.29 19.73 76.71 136.51PD Price of Demand (Euro/ton) 103.20 22.66 72.26 136.60L Number of workers 2620.64 1163.26 1005.00 4334.00µ Profit (million Euros) 286.72 104.14 131.33 489.09w Wages (Euro/Month) 2748.46 403.29 1984.50 3327.15ch Thermal energy cost (Euro/GJ) 5.39 2.11 3.06 12.16ce Electricity cost (Euro/GJ) 30.31 3.45 20.99 36.29GDPc GDP Construction (million Euros) 16143.78 2476.57 12505.41 20003.49Qs/L Productivity (1000 tons/worker) 2.23 1.07 1.35 4.62N Number of plants 11.85 2.21 9.00 14.00
Notes: All monetary variables are real and deflated by the consumer price index or the GDP deflator (2010=100).
became a significant competitive threat (see Figure 6.2) and the formal cartel was dissolved in1995. The wage share remained almost constant during the registered cartel and reached a max-imum in 1995 when domestic production went down and capacity reduction and lay-offs werenot yet realized. The cost share of electricity was almost constant prior to 1995 but increasedlater on with the exception of 1999 when electricity prices were reduced due to liberalization.
Figure 6.2 decomposes domestic consumption into domestic production plus imports minusexports. Prior to the fall of the iron curtain in 1990, imports were negligible. The share ofimports in total consumption reached a maximum in the years after the EU accession in 1995.This might indicate problems in competitiveness of the Austrian cement industry. From 2006onwards, Austria started to export cement in significant amounts.
In order to describe the restructuring past 1990, Figure 6.3 compares data on plants andemployees in absolute terms and relative to total production in Austria and Germany. Germanyserves as a benchmark where cartels where not able to register and prices were not regulated(but illegal cartelization activity cannot be excluded).6
The first graph in Figure 6.3 reveals that the number of cement plants monotonically in-creased in Austria prior to 1990. At the same time, 30 out of 90 cement plants in Germanywere closed. Prior to 1990, production per plant peaked at about 500,000 tons in 1973 in bothcountries (third graph) and fell to below 350,000 tons in 1985. Solely German plant produc-tivity increased again to about 450,000 tons in 1990. German employment started to declinealready in the 1960s so that output per worker or labor productivity reached about 2,500 tonsin 1973 whereas Austrian labor productivity remained at about 1,500 tons. The absolute laborproductivity as well as the difference between both countries remained almost constant until
6Note that due to the German reunification in 1990 the number of plants and employees as well as totalcement production increased.
CHAPTER 6. A REGISTERED CARTEL AND ITS END: CEMENT 115
Figure 6.1: Domestic Cement Prices and Costs (Euro/ton)
1973
1974
1975
1976
1977
1978
1979
1980
1981
1982
1983
1984
1985
1986
1987
1988
1989
1990
1991
1992
1993
1994
1995
1996
1997
1998
1999
2000
2001
2002
2003
2004
2005
2006
2007
2008
2009
2010
2011
labor (Eur/t)electricity (Eur/t)thermal energy (Eur/t)mark−up (Eur/t)
020
4060
8010
012
014
0
Sources: See the Appendix, Section 6.8.1 for detailed information on data sources and data imputations. Notes:(1) All variables are real and deflated by the consumer price index (2010=100). (2) The vertical line indicatesAustria’s EU accession on January 1st, 1995.
1990 (second and fourth graph).The restructuring in the Austrian cement industry took place between 1990 and 2000. Five
out of fourteen cement plants were closed. Employment was reduced by more than 50% inAustria whereas in Germany, the number of plants remained almost constant and employmentshows only a slight decrease from 1991 to 2000. In terms of productivity (production/plant andproduction/employee) Austria matched Germany only in 2005-2010.
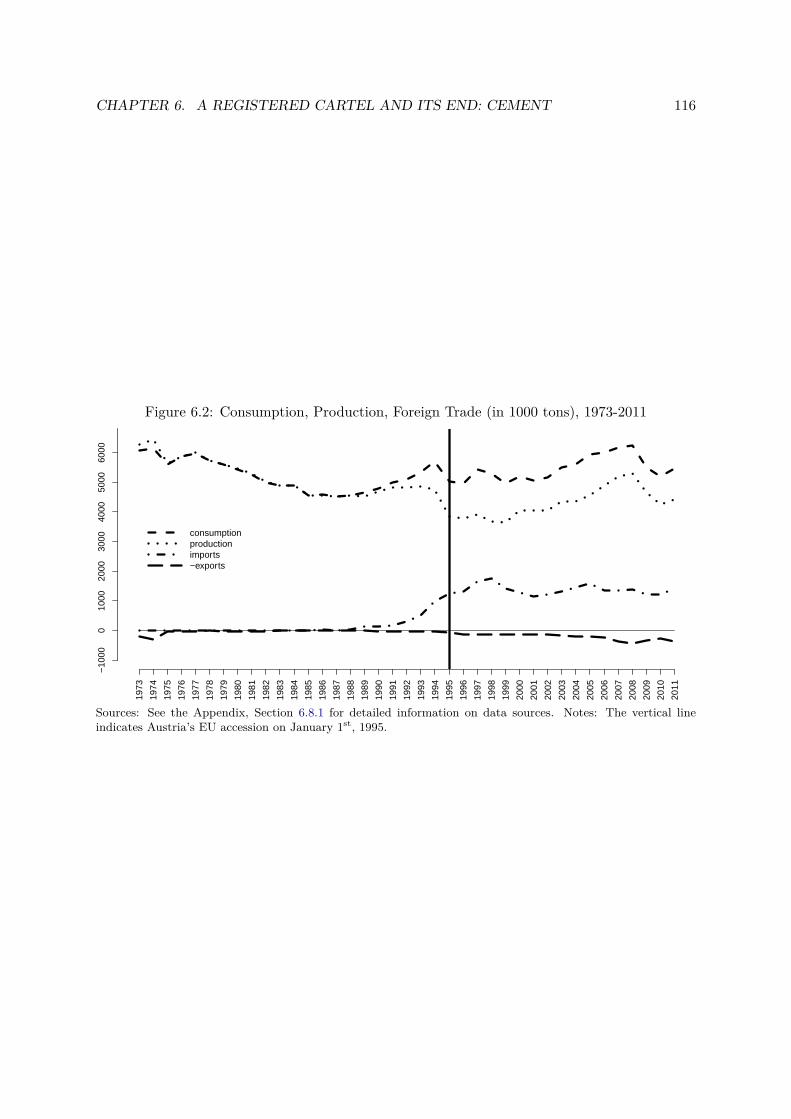
CHAPTER 6. A REGISTERED CARTEL AND ITS END: CEMENT 116
Figure 6.2: Consumption, Production, Foreign Trade (in 1000 tons), 1973-2011
1973
1974
1975
1976
1977
1978
1979
1980
1981
1982
1983
1984
1985
1986
1987
1988
1989
1990
1991
1992
1993
1994
1995
1996
1997
1998
1999
2000
2001
2002
2003
2004
2005
2006
2007
2008
2009
2010
2011
−10
000
1000
2000
3000
4000
5000
6000
consumptionproductionimports−exports
Sources: See the Appendix, Section 6.8.1 for detailed information on data sources. Notes: The vertical lineindicates Austria’s EU accession on January 1st, 1995.
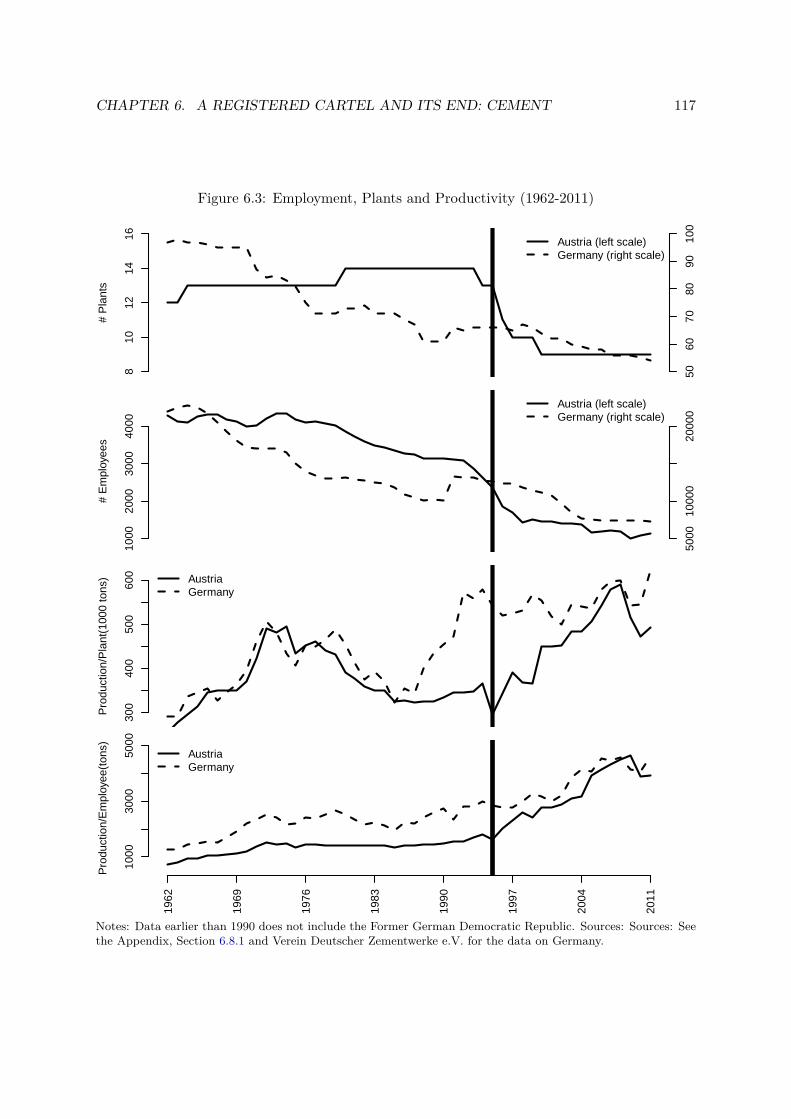
CHAPTER 6. A REGISTERED CARTEL AND ITS END: CEMENT 117
Figure 6.3: Employment, Plants and Productivity (1962-2011)
810
1214
16
Index
# P
lant
s
Austria (left scale)Germany (right scale)
Index
5060
7080
9010
0
1000
2000
3000
4000
Index
# E
mpl
oyee
s
Austria (left scale)Germany (right scale)
Index
5000
1000
020
000
300
400
500
600
Index
Pro
duct
ion/
Pla
nt(1
000
tons
)
Index
AustriaGermany
1000
3000
5000
Pro
duct
ion/
Em
ploy
ee(t
ons)
1962
1969
1976
1983
1990
1997
2004
2011
AustriaGermany
Notes: Data earlier than 1990 does not include the Former German Democratic Republic. Sources: Sources: Seethe Appendix, Section 6.8.1 and Verein Deutscher Zementwerke e.V. for the data on Germany.
CHAPTER 6. A REGISTERED CARTEL AND ITS END: CEMENT 118
6.5 Empirical ModelsThis section is essentially split in two parts that both rely on empirical methods to test theeffects of the registered cartel and its dissolution. In the first part, I evaluate the pricing duringthe period of the registered cartel. In the second, I focus on the institutional shift and its effecton prices, profits, employment and industry structure.
6.5.1 Evaluation of the Price Approval Procedure
Equation 6.1 presents a more formal regression on the relation of price to cost changes duringthe period of the registered cartel and approved pricing for 1973-1993.7 ∆p is the observedchange in the average price in euros per ton of cement. For energy, ∆ch is the absolute changein euros per gigajoule (GJ) for thermal energy, ∆ce is the absolute change in euros per gigajouleof electricity, and ∆cw is the relative percentage change in effective wages.8
∆p = ∆ch + ∆ce + ∆cw + u (6.1)
The expectation is that the average usage of the respective inputs for a ton of cementdetermines the impact of an input price change on the output price for cement. The averageusage for thermal energy is 3.02 GJ/ton for 1973-1993, 0.40 GJ/ton for electricity, and a 23.5%share of wages relative to revenues. I omit the number of employees. First, the productivityin terms of output per worker was relatively constant. Second, it is important to keep in mindthat neither the Chamber of Commerce nor the Chamber of Labor had an interest in loweringprices due to lower wage cost. The Chamber of Labor represented workers and did not ask fordismissals of workers.9 Third, a procedure to reduce prices due to a reduction of the labor forcedid not exist.
The regressors are exogenous. The cost for thermal energy and electricity are exogenous toAustrian cement demand. Variation in the input prices stems from worldwide energy price fluc-tuations and regulated electricity prices within Austria. Effective nominal wage cost increasesare negotiated at the level of the Austrian Association for Building Materials and Ceramic In-dustries, where the cement industry accounts for less than 20% of employees. Variation in wageincreases is mainly driven by general economic conditions like economic growth and inflation.
Table 6.3 presents the results on the pricing regression in Equation 6.1 for the regulatoryregime prior to 1994. Model (1) and (2) are in nominal terms—reflecting the actual negotiationsin the subcommittee on prices. Model (3) and (4) are in real terms—the negative constant termin the real models accounts for the fact that a non-adjustment of the nominal price led to anactual decrease of the real price. For the real models, the coefficients for electricity and wageincreases become slightly insignificant at the 5% level, but the estimates are in line with thenominal model.
7Data availability restrictions required to start in 1973. Eroding cartel pricing due to imports required toinclude 1993 as the last year of effective price regulation and cartelization.
8I choose the percentage change in effective wages because the protocols of the Parity’s subcommittee onprices explicitly refer to such increases (“Lohntangente”).
9Wehsely (1979, p.199) admits that job security was still an issue when the cartels were prolonged in the1970s. Productivity started to improve only from 1990 onwards—when the iron curtain fell, imports started andthe probability of EU accession rose. I ran a regression including employment as an explanatory variable, andthe results remained robust.
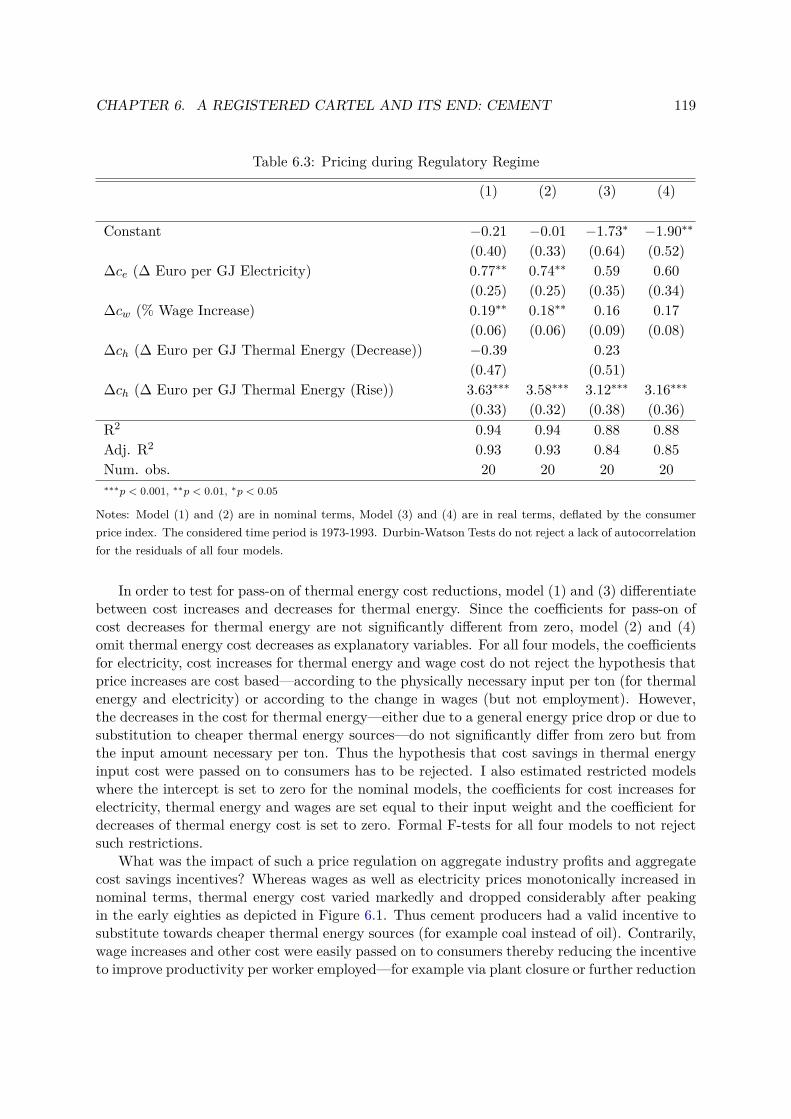
CHAPTER 6. A REGISTERED CARTEL AND ITS END: CEMENT 119
Table 6.3: Pricing during Regulatory Regime
(1) (2) (3) (4)
Constant −0.21 −0.01 −1.73∗ −1.90∗∗
(0.40) (0.33) (0.64) (0.52)∆ce (∆ Euro per GJ Electricity) 0.77∗∗ 0.74∗∗ 0.59 0.60
(0.25) (0.25) (0.35) (0.34)∆cw (% Wage Increase) 0.19∗∗ 0.18∗∗ 0.16 0.17
(0.06) (0.06) (0.09) (0.08)∆ch (∆ Euro per GJ Thermal Energy (Decrease)) −0.39 0.23
(0.47) (0.51)∆ch (∆ Euro per GJ Thermal Energy (Rise)) 3.63∗∗∗ 3.58∗∗∗ 3.12∗∗∗ 3.16∗∗∗
(0.33) (0.32) (0.38) (0.36)R2 0.94 0.94 0.88 0.88Adj. R2 0.93 0.93 0.84 0.85Num. obs. 20 20 20 20∗∗∗p < 0.001, ∗∗p < 0.01, ∗p < 0.05
Notes: Model (1) and (2) are in nominal terms, Model (3) and (4) are in real terms, deflated by the consumerprice index. The considered time period is 1973-1993. Durbin-Watson Tests do not reject a lack of autocorrelationfor the residuals of all four models.
In order to test for pass-on of thermal energy cost reductions, model (1) and (3) differentiatebetween cost increases and decreases for thermal energy. Since the coefficients for pass-on ofcost decreases for thermal energy are not significantly different from zero, model (2) and (4)omit thermal energy cost decreases as explanatory variables. For all four models, the coefficientsfor electricity, cost increases for thermal energy and wage cost do not reject the hypothesis thatprice increases are cost based—according to the physically necessary input per ton (for thermalenergy and electricity) or according to the change in wages (but not employment). However,the decreases in the cost for thermal energy—either due to a general energy price drop or due tosubstitution to cheaper thermal energy sources—do not significantly differ from zero but fromthe input amount necessary per ton. Thus the hypothesis that cost savings in thermal energyinput cost were passed on to consumers has to be rejected. I also estimated restricted modelswhere the intercept is set to zero for the nominal models, the coefficients for cost increases forelectricity, thermal energy and wages are set equal to their input weight and the coefficient fordecreases of thermal energy cost is set to zero. Formal F-tests for all four models to not rejectsuch restrictions.
What was the impact of such a price regulation on aggregate industry profits and aggregatecost savings incentives? Whereas wages as well as electricity prices monotonically increased innominal terms, thermal energy cost varied markedly and dropped considerably after peakingin the early eighties as depicted in Figure 6.1. Thus cement producers had a valid incentive tosubstitute towards cheaper thermal energy sources (for example coal instead of oil). Contrarily,wage increases and other cost were easily passed on to consumers thereby reducing the incentiveto improve productivity per worker employed—for example via plant closure or further reduction
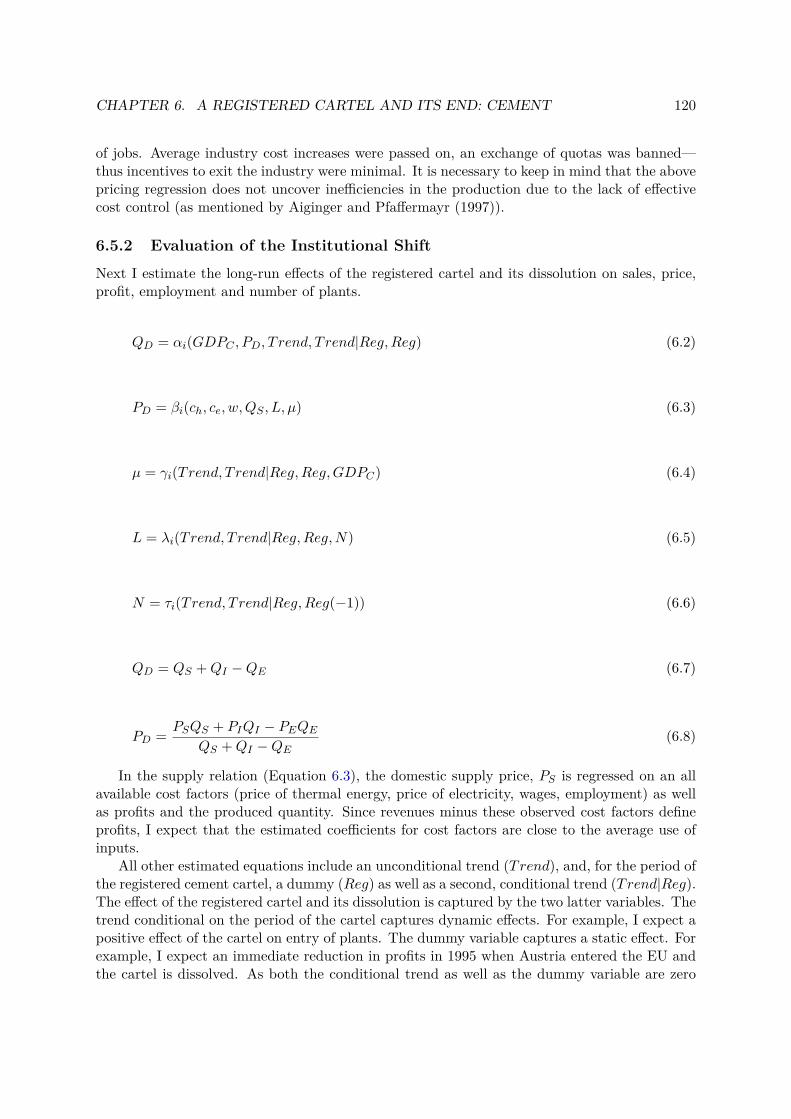
CHAPTER 6. A REGISTERED CARTEL AND ITS END: CEMENT 120
of jobs. Average industry cost increases were passed on, an exchange of quotas was banned—thus incentives to exit the industry were minimal. It is necessary to keep in mind that the abovepricing regression does not uncover inefficiencies in the production due to the lack of effectivecost control (as mentioned by Aiginger and Pfaffermayr (1997)).
6.5.2 Evaluation of the Institutional Shift
Next I estimate the long-run effects of the registered cartel and its dissolution on sales, price,profit, employment and number of plants.
QD = αi(GDPC , PD, T rend, Trend|Reg,Reg) (6.2)
PD = βi(ch, ce, w,QS , L, µ) (6.3)
µ = γi(Trend, Trend|Reg,Reg,GDPC) (6.4)
L = λi(Trend, Trend|Reg,Reg,N) (6.5)
N = τi(Trend, Trend|Reg,Reg(−1)) (6.6)
QD = QS +QI −QE (6.7)
PD = PSQS + PIQI − PEQEQS +QI −QE
(6.8)
In the supply relation (Equation 6.3), the domestic supply price, PS is regressed on an allavailable cost factors (price of thermal energy, price of electricity, wages, employment) as wellas profits and the produced quantity. Since revenues minus these observed cost factors defineprofits, I expect that the estimated coefficients for cost factors are close to the average use ofinputs.
All other estimated equations include an unconditional trend (Trend), and, for the period ofthe registered cement cartel, a dummy (Reg) as well as a second, conditional trend (Trend|Reg).The effect of the registered cartel and its dissolution is captured by the two latter variables. Thetrend conditional on the period of the cartel captures dynamic effects. For example, I expect apositive effect of the cartel on entry of plants. The dummy variable captures a static effect. Forexample, I expect an immediate reduction in profits in 1995 when Austria entered the EU andthe cartel is dissolved. As both the conditional trend as well as the dummy variable are zero
CHAPTER 6. A REGISTERED CARTEL AND ITS END: CEMENT 121
in 1995 but not before, I have to look at the total effect of this two variables on the dependentvariable.
The domestic demand function (Equation 6.2) additionally depends on construction activityand the price for domestic demand. For construction activity, I expect a positive impact ondomestic demand for cement, for the price I expect a negative impact.
Two further equations include further explanatary variables. I test the existence and the sizeof influence for construction activity on profits (Equation 6.4) and for the (possibly endogenous)number of plants on employment (Equation 6.5). In the equation that aims to explain thenumber of active plants (Equation 6.6), I replace the dummy variable with a one-year laggedvariable (thus a dummy for 1973-1995) in order to take into account that two plants were closedin 1996 but not 1995.
Furthermore, the system of equations includes a market equilibrium condition (Equation6.7) and a definition of the average sales price (Equation 6.8).
In order to directly estimate elasticities, I chose a logarithmic specification as a functionalform.10 But one has to keep in mind, that for larger effects the approximative value of thelogarithm for percentage changes has an increased bias.
As I estimate a system of equations within one industry, I have to consider the question ofendogenous variables. All but the pricing equation (3) include a trend, a conditional trend andthe dummy for the register as explanatory variables. The changes in time as well as the changein the institutional set-up are clearly exogenous to all developments in the cement industry.Construction activity is exogenous to developments in the cement industry, since cement isan essential input that accounts only for an insignificant (and diminishing) cost share of totalconstruction activity. I have already explained above why I assume that wage increases and theprices for electricity and thermal energy are exogenous.
For price, quantity, profits, number of employees and plants I take into account that thesevariables might be endogenous. However, there are some arguments against “strong” endogene-ity for some of these variables. First, the price was regulated prior to 1995 and faced exogenousimport price competition later on.11 Furthermore, the demand for cement is often found tobe inelastic—which is inconsistent with profit-maximizing behavior that takes into account theelasticity of demand when setting prices. Second, but for the same reasons, the variation inquantity is mainly driven by other factors than pricing. Profits and the number of employeesand plants are clearly not independent of developments in the cement industry. However, thereare strong indications that the institutional set-up strongly influenced the industry outcome.
Table 6.4 reports the ordinary least squares and the two-stage least squares estimationresults. For all equations, a unit root for the residuals is rejected. So the assumption ofstationarity of the residuals is not rejected.12
10A linear specification did not lead to significantly different results.11See also Salvo (2010).12My focus is on the long-run effects, thus I do not decompose my equations into a short-run and a long-run
effect as a cointegration analysis would do.
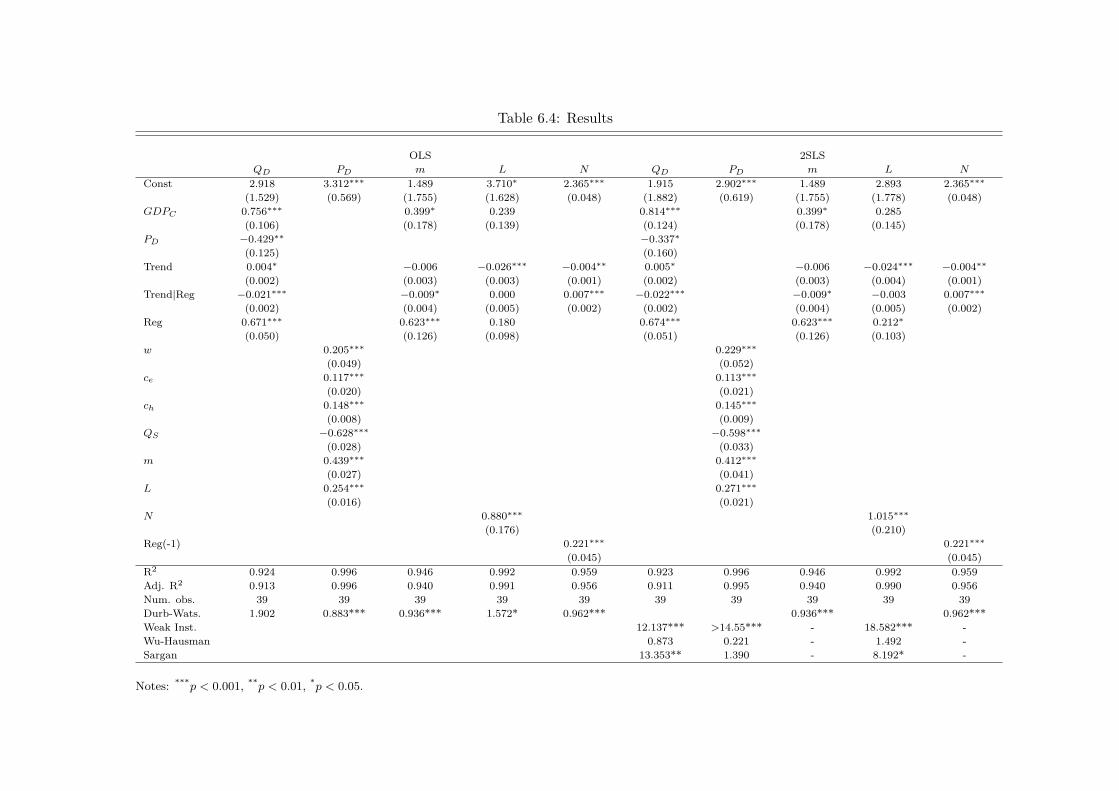
Table 6.4: Results
OLS 2SLSQD PD m L N QD PD m L N
Const 2.918 3.312∗∗∗ 1.489 3.710∗ 2.365∗∗∗ 1.915 2.902∗∗∗ 1.489 2.893 2.365∗∗∗
(1.529) (0.569) (1.755) (1.628) (0.048) (1.882) (0.619) (1.755) (1.778) (0.048)GDPC 0.756∗∗∗ 0.399∗ 0.239 0.814∗∗∗ 0.399∗ 0.285
(0.106) (0.178) (0.139) (0.124) (0.178) (0.145)PD −0.429∗∗ −0.337∗
(0.125) (0.160)Trend 0.004∗ −0.006 −0.026∗∗∗ −0.004∗∗ 0.005∗ −0.006 −0.024∗∗∗ −0.004∗∗
(0.002) (0.003) (0.003) (0.001) (0.002) (0.003) (0.004) (0.001)Trend|Reg −0.021∗∗∗ −0.009∗ 0.000 0.007∗∗∗ −0.022∗∗∗ −0.009∗ −0.003 0.007∗∗∗
(0.002) (0.004) (0.005) (0.002) (0.002) (0.004) (0.005) (0.002)Reg 0.671∗∗∗ 0.623∗∗∗ 0.180 0.674∗∗∗ 0.623∗∗∗ 0.212∗
(0.050) (0.126) (0.098) (0.051) (0.126) (0.103)w 0.205∗∗∗ 0.229∗∗∗
(0.049) (0.052)ce 0.117∗∗∗ 0.113∗∗∗
(0.020) (0.021)ch 0.148∗∗∗ 0.145∗∗∗
(0.008) (0.009)QS −0.628∗∗∗ −0.598∗∗∗
(0.028) (0.033)m 0.439∗∗∗ 0.412∗∗∗
(0.027) (0.041)L 0.254∗∗∗ 0.271∗∗∗
(0.016) (0.021)N 0.880∗∗∗ 1.015∗∗∗
(0.176) (0.210)Reg(-1) 0.221∗∗∗ 0.221∗∗∗
(0.045) (0.045)R2 0.924 0.996 0.946 0.992 0.959 0.923 0.996 0.946 0.992 0.959Adj. R2 0.913 0.996 0.940 0.991 0.956 0.911 0.995 0.940 0.990 0.956Num. obs. 39 39 39 39 39 39 39 39 39 39Durb-Wats. 1.902 0.883*** 0.936*** 1.572* 0.962*** 0.936*** 0.962***Weak Inst. 12.137*** >14.55*** - 18.582*** -Wu-Hausman 0.873 0.221 - 1.492 -Sargan 13.353** 1.390 - 8.192* -
Notes: ***p < 0.001, **p < 0.01, *p < 0.05.
CHAPTER 6. A REGISTERED CARTEL AND ITS END: CEMENT 123
For the equations with potentially endogenous variables (QD, PD, L on the right side ofTable 6.4), my instruments are relevant, since weak instruments are rejected. Furthermore, forall of these equations, the Wu-Hausman test does not reject exogeneity of any variable. Thus Irefer to the OLS estimates.13 Since I am able to rely on the OLS estimates, I do not need totake care of the Sargan test that indicates some instrumental variables that are not exogenousto the residuals.
For the demand relation (Equation 6.2), an 1% increase in construction activity inducesan estimated 0.75% increase of cement demand. The estimated demand elasticity is -0.43 andsignificantly lower than 1. Thus cement demand is inelastic. During the registry, the logarithmof demand was 0.67 higher, but decreased by additional 0.02 each year during 1973-1994. Thetotal effect of the dummy and the time trend for the period of the registered cartels indicatesa demand drop by about 0.2 (or 18%) in 1995 when the cartel dissolved and unlimited importswere allowed. From 1995 onwards, the time trend indicates an additional growth of cementdemand by 0.4%. The interpretation of this equation is not straightforward - neither is it clearwhy the registered cartel had a positive impact on demand nor why the dissolution of theregistered cartel led to a demand drop. For the former impact, it is important to keep in mindthat the share of cement in total construction cost fell from 6.6% in 1973 to about 2% from1995 onwards. This and not the institutional shift might have driven the downward trend incement demand. In sum, I cannot reject the hypothesis that the registered cartel did not havea negative impact on cement demand.
In the estimated supply relation (6.3), relative increases of factor inputs or factor input costsare expected to influence the sales price based on their relative cost share. For 1973-2011, theaverage cost share for thermal energy was 15%, for electricity it was 12% and for labor cost itwas 20%. As expected, the estimated price elasticity with respect to the prices for electricity,thermal energy and wages is 11.3%, 14.5%, 22.9% and thus not significantly different thanthe average cost share. Solely a relative change in employment influences the price by 25%,which is significantly more than the average of 20% suggests. The elasticity with respect toproduction was -0.63, thus an increase of production by 1% led to a decrease of the price by-0.63%. However, I also included profits as an explanatory variable. An increase in profits by1% increased the price by 0.44%. In sum, an increased in production that increased profit by anequal relative size leads to slight decrease in price—this might indicate economies of scale andcoincides with the cartel pricing that allocated fixed cost on a pro rata basis on total expectedproduction according to the rule of the registered cartel.
The endogenous variables employment and profits are considered below. The Durbin-Watsonstatistic in Table 6.4 indicates positive autocorrelation of the residuals and thus a biased esti-mate. For three reasons, the Durbin-Watson test does not matter too much. First, the residualsaccount only for 0.4% of total variance in prices—which indicates a relatively low amount ofbiasedness. Second, the estimates do not significantly differ from the expected estimates that Ialso found in Table 6.3). Third, applying a Newey-West procedure on the model does not haveany significant effect on the significance.
At last, the supply relation is not essential in order to evaluate the long-run effects of thedissolution of the cartel. So a more sophisticated model of the supply relation is not the mainaim of this paper.
Profits depend strongly on the existence of the registered cartel. During the cartel, profitsdecreased each year by roughly -0.9%. This coincides with a decrease of the profits in the last
13For several different estimations methods (SUR, WLS and 3SLS), the results did not significantly differ.
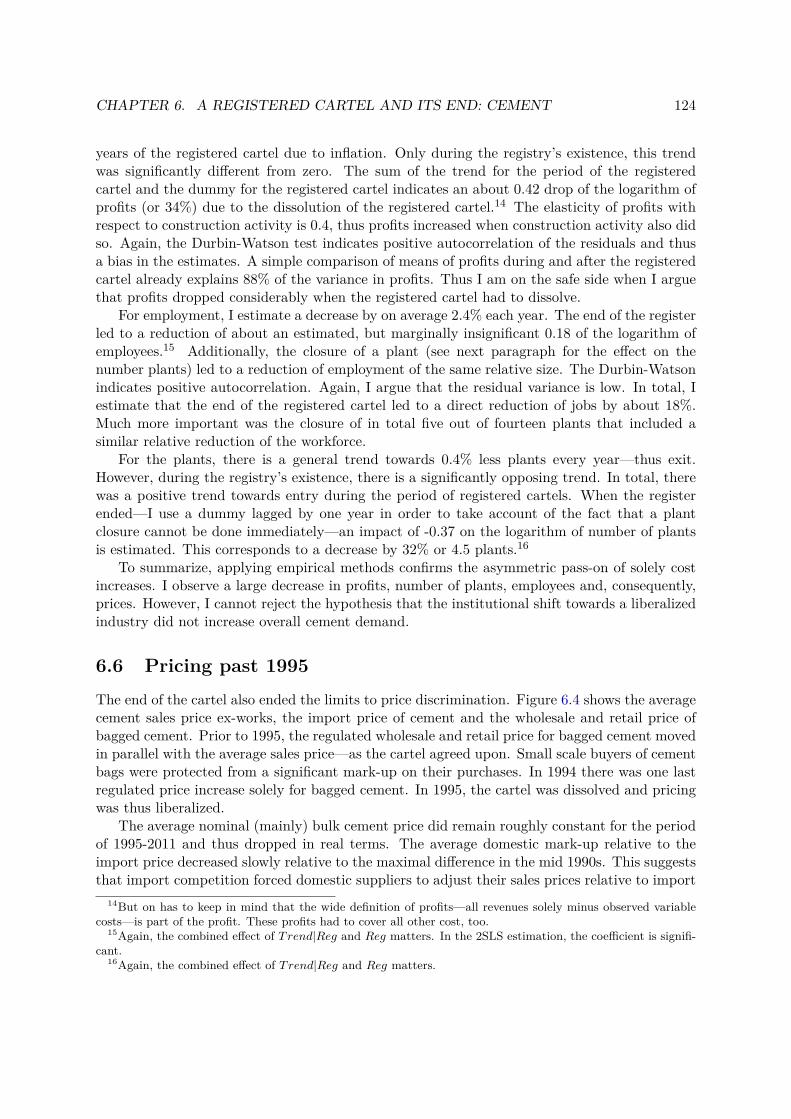
CHAPTER 6. A REGISTERED CARTEL AND ITS END: CEMENT 124
years of the registered cartel due to inflation. Only during the registry’s existence, this trendwas significantly different from zero. The sum of the trend for the period of the registeredcartel and the dummy for the registered cartel indicates an about 0.42 drop of the logarithm ofprofits (or 34%) due to the dissolution of the registered cartel.14 The elasticity of profits withrespect to construction activity is 0.4, thus profits increased when construction activity also didso. Again, the Durbin-Watson test indicates positive autocorrelation of the residuals and thusa bias in the estimates. A simple comparison of means of profits during and after the registeredcartel already explains 88% of the variance in profits. Thus I am on the safe side when I arguethat profits dropped considerably when the registered cartel had to dissolve.
For employment, I estimate a decrease by on average 2.4% each year. The end of the registerled to a reduction of about an estimated, but marginally insignificant 0.18 of the logarithm ofemployees.15 Additionally, the closure of a plant (see next paragraph for the effect on thenumber plants) led to a reduction of employment of the same relative size. The Durbin-Watsonindicates positive autocorrelation. Again, I argue that the residual variance is low. In total, Iestimate that the end of the registered cartel led to a direct reduction of jobs by about 18%.Much more important was the closure of in total five out of fourteen plants that included asimilar relative reduction of the workforce.
For the plants, there is a general trend towards 0.4% less plants every year—thus exit.However, during the registry’s existence, there is a significantly opposing trend. In total, therewas a positive trend towards entry during the period of registered cartels. When the registerended—I use a dummy lagged by one year in order to take account of the fact that a plantclosure cannot be done immediately—an impact of -0.37 on the logarithm of number of plantsis estimated. This corresponds to a decrease by 32% or 4.5 plants.16
To summarize, applying empirical methods confirms the asymmetric pass-on of solely costincreases. I observe a large decrease in profits, number of plants, employees and, consequently,prices. However, I cannot reject the hypothesis that the institutional shift towards a liberalizedindustry did not increase overall cement demand.
6.6 Pricing past 1995The end of the cartel also ended the limits to price discrimination. Figure 6.4 shows the averagecement sales price ex-works, the import price of cement and the wholesale and retail price ofbagged cement. Prior to 1995, the regulated wholesale and retail price for bagged cement movedin parallel with the average sales price—as the cartel agreed upon. Small scale buyers of cementbags were protected from a significant mark-up on their purchases. In 1994 there was one lastregulated price increase solely for bagged cement. In 1995, the cartel was dissolved and pricingwas thus liberalized.
The average nominal (mainly) bulk cement price did remain roughly constant for the periodof 1995-2011 and thus dropped in real terms. The average domestic mark-up relative to theimport price decreased slowly relative to the maximal difference in the mid 1990s. This suggeststhat import competition forced domestic suppliers to adjust their sales prices relative to import
14But on has to keep in mind that the wide definition of profits—all revenues solely minus observed variablecosts—is part of the profit. These profits had to cover all other cost, too.
15Again, the combined effect of T rend|Reg and Reg matters. In the 2SLS estimation, the coefficient is signifi-cant.
16Again, the combined effect of T rend|Reg and Reg matters.
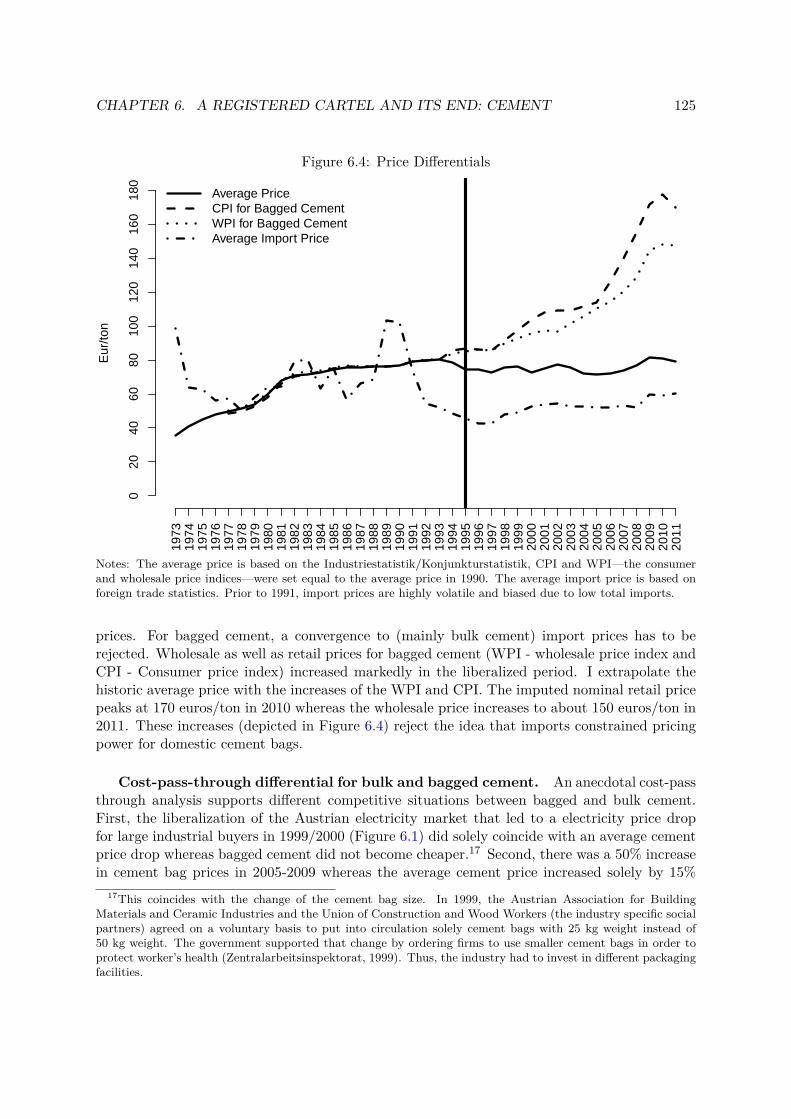
CHAPTER 6. A REGISTERED CARTEL AND ITS END: CEMENT 125
Figure 6.4: Price Differentials19
7319
7419
7519
7619
7719
7819
7919
8019
8119
8219
8319
8419
8519
8619
8719
8819
8919
9019
9119
9219
9319
9419
9519
9619
9719
9819
9920
0020
0120
0220
0320
0420
0520
0620
0720
0820
0920
1020
11
020
4060
8010
012
014
016
018
0
Eur
/ton
Average PriceCPI for Bagged CementWPI for Bagged CementAverage Import Price
Notes: The average price is based on the Industriestatistik/Konjunkturstatistik, CPI and WPI—the consumerand wholesale price indices—were set equal to the average price in 1990. The average import price is based onforeign trade statistics. Prior to 1991, import prices are highly volatile and biased due to low total imports.
prices. For bagged cement, a convergence to (mainly bulk cement) import prices has to berejected. Wholesale as well as retail prices for bagged cement (WPI - wholesale price index andCPI - Consumer price index) increased markedly in the liberalized period. I extrapolate thehistoric average price with the increases of the WPI and CPI. The imputed nominal retail pricepeaks at 170 euros/ton in 2010 whereas the wholesale price increases to about 150 euros/ton in2011. These increases (depicted in Figure 6.4) reject the idea that imports constrained pricingpower for domestic cement bags.
Cost-pass-through differential for bulk and bagged cement. An anecdotal cost-passthrough analysis supports different competitive situations between bagged and bulk cement.First, the liberalization of the Austrian electricity market that led to a electricity price dropfor large industrial buyers in 1999/2000 (Figure 6.1) did solely coincide with an average cementprice drop whereas bagged cement did not become cheaper.17 Second, there was a 50% increasein cement bag prices in 2005-2009 whereas the average cement price increased solely by 15%
17This coincides with the change of the cement bag size. In 1999, the Austrian Association for BuildingMaterials and Ceramic Industries and the Union of Construction and Wood Workers (the industry specific socialpartners) agreed on a voluntary basis to put into circulation solely cement bags with 25 kg weight instead of50 kg weight. The government supported that change by ordering firms to use smaller cement bags in order toprotect worker’s health (Zentralarbeitsinspektorat, 1999). Thus, the industry had to invest in different packagingfacilities.
CHAPTER 6. A REGISTERED CARTEL AND ITS END: CEMENT 126
(Table 6.5). The industry offered two justifications for the increase in list prices: First, anunderallocation of emission certificates to the cement industry required the industry to buyadditional certificates for marginal production. Second, there was an increase in energy cost(Pozsogar, 2011). None of these arguments applies solely to cement bags. Thus, this is nota cost-based explanation for the price differential between cement bags and bulk cement for2005-2009. I found no other explanation for the increasing surcharge on cement bags relativeto bulk cement.
Indices are accurate for list prices of Austrian cement. It is essential to knowwhether these indices represent real transaction prices. The consumer price index matches therecent level of list and actual purchase prices (Table 6.7 in the Appendix) for cement producedin Austria. Although this is only anecdotal evidence—I was not able to collect a sufficientlylarge sample on individual transaction prices—Table 6.7 suggests that list prices for Austriancement exceed list prices for Slovakian cement in Austria as well as list prices for cement inGermany and Hungary by about 100%. A consumer who relies on Austrian cement (for exampledue to perceived higher quality) and does not negotiate prices pays a vastly higher price. Today,list prices are changed once a year—similar as prior to 1995—and available on the websites ofthe majority of cement suppliers.
For the wholesale price index (WPI) it is important to know how these data are generated.The WPI is based on the notified price for one ton of bagged cement that is sold by a wholesalerto a non-final consumer. Statistics Austria (the national statistics institute) explicitly statesthat the low number of notifying firms is a problem for the quality that might influence thewhole index. Notification is done on a voluntarily basis. Thus notification is also a revealedindustries’ preference that the index is deemed useful. In order to minimize administrativeburden, Statistics Austria normally asks the wholesale market leader for the price of the top-selling product within a category—thus the top-selling cement bags (Statistik Austria (2010)and Statistik Austria (2012)). According to industry experts, the wholesale organisation of localcooperatives (“Raiffeisen Ware Austria”) is the market leader for wholesale of bagged cement.A possible explanation for the high wholesale price is as follows: The local cooperatives—that inprinciple may act independent of each other—are often the sole local supplier of bagged cementin rural areas. Thus, in local supply of cement bags, they are often constrained solely by eachother but not by competitors outside the cooperatives. A wholesale price close to the list pricerestricts local competition between cooperatives.
At last, the monotonic increase of the notified consumer and wholesale price index does notsuggest that entry occurred in a sufficient scale to affect the CPI or WPI. This suggests thathigh priced Austrian cement bags are still the market leaders.
Price Adjustment
Irrespective of whether these price indices match real transaction prices, these cement priceindices are used for price adjustment and thus have a real impact. Prior to EU accession,price increases of cement as well as ready-mixed concrete (the most important downstreamproduct relying on cement) were monitored by social partners in the Subcommittee on Prices.The construction industry has relied and still relies on price adjustment policies for long termcontracts. In general, this is efficient. Kosmopoulou and Zhou (2014) find that price adjustmentpolicies lead to more aggressive and less dispersed bidding behavior in procurement auctions.
CHAPTER 6. A REGISTERED CARTEL AND ITS END: CEMENT 127
Price adjustment is important in Austria. Fixed-price contracts with escalation arecommon in Austria. For Austrian public works, public authorities are subject to the FederalPublic Procurement Law and thus obliged to use price adjustment clauses for constructionprojects surpassing twelve months (§24(7) BVergG). Also for non public construction projects,adjustment clauses are typically used if the duration exceeds twelve months—an Austrian stan-dard for building and civil engineering contracts includes a price adjustment clause for allprojects with at least six months duration.18
Accuracy. However, for price adjustment clauses to be efficient, the accuracy of the indicesis of central importance (Skolnik, 2011). Prior to 1995, there was essentially one price for everyproduct and thus one price adjustment irrespective of the underlying index that was includedin every contract. Then, price differentials emerged and influended price indices. From 1993on, the arising price differentials are shown in Table 6.5. Thus, I will evaluate which cementprice statistics exist, whether their use in specific more general indices is accurate and whetherthe specific weight of the cement price within a more general index is accurate.
The most accurate and robust price index is the ex-works average price for cement as well asfor ready-mixed concrete—it measures average purchase prices. Table 6.5 shows that the priceof cement bags increased more strongly (WPI and CPI) than the bulk cement price. Cementbags account only for 8% of total cement sales in 2010. Relying on the (list) price increase ofcement bags to adjust prices for bulk cement is inaccurate.
Official construction cost indices temporarily inaccurate. Statistics Austria com-piles several construction cost indices. Table 6.6 shows that its reliance on the WPI for cementbags up to 2005 to adjust prices for major construction projects. Up to 2010, the WPI stillentered the construction cost index for residential buildings. Since 2010, there is no longer anybias due to inaccurate cement prices in these offical indices.
Other inaccurate indices still exist. Privately compiled and relying on the wholesaleprice of bagged cement is the index for ready-mixed concrete (“Transportbetonindex”). Theready-mixed concrete industry is the main downstream processing industry relying on cement.When the formal approval of price increases was abolished in the early 1990s, the approvedprice increases no longer served as a basis for price adjustment. The Austrian Association forBuilding Materials and Ceramic Industries (the mandatory body representing the industry)stepped in and started to produce its own index on March 1st, 1994 from 1993 onwards. Thebasket of goods for the Laspeyres index was fixed for 1993, 2004 and again 2011. For 2004, theweight of cement was set to 33.1% and for 2011, the weight of cement was reduced to 31.63%.19The annual relative change is based on the WPI for bagged cement (Kropik, 2012).
Beyond 2005 and still ongoing, a federal ministry20 compiles a construction cost index fordifferent activities for surface building (“Hochbau”) and a list of input prices for specific con-struction projects like tunnels or power stations. For example, for activities of the constructionindustry (“Bauindustrie und Baugewerbe”), the WPI for cement has a weight of 18.02% within
18See Kropik et al. (2007) that describe the specific standard on conversion of variable prices of constructionworks in detail.
19Similary, the WPI for concrete rubble has a weight of 19.03% in 2004 as well as 2011.20It is the section “Tourism and Historic buildings” currently (2015) situated at the Federal Ministry of Science,
Research and Economy.
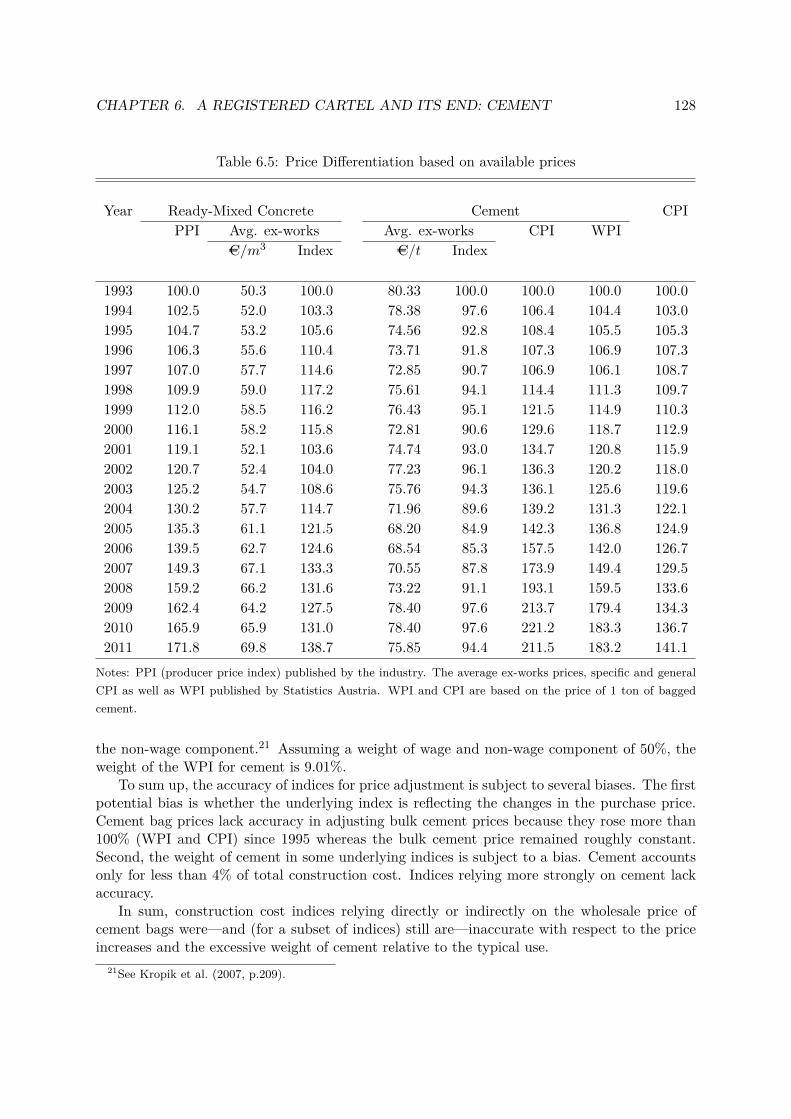
CHAPTER 6. A REGISTERED CARTEL AND ITS END: CEMENT 128
Table 6.5: Price Differentiation based on available prices
Year Ready-Mixed Concrete Cement CPIPPI Avg. ex-works Avg. ex-works CPI WPI
AC/m3 Index AC/t Index
1993 100.0 50.3 100.0 80.33 100.0 100.0 100.0 100.01994 102.5 52.0 103.3 78.38 97.6 106.4 104.4 103.01995 104.7 53.2 105.6 74.56 92.8 108.4 105.5 105.31996 106.3 55.6 110.4 73.71 91.8 107.3 106.9 107.31997 107.0 57.7 114.6 72.85 90.7 106.9 106.1 108.71998 109.9 59.0 117.2 75.61 94.1 114.4 111.3 109.71999 112.0 58.5 116.2 76.43 95.1 121.5 114.9 110.32000 116.1 58.2 115.8 72.81 90.6 129.6 118.7 112.92001 119.1 52.1 103.6 74.74 93.0 134.7 120.8 115.92002 120.7 52.4 104.0 77.23 96.1 136.3 120.2 118.02003 125.2 54.7 108.6 75.76 94.3 136.1 125.6 119.62004 130.2 57.7 114.7 71.96 89.6 139.2 131.3 122.12005 135.3 61.1 121.5 68.20 84.9 142.3 136.8 124.92006 139.5 62.7 124.6 68.54 85.3 157.5 142.0 126.72007 149.3 67.1 133.3 70.55 87.8 173.9 149.4 129.52008 159.2 66.2 131.6 73.22 91.1 193.1 159.5 133.62009 162.4 64.2 127.5 78.40 97.6 213.7 179.4 134.32010 165.9 65.9 131.0 78.40 97.6 221.2 183.3 136.72011 171.8 69.8 138.7 75.85 94.4 211.5 183.2 141.1
Notes: PPI (producer price index) published by the industry. The average ex-works prices, specific and generalCPI as well as WPI published by Statistics Austria. WPI and CPI are based on the price of 1 ton of baggedcement.
the non-wage component.21 Assuming a weight of wage and non-wage component of 50%, theweight of the WPI for cement is 9.01%.
To sum up, the accuracy of indices for price adjustment is subject to several biases. The firstpotential bias is whether the underlying index is reflecting the changes in the purchase price.Cement bag prices lack accuracy in adjusting bulk cement prices because they rose more than100% (WPI and CPI) since 1995 whereas the bulk cement price remained roughly constant.Second, the weight of cement in some underlying indices is subject to a bias. Cement accountsonly for less than 4% of total construction cost. Indices relying more strongly on cement lackaccuracy.
In sum, construction cost indices relying directly or indirectly on the wholesale price ofcement bags were—and (for a subset of indices) still are—inaccurate with respect to the priceincreases and the excessive weight of cement relative to the typical use.
21See Kropik et al. (2007, p.209).
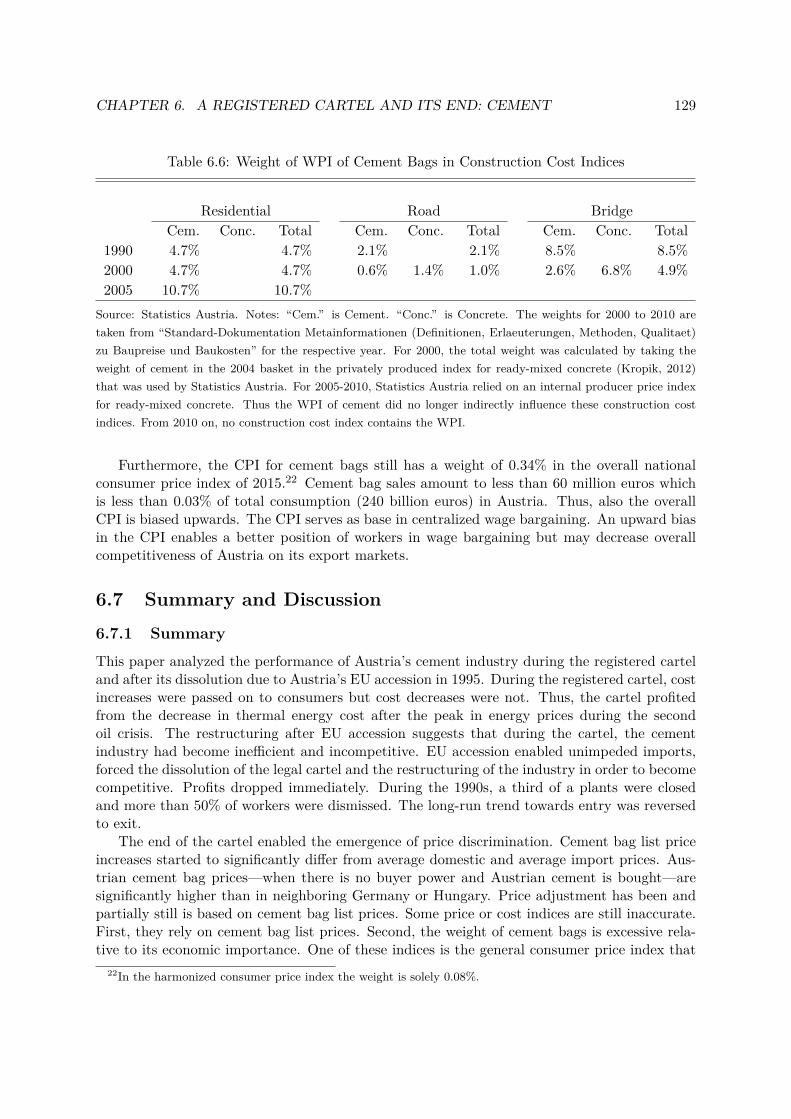
CHAPTER 6. A REGISTERED CARTEL AND ITS END: CEMENT 129
Table 6.6: Weight of WPI of Cement Bags in Construction Cost Indices
Residential Road BridgeCem. Conc. Total Cem. Conc. Total Cem. Conc. Total
1990 4.7% 4.7% 2.1% 2.1% 8.5% 8.5%2000 4.7% 4.7% 0.6% 1.4% 1.0% 2.6% 6.8% 4.9%2005 10.7% 10.7%
Source: Statistics Austria. Notes: “Cem.” is Cement. “Conc.” is Concrete. The weights for 2000 to 2010 aretaken from “Standard-Dokumentation Metainformationen (Definitionen, Erlaeuterungen, Methoden, Qualitaet)zu Baupreise und Baukosten” for the respective year. For 2000, the total weight was calculated by taking theweight of cement in the 2004 basket in the privately produced index for ready-mixed concrete (Kropik, 2012)that was used by Statistics Austria. For 2005-2010, Statistics Austria relied on an internal producer price indexfor ready-mixed concrete. Thus the WPI of cement did no longer indirectly influence these construction costindices. From 2010 on, no construction cost index contains the WPI.
Furthermore, the CPI for cement bags still has a weight of 0.34% in the overall nationalconsumer price index of 2015.22 Cement bag sales amount to less than 60 million euros whichis less than 0.03% of total consumption (240 billion euros) in Austria. Thus, also the overallCPI is biased upwards. The CPI serves as base in centralized wage bargaining. An upward biasin the CPI enables a better position of workers in wage bargaining but may decrease overallcompetitiveness of Austria on its export markets.
6.7 Summary and Discussion
6.7.1 Summary
This paper analyzed the performance of Austria’s cement industry during the registered carteland after its dissolution due to Austria’s EU accession in 1995. During the registered cartel, costincreases were passed on to consumers but cost decreases were not. Thus, the cartel profitedfrom the decrease in thermal energy cost after the peak in energy prices during the secondoil crisis. The restructuring after EU accession suggests that during the cartel, the cementindustry had become inefficient and incompetitive. EU accession enabled unimpeded imports,forced the dissolution of the legal cartel and the restructuring of the industry in order to becomecompetitive. Profits dropped immediately. During the 1990s, a third of a plants were closedand more than 50% of workers were dismissed. The long-run trend towards entry was reversedto exit.
The end of the cartel enabled the emergence of price discrimination. Cement bag list priceincreases started to significantly differ from average domestic and average import prices. Aus-trian cement bag prices—when there is no buyer power and Austrian cement is bought—aresignificantly higher than in neighboring Germany or Hungary. Price adjustment has been andpartially still is based on cement bag list prices. Some price or cost indices are still inaccurate.First, they rely on cement bag list prices. Second, the weight of cement bags is excessive rela-tive to its economic importance. One of these indices is the general consumer price index that
22In the harmonized consumer price index the weight is solely 0.08%.
CHAPTER 6. A REGISTERED CARTEL AND ITS END: CEMENT 130
is—for example—used in wage bargaining today.
6.7.2 Discussion
As expected and expressed by policymakers (Wieser and Kitzmantel, 1989), EU accession indeedbroke up the ossified institutional set-up of registered cartels, liberalized the industry, increasedproductivity and in general, emerging competition led to lower prices. This confirms the overallevidence on the beneficial effects of competition (Werden (2003), Connor (2014) and Baker(2003)) and expands the literature on the effects of cartels on productivity. Whereas Röller andSteen (2006) relate the inner workings of the Norwegian cement cartel to an incentive to expandcapacity, I observe increased entry and a lack of exit due to the specifics of the Austrian cementcartel confirming the findings of Aiginger and Pfaffermayr (1997) who stress the survival of highcost firms and Symeonidis (2002) who found that intensified competition after the end of Britishregistered cartels led to increased industry concentration. Whereas the registered cement cartelhad a positive effect on (excessive) investment into new plants by outsiders, it had a negativeaffect on productivity.
The increase of cement bag list prices, the need for bargaining power of cement bag buyersand the inaccuracy of some prices indices confirms the evidence that competition does not alwaysguarantee lower prices for all market participants (Miller and Osborne (2014) and Crandall andWinston (2003)). Empirically, inelastic demand is in line with limit pricing found by Salvo(2010) in Brazil.
For Austria’s economic policy, I recommend to reassess the use of cement bag prices invarious price indices. Most importantly, the overall consumer price index is inaccurate withrespect of the weight of cement bags. Furthermore, an investigation whether and if so why realtransactions price match the list prices is recommended. EU accession was an effective remedyin restructuring the Austrian cement industry and lowering prices for large industrial buyers,but some potential for reforms is still left to Austrian economic policy itself—the promise oflowered prices did not materialize for consumers of Austrian cement bags. The market leader’slist price of its top-product stands at 196.50 Euro/ton (net of tax)—which is (even in real terms)more than the last 40 years (Lafarge Zementwerke GmbH (2016)).
6.8 Appendix
6.8.1 Data Sources
Domestic Production is based on the Industriestatistik published by Statistics Austria (1973-1987) and on an industry publication (1988-2011, Hackl and Mauschitz (2014)).
Foreign trade statistics contain cement imports and exports.23 I took all cement importsexcept white portland cement and calcium aluminate cement. For imported cement clinker, Iadd 40.8% weight in order to account for additives. Exports are total cement exports minuswhite portland cement, calcium aluminate cement and cement clinker.24
The domestic price is the price of portland cement or (if the former is missing) the price oftotal cement which both result from the division of revenues by the output published by Statis-
23For 1973-1987, I took the data from Fersterer (1996).24This assumes that imported cement clinker is grinded to cement whereas domestically produced clinker that
is not used for cement production within the same statistical unit is exported.
CHAPTER 6. A REGISTERED CARTEL AND ITS END: CEMENT 131
tics Austria (Industriestatistik for 1973-1995, Konjunkturerhebung for 1996-2002 and Konjunk-turstatistik for 2002-2011).
The number of workers is taken from the yearly report of the Austrian Association forBuilding Materials and Ceramic Industries (Fachverband der Stein- und keramischen Industrie,2013).
Aggregate thermal energy cost had to be calculated and/or estimated. Fossil fuels like oil,coal and gas as well as renewables or alternative fuels were used as substitutes for the pro-duction of thermal energy. For 1973 to 1995, detailed tables on energy use—purchase valuesand volumes—for the Austrian Association for Building Materials and Ceramic Industries areavailable (Fachverband der Stein- und keramischen Industrie, 2013). Since the cement industryis energy intensive and accounts for 60% of the association’s energy use (except electricity) in1988-1995, the association’s energy use data is used to calculate input prices and to estimate rea-sonable energy input uses for the cement industry that match the relative energy cost shares forcoal, oil and gas in the input-output tables for 1976 and 1983 (“Nichtlandwirtschaftliche Bereich-szählung”) and specific energy input data for the cement industry in 1988. From 1988 onwards,the cement industry publishes aggregate input use of fossil and renewable energy sources (Hackland Mauschitz, 2014). For energy input prices from 1995 on, I rely on the foreign trade statis-tics (petrol coke, bituminous coal, natural gas) and data published by kohlenstatistik.de (browncoal, heating oil) to impute energy purchase prices for the cement industry. Purchase prices foralternative energy sources like scrape tyres or plastics scraps are not available. I assume thatpurchase prices are equal to estimated average purchase prices for fossil energy sources.
For electricity, the Austrian Association for Building Materials and Ceramic Industries pub-lished prices from 1973 to 1995 (Fachverband der Stein- und keramischen Industrie, 2013). For1996 to 2002, electricity prices excluding taxes are taken from Kratena (2011). From 2003onwards, E-Control provides energy prices for large industrial customers. Exact usage of elec-tricity is available from 1997 onwards (Hackl and Mauschitz, 2014). For the period back to1973, I assume a constant electricity use of 0.404 GJ/ton of cement to impute electricity usage.
For wages, the ASSD data base (Zweimüller et al., 2009) provides mean gross monthly wagesfor the cement industry. Employment times the mean gross monthly wages (Zweimüller et al.,2009) times fourteen times 1.25 gives the total yearly wage cost that include the mandatorythirteenth and fourteenth monthly salary as well as mandatory employer’s contribution to thesocial security system in Austria that equals about 25% of gross monthly wages.
The real gross domestic product of the construction sector was provided by the AustrianInstitute of Economic Research.
The number of plants is based on the respective entry and exits dates of the individualplants.
Profit is defined as total revenues minus thermal energy, electricity and total wages.
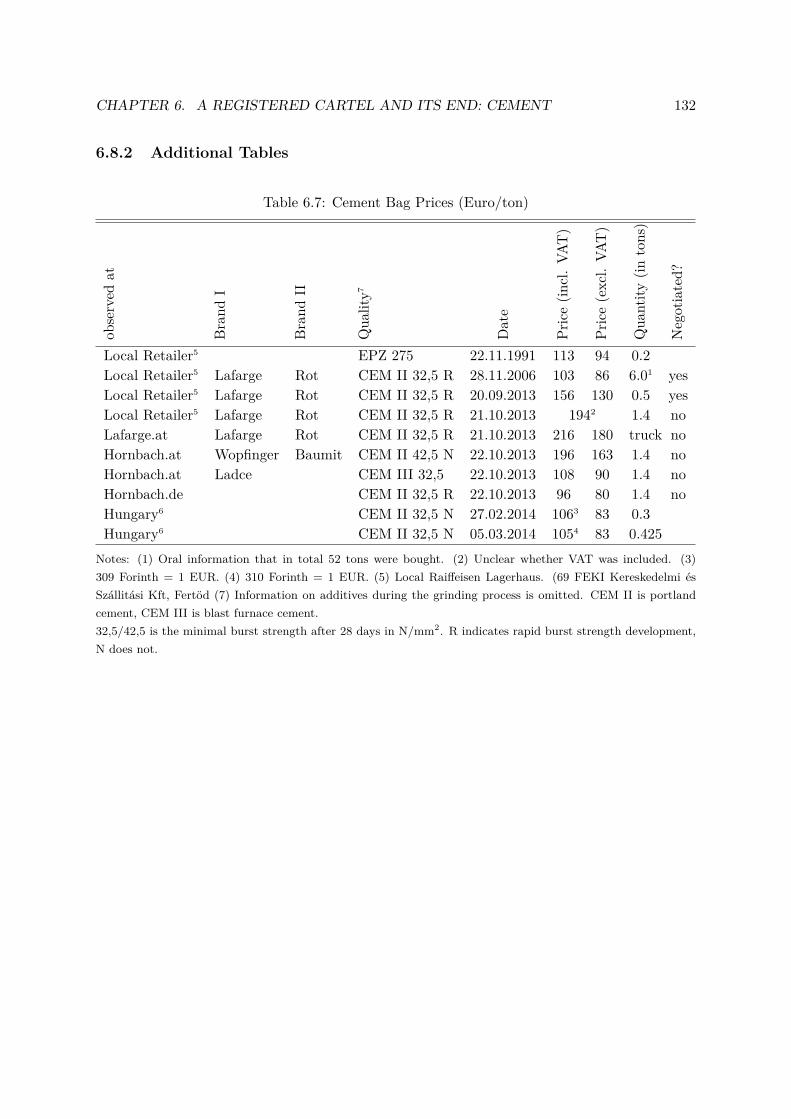
CHAPTER 6. A REGISTERED CARTEL AND ITS END: CEMENT 132
6.8.2 Additional Tables
Table 6.7: Cement Bag Prices (Euro/ton)
observed
at
Bran
dI
Bran
dII
Qua
lity7
Date
Price(in
cl.VA
T)
Price(excl.
VAT)
Qua
ntity
(intons)
Negotiated?
Local Retailer5 EPZ 275 22.11.1991 113 94 0.2Local Retailer5 Lafarge Rot CEM II 32,5 R 28.11.2006 103 86 6.01 yesLocal Retailer5 Lafarge Rot CEM II 32,5 R 20.09.2013 156 130 0.5 yesLocal Retailer5 Lafarge Rot CEM II 32,5 R 21.10.2013 1942 1.4 noLafarge.at Lafarge Rot CEM II 32,5 R 21.10.2013 216 180 truck noHornbach.at Wopfinger Baumit CEM II 42,5 N 22.10.2013 196 163 1.4 noHornbach.at Ladce CEM III 32,5 22.10.2013 108 90 1.4 noHornbach.de CEM II 32,5 R 22.10.2013 96 80 1.4 noHungary6 CEM II 32,5 N 27.02.2014 1063 83 0.3Hungary6 CEM II 32,5 N 05.03.2014 1054 83 0.425
Notes: (1) Oral information that in total 52 tons were bought. (2) Unclear whether VAT was included. (3)309 Forinth = 1 EUR. (4) 310 Forinth = 1 EUR. (5) Local Raiffeisen Lagerhaus. (69 FEKI Kereskedelmi ésSzállitási Kft, Fertöd (7) Information on additives during the grinding process is omitted. CEM II is portlandcement, CEM III is blast furnace cement.32,5/42,5 is the minimal burst strength after 28 days in N/mm2. R indicates rapid burst strength development,N does not.
Bibliography
Aiginger, K. and Pfaffermayr, M. (1997). Looking at the Cost Side of “Monopoly”. Journal ofIndustrial Economics, 45(3):245–267.
Anton, J. J. and DasVarma, G. (2005). Storability, Market Structure and Demand-Shift Incen-tives. RAND Journal of Economics, 36(3):520–543.
Arbeiterzeitung (1888-1914). Various issues.
Asker, J. (2010). A Study of the Internal Organization of a Bidding Cartel. American EconomicReview, 100(3):724–762.
Asker, J. and Bar-Isaac, H. (2014). Raising Retailers’ Profits: On Vertical Practices and theExclusion of Rivals. American Economic Review, 104(2):672–686.
Auspitz, R. (1904). Wirtschaftliche Entwicklung. Vortrag gehalten in der Generalversammlungdes Centralvereines für Rübenzuckerindustrie am 5. Juni 1904 in Wien. Oesterr.-ungar.Zeitschrift für Zuckerindustrie und Landwirthschaft, pages 532–543.
Auspitz, R. and Lieben, R. (1889). Untersuchungen über die Theorie des Preises. Duncker undHumblot, Leipzig.
Baker, J. B. (2003). The Case for Antitrust Enforcement. Journal of Economic Perspectives,17(4):27–50.
Berger, H. and Hoenig, V. (2010). Energieeffizienz der österreichischen Zementin-dustrie. Technical report, Vereinigung der österreichischen Zementindustrie.www.zement.at/downloads/energieeffizienzanalyse.pdf.
Butschek, F. (2011). Österreichische Wirtschaftsgeschichte: von der Antike bis zur Gegenwart.Böhlau.
Cave, J. and Salant, S. W. (1995). Cartel Quotas under Majority Rule. American EconomicReview, 85(1):82–102.
Centralverein (1872-1888). Various issues. Der Marktbericht: Organ für Handel und technis-chen Fortschritt der landwirthschaftlichen Gewerbe, vorzugsweise für Rübenzucker-Industrie,Spirituosen, Getränke und Consumtions-Artikel.
Centralverein (1888-1914). Various issues. Wochenschrift des Centralvereines für Rübenzucker-Industrie in der Öst.-Ung. Monarchie.
133
BIBLIOGRAPHY 134
Centralverein (1904). Der Centralverein für Rübenzucker-Industrie in der Österr.-Ungar. Monar-chie (Verein für Rübenzucker-Industrie im Kaiserthum Österreich) 1854-1904: Festschrift an-lässlich der Feier des fünfzigjährigen Bestandes des Vereines. Wien.
Chicu, M., Vickers, C., and Ziebarth, N. L. (2013). Cementing the Case for Collusion underthe National Recovery Administration. Explorations in Economic History, 50(4):487–507.
Cleveland, R. B. et al. (1990). STL: A Seasonal-Trend Decomposition Procedure based onLoess. Journal of Official Statistics, 6:3–73.
Connor, J. M. (2003). Private International Cartels: Effectiveness, Welfare, and AnticartelEnforcement. Working Papers, 12(03).
Connor, J. M. (2014). Price-fixing overcharges: Revised 3rd edition. Available at SSRN 2400780.
Crandall, R. W. and Winston, C. (2003). Does Antitrust Policy improve Consumer Welfare?Assessing the Evidence. Journal of Economic Perspectives, 17(4):3–26.
d’Aspremont, C., Encaoua, D., and Ponssard, J. C. (2000). Competition Policy and GameTheory: Reflections Based on the Cement Industry Case. In Norman, G. and Thisse, J.-F.,editors, Market Structure and Competition Policy: Game Theoretical Approaches, pages 9–30.Cambridge University Press.
Davis, P. and Fletcher, A. (2013). Contributions to Competition Economics: Introduction.Economic Journal, 123(572):F493–F504.
Dudine, P., Hendel, I., and Lizzeri, A. (2006). Storable Good Monopoly: The Role of Commit-ment. American Economic Review, 96(5):1706–1719.
Fachverband der Stein- und keramischen Industrie (1983-2013). Various issues. GeschäftsberichtFachverband Steine-Keramik.
Farnleitner, J. (1977). Die Paritätische Kommission: Institution und Verfahren. Prugg, Eisen-stadt, 2. Auflage edition.
Farrell, J. (2000). Renegotiation In Repeated Oligopoly Interaction. Incentives, Organization,and Public Economics: Papers in Honour of Sir James Mirrlees: Papers in Honour of SirJames Mirrlees.
Fersterer, J. (1996). Industrieökonomische Analyse der österreichischen Zementindustrie. Mas-ter’s thesis, JKU, Linz.
Fink, N. (2016). Formation and Adaptation of the Sugar Cartel in Austria-Hungary. WIFOWorking Papers, 508.
Fink, N. and Frübing, S. (2015). Legal and Illegal Cartels in the European Cement Industry.ZEW Discussion Papers, 15-066.
Fink, N., Schmidt-Dengler, P., Stahl, K., and Zulehner, C. (2014). Registered Cartels in Austria- Coding Protocol. ZEW Mannheim Discussion Papers, (14-058).
Fink, N., Schmidt-Dengler, P., Stahl, K., and Zulehner, C. (2015). Registered Cartels in Austria.An Overview. WIFO Working Papers.
BIBLIOGRAPHY 135
Fox, J. and Weisberg, S. (2011). An R Companion to Applied Regression. Sage, Thousand OaksCA, second edition.
Genesove, D. (2015). History in the Study of Industrial Organization. Paper presented at themeeting of the European Association for Research in Industrial Economics, Munich, Germany.
Genesove, D. and Mullin, W. P. (1998). Testing Static Oligopoly Models: Conduct and Cost inthe Sugar Industry, 1890-1914. RAND Journal of Economics, 29(2):355–377.
Genesove, D. and Mullin, W. P. (2001). Rules, Communication, and Collusion: NarrativeEvidence from the Sugar Institute Case. American Economic Review, 91(3):379–398.
Griffin, C. F. (1902). The Sugar Industry and Legislation in Europe. Quarterly Journal ofEconomics, 17(1):1–43.
Hackl, A. and Mauschitz, G. (1995-2014). Various issues. Emissionen aus Anlagen der österre-ichischen Zementindustrie.
Handels- und Gewerbekammer Prag (1896). Denkschrift der Handels- und Gewerbekammerin Prag gerichtet an das k. k. Handelsministerium in Betreff der staatlichen Regelung desCartellwesens. Prag.
Hanreich, H. (1989). Wertungswandel im Wettbewerbsrecht. PhD thesis, Wien. Habilitationthesis.
Harrington, J. E. (2006). How do cartels operate? Now Publishers Inc.
Harrington, J. E. and Skrzypacz, A. (2007). Collusion under Monitoring of Sales. RANDJournal of Economics, 38(2):314–331.
Harrington, J. E. and Skrzypacz, A. (2011). Private Monitoring and Communication in Cartels:Explaining recent collusive Practices. American Economic Review, 101(6):2425–2449.
Harrington Jr, J. E., Hüschelrath, K., Laitenberger, U., and Smuda, F. (2015). The DiscontentCartel Member and Cartel Collapse: The Case of the German Cement Cartel. InternationalJournal of Industrial Organization, 42:106–119.
Hendel, I. and Nevo, A. (2004). Intertemporal Substitution and Storable Products. Journal ofthe European Economic Association, 22(2):536–547.
Hendel, I. and Nevo, A. (2006). Measuring the Implications of Sales and Consumer InventoryBehaviour. Econometrica, 74(6):1637–1673.
Hendel, I. and Nevo, A. (2010). A simple Model of Demand Anticipation. Working Paper.
Henningsen, A. and Hamann, J. D. (2007). systemfit: A package for estimating systems ofsimultaneous equations in r. Journal of Statistical Software, 23(4):1–40.
Hines, James R., J. (2008). Excise Taxes. In Durlauf, S. N. and Blume, L. E., editors, The NewPalgrave Dictionary of Economics. Palgrave Macmillan, Basingstoke.
Hlawitschka, A. (1902). Das Wesen und die schädliche Wirkung des Zuckerkartells und derRübenkartelle in Österreich-Ungarn. Wien.
BIBLIOGRAPHY 136
Hromada, E. (1911). Die Entwicklung der Kartelle in der österreichisch-ungarischen Zuck-erindustrie. PhD thesis, Zürich.
Hyytinen, A., Steen, F., and Toivanen, O. (2015). Anatomy of Cartel Contracts. mimeo.
Inderst, R. and Wey, C. (2011). Countervailing Power And Dynamic Efficiency. Journal of theEuropean Economic Association, 9(4):702–720.
Ivaldi, M., Jullien, B., Rey, P., Seabright, P., and Tirole, J. (2003). The Economics of TacitCollusion. IDEI Working Papers 186, Institut d’Économie Industrielle (IDEI), Toulouse.
Johnstone, H. W. (1951). The Restraint of Competition in the Austrian Economy. mimeo.
Kartell-Rundschau (1903-1911). Various issues. Kartell-Rundschau: Monatsschrift für Rechtund Wirtschaft im Kartell- und Konzernwesen.
k.k. Handelsministerium, editor (1912a). Verhandlungen der vom k.k. Handelsministerium ve-ranstalteten Kartellenquete, volume 1.Zuckerindustrie 27.,28.,29.Februar 1912, Wien. Hof-u.Staatdr.
k.k. Handelsministerium, editor (1912b). Verhandlungen der vom k.k. Handelsministerium ve-ranstalteten Kartellenquete, volume VII.Portlandzement 3.Juni 1912, Wien. Hof-u.Staatdr.
Kleiber, C., Hornik, K., Leisch, F., and Zeileis, A. (2002). strucchange: An r package for testingfor structural change in linear regression models. Journal of Statistical Software, 7(2):1–38.
Kleiber, C. and Zeileis, A. (2008). Applied Econometrics with R. Springer-Verlag, New York.ISBN 978-0-387-77316-2.
Kohl, W. and Steiger-Moser, S., editors (2014). Die österreichische Zuckerindustrie und ihreGeschichte(n) 1750-2013. Böhlau, Wien.
Kopczuk, W., Marion, J., Mühlegger, E., and Slemrod, J. (2013). Do the Laws of Tax IncidenceHold? Point of Collection and the Pass-through of State Diesel Taxes. NBER Working Papers,19410.
Kosmopoulou, G. and Zhou, X. (2014). Price Adjustment Policies in Procurement Contracting:An Analysis of Bidding Behavior. Journal of Industrial Economics, 62(1):77–112.
Kratena, K. (2011). Gesamtwirtschaftliche Effekte der Energiemarktliberalisierung in Österre-ich.
Kraus, K. (1899-1936). Various issues. Die Fackel.
Kropik, A. (2012). Forschungsbericht - Überarbeitung des Transportbetonindex (Basis2011=100). Technical report, TU Wien.
Kropik, A., Heegemann, I., and Scherer, P. (2007). Verguetungsaenderung bei Kostenveraen-derungen im Bauwesen. Insbesondere nach OENORM B2111 - Umrechnung veraenderlicherPreise von Bauleistungen. Oesterreichisches Normungsinstitut, Vienna.
Ku, S. M. and Lee, J. R. (2012). Price Fixing Cartel by Three Sugar Manufacturers. KFTCDecision NO. 2007-408.
BIBLIOGRAPHY 137
Lafarge Zementwerke GmbH (2016). Zement Preise 2016. ZEMENT QUALITÄTSZEMENTECHROMATARM. gültig ab 1.1.2016. Website. Available at http://www.lafarge.at/uploads/tx_templavoila/NEU_20160114_Lafarge_Preisliste2016_SCREEN__1_.pdf;download on 30th of January 2016.
Leifeld, P. (2013). texreg: Conversion of statistical model output in R to LATEX and HTMLtables. Journal of Statistical Software, 55(8):1–24.
Levenstein, M. C. and Suslow, V. Y. (2006). What determines Cartel Success? Journal ofEconomic Literature, 44(1):43–95.
Levenstein, M. C. and Suslow, V. Y. (2011). Breaking up is hard to do: Determinants of cartelduration. Journal of Law and Economics, 54(2):455 – 492.
Mariusz Paździora (2008). Austria-Hungary 1914, physical.http://commons.wikimedia.org/wiki/File:Austria1914physical.jpg. CC BY 3.0.
Menger, C. (1871). Grundsätze der Volkswirthschaftslehre. Willhelm Braumüller, Wien.
Menger, C. (1897). Ein Gesetz gegen Kartelle. Jahrbücher für Nationalökonomie und Statistik,14(3):113–115.
Miller, N. H. and Osborne, M. (2014). Spatial Differentiation and Price Discrimination inthe Cement Industry: Evidence from a Structural Model. RAND Journal of Economics,45(2):221–247.
Mühlpeck, V., Sandgruber, R., and Woitek, H. (1979). Index der Verbraucherpreise, 1800 -1914. Eine Rückberechnung für Wien und den Gebietsstand des heutigen Österreich, pages649–688. bearb. im Österr. Statistischen Zentralamt.
Neue Freie Presse (1888-1914). Various issues.
Normann, H.-T. and Tan, E. S. (2013). Effects of different Cartel Policies: Evidence from theGerman Power-cable Industry. Industrial and Corporate Change, 23(4):1037–1057.
Öst.Akad.d.Wissenschaften (2005). Siegl, Eduard. Österreichisches Biographisches Lexikon undBiographische Dokumentation, 12:240.
Pfaff, B. (2008). Analysis of Integrated and Cointegrated Time Series with R. Springer, NewYork, second edition. ISBN 0-387-27960-1.
Pigman, G. A. (1997). Hegemony and Trade Liberalization Policy: Britain and the BrusselsSugar Convention of 1902. Review of International Studies, 23(02):185–210.
Pindyck, R. S. (2001). The Dynamics of Commodity Spot and Futures Markets: A Primer.Energy Journal, 22(3):1–29.
Planker, P. (1998). Standortanalyse eines österr. Zementwerkes nach dem Kartellzusammen-bruch, der Ostöffnung und dem EU Beitritt. Master’s thesis, WU Wien.
Pollan, W. (1992). Preisregelung in Österreich. Wirtschaftspolitische Blätter, (1):33–44.
Pozsogar, W. (2011). Kosten am Bau schießen in die Höhe. DiePresse.
BIBLIOGRAPHY 138
Prager Zuckermarkt (1906). Various issues.
R Core Team (2012a). foreign: Read Data Stored by Minitab, S, SAS, SPSS, Stata, Systat,dBase, ... R package version 0.8-51.
R Core Team (2012b). R: A Language and Environment for Statistical Computing. R Foundationfor Statistical Computing, Vienna, Austria. ISBN 3-900051-07-0.
Reiterer, D. (1997). Logistikoptimierung in der Stein- und keramischen Industrie: eine schwer-punktmäßige Betrachtung der Bereiche Sand und Kies, Transportbeton, Fertigestrich/-Mörtelsowie Zement; durchgeführt am Beispiel der Kies Union Vereinigte Kieswerke AG. Master’sthesis, WU Wien, Wien.
Resch, A. (2002). Industriekartelle in Österreich vor dem Ersten Weltkrieg. Marktstrukturen,Organisationstendenzen und Wirtschaftsentwicklung von 1900 bis 1913, volume 84 of Schriftenzur Sozial- und Wirtschaftsgeschichte. Duncker und Humblot, Berlin.
Riccardi, R., Oggioni, G., and Toninelli, R. (2012). Efficiency Analysis of World Cement In-dustry in Presence of undesirable Output: Application of Data Envelopment Analysis anddirectional Distance Function. Energy Policy, 44:140–152.
Röller, L.-H. and Steen, F. (2006). On the Workings of a Cartel: Evidence from the NorwegianCement Industry. American Economic Review, pages 321–338.
Roth, K. and Lück, E. (2011). Ein Molekülschicksal. Die Saccharin-Saga. Teil 1. Chem. UnsererZeit, 45:406–423.
RStudio Team (2015). RStudio: Integrated Development Environment for R. RStudio, Inc.,Boston, MA.
Rudolph, R. L. (1973). Quantitative Aspekte der Industrialisierung in Cisleithanien 1848-1914,pages 233–249. Verlag der Österreichischischen Akademie der Wissenschaften.
Salvo, A. (2010). Inferring Market Power under the Threat of Entry: The Case of the BrazilianCement Industry. RAND Journal of Economics, 41(2):326–350.
Schaal, D. (2005). Rübenzuckerindustrie und regionale Industrialisierung. Number 4 inForschungen zur neuesten Geschichte. Münster.
Schneider, F. and Wagner, A. (2001). Institutions of Conflict Management and EconomicGrowth in the European Union. Kyklos, pages 509–531.
Schulte, H. (1980). Das österreichische Kartellrecht vor 1938. Westfälische-Wilhelms-Universität. Dissertation.
Schulze, M.-S. (2000). Patterns of Growth and Stagnation in the late nineteenth CenturyHabsburg Economy. European Review of Economic History, 4(3):311–340.
Seidel, H. (2005). Österreichs Wirtschaft und Wirtschaftspolitik nach dem Zweiten Weltkrieg.Manz’Sche Verlags- U. Universitätsbuchhandlung.
BIBLIOGRAPHY 139
Siegl, E. (1879). Zur Zuckersteuerfrage. Organ des Central-Vereins für Rübenzucker-Industriein der österreichisch-ungarischen Monarchie. Zeitschrift für Landwirtschaft und technis-chen Fortschritt der landwirtschaftlichen Gewerbe, vorzugsweise für Rübenzucker-Industrie,(17):953–966.
Skolnik, J. (2011). Price Indexing in Transportation Construction Contracts. Technical report,Final Report for NCHRP 20-07/Task 274. Transportation Research Board, Washingtion, DC.
Stammer, K. (1887). Lehrbuch der Zuckerfabrikation. F. Vieweg und Sohn.
Statistik Austria (2010). Index der Großhandelspreise (Basis: Jahresdurchschnitt 2010=100)Revision 2010.
Statistik Austria (2012). Standard Dokumentation zum Grosshandelspreisindex.
Stigler, G. J. (1964). A Theory of Oligopoly. Journal of Political Economy, pages 44–61.
Symeonidis, G. (2002). The Effects of Competition: Cartel policy and the Evolution of Strategyand Structure in British Industry. MIT Press Books, 1.
Taylor, J. E. (2007). Cartel Code Attributes and Cartel Performance: An Industry-LevelAnalysis of the National Industrial Recovery Act. Journal of Law and Economics, 50:597–624.
Tüchler, M. (2003). Die Entwicklung des österreichischen Kartellrechts. In Resch, A., editor,Kartelle in Oesterreich, volume 23, pages 121–148. Veröffentlichungen der österreichischenGesellschaft für Unternehmensgeschichte, Wien.
Verein Betonmarketing (2012). Zementerzeugung in Österreich. Technical report.
Vickers, C. and Ziebarth, N. L. (2014). Did the National Recovery Administration FosterCollusion? Evidence from the Macaroni Industry. Journal of Economic History, 74:831–862.
Walker, F. (1903). The Sugar Situation in Austria. Political Science Quarterly, 18(4):565–598.
Wehsely, H. (1978). Kartellrecht und Kartellpolitik in der Praxis. Wiener JuristischeGesellschaft. Österreichische Juristen-Zeitung, pages 465–467.
Wehsely, H. (1979). Mißbrauchsaufsicht statt Kartellaufsicht. Wirtschaft und Gesellschaft,pages 197–204.
Werden, G. J. (2003). The Effect of Antitrust Policy on Consumer Welfare: What Crandalland Winston overlook. US Department of Justice Antitrust Division Discussion Paper No.EAG, pages 03–2.
Wieser, T. and Kitzmantel, E. (1989). Austria and the European Community. Journal ofCommon Market Studies, 28(4):431–449.
Williams, J. C. and Wright, B. D. (1991). Storage and Commodity Markets. Cambridge Uni-versity Press.
BIBLIOGRAPHY 140
w/o (1886). Motivenbericht zum Gesetzentwurfe, betreffend die Zuckerbesteuerung. Organdes Central-Vereins für Rübenzucker-Industrie in der österreichisch-ungarischen Monarchie.Zeitschrift für Landwirtschaft und technischen Fortschritt der landwirtschaftlichen Gewerbe,vorzugsweise für Rübenzucker-Industrie, (24):467–474.
w/o (1897). Übereinkommen der Genossenschaft der österreichisch-ungarischen Zuckerfabrikenmit mehreren anderen Firmen.
Zeileis, A. (2004). Econometric computing with hc and hac covariance matrix estimators.Journal of Statistical Software, 11(10):1–17.
Zeileis, A. (2011). dynlm: Dynamic Linear Regression. R package version 0.3-1.
Zeileis, A. and Grothendieck, G. (2005). zoo: S3 infrastructure for regular and irregular timeseries. Journal of Statistical Software, 14(6):1–27.
Zeileis, A. and Hothorn, T. (2002). Diagnostic checking in regression relationships. R News,2(3):7–10.
Zentralarbeitsinspektorat (1999). Erlass 61209/12/4/99, Einführung von 25-kg-Zementsäcken.Bundesministerium für Arbeit, Gesundheit und Soziales.
Zweimüller, J., Winter-Ebmer, R., Lalive, R., Kuhn, A., Wuellrich, J.-P., Ruf, O., and Büchi,S. (2009). Austrian social security database. Available at SSRN 1399350.
Curriculum vitae
Employment
Sep 2015 - Dec 2015 University of Mannheim
Mar 2015 - Jun 2015 Vienna University of Business and Economics
Jul 2015 - Aug 2015 Participation in preparing an expert opinion for the AustrianCartel Court
Mar 2013 - ongoing Lecturer at the Vienna University of Business and Economics
Sep 2011 - Feb 2015 Johannes Kepler University of Linz (part-time)
Nov 2006 - Aug 2012 Austrian Federal Competition Authority (part-time from Sep2011 onwards)
Jan 2004 - Aug 2006 Austrian Federal Ministry of Finance (Economic Policy)
Education
Feb 2013 - ongoing Johannes Kepler University of Linz - Doctoral Studies inEconomics
Oct 1998 - Nov 2003 University of Vienna - Mag. rer. soc. oec (Economics)

![Stakeholder-Awareness - Was ist hier los?ubicomp/projekte/master1… · Essays On Software Engineering. Pearson Education, 1995. [4]S. Dorairaj, J. Noble, and P. Malik. Understanding](https://img.pdfslide.org/doc/110x75/5f38262e9ce82a0bb345c7e4/stakeholder-awareness-was-ist-hier-los-ubicompprojektemaster1-essays-on-software.jpg)