Embed Size (px)
Citation preview

Expression and Function of the Fat Mass and
Obesity-Associated Gene FTO
Inaugural-Dissertation
zur
Erlangung des Doktorgrades
Dr. rer. nat.
der Fakultät für
Biologie
an der
Universität Duisburg-Essen
vorgelegt von
Tea Berulava
aus Gulriphshi
Oktober 2012

Die der vorliegenden Arbeit zugrunde liegenden Experimente wurden am Institut für Humangenetik an
der Universität Duisburg-Essen durchgeführt.
1. Gutachter: Prof. Dr. Bernhard Horsthemke
2. Gutachter: Prof. Dr. Anke Hinney
3. Gutachter: Prof. Dr. Ulrich Rüther
Vorsitzender des Prüfungsausschusses: Prof. Dr. Ann Ehrenhofer-Murray
Tag der mündlichen Prüfung: 05.02.2012
List of Papers
This thesis is based on the following papers:
1. Kanber D*., Berulava T*., Ammerpohl O., Mitter D., Richter J., Siebert R., Horsthemke B.,
Lohmann D., Buiting K. (2009). "The Human Retinoblastoma Gene Is Imprinted." Plos
Genetics 5(12).
2. Berulava T. and Horsthemke B. (2010). "The obesity-associated SNPs in intron 1 of the FTO
gene affect primary transcript levels." Eur J Hum Genet 18(9): 1054-1056.
3. Berulava T. and Horsthemke B. (2010). "Comment on: Jowett et al. (2010) Genetic Variation
at the FTO Locus Influences RBL2 Gene Expression. Diabetes;59:726–732." Diabetes 59(7):
e9.
4. Berulava T., Ziehe M., Klein-Hitpass L., Mladenov E., Thomale J., Rüther U., Horsthemke B.
(2012). "FTO levels affect RNA modification and the transcriptome." Eur J Hum Genet [Epub
ahead of print].
* shared first authorship

დოდონა - დედას
და თემური - მამას
Table of Contents
I
Table of Contents
Table of Contents……………………………………………………………………………………I-IV
Abbreviations and Units………………………………………………………………………….V-VIII
1. Introduction 1
1.1 The FTO gene – A Discovery of the Genome Wide Association Studies……………………….. 1
1.2 Strong LD Relationships Hinder Identification of Causative FTO Variant(s)………………….. 4
1.3 The FTO gene……………………………………………………………………………………. 6
1.4 Findings from Animal Studies…………………………………………………………………… 9
1.5 FTO Studies in Humans………………………………………………………………………….. 11
1.6 FTO Demethylates RNA…………………………………………………………………………. 14
1.7 Importance of RNA Modifications………………………………………………………………. 15
1.8 Aim of the Project………………………………………………………………………………... 18
2. Materials and Methods 19
2.1 Study Cohort……………………………………………………………………………………... 19
2.2 Materials………………………………………………………………………………………….. 19
2.2.1 DNA and Protein Markers………………………………………………………………… 19
2.2.2 Oligonucleotides…………………………………………………………………………... 20
2.2.3 Enzymes…………………………………………………………………………………... 20
2.2.4 Antibodies………………………………………………………………………………… 20
2.2.5 SureFIND Transcriptome PCR Array…………………………………………………….. 21
2.2.6 Competent Cells…………………………………………………………………………... 21
2.3 Methods…………………………………………………………………………………………... 22
2.3.1 Working with DNA and RNA…………………………………………………………… 22
2.3.1.1 DNA Preparation from Cells……………………………………………………... 22
2.3.1.2 Mini-Preparation of Plasmid DNA………………………………………………. 22
2.3.1.3 Maxi-Preparation of Plasmid DNA……………………………………………… 22
Table of Contents
II
2.3.1.4 Preparation of Unspliced Heterogenous Nuclear RNA (hnRNA)……………….. 23
2.3.1.5 Preparation of Total RNA………………………………………………………... 23
2.3.1.6 DNA and RNA Concentration Measurements…………………………………… 24
2.3.1.7 Restriction Analyses……………………………………………………………… 24
2.3.1.8 Reverse Transcriptase Reaction for Preparation of cDNA……………………….. 24
2.3.1.9 PCR Amplification……………………………………………………………….. 25
2.3.1.10 Agarose Gel Electrophoresis……………………………………………………... 26
2.3.1.11 Gel Extraction of DNA…………………………………………………………... 26
2.3.1.12 Real-Time PCR…………………………………………………………………… 26
2.3.1.13 Genotyping……………………………………………………………………….. 27
2.3.1.14 Primer Extension Assay………………………………………………………….. 27
2.3.1.15 Microarray Analyses……………………………………………………………… 28
2.3.2 Electrophoretic Mobility Shift Assay (EMSA)…………………………………………… 28
2.3.3 Preparation of Protein from Cell Culture…………………………………………………. 29
2.3.3.1 Preparation of Protein from Nuclear Fraction……………………………………. 29
2.3.3.2 Preparation of Whole Cell Protein Extract……………………………………….. 30
2.3.3.3 Concentration Measurements of Protein Extracts………………………………... 31
2.3.3.4 Seperation of Proteins by Electrophoretic Mobility (SDS-PAGE) followed by
Western Blotting…………………………………………………………………. 31
2.3.4 Cell Culture……………………………………………………………………………….. 32
2.3.5 FTO overexpression and knockdown…………………………………………………….. 33
2.3.5.1 Constructs used for Subclonning………………………………………………… 33
2.3.5.2 Generation of FTO-Overexpressing Cell Lines…………………………………... 33
2.3.5.3 FTO-Knockdown by siRNA Transfection……………………………………….. 34
2.3.6 RNA Hydrolysis…………………………………………………………………………... 35
2.3.7 High Performance Liquid Chromatography with Mass Spectrometry (HPLC-MS)……… 35
2.3.8 Immunocytochemistry and Microscopy…………………………………………………... 35
2.3.9 RNA-FISH………………………………………………………………………………... 36
2.3.10 Confocal Laser microscopy……………………………………………………………...... 36
2.3.11 Software Tools and Statistical Analyses………………………………………………….. 37
Table of Contents
III
3. Results 38
3.1 Expression Studies……………………………………………………………………………….. 38
3.1.1 Allelic Expression Studies………………………………………………………………… 38
3.1.1.1 Primer Extension Assay………………………………………………………….. 38
3.1.1.2 The Risk Allele of FTO Makes More Primary Transcripts………………………. 40
3.1.1.3 Allelic Expression of FTO-Neighboring Genes is Independent
of FTO Genotype…………………………………………………………………. 44
3.1.2 In silico Analyses of the Obesity-Associated FTO SNPs………………………………… 48
3.1.3 Electrophoretic Mobility Shift Assay (EMSA)…………………………………………… 49
3.1.4 Transcription Factors Regulating Expression of FTO…………………………………...... 52
3.2 Functional Studies………………………………………………………………………………... 56
3.2.1 Generation of the FTO-Overexpressing Cell Lines……………………………………….. 56
3.2.2 Induction of FTO Overexpression………………………………………………………… 57
3.2.3 Changes in the Transcriptome of FTO-Overexpressing Cells…………...……………….. 60
3.2.4 Changes in Transcriptome of FTO-Knockdown Cells…………………………………… 62
3.2.5 Subcellular Localization of the FTO Protein……………………………………………… 64
3.2.6 FTO is Enriched at Nuclear Speckles……………………………………………………... 66
3.2.7 Modification of Brain RNA in Wildtype and Fto Knock-out Mice……………………… 71
4. Discussion 73
4.1 FTO Genotype Affects FTO Expression………………………………………………………… 73
4.2 Overexpression of FTO Causes Obesity…………………………………………………………. 78
4.3 Transcriptional Regulation of FTO………………………………………………..…………….. 80
4.4 Consequences of Altered FTO Level……….…………………………………………………… 82
4.5 Subcellular Localization of FTO……………………………………………...…………………. 86
4.6 RNA Methylation Analysis……………………………………...………………………………. 87
4.7 Relevance of FTO for Obesity…………………………………………………………………… 89
Table of Contents
IV
5. Summary 92
6. References 93
7. Appendix 107
7.1 Section 1 – Primer sequences for PCR/RT-PCR and primer extension assays……………… 107
7.2 Section 2 – Sequences of oligonucleotides used in EMSA………………………………….. 107
7.3 Section 3 – Transcription factors positively regulating FTO expression……………………. 108
7.4 Section 4 – Transcription factors negatively regulating FTO expression…………………… 110
7.5 Section 5 – Transcription factors retrieved from UCSC browser…………………………… 112
7.6 Section 6 – Transcription factors retrieved from UCSC browser (Transfc Matrix
Database (v7.0))……………………………………………………………………………... 115
7.7 Section 7 – List of transcripts with changed levels after 48h of FTO overexpression……… 118
7.8 Section 8 – List of Gene Ontology subcategories generated by GeneTrail online tool……... 121
7.9 Section 9 – List of transcripts with changed levels after 48h of FTO knockdown…………. 129
7.10 Section 10 – List of Gene Ontology subcategories generated by GeneTrail online tool……. 134
7.11 Section 11 – Probesets for MALAT1 in FTO-overexpressing clones and
FTO-knockdown cells………………………………………………………………………. 134
7.12 Section 12 – Subpopulations of the FTO protein…………………………………………… 136
8. Acknowledgements 137
Abbreviations and Units
V
Abbreviations and Units
Abbreviations
1-meA 1-methyladenosine
1-meG 1-methylguanosine
3’UTR 3' untranslated region
3-meC 3-methylcytidine
3-meT 3-methylthymidine
3-meU 3-methyluridine
5-mC 5-Methylcytidine
A Adenosine
APC Adenomatosis Polyposis Coli
APS Ammoniumpersulfate
BMI Body Mass Index
BSA Bovine Serum Albumin,
C Cytidine
cDNA Complementary DNA
CEU CEPH: Utah residents with ancestry from northern and western Europe
CHB Han Chinese in Beijing, China
CMV Cytomegalovirus
CO2 Carbon dioxide
CpG Dinucleotide with the base sequence CG in 5’-3’ orientation
CTCF CCCTC-binding factor
CTD C-terminus Domain
CUTL1 or CUX1 Cut-like Homeobox 1
DMEM Dulbecco’s Modified Eagle’s Medium
DNA Deoxyribonucleic Acid
DNase Deoxyribonuclease
dNTP Deoxyribonucleotidetriphosphate
dsDNA Double strand DNA
DTT Dithiotreitol
E. coli Escherichia coli
EDTA Ethylenediaminetetraacetic acid
EMSA Electrophoretic Mobility Shift Assay
ENU N-ethyl-N-nitrosurea
EtBr Ethidium bromide
FCS Fetal Calf Serum
Fig Figure
FTO Fat mass and obesity associated gene
G Guanosine
Abbreviations and Units
VI
GAPDH Glyceraldehyde-3-phosphate dehydrogenase
gDNA genomic DNA
GWASs Genome Wide Association Studies
H2O Water
HEK293 Human Embryonic Kidney 293 cells
HeLa Hela cell, immortal cells derived from cervical cancer cells
HEPES 4-(2-hydroxyethyl)-1-piperazineethanesulfonic acid
hnRNA unspliced heterogeneous nuclear RNA
KCl Potassium chloride
KOH Potassium hydroxide
LB Luria Broth
LCs Lymphoblastoid cells
LD Linkage Disequilibrium
MCF-7 Michigan Cancer Foundation - 7, breast cancer cell line
METTL3 Methyltransferase like 3 gene
MgCl2 Magnesium chloride
miRNA microRNA
mRNA messenger RNA
N6-meA N6-methyladenosine
NaCl Sodium chloride
NaF Sodium fluoride
NaOH Sodium hydroxide
NTD N-terminus Domain
OD Optical Density
ORF Open Reading Frame
PBS Phosphate Buffered Saline
PCR Polymerase Chain Reaction
pre-mRNA precursor messenger RNA
qPCR quantitative PCR
RBL2 Retinoblastoma-like 2 gene
RNA Ribonucleic Acid
RNase Ribonuclease
RPGRIP1L Retinis pigmentosa GTP-ase regulator-interacting protein 1-like
rRNA ribosomal RNA
RT room temperature
SDS Sodium dodecyl sulfate
SDS-PAGE Sodium dodecyl sulfate polyacrylamide gel electrophoresis
SGBS Preadipocyte cell line from a patient with Simpson-Golabi-Behmel syndrome
siRNA small interfering RNA
snoRNA small nucleolar RNA
SNPs single nucleotide polymorphisms
Abbreviations and Units
VII
snRNA small nuclear RNA
ssDNA single-stranded DNA
ssRNA single-stranded RNA
SV40 Simian Virus 40
SY5Y Human neuroblastoma cell line
T Thymidine
T2D type 2 diabetic
TAE Tris-actetate-EDTA buffer
TBS Tris-buffered saline
TCF7L2 Transcription factor 7-like 2 gene
TE Tris-EDTA buffer
TEMED Tetramethylethylenediamine
Tris Tris(hydroxymethyl)aminomethane
tRNA transfer RNA
Tween 20 Polyoxyethylene sorbitan monolaurate
UV Ultra Violet
YRI Yoruba in Ibadan, Nigeria
ΨU Pseudouridine
Abbreviations and Units
VIII
Units
°C degrees celsius
aa amino acid(s)
bp base pair(s)
g gramm(s)
h hour(s)
kb kilobase(s)
kDa kilodalton
l litre
M molar (mol/l)
m milli (10-3)
mA milliampere
min minute(s)
ml millilitre
n nano (10-9)
n x g n-fold earth’s acceleration
nm nanometer(s)
pH -log[H+]
rpm rotations per minute
s seconds
U unit(s)
V volt
v/v volume per volume
w/v weight per volume
µ micro (10-6)
Introduction
1
1. Introduction
1.1 The FTO Gene – A Discovery of the Genome-Wide Association Studies
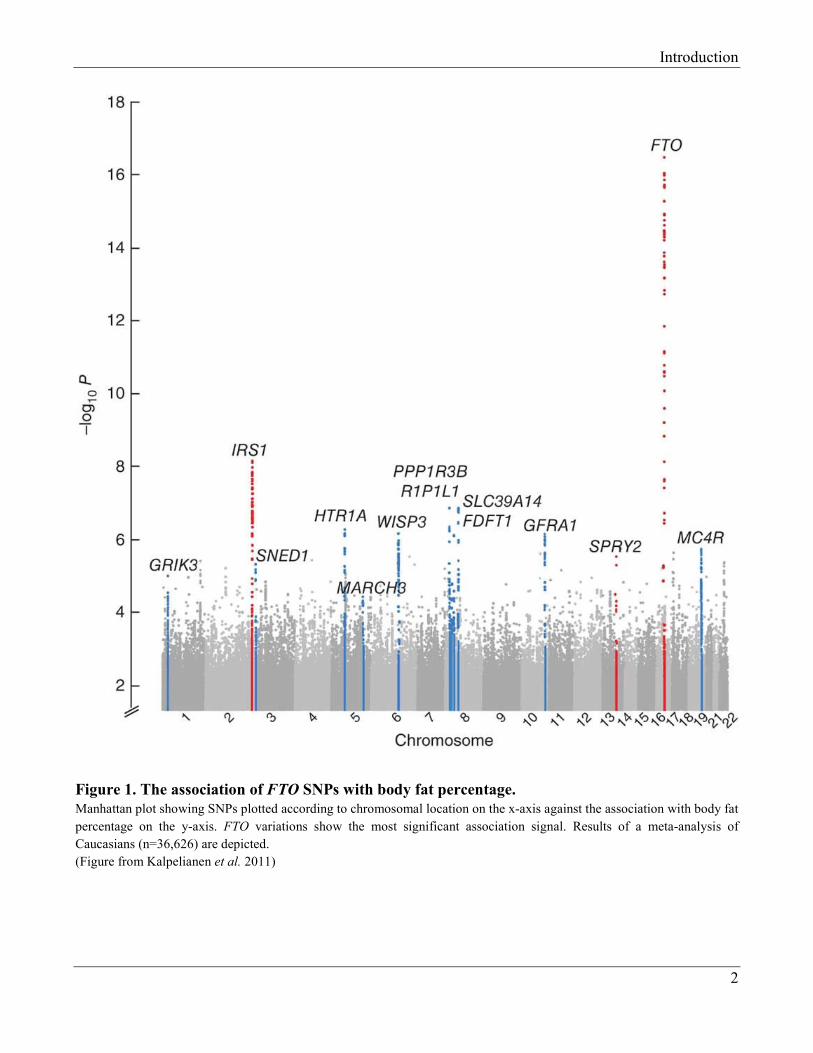
The fat mass and obesity-associated gene FTO first came to the awareness of the obesity
research field in 2007, when genome-wide association studies (GWASs) robustly associated the block
of single nucleotide polymorphisms (SNPs) within intron 1 of the gene with normal variation of body
weight (Figure 1). GWASs have the advantage of allowing the examination of many common variants
covering the whole genome to find association with traits of interest in large groups of individuals
recruited to case-control studies. Four independent groups almost simultaneously reported the strong
link of the FTO intronic variants to body weight regulation this year. Frayling and colleagues
performed GWAS in individuals with type 2 diabetes (T2D) and controls and ended up with
association signals in the FTO gene. However, the association abolished after subsequent adjustment
for body mass index (BMI), indicating that the impact of FTO variation on T2D was because of
association with obesity. They confirmed this intriguing finding by genotyping almost 40000
individuals (Frayling et al. 2007). Dina et al. identified the link between the FTO genotype and obesity
by chance while testing 48 SNPs in different regions for determination of the distribution of neutral
SNPs in their case-control study of obese European patients (Dina et al. 2007). The authors even stated
that they were actually searching for evidence for population stratification, and they were surprised to
find this association instead. Scuteri and colleagues designed their GWAS directly for identification of
association between genomic variation and obesity-related quantitative traits, namely BMI, hip
circumference and body weight. The strong link between FTO variation and obesity-related
quantitative traits they initially found in a population from Sardinia, was also revealed in non-white
population, when authors recruited African, Hispanic and European Americans to their study (Scuteri
et al. 2007). Also in 2007, Hinney et al. reported results of a GWAS conducted for extreme early onset
obesity and demonstrated the strong contribution of FTO variation to early onset obesity (Hinney et al.
2007).
Introduction
2
Figure 1. The association of FTO SNPs with body fat percentage.
Manhattan plot showing SNPs plotted according to chromosomal location on the x-axis against the association with body fat
percentage on the y-axis. FTO variations show the most significant association signal. Results of a meta-analysis of
Caucasians (n=36,626) are depicted.
(Figure from Kalpelianen et al. 2011)
Introduction
3
Numerous studies have followed since then, demonstrating the association of the SNPs in intron
1 of FTO with obesity in many populations of different ancestry, age and of both sexes (Cecil et al.
2008; Do et al. 2008). Recently, the FTO genotype has been reported to be associated with phenotypic
variability of BMI (Yang et al. 2012). To date, more than 20 different populations of European, African
and Asians ancestries have been investigated and the association of the FTO variation with the BMI has
repeatedly been confirmed (Andreasen et al. 2008; Cecil et al. 2008; Hotta et al. 2008; Ng et al. 2008;
Tan et al. 2008; Villalobos-Comparan et al. 2008; Cornes et al. 2009; Tonjes et al. 2010; Jacobsson et
al. 2012). Among all obesity-associated loci, FTO has the largest effect on body weight (Speliotes et al.
2010), although the mean weight difference contributing to the FTO obesity variations is rather modest.
On average, homozygotes for the risk allele weigh 3 kg more and have a 1.67-fold increased risk of
developing obesity compared to those with non-risk alleles only (Frayling et al. 2007; Scuteri et al.
2007). Importantly, studies have shown that the risk of obesity in individuals carrying the risk FTO
allele(s) is weaker in physically active individuals and can be attenuated by a low-energy diet
(Demerath et al. 2011; Kilpelainen et al. 2011; Phillips et al. 2012).
Since the obesity-associated FTO SNPs are of intronic location, it has been widely disputed
whether the FTO variations contribute to the normal body weight variation through a direct or indirect
regulatory effect on itself or other gene(s). The retinis pigmentosa GTP-ase regulator-interacting
protein 1-like (RPGRIP1L) gene is one of the genes that has been considered to be differentially
regulated by the FTO variations (Frayling et al. 2007). RPGRIP1L shares a CpG island with FTO and
is transcribed in the opposite direction, suggesting that the two genes are co-regulated. Another
argument for this assumption was that both FTO and RPGRIP1L are ubiquitously expressed and show
high similarity of expression profile in fetal and adult tissues (Frayling et al. 2007; Stratigopoulos et al.
2008). The RPGRIP1L protein is located in cilia and centrosomes and is present in nearly all cell types
(Arts et al. 2007; Zhu et al. 2009). RPGRIP1L loss-of-function mutations cause Joubert syndrome type
7 or lethal Meckel syndrome type 5 (Delous et al. 2007). Additionally, expression of the
retinoblastoma-like 2 (RBL2) gene has been reported to be affected by the FTO genotype possibly
through interaction at a large genomic distance (Jowett et al. 2010). RBL2 has been described to
regulate proliferation and differentiation of preadipocytes into adipocytes (Shin et al. 1995; Dimas et
al. 2009).
Introduction
4
1.2 Strong LD Relationships Hinder Identification of Causative FTO Variant(s)
The obesity-associated FTO SNPs are located within the 47 kilobase linkage disequilibrium
(LD) block encompassing parts of the first two introns as well as exon 2 of FTO. Linkage
disequilibrium is a non-random association of alleles at two or more loci (Weiss and Clark 2002). In
other words, it refers to an allele combination in a population with higher or lower occurrence than
would be expected from a random formation of haplotypes from alleles based on their frequencies
(indicating genetic markers co-segregating on a chromosome and being inherited together in a non-
random way). Consequently, LD relationships between genetic markers differ in different populations
and between different genomic regions. The full LD exists between alleles when one can predict
existence of one knowing the other. There are two measures used to characterize LD relationships: D’
and r2. The first one is a normalized D, which represents deviation of the observed frequency from the
expected frequency. D’ ranges from 0 to 1, where 1 means that two SNPs are not separated by
recombination event and complete LD exists between them. The r2 value reflects statistical correlation
between pairs of alleles and indicates the frequency of each allele. It also ranges from 0 to 1, where 1
means that two alleles are always together and have the same frequency on top of that (Zondervan and
Cardon 2004).
It has been shown that there are quite a number of FTO SNPs that give a signal for the
association to obesity. These are rs9939609, rs8050136, rs1421085, rs17817449, rs1121980,
rs3751812, rs9941349, rs9937053, rs9923233, s9930506 and some others (Peng et al. 2011; Jacobsson
et al. 2012). Owing to the tight LD correlation between them, it is very difficult to identify the
functionally relevant variant(s). So far, all fine-mapping efforts have been hindered by the strong LD in
this region (Scuteri et al. 2007; Grant et al. 2008; Hotta et al. 2008; Rampersaud et al. 2008; Fawcett
and Barroso 2010). From this point of view, association studies conducted in different populations are
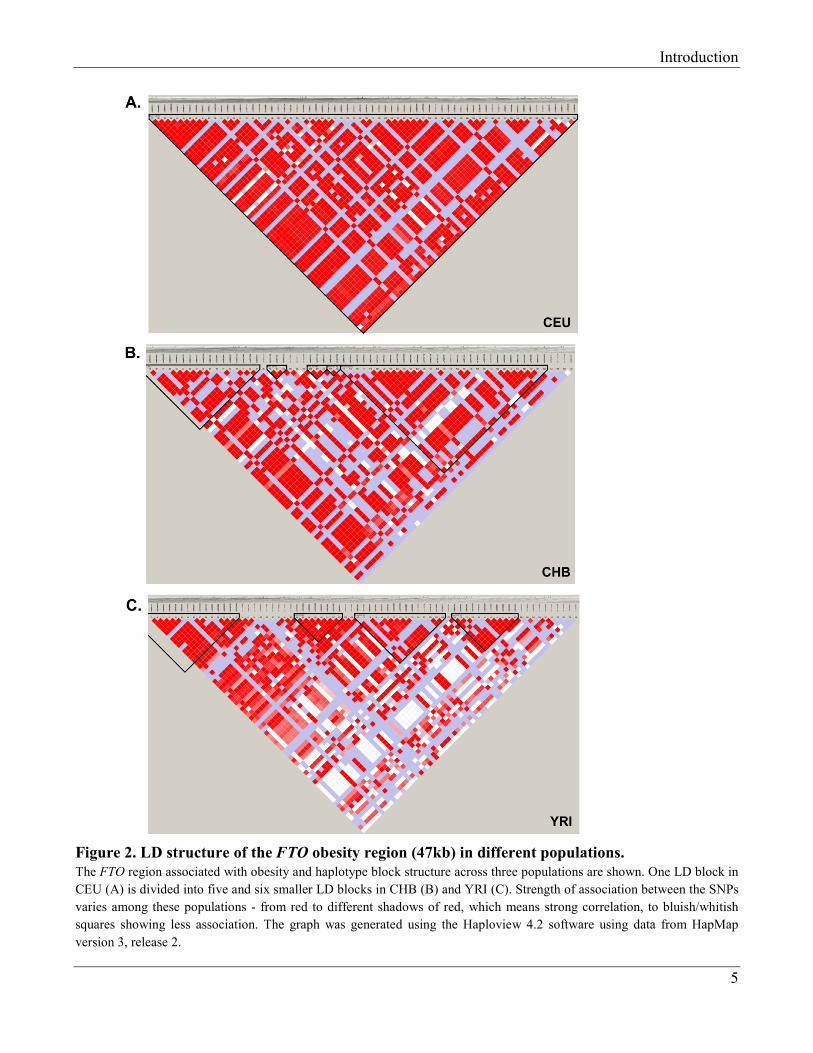
very valuable, given the fact that people of different ancestry harbor varying patterns of LD. Figure 2
displays LD blocks for different populations from the genomic region where FTO obesity-associated
SNPs are located. It is clear that a 47kb region with obesity-associated variations forms one LD block
(surrounded by a black triangle) in CEU population (CEPH: Utah residents with ancestry from northern
and western Europe), whereas the same region is divided into five and four smaller LD blocks in CHB
(Han Chinese in Beijing, China) and YRI (Yoruba in Ibadan, Nigeria) populations, respectively.
Furthermore, the strength of correlation between the SNPs is different between the groups.
Introduction
5
Figure 2. LD structure of the FTO obesity region (47kb) in different populations.
The FTO region associated with obesity and haplotype block structure across three populations are shown. One LD block in
CEU (A) is divided into five and six smaller LD blocks in CHB (B) and YRI (C). Strength of association between the SNPs
varies among these populations - from red to different shadows of red, which means strong correlation, to bluish/whitish
squares showing less association. The graph was generated using the Haploview 4.2 software using data from HapMap
version 3, release 2.
Introduction
6
To evaluate association with obesity, hundreds of studies, nicely reviewed by Peng et al. and
Jacobson et al., have investigated the SNPs that give a signal for the association to obesity in
populations of different origin (Peng et al. 2011; Jacobsson et al. 2012). Interestingly, the major
obesity-associated SNPs found European populations, rs9939609 and rs8050136, were not linked to the
obese phenotype in two people of African descent (Hassanein et al. 2010). Instead, two other SNPs,
rs3751812 and rs9941349, were identified as obesity-associated in these populations, but the authors
could not further distinguish between the two SNPs due to high LD relationship. Hence, it is unlikely
that the SNPs rs9939609 and rs8050136 determined from the European cohorts are causative, and it
might be that the two SNPs identified in the African cohorts, or variants in strong LD relationship with
them, contribute to the link of FTO to obesity. In Europeans, the two SNPs identified in the African
cohorts are in full LD relationship with the two SNPs from the European cohorts.
Although African cohorts showed that rs8050136 is unlikely to be a causative SNP, it is the
only suggested functional variant that has been extensively investigated up to now. As shown by
Stratigopoulus et al., rs8050136 is located in the binding site of Cut-like Homeobox 1 (CUX1 or
CUTL1, the latter is used hereafter) and is involved in regulation of expression of FTO and RPGRIP1L
(Stratigopoulos et al. 2008). In particular, two different cleavage forms of CUTL1, P200 and P110,
have been demonstrated to preferentially bind at rs8050136 depending on the presence of the risk
nucleotide (A) or non-risk nucleotide (C). The A risk allele of rs8050136 is preferentially bound by
P200, which is a transcriptional repressor and decreases expression of the FTO gene only. P110, a
transcriptional activator, is preferentially bound to the C allele at the same position and has been
reported to increase expression of both FTO and RPGRIP1L (Stratigopoulos et al. 2011). Nevertheless,
the mechanism by which the FTO SNPs are associated with obesity as well as the function of the FTO
protein in body weight regulation still remain to be discovered.
1.3 The FTO Gene
The FTO gene was first described in 1999 in a mouse with fused toes (ft mouse) and was named
Fatso (Fto), due to the largest size in the 1.6 Mb deletion on murine chromosome 8 (Peters et al. 1999).
These mice are characterized by partial syndactyly of forelimbs, impaired programmed cell death and
abnormalities in craniofacial development, but without any sign of change body weight or obesity.
Introduction
7
After the identification of the association of this gene with human obesity, the name was changed based
on the new phenotype with intention to keep the old symbol to “fat mass and obesity associated”
(FTO).
The FTO gene is located on chromosome 16 in humans and encompasses a large genomic
region of more than 400 kb. It contains nine exons and is found in most vertebrates and green algae, but
not in invertebrate animals and fungi. It is absent in green plants as well, suggesting that the ancestor
gene was present at least 450 million years ago (Fredriksson et al. 2008; Robbens et al. 2008).
Moreover, the region where FTO obesity SNPs are located is strongly conserved across species (Loos
and Bouchard 2008; Loos et al. 2008). Studies of mouse Fto and human FTO showed that the gene is
ubiquitously expressed in both, embryonic and adult tissues, with highest expression in brain, in
particular in hypothalamic nuclei regulating the appetite (Dina et al. 2007; Frayling et al. 2007; Gerken
et al. 2007; Fredriksson et al. 2008).
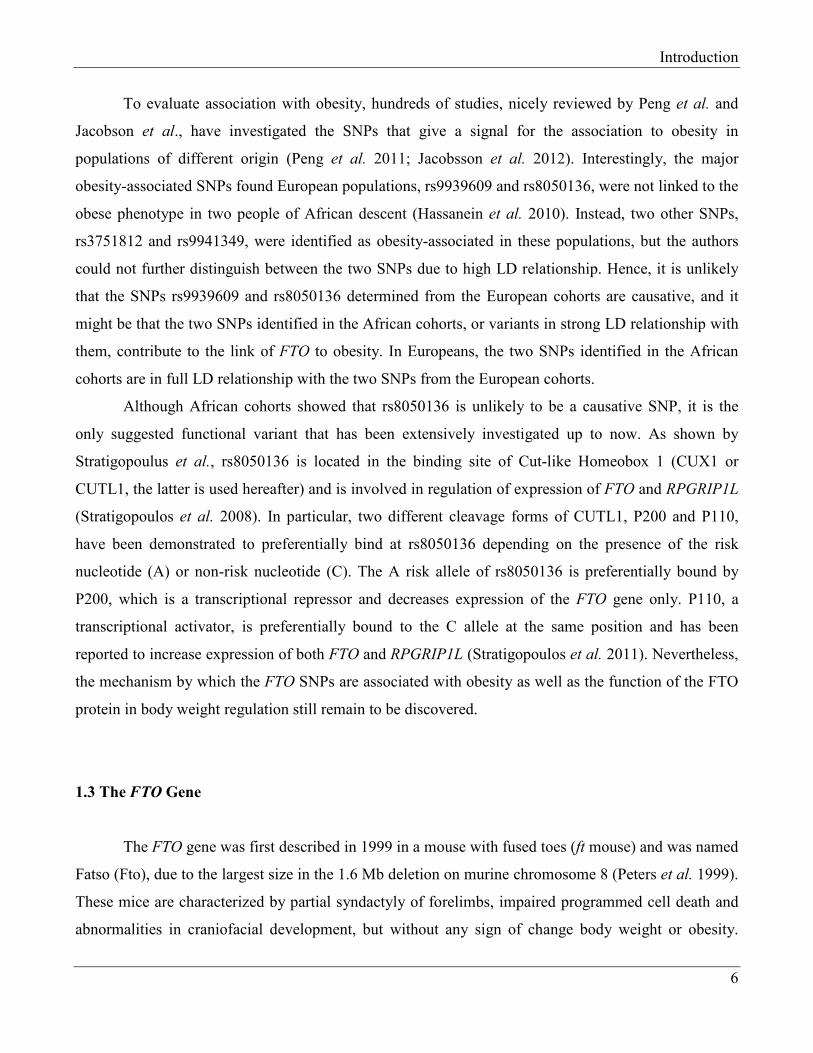
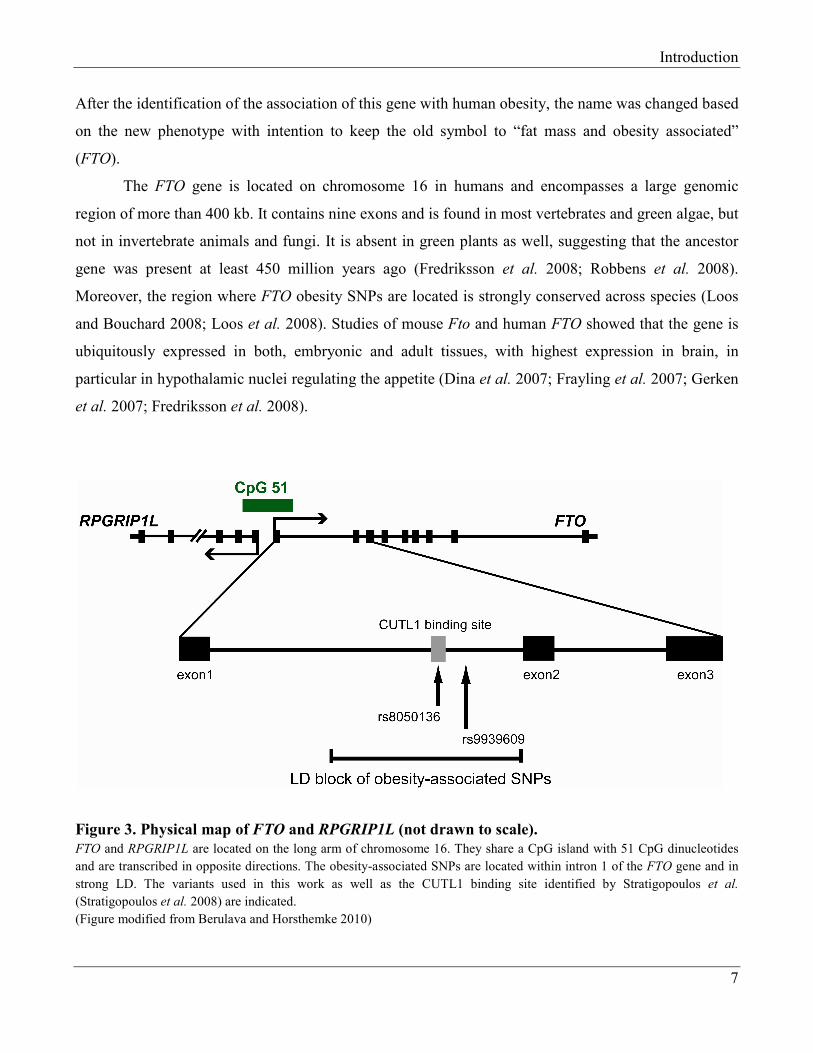
Figure 3. Physical map of FTO and RPGRIP1L (not drawn to scale).
FTO and RPGRIP1L are located on the long arm of chromosome 16. They share a CpG island with 51 CpG dinucleotides
and are transcribed in opposite directions. The obesity-associated SNPs are located within intron 1 of the FTO gene and in
strong LD. The variants used in this work as well as the CUTL1 binding site identified by Stratigopoulos et al.
(Stratigopoulos et al. 2008) are indicated.
(Figure modified from Berulava and Horsthemke 2010)
Introduction
8
The FTO protein consists of 505 amino acids (aa) and is localized to the cell nucleus. When the
intronic variants of FTO were first reported to be associated with obesity, the function of the gene was
unknown. Using bioinformatic analyses, it has been proposed that FTO belongs to the non-heme Fe(II)-
and α-ketoglutarate-dependent oxygenase superfamily (Gerken et al. 2007; Sanchez-Pulido and
Andrade-Navarro 2007), different members of which are involved in deoxyribonucleic acid (DNA)
repair, fatty acid metabolism and posttranslational modifications of histones (Loenarz and Schofield
2008). The enzymes from this family catalyze oxidation of multiple substrates using non-heme iron as
a co-factor and α-ketoglutarate as a co-substrate. Within the family, FTO shares more features with
Escherichia coli (E. coli) enzyme AlkB and its eukaryotic homologs (Sanchez-Pulido and Andrade-
Navarro 2007). The subclass of these enzymes is capable of repair of DNA methylation damage by
hydroxylation of methyl groups leading to their removal from DNA (Falnes et al. 2002; Aas et al.
2003). Human and bacterial AlkB proteins have been reported to be able to repair different methyl
lesions in mRNA and tRNA, and thus, recover RNA function (Ougland et al. 2004). By subsequent in
vitro studies FTO was shown to function as a demethylase with (i) a strong preference for single-
stranded DNA (ssDNA) over double-stranded DNA (dsDNA) and (ii) about two-fold higher enzymatic
activity towards single-stranded RNA (ssRNA) compared to ssDNA (Gerken et al. 2007; Jia et al.
2008). Favorite nucleotides 3-methyluridine (3-meU) and 3-methylthymidine (3-meT) in ssRNA and
ssDNA, respectively, were suggested (Gerken et al. 2007; Jia et al. 2008). Later, in vitro and in vivo
studies have added new pieces of information to this primary finding (see chapter 1.6).
Structural and biochemical analyses have provided insight into understanding the substrate-
specificity of the FTO protein and mechanisms how its activity is regulated (Han et al. 2010). The
crystal structure of FTO revealed that it compromises two well-defined domains, an N-terminal AlkB-
like domain (NTD) with a catalytic core and a C-terminal domain (CTD) that shows no homology to
any known structure. Additionally, FTO has an extra loop that preferentially selects methylated single-
stranded nucleic acids (Han et al. 2010). Given the fact that RNA, in particular ribosomal RNA
(rRNA), is abundant in cells and is mostly single-stranded, authors have suggested that FTO may
modify rRNA. Importantly, it has been shown that the NTD and the CTD interact with each other, and
moreover, that this interaction is crucial for the proper function of FTO (Han et al, 2010). However,
low kinetic parameters of FTO in vitro and discrepancies in the functional consequences of impaired
FTO/Fto (see chapters 1.4 and 1.5) leaves space for the speculation that FTO might have other binding
Introduction
9
partner(s) within a cell or is posttranslationally modified (Boissel et al. 2009; Church et al. 2009; Han
et al. 2010; Han et al. 2010; Ma et al. 2012).
1.4 Findings from Animal Studies
Although caution is always recommended when deducing human gene function from animal
models, studies on transgenic animals represent an elegant way to elucidate in vivo function of a gene
of interest. In 2007, when associations between FTO SNPs and BMI were first discovered, almost
nothing was known about the function of FTO. In their original paper, Frayling and colleagues even
stated that “FTO is a gene of unknown function in an unknown pathway…” (Frayling et al. 2007).
Analysis of Fto-deficient and Fto-overexpressing mice provided invaluable insights into the function of
FTO/Fto and shed light whether decreased or increased expression of gene contributes to the
development of obesity. At the same time, data about influence of feeding and other factors on the
expression level of FTO/Fto remains controversial.
Three mouse models have been reported that have given insights into relevance of Fto: two
with Fto deficiency and one with extra copies of the gene (Church et al. 2009; Fischer et al. 2009;
Church et al. 2010). In 2009, a group working with fused toes (ft) mutant mice described a mouse
model with a global Fto-specific knockout (Fischer et al. 2009). The mice were generated by replacing
exons 2 and 3 of Fto with a neomycin resistance cassette. This cassette also deletes part of intron 1, but
not the position that is equivalent to the obesity-associated FTO SNPs. Fto-/- mice displayed a complex
phenotype of postnatal growth retardation, reduction in lean body mass and adipose tissue despite
elevated food intake (relative hyperphagia), decreased spontaneous locomotor activity and increased
sympathetic nervous system activity. Moreover, Fto-/- mice showed increased metabolic rate and were
resistant to the high-fat diet-induced obesity. Although Fto-/- mice were born at the expected Mendelian
ratio, postnatal death occurred more frequently than expected. The heterozygous mice had a reduced
Fto expression leading to a significantly reduced weight after 12 weeks compared to their wildtype
littermates (Fischer et al. 2009). In contrast, no obesity-related changes were detected in a mouse
model described by Gao et al. Both whole body and neuronal-specific Fto-knockout animals displayed
postnatal growth retardation (similar to Fto knockout mice by Fischer et al., 2009), but their body
composition was normal (Gao et al. 2010).
Introduction
10
A milder phenotype has been reported for a mouse model with a dominant mutation induced by
ENU (N-ethyl-N-nitrosurea) mutagenesis in Fto leading to the substitution of phenylalanine for
isoleucine at position 367 (I367F) in the C-terminal region of the murine Fto protein (Church et al.
2009). The I367F substitution disrupts protein dimerization and results in a reduction of catalytic
activity. The authors could show that the mutated Fto is expressed at a lower level when transfected
into the mammalian cells (Church et al. 2009). In contrast to Fto-/- mice (Fischer et al. 2009), I367F
mutants showed no difference in postnatal mortality, physical activity and food intake compared to
wildtype littermates. Both heterozygous and homozygous male animals exhibited a maturity-onset
reduction in fat mass, but the body weight of female mice was not affected. No growth retardation or
any other gross abnormalities were reported (Church et al. 2009). Interestingly, I367F mice resembled
Fto-/- mice with increased energy expenditure (Church et al. 2009; Fischer et al. 2009).
Despite the differences in the phenotypes of Fto-/- and I367F mice, these findings showed that
disruption of Fto activity protects from obesity. An additional important conclusion drawn from these
works is that association of FTO SNPs with obesity in humans is due to functional effects of these
SNPs on FTO rather than other genes. This notion was later strengthened by the Fto-overexpressing
mouse model published by Church et al. in 2010. The authors created transgenic mice carrying one or
two additional copies of Fto leading to its global overexpression. The transgenic animals displayed an
increased food intake and a dose-dependent increase in body weight, irrespective of whether they were
fed with normal or high-fat diets. Mice with increased Fto expression on a high-fat diet developed
glucose intolerance (Church et al. 2010). Taken together, these studies have provided strong evidence
that increased expression of Fto is the cause of obesity.
Data about regulation of Fto expression in animals are contradictory to some extent. Studies of
mouse Fto and human FTO messenger RNA (mRNA) expression showed that both are widely
expressed across multiple tissues, with the particularly high expression in brain, especially in
hypothalamus (Gerken et al. 2007; Fredriksson et al. 2008; Qi et al. 2008). As the hypothalamus is a
key region for regulation of energy homeostasis (Coll et al. 2008), a number of studies have been
performed to address changes in hypothalamic expression of Fto in response to changes in the
nutritional status of animals (Gerken et al. 2007; Fredriksson et al. 2008; Stratigopoulos et al. 2008;
Jovanovic et al. 2010; Tung et al. 2010). In the mouse, bidirectional regulation of Fto expression in the
arcuate nucleus within the hypothalamus has been shown to depend on the diet. In particular, Fto
mRNA levels decreased following a 48h-long fasting period (Gerken et al. 2007), and this effect could
Introduction
11
not be rescued by the anti-starvation hormone leptin (Stratigopoulos et al. 2008). The suggestion that
the reduction of the Fto level is independent of leptin was further supported by the finding that Fto
expression in hypothalamus was reduced in the Lepob mice (mouse completely lacking leptin) on a
fasting diet compared to the Lepob mice on a standard diet (Stratigopoulos et al. 2008). A further study
showed that wildtype mice had increased expression of Fto after 10 weeks of high-fat diet (Tung et al.
2010). These studies suggest that the expression of Fto in mouse hypothalamus is downregulated by
fasting and upregulated by feeding. In contrast to the data from mouse, a report in rats showed that Fto
expression increases significantly in the whole hypothalamus after food deprivation and restriction
(Fredriksson et al. 2008). The discrepancy between these findings might be explained by differences in
the experimental designs, like different sampling times, and differences in physiology of mouse and rat,
such as the sensitivity of animals to fasting. Another group has reported about 2.5 fold upregulation of
Fto expression in the arcuate nucleus of hypothalamus in rats in response to high-fat diet (Tung et al.
2010). An additional finding from this study was that experimental 2.5-fold overexpression of Fto in
hypothalamus resulted in decreased food intake, whereas 40% knockdown of Fto led to increased daily
food intake. This is in line with the relative hyperphagia observed in Fto-/- mice (Fischer et al. 2009).
Further analyses of six mouse models of obesity did not show a significant difference in hypothalamic
Fto expression, but revealed reduced level of Fto mRNA in mesenteric fat (Stratigopoulos et al. 2008).
To summarize, the expression of Fto is apparently influenced by feeding and fasting conditions,
and most likely in a tissue-specific way. It is not clear whether differences in Fto expression are a cause
or a result of obesity. Although it is assumed that hypothalamic Fto levels play an important role in
regulation of energy intake, it seems to be worthy of attention/highly considerable, possibility that Fto
modulates energy expenditure in other tissues (given the ubiquitous expression of it) cannot be ruled
out.
1.5 FTO Studies in Humans
The breakthrough finding by GWAS in 2007 that SNPs within intron 1 of FTO are robustly
associated with BMI encouraged a wealth of subsequent studies trying to gain knowledge about the
biology of FTO (Frayling et al. 2007; Scuteri et al. 2007; Jia et al. 2008; Speliotes et al. 2010). In
addition, a number of works have been performed to assess the contribution of obesity-associated SNPs
Introduction
12
in FTO to other indicators of common obesity. Indeed, a significant association has been reported
between the FTO risk allele and increased waist and hip circumference and waist-to-hip ratio (Scuteri
et al. 2007; Do et al. 2008; Tan et al. 2008). Importantly, no study so far could show a link between
FTO genotype and FTO expression levels (Kloting et al. 2008; Grunnet et al. 2009; Lappalainen et al.
2009; Zabena et al. 2009). On the other hand, a correlation between FTO expression and the amount of
body and fat mass, as well as a significant modulation of FTO mRNA levels during adipogenesis have
been shown (Wahlen et al. 2008; Tews et al. 2011). Kloting and colleagues and Zabena and colleagues
reported that FTO mRNA expression was higher in subcutaneous adipose tissue than in visceral
adipose tissue in normal weight and obese individuals (Kloting et al. 2008; Zabena et al. 2009). Terra
et al. described significantly higher FTO mRNA levels in visceral adipose tissue than in subcutaneous
adipose tissue of obese, but not of lean subjects (Terra et al. 2010). Wahlen et al. showed an increased
level of subcutaneous adipose tissue FTO mRNA in obese individuals compared with non-obese
subjects. Additionally, the authors reported no difference in FTO expression between omental and
subcutaneous adipose tissue (Wahlen et al. 2008). However, studies performed to identify differences
of FTO mRNA expression between visceral and subcutaneous adipose tissues have been inconsistent
(Kloting et al. 2008; Wahlen et al. 2008; Zabena et al. 2009; Terra et al. 2010), and comparison of
FTO mRNA expression levels in adipose tissues in obese, normal weight and lean individuals did not
lead to a clear answer (Wahlen et al. 2008; Samaras et al. 2010; Terra et al. 2010).
Other studies have shown that FTO SNPs are associated with measurements of metabolic traits,
such as higher fasting insulin, glucose (Jacobsson et al. 2008), triglycerides and lower HDL cholesterol
(Freathy et al. 2008). Leptin levels, energy/food intake and satiety have also been reported to be
associated with the intronic variants of FTO (Cecil et al. 2008; Speakman et al. 2008; den Hoed et al.
2009; Haupt et al. 2009; Tanofsky-Kraff et al. 2009; Wardle et al. 2009). Interestingly, an association
between reduced brain volume and increased risk of Alzheimer disease has been shown in individuals
with the FTO risk allele (Ho et al. 2010; Benedict et al. 2011; Keller et al. 2011). This might be
through higher BMI, as studies have repeatedly shown a link between body weight and impairments of
cognitive function in individuals (Elias et al. 2003; Cohen 2010).
In 2009, a publication by Boissel et al. showed that FTO plays a crucial role in the normal
development of the central nervous and cardiovascular systems (Boissel et al. 2009). The authors
described a large Palestinian Arab consanguineous multiplex family with nine affected individuals with
severe polymalformation syndrome. Extensive investigations revealed a single nucleotide substitution
Introduction
13
at cDNA position 947 within FTO, leading to change of arginine with glutamine at position 316
(R316Q) on the protein level. Importantly, this amino acid is highly conserved across all FTO paralogs,
and thus, the full inactivation of the mutant form was not surprising. The clinical consequences of the
loss-of-function FTO mutation included postnatal growth retardation, severe psychomotor delay, facial
dysmorphism and functional brain deficits. Some patients displayed structural brain malformations,
cardiac defects, genital abnormalities and cleft palate. Early lethality (within 2.5 years) because of
intercurrent infections or unknown cause occurred in homozygotes. Parents of probands heterozygote
for R316Q were not clinically obese (Boissel et al. 2009). Interestingly, a female patient with a partial
duplication of the 16q region containing FTO and functional brain and developmental abnormalities
showed an obese phenotype (van den Berg et al. 2010). An increase in FTO mRNA levels was not
revealed in the patient’s lymphocytes although a 1.5-fold increase in FTO copy number was confirmed
with qPCR (van den Berg et al. 2010).
A number of heterozygous non-synonymous mutations in FTO have been revealed by
sequencing of all coding exons and exon-intron junctions in severely obese and lean individuals (Meyre
et al. 2010). Some of these variants have been proven to cause a complete catalytic inactivation of
FTO, but these substitutions were found in both obese and lean subjects. The total number of mutations
as well as the number of unique mutations did not differ between the lean and obese cohorts (Meyre et
al. 2010). Thus, it seems that loss of one functional copy of FTO is compatible with both lean and
obese phenotypes.
It is inappropriate to directly compare individuals with impaired FTO function to those carrying
obesity-associated variations in the intron 1 of FTO. However, the severe clinical phenotype caused by
the homozygous loss-of-function of FTO differs from that observed in Fto-/- mice, although in the latter
case significant postnatal death and growth retardation occurred (Boissel et al. 2009; Fischer et al.
2009). This discrepancy might be explained by a different function of FTO/Fto in these different
species. The finding that both lean and obese individuals can carry heterozygous loss-of-function
mutations in FTO indicates that haploinsufficiency does not fully protect from obesity. However, given
the small number of participants of this study (Meyre et al. 2010) and the fact that development of
obesity depends on many factors, the study by Meyre et al. may not be free of biases.
Introduction
14
1.6 FTO Demethylates RNA
The first evidence that FTO can demethylate nucleic acids appeared in 2007 when Gerken and
colleagues reported in vitro substrates of FTO (Gerken et al. 2007). Before this, bioinformatic
approaches revealed that FTO belongs to the AlkB-like 2-oxoglutarate-dependent DNA/RNA
demethylase family. The authors could demonstrate that recombinant murine Fto catalyzes
demethylation of 3-methylthymidine (3-meT) and has very low or no affinity to 1-methyladenosine (1-
meA), 3-methylcytidine (3-meC) and 1-methylguanosine (1-meG) in ssDNA. In 2008, Jia et al.
reported that, in addition to 3-meT in ssDNA, human recombinant FTO demethylates 3-methyluridine
(3-meU) in ssRNA by oxidation. Additionally, it has been shown that both murine and human
recombinant FTO proteins have a 2-fold preference for 3-meU in ssRNA over 3-meT in ssDNA (Jia et
al. 2008).
In recent in vitro and in vivo studies, N6-methyladenosine (N6-meA) has emerged as a substrate
of FTO. In the end of 2011, Jia and colleagues published their work demonstrating that FTO has an
efficient oxidative demethylation activity towards N6-meA in RNA in vitro. Although other
modifications have been described as targets for FTO in earlier studies (Gerken et al. 2007; Jia et al.
2008), the authors of this work turned their attention to the most abundant methylated base in mRNA,
N6-meA. Using an in vitro approach, as well as by analyzing the level of N6-meA in cells transfected
with either FTO-specific siRNA or an FTO-expressing vector, they demonstrated that FTO efficiently
demethylates N6-meA in cellular mRNA in vivo (Jia et al. 2011).
Further evidence that FTO can demethylate N6-meA was provided by Meyer and colleagues in
2012 (Meyer et al. 2012). While performing a transcriptome-wide N6-meA localization study, the
authors examined the level of this particular modification in FTO-overexpressing cells. Immunoblot
analysis of total RNA demonstrated a significant decrease in the level of N6-meA in the presence of
abundant FTO. Moreover, it has been shown that overexpression of FTO resulted in a broad size range
of RNAs with reduced N6-meA immunoreactivity (Meyer et al. 2012).
Introduction
15
1.7 Importance of RNA Modifications
RNA modifications are still an unexplored field, while for DNA and proteins multiple layers of
epigenetic regulations resulting from different modifications have been extensively investigated.
Numerous posttranscriptional modifications in RNA nucleotides are introduced by enzymes along with
RNA processing/maturation (Czerwoniec et al. 2009; Cantara et al. 2011). The frequency, location and
distribution of these different types of chemical changes vary greatly between different RNA molecules
and at the same time carry signs of specificity (Czerwoniec et al. 2009; Motorin and Helm 2011).
Nevertheless, the complexity of the relationship between RNA structure and function, and the lack of
techniques to assess such relationships makes it very challenging to decipher the biological significance
of RNA modifications.
However, recent works show that this field is developing rapidly. The importance of
modification of the last nucleotide in microRNA (miRNA) has been demonstrated (Yu et al. 2005).
The number of posttranscriptional modifications of ribosomal RNAs (rRNA) has been determined
(Guymon et al. 2007), and the biosynthesis pathways of known modifications have been elucidated
(Nasvall et al. 2007). In many cases, the biochemical and physiological roles of these modifications
have been found, for example in the decoding process for modifications in transfer RNA (tRNA)
(Johansson et al. 2008). Loss of cytosine methylation in tRNAs has been shown to result in
underdeveloped phenotype and impaired cellular differentiation in mouse (Tuorto et al. 2012). Finally,
numerous new RNA-modifying enzymes have been identified, including a number of tRNA and rRNA
methyltransferases (Sergiev et al. 2007; Jurkowski et al. 2008; Purta et al. 2008; Purta et al. 2008;
Schaefer et al. 2010).
From the wide range of RNA modifications (Motorin and Helm 2011), this chapter will focus
on those important for this project. The knowledge about the location and the function of N6-meA, a
modification shown to be a substrate for the FTO protein, was limited until very recent works. N6-meA
is the most frequent modification of mRNAs, and it is also found in tRNA, rRNA and viral RNA (Wei
et al. 1975; Narayan and Rottman 1988; Czerwoniec et al. 2009; Cantara et al. 2011). In mRNA, N6-
meA does not change the coding capacity of transcripts (Levanon et al. 2004; Dai et al. 2007), and its
significance for mRNA and/or other kinds of RNA still need to be resolved. N6-meA formation is
catalyzed by a multi-component enzyme, which is evolutionary highly conserved and of nuclear
Introduction
16
localization. So far, only one subunit of this complex has been identified, namely methyltransferase
like 3 – METTL3 (Bokar et al. 1997).
Three studies have very recently given deeper insights into the biology of N6-me6 ((Jia et al.
2011; Dominissini et al. 2012; Meyer et al. 2012). Meyer and colleagues conducted sequencing
analyses of transcription-wide localization of N6-meA in mammalian tissues, and more than 7000
mammalian mRNAs were identified to contain N6-meA. Moreover, the authors have shown that the
content of N6-meA varies a lot between different immortalized cell lines, including several cancer
lines, suggesting that different populations of cells are characterized by different N6-meA levels
(Meyer et al. 2012). A further interesting finding was that N6-meA is highly enriched in brain and its
level increases during neuronal maturation (Meyer et al. 2012). Given the fact that FTO can
demethylate N6-meA, the well-described high expression of FTO in the brain (Gerken et al. 2007;
Fredriksson et al. 2008; Yeo 2012) is intriguing, but of course, one should consider existence of
different populations of cells within the brain.
When the regional distribution of N6-meA within the transcripts was examined, it turned out
that N6-meA is significantly abundant in the 3’UTR of mRNAs, in particular in the close vicinity of
stop codons (Jia et al. 2011; Dominissini et al. 2012; Meyer et al. 2012). Only a low percentage of N6-
meA was detected intronic regions. Further analyses showed that the majority of transcripts enriched
with N6-meA (67%) contain miRNA binding sites, suggesting that the modifications affect miRNA-
guided regulation of transcripts (Meyer et al. 2012). Additionally, analyses of splice junctions with
regard to content of N6-meA showed no enrichment at exon-exon junctions (Meyer et al. 2012). In
contrast, knockdown of the METT3 and subsequent analyses of the transcriptome revealed that the N6-
meA levels affected alternative splicing (Dominissini et al. 2012). The discrepancy between these two
studies might be explained by the fact that the first group investigated the methylation of exon-exon
junctions only, whereas Dominissini and colleagues used a different read-out for changes in splicing
patterns.
Not much is known about the significance of 3-meU in RNA. It is found in rRNA of archaea
(23S), bacteria (16S and 23S) and eukarya (18S and 28S) and it is characterized by position specificity
(Negre et al. 1989; Cantara et al. 2011). 3-meU has been detected in 28S rRNA in HeLa cells
(Klagsbrun 1973). Moreover, it has been shown that 3-meU considerably affects the structure of rRNA
(Micura et al. 2001) and changes its sensitivity to chemical cleavage (Fan et al. 2003). The effect of 3-
meU on RNAs might be indirect, since it has been shown that methyl group prevents the uridine from
Introduction
17
H/ACA small nucleolar RNA (snoRNA) guided isomerization (Zhou et al. 2010). Thus, the content of
the pseudouridine (ΨU), known as the fifth base in RNA, might be regulated in such a way.
Pseudouridine, the most frequent nucleotide modification found in functional RNAs, is a C-
glycoside isomer of uridine and usually appears in highly conserved regions (Ofengand 2002). It has
been shown that defects in rRNA pseudouridylation affects ribosome-ligand binding and translational
fidelity in all kingdoms of life (Jack et al. 2011). In particular, a reduction in ΨU level leads to the
inhibition of IRES-mediated translation due to affected ribosome recruitment and tRNA binding to
ribosomes. Thus, pseudouridylation is required for translational fidelity (Jack et al. 2011). Another
study has shown that environmental stimuli induce isomerization of uridine within the spliceosomal
small nuclear RNA (snRNA) U2, leading to changes in pre-mRNA splicing (Wu et al. 2011).
Taken together, these works indicate the functional importance of different modifications of
ribonucleosides for RNA molecules, and adds an additional, RNA-dependent level of regulation to the
complex physiology of a cell.
Aim of the Project
18
1.8 Aim of the Project
Despite the discovery of a robust association of intronic FTO SNPs with BMI and obesity, the
impact of these variations on expression of FTO and/or other genes has remained unknown. Moreover,
the biological function of FTO, in particular its contribution to body weight regulation, is still a subject
of extensive investigations.
This project was launched in 2008 and based on the assumption that the intronic FTO variations
affect an enhancer or silencer element and therefore expression of FTO itself. Since other resesarchers
had failed to link FTO genotypes to levels of FTO mRNA, I decided to investigate the allelic
expression of FTO in heterozygous subjects. Lack of expressed FTO SNPs made it necessary to use
unspliced heterogeneous nuclear RNA (hnRNA) to distinguish between FTO alleles. Furthermore,
allelic expression studies for loci mentioned together with FTO in view of body weight regulation
(RPGRIP1L and RBL2), will clarify whether FTO SNPs affect their transcription in cis. In addition,
characterization of obesity-associated FTO SNPs, both with in silico and experimental approaches, is
expected to facilitate narrowing down the group of known SNPs to those with functional significance.
Examination of consequences of altered cellular FTO levels will give insights in its biology. Previous
work points to the function of FTO as a transcription factor (Wu et al. 2010). Investigations of steady-
state mRNA levels in FTO overexpressing and deficient cells may give a full answer to whether this is
true, and may furthermore reveal downstream target(s). Additionally, studies on the location of FTO
within the cell will provide further clues to its area of function.
Because several studies showed 3-meU as a preferred substrate for FTO in ssRNAs, the main
focus of methylation analyses of RNA was on this particular ribonucleoside modification (Gerken et al.
2007; Jia et al. 2008). Nevertheless, 3-meC/C and N6-meA were included in later stages of this study,
as 3-meC/C was the second best in vitro substrate for FTO, and N6-meA has been recently reported to
be demethylated by FTO both in vitro and in vivo (Gerken et al. 2007; Jia et al. 2008; Jia et al. 2011;
Meyer et al. 2012).
Thus, the overall aim of this thesis was to investigate the impact of FTO genotype on FTO
expression and elucidate the function of the FTO protein by determining its subcellular localization and
the effect of FTO dosage on RNA expression profiles and RNA modification levels.
Materials and Methods
19
2. Materials and Methods
2.1 Study Cohort
The study was approved by the ethics committee of the University Hospital Essen. Blood
samples and skin biopsies from normal weight individuals (BMI 18.5 - 25) were obtained after
informed consent was given.
2.2 Materials
Chemicals and enzymes were purchased from Biomers (Ulm, Germany), Boehringer Mannheim
(Mannheim, Germany), Clontech (Heidelberg, Germany), Invitrogen (Carlsbad, CA, USA), Merck
(Darmstadt, Germany), New England Biolabs (NEB, Ipswich, MA, USA), Promega (Mannheim,
Germany), Roth (Karlsruhe, Germany), Sigma (Heidelberg, Germany) and Roche (Mannheim,
Germany).
2.2.1 DNA and Protein Markers
DNA markers 1 kb DNA ladder, Invitrogen
FastRuler™ DNA ladder, Low Range, Fermentas (Waltham, MA, USA)
FastRuler™ DNA ladder, Middle Range, Fermentas (Waltham, MA, USA)
Protein Marker: PageRuler™ Plus Prestained Protein Ladder, Fermentas (Waltham, MA, USA)
PageRuler™ Prestained Protein Ladder, Fermentas (Waltham, MA, USA)
Materials and Methods
20
2.2.2 Oligonucleotides
All primers in the present study were designed with Primer3 software (at
http://frodo.wi.mit.edu/primer3/), primers and universal probes for qPCR assays were selected by
Universal Probe Library Assay Design center (at https://www.roche-applied-
science.com/sis/rtpcr/upl/index.jsp?id=uplct_030000). All oligonucleotides were ordered from and
synthesized by Biomers.net (Ulm, Germany).
2.2.3 Enzymes
Restriction enzymes were purchased from Roche (Mannheim, Germany) or New England
Biolabs (NEB, Ipswich, MA, USA). GoTaq Green polymerase mostly used in PCR was from Promega
(Mannhein, Germany). Enzymes used in subclonning (T4-DNA-Ligase, Klenow, Alkaline phosphatase,
Mung Bean nuclease) were bought from Roche (Mannheim, Germany), Fermantas (Waltham, MA,
USA) and NEB (Ipswich, MA, USA). DNase I for cleaning up the hnRNA/RNA samples was
purchased from Qiagen (Hilden, Germany). Enzymes used for RNA hydrolysis (Nuclease P1,
Phosphodiesterase I from Snake Venom and Alkaline Phosphatase) were purchased from Sigma
Aldrich (Heidelberg, Germany). For PCR and RT-PCR AmpliTaq Gold polymerase (Roche,
Mannheim, Germany) and GoTaq Green polymerase (Promega, Mannheim, Germany) were used.
2.2.4 Antibodies
Mouse anti-FTO monoclonal antibody 5-2H10 – Abcam, Catalog No. ab92821
Rabbit anti-FTO monoclonal antibody EPR6894 – Epitomics, Catalog No.5514-1
Rabbit anti-COIL polyclonal antibody – ProteinTech, Catalog No. 10967-1-AP
Rabbit anti-PML polyclonal antibody – Abcam, Catalog No. ab53773
Mouse anti-SC35 (phosphor) monoclonal antibody – Abcam, Catalog No. ab11826
Rabbit anti-PSPC1 polyclonal antibody – Santa Cruz Biotechnology, Catalog No. sc-84577
Rabbit anti-GAPDH monoclonal antibody - Cell Signaling Technology, Catalog No. 2118 S
Materials and Methods
21
Goat anti-mouse Alexa Fluor® 488 secondary antibody – Invitrogen, Catalog No. A-11001
Goat anti-rabbit Alexa Fluor® 488 secondary antibody – Invitrogen, Catalog No. A-11008
Goat anti-mouse Cy3 secondary antibody – Dianova, Catalog No. 115-165-020
Stabilized Goat Anti-Mouse HRP Conjugated – PIERCE, Catalog-No. 32430
Stabilized Goat Anti-Rabbit HRP Conjugated – PIERCE, Catalog-No. 32460
2.2.5 SureFIND Transcriptome PCR Array
Ready-to-use PCR arrays were purchased from Qiagen (Hilden, Germany).
Expressed Transcription Factor-1 siRNA MCF-7 – Catalog No. 33661 TCSC-601A
Expressed Transcription Factor-2 siRNA MCF-7 – Catalog No. 33661 TCSC-602A
Expressed Transcription Factor-3 siRNA MCF-7 – Catalog No. 33661 TCSC-603A
2.2.6 Competent Cells
E. coli DH5α – F-, endA1, hsdR17, (rk-, mk+), supE44, thi-1, recA1, gyrA, (Nalr), relA1, D(lacZYA-
argF)U169, deoR, (Φ80dlacZ∆M15).
One Shot Mach1-T1 Chemically Competent E. coli – F- φ80(lacZ)∆M15 ∆lacX74 hsdR(rK-
mK+)∆recA1398 endA1 tonA, Invitrogen, Catalog No. C8620-03 (Invitrogen, Karlsruhe, Germany).
Materials and Methods
22
2.3 Methods
2.3.1 Working with DNA and RNA
2.3.1.1 DNA Preparation from Cells
Human DNA was extracted from whole blood with the EZ1 DNA Blood Kit (Qiagen, Hilden,
Germany). Genomic DNA (gDNA) from all cell types used in study was prepared with the FlexiGene
DNA Kit (Qiagen, Hilden, Germany) following the manufacturer`s instructions.
2.3.1.2 Mini-Preparation of Plasmid DNA
For mini-preparations of plasmid DNA, a single bacterial colony was incubated overnight in 5
ml LB with ampicillin (100 µg/ml) at 37°C and 250 rpm. 1.5 ml of the overnight culture were
transferred to a 1.5 ml reaction tube and pelleted for 5 min (2600 x g, 4°C). P1, P2 and P3 bufferes
were purchased from Qiagen (Hilden, Germany). The pellet was resuspended in 300 µl buffer P1 and
mixed by vortexing. 300 µl buffer P2 were added, the sample vigorously mixed by shaking, and then
incubated at RT for 3 min. 300 µl buffer P3 were added, the sample vigorously mixed by shaking,
centrifuged for 15 min (10300 x g, 4°C), and placed on ice immediately after centrifugation. The
supernatant was transferred to a fresh 1.5 ml reaction tube containing 500 µl ethanol (100 %) and
centrifuged for 20 min (16000 x g, RT). The DNA pellet was washed with 70 % ethanol and
centrifuged for 5 min (16000 x g, RT). The supernatant was discarded and the pellet left to air-dry for
15 min before resuspension in 25 µl H2O.
2.3.1.3 Maxi-Preparation of Plasmid DNA
Maxi-preparations of plasmid DNA were performed using the Plasmid Maxi Kit (Qiagen,
Hilden, Germany), strictly following the protocol.
Materials and Methods
23
2.3.1.4 Preparation of Unspliced Heterogenous Nuclear RNA (hnRNA)
For hnRNA extraction, lymphocytes were isolated with Ficoll-Paque PLUS (GE Healthcare,
USA) from fresh blood collected in EDTA tubes. Briefly, 2 ml of the blood samples were diluted with
2 ml PBS and layered on 3 ml Ficoll-Paque PLUS in a centrifuge tube. After centrifugation at 400 x g
for 40 min at room temperature (RT), the lymphocyte layer was carefully transferred into a new tube
and washed twice with PBS. Afterwards, lymphocytes prepared as described above, fibroblasts, LCs
and SGBS cells then were subjected to hnRNA extraction, exactly following the procedure described in
the manual of the Cytoplasmic & Nuclear RNA Purification Kit (Norgen Biotek Corporation, Thorold,
Canada). DNase treatment was carried out in solution followed by cleaning-up on RNeasy Mini Kit
spin columns (Qiagen Hilden, Germany). To minimize loss of hnRNA, all steps were carried out as
quickly as possible. Isolated hnRNA was dispensed in several aliquots and frozen in liquid nitrogen.
2.3.1.5 Preparation of Total RNA
Total RNA from blood was extracted with the PAXgene blood RNA Kit strictly following the
manufacturer’s instructions (PreAnalitiX, Hombrechtikon, Switzerland). To prevent false results due to
DNA contamination, samples were treated with DNase I (Qiagen, Hilden, Germany) following the
manufacturer’s protocol.
For FTO knockdown and overexpression cells RNeasy Mini Kit (Qiagen, Hilden, Germany)
was used to prepare total cellular RNA. Cells were placed in the corresponding volume of RLT buffer
and disrupted by pipetting up and down several times. RNA was precipitated with isopropanol. DNase
I treatment was performed twice for each sample, first on spin columns during extraction, and
afterwards in solution in eluted RNA. After the second DNase I treatment, all samples were cleaned up
with the RNeasy Mini Kit, concentrations were measured and working solutions (100 ng/µl) were
prepared.
RNA from brain of Fto-deficient (Fischer et al. 2009) and wildtype mice was extracted with
miRNeasy kit (Qiagen, Hilden, Germany) following the instructions of the manufacturer. The small
RNA fraction was eluted with the RNeasy MinElute Cleanup Kit (Qiagen, Hilden, Germany). Using
this approach, two fractions of RNA were prepared: large RNAs above 200 nt (mRNA with ribosomal
Materials and Methods
24
RNAs) and small RNAs less than 200 nt in size (enriched with miRNAs, transferring RNAs, 5S and
5.8S rRNAs). The large RNA fraction was treated with DNase I twice, just like total cellular RNA.
2.3.1.6 DNA and RNA Concentration Measurements
The exact concentration of DNA and RNA in solution was determined by photometric
adsorption measurements at a wavelength of λ = 260 nm and 280 nm in a ND-1000 Spectrophotometer
(NanoDrop Technologies, Thermo Scientific, Waltham, MA, USA). An OD260 = 1 corresponds to a
dsDNA concentration of 50 µg/ml or an RNA concentration of 40 µg/ml. The ratio of OD260 to OD280
indicates the purity of the sample. The ratio is 1.8 for pure DNA and 2.0 for pure RNA.
2.3.1.7 Restriction Analyses
For analytical and preparative purposes, DNA or plasmid DNA was digested in a ratio of 10 U
restriction enzyme per µg DNA in the buffer supplied by the manufacturer in a total volume of 20 or 50
µl. Digests were carried out at 37°C for 1 – 2 h. The volume of restriction enzyme was never above 10
% of the total volume to prevent high glycerol concentrations from inhibiting the digest. Digestions
products were analyzed on an agarose gel and checked for amount and size of generated fragments.
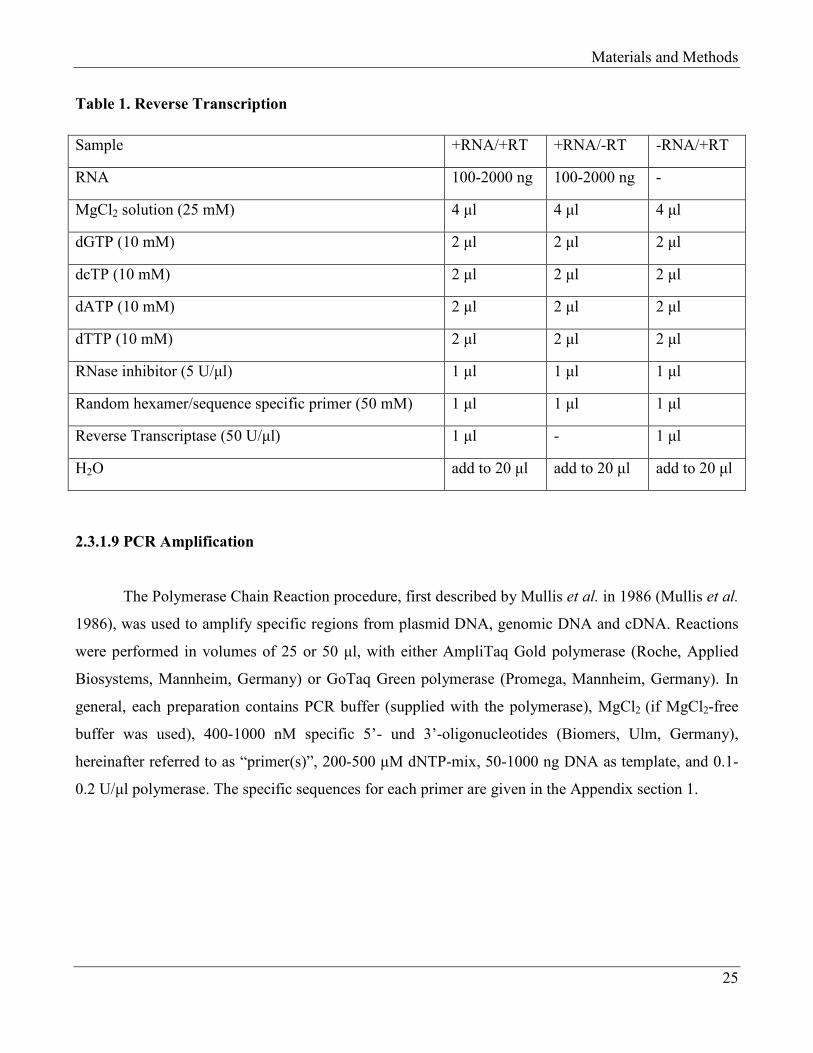
2.3.1.8 Reverse Transcriptase Reaction for Preparation of cDNA
Reverse transcription was performed with kit from Applied Biosystems (Foster City, CA,
USA). Reactions were prepared according to Table 1. The temperature profile was as following: 10
min at 21°C (for primer binding), 15 min at 42°C (reverse transcription) and 5 min at 95°C
(denaturation).
Materials and Methods
25
Table 1. Reverse Transcription
Sample +RNA/+RT +RNA/-RT -RNA/+RT
RNA 100-2000 ng 100-2000 ng -
MgCl2 solution (25 mM) 4 µl 4 µl 4 µl
dGTP (10 mM) 2 µl 2 µl 2 µl
dcTP (10 mM) 2 µl 2 µl 2 µl
dATP (10 mM) 2 µl 2 µl 2 µl
dTTP (10 mM) 2 µl 2 µl 2 µl
RNase inhibitor (5 U/µl) 1 µl 1 µl 1 µl
Random hexamer/sequence specific primer (50 mM) 1 µl 1 µl 1 µl
Reverse Transcriptase (50 U/µl) 1 µl - 1 µl
H2O add to 20 µl add to 20 µl add to 20 µl
2.3.1.9 PCR Amplification
The Polymerase Chain Reaction procedure, first described by Mullis et al. in 1986 (Mullis et al.
1986), was used to amplify specific regions from plasmid DNA, genomic DNA and cDNA. Reactions
were performed in volumes of 25 or 50 µl, with either AmpliTaq Gold polymerase (Roche, Applied
Biosystems, Mannheim, Germany) or GoTaq Green polymerase (Promega, Mannheim, Germany). In
general, each preparation contains PCR buffer (supplied with the polymerase), MgCl2 (if MgCl2-free
buffer was used), 400-1000 nM specific 5’- und 3’-oligonucleotides (Biomers, Ulm, Germany),
hereinafter referred to as “primer(s)”, 200-500 µM dNTP-mix, 50-1000 ng DNA as template, and 0.1-
0.2 U/µl polymerase. The specific sequences for each primer are given in the Appendix section 1.
Materials and Methods
26
2.3.1.10 Agarose Gel Electrophoresis
DNA or PCR/RT-PCR products were separated by size on 1-2 % (w/v) agarose gels. The
agarose was boiled in TAE buffer, cooled at RT for 5-10 min, and 0.4 µg/ml ethidium bromide (EtBr)
was added. Gels were run in TAE buffer with 0.4 µg/ml EtBr. Before application to the gel slots, 6x
loading dye (Fermentas, Waltham, MA, USA) was added to the samples, PCR products in GoTaq
Green buffer did not require addition of loading dye. The separation was performed at 100-120 V.
DNA Markers were used to determine the specific sizes of fragments. The EtBr, which intercalates into
the DNA, enabled visualization of the DNA on a UV-transilluminator with a wavelength of λ=312 nm.
2.3.1.11 Gel Extraction of DNA
When necessary, after electrophoresis, DNA bands were excised from the agarose gel on a UV-
transilluminator with a wavelength of λ=312 nm. The QIAquick Gel Extraction Kit, the MinElute Gel
Extraction Kit (both Qiagen, Hilden, Germany) or the Gel and PCR Clean-Up System (Promega,
Mannheim, Germany) were used to purify the DNA from the gel slice. The procedure was performed
strictly following the manufacturer’s protocol.
2.3.1.12 Real-Time PCR
RNA reverse transcribed into cDNA was used for quantitative Real-Time PCR (qPCR)
analyses. Dual color real-time PCR was performed on a LightCycler 480 System using FAM-labeled
probe #87 from the Universal ProbeLibrary for FTO (primers sequences were 5’-
gaaaatctggtggacaggtca-3’ and 5’-cgagargagagtcatcctcactt-3’ for FTO_cDNA_F and FTO_cDNA_R,
respectively) and Yellow-555-labeled universal reference GAPDH probe (Roche, Mannheim,
Germany). LightCycler 480 probes master mix was used in reaction (Roche, Mannheim, Germany).
For Expressed Transcription Factor Knockdown, SureFIND Transcriptome PCR Arrays qPCR
was performed using FastStart Universal probe Master Mix with ROX standard as the experiments
were run on an ABI 7900HT machine. Data analyses and calculation of relative FTO expression was
Materials and Methods
27
performed using the SDS2.2 package (Applied Biosystems). Three plates were analyzed for each array.
Mean values and standard deviations were calculated in Microsoft Excel (Microsoft Office Professional
2007).
2.3.1.13 Genotyping
Subjects were genotyped by sequence analysis of genomic DNA. Sequence reactions were
performed with Big Dye Terminators (BigDye® Terminator v1.1 Cycle Sequencing Kit, Applied
Biosystems, Foster City, CA, USA) using 50-200 ng of PCR products and 1 µM primer. Thermocycler
was programmed as 96°C for 1 min followed by 25 cycles of 96°C for 10 sec, X°C (depending on the
primers) for 5 sec and 60°C for 4 min. Reaction products were analyzed with an ABI 3100 Genetic
Analyzer and Sequencing Analysis software (Applied Biosystems, Foster City, CA, USA) with the
following parameters: Dye Set: E (Big Dye® Kit v1.1), Mobility File: DT3100POP6(Rey et
al.)v2.mob, Run Module: Seq50_20s_6500s, Analysis Module: BC_3100POP6SR_seqOffFtOff.saz.
The sequences of primers are given in Appendix, section 1.
2.3.1.14 Primer Extension Assay
Primer extension assays were performed with ABI Prism SNaPshot ddNTP Primer Extension
kit from Applied Biosystems, Foster City, CA, USA. Total RNA from blood for RPGRIP1L and RBL2
was reverse transcribed with random hexamers, whereas cDNA from hnRNA for FTO was primed with
sequence specific primers FTO R1 or FTO R2 (all primer sequences and annealing temperatures are
given in the Table S1). cDNA from hnRNA for TCF7L2 was reverse transcribed with random
hexamers as well. For amplification the GoTaq DNA Polymerase Kit (Promega, Madison, USA) was
used. FTO genomic DNA and cDNA were amplified with primers FTO F1 and FTO R1. RPGRIP1L
genomic DNA was amplified with primers gRP F and gRP R, cDNA was amplified with cRP F and
cRP R. RBL2 genomic DNA was amplified with primers gRBL2 F and gRBL2 R, cDNA was amplified
with gRBL2 F and gRBL2 R. For the TCF7L2 locus both gDNA and cDNA were amplified using the
same pair of primers: gcDNA F and gcDNA R. Sequences of primers are listed in Appendix, section 1.
Materials and Methods
28
PCR and RT-PCR products were analyzed on agarose gel for the correct sizes and to ensure that
there were no traces of DNA contamination in case of RT-PCR. Then, DNA bands were excised from
the agarose gel and purified as described above. Concentrations were measured on ND-1000
Spectrophotometer and molarity was calculated following the algorithm 1000/(650xX)xY, where X
stands for the product size, and Y for the concentration in ng/µl (for the more details see the manual for
ABI Prism SNaPshot ddNTP Primer Extension Kit). Primer extension assays were performed using 0.2
pM of the PCR/RT-PCR products; all unincorporated nucleotides were removed enzymaticlly. The
reaction products were analyzed by gel capillary electrophoresis on ABI 3100 DNA Analyzer and the
electropherograms were analyzed with the Gene Mapper 4.0 software. Allelic DNA ratios were used to
normalize the cDNA ratios. For statistical analyses JMP7 package was used (SAS, Cary, NC, USA).
For more detailed explanation of assay see Results, chapter “Primer extension assay”.
2.3.1.15 Microarray Analyses
Microarray analyses of RNA samples were performed at the Biochip Lab, under supervision of
Dr. Klein-Hitpass. In short, HG-U133Plus_2.0 microarrays (Affymetrix, Santa Clara, CA, USA) were
used. The arrays were washed and stained according to the manufacturer's recommendation and finally
scanned in a GeneChip scanner 3000 (Affymetrix, Santa Clara, CA, USA).
2.3.2 Electrophoretic Mobility Shift Assay (EMSA)
EMSA was carried out with Cy5-labelled oligonucleotide probes. Selected SNP-surrounding
region corresponding oligonucleotides containing either the risk or the non-risk variant were
commercially synthesized (Biomers.net). Cy5-labelled forward strands were annealed with non-labeled
reverse strands, and the double-stranded probes were separated and purified from single-stranded
oligonucleotides on a 12 % polyacrylamide gel. DNA-protein binding reactions were conducted in 50
mM Tris-HCl, 250 mM NaCl, 5 mM MgCl2, 2.5 mM EDTA, 2.5 mM DTT, 20 % v/v glycerol and the
appropriate concentrations of poly(dI-dC). For DNA-protein interactions, 3-5 µg of nuclear protein
extract from the different cell lines was incubated for 10-30 min on ice, and Cy-5-labelled genotype-
Materials and Methods
29
specific DNA probe was added for another 20 min. For competition experiments, 50-fold molar excess
of unlabeled probe as competitor was included in the reaction prior to addition of Cy5-labeled DNA
probes. Binding reactions were incubated for 20 min at 4°C. The DNA-protein complexes were
resolved on a non-denaturation 5.3 % polyacrylamide gel in 0.5x Tris/borate/EDTA buffer. All EMSAs
were performed in triplicate or more, and fluorescence was visualized with a Typhoon TRIO+imager
(GE Healthcare, Germany). 3-4 independent EMSA experiments were conducted per SNP.
2.3.3 Preparation of Protein from Cell Culture
2.3.3.1 Preparation of Protein from the Nuclear Fraction
The method for preparation of protein from the nuclear fraction is based on lyses of cytoplasmic
membrane, followed by treatment of purified nuclei with hypo-osmotic buffer. After removing the
culture medium, cells were washed with PBS before being collected in 1 ml PBS (with a cell scraper in
case of adherent cells). After centrifugation at 8000 x g for 1 min, the supernatant was removed and the
cell pellet was resuspended in the 200 μl of homogenization buffer. From hereafter all steps were
performed at 4°C. Resuspended cells were homogenized with pistil and potter (10-15 rounds).
Homogenized cells were transferred in 1.5 ml micro centrifuge tube, placed on ice for 10 min and then
centrifuged at 3300 g for 15 min at 4°C. The cytoplasmic fraction stays in the supernatant, whereas
pellet contains nuclei. Pelleted nuclear fraction was first resuspended in 100 μl of low salt buffer, and
then 100 μl of high salt buffer was added. After vigorous vortexing for 30 min at 4°C, the tubes were
centrifuged at 25000 x g for 30 min at 4°C. The supernatants containing the nuclear proteins were
collected, and concentrations were measured by standard Bradford assay.
Homogenization buffer HEPES, pH 7.9 10 mM
MgCl2 1.5 mM
KCl 10 mM
NaF 20 mM
Dithiothretol (DTT) 0.5 mM
Phosphatase/Protease inhibitors* 1x
Materials and Methods
30
Low salt buffer HEPES, pH 7.9 20 mM
MgCl2 1.5 mM
KCl 20 mM
NaF 20 mM
Dithiothretol (DTT) 0.5 mM
EDTA 0.2 mM
Glycerol 25 %
Phosphatase/Protease inhibitors* 1x
High salt buffer HEPES, pH 7.9 20 mM
MgCl2 1.5 mM
KCl 1.2 M
NaF 20 mM
Dithiothretol (DTT) 0.5 mM
EDTA 0.2 mM
Glycerol 25 %
Phosphatase/Protease inhibitors* 1x
* Halt Protease/Phosphatase Inhibitor Single-Use Cocktail (Thermo Scientific, Waltham, MA, USA)
2.3.3.2 Preparation of Whole Cell Protein Extract
To obtain whole cell protein extracts, cells were first briefly washed in PBS. Adherent and
semi-adherent cultures were collected with a cell scraper, then resuspended in PBS and centrifuged for
2 min at 8000 x g. The supernatant was removed and the weight of the pellet determined. The pellet
was then resuspended in the appropriate volume of WCE (Whole Cell Extract) buffer (30 mM Tris-
HCl, pH 8, 0.42M NaCl, 0.5 mM EDTA, 20 % glycerol) supplemented with Halt Protease/Phosphatase
Inhibitor Single-Use Cocktail (Thermo Scientific, Waltham, MA, USA) and sonicated using a Branson
Sonifier at constant power with following settings: duty cycle 40-50 and output control 2.5. Samples
were placed at 4°C to cool down in between sonications. After sonication, insoluble elements were
pelleted by centrifugation for 15 min at 4°C, 8000 x g. The protein concentration in supernatant was
Materials and Methods
31
measured by standard Bradford assay.
2.3.3.3. Concentration Measurements of Protein Extracts
The concentration of whole cell and nuclear protein extracts from cell culture was performed
using the Coomassie Plus assay reagent (Pierce). This technique was described first by Bradford et al.
(1976) and based on the observation that the absorbance maximum for an acidic solution of Coomassie
Brilliant Blue G-250 shifts from 465 nm to 595 nm when binding to protein occurs. According to the
manufacturer’s protocol, the reagent was mixed by inverting the bottle and the required amount was
transferred to a 50 ml Falcon tube and left to stand to reach RT. 33 µl of each sample were added to 1
ml of Coomassie Plus reagent in a cuvette, inverted several times, and left to stand for 5 – 10 min. The
cuvettes were inverted once more before being measured in a Spectrophotometer at OD595
. If the
sample OD550
was above 1.5, 33 µl of a 1:10 dilution of the sample were measured. The OD550
of each
sample was compared to a standard curve prepared with BSA according to Table 3.
Table 2. Preparation of standard curve for protein measurements
Standard A B C D E F G H I
c (µg/µl) 2 1.5 1 0.75 0.5 0.25 0.125 0.025 2
H2O (µl) 0 125 325 175 325 325 325 400 400
BSA stock
solution 2 mg/ml (µl)
300
stock
375
stock
325
stock
175
from B
325
from C
325
from E
325
from F
100
from G
0
2.3.3.4. Seperation of Proteins by Electrophoretic Mobility (SDS-PAGE) followed by Western
Blotting
Proteins were separated by SDS/PAGE (10 % gel), followed by blotting and detection with
enhanced chemiluminescence reagent (Thermo Fisher Scientific, Waltham, MA, USA). Briefly, 5x
Protein buffer was added to each sample in appropriate volumes, and samples were boiled at 96°C for 5
Materials and Methods
32
min before administrating to the gel slot. Separation was carried out in 1x SDS running buffer at 15
mA until the bromphenol blue band had reached the bottom of the stacking gel (≈1 h). Separation was
then continued at 20 mA until the desired separation had been reached (≈1.5-2 h). Prestained protein
marker was used for judgement.
For immunological detection the gel containing the separated proteins was transferred to a
nylon membrane (Amersham, Amersham, UK) using a semi-dry blotting chamber (BioRad, Hercules,
CA, USA). Before transfer, all components (thick Whatman paper, nylon membrane and
polyacrilamide gel) were soaked in the transfer buffer for 5 min. The components were stacked on the
anode of the chamber in the following order: Whatman paper, nylon membrane, polyacrilamide gel,
Whatman paper. Air burbles were removed by gentle rolling over the stack with a Pasteur pipette.
Blotting chamber was closed, and transfer was performed for 90 min at 200 mA per blot and a
maximum current of 25 V.
After transfer, nylon membranes were washed in TBS buffer and stained in Ponceau Red for 2
min to visualize protein bands. Membrane were then destained, and blocked in blocking solution for 1
h to avoid the non-specific bindings. Incubation with primary antibodies were performed at 4°C
overnight, incubation with secondary antibodies were carried out at 4°C for 1 h. Between the
incubation steps nylon membrane were washed in TBST buffer 3 times for 10 min each. Protein bands
were visualized with ECL substrate (Pierce, Thermo Scientific, Waltham, MA, USA) for 5 min.
The primary antibodies used were mouse and rabbit anti-FTO (Abcam, Cambridge, UK;
Epitomics, Burlingame CA, USA) and rabbit anti-GAPDH (Cell Signaling Technology, Danvers, MA,
USA). Secondary antibodies were goat anti-mouse and anti-rabbit HRP (horseradish peroxidase)
conjugated antibodies (Thermo Fisher Scientific, Waltham, MA, USA).
2.3.4. Cell Culture
Lymphoblastoid cells (LCs) were established by Epstein-Barr virus (EBV) transformation of
peripheral blood lymphocytes from normal individuals. Cells were grown in RPMI 1640 medium with
10 % fetal calf serum and 1 % penicillin/streptomycin at 37°C. Skin fibroblasts were cultured in
AmnioMAX+M-C100 medium containing 20 % AmnioMAX- Supplement (Gibco, Invitrogen,
Carlsbad, CA, USA) at 370C in a humidified atmosphere containing 5 % CO2. SGBS cells were kindly
Materials and Methods
33
provided by Dr. Daniel Tews (Division of Pediatric Endocrinology and Diabetes Endocrine Research
Laboratory Department of Pediatrics and Adolescent Medicine University Medical Center Ulm).
The following cells lines – HeLa, MCF-7, HEK293, Flp-In™ 293 T-Rex and its derivates used
in this study were cultured in DMEM medium supplemented with FCS 10 % and PenStrep 1 % in a
humidified incubator at 37°C supplied with 5 % CO2. Blasticidin, zeocin and hygromycin were used as
selective antibiotics at different stages for Flp-In™ 293 T-Rex and its derivates.
2.3.5. FTO-Overexpression and -Knockdown
2.3.5.1. Constructs used for Subclonning
An untagged full-length FTO cDNA clone for native protein expression was purchased from
Origene (Rockville, MD, USA. Cat. No SC315786). pcDNA5/FRT/TO, pOG44 expressing Flp
recombinase and pcDNA5/FRT/TO_GFP (as a positive control) were obtained from Invitrogen
(Carlsbad, CA, USA). Flp-In™ T-Rex 293 cells were selected as host cell line (Invitrogen).
2.3.5.2. Generation of FTO Overexpressing Cell Lines
The Flp-In™ 293 T-Rex cell line contains a single FRT integration site followed by a LacZ-
zeocin fusion gene controlled by an SV40 early promoter. The LacZ-zeocin fusion gene enables
selection of FRT-containing cells with Zeocin. At an independent site, the cells carry the Tet repressor
gene followed by a blasticidin resistance gene.
The gene of interest (GOI) is cloned into the pcDNA5/FRT/TO vector, which also contains an
FRT recombination site. In the next step, the pcDNA5/FRT/TO vector containing GOI is delivered into
the cells together with the pOG44 vector, which expressed the Flp recombinase. Upon transfection, the
Flp recombinase mediates recombination between FRT sites of the genome and the
pcDNA5/FRT/TO_GOI construct, so that the GOI becomes inserted into the genome at the FRT site.
After successful recombination, cells become sensitive to zeocin, lose β-galactosidase activity because
the LacZ-Zeocin gene loses its ATG start codon and gain resistance to hygromycin because the
Materials and Methods
34
hygromycin resistance gene is inserted instead of LacZ-zeocin. Hygromycin is used to select
recombined cells, and β-galactosidase assays are used to measure the purity of the cell population.
Blasticidin and zeocin are used in medium for unmodified Flp-In™ 293 T-Rex cells. Successful
recombinants, in this study clones containing FTO, are selected and kept on medium containing
hygromycin instead of zeocin (for detailed information visit Invitrogen website).
The FTO open reading frame (ORF) with its original Kozak sequence and part of the 3’ UTR
(including the first two polyadenylation signal sequences) was subcloned into the NotI site of
pcDNA5/FRT/TO to generate pcDNA/FRT/TO_FTO. The cDNA was fully sequenced to exclude any
mutations. To generate FTO-overexpressing cell lines, Flp-In™ 293 T-Rex cells were cotransfected
with pcDNA/FRT/TO_FTO (or pcDNA5/FRT/TO_GFP as a positive control) and pOG44 at 9:1 ratio
with Fugene reagent following manufacture’s instruction (Roche, Mannheim, Germany). Empty
pcDNA/FRT/TO was used as a negative control. Transfection of empty pcDNA5/FRT/TO without
pOG44 ensures that so no recombination occurs. Hence, by the time when all cells are dead in the
presence of hygromycin in negative controls, in the real experiments (pcDNA/FRT/TO_FTO and
pcDNA5/FRT/TO_GFP) all cells failed to recombine are expected to be eliminated as well.
Cells were 70-80 % confluent at the time of transfection. Three independent single-cell derived
clones (FTO1_C1, FTO2_D4 and FTO3_A3) were selected for further experiments. All cell lines were
checked for β-galactosidase activity (which is encoded by LacZ-zeocin fusion gene and is lost after
successful recombination) to ensure the purity of generated cells. Clones FTO1_C1 and FTO2_D4, but
not clone FTO3_A3 showed increased FTO expression upon induction.
2.3.5.3. FTO Knockdown by siRNA Transfection
Unmodified Flp-In™ 293 T-Rex cells were used for FTO knockdown experiments.
Commercially available siRNA designed for FTO was purchased from Origene (Rockville, MD, USA.
Cat. No SR312322). The kit contained three different siRNAs, two aimed at the 3’UTR and one at the
coding sequence. Universal scrambled negative control siRNA absent in human, mouse and rat
genomes was also provided with the kit. To evaluate efficiency of transfection, Cy3 labeled control
siRNA (Origene, Rockville, MD, USA. Cat. No SR30002) was used. As a transfection reagent,
lipofectamine 2000 (Invitrogen, Carlsbad, CA, USA) was used.
Materials and Methods
35
Transfections were performed following the standard protocol at 10 nM concentration of
siRNAs. Briefly, cells were plated in 6-well plate one day before transfection. On day of transfection,
the medium was changed, and 2 h later, siRNAs and lipofectamine were added to OPTIMem and
incubated at room temperature for 5 minutes separately, then combined and incubated for another 20
min. Afterwards, the formed complexes were added to cells in a drop-like manner. RNA and protein
were extracted after 48 h of transfection from both, FTO siRNA and scrambled siRNA transfected
cells.
2.3.6. RNA Hydrolysis
RNA samples were hydrolyzed as described (Crain 1990). Briefly, RNAs were denaturated at
100°C and rapidly chilled down in ice-water. Then 1/10 of volume 0.1 M ammonium acetate and 2
units for 20 µg of RNA nuclease P1 (Sigma-Aldrich, St. Louis, MO, USA) were added. Solutions were
incubated at 45°C for 2 h. Hydrolysis was continued after adding venom phosphodiesterase (Sigma-
Aldrich, St. Louis, MO, USA) at 37°C for another 2 h. Finally, digested ribonucleotides were
dephosphorylated to ribonucleosides by alkaline phosphatase (Fermentas, Thermo Fisher
Scientific,Waltham, MA, USA). The solutions were analyzed by HLPC-MS.
2.3.7. High Performance Liquid Chromatography with Mass Spectrometry (HPLC-MS)
For performing HPLC-MS analyses, digested RNA solutions were sent to Dr. M. Ziehe at the
Department of Analytical and Environmental Chemistry, Humboldt-Universität zu Berlin, Germany.
2.3.8. Immunocytochemistry and Microscopy
Immunocytochemistry was performed as described (Wawrzik et al. 2010). Briefly, cells were
seeded on sterile cover slips one day before immunostaining. The whole procedure was performed at
room temperature. Cells were washed with PBS and fixed in methanol for 10 min, again washed with
Materials and Methods
36
PBS and equilibrated in I buffer (10 mM Tris pH 7.5, 100 mM NaCl, supplemented with 0.05 % Tween
20 and 1 % BSA) for at least 30 min. Primary antibodies used for immunoflueresence staining for FTO,
Fibrillarin, PML, COIL, SC35 were from mouse and rabbit (Abcam, Cambridge, UK; Epitomics,
Burlingame CA, USA). Secondary antibodies were labeled either with Cy3 (goat anti-mouse and anti-
rabbit, Dianova GmbH, Hamburg, Germany) or Alexa Fluor 488 (goat anti-mouse and anti-rabbit,
Invitrogen, Carlsbad, CA, USA). The dilutions 1:300 and 1:600 in I buffer were used for Cy3 and
Alexa Fluor 488 labeled antibodies, respectively. Dilutions for primary antibodies were in the range
from 1:100 to 1:1000. Cover slips were washed in between with I buffer, stained with DAPI and
mounted on microscope slides in ProLong Antifade gold medium (Invitrogen, Carlsbad, CA, USA).
2.3.9. RNA-FISH
FISH probes were prepared by digoxigenin-nick translation (Roche, Mannheim, Germany) of
PCR products for MALAT1 and NEAT1. Cells seeded on cover slips one day before the experiment
were washed in PBS, incubated in CSK buffer for 5 min, and fixed in 4 % paraformladehyde in PBS
for 10 min in ice-water. Afterwards slides were washed in 70 % ethanol, dehydrated in higher
concentrated ethanol and hybridized to denaturated probes at 37°C overnight in humidified chamber.
For colocalization analyses, before applying primary rabbit anti-digoxigenin and mouse anti-FTO
antibodies, cells were again fixed with 2 % paraformaldehyde in PBS for 15 min at room temperature.
Secondary antibodies used were anti-rabbit Alexa Flour 488 (Invitrogen, Carlsbad, CA, USA) and anti-
mouse Cy3 (Dianova GmbH, Hamburg, Germany). Finally cells were stained with DAPI and mounted
in antifade gold (Invitrogen, Carlsbad, CA, USA) on microscope slides.
2.3.10. Confocal Laser Microscopy
Immunofluorescence stained cells were visualized by using a Leica TCS SP5 confocal
microscope with a 63x/1.4 oil immersion Leica objective. In order to avoid cross talk between different
channels bidirectional scans were applied in a sequential scan modus with predefined settings. Mostly,
a resolution of 1024 x 1024 and a zoom factor of 2 were set, resulting in a pixel size of about 100 nm.
Materials and Methods
37
For each slide, at least 2 fields were scanned at different z-sections with 0.5 µm steps within a z-stack.
After each scan, three-dimensional data sets (LIF files) and maximum intensity projection TIFF images
of the field scanned were generated.
2.3.11 Software Tools and Statistical Analyses
HaploView software, version 4.2, was used for analyses and graphical representation of LD
structures indicated as r2 (Cambridge, MA, USA) (Barrett et al. 2005). Data for the appropriate
genomic region for different populations (CEU, CHB and YRI) was retrieved from the internation
HapMap project (version 3, release 2).
Gene set enrichment analyses of transcripts showing deregulation in FTO-overexpressing and -
knockdown cells were performed using the GeneTrail online tool (http://genetrail.bioinf.uni-sb.de/).
JMP7 package was used for statistical analyses (SAS, Cary, NC, USA). Data from qPCR were
analyzed using the SDS2.2 package (Applied Biosystems). Means and standard deviations were
calculated using Microsoft Excel (Microsoft Office Professional, 2007).
Results
38
3. Results
3.1 Expression Studies
The original hypothesis was that the intronic region harboring obesity-associated FTO
variations might function as a cis-acting regulatory element, and thereby, have an impact on expression
of FTO or other genes. Using allelic expression analyses, I investigated whether the FTO genotype
affects the expression of FTO itself, or has an influence on loci in the 5’ region. Due to the findings
from the allelic expression studies, obesity-associated FTO polymorphisms were further investigated to
explore their potential to have an influence on transcription in a cis manner. In particular, SNPs were
prioritized depending on their location (e.g. in open/closed chromatin regions), conservation and
capacity for binding transcription factors. The latter was evaluated by in silico approaches first using
publicly available browsers and then with help of self-developed phylogenetic module complexity
analysis, developed and performed by Dr. M. Claussnitzer. The protein binding activities for the
separate SNPs with their risk and non-risk alleles were further evaluated by electrophoretic mobility
shift assay (EMSA). Additionally, 270 well-known transcription factors were screened to identify those
regulating expression of FTO. Finally, the genomic region comprising obesity-associated SNPs (47kb)
was inspected in the UCSC browser to find out whether factors affecting transcription of FTO are
found or predicted to bind to the given region, or more promisingly, to any of the obesity-associated
SNP position(s).
3.1.1 Allelic Expression Studies
3.1.1.1 Primer Extension Assay
Since the discovery of the obesity-associated variations within intron 1 of FTO, a number of
studies have failed to detect the effect of the FTO genotype on the mRNA level (Kloting et al. 2008;
Wahlen et al. 2008; Grunnet et al. 2009; Wawrzik et al. 2010). The most probable reason is the fact
that unrelated individuals unavoidably differ in genetic background, environmental exposure and life
events, and thus, a very large number of individuals would have to be tested to reveal the subtle effects
Results
39
of cis-regulatory elements. These obstacles can be easily avoided by determining the ratio of allelic
transcript levels in heterozygous individuals, where all factors mentioned above are expected to be
ruled out and each allele serves as a control for the another one (Yan et al. 2002; Lo et al. 2003;
Pastinen et al. 2004; Kanber et al. 2009).
A single nucleotide primer extension method was applied to measure the allelic ratios of RNA
transcripts after conversion to complementary DNA (cDNA) using genomic DNA (gDNA) as reference
(Figure 4). First, the sequences surrounding the given SNP were amplified by RT-PCR for RNA and
PCR for gDNA (Figure 4, A). After the amplification step, a quantitative primer extension assay was
carried out with the ABI Prism SNaPshot ddNTP Primer Extension Kit using an equimolar amount of
amplicons from RT-PCR and PCR. The oligonucleotide probe of the primer extension assay is
designed to lie adjacent to the SNP of interest, and it is extended by only one of four fluorescently
labeled dideoxynucleotides during the SNaPshot reaction (Figure 4, B). This nucleotide is
complementary to the base found at the SNP and lacks the 3’ hydroxyl group (OH), which is required
for the formation of the phosphodiester bond with the next nucleotide. The SNaPshot reaction products
were purified and analyzed by gel capillary electrophoresis resulting in electropherograms with peak
areas, heights and sizes corresponding to the product with incorporated ddNTPs (Figure 4, C). In the
last step, the ratios of the peak areas of the two nucleotides at the SNP position from RNA templates
are normalized against values generated from gDNA templates at the same position, assuming that the
two alleles are present in equal amount in gDNA (Figure 4, D).
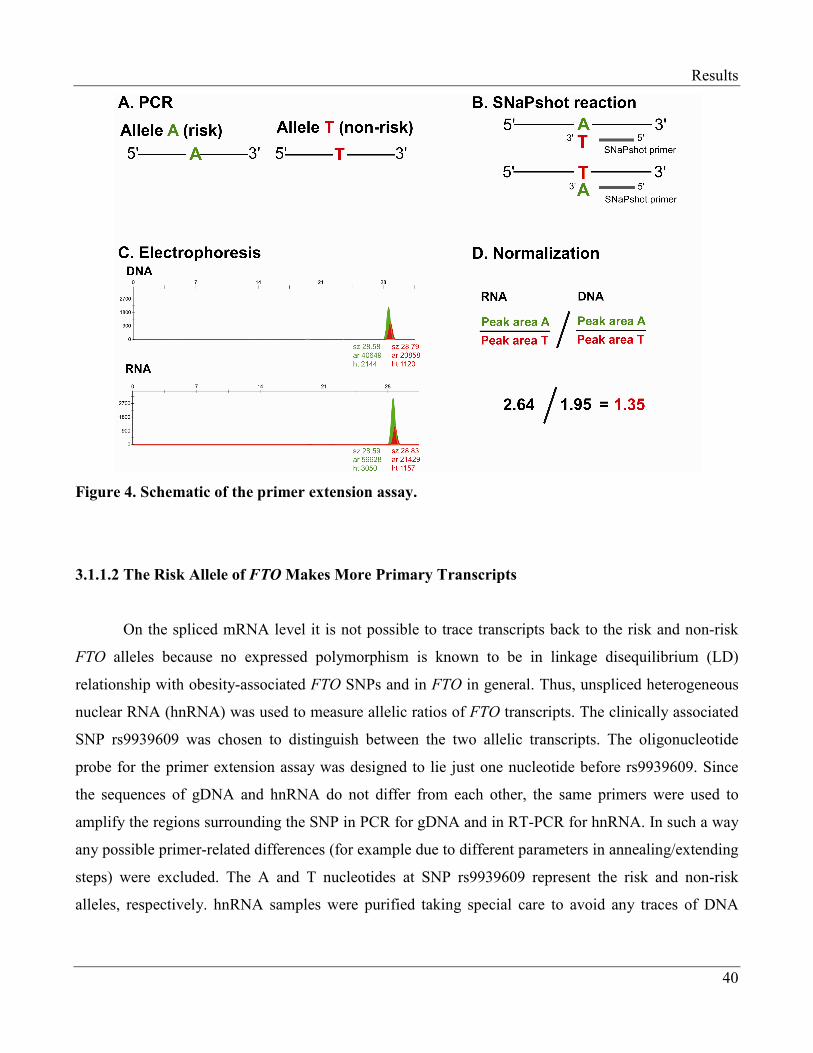
Results
40
Figure 4. Schematic of the primer extension assay.
3.1.1.2 The Risk Allele of FTO Makes More Primary Transcripts
On the spliced mRNA level it is not possible to trace transcripts back to the risk and non-risk
FTO alleles because no expressed polymorphism is known to be in linkage disequilibrium (LD)
relationship with obesity-associated FTO SNPs and in FTO in general. Thus, unspliced heterogeneous
nuclear RNA (hnRNA) was used to measure allelic ratios of FTO transcripts. The clinically associated
SNP rs9939609 was chosen to distinguish between the two allelic transcripts. The oligonucleotide
probe for the primer extension assay was designed to lie just one nucleotide before rs9939609. Since
the sequences of gDNA and hnRNA do not differ from each other, the same primers were used to
amplify the regions surrounding the SNP in PCR for gDNA and in RT-PCR for hnRNA. In such a way
any possible primer-related differences (for example due to different parameters in annealing/extending
steps) were excluded. The A and T nucleotides at SNP rs9939609 represent the risk and non-risk
alleles, respectively. hnRNA samples were purified taking special care to avoid any traces of DNA
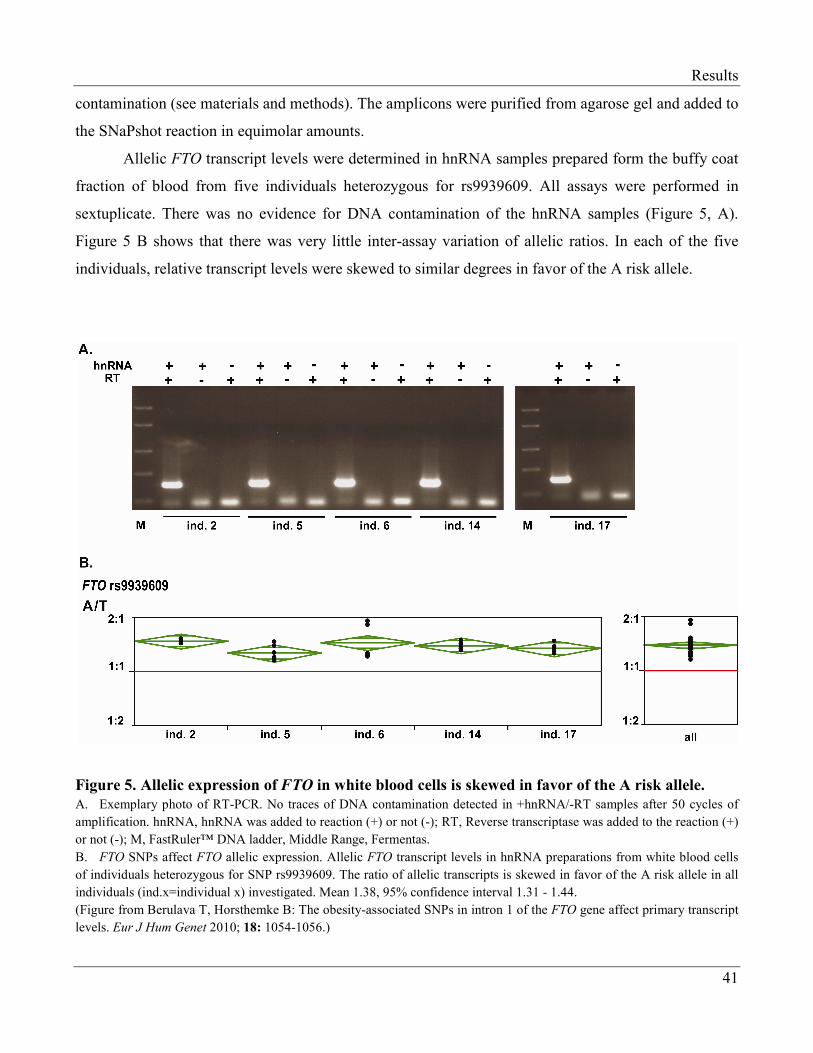
Results
41
contamination (see materials and methods). The amplicons were purified from agarose gel and added to
the SNaPshot reaction in equimolar amounts.
Allelic FTO transcript levels were determined in hnRNA samples prepared form the buffy coat
fraction of blood from five individuals heterozygous for rs9939609. All assays were performed in
sextuplicate. There was no evidence for DNA contamination of the hnRNA samples (Figure 5, A).
Figure 5 B shows that there was very little inter-assay variation of allelic ratios. In each of the five
individuals, relative transcript levels were skewed to similar degrees in favor of the A risk allele.
Figure 5. Allelic expression of FTO in white blood cells is skewed in favor of the A risk allele.
A. Exemplary photo of RT-PCR. No traces of DNA contamination detected in +hnRNA/-RT samples after 50 cycles of
amplification. hnRNA, hnRNA was added to reaction (+) or not (-); RT, Reverse transcriptase was added to the reaction (+)
or not (-); M, FastRuler™ DNA ladder, Middle Range, Fermentas.
B. FTO SNPs affect FTO allelic expression. Allelic FTO transcript levels in hnRNA preparations from white blood cells
of individuals heterozygous for SNP rs9939609. The ratio of allelic transcripts is skewed in favor of the A risk allele in all
individuals (ind.x=individual x) investigated. Mean 1.38, 95% confidence interval 1.31 - 1.44.
(Figure from Berulava T, Horsthemke B: The obesity-associated SNPs in intron 1 of the FTO gene affect primary transcript
levels. Eur J Hum Genet 2010; 18: 1054-1056.)
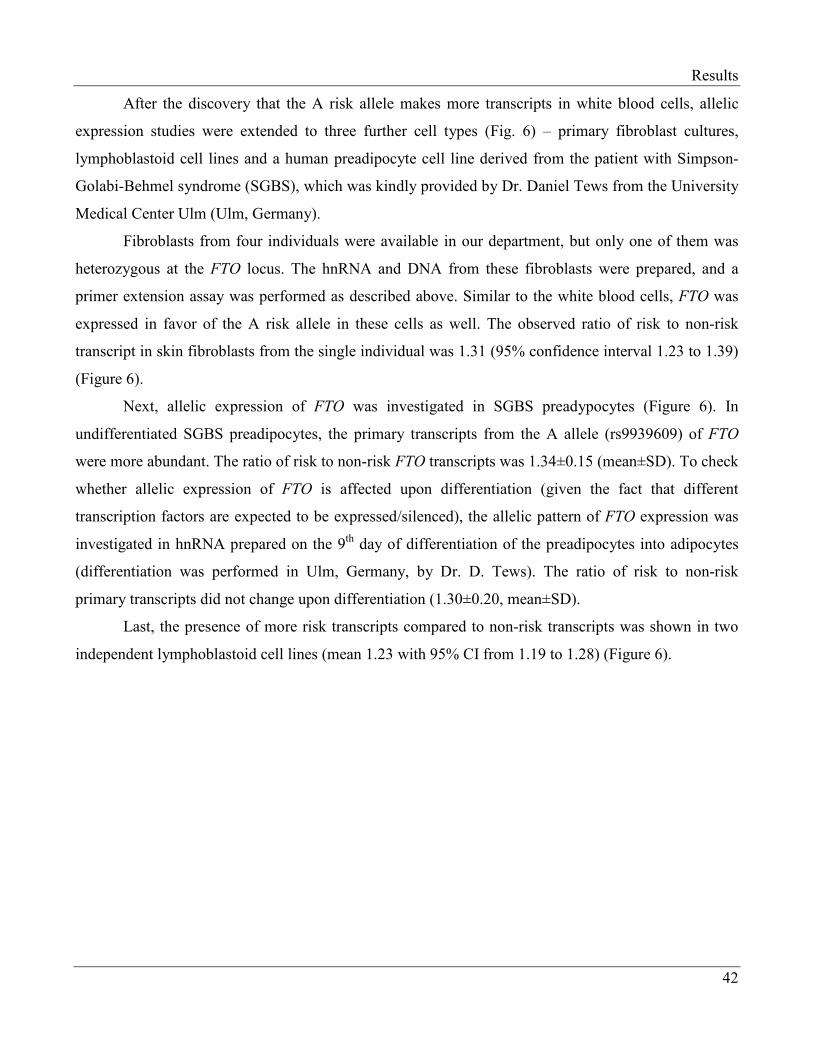
Results
42
After the discovery that the A risk allele makes more transcripts in white blood cells, allelic
expression studies were extended to three further cell types (Fig. 6) – primary fibroblast cultures,
lymphoblastoid cell lines and a human preadipocyte cell line derived from the patient with Simpson-
Golabi-Behmel syndrome (SGBS), which was kindly provided by Dr. Daniel Tews from the University
Medical Center Ulm (Ulm, Germany).
Fibroblasts from four individuals were available in our department, but only one of them was
heterozygous at the FTO locus. The hnRNA and DNA from these fibroblasts were prepared, and a
primer extension assay was performed as described above. Similar to the white blood cells, FTO was
expressed in favor of the A risk allele in these cells as well. The observed ratio of risk to non-risk
transcript in skin fibroblasts from the single individual was 1.31 (95% confidence interval 1.23 to 1.39)
(Figure 6).
Next, allelic expression of FTO was investigated in SGBS preadypocytes (Figure 6). In
undifferentiated SGBS preadipocytes, the primary transcripts from the A allele (rs9939609) of FTO
were more abundant. The ratio of risk to non-risk FTO transcripts was 1.34±0.15 (mean±SD). To check
whether allelic expression of FTO is affected upon differentiation (given the fact that different
transcription factors are expected to be expressed/silenced), the allelic pattern of FTO expression was
investigated in hnRNA prepared on the 9th day of differentiation of the preadipocytes into adipocytes
(differentiation was performed in Ulm, Germany, by Dr. D. Tews). The ratio of risk to non-risk
primary transcripts did not change upon differentiation (1.30±0.20, mean±SD).
Last, the presence of more risk transcripts compared to non-risk transcripts was shown in two
independent lymphoblastoid cell lines (mean 1.23 with 95% CI from 1.19 to 1.28) (Figure 6).
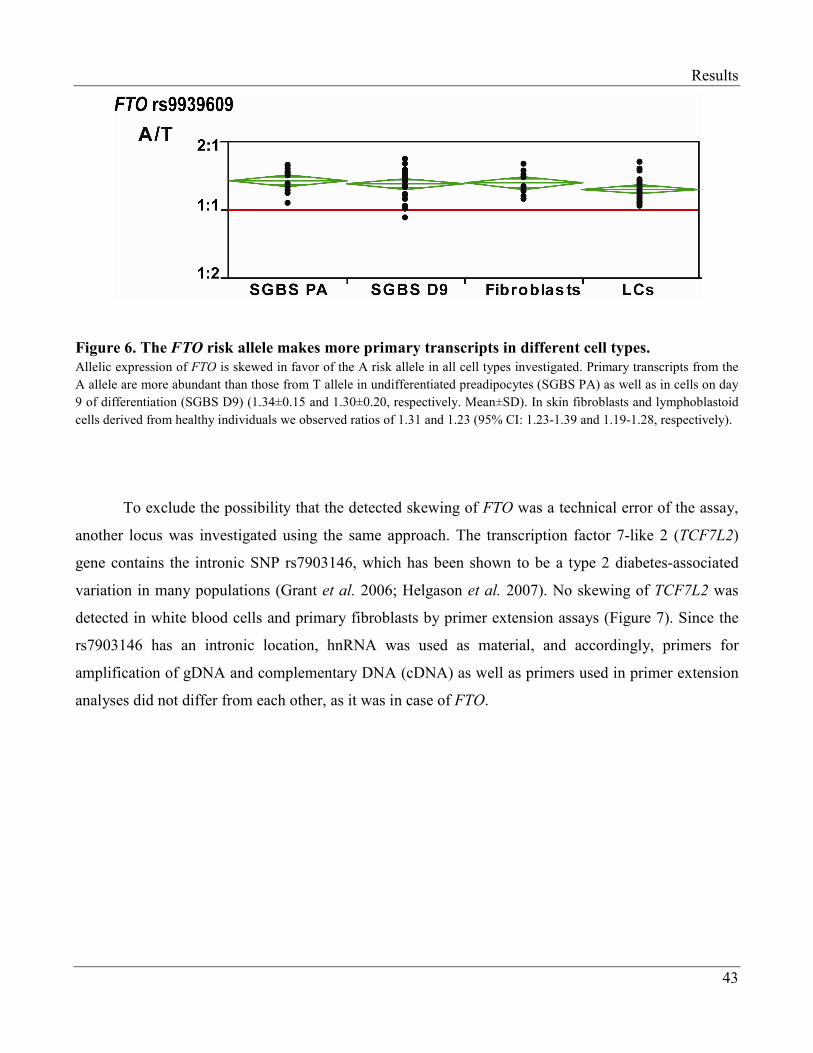
Results
43
Figure 6. The FTO risk allele makes more primary transcripts in different cell types.
Allelic expression of FTO is skewed in favor of the A risk allele in all cell types investigated. Primary transcripts from the
A allele are more abundant than those from T allele in undifferentiated preadipocytes (SGBS PA) as well as in cells on day
9 of differentiation (SGBS D9) (1.34±0.15 and 1.30±0.20, respectively. Mean±SD). In skin fibroblasts and lymphoblastoid
cells derived from healthy individuals we observed ratios of 1.31 and 1.23 (95% CI: 1.23-1.39 and 1.19-1.28, respectively).
To exclude the possibility that the detected skewing of FTO was a technical error of the assay,
another locus was investigated using the same approach. The transcription factor 7-like 2 (TCF7L2)
gene contains the intronic SNP rs7903146, which has been shown to be a type 2 diabetes-associated
variation in many populations (Grant et al. 2006; Helgason et al. 2007). No skewing of TCF7L2 was
detected in white blood cells and primary fibroblasts by primer extension assays (Figure 7). Since the
rs7903146 has an intronic location, hnRNA was used as material, and accordingly, primers for
amplification of gDNA and complementary DNA (cDNA) as well as primers used in primer extension
analyses did not differ from each other, as it was in case of FTO.
Results
44
Figure 7. TCF7L2 risk and non-risk alleles are equally expressed in different cells.
Results of allelic expression studies in hnRNA preparation from white blood cells of six heterozygotes. The mean of the
ratio of T risk to C non-risk transcripts was 1.03 (95% CI: 0.89-1.16). In fibroblasts (from the single individual, two
independent RNA preparations, 10 RT-PCRs) the equal expression from the both alleles of the TCF7L2 gene was detected
(ratio of 1.02, 95% CI: 0.96-1.08).
In summary, the primer extension assays led to the finding that transcripts from the A risk allele
of FTO were 30-40% more abundant than those made from the non-risk allele in all cell types
investigated.
3.1.1.3 Allelic Expression of FTO-Neighboring Genes is Independent of FTO Genotype
Allelic expression was next investigated for RPGRIP1L and RBL2 in individuals with a known
FTO genotype. Because of the intronic location of the FTO obesity-associated SNPs, it has been
discussed that this region may have an impact on the expression of neighboring genes, implicating that
the link between FTO variation and obesity is not because of the function of FTO itself (Frayling et al.
2007; Stratigopoulos et al. 2008; Tews et al. 2011). In this view, RPGRIP1L was of primary interest as
it lies head-to-head with FTO and, being transcribed in the opposite direction, shares a CpG island with
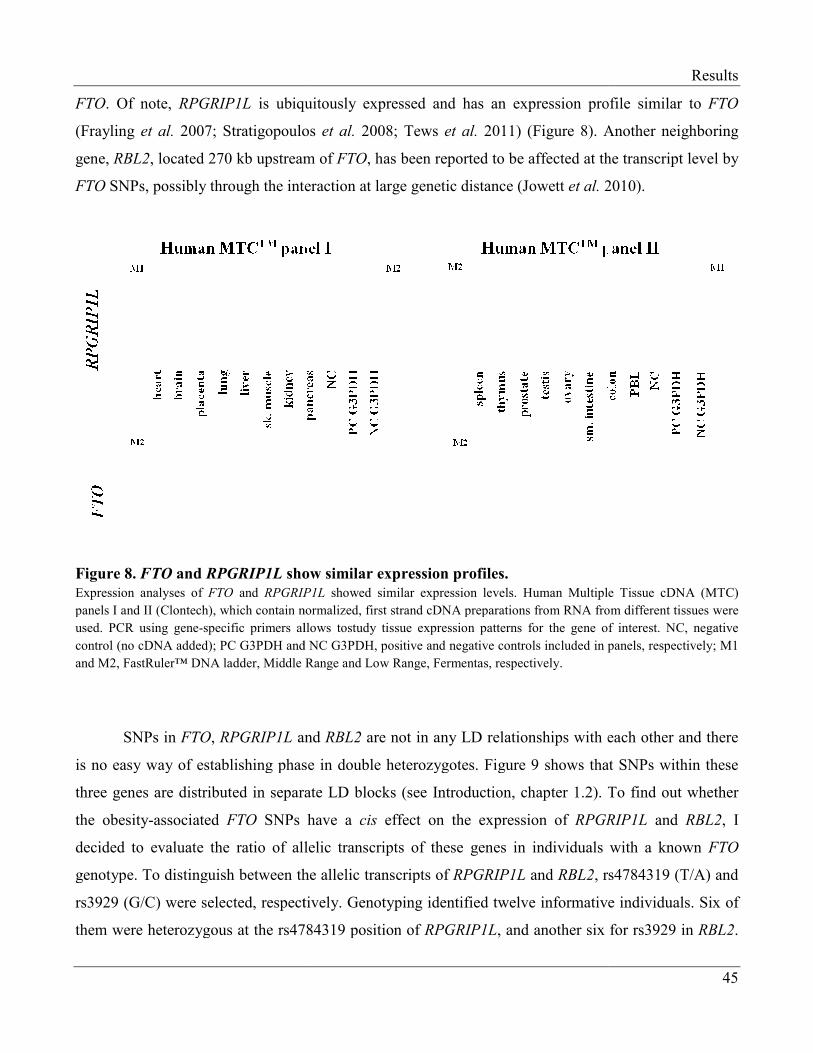
FTO. Of note, RPGRIP1L is ubiquitously expressed and has an expression profile similar to
(Frayling et al. 2007; Stratigopoulos
gene, RBL2, located 270 kb upstream of
FTO SNPs, possibly through the interaction at large genetic distance
Figure 8. FTO and RPGRIP1L show similar expression profiles.
Expression analyses of FTO and RPGRIP1L
panels I and II (Clontech), which contain normalized, first strand cDNA preparations from RNA from different tissues were
used. PCR using gene-specific primers allows tostudy tissue expres
control (no cDNA added); PC G3PDH and NC G3PDH, positive and negative controls included in panels, respectively; M1
and M2, FastRuler™ DNA ladder, Middle Range and Low Range, Fermentas, respectively.
SNPs in FTO, RPGRIP1L and
is no easy way of establishing phase in double heterozygotes. Figure
three genes are distributed in separate LD blocks (see Introduction
the obesity-associated FTO SNPs have a
decided to evaluate the ratio of allelic transcripts of these genes in individuals with a known
genotype. To distinguish between the allelic transcripts of
rs3929 (G/C) were selected, respectively. Genotyping identified twelve informative individuals. Six of
them were heterozygous at the rs4784319 position
is ubiquitously expressed and has an expression profile similar to
Stratigopoulos et al. 2008; Tews et al. 2011) (Figure 8). Another neighboring
, located 270 kb upstream of FTO, has been reported to be affected at the transcript level by
SNPs, possibly through the interaction at large genetic distance (Jowett et al. 2010
show similar expression profiles.
RPGRIP1L showed similar expression levels. Human Multiple Tissue cDNA (MTC)
panels I and II (Clontech), which contain normalized, first strand cDNA preparations from RNA from different tissues were
specific primers allows tostudy tissue expression patterns for the gene of interest. NC, negative
control (no cDNA added); PC G3PDH and NC G3PDH, positive and negative controls included in panels, respectively; M1
FastRuler™ DNA ladder, Middle Range and Low Range, Fermentas, respectively.
and RBL2 are not in any LD relationships with each other and there
is no easy way of establishing phase in double heterozygotes. Figure 9 shows that SNPs within these
three genes are distributed in separate LD blocks (see Introduction, chapter 1.2). To
SNPs have a cis effect on the expression of RPGRIP1L
decided to evaluate the ratio of allelic transcripts of these genes in individuals with a known
genotype. To distinguish between the allelic transcripts of RPGRIP1L and RBL2, rs4784319 (T/A) and
3929 (G/C) were selected, respectively. Genotyping identified twelve informative individuals. Six of
them were heterozygous at the rs4784319 position of RPGRIP1L, and another six for rs3929 in
Results
45
is ubiquitously expressed and has an expression profile similar to FTO
). Another neighboring
has been reported to be affected at the transcript level by
2010).
showed similar expression levels. Human Multiple Tissue cDNA (MTC)
panels I and II (Clontech), which contain normalized, first strand cDNA preparations from RNA from different tissues were
sion patterns for the gene of interest. NC, negative
control (no cDNA added); PC G3PDH and NC G3PDH, positive and negative controls included in panels, respectively; M1
are not in any LD relationships with each other and there
shows that SNPs within these
). To find out whether
RPGRIP1L and RBL2, I
decided to evaluate the ratio of allelic transcripts of these genes in individuals with a known FTO
, rs4784319 (T/A) and
3929 (G/C) were selected, respectively. Genotyping identified twelve informative individuals. Six of
, and another six for rs3929 in RBL2.
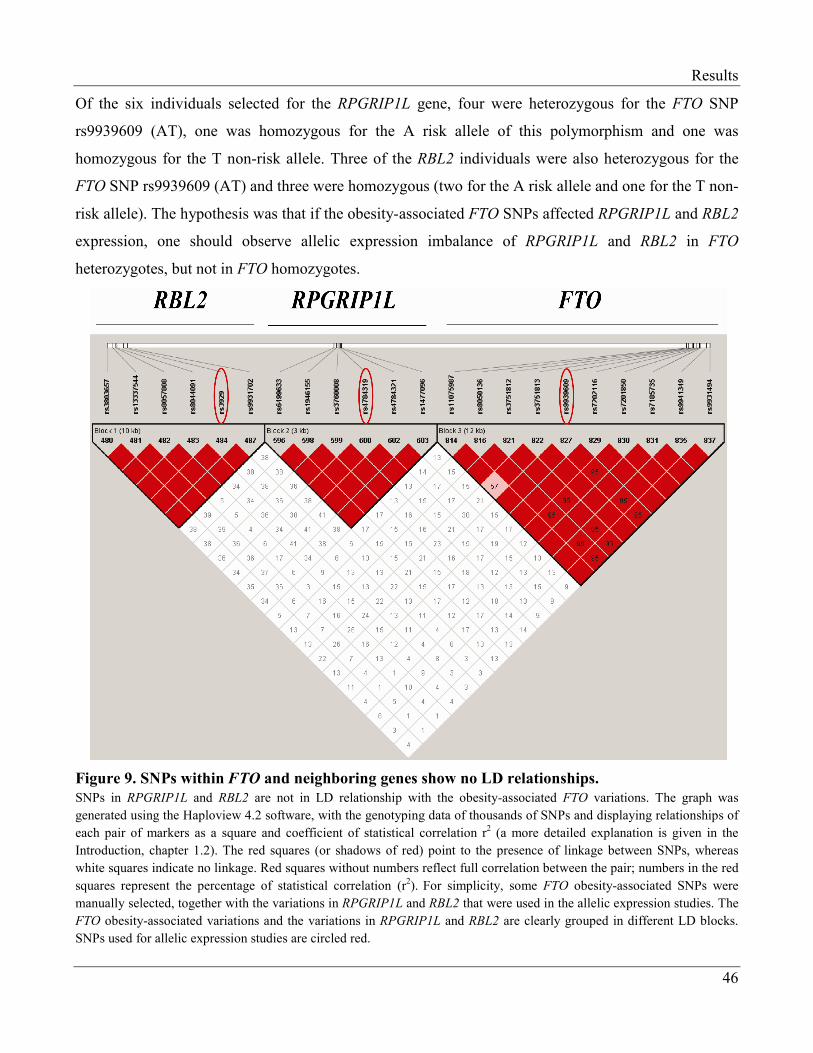
Results
46
Of the six individuals selected for the RPGRIP1L gene, four were heterozygous for the FTO SNP
rs9939609 (AT), one was homozygous for the A risk allele of this polymorphism and one was
homozygous for the T non-risk allele. Three of the RBL2 individuals were also heterozygous for the
FTO SNP rs9939609 (AT) and three were homozygous (two for the A risk allele and one for the T non-
risk allele). The hypothesis was that if the obesity-associated FTO SNPs affected RPGRIP1L and RBL2
expression, one should observe allelic expression imbalance of RPGRIP1L and RBL2 in FTO
heterozygotes, but not in FTO homozygotes.
Figure 9. SNPs within FTO and neighboring genes show no LD relationships.
SNPs in RPGRIP1L and RBL2 are not in LD relationship with the obesity-associated FTO variations. The graph was
generated using the Haploview 4.2 software, with the genotyping data of thousands of SNPs and displaying relationships of
each pair of markers as a square and coefficient of statistical correlation r2 (a more detailed explanation is given in the
Introduction, chapter 1.2). The red squares (or shadows of red) point to the presence of linkage between SNPs, whereas
white squares indicate no linkage. Red squares without numbers reflect full correlation between the pair; numbers in the red
squares represent the percentage of statistical correlation (r2). For simplicity, some FTO obesity-associated SNPs were
manually selected, together with the variations in RPGRIP1L and RBL2 that were used in the allelic expression studies. The
FTO obesity-associated variations and the variations in RPGRIP1L and RBL2 are clearly grouped in different LD blocks.
SNPs used for allelic expression studies are circled red.
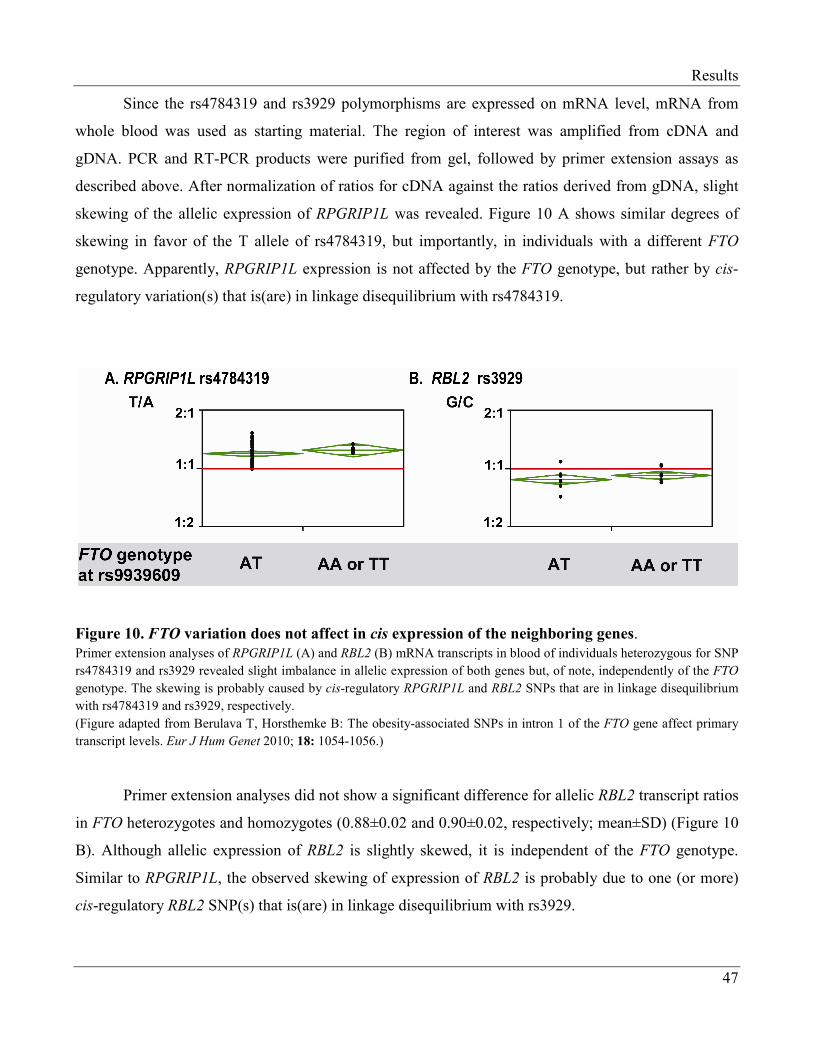
Results
47
Since the rs4784319 and rs3929 polymorphisms are expressed on mRNA level, mRNA from
whole blood was used as starting material. The region of interest was amplified from cDNA and
gDNA. PCR and RT-PCR products were purified from gel, followed by primer extension assays as
described above. After normalization of ratios for cDNA against the ratios derived from gDNA, slight
skewing of the allelic expression of RPGRIP1L was revealed. Figure 10 A shows similar degrees of
skewing in favor of the T allele of rs4784319, but importantly, in individuals with a different FTO
genotype. Apparently, RPGRIP1L expression is not affected by the FTO genotype, but rather by cis-
regulatory variation(s) that is(are) in linkage disequilibrium with rs4784319.
Figure 10. FTO variation does not affect in cis expression of the neighboring genes.
Primer extension analyses of RPGRIP1L (A) and RBL2 (B) mRNA transcripts in blood of individuals heterozygous for SNP
rs4784319 and rs3929 revealed slight imbalance in allelic expression of both genes but, of note, independently of the FTO
genotype. The skewing is probably caused by cis-regulatory RPGRIP1L and RBL2 SNPs that are in linkage disequilibrium
with rs4784319 and rs3929, respectively.
(Figure adapted from Berulava T, Horsthemke B: The obesity-associated SNPs in intron 1 of the FTO gene affect primary
transcript levels. Eur J Hum Genet 2010; 18: 1054-1056.)
Primer extension analyses did not show a significant difference for allelic RBL2 transcript ratios
in FTO heterozygotes and homozygotes (0.88±0.02 and 0.90±0.02, respectively; mean±SD) (Figure 10
B). Although allelic expression of RBL2 is slightly skewed, it is independent of the FTO genotype.
Similar to RPGRIP1L, the observed skewing of expression of RBL2 is probably due to one (or more)
cis-regulatory RBL2 SNP(s) that is(are) in linkage disequilibrium with rs3929.
Results
48
3.1.2 In Silico Analyses of the Obesity-Associated FTO SNPs
To understand the mechanism by which genetic variation in FTO affects its expression, the
causative SNP(s) and the relevant binding factor(s) need to be determined. Identification of the
causative SNP by fine mapping in Europeans has not been successful due to the tight LD relationships
between obesity-associated SNPs in intron 1 of FTO (see Figure 2 in Introduction, chapter 1.2). Studies
addressing the link between FTO variations and body weight in African-ancestry populations, where
the degree of LD is less than in Europeans, have not yielded consistent results (Scuteri et al. 2007;
Grant et al. 2008; Hotta et al. 2008; Rampersaud et al. 2008; Fawcett and Barroso 2010). In 2010,
Hassanein et al. replicated the association between FTO variations and BMI in African-Americans and
reported that potentially causal variants are rs3751812 and rs9941349, or those that are correlated with
them in this particular population (Hassanein et al. 2010).
In an attempt to prioritize obesity-associated variations with regard to their plausible causative
role, SNPs were analyzed based on (i) evolutionary conservation, (ii) fine-mapping data in African-
Americans, (iii) location with regard to open chromatin and (iv) known transcription factor binding
sites. Additional criterion was a correlation coefficient higher than 0.8 (r2>0.8) with obesity-associated
SNP rs3751812. The variations selected following the criteria above are listed in Table 3. The data on
evolutionary conservation of sequences covering obesity-associated SNPs were retrieved from the
publicly accessible ECR (Evolutionary Conserved Regions) browser (http://ecrbrowser.dcode.org/).
The UCSC genome browser (http://genome.ucsc.edu/) was used to characterize selected SNPs
regarding their location (open chromatin by FAIRE and DNase I hypersensitivity regions). The
potential of obesity-associated SNPs to bind known transcription factors was evaluated using
phylogenetic footprinting (ConSite at http://asp.ii.uib.no:8090/cgi-bin/CONSITE/consite/) and different
algorithms provided by Biobase biological database (http://www.gene-regulation.com/index2.html).
Selected SNPs were further characterized by M. Claussnitzer using a self-developed
phylogenetic module complexity analysis (PMCA), which is a novel bioinformatics approach for
finding out cis-regulatory variants within disease-associated loci. PMCA integrates evolutionary
conservation with a complexity assessment of co-occurring transcription factor binding sites
(Claussnitzer et al., manuscript submitted). PMCA category 1 means a good candidate for regulatory
function, whereas category 2 indicates a poor candidate. All SNPs apart from rs9936385 were in
category 1. The most promising SNP from this analysis was rs9941349.
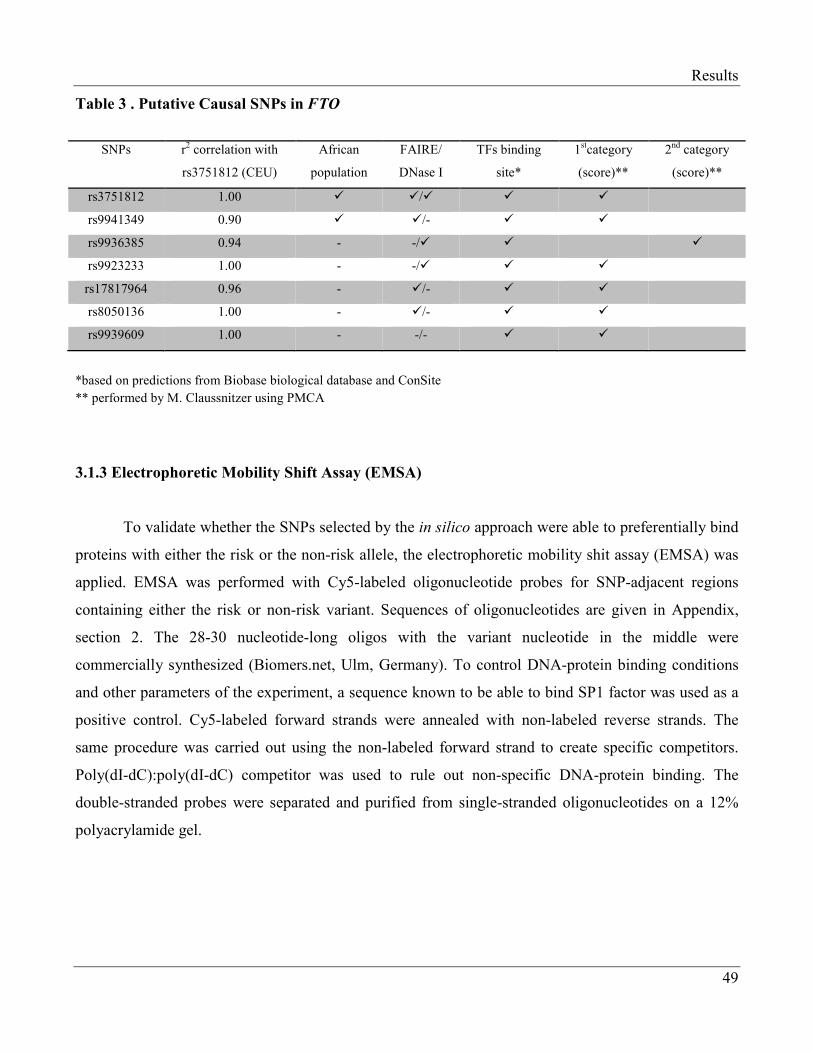
Results
49
Table 3 . Putative Causal SNPs in FTO
*based on predictions from Biobase biological database and ConSite
** performed by M. Claussnitzer using PMCA
3.1.3 Electrophoretic Mobility Shift Assay (EMSA)
To validate whether the SNPs selected by the in silico approach were able to preferentially bind
proteins with either the risk or the non-risk allele, the electrophoretic mobility shit assay (EMSA) was
applied. EMSA was performed with Cy5-labeled oligonucleotide probes for SNP-adjacent regions
containing either the risk or non-risk variant. Sequences of oligonucleotides are given in Appendix,
section 2. The 28-30 nucleotide-long oligos with the variant nucleotide in the middle were
commercially synthesized (Biomers.net, Ulm, Germany). To control DNA-protein binding conditions
and other parameters of the experiment, a sequence known to be able to bind SP1 factor was used as a
positive control. Cy5-labeled forward strands were annealed with non-labeled reverse strands. The
same procedure was carried out using the non-labeled forward strand to create specific competitors.
Poly(dI-dC):poly(dI-dC) competitor was used to rule out non-specific DNA-protein binding. The
double-stranded probes were separated and purified from single-stranded oligonucleotides on a 12%
polyacrylamide gel.
SNPs r2 correlation with
rs3751812 (CEU)
African
population
FAIRE/
DNase I
TFs binding
site*
1stcategory
(score)**
2nd category
(score)**
rs3751812 1.00 � �/� � �
rs9941349 0.90 � �/- � �
rs9936385 0.94 - -/� � �
rs9923233 1.00 - -/� � �
rs17817964 0.96 - �/- � �
rs8050136 1.00 - �/- � �
rs9939609 1.00 - -/- � �
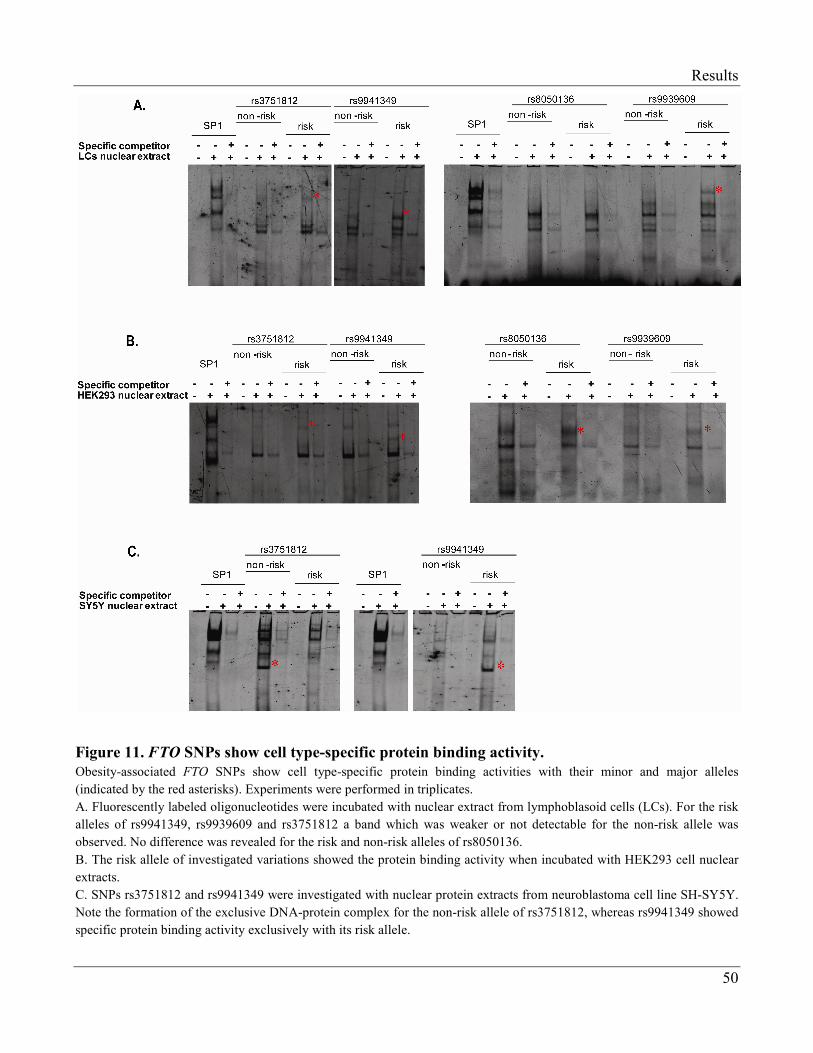
Results
50
Figure 11. FTO SNPs show cell type-specific protein binding activity.
Obesity-associated FTO SNPs show cell type-specific protein binding activities with their minor and major alleles
(indicated by the red asterisks). Experiments were performed in triplicates.
A. Fluorescently labeled oligonucleotides were incubated with nuclear extract from lymphoblasoid cells (LCs). For the risk
alleles of rs9941349, rs9939609 and rs3751812 a band which was weaker or not detectable for the non-risk allele was
observed. No difference was revealed for the risk and non-risk alleles of rs8050136.
B. The risk allele of investigated variations showed the protein binding activity when incubated with HEK293 cell nuclear
extracts.
C. SNPs rs3751812 and rs9941349 were investigated with nuclear protein extracts from neuroblastoma cell line SH-SY5Y.
Note the formation of the exclusive DNA-protein complex for the non-risk allele of rs3751812, whereas rs9941349 showed
specific protein binding activity exclusively with its risk allele.
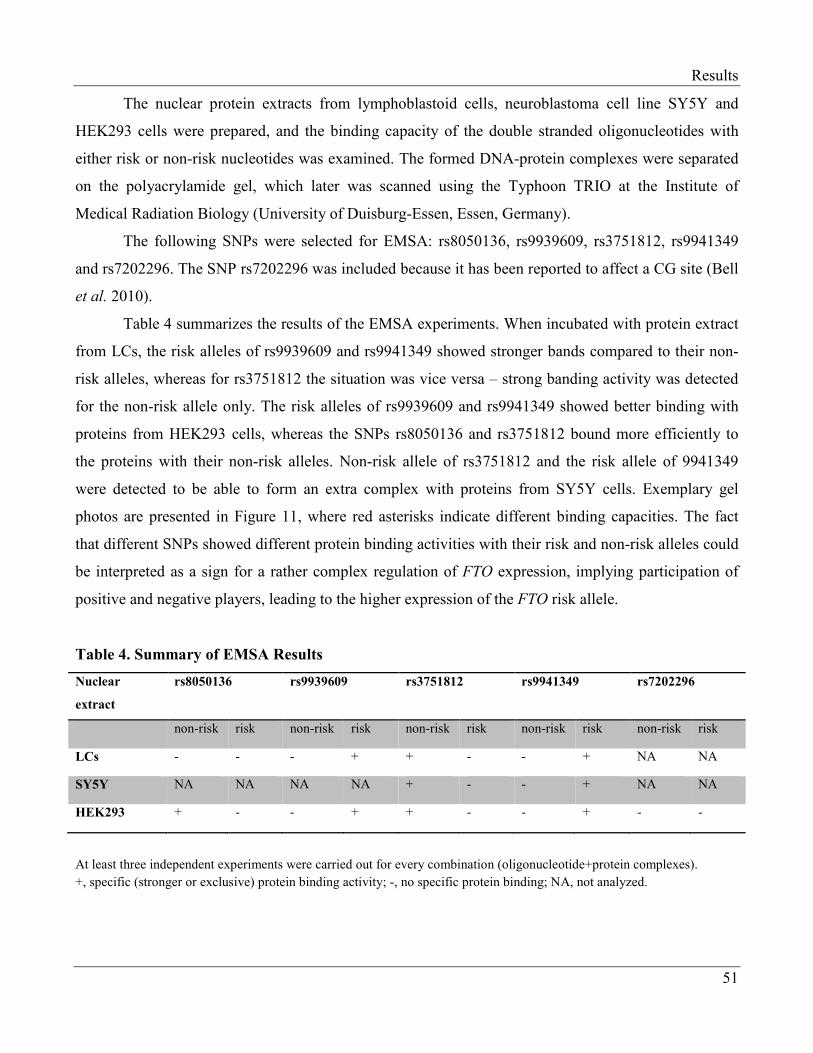
Results
51
The nuclear protein extracts from lymphoblastoid cells, neuroblastoma cell line SY5Y and
HEK293 cells were prepared, and the binding capacity of the double stranded oligonucleotides with
either risk or non-risk nucleotides was examined. The formed DNA-protein complexes were separated
on the polyacrylamide gel, which later was scanned using the Typhoon TRIO at the Institute of
Medical Radiation Biology (University of Duisburg-Essen, Essen, Germany).
The following SNPs were selected for EMSA: rs8050136, rs9939609, rs3751812, rs9941349
and rs7202296. The SNP rs7202296 was included because it has been reported to affect a CG site (Bell
et al. 2010).
Table 4 summarizes the results of the EMSA experiments. When incubated with protein extract
from LCs, the risk alleles of rs9939609 and rs9941349 showed stronger bands compared to their non-
risk alleles, whereas for rs3751812 the situation was vice versa – strong banding activity was detected
for the non-risk allele only. The risk alleles of rs9939609 and rs9941349 showed better binding with
proteins from HEK293 cells, whereas the SNPs rs8050136 and rs3751812 bound more efficiently to
the proteins with their non-risk alleles. Non-risk allele of rs3751812 and the risk allele of 9941349
were detected to be able to form an extra complex with proteins from SY5Y cells. Exemplary gel
photos are presented in Figure 11, where red asterisks indicate different binding capacities. The fact
that different SNPs showed different protein binding activities with their risk and non-risk alleles could
be interpreted as a sign for a rather complex regulation of FTO expression, implying participation of
positive and negative players, leading to the higher expression of the FTO risk allele.
Table 4. Summary of EMSA Results
Nuclear
extract
rs8050136 rs9939609 rs3751812 rs9941349 rs7202296
non-risk risk non-risk risk non-risk risk non-risk risk non-risk risk
LCs - - - + + - - + NA NA
SY5Y NA NA NA NA + - - + NA NA
HEK293 + - - + + - - + - -
At least three independent experiments were carried out for every combination (oligonucleotide+protein complexes).
+, specific (stronger or exclusive) protein binding activity; -, no specific protein binding; NA, not analyzed.
Results
52
3.1.4 Transcription Factors Regulating Expression of FTO
FTO is a widely expressed gene, and most probably its transcriptional regulation is controlled
by more than one factor, thereby forming a complex network and ensuring high-level ubiquitous
expression. The results from the EMSA experiments pictured the complicated situation implying that
interaction between many factors and different polymorphisms modulates FTO expression. In an
attempt to find out which transcription factors are important for FTO expression, we referred to ready-
to-use Expressed Transcription Factor Knockdown PCR Arrays (Qiagen). A unique "transcriptome" or
cDNA sample synthesized from a cell sample treated with a unique siRNA for particular transcription
factor is placed in each well of a Transcriptome PCR Array. The mRNAs are converted to cDNA via
random hexamers and oligo-dT primers. By applying a qPCR assay designed for gene of interest, it is
possible to find out which transcription factors regulate the expression of this gene. In other words, a
change in expression of the tested gene in a specific well identifies the corresponding transcription
factor as a regulator of that gene. Three arrays were run, each with 90 experimental cDNAs derived
from MCF-7 cells treated with siRNAs, making 270 transcription factors in total. RNA from the
siRNA treated MCF-7 cells was extracted after 48h of transfection.
Duplex qPCR was performed using FAM-labeled probe #87 from the Universal ProbeLibrary
for FTO and a Yellow 555-labeled universal reference GAPDH probe. FastStart Universal probe
Master Mix with ROX standard was used. The experiments were run on an ABI 7900HT machine.
Data analyses and calculation of relative FTO expression was performed using the SDS2.2 package
(Applied Biosystems). Three plates were analyzed for each array. Mean values and standard deviations
were calculated.
Following transcription factors were identified as positive regulators of FTO expression:
MED24, HCFC1, HOXD8, PPARA, RB1, RBM14, IRF6, PBX3, MED16, PPARGC1B, KLF4, CERS6,
PCGF2, PTTG1, HMG20A and MYBL2 (Figure 12). Knockdown of those factors resulted in more than
50% reduction in FTO mRNA levels. Transcription factors only moderately affecting FTO expression
are listed in the Appendix, section 3. Different members of the mediator complex (MED24, MED16)
and factors relevant for adipogenesis (PPARGC1B, PPARA) were identified to be necessary for FTO
expression.
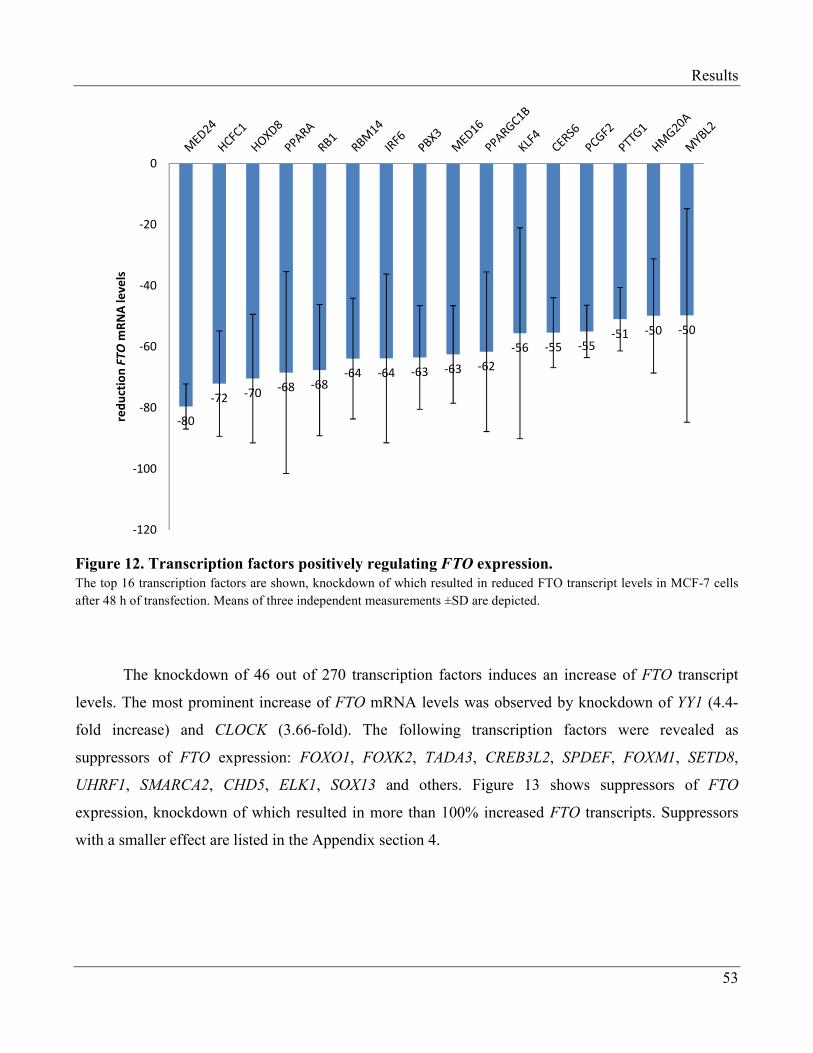
Results
53
Figure 12. Transcription factors positively regulating FTO expression.
The top 16 transcription factors are shown, knockdown of which resulted in reduced FTO transcript levels in MCF-7 cells
after 48 h of transfection. Means of three independent measurements ±SD are depicted.
The knockdown of 46 out of 270 transcription factors induces an increase of FTO transcript
levels. The most prominent increase of FTO mRNA levels was observed by knockdown of YY1 (4.4-
fold increase) and CLOCK (3.66-fold). The following transcription factors were revealed as
suppressors of FTO expression: FOXO1, FOXK2, TADA3, CREB3L2, SPDEF, FOXM1, SETD8,
UHRF1, SMARCA2, CHD5, ELK1, SOX13 and others. Figure 13 shows suppressors of FTO
expression, knockdown of which resulted in more than 100% increased FTO transcripts. Suppressors
with a smaller effect are listed in the Appendix section 4.
-80
-72 -70-68 -68
-64 -64 -63 -63 -62
-56 -55 -55-51 -50 -50
-120
-100
-80
-60
-40
-20
0
re
du
ctio
n F
TO
mR
NA
le
ve
ls
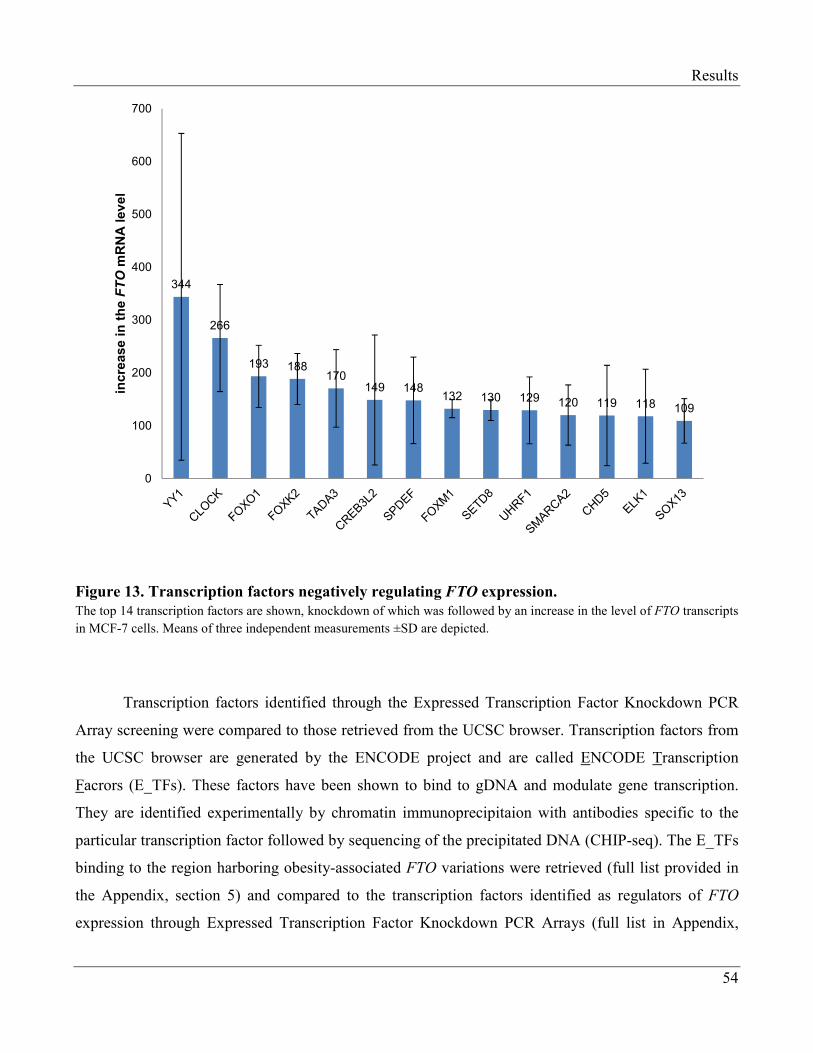
Results
54
Figure 13. Transcription factors negatively regulating FTO expression.
The top 14 transcription factors are shown, knockdown of which was followed by an increase in the level of FTO transcripts
in MCF-7 cells. Means of three independent measurements ±SD are depicted.
Transcription factors identified through the Expressed Transcription Factor Knockdown PCR
Array screening were compared to those retrieved from the UCSC browser. Transcription factors from
the UCSC browser are generated by the ENCODE project and are called ENCODE Transcription
Facrors (E_TFs). These factors have been shown to bind to gDNA and modulate gene transcription.
They are identified experimentally by chromatin immunoprecipitaion with antibodies specific to the
particular transcription factor followed by sequencing of the precipitated DNA (CHIP-seq). The E_TFs
binding to the region harboring obesity-associated FTO variations were retrieved (full list provided in
the Appendix, section 5) and compared to the transcription factors identified as regulators of FTO
expression through Expressed Transcription Factor Knockdown PCR Arrays (full list in Appendix,
344
266
193 188170
149 148132 130 129
120 119 118109
0
100
200
300
400
500
600
700
increase in the FTOmRNA level
Results
55
Section 3 and 4). There was no overlap between regulators of FTO from Expressed Transcription
Factor Knockdown PCR Arrays and E_TFs. The hypothesis was that transcription factors found to
regulate expression of FTO might exert their effect through binding to the region of the FTO gene,
where obesity-associated SNPs reside and which is considered as a putative regulatory element. Of
course, binding to the promoter of FTO or any other (unknown) regulatory elements can account for
their regulatory effects as well.
Additionally, the transcription factors determined by array were compared to factors predicted
to bind DNA in the FTO region containing obesity-associated SNPs. The binding sites for these factors
were identified based on conservation among humans, mouse and rat. These binding sites and
corresponding transcription factors were computed with the Transfac Matrix Database (v7.0) created
by Transfac Matrix Database (v7.0) created by Biobase (http://www.biobase-international.com), and
data are purely computational (complete list in Appendix, section 6).
When positive and negative regulators of FTO expression were compared to the list generated
from Biobase (Appendix, section 3 and 4 compared to section 6) the FOXO1 and REL factors
overlapped. FOXO1 is computed to bind to the regions between chr16:53807510-53807520 (the closest
SNP is rs16952522 at the 13th nucleotide in 5’ direction) and chr16:53827935-53827945 (the nearest
SNP is rs62033408 at the 14th nucleotide in 3’ direction) on the minus strand (GRCh37/hg19), whereas
REL likely binds to the region chr16:53802056-53802066 on the plus strand (the closest SNP is
rs9923544, 70 bp upstream in 5’ direction). None of the SNPs that were prioritized as putative
causative polymorphisms were found within or close to these regions.
Results
56
3.2 Functional Studies
To elucidate the hypothesis that the FTO protein functions as a transcription factor (Wu et al.
2010) or exerts its effect by removing methyl groups from ribonucelosides in RNA molecules, the
consequences of its overexpression and knockdown were investigated on the transcriptome and RNA
methylation levels. Cell lines stably overexpressing an FTO transgene were generated for
overexpression experiments, and transient transfections with ready-to-use siRNAs were performed for
knockdown experiments. Steady-state levels of RNA were measured using Affymetrix U133 plus 2.0
microarrays. The microarray analyses were performed in the BioChip lab under supervision of Dr.
Klein-Hitpass (Institute of Cell Biology, University of Duisburg-Essen, Essen, Germany). The ratio of
methylated to unmethylated ribonucleosides was determined in Fto-deficient animals, in particular in
total brain RNA preparations. Fto knockout mice were kindly provided by Prof. U. Rüther (Institute for
Animal Developmental and Molecular Biology, Heinrich-Heine-University, Düsseldorf, Germany).
The methylation status of ribonucleosides was determined by Dr. M. Ziehe (Analytical and
Environmental Chemistry, Humboldt-Universität zu Berlin, Berlin) using HPLC-MS.
3.2.1 Generation of the FTO Overexpressing Cell Line
To generate a stable, inducible FTO expressing cell line, the Flp-In™ T-Rex Core kit was used.
Integration of the gene of interest (GOI) in the cellular genome is mediated by the Flp recombinase in
this system. Flp-In™ T-Rex 293 cells were selected as host cell line (for more details see Materials and
Methods, chapter 2.3.5.2.)
Expression of the transgene is controlled by the human cytomegalovirus (CMV) promoter
which contains two tandem copies of tet operator. Binding of Tet repressors (expressed from
pcDNA6/TR plasmid, which is integrated at the independent site in Flp-In™ T-Rex 293 genome) to
these sequences ensures depression of promoter controlling inserted transgene. After introducing
tetracycline or doxycycline (see below) in the system, it binds to the Tet repressor causing
conformational change of it in the way, that it is unable to bind to tet operator. As a result, transcription
of the transgene is induced.
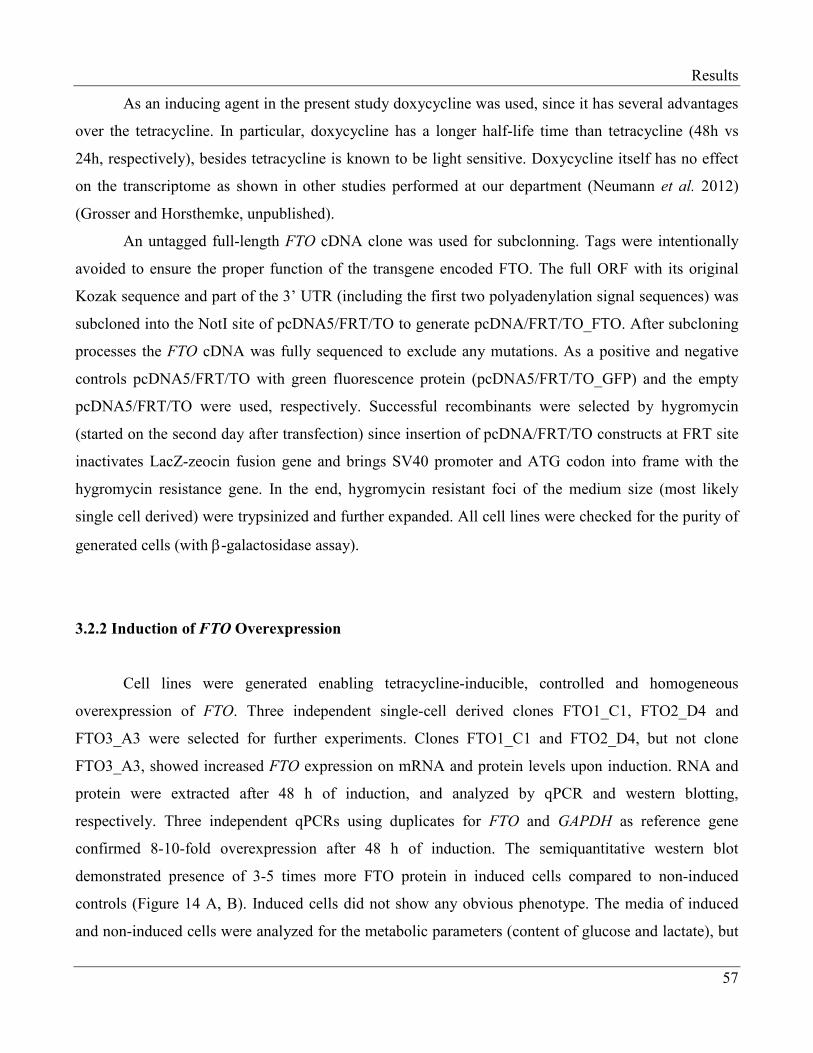
Results
57
As an inducing agent in the present study doxycycline was used, since it has several advantages
over the tetracycline. In particular, doxycycline has a longer half-life time than tetracycline (48h vs
24h, respectively), besides tetracycline is known to be light sensitive. Doxycycline itself has no effect
on the transcriptome as shown in other studies performed at our department (Neumann et al. 2012)
(Grosser and Horsthemke, unpublished).
An untagged full-length FTO cDNA clone was used for subclonning. Tags were intentionally
avoided to ensure the proper function of the transgene encoded FTO. The full ORF with its original
Kozak sequence and part of the 3’ UTR (including the first two polyadenylation signal sequences) was
subcloned into the NotI site of pcDNA5/FRT/TO to generate pcDNA/FRT/TO_FTO. After subcloning
processes the FTO cDNA was fully sequenced to exclude any mutations. As a positive and negative
controls pcDNA5/FRT/TO with green fluorescence protein (pcDNA5/FRT/TO_GFP) and the empty
pcDNA5/FRT/TO were used, respectively. Successful recombinants were selected by hygromycin
(started on the second day after transfection) since insertion of pcDNA/FRT/TO constructs at FRT site
inactivates LacZ-zeocin fusion gene and brings SV40 promoter and ATG codon into frame with the
hygromycin resistance gene. In the end, hygromycin resistant foci of the medium size (most likely
single cell derived) were trypsinized and further expanded. All cell lines were checked for the purity of
generated cells (with β-galactosidase assay).
3.2.2 Induction of FTO Overexpression
Cell lines were generated enabling tetracycline-inducible, controlled and homogeneous
overexpression of FTO. Three independent single-cell derived clones FTO1_C1, FTO2_D4 and
FTO3_A3 were selected for further experiments. Clones FTO1_C1 and FTO2_D4, but not clone
FTO3_A3, showed increased FTO expression on mRNA and protein levels upon induction. RNA and
protein were extracted after 48 h of induction, and analyzed by qPCR and western blotting,
respectively. Three independent qPCRs using duplicates for FTO and GAPDH as reference gene
confirmed 8-10-fold overexpression after 48 h of induction. The semiquantitative western blot
demonstrated presence of 3-5 times more FTO protein in induced cells compared to non-induced
controls (Figure 14 A, B). Induced cells did not show any obvious phenotype. The media of induced
and non-induced cells were analyzed for the metabolic parameters (content of glucose and lactate), but
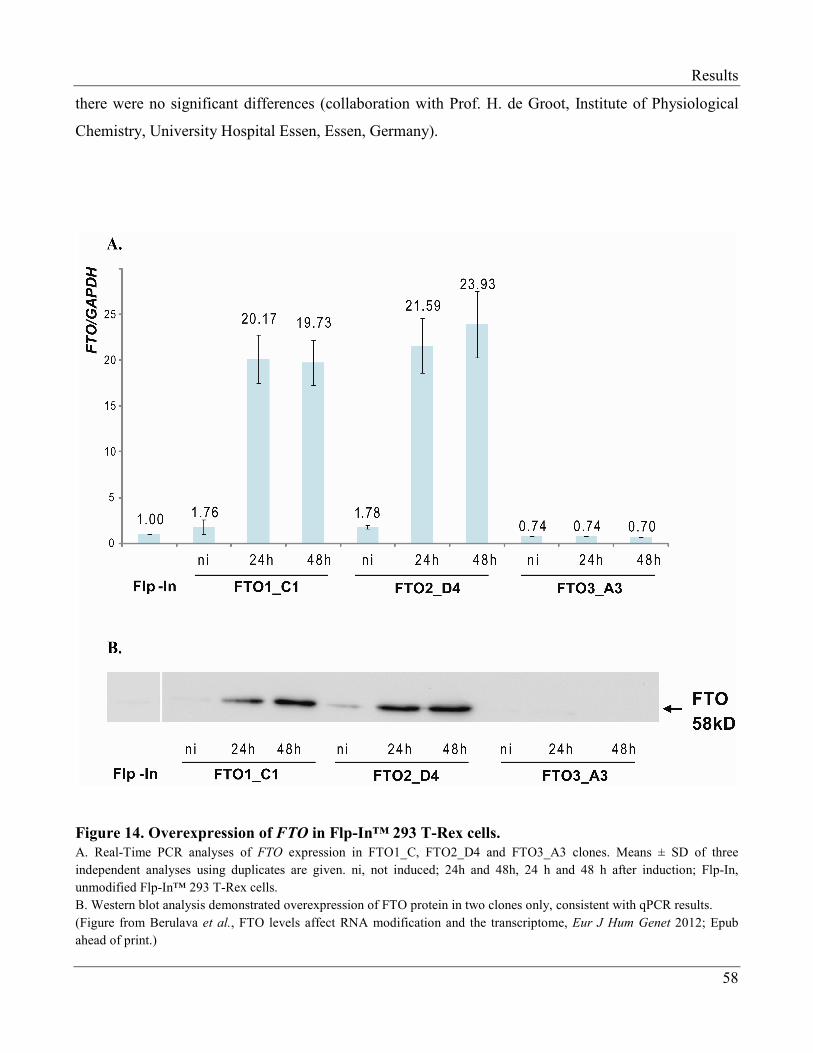
Results
58
there were no significant differences (collaboration with Prof. H. de Groot, Institute of Physiological
Chemistry, University Hospital Essen, Essen, Germany).
Figure 14. Overexpression of FTO in Flp-In™ 293 T-Rex cells.
A. Real-Time PCR analyses of FTO expression in FTO1_C, FTO2_D4 and FTO3_A3 clones. Means ± SD of three
independent analyses using duplicates are given. ni, not induced; 24h and 48h, 24 h and 48 h after induction; Flp-In,
unmodified Flp-In™ 293 T-Rex cells.
B. Western blot analysis demonstrated overexpression of FTO protein in two clones only, consistent with qPCR results.
(Figure from Berulava et al., FTO levels affect RNA modification and the transcriptome, Eur J Hum Genet 2012; Epub
ahead of print.)
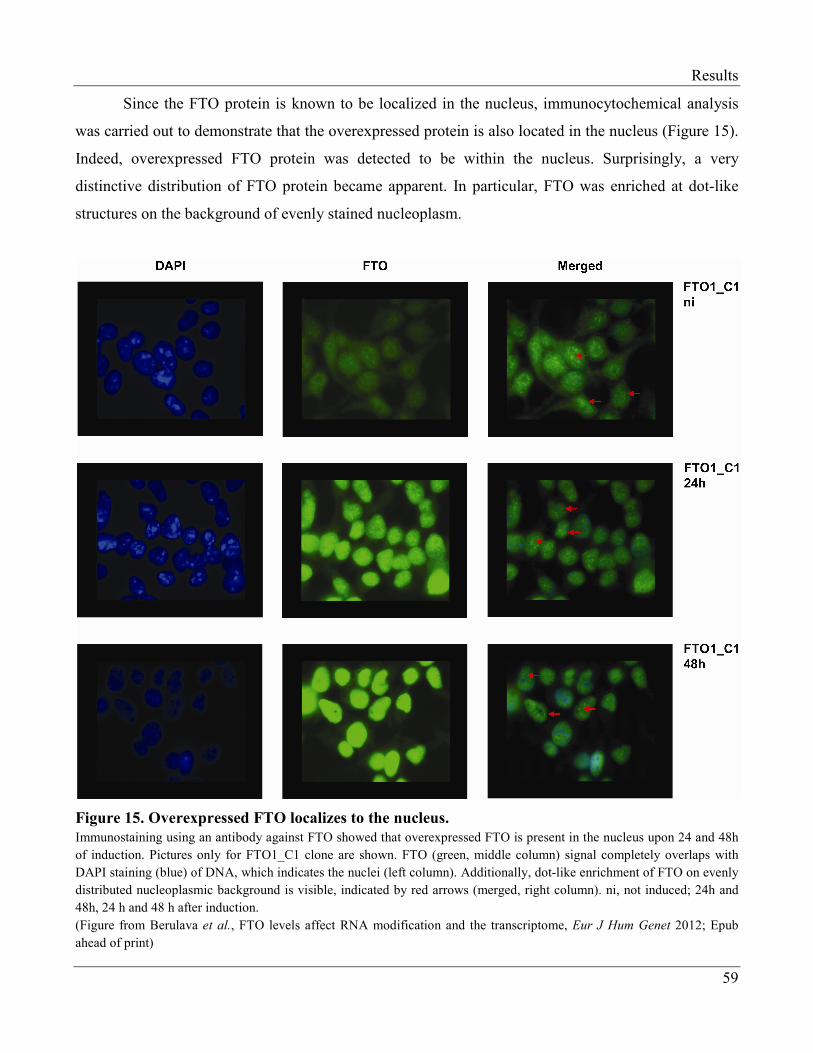
Results
59
Since the FTO protein is known to be localized in the nucleus, immunocytochemical analysis
was carried out to demonstrate that the overexpressed protein is also located in the nucleus (Figure 15).
Indeed, overexpressed FTO protein was detected to be within the nucleus. Surprisingly, a very
distinctive distribution of FTO protein became apparent. In particular, FTO was enriched at dot-like
structures on the background of evenly stained nucleoplasm.
Figure 15. Overexpressed FTO localizes to the nucleus.
Immunostaining using an antibody against FTO showed that overexpressed FTO is present in the nucleus upon 24 and 48h
of induction. Pictures only for FTO1_C1 clone are shown. FTO (green, middle column) signal completely overlaps with
DAPI staining (blue) of DNA, which indicates the nuclei (left column). Additionally, dot-like enrichment of FTO on evenly
distributed nucleoplasmic background is visible, indicated by red arrows (merged, right column). ni, not induced; 24h and
48h, 24 h and 48 h after induction.
(Figure from Berulava et al., FTO levels affect RNA modification and the transcriptome, Eur J Hum Genet 2012; Epub
ahead of print)
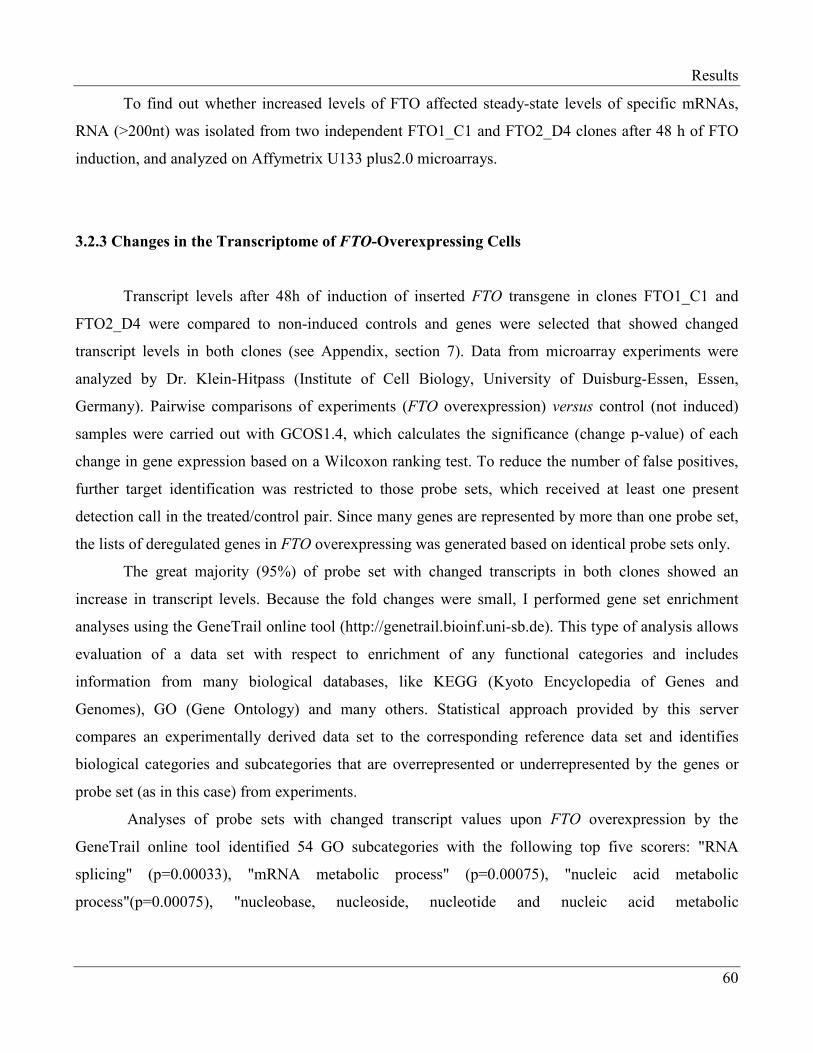
Results
60
To find out whether increased levels of FTO affected steady-state levels of specific mRNAs,
RNA (>200nt) was isolated from two independent FTO1_C1 and FTO2_D4 clones after 48 h of FTO
induction, and analyzed on Affymetrix U133 plus2.0 microarrays.
3.2.3 Changes in the Transcriptome of FTO-Overexpressing Cells
Transcript levels after 48h of induction of inserted FTO transgene in clones FTO1_C1 and
FTO2_D4 were compared to non-induced controls and genes were selected that showed changed
transcript levels in both clones (see Appendix, section 7). Data from microarray experiments were
analyzed by Dr. Klein-Hitpass (Institute of Cell Biology, University of Duisburg-Essen, Essen,
Germany). Pairwise comparisons of experiments (FTO overexpression) versus control (not induced)
samples were carried out with GCOS1.4, which calculates the significance (change p-value) of each
change in gene expression based on a Wilcoxon ranking test. To reduce the number of false positives,
further target identification was restricted to those probe sets, which received at least one present
detection call in the treated/control pair. Since many genes are represented by more than one probe set,
the lists of deregulated genes in FTO overexpressing was generated based on identical probe sets only.
The great majority (95%) of probe set with changed transcripts in both clones showed an
increase in transcript levels. Because the fold changes were small, I performed gene set enrichment
analyses using the GeneTrail online tool (http://genetrail.bioinf.uni-sb.de). This type of analysis allows
evaluation of a data set with respect to enrichment of any functional categories and includes
information from many biological databases, like KEGG (Kyoto Encyclopedia of Genes and
Genomes), GO (Gene Ontology) and many others. Statistical approach provided by this server
compares an experimentally derived data set to the corresponding reference data set and identifies
biological categories and subcategories that are overrepresented or underrepresented by the genes or
probe set (as in this case) from experiments.
Analyses of probe sets with changed transcript values upon FTO overexpression by the
GeneTrail online tool identified 54 GO subcategories with the following top five scorers: "RNA
splicing" (p=0.00033), "mRNA metabolic process" (p=0.00075), "nucleic acid metabolic
process"(p=0.00075), "nucleobase, nucleoside, nucleotide and nucleic acid metabolic
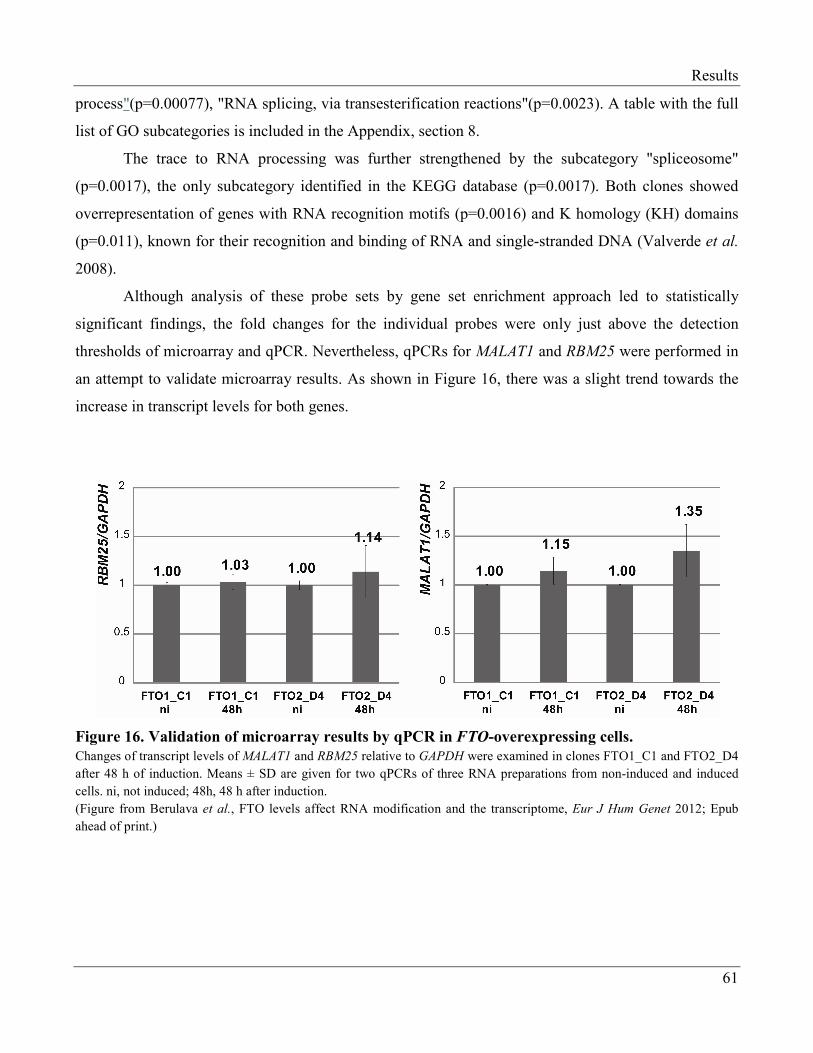
Results
61
process"(p=0.00077), "RNA splicing, via transesterification reactions"(p=0.0023). A table with the full
list of GO subcategories is included in the Appendix, section 8.
The trace to RNA processing was further strengthened by the subcategory "spliceosome"
(p=0.0017), the only subcategory identified in the KEGG database (p=0.0017). Both clones showed
overrepresentation of genes with RNA recognition motifs (p=0.0016) and K homology (KH) domains
(p=0.011), known for their recognition and binding of RNA and single-stranded DNA (Valverde et al.
2008).
Although analysis of these probe sets by gene set enrichment approach led to statistically
significant findings, the fold changes for the individual probes were only just above the detection
thresholds of microarray and qPCR. Nevertheless, qPCRs for MALAT1 and RBM25 were performed in
an attempt to validate microarray results. As shown in Figure 16, there was a slight trend towards the
increase in transcript levels for both genes.
Figure 16. Validation of microarray results by qPCR in FTO-overexpressing cells.
Changes of transcript levels of MALAT1 and RBM25 relative to GAPDH were examined in clones FTO1_C1 and FTO2_D4
after 48 h of induction. Means ± SD are given for two qPCRs of three RNA preparations from non-induced and induced
cells. ni, not induced; 48h, 48 h after induction.
(Figure from Berulava et al., FTO levels affect RNA modification and the transcriptome, Eur J Hum Genet 2012; Epub
ahead of print.)
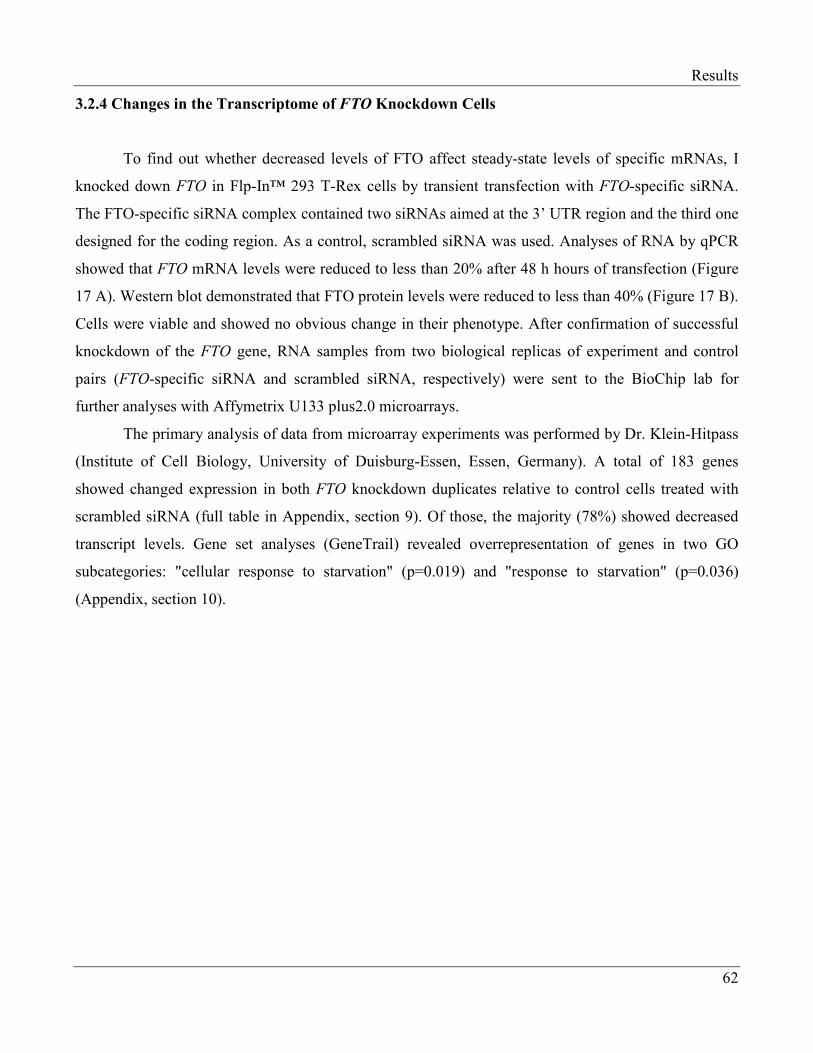
Results
62
3.2.4 Changes in the Transcriptome of FTO Knockdown Cells
To find out whether decreased levels of FTO affect steady-state levels of specific mRNAs, I
knocked down FTO in Flp-In™ 293 T-Rex cells by transient transfection with FTO-specific siRNA.
The FTO-specific siRNA complex contained two siRNAs aimed at the 3’ UTR region and the third one
designed for the coding region. As a control, scrambled siRNA was used. Analyses of RNA by qPCR
showed that FTO mRNA levels were reduced to less than 20% after 48 h hours of transfection (Figure
17 A). Western blot demonstrated that FTO protein levels were reduced to less than 40% (Figure 17 B).
Cells were viable and showed no obvious change in their phenotype. After confirmation of successful
knockdown of the FTO gene, RNA samples from two biological replicas of experiment and control
pairs (FTO-specific siRNA and scrambled siRNA, respectively) were sent to the BioChip lab for
further analyses with Affymetrix U133 plus2.0 microarrays.
The primary analysis of data from microarray experiments was performed by Dr. Klein-Hitpass
(Institute of Cell Biology, University of Duisburg-Essen, Essen, Germany). A total of 183 genes
showed changed expression in both FTO knockdown duplicates relative to control cells treated with
scrambled siRNA (full table in Appendix, section 9). Of those, the majority (78%) showed decreased
transcript levels. Gene set analyses (GeneTrail) revealed overrepresentation of genes in two GO
subcategories: "cellular response to starvation" (p=0.019) and "response to starvation" (p=0.036)
(Appendix, section 10).
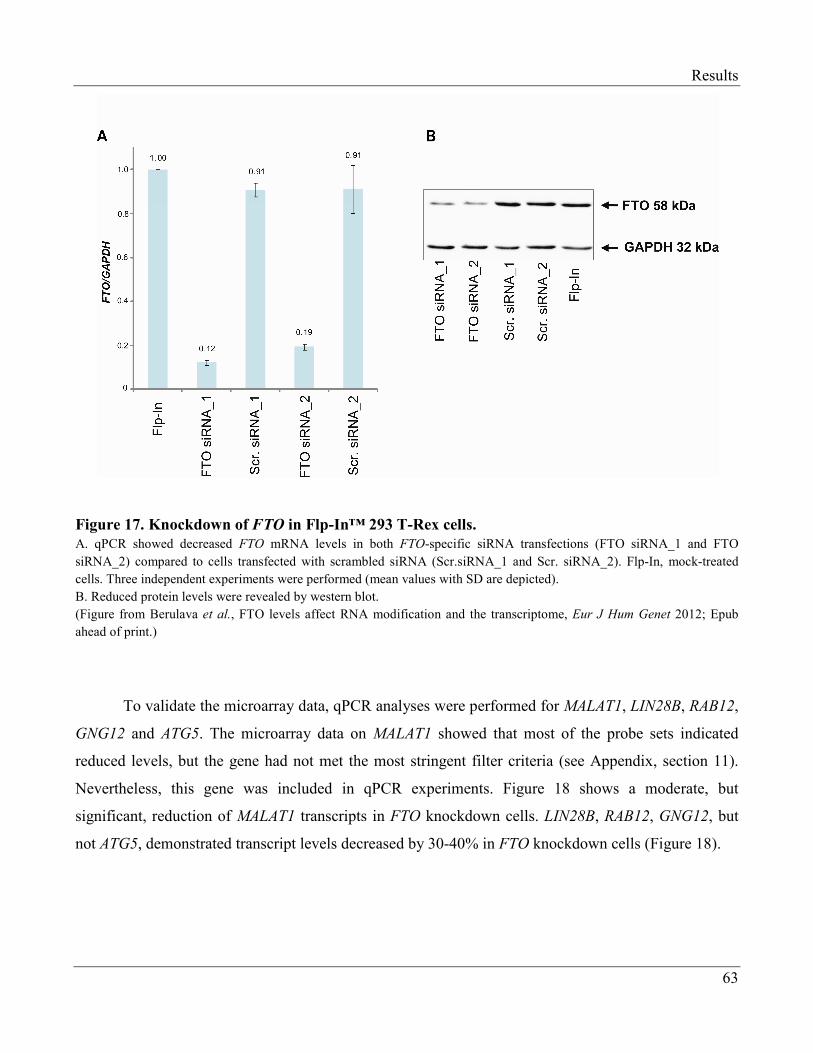
Results
63
Figure 17. Knockdown of FTO in Flp-In™ 293 T-Rex cells.
A. qPCR showed decreased FTO mRNA levels in both FTO-specific siRNA transfections (FTO siRNA_1 and FTO
siRNA_2) compared to cells transfected with scrambled siRNA (Scr.siRNA_1 and Scr. siRNA_2). Flp-In, mock-treated
cells. Three independent experiments were performed (mean values with SD are depicted).
B. Reduced protein levels were revealed by western blot.
(Figure from Berulava et al., FTO levels affect RNA modification and the transcriptome, Eur J Hum Genet 2012; Epub
ahead of print.)
To validate the microarray data, qPCR analyses were performed for MALAT1, LIN28B, RAB12,
GNG12 and ATG5. The microarray data on MALAT1 showed that most of the probe sets indicated
reduced levels, but the gene had not met the most stringent filter criteria (see Appendix, section 11).
Nevertheless, this gene was included in qPCR experiments. Figure 18 shows a moderate, but
significant, reduction of MALAT1 transcripts in FTO knockdown cells. LIN28B, RAB12, GNG12, but
not ATG5, demonstrated transcript levels decreased by 30-40% in FTO knockdown cells (Figure 18).
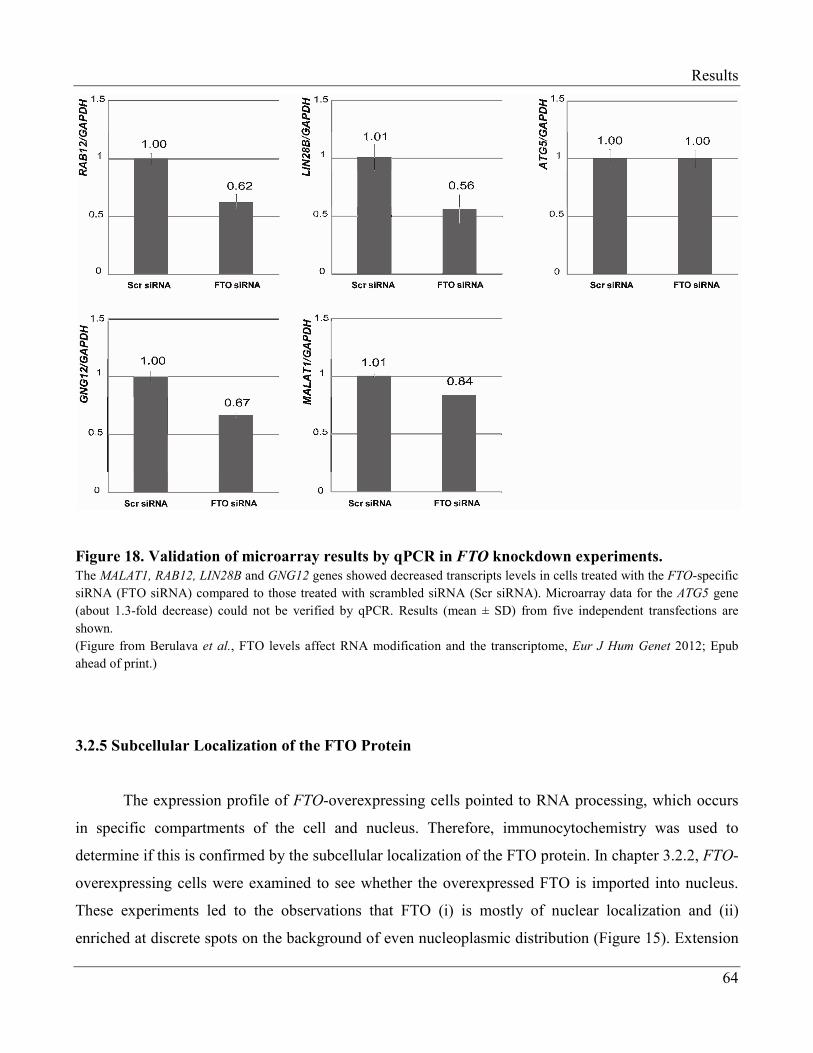
Results
64
Figure 18. Validation of microarray results by qPCR in FTO knockdown experiments.
The MALAT1, RAB12, LIN28B and GNG12 genes showed decreased transcripts levels in cells treated with the FTO-specific
siRNA (FTO siRNA) compared to those treated with scrambled siRNA (Scr siRNA). Microarray data for the ATG5 gene
(about 1.3-fold decrease) could not be verified by qPCR. Results (mean ± SD) from five independent transfections are
shown.
(Figure from Berulava et al., FTO levels affect RNA modification and the transcriptome, Eur J Hum Genet 2012; Epub
ahead of print.)
3.2.5 Subcellular Localization of the FTO Protein
The expression profile of FTO-overexpressing cells pointed to RNA processing, which occurs
in specific compartments of the cell and nucleus. Therefore, immunocytochemistry was used to
determine if this is confirmed by the subcellular localization of the FTO protein. In chapter 3.2.2, FTO-
overexpressing cells were examined to see whether the overexpressed FTO is imported into nucleus.
These experiments led to the observations that FTO (i) is mostly of nuclear localization and (ii)
enriched at discrete spots on the background of even nucleoplasmic distribution (Figure 15). Extension
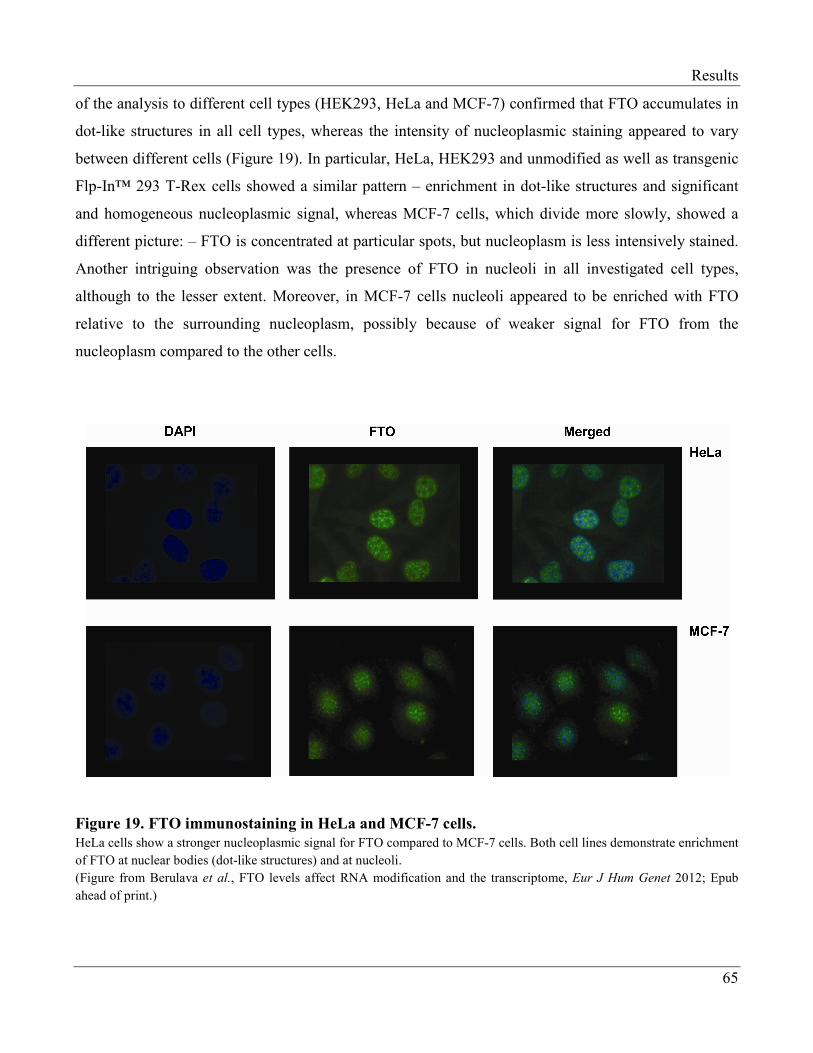
Results
65
of the analysis to different cell types (HEK293, HeLa and MCF-7) confirmed that FTO accumulates in
dot-like structures in all cell types, whereas the intensity of nucleoplasmic staining appeared to vary
between different cells (Figure 19). In particular, HeLa, HEK293 and unmodified as well as transgenic
Flp-In™ 293 T-Rex cells showed a similar pattern – enrichment in dot-like structures and significant
and homogeneous nucleoplasmic signal, whereas MCF-7 cells, which divide more slowly, showed a
different picture: – FTO is concentrated at particular spots, but nucleoplasm is less intensively stained.
Another intriguing observation was the presence of FTO in nucleoli in all investigated cell types,
although to the lesser extent. Moreover, in MCF-7 cells nucleoli appeared to be enriched with FTO
relative to the surrounding nucleoplasm, possibly because of weaker signal for FTO from the
nucleoplasm compared to the other cells.
Figure 19. FTO immunostaining in HeLa and MCF-7 cells.
HeLa cells show a stronger nucleoplasmic signal for FTO compared to MCF-7 cells. Both cell lines demonstrate enrichment
of FTO at nuclear bodies (dot-like structures) and at nucleoli.
(Figure from Berulava et al., FTO levels affect RNA modification and the transcriptome, Eur J Hum Genet 2012; Epub
ahead of print.)
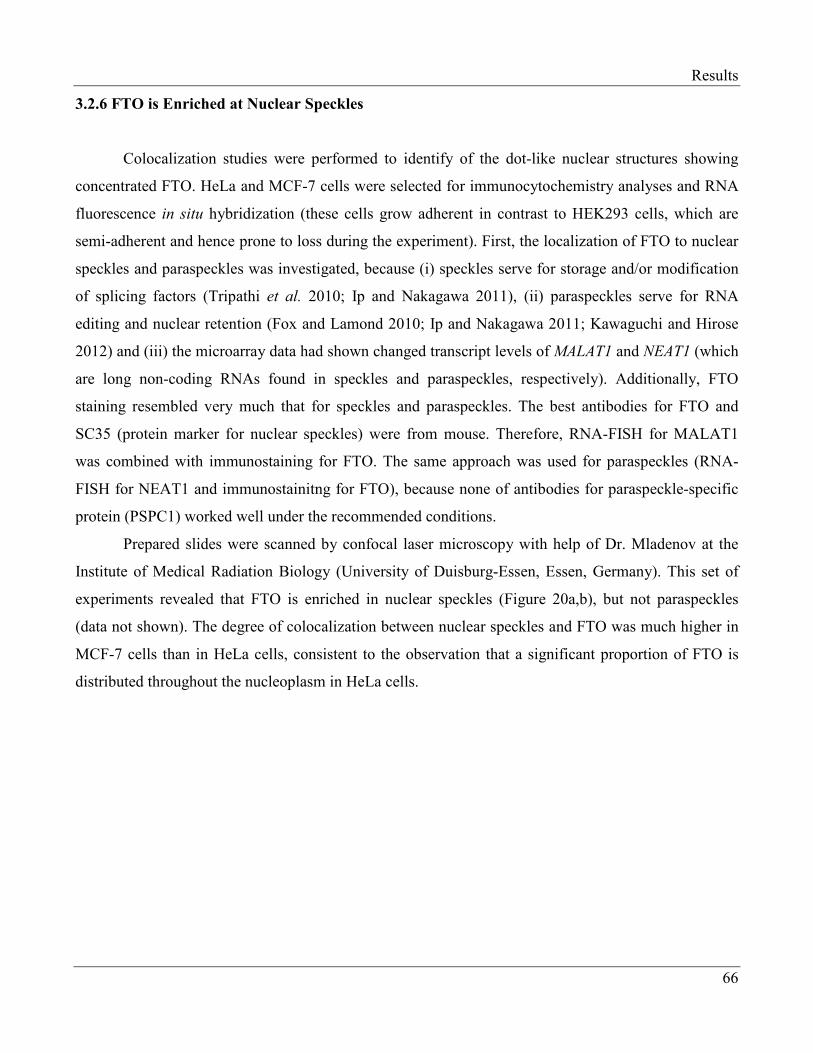
Results
66
3.2.6 FTO is Enriched at Nuclear Speckles
Colocalization studies were performed to identify of the dot-like nuclear structures showing
concentrated FTO. HeLa and MCF-7 cells were selected for immunocytochemistry analyses and RNA
fluorescence in situ hybridization (these cells grow adherent in contrast to HEK293 cells, which are
semi-adherent and hence prone to loss during the experiment). First, the localization of FTO to nuclear
speckles and paraspeckles was investigated, because (i) speckles serve for storage and/or modification
of splicing factors (Tripathi et al. 2010; Ip and Nakagawa 2011), (ii) paraspeckles serve for RNA
editing and nuclear retention (Fox and Lamond 2010; Ip and Nakagawa 2011; Kawaguchi and Hirose
2012) and (iii) the microarray data had shown changed transcript levels of MALAT1 and NEAT1 (which
are long non-coding RNAs found in speckles and paraspeckles, respectively). Additionally, FTO
staining resembled very much that for speckles and paraspeckles. The best antibodies for FTO and
SC35 (protein marker for nuclear speckles) were from mouse. Therefore, RNA-FISH for MALAT1
was combined with immunostaining for FTO. The same approach was used for paraspeckles (RNA-
FISH for NEAT1 and immunostainitng for FTO), because none of antibodies for paraspeckle-specific
protein (PSPC1) worked well under the recommended conditions.
Prepared slides were scanned by confocal laser microscopy with help of Dr. Mladenov at the
Institute of Medical Radiation Biology (University of Duisburg-Essen, Essen, Germany). This set of
experiments revealed that FTO is enriched in nuclear speckles (Figure 20a,b), but not paraspeckles
(data not shown). The degree of colocalization between nuclear speckles and FTO was much higher in
MCF-7 cells than in HeLa cells, consistent to the observation that a significant proportion of FTO is
distributed throughout the nucleoplasm in HeLa cells.
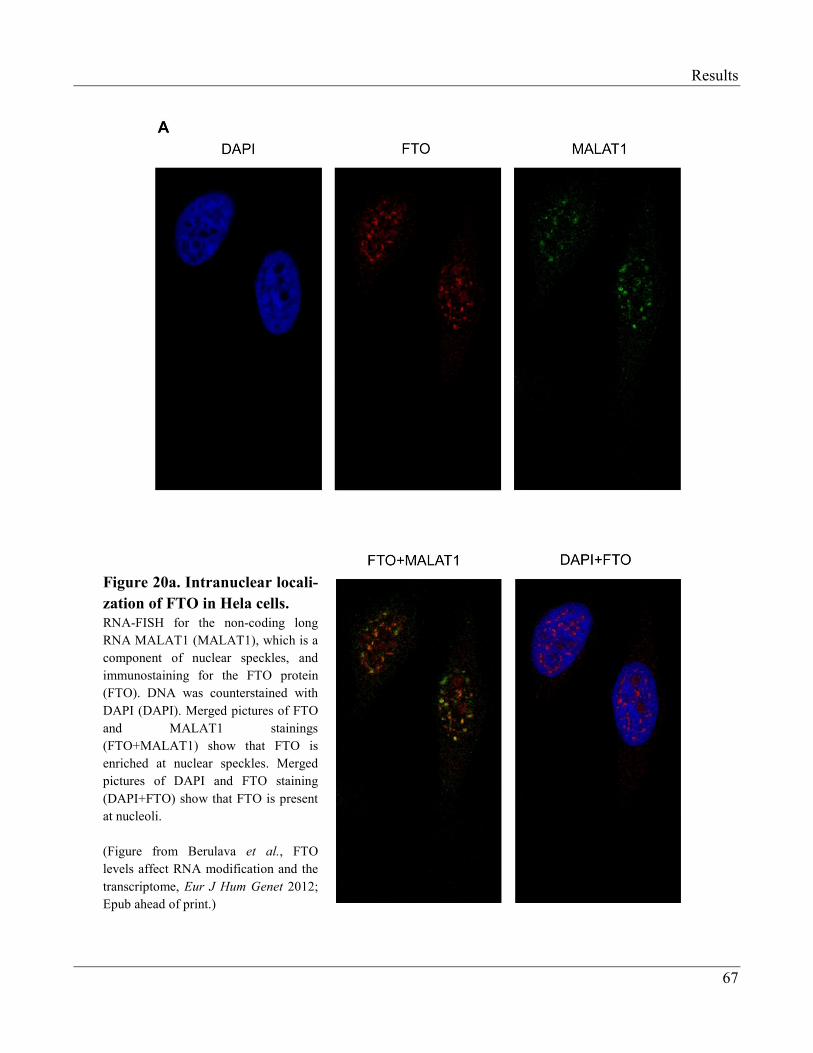
Results
67
Figure 20a. Intranuclear locali-
zation of FTO in Hela cells.
RNA-FISH for the non-coding long
RNA MALAT1 (MALAT1), which is a
component of nuclear speckles, and
immunostaining for the FTO protein
(FTO). DNA was counterstained with
DAPI (DAPI). Merged pictures of FTO
and MALAT1 stainings
(FTO+MALAT1) show that FTO is
enriched at nuclear speckles. Merged
pictures of DAPI and FTO staining
(DAPI+FTO) show that FTO is present
at nucleoli.
(Figure from Berulava et al., FTO
levels affect RNA modification and the
transcriptome, Eur J Hum Genet 2012;
Epub ahead of print.)
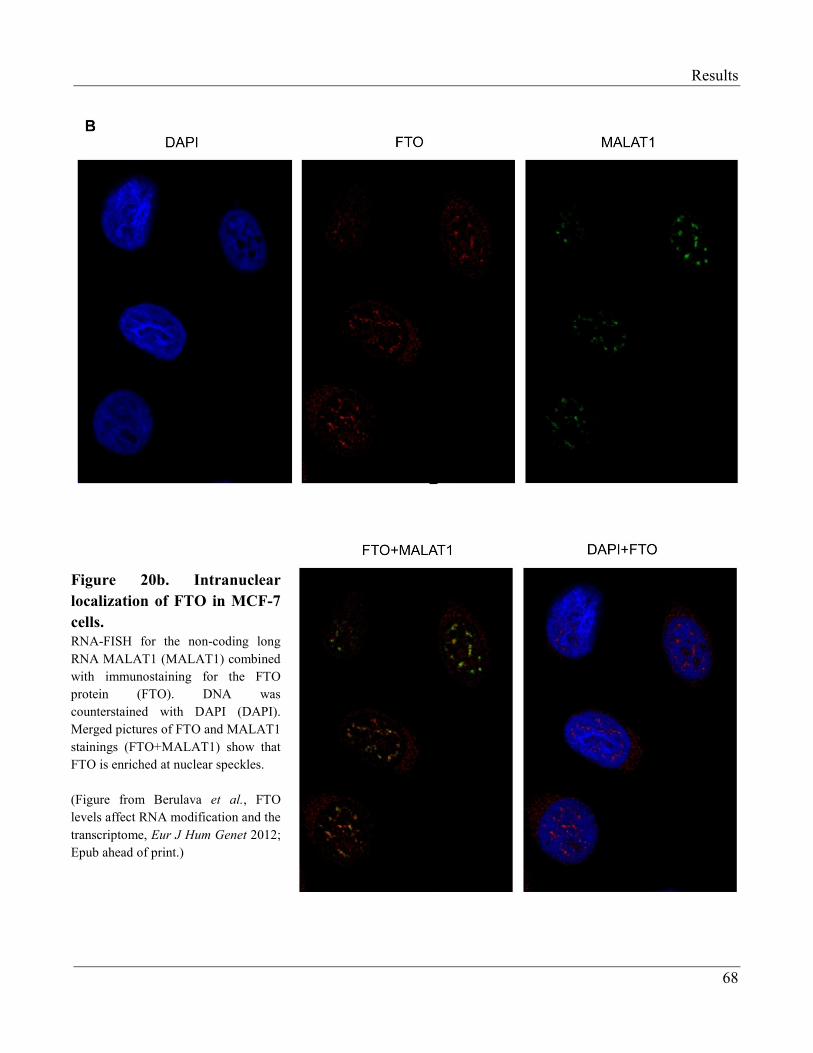
Results
68
Figure 20b. Intranuclear
localization of FTO in MCF-7
cells.
RNA-FISH for the non-coding long
RNA MALAT1 (MALAT1) combined
with immunostaining for the FTO
protein (FTO). DNA was
counterstained with DAPI (DAPI).
Merged pictures of FTO and MALAT1
stainings (FTO+MALAT1) show that
FTO is enriched at nuclear speckles.
(Figure from Berulava et al., FTO
levels affect RNA modification and the
transcriptome, Eur J Hum Genet 2012;
Epub ahead of print.)
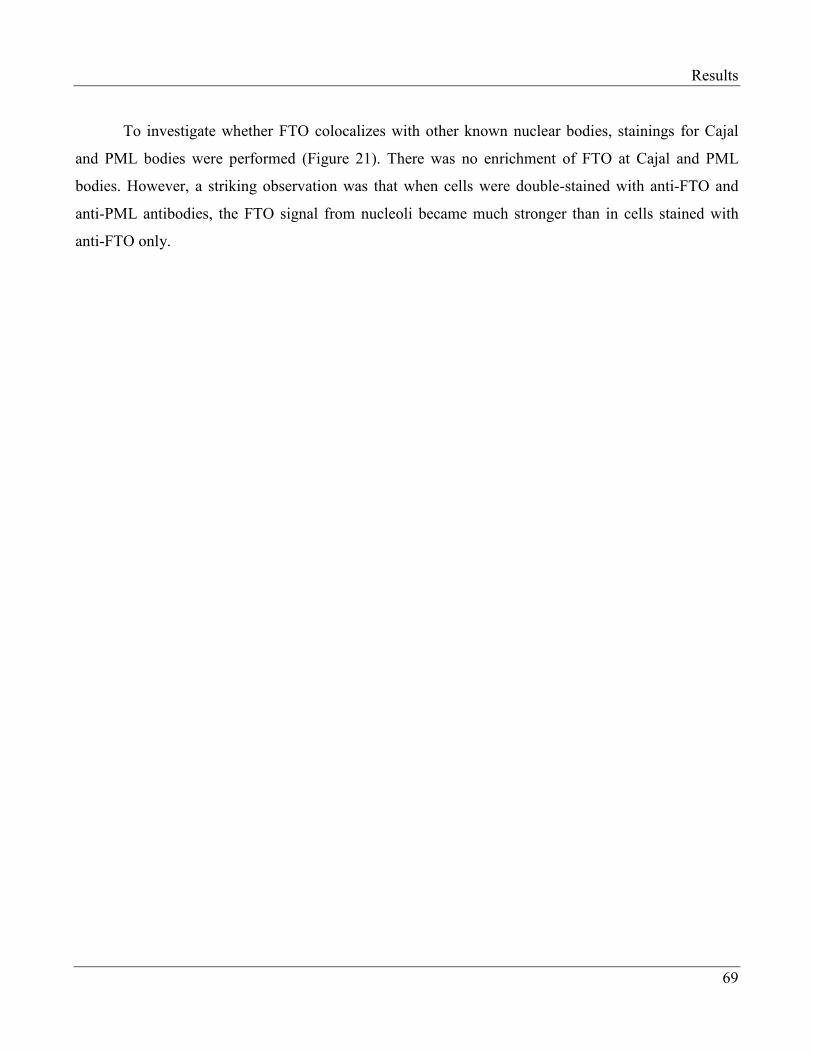
Results
69
To investigate whether FTO colocalizes with other known nuclear bodies, stainings for Cajal
and PML bodies were performed (Figure 21). There was no enrichment of FTO at Cajal and PML
bodies. However, a striking observation was that when cells were double-stained with anti-FTO and
anti-PML antibodies, the FTO signal from nucleoli became much stronger than in cells stained with
anti-FTO only.
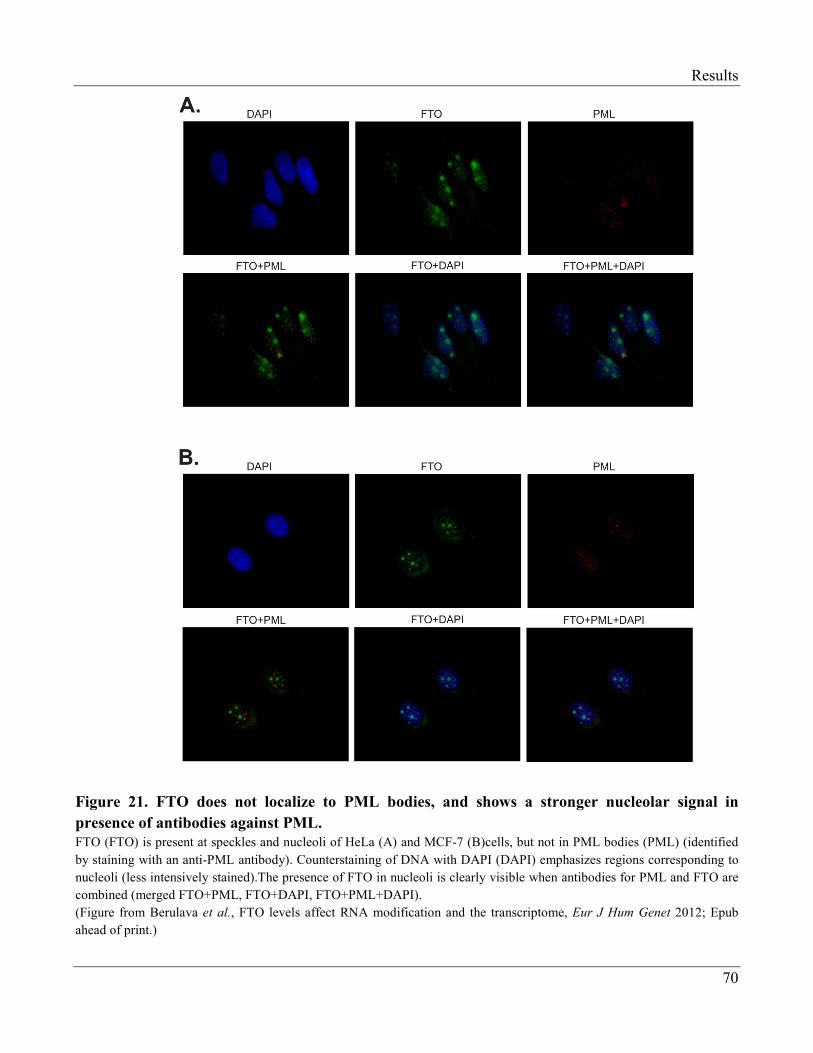
Results
70
Figure 21. FTO does not localize to PML bodies, and shows a stronger nucleolar signal in
presence of antibodies against PML.
FTO (FTO) is present at speckles and nucleoli of HeLa (A) and MCF-7 (B)cells, but not in PML bodies (PML) (identified
by staining with an anti-PML antibody). Counterstaining of DNA with DAPI (DAPI) emphasizes regions corresponding to
nucleoli (less intensively stained).The presence of FTO in nucleoli is clearly visible when antibodies for PML and FTO are
combined (merged FTO+PML, FTO+DAPI, FTO+PML+DAPI).
(Figure from Berulava et al., FTO levels affect RNA modification and the transcriptome, Eur J Hum Genet 2012; Epub
ahead of print.)
Results
71
3.2.7 Modification of Brain RNA in Wildtype and Fto Knock-out Mice
In 2007, Gerken et al. showed that 3-methyluridine and 3-methylthymidine in single stranded
RNA and DNA, respectively, are the preferred in vitro substrates of mouse and human Fto/FTO
(Gerken et al. 2007). Given that RNA (in particular ribosomal RNA) is abundant and mainly single-
stranded, Han et al. suggested that RNA may be the primary substrate of FTO (Han et al. 2010). The
expression profiles of FTO-overexpressing and -knockdown cells together with the results of
subcellular localization analyses in this study support this view and encouraged me to examine the ratio
of modified to unmodified ribonucleosides. Fto-deficient (Fischer et al. 2009) animals and wildtype
littermates were kindly provided by Prof. Rüther Institute for Animal Developmental and Molecular
Biology, Heinrich-Heine-University, Düsseldorf, Germany) and brain was chosen as tissue for this
experiment, because (i) Fto expression is highest in brain, and (ii) Fto knock-out mice completely lack
Fto. Thus, any effect should be most obvious and functionally relevant.
Total RNA from whole brains of wildtype and Fto-/- mice was prepared into two fractions: large
RNA (>200 bases) and small RNA (< 200 bases). The first fraction contains mainly rRNA, whereas the
second fraction contains mainly tRNA. Enzymatic digestion of RNA samples was performed as
described (Crain 1990) and sent to Berlin for analyses by High Performance Liquid Chromatography
with Mass Spectrometry (HPLC-MS) on an Agilent 1200 system coupled to an LTQ iontrap
(performed by Dr. Ziehe, Department of Analytical and Environmental Chemistry, Humboldt-
Universität zu Berlin, Germany).
The following ribonucleosides, which have been shown to be substrates and reaction products
of FTO (Gerken et al. 2007; Jia et al. 2011), were measured: 3-methyluridine (3-meU), uridine (U), 6-
methyladenosine (N6-meA), adenosine (A), 3-methylcytidine (3-meC) and cytidine (C). Pseudouridine
(ΨU) was included in the analyses as well, based on the finding that 3-methylation prevents uridine
from pseudouridinylation (Zhou et al. 2010). Calculations of the ratios of modified and unmodified
nucleosides were done relative to standard curves.
Figure 22 shows the analysis of four Fto-/- animals (two females, two males) against five
wildtype mice (three females, two males). In the large RNA fraction, the ratio of 3-meU/U was higher
in female and male Fto-/- mice (see, Figure 22). In particular, female Fto
-/- mice showed 33% higher 3-
meU/U ratio than the wildtype animals. The difference was also significant, but less prominent, in
males (+14%). The ratio of ΨU/U in Fto-/- animals compared to their wildtype littermates was
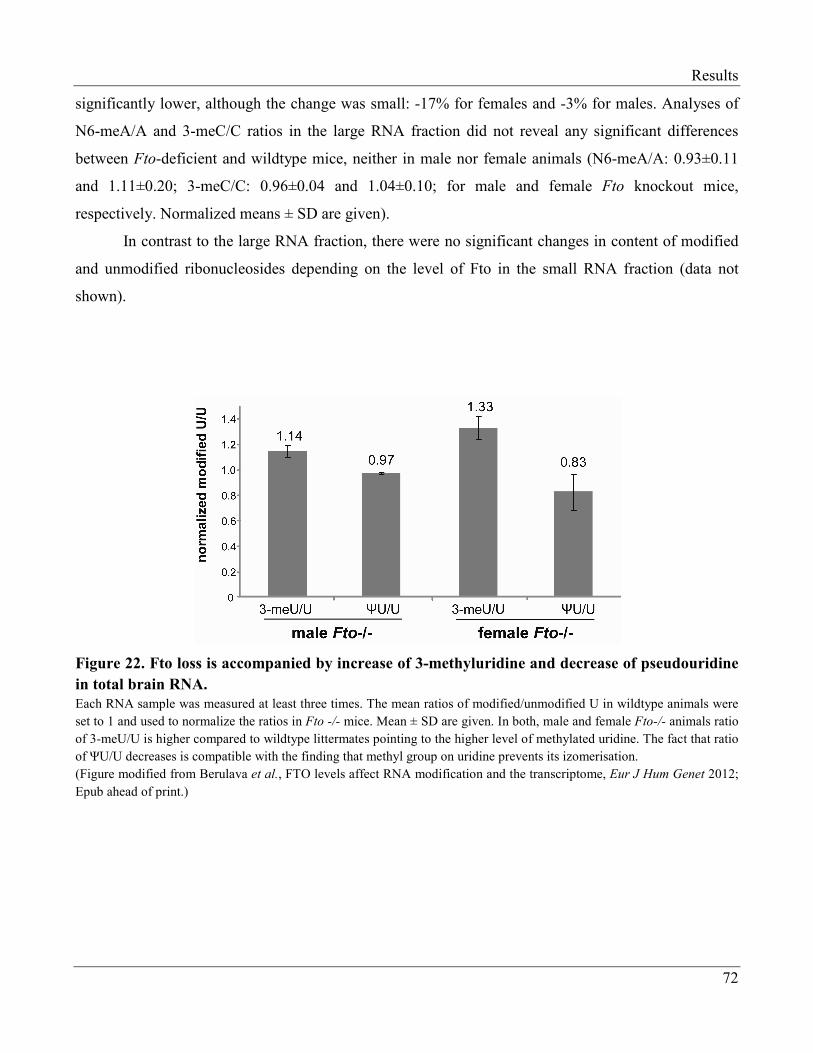
Results
72
significantly lower, although the change was small: -17% for females and -3% for males. Analyses of
N6-meA/A and 3-meC/C ratios in the large RNA fraction did not reveal any significant differences
between Fto-deficient and wildtype mice, neither in male nor female animals (N6-meA/A: 0.93±0.11
and 1.11±0.20; 3-meC/C: 0.96±0.04 and 1.04±0.10; for male and female Fto knockout mice,
respectively. Normalized means ± SD are given).
In contrast to the large RNA fraction, there were no significant changes in content of modified
and unmodified ribonucleosides depending on the level of Fto in the small RNA fraction (data not
shown).
Figure 22. Fto loss is accompanied by increase of 3-methyluridine and decrease of pseudouridine
in total brain RNA.
Each RNA sample was measured at least three times. The mean ratios of modified/unmodified U in wildtype animals were
set to 1 and used to normalize the ratios in Fto -/- mice. Mean ± SD are given. In both, male and female Fto-/- animals ratio
of 3-meU/U is higher compared to wildtype littermates pointing to the higher level of methylated uridine. The fact that ratio
of ΨU/U decreases is compatible with the finding that methyl group on uridine prevents its izomerisation.
(Figure modified from Berulava et al., FTO levels affect RNA modification and the transcriptome, Eur J Hum Genet 2012;
Epub ahead of print.)
Discussion
73
4. Discussion
In 2007, genome-wide association studies revealed a strong association between a block of
SNPs in intron 1 of FTO, BMI and other obesity-related traits (Dina et al. 2007; Frayling et al. 2007;
Hinney et al. 2007; Scuteri et al. 2007). Since then, this finding has been replicated in children and
adults of many different populations, thereby making the FTO gene the most robust gene for common
obesity characterized to date (Peng et al. 2011; Jacobsson et al. 2012). However, the mechanism by
which obesity-associated variations affect FTO expression is unknown.
During the past five years, great advances have been made in the field of FTO research. In vitro
and in vivo studies have shown that the FTO protein can demethylate single-stranded RNA (Gerken et
al. 2007; Jia et al. 2008; Han et al. 2010), and putative regulators have been suggested for the influence
of the FTO obesity variations on its transcription (Stratigopoulos et al. 2008; Stratigopoulos et al.
2011). Data on FTO/Fto deficiency (Boissel et al. 2009; Church et al. 2009; Fischer et al. 2009; Meyre
et al. 2010) as well as a report on a mouse model overexpressing Fto (Church et al. 2010) have showed
the effects of deregulation of Fto expression. Nevertheless, the biological significance of FTO and the
relevance of its function for body weight regulation remain unrevealed.
To address the questions raised above, the present project was run into two main directions: (i)
expression studies to investigate the link between obesity-associated SNPs and the expression of FTO
and/or other genes, and (ii) functional studies to gain insight into FTO biology.
4.1 FTO Genotype Affects FTO Expression
Since the discovery of obesity-associated SNPs in the FTO gene, the main assumption was that
these variations influence transcription in cis. This is why the genome-wide association studies
reporting the contribution of intronic FTO variations to common obesity were followed by works trying
to establish the link between FTO genotype and the level of mRNA from FTO and/or other genes.
However, none of these works could demonstrate an association between FTO genotype and the level
of FTO mRNA (Kloting et al. 2008; Wahlen et al. 2008; Grunnet et al. 2009; Zabena et al. 2009). In
2008, Klöting et al. and Wahlen et al. reported that there is no association between mRNA levels of
FTO or its neighboring gene RPGRIP1L and the presence of obesity variations in the intron of the FTO
Discussion
74
gene in the adipose tissue (Kloting et al. 2008; Wahlen et al. 2008). Both studies were carried out in
obese and lean participants, and qPCR was used to measure the level of FTO mRNA in samples of
visceral and subcutaneous adipose tissue obtained by needle biopsy. Lappalainen et al. and other group
have demonstrated that there is no link between FTO genotype and FTO expression in various tissues
(Grunnet et al. 2009; Lappalainen et al. 2009). The only work reporting an association of FTO
genotype with expression profile was published in 2010 by Jowett et al. The authors found an
association between the FTO genotype and transcript levels of RBL2, which is located about 270 kb in
5’ direction of FTO, and thus, have suggested interaction at a large genomic distance (Jowett et al.
2010). However, this finding has not been replicated and to date there are no data linking FTO
genotype to the expression levels of FTO and/or any other gene(s).
In general, studies on cis-regulatory effects on gene transcription in humans are hampered by
the fact that the tested individuals unavoidably differ in genetic background, age, life events and
environmental exposure. In order to detect subtle differences in transcript levels, a very large numbers
of individuals would have to be tested. These circumstances can be avoided by determining the ratio of
allelic transcript levels in heterozygous individuals, where each allele serves as an internal control for
the other and all possible interfering factors are ruled out (Yan et al. 2002; Lo et al. 2003; Pastinen et
al. 2004; Serre et al. 2008; Kanber et al. 2009). The use of this approach, which actually needs only
few subjects, allowed to precisely evaluate allelic expression patterns of the FTO and its neighboring
genes RPGRIP1L and RBL2.
The risk allele of FTO was shown to give more primary transcripts than the non-risk allele in
white blood cells, with about 40% more transcripts from the risk allele (Berulava and Horsthemke
2010). This phenomenon was also true for different cell types, in particular for fibroblasts,
lymphoblastoid cells, SGBS preadipocytes and differentiated SGBS adipocytes (Wabitsch et al. 2001;
Fischer-Posovszky et al. 2008). The degree of skewing of allelic FTO expression was almost the same
in all cells, suggesting that most of the variation in FTO expression is due to cis-regulatory variants in
intron 1. The observed skewing cannot be due to the presence of gDNA in hnRNA preparations,
because there was no evidence for gDNA contamination. Even if there were DNA contamination,
allelic PCR products from gDNA would be present in equal amounts and would have scaled down the
observed skewing in allelic expression, rather than increase it. In such a case, one would expect an even
more prominent imbalance between the transcripts of the risk and non-risk alleles of FTO. It is highly
unlikely that the skewing is a technical error, since the very same approach was used for TCF7L2,
Discussion
75
which showed equal levels of allelic transcripts. The TCF7L2 gene is another important finding from
the genome-wide association studies with its intronic SNP rs7903146, which is associated with type 2
diabetes (Helgason et al. 2007). Apparently, TCF7L2 shows tissue-specific allelic expression. As
reported by Gaulton and colleagues in 2010, rs7903146 is located in pancreatic islet-selective open
chromatin, and shows higher enhancer activity with its risk allele in β-cell lines (Gaulton et al. 2010).
The ubiquitous expression of FTO implies a more fundamental cellular regulation of its expression,
which might be considered as an argument for the observed skewing in the same direction and to the
same degree in different cell types.
The determination of allelic expression with intronic SNPs gives very similar estimates to those
obtained with exonic SNPs (Serre et al. 2008). Hence, one can assume that more hnRNA transcripts are
derived from the risk allele and processed into mRNA, leading to more FTO mRNA in the end. The
lack of an expressed SNP did not allow to verify experimentally whether this is the case. Higher
mRNA levels might translate into higher protein levels, but of course, proving such an assumption on
the protein level is even more challenging. Since allelic bias was already detectable on hnRNA level, it
is likely that more primary transcripts from the risk allele are a consequence of the higher rate of
transcription, rather than altered stability/processing of the generated RNA.
Since the association between the FTO locus and obesity was first reported, there has been a
debate whether the accused gene was the FTO, or in fact RPGRIP1L, the gene encoding retinitis
pigmentosa GTPase regulator-interacting protein 1-like protein (Frayling et al. 2007). RPGRIP1L
shares a CpG island with FTO and is transcribed in the opposite direction, suggesting that the two
genes are co-regulated. The RPGRIP1L protein is located in the basal bodies of cilia in the retina, brain
and kidney (Arts et al. 2007; Zhu et al. 2009). Loss-of-function mutations in RPGRIP1L cause Joubert
syndrome type 7 with mid-hindbrain malformation and developmental delay or lethal Meckel
syndrome type 5 (Delous et al. 2007). The RPGRIP1L protein is a member of the hedgehog pathway,
playing a role in developmental processes during the embryogenesis (Vierkotten et al. 2007). FTO and
RPGRIP1L are ubiquitously expressed and show similar expression profiles in fetal and adult tissues
(Frayling et al. 2007; Stratigopoulos et al. 2008). The first report that FTO and RPGRIP1L are co-
regulated appeared in 2008 by Stratigopoulus and colleagues. The main finding was that the A risk
allele of the obesity-associated FTO SNP rs8050136 preferentially binds the transcription factor
CUTL1 in human fibroblast DNA, and that an siRNA knock-down of CUTL1 by 70% decreased FTO
and RPGRIP1L expression by 90% and 65%, respectively (Stratigopoulos et al. 2008). In 2010, the
Discussion
76
same group published results of their further investigation of the mechanisms how CUTL1 regulates
the FTO/RPGRIP1L expression (Stratigopoulos et al. 2011). Experiments were conducted in neurons
(N41 mouse hypothalamic cells, N2a neorblastoma cells and arcuate hypothalamic neurons of
C57BL/6 mice). The authors claimed that the two isoforms of CUTL1, P200 and P110 are
characterized by preferential binding at risk and non-risk alleles of rs8050136, respectively. In
particular, P200 binds to the A risk allele of rs8050136 acting as a repressor of FTO expression, and
fails to bind to the C non-risk allele of the variation. On the other hand, P110 functions as an activator
of FTO and RPGRIP1L through binding to the C non-risk allele of rs80580136. As stated by
Stratigopoulos et al., reduced affinity of transcriptional activator P110 to the A risk allele of rs8050136
leads to decreased levels of FTO and RPGRIP1L mRNA, followed by reduced leptin receptor
trafficking to the cilium, and resulting in a diminished cellular response to leptin. Based on these data,
the authors suggest that both FTO and RPGRIP1L participate in control of food intake by modulating
leptin signaling in the arcuate hypothalamic nuclei, and that they are regulated by CUTL1 through its
binding to the risk and non-risk alleles of rs8050136 (Stratigopoulos et al. 2011).
In contrast to the data from the work by Stratigopoulos et al., we could not show any cis-
regulatory effect of the FTO genotype on RPGRIP1L expression. The obesity-associated FTO SNPs
rs9939609 (used in this study) and rs8050136 are in complete LD, and the risk and non-risk alleles are
in phase. Primer extension analyses of blood RNA revealed slight skewing of allelic expression of
RPGRIP1L, but of note, regardless whether tested individuals were hetorozygotes or homozygotes for
the FTO risk and non-risk alleles. Most probably, the observed skewing in allelic expression of
RPGRIP1L is due to some other factors, which are in cis relation with SNP rs4784319. RPGRIP1L
transcription independent of the FTO genotype is consistent with previous studies reporting no
association between RPGRIP1L variation and obesity (Jacobsson et al. 2008). Allelic expression
studies for RPGRIP1L were performed in total blood RNA. CUTL1 is expressed in blood as well
(BioGPS database at http://biogps.org/#goto=welcome), but it is regulated not only through the
cleavage by cathepsin L (Li et al. 2000; Truscott et al. 2007; Wilson et al. 2009). Hence, it is
impossible to predict without any experimental investigation which factors regulate expression of FTO
and RPGRIP1L in blood cells and whether findings with regard to CUTL1 are relevant in this case.
Therefore, data from our project and from the works conducted by the group of Stratigopoulos et al. are
beyond of comparison at the present time.
Discussion
77
In 2010, expression of the retinoblastoma-like 2 gene (RBL2), another gene in 5’ proximity of
the FTO locus, was reported to be affected by the obesity-associated FTO variations. RBL2 is a
member of the retinoblastoma family of tumor suppressor genes, and like RB1, it binds members of the
DNA-binding E2F transcription factor family (Shin et al. 1995). Members of the E2F transcription
factor family are known to regulate transcription of many genes, and thereby, control cell cycle
progression and cellular differentiation. In 2009, the RBL2 gene was shown to be involved in
preadipocyte proliferation and differentiation through differential binding to E2F in the pre-adipocyte
in the quiescent, non-proliferating and differentiated states (Dimas et al. 2009).
The study reporting influence of the FTO obesity-associated variations on the transcript levels
of RBL2 was performed by Jowett and colleagues (Jowett et al. 2010). The aim of the study was the
identification of gene expression patterns influenced by the genomic variants. This correlation was
established between the global gene transcription activity for each individual in a large human cohort
(n=1,240) and genotype data generated from the same individuals. The result of this work was that the
genetic variation at the FTO locus does not influence FTO gene expression levels, but is strongly
correlated with expression of RBL2, hence suggesting interaction at large genetic distances (Jowett et
al. 2010). However, this finding has not been replicated by the authors or others.
Nevertheless, because of this report, the allelic expression pattern of RBL2 was investigated
using the primer extension approach. The ratio of allelic transcripts of RBL2 was measured in
individuals with different FTO genotypes (heterozygotes and homozygotes for the risk and non-risk
alleles at the FTO locus), assuming that if obesity-associated SNPs affected transcription of RBL2 in
cis, one would observe allelic imbalance in FTO heterozygotes, but not in homozygotes. Indeed,
skewed allelic expression in favor of the C allele of rs3929 was revealed for RBL2, but in all
individuals tested (AT, AA and TT at rs9939609, where A represents the risk allele and T the non-risk
allele). It seems that allelic expression of RBL2 is controlled by some other factor(s), which is/are in cis
with rs3929.
In summary, the findings from the allelic expression studies of FTO, RPGRIP1L and RBL2
support the hypothesis that the obesity-associated variations within the intron 1 of FTO serves as a cis
regulatory element for FTO itself and has no influence on the expression of the genes in 5’ upstream
region. Moreover, the FTO risk allele was shown to make more primary transcripts than the non-risk
allele. Based on these findings, it can be concluded that (i) the association found between the FTO
Discussion
78
intronic SNPs and body weight is most likely mediated through the function of FTO and (ii) increased
expression of FTO leads to common obesity.
4.2 Overexpression of FTO Causes Obesity
Since 2007, when FTO was first introduced to the field of obesity genetics by genome-wide
association studies, there has been debate whether loss- or gain-of function leads to a higher BMI. The
finding from this work that the allele carrying the risk variants makes more FTO transcripts led to the
suggestion that increased (rather than decreased) expression of FTO (and not other gene(s)) results in
increased BMI and other obesity-associated traits. This is further supported by the studies of human
and murine FTO/Fto described in the following.
Two mouse models for Fto deficiency have been described: a Fto-/- knockout mice completely
lacking expression of the Fto protein (Fischer et al. 2009), and mice with a partial loss-of-function
mutation leading to a reduced level of Fto protein (Church et al. 2009). The Fto-/- knockout mouse was
reported in 2009, and is characterized by postnatal growth retardation, decreased fat and lean body
mass, increased metabolic rate, relative hyperphagia and reduced spontaneous locomotion. Although
there were no other gross developmental abnormalities, postnatal death was more frequent in these
mice. Fto-/- knockout mice have 30-40% reduced body weight compared to their wildtype littermates.
Additionaly, Fto-/- knockout animals were resistant to obesity induced with a high-fat diet (Fischer et
al. 2009).
A slightly different phenotype was described for mice segregating a missense mutation in exon
6 of the Fto gene (Church et al. 2009). A single base substation resulted in a change in the amino acid
sequence from isoleucine to phenylalanine at position 367 (I367F), causing reduced expression levels
and decreased catalytic activity. Retained function of the I367F Fto protein might be an explanation for
the different/milder phenotype from that of the Fto-/- knockout mice. More precisely, in Fto mutant
mice, growth reduction starts later when animals are mature, and only in males. They can gain weight
on a high-fat diet, although much slower than their wildtype littermates. There is no evidence for
growth retardation and a higher rate of postnatal mortality in I367F mice, and there is no difference in
food intake between healthy mice and those carrying the point mutation (Church et al. 2009). In
summary, Fto I367F mutants show a milder phenotype than Fto-/- knockout mice. Furthermore, data
Discussion
79
from these two models indicate that disruption of the Fto protein is enough to protect from obesity.
Another important hypothesis that emerged from these works is that the association established in
humans between the SNPs in the intron 1 of FTO and obesity is mediated through the functional effects
of FTO rather than through other genes in the region.
This hypothesis was further strengthened by the mouse model overexpressing the Fto gene. In
2010, Church et al. created mice that ubiquitously expressed one or two additional copies of the Fto
gene. These animals displayed a dose-dependent increase in body weight and food intake, regardless
whether they were on a standard or a high-fat diet. Additionally, when Fto overexpressing mice were
fed with a high-fat diet, they developed glucose intolerance (Church et al. 2010). Importanlty, the
authors introduced Fto cDNA into the murine genome, thus providing the strongest evidence for our
initial hypothesis that (i) it is the FTO gene that accounts for body weigh regulation, and (ii)
overexpression of FTO leads to obesity.
Animal models are very useful tools to explore the gene function, but they do not necessarily
reflect the situation in humans. In 2009, Boissel et al. published a report about a large Palestinian Arab
consanguineous family segregating a loss-of-function non-synonymous mutation leading to a change
from arginine to glutamine at position 316 (R316Q) in the FTO protein (Boissel et al. 2009). This
amino acid substitution does not influence the nuclear localization of the protein, but R316Q FTO
completely lacks catalytic activity. Affected members of family suffer from a previously unreported
polymalformation syndrome, which includes severe postnatal growth retardation, psychomotor delay,
functional brain deficits and characteristic facial dysmorphism. In homozygotes, death from
intercurrent infection or an unidentified cause occurred within 2.5 years of age. Heterozygotes for this
mutation are not clinically overweight/obese (Boissel et al. 2009). In contrast, a female patient
harboring a small chromosomal duplication including the FTO gene was described in 2010 (van den
Berg et al. 2010). Partial trisomy at 16q led to a 1.5-fold increase of FTO copy number in gDNA, but
apparently did not result in a change in FTO transcript levels. Intriguingly, the patient’s clinical signs
included obesity on top of moderate to severe brain and developmental abnormalities (van den Berg et
al. 2010). Another interesting study conducted by Mayere et al. evaluated the prevalence of non-
synonymous FTO mutations in lean and severely obese individuals (Meyre et al. 2010). The aim was to
identify FTO mutations enriched in one group only. The outcome of this work was that the frequency
of missense mutations (in heterozygous form) found in both groups, as well as the total number of
mutations found exclusively in one group, was not different between the lean and obese individuals.
Discussion
80
Thus, loss of one functional FTO copy appears to be compatible with both a lean and an obese
phenotype and implies that haploinsufficiency of FTO does not completely protect against obesity
(Meyre et al. 2010). Additionally, obesity in humans is a consequence of rather complicated behavior
affected by multiple factors that are not easy to control, which may only be avoidable by using a cohort
with a very large number of participants.
Taken together, data from our project and those from different studies carried out on human and
murine FTO/Fto suggest that overexpression of FTO leads to obesity. Consequently, the gain-of-
function effect for the FTO risk allele is highly conceivable.
4.3 Transcriptional Regulation of FTO
Assessment of the impact of the intronic FTO variations on FTO transcription is very
challenging, and the identification of the causal variants is even more so. Increased expression of the
risk allele, as shown in this study, is compatible with a role of CUTL1 in activating FTO, in particular
by its proteolytic cleavage product P110, as suggested by Stratigopoulos et al. (Stratigopoulos et al.
2008; Stratigopoulos et al. 2011). Of course, other transcriptional activators may also play a role.
Prioritization of the obesity-associated SNPs with an in silico approach followed by experimental
validation with EMSA pointed to a complex regulation of FTO gene expression. This implies that risk
and non-risk alleles of different SNPs are able to bind proteins either exclusively or with different
affinity and depending on cell type. It might be that not a single SNP is responsible for the observed
association between the intronic variants of the FTO gene and its skewed expression, but rather a
combination of several of them. The tight LD relationship between obesity-associated SNPs in
Caucasians made it even more difficult to narrow down to the causative variant(s). For the
characterization of obesity-associated SNPs in this study I compared LD blocks and their structures for
the particular FTO region in Caucasians and Africans. It is very likely that extension of such a study to
further populations (where LD relationships are not the same between polymorphisms within the intron
1 of the FTO gene) might further help with identification of causative SNP(s), especially as association
studies have meanwhile been conducted in many different populations (Jacobsson et al. 2012). The full
analyses of data and review of works repeatedly demonstrating a link between FTO variations and
obesity in a wide range of populations shows that sometimes one SNP that is associated with obesity in
Discussion
81
one population does not appear to be associated with obesity in another population (Peng et al. 2011;
Jacobsson et al. 2012). Comparison of FTO LD blocks between these populations will further promote
efforts to find the mechanism by which intronic FTO variation affects FTO expression, such as
causative SNP(s) and its/their interacting partner(s).
As a part of expression studies, 270 known transcription factors were screened to identify
regulators of FTO gene expression. The qPCR assay designed for FTO and GAPDH (as reference) was
applied to ready-to-use PCR arrays, which contained cDNA prepared from RNA from the MCF-7 cells
treated in advance with transcription factor-specific siRNAs. The design of experiment allowed
identification of the negative and positive regulators of FTO expression, since reduced level of FTO
mRNA characterized the transcription factor as a positive regulator, whereas increased expression of
FTO in the absence of the given transcription factor pointed to its repressive function. Unfortunately,
CUTL1, which is the only experimentally characterized regulator of FTO expression to date
(Stratigopoulos et al. 2008; Stratigopoulos et al. 2011), was not included in these arrays.
Screening of transcription factors identified those regulating FTO gene expression. In the next
step, factors dramatically and/or moderately affecting expression of the FTO were sorted to find those
with putative binding sites (experimentally validated or computed, from ENCODE project or Biobase,
respectively) in the region of the FTO gene harboring obesity-associated variations. Binding sites for
FOXO1 and REL in the FTO sequence containing obesity-associated SNPs were computed by Transfac
Matrix Database created by Biobase (http://www.biobase-international.com/). Both factors were
identified as repressors of FTO expression, since their deficiency induced 193% and 66% more FTO
transcripts, respectively. Two independent binding sites were found for FOXO1 on the minus strand,
and a single site on the plus strand for REL. Data from GeneAtlas U133A (gcrma dataset) showed that
neither of these genes is expressed in brain, where FTO expression is the highest. Interestingly, a
moderate expression of FOXO1 and REL is found in adipose tissue (source
http://biogps.org/#goto=search).
FOXO1, together with other members of the Forkhead transcription factor family, is known to
regulate expression of genes involved in autophagy, DNA damage repair, apoptosis, cell
differentiation, cell cycle progression and glucose metabolism (Zhang et al. 2002; Lam et al. 2006; Wu
et al. 2012). Apparently, FOXO1 is a repressor of the FTO gene, since its knockdown in MCF-7 cells
induces an almost 3-fold increase in FTO transcripts. A moderate increase (about 60%) in FTO mRNA
resulted from the REL deficiency in the same cell line. The REL gene encodes the transcription factor
Discussion
82
c-Rel, which is a member of the Rel/NFKB family. Expression of REL is linked to endoplasmic
reticulum stress, apoptosis and autophagy (Valentin-Acevedo et al. 2011). There is no SNP in the
putative binding sites for the FOXO1 and REL in the FTO gene. Of course, transcription factors
identified from this screening do not necessarily have to bind to the region of FTO with obesity-
associated SNPs. All these transcription factors might exert their effect by acting on the promoter or
any other regulatory element of FTO. Additionally, it might be that there are some intermediates
between the identified factors and the regulation of FTO expression. The strongest reduction of the
FTO mRNA level was observed when different members of mediator complex, like MED24 and
MED16, were knocked down. PPARA and its stimulator PPARGC1B appeared to be positive FTO
regulators, and MED24 has recently been described as a PPARA-interacting cofactor (Ge et al. 2008;
Pyper et al. 2010). PPARA and PPARGC1B are well known for their crucial role in the lipid
catabolism. These genes also affect the expression of target genes related to cell proliferation, cell
differentiation and immune and inflammation responses (Lefebvre et al. 2006; Haemmerle et al. 2011;
Norrbom et al. 2011; John et al. 2012). YY1 and CLOCK were identified as major repressors of FTO
expression in MCF-7 cells. CLOCK, which encodes a transcription factor and a DNA-binding histone
acetyltransferase, regulates circadian rhythm and metabolism (Hussain and Pan 2012). YY1 is a
ubiquitous transcription factor that is involved in a broad spectrum of cellular processes (Gordon et al.
2005). Different members of the Forkhead transcription factor family (FOXO1, FOXM1, FOXK2)
appeared to repress transcription of FTO as well. This family is characterized by the presence of a
highly conserved forkhead domain, which has a winged-helix motif and DNA binding activity.
Members of this family are involved in many cellular processes during embryogenesis, differentiation
and tumorigenesis (Lam et al. 2006). FOXO1 has been recently described to play a role in diabetes-
induced oxidative stress and to be able to mediate cellular response to it (Subauste and Burant 2007).
4.4 Consequences of Altered FTO Levels
In the second part of this project, functional studies addressing the FTO biology were brought
into focus. To gain insight into FTO function, consequences of its altered levels were investigated in
human cells and murine brain. In 2010, Wu et al. published a study suggesting that FTO might be a
transcription factor (Wu et al. 2010). Additionally, in vitro and in vivo studies have shown that FTO
Discussion
83
can demethylate single stranded DNA and RNA, but prefers RNA (Gerken et al. 2007; Jia et al. 2008;
Jia et al. 2011). Interestingly, other members of the family FTO belong to – the non-heme Fe(II)- and
α-ketoglutarate-dependent oxygenase superfamily, namely TET1, TET2 and TET3 are known to
demethylate DNA through oxidation of 5-methyl-desoxycytidine to 5-hydroxy-methyl-desoxycytidine
(Cimmino et al. 2011; Guo et al. 2011; Tan and Shi 2012). Because of these facts, it seemed reasonable
to evaluate the effect of increased and decreased FTO levels on the transcriptome. Additionally,
methylation analyses were performed on total brain RNA from Fto-/- knockout mice (Fischer et al.
2009), since the methylation changes were expected to be more prominent with complete lack of Fto
protein.
In order to address the points raised above, FTO was overexpressed and knocked down in
cultured cells, and the steady state levels of mRNAs were examined. In HEK293 cells, the
overexpression of FTO predominantly changed the mRNA levels of genes that are involved in RNA
processing and metabolism, whereas FTO knock-down changed the mRNA levels of genes involved in
cellular response to starvation. The majority of genes (95% of probe sets) in the FTO overexpression
experiment showed increased transcript levels, whereas the majority of genes reacting to FTO
deficiency displayed reduced transcript levels (87% of probe sets) (Appendix, sections 7 and 9).
It is difficult to identify the reason why the observed changes occurring in the transcriptome
depend on the level of FTO, since we measured steady state levels of transcripts. In general, changed
transcript levels can result from changed rates of RNA transcription, processing or degradation. Wu et
al. have suggested that FTO might serve as a transcription factor (Wu et al. 2010). Although this
possibility cannot be completely ruled out, it is very unlikely, because (i) FTO is an enzyme, (ii)
overexpression of FTO had little effects on the transcriptome after 24 hours (data not shown), (iii) the
observed fold changes after 48 hours were rather small (although they were significant), and (iv) if
FTO were a transcription factor, one would expect more drastic effects in case of FTO abundance. If an
effect of altered FTO levels on transcription rates does exist, it is very likely to be indirect. An indirect
effect means that a change in FTO levels disturbs the cellular system and elicits evasive or
compensatory mechanisms through autoregulatory feedback loops.
There are good arguments why altered levels of FTO might affect RNA processing and
stability, and why it induces changes in transcript levels of genes important for RNA biology. FTO has
been reported to demethylate single stranded RNA in vitro and in vivo (Gerken et al. 2007; Jia et al.
2008; Jia et al. 2011; Meyer et al. 2012). The biological significance of RNA methylation is not
Discussion
84
completely understood, but the well-described fact that different modifications are of site-specific
localization implies their important biological role (Dominissini et al. 2012; Meyer et al. 2012). It is
very likely that these modifications affect RNA structure, stability, accessibility to binding factors
and/or processing. It might be that these modifications influence nuclear retention of transcripts and/or
localization of mature mRNAs within the cell. The latter allows regulation of protein synthesis at high
speed in response to cellular demand (Besse and Ephrussi 2008; Paquin and Chartrand 2008).
Recent studies have found that FTO can demethylate N6-methyladenosine (N6-meA) (Jia et al.
2011; Meyer et al. 2012). In 2012, Dominissini et al. mapped 6-meA in mRNA, showing that it is
present in the regions around stop codons and within long internal exons and that FTO could possibly
affect alternative splicing by demethylation of RNA (Dominissini et al. 2012). Interestingly, these sites
appeared to be highly conserved between humans and mice. Additionally, the authors demonstrated
that the level of 6-meA affects RNA splicing, and suggested that it might be that presence of this
modification close to stop codons influences translational efficiency (Dominissini et al. 2012). Hence,
the finding of this thesis that overexpression of FTO on cellular level resulted in increased transcript
levels of genes involved in RNA splicing, could be interpreted as a cellular response to the changed
level of N6-meA in the mRNA pool. Another important study published recently has reported mainly
the same results as Dominissini et al. regarding the topology of N6-meA within the mRNA molecule
(Meyer et al. 2012). An additional finding was the association between N6-meA residues and miRNA
binding sites within the 3‘UTR. Interestingly, in this study, knockdown of FTO induced decreased
levels of mRNA from genes that are known targets for miRNAs (Tan et al. 2009; Piskounova et al.
2011; Yan et al. 2011; Zhu et al. 2011; Lu et al. 2012).
Higher FTO levels led to higher levels of transcripts in 95% of probe sets, whereas FTO
deficiency led to decreased levels of transcripts in 87% of probe sets (Berulava et al. 2012). This
finding might reflect a changed rate of transcript degradation, possibly as a consequence of altered N6-
meA levels. For example, MALAT1, the long non-coding RNA that is involved in regulation of the
alternative splicing (Tripathi et al. 2010) and is associated with nuclear speckles harboring FTO (Jia et
al. 2011; Berulava et al. 2012) has been reported to have a high degree of N6-methyladenosine (Meyer
et al. 2012). In cells overexpressing FTO, there was a slight trend towards increased MALAT1
transcripts, whereas cells lacking FTO showed a significant reduction of MALAT1 transcripts.
Taken together, the findings from the recent studies and data from this project suggest that the
steady state levels of different transcripts may be controlled by FTO-dependent demethylation. The
Discussion
85
milder effects seen in the FTO overexpressing cells (the increase in transcript levels was mostly just
above the qPCR detection limit) could be explained by a sort of saturation effect. In other words, given
the high endogenous level of FTO, further increase of FTO expression would not have caused very
drastic changes on the transcript level.
The overexpression of Fto in mice affects body weight only (Church et al. 2010), whereas a
complete loss and loss-of function mutations in mice (Church et al. 2009; Fischer et al. 2009) and
humans (Boissel et al. 2009) did not only result in reduced body weight, but also in other
complications. Thus, the finding that the knockdown of FTO affected the mRNA levels of other genes
may not be too surprising. When analyzing the list of probe set with changed values upon reduction of
the FTO level, significant changes were found in the GO subcategory: “cellular response to starvation”.
Interestingly, it has recently been reported that the expression of FTO itself is regulated by the
nutritional state of the cell (Cheung et al. 2012). In particular, FTO mRNA and protein have been
shown to decrease in response to essential amino acid starvation. The GO subcategory “cellular
response to starvation” includes genes related to autophagy (for example ATG5 and BECN1). Several
links between body weight regulation and autophagy in liver, adipose tissue and hypothalamic cells
have recently been established (Zhang et al. 2009; Rabinowitz and White 2010; Kaushik et al. 2011).
We could not verify the reduced transcript levels of the ATG5 gene by qPCR, but the possible link
between autophagy and FTO function may merit further examination. In view of the link between
autophagy and ciliary function, which are both regulated by mTOR signaling and its upstream TCS
regulator (Huber et al. 2011), it has to be mentioned that overexpression and depletion of FTO affected
transcript levels of several genes that are involved in ciliary function (indicated by an * in the
Appendix, sections 7 and 9).
Why FTO deficiency leading to more methylated nucleotides in RNA molecules would cause
changes in transcripts from genes related to cellular response to starvation is difficult to interpret and
needs further, more careful, investigations. There are only five probe sets out of 187 grouped under the
GO subcategory “cellular response to starvation”. Although others did not appear to be enriched at any
GO subcategory, it is very intriguing that majority of them (87%) showed decreased levels upon FTO
knockdown. As mentioned above, it is reasonable to suppose that the lack of FTO contributes to half-
life of RNAs through affecting the level of modifications in miRNA binding sites. For example, the
level of transcripts from the LIN28B gene, which regulates biogenesis of let-7 miRNAs and is regulated
by its own by the same miRNAs (Piskounova et al. 2011), is reduced by almost 50 % in FTO
Discussion
86
knockdown cells. It is not known whether LIN28B transcript is enriched with any modifications. The
GNG12 and RAB12 genes, transcripts from which also were found to be decreased by about 40% in
case of FTO deficiency, have been recently reported to be a target for different miRNAs (Tan et al.
2009; Zhu et al. 2009; Yan et al. 2011; Lu et al. 2012). These genes were chosen to verify microarray
results without knowing that they are targets for miRNAs and that N6-meA are found at miRNAs
binding sites. So, if transcripts from the LIN28B, GNG12 and RAM12 genes contained N6-meA in their
miRNAs binding sites in 3’UTR, one would think that in case of reduced FTO level, more adenosine
stayed methylated. One could further speculate whether methylated ribonucleosides mediate target
recognition/degradation by miRNAs or reduces binding of protective factors.
4.5 Subcellular Localization of FTO
Surprisingly, immunostaining of the FTO protein in FTO overexpressing cells revealed a very
distinctive, dot-like distribution pattern within the nucleus. The initial aim was to check whether
overexpressed protein retained its nuclear localization. The subsequent subcellular localization studies
demonstrated that FTO is present in different nuclear spots relevant for RNA processing, in particular
in nuclear speckles and to a lesser and varying extent in the nucleoplasm and nucleoli (Berulava et al.
2012).
Nuclear speckles are known as spots for the storage/modification of pre-mRNA splicing factors.
Moreover, they contain different transcription factors, 3’-end RNA processing factors, translation
regulation factors and the large subunit of RNA polymerase II (Spector and Lamond 2011; Tripathi et
al. 2012). The finding from this study is consistent with the report by Jia et al., who have also shown
that the inhibition of transcription changes the nucleoplasmic distribution of FTO becomes more
concentrated at nuclear speckles (Jia et al. 2011). Nuclear speckles on their own react to inhibition of
transcription by getting fewer and more concentrated (by fusing to each other). Hence, it is difficult to
say whether inhibition of transcription itself or passive movement of FTO to the nuclear speckles
serves as a driving force for FTO relocation.
Because FTO has the ability to move within the cell depending on different factors, the next
idea was that it might be postranslationally modified. This work is far from being complete, and only
preliminary experiments with 2D electrophoresis have been performed. Nevertheless, at least two
Discussion
87
different populations of FTO protein were observed on the blots, the biggest one called “major” and
others “rest”. Upon inhibition of transcription with Actinomycin-D, the ratio between the “major” and
“rest” spots changed (see Appendix, section 12). Future studies will provide more information about
posttranslational changes of FTO and the ways of its regulation. Another argument that the FTO
distribution in cells depends on cellular state is the observation made in this study and others that
different cells with different potentials of proliferation/transcription are characterized by distinctive
patterns of nuclear FTO staining (Jia et al. 2011; Berulava et al. 2012).
4.6 RNA Methylation Analysis
Apart from in nuclear speckles, FTO was also identified in nucleoli, which are the major
machinery for rRNA transcription and procession (Shaw and Brown 2012). The presence of FTO in
nucleoli supports the idea that FTO is involved in rRNA modification. A number of modifications in
different rRNAs are well-described, although their importance often remains elusive (Czerwoniec et al.
2009; Motorin and Helm 2011; Yi and Pan 2011). In fact, the RNA methylation analyses in this study
showed that the ratio of 3-meU/U in total RNA from brain of Fto-/- mouse is increased compared to
wildtype animals. In other words, in the absence of Fto, RNA contained more methylated uridine
relative to unmodified uridine. Since this experiment was performed using total RNA, which consists
mainly of rRNA, it is very likely that the observed changes mainly reflect changes in the modification
of rRNA. In vitro studies have described 3-meU as a preferred substrate of FTO (Gerken et al. 2007;
Jia et al. 2008), and the results of this study are in line with this. In the large RNA fraction, no
significant changes were observed in the N6-meA/A and 3-meC/C ratios, which were included in
experiments because of works describing them as another substrate for FTO (Gerken et al. 2007; Jia et
al. 2008; Jia et al. 2011; Meyer et al. 2012). This may be due to the fact that N6-meA and 3-meC are
poor substrates of FTO (Gerken et al. 2007), or that the RNA molecules containing these modifications
are underrepresented in total RNA preparations, so that the changes are below the detection level of the
method. In fact, different groups have recently shown that the content of N6-meA in the mRNA
fraction (depleted from rRNAs) depends on the level of FTO, and that N6-meA also is a substrate for
FTO (Jia et al. 2011; Meyer et al. 2012). Taken together, the present study and the studies by Ji et al.
(Jia et al. 2011) and Meyer et al.(Meyer et al. 2012) suggest that FTO has multiple RNA substrates.
Discussion
88
In Fto-deficient mice, a decreased ratio of ΨU/U was observed. It has been shown that 3-
methylation of uridine inhibits its H/ACA snoRNA-guided isomerization into psesudouridine (Zhou et
al. 2010). Hence, the observed decrease in the ΨU/U ratio in Fto-deficient mice is in line with the
increased 3-meU/U ratio. This means that in absence of Fto more uridine stays methylated and is
thereby prevented from isomerization. Pseudouridine has recently been reported to affect translation
efficiency (Jack et al. 2011), and ribosomal activity has been linked to obesity (Estornell et al. 1995).
Another interesting study has demonstrated that pseudouridylation of the spliceosomal small nuclear
RNA (snRNA) U2 is affected by nutrition (Wu et al. 2011). Pseudouridines in spliceosomal snRNAs
are generally clustered in regions that are functionally important during splicing (Yu et al. 2011). The
small RNA fraction investigated in this study revealed no changes in uridine modifications. The
protocol for small RNA preparation did not contain any step for removal of tRNAs, and thus, probably
leads to their enrichment. So, it might be that changes affecting snRNAs may have gone undetected.
In summary, the present work showed for the first time that obesity-associated variations within
intron 1 of FTO affects its transcription, thereby providing evidence that FTO itself regulates body
weight. Furthermore, the finding that the FTO risk allele makes more transcripts prompted the
hypothesis that it is overexpression of FTO that causes obesity (Berulava and Horsthemke 2010). This
hypothesis was nicely supported by three different mouse models (Church et al. 2009; Fischer et al.
2009; Church et al. 2010). Cells with higher amounts of FTO appear to change the transcript levels of
genes involved in RNA metabolism, but the link to FTO function, RNA biology and body weight needs
to be explored further. Altered FTO/Fto levels were shown to affect different modifications (N6-meA,
3-meU and, indirectly, ΨU) in different classes of RNA (mRNA and most likely rRNA). Upon FTO
knockdown, a different set of genes changes transcript levels, which is in line with observation that
lack of FTO/Fto is associated with much more traits than leanness only. Although the mechanism by
which FTO is regulated and the FTO protein contributes to body weight remains unrevealed and to be
solved, the present study added important pieces of information to the knowledge about FTO.
4.7 Relevance of FTO for Obesity
Although many questions concerning FTO have been addressed, it is still unclear how FTO
regulates body weight and through which cell type FTO exerts its effect. This study showed that allelic
Discussion
89
expression of FTO is skewed in favor of the risk allele in cells most likely non-relevant with regard to
body weight regulation: white blood cells, fibroblasts and lymphoblastoid cells (Berulava and
Horsthemke 2010). More interestingly, allelic imbalance of FTO to the almost the same degree was
revealed in preadipocytes and differentiated adipocytes, which are cells of primary importance for body
weight regulation (Wabitsch et al. 2001; Fischer-Posovszky et al. 2008). The fact that more transcripts
are made from the FTO risk allele than from the non-risk allele in all investigated cell types led to the
suggestion that FTO overexpression is a cause of obesity.
Given the ubiquitous expression of FTO (Frayling et al. 2007; Stratigopoulos et al. 2008), the
main findings of this study with regard to their relevance for body weight regulation might be seen
from different views. It might be that the level of FTO expression affects the total mRNA pool in a cell,
and thereby, its metabolic state. Glucose consumption and concentration of lactate were measured in
this study, but the products of cell metabolism in the medium did not reveal any difference between
cells with endogenous FTO levels and those overexpressing FTO. However, this possibility cannot be
ruled out as results from cell culture cannot be directly applied to the whole organism. Of course, one
should consider the possibility that FTO acts only on specific subset of RNA. Further experiments
aimed at identification of substrates of FTO would be necessary to determine this.
From the FTO overexpression and knockdown experiments several important findings were
made. First, higher levels of FTO induced an increase in steady state levels of transcripts of affected
genes, whereas cells responded to the lack of FTO by decreased transcript levels from the affected loci
(Berulava et al. 2012). As FTO has the ability to demethylate N6-meA in mRNA (Jia et al. 2011;
Meyer et al. 2012) and, as shown in this study, also demethylate 3-meU in most likely rRNA, it is
tempting to speculate that the level of methylation of RNA determines its half-life (possibly through
regulation by RNA-binding proteins and miRNAs), and hence, influences the cellular need for
transcription. Transcription is one of the most energy-consuming cellular processes. Assuming that a
higher level of FTO in cells decreases the rate of transcription (because transcripts became more
stable), excess energy would be expected, possibly leading to obesity. In case of FTO deficiency, this
would account for the increased transcriptional rate and increased demand in energy.
Second, gene set enrichment analyses revealed overrepresentation of genes involved in RNA
splicing/metabolism among those affected by FTO overexpression (Berulava et al. 2012). How the
change of these transcripts is linked to increased body weight is unclear, as well as why exactly
members of this biological group reacted to increased FTO levels. However, these results make it
Discussion
90
feasible that the effect of FTO on body weight regulation is mediated through the RNA metabolism.
The influence of FTO on body weight through increased levels of mRNA of genes functioning in the
RNA processing machinery could be specific or general. A specific action of FTO might imply that
altered processing/splicing of a transcript or a set of transcripts is involved in the regulation of body
weight. In contrast, the general way of impact of FTO on BMI might be to determine the metabolic
state of cell by broadly affecting RNA metabolism/splicing. These thoughts might be relevant to
determine the physiological role of FTO. In the overexpressing cells in this study, the level of FTO was
increased up to 5-fold (based on semiquantitatve western blot analyses), whereas primer extension
analyses led to the discovery that the risk allele of the FTO gene makes about 40% more transcripts. It
is challenging to try and to apply findings from cultured cells to the whole organism. Estimation how
big the effect of 40% (or 80% in case of homozygosity) more FTO would be is difficult, if not
impossible, especially as the FTO genotype has a very robust, but rather moderate/small effect on the
body weight. We still do not know the cell type where FTO has an effect on body weight regulation. It
might be that imbalance of allelic expression is even more prominent in the “right” (cell types through
which FTO exerts its function) cells.
Third, knockdown of FTO was followed by deregulation of genes involved in “cellular response
to starvation” (Berulava et al. 2012). It is very interesting that from the deregulated genes showing
decreased transcript levels, five grouped under the GO category “cellular response to starvation” under
lack of FTO. Two out these five genes are well-known autophagy-related genes (Mehrpour et al. 2010;
Kang et al. 2011; Yamada and Singh 2012). Again, it is tempting to speculate that FTO deficiency
increases cellular energy demand, and a as consequence, genes relevant for autophagy, the well-
characterized process that regulates food intake and energy balance (Zhang et al. 2009; Rabinowitz and
White 2010; Kaushik et al. 2011), change their transcript levels.
Fourth, Fto knockout mice had higher levels of 3-meU in total RNA from brain. 3-meU has
been detected endogenously in 28s rRNA (Klagsbrun 1973). Additionally, it has been shown that 3-
meU modulates sensitivity of rRNA to chemical cleavage by affecting rRNA structure (Micura et al.
2001; Fan et al. 2003), and thus, might regulate the function and/or half life of rRNA. This, in turn,
may play a critical role in the control of translation, possibly of transcripts from the genes directly
involved in the control of energy balance. A link between the efficiency of translation, ribosomal
activity and obesity has been reported (Estornell et al. 1995). This hypothesis is strengthened by the
finding that besides increased levels of 3-meU, Fto-deficient mice showed decreased level of
Discussion
91
pseudouridine. Pseudouridine is referred to as the fifth base in RNA biology (Motorin and Helm 2011),
and has recently been reported to affect the efficiency of protein biosynthesis (Jack et al. 2011).
The last issue I would like to address is the therapeutic perspective for FTO. The last sentence
of my first paper reporting that the FTO risk allele makes more transcripts suggested that therapeutic
intervention and subtle inactivation of FTO might prevent obesity (Berulava and Horsthemke 2010). Of
course, the most valuable scientific contribution regarding FTO lies in the elucidation of the
physiological pathways that underlie its association with obesity, which might lead to the new
therapeutic drugs. The FTO protein is an enzyme (Gerken et al. 2007; Han et al. 2010), and given the
fact that increased FTO leads to obesity, identification of its inhibitors should not be too difficult (Chen
et al. 2012). However, FTO can modify different classes of RNA (mRNA and probably rRNA) (Jia et
al. 2011; Berulava et al. 2012; Meyer et al. 2012), FTO affects the mRNA levels of genes belonging to
specific functional categories (Berulava et al. 2012), and a wide range of phenotype changes depends
on the level of FTO/Fto (Boissel et al. 2009; Church et al. 2009; Fischer et al. 2009; Church et al.
2010; Gao et al. 2010; Meyre et al. 2010; van den Berg et al. 2010), emphasizing the care which
should be taken in view of drug development. Moreover, it has been shown that the risk of obesity in
individuals carrying obesity-associated FTO SNPs is reduced by physical exercise and a calorie-
restricted diet (Andreasen et al. 2008; Ruiz et al. 2010; Demerath et al. 2011; Kilpelainen et al. 2011;
Phillips et al. 2012). With the consequences of obesity and all the efforts to find ways to avoid it
costing more and more millions for humanity, maybe it is the time to put more emphasis on prevention.
Summary
92
5. Summary
Genome-wide association studies have revealed a strong association between a block of single-
nucleotide polymorphisms (SNPs) in intron 1 of the fat mass and obesity-associated (FTO) gene, body
mass index (BMI) and other obesity-related traits in children and adults of many different populations.
Yet, the function of FTO, its relevance for body weight regulation and its mechanism remain unknown.
Hence, expression studies were performed in this project to investigate the link between obesity-
associated SNPs and expression of the FTO and/or other genes, and functional studies were performed
to gain insight into FTO biology.
Allelic expression studies by primer extension assays were carried out to address the question
whether obesity-associated variation affects transcription of the FTO and /or other genes in cis. It was
demonstrated that the risk allele of FTO makes about 40% more transcripts than the non-risk allele in
the different cell types. Characterization of single polymorphisms with regard to their location and
protein binding activity pointed to a complex regulation of the expression of FTO. This was
strengthened by the fact that the cellular level of FTO mRNA is controlled by a number of transcription
factors. Allelic expression of the neighboring RPGRIP1L and RBL2 was shown to be independent of
the FTO genotype.
To elucidate the function of the FTO protein, effects of its altered levels on the transcriptome
and RNA methylation were investigated. Overexpression of FTO resulted in changes of steady state
levels of genes involved in RNA processing and metabolism, whereas deficiency of FTO led to
alterations in transcripts levels of genes determining cellular response to starvation. Subcellular
localization studies showed that FTO is enriched in nuclear speckles, where RNA splicing factors are
stored and modified, and is present in nucleoli, where ribosomal RNA is transcribed and processed. In
vitro studies have suggested that FTO acts as a nucleic acid demethylase and prefers single stranded
RNA as a substrate. Therefore, the effects of FTO on RNA methylation were investigated. By
comparison of content of modified and non-modified ribonucleosides in total brain RNA of Fto-
deficient and wildtype mice I could show that the level of FTO affects the 3-methyluridine/uridine and
pseudouridine/uridine ratios.
In summary, I could show that increased expression of FTO predisposes to obesity, possibly by
affecting transcriptome and RNA modifications. Further investigations will help to elucidate the link
between FTO function, RNA processing and obesity.
References
93
6. References:
Aas P. A., Otterlei M., et al. (2003). "Human and bacterial oxidative demethylases repair alkylation
damage in both RNA and DNA." Nature 421(6925): 859-863.
Andreasen C. H., Stender-Petersen K. L., et al. (2008). "Low physical activity accentuates the effect of
the FTO rs9939609 polymorphism on body fat accumulation." Diabetes 57(1): 95-101.
Arts Heleen H., Doherty Dan, et al. (2007). "Mutations in the gene encoding the basal body protein
RPGRIP1L, a nephrocystin-4 interactor, cause Joubert syndrome." Nat Genet 39(7): 882-888.
Barrett J. C., Fry B., et al. (2005). "Haploview: analysis and visualization of LD and haplotype maps."
Bioinformatics 21(2): 263-265.
Bell C. G., Finer S., et al. (2010). "Integrated genetic and epigenetic analysis identifies haplotype-
specific methylation in the FTO type 2 diabetes and obesity susceptibility locus." PLoS One
5(11): e14040.
Benedict Christian, Jacobsson Josefin A., et al. (2011). "The fat mass and obesity gene is linked to
reduced verbal fluency in overweight and obese elderly men." Neurobiology of Aging 32(6):
1159.e1151-1159.e1155.
Berulava T. and Horsthemke B. (2010). "The obesity-associated SNPs in intron 1 of the FTO gene
affect primary transcript levels." Eur J Hum Genet 18(9): 1054-1056.
Berulava T., Ziehe M., et al. (2012). "FTO levels affect RNA modification and the transcriptome." Eur
J Hum Genet.
Besse F. and Ephrussi A. (2008). "Translational control of localized mRNAs: restricting protein
synthesis in space and time." Nat Rev Mol Cell Biol 9(12): 971-980.
Boissel S., Reish O., et al. (2009). "Loss-of-function mutation in the dioxygenase-encoding FTO gene
causes severe growth retardation and multiple malformations." Am J Hum Genet 85(1): 106-
111.
Bokar J. A., Shambaugh M. E., et al. (1997). "Purification and cDNA cloning of the AdoMet-binding
subunit of the human mRNA (N6-adenosine)-methyltransferase." RNA 3(11): 1233-1247.
Cantara W. A., Crain P. F., et al. (2011). "The RNA Modification Database, RNAMDB: 2011 update."
Nucleic Acids Res 39(Database issue): D195-201.
Cecil J. E., Tavendale R., et al. (2008). "An obesity-associated FTO gene variant and increased energy
intake in children." N Engl J Med 359(24): 2558-2566.
Chen B., Ye F., et al. (2012). "Development of Cell-active N6-Methyladenosine RNA Demethylase
FTO Inhibitor." J Am Chem Soc.
Cheung M. K., Gulati P., et al. (2012). "FTO expression is regulated by availability of essential amino
acids." Int J Obes.
Church C., Lee S., et al. (2009). "A mouse model for the metabolic effects of the human fat mass and
obesity associated FTO gene." PLoS Genet 5(8): e1000599.
Church C., Moir L., et al. (2010). "Overexpression of Fto leads to increased food intake and results in
obesity." Nat Genet 42(12): 1086-1092.
Cimmino L., Abdel-Wahab O., et al. (2011). "TET Family Proteins and Their Role in Stem Cell
Differentiation and Transformation." Cell Stem Cell 9(3): 193-204.
Cohen R. A. (2010). "Obesity-associated cognitive decline: excess weight affects more than the
waistline." Neuroepidemiology 34(4): 230-231.
Coll A. P., Yeo G. S., et al. (2008). "SnapShot: the hormonal control of food intake." Cell 135(3): 572
e571-572.
References
94
Cornes B. K., Lind P. A., et al. (2009). "Replication of the association of common rs9939609 variant of
FTO with increased BMI in an Australian adult twin population but no evidence for gene by
environment (G x E) interaction." Int J Obes (Lond) 33(1): 75-79.
Crain P. F. (1990). "Preparation and enzymatic hydrolysis of DNA and RNA for mass spectrometry."
Methods Enzymol 193: 782-790.
Czerwoniec A., Dunin-Horkawicz S., et al. (2009). "MODOMICS: a database of RNA modification
pathways. 2008 update." Nucleic Acids Res 37(Database issue): D118-121.
Dai Q., Fong R., et al. (2007). "Identification of recognition residues for ligation-based detection and
quantitation of pseudouridine and N6-methyladenosine." Nucleic Acids Res 35(18): 6322-6329.
Delous Marion, Baala Lekbir, et al. (2007). "The ciliary gene RPGRIP1L is mutated in cerebello-
oculo-renal syndrome (Joubert syndrome type B) and Meckel syndrome." Nat Genet 39(7):
875-881.
Demerath E. W., Lutsey P. L., et al. (2011). "Interaction of FTO and physical activity level on
adiposity in African-American and European-American adults: the ARIC Study." Obesity
(Silver Spring) 19(9): 1866-1872.
den Hoed M., Westerterp-Plantenga M. S., et al. (2009). "Postprandial responses in hunger and satiety
are associated with the rs9939609 single nucleotide polymorphism in FTO." Am J Clin Nutr
90(5): 1426-1432.
Dimas A. S., Deutsch S., et al. (2009). "Common Regulatory Variation Impacts Gene Expression in a
Cell Type-Dependent Manner." Science 325(5945): 1246-1250.
Dina C., Meyre D., et al. (2007). "Variation in FTO contributes to childhood obesity and severe adult
obesity." Nat Genet 39(6): 724-726.
Do R., Bailey S. D., et al. (2008). "Genetic variants of FTO influence adiposity, insulin sensitivity,
leptin levels, and resting metabolic rate in the Quebec Family Study." Diabetes 57(4): 1147-
1150.
Dominissini D., Moshitch-Moshkovitz S., et al. (2012). "Topology of the human and mouse m6A RNA
methylomes revealed by m6A-seq." Nature 485(7397): 201-206.
Dominissini Dan, Moshitch-Moshkovitz Sharon, et al. (2012). "Topology of the human and mouse
m6A RNA methylomes revealed by m6A-seq." Nature advance online publication.
Elias M. F., Elias P. K., et al. (2003). "Lower cognitive function in the presence of obesity and
hypertension: the Framingham heart study." Int J Obes Relat Metab Disord 27(2): 260-268.
Estornell E., Cabo J., et al. (1995). "Protein synthesis is stimulated in nutritionally obese rats." J Nutr
125(5): 1309-1315.
Estornell Ernesto, Cabo José, et al. (1995). "Protein Synthesis Is Stimulated in Nutritionally Obese
Rats." The Journal of Nutrition 125(5): 1309-1315.
Falnes P. O., Johansen R. F., et al. (2002). "AlkB-mediated oxidative demethylation reverses DNA
damage in Escherichia coli." Nature 419(6903): 178-182.
Fan J., Schnare M. N., et al. (2003). "Characterization of fragmented mitochondrial ribosomal RNAs of
the colorless green alga Polytomella parva." Nucleic Acids Res 31(2): 769-778.
Fawcett K. A. and Barroso I. (2010). "The genetics of obesity: FTO leads the way." Trends Genet
26(6): 266-274.
Fischer-Posovszky P., Newell F. S., et al. (2008). "Human SGBS Cells - a Unique Tool for Studies of
Human Fat Cell Biology." Obesity Facts 1(4): 184-189.
Fischer J., Koch L., et al. (2009). "Inactivation of the Fto gene protects from obesity." Nature
458(7240): 894-898.
Fox A. H. and Lamond A. I. (2010). "Paraspeckles." Cold Spring Harb Perspect Biol 2(7): a000687.
References
95
Frayling T. M., Timpson N. J., et al. (2007). "A common variant in the FTO gene is associated with
body mass index and predisposes to childhood and adult obesity." Science 316(5826): 889-894.
Freathy R. M., Timpson N. J., et al. (2008). "Common variation in the FTO gene alters diabetes-related
metabolic traits to the extent expected given its effect on BMI." Diabetes 57(5): 1419-1426.
Fredriksson R., Hagglund M., et al. (2008). "The obesity gene, FTO, is of ancient origin, up-regulated
during food deprivation and expressed in neurons of feeding-related nuclei of the brain."
Endocrinology 149(5): 2062-2071.
Gao X., Shin Y. H., et al. (2010). "The fat mass and obesity associated gene FTO functions in the brain
to regulate postnatal growth in mice." PLoS One 5(11): e14005.
Gaulton K. J., Nammo T., et al. (2010). "A map of open chromatin in human pancreatic islets." Nat
Genet 42(3): 255-259.
Ge K., Cho Y. W., et al. (2008). "Alternative mechanisms by which mediator subunit MED1/TRAP220
regulates peroxisome proliferator-activated receptor gamma-stimulated adipogenesis and target
gene expression." Molecular and Cellular Biology 28(3): 1081-1091.
Gerken T., Girard C. A., et al. (2007). "The obesity-associated FTO gene encodes a 2-oxoglutarate-
dependent nucleic acid demethylase." Science 318(5855): 1469-1472.
Gordon S., Akopyan G., et al. (2005). "Transcription factor YY1: structure, function, and therapeutic
implications in cancer biology." Oncogene 25(8): 1125-1142.
Grant S. F., Li M., et al. (2008). "Association analysis of the FTO gene with obesity in children of
Caucasian and African ancestry reveals a common tagging SNP." PLoS One 3(3): e1746.
Grant S. F., Thorleifsson G., et al. (2006). "Variant of transcription factor 7-like 2 (TCF7L2) gene
confers risk of type 2 diabetes." Nat Genet 38(3): 320-323.
Grunnet L. G., Nilsson E., et al. (2009). "Regulation and function of FTO mRNA expression in human
skeletal muscle and subcutaneous adipose tissue." Diabetes 58(10): 2402-2408.
Guo J. U., Su Y., et al. (2011). "Emerging roles of TET proteins and 5-hydroxymethylcytosines in
active DNA demethylation and beyond." Cell Cycle 10(16): 2662-2668.
Guymon R., Pomerantz S. C., et al. (2007). "Post-transcriptional modifications in the small subunit
ribosomal RNA from Thermotoga maritima, including presence of a novel modified cytidine."
RNA 13(3): 396-403.
Haemmerle G., Moustafa T., et al. (2011). "ATGL-mediated fat catabolism regulates cardiac
mitochondrial function via PPAR-alpha and PGC-1." Nat Med 17(9): 1076-1085.
Han Z., Huang N., et al. (2010). "A loop matters for FTO substrate selection." Protein Cell 1(7): 616-
620.
Han Z., Niu T., et al. (2010). "Crystal structure of the FTO protein reveals basis for its substrate
specificity." Nature 464(7292): 1205-1209.
Hassanein M. T., Lyon H. N., et al. (2010). "Fine mapping of the association with obesity at the FTO
locus in African-derived populations." Hum Mol Genet 19(14): 2907-2916.
Haupt A., Thamer C., et al. (2009). "Variation in the FTO gene influences food intake but not energy
expenditure." Exp Clin Endocrinol Diabetes 117(4): 194-197.
Helgason A., Palsson S., et al. (2007). "Refining the impact of TCF7L2 gene variants on type 2
diabetes and adaptive evolution." Nat Genet 39(2): 218-225.
Hinney A., Nguyen T. T., et al. (2007). "Genome wide association (GWA) study for early onset
extreme obesity supports the role of fat mass and obesity associated gene (FTO) variants." PLoS
One 2(12): e1361.
Ho A. J., Stein J. L., et al. (2010). "A commonly carried allele of the obesity-related FTO gene is
associated with reduced brain volume in the healthy elderly." Proc Natl Acad Sci U S A
107(18): 8404-8409.
References
96
Hotta K., Nakata Y., et al. (2008). "Variations in the FTO gene are associated with severe obesity in
the Japanese." J Hum Genet 53(6): 546-553.
Huber Tobias B., Walz Gerd, et al. (2011). "mTOR and rapamycin in the kidney: signaling and
therapeutic implications beyond immunosuppression." Kidney Int 79(5): 502-511.
Hussain M. M. and Pan X. (2012). "Clock regulation of dietary lipid absorption." Curr Opin Clin Nutr
Metab Care 15(4): 336-341.
Ip J. Y. and Nakagawa S. (2011). "Long non-coding RNAs in nuclear bodies." Dev Growth Differ.
Jack K., Bellodi C., et al. (2011). "rRNA pseudouridylation defects affect ribosomal ligand binding and
translational fidelity from yeast to human cells." Mol Cell 44(4): 660-666.
Jacobsson J. A., Danielsson P., et al. (2008). "Major gender difference in association of FTO gene
variant among severely obese children with obesity and obesity related phenotypes." Biochem
Biophys Res Commun 368(3): 476-482.
Jacobsson J. A., Schiöth H. B., et al. (2012). "The impact of intronic single nucleotide polymorphisms
and ethnic diversity for studies on the obesity gene FTO." Obesity Reviews: no-no.
Jia G., Fu Y., et al. (2011). "N6-methyladenosine in nuclear RNA is a major substrate of the obesity-
associated FTO." Nat Chem Biol 7(12): 885-887.
Jia G., Yang C. G., et al. (2008). "Oxidative demethylation of 3-methylthymine and 3-methyluracil in
single-stranded DNA and RNA by mouse and human FTO." FEBS Lett 582(23-24): 3313-3319.
Johansson M. J., Esberg A., et al. (2008). "Eukaryotic wobble uridine modifications promote a
functionally redundant decoding system." Mol Cell Biol 28(10): 3301-3312.
John E., Wienecke-Baldacchino A., et al. (2012). "Dataset integration identifies transcriptional
regulation of microRNA genes by PPARgamma in differentiating mouse 3T3-L1 adipocytes."
Nucleic Acids Res 40(10): 4446-4460.
Jovanovic Z., Tung Y. C., et al. (2010). "Identification of the global transcriptomic response of the
hypothalamic arcuate nucleus to fasting and leptin." J Neuroendocrinol 22(8): 915-925.
Jowett J. B., Curran J. E., et al. (2010). "Genetic variation at the FTO locus influences RBL2 gene
expression." Diabetes 59(3): 726-732.
Jurkowski T. P., Meusburger M., et al. (2008). "Human DNMT2 methylates tRNA(Asp) molecules
using a DNA methyltransferase-like catalytic mechanism." Rna-a Publication of the Rna
Society 14(8): 1663-1670.
Kanber D., Berulava T., et al. (2009). "The Human Retinoblastoma Gene Is Imprinted." Plos Genetics
5(12).
Kang R., Zeh H. J., et al. (2011). "The Beclin 1 network regulates autophagy and apoptosis." Cell
Death Differ 18(4): 571-580.
Kaushik S., Rodriguez-Navarro J. A., et al. (2011). "Autophagy in hypothalamic AgRP neurons
regulates food intake and energy balance." Cell Metab 14(2): 173-183.
Kawaguchi T. and Hirose T. (2012). "Architectural roles of long noncoding RNAs in the intranuclear
formation of functional paraspeckles." Front Biosci 17: 1729-1746.
Keller L., Xu W., et al. (2011). "The obesity related gene, FTO, interacts with APOE, and is associated
with Alzheimer's disease risk: a prospective cohort study." J Alzheimers Dis 23(3): 461-469.
Kilpelainen T. O., Qi L., et al. (2011). "Physical activity attenuates the influence of FTO variants on
obesity risk: a meta-analysis of 218,166 adults and 19,268 children." PLoS Med 8(11):
e1001116.
Klagsbrun M. (1973). "Differences in the methylation of transfer ribonucleic acid in vitro by the
mitochondrial and cytoplasmic transfer ribonucleic acid methylases of HeLa cells." J Biol Chem
248(7): 2606-2611.
References
97
Kloting N., Schleinitz D., et al. (2008). "Inverse relationship between obesity and FTO gene expression
in visceral adipose tissue in humans." Diabetologia 51(4): 641-647.
Lam E. W., Francis R. E., et al. (2006). "FOXO transcription factors: key regulators of cell fate."
Biochem Soc Trans 34(Pt 5): 722-726.
Lappalainen Tiina J., Tolppanen Anna-Maija, et al. (2009). "The Common Variant in the FTO Gene
Did Not Modify the Effect of Lifestyle Changes on Body Weight: The Finnish Diabetes
Prevention Study." Obesity 17(4): 832-836.
Lefebvre P., Chinetti G., et al. (2006). "Sorting out the roles of PPAR alpha in energy metabolism and
vascular homeostasis." J Clin Invest 116(3): 571-580.
Levanon Erez Y., Eisenberg Eli, et al. (2004). "Systematic identification of abundant A-to-I editing
sites in the human transcriptome." Nat Biotech 22(8): 1001-1005.
Li S., Aufiero B., et al. (2000). "Regulation of the homeodomain CCAAT displacement/cut protein
function by histone acetyltransferases p300/CREB-binding protein (CBP)-associated factor and
CBP." Proc Natl Acad Sci U S A 97(13): 7166-7171.
Lo H. Shuen, Wang Zhining, et al. (2003). "Allelic Variation in Gene Expression Is Common in the
Human Genome." Genome Research 13(8): 1855-1862.
Loenarz C. and Schofield C. J. (2008). "Expanding chemical biology of 2-oxoglutarate oxygenases."
Nat Chem Biol 4(3): 152-156.
Loos R. J. and Bouchard C. (2008). "FTO: the first gene contributing to common forms of human
obesity." Obes Rev 9(3): 246-250.
Loos R. J., Lindgren C. M., et al. (2008). "Common variants near MC4R are associated with fat mass,
weight and risk of obesity." Nat Genet 40(6): 768-775.
Lu S., Mukkada V. A., et al. (2012). "MicroRNA profiling in mucosal biopsies of eosinophilic
esophagitis patients pre and post treatment with steroids and relationship with mRNA targets."
PLoS One 7(7): e40676.
Ma M., Harding H. P., et al. (2012). "Kinetic analysis of FTO (fat mass and obesity-associated) reveals
that it is unlikely to function as a sensor for 2-oxoglutarate." Biochem J 444(2): 183-187.
Mehrpour M., Esclatine A., et al. (2010). "Overview of macroautophagy regulation in mammalian
cells." Cell Res 20(7): 748-762.
Meyer K. D., Saletore Y., et al. (2012). "Comprehensive analysis of mRNA methylation reveals
enrichment in 3' UTRs and near stop codons." Cell 149(7): 1635-1646.
Meyer Kate D, Saletore Yogesh, et al. (2012). "Comprehensive Analysis of mRNA Methylation
Reveals Enrichment in 32 UTRs and near Stop Codons." Cell.
Meyre D., Proulx K., et al. (2010). "Prevalence of loss-of-function FTO mutations in lean and obese
individuals." Diabetes 59(1): 311-318.
Micura R., Pils W., et al. (2001). "Methylation of the nucleobases in RNA oligonucleotides mediates
duplex-hairpin conversion." Nucleic Acids Res 29(19): 3997-4005.
Motorin Y. and Helm M. (2011). "RNA nucleotide methylation." Wiley Interdiscip Rev RNA 2(5): 611-
631.
Mullis K., Faloona F., et al. (1986). "Specific enzymatic amplification of DNA in vitro: the polymerase
chain reaction." Cold Spring Harb Symp Quant Biol 51 Pt 1: 263-273.
Narayan P. and Rottman F. M. (1988). "An in vitro system for accurate methylation of internal
adenosine residues in messenger RNA." Science 242(4882): 1159-1162.
Nasvall S. J., Chen P., et al. (2007). "The wobble hypothesis revisited: Uridine-5-oxyacetic acid is
critical for reading of G-ending codons." Rna-a Publication of the Rna Society 13(12): 2151-
2164.
References
98
Negre D., Weitzmann C., et al. (1989). "In vitro methylation of Escherichia coli 16S ribosomal RNA
and 30S ribosomes." Proc Natl Acad Sci U S A 86(13): 4902-4906.
Neumann L. C., Markaki Y., et al. (2012). "The imprinted NPAP1/C15orf2 gene in the Prader-Willi
syndrome region encodes a nuclear pore complex associated protein." Hum Mol Genet 21(18):
4038-4048.
Ng M. C., Park K. S., et al. (2008). "Implication of genetic variants near TCF7L2, SLC30A8, HHEX,
CDKAL1, CDKN2A/B, IGF2BP2, and FTO in type 2 diabetes and obesity in 6,719 Asians."
Diabetes 57(8): 2226-2233.
Norrbom J., Sällstedt E. K., et al. (2011). "Alternative splice variant PGC-1α-b is strongly induced by
exercise in human skeletal muscle." American Journal of Physiology - Endocrinology And
Metabolism 301(6): E1092-E1098.
Ofengand J. (2002). "Ribosomal RNA pseudouridines and pseudouridine synthases." FEBS Lett
514(1): 17-25.
Ougland R., Zhang C. M., et al. (2004). "AlkB restores the biological function of mRNA and tRNA
inactivated by chemical methylation." Mol Cell 16(1): 107-116.
Paquin N. and Chartrand P. (2008). "Local regulation of mRNA translation: new insights from the
bud." Trends Cell Biol 18(3): 105-111.
Pastinen T., Sladek R., et al. (2004). "A survey of genetic and epigenetic variation affecting human
gene expression." Physiol Genomics 16(2): 184-193.
Peng S., Zhu Y., et al. (2011). "FTO gene polymorphisms and obesity risk: a meta-analysis." BMC
Med 9: 71.
Peters T., Ausmeier K., et al. (1999). "Cloning of Fatso (Fto), a novel gene deleted by the Fused toes
(Ft) mouse mutation." Mamm Genome 10(10): 983-986.
Phillips Catherine M., Kesse-Guyot Emmanuelle, et al. (2012). "High Dietary Saturated Fat Intake
Accentuates Obesity Risk Associated with the Fat Mass and Obesity–Associated Gene in
Adults." The Journal of Nutrition 142(5): 824-831.
Piskounova E., Polytarchou C., et al. (2011). "Lin28A and Lin28B inhibit let-7 microRNA biogenesis
by distinct mechanisms." Cell 147(5): 1066-1079.
Purta Elzbieta, Kaminska Katarzyna H., et al. (2008). "YbeA is the m3Ψ methyltransferase RlmH that
targets nucleotide 1915 in 23S rRNA." RNA 14(10): 2234-2244.
Purta Elzbieta, O’Connor Michelle, et al. (2008). "YccW is the m5C Methyltransferase Specific for
23S rRNA Nucleotide 1962." Journal of Molecular Biology 383(3): 641-651.
Pyper S. R., Viswakarma N., et al. (2010). "PRIC295, a Nuclear Receptor Coactivator, Identified from
PPARalpha-Interacting Cofactor Complex." PPAR Res 2010.
Qi L., Kang K., et al. (2008). "Fat mass-and obesity-associated (FTO) gene variant is associated with
obesity: longitudinal analyses in two cohort studies and functional test." Diabetes 57(11): 3145-
3151.
Rabinowitz J. D. and White E. (2010). "Autophagy and metabolism." Science 330(6009): 1344-1348.
Rampersaud E., Mitchell B. D., et al. (2008). "Physical activity and the association of common FTO
gene variants with body mass index and obesity." Arch Intern Med 168(16): 1791-1797.
Rey D., Fernandez-Honrado M., et al. (2012). "Amerindians show no association of PC-1 gene Gln121
allele and obesity: a thrifty gene population genetics." Mol Biol Rep 39(7): 7687-7693.
Robbens S., Rouze P., et al. (2008). "The FTO gene, implicated in human obesity, is found only in
vertebrates and marine algae." J Mol Evol 66(1): 80-84.
Ruiz J. R., Labayen I., et al. (2010). "Attenuation of the effect of the FTO rs9939609 polymorphism on
total and central body fat by physical activity in adolescents: the HELENA study." Arch Pediatr
Adolesc Med 164(4): 328-333.
References
99
Samaras K., Botelho N. K., et al. (2010). "Subcutaneous and visceral adipose tissue FTO gene
expression and adiposity, insulin action, glucose metabolism, and inflammatory adipokines in
type 2 diabetes mellitus and in health." Obesity Surgery 20(1): 108-113.
Sanchez-Pulido L. and Andrade-Navarro M. A. (2007). "The FTO (fat mass and obesity associated)
gene codes for a novel member of the non-heme dioxygenase superfamily." BMC Biochem 8:
23.
Schaefer M., Pollex T., et al. (2010). "RNA methylation by Dnmt2 protects transfer RNAs against
stress-induced cleavage." Genes Dev 24(15): 1590-1595.
Scuteri A., Sanna S., et al. (2007). "Genome-wide association scan shows genetic variants in the FTO
gene are associated with obesity-related traits." PLoS Genet 3(7): e115.
Sergiev P. V., Bogdanov A. A., et al. (2007). "Ribosomal RNA guanine-(N2)-methyltransferases and
their targets." Nucleic Acids Research 35(7): 2295-2301.
Serre D., Gurd S., et al. (2008). "Differential allelic expression in the human genome: a robust
approach to identify genetic and epigenetic cis-acting mechanisms regulating gene expression."
PLoS Genet 4(2): e1000006.
Shaw P. and Brown J. (2012). "Nucleoli: composition, function, and dynamics." Plant Physiol 158(1):
44-51.
Shin E K, Shin A, et al. (1995). "Multiple change in E2F function and regulation occur upon muscle
differentiation." Molecular and Cellular Biology 15(4): 2252-2262.
Shin E. K., Shin A., et al. (1995). "Multiple change in E2F function and regulation occur upon muscle
differentiation." Mol Cell Biol 15(4): 2252-2262.
Speakman J. R., Rance K. A., et al. (2008). "Polymorphisms of the FTO gene are associated with
variation in energy intake, but not energy expenditure." Obesity (Silver Spring) 16(8): 1961-
1965.
Spector D. L. and Lamond A. I. (2011). "Nuclear speckles." Cold Spring Harb Perspect Biol 3(2).
Speliotes E. K., Willer C. J., et al. (2010). "Association analyses of 249,796 individuals reveal 18 new
loci associated with body mass index." Nat Genet 42(11): 937-948.
Stratigopoulos G., LeDuc C. A., et al. (2011). "Cut-like homeobox 1 (CUX1) regulates expression of
the fat mass and obesity-associated and retinitis pigmentosa GTPase regulator-interacting
protein-1-like (RPGRIP1L) genes and coordinates leptin receptor signaling." J Biol Chem
286(3): 2155-2170.
Stratigopoulos G., Padilla S. L., et al. (2008). "Regulation of Fto/Ftm gene expression in mice and
humans." Am J Physiol Regul Integr Comp Physiol 294(4): R1185-1196.
Subauste Angela R. and Burant Charles F. (2007). "Role of FoxO1 in FFA-induced oxidative stress in
adipocytes." American Journal of Physiology - Endocrinology And Metabolism 293(1): E159-
E164.
Tan J. T., Dorajoo R., et al. (2008). "FTO variants are associated with obesity in the Chinese and
Malay populations in Singapore." Diabetes 57(10): 2851-2857.
Tan L. P., Seinen E., et al. (2009). "A high throughput experimental approach to identify miRNA
targets in human cells." Nucleic Acids Res 37(20): e137.
Tan L. and Shi Y. G. (2012). "Tet family proteins and 5-hydroxymethylcytosine in development and
disease." Development 139(11): 1895-1902.
Tanofsky-Kraff M., Han J. C., et al. (2009). "The FTO gene rs9939609 obesity-risk allele and loss of
control over eating." Am J Clin Nutr 90(6): 1483-1488.
Terra X., Auguet T., et al. (2010). "Anti-inflammatory profile of FTO gene expression in adipose
tissues from morbidly obese women." Cell Physiol Biochem 26(6): 1041-1050.
References
100
Tews D., Fischer-Posovszky P., et al. (2011). "Regulation of FTO and FTM expression during human
preadipocyte differentiation." Horm Metab Res 43(1): 17-21.
Tonjes A., Zeggini E., et al. (2010). "Association of FTO variants with BMI and fat mass in the self-
contained population of Sorbs in Germany." Eur J Hum Genet 18(1): 104-110.
Tripathi V., Ellis J. D., et al. (2010). "The nuclear-retained noncoding RNA MALAT1 regulates
alternative splicing by modulating SR splicing factor phosphorylation." Mol Cell 39(6): 925-
938.
Tripathi V., Song D. Y., et al. (2012). "SRSF1 regulates the assembly of pre-mRNA processing factors
in nuclear speckles." Mol Biol Cell 23(18): 3694-3706.
Truscott M., Denault J. B., et al. (2007). "Carboxyl-terminal proteolytic processing of CUX1 by a
caspase enables transcriptional activation in proliferating cells." J Biol Chem 282(41): 30216-
30226.
Tung Y. C., Ayuso E., et al. (2010). "Hypothalamic-specific manipulation of Fto, the ortholog of the
human obesity gene FTO, affects food intake in rats." PLoS One 5(1): e8771.
Tuorto Francesca, Liebers Reinhard, et al. (2012). "RNA cytosine methylation by Dnmt2 and NSun2
promotes tRNA stability and protein synthesis." Nat Struct Mol Biol 19(9): 900-905.
Valentin-Acevedo A., Sinquett F. L., et al. (2011). "c-Rel deficiency increases caspase-4 expression
and leads to ER stress and necrosis in EBV-transformed cells." PLoS One 6(10): e25467.
Valverde R., Edwards L., et al. (2008). "Structure and function of KH domains." FEBS J 275(11):
2712-2726.
van den Berg L., de Waal H. D., et al. (2010). "Investigation of a patient with a partial trisomy 16q
including the fat mass and obesity associated gene (FTO): fine mapping and FTO gene
expression study." Am J Med Genet A 152A(3): 630-637.
Vierkotten J., Dildrop R., et al. (2007). "Ftm is a novel basal body protein of cilia involved in Shh
signalling." Development 134(14): 2569-2577.
Villalobos-Comparan M., Teresa Flores-Dorantes M., et al. (2008). "The FTO gene is associated with
adulthood obesity in the Mexican population." Obesity (Silver Spring) 16(10): 2296-2301.
Wabitsch M., Brenner R. E., et al. (2001). "Characterization of a human preadipocyte cell strain with
high capacity for adipose differentiation." Int J Obes Relat Metab Disord 25(1): 8-15.
Wahlen K., Sjolin E., et al. (2008). "The common rs9939609 gene variant of the fat mass- and obesity-
associated gene FTO is related to fat cell lipolysis." Journal of Lipid Research 49(3): 607-611.
Wardle J., Llewellyn C., et al. (2009). "The FTO gene and measured food intake in children." Int J
Obes (Lond) 33(1): 42-45.
Wawrzik M., Unmehopa U. A., et al. (2010). "The C15orf2 gene in the Prader-Willi syndrome region
is subject to genomic imprinting and positive selection." Neurogenetics 11(2): 153-161.
Wei C. M., Gershowitz A., et al. (1975). "Methylated nucleotides block 5' terminus of HeLa cell
messenger RNA." Cell 4(4): 379-386.
Weiss K. M. and Clark A. G. (2002). "Linkage disequilibrium and the mapping of complex human
traits." Trends Genet 18(1): 19-24.
Wilson B. J., Harada R., et al. (2009). "CUX1 Transcription Factor Is a Downstream Effector of the
Proteinase- activated Receptor 2 (PAR(2))." Journal of Biological Chemistry 284(1): 36-45.
Wu G. W., Xiao M., et al. (2011). "U2 snRNA is inducibly pseudouridylated at novel sites by Pus7p
and snR81 RNP." Embo Journal 30(1): 79-89.
Wu G., Xiao M., et al. (2011). "U2 snRNA is inducibly pseudouridylated at novel sites by Pus7p and
snR81 RNP." EMBO J 30(1): 79-89.
Wu L., Li H., et al. (2012). "MicroRNA-223 regulates FOXO1 expression and cell proliferation."
FEBS Lett 586(7): 1038-1043.
References
101
Wu Q., Saunders R. A., et al. (2010). "The obesity-associated Fto gene is a transcriptional coactivator."
Biochem Biophys Res Commun 401(3): 390-395.
Yamada E. and Singh R. (2012). "Mapping autophagy on to your metabolic radar." Diabetes 61(2):
272-280.
Yan H., Yuan W., et al. (2002). "Allelic variation in human gene expression." Science 297(5584):
1143.
Yan L. X., Wu Q. N., et al. (2011). "Knockdown of miR-21 in human breast cancer cell lines inhibits
proliferation, in vitro migration and in vivo tumor growth." Breast Cancer Res 13(1): R2.
Yang Jian, Loos Ruth J. F., et al. (2012). "FTO genotype is associated with phenotypic variability of
body mass index." Nature advance online publication.
Yeo G. S. (2012). "FTO and obesity: a problem for a billion people." J Neuroendocrinol 24(2): 393-
394.
Yi C. and Pan T. (2011). "Cellular dynamics of RNA modification." Acc Chem Res 44(12): 1380-1388.
Yu A. T., Ge J., et al. (2011). "Pseudouridines in spliceosomal snRNAs." Protein Cell 2(9): 712-725.
Yu B., Yang Z. Y., et al. (2005). "Methylation as a crucial step in plant microRNA biogenesis."
Science 307(5711): 932-935.
Zabena C., Gonzalez-Sanchez J. L., et al. (2009). "The FTO Obesity Gene. Genotyping and Gene
Expression Analysis in Morbidly Obese Patients." Obesity Surgery 19(1): 87-95.
Zhang X., Gan L., et al. (2002). "Phosphorylation of serine 256 suppresses transactivation by FKHR
(FOXO1) by multiple mechanisms. Direct and indirect effects on nuclear/cytoplasmic shuttling
and DNA binding." J Biol Chem 277(47): 45276-45284.
Zhang Y., Goldman S., et al. (2009). "Adipose-specific deletion of autophagy-related gene 7 (atg7) in
mice reveals a role in adipogenesis." Proc Natl Acad Sci U S A 106(47): 19860-19865.
Zhou J., Liang B., et al. (2010). "Functional and structural impact of target uridine substitutions on the
H/ACA ribonucleoprotein particle pseudouridine synthase." Biochemistry 49(29): 6276-6281.
Zhu D., Shi S., et al. (2009). "Growth arrest induces primary-cilium formation and sensitizes IGF-1-
receptor signaling during differentiation induction of 3T3-L1 preadipocytes." J Cell Sci 122(Pt
15): 2760-2768.
Zhu H., Shyh-Chang N., et al. (2011). "The Lin28/let-7 axis regulates glucose metabolism." Cell
147(1): 81-94.
Zondervan K. T. and Cardon L. R. (2004). "The complex interplay among factors that influence allelic
association (vol 5, pg 89, 2004)." Nature Reviews Genetics 5(3): 238-238.
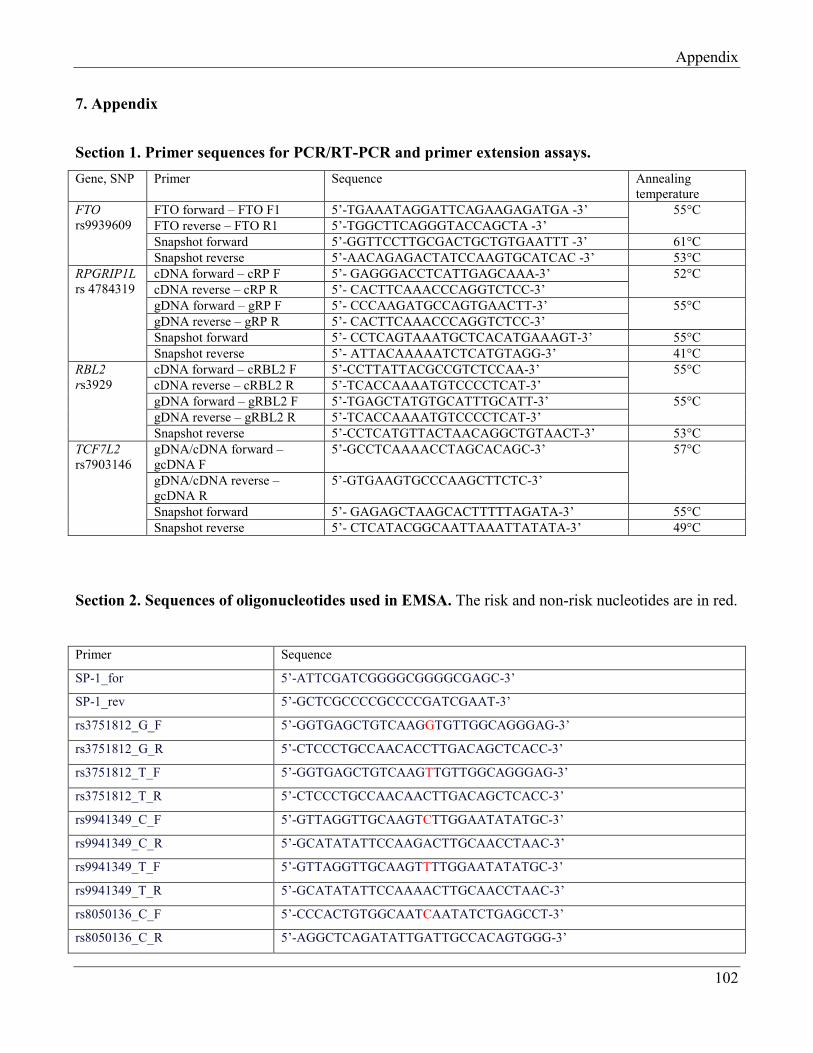
Appendix
102
7. Appendix
Section 1. Primer sequences for PCR/RT-PCR and primer extension assays.
Gene, SNP
Primer Sequence
Annealing
temperature
FTO
rs9939609
FTO forward – FTO F1 5’-TGAAATAGGATTCAGAAGAGATGA -3’ 55°C
FTO reverse – FTO R1 5’-TGGCTTCAGGGTACCAGCTA -3’
Snapshot forward 5’-GGTTCCTTGCGACTGCTGTGAATTT -3’ 61°C
Snapshot reverse 5’-AACAGAGACTATCCAAGTGCATCAC -3’ 53°C
RPGRIP1L
rs 4784319
cDNA forward – cRP F 5’- GAGGGACCTCATTGAGCAAA-3’ 52°C
cDNA reverse – cRP R 5’- CACTTCAAACCCAGGTCTCC-3’
gDNA forward – gRP F 5’- CCCAAGATGCCAGTGAACTT-3’ 55°C
gDNA reverse – gRP R 5’- CACTTCAAACCCAGGTCTCC-3’
Snapshot forward 5’- CCTCAGTAAATGCTCACATGAAAGT-3’ 55°C
Snapshot reverse 5’- ATTACAAAAATCTCATGTAGG-3’ 41°C
RBL2
rs3929
cDNA forward – cRBL2 F 5’-CCTTATTACGCCGTCTCCAA-3’ 55°C
cDNA reverse – cRBL2 R 5’-TCACCAAAATGTCCCCTCAT-3’
gDNA forward – gRBL2 F 5’-TGAGCTATGTGCATTTGCATT-3’ 55°C
gDNA reverse – gRBL2 R 5’-TCACCAAAATGTCCCCTCAT-3’
Snapshot reverse 5’-CCTCATGTTACTAACAGGCTGTAACT-3’ 53°C
TCF7L2
rs7903146
gDNA/cDNA forward –
gcDNA F
5’-GCCTCAAAACCTAGCACAGC-3’ 57°C
gDNA/cDNA reverse –
gcDNA R
5’-GTGAAGTGCCCAAGCTTCTC-3’
Snapshot forward 5’- GAGAGCTAAGCACTTTTTAGATA-3’ 55°C
Snapshot reverse 5’- CTCATACGGCAATTAAATTATATA-3’ 49°C
Section 2. Sequences of oligonucleotides used in EMSA. The risk and non-risk nucleotides are in red.
Primer Sequence
SP-1_for 5’-ATTCGATCGGGGCGGGGCGAGC-3’
SP-1_rev 5’-GCTCGCCCCGCCCCGATCGAAT-3’
rs3751812_G_F 5’-GGTGAGCTGTCAAGGTGTTGGCAGGGAG-3’
rs3751812_G_R 5’-CTCCCTGCCAACACCTTGACAGCTCACC-3’
rs3751812_T_F 5’-GGTGAGCTGTCAAGTTGTTGGCAGGGAG-3’
rs3751812_T_R 5’-CTCCCTGCCAACAACTTGACAGCTCACC-3’
rs9941349_C_F 5’-GTTAGGTTGCAAGTCTTGGAATATATGC-3’
rs9941349_C_R 5’-GCATATATTCCAAGACTTGCAACCTAAC-3’
rs9941349_T_F 5’-GTTAGGTTGCAAGTTTTGGAATATATGC-3’
rs9941349_T_R 5’-GCATATATTCCAAAACTTGCAACCTAAC-3’
rs8050136_C_F 5’-CCCACTGTGGCAATCAATATCTGAGCCT-3’
rs8050136_C_R 5’-AGGCTCAGATATTGATTGCCACAGTGGG-3’
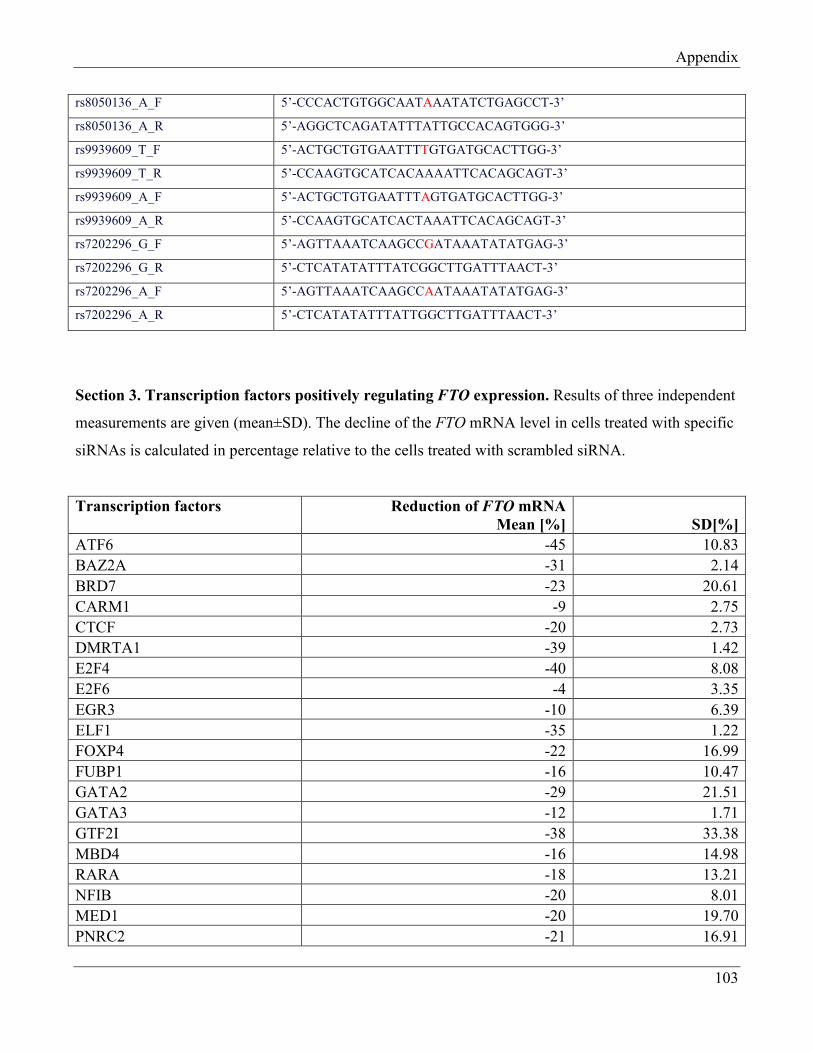
Appendix
103
rs8050136_A_F 5’-CCCACTGTGGCAATAAATATCTGAGCCT-3’
rs8050136_A_R 5’-AGGCTCAGATATTTATTGCCACAGTGGG-3’
rs9939609_T_F 5’-ACTGCTGTGAATTTTGTGATGCACTTGG-3’
rs9939609_T_R 5’-CCAAGTGCATCACAAAATTCACAGCAGT-3’
rs9939609_A_F 5’-ACTGCTGTGAATTTAGTGATGCACTTGG-3’
rs9939609_A_R 5’-CCAAGTGCATCACTAAATTCACAGCAGT-3’
rs7202296_G_F 5’-AGTTAAATCAAGCCGATAAATATATGAG-3’
rs7202296_G_R 5’-CTCATATATTTATCGGCTTGATTTAACT-3’
rs7202296_A_F 5’-AGTTAAATCAAGCCAATAAATATATGAG-3’
rs7202296_A_R 5’-CTCATATATTTATTGGCTTGATTTAACT-3’
Section 3. Transcription factors positively regulating FTO expression. Results of three independent
measurements are given (mean±SD). The decline of the FTO mRNA level in cells treated with specific
siRNAs is calculated in percentage relative to the cells treated with scrambled siRNA.
Transcription factors
Reduction of FTO mRNA
Mean [%] SD[%]
ATF6 -45 10.83
BAZ2A -31 2.14
BRD7 -23 20.61
CARM1 -9 2.75
CTCF -20 2.73
DMRTA1 -39 1.42
E2F4 -40 8.08
E2F6 -4 3.35
EGR3 -10 6.39
ELF1 -35 1.22
FOXP4 -22 16.99
FUBP1 -16 10.47
GATA2 -29 21.51
GATA3 -12 1.71
GTF2I -38 33.38
MBD4 -16 14.98
RARA -18 13.21
NFIB -20 8.01
MED1 -20 19.70
PNRC2 -21 16.91
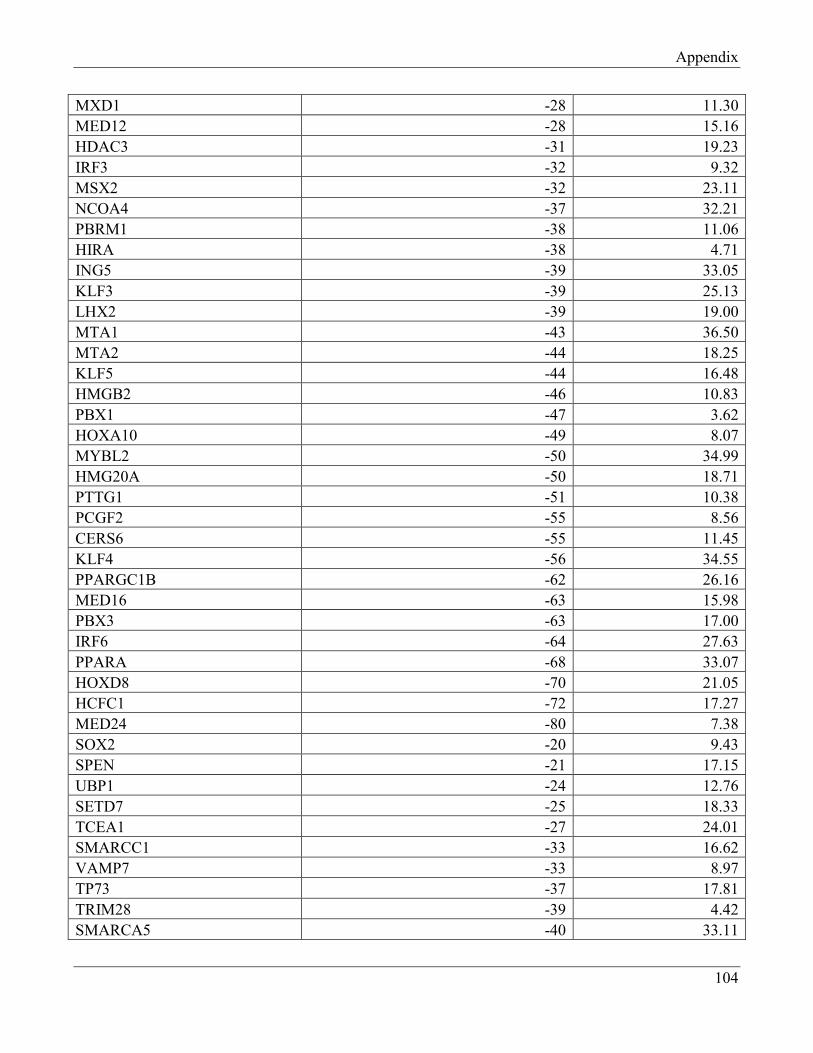
Appendix
104
MXD1 -28 11.30
MED12 -28 15.16
HDAC3 -31 19.23
IRF3 -32 9.32
MSX2 -32 23.11
NCOA4 -37 32.21
PBRM1 -38 11.06
HIRA -38 4.71
ING5 -39 33.05
KLF3 -39 25.13
LHX2 -39 19.00
MTA1 -43 36.50
MTA2 -44 18.25
KLF5 -44 16.48
HMGB2 -46 10.83
PBX1 -47 3.62
HOXA10 -49 8.07
MYBL2 -50 34.99
HMG20A -50 18.71
PTTG1 -51 10.38
PCGF2 -55 8.56
CERS6 -55 11.45
KLF4 -56 34.55
PPARGC1B -62 26.16
MED16 -63 15.98
PBX3 -63 17.00
IRF6 -64 27.63
PPARA -68 33.07
HOXD8 -70 21.05
HCFC1 -72 17.27
MED24 -80 7.38
SOX2 -20 9.43
SPEN -21 17.15
UBP1 -24 12.76
SETD7 -25 18.33
TCEA1 -27 24.01
SMARCC1 -33 16.62
VAMP7 -33 8.97
TP73 -37 17.81
TRIM28 -39 4.42
SMARCA5 -40 33.11
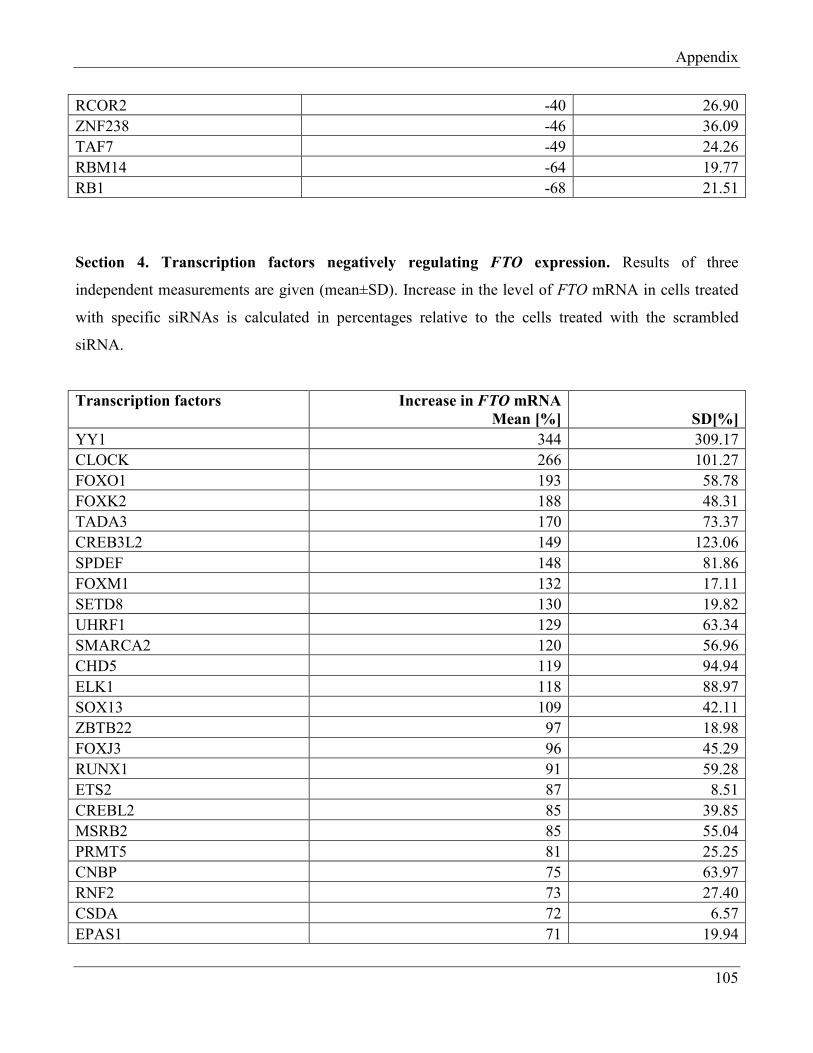
Appendix
105
RCOR2 -40 26.90
ZNF238 -46 36.09
TAF7 -49 24.26
RBM14 -64 19.77
RB1 -68 21.51
Section 4. Transcription factors negatively regulating FTO expression. Results of three
independent measurements are given (mean±SD). Increase in the level of FTO mRNA in cells treated
with specific siRNAs is calculated in percentages relative to the cells treated with the scrambled
siRNA.
Transcription factors
Increase in FTO mRNA
Mean [%] SD[%]
YY1 344 309.17
CLOCK 266 101.27
FOXO1 193 58.78
FOXK2 188 48.31
TADA3 170 73.37
CREB3L2 149 123.06
SPDEF 148 81.86
FOXM1 132 17.11
SETD8 130 19.82
UHRF1 129 63.34
SMARCA2 120 56.96
CHD5 119 94.94
ELK1 118 88.97
SOX13 109 42.11
ZBTB22 97 18.98
FOXJ3 96 45.29
RUNX1 91 59.28
ETS2 87 8.51
CREBL2 85 39.85
MSRB2 85 55.04
PRMT5 81 25.25
CNBP 75 63.97
RNF2 73 27.40
CSDA 72 6.57
EPAS1 71 19.94
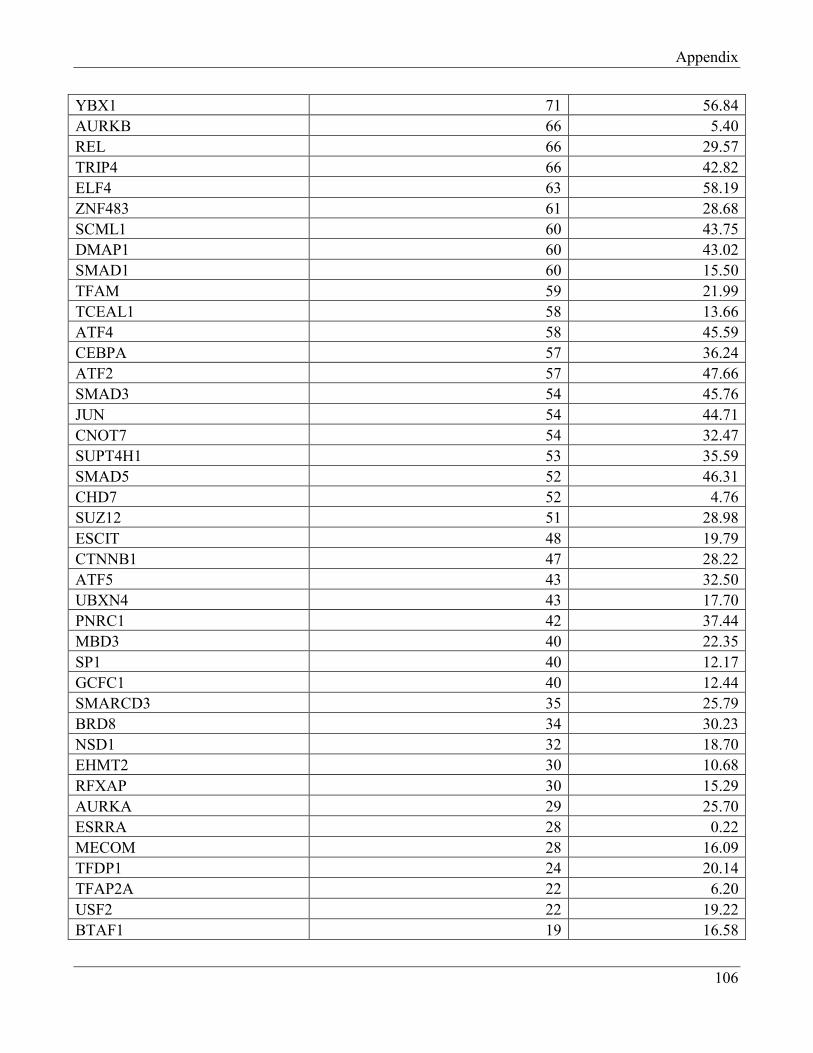
Appendix
106
YBX1 71 56.84
AURKB 66 5.40
REL 66 29.57
TRIP4 66 42.82
ELF4 63 58.19
ZNF483 61 28.68
SCML1 60 43.75
DMAP1 60 43.02
SMAD1 60 15.50
TFAM 59 21.99
TCEAL1 58 13.66
ATF4 58 45.59
CEBPA 57 36.24
ATF2 57 47.66
SMAD3 54 45.76
JUN 54 44.71
CNOT7 54 32.47
SUPT4H1 53 35.59
SMAD5 52 46.31
CHD7 52 4.76
SUZ12 51 28.98
ESCIT 48 19.79
CTNNB1 47 28.22
ATF5 43 32.50
UBXN4 43 17.70
PNRC1 42 37.44
MBD3 40 22.35
SP1 40 12.17
GCFC1 40 12.44
SMARCD3 35 25.79
BRD8 34 30.23
NSD1 32 18.70
EHMT2 30 10.68
RFXAP 30 15.29
AURKA 29 25.70
ESRRA 28 0.22
MECOM 28 16.09
TFDP1 24 20.14
TFAP2A 22 6.20
USF2 22 19.22
BTAF1 19 16.58
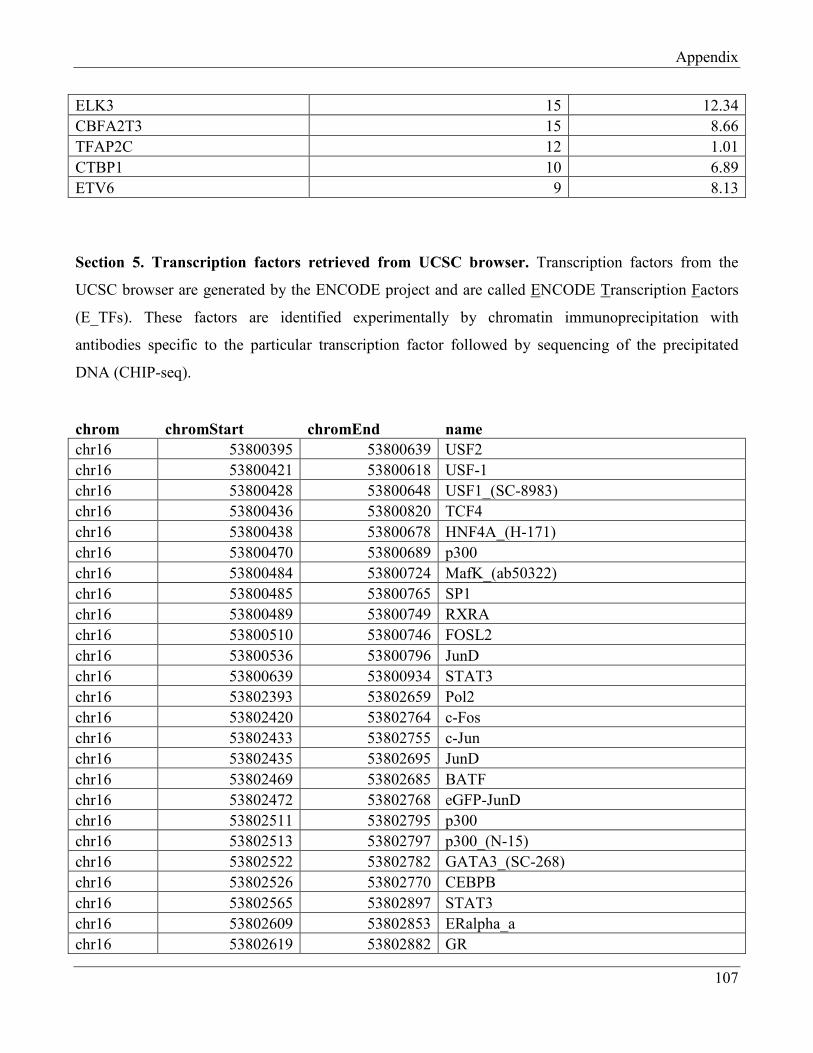
Appendix
107
ELK3 15 12.34
CBFA2T3 15 8.66
TFAP2C 12 1.01
CTBP1 10 6.89
ETV6 9 8.13
Section 5. Transcription factors retrieved from UCSC browser. Transcription factors from the
UCSC browser are generated by the ENCODE project and are called ENCODE Transcription Factors
(E_TFs). These factors are identified experimentally by chromatin immunoprecipitation with
antibodies specific to the particular transcription factor followed by sequencing of the precipitated
DNA (CHIP-seq).
chrom chromStart chromEnd name
chr16 53800395 53800639 USF2
chr16 53800421 53800618 USF-1
chr16 53800428 53800648 USF1_(SC-8983)
chr16 53800436 53800820 TCF4
chr16 53800438 53800678 HNF4A_(H-171)
chr16 53800470 53800689 p300
chr16 53800484 53800724 MafK_(ab50322)
chr16 53800485 53800765 SP1
chr16 53800489 53800749 RXRA
chr16 53800510 53800746 FOSL2
chr16 53800536 53800796 JunD
chr16 53800639 53800934 STAT3
chr16 53802393 53802659 Pol2
chr16 53802420 53802764 c-Fos
chr16 53802433 53802755 c-Jun
chr16 53802435 53802695 JunD
chr16 53802469 53802685 BATF
chr16 53802472 53802768 eGFP-JunD
chr16 53802511 53802795 p300
chr16 53802513 53802797 p300_(N-15)
chr16 53802522 53802782 GATA3_(SC-268)
chr16 53802526 53802770 CEBPB
chr16 53802565 53802897 STAT3
chr16 53802609 53802853 ERalpha_a
chr16 53802619 53802882 GR
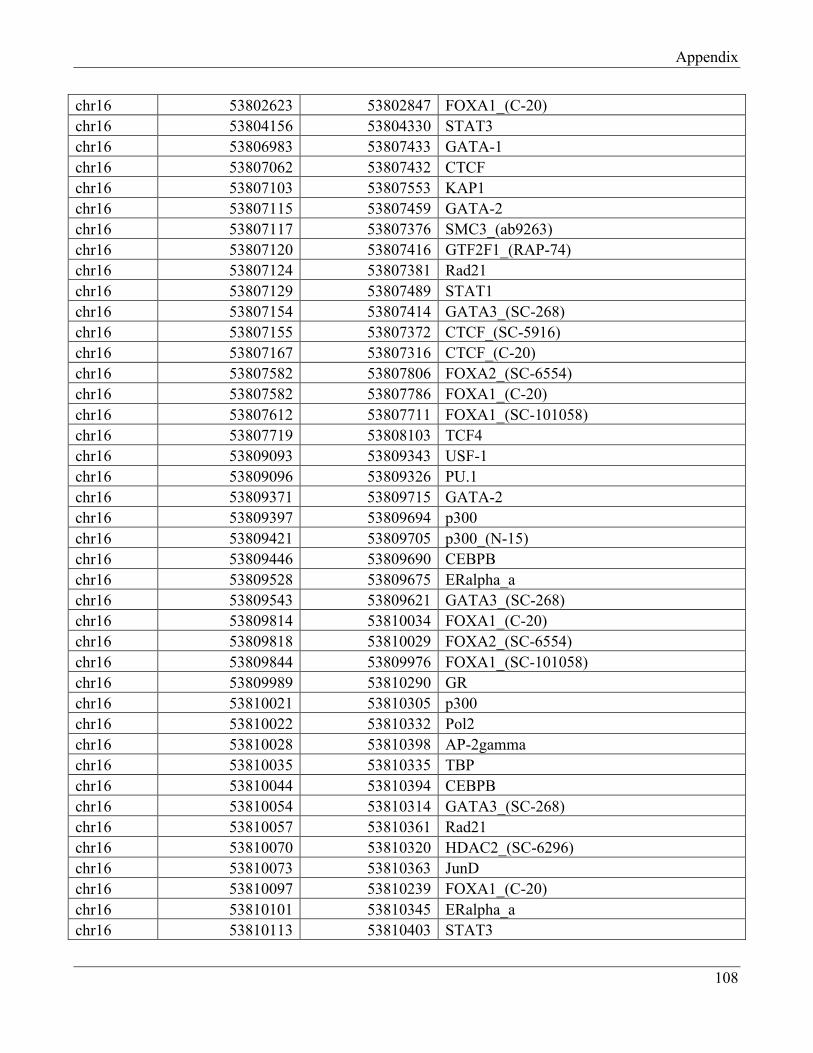
Appendix
108
chr16 53802623 53802847 FOXA1_(C-20)
chr16 53804156 53804330 STAT3
chr16 53806983 53807433 GATA-1
chr16 53807062 53807432 CTCF
chr16 53807103 53807553 KAP1
chr16 53807115 53807459 GATA-2
chr16 53807117 53807376 SMC3_(ab9263)
chr16 53807120 53807416 GTF2F1_(RAP-74)
chr16 53807124 53807381 Rad21
chr16 53807129 53807489 STAT1
chr16 53807154 53807414 GATA3_(SC-268)
chr16 53807155 53807372 CTCF_(SC-5916)
chr16 53807167 53807316 CTCF_(C-20)
chr16 53807582 53807806 FOXA2_(SC-6554)
chr16 53807582 53807786 FOXA1_(C-20)
chr16 53807612 53807711 FOXA1_(SC-101058)
chr16 53807719 53808103 TCF4
chr16 53809093 53809343 USF-1
chr16 53809096 53809326 PU.1
chr16 53809371 53809715 GATA-2
chr16 53809397 53809694 p300
chr16 53809421 53809705 p300_(N-15)
chr16 53809446 53809690 CEBPB
chr16 53809528 53809675 ERalpha_a
chr16 53809543 53809621 GATA3_(SC-268)
chr16 53809814 53810034 FOXA1_(C-20)
chr16 53809818 53810029 FOXA2_(SC-6554)
chr16 53809844 53809976 FOXA1_(SC-101058)
chr16 53809989 53810290 GR
chr16 53810021 53810305 p300
chr16 53810022 53810332 Pol2
chr16 53810028 53810398 AP-2gamma
chr16 53810035 53810335 TBP
chr16 53810044 53810394 CEBPB
chr16 53810054 53810314 GATA3_(SC-268)
chr16 53810057 53810361 Rad21
chr16 53810070 53810320 HDAC2_(SC-6296)
chr16 53810073 53810363 JunD
chr16 53810097 53810239 FOXA1_(C-20)
chr16 53810101 53810345 ERalpha_a
chr16 53810113 53810403 STAT3
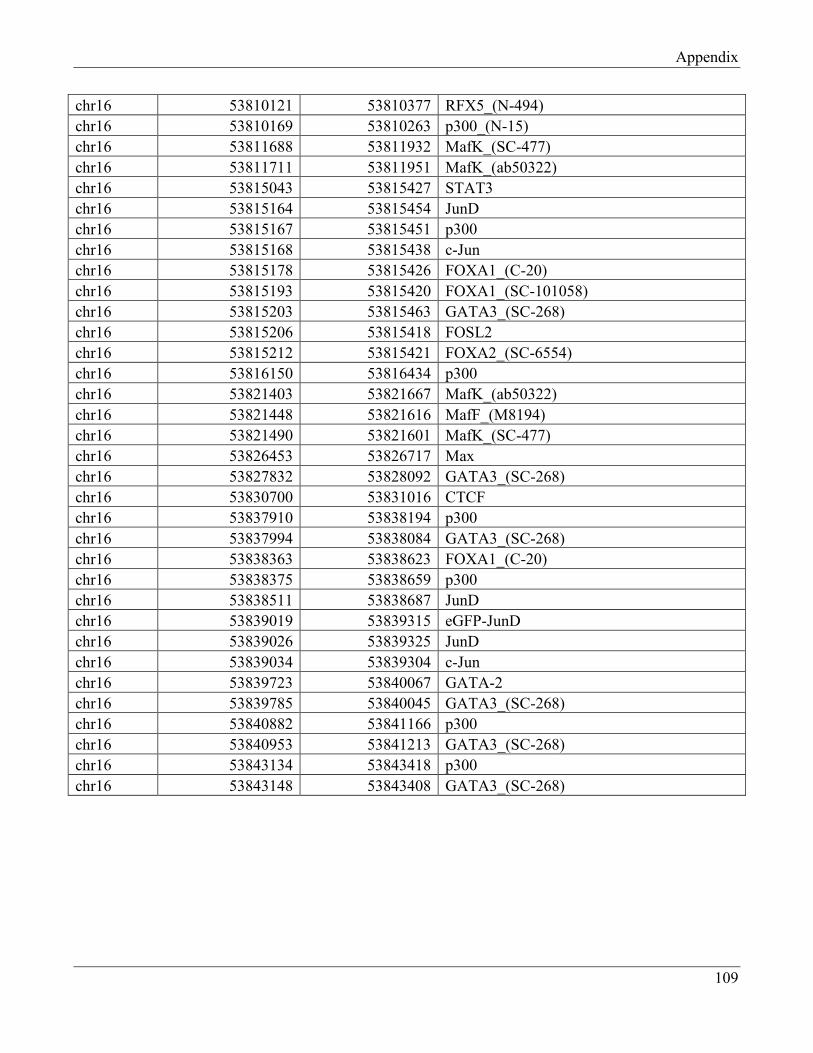
Appendix
109
chr16 53810121 53810377 RFX5_(N-494)
chr16 53810169 53810263 p300_(N-15)
chr16 53811688 53811932 MafK_(SC-477)
chr16 53811711 53811951 MafK_(ab50322)
chr16 53815043 53815427 STAT3
chr16 53815164 53815454 JunD
chr16 53815167 53815451 p300
chr16 53815168 53815438 c-Jun
chr16 53815178 53815426 FOXA1_(C-20)
chr16 53815193 53815420 FOXA1_(SC-101058)
chr16 53815203 53815463 GATA3_(SC-268)
chr16 53815206 53815418 FOSL2
chr16 53815212 53815421 FOXA2_(SC-6554)
chr16 53816150 53816434 p300
chr16 53821403 53821667 MafK_(ab50322)
chr16 53821448 53821616 MafF_(M8194)
chr16 53821490 53821601 MafK_(SC-477)
chr16 53826453 53826717 Max
chr16 53827832 53828092 GATA3_(SC-268)
chr16 53830700 53831016 CTCF
chr16 53837910 53838194 p300
chr16 53837994 53838084 GATA3_(SC-268)
chr16 53838363 53838623 FOXA1_(C-20)
chr16 53838375 53838659 p300
chr16 53838511 53838687 JunD
chr16 53839019 53839315 eGFP-JunD
chr16 53839026 53839325 JunD
chr16 53839034 53839304 c-Jun
chr16 53839723 53840067 GATA-2
chr16 53839785 53840045 GATA3_(SC-268)
chr16 53840882 53841166 p300
chr16 53840953 53841213 GATA3_(SC-268)
chr16 53843134 53843418 p300
chr16 53843148 53843408 GATA3_(SC-268)
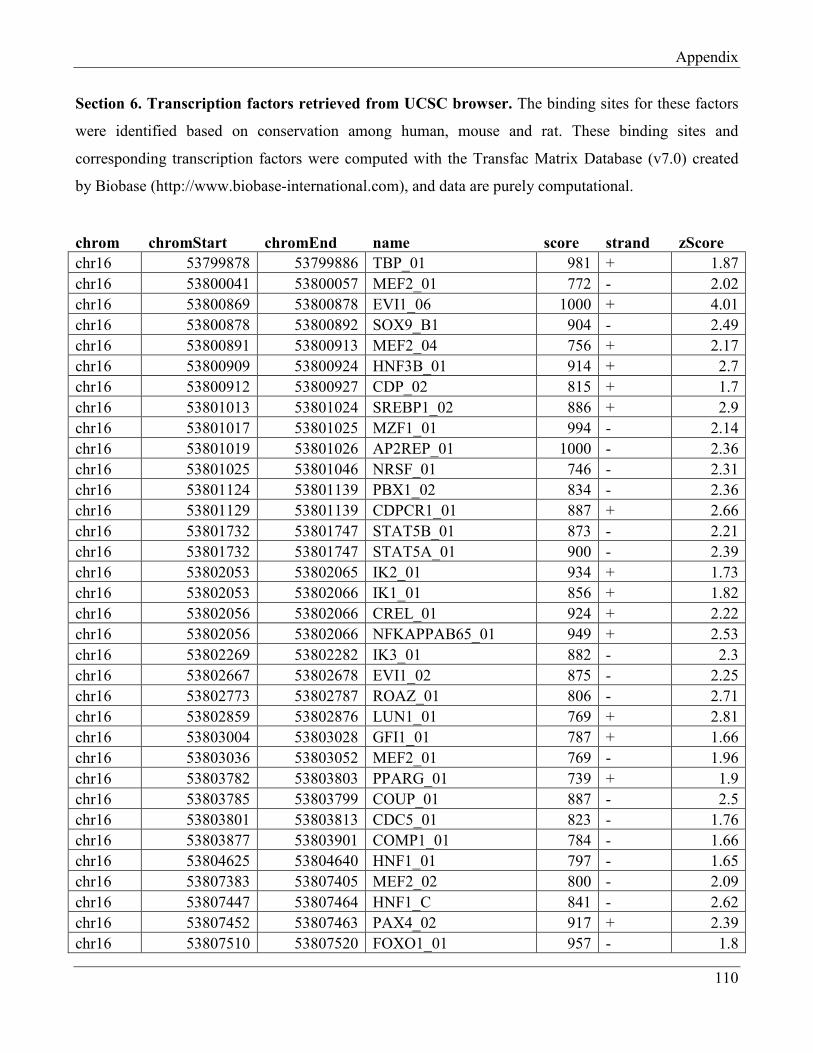
Appendix
110
Section 6. Transcription factors retrieved from UCSC browser. The binding sites for these factors
were identified based on conservation among human, mouse and rat. These binding sites and
corresponding transcription factors were computed with the Transfac Matrix Database (v7.0) created
by Biobase (http://www.biobase-international.com), and data are purely computational.
chrom chromStart chromEnd name score strand zScore
chr16 53799878 53799886 TBP_01 981 + 1.87
chr16 53800041 53800057 MEF2_01 772 - 2.02
chr16 53800869 53800878 EVI1_06 1000 + 4.01
chr16 53800878 53800892 SOX9_B1 904 - 2.49
chr16 53800891 53800913 MEF2_04 756 + 2.17
chr16 53800909 53800924 HNF3B_01 914 + 2.7
chr16 53800912 53800927 CDP_02 815 + 1.7
chr16 53801013 53801024 SREBP1_02 886 + 2.9
chr16 53801017 53801025 MZF1_01 994 - 2.14
chr16 53801019 53801026 AP2REP_01 1000 - 2.36
chr16 53801025 53801046 NRSF_01 746 - 2.31
chr16 53801124 53801139 PBX1_02 834 - 2.36
chr16 53801129 53801139 CDPCR1_01 887 + 2.66
chr16 53801732 53801747 STAT5B_01 873 - 2.21
chr16 53801732 53801747 STAT5A_01 900 - 2.39
chr16 53802053 53802065 IK2_01 934 + 1.73
chr16 53802053 53802066 IK1_01 856 + 1.82
chr16 53802056 53802066 CREL_01 924 + 2.22
chr16 53802056 53802066 NFKAPPAB65_01 949 + 2.53
chr16 53802269 53802282 IK3_01 882 - 2.3
chr16 53802667 53802678 EVI1_02 875 - 2.25
chr16 53802773 53802787 ROAZ_01 806 - 2.71
chr16 53802859 53802876 LUN1_01 769 + 2.81
chr16 53803004 53803028 GFI1_01 787 + 1.66
chr16 53803036 53803052 MEF2_01 769 - 1.96
chr16 53803782 53803803 PPARG_01 739 + 1.9
chr16 53803785 53803799 COUP_01 887 - 2.5
chr16 53803801 53803813 CDC5_01 823 - 1.76
chr16 53803877 53803901 COMP1_01 784 - 1.66
chr16 53804625 53804640 HNF1_01 797 - 1.65
chr16 53807383 53807405 MEF2_02 800 - 2.09
chr16 53807447 53807464 HNF1_C 841 - 2.62
chr16 53807452 53807463 PAX4_02 917 + 2.39
chr16 53807510 53807520 FOXO1_01 957 - 1.8
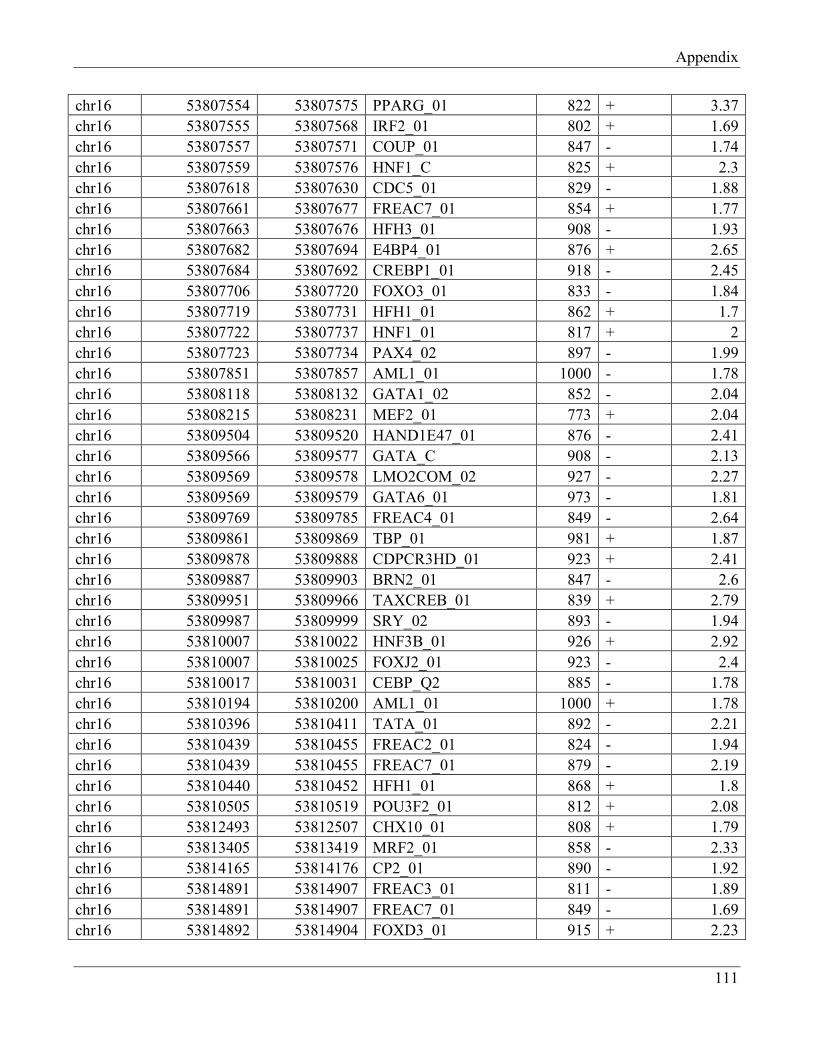
Appendix
111
chr16 53807554 53807575 PPARG_01 822 + 3.37
chr16 53807555 53807568 IRF2_01 802 + 1.69
chr16 53807557 53807571 COUP_01 847 - 1.74
chr16 53807559 53807576 HNF1_C 825 + 2.3
chr16 53807618 53807630 CDC5_01 829 - 1.88
chr16 53807661 53807677 FREAC7_01 854 + 1.77
chr16 53807663 53807676 HFH3_01 908 - 1.93
chr16 53807682 53807694 E4BP4_01 876 + 2.65
chr16 53807684 53807692 CREBP1_01 918 - 2.45
chr16 53807706 53807720 FOXO3_01 833 - 1.84
chr16 53807719 53807731 HFH1_01 862 + 1.7
chr16 53807722 53807737 HNF1_01 817 + 2
chr16 53807723 53807734 PAX4_02 897 - 1.99
chr16 53807851 53807857 AML1_01 1000 - 1.78
chr16 53808118 53808132 GATA1_02 852 - 2.04
chr16 53808215 53808231 MEF2_01 773 + 2.04
chr16 53809504 53809520 HAND1E47_01 876 - 2.41
chr16 53809566 53809577 GATA_C 908 - 2.13
chr16 53809569 53809578 LMO2COM_02 927 - 2.27
chr16 53809569 53809579 GATA6_01 973 - 1.81
chr16 53809769 53809785 FREAC4_01 849 - 2.64
chr16 53809861 53809869 TBP_01 981 + 1.87
chr16 53809878 53809888 CDPCR3HD_01 923 + 2.41
chr16 53809887 53809903 BRN2_01 847 - 2.6
chr16 53809951 53809966 TAXCREB_01 839 + 2.79
chr16 53809987 53809999 SRY_02 893 - 1.94
chr16 53810007 53810022 HNF3B_01 926 + 2.92
chr16 53810007 53810025 FOXJ2_01 923 - 2.4
chr16 53810017 53810031 CEBP_Q2 885 - 1.78
chr16 53810194 53810200 AML1_01 1000 + 1.78
chr16 53810396 53810411 TATA_01 892 - 2.21
chr16 53810439 53810455 FREAC2_01 824 - 1.94
chr16 53810439 53810455 FREAC7_01 879 - 2.19
chr16 53810440 53810452 HFH1_01 868 + 1.8
chr16 53810505 53810519 POU3F2_01 812 + 2.08
chr16 53812493 53812507 CHX10_01 808 + 1.79
chr16 53813405 53813419 MRF2_01 858 - 2.33
chr16 53814165 53814176 CP2_01 890 - 1.92
chr16 53814891 53814907 FREAC3_01 811 - 1.89
chr16 53814891 53814907 FREAC7_01 849 - 1.69
chr16 53814892 53814904 FOXD3_01 915 + 2.23
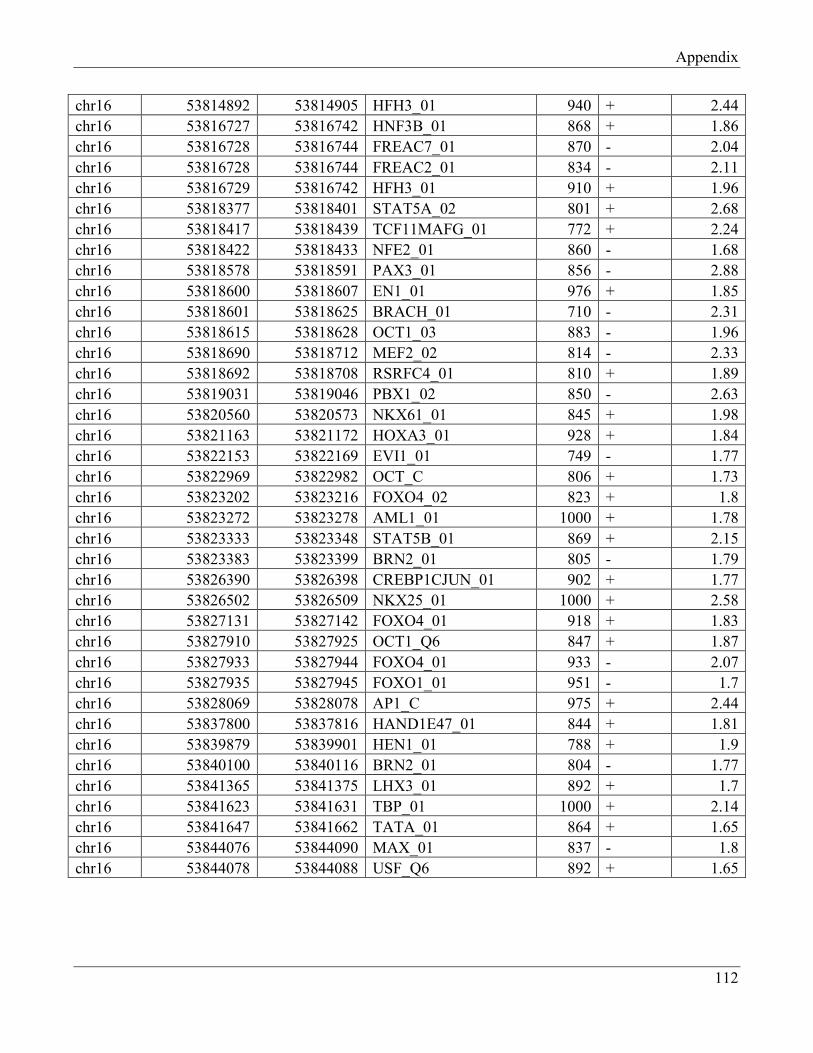
Appendix
112
chr16 53814892 53814905 HFH3_01 940 + 2.44
chr16 53816727 53816742 HNF3B_01 868 + 1.86
chr16 53816728 53816744 FREAC7_01 870 - 2.04
chr16 53816728 53816744 FREAC2_01 834 - 2.11
chr16 53816729 53816742 HFH3_01 910 + 1.96
chr16 53818377 53818401 STAT5A_02 801 + 2.68
chr16 53818417 53818439 TCF11MAFG_01 772 + 2.24
chr16 53818422 53818433 NFE2_01 860 - 1.68
chr16 53818578 53818591 PAX3_01 856 - 2.88
chr16 53818600 53818607 EN1_01 976 + 1.85
chr16 53818601 53818625 BRACH_01 710 - 2.31
chr16 53818615 53818628 OCT1_03 883 - 1.96
chr16 53818690 53818712 MEF2_02 814 - 2.33
chr16 53818692 53818708 RSRFC4_01 810 + 1.89
chr16 53819031 53819046 PBX1_02 850 - 2.63
chr16 53820560 53820573 NKX61_01 845 + 1.98
chr16 53821163 53821172 HOXA3_01 928 + 1.84
chr16 53822153 53822169 EVI1_01 749 - 1.77
chr16 53822969 53822982 OCT_C 806 + 1.73
chr16 53823202 53823216 FOXO4_02 823 + 1.8
chr16 53823272 53823278 AML1_01 1000 + 1.78
chr16 53823333 53823348 STAT5B_01 869 + 2.15
chr16 53823383 53823399 BRN2_01 805 - 1.79
chr16 53826390 53826398 CREBP1CJUN_01 902 + 1.77
chr16 53826502 53826509 NKX25_01 1000 + 2.58
chr16 53827131 53827142 FOXO4_01 918 + 1.83
chr16 53827910 53827925 OCT1_Q6 847 + 1.87
chr16 53827933 53827944 FOXO4_01 933 - 2.07
chr16 53827935 53827945 FOXO1_01 951 - 1.7
chr16 53828069 53828078 AP1_C 975 + 2.44
chr16 53837800 53837816 HAND1E47_01 844 + 1.81
chr16 53839879 53839901 HEN1_01 788 + 1.9
chr16 53840100 53840116 BRN2_01 804 - 1.77
chr16 53841365 53841375 LHX3_01 892 + 1.7
chr16 53841623 53841631 TBP_01 1000 + 2.14
chr16 53841647 53841662 TATA_01 864 + 1.65
chr16 53844076 53844090 MAX_01 837 - 1.8
chr16 53844078 53844088 USF_Q6 892 + 1.65
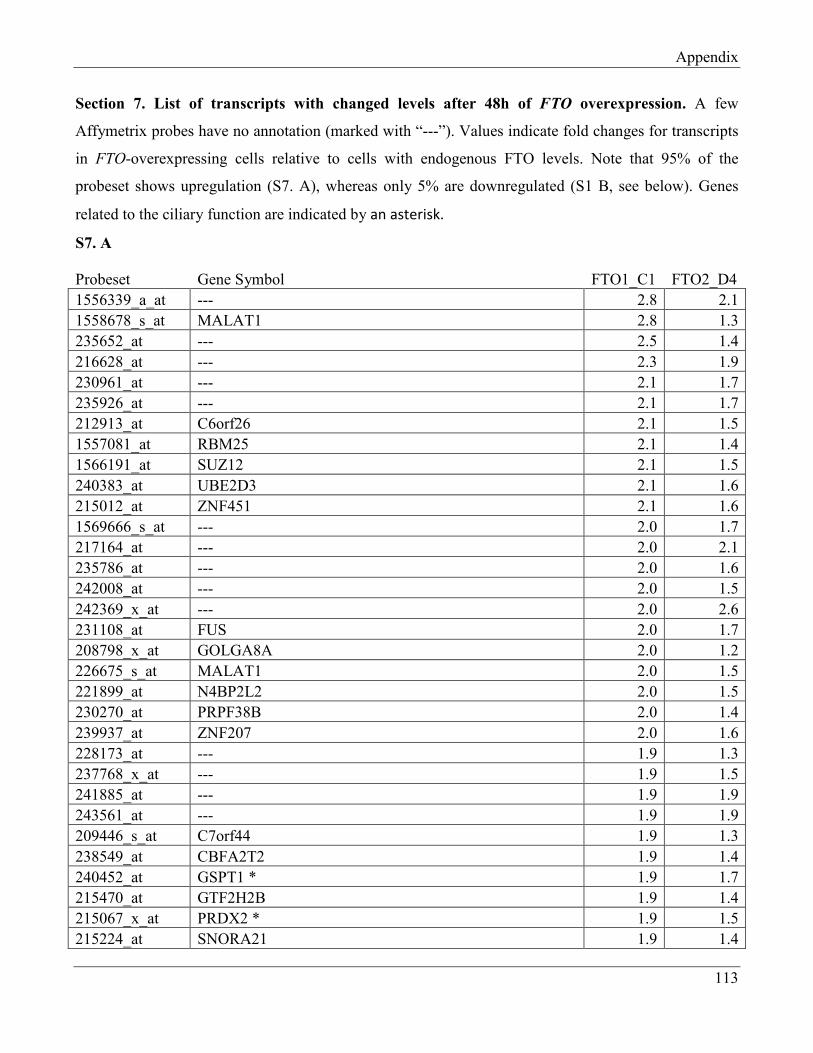
Appendix
113
Section 7. List of transcripts with changed levels after 48h of FTO overexpression. A few
Affymetrix probes have no annotation (marked with “---”). Values indicate fold changes for transcripts
in FTO-overexpressing cells relative to cells with endogenous FTO levels. Note that 95% of the
probeset shows upregulation (S7. A), whereas only 5% are downregulated (S1 B, see below). Genes
related to the ciliary function are indicated by an asterisk.
S7. A
Probeset Gene Symbol FTO1_C1 FTO2_D4
1556339_a_at --- 2.8 2.1
1558678_s_at MALAT1 2.8 1.3
235652_at --- 2.5 1.4
216628_at --- 2.3 1.9
230961_at --- 2.1 1.7
235926_at --- 2.1 1.7
212913_at C6orf26 2.1 1.5
1557081_at RBM25 2.1 1.4
1566191_at SUZ12 2.1 1.5
240383_at UBE2D3 2.1 1.6
215012_at ZNF451 2.1 1.6
1569666_s_at --- 2.0 1.7
217164_at --- 2.0 2.1
235786_at --- 2.0 1.6
242008_at --- 2.0 1.5
242369_x_at --- 2.0 2.6
231108_at FUS 2.0 1.7
208798_x_at GOLGA8A 2.0 1.2
226675_s_at MALAT1 2.0 1.5
221899_at N4BP2L2 2.0 1.5
230270_at PRPF38B 2.0 1.4
239937_at ZNF207 2.0 1.6
228173_at --- 1.9 1.3
237768_x_at --- 1.9 1.5
241885_at --- 1.9 1.9
243561_at --- 1.9 1.9
209446_s_at C7orf44 1.9 1.3
238549_at CBFA2T2 1.9 1.4
240452_at GSPT1 * 1.9 1.7
215470_at GTF2H2B 1.9 1.4
215067_x_at PRDX2 * 1.9 1.5
215224_at SNORA21 1.9 1.4
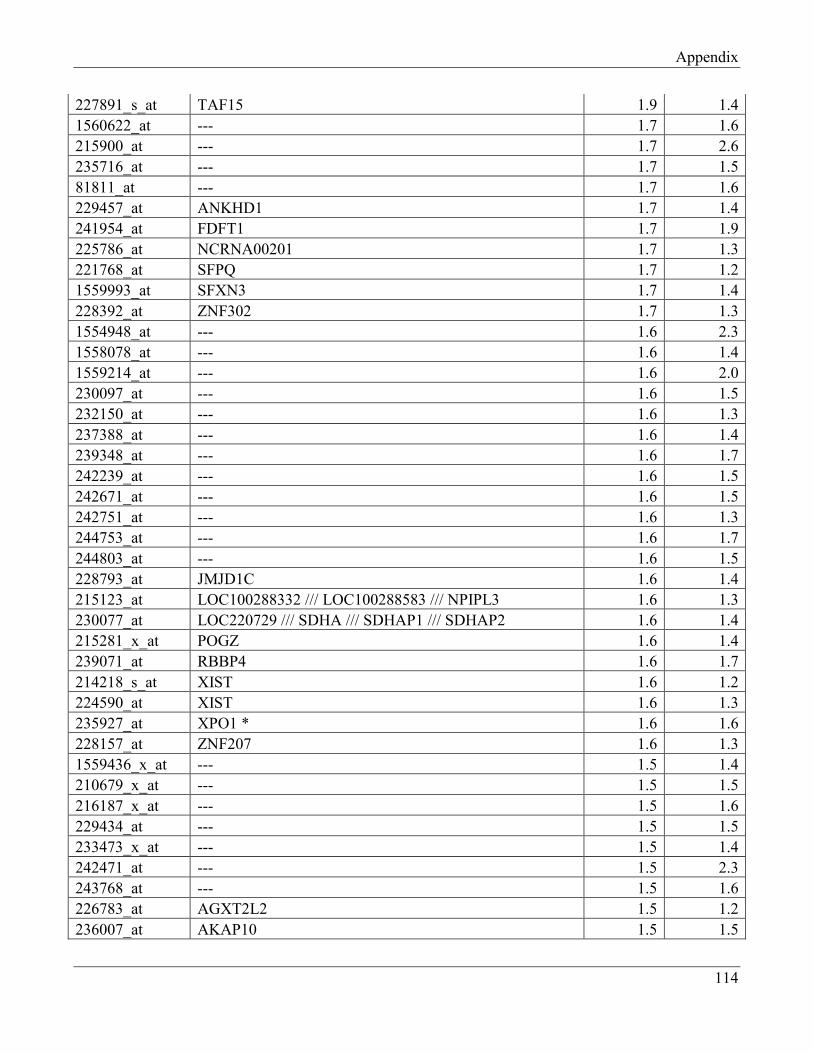
Appendix
114
227891_s_at TAF15 1.9 1.4
1560622_at --- 1.7 1.6
215900_at --- 1.7 2.6
235716_at --- 1.7 1.5
81811_at --- 1.7 1.6
229457_at ANKHD1 1.7 1.4
241954_at FDFT1 1.7 1.9
225786_at NCRNA00201 1.7 1.3
221768_at SFPQ 1.7 1.2
1559993_at SFXN3 1.7 1.4
228392_at ZNF302 1.7 1.3
1554948_at --- 1.6 2.3
1558078_at --- 1.6 1.4
1559214_at --- 1.6 2.0
230097_at --- 1.6 1.5
232150_at --- 1.6 1.3
237388_at --- 1.6 1.4
239348_at --- 1.6 1.7
242239_at --- 1.6 1.5
242671_at --- 1.6 1.5
242751_at --- 1.6 1.3
244753_at --- 1.6 1.7
244803_at --- 1.6 1.5
228793_at JMJD1C 1.6 1.4
215123_at LOC100288332 /// LOC100288583 /// NPIPL3 1.6 1.3
230077_at LOC220729 /// SDHA /// SDHAP1 /// SDHAP2 1.6 1.4
215281_x_at POGZ 1.6 1.4
239071_at RBBP4 1.6 1.7
214218_s_at XIST 1.6 1.2
224590_at XIST 1.6 1.3
235927_at XPO1 * 1.6 1.6
228157_at ZNF207 1.6 1.3
1559436_x_at --- 1.5 1.4
210679_x_at --- 1.5 1.5
216187_x_at --- 1.5 1.6
229434_at --- 1.5 1.5
233473_x_at --- 1.5 1.4
242471_at --- 1.5 2.3
243768_at --- 1.5 1.6
226783_at AGXT2L2 1.5 1.2
236007_at AKAP10 1.5 1.5
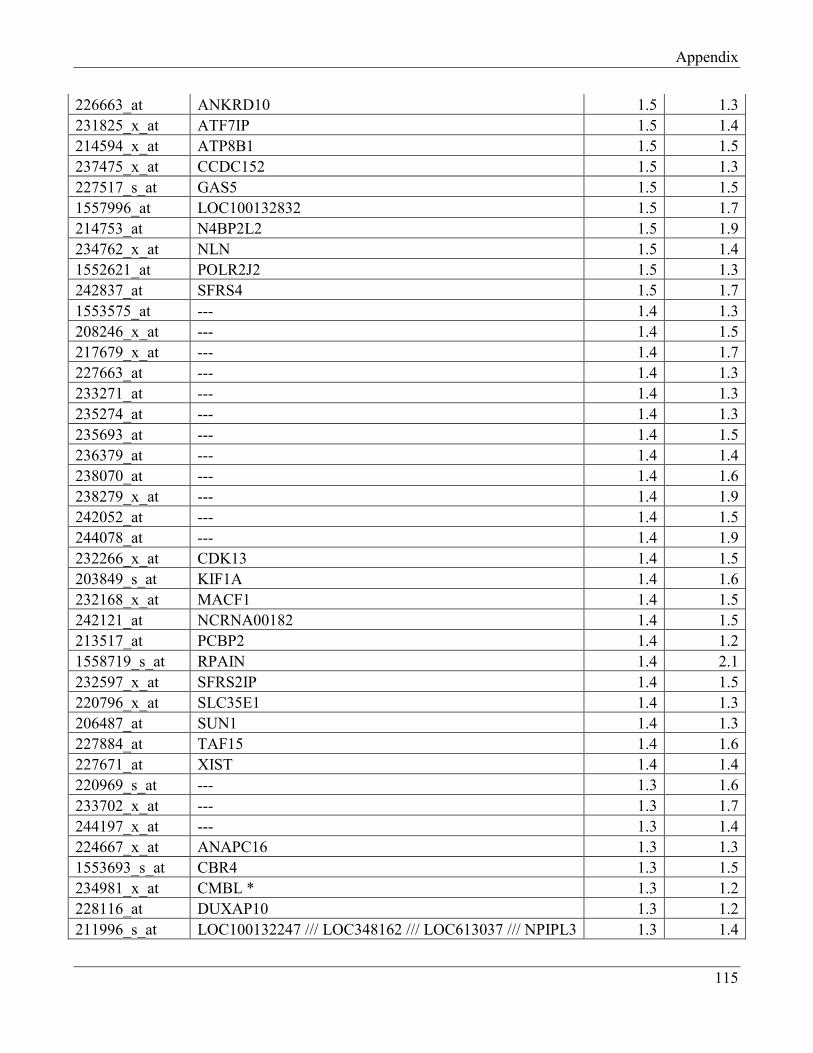
Appendix
115
226663_at ANKRD10 1.5 1.3
231825_x_at ATF7IP 1.5 1.4
214594_x_at ATP8B1 1.5 1.5
237475_x_at CCDC152 1.5 1.3
227517_s_at GAS5 1.5 1.5
1557996_at LOC100132832 1.5 1.7
214753_at N4BP2L2 1.5 1.9
234762_x_at NLN 1.5 1.4
1552621_at POLR2J2 1.5 1.3
242837_at SFRS4 1.5 1.7
1553575_at --- 1.4 1.3
208246_x_at --- 1.4 1.5
217679_x_at --- 1.4 1.7
227663_at --- 1.4 1.3
233271_at --- 1.4 1.3
235274_at --- 1.4 1.3
235693_at --- 1.4 1.5
236379_at --- 1.4 1.4
238070_at --- 1.4 1.6
238279_x_at --- 1.4 1.9
242052_at --- 1.4 1.5
244078_at --- 1.4 1.9
232266_x_at CDK13 1.4 1.5
203849_s_at KIF1A 1.4 1.6
232168_x_at MACF1 1.4 1.5
242121_at NCRNA00182 1.4 1.5
213517_at PCBP2 1.4 1.2
1558719_s_at RPAIN 1.4 2.1
232597_x_at SFRS2IP 1.4 1.5
220796_x_at SLC35E1 1.4 1.3
206487_at SUN1 1.4 1.3
227884_at TAF15 1.4 1.6
227671_at XIST 1.4 1.4
220969_s_at --- 1.3 1.6
233702_x_at --- 1.3 1.7
244197_x_at --- 1.3 1.4
224667_x_at ANAPC16 1.3 1.3
1553693_s_at CBR4 1.3 1.5
234981_x_at CMBL * 1.3 1.2
228116_at DUXAP10 1.3 1.2
211996_s_at LOC100132247 /// LOC348162 /// LOC613037 /// NPIPL3 1.3 1.4
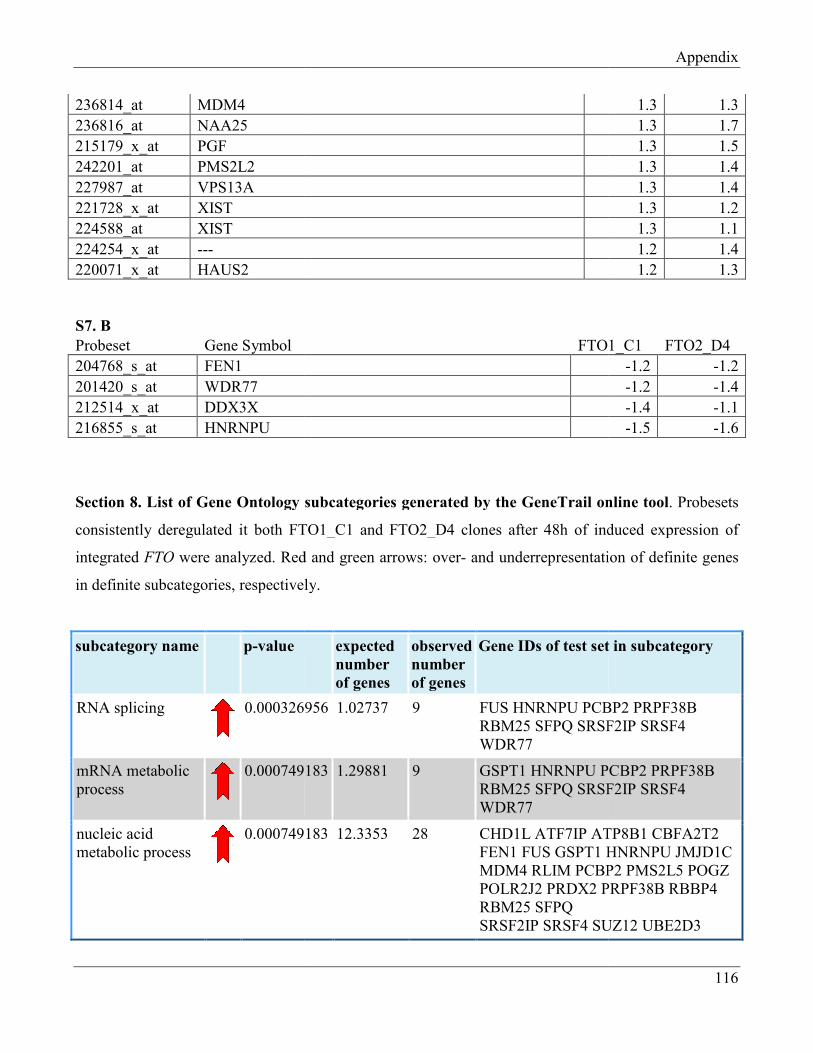
236814_at MDM4
236816_at NAA25
215179_x_at PGF
242201_at PMS2L2
227987_at VPS13A
221728_x_at XIST
224588_at XIST
224254_x_at ---
220071_x_at HAUS2
S7. B
Probeset Gene Symbol
204768_s_at FEN1
201420_s_at WDR77
212514_x_at DDX3X
216855_s_at HNRNPU
Section 8. List of Gene Ontology subcategories generated by
consistently deregulated it both FTO1_C1 and FTO2_D4 clones after 48h of induced expression of
integrated FTO were analyzed. Red and green arrows: over
in definite subcategories, respectively
subcategory name p-value
RNA splicing
0.000326956
mRNA metabolic
process
0.000749183
nucleic acid
metabolic process
0.000749183
FTO1_C1
List of Gene Ontology subcategories generated by the GeneTrail online tool
consistently deregulated it both FTO1_C1 and FTO2_D4 clones after 48h of induced expression of
were analyzed. Red and green arrows: over- and underrepresentation of definite genes
, respectively.
expected
number
of genes
observed
number
of genes
Gene IDs of test set in subcategory
0.000326956 1.02737 9 FUS HNRNPU PCBP2
RBM25 SFPQ SRSF2IP
WDR77
0.000749183 1.29881 9 GSPT1 HNRNPU PCBP2
RBM25 SFPQ SRSF2IP
WDR77
0.000749183 12.3353 28 CHD1L ATF7IP ATP8B1
FEN1 FUS GSPT1 HNRNPU
MDM4 RLIM PCBP2
POLR2J2 PRDX2 PRPF38B
RBM25 SFPQ
SRSF2IP SRSF4 SUZ12
Appendix
116
1.3 1.3
1.3 1.7
1.3 1.5
1.3 1.4
1.3 1.4
1.3 1.2
1.3 1.1
1.2 1.4
1.2 1.3
FTO1_C1 FTO2_D4
-1.2 -1.2
-1.2 -1.4
-1.4 -1.1
-1.5 -1.6
GeneTrail online tool. Probesets
consistently deregulated it both FTO1_C1 and FTO2_D4 clones after 48h of induced expression of
and underrepresentation of definite genes
Gene IDs of test set in subcategory
PCBP2 PRPF38B
SRSF2IP SRSF4
PCBP2 PRPF38B
SRSF2IP SRSF4
ATP8B1 CBFA2T2
HNRNPU JMJD1C
PCBP2 PMS2L5 POGZ
PRPF38B RBBP4
SUZ12 UBE2D3
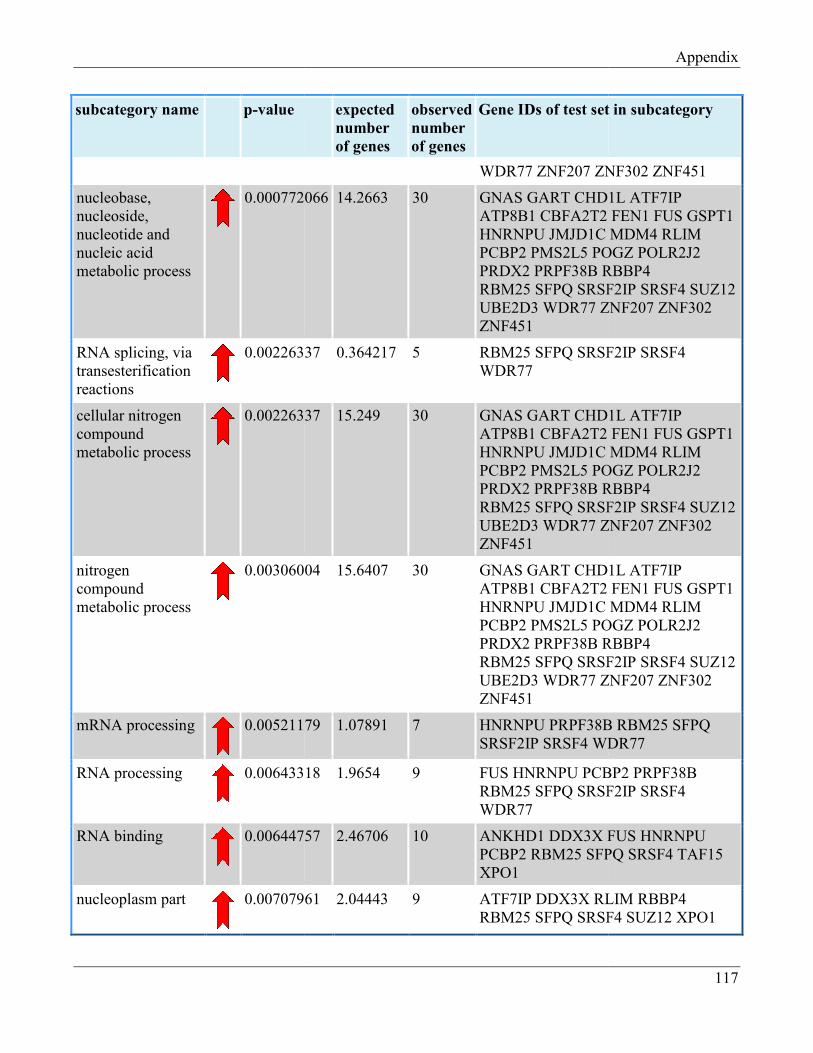
subcategory name p-value
nucleobase,
nucleoside,
nucleotide and
nucleic acid
metabolic process
0.000772066
RNA splicing, via
transesterification
reactions
0.00226337
cellular nitrogen
compound
metabolic process
0.00226337
nitrogen
compound
metabolic process
0.00306004
mRNA processing
0.00521179
RNA processing
0.00643318
RNA binding
0.00644757
nucleoplasm part
0.00707961
expected
number
of genes
observed
number
of genes
Gene IDs of test set in subcategory
WDR77 ZNF207 ZNF302
0.000772066 14.2663 30 GNAS GART CHD1L
ATP8B1 CBFA2T2
HNRNPU JMJD1C
PCBP2 PMS2L5 POGZ
PRDX2 PRPF38B RBBP4
RBM25 SFPQ SRSF2IP
UBE2D3 WDR77 ZNF207
ZNF451
0.00226337 0.364217 5 RBM25 SFPQ SRSF2IP
WDR77
0.00226337 15.249 30 GNAS GART CHD1L
ATP8B1 CBFA2T2
HNRNPU JMJD1C
PCBP2 PMS2L5 POGZ
PRDX2 PRPF38B RBBP4
RBM25 SFPQ SRSF2IP
UBE2D3 WDR77 ZNF207
ZNF451
0.00306004 15.6407 30 GNAS GART CHD1L
ATP8B1 CBFA2T2
HNRNPU JMJD1C
PCBP2 PMS2L5 POGZ
PRDX2 PRPF38B RBBP4
RBM25 SFPQ SRSF2IP
UBE2D3 WDR77 ZNF207
ZNF451
0.00521179 1.07891 7 HNRNPU PRPF38B
SRSF2IP SRSF4 WDR77
0.00643318 1.9654 9 FUS HNRNPU PCBP2
RBM25 SFPQ SRSF2IP
WDR77
0.00644757 2.46706 10 ANKHD1 DDX3X FUS
PCBP2 RBM25 SFPQ
XPO1
0.00707961 2.04443 9 ATF7IP DDX3X RLIM
RBM25 SFPQ SRSF4
Appendix
117
Gene IDs of test set in subcategory
ZNF302 ZNF451
CHD1L ATF7IP
FEN1 FUS GSPT1
MDM4 RLIM
POGZ POLR2J2
RBBP4
SRSF2IP SRSF4 SUZ12
ZNF207 ZNF302
SRSF2IP SRSF4
CHD1L ATF7IP
FEN1 FUS GSPT1
MDM4 RLIM
POGZ POLR2J2
RBBP4
SRSF2IP SRSF4 SUZ12
ZNF207 ZNF302
CHD1L ATF7IP
FEN1 FUS GSPT1
MDM4 RLIM
POGZ POLR2J2
RBBP4
SRSF2IP SRSF4 SUZ12
ZNF207 ZNF302
PRPF38B RBM25 SFPQ
WDR77
PCBP2 PRPF38B
SRSF2IP SRSF4
FUS HNRNPU
SFPQ SRSF4 TAF15
RLIM RBBP4
SRSF4 SUZ12 XPO1
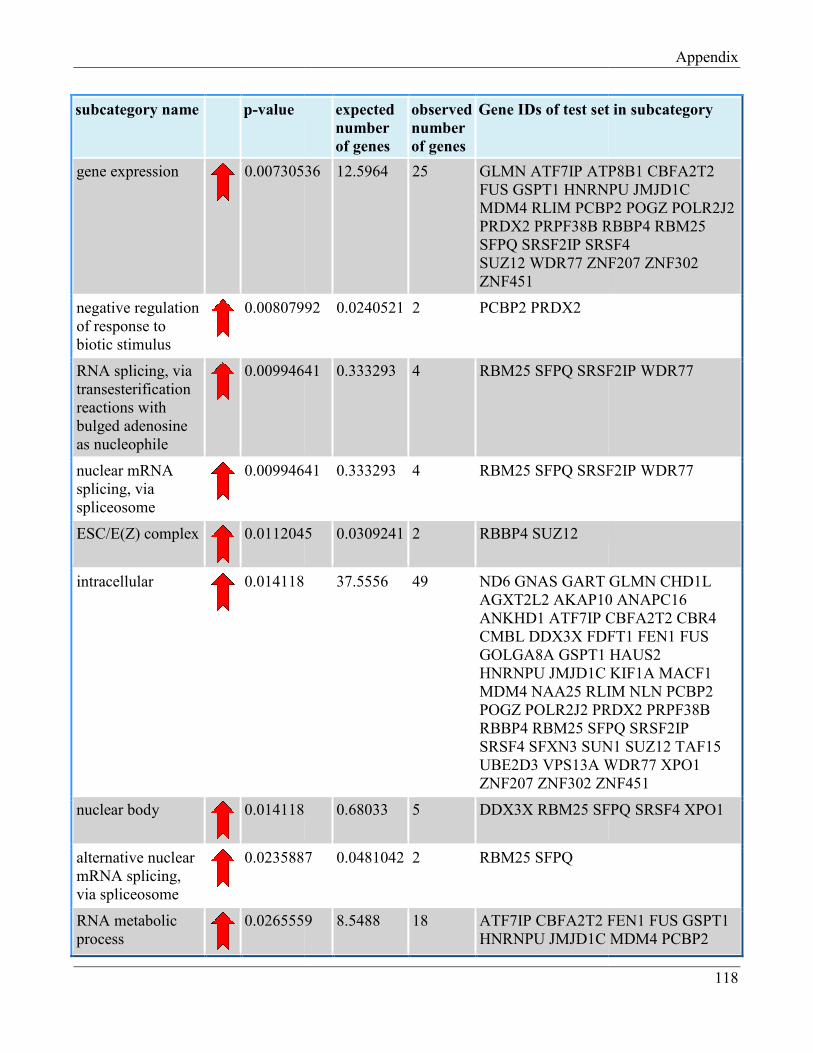
subcategory name p-value
gene expression
0.00730536
negative regulation
of response to
biotic stimulus
0.00807992
RNA splicing, via
transesterification
reactions with
bulged adenosine
as nucleophile
0.00994641
nuclear mRNA
splicing, via
spliceosome
0.00994641
ESC/E(Z) complex
0.0112045
intracellular
0.014118
nuclear body
0.014118
alternative nuclear
mRNA splicing,
via spliceosome
0.0235887
RNA metabolic
process
0.0265559
expected
number
of genes
observed
number
of genes
Gene IDs of test set in subcategory
0.00730536 12.5964 25 GLMN ATF7IP ATP8B1
FUS GSPT1 HNRNPU
MDM4 RLIM PCBP2
PRDX2 PRPF38B RBBP4
SFPQ SRSF2IP SRSF4
SUZ12 WDR77 ZNF207
ZNF451
0.00807992 0.0240521 2 PCBP2 PRDX2
0.00994641 0.333293 4 RBM25 SFPQ SRSF2IP
0.00994641 0.333293 4 RBM25 SFPQ SRSF2IP
0.0112045 0.0309241 2 RBBP4 SUZ12
0.014118 37.5556 49 ND6 GNAS GART
AGXT2L2 AKAP10
ANKHD1 ATF7IP CBF
CMBL DDX3X FDFT1
GOLGA8A GSPT1
HNRNPU JMJD1C
MDM4 NAA25 RLIM
POGZ POLR2J2 PRDX2
RBBP4 RBM25 SFPQ
SRSF4 SFXN3 SUN1
UBE2D3 VPS13A WDR7
ZNF207 ZNF302 ZNF451
0.014118 0.68033 5 DDX3X RBM25 SFPQ
0.0235887 0.0481042 2 RBM25 SFPQ
0.0265559 8.5488 18 ATF7IP CBFA2T2 FEN1
HNRNPU JMJD1C
Appendix
118
Gene IDs of test set in subcategory
ATP8B1 CBFA2T2
HNRNPU JMJD1C
PCBP2 POGZ POLR2J2
RBBP4 RBM25
SRSF4
ZNF207 ZNF302
SRSF2IP WDR77
SRSF2IP WDR77
GLMN CHD1L
AKAP10 ANAPC16
CBFA2T2 CBR4
FDFT1 FEN1 FUS
HAUS2
KIF1A MACF1
RLIM NLN PCBP2
PRDX2 PRPF38B
SFPQ SRSF2IP
SUN1 SUZ12 TAF15
WDR77 XPO1
ZNF451
SFPQ SRSF4 XPO1
FEN1 FUS GSPT1
MDM4 PCBP2
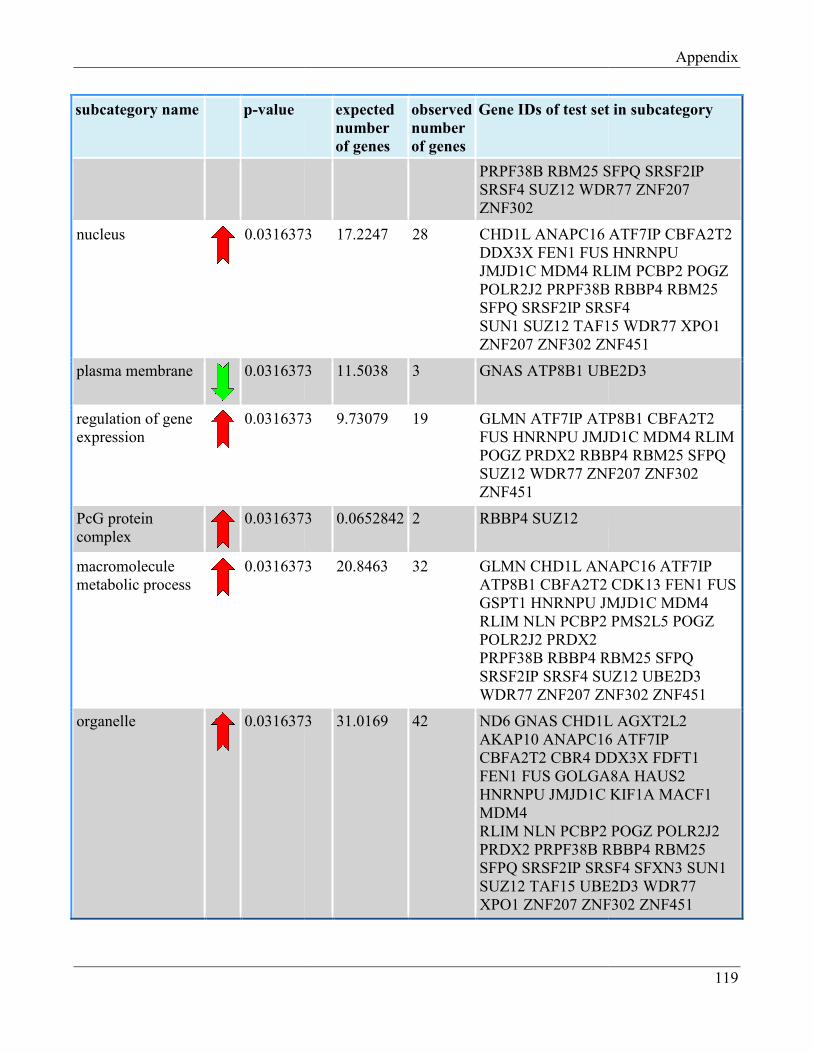
subcategory name p-value
nucleus
0.0316373
plasma membrane
0.0316373
regulation of gene
expression
0.0316373
PcG protein
complex
0.0316373
macromolecule
metabolic process
0.0316373
organelle
0.0316373
expected
number
of genes
observed
number
of genes
Gene IDs of test set in subcategory
PRPF38B RBM25 SFPQ
SRSF4 SUZ12 WDR77
ZNF302
0.0316373 17.2247 28 CHD1L ANAPC16
DDX3X FEN1 FUS
JMJD1C MDM4 RLI
POLR2J2 PRPF38B
SFPQ SRSF2IP SRSF4
SUN1 SUZ12 TAF15
ZNF207 ZNF302 ZNF451
0.0316373 11.5038 3 GNAS ATP8B1 UBE2D3
0.0316373 9.73079 19 GLMN ATF7IP ATP8B1
FUS HNRNPU JMJD1C
POGZ PRDX2 RBBP4
SUZ12 WDR77 ZNF207
ZNF451
0.0316373 0.0652842 2 RBBP4 SUZ12
0.0316373 20.8463 32 GLMN CHD1L ANAPC16
ATP8B1 CBFA2T2
GSPT1 HNRNPU JMJD1C
RLIM NLN PCBP2
POLR2J2 PRDX2
PRPF38B RBBP4 RBM25
SRSF2IP SRSF4 SUZ12
WDR77 ZNF207 ZNF302
0.0316373 31.0169 42 ND6 GNAS CHD1L
AKAP10 ANAPC16
CBFA2T2 CBR4 DDX3X
FEN1 FUS GOLGA8A
HNRNPU JMJD1C
MDM4
RLIM NLN PCBP2
PRDX2 PRPF38B RBBP4
SFPQ SRSF2IP SRSF4
SUZ12 TAF15 UBE2D3
XPO1 ZNF207 ZNF302
Appendix
119
Gene IDs of test set in subcategory
SFPQ SRSF2IP
WDR77 ZNF207
ATF7IP CBFA2T2
FUS HNRNPU
RLIM PCBP2 POGZ
PRPF38B RBBP4 RBM25
SRSF4
TAF15 WDR77 XPO1
ZNF451
UBE2D3
ATP8B1 CBFA2T2
JMJD1C MDM4 RLIM
RBBP4 RBM25 SFPQ
ZNF207 ZNF302
ANAPC16 ATF7IP
CDK13 FEN1 FUS
JMJD1C MDM4
PMS2L5 POGZ
RBM25 SFPQ
SUZ12 UBE2D3
ZNF302 ZNF451
CHD1L AGXT2L2
ANAPC16 ATF7IP
DDX3X FDFT1
GOLGA8A HAUS2
KIF1A MACF1
POGZ POLR2J2
RBBP4 RBM25
SRSF4 SFXN3 SUN1
UBE2D3 WDR77
ZNF302 ZNF451
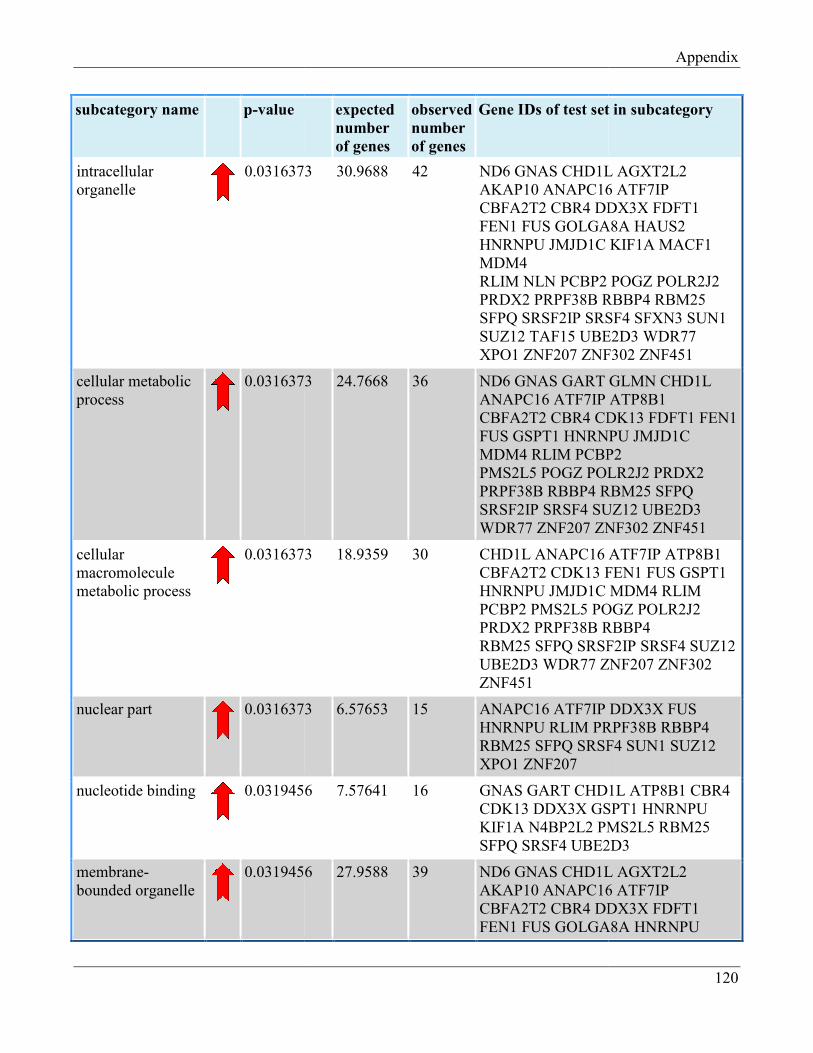
subcategory name p-value
intracellular
organelle
0.0316373
cellular metabolic
process
0.0316373
cellular
macromolecule
metabolic process
0.0316373
nuclear part
0.0316373
nucleotide binding
0.0319456
membrane-
bounded organelle
0.0319456
expected
number
of genes
observed
number
of genes
Gene IDs of test set in subcategory
0.0316373 30.9688 42 ND6 GNAS CHD1L
AKAP10 ANAPC16
CBFA2T2 CBR4 DDX3X
FEN1 FUS GOLGA8A
HNRNPU JMJD1C
MDM4
RLIM NLN PCBP2
PRDX2 PRPF38B RBBP4
SFPQ SRSF2IP SRSF4
SUZ12 TAF15 UBE2D3
XPO1 ZNF207 ZNF30
0.0316373 24.7668 36 ND6 GNAS GART
ANAPC16 ATF7IP
CBFA2T2 CBR4 CDK13
FUS GSPT1 HNRNPU
MDM4 RLIM PCBP2
PMS2L5 POGZ POLR2J2
PRPF38B RBBP4 RBM25
SRSF2IP SRSF4 SUZ12
WDR77 ZNF207 ZNF302
0.0316373 18.9359 30 CHD1L ANAPC16
CBFA2T2 CDK13 FEN1
HNRNPU JMJD1C
PCBP2 PMS2L5 POGZ
PRDX2 PRPF38B R
RBM25 SFPQ SRSF2IP
UBE2D3 WDR77 ZNF207
ZNF451
0.0316373 6.57653 15 ANAPC16 ATF7IP
HNRNPU RLIM PRPF38B
RBM25 SFPQ SRSF4
XPO1 ZNF207
0.0319456 7.57641 16 GNAS GART CHD1L
CDK13 DDX3X GSPT1
KIF1A N4BP2L2 PMS2L5
SFPQ SRSF4 UBE2D3
0.0319456 27.9588 39 ND6 GNAS CHD1L
AKAP10 ANAPC16
CBFA2T2 CBR4 DDX3X
FEN1 FUS GOLGA8A
Appendix
120
Gene IDs of test set in subcategory
CHD1L AGXT2L2
ANAPC16 ATF7IP
DDX3X FDFT1
GOLGA8A HAUS2
KIF1A MACF1
POGZ POLR2J2
RBBP4 RBM25
SRSF4 SFXN3 SUN1
UBE2D3 WDR77
ZNF302 ZNF451
GLMN CHD1L
ATP8B1
CDK13 FDFT1 FEN1
HNRNPU JMJD1C
PCBP2
POLR2J2 PRDX2
RBM25 SFPQ
SUZ12 UBE2D3
ZNF302 ZNF451
ATF7IP ATP8B1
FEN1 FUS GSPT1
MDM4 RLIM
POGZ POLR2J2
RBBP4
SRSF2IP SRSF4 SUZ12
ZNF207 ZNF302
DDX3X FUS
PRPF38B RBBP4
SRSF4 SUN1 SUZ12
CHD1L ATP8B1 CBR4
GSPT1 HNRNPU
PMS2L5 RBM25
UBE2D3
CHD1L AGXT2L2
ANAPC16 ATF7IP
DDX3X FDFT1
GOLGA8A HNRNPU
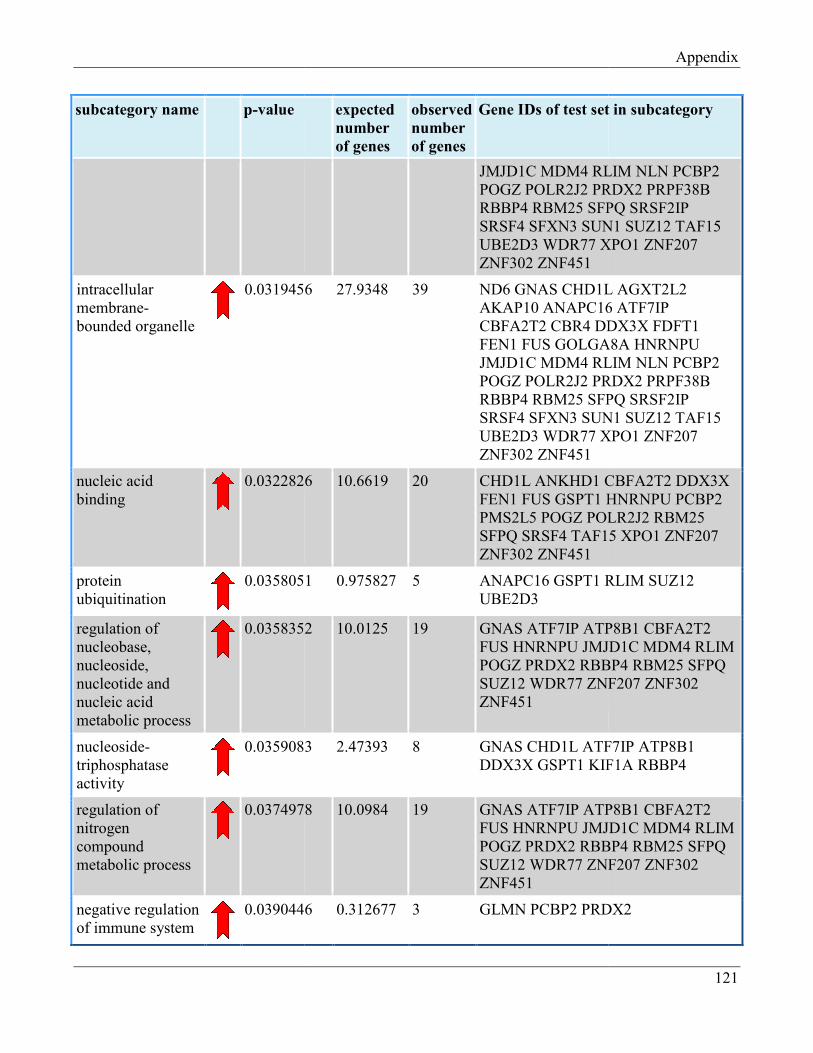
subcategory name p-value
intracellular
membrane-
bounded organelle
0.0319456
nucleic acid
binding
0.0322826
protein
ubiquitination
0.0358051
regulation of
nucleobase,
nucleoside,
nucleotide and
nucleic acid
metabolic process
0.0358352
nucleoside-
triphosphatase
activity
0.0359083
regulation of
nitrogen
compound
metabolic process
0.0374978
negative regulation
of immune system
0.0390446
expected
number
of genes
observed
number
of genes
Gene IDs of test set in subcategory
JMJD1C MDM4 RLIM
POGZ POLR2J2 PRDX2
RBBP4 RBM25 SFPQ
SRSF4 SFXN3 SUN1
UBE2D3 WDR77 XPO1
ZNF302 ZNF451
0.0319456 27.9348 39 ND6 GNAS CHD1L
AKAP10 ANAPC16
CBFA2T2 CBR4 DDX3X
FEN1 FUS GOLGA8A
JMJD1C MDM4 RLIM
POGZ POLR2J2 PRDX2
RBBP4 RBM25 SFPQ
SRSF4 SFXN3 SUN1
UBE2D3 WDR77 XPO1
ZNF302 ZNF451
0.0322826 10.6619 20 CHD1L ANKHD1 CBFA2T2
FEN1 FUS GSPT1 HNRNPU
PMS2L5 POGZ POLR2J2
SFPQ SRSF4 TAF15
ZNF302 ZNF451
0.0358051 0.975827 5 ANAPC16 GSPT1 RLIM
UBE2D3
0.0358352 10.0125 19 GNAS ATF7IP ATP8B1
FUS HNRNPU JMJD1C
POGZ PRDX2 RBBP4
SUZ12 WDR77 ZNF207
ZNF451
0.0359083 2.47393 8 GNAS CHD1L ATF7IP
DDX3X GSPT1 KIF1A
0.0374978 10.0984 19 GNAS ATF7IP ATP8B1
FUS HNRNPU JMJD1C
POGZ PRDX2 RBBP4
SUZ12 WDR77 ZNF207
ZNF451
0.0390446 0.312677 3 GLMN PCBP2 PRDX2
Appendix
121
Gene IDs of test set in subcategory
RLIM NLN PCBP2
PRDX2 PRPF38B
SFPQ SRSF2IP
SUN1 SUZ12 TAF15
XPO1 ZNF207
CHD1L AGXT2L2
ANAPC16 ATF7IP
DDX3X FDFT1
GOLGA8A HNRNPU
RLIM NLN PCBP2
PRDX2 PRPF38B
SFPQ SRSF2IP
SUN1 SUZ12 TAF15
XPO1 ZNF207
CBFA2T2 DDX3X
HNRNPU PCBP2
POLR2J2 RBM25
TAF15 XPO1 ZNF207
RLIM SUZ12
ATP8B1 CBFA2T2
JMJD1C MDM4 RLIM
RBBP4 RBM25 SFPQ
ZNF207 ZNF302
ATF7IP ATP8B1
KIF1A RBBP4
ATP8B1 CBFA2T2
JMJD1C MDM4 RLIM
RBBP4 RBM25 SFPQ
ZNF207 ZNF302
PRDX2
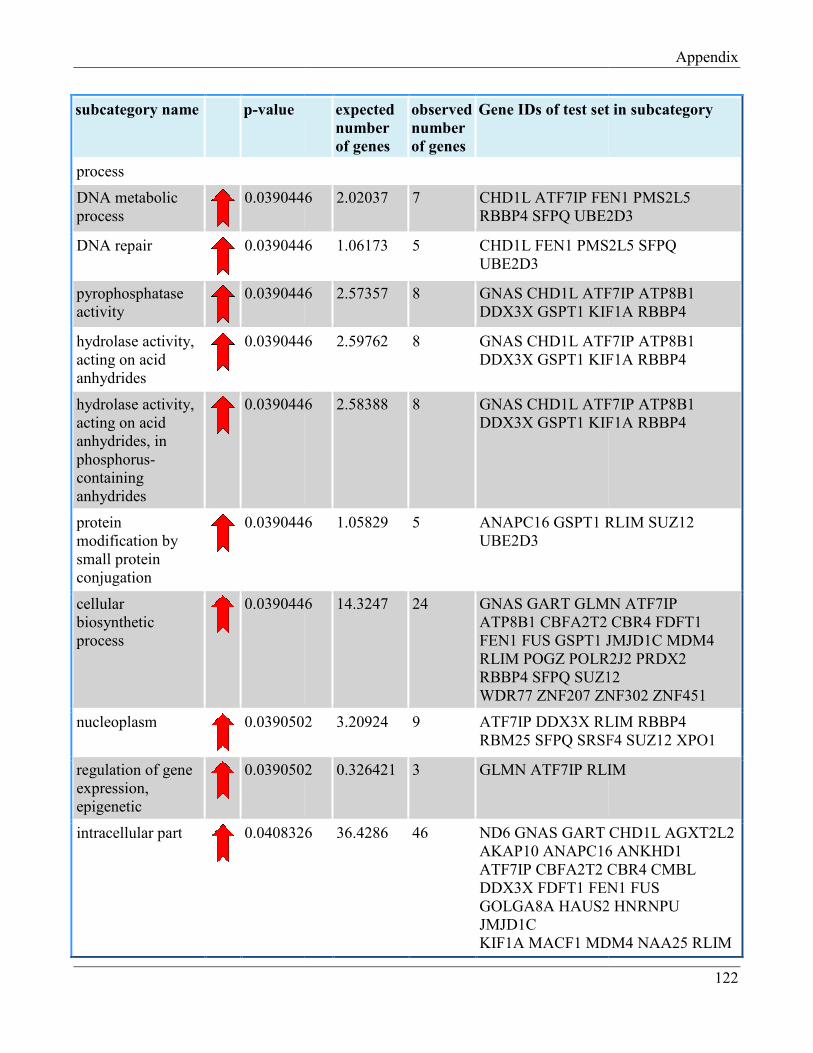
subcategory name p-value
process
DNA metabolic
process
0.0390446
DNA repair
0.0390446
pyrophosphatase
activity
0.0390446
hydrolase activity,
acting on acid
anhydrides
0.0390446
hydrolase activity,
acting on acid
anhydrides, in
phosphorus-
containing
anhydrides
0.0390446
protein
modification by
small protein
conjugation
0.0390446
cellular
biosynthetic
process
0.0390446
nucleoplasm
0.0390502
regulation of gene
expression,
epigenetic
0.0390502
intracellular part
0.0408326
expected
number
of genes
observed
number
of genes
Gene IDs of test set in subcategory
0.0390446 2.02037 7 CHD1L ATF7IP FEN1
RBBP4 SFPQ UBE2D3
0.0390446 1.06173 5 CHD1L FEN1 PMS2L5
UBE2D3
0.0390446 2.57357 8 GNAS CHD1L ATF7IP
DDX3X GSPT1 KIF1A
0.0390446 2.59762 8 GNAS CHD1L ATF7IP
DDX3X GSPT1 KIF1A
0.0390446 2.58388 8 GNAS CHD1L ATF7IP
DDX3X GSPT1 KIF1A
0.0390446 1.05829 5 ANAPC16 GSPT1 RLIM
UBE2D3
0.0390446 14.3247 24 GNAS GART GLMN
ATP8B1 CBFA2T2
FEN1 FUS GSPT1 JMJD1C
RLIM POGZ POLR2J2
RBBP4 SFPQ SUZ12
WDR77 ZNF207 ZNF302
0.0390502 3.20924 9 ATF7IP DDX3X RLIM
RBM25 SFPQ SRSF4
0.0390502 0.326421 3 GLMN ATF7IP RLIM
0.0408326 36.4286 46 ND6 GNAS GART
AKAP10 ANAPC16
ATF7IP CBFA2T2 CBR4
DDX3X FDFT1 FEN1
GOLGA8A HAUS2
JMJD1C
KIF1A MACF1 MDM4
Appendix
122
Gene IDs of test set in subcategory
FEN1 PMS2L5
UBE2D3
PMS2L5 SFPQ
ATF7IP ATP8B1
KIF1A RBBP4
ATF7IP ATP8B1
KIF1A RBBP4
ATF7IP ATP8B1
KIF1A RBBP4
RLIM SUZ12
GLMN ATF7IP
CBR4 FDFT1
JMJD1C MDM4
POLR2J2 PRDX2
SUZ12
ZNF302 ZNF451
RLIM RBBP4
SRSF4 SUZ12 XPO1
RLIM
CHD1L AGXT2L2
ANAPC16 ANKHD1
CBR4 CMBL
FEN1 FUS
HAUS2 HNRNPU
MDM4 NAA25 RLIM
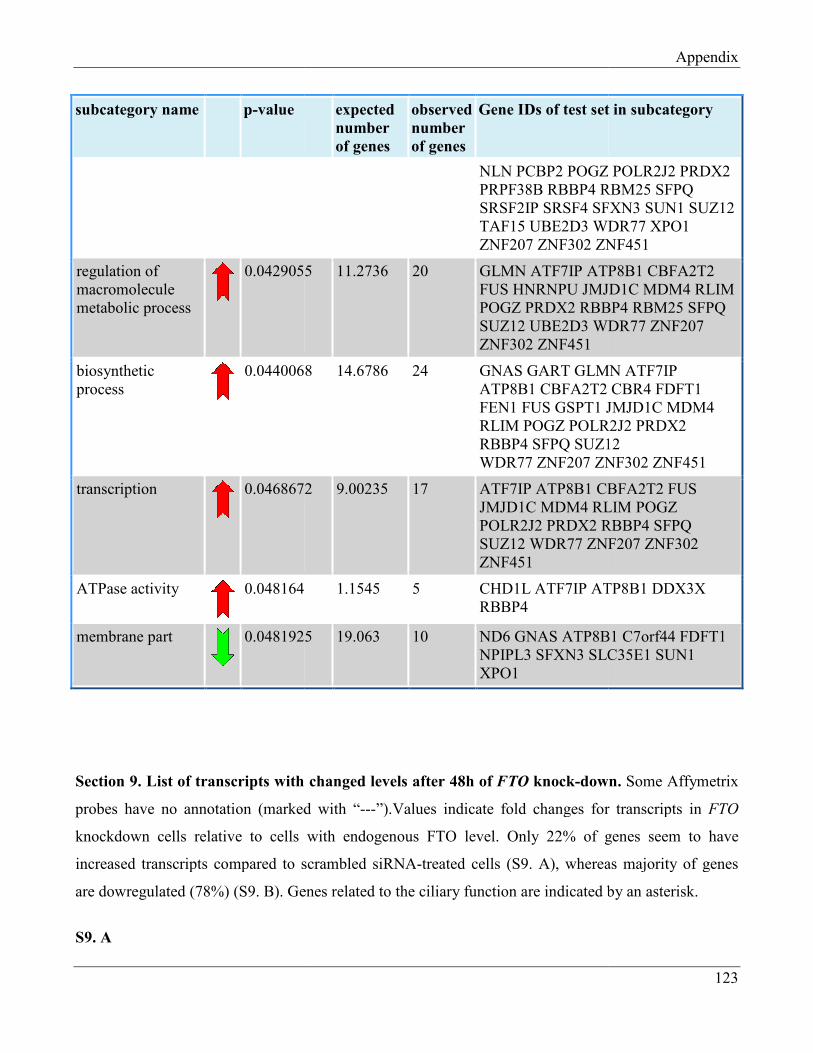
subcategory name p-value
regulation of
macromolecule
metabolic process
0.0429055
biosynthetic
process
0.0440068
transcription
0.0468672
ATPase activity
0.048164
membrane part
0.0481925
Section 9. List of transcripts with changed levels after 48h of
probes have no annotation (marked
knockdown cells relative to cells with endogenous FTO level. Only 22% of genes seem to have
increased transcripts compared to scrambled siRNA
are dowregulated (78%) (S9. B). Genes related to the ciliary function are indicated by
S9. A
expected
number
of genes
observed
number
of genes
Gene IDs of test set in subcategory
NLN PCBP2 POGZ
PRPF38B RBBP4 RBM25
SRSF2IP SRSF4 SFXN3
TAF15 UBE2D3 WDR77
ZNF207 ZNF302 ZNF451
0.0429055 11.2736 20 GLMN ATF7IP ATP8B1
FUS HNRNPU JMJD1C
POGZ PRDX2 RBBP4
SUZ12 UBE2D3 WDR77
ZNF302 ZNF451
0.0440068 14.6786 24 GNAS GART GLMN
ATP8B1 CBFA2T2
FEN1 FUS GSPT1 JMJD1C
RLIM POGZ POLR2J2
RBBP4 SFPQ SUZ12
WDR77 ZNF207 ZNF302
72 9.00235 17 ATF7IP ATP8B1 CBFA2T2
JMJD1C MDM4 RLIM
POLR2J2 PRDX2 RBBP4
SUZ12 WDR77 ZNF207
ZNF451
0.048164 1.1545 5 CHD1L ATF7IP ATP8B1
RBBP4
0.0481925 19.063 10 ND6 GNAS ATP8B1
NPIPL3 SFXN3 SLC35E1
XPO1
. List of transcripts with changed levels after 48h of FTO knock-down.
marked with “---”).Values indicate fold changes for transcripts in
knockdown cells relative to cells with endogenous FTO level. Only 22% of genes seem to have
transcripts compared to scrambled siRNA-treated cells (S9. A), whereas majority of genes
B). Genes related to the ciliary function are indicated by
Appendix
123
Gene IDs of test set in subcategory
POGZ POLR2J2 PRDX2
RBM25 SFPQ
SFXN3 SUN1 SUZ12
WDR77 XPO1
ZNF451
ATP8B1 CBFA2T2
JMJD1C MDM4 RLIM
RBBP4 RBM25 SFPQ
WDR77 ZNF207
GLMN ATF7IP
CBR4 FDFT1
JMJD1C MDM4
POLR2J2 PRDX2
SUZ12
ZNF302 ZNF451
CBFA2T2 FUS
RLIM POGZ
RBBP4 SFPQ
ZNF207 ZNF302
ATP8B1 DDX3X
ATP8B1 C7orf44 FDFT1
SLC35E1 SUN1
down. Some Affymetrix
”).Values indicate fold changes for transcripts in FTO
knockdown cells relative to cells with endogenous FTO level. Only 22% of genes seem to have
A), whereas majority of genes
B). Genes related to the ciliary function are indicated by an asterisk.
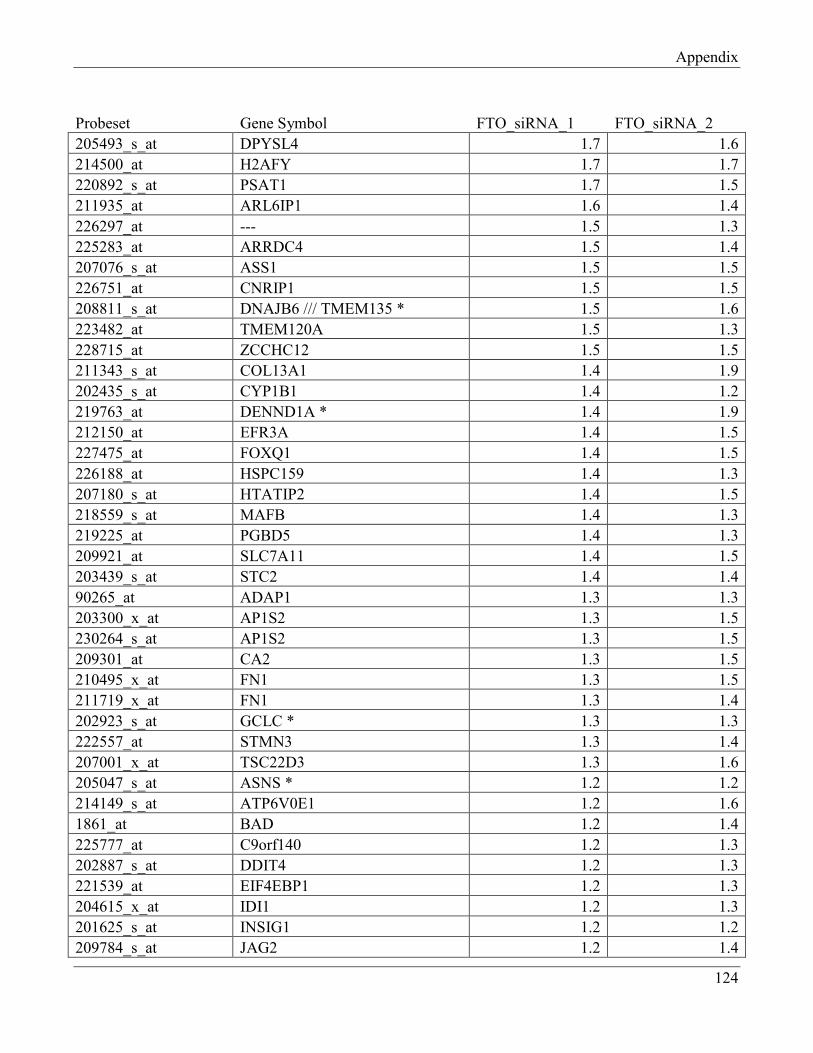
Appendix
124
Probeset Gene Symbol FTO_siRNA_1 FTO_siRNA_2
205493_s_at DPYSL4 1.7 1.6
214500_at H2AFY 1.7 1.7
220892_s_at PSAT1 1.7 1.5
211935_at ARL6IP1 1.6 1.4
226297_at --- 1.5 1.3
225283_at ARRDC4 1.5 1.4
207076_s_at ASS1 1.5 1.5
226751_at CNRIP1 1.5 1.5
208811_s_at DNAJB6 /// TMEM135 * 1.5 1.6
223482_at TMEM120A 1.5 1.3
228715_at ZCCHC12 1.5 1.5
211343_s_at COL13A1 1.4 1.9
202435_s_at CYP1B1 1.4 1.2
219763_at DENND1A * 1.4 1.9
212150_at EFR3A 1.4 1.5
227475_at FOXQ1 1.4 1.5
226188_at HSPC159 1.4 1.3
207180_s_at HTATIP2 1.4 1.5
218559_s_at MAFB 1.4 1.3
219225_at PGBD5 1.4 1.3
209921_at SLC7A11 1.4 1.5
203439_s_at STC2 1.4 1.4
90265_at ADAP1 1.3 1.3
203300_x_at AP1S2 1.3 1.5
230264_s_at AP1S2 1.3 1.5
209301_at CA2 1.3 1.5
210495_x_at FN1 1.3 1.5
211719_x_at FN1 1.3 1.4
202923_s_at GCLC * 1.3 1.3
222557_at STMN3 1.3 1.4
207001_x_at TSC22D3 1.3 1.6
205047_s_at ASNS * 1.2 1.2
214149_s_at ATP6V0E1 1.2 1.6
1861_at BAD 1.2 1.4
225777_at C9orf140 1.2 1.3
202887_s_at DDIT4 1.2 1.3
221539_at EIF4EBP1 1.2 1.3
204615_x_at IDI1 1.2 1.3
201625_s_at INSIG1 1.2 1.2
209784_s_at JAG2 1.2 1.4
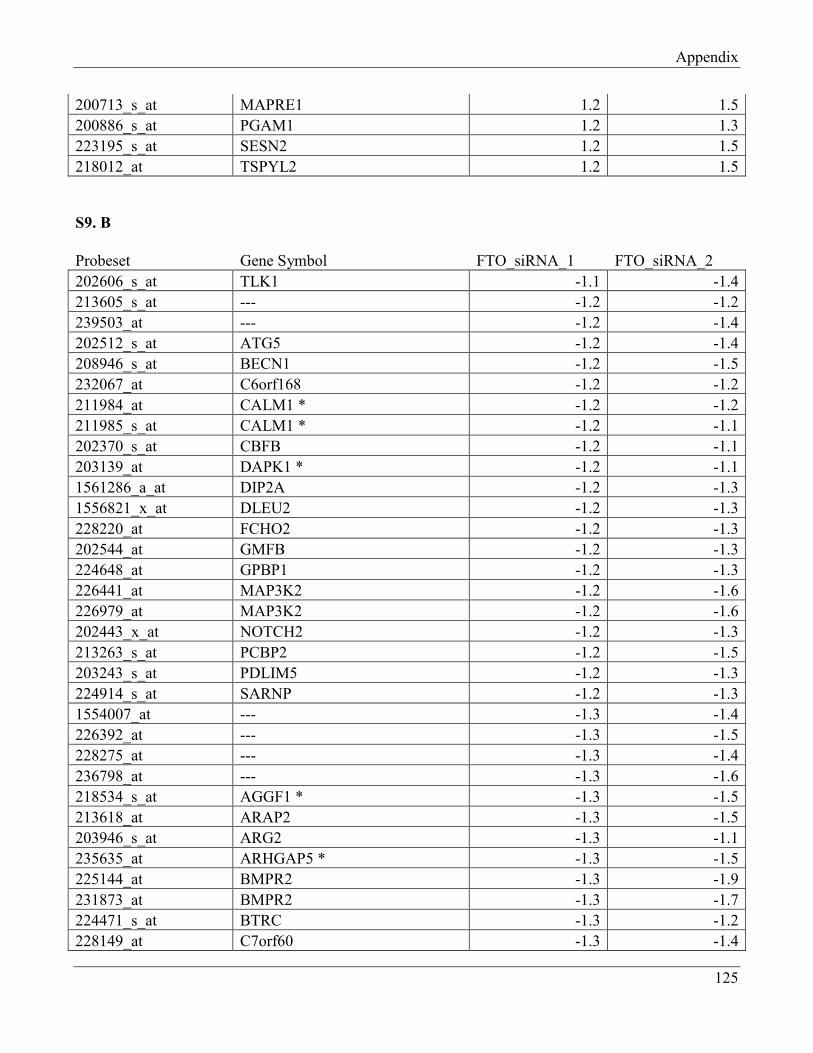
Appendix
125
200713_s_at MAPRE1 1.2 1.5
200886_s_at PGAM1 1.2 1.3
223195_s_at SESN2 1.2 1.5
218012_at TSPYL2 1.2 1.5
S9. B
Probeset Gene Symbol FTO_siRNA_1 FTO_siRNA_2
202606_s_at TLK1 -1.1 -1.4
213605_s_at --- -1.2 -1.2
239503_at --- -1.2 -1.4
202512_s_at ATG5 -1.2 -1.4
208946_s_at BECN1 -1.2 -1.5
232067_at C6orf168 -1.2 -1.2
211984_at CALM1 * -1.2 -1.2
211985_s_at CALM1 * -1.2 -1.1
202370_s_at CBFB -1.2 -1.1
203139_at DAPK1 * -1.2 -1.1
1561286_a_at DIP2A -1.2 -1.3
1556821_x_at DLEU2 -1.2 -1.3
228220_at FCHO2 -1.2 -1.3
202544_at GMFB -1.2 -1.3
224648_at GPBP1 -1.2 -1.3
226441_at MAP3K2 -1.2 -1.6
226979_at MAP3K2 -1.2 -1.6
202443_x_at NOTCH2 -1.2 -1.3
213263_s_at PCBP2 -1.2 -1.5
203243_s_at PDLIM5 -1.2 -1.3
224914_s_at SARNP -1.2 -1.3
1554007_at --- -1.3 -1.4
226392_at --- -1.3 -1.5
228275_at --- -1.3 -1.4
236798_at --- -1.3 -1.6
218534_s_at AGGF1 * -1.3 -1.5
213618_at ARAP2 -1.3 -1.5
203946_s_at ARG2 -1.3 -1.1
235635_at ARHGAP5 * -1.3 -1.5
225144_at BMPR2 -1.3 -1.9
231873_at BMPR2 -1.3 -1.7
224471_s_at BTRC -1.3 -1.2
228149_at C7orf60 -1.3 -1.4
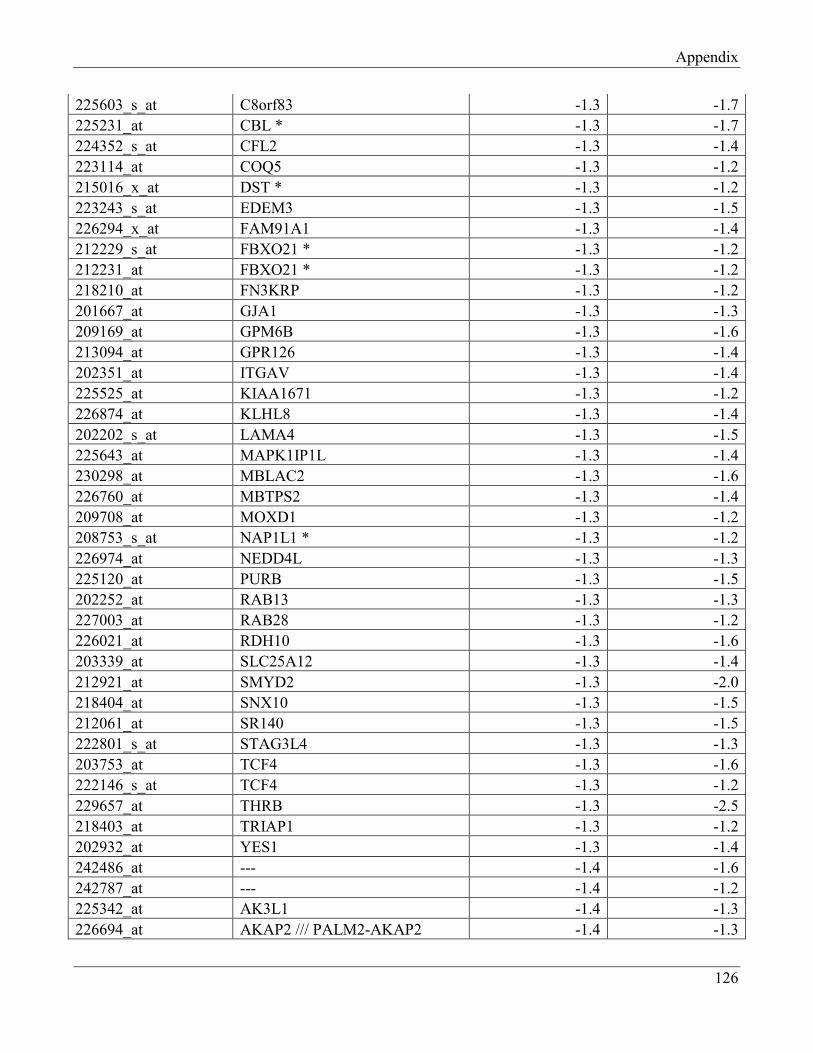
Appendix
126
225603_s_at C8orf83 -1.3 -1.7
225231_at CBL * -1.3 -1.7
224352_s_at CFL2 -1.3 -1.4
223114_at COQ5 -1.3 -1.2
215016_x_at DST * -1.3 -1.2
223243_s_at EDEM3 -1.3 -1.5
226294_x_at FAM91A1 -1.3 -1.4
212229_s_at FBXO21 * -1.3 -1.2
212231_at FBXO21 * -1.3 -1.2
218210_at FN3KRP -1.3 -1.2
201667_at GJA1 -1.3 -1.3
209169_at GPM6B -1.3 -1.6
213094_at GPR126 -1.3 -1.4
202351_at ITGAV -1.3 -1.4
225525_at KIAA1671 -1.3 -1.2
226874_at KLHL8 -1.3 -1.4
202202_s_at LAMA4 -1.3 -1.5
225643_at MAPK1IP1L -1.3 -1.4
230298_at MBLAC2 -1.3 -1.6
226760_at MBTPS2 -1.3 -1.4
209708_at MOXD1 -1.3 -1.2
208753_s_at NAP1L1 * -1.3 -1.2
226974_at NEDD4L -1.3 -1.3
225120_at PURB -1.3 -1.5
202252_at RAB13 -1.3 -1.3
227003_at RAB28 -1.3 -1.2
226021_at RDH10 -1.3 -1.6
203339_at SLC25A12 -1.3 -1.4
212921_at SMYD2 -1.3 -2.0
218404_at SNX10 -1.3 -1.5
212061_at SR140 -1.3 -1.5
222801_s_at STAG3L4 -1.3 -1.3
203753_at TCF4 -1.3 -1.6
222146_s_at TCF4 -1.3 -1.2
229657_at THRB -1.3 -2.5
218403_at TRIAP1 -1.3 -1.2
202932_at YES1 -1.3 -1.4
242486_at --- -1.4 -1.6
242787_at --- -1.4 -1.2
225342_at AK3L1 -1.4 -1.3
226694_at AKAP2 /// PALM2-AKAP2 -1.4 -1.3
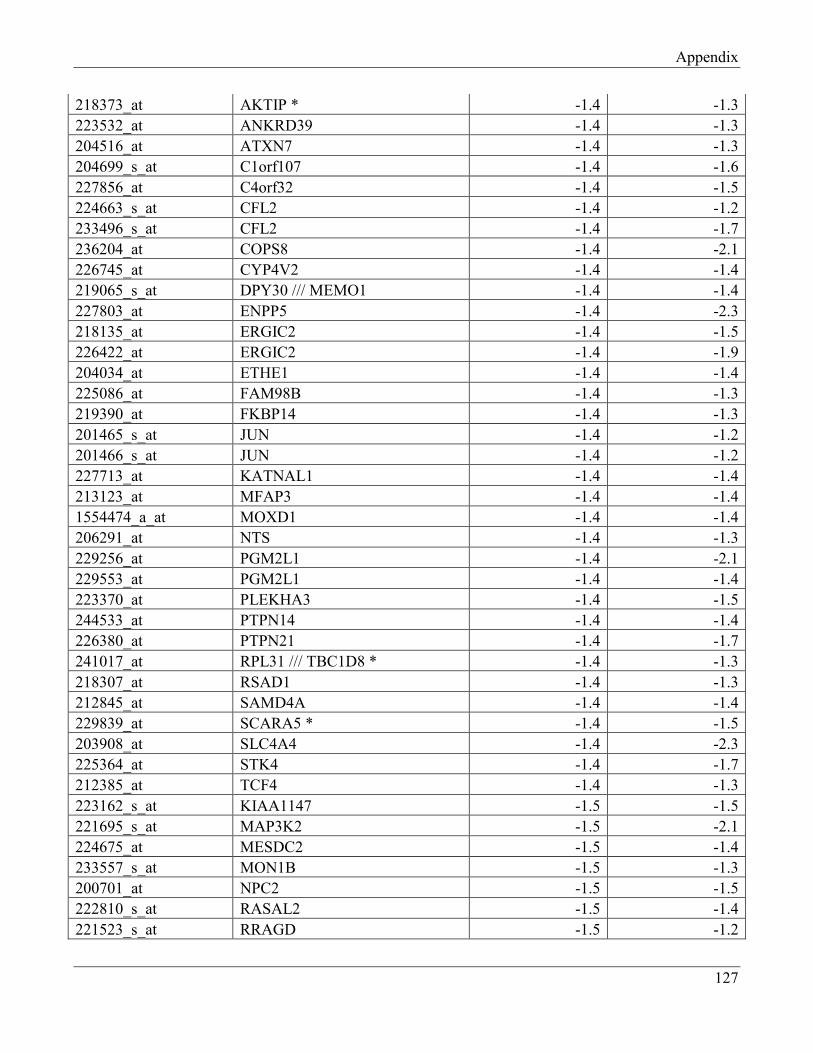
Appendix
127
218373_at AKTIP * -1.4 -1.3
223532_at ANKRD39 -1.4 -1.3
204516_at ATXN7 -1.4 -1.3
204699_s_at C1orf107 -1.4 -1.6
227856_at C4orf32 -1.4 -1.5
224663_s_at CFL2 -1.4 -1.2
233496_s_at CFL2 -1.4 -1.7
236204_at COPS8 -1.4 -2.1
226745_at CYP4V2 -1.4 -1.4
219065_s_at DPY30 /// MEMO1 -1.4 -1.4
227803_at ENPP5 -1.4 -2.3
218135_at ERGIC2 -1.4 -1.5
226422_at ERGIC2 -1.4 -1.9
204034_at ETHE1 -1.4 -1.4
225086_at FAM98B -1.4 -1.3
219390_at FKBP14 -1.4 -1.3
201465_s_at JUN -1.4 -1.2
201466_s_at JUN -1.4 -1.2
227713_at KATNAL1 -1.4 -1.4
213123_at MFAP3 -1.4 -1.4
1554474_a_at MOXD1 -1.4 -1.4
206291_at NTS -1.4 -1.3
229256_at PGM2L1 -1.4 -2.1
229553_at PGM2L1 -1.4 -1.4
223370_at PLEKHA3 -1.4 -1.5
244533_at PTPN14 -1.4 -1.4
226380_at PTPN21 -1.4 -1.7
241017_at RPL31 /// TBC1D8 * -1.4 -1.3
218307_at RSAD1 -1.4 -1.3
212845_at SAMD4A -1.4 -1.4
229839_at SCARA5 * -1.4 -1.5
203908_at SLC4A4 -1.4 -2.3
225364_at STK4 -1.4 -1.7
212385_at TCF4 -1.4 -1.3
223162_s_at KIAA1147 -1.5 -1.5
221695_s_at MAP3K2 -1.5 -2.1
224675_at MESDC2 -1.5 -1.4
233557_s_at MON1B -1.5 -1.3
200701_at NPC2 -1.5 -1.5
222810_s_at RASAL2 -1.5 -1.4
221523_s_at RRAGD -1.5 -1.2
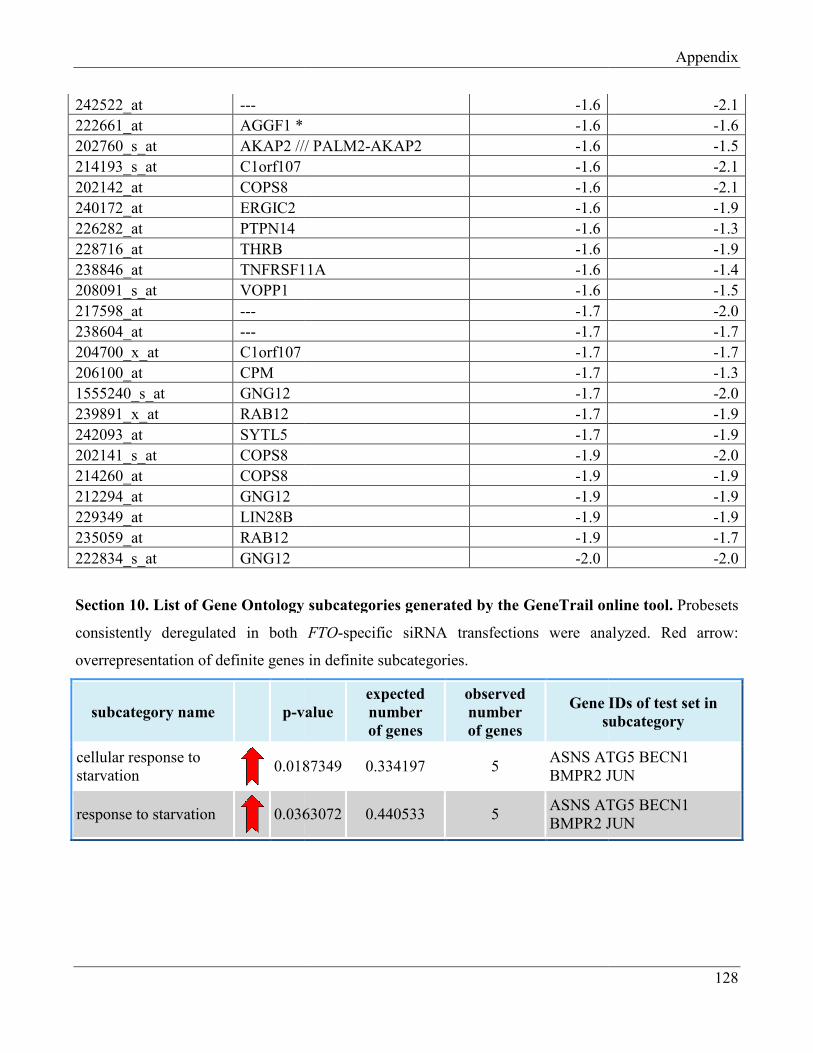
242522_at ---
222661_at AGGF1 *
202760_s_at AKAP2 /// PALM2
214193_s_at C1orf107
202142_at COPS8
240172_at ERGIC2
226282_at PTPN14
228716_at THRB
238846_at TNFRSF11A
208091_s_at VOPP1
217598_at ---
238604_at ---
204700_x_at C1orf107
206100_at CPM
1555240_s_at GNG12
239891_x_at RAB12
242093_at SYTL5
202141_s_at COPS8
214260_at COPS8
212294_at GNG12
229349_at LIN28B
235059_at RAB12
222834_s_at GNG12
Section 10. List of Gene Ontology subcategories generated by
consistently deregulated in both
overrepresentation of definite genes in definite subcategories.
subcategory name
p-value
cellular response to
starvation
0.0187349
response to starvation
0.0363072
-1.6
-1.6
AKAP2 /// PALM2-AKAP2 -1.6
-1.6
-1.6
-1.6
-1.6
-1.6
TNFRSF11A -1.6
-1.6
-1.7
-1.7
-1.7
-1.7
-1.7
-1.7
-1.7
-1.9
-1.9
-1.9
-1.9
-1.9
-2.0
List of Gene Ontology subcategories generated by the GeneTrail online tool.
both FTO-specific siRNA transfections were analyzed. Red arrow:
overrepresentation of definite genes in definite subcategories.
value
expected
number
of genes
observed
number
of genes
Gene
subcategory
0.0187349 0.334197 5 ASNS ATG5
BMPR2 JUN
0.0363072 0.440533 5 ASNS ATG5
BMPR2 JUN
Appendix
128
-2.1
-1.6
-1.5
-2.1
-2.1
-1.9
-1.3
-1.9
-1.4
-1.5
-2.0
-1.7
-1.7
-1.3
-2.0
-1.9
-1.9
-2.0
-1.9
-1.9
-1.9
-1.7
-2.0
GeneTrail online tool. Probesets
were analyzed. Red arrow:
IDs of test set in
subcategory
ATG5 BECN1
JUN
ATG5 BECN1
JUN
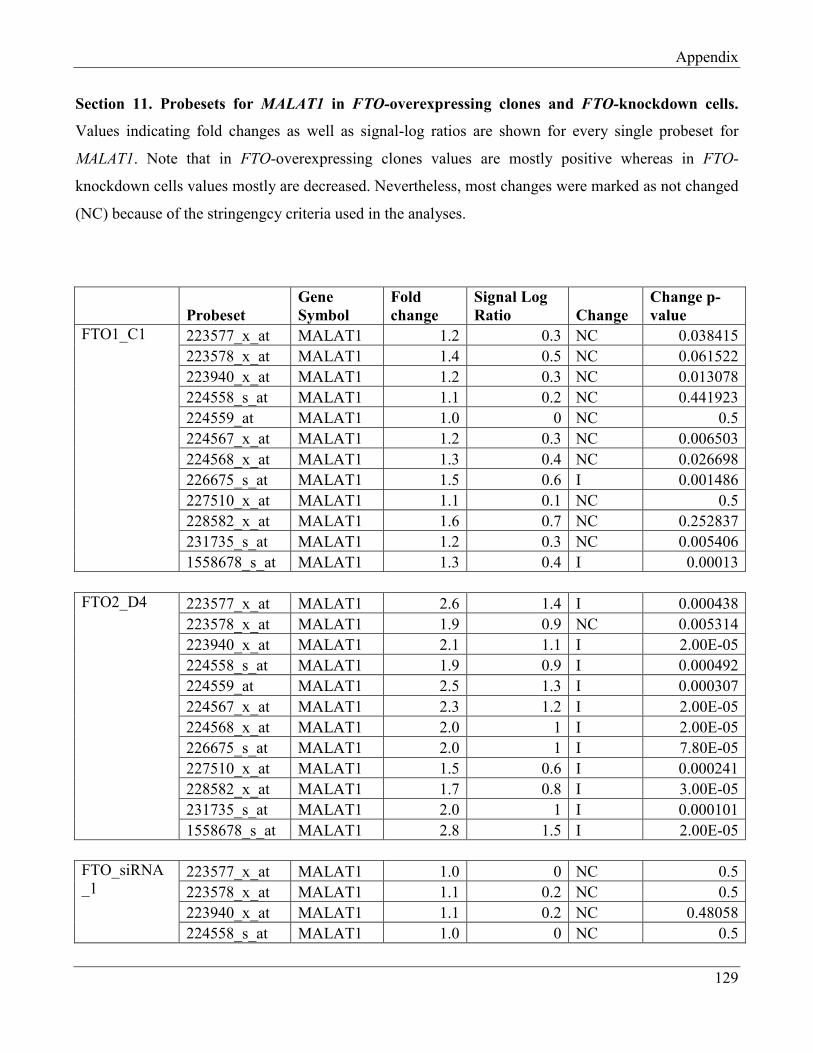
Appendix
129
Section 11. Probesets for MALAT1 in FTO-overexpressing clones and FTO-knockdown cells.
Values indicating fold changes as well as signal-log ratios are shown for every single probeset for
MALAT1. Note that in FTO-overexpressing clones values are mostly positive whereas in FTO-
knockdown cells values mostly are decreased. Nevertheless, most changes were marked as not changed
(NC) because of the stringengcy criteria used in the analyses.
Probeset
Gene
Symbol
Fold
change
Signal Log
Ratio Change
Change p-
value
FTO1_C1 223577_x_at MALAT1 1.2 0.3 NC 0.038415
223578_x_at MALAT1 1.4 0.5 NC 0.061522
223940_x_at MALAT1 1.2 0.3 NC 0.013078
224558_s_at MALAT1 1.1 0.2 NC 0.441923
224559_at MALAT1 1.0 0 NC 0.5
224567_x_at MALAT1 1.2 0.3 NC 0.006503
224568_x_at MALAT1 1.3 0.4 NC 0.026698
226675_s_at MALAT1 1.5 0.6 I 0.001486
227510_x_at MALAT1 1.1 0.1 NC 0.5
228582_x_at MALAT1 1.6 0.7 NC 0.252837
231735_s_at MALAT1 1.2 0.3 NC 0.005406
1558678_s_at MALAT1 1.3 0.4 I 0.00013
FTO2_D4 223577_x_at MALAT1 2.6 1.4 I 0.000438
223578_x_at MALAT1 1.9 0.9 NC 0.005314
223940_x_at MALAT1 2.1 1.1 I 2.00E-05
224558_s_at MALAT1 1.9 0.9 I 0.000492
224559_at MALAT1 2.5 1.3 I 0.000307
224567_x_at MALAT1 2.3 1.2 I 2.00E-05
224568_x_at MALAT1 2.0 1 I 2.00E-05
226675_s_at MALAT1 2.0 1 I 7.80E-05
227510_x_at MALAT1 1.5 0.6 I 0.000241
228582_x_at MALAT1 1.7 0.8 I 3.00E-05
231735_s_at MALAT1 2.0 1 I 0.000101
1558678_s_at MALAT1 2.8 1.5 I 2.00E-05
FTO_siRNA
_1 223577_x_at MALAT1 1.0 0 NC 0.5
223578_x_at MALAT1 1.1 0.2 NC 0.5
223940_x_at MALAT1 1.1 0.2 NC 0.48058
224558_s_at MALAT1 1.0 0 NC 0.5
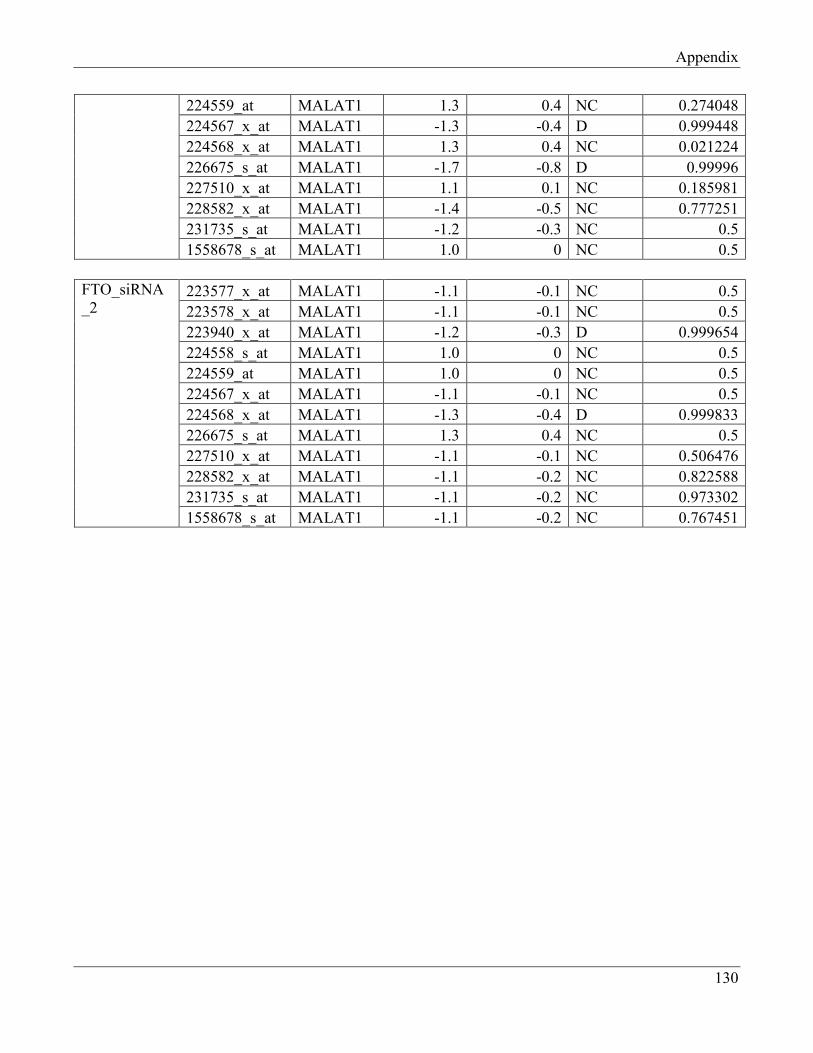
Appendix
130
224559_at MALAT1 1.3 0.4 NC 0.274048
224567_x_at MALAT1 -1.3 -0.4 D 0.999448
224568_x_at MALAT1 1.3 0.4 NC 0.021224
226675_s_at MALAT1 -1.7 -0.8 D 0.99996
227510_x_at MALAT1 1.1 0.1 NC 0.185981
228582_x_at MALAT1 -1.4 -0.5 NC 0.777251
231735_s_at MALAT1 -1.2 -0.3 NC 0.5
1558678_s_at MALAT1 1.0 0 NC 0.5
FTO_siRNA
_2 223577_x_at MALAT1 -1.1 -0.1 NC 0.5
223578_x_at MALAT1 -1.1 -0.1 NC 0.5
223940_x_at MALAT1 -1.2 -0.3 D 0.999654
224558_s_at MALAT1 1.0 0 NC 0.5
224559_at MALAT1 1.0 0 NC 0.5
224567_x_at MALAT1 -1.1 -0.1 NC 0.5
224568_x_at MALAT1 -1.3 -0.4 D 0.999833
226675_s_at MALAT1 1.3 0.4 NC 0.5
227510_x_at MALAT1 -1.1 -0.1 NC 0.506476
228582_x_at MALAT1 -1.1 -0.2 NC 0.822588
231735_s_at MALAT1 -1.1 -0.2 NC 0.973302
1558678_s_at MALAT1 -1.1 -0.2 NC 0.767451
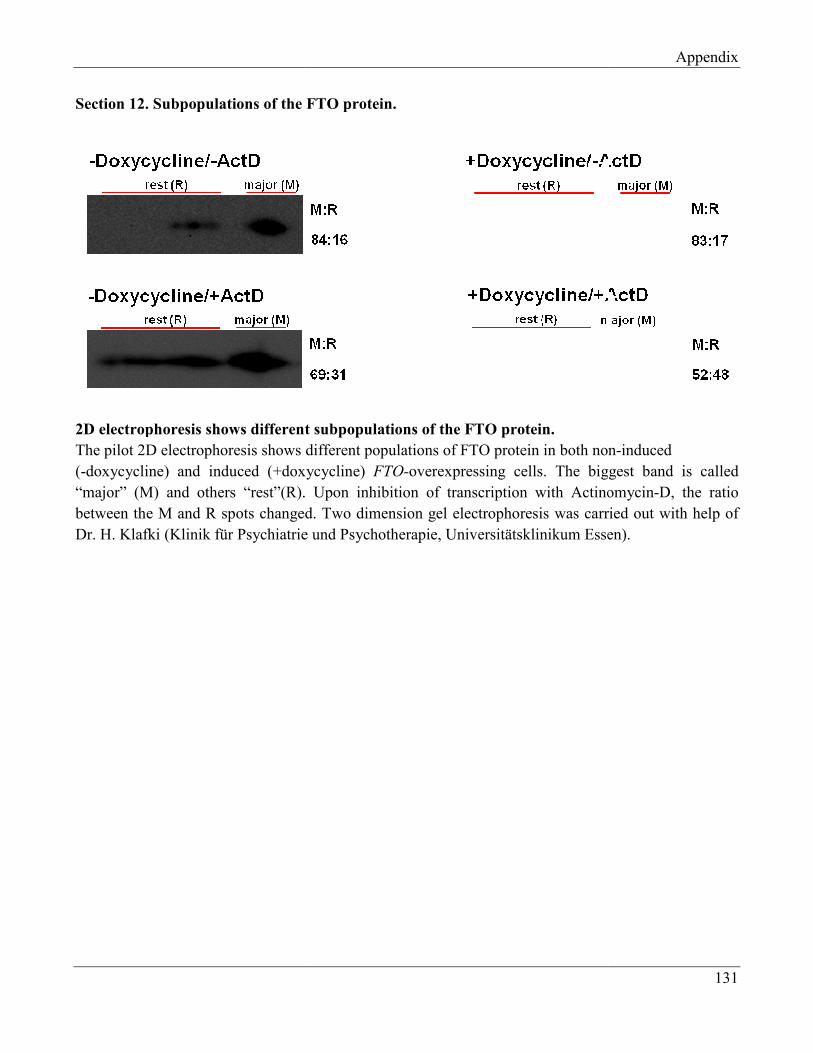
Section 12. Subpopulations of the FTO protein.
2D electrophoresis shows different
The pilot 2D electrophoresis shows
(-doxycycline) and induced (+doxycycline)
“major” (M) and others “rest”(R).
between the M and R spots changed.
Dr. H. Klafki (Klinik für Psychiatrie und Psychotherapie, Universitätsklinikum Essen).
Subpopulations of the FTO protein.
2D electrophoresis shows different subpopulations of the FTO protein.
electrophoresis shows different populations of FTO protein in both non
doxycycline) and induced (+doxycycline) FTO-overexpressing cells. The biggest
. Upon inhibition of transcription with Actinomycin
spots changed. Two dimension gel electrophoresis was carried out with help of
Klinik für Psychiatrie und Psychotherapie, Universitätsklinikum Essen).
Appendix
131
in both non-induced
he biggest band is called
Upon inhibition of transcription with Actinomycin-D, the ratio
Two dimension gel electrophoresis was carried out with help of
Klinik für Psychiatrie und Psychotherapie, Universitätsklinikum Essen).

Acknowledgements
132
8. Acknowledgements
This project was supported by the Bundesministerium für Bildung und Forschung (NGFN plus
01GS0820). The practical work was carried out at the Institute of Human Genetics, University of
Duisburg-Essen, Essen, Germany.
I would like to start by giving my special thanks to Prof. Dr. Bernhard Horsthemke for his
excellent guidance and supervision. His valuable suggestions, analytical criticism and positive attitude
were an immense contribution and support. I appreciate very much his very fast and honest evaluations
of every single point we discussed during the project. I have been amazingly fortunate to have an
advisor who gave me the freedom to research and explore on my own, and at the same time provide
every support to help me recover from my faltered steps. Additionally, I am very thankful to him for all
tips and advice that made my life much easier and happier here in Essen.
I would like to acknowledge all coauthors, Dr. Matthias Ziehe, Dr. Ludger Klein-Hitpass,
Dr. Emil Mladenov, Dr. Jürgen Thomale and Prof. Ulrich Rüther for their valuable contribution to
the functional part of this work. I would also like to thank Dr. Daniel Tews for collaboration and a
friendly welcome to the University Medical Center Ulm. I am thankful to Dr. M. Claussnitzer for her
help. I am grateful to Prof. G. Iliakis for providing access to the confocal laser microscope and
Typhoon TRIO scanner, Prof. M. Linscheid and Dr. H. Klafki for providing equipments and helpful
suggestions.
In addition to those mentioned above, I would like to express my thanks to all present and past
members of the department and lab 13. I thank Prof. Dietmar Lohmann for always being helpful, Dr.
Tobias Schopen, Birgit Ansperger and Saskia Seland for their friendship and kind assistance with
writing letters, giving wise advice, helping with various applications, and so on. I thank Michalla
Hiber for doing cell culture while I was not in the lab, Dr. Corinna Zogel for her help in the beginning
of my PhD. I am grateful to all the people at the department of human genetics for creating the friendly
atmosphere, all the care and support I received during these years and for all activities outside the lab.

Acknowledgements
133
For the critical and careful reading of my thesis I am very grateful to Nicholas Wagner. I
appreciate very much all his efforts to convert my “Georgian English” back to “English English”.
Special thanks go to my fellow PhD students Jasmin Beygo, Lisa Neumann and Christian Grosser
and postdocs Deniz Kanber, Laura Steenpass, Nicholas Wagner and Michael Zeschnigk for always
having time to discuss problems, new ideas, to try to find answers to questions and in general, for great
scientific atmosphere and good company. And not least importantly, for the best friendship - It has
been a great privilege to share with them the ups and downs of my PhD period and to spend these years
at the institute surrounded by people who will always remain so dear to me.
I wish to thank my best friends for helping me get through the difficult times, and for all the
emotional support, entertainment, and encouragement they provided.
Finally, I want to thank my family for their support throughout my studies and their interest in
my work. I wish to thank my parents, Dodo and Temuri for always being beside me and for their love
and support. To my always supportive brother David and my lovely sister Tamri, who always believed
in me and encouraged me to see the best sides of life, for giving me other things than biology to think
about and just for being the best brother and sister ever. This PhD thesis would have never been
possible without them.

134
Curriculum Vitae
Name: Tea Berulava
Date of Birth: 07.03.1980
Place of Birth: Gulriphshi
Nationality: Georgian
Education: 08.2008 – Present PhD student in Biology at the University of Duiburg-Essen,
Institute of Human Genetics. Supervisor Prof. B.Horsthemke.
2002-2004 Master’s Degree, with Honors, Tbilisi State University (TSU),
Faculty of Biology, Department of Cell and Molecular Biology.
1998-2002 Bachelor’s Degree, with Honors, Tbilisi State University (TSU),
Faculty of Biology.
Languages: Georgian – native
English – fluent
Russian – fluent
German – good

135
Erklärung:
Hiermit erkläre ich, gem. § 6 Abs. (2) f) der Promotionsordnung der Fakultäten für Biologie, Chemie
und Mathematik zur Erlangung der Dr. rer. nat., dass ich das Arbeitgebiet, dem das Thema
„Expression and Function of the Fat Mass and Obesity-Associated Gene FTO“ zuzuordnen ist, in
Forschung und Lehre vertrete und den Antrag von Frau Tea Berulava befürworte und die Betreuung
auch im Falle eines Weggangs, wenn nicht wichtige Gründe dem entgegenstehen, weiterführen werde.
Essen, den 24.09.2012 ________________________________________
Unterschrift eines Mitglieds der Universität Duisburg-Essen
(Prof. Dr. Bernhard Horsthemke)
Erklärung:
Hiermit erkläre ich, gem. § 7 Abs. (2) c) + e) der Promotionsordnung Fakultäten für Biologie, Chemie
und Mathematik zur Erlangung des Dr. rer. nat., dass ich die vorliegende Dissertation selbständig
verfasst und mich keiner anderen als der angegebenen Hilfsmittel bedient habe.
Essen, den 24.09.2012 _______________________________________
Unterschrift der Doktorandin
Erklärung:
Hiermit erkläre ich, gem. § 7 Abs. (2) d) + f) der Promotionsordnung der Fakultäten für Biologie,
Chemie und Mathematik zur Erlangung des Dr. rer. nat., dass ich keine anderen Promotionen bzw.
Promotionsversuche in der Vergangenheit durchgeführt habe und dass diese Arbeit von keiner anderen
Fakultät/Fachbereich abgelehnt worden ist.
Essen, den 24.09.2012 _______________________________________
Unterschrift der Doktorandin