Embed Size (px)
Citation preview
FORMATION, DISTRIBUTION, AND PATHOPHYSIOLOGICAL RELEVANCE
OF THE 'ADVANCED GLYCATION END-PRODUCT' Nε-(CARBOXYMETHYL)-LYSINE
IN TARGET TISSUES OF DIABETIC ORGAN DAMAGE AND IN DEGENERATIVE AND CHRONIC
INFLAMMATORY TISSUE LESIONS
BILDUNG, VERTEILUNG AND PATHOPHYSIOLOGISCHE BEDEUTUNG VON
N(EPSILON)-CARBOXYMETHYLLYSIN BEI DIABETISCHER ORGANSCHÄDIGUNG UND IN CHRONISCH
DEGENERATIVEN UND CHRONISCH ENTZÜNDLICHEN GEWEBELÄSIONEN
DISSERTATION
der Fakultät für Chemie und Pharmazie
der Eberhard-Karls-Universität Tübingen
zur Erlangung des Grades eines Doktors
der Naturwissenschaften
2004
vorgelegt von
Ulrich Friess

Tag der mündlichen Prüfung: 20.07.2004
Dekan: Prof. Dr. Hans-Georg Probst
1. Berichterstatter: Prof. Dr. Dr. h.c.mult. Wolfgang Voelter
2. Berichterstatter: Prof. Dr. Michael Duszenko
Die vorliegende Arbeit wurde von April 2000 bis Juni 2003 unter
der Leitung von Herrn Prof. Dr. Dr. h.c.mult. Wolfgang Voelter
und Herrn Prof. Dr. Erwin Schleicher am Institut für
Physiologische Chemie und im Zentrallaboratorium der
Medizinischen Klinik der Universität Tübingen (Abteilung Innere
Medizin IV, Ärztlicher Direktor Prof. Dr. Hans-Ulrich Häring)
angefertigt.
Teile dieser Arbeit wurden bereits veröffentlicht oder präsentiert:
Publikationen:
1. Schleicher E, Nerlich A, Haslbeck M, Heuss D, Kasper M, Bierhaus A, Nawroth PP, Haering HU, Friess U: Formation of Nε-(carboxymethyl)lysine in inflammatory and non-inflammatory conditions of nerve and muscle and in inflammatory cells in vitro. Proceedings of the 7th International Symposium on the Maillard Reaction, Kumamoto, 2001, Elsevier International Congress Series (2002) 1245:53-59.
2. Friess U, Waldner M, Wahl HG, Lehmann R, Haering HU,
Voelter W, Schleicher E: Liquid chromatography-based determination of urinary free and total N(epsilon)-(carboxymethyl)lysine excretion in normal and diabetic subjects. J Chromatogr B Analyt Technol Biomed Life Sci (2003) 794:273-280.
3. Haslbeck KM, Schleicher ED, Friess U, Kirchner A, Neundörfer B, Heuss D: Nε-Carboxymethyllysine in diabetic and non-diabetic polyneuropathies. Acta Neuropathol (2002) 104:42-52.
4. Schwab W, Friess U, Hempel U, Schulze E, Makita Z, Kasper
M, Simank HG: Immunohistochemical demonstration of Nε-(carboxymethyl)lysine protein adducts in normal and osteoarthritic cartilage. Histochem Cell Biol (2002) 117:541-546.
Posterpräsentationen:
5. Friess U et al.: Urinary excretion of free and bound Nε-(carboxymethyl)lysine in nonproteinuric diabetics (Kongress Labormedizin der DGKC/DGLM, Rostock 9/2001).
6. Friess U, Bierhaus A, Haslbeck M, Waldner M, Nawroth PP,
Haering HU, Schleicher ED. Accumulation and distribution of N(ε)-(carboxymethyl)lysine in tissues and leukocytes in Diabetes Mellitus and colocalisation with the receptor for advanced glycation end-products and the transcription factor NFκB. Diabetes und Stoffwechsel 11, Suppl.1 (2002), (Jahrestagung Deut. Diabetes Ges., Dresden 5/2002).
7. Friess U, Waldner M, Weigert C, Griendling K, Haering HU and
Schleicher E: Intracellular Nε-(carboxymethyl)lysine formation in monocytic and neuroglial cell lines. Second Symposium for advanced glycation end-products, Jena 2003.
Danksagung
Herzlich danken möchte ich
Herrn Prof. Dr. Dr. h.c. Voelter für die Annahme als Doktorand
und die freundliche Unterstützung bei der Realisierung dieser
Promotion.
Herrn Prof. Dr. E. Schleicher für die Überlassung des Themas
und die intensive Betreuung beim Verfassen der
Veröffentlichungen.
Herrn Prof. H.-U. Häring für das stete Interesse an meiner Arbeit.
Michaela Waldner für die sorgfältige und tatkräftige Mitarbeit im
Labor.
Cora Weigert, Rainer Lehmann, Alexander Beck und Klaus
Möschel für viele Tips und die gesamte Unterstützung in den
letzten drei Jahren.

i
CONTENTS
1 INTRODUCTION 1
1.1 Maillard Reaction and ‚advanced glycation end-products (AGEs)’ 1
1.2 ‚Early glycation products‘ and ‚advanced glycation end-products‘ are also observed in vivo 4
1.3 Classification of AGEs 5 1.4 Mechanisms of the in vivo formation of AGEs 6 1.5 Intracellular AGE formation 8 1.6 Nε-(carboxymethyl)-lysine (CML) 9 1.7 Pathogenesis of diabetic organ damage 11 1.8 Oxidative stress – a key feature of diabetes mellitus
and of tissue lesion in other diseases 13 1.9 Oxidative stress 16 1.10 Why could CML represent a potential biomarker for
oxidative stress? 18 1.10.1 In vitro, formation of CML involves oxidative
chemistry 18 1.10.2 CML is formed in a wide variety of diseases
where oxidative stress has been implicated in the pathogenesis 21
1.10.3 In experimental settings, CML is involved in a variety of pathomechanisms 21
1.10.4 CML is a ligand for the receptor for AGEs (RAGE) and colocalises with RAGE in tissue lesions. Experimental data show a possible pathophysiological role of CML/RAGE interaction in chronic inflammatory and degenerative diseases 22
1.10.5 When present, CML depositions are often found within or in close proximity to infiltrating inflammatory cells and activated resident cells 23
1.10.6 From cell culture experiments there is evidence for de novo intracellular CML formation 24
1.10.7 CML formation on cellular proteins has also been described in vivo in circulating blood cells 25
ii
1.10.8 Many of the CML-forming cell types possess enzymatic systems to generate oxidative stress. 25
2 AIM OF THIS STUDY 27
3 MATERIAL AND METHODS 28
3.1 Chemicals 28 3.2 Tests, kits and other materials 31
3.2.1 Isolation of leucocyte subclasses 32 3.2.2 Immunoprecipitation 32 3.2.3 2-D Elpho 32
3.3 Cell culture media and additives 33 3.4 Cell lines 33 3.5 Cell culture conditions and experimental conditions
in cell culture experiments 34 3.5.1 Mono Mac 6, PLB 985 and PLB
985gp91∆488-497 monocytic cells 34 3.5.2 N11 and N11/6 murine microglial cells 35
3.6 Equipment 38 3.7 In vitro chemical carboxymethylation of proteins 39 3.8 Determination of CML content by amino acid
analysis 41 3.9 In vitro lipid peroxidation of RNAse 42 3.10 Synthesis of CML standard 43 3.11 Preparation of cell lysates and protein extracts 48 3.12 Western blots / dot blots 50 3.13 Antibodies 53 3.14 HPLC determination of urinary CML excretion 56
3.14.1 Study group and sample collection 56 3.14.2 Preparation of the urine samples 58 3.14.3 Sample derivatisation and HPLC analysis 58
3.15 Immunohistochemistry and Western-blotting in muscle and nerve tissue 59
3.16 Immunohistochemistry and Western-blotting of CML-modified proteins in cartilage 60
3.17 Density gradient preparation of granulocytes 61 3.18 Preparation of leukocyte subclasses 63 3.19 Luminol and lucigenin chemiluminescence assay
for granulocytes 65
iii
3.20 Lucigenin chemiluminescence assay for cell culture cells 65
3.21 Statistical analysis 69
4 RESULTS 70
4.1 Chemical carboxymethylation of model proteins and characterisation of the used anti-CML antibodies 70
4.2 CML excretion is increased in urine in diabetic subjects and CML formation can be demonstrated in vivo in tissues and in circulating leukocytes 79 4.2.1 Increased in vivo formation and excretion of
protein-bound CML in diabetic subjects 79 4.2.1.1 Validation of the HPLC method 79 4.2.1.2 Urinary CML excretion in diabetic and non-
diabetic subjects 83 4.2.2 Demonstration of increased in vivo
accumulation of CML in nerve, muscle and vascular tissues in diabetes mellitus and in chronic inflammatory and chronic degenerative diseases 86
4.2.2.1 CML in noninflammatory and inflammatory peripheral polyneuropathies 86
4.2.2.2 CML in noninflammatory and inflammatory myopathies 89
4.2.2.3 CML accumulation in osteoarthritis 93 4.2.3 CML accumulation in circulating granulocytes
96 4.3 Mechanism of CML formation in inflammation-
associated cells 98 4.3.1 Lipid peroxidation leads to carboxymethylation
of proteins in vitro 98 4.3.2 The ‚oxidative burst‘ of granulocytes leads to
the carboxymethylation of serum proteins 100 4.3.3 In pre-differentiated monocytic cell lines,
stimulation of ROS-generating mechanisms leads to CML modification of distinct cellular proteins 102
4.3.3.1 Experiments with pre-differentiated Mono Mac 6 cells 102
4.3.3.2 Experiments with pre-differentiated PLB 985 and PLB 985 gp91∆488-497 (NADPH oxidase knock out) monocytic cells 115
iv
4.3.4 CML formation in stimulated N11 and N11/6 (NADPH oxidase deficient) microglia cells 117
4.3.5 Do inhibitors of the respiratory chain influence CML formation? 119
4.3.6 Identification of CML-modified proteins 124
5 DISCUSSION 125
5.1 CML excretion in urine 125 5.2 Pathophysiological significance of CML
accumulation in diabetes and in chronic inflammatory or chronic degenerative diseases 128 5.2.1 Over a life time the amount of protein glycation
in tissues remains almost constant but the CML content increases in an age-dependent fashion 128
5.2.2 CML accumulation in extracellular matrix proceeds slowly as an inevitable process over months to years and is increased by hyperglycemia 129
5.2.3 Under oxidative conditions, CML formation proceeds within hours to days, especially in lesioned tissue and intracellularly 129
5.2.3.1 CML accumulation in diabetic organ damage 130
5.2.3.2 CML accumulation in atherosclerosis and vascular disease 135
5.2.3.3 CML formation in Alzheimer’s disease and other neurodegenerative conditions 138
5.2.3.4 CML formation in degenerative conditions as osteoarthritis 139
5.2.3.5 CML formation in inflammatory conditions 141 5.2.4 Is intracellular CML actually formed within the
cell? 144 5.3 Which cellular source of ROS production is
involved in CML formation? 147 5.3.1 Is NADPH oxidase implicated in CML
formation? 147 5.3.2 Is the cellular NADPH oxidase activity crucial
for CML formation? 150 5.3.3 Is ROS production from the mitochondrial
respiratory chain involved in CML formation? 151
v
6 ZUSAMMENFASSUNG (DEUTSCH) 153
7 SUMMARY (ENGLISH) 158
8 REFERENCES 162
9 APPENDIX 193
Introduction
vi
ABBREVIATIONS 3-DG 3-Deoxyglucosone
4-OHCA α-Cyano-4-hydroxycinnamic acid
AA Amino acid
Ab Antibody
AD Alzheimer’s disease
AGE Advanced glycation end-product
APS Ammonium persulfate
ASA Amino acid analysis
au Arbitrary unit
BMI Body mass index
BSA Bovine serum albumin
CCCP Carbonyl cyanide 3-chlorophenylhydrazone
CD Cluster of differentiation
CEL Nε-(carboxyethyl)-lysine
CIDP Chronic inflammatory demyelating polyneuropathy
CML Nε-(carboxymethyl)-lysine
CMT I Charcot-Marie-Tooth-disease type I
COMP Cartilage oligomeric matrix component
CPEO syndrome
Chronic progressive external opthalmoplegia syndrome
CPR Cytochrome P450 reductase
CV Coefficient of variation
DAG Diacyl glycerole
DHAP Dihroxyacetone phosphate
Dil. Dilution
DM Diabetes mellitus
DMEM Dulbecco’s modified Eagle’s medium
Introduction
vii
D-Myo Dermatomyositis
DOLD 3-Deoxyglucosone-derived lysine dimer
DPI Diphenyleneiodonium chloride
DTT Dithiothreitol
ECL Enhanced luminol chemiluminescence
ECM Extracellular matrix
EDTA Ethylendiamintetraacetate
ESRD End stage renal disease
FCS Fetal calf serum
fMLF N-formyl-met-leu-phe
GAPDH Glyceraldehyde-3-phosphate dehydrogenase
GC-MS Gas chromatography - mass spectrometry
GOLD Glyoxal-derived lysine dimer
GSH Reduced glutathione
HbA1c Hemoglobin A1c
HEPES N-(2-hydroxyethyl)piperazine-N‘-2-ethanesulfonic acid
HMAP 4'-Hydroxy-3'-methoxyacetophenone (apocynine, acetovanillone)
HMSN I Hereditary motorsensoric neuropathy type I
HRP Horse radish peroxidase
HSA Human serum albumin
HSS Hanks‘ salt solution
IHC Immunohistochemistry
IP Immunoprecipitation
kD Kilo Dalton
LC-MS Liquid chromatography – mass spectrometry
LDL Low density lipoprotein
LGD Limb-girdle-dystrophy
Introduction
viii
L-NAME Nitro-L-arginine methyl ester hydrochloride
LPS Lipopolysaccharide
Mab Monoclonal antibody
MDA Malondialdehyde
MELAS syndrome
Mitochondrial encephalopathy, lactic acidosis and stroke like episodes syndrome
MGO Methyl glyoxal
MNR Magnetic nuclear resonance (spectrometry)
MOLD Methylglyoxal-derived lysine dimer
MPA 3-Mercaptopropionic acid
MPO Myeloperoxidase
MSR Macrophage scavenger receptor
MW Molecular weigth
NDG Nordihydroguaiaretic acid
NEAA Non essential amino acids
NET-G NET-G buffer
NFκB Nuclear factor kappa B
NP Neuropathy
OA Osteoarthritis
OPA o-Phtaldialdehyde
OPI Oxalacetate, pyruvate, insulin
PAGE Polyacrylamide gel electrophoresis
PBMC Peripheral bone mononuclear cells
PBS Phosphate buffered saline
PHOX Phagocytic NADPH oxidase
PKC Protein kinase C
PMA Phorbol-12-myristat-13-acetat
P-Myo Polymyositis
Introduction
ix
PN Polyneuropathy
RA Rheumatoid arthritis
RAGE Receptor for AGEs
RP-HPLC Reversed phase high pressure chromatography
RT Retention time
SD Standard deviation
SDS Sodium dodecylsulfate
SELDI-MS Surface enhanced laser desorption/ionisation mass spectrometry
SIM-GC-MS Single ion monitoring GC-MS
SMC Smooth muscle cells
TEMED N,N,N’,N’-tetramethylendiamine
TFA Trifluoroacetic acid
TNFα Tumor necrosis factor alpha
TRIS Tris[hydroxymethyl]aminomethane
TTFA 2-Thenoyltrifluoroacetone
TLC Thin layer chromatography
WB Western blot

Introduction
1
1 INTRODUCTION
1.1 Maillard Reaction and ‚advanced glycation end-products (AGEs)’
The process of ‘non-enzymatic browning’ has been known in food
chemistry for almost a century. In this series of reactions, the
amino groups of amino acids, peptides or proteins react with
glucose or other reducing sugars and produce a heterogeneous
group of colourless or yellow-brown products in a complex series
of reactions. These products sometimes show fluorescence
and/or form crosslinks between proteins or other
macromolecules. This process was described for the first time by
the French Chemist L.C. Maillard [1] and is called the Maillard
reaction or “non-enzymatic glycation”. The products of this
process have been named ‘Maillard Products’ or ‚advanced
glycation end-products’ (AGEs), and give bread crusts and
roasted or fried food their characteristic taste and color.
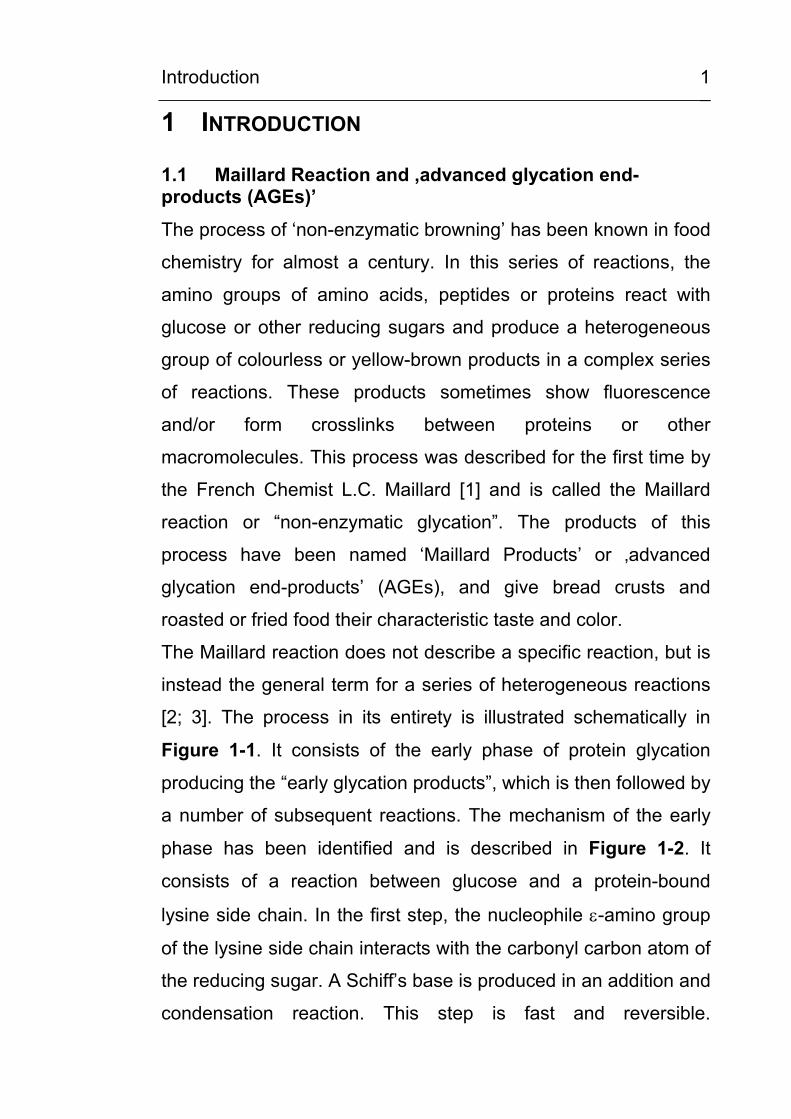
The Maillard reaction does not describe a specific reaction, but is
instead the general term for a series of heterogeneous reactions
[2; 3]. The process in its entirety is illustrated schematically in
Figure 1-1. It consists of the early phase of protein glycation
producing the “early glycation products”, which is then followed by
a number of subsequent reactions. The mechanism of the early
phase has been identified and is described in Figure 1-2. It
consists of a reaction between glucose and a protein-bound
lysine side chain. In the first step, the nucleophile ε-amino group
of the lysine side chain interacts with the carbonyl carbon atom of
the reducing sugar. A Schiff’s base is produced in an addition and
condensation reaction. This step is fast and reversible.
Introduction
2
Figu
re 1
-1. O
verv
iew
on
the
early
and
late
sta
ge o
f the
Mai
llard
reac
tion.
Introduction
3
Figu
re 1
-2. F
unct
iona
l cla
ssifi
catio
n of
adv
ance
d gl
ycat
ion
end-
prod
ucts
der
ived
from
glu
cose
,3-
deox
yglu
coso
ne (
3-D
G),
met
hylg
lyox
al a
nd g
lyox
al.
Abbr
evia
tions
: C
ML:
Nε -(c
arbo
xym
ethy
l)-ly
sine
; CEL
: Nε -(c
arbo
xyet
hyl)-
lysi
ne; G
OLD
, MO
LD a
nd D
OLD
: gly
oxal
-, m
ethy
lgly
oxal
- an
d 3-
DG
-de
rived
imid
azol
ium
lysi
ne d
imer
(fro
m [1
8]).
Introduction
4
In the subsequent Amadori reaction, a relatively stable keto-
amine (fructosamine) is formed by an intermediate open-chain
enol step. The equilibrium of this rearrangement is shifted
towards the keto-amine side, and this step determines the speed
of the protein glycation. The resulting fructosamine structure is
instable and reacts in a number of complex follow–up reactions to
form several intermediate products. Even though a large number
of AGEs have been isolated in tissues and reaction mixtures, the
intermediate steps of these reactions are only partly known, and it
is still not possible to describe the complete chain of reactions of
the late phase for the Maillard reaction. To date, the AGEs known
are mostly stable metabolites that are not changed during the
isolation and purification process and do not react further.
1.2 ‚Early glycation products‘ and ‚advanced glycation end-products‘ are also observed in vivo
Within the last 30 years it became evident that the Maillard
reaction does not only occur in reaction mixtures, but also within
the human body and that it plays an important role in the
processes of aging, degenerative diseases and in the
development of diabetic endorgan damage [4-7]. Early glycation
products and AGE precursors were first discovered in vivo in
hemoglobin [8; 9] and the measurement of glycated hemoglobin
(HbA1c) is used widely to assess the degree of long term
hyperglycemia in diabetic patients [10].
Besides hemoglobin and serum proteins, the long-lived proteins
of the extracellular matrix, such as collagens, become glycated.
Glycation has been demonstrated in the proteins of tendons,
bone, skin and connective tissue, aorta and the glomerular
Introduction
5
basement membrane and, further, the rate of glycation has been
found to correlate with the degree of hyperglycemia [11-13].
However, there is little convincing evidence that glycation itself is
a dangerous process [14]. Because of protein turnover and the
abundance of most enzymes and proteins in the body, it is
unlikely that glycation itself is significant in the pathogenesis of
diseases [14; 15]. The rate of formation of AGEs exceeds that
predicted by first order kinetics in protein glycation [10]. This
implies that over time even modest hyperglycemia can result in
significant accumulation of AGEs on long-lived proteins. This is
well illustrated in certain long-lived proteins such as lens
cristallins or tissue collagens. Because of the long biological half-
life, these proteins have been used most frequently to assess the
progress of the Maillard reaction in vivo and now, attention is
focused on the permanent, irreversible AGEs [14; 16].
1.3 Classification of AGEs
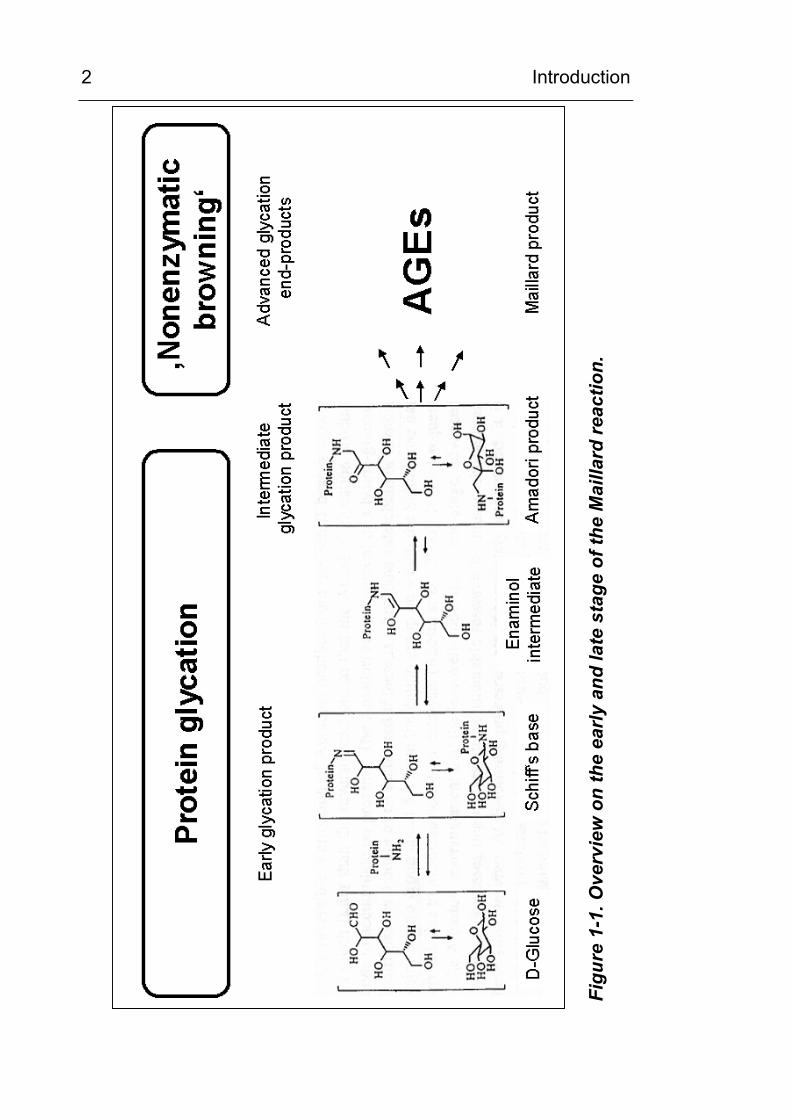
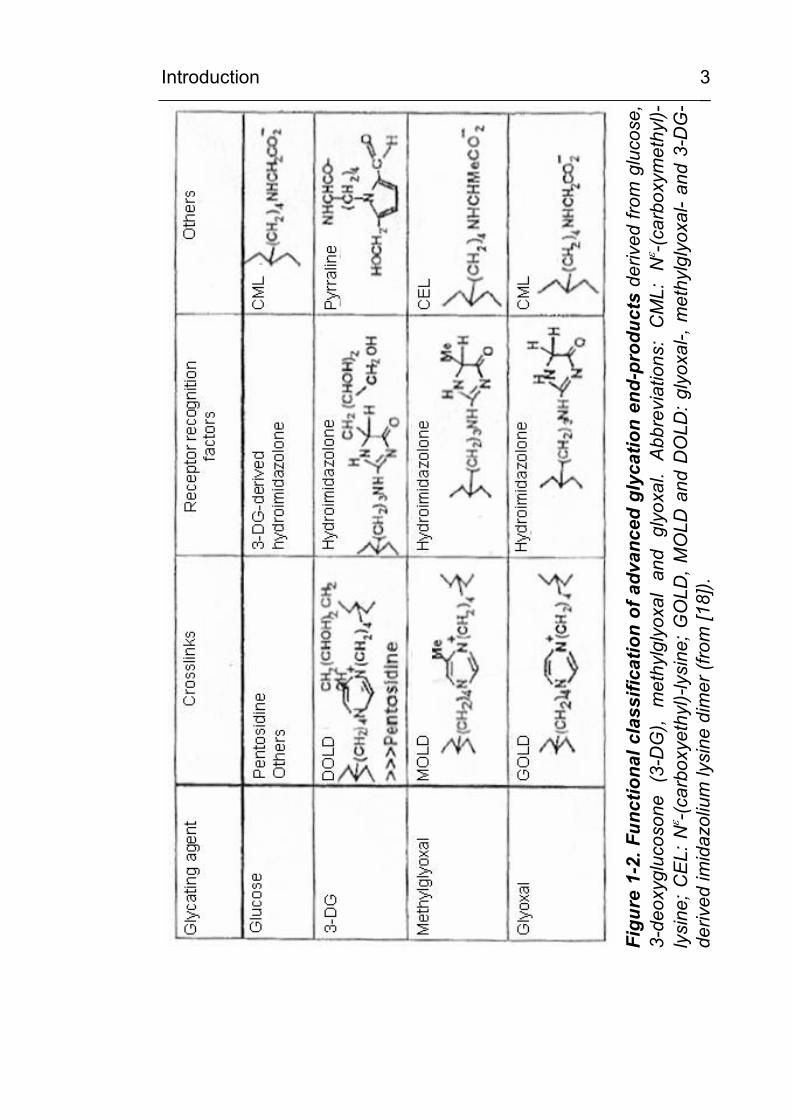
A number of AGEs have also been found in vivo in tissues and
extracellular fluids. As shown in Figure 1-2, this group of
compounds is very heterogeneous. The most commonly used
classification of AGEs is based on putative pathophysiological
relevance [17; 18], since modification of a macromolecule by
AGEs very often results in changed or impaired function. Often,
AGE modification leads to molecular crosslinking or to changes in
charge or conformation. AGE-modified proteins can show
changed enzymatic activity, changed rates of catabolism or
abnormal receptor binding properties. AGEs can act as ligands of
pathophysiologically active effector systems such as the receptor
for advanced glycation end products (RAGE) or the NFκB system
Introduction
6
[19]. Figure 1-2 shows the structure and classification of the most
important AGES which have been characterized according to
their potential or observed pathophysiological activities.
1.4 Mechanisms of the in vivo formation of AGEs
Throughout the last 30 years, a large body of evidence has
accumulated indicating that AGEs are formed in vivo from glycation
during cell metabolism, i.e. from the reaction of reducing sugars
(e.g. glucose, fructose, ribose, trioses or others), sugar phosphates
or of related compounds such as ascorbic acid with amino groups
in proteins, lipids and nucleic acids [20]. Glucose has the slowest
glycation rate whereas intracellular sugars, such as glucose-6-
phosphate or fructose, form AGEs at a much faster rate. The order
of the rate of glycation of different intermediates in metabolism is
glycolaldehyde > glyceraldehyde > glucose-6-phosphate > xylose >
fructose > glucose [21; 22]. If oxidation accompanies glycation, then the products formed are
known as glycoxidation products. The AGEs Nε-
(carboxymethyl)lysine and pentosidine are such examples. A
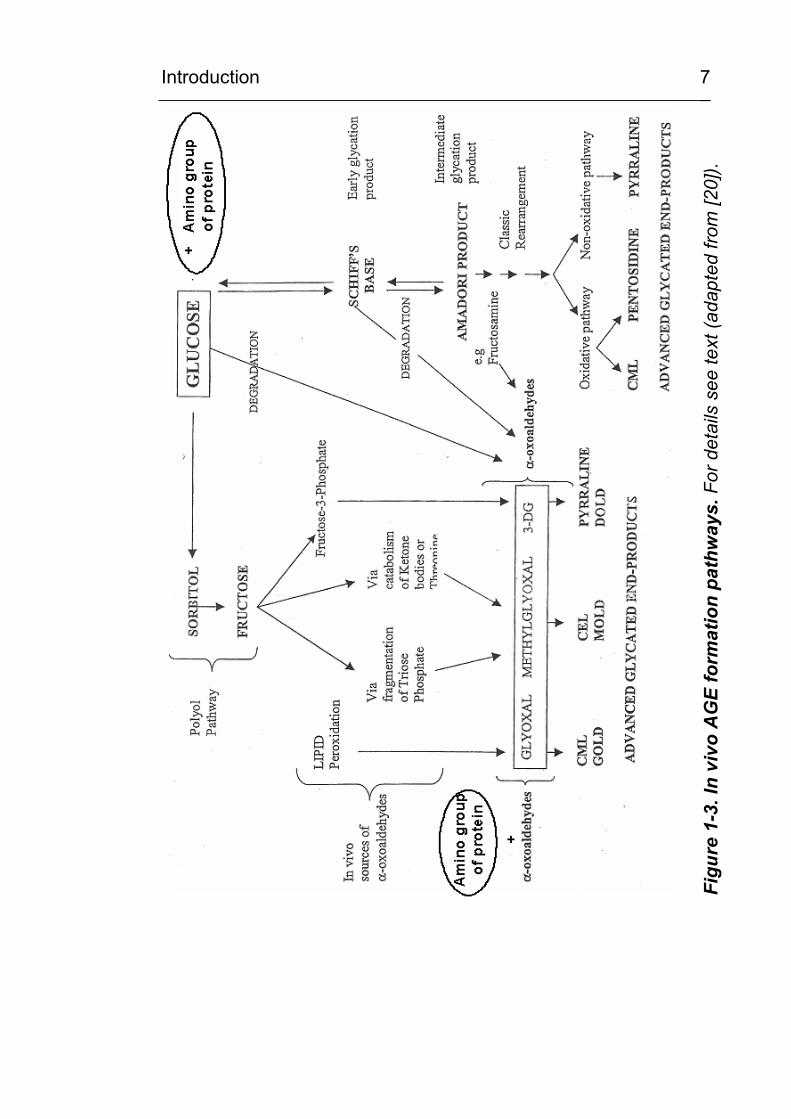
current scheme for the in vivo formation of AGEs is given in Figure
1-3. Of importance in the Maillard reaction is the formation of
reactive intermediate products during the Amadori rearrangement.
These compounds are known as α-dicarbonyls or oxoaldehydes
and include such products as glyoxal, methylglyoxal (MGO) and 3-
deoxyglucosone (3-DG) [23]. The 3-DG is formed by
rearrangement and hydrolysis of Amadori adducts and from
fructose-3-phosphate, a product of the polyol pathway. MGO is
formed during glycolysis and also from the oxidative decomposition
of poly-unsaturated fatty acids (lipid peroxidation).
Introduction
7
Figu
re 1
-3. I
n vi
vo A
GE
form
atio
n pa
thw
ays.
For
det
ails
see
text
(ada
pted
from
[20]
).
Introduction
8
In addition, MGO can be derived from fructose by fragmentation
of triose phosphates or from the catabolism of ketone bodies and
threonine [24]. MGO, 3-DG and glyoxal have recently been
proposed to be formed from all stages of the glycation process by
degradation of glucose or Schiff’s bases in early glycation or from
Amadori products such as fructosamine in the intermediate
stages of glycation. The accumulation of reactive dicarbonyls
from glycoxidation or from lipoxidation or from both is termed
carbonyl stress [25; 26]. These dicarbonyl precursors can go on
to form oxidative AGEs such as Nε-(carboxymethyl)-lysine (CML)
and pentosidine or non-oxidative AGEs derived from 3-DG
[deoxyglucosone-lysine dimer (DOLD)] or MGO [Methyl glyoxal
lysine dimer (MOLD)]. This recently described phenomenon of
carbonyl stress has been observed in both, diabetes and uremia
[27-29] and has been implicated in the accelerated vascular
damage observed in both conditions.
1.5 Intracellular AGE formation
Originally, the formation of AGEs was thought to arise exclusively
from the non-enzymatic reactions between extracellular proteins
and glucose. However, the rate of AGE formation from glucose is
orders of magnitude slower than the rate of AGE formation from
dicarbonyl precursors generated intracellularly. Recently it has
been recognised that AGEs can also form rapidly on
cytoplasmatic proteins and other intracellular components such
as lipids and nucleic acids [30; 31]. It now seems likely that
intracellular hyperglycemia and/or oxidative stress is the primary
initiating event in the formation of both intracellular and
extracellular AGEs [30; 31].
Introduction
9
As shown in Figure 1-3, AGEs can arise from intracellular
autoxidation of glucose to glyoxal, decomposition of the Amadori
product to 3-DG, and fragmentation of trioses as glyceraldehyde-
3-phosphate and dihydroxyacetone phosphate to MGO. These
reactive intracellular dicarbonyls –glyoxal, MGO and 3-DG- can
then react with the amino groups of intracellular proteins to form
AGEs. Indeed, it has been demonstrated that intracellular AGEs
may form at a rate of up to 14-fold higher in high (30mM) glucose
conditions [31]. MGO is detoxified by the glyoxalase system [32;
33]. All three AGE precursors are also substrates for other
reductases.
Overall, the reactions leading to AGE formation in vivo are
complex and not fully understood. The best characterised
metabolic pathways are the reactions leading to Nε-
(carboxymethyl)-lysine (CML), where multiple steps require
oxidative chemistry. CML has therefore gained interest as a
potential biomarker for oxidative stress [34-36].
1.6 Nε-(carboxymethyl)-lysine (CML)
The most abundant and best characterised AGE is Nε-
(carboxymethyl)-lysine (CML) [37; 38]. Originally, CML was
described as an AGE resulting from a Maillard type reaction of
glucose with lysine residues [39]. The authors made the
interesting observation, that under anaerobic conditions, CML
formation was abolished in vitro. Subsequently, CML was found
to be the most abundant AGE to be formed in a variety of
oxidative conditions [40]. In contrast to other AGEs, which also
form under nonoxidative conditions, CML is now considered to be
an advanced glycoxidation end-product. CML has become a key
Introduction
10
marker of protein modification in response to glyoxidative,
lipoxidative and carbonyl stress in vitro and it has been sugested
that CML could also represent a biomarker for systemic or local
oxidative stress in tissue lesions in vivo [34-36]. CML ist the most
abundant AGE in tissues and body fluids. It is an irreversible
protein modification which is stable to acid hydrolysis and can be
quantified from protein hydrolysates. Although CML is the
smallest one of the AGE modifications, it migth be functionally
relevant. It leads to a change in charge since, after modification,
the former positively charged lysine residues carry a negatively
charged carboxylic group. Therefore, a zwitter ion results which
may in turn exert different biological properties.
The occurence and distribution of CML in tissues has been
studied extensively using specific antibodies. Immunolocalisation
of CML has been demonstrated in skin, lung, heart, kidney,
intestine, intervertebral discs and particularly in arteries (as
reviewed in [35; 41] and in the discussion section). The content of
CML increases with the chronological age of proteins [42-44].
CML accumulation has been demonstrated in all tissues
associated with diabetic organ damage. In diabetes, the rate of
CML is accelerated as compared to that seen in aging and in
some studies, the age-adjusted concentration of CML has been
found to correlate with the severity of diabetic complications [14;
45]. Furthermore, high levels of CML have been observed within
artheroslerotic plaques, in foam cells [34; 41; 46] and in a variety
of chronic degenerative and chronic inflammatory diseases, as
discussed below.
Introduction
11
1.7 Pathogenesis of diabetic organ damage
Diabetic organ damage affects very different organs such as the
kidney, eye, peripheral nerves, skin, heart, and the brain.
Vascular changes can be found in all the different types of late
stage deterioration of organ function and damage can be
microvascular (e.g. kidney, retina, nerves) or macrovascular (e.g.
brain, carotic artery). In Germany in the year 2000, the number of
newly diagnosed cases of diabetic retinopathy was 56,000
(including 2300 cases of blindness) and the number of diabetic
kidney disease was 4000. The annual costs for dialysis are in
excess of 180 Million Euro. Due to diabetic alterations of the
blood vessels, 28,000 limb amputations and 35,000 myocardial
infarctions were counted in the year 2000 (Bretzel, RG 2000).
The medical costs of diabetic complications are of economic
importance and are an estimated one billion Euro per year, which
is as high as the primary costs of diagnosis and treatment of
diabetes mellitus.
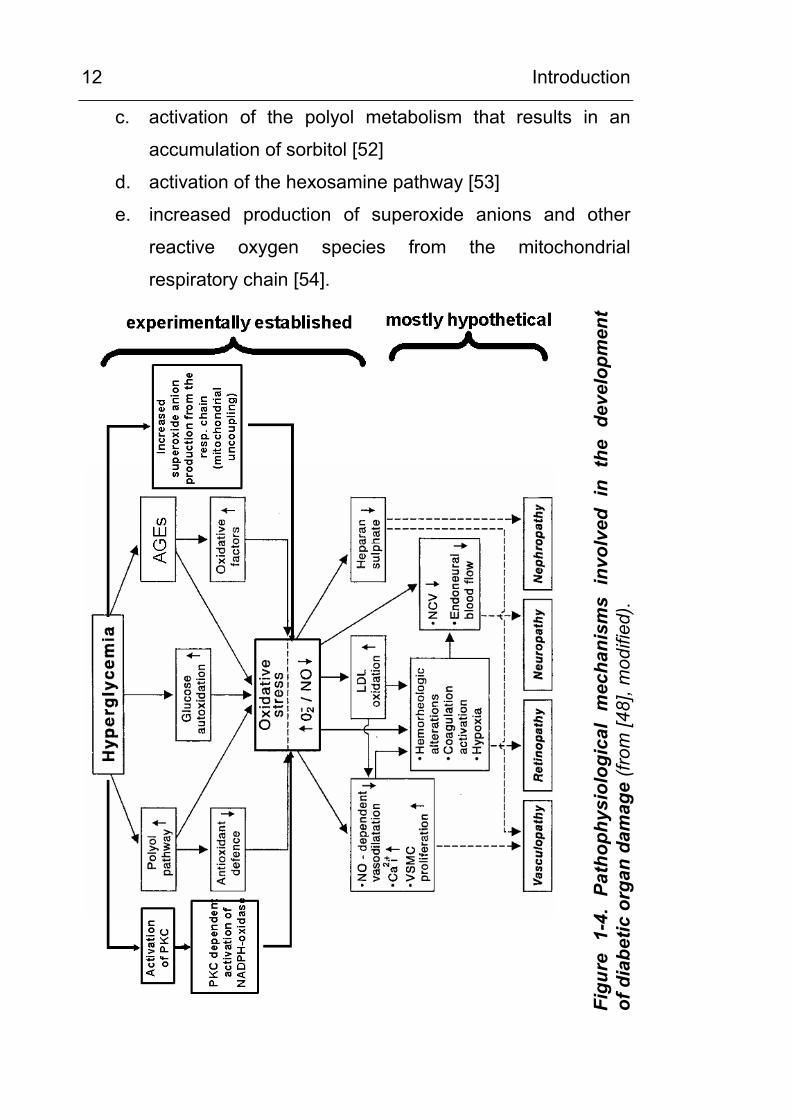
Strict control of blood sugar levels slow the development of
diabetic damage considerably, and several research studies have
suggested that hyperglycemia contributes directly or indirectly to
the pathogenesis of diabetic late stage tissue/organ damage [30;
47] through five different mechanisms. These mechanisms can
interact and are shown schematically in Figure 1-4.
Hyperglycemia can lead to
a. increased intracellular and extracellular formation of
AGEs [49; 50]
b. activation of protein kinase C, followed by an activation of
NADPH-dependent oxidase [51]
Introduction
12
c. activation of the polyol metabolism that results in an
accumulation of sorbitol [52]
d. activation of the hexosamine pathway [53]
e. increased production of superoxide anions and other
reactive oxygen species from the mitochondrial
respiratory chain [54].
Figu
re 1
-4.
Path
ophy
siol
ogic
al m
echa
nism
s in
volv
ed i
n th
e de
velo
pmen
t of
dia
betic
org
an d
amag
e (fr
om [4
8], m
odifi
ed).
Introduction
13
A possible final endpoint of all cellular changes induced by
hyperglycemia appears to be the production of cellular oxidative
stress [47; 55-57].
1.8 Oxidative stress – a key feature of diabetes mellitus and of tissue lesion in other diseases
Accumulating data support the hypothesis that oxidative stress
migth play an important role in the pathogenesis of late diabetic
complications [47; 48; 56; 58]. Several studies have shown that
increased production of ROS and/or antioxidant depletion occurs
in patients with diabetes mellitus [59-64]. Several pathways are
supposed to contribute to the oxidative stress associated with
acute or chronic hyperglycemia, most importantly increased ROS
production from the mitochondrial respiratory chain [65] or from
activated ROS-generating enzymes and glucose autoxidation.
[40; 66; 67]. A close relationship of oxidative stress and glycemic
control has been described by showing a positive correlation
between malondialdehyde (MDA) and both, fasting blood sugar
and glycated hemoglobin [68]. Moreover, the hypothesis that free
radicals and subsequent oxidative stress migth mediate the
effects of hyperglycemia is supported by the observation that
antioxidants counteract many of the injurious effects of
hyperglycemia [69-71]. Besides production of oxygen free
radicals, depletion of antioxidative capacities may also play an
important role in diabetic tissue damage [72-74]. In a recent
study, Nourooz-Zadeh and colleagues described a relationship
between the quality of glycemic control and the presence of free
radicals and thereby demonstrated oxidative stress occuring prior
to the manifestations of late diabetic complications [75].
Introduction
14
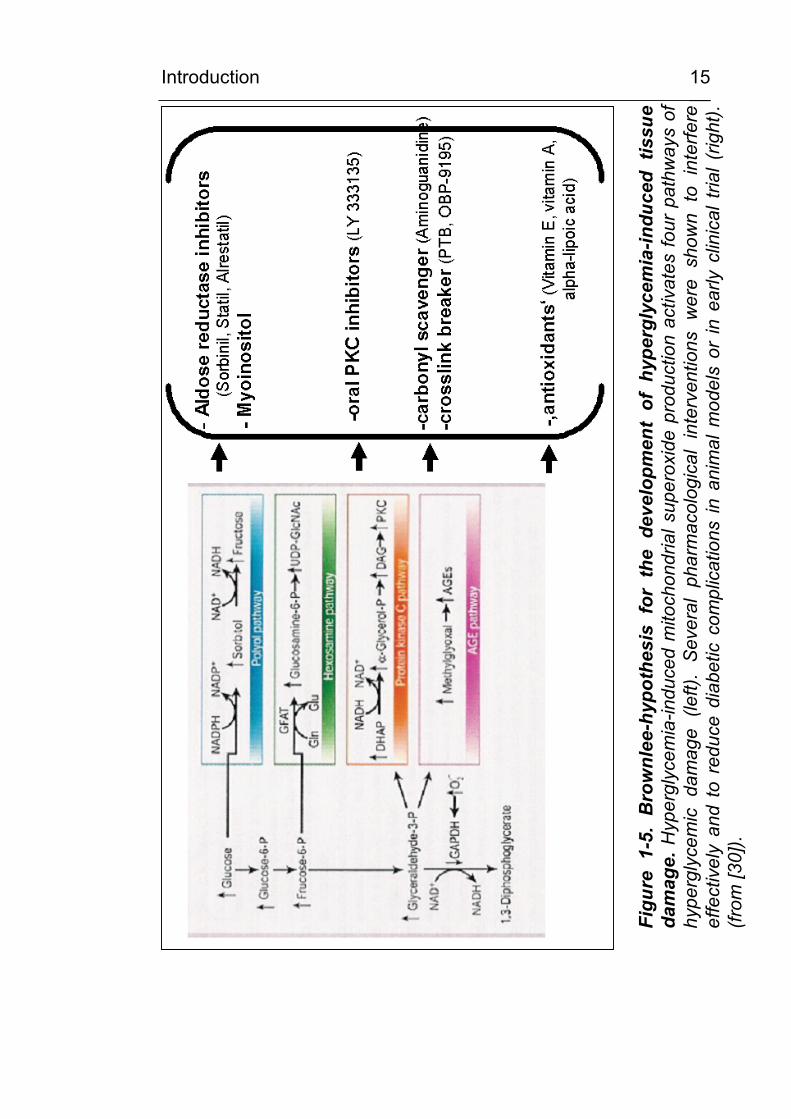
An important mechanism by which hyperglycemia increases
intracellular stress was recently described by Brownlee and
Nishikawa [30; 55]. As shown in Figure 1-5, these authors
propose that hyperglycemia-induced mitochondrial superoxide
production (e) activates all of the first four mechanisms (a-d)
mentioned above. From experimental data it was suggested that
excess superoxide partially inhibits the glycolytic enzyme
GAPDH, thereby diverting upstream metabolites from glycolysis
into the pathways of glucose overutilisation. This results in an
increased flux of dihydroxyacetone phosphate (DHAP) to DAG,
an activator of PKC, and of trioses to MGO, the main intracellular
AGE precursor. The increased flux of fructose-6-phosphate to
UDP-N-acetylglucosamine increases modifications of proteins by
O-linked N-acetylglucosamine (GlcNAc). Furthermore, the
increased glucose flux through the polyol pathway consumes
NADPH and depletes GSH, thereby diminishing the intracellular
antioxidative capacity.
In diabetics, there is not only evidence of increased oxidative
stress in body fluids or locally in the tissues, but additionally, it is
possible to show the effect of oxidative stress on potential target
cells. The activation of the redox sensitive transcription factor
NFκB has been found in the immuno-histological analysis of
blood vessels and kidney samples and in peripheral mononuclear
blood cells of patients with diabetes mellitus [76]. Furthermore,
antioxidants such as vitamin E and thioct acid (α-lipoic acid) were
able to reduce oxidative stress and NFκB-activation [77].
Introduction
15
Figu
re 1
-5.
Bro
wnl
ee-h
ypot
hesi
s fo
r th
e de
velo
pmen
t of
hyp
ergl
ycem
ia-in
duce
d tis
sue
dam
age.
Hyp
ergl
ycem
ia-in
duce
d m
itoch
ondr
ial s
uper
oxid
e pr
oduc
tion
activ
ates
four
pat
hway
s of
hy
perg
lyce
mic
dam
age
(left)
. Se
vera
l ph
arm
acol
ogic
al i
nter
vent
ions
wer
e sh
own
to i
nter
fere
ef
fect
ivel
y an
d to
red
uce
diab
etic
com
plic
atio
ns in
ani
mal
mod
els
or in
ear
ly c
linic
al t
rial (
right
). (fr
om [3
0]).
Introduction
16
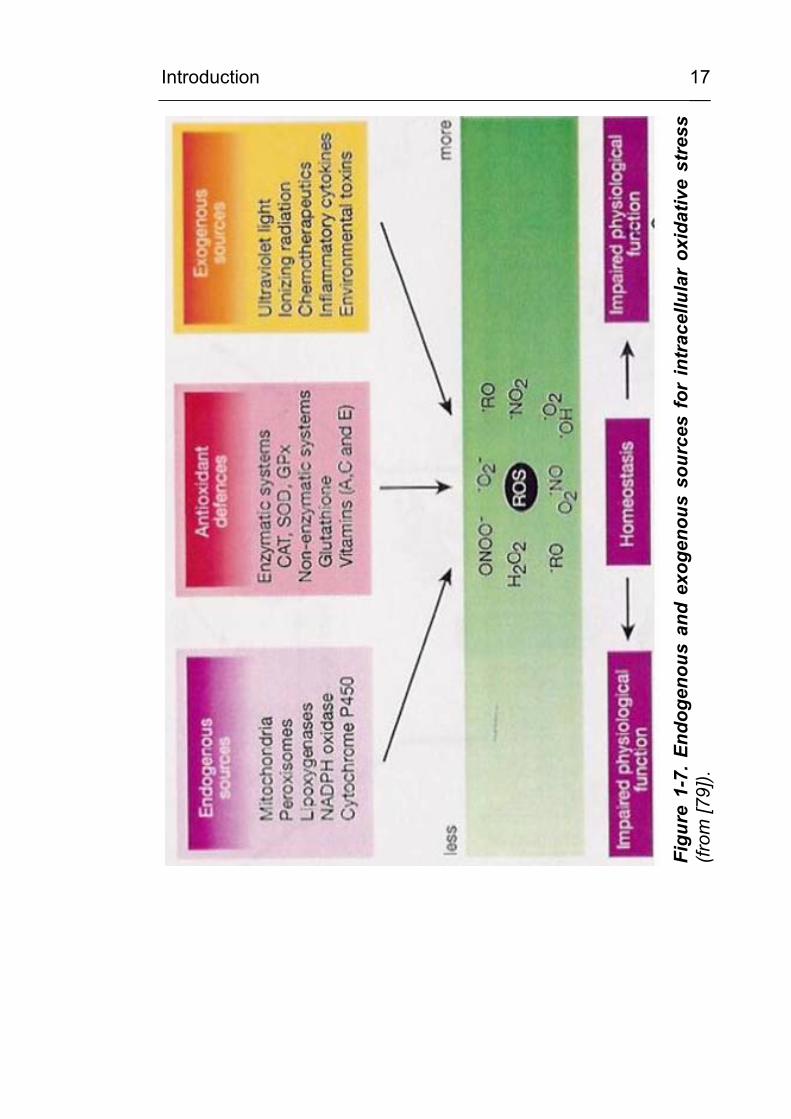
1.9 Oxidative stress
The term oxidative stress describes the increased occurrence of
reactive oxygen species (ROS) in the extracellular and
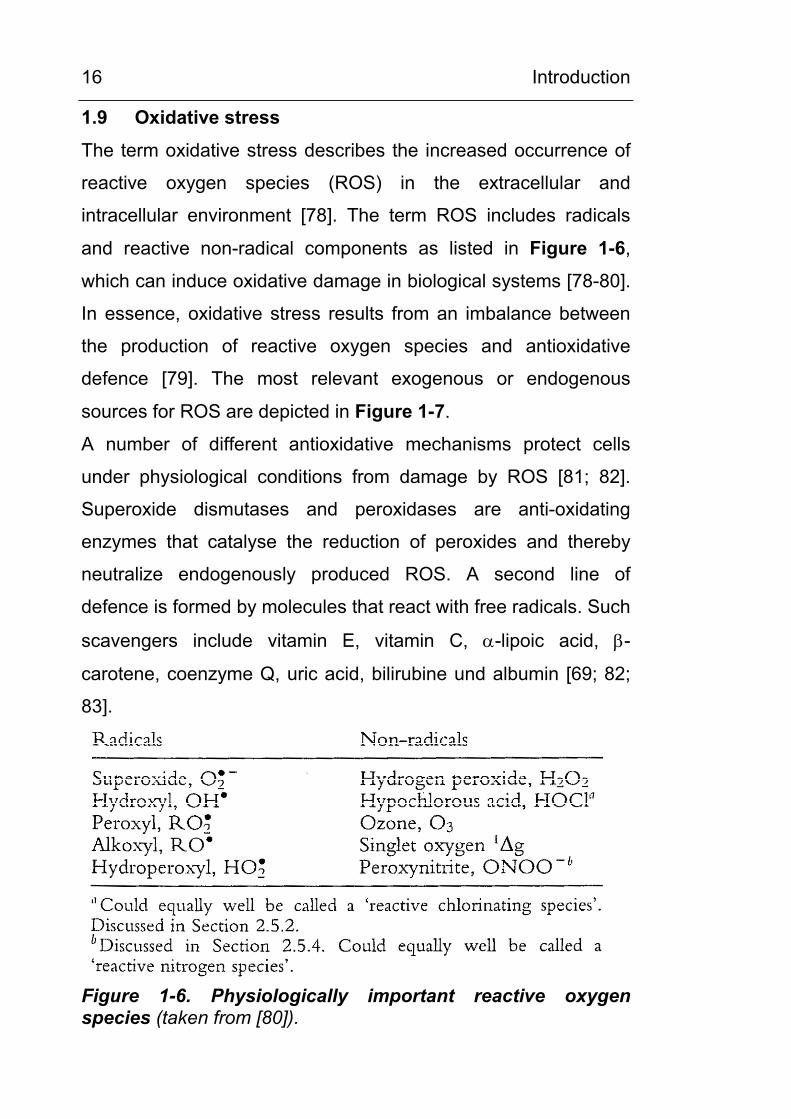
intracellular environment [78]. The term ROS includes radicals
and reactive non-radical components as listed in Figure 1-6,
which can induce oxidative damage in biological systems [78-80].
In essence, oxidative stress results from an imbalance between
the production of reactive oxygen species and antioxidative
defence [79]. The most relevant exogenous or endogenous
sources for ROS are depicted in Figure 1-7.
A number of different antioxidative mechanisms protect cells
under physiological conditions from damage by ROS [81; 82].
Superoxide dismutases and peroxidases are anti-oxidating
enzymes that catalyse the reduction of peroxides and thereby
neutralize endogenously produced ROS. A second line of
defence is formed by molecules that react with free radicals. Such
scavengers include vitamin E, vitamin C, α-lipoic acid, β-
carotene, coenzyme Q, uric acid, bilirubine und albumin [69; 82;
83].
Figure 1-6. Physiologically important reactive oxygenspecies (taken from [80]).
Introduction
17
Figu
re 1
-7. E
ndog
enou
s an
d ex
ogen
ous
sour
ces
for
intr
acel
lula
r ox
idat
ive
stre
ss(fr
om [7
9]).
Introduction
18
1.10 Why could CML represent a potential biomarker for oxidative stress?
1.10.1 In vitro, formation of CML involves oxidative chemistry
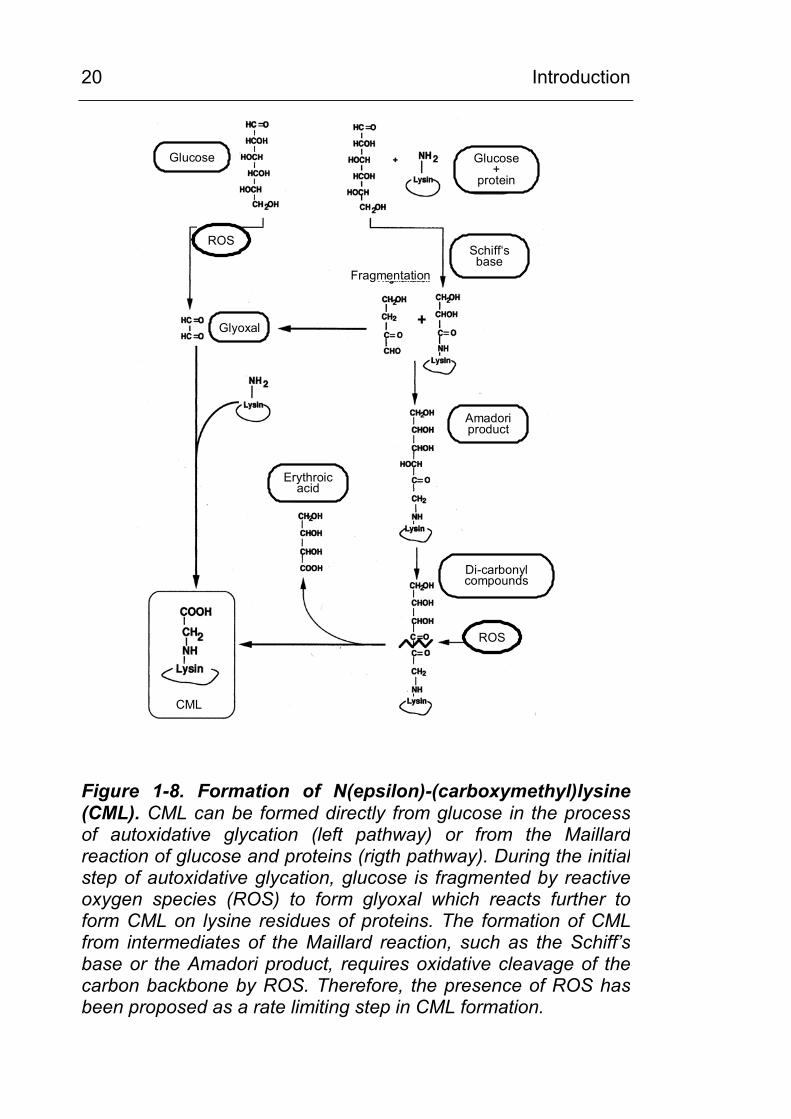
Originally, the Amadori adduct was considered the common
precursor of all AGEs [35]. The CML formation from the Amadori
adduct (rigth pathway in Figure 1-8) requires oxidative cleavage
of the six carbon backbone of the sugar, a reaction with is
essentially irreversible. Therefore, oxidation chemistry had been
proposed as a rate limiting step in this mechanism of CML
formation.
However, in the late 1980s, Wolff [84] proposed an alternative
pathway, autoxidative glycation, in which reducing sugars were
first fragmented oxidatively to yield smaller, more reactive,
carbonyl intermediates, such as glyoxal, then proceeding to react
with protein to form AGEs. In studies on autoxidative glycation it
was found by Wells-Knecht et al. [85] that glyoxal and arabinose
were the major products of autooxidation of glucose and that
CML was formed during the reaction of glyoxal with proteins (left
pathway in Figure 1-8). Additionally, ascorbate, which oxidises in
the presence of free metals into the highly labile
dehydroascorbate, undergoes further decomposition to form
pentoses and tetroses which contribute to CML formation by
subsequent reactions [86].
It is now known that CML can be formed by a maze of alternative
pathways involving oxidative chemistry and reactive carbonyl
intermediates. It may be formed during autoxidation of
carbohydrates, including aldoses and ketoses [87], 3-
deoxyglucosone [88] and ascorbate, from Schiff’s base and
Introduction
19
Amadori adducts [89], by autoxidation of fatty acids and amino
acids such as serine [90] and from phosphorylated intermediates
in carbohydrate metabolism [91]. In addition, Knecht et al. [85]
described that CML could be formed independently from glucose
autoxidation by an intramolecular Cannizzaro reaction from the
precursors glyoxal and glycolaldehyde. Additionally, it may be
formed from products of the polyol pathway [91].
Metal-catalysed autoxidation of glucose in the presence or
absence of proteins is paralleled by the generation of ROS, such
as hydroxyl radicals or superoxide radicals [92-96], that can
undergo dismutation to hydrogen peroxides. Incubation of
proteins, low density lipoproteins (LDL) or phosphatidylcholine
liposomes with glucose under oxidising conditions in the
presence of transition metals (e.g. copper) [97] also results in
increased carbohydrate incorporation/fragmentation and
formation of CML and thiobarbituric acid-reactive components. In
the transition metal-mediated “Fenton reaction”, hydrogen
peroxide can produce highly reactive hydroxyl radicals.
Additionally, the reactive oxygen/reactive nitrogen species
peroxynitrite induces the formation of CML on proteins [98].
Thus, not only glycation, but also oxidative damage of
macromolecules accounts for the formation of CML and other
AGEs. Therefore, it has been supposed [36; 99] that formation of
glycoxidation products in vivo does not only depend on the
relative glucose concentrations, but also on the local oxidative
environment.
Introduction
20
ROSROS
ROS
Glucose Glucose+
protein
Schiff‘sbase
Amadoriproduct
Di-carbonylcompounds
Erythroicacid
Glyoxal
CML
Fragmentation
Figure 1-8. Formation of N(epsilon)-(carboxymethyl)lysine (CML). CML can be formed directly from glucose in the processof autoxidative glycation (left pathway) or from the Maillardreaction of glucose and proteins (rigth pathway). During the initialstep of autoxidative glycation, glucose is fragmented by reactive oxygen species (ROS) to form glyoxal which reacts further toform CML on lysine residues of proteins. The formation of CMLfrom intermediates of the Maillard reaction, such as the Schiff’sbase or the Amadori product, requires oxidative cleavage of the carbon backbone by ROS. Therefore, the presence of ROS hasbeen proposed as a rate limiting step in CML formation.
Introduction
21
1.10.2 CML is formed in a wide variety of diseases where oxidative stress has been implicated in the pathogenesis
There is the notion that histological depositions of CML were
observed in a wide variety of pathological conditions where
oxidative stress has been implicated in the pathomechanism [6].
Apart from diabetic organ damage and diabetic microvascular
disease [100], CML formation has been found in an array of
chronic inflammatory and degenerative diseases. CML
depositions have been found in seemingly disparate pathologies,
such as connective tissue disease (particularly rheumatoid
arthritis) [101], in degenerative neurological diseases such as M.
Alzheimer [102-104] or in end-stage renal disease (ESRD) [105;
106]. In vitro work has mostly shown CML and other AGEs to be
part of the complex interactions of oxidative stress and vascular
damage, particularly in atherosclerosis [34] and in the accelerated
vascular damage in ESRD [107] or diabetes.
1.10.3 In experimental settings, CML is involved in a variety of pathomechanisms
At present, it is unknown whether CML may serve solely as a
biomarker for oxidative stress or whether it has biological
functions in perpetuating chronic inflammation and other
pathological processes. Nevertheless, there is evidence that CML
and other AGEs play a key role in a wide variety of
pathophysiological mechanisms, be it as an indicator or as a
stimulus sustaining chronic inflammation and tissue damage. On
the one hand, the CML/AGE modification alters the structure,
function and turnover rate of proteins. On the other hand, it has
been shown that physiologically relevant quantities of CML-
modified proteins are effective ligands for the receptor for AGEs
Introduction
22
(RAGE) [108] as discussed in the following paragraph. CML and
AGEs have been shown to induce or to be associated with the
ras/raf/MAP-kinase pathway [109; 110] and also with differential
gen expression [111]. CML has been shown to induce RAGE-
mediated intracellular ROS generation by activation of cellular
NADPH oxidase [112]. Further evidence for the involvement of
CML in the pathogenesis of diabetic late complications comes
from the observation that structurally different inhibitors of CML
formation also ameliorate diabetic tissue damage in animal
models [113; 114].
1.10.4 CML is a ligand for the receptor for AGEs (RAGE) and colocalises with RAGE in tissue lesions. Experimental data show a possible pathophysiological role of CML/RAGE interaction in chronic inflammatory and degenerative diseases
RAGE is a 35 kD protein which is expressed on endothelial cells,
monocytes/macrophages, T-lymphocytes, smooth muscle cells,
mesangial cells, neurones and microglial cells [115; 116]. In vitro
and in vivo studies have shown that CML/AGE-RAGE binding on
macrophages, endothelial and microglia cells leads to intracellular
oxidative stress and activation of the redoxsensitiv transcription
faktor NFκB [67; 108; 117]. An actual hypothesis [118] links
CML/RAGE-mediated activation of NFκB to the perpetuation of
pathological processes such as chronic inflammation,
atherosclerosis and diabetic organ damage.
The colocalisation of CML and RAGE has been described in
various organs susceptible to diabetic late complications and to
microvascular injury, including kidney [119], retina [120], nerve
and other organs [121]. There is ongoing debate as to whether
Introduction
23
this colocalisation reflects a receptor-mediated clearance
mechanism or a functionally relevant receptor-triggered
pathomechanism of tissue damage [67; 122; 123].
1.10.5 When present, CML depositions are often found within or in close proximity to infiltrating inflammatory cells and activated resident cells
There are numerous observations from immunohistochemical
studies, using CML-specific antibodies, that CML–
immunoreactivity is localised within invading inflammatory or
activated resident cells, suggesting that these cell types are
involved in CML formation. This has been observed in
atherosclerosis (as shown in Figure 1-9), in Alzheimer’s disease
(as shown in Figure 1-10) and in other conditions such as
macular retina degeneration [41; 102; 124]. Thus, it is possible
that accumulated CML at the sites of tissue injury migth
originate, in part, from infiltating inflammatory cells or from
activated resident cells involved in tissue injury or repair.
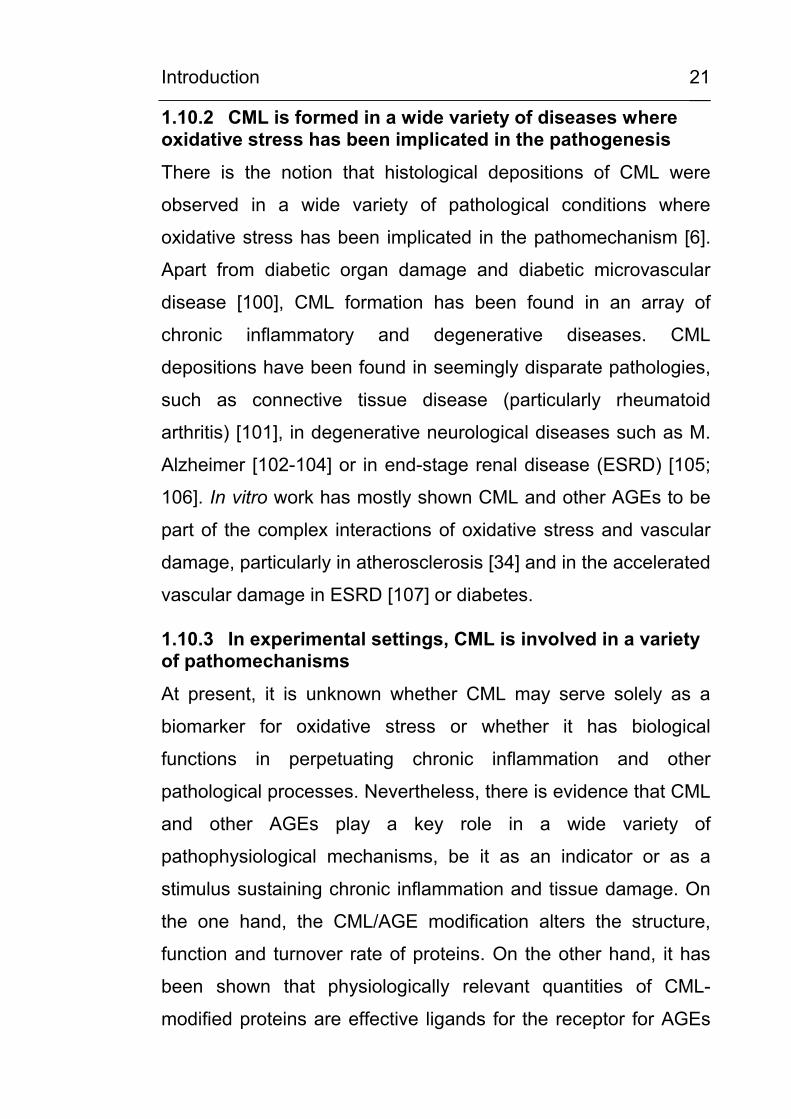
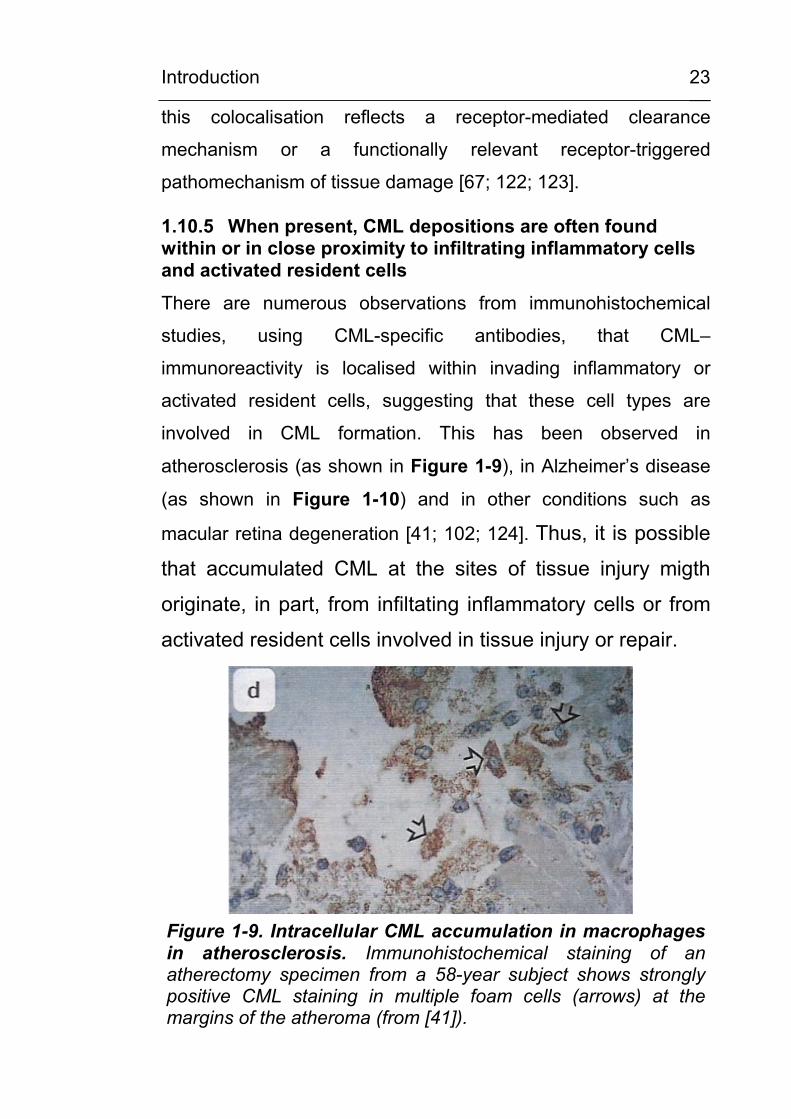
Figure 1-9. Intracellular CML accumulation in macrophages in atherosclerosis. Immunohistochemical staining of an atherectomy specimen from a 58-year subject shows strongly positive CML staining in multiple foam cells (arrows) at the margins of the atheroma (from [41]).
Introduction
24
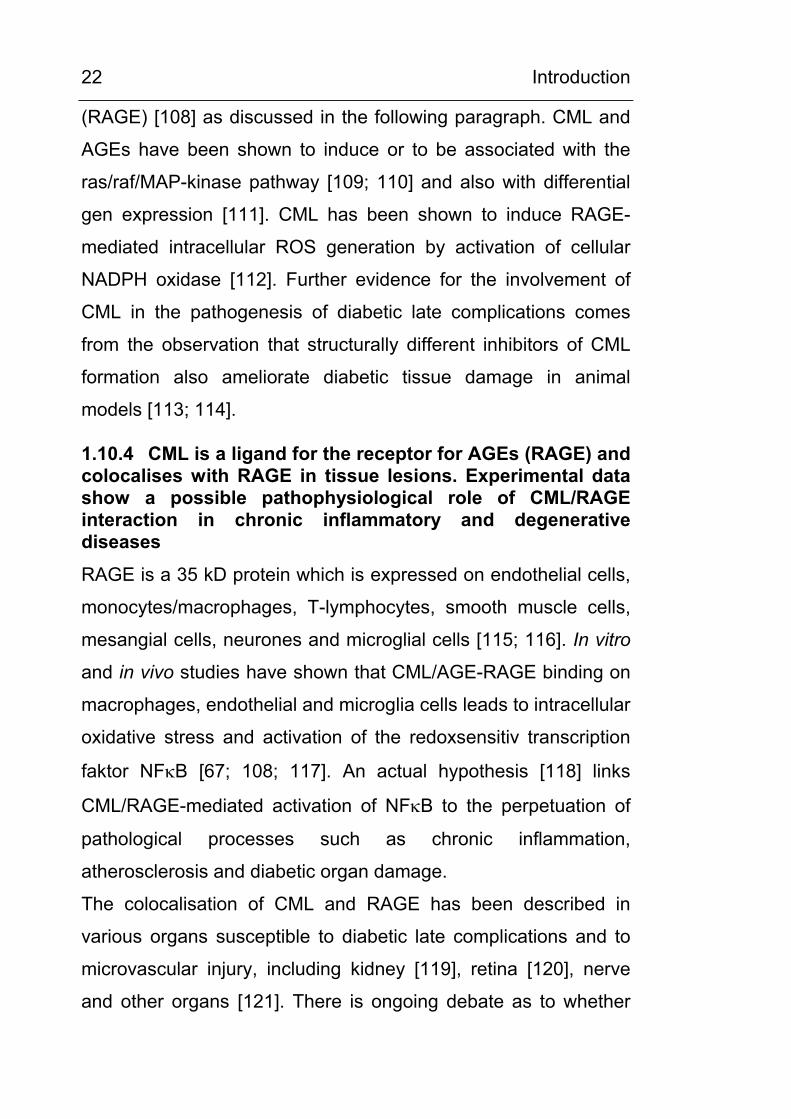
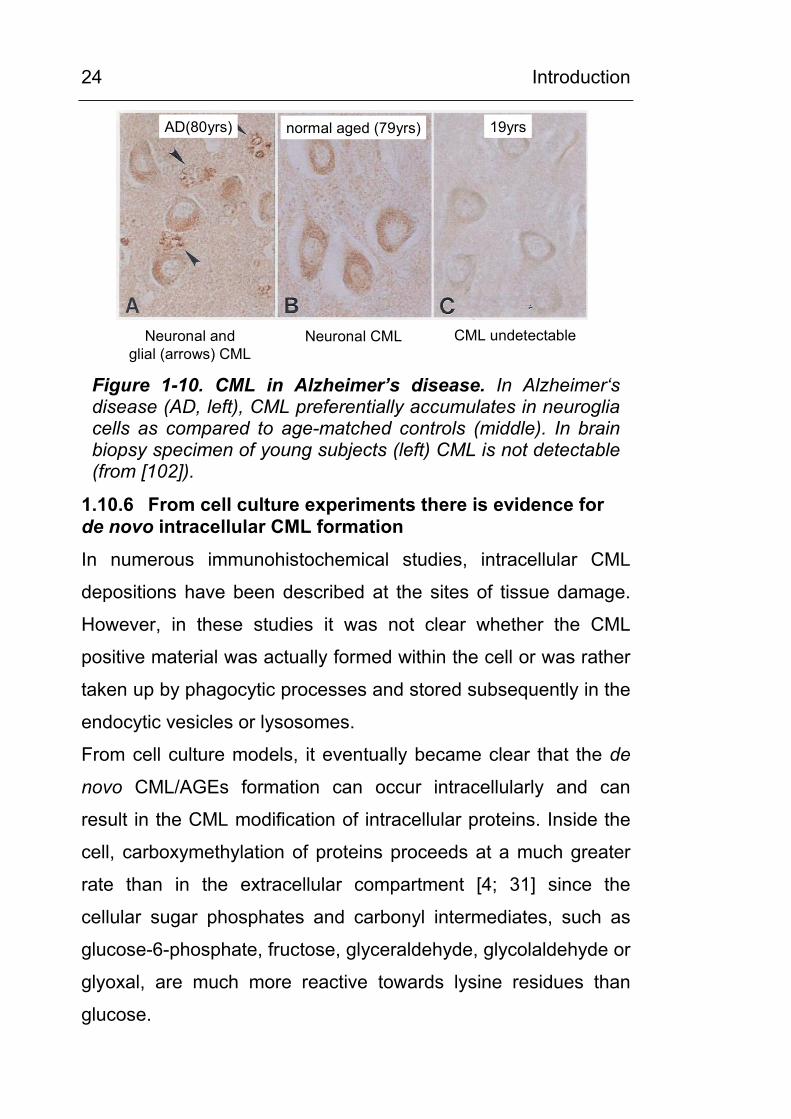
AD(80yrs) normal aged (79yrs) 19yrs
Neuronal and glial (arrows) CML
Neuronal CML CML undetectable
Figure 1-10. CML in Alzheimer’s disease. In Alzheimer‘s disease (AD, left), CML preferentially accumulates in neuroglia cells as compared to age-matched controls (middle). In brain biopsy specimen of young subjects (left) CML is not detectable (from [102]).
1.10.6 From cell culture experiments there is evidence for de novo intracellular CML formation
In numerous immunohistochemical studies, intracellular CML
depositions have been described at the sites of tissue damage.
However, in these studies it was not clear whether the CML
positive material was actually formed within the cell or was rather
taken up by phagocytic processes and stored subsequently in the
endocytic vesicles or lysosomes.
From cell culture models, it eventually became clear that the de
novo CML/AGEs formation can occur intracellularly and can
result in the CML modification of intracellular proteins. Inside the
cell, carboxymethylation of proteins proceeds at a much greater
rate than in the extracellular compartment [4; 31] since the
cellular sugar phosphates and carbonyl intermediates, such as
glucose-6-phosphate, fructose, glyceraldehyde, glycolaldehyde or
glyoxal, are much more reactive towards lysine residues than
glucose.
Introduction
25
Evidence for intracellular CML formation comes now from a
variety of cell types such as aortic endothelial cells, lung epithelial
cells or cultured cortical neurons [31; 125-127]. Giardino et al.
[31] observed a 13.8-fold higher rate in intracellular CML
formation in cultured endothelial cell when they were cultured in
high glucose (30mM) conditions as compared to normal glucose.
Furthermore, cells which were deficient in glyoxalase I showed an
even higher increase in CML modification. The overexpression of
glyoxalase I completely prevented the high glucose-induced AGE
formation [32].
1.10.7 CML formation on cellular proteins has also been described in vivo in circulating blood cells
Evidence for the carboxymethylation of intracellular proteins
comes not only from cell culture studies, but also from ex vivo-
isolated circulating blood cells. Hammes et al. [45] detected
increased levels of CML in circulating long-lived T-lymphocytes
and Schiekofer et al. described intracellular CML modification of
proteins in circulating peripheral blood monocytic cells (PBMC)
under short term (2 h) hyperglycemia [109]. Pamplona et al [128;
129] detected a number of carboxymethylated intracellular
proteins, including mitochondrial proteins, by Western-blotting
analysis and Baynes et al (personal communication) detected
CML in liver and muscle proteins at levels comparable to
concentrations found in extracellular matrix.
1.10.8 Many of the CML-forming cell types possess enzymatic systems to generate oxidative stress.
Cellular oxidative stress is formed by processes like oxidative
phosphorylation or by cellular enzymes such as myeloperoxidase
or NADPH oxidase. Furthermore, it is known that cellular
Introduction
26
oxidative stress promotes formation of CML and other AGEs. This
has been demonstrated in granulocytes [130] and monocytic cells
[131], as well as in cell lines of epithelial [126], endothelial [31]
and neuronal [88; 127] origin. In these studies, oxidative stress
was generated either by ROS-generating enzymes [130] or by
diminishing the antioxidative defense, e.g by GSH depletion
through menadione [45]. The ROS-mediated CML formation was
most obvious in granulocytes, where stimulation with the
phorbolester PMA resulted in an “oxidative burst” from
myeloperoxidase and NADPH oxidase leading to rapid
carboxymethylation of model proteins [130].
Many of the cell types in which intracellular CML formation has
been described so far, contain enzyms to exert oxidative stress,
namely NADPH oxidase. Cellular NADPH oxidase has been
described so far in granulocytes and macrophages and in
endothelial cells, chondrocytes, osteoclasts, neurons and other
nonphagocytic cells (reviewed in [132]). Remarkably, in most of
these cell types, CML formation has been demonstrated in
immunohistochemical studies, and a primary aim of the present
study is to prove or disprove the involvement of NADPH oxidase
and NADPH oxidase-generated superoxide anions in CML
formation.
Aim of this study
27
2 AIM OF THIS STUDY In the present study, the hypothesis will be tested that the
advanced glycation end product (AGE) Nε-(carboxymethyl)-lysine
(CML) is
(a) produced intracellularly in macrophages and granulocytes,
(b) a product of lipid-peroxidation,
(c) formed under the influence of reactive oxygen species (ROS),
especially of superoxide anions which are produced by cellular
NADPH oxidase.
Furthermore, this study will examine, whether
(d) the analysis and measurement of CML in tissues and body
fluids and the identification of specific CML-modified proteins may
add to the understanding of the pathophysiological processes in
chronic inflammatory and degenerative diseases.
Material and Methods
28
3 MATERIAL AND METHODS
3.1 Chemicals
All solvents were of HPLC grade. All reagents and buffer salts
were p. A. or of the highest grade obtainable. The following
chemicals were used:
Arachidonic acid Sigma, Deisenhofen, A9673
3-Mercaptopropionic acid (MPA) Sigma, Deisenhofen
Acetic acid Merck, Darmstadt
Acetone Merck, Darmstadt
Acetonitrile Merck, Darmstadt
Acrylamide(30%)/bis (N,N‘methylenbisacrylamide)(0.8%)
Roth, Karlsruhe
Albumin, bovine serum (BSA), fraction V, low endotoxin
Sigma, Deisenhofen, A8806
Albumin, human serum (HSA), low endotoxin
Sigma, Deisenhofen, A5843
Aminoguanidine Sigma, Deisenhofen, A8835
Ammonium bicarbonate Merck, Darmstadt
Ammonium persulfate Serva, Heidelberg
Aprotinin (Trasylol) Bayer, Leverkusen
Boc-Lys-OH [N-α-t.-Boc-L-lysine] Calbiochem, Läufelingen, CH
Calcium chloride Serva, Heidelberg
Carboxyethyl-lysine Prof. Hammes, Mannheim
Carboxymethyl-lysine U. Friess, Tuebingen M. Lederer, Stuttgart H. Echner, Tuebingen
Material and Methods
29
CM-H2DCFDA Molecular Probes, Göttingen
Coomassie brilliant blue R-250 Serva, Heidelberg
Digitonin Sigma, Deisenhofen, D5628
Dimethyl sulfoxide (DMSO) Roth, Karlsruhe
Di-potassium hydrogen phosphate Merck, Darmstadt
D-mannitol Sigma, Deisenhofen, M8429
DTT (dithiothreitol) Sigma, Deisenhofen
EDTA (ethylendiamintetraacetate) Merck, Darmstadt
Ethanol (95%, 70%) Merck, Darmstadt
Ferritin, cationized Sigma, Deisenhofen, F7879
Glycerol Serva, Heidelberg
Glyoxylic acid, sodium salt Fluka, Buchs, CH
Hemoglobin A0 Sigma, Heidelberg, H0267
HEPES (N-(2-hydroxythyl)piperazine-
N‘-2-ethanesulfonic acid)
Serva, Heidelberg
Histopaque-1119/-1077 Sigma, Deisenhofen
Hydrocloric acid (>36.5% w/w)) Sigma, Deisenhofen
Hypoxanthine Sigma, Deisenhofen, H9377
L-glutamine Sigma, Deisenhofen, G7029
Linoleic acid Sigma, Deisenhofen, L1376
Lipopolysaccharide (LPS) from E. coli 026:B6
Sigma, Deisenhofen, L8274
Material and Methods
30
Lucigenin (bis-N-methylacridiniumnitrate)
Sigma, Deisenhofen
Luminol (3-aminophthalhydrazide) Fluka, Neu-Ulm
Lysozyme Seikagaku, Japan
Methanol Merck, Darmstadt
N,N,N‘,N‘-tetramethylendiamine (TEMED)
Serva, Heidelberg
NADPH Sigma, Deisenhofen, N6505
Oleic acid Sigma, Deisenhofen, O1383
o-Phtaldialdehyde (OPA) Sigma, Deisenhofen
Phosphoric acid Merck, Darmstadt
Pluronic F-127 Molecular Probes, Göttingen
PMA (phorbol-12-myristate-13-acetate)
Sigma, Deisenhofen
PMSF (phenylmethylsulfonylfluoride) Sigma, Deisenhofen
Potassium chloride Merck, Darmstadt
Potassium hydrogen phosphate Merck, Darmstadt
Protease inhibitor cocktail for mammalian tissues
Sigma, Deisenhofen, P8340
Ribonuclease A Sigma, Deisenhofen, R5500
Sodium cyanoborohydride Sigma, Deisenhofen, S8628
Sodium dodecylsulfate (SDS) Bio-Rad, Munich
TIRON [4,5-dihydroxy-1,3-benzene-disulfonic acid]
Sigma, Deisenhofen, D7389,
Trifluoroacetic acid (TFA) Merck, Darmstadt
Material and Methods
31
TRIS (tris[hydroxymethyl]aminomethane)
Merck, Darmstadt
TRIS Ultrapure (for ECL solutions) ICN, Irvine, USA, Cat.No. 819623
Vitamin D3 (1,25-(OH)2vitamin D3) Calbiochem, Läufelingen, CH
Xanthine oxidase Sigma, Deisenhofen, X4500
Zymosan A from saccharomyces cervisiae
Sigma, Deisenhofen, Z4250
β-Mercaptoethanol Sigma, Deisenhofen
3.2 Tests, kits and other materials
BioRad protein assay dye reagent Bio-Rad, Munich, Art.#500-0006
BioRad protein assay kit Bio-Rad, Munich, Art.# 500-0001
BioRad RC DC protein assay kit Bio-Rad, Munich, Art.# 500-0001
Bio-Rad Precision Plus unstained protein standards
Bio-Rad, Munich
Bio-Rad Precision Plus stained protein standards (dual color)
Bio-Rad, Munich
BenchMark Prestained Protein Ladder
Invitrogen, Karlsruhe
Premixed Protein Molecular Weigth Marker low range
Boehringer/Roche, Mannheim
Biochrom buffer set P for amino acid analysis
Biochrom, Cambridge, GB
GB gel blotting paper Schleicher + Schüll, Dassel
Protran nitrocellulose membrane 0.45µm
Schleicher + Schüll, Dassel
Material and Methods
32
Immuno-Blot PVDF membrane Bio-Rad, Munich
Glass hydrolysis tubes Wheaton, Milville, NJ, USA
Hyperfilm ECL Amersham Pharmacia Biotech, Freiburg
Spectrum Float-A-Lyzer (MW cut off: 5000 Da)
Roth, Karlsruhe
3.2.1 Isolation of leucocyte subclasses
Dynabeads M-450 CD3 (panT) Dynal, Hamburg
Dynabeads M-450 CD14 Dynal, Hamburg
Dynabeads M–450 CD15 Dynal, Hamburg
3.2.2 Immunoprecipitation
Pierce Seize Primary Immunoprecipitation kit
Pierce, Bonn
Pierce Seize Classic (G) Immunoprecipitation kit
Pierce, Bonn
Pierce Seize X Protein G Immunoprecipitation kit
Pierce, Bonn
Pierce ImmunoPure Immobilized Protein G
Pierce, Bonn
3.2.3 2-D Elpho
Sypro Ruby gel stain Bio-Rad, Munich, Art.# 170-3125
Sypro Ruby blot stain Bio-Rad, Munich, Art.# 170-3148
Pierce GelCode E-zinc stain kit Pierce, Bonn
Material and Methods
33
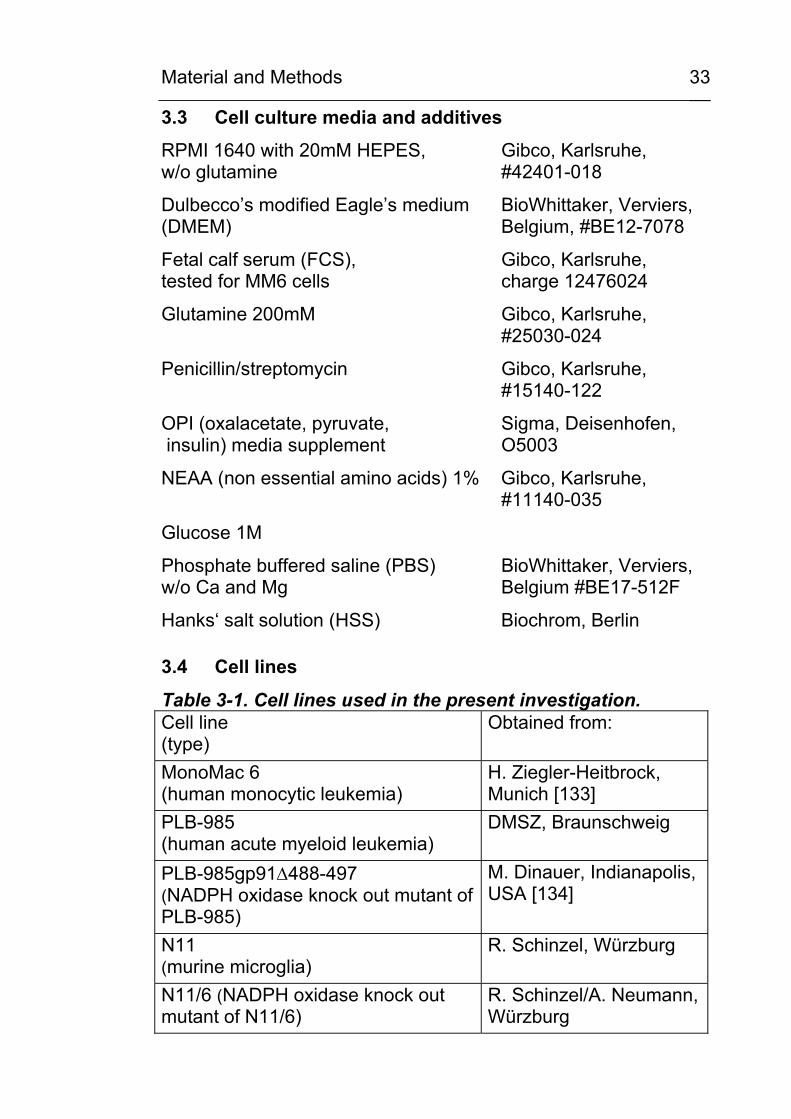
3.3 Cell culture media and additives
RPMI 1640 with 20mM HEPES, w/o glutamine
Gibco, Karlsruhe, #42401-018
Dulbecco’s modified Eagle’s medium (DMEM)
BioWhittaker, Verviers, Belgium, #BE12-7078
Fetal calf serum (FCS), tested for MM6 cells
Gibco, Karlsruhe, charge 12476024
Glutamine 200mM Gibco, Karlsruhe, #25030-024
Penicillin/streptomycin Gibco, Karlsruhe, #15140-122
OPI (oxalacetate, pyruvate, insulin) media supplement
Sigma, Deisenhofen, O5003
NEAA (non essential amino acids) 1% Gibco, Karlsruhe, #11140-035
Glucose 1M
Phosphate buffered saline (PBS) w/o Ca and Mg
BioWhittaker, Verviers, Belgium #BE17-512F
Hanks‘ salt solution (HSS) Biochrom, Berlin
3.4 Cell lines
Table 3-1. Cell lines used in the present investigation. Cell line (type)
Obtained from:
MonoMac 6 (human monocytic leukemia)
H. Ziegler-Heitbrock, Munich [133]
PLB-985 (human acute myeloid leukemia)
DMSZ, Braunschweig
PLB-985gp91∆488-497 (NADPH oxidase knock out mutant of PLB-985)
M. Dinauer, Indianapolis, USA [134]
N11 (murine microglia)
R. Schinzel, Würzburg
N11/6 (NADPH oxidase knock out mutant of N11/6)
R. Schinzel/A. Neumann, Würzburg
Material and Methods
34
3.5 Cell culture conditions and experimental conditions in cell culture experiments
3.5.1 Mono Mac 6, PLB 985 and PLB 985gp91∆488-497 monocytic cells
All cell culture media and additives were from Gibco, Karlsruhe,
unless stated otherwise. The cell culture media were prepared
according to the following recipes:
Monocytic cell growth medium (5.5 mM (1 g/l) glucose):
To 450 ml RPMI 1640 medium (5.5 mM glucose, 20mM HEPES,
w/o glutamine, cat. #42401-018) was added:
50 ml inactivated FCS (low LPS, Gibco, Karlsruhe, cat. # 16000-
044, tested lot #12476024) to a final concentration of 10 %, 5 ml
glutamine to a final conc. of 2 mM, 2.5 ml penicillin to a final conc.
of 100 u/l, 2.5 ml streptomycin to a final conc. of 100 µg/l and 5 ml
OPI medium supplement to a final conc. of oxalacetate 1 mM,
pyruvate 1 mM and insulin 9 µg/ml, respectively.
Monocytic cell experimental medium (30 mM (5.5 g/l) glucose):
Same as above. Additionally, 1M sterile glucose solution was
added to a final concentration of 30 mM glucose.
Culture conditions:
Cells were kept in growth medium (see above) at 370C in a
humidified 5 %CO2 atmosphere. Cells were split 1:10 twice
weekly.
Predifferentiation of Mono Mac 6 and PLB 985 cells:
For subsequent experiments, cells were split 1:10 and Mono Mac
6 cells were pre-differentiated by incubation with TNFα (1nM/ml
which equals 17ng/ml) for 3 d according to Ziegler-Heitbrock et al.
Material and Methods
35
[135; 136] and PLB 985 cells were pre-differentiated by
incubation with 50 nM 1,15-(OH)2-vitamin D3 for 5 d according to
Perkins et al. [137] in growth medium. After this period of time,
the cells were found to produce ROS in the lucigenin
chemiluminescence test as a feature of monocytic differentiation.
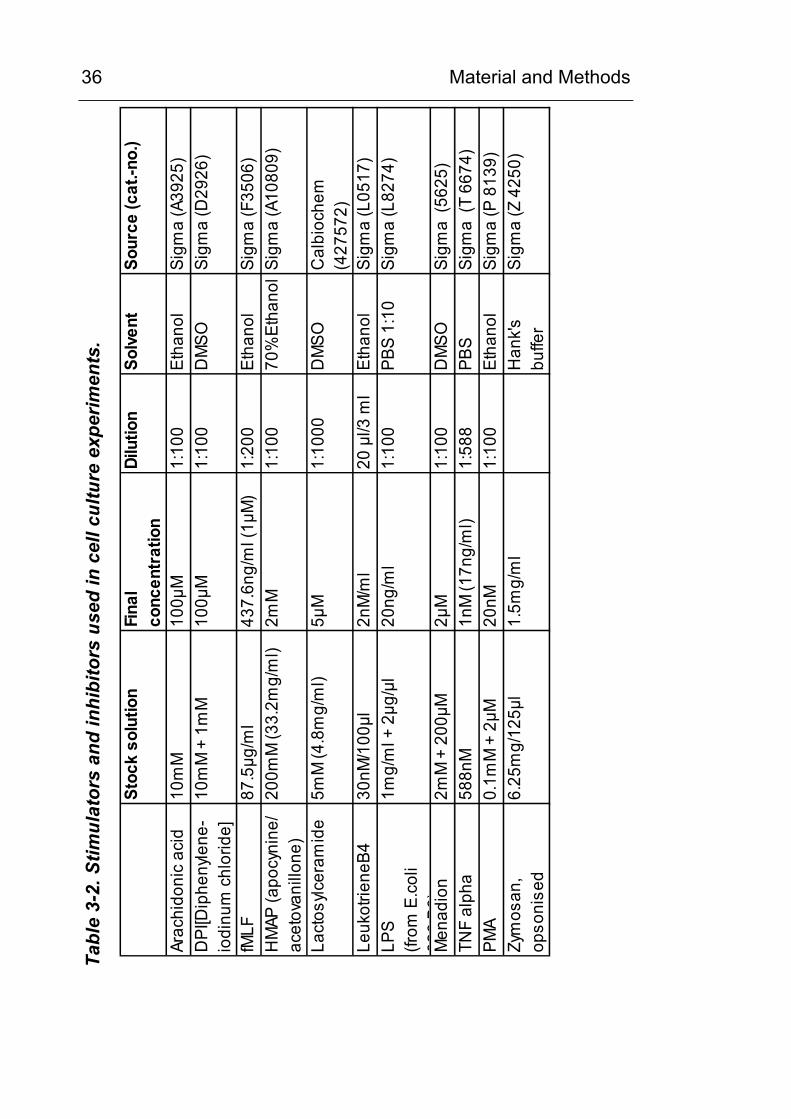
Experimental conditions:
Pre-differentiated Mono Mac 6 or PLB 985 cells were stimulated
by 20 nM PMA in normal glucose (5.5mM) or high glucose
(30mM) growth medium as indicated. Pre-differentiated cells were
seeded at approx. 0.25 – 0.50 x 10⁶ cells/ml in 6 wells or culture
flasks in experimental medium. The stimulating agents or
inhibitors listed in Table 3-2 were added as indicated in each
experiment (see Results). For controls, the solvents EtOH and
DMSO were added to a final concentration of 0.05% and 2%,
respectively.
3.5.2 N11 and N11/6 murine microglial cells
Microglial cell growth and experimental medium (final conc. 11 mM / 2 g/l glucose):
To 450 ml DMEM medium (1 g/l glucose, BioWhittaker, Verviers,
Belgium, cat. #BE12-7078) was added: 50 ml inactivated FCS to
a final concentration of 10 %, 5 ml glutamine to a final conc. of 2
mM, 2.5 ml penicillin to a final conc. of 100 u/l and 2.5 ml
streptomycin to a final conc. of 100 µg/l.
Material and Methods
36 Ta
ble
3-2.
Stim
ulat
ors
and
inhi
bito
rs u
sed
in c
ell c
ultu
re e
xper
imen
ts.
Stoc
k so
lutio
nFi
nal
conc
entr
atio
nDi
lutio
nSo
lven
tSo
urce
(cat
.-no.
)
Arac
hido
nic
acid
10m
M10
0µM
1:10
0Et
hano
lSi
gma
(A39
25)
DPI
[Dip
heny
lene
-io
dinu
m c
hlor
ide]
10m
M +
1m
M10
0µM
1:10
0D
MSO
Sigm
a (D
2926
)
fMLF
87.5
µg/m
l43
7.6n
g/m
l (1µ
M)
1:20
0Et
hano
lSi
gma
(F35
06)
HM
AP (a
pocy
nine
/ac
etov
anill
one)
200m
M (3
3.2m
g/m
l)2m
M1:
100
70%
Etha
nol
Sigm
a (A
1080
9)
Lact
osylc
eram
ide
5mM
(4.8
mg/
ml)
5µM
1:10
00D
MSO
Cal
bioc
hem
(4
2757
2)Le
ukot
riene
B430
nM/1
00µl
2nM
/ml
20 µ
l/3 m
l Et
hano
lSi
gma
(L05
17)
LPS
(from
E.c
oli
026
B6)
1mg/
ml +
2µg
/µl
20ng
/ml
1:10
0PB
S 1:
10
Sigm
a (L
8274
)
Men
adio
n2m
M +
200
µM2µ
M1:
100
DM
SOSi
gma
(562
5)TN
F al
pha
588n
M1n
M (1
7ng/
ml)
1:58
8 PB
S Si
gma
(T 6
674)
PMA
0.1m
M +
2µM
20nM
1:10
0Et
hano
lSi
gma
(P 8
139)
Zym
osan
, op
soni
sed
6.25
mg/
125µ
l1.
5mg/
ml
Han
k'sbu
ffer
Sigm
a (Z
425
0)
Material and Methods
37
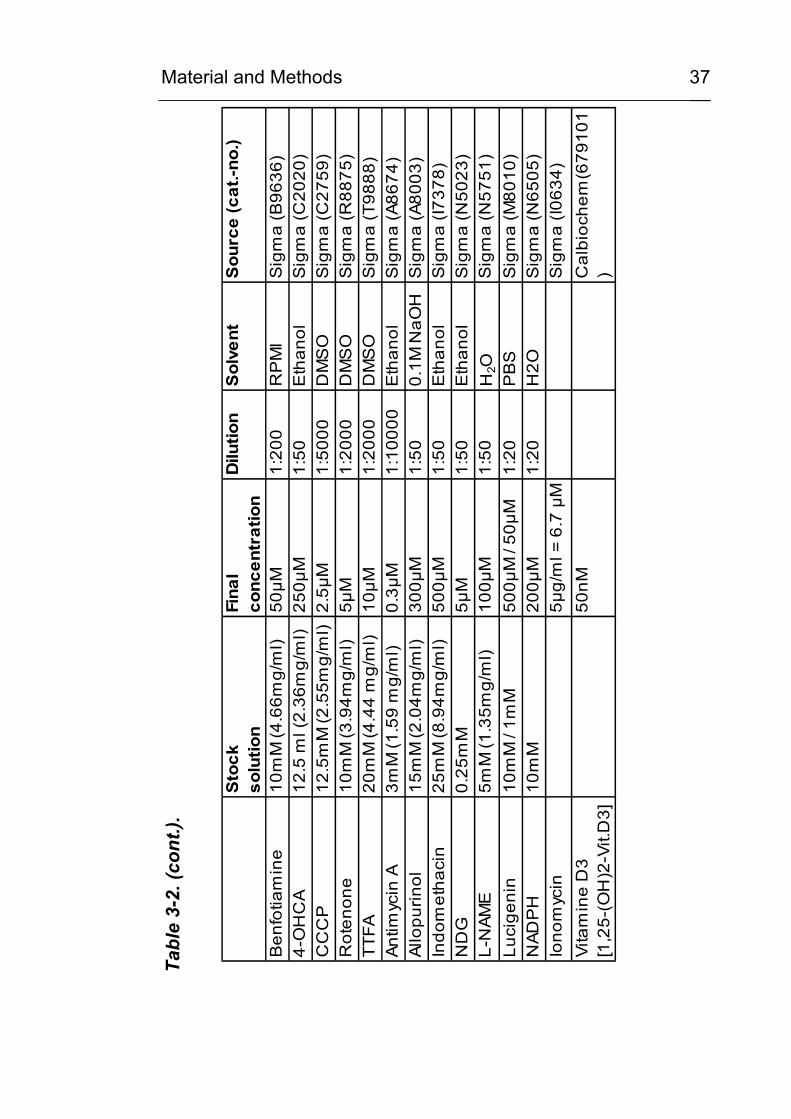
Tabl
e 3-
2. (c
ont.)
.
Sto
ck
solu
tion
Fina
lco
ncen
trat
ion
Dilu
tion
Sol
vent
Sou
rce
(cat
.-no.
)
Ben
fotia
min
e10
mM
(4.6
6mg/
ml)
50µM
1:20
0R
PM
IS
igm
a (B
9636
)4-
OH
CA
12.5
ml (
2.36
mg/
ml)
250µ
M1:
50E
than
olS
igm
a (C
2020
)C
CC
P12
.5m
M (2
.55m
g/m
l)2.
5µM
1:50
00D
MS
OS
igm
a (C
2759
)R
oten
one
10m
M (3
.94m
g/m
l)5µ
M1:
2000
DM
SO
Sig
ma
(R88
75)
TTFA
20m
M (4
.44
mg/
ml)
10µM
1:20
00D
MS
OS
igm
a (T
9888
)An
timyc
in A
3mM
(1.5
9 m
g/m
l)0.
3µM
1:10
000
Eth
anol
Sig
ma
(A86
74)
Allo
purin
ol15
mM
(2.0
4mg/
ml)
300µ
M1:
500.
1M N
aOH
Sig
ma
(A80
03)
Indo
met
haci
n25
mM
(8.9
4mg/
ml)
500µ
M1:
50E
than
olS
igm
a (I7
378)
ND
G0.
25m
M5µ
M1:
50E
than
olS
igm
a (N
5023
)L-
NAM
E5m
M (1
.35m
g/m
l)10
0µM
1:50
H2O
Sig
ma
(N57
51)
Luci
geni
n10
mM
/ 1m
M50
0µM
/ 50
µM1:
20P
BS
Sig
ma
(M80
10)
NAD
PH
10m
M
200µ
M1:
20H
2OS
igm
a (N
6505
) Io
nom
ycin
5µg/
ml =
6.7
µM
Sig
ma
(I063
4)Vi
tam
ine
D3
[1,2
5-(O
H)2
-Vit.
D3]
50nM
Cal
bioc
hem
(679
101
)
Material and Methods
38
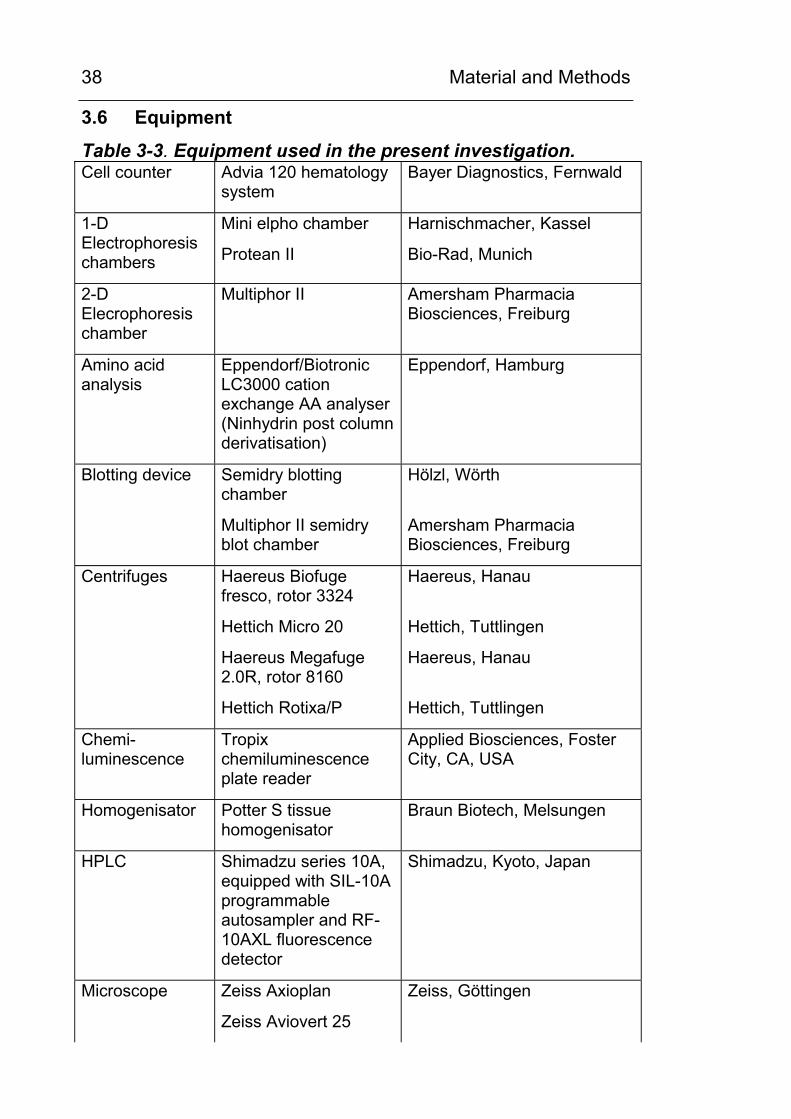
3.6 Equipment
Table 3-3. Equipment used in the present investigation. Cell counter Advia 120 hematology
system Bayer Diagnostics, Fernwald
1-D Electrophoresis chambers
Mini elpho chamber
Protean II
Harnischmacher, Kassel
Bio-Rad, Munich
2-D Elecrophoresis chamber
Multiphor II Amersham Pharmacia Biosciences, Freiburg
Amino acid analysis
Eppendorf/Biotronic LC3000 cation exchange AA analyser (Ninhydrin post column derivatisation)
Eppendorf, Hamburg
Blotting device Semidry blotting chamber
Multiphor II semidry blot chamber
Hölzl, Wörth
Amersham Pharmacia Biosciences, Freiburg
Centrifuges Haereus Biofuge fresco, rotor 3324
Hettich Micro 20
Haereus Megafuge 2.0R, rotor 8160
Hettich Rotixa/P
Haereus, Hanau
Hettich, Tuttlingen
Haereus, Hanau
Hettich, Tuttlingen
Chemi- luminescence
Tropix chemiluminescence plate reader
Applied Biosciences, Foster City, CA, USA
Homogenisator Potter S tissue homogenisator
Braun Biotech, Melsungen
HPLC Shimadzu series 10A, equipped with SIL-10A programmable autosampler and RF-10AXL fluorescence detector
Shimadzu, Kyoto, Japan
Microscope Zeiss Axioplan
Zeiss Aviovert 25
Zeiss, Göttingen
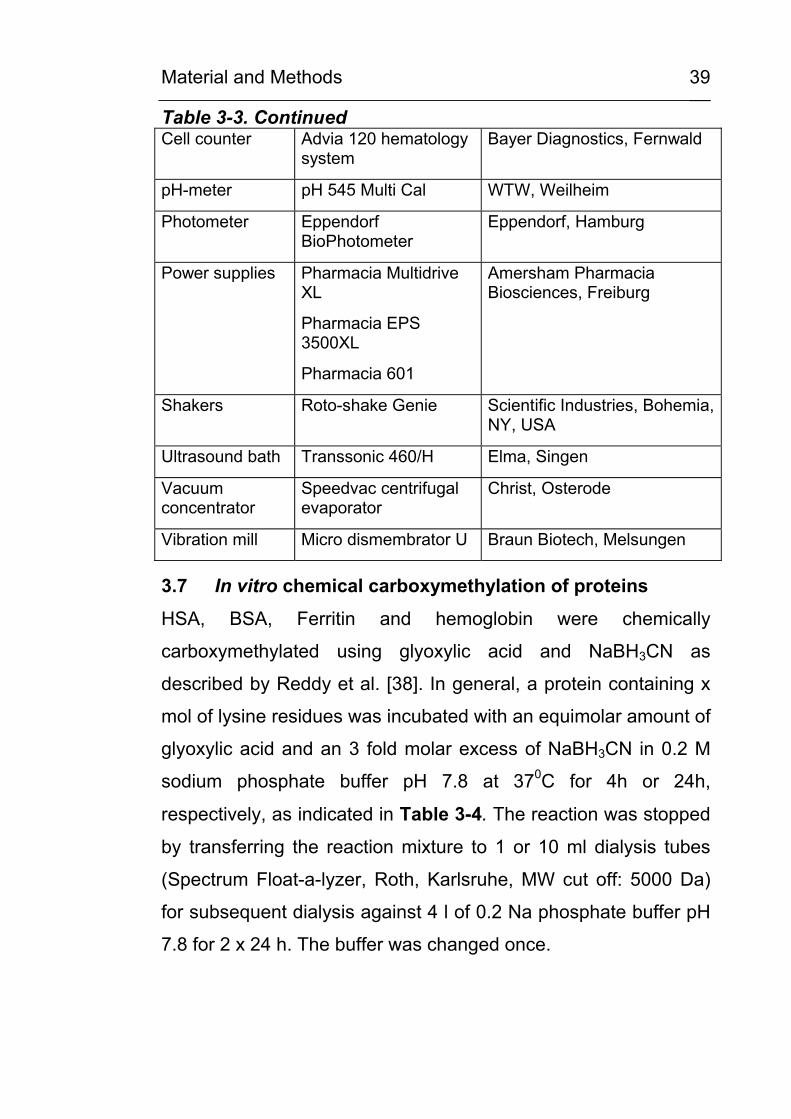
Material and Methods
39
Table 3-3. Continued Cell counter Advia 120 hematology
system Bayer Diagnostics, Fernwald
pH-meter pH 545 Multi Cal WTW, Weilheim
Photometer Eppendorf BioPhotometer
Eppendorf, Hamburg
Power supplies Pharmacia Multidrive XL
Pharmacia EPS 3500XL
Pharmacia 601
Amersham Pharmacia Biosciences, Freiburg
Shakers Roto-shake Genie Scientific Industries, Bohemia, NY, USA
Ultrasound bath Transsonic 460/H Elma, Singen
Vacuum concentrator
Speedvac centrifugal evaporator
Christ, Osterode
Vibration mill Micro dismembrator U Braun Biotech, Melsungen
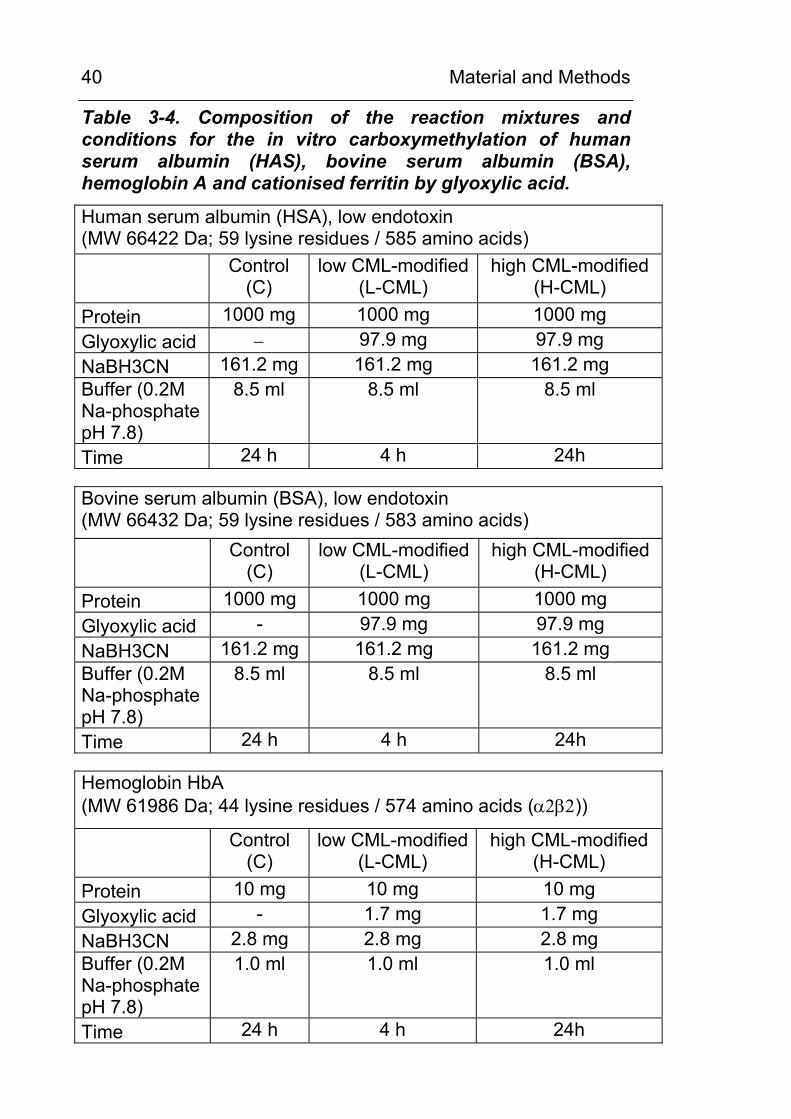
3.7 In vitro chemical carboxymethylation of proteins
HSA, BSA, Ferritin and hemoglobin were chemically
carboxymethylated using glyoxylic acid and NaBH3CN as
described by Reddy et al. [38]. In general, a protein containing x
mol of lysine residues was incubated with an equimolar amount of
glyoxylic acid and an 3 fold molar excess of NaBH3CN in 0.2 M
sodium phosphate buffer pH 7.8 at 370C for 4h or 24h,
respectively, as indicated in Table 3-4. The reaction was stopped
by transferring the reaction mixture to 1 or 10 ml dialysis tubes
(Spectrum Float-a-lyzer, Roth, Karlsruhe, MW cut off: 5000 Da)
for subsequent dialysis against 4 l of 0.2 Na phosphate buffer pH
7.8 for 2 x 24 h. The buffer was changed once.
Material and Methods
40
Table 3-4. Composition of the reaction mixtures and conditions for the in vitro carboxymethylation of human serum albumin (HAS), bovine serum albumin (BSA), hemoglobin A and cationised ferritin by glyoxylic acid.
Human serum albumin (HSA), low endotoxin (MW 66422 Da; 59 lysine residues / 585 amino acids)
Control
(C) low CML-modified
(L-CML) high CML-modified
(H-CML) Protein 1000 mg 1000 mg 1000 mg Glyoxylic acid − 97.9 mg 97.9 mg NaBH3CN 161.2 mg 161.2 mg 161.2 mg Buffer (0.2M Na-phosphate pH 7.8)
8.5 ml 8.5 ml 8.5 ml
Time 24 h 4 h 24h Bovine serum albumin (BSA), low endotoxin (MW 66432 Da; 59 lysine residues / 583 amino acids)
Control
(C) low CML-modified
(L-CML) high CML-modified
(H-CML) Protein 1000 mg 1000 mg 1000 mg Glyoxylic acid - 97.9 mg 97.9 mg NaBH3CN 161.2 mg 161.2 mg 161.2 mg Buffer (0.2M Na-phosphate pH 7.8)
8.5 ml 8.5 ml 8.5 ml
Time 24 h 4 h 24h Hemoglobin HbA (MW 61986 Da; 44 lysine residues / 574 amino acids (α2β2))
Control
(C) low CML-modified
(L-CML) high CML-modified
(H-CML) Protein 10 mg 10 mg 10 mg Glyoxylic acid - 1.7 mg 1.7 mg NaBH3CN 2.8 mg 2.8 mg 2.8 mg Buffer (0.2M Na-phosphate pH 7.8)
1.0 ml 1.0 ml 1.0 ml
Time 24 h 4 h 24h
Material and Methods
41
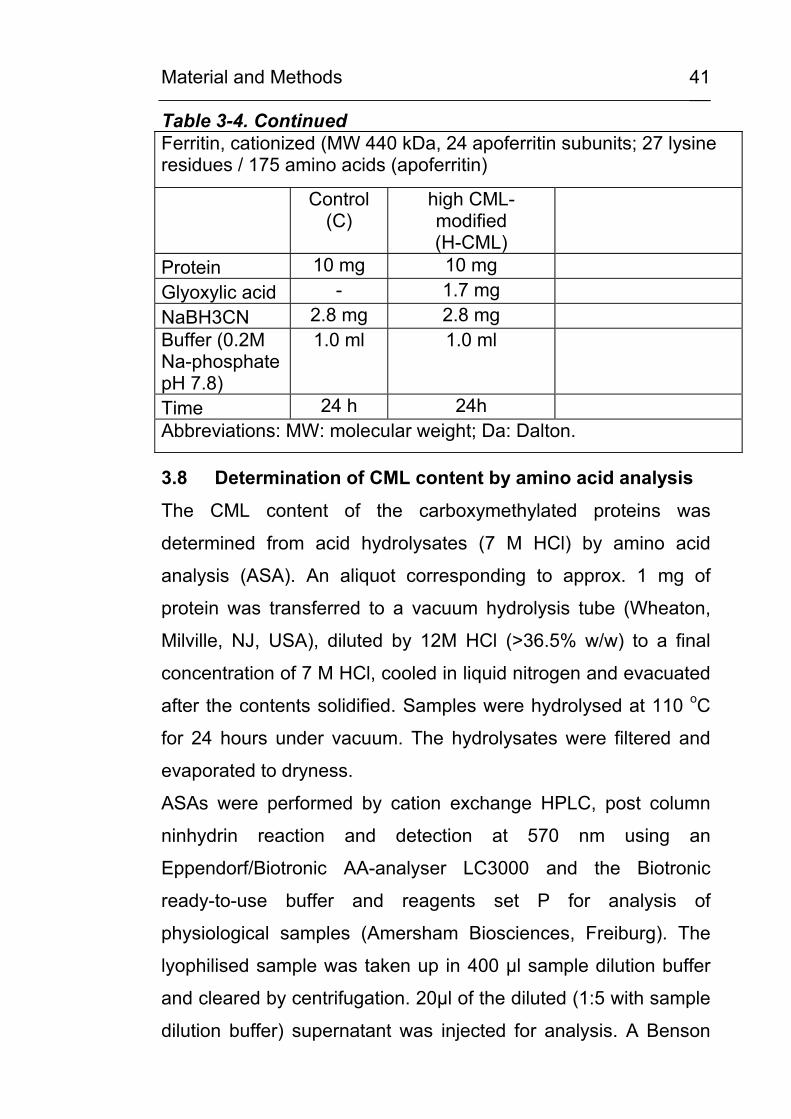
Table 3-4. Continued Ferritin, cationized (MW 440 kDa, 24 apoferritin subunits; 27 lysine residues / 175 amino acids (apoferritin)
Control (C)
high CML-modified (H-CML)
Protein 10 mg 10 mg Glyoxylic acid - 1.7 mg NaBH3CN 2.8 mg 2.8 mg Buffer (0.2M Na-phosphate pH 7.8)
1.0 ml 1.0 ml
Time 24 h 24h Abbreviations: MW: molecular weight; Da: Dalton.
3.8 Determination of CML content by amino acid analysis
The CML content of the carboxymethylated proteins was
determined from acid hydrolysates (7 M HCl) by amino acid
analysis (ASA). An aliquot corresponding to approx. 1 mg of
protein was transferred to a vacuum hydrolysis tube (Wheaton,
Milville, NJ, USA), diluted by 12M HCl (>36.5% w/w) to a final
concentration of 7 M HCl, cooled in liquid nitrogen and evacuated
after the contents solidified. Samples were hydrolysed at 110 oC
for 24 hours under vacuum. The hydrolysates were filtered and
evaporated to dryness.
ASAs were performed by cation exchange HPLC, post column
ninhydrin reaction and detection at 570 nm using an
Eppendorf/Biotronic AA-analyser LC3000 and the Biotronic
ready-to-use buffer and reagents set P for analysis of
physiological samples (Amersham Biosciences, Freiburg). The
lyophilised sample was taken up in 400 µl sample dilution buffer
and cleared by centrifugation. 20µl of the diluted (1:5 with sample
dilution buffer) supernatant was injected for analysis. A Benson
Material and Methods
42
amino acid standard was run in parallel and amino acids were
identified according to their retention time. Samples were spiked
with additional CML standard at a concentration of 100 nmol/ml
and the CML peak was identified by coelution.
3.9 In vitro lipid peroxidation of RNAse
The lipid peroxidation of RNAse by the polyunsaturated fatty
acids (PUFAs) oleic acid, linoleic acid and arachidonic acid,
respectively, was investigated under various oxidative conditions
and under the influence of antioxidative agents. Table 3-5 lists
the composition of the reaction mixtures.
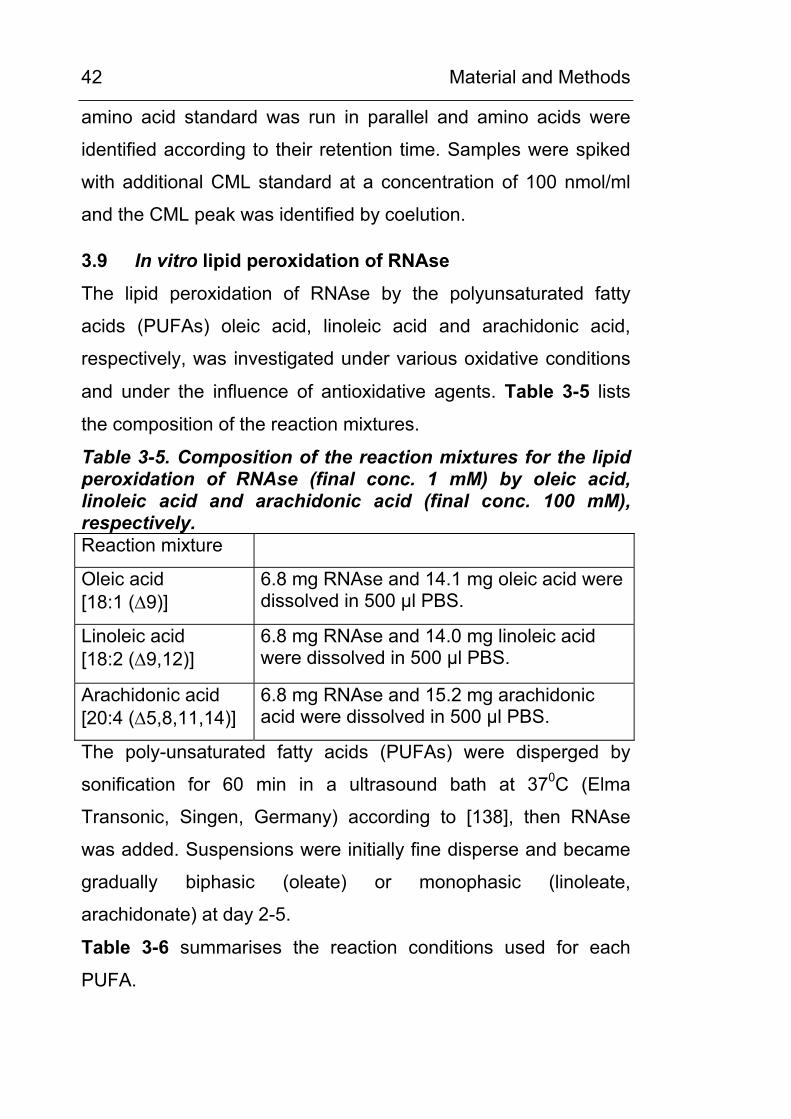
Table 3-5. Composition of the reaction mixtures for the lipid peroxidation of RNAse (final conc. 1 mM) by oleic acid, linoleic acid and arachidonic acid (final conc. 100 mM), respectively. Reaction mixture
Oleic acid [18:1 (∆9)]
6.8 mg RNAse and 14.1 mg oleic acid were dissolved in 500 µl PBS.
Linoleic acid [18:2 (∆9,12)]
6.8 mg RNAse and 14.0 mg linoleic acid were dissolved in 500 µl PBS.
Arachidonic acid [20:4 (∆5,8,11,14)]
6.8 mg RNAse and 15.2 mg arachidonic acid were dissolved in 500 µl PBS.
The poly-unsaturated fatty acids (PUFAs) were disperged by
sonification for 60 min in a ultrasound bath at 370C (Elma
Transonic, Singen, Germany) according to [138], then RNAse
was added. Suspensions were initially fine disperse and became
gradually biphasic (oleate) or monophasic (linoleate,
arachidonate) at day 2-5.
Table 3-6 summarises the reaction conditions used for each
PUFA.
Material and Methods
43
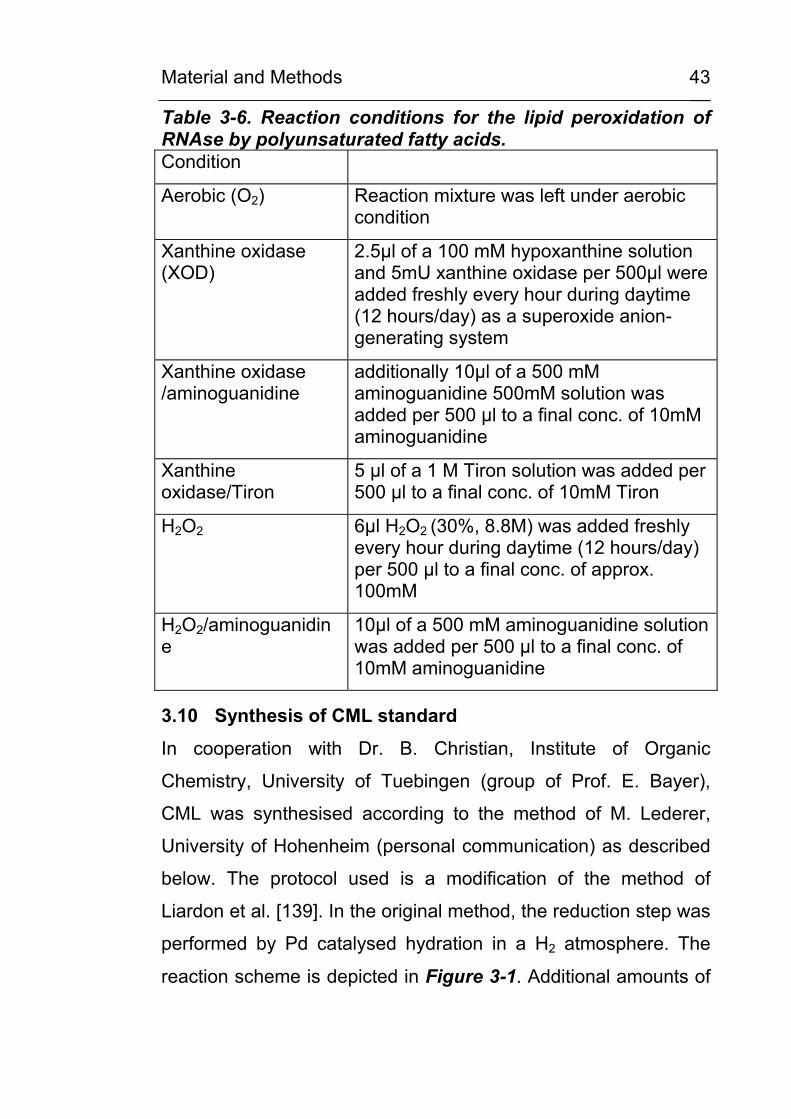
Table 3-6. Reaction conditions for the lipid peroxidation of RNAse by polyunsaturated fatty acids. Condition
Aerobic (O2) Reaction mixture was left under aerobic condition
Xanthine oxidase (XOD)
2.5µl of a 100 mM hypoxanthine solution and 5mU xanthine oxidase per 500µl were added freshly every hour during daytime (12 hours/day) as a superoxide anion-generating system
Xanthine oxidase /aminoguanidine
additionally 10µl of a 500 mM aminoguanidine 500mM solution was added per 500 µl to a final conc. of 10mM aminoguanidine
Xanthine oxidase/Tiron
5 µl of a 1 M Tiron solution was added per 500 µl to a final conc. of 10mM Tiron
H2O2 6µl H2O2 (30%, 8.8M) was added freshly every hour during daytime (12 hours/day) per 500 µl to a final conc. of approx. 100mM
H2O2/aminoguanidine
10µl of a 500 mM aminoguanidine solution was added per 500 µl to a final conc. of 10mM aminoguanidine
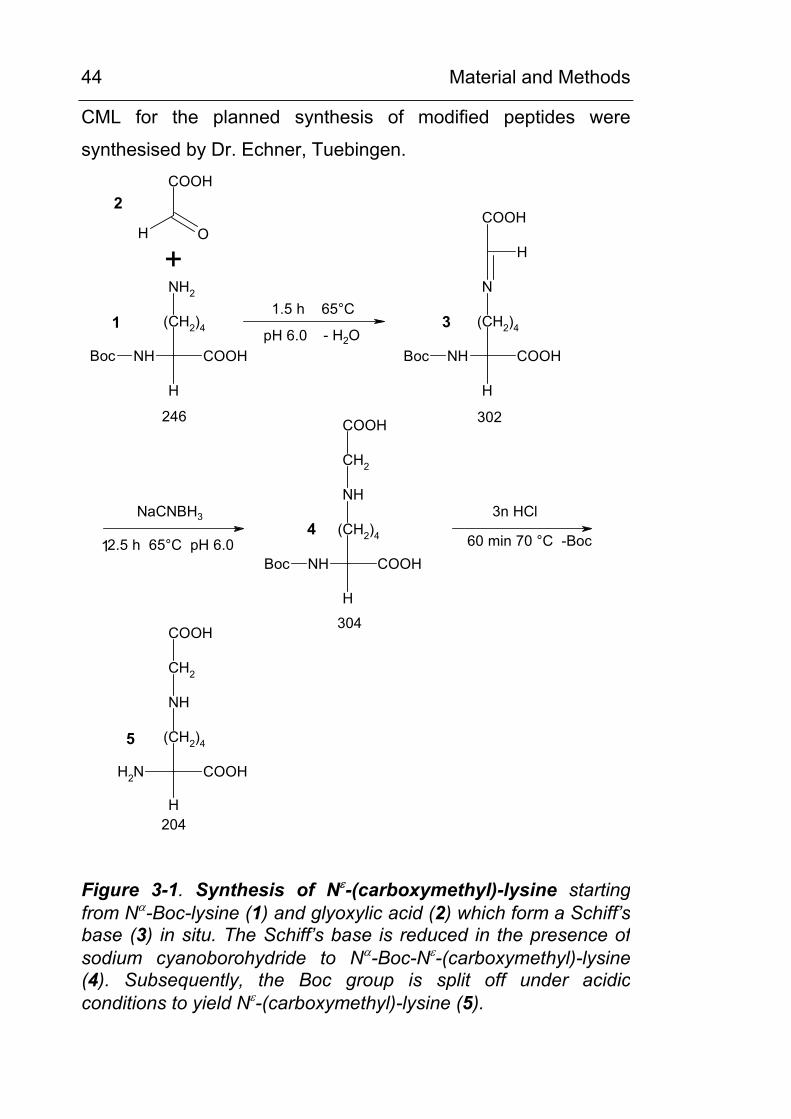
3.10 Synthesis of CML standard
In cooperation with Dr. B. Christian, Institute of Organic
Chemistry, University of Tuebingen (group of Prof. E. Bayer),
CML was synthesised according to the method of M. Lederer,
University of Hohenheim (personal communication) as described
below. The protocol used is a modification of the method of
Liardon et al. [139]. In the original method, the reduction step was
performed by Pd catalysed hydration in a H2 atmosphere. The
reaction scheme is depicted in Figure 3-1. Additional amounts of
Material and Methods
44
CML for the planned synthesis of modified peptides were
synthesised by Dr. Echner, Tuebingen.
H O
COOH
NH2
(CH2)4
COOH
H
NHBoc
N
(CH2)4
COOH
H
NHBoc
H
COOH
NH
(CH2)4
COOH
H
NHBoc
CH2
COOH
NH
(CH2)4
COOH
H
NH2
CH2
COOH
+1.5 h 65°C
pH 6.0 - H2O
2.5 h 65°C pH 6.0
NaCNBH3 3n HCl
60 min 70 °C -Boc
246 302
304
204
1
2
3
4
5
1
Figure 3-1. Synthesis of Nε-(carboxymethyl)-lysine starting from Nα-Boc-lysine (1) and glyoxylic acid (2) which form a Schiff’s base (3) in situ. The Schiff’s base is reduced in the presence ofsodium cyanoborohydride to Nα-Boc-Nε-(carboxymethyl)-lysine (4). Subsequently, the Boc group is split off under acidicconditions to yield Nε-(carboxymethyl)-lysine (5).
Material and Methods
45
Synthesis protocol
Nα-tert.-Boc-L-lysine (1) was purchased from Calbiochem,
Läufelingen, CH, glyoxylic acid (2) and NaCNBH3 was purchased
from Sigma, Deisenhofen. Citrate buffer was prepared according
to Sörensen by dissolving 2.1 g citric acid monohydrate im 20 ml
H2O and was adjusted to pH 6 by adding 1M NaOH.
Microanalysis was performed at the Microanalytical Laboratory at
the Institute for Inorganic Chemistry at the University of
Tuebingen.
Synthesis of Nα-Boc-Nε -(carboxymethyl)-lysine (4)
Nα-Boc lysine (1) (985.24 mg, 4 mmol) and sodium glyoxylate (2)
(684.18 mg, 6 mmol) was dissolved in 8 ml of citrate buffer. The
solution was adjusted to a pH of 6 (pH-electrode) using 1 M
NaOH and stirred for 1.5 h at 65 °C. Subsequently, NaCNBH3
(384.8 mg, 6.12 mmol) was added and the solution stirred
continuously for 12.5 h at 65 °C. Samples were taken regularly
and analysed using thin-layer chromatography (TLC). After 14 h
of reaction time, TLC analysis could not detect any remaining Nα-
Boc lysine in the solution. After completion of the reaction, the
solution was concentrated in a rotatory evaporator. The residue of
the solution was dissolved in methanol and desalted using a short
column packed with cellulose. After washing with additional
methanol, the collected filtered solution was dried. In a second
desalting step, the residue was dissolved in methanol and
separated through a long column packed with cellulose.
Yield of 4: 1080.6 mg (3.56 mmol; 88.9 % of expected value)
Synthesis of Nε-(carboxymethyl)-lysine (5)
Material and Methods
46
Nα-Boc-Nε-(carboxymethyl)-lysine (4) (1080.6 mg, 3.56 mmol)
was dissolved in 10 ml of 3M HCl and heated for 1 h to 70 °C.
After removing the HCL in a vacuum concentrator, the residue
was recrystallized in water-ethanol. Yield of 5: 728.4 mg (2.62
mmol; 73.9 % of exspected value). Elemental analysis:
C8H16N2O4: calculated (in %) C 47.1, H 7.8, N 13.7; found (in %)
C 44.91, H 7.10, N 12.61, Cl 1.20
Characterisation of Nε-(carboxymethyl)-lysine (CML) for use as a standard compound
The synthetic product was further characterised by LC-MS,
cation-exchange HPLC and reversed-phase HPLC. Identification
of the synthesis product by MS (Figure 3-2, C) showed that the
product contained CML (MW 204.3 [M+H]+ with m/z of 205.4)
besides traces of lysine ( [M+H]+ with m/z of 147.4). Cation
exchange HPLC (Figure 3-2, A) and sensitive RP-HPLC using
OPA-derivatisation and fluorescence detection (Figure 3-2, B)
revealed a single peak for CML and no other amino compound.
The CML content of the synthesis product was estimated by
comparison with a CML standard synthesised and characterised
by Dr. M. Lederer, Stuttgart. In amino acid analysis (Figure 3-2,
A), 95% of the exspected concentration (210.6 µmol/l as
compared to 220 µmol/l exspected) was found and in RP-HPLC,
(Figure 3-2, B) 90% of the exspected concentration (1.0 µmol/l
as compared to 1.1 µmol/l exspected) was found. These data
together with the results from elemental analysis indicate that the
raw product had a CML content of 90-95% and contained no
other amino group bearing compound. Therefore, it was suited for
identification of CML during chromatography and for the synthesis
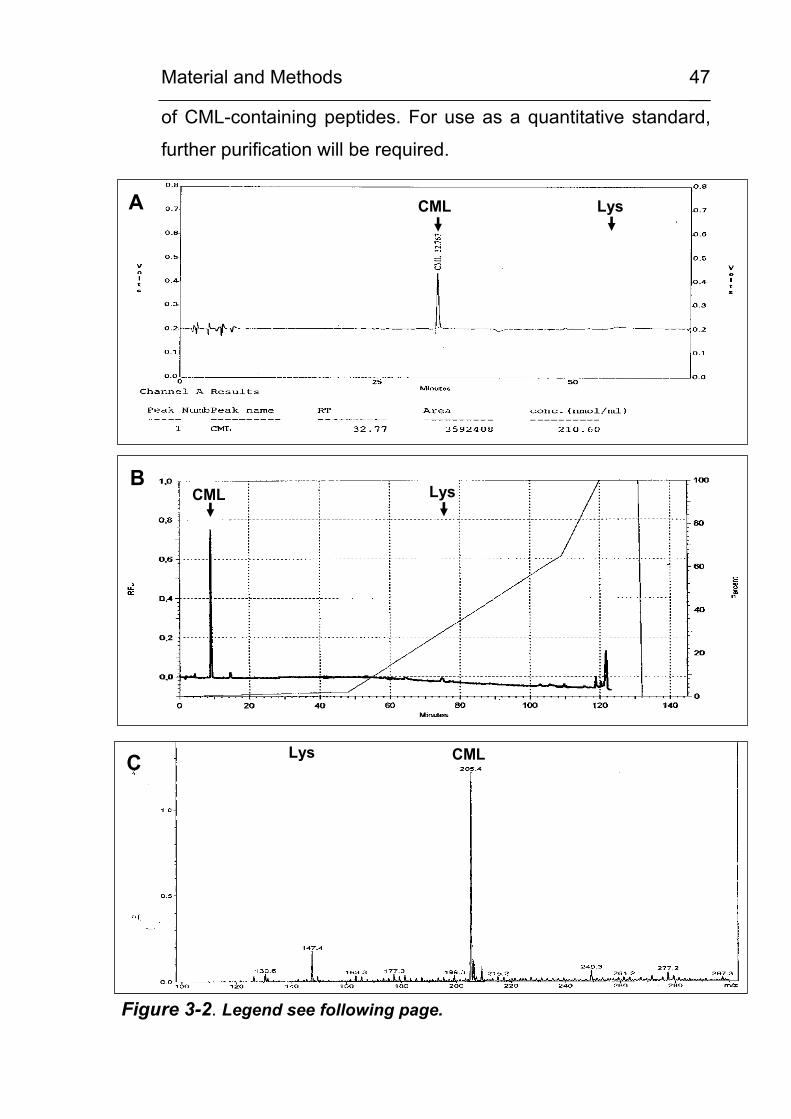
Material and Methods
47
of CML-containing peptides. For use as a quantitative standard,
further purification will be required.
CML LysA
LysCMLB
CMLLysC
Figure 3-2. Legend see following page.
Material and Methods
48
Figure 3-2. Characterisation of synthethic CML by cation exchangeHPLC (A), by RP-HPLC (B) and by ESI-MS (C). The product was dissolved at 4.5 mg/ml. In (A) a 1:100 dilution (which would equal 220 µmol/l CML) and in (B) a 1:20000 dilution (which would equal 1.1µmol/l) was analysed. Chromatographic separations (A, B) gave a single peak of CML as identified by coelution with CML standard. In (C) the sample was diluted to 10 pmol/µl in 50% methanol/1% formic acidand injected at a rate of 5 µl/min. ESI-MS (C) of the synthesis product revealed the characteristic mass of CML (M+H+ m/z 205) besidestraces of lysine (M+H+ m/z 147). Conditions: A: Eppendorf/Biotronic LC 3000 amino acid analyser (Eppendorf, Hamburg, Germany), Eppendorfcation exchange resin, column 125 x 4 mm, 20 µl injection volume,isocratic elution, Eppendorf ready-to-use buffer, ninhydrin post column derivatisation, 1250C, detection 570nm. For external calibration, the Benson amino acid standard P with additional CML at a concentrationof 100 nmol/ml was used (not shown). The peak for carboxymethyllysine (CML) and lysine (Lys) was identified by coelutionwith standards at 32.7 and 60.3 min, respectively; B: GROM-SIL 100 ODS-0 AB C18 reversed phase column, 5 µm, 200x4 mm, flow 0.4ml/min, 210C, injection 10 µl, eluent A: 1% ACN / 1% TFA, eluent B:45% ACN / 5% TFA in 15 mM NaH2PO4, pH 7.2, gradient: 0-2.5% B (0-44min), 2.5-60% B (44-110min); 60-100% B (110-120min), OPA pre-column derivatisation, fluorescence detection, excitation 340nm,emission 455nm; C: Bruker Daltronics esquire3000 plus ESI-MS; pos. ionisation mode, capillary exit 103.0 V, scan from 100 to 300 m/z.Abbreviations: CML: carboxymethyllysine; Lys: lysine; RFU: rel. fluorescence units
3.11 Preparation of cell lysates and protein extracts
For Western-blotting, 1% Triton lysates were prepared from cell
culture cells. The composition of the cell lysis buffer was: 50 mM
Tris-HCl (pH 8), 150 mM NaCl, 0.02% sodium azide, 1% Triton X-
100, 0,5 mM PMSF and 14 µg/µl. aprotinin. PMSF and aprotinin
were freshly added from stock solutions of 100mM PMSF in EtOH
and 70mg/50ml aprotinin (Trasylol®) in H2O, respectively.
Suspension cells (or trypsinated and scraped off adherent cells)
were counted using an Advia120 automatised cell counter (Bayer
Diagnostics, Fernwald, Germany). Viability was shown to be
Material and Methods
49
>85% by trypan blue exclusion testing. Typically, approx. 4x10⁶
suspension cells (or approx. 5 x 10⁵ adherent cells) were
harvested by centrifugation (900 rpm equal to 125 x g, 3 min, 40,
Haereus Megafuge 2.0R) and washed 3 times in PBS (900 rpm, 3
min, 40). The cell pellet was resuspended in 200 µl lysis buffer (or
50 µl per 106 cells if cell counts were low) with freshly added
aprotinin and PMSF, vortexed for 10 sec and centrifuged (13000
rpm equal to 16000g, 5 min., 40C) using a microcentrifuge
(Haereus Biofuge). The protein concentrations of the
supernatants were determined with a modified Bradford reaction
(Bio-Rad protein assay, Bio-Rad, Munich, Germany) against a
calibration curve made from BSA standard (Bio-Rad). Protein
concentrations were typically in the range of 2 - 4 µg protein / µl.
Supernatants were stored at -700C.
Protein extracts from tissues were prepared using the
homogenisation buffer given below. 10 – 100 mg of tissue were
frozen in liquid nitrogen and powdered in a liquid nitrogen-cooled
vibration mill (Micro-Dismembrator U, Braun Biotech, Melsungen,
Germany) using a 3 ml teflon shaking flask at 2000 rpm for 1 min.
Powdered tissue was placed in 1.5 ml ice-cold tissue
homogenisation buffer (10 mM NaHCO3 pH 7.0, 0.25 M sucrose,
5 mM NaN3, freshly added protease inhibitor cocktail (10 µl/100
µg tissue, Sigma, P8340) and 100 µM PMSF) and further
homogenised in a motor-driven Potter-Elvejem tissue
homogenisator (Potter S, Braun Biotech, Melsungen, Germany)
at 1500 rpm for 2 min and 20 ups and downs. The crude
homogenates were centrifuged (13000 rpm, 10 min, 4o) and
protein concentrations of the supernatants were determined with
a modified Bradford reaction (Bio-Rad protein assay, Bio-Rad,
Material and Methods
50
Munich, Germany), typically resulting in 0.1 to 0.3 µg protein / µl.
Protein extracts were stored frozen at –700C.
3.12 Western blots / dot blots
Aliquots of cell lysates or tissue homogenates, equivalent to 10 to
30 µg protein, were denaturated with 0.2 volumes of Laemmli
buffer (25 % glycerol, 2 % sodium dodecylsulfate (SDS), 5 % β-
mercaptoethanol in 60 mM Tris/HCl pH 6.8) at 95 oC for 5 min,
loaded in pockets and separated by sodium dodecylsulfate
polyacrylamide gel electrophoresis (SDS-PAGE) on 1.5 mm thick
7.5% polyacrylamide gels. For separation of low molcular weigth
proteins, e.g. hemoglobin, 15% separation gels were used.
Recipes for stacking and separation gels are given in Table 3-7.
Proteins were transferred to nitrocellulose membranes by semi-
dry-electroblotting (transfer buffer: 48 mM Tris, 39 mM glycine,
0.040 % SDS, 20 % (v/v) methanol). Transfer conditions were 1 h
45 min at a current of 0.8 mA / cm2. Blotting efficiency was
controlled by reversible Ponceau Red protein staining of the
membranes. After blotting, the nitrocellulose membranes were
blocked with NET-G buffer ( 150 mM NaCl, 50 mM Tris/HCl pH
7.4, 5 mM EDTA, 0.05 % Triton X-100, 0.25 % gelatine) and
incubated with the appropriate specific first antibody overnigth at
4oC. The primary antibodies used in this study and the
appropriate dilutions are listed in Table 3-8. After washing with
NET-G buffer, the membranes were incubated with the
appropriate species-specific horseradish peroxidase-conjugated
anti-IgG as listed in Table 3-9 for 1 h at room temperature.
Immunoreactive proteins were detected by enhanced
chemiluminescence using the ECL system (Amersham
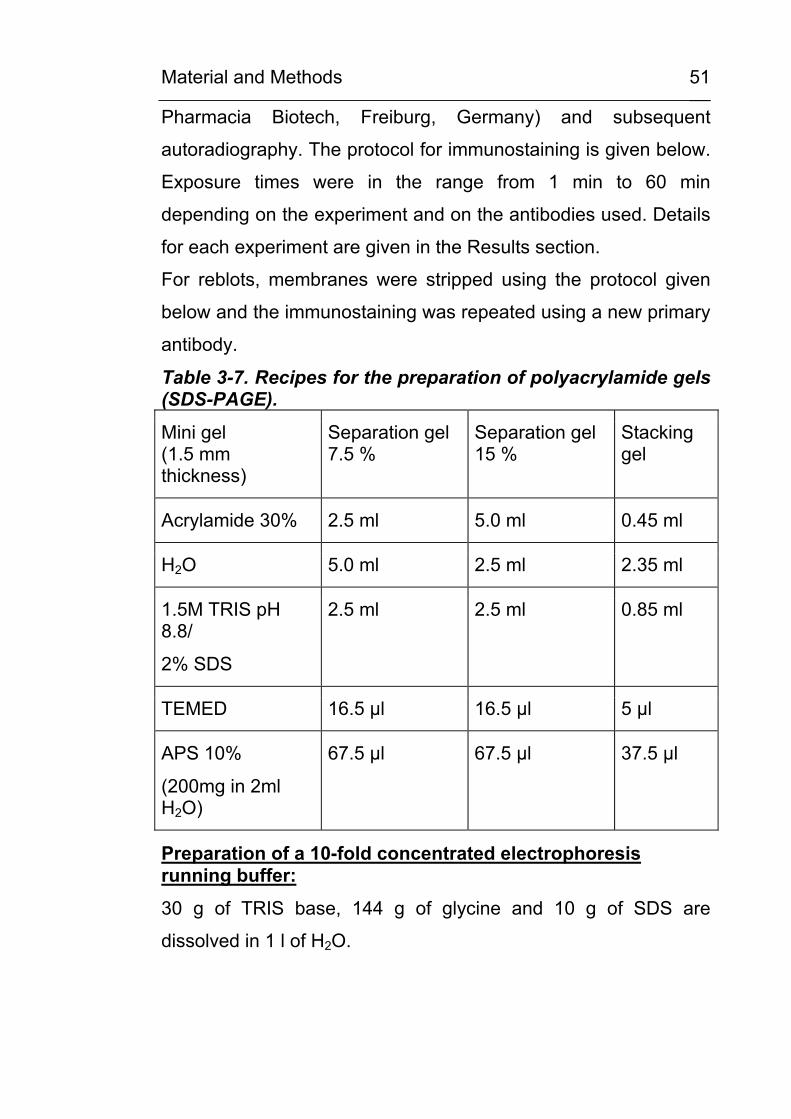
Material and Methods
51
Pharmacia Biotech, Freiburg, Germany) and subsequent
autoradiography. The protocol for immunostaining is given below.
Exposure times were in the range from 1 min to 60 min
depending on the experiment and on the antibodies used. Details
for each experiment are given in the Results section.
For reblots, membranes were stripped using the protocol given
below and the immunostaining was repeated using a new primary
antibody.
Table 3-7. Recipes for the preparation of polyacrylamide gels (SDS-PAGE). Mini gel (1.5 mm thickness)
Separation gel 7.5 %
Separation gel 15 %
Stacking gel
Acrylamide 30% 2.5 ml 5.0 ml 0.45 ml
H2O 5.0 ml 2.5 ml 2.35 ml
1.5M TRIS pH 8.8/
2% SDS
2.5 ml 2.5 ml 0.85 ml
TEMED 16.5 µl 16.5 µl 5 µl
APS 10%
(200mg in 2ml H2O)
67.5 µl 67.5 µl 37.5 µl
Preparation of a 10-fold concentrated electrophoresis running buffer:
30 g of TRIS base, 144 g of glycine and 10 g of SDS are
dissolved in 1 l of H2O.
Material and Methods
52
Preparation of 10-fold concentrated NET-G buffer:
25 g of gelatine is dissolved in approximately 500 ml of H2O at
370C in a water bath. Subsequently, 87.66 g of NaCl, 60.55 g of
TRIS base and 19.10 g of EDTA are added and the solution is
filled up with H2O to a final volume of 1 l.
Immunostaining protocol for Western blot / dot blot membranes:
1. Membranes are blocked for 3 x 15min in NET-G buffer
2. Primary antibody is added and membranes are incubated
overnigth at 40C on a laboratory rocker
3. Membranes are washed for 3 x 15min in NET-G buffer
4. Secondary antibody/HRP-conjugat is added and membranes
are incubated for 60 min at room temperature on a laboratory
rocker
5. Membranes are washed for 4 x 15min in NET-G buffer
Protocol for the immunodetection by enhanced luminol chemiluminescence (ECL):
All steps are performed in the dark.
1. Equal volumes of ECL solution A and B (see below) are added
to immunostained membranes for 3 min in the dark
2. Membranes are put in a film developer cassette and covered
with transparent cover sheets. Film (Hyperfilm ECL, Amersham
Pharmacia Biotech) is placed on top and cassette is closed.
3. Film is exposed for the indicated time (1 – 60 min) and
developed.
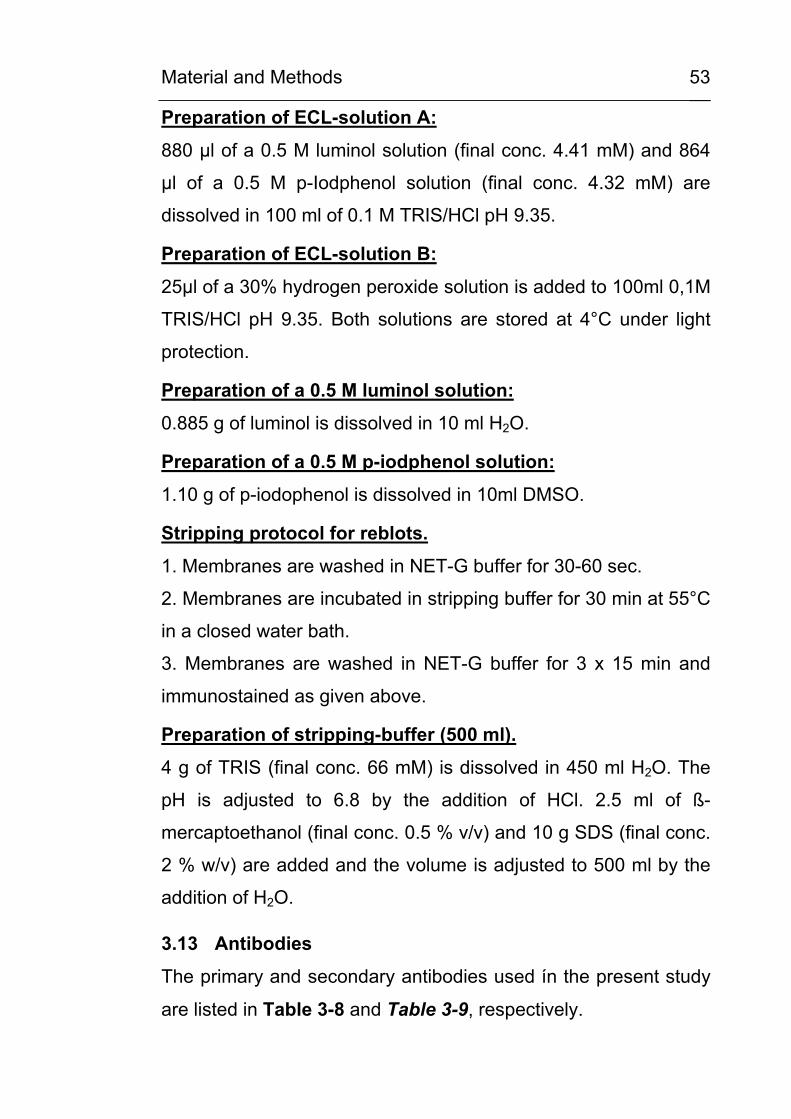
Material and Methods
53
Preparation of ECL-solution A:
880 µl of a 0.5 M luminol solution (final conc. 4.41 mM) and 864
µl of a 0.5 M p-Iodphenol solution (final conc. 4.32 mM) are
dissolved in 100 ml of 0.1 M TRIS/HCl pH 9.35.
Preparation of ECL-solution B:
25µl of a 30% hydrogen peroxide solution is added to 100ml 0,1M
TRIS/HCl pH 9.35. Both solutions are stored at 4°C under light
protection.
Preparation of a 0.5 M luminol solution:
0.885 g of luminol is dissolved in 10 ml H2O.
Preparation of a 0.5 M p-iodphenol solution:
1.10 g of p-iodophenol is dissolved in 10ml DMSO.
Stripping protocol for reblots.
1. Membranes are washed in NET-G buffer for 30-60 sec.
2. Membranes are incubated in stripping buffer for 30 min at 55°C
in a closed water bath.
3. Membranes are washed in NET-G buffer for 3 x 15 min and
immunostained as given above.
Preparation of stripping-buffer (500 ml).
4 g of TRIS (final conc. 66 mM) is dissolved in 450 ml H2O. The
pH is adjusted to 6.8 by the addition of HCl. 2.5 ml of ß-
mercaptoethanol (final conc. 0.5 % v/v) and 10 g SDS (final conc.
2 % w/v) are added and the volume is adjusted to 500 ml by the
addition of H2O.
3.13 Antibodies
The primary and secondary antibodies used ín the present study
are listed in Table 3-8 and Table 3-9, respectively.
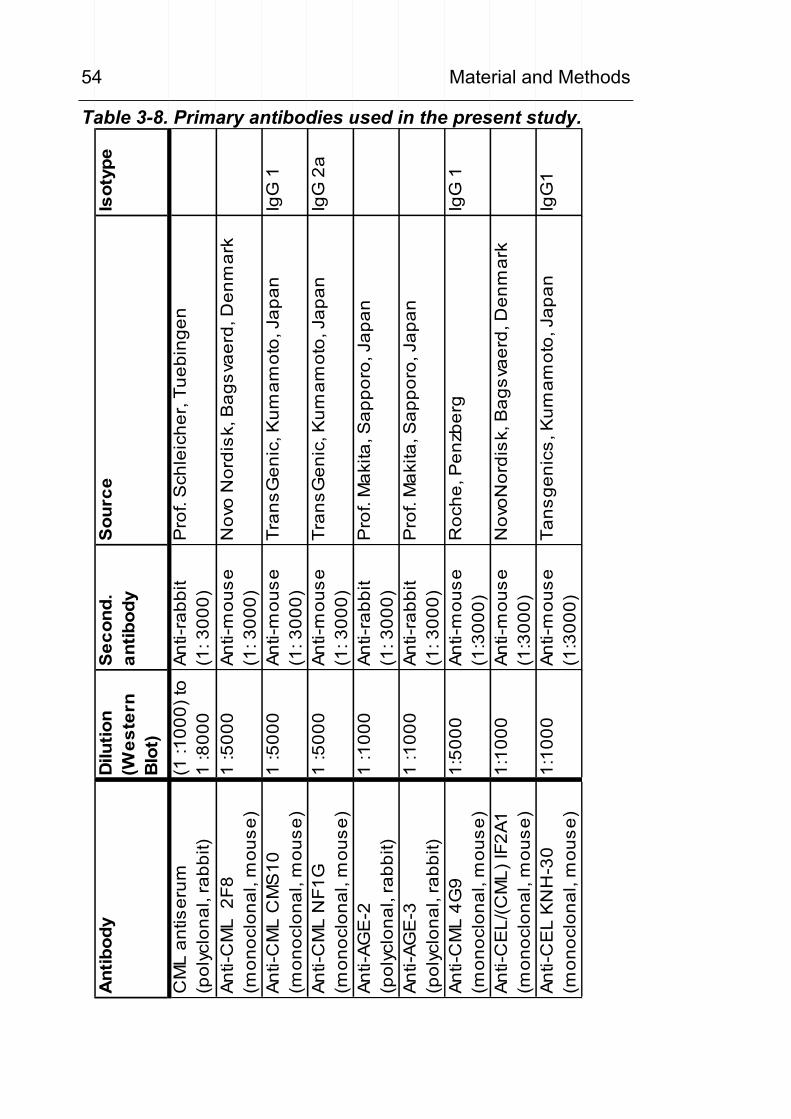
Material and Methods
54
Table 3-8. Primary antibodies used in the present study.
Ant
ibod
yD
ilutio
n(W
este
rn
Blo
t)
Sec
ond.
antib
ody
Sou
rce
Isot
ype
CM
L an
tiser
um(p
olyc
lona
l, ra
bbit)
(1 :1
000)
to
1 :8
000
Anti-
rabb
it
(1: 3
000)
Pro
f. S
chle
iche
r, Tu
ebin
gen
Anti-
CM
L 2
F8(m
onoc
lona
l, m
ouse
)1
:500
0An
ti-m
ouse
(1
: 300
0)N
ovo
Nor
disk
, Bag
svae
rd, D
enm
ark
Anti-
CM
L C
MS
10(m
onoc
lona
l, m
ouse
)1
:500
0An
ti-m
ouse
(1
: 300
0)Tr
ansG
enic
, Kum
amot
o, J
apan
IgG
1
Anti-
CM
L N
F1G
(mon
oclo
nal,
mou
se)
1 :5
000
Anti-
mou
se
(1: 3
000)
Tran
sGen
ic, K
umam
oto,
Jap
anIg
G 2
a
Anti-
AGE
-2(p
olyc
lona
l, ra
bbit)
1 :1
000
Anti-
rabb
it (1
: 300
0)P
rof.
Mak
ita, S
appo
ro, J
apan
Anti-
AGE
-3(p
olyc
lona
l, ra
bbit)
1 :1
000
Anti-
rabb
it (1
: 300
0)P
rof.
Mak
ita, S
appo
ro, J
apan
Anti-
CM
L 4G
9(m
onoc
lona
l, m
ouse
)1:
5000
Anti-
mou
se
(1:3
000)
Roc
he, P
enzb
erg
IgG
1
Anti-
CE
L/(C
ML)
IF2A
1(m
onoc
lona
l, m
ouse
)1:
1000
Anti-
mou
se
(1:3
000)
Nov
oNor
disk
, Bag
svae
rd, D
enm
ark
Anti-
CE
L K
NH
-30
(mon
oclo
nal,
mou
se)
1:10
00An
ti-m
ouse
(1
:300
0)Ta
nsge
nics
, Kum
amot
o, J
apan
IgG
1
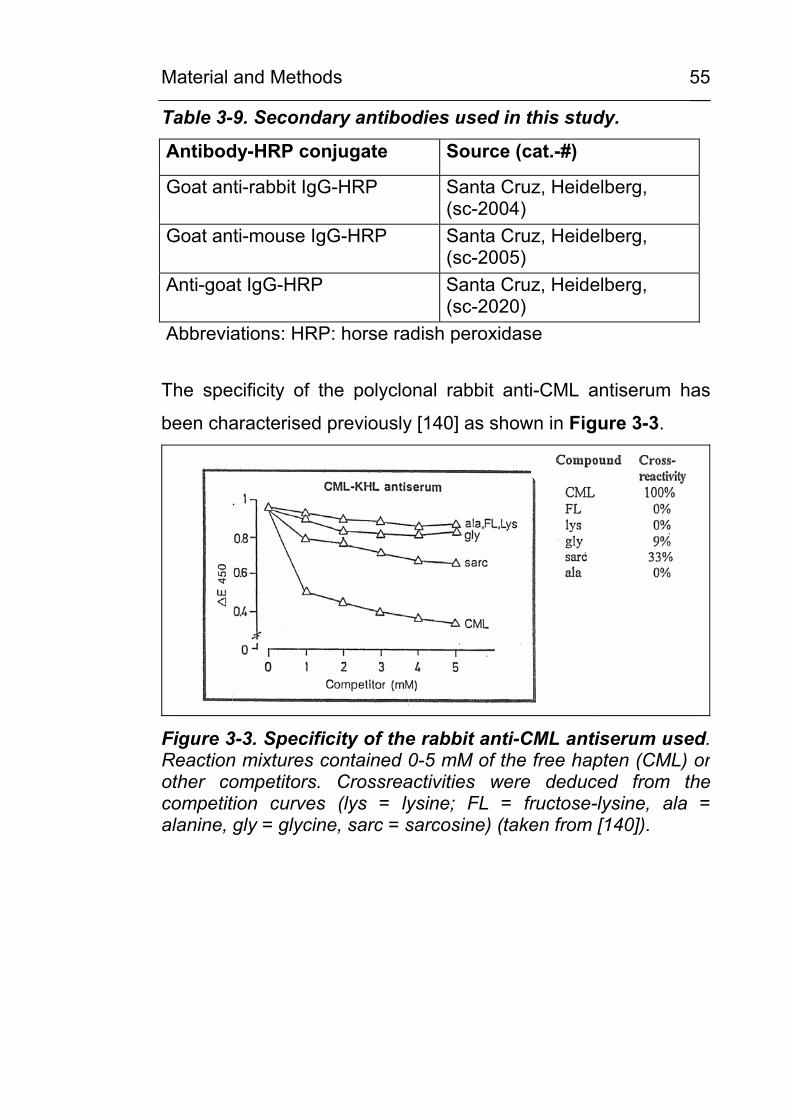
Material and Methods
55
Table 3-9. Secondary antibodies used in this study.
Antibody-HRP conjugate Source (cat.-#)
Goat anti-rabbit IgG-HRP Santa Cruz, Heidelberg, (sc-2004)
Goat anti-mouse IgG-HRP Santa Cruz, Heidelberg, (sc-2005)
Anti-goat IgG-HRP Santa Cruz, Heidelberg, (sc-2020)
Abbreviations: HRP: horse radish peroxidase
The specificity of the polyclonal rabbit anti-CML antiserum has
been characterised previously [140] as shown in Figure 3-3.
Figure 3-3. Specificity of the rabbit anti-CML antiserum used. Reaction mixtures contained 0-5 mM of the free hapten (CML) or other competitors. Crossreactivities were deduced from thecompetition curves (lys = lysine; FL = fructose-lysine, ala = alanine, gly = glycine, sarc = sarcosine) (taken from [140]).
Material and Methods
56
3.14 HPLC determination of urinary CML excretion
3.14.1 Study group and sample collection
First morning urine samples were obtained from 51 diabetic
patients (DM; age 57 +/- 14 years, HbA1c 8,0 +/- 1,8 %) and from
42 controls (C: age 45 +/- 17 years). Characteristics of patient
and control groups are summarised in Table 3-10. As assessed
from the clinical record, 72% of the patients (29 out of 42 patients
with data available) showed signs of diabetic neuropathy
(reduced vibration sensation) and 37 % (16 out of 43 patients
who received examination) showed non-proliferative or
proliferative retinopathy. Inclusion criteria for all participants were:
absence of gross proteinuria (< 300 mg/l), absence of renal
impairment (serum creatinine ≤ 1.0 mg/dl) and absence of
inflammatory signs and symptoms by clinical record and by
laboratory parameters (normal white blood count, no elevation of
C-reactive protein). HbA1c was measured by cation exchange
HPLC (Tosoh 2.2 HLC-723, Tosoh Corp., Tokyo, Japan), urinary
protein by a modified Biuret reaction on a BM/Hitachi 747 clinical
chemistry analyser and urinary albumin by nephelometry (Dade
Behring BN II, Marburg, Germany). Urine was stored frozen at –
20oC for up to 2 years. Urinary creatinine, protein and albumin
were measured directly prior to sample work up.
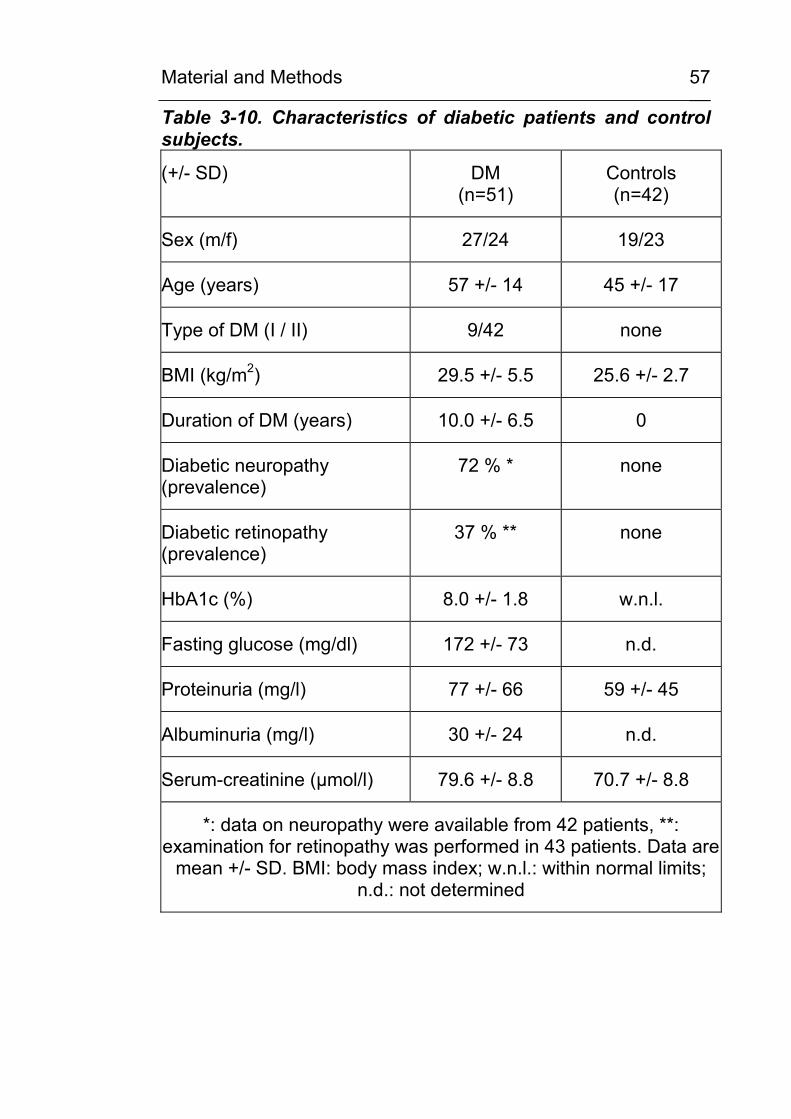
Material and Methods
57
Table 3-10. Characteristics of diabetic patients and control subjects.
(+/- SD) DM (n=51)
Controls (n=42)
Sex (m/f) 27/24 19/23
Age (years) 57 +/- 14 45 +/- 17
Type of DM (I / II) 9/42 none
BMI (kg/m2) 29.5 +/- 5.5 25.6 +/- 2.7
Duration of DM (years) 10.0 +/- 6.5 0
Diabetic neuropathy (prevalence)
72 % * none
Diabetic retinopathy (prevalence)
37 % ** none
HbA1c (%) 8.0 +/- 1.8 w.n.l.
Fasting glucose (mg/dl) 172 +/- 73 n.d.
Proteinuria (mg/l) 77 +/- 66 59 +/- 45
Albuminuria (mg/l) 30 +/- 24 n.d.
Serum-creatinine (µmol/l) 79.6 +/- 8.8 70.7 +/- 8.8
*: data on neuropathy were available from 42 patients, **: examination for retinopathy was performed in 43 patients. Data are
mean +/- SD. BMI: body mass index; w.n.l.: within normal limits; n.d.: not determined
Material and Methods
58
3.14.2 Preparation of the urine samples
A volume of urine equivalent to 1 mg creatinine was evaporated
to dryness with a Speedvac centrifugal evaporator (Christ,
Osterode, Germany). 420 µl of 12M HCl (>36.5% w/w) and 300 µl
H2O was added to a final concentration of 7 M HCl. The solution
was transferred to vacuum hydrolysis tubes (Wheaton, Milville,
NJ, USA), cooled in liquid nitrogen and evacuated after the
contents solidified. Samples were hydrolysed at 110 oC for 24
hours under vacuum. The hydrolysate was filtered, evaporated to
dryness, resuspended in 1000 µl redryness solution
(H2O/EtOH/Triethylamine 2:2:1 (v/v/v)) to remove traces of HCl,
evaporated to dryness and resuspended in 200 µl 15 mM
NaH2PO4, pH 7.2. For analysis of free CML one volume of urine,
equivalent to 0.5 mg creatinine, and two volumes of acetonitrile
were allowed to stand overnight at 4 oC for precipitation and
centrifuged at 4000 rpm for 5 min. The supernatant was
evaporated to dryness and resuspended in 100 µl H2O.
3.14.3 Sample derivatisation and HPLC analysis
All steps of pre-column derivatisation with OPA were performed
with the programmable autosampler Shimadzu SIL-10A
(Shimadzu Corp., Kyoto, Japan) using the following protocol: 200
µl of appropriately diluted sample (1:250 for urine hydrolysates
and 1:100 for deproteinised urine ) was incubated with 200 µl
buffer 1 (0.2 M Na3BO3, 5 mM EDTA, pH 10) and 100 µl OPA-
reagent (50 mg OPA/50 µl 3-mercaptopropionic acid in 5 ml
methanol) for 3 min, stopped with 200 µl buffer 2 (1 M KH2PO4,
pH 4.0) and immediately injected for HPLC-analysis (injection
volume 10 µl). HPLC analysis was performed in an air-
Material and Methods
59
conditioned laboratory environment with a room temperature set
at 21 0C using a Shimadzu series 10A HPLC device, equipped
with a Shimadzu RF-10AXL fluorescence detector (excitation 340
nm, emission 455 nm) and a GROM-SIL 100 ODS-0 AB RP-
column (5 µm, 200*4 mm) from Grom (Herrenberg, Germany).
Eluents were A: 1 % ACN / 1 % THF and B: 45 % ACN / 5 % THF
in 15 mM NaH2PO4, pH 7.2. As gradient was used: 0-1.25 % B
(0-17 min at 0.4 ml/min), 1.25-100 % B (17-18min at 0.4 ml/min),
100 % B (18-28 min at 0.8 ml/min) and 100 % A (29-39 min at
0.8ml/min).
3.15 Immunohistochemistry and Western-blotting in muscle and nerve tissue
Immunohistochemistry of nerve tissue was performed in
cooperation with Dr. M. Haslbeck, Erlangen and Dr. A. Bierhaus,
Tuebingen/Heidelberg, as described in [141]. Specimens were
obtained from patients with polyneuropathies of various etiologies
and of healthy controls. Tissue samples were frozen immediately
after biopsy in isopentane and cooled in liquid nitrogen.
Segments of the biopsy sample were fixed in cold 4%
glutaraldehyde in 0.1 cacodylate buffer at pH 7.4, embedded in
epoxy resin, cut for semithin sections and stained with methylene
blue. For immunohistochemical staining a specific rabbit anti-CML
antiserum was used, characterised by us previously [41; 140]. As
shown in Figure 3-3, the antiserum showed only little or no
crossreactivity with the related compounds lysine, alanine, glycine
or fructoselysine. The antiserum was used because of its higher
stability compared to the immunopurified antibodies. The bound
antibodies were visualised using the alkaline phosphatase anti-
alkaline phosphatase (APAAP) immunostaining method as
Material and Methods
60
desribed earlier [141]. Faint haematoxylin counterstaining was
used to reveal cellular structures. Negative controls for the
stainingspecificity of the antiserum were performed with
unspecific rabbit immunoglobulin instead of the specific antibody
and also after preincubation of the CML antiserum with CML-
modified human serum albumin (CML-HSA). For Western blot
detection of CML-modified proteins, aliquots of 50 – 100 mg
muscle or 10 - 30 mg nerve tissue were frozen in liquid nitrogen
and powdered in a liquid nitrogen-cooled vibration mill (Micro-
Dismembrator U, Braun Biotech, Melsungen, Germany) using a 3
ml teflon shaking flask at 2000 rpm for 1 min. Powdered tissue
was placed in 1.5 ml ice cold buffer (10 mM NaHCO3 pH 7.0, 0.25
M sucrose, 5 mM NaN3, freshly added protease inhibitor cocktail
(Sigma, P8340) and 100 µM PMSF) and further homogenised in
a motor-driven Potter-Elvejem tissue homogenisator (Potter S,
Braun Biotech, Melsungen, Germany) at 1500 rpm for 2 min and
20 ups and downs. The crude homogenates were centrifuged
(13000 rpm, 10 min, 4o) and supernatants (10 to 30 µg
protein/lane) were taken for Western blot analysis as described
above. The protein concentrations of the supernatants were
determined with a modified Bradford reaction (Bio-Rad protein
assay, Bio-Rad, Munich, Germany) typically resulting in 0.1 mg
protein / ml.
3.16 Immunohistochemistry and Western-blotting of CML-modified proteins in cartilage
Immunohistochemistry of cartilage tissue was performed in
cooperation with Dr. W. Schwab, Dresden, as described in [142].
Osteochondral specimens were obtained during knee surgery
from a patient with osteoarthritis and from a patient with healthy
Material and Methods
61
cartilage. Specimens were fixed in 4% buffered formalin,
decalcified for 2 weeks in EDTA solution and embedded in
paraffin. Sections were cut (5µm) and mounted on silane-coated
slides. The sections were dewaxed, washed in phospate-buffered
saline (pH 7.4) and treated with 0.3% hydrogen peroxide for 30
min followed by the incubation with rabbit anti-CML antiserum
(dilution 1:2000, Prof. Schleicher, Tuebingen) for 1 h at 37oC. The
primary antibody was incubated with a biotinylated anti-rabbit IgG
antibody and then detected with a streptavidin/biotin-peroxidase
complex (Vectastain Elite; Vector, Burlinggame, Calif.; USA). The
peroxidase activity was visualised with 3,3‘-diaminobenzidine and
counterstained with hemalaun. For specific negative controls the
primary antibody was replaced with a non-specific rabbit IgG. The
specificity of the polyclonal CML antiserum was proofed in
preabsorption experiments with CML-human serum albumin. All
control sections were completely negative. For Western-blotting,
protein extracts were prepared as described above except for
prolonging the intervals of the vibration mill to 3 x 1min. The
crude homogenates were centrifuged (13000 rpm, 10 min, 4o)
and supernatants (10µg protein/lane) were taken for Western blot
analysis.
3.17 Density gradient preparation of granulocytes
Granulocytes were isolated from buffy coats which were prepared
by the blood bank on the same day. Aliquots of 20 ml of buffy
coat were carefully layered on a biphasic Histopaque (Sigma,
Deisenhofen) density gradient as depicted in Figure 3-4 and
centrifuged for 25 min at 633 g and 180C without brakes.The
granulocytic layer at the 1.077 / 1.119 interface was transferred
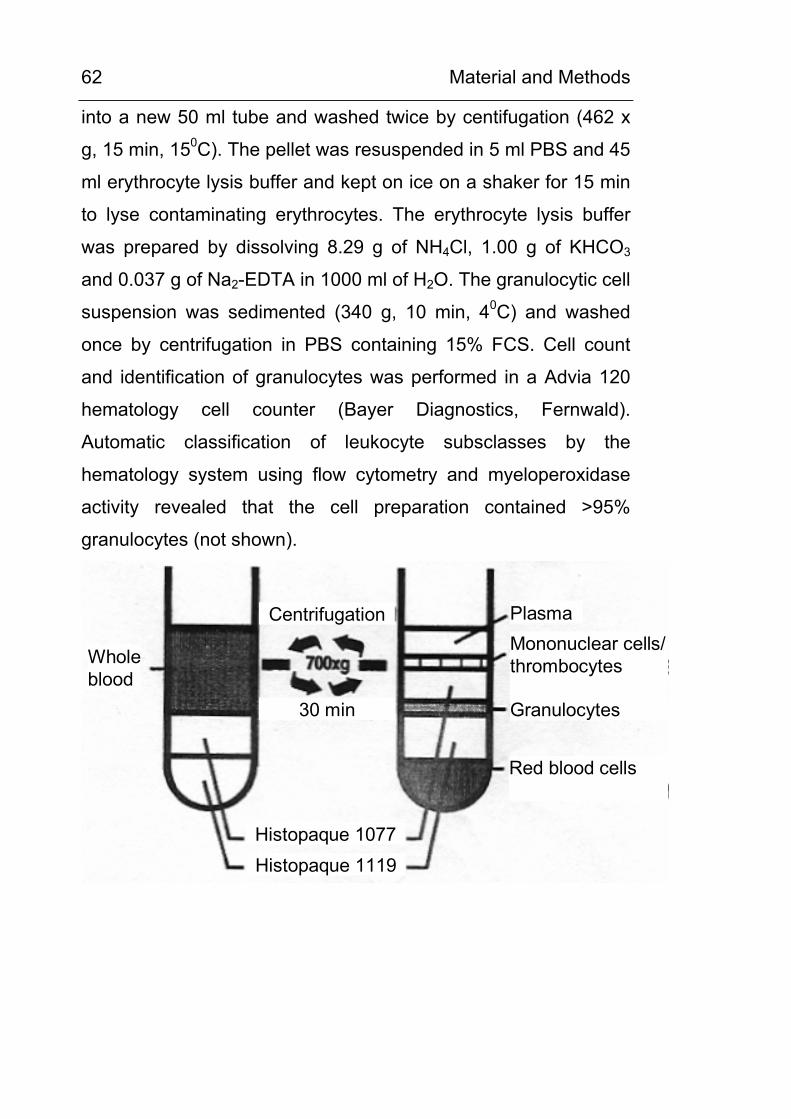
Material and Methods
62
into a new 50 ml tube and washed twice by centifugation (462 x
g, 15 min, 150C). The pellet was resuspended in 5 ml PBS and 45
ml erythrocyte lysis buffer and kept on ice on a shaker for 15 min
to lyse contaminating erythrocytes. The erythrocyte lysis buffer
was prepared by dissolving 8.29 g of NH4Cl, 1.00 g of KHCO3
and 0.037 g of Na2-EDTA in 1000 ml of H2O. The granulocytic cell
suspension was sedimented (340 g, 10 min, 40C) and washed
once by centrifugation in PBS containing 15% FCS. Cell count
and identification of granulocytes was performed in a Advia 120
hematology cell counter (Bayer Diagnostics, Fernwald).
Automatic classification of leukocyte subsclasses by the
hematology system using flow cytometry and myeloperoxidase
activity revealed that the cell preparation contained >95%
granulocytes (not shown).
Wholeblood
Centrifugation
Histopaque 1077Histopaque 1119
Plasma
30 min
Mononuclear cells/thrombocytes
Granulocytes
Red blood cells
Material and Methods
63
Figure 3-4. Ex vivo isolation of granulocytes: buffy coats were separated by density centrifugation using a biphasic Hyperpaque gradient.
3.18 Preparation of leukocyte subclasses
Sedimented blood cells from a freshly drawn 3 ml EDTA blood
sample were washed twice with 10 ml of PBS containing 0.6 %
sodium citrate and 2 % FCS by centrifugation (4000 rpm, 3 min,
40C). The washed blood cells were resuspended in 5 ml of PBS
containing 0.6 % sodium citrate and 2 % FCS and the sequential
isolation of leukocyte subclasses was performed according to the
instructions of the manufacturer. The work-flow is depicted in
Figure 3-5.
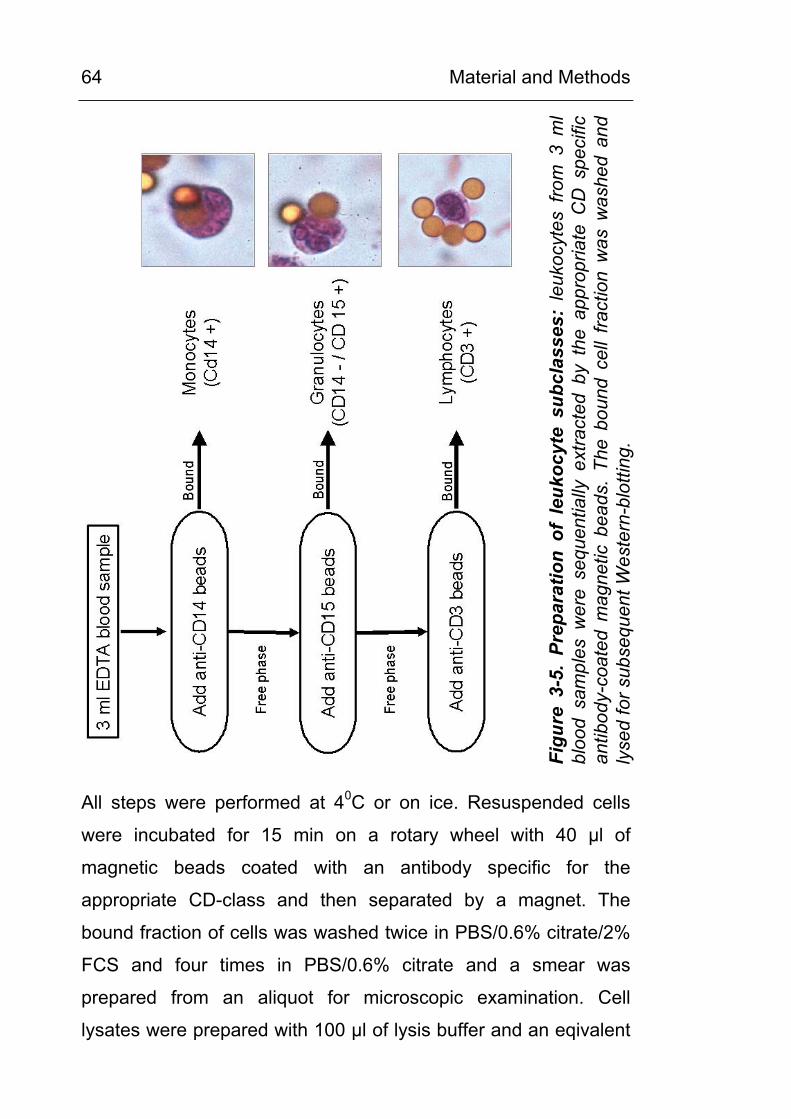
Material and Methods
64
Figu
re 3
-5.
Prep
arat
ion
of l
euko
cyte
sub
clas
ses:
leu
kocy
tes
from
3 m
lbl
ood
sam
ples
wer
e se
quen
tially
ext
ract
ed b
y th
e ap
prop
riate
CD
spe
cific
antib
ody-
coat
ed m
agne
tic b
eads
. Th
e bo
und
cell
fract
ion
was
was
hed
and
lyse
d fo
r sub
sequ
ent W
este
rn-b
lotti
ng.
All steps were performed at 40C or on ice. Resuspended cells
were incubated for 15 min on a rotary wheel with 40 µl of
magnetic beads coated with an antibody specific for the
appropriate CD-class and then separated by a magnet. The
bound fraction of cells was washed twice in PBS/0.6% citrate/2%
FCS and four times in PBS/0.6% citrate and a smear was
prepared from an aliquot for microscopic examination. Cell
lysates were prepared with 100 µl of lysis buffer and an eqivalent
Material and Methods
65
of 10µg protein was denatured in Lämmli’s buffer for subsequent
Western blot analysis. Purity of the leukocyte fractions, as
evaluated by microscopic examination, was found to be > 90 %
for monocytes, > 80 % for granulocytes and > 95 % for
lymphocytes.
3.19 Luminol and lucigenin chemiluminescence assay for granulocytes
The generation of myeloperoxidase-derived hypochlorite anions
was measured as luminol chemiluminescence and the generation
of NADPH oxidase-derived superoxide anions was measured as
lucigenin chemiluminescence on a Tropix chemiluminescence
plate reader with a programmable 2 channel reagent dispenser
(Applied Biosystems, Foster City, USA) according to the method
of Dr. Bruchelt, Tuebingen [143]. Granulocytes were freshly
prepared from buffy coats by density gradient centrifugation.
250000 cells/well were suspended in 200 µl Hank’s buffer on a
96-well plate and stimulated by 25 µl of a 15 mg/ml solution of
opsonised zymosan (final conc. 1.5 mg/ml). The plate was
inserted immediately and the chemiluminescence reaction was
started by pipetting 25 µl of a 500 µM luminol or lucigenin
solution, respectively, through the programmable reagent channel
P of the plate reader. The chemiluminescence signal was
recorded and integrated over 15 min.
3.20 Lucigenin chemiluminescence assay for cell culture cells
The measurement of lucigenin chemiluminescence is used as a
measure of cellular superoxide anion production and NADPH
oxidase activity [144-147]. The mechanism of superoxide anion-
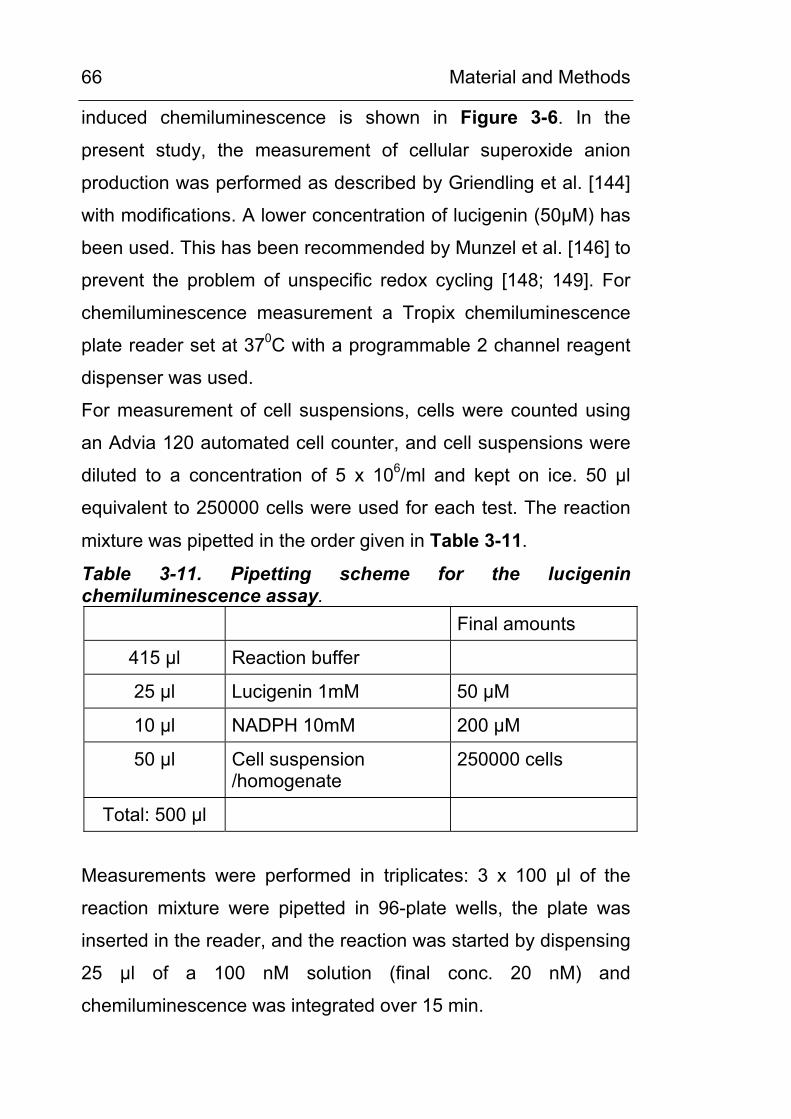
Material and Methods
66
induced chemiluminescence is shown in Figure 3-6. In the
present study, the measurement of cellular superoxide anion
production was performed as described by Griendling et al. [144]
with modifications. A lower concentration of lucigenin (50µM) has
been used. This has been recommended by Munzel et al. [146] to
prevent the problem of unspecific redox cycling [148; 149]. For
chemiluminescence measurement a Tropix chemiluminescence
plate reader set at 370C with a programmable 2 channel reagent
dispenser was used.
For measurement of cell suspensions, cells were counted using
an Advia 120 automated cell counter, and cell suspensions were
diluted to a concentration of 5 x 10⁶/ml and kept on ice. 50 µl
equivalent to 250000 cells were used for each test. The reaction
mixture was pipetted in the order given in Table 3-11.
Table 3-11. Pipetting scheme for the lucigenin chemiluminescence assay. Final amounts
415 µl Reaction buffer
25 µl Lucigenin 1mM 50 µM
10 µl NADPH 10mM 200 µM
50 µl Cell suspension /homogenate
250000 cells
Total: 500 µl
Measurements were performed in triplicates: 3 x 100 µl of the
reaction mixture were pipetted in 96-plate wells, the plate was
inserted in the reader, and the reaction was started by dispensing
25 µl of a 100 nM solution (final conc. 20 nM) and
chemiluminescence was integrated over 15 min.
Material and Methods
67
For measurements of cell homogenates, cells were counted and
cell pellets equal to approx. 2 x 10⁶ cells were washed and lysed
using the lysis buffer given below. The volume of lysis buffer was
calculated and added at a ratio of 100µl per 0.5 x 10⁶ cells.
In experiments, where the effects of inhibitors or stimuli on
superoxide anion production was tested, cell suspensions or
homogenates were preincubated with the indicated substances
for 20 min before the samples were pipetted to the reaction
mixture.
Composition of the lucigenin chemiluminescence reaction buffer (modified from [144]:
50 mM sodium phosphate, pH 7.0
1 mM EGTA
150 mM sucrose
Composition of the cell lysis buffer for the lucigenin chemiluminescence assay (modified from [144]:
20 mM potassium phosphate, Ph 7.0
1 mM EGTA
0.5 mM PMSF
14 µg/ml Aprotinin
20 µl/2x106 cells Mammalian protease inhibitor cocktail
(Sigma P8340)
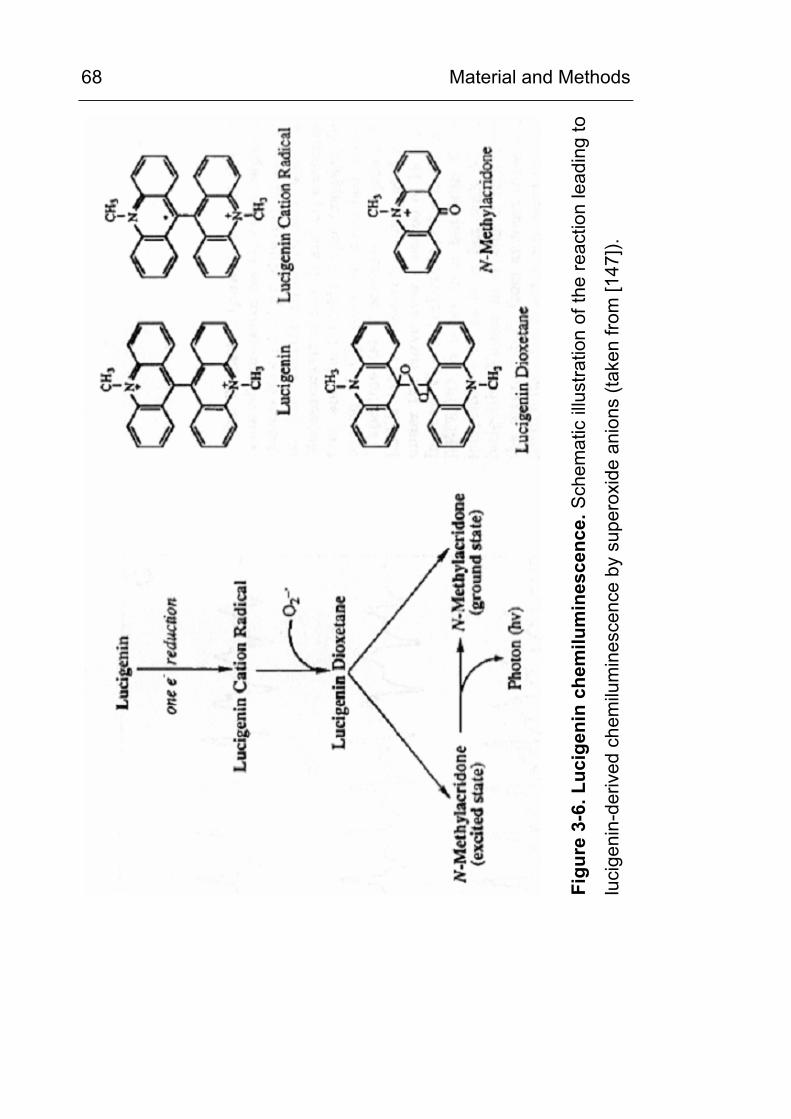
Material and Methods
68
Figu
re 3
-6. L
ucig
enin
che
milu
min
esce
nce.
Sch
emat
ic il
lust
ratio
n of
the
reac
tion
lead
ing
to
luci
geni
n-de
rived
che
milu
min
esce
nce
by s
uper
oxid
e an
ions
(tak
en fr
om [1
47]).
Material and Methods
69
3.21 Statistical analysis
The unpaired Student’s-t-test (two-sided) was used to compare
mean values among the different groups and linear regression
analysis was used to assess correlations. All data are shown as
the mean +/- SD, unless otherwise specified.
Results
70
4 RESULTS
4.1 Chemical carboxymethylation of model proteins and characterisation of the used anti-CML antibodies
Figure 4-1 and Figure 4-2 show the anti-CML Western blots of
HSA, BSA, ferritin and hemoglobin which were chemically
carboxymethylated in vitro using glyoxylic acid as the C2
precursor. The CML content of the products was determined by
ASA using a cation exchange amino acid analyser with ninhydrin
post-column derivatisation (Figure 4-3 and Figure 4-4). For peak
identification and quantification synthetic CML was used as a
standard. As shown for HSA, carboxymethylation proceeded
rapidly and after 4 h approx. 33 % of all lysine residues and after
24 h more than 50 % of all lysine residues were modified (Figure
4-3 and Figure 4-4).
These CML-modified proteins were used to estimate and
compare the sensitivity of the CML-antibodies used in this study
(Figure 4-5). The commercially-obtained monoclonal anti-CML
antibody CMS10, (Trangenics, Kumamoto, Japan) did not show
any reaction (data not shown), be it in Western-blotting or IHC.
The other antibodies (polyclon. anti-CML antiserum (rabbit); mab
4G9 (Roche); mab 2F8 (NovoNordisk, Bagsvaerd, Denmark);
mab NF1G (Transgenics, Kumamoto, Japan)) were shown to be
highly sensitive with a detection limit down to an amount of 1 ng
of CML-protein which equals 0.5 to 1.0 pmoles of CML residues,
depending on the protein used. The calculation e.g. for highly
modified CML-HSA (H-CML-HSA) reads as follows: the detection
limit is 1 ng of H-CML-HSA. (Figure 4-5).1 ng of HSA (MW 66.5
kDa) equals 15 fmol of HSA. HSA contains 59 mol lysine residues
Results
71
/ mol HSA. In H-CML-HSA, 51% of its lysine residues are
carboxymethylated (Figure 4-3). Therefore, 1 ng of H-CML-HSA
contains: 15 fmol x 59 x 0.51 = 442.5 fmol CM-lysine which
equals approx. 0.5 pmol CM lysine.
The antibodies were specific for AGE-modified proteins and did
not crossreact with non-carboxymethylated control proteins up to
amounts as high as 0.015µg of control protein. Monomeric CML
was recognised only by the monoclonal antibody 4G9 at very high
amounts (250 ng or 1.25 nmol on dot blot), but did not react with
the other CML antibodies at these quantities on dot blots (data
not shown). Epitope recognition of the CML modification was
independent from the protein environment since it was equal in
different proteins. Therefore the antibodies truly represent
modification-specific antibodies and are not directed against the
protein compound.
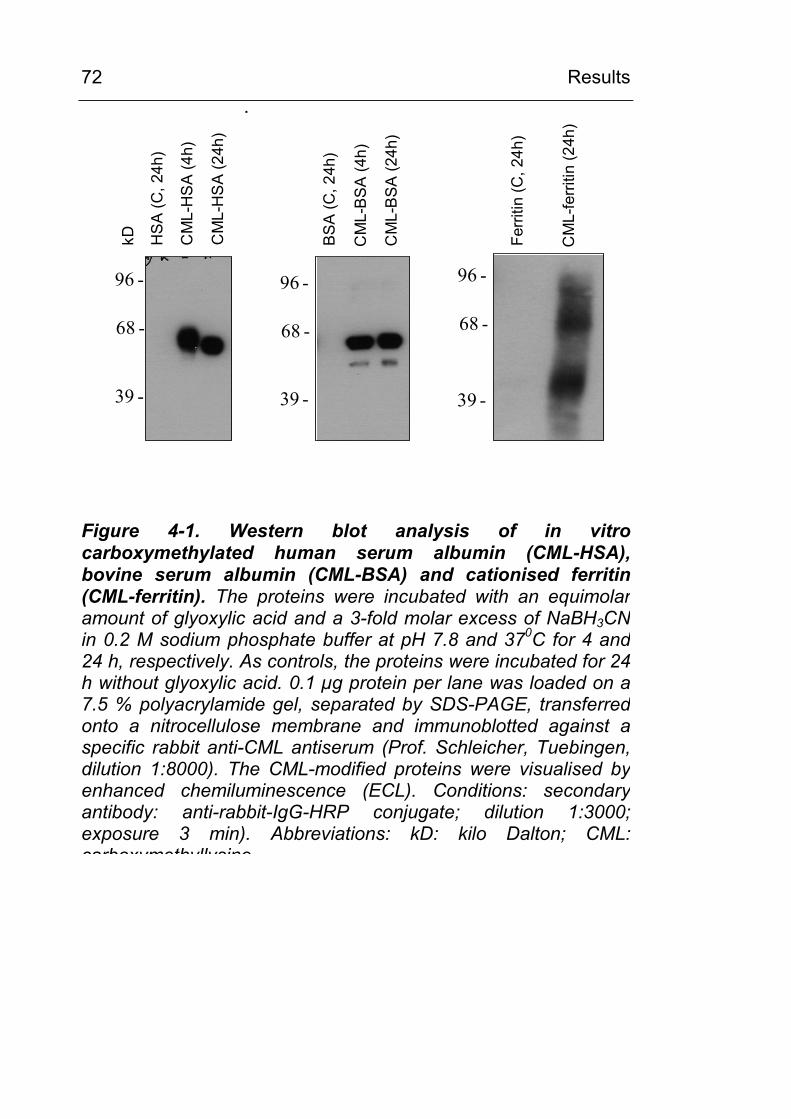
Results
72 :
68 -
96 -
39 -
HS
A (C
, 24h
)
CM
L-H
SA
(4h)
CM
L-H
SA
(24h
)
68 -
96 -
39 -
BS
A (C
,24h
)
CM
L-B
SA
(4h)
CM
L-B
SA
(24h
)39 -
68 -
96 -
CM
L-fe
rritin
(24h
)
Ferri
tin(C
,24h
)
kD
Figure 4-1. Western blot analysis of in vitrocarboxymethylated human serum albumin (CML-HSA), bovine serum albumin (CML-BSA) and cationised ferritin (CML-ferritin). The proteins were incubated with an equimolaramount of glyoxylic acid and a 3-fold molar excess of NaBH3CN in 0.2 M sodium phosphate buffer at pH 7.8 and 370C for 4 and 24 h, respectively. As controls, the proteins were incubated for 24h without glyoxylic acid. 0.1 µg protein per lane was loaded on a7.5 % polyacrylamide gel, separated by SDS-PAGE, transferred onto a nitrocellulose membrane and immunoblotted against aspecific rabbit anti-CML antiserum (Prof. Schleicher, Tuebingen,dilution 1:8000). The CML-modified proteins were visualised byenhanced chemiluminescence (ECL). Conditions: secondaryantibody: anti-rabbit-IgG-HRP conjugate; dilution 1:3000;exposure 3 min). Abbreviations: kD: kilo Dalton; CML: carboxymethyllysine
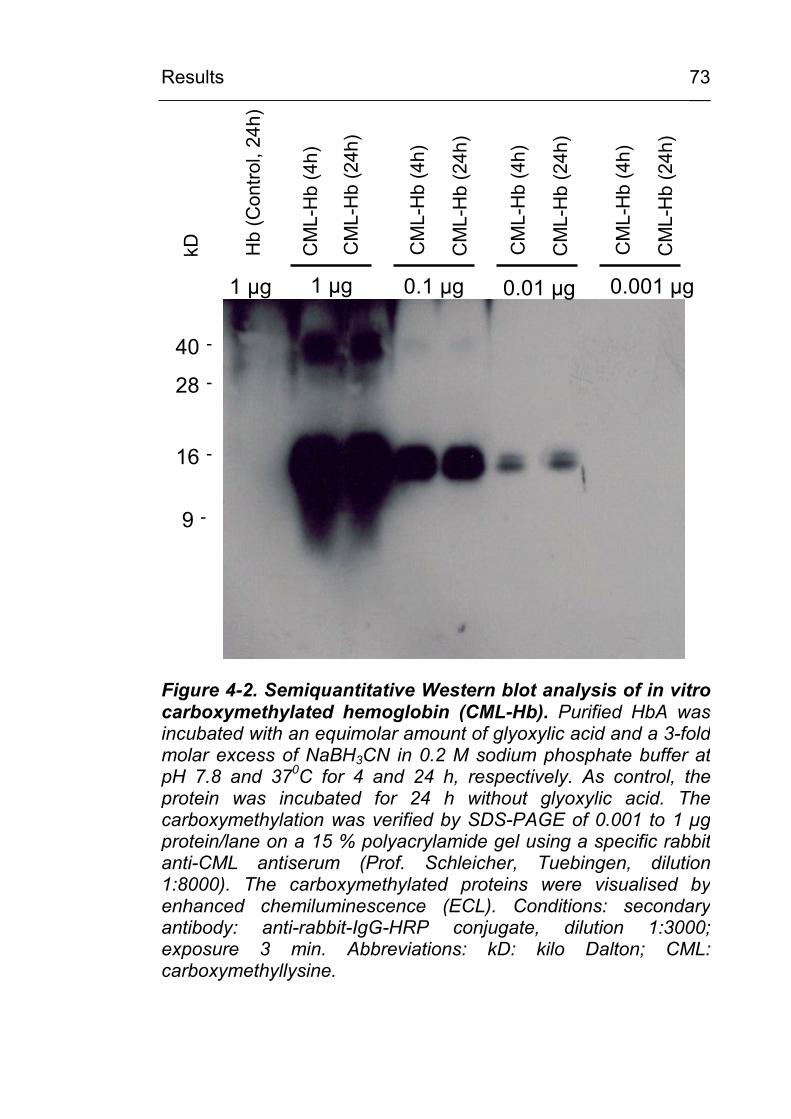
Results
73
Hb
(Con
trol,
24h)
28 -
40 -
16 -
9 -
1 µg 0.1 µg 0.01 µg 0.001 µg1 µgC
ML-
Hb
(4h)
CM
L-H
b(2
4h)
CM
L-H
b(4
h)
CM
L-H
b(2
4h)
CM
L-H
b(4
h)
CM
L-H
b(2
4h)
CM
L-H
b(4
h)
CM
L-H
b(2
4h)
kD
Figure 4-2. Semiquantitative Western blot analysis of in vitrocarboxymethylated hemoglobin (CML-Hb). Purified HbA was incubated with an equimolar amount of glyoxylic acid and a 3-fold molar excess of NaBH3CN in 0.2 M sodium phosphate buffer atpH 7.8 and 370C for 4 and 24 h, respectively. As control, theprotein was incubated for 24 h without glyoxylic acid. Thecarboxymethylation was verified by SDS-PAGE of 0.001 to 1 µg protein/lane on a 15 % polyacrylamide gel using a specific rabbitanti-CML antiserum (Prof. Schleicher, Tuebingen, dilution1:8000). The carboxymethylated proteins were visualised byenhanced chemiluminescence (ECL). Conditions: secondary antibody: anti-rabbit-IgG-HRP conjugate, dilution 1:3000; exposure 3 min. Abbreviations: kD: kilo Dalton; CML:carboxymethyllysine.
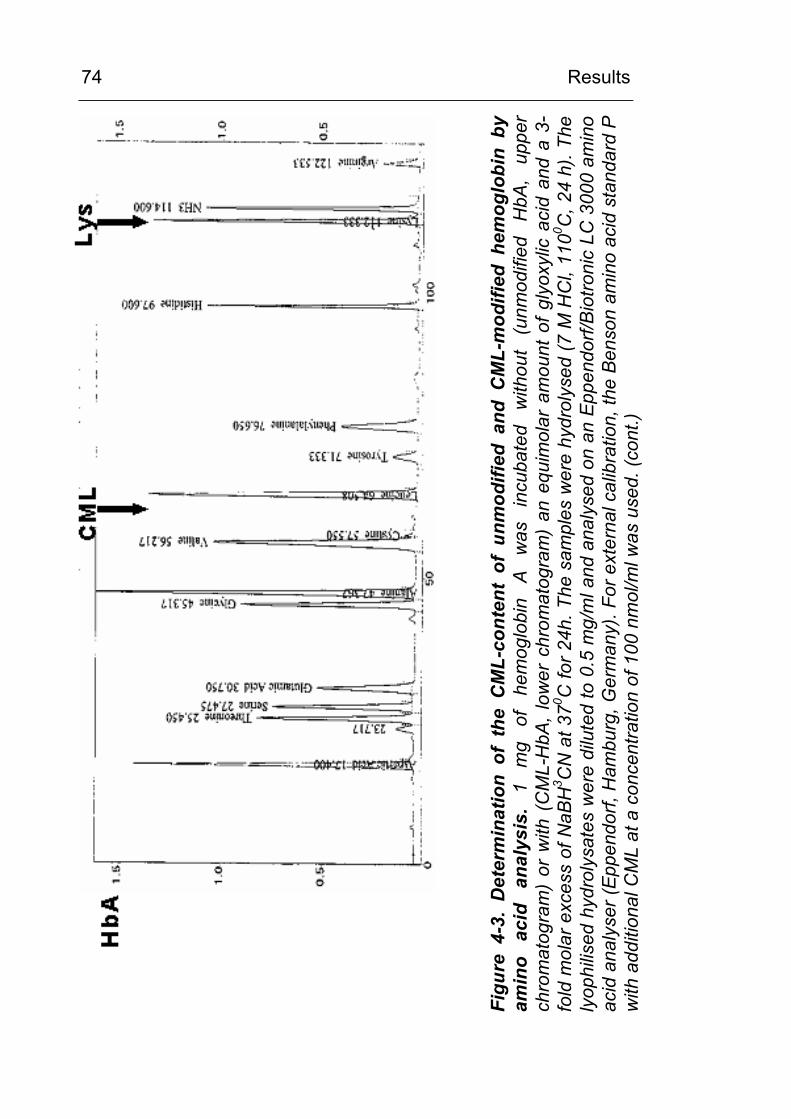
Results
74
Figu
re 4
-3.
Det
erm
inat
ion
of t
he C
ML-
cont
ent
of u
nmod
ified
and
CM
L-m
odifi
ed h
emog
lobi
n by
am
ino
acid
an
alys
is.
1 m
g of
he
mog
lobi
n A
was
in
cuba
ted
with
out
(unm
odifi
ed
HbA
, up
per
chro
mat
ogra
m)
or w
ith (
CM
L-H
bA, l
ower
chr
omat
ogra
m)
an e
quim
olar
am
ount
of g
lyox
ylic
aci
d an
d a
3-fo
ld m
olar
exc
ess
of N
aBH
3 CN
at 3
70 C fo
r 24h
. The
sam
ples
wer
e hy
drol
ysed
(7 M
HC
l, 11
00 C, 2
4 h)
. The
ly
ophi
lised
hyd
roly
sate
s w
ere
dilu
ted
to 0
.5 m
g/m
l and
ana
lyse
d on
an
Eppe
ndor
f/Bio
troni
c LC
300
0 am
ino
acid
ana
lyse
r (Ep
pend
orf,
Ham
burg
, Ger
man
y). F
or e
xter
nal c
alib
ratio
n, th
e Be
nson
am
ino
acid
sta
ndar
d P
with
add
ition
al C
ML
at a
con
cent
ratio
n of
100
nm
ol/m
l was
use
d. (c
ont.)
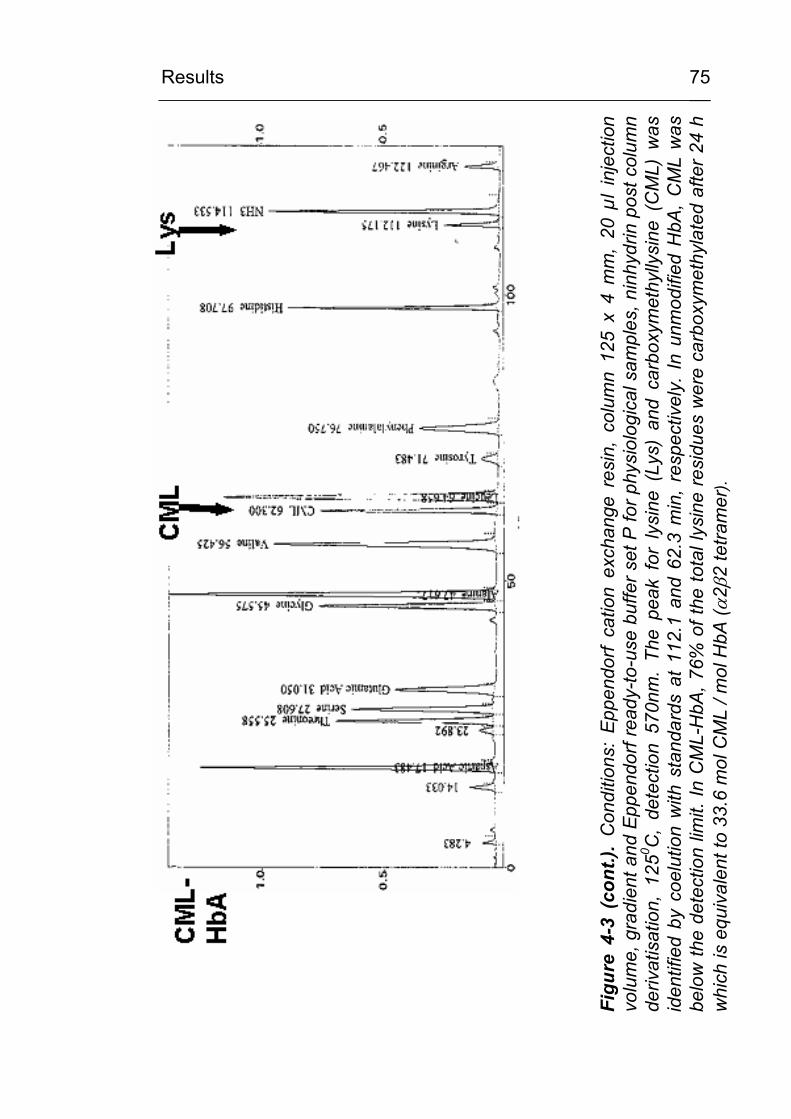
Results
75
Figu
re 4
-3 (
cont
.). C
ondi
tions
: Ep
pend
orf
catio
n ex
chan
ge r
esin
, co
lum
n 12
5 x
4 m
m,
20 µ
l in
ject
ion
volu
me,
gra
dien
t and
Epp
endo
rf re
ady-
to-u
se b
uffe
r set
P fo
r phy
siol
ogic
al s
ampl
es, n
inhy
drin
pos
t col
umn
deriv
atis
atio
n, 1
250 C
, de
tect
ion
570n
m.
The
peak
for
lys
ine
(Lys
) an
d ca
rbox
ymet
hylly
sine
(C
ML)
was
id
entif
ied
by c
oelu
tion
with
sta
ndar
ds a
t 11
2.1
and
62.3
min
, re
spec
tivel
y. I
n un
mod
ified
HbA
, C
ML
was
be
low
the
dete
ctio
n lim
it. In
CM
L-H
bA, 7
6% o
f the
tota
l lys
ine
resi
dues
wer
e ca
rbox
ymet
hyla
ted
afte
r 24
h w
hich
is e
quiv
alen
t to
33.6
mol
CM
L / m
ol H
bA (α
2β2
tetra
mer
).
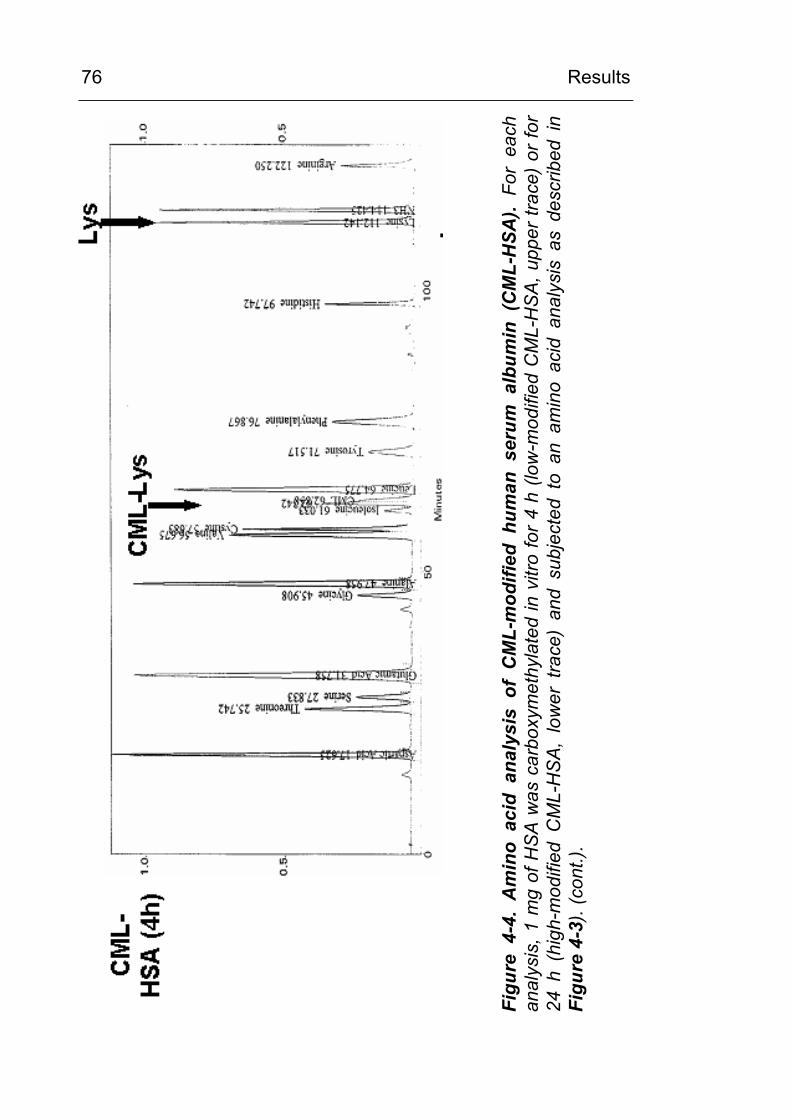
Results
76
Figu
re 4
-4.
Am
ino
acid
ana
lysi
s of
CM
L-m
odifi
ed h
uman
ser
um a
lbum
in (
CM
L-H
SA).
For
each
an
alys
is, 1
mg
of H
SA w
as c
arbo
xym
ethy
late
d in
vitr
o fo
r 4 h
(low
-mod
ified
CM
L-H
SA, u
pper
trac
e) o
r for
24
h (
high
-mod
ified
CM
L-H
SA,
low
er t
race
) an
d su
bjec
ted
to a
n am
ino
acid
ana
lysi
s as
des
crib
ed i
n Fi
gure
4-3
). (c
ont.)
.
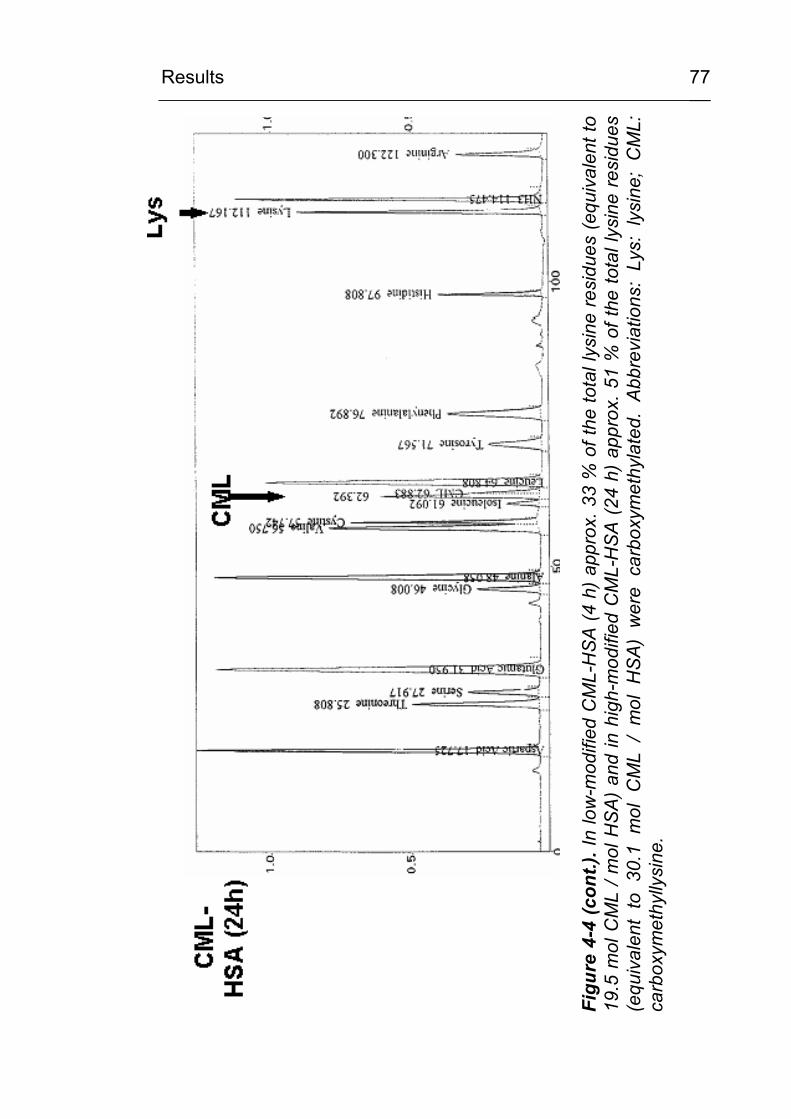
Results
77
Figu
re 4
-4 (c
ont.)
. In
low
-mod
ified
CM
L-H
SA (4
h) a
ppro
x. 3
3 %
of t
he to
tal l
ysin
e re
sidu
es (e
quiv
alen
t to
19.5
mol
CM
L / m
ol H
SA)
and
in h
igh-
mod
ified
CM
L-H
SA (2
4 h)
app
rox.
51
% o
f the
tota
l lys
ine
resi
dues
(e
quiv
alen
t to
30.
1 m
ol C
ML
/ m
ol H
SA)
wer
e ca
rbox
ymet
hyla
ted.
Abb
revi
atio
ns:
Lys:
lys
ine;
CM
L:
carb
oxym
ethy
llysi
ne.
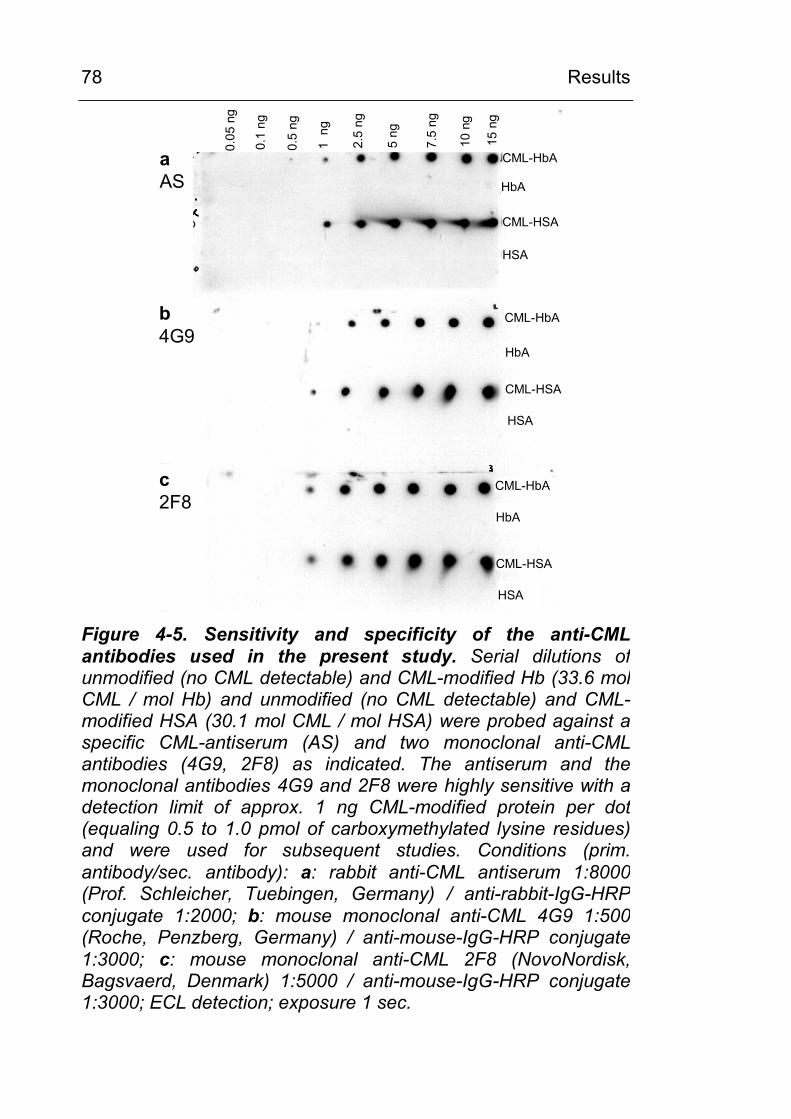
Results
78
CML-HSA
aAS
CML-HbA
HbA
HSA
CML-HbA
HbA
CML-HSA
HSA
CML-HbA
HbA
CML-HSA
HSA
b4G9
c2F8
0.05
ng
0.1
ng
0.5
ng
1 n
g
2.5
ng
5 ng
7.5
ng
10 n
g
15 n
g
Figure 4-5. Sensitivity and specificity of the anti-CML antibodies used in the present study. Serial dilutions of unmodified (no CML detectable) and CML-modified Hb (33.6 mol CML / mol Hb) and unmodified (no CML detectable) and CML-modified HSA (30.1 mol CML / mol HSA) were probed against aspecific CML-antiserum (AS) and two monoclonal anti-CMLantibodies (4G9, 2F8) as indicated. The antiserum and the monoclonal antibodies 4G9 and 2F8 were highly sensitive with adetection limit of approx. 1 ng CML-modified protein per dot (equaling 0.5 to 1.0 pmol of carboxymethylated lysine residues)and were used for subsequent studies. Conditions (prim. antibody/sec. antibody): a: rabbit anti-CML antiserum 1:8000 (Prof. Schleicher, Tuebingen, Germany) / anti-rabbit-IgG-HRP conjugate 1:2000; b: mouse monoclonal anti-CML 4G9 1:500 (Roche, Penzberg, Germany) / anti-mouse-IgG-HRP conjugate 1:3000; c: mouse monoclonal anti-CML 2F8 (NovoNordisk, Bagsvaerd, Denmark) 1:5000 / anti-mouse-IgG-HRP conjugate 1:3000; ECL detection; exposure 1 sec.
Results
79
4.2 CML excretion is increased in urine in diabetic subjects and CML formation can be demonstrated in vivo in tissues and in circulating leukocytes
4.2.1 Increased in vivo formation and excretion of protein-bound CML in diabetic subjects
4.2.1.1 Validation of the HPLC method
Upon variation of the gradient using various columns, filled with
modified C18 reverse phase materials, conditions for base line
separation of CML in hydrolysed and in deproteinised urine were
elaborated as described in methods. Figure 4-6 shows
chromatograms of an urine sample after acid hydrolysis (A/B)
and of an urine sample after acetonitrile precipitation (C/D) of a
representative diabetic patient. CML eluted at RT 8.7 – 9.1 min
(Figure 4-6, A/C) and peak identity was confirmed by the
coelution of an added CML standard (Figure 4-6, B/D).
Throughout all samples, the CML peak was found to be narrow
and fully baseline-separated from the chemically-related homolog
carboxyethyllysine CEL (RT 10.5 min; Figure 4-6 B). Using other
columns (GromSIL ODS-3 CP, GromSIL ODS-4 HE, GromSIL
ODS 5-ST, GromSIL OPA3, all from Grom, Herrenberg,
Germany), CML could not be fully separated neither from the
preceeding peak (caused by the abundant physiological amino
acid serine) nor from CEL. For six-point calibration, standard
solutions from 0.05 to 1.5 µmol/l (corresponding to 0.14 - 4.26
pmol) were prepared from a CML standard in H2O. 200µl of each
standard concentration was derivatised and analysed in
triplicates. Linearity of the standard calibration curve was verified
in a range from 0.14 pmol to 4.26 pmol CML. The calibration line
was: CML (pmol) = 0.009 + 0.318 x area (106 au); (R=0.994). For
Results
80
valididation of the analytical procedure, a processed patient
sample was diluted (1:250 for hydrolysed urine and 1:100 for
deproteinized urine), spiked with 0.1 or 0.5 µmol/l CML standard
(corresponding to 0.28 and 1.4 pmol CML), aliquotted, and
measured in eigthfold replicates. The peak areas were calculated
from measurements of unspiked and spiked sample pairs. The
coefficient of variation (CV) for the peak area was 5.1 % (in
series) and 7.5 % (from day to day) for the calibration level of
0.28 pmol CML on column and 2.17 % (in series) and 6.7 % (from
day to day) for the calibration level of 1.4 pmol CML on column.
Recovery of CML during acid hydrolysis was 90-95 %. The
detection limit of the method was 0.07 pmol CML on column
(signal/noise = 4).
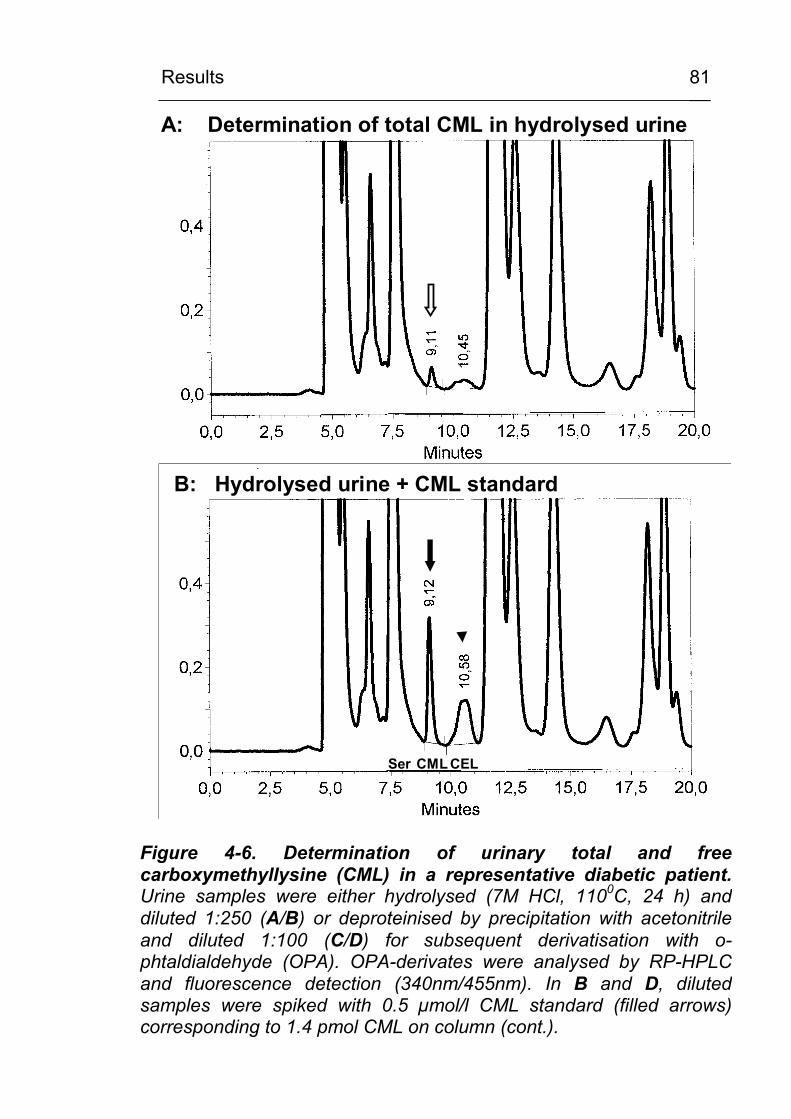
Results
81
RFU
A: Determination of total CML in hydrolysed urine
RFU
Ser CML CEL
B: Hydrolysed urine + CML standard
Figure 4-6. Determination of urinary total and freecarboxymethyllysine (CML) in a representative diabetic patient.Urine samples were either hydrolysed (7M HCl, 1100C, 24 h) and diluted 1:250 (A/B) or deproteinised by precipitation with acetonitrile and diluted 1:100 (C/D) for subsequent derivatisation with o-phtaldialdehyde (OPA). OPA-derivates were analysed by RP-HPLC and fluorescence detection (340nm/455nm). In B and D, diluted samples were spiked with 0.5 µmol/l CML standard (filled arrows)corresponding to 1.4 pmol CML on column (cont.).
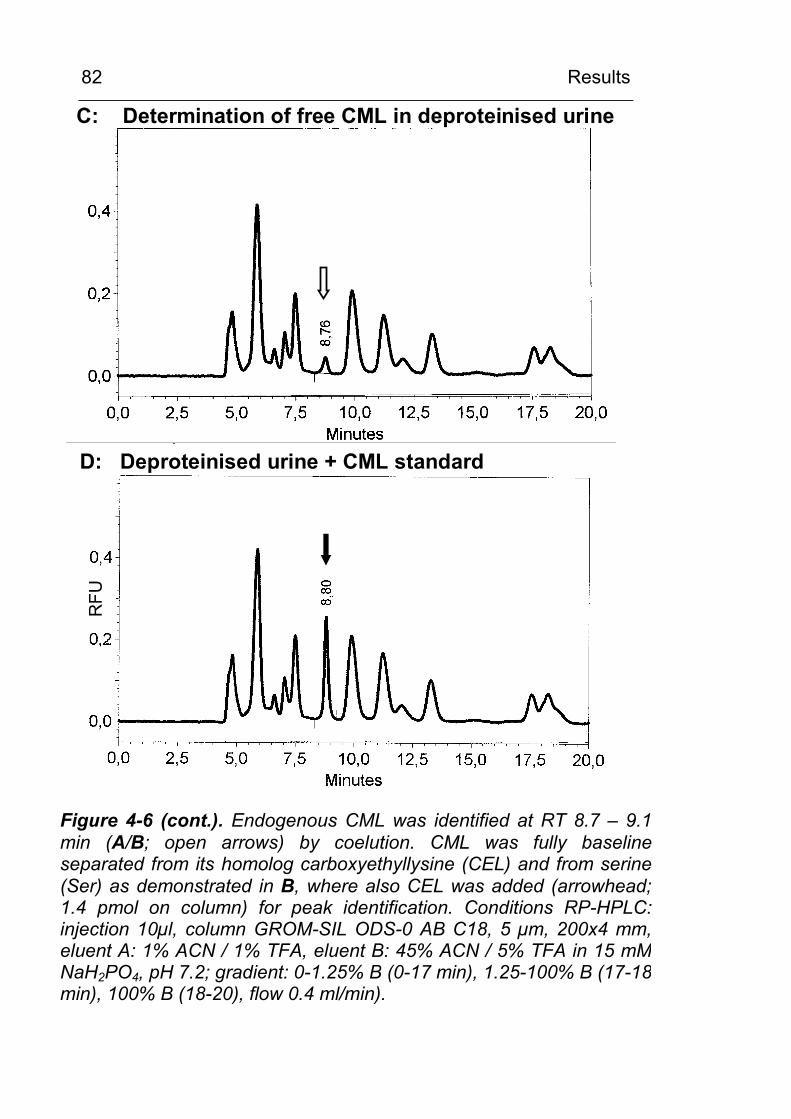
Results
82 R
FUC: Determination of free CML in deproteinised urine
RFU
D: Deproteinised urine + CML standard
Figure 4-6 (cont.). Endogenous CML was identified at RT 8.7 – 9.1 min (A/B; open arrows) by coelution. CML was fully baselineseparated from its homolog carboxyethyllysine (CEL) and from serine(Ser) as demonstrated in B, where also CEL was added (arrowhead; 1.4 pmol on column) for peak identification. Conditions RP-HPLC: injection 10µl, column GROM-SIL ODS-0 AB C18, 5 µm, 200x4 mm, eluent A: 1% ACN / 1% TFA, eluent B: 45% ACN / 5% TFA in 15 mMNaH2PO4, pH 7.2; gradient: 0-1.25% B (0-17 min), 1.25-100% B (17-18 min), 100% B (18-20), flow 0.4 ml/min).
Results
83
4.2.1.2 Urinary CML excretion in diabetic and non-diabetic subjects
In Figure 4-7. the urinary excretion of total and free CML of 51
diabetic patients (DM) is compared to 42 non-diabetic controls
(C). In diabetic patients, the excretion of total CML is increased
by about 30 % (DM: 0.58 +/- 0.21; C: 0.45 +/- 0.14 µmol/mmol
creatinine ; p < 0.001). Urinary excretion of free CML was not
statistically different between both groups, although it tended to
be higher in diabetic patients (DM: 0.22 +/- 0.15 versus C: 0.18
+/- 0.13 µmol/mmol creatinine; ns). To assess the peptide- and
protein-bound fraction of CML, the difference between total and
free CML was calculated. ‘Bound CML’ contained about 60 % of
total CML and consisted of protein- and peptide-bound CML
which has not been precipitated. Patients with diabetes had a
significantly higher excretion of bound CML compared to controls
(DM: 0.36 +/- 0.17; C: 0.27 +/- 0.14; P < 0.05). As shown in
Figure 4-8 the calculated fraction of bound CML correlates
significantly with urinary protein excretion (R = 0.46, p < 0.001)
and with albumin excretion (R = 0.73, p < 0.001), whereas the
correlation of total CML excretion with protein excretion (R = 0.28,
p = 0.047) and albumin excretion (R = 0.29, p = 0.037) was at the
border of significance (data not shown). Excretion of free CML did
not correlate with protein or albumin excretion. Neither total nor
free nor bound CML did correlate with age, duration of DM or
HbA1c. The urinary CML excretion in subgroups with diabetic
neuropathy or retinopathy did not differ from the total group of
diabetic patients (data not shown). Since previous reports have
shown that CML formation in certain tissues such as skin,
vertebral discs or eye lens collagen is increased with age [42; 43;
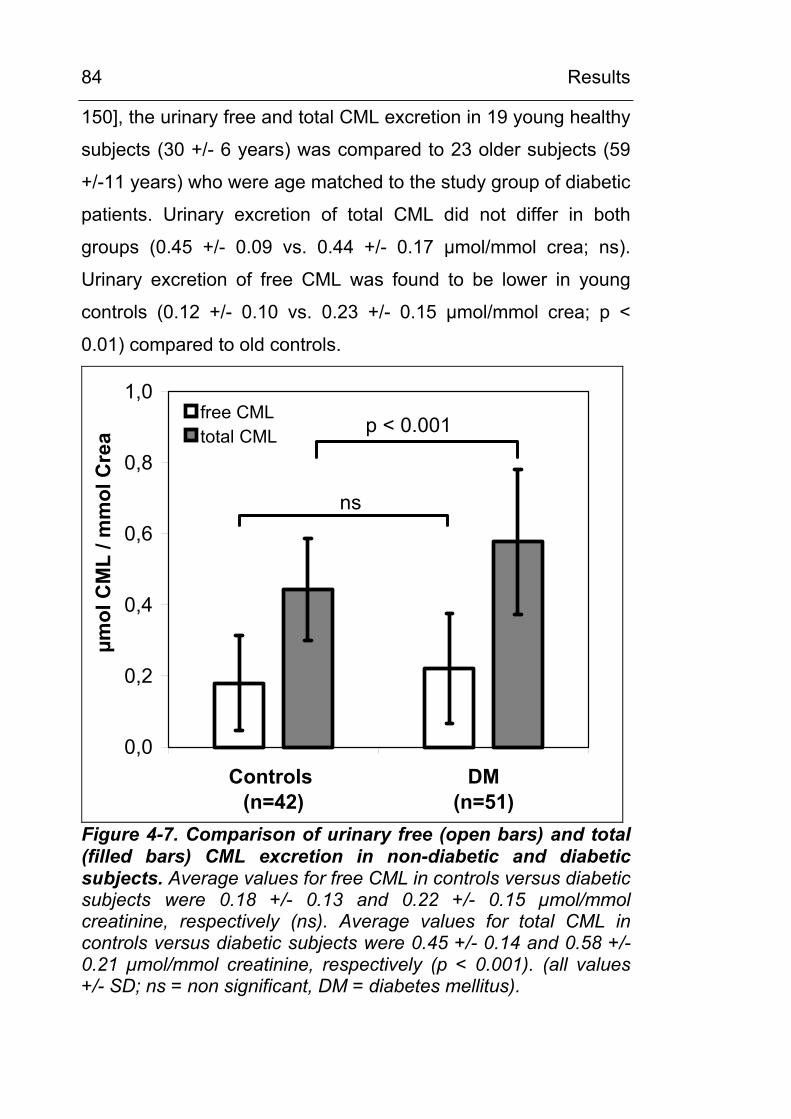
Results
84
150], the urinary free and total CML excretion in 19 young healthy
subjects (30 +/- 6 years) was compared to 23 older subjects (59
+/-11 years) who were age matched to the study group of diabetic
patients. Urinary excretion of total CML did not differ in both
groups (0.45 +/- 0.09 vs. 0.44 +/- 0.17 µmol/mmol crea; ns).
Urinary excretion of free CML was found to be lower in young
controls (0.12 +/- 0.10 vs. 0.23 +/- 0.15 µmol/mmol crea; p <
0.01) compared to old controls.
0,0
0,2
0,4
0,6
0,8
1,0
Controls (n=42)
DM(n=51)
µmol
CM
L / m
mol
Cre
a
free CMLtotal CML
ns
p < 0.001
Figure 4-7. Comparison of urinary free (open bars) and total (filled bars) CML excretion in non-diabetic and diabetic subjects. Average values for free CML in controls versus diabetic subjects were 0.18 +/- 0.13 and 0.22 +/- 0.15 µmol/mmol creatinine, respectively (ns). Average values for total CML in controls versus diabetic subjects were 0.45 +/- 0.14 and 0.58 +/- 0.21 µmol/mmol creatinine, respectively (p < 0.001). (all values +/- SD; ns = non significant, DM = diabetes mellitus).
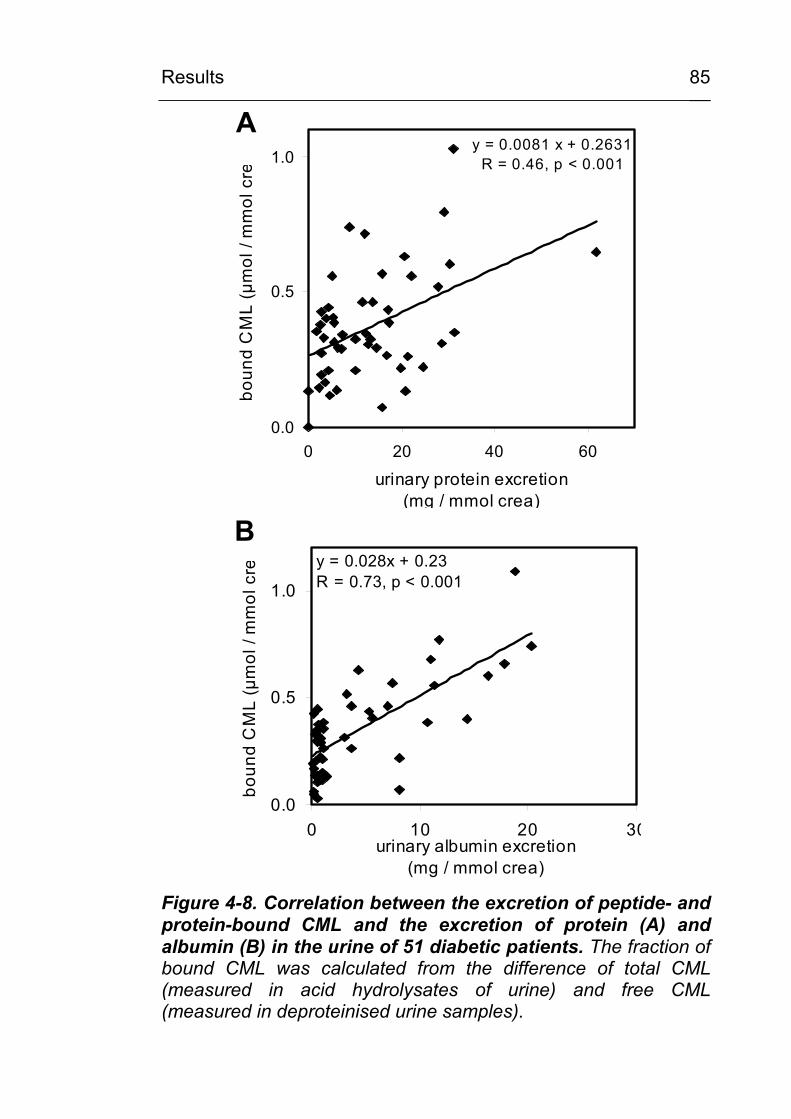
Results
85
y = 0.0081 x + 0.2631R = 0.46, p < 0.001
0.0
0.5
1.0
0 20 40 60
urinary protein excretion (mg / mmol crea)
boun
d C
ML
(µm
ol /
mm
ol c
re
A
y = 0.028x + 0.23R = 0.73, p < 0.001
0.0
0.5
1.0
0 10 20 30urinary albumin excretion
(mg / mmol crea)
boun
d C
ML
(µm
ol /
mm
ol c
re
B
Figure 4-8. Correlation between the excretion of peptide- and protein-bound CML and the excretion of protein (A) and albumin (B) in the urine of 51 diabetic patients. The fraction of bound CML was calculated from the difference of total CML (measured in acid hydrolysates of urine) and free CML (measured in deproteinised urine samples).
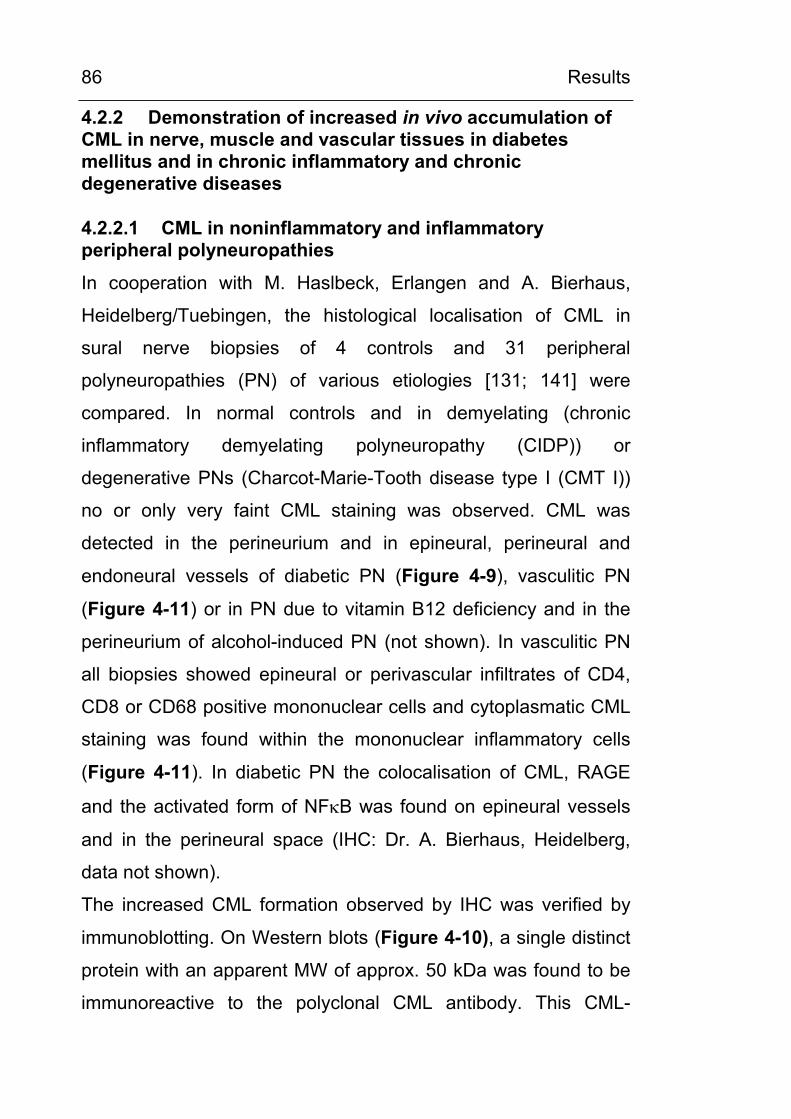
Results
86
4.2.2 Demonstration of increased in vivo accumulation of CML in nerve, muscle and vascular tissues in diabetes mellitus and in chronic inflammatory and chronic degenerative diseases
4.2.2.1 CML in noninflammatory and inflammatory peripheral polyneuropathies
In cooperation with M. Haslbeck, Erlangen and A. Bierhaus,
Heidelberg/Tuebingen, the histological localisation of CML in
sural nerve biopsies of 4 controls and 31 peripheral
polyneuropathies (PN) of various etiologies [131; 141] were
compared. In normal controls and in demyelating (chronic
inflammatory demyelating polyneuropathy (CIDP)) or
degenerative PNs (Charcot-Marie-Tooth disease type I (CMT I))
no or only very faint CML staining was observed. CML was
detected in the perineurium and in epineural, perineural and
endoneural vessels of diabetic PN (Figure 4-9), vasculitic PN
(Figure 4-11) or in PN due to vitamin B12 deficiency and in the
perineurium of alcohol-induced PN (not shown). In vasculitic PN
all biopsies showed epineural or perivascular infiltrates of CD4,
CD8 or CD68 positive mononuclear cells and cytoplasmatic CML
staining was found within the mononuclear inflammatory cells
(Figure 4-11). In diabetic PN the colocalisation of CML, RAGE
and the activated form of NFκB was found on epineural vessels
and in the perineural space (IHC: Dr. A. Bierhaus, Heidelberg,
data not shown).
The increased CML formation observed by IHC was verified by
immunoblotting. On Western blots (Figure 4-10), a single distinct
protein with an apparent MW of approx. 50 kDa was found to be
immunoreactive to the polyclonal CML antibody. This CML-
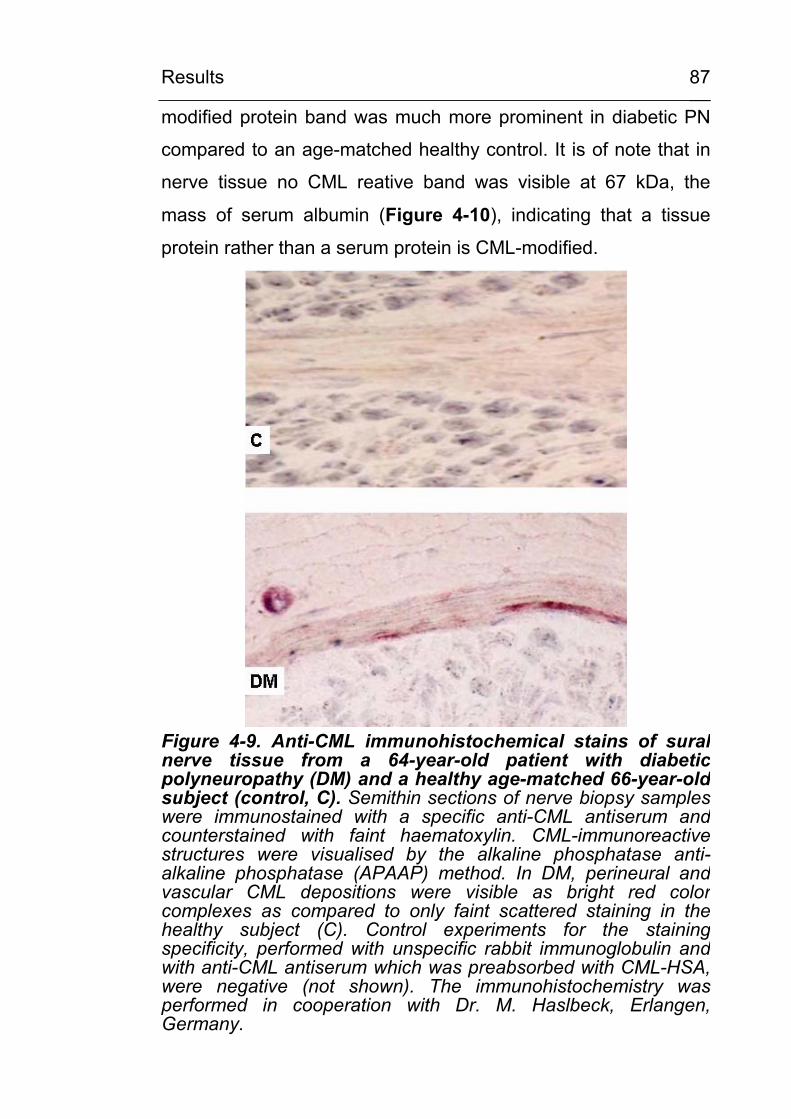
Results
87
modified protein band was much more prominent in diabetic PN
compared to an age-matched healthy control. It is of note that in
nerve tissue no CML reative band was visible at 67 kDa, the
mass of serum albumin (Figure 4-10), indicating that a tissue
protein rather than a serum protein is CML-modified.
Figure 4-9. Anti-CML immunohistochemical stains of suralnerve tissue from a 64-year-old patient with diabetic polyneuropathy (DM) and a healthy age-matched 66-year-old subject (control, C). Semithin sections of nerve biopsy sampleswere immunostained with a specific anti-CML antiserum and counterstained with faint haematoxylin. CML-immunoreactive structures were visualised by the alkaline phosphatase anti-alkaline phosphatase (APAAP) method. In DM, perineural andvascular CML depositions were visible as bright red colorcomplexes as compared to only faint scattered staining in the healthy subject (C). Control experiments for the stainingspecificity, performed with unspecific rabbit immunoglobulin andwith anti-CML antiserum which was preabsorbed with CML-HSA, were negative (not shown). The immunohistochemistry wasperformed in cooperation with Dr. M. Haslbeck, Erlangen,Germany.
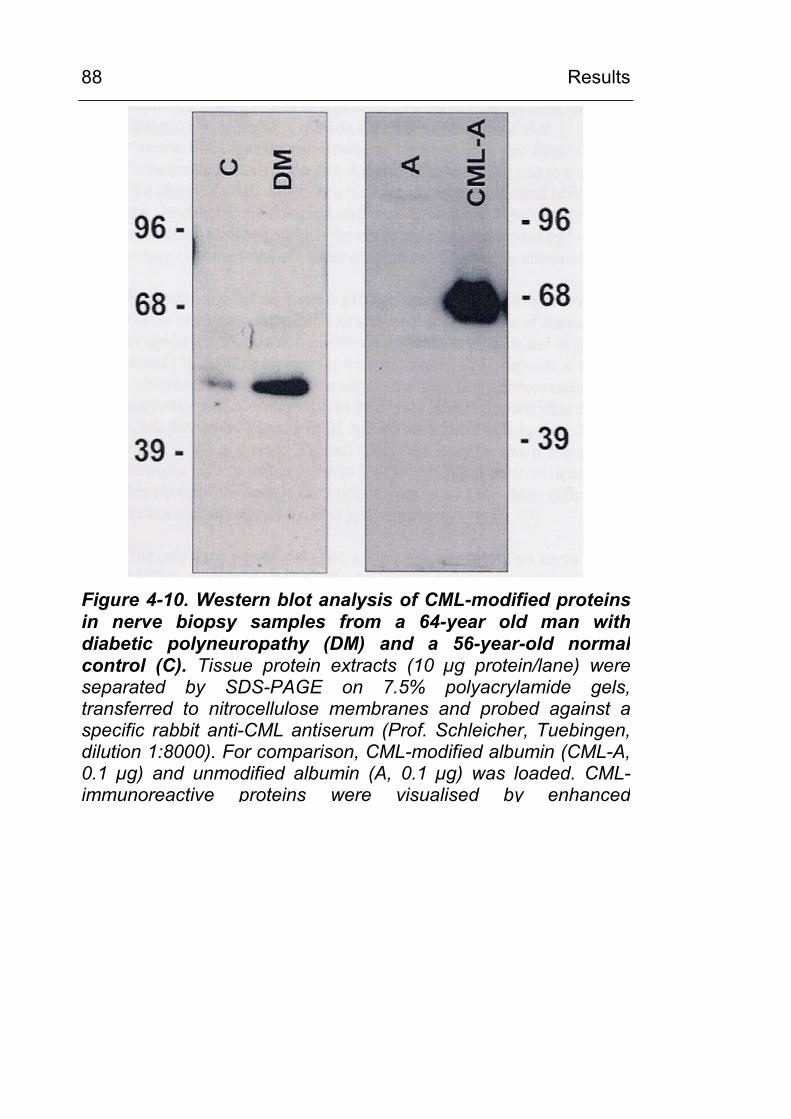
Results
88
Figure 4-10. Western blot analysis of CML-modified proteins in nerve biopsy samples from a 64-year old man with diabetic polyneuropathy (DM) and a 56-year-old normal control (C). Tissue protein extracts (10 µg protein/lane) wereseparated by SDS-PAGE on 7.5% polyacrylamide gels,transferred to nitrocellulose membranes and probed against aspecific rabbit anti-CML antiserum (Prof. Schleicher, Tuebingen,dilution 1:8000). For comparison, CML-modified albumin (CML-A, 0.1 µg) and unmodified albumin (A, 0.1 µg) was loaded. CML-immunoreactive proteins were visualised by enhanced
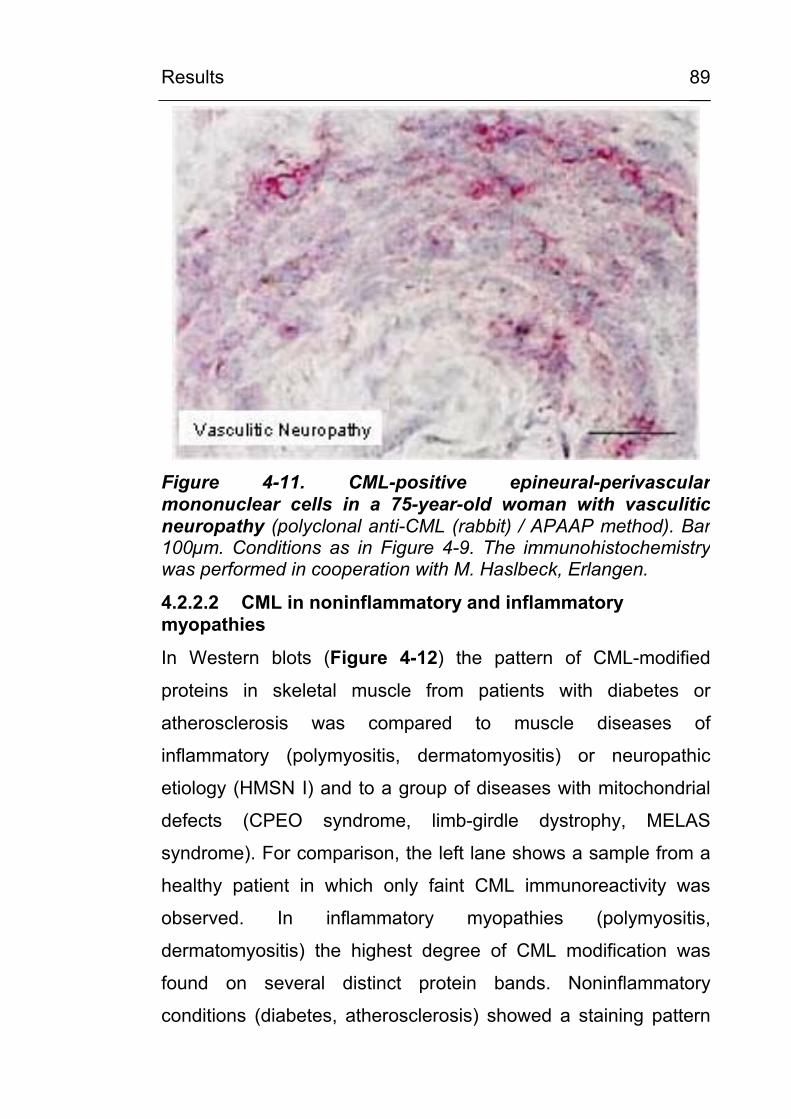
Results
89
Figure 4-11. CML-positive epineural-perivascular mononuclear cells in a 75-year-old woman with vasculitic neuropathy (polyclonal anti-CML (rabbit) / APAAP method). Bar 100µm. Conditions as in Figure 4-9. The immunohistochemistry was performed in cooperation with M. Haslbeck, Erlangen.
4.2.2.2 CML in noninflammatory and inflammatory myopathies
In Western blots (Figure 4-12) the pattern of CML-modified
proteins in skeletal muscle from patients with diabetes or
atherosclerosis was compared to muscle diseases of
inflammatory (polymyositis, dermatomyositis) or neuropathic
etiology (HMSN I) and to a group of diseases with mitochondrial
defects (CPEO syndrome, limb-girdle dystrophy, MELAS
syndrome). For comparison, the left lane shows a sample from a
healthy patient in which only faint CML immunoreactivity was
observed. In inflammatory myopathies (polymyositis,
dermatomyositis) the highest degree of CML modification was
found on several distinct protein bands. Noninflammatory
conditions (diabetes, atherosclerosis) showed a staining pattern
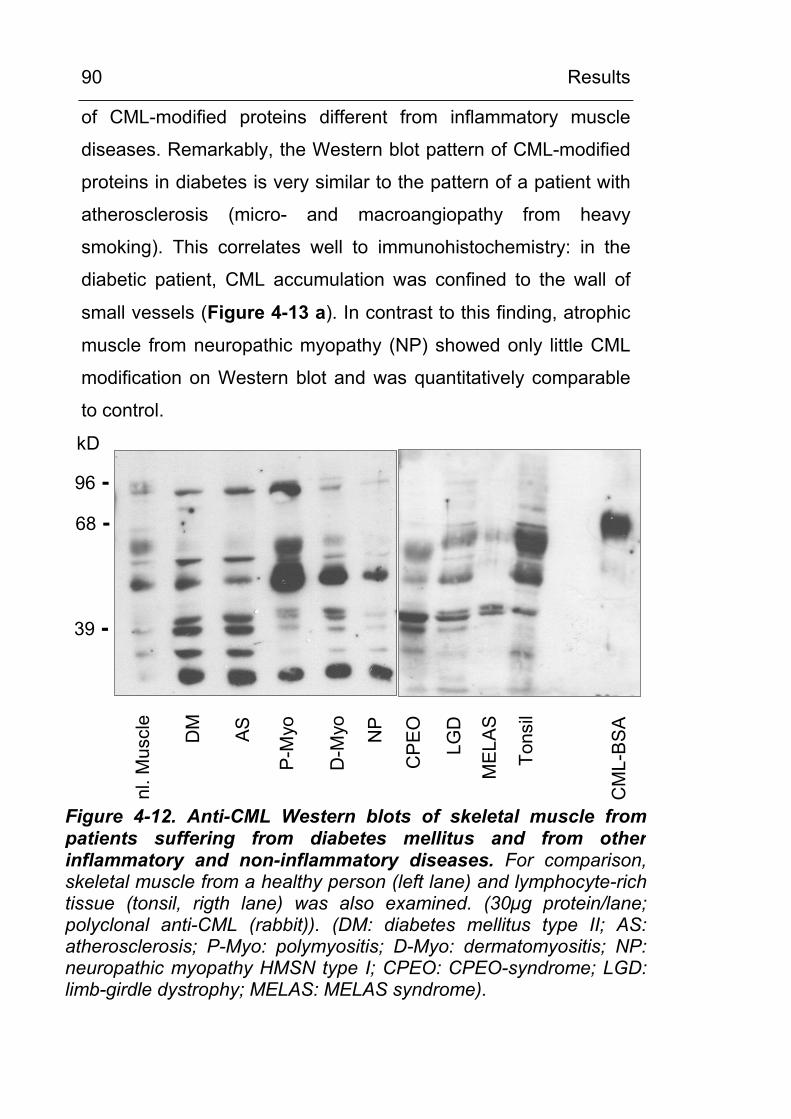
Results
90
of CML-modified proteins different from inflammatory muscle
diseases. Remarkably, the Western blot pattern of CML-modified
proteins in diabetes is very similar to the pattern of a patient with
atherosclerosis (micro- and macroangiopathy from heavy
smoking). This correlates well to immunohistochemistry: in the
diabetic patient, CML accumulation was confined to the wall of
small vessels (Figure 4-13 a). In contrast to this finding, atrophic
muscle from neuropathic myopathy (NP) showed only little CML
modification on Western blot and was quantitatively comparable
to control.
nl. M
uscl
e
DM AS
P-M
yo
D-M
yo NP
CP
EO
LGD
MEL
AS
Tons
il
CM
L-B
SA
96 -
68 -
39 -
kD
Figure 4-12. Anti-CML Western blots of skeletal muscle frompatients suffering from diabetes mellitus and from otherinflammatory and non-inflammatory diseases. For comparison, skeletal muscle from a healthy person (left lane) and lymphocyte-rich tissue (tonsil, rigth lane) was also examined. (30µg protein/lane;polyclonal anti-CML (rabbit)). (DM: diabetes mellitus type II; AS:atherosclerosis; P-Myo: polymyositis; D-Myo: dermatomyositis; NP: neuropathic myopathy HMSN type I; CPEO: CPEO-syndrome; LGD: limb-girdle dystrophy; MELAS: MELAS syndrome).
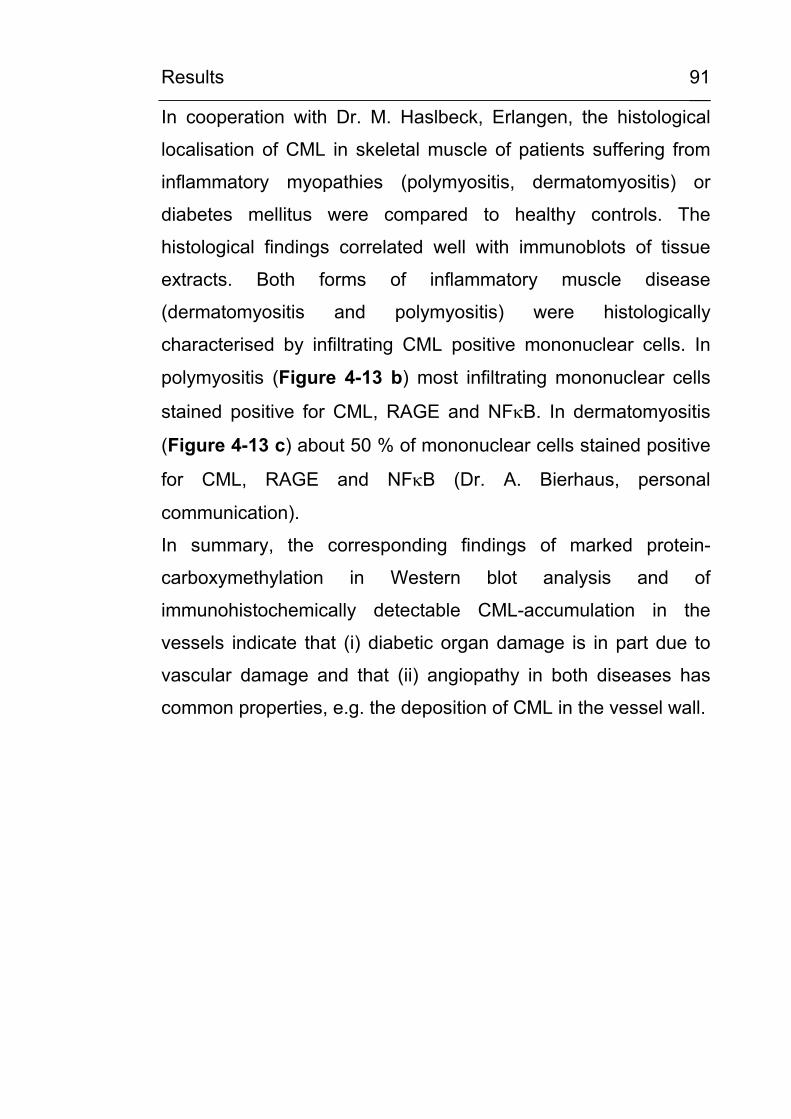
Results
91
In cooperation with Dr. M. Haslbeck, Erlangen, the histological
localisation of CML in skeletal muscle of patients suffering from
inflammatory myopathies (polymyositis, dermatomyositis) or
diabetes mellitus were compared to healthy controls. The
histological findings correlated well with immunoblots of tissue
extracts. Both forms of inflammatory muscle disease
(dermatomyositis and polymyositis) were histologically
characterised by infiltrating CML positive mononuclear cells. In
polymyositis (Figure 4-13 b) most infiltrating mononuclear cells
stained positive for CML, RAGE and NFκB. In dermatomyositis
(Figure 4-13 c) about 50 % of mononuclear cells stained positive
for CML, RAGE and NFκB (Dr. A. Bierhaus, personal
communication).
In summary, the corresponding findings of marked protein-
carboxymethylation in Western blot analysis and of
immunohistochemically detectable CML-accumulation in the
vessels indicate that (i) diabetic organ damage is in part due to
vascular damage and that (ii) angiopathy in both diseases has
common properties, e.g. the deposition of CML in the vessel wall.
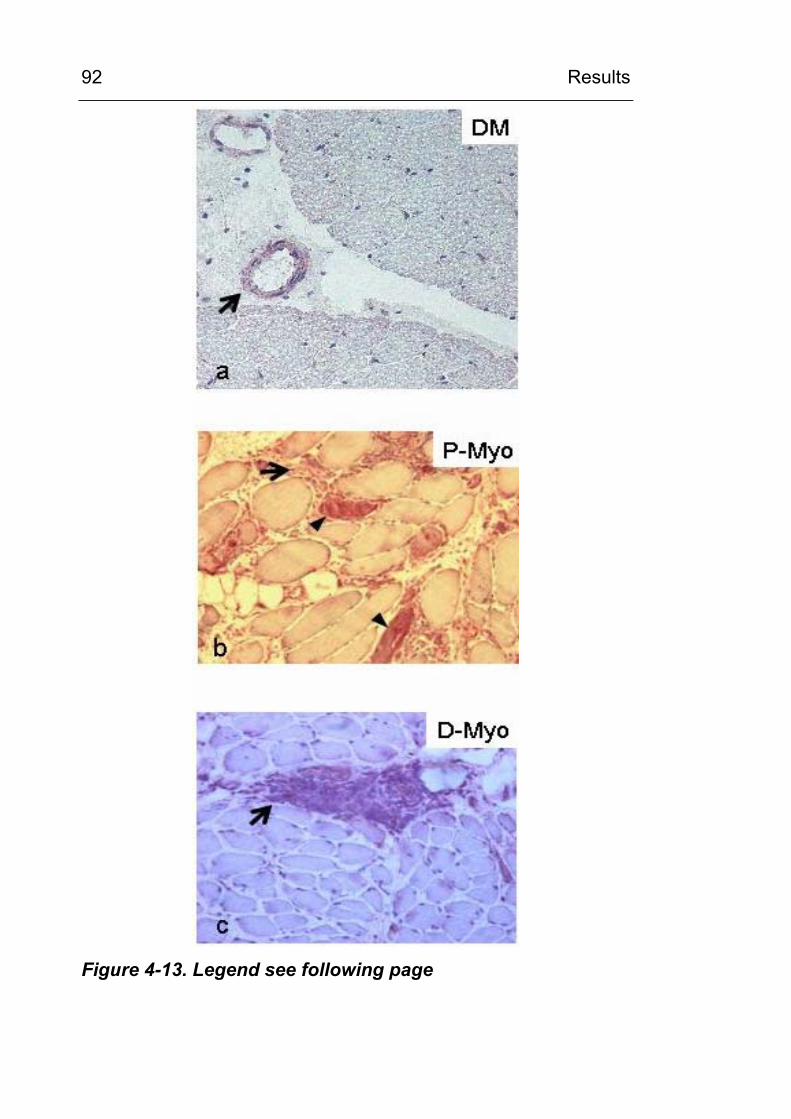
Results
92
Figure 4-13. Legend see following page
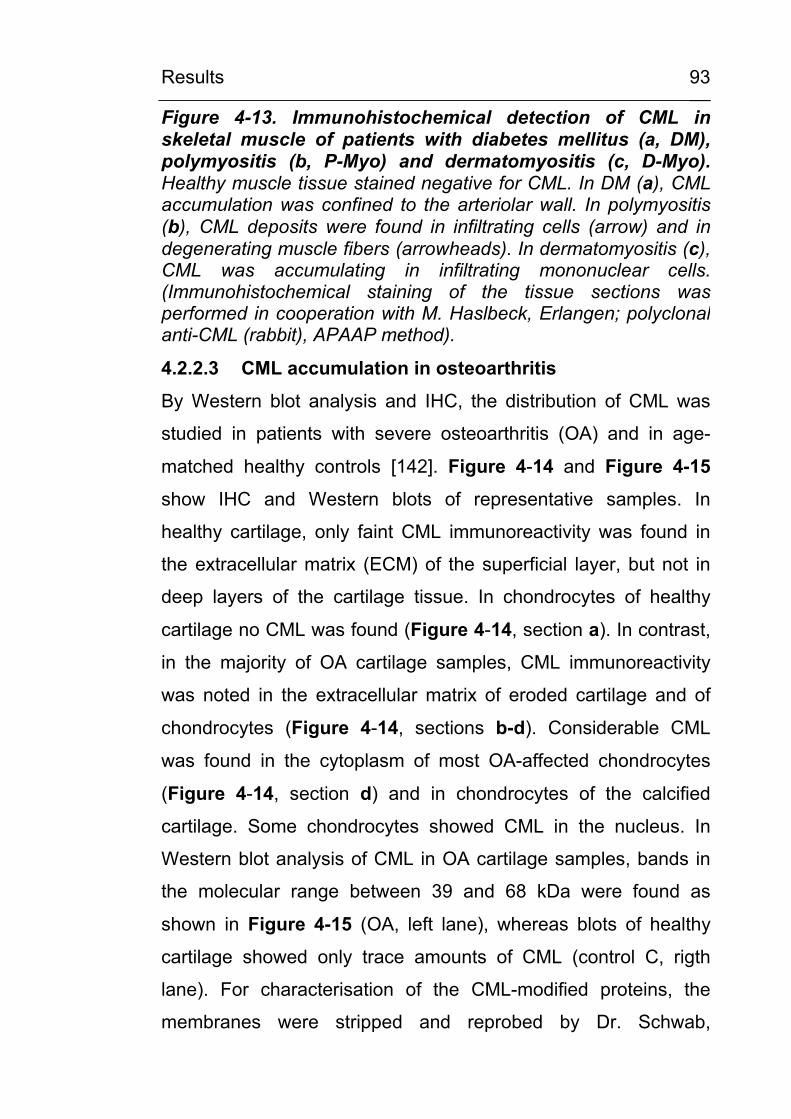
Results
93
Figure 4-13. Immunohistochemical detection of CML in skeletal muscle of patients with diabetes mellitus (a, DM), polymyositis (b, P-Myo) and dermatomyositis (c, D-Myo).Healthy muscle tissue stained negative for CML. In DM (a), CML accumulation was confined to the arteriolar wall. In polymyositis (b), CML deposits were found in infiltrating cells (arrow) and indegenerating muscle fibers (arrowheads). In dermatomyositis (c),CML was accumulating in infiltrating mononuclear cells.(Immunohistochemical staining of the tissue sections was performed in cooperation with M. Haslbeck, Erlangen; polyclonalanti-CML (rabbit), APAAP method).
4.2.2.3 CML accumulation in osteoarthritis
By Western blot analysis and IHC, the distribution of CML was
studied in patients with severe osteoarthritis (OA) and in age-
matched healthy controls [142]. Figure 4-14 and Figure 4-15
show IHC and Western blots of representative samples. In
healthy cartilage, only faint CML immunoreactivity was found in
the extracellular matrix (ECM) of the superficial layer, but not in
deep layers of the cartilage tissue. In chondrocytes of healthy
cartilage no CML was found (Figure 4-14, section a). In contrast,
in the majority of OA cartilage samples, CML immunoreactivity
was noted in the extracellular matrix of eroded cartilage and of
chondrocytes (Figure 4-14, sections b-d). Considerable CML
was found in the cytoplasm of most OA-affected chondrocytes
(Figure 4-14, section d) and in chondrocytes of the calcified
cartilage. Some chondrocytes showed CML in the nucleus. In
Western blot analysis of CML in OA cartilage samples, bands in
the molecular range between 39 and 68 kDa were found as
shown in Figure 4-15 (OA, left lane), whereas blots of healthy
cartilage showed only trace amounts of CML (control C, rigth
lane). For characterisation of the CML-modified proteins, the
membranes were stripped and reprobed by Dr. Schwab,
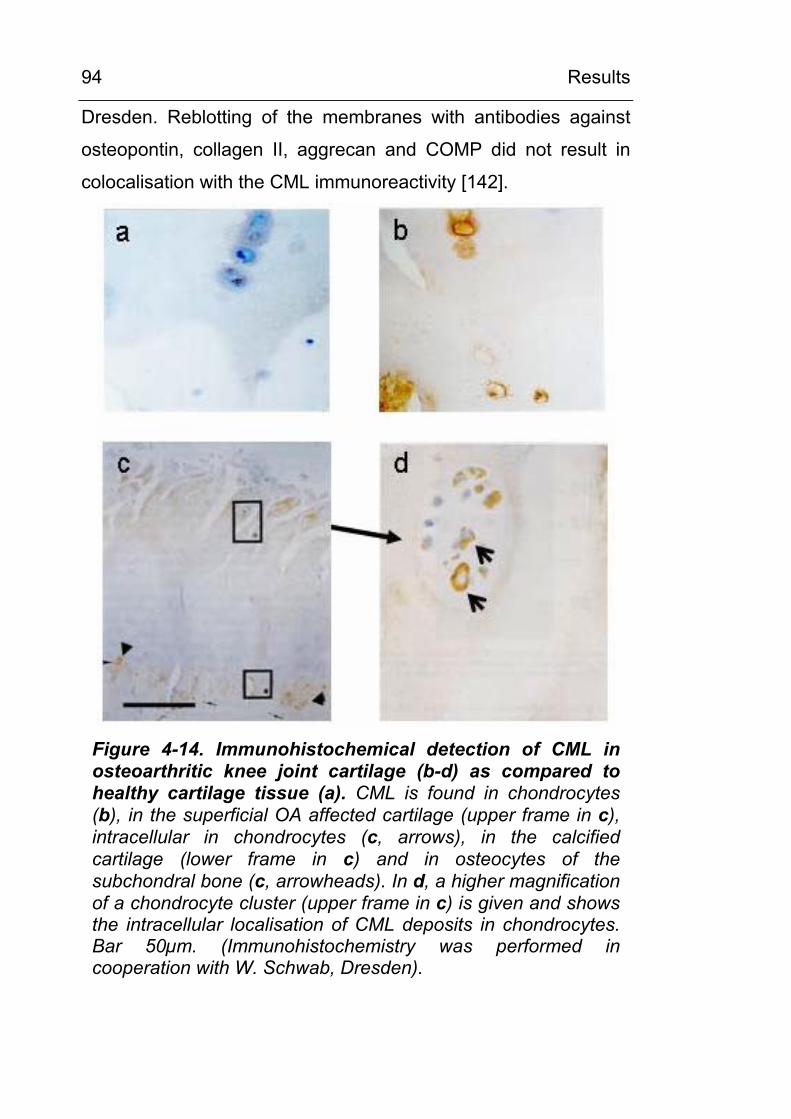
Results
94
Dresden. Reblotting of the membranes with antibodies against
osteopontin, collagen II, aggrecan and COMP did not result in
colocalisation with the CML immunoreactivity [142].
Figure 4-14. Immunohistochemical detection of CML in osteoarthritic knee joint cartilage (b-d) as compared to healthy cartilage tissue (a). CML is found in chondrocytes (b), in the superficial OA affected cartilage (upper frame in c), intracellular in chondrocytes (c, arrows), in the calcified cartilage (lower frame in c) and in osteocytes of the subchondral bone (c, arrowheads). In d, a higher magnification of a chondrocyte cluster (upper frame in c) is given and shows the intracellular localisation of CML deposits in chondrocytes. Bar 50µm. (Immunohistochemistry was performed in cooperation with W. Schwab, Dresden).
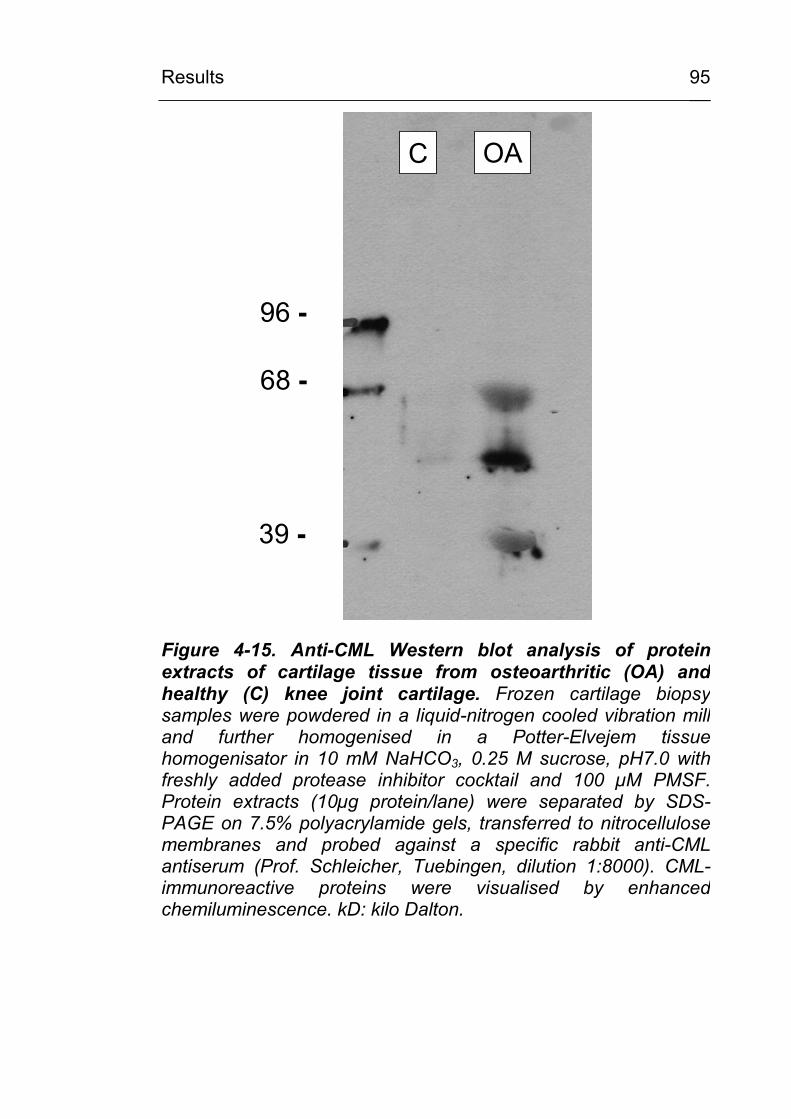
Results
95
96 -
68 -
39 -
C OA
Figure 4-15. Anti-CML Western blot analysis of proteinextracts of cartilage tissue from osteoarthritic (OA) andhealthy (C) knee joint cartilage. Frozen cartilage biopsy samples were powdered in a liquid-nitrogen cooled vibration mill and further homogenised in a Potter-Elvejem tissue homogenisator in 10 mM NaHCO3, 0.25 M sucrose, pH7.0 with freshly added protease inhibitor cocktail and 100 µM PMSF.Protein extracts (10µg protein/lane) were separated by SDS-PAGE on 7.5% polyacrylamide gels, transferred to nitrocellulosemembranes and probed against a specific rabbit anti-CML antiserum (Prof. Schleicher, Tuebingen, dilution 1:8000). CML-immunoreactive proteins were visualised by enhancedchemiluminescence. kD: kilo Dalton.
Results
96
4.2.3 CML accumulation in circulating granulocytes
It was studied, whether CML modification of cellular proteins can
be observed in circulating leukocytes of hyperglycemic diabetic
patients as compared to normoglycemic non-diabetic controls. By
immunoabsorption using antibody-coated magnetic beads, CD14-
positive monocytes, CD14-negative/CD15-positive granulocytes
and CD3-positive lymphocytes were prepared from EDTA blood
samples of 8 diabetic patients (HbA1c in the range of 9.8 –
13.2%) and of 6 non-diabetic controls. Cell lysates were prepared
and analysed by Western blotting (polyclonal rabbit anti-CML
antiserum). In granulocytes, in 2 out of 8 diabetic patients a single
CML-modified protein band was found with an apparent MW of
approx. 25kDa (Figure 4-16) but not in granulocytes of
normoglycemic controls. In monocytes and lymphocytes no CML
modification was observed, neither in diabetics nor in controls.
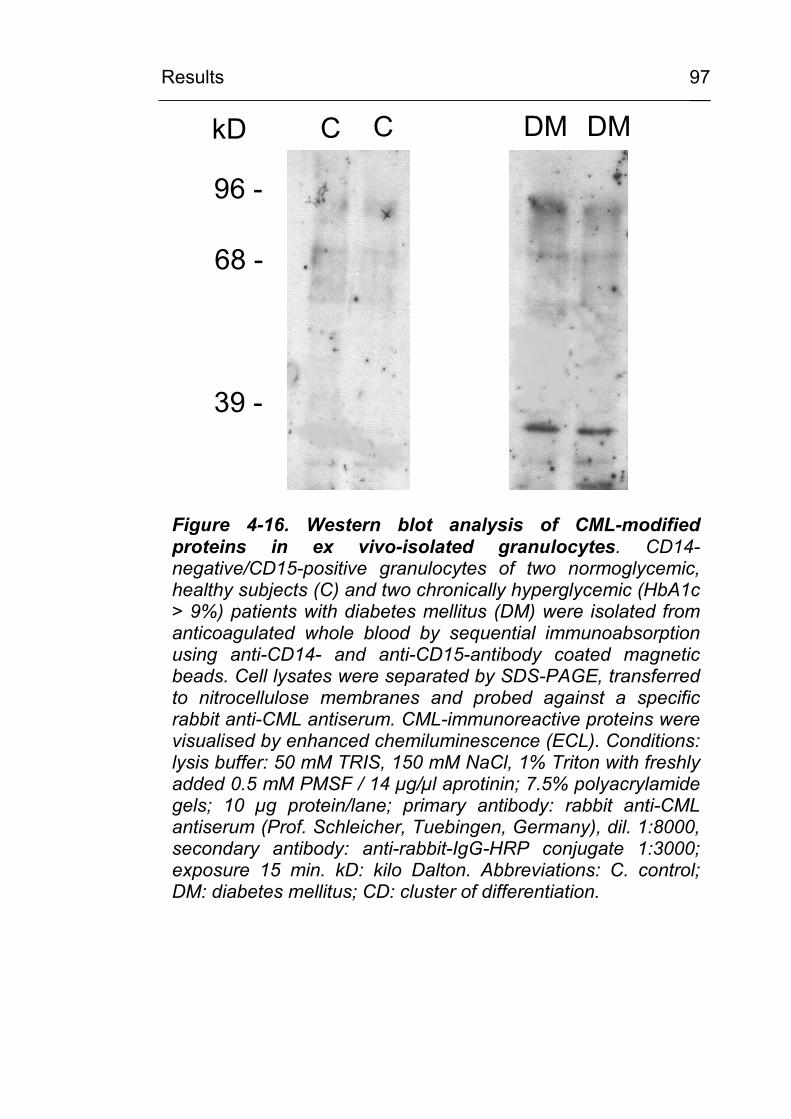
Results
97
kD
96 -
68 -
39 -
C C DM DM
Figure 4-16. Western blot analysis of CML-modified proteins in ex vivo-isolated granulocytes. CD14-negative/CD15-positive granulocytes of two normoglycemic, healthy subjects (C) and two chronically hyperglycemic (HbA1c > 9%) patients with diabetes mellitus (DM) were isolated from anticoagulated whole blood by sequential immunoabsorption using anti-CD14- and anti-CD15-antibody coated magnetic beads. Cell lysates were separated by SDS-PAGE, transferred to nitrocellulose membranes and probed against a specific rabbit anti-CML antiserum. CML-immunoreactive proteins were visualised by enhanced chemiluminescence (ECL). Conditions: lysis buffer: 50 mM TRIS, 150 mM NaCl, 1% Triton with freshly added 0.5 mM PMSF / 14 µg/µl aprotinin; 7.5% polyacrylamide gels; 10 µg protein/lane; primary antibody: rabbit anti-CML antiserum (Prof. Schleicher, Tuebingen, Germany), dil. 1:8000, secondary antibody: anti-rabbit-IgG-HRP conjugate 1:3000; exposure 15 min. kD: kilo Dalton. Abbreviations: C. control; DM: diabetes mellitus; CD: cluster of differentiation.
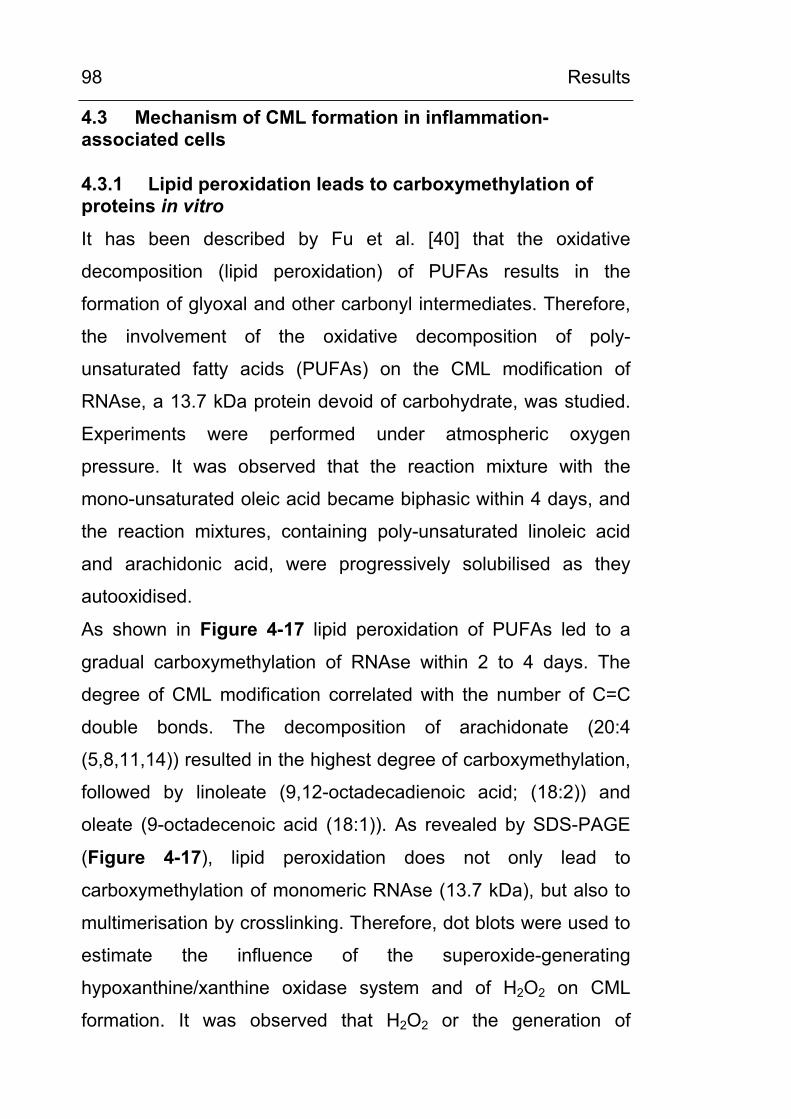
Results
98
4.3 Mechanism of CML formation in inflammation-associated cells
4.3.1 Lipid peroxidation leads to carboxymethylation of proteins in vitro
It has been described by Fu et al. [40] that the oxidative
decomposition (lipid peroxidation) of PUFAs results in the
formation of glyoxal and other carbonyl intermediates. Therefore,
the involvement of the oxidative decomposition of poly-
unsaturated fatty acids (PUFAs) on the CML modification of
RNAse, a 13.7 kDa protein devoid of carbohydrate, was studied.
Experiments were performed under atmospheric oxygen
pressure. It was observed that the reaction mixture with the
mono-unsaturated oleic acid became biphasic within 4 days, and
the reaction mixtures, containing poly-unsaturated linoleic acid
and arachidonic acid, were progressively solubilised as they
autooxidised.
As shown in Figure 4-17 lipid peroxidation of PUFAs led to a
gradual carboxymethylation of RNAse within 2 to 4 days. The
degree of CML modification correlated with the number of C=C
double bonds. The decomposition of arachidonate (20:4
(5,8,11,14)) resulted in the highest degree of carboxymethylation,
followed by linoleate (9,12-octadecadienoic acid; (18:2)) and
oleate (9-octadecenoic acid (18:1)). As revealed by SDS-PAGE
(Figure 4-17), lipid peroxidation does not only lead to
carboxymethylation of monomeric RNAse (13.7 kDa), but also to
multimerisation by crosslinking. Therefore, dot blots were used to
estimate the influence of the superoxide-generating
hypoxanthine/xanthine oxidase system and of H2O2 on CML
formation. It was observed that H2O2 or the generation of
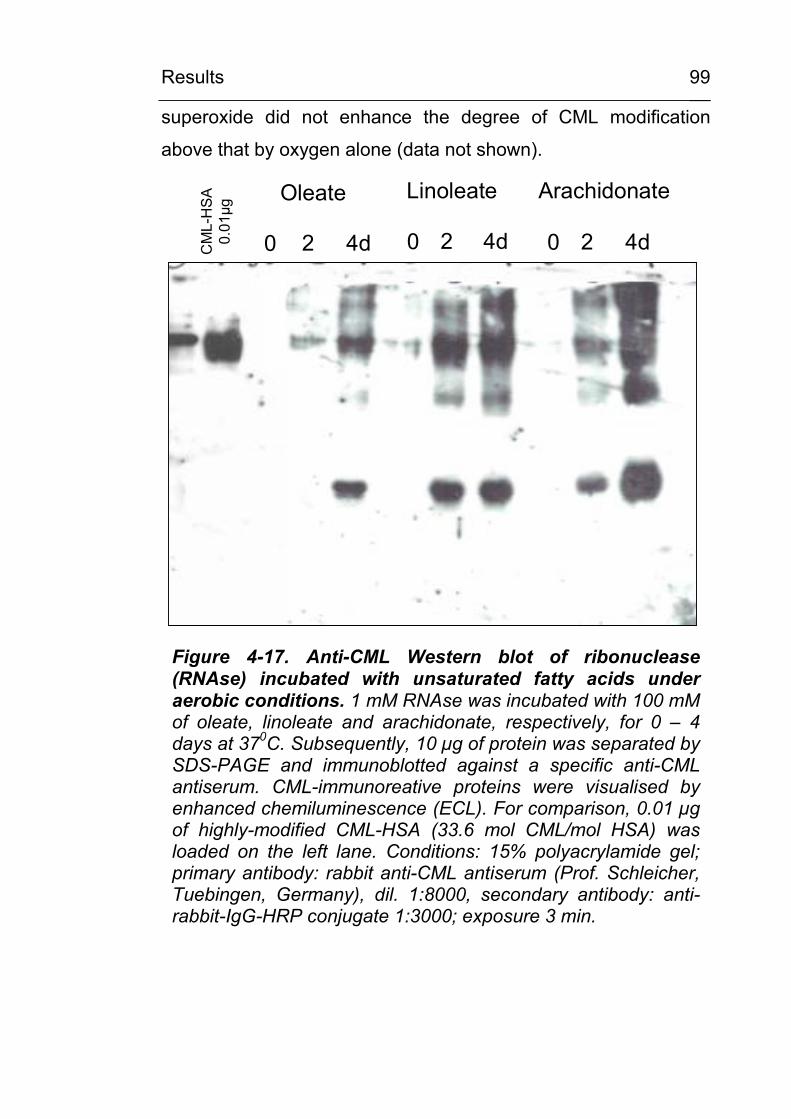
Results
99
superoxide did not enhance the degree of CML modification
above that by oxygen alone (data not shown).
0 2 4d 0 2 4d 0 2 4d
Oleate Linoleate ArachidonateC
ML-
HSA
0.01
µg
Figure 4-17. Anti-CML Western blot of ribonuclease (RNAse) incubated with unsaturated fatty acids under aerobic conditions. 1 mM RNAse was incubated with 100 mM of oleate, linoleate and arachidonate, respectively, for 0 – 4 days at 370C. Subsequently, 10 µg of protein was separated by SDS-PAGE and immunoblotted against a specific anti-CML antiserum. CML-immunoreative proteins were visualised by enhanced chemiluminescence (ECL). For comparison, 0.01 µg of highly-modified CML-HSA (33.6 mol CML/mol HSA) was loaded on the left lane. Conditions: 15% polyacrylamide gel; primary antibody: rabbit anti-CML antiserum (Prof. Schleicher, Tuebingen, Germany), dil. 1:8000, secondary antibody: anti-rabbit-IgG-HRP conjugate 1:3000; exposure 3 min.
Results
100
4.3.2 The ‚oxidative burst‘ of granulocytes leads to the carboxymethylation of serum proteins
Granulocytes were isolated from freshly-prepared buffy coats and
suspended in RPMI, containing 5% FCS, and stimulated by
opsonised zymosan (1.5 mg/ml) to study the effect of the
granulocytic ROS production on serum proteins. As shown in
Figure 4-18 A/B, stimulation with opsonised zymosan resulted in
an ‚oxidative burst‘ with marked stimulation of myeloperoxidase
(MPO, measured as luminol chemiluminescence) and of NADPH
oxidase (measured as lucigemin chemiluminescence) for 120
min. The degree of protein-carboxymethylation of the serum
proteins ( as well as of intracellular proteins set free from lysed
granulocytes) was analysed by Western-blotting (
Figure 4-18 C). A time-dependent CML modification
predominantly on albumin (65 kDa), but also on other distinct
proteins was observed. This experiment demonstrated the overall
effect of the ROS set free during the granulocytic ‚oxidative burst‘
on CML formation, but was not found suitable to study
intracellular CML formation since granulocytic cells were
completely lysed within 2 hours.
0
20
au
(n=3, +/- SD)
Lum
inol
lum
ines
cenc
e(a
u) A20
00 30 90 120min
Figure 4-18. Legend see following page.
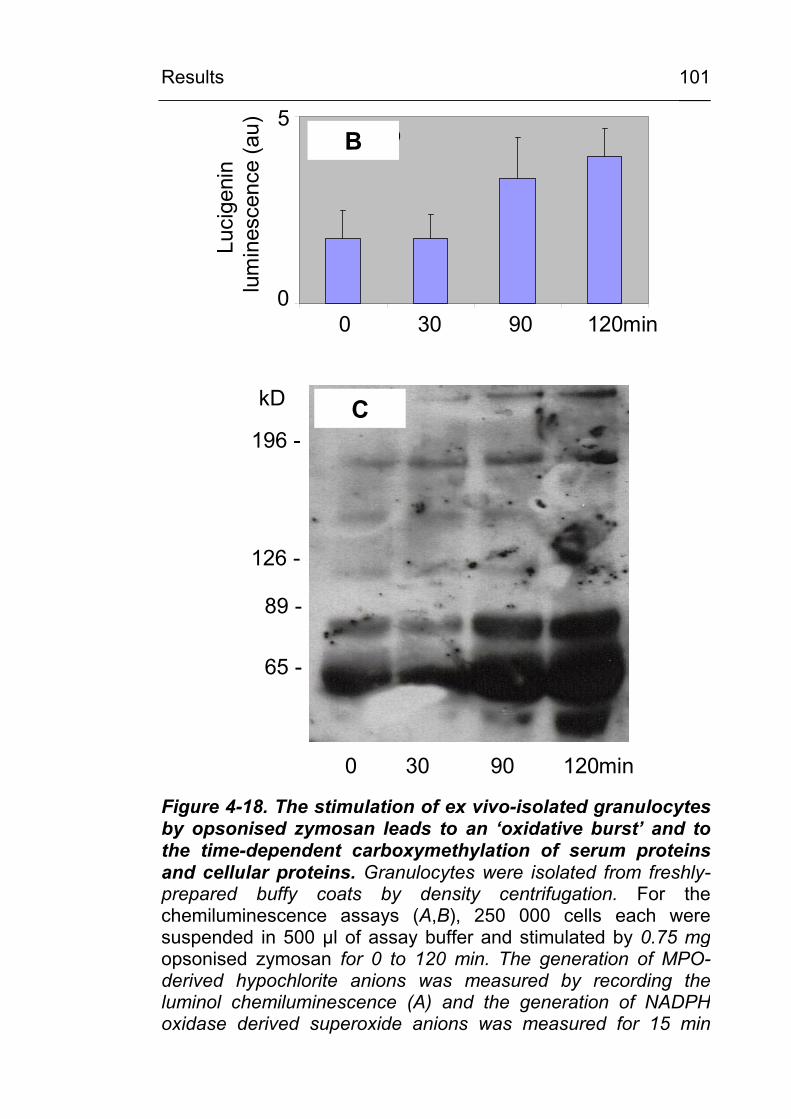
Results
101
0
5
au
(n=3, +/- SD)
Luci
geni
nlu
min
esce
nce
(au)
0 30 90 120min
B
196 -
126 -
89 -
65 -
kD
0 30 90 120min
C
5
0
Figure 4-18. The stimulation of ex vivo-isolated granulocytes by opsonised zymosan leads to an ‘oxidative burst’ and to the time-dependent carboxymethylation of serum proteinsand cellular proteins. Granulocytes were isolated from freshly-prepared buffy coats by density centrifugation. For the chemiluminescence assays (A,B), 250 000 cells each were suspended in 500 µl of assay buffer and stimulated by 0.75 mgopsonised zymosan for 0 to 120 min. The generation of MPO-derived hypochlorite anions was measured by recording theluminol chemiluminescence (A) and the generation of NADPHoxidase derived superoxide anions was measured for 15 min
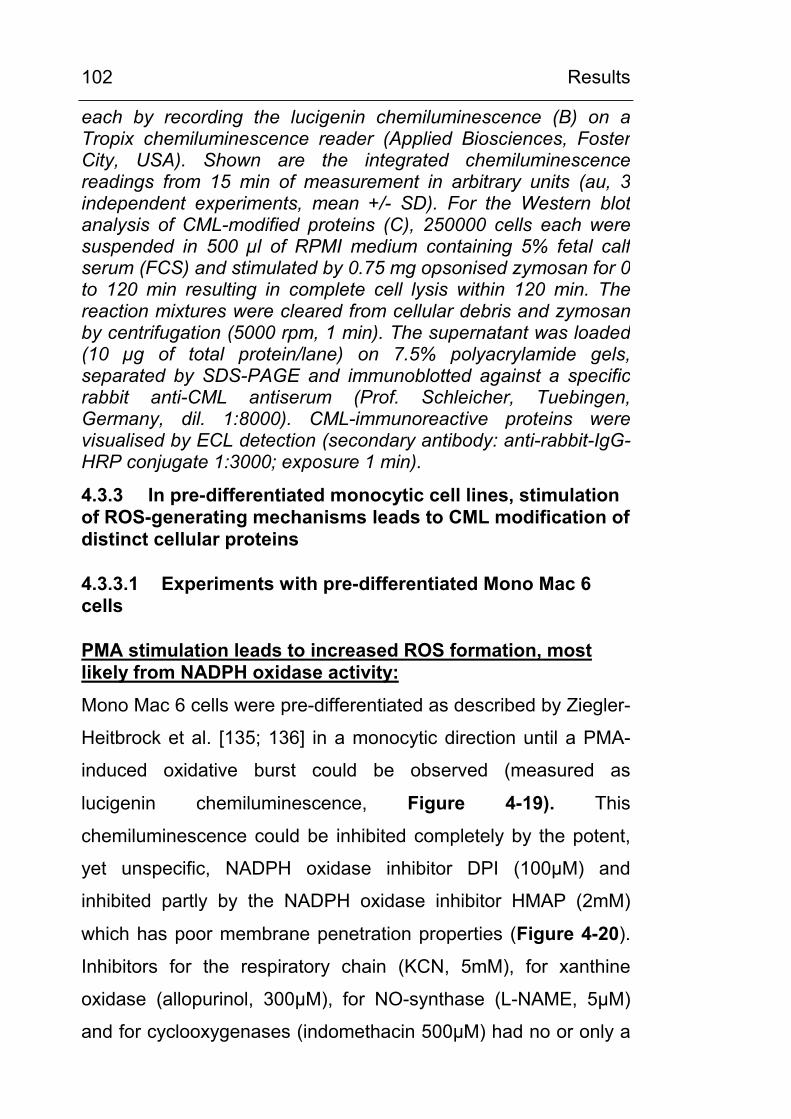
Results
102
each by recording the lucigenin chemiluminescence (B) on aTropix chemiluminescence reader (Applied Biosciences, FosterCity, USA). Shown are the integrated chemiluminescencereadings from 15 min of measurement in arbitrary units (au, 3 independent experiments, mean +/- SD). For the Western blot analysis of CML-modified proteins (C), 250000 cells each weresuspended in 500 µl of RPMI medium containing 5% fetal calfserum (FCS) and stimulated by 0.75 mg opsonised zymosan for 0 to 120 min resulting in complete cell lysis within 120 min. Thereaction mixtures were cleared from cellular debris and zymosanby centrifugation (5000 rpm, 1 min). The supernatant was loaded(10 µg of total protein/lane) on 7.5% polyacrylamide gels,separated by SDS-PAGE and immunoblotted against a specificrabbit anti-CML antiserum (Prof. Schleicher, Tuebingen,Germany, dil. 1:8000). CML-immunoreactive proteins were visualised by ECL detection (secondary antibody: anti-rabbit-IgG-HRP conjugate 1:3000; exposure 1 min).
4.3.3 In pre-differentiated monocytic cell lines, stimulation of ROS-generating mechanisms leads to CML modification of distinct cellular proteins
4.3.3.1 Experiments with pre-differentiated Mono Mac 6 cells
PMA stimulation leads to increased ROS formation, most likely from NADPH oxidase activity:
Mono Mac 6 cells were pre-differentiated as described by Ziegler-
Heitbrock et al. [135; 136] in a monocytic direction until a PMA-
induced oxidative burst could be observed (measured as
lucigenin chemiluminescence, Figure 4-19). This
chemiluminescence could be inhibited completely by the potent,
yet unspecific, NADPH oxidase inhibitor DPI (100µM) and
inhibited partly by the NADPH oxidase inhibitor HMAP (2mM)
which has poor membrane penetration properties (Figure 4-20).
Inhibitors for the respiratory chain (KCN, 5mM), for xanthine
oxidase (allopurinol, 300µM), for NO-synthase (L-NAME, 5µM)
and for cyclooxygenases (indomethacin 500µM) had no or only a
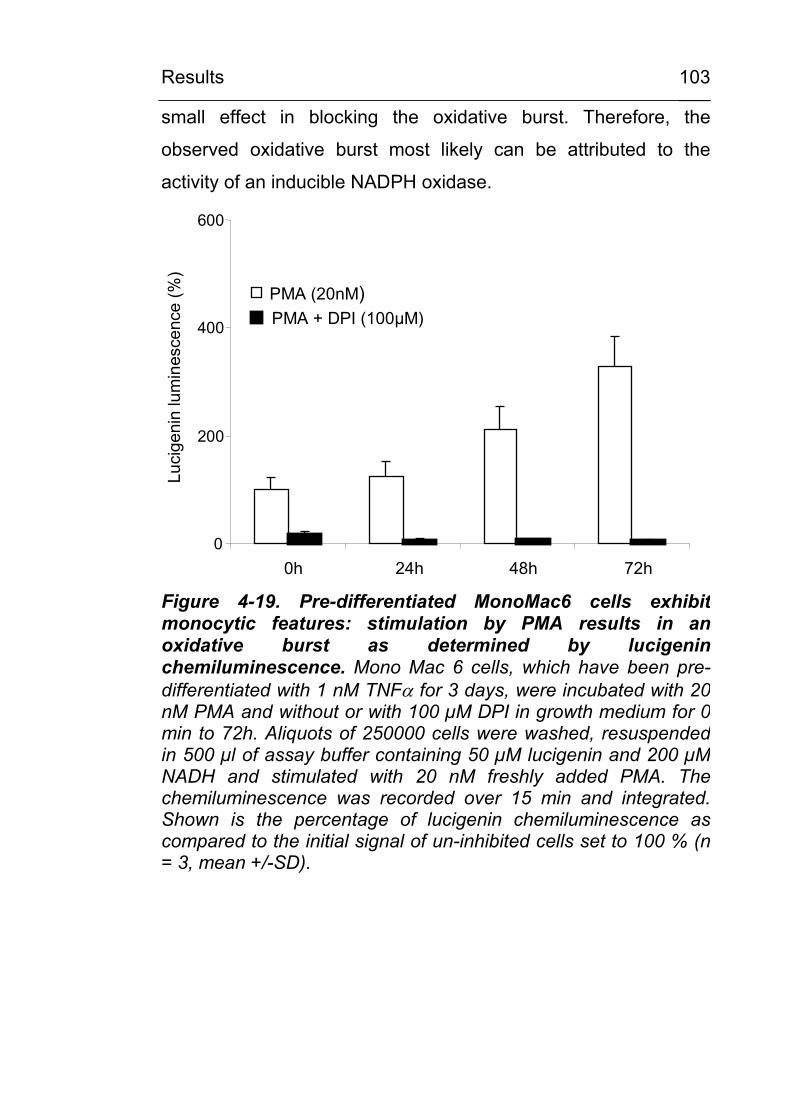
Results
103
small effect in blocking the oxidative burst. Therefore, the
observed oxidative burst most likely can be attributed to the
activity of an inducible NADPH oxidase.
0
200
400
600
0h 24h 48h 72h
Luci
geni
nlu
min
esce
nce
(%)
PMA (20nM)PMA + DPI (100µM)
Figure 4-19. Pre-differentiated MonoMac6 cells exhibitmonocytic features: stimulation by PMA results in anoxidative burst as determined by lucigeninchemiluminescence. Mono Mac 6 cells, which have been pre-differentiated with 1 nM TNFα for 3 days, were incubated with 20 nM PMA and without or with 100 µM DPI in growth medium for 0min to 72h. Aliquots of 250000 cells were washed, resuspendedin 500 µl of assay buffer containing 50 µM lucigenin and 200 µMNADH and stimulated with 20 nM freshly added PMA. Thechemiluminescence was recorded over 15 min and integrated.Shown is the percentage of lucigenin chemiluminescence ascompared to the initial signal of un-inhibited cells set to 100 % (n = 3, mean +/-SD).
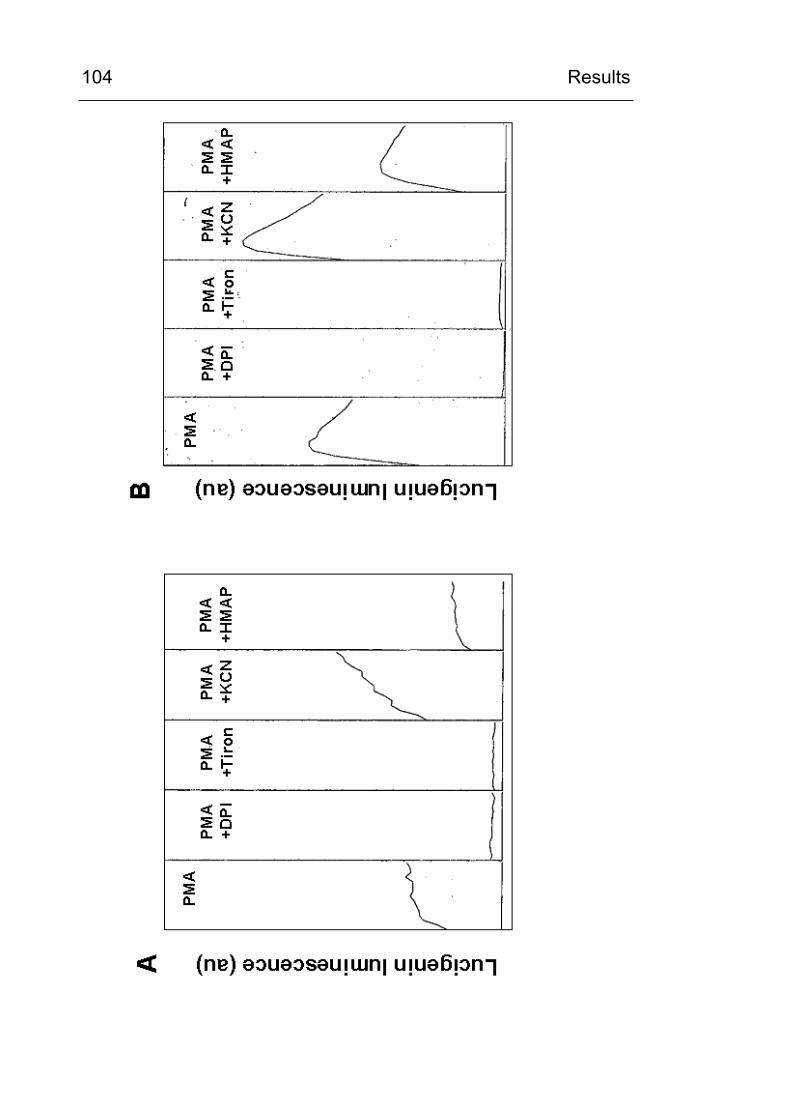
Results
104
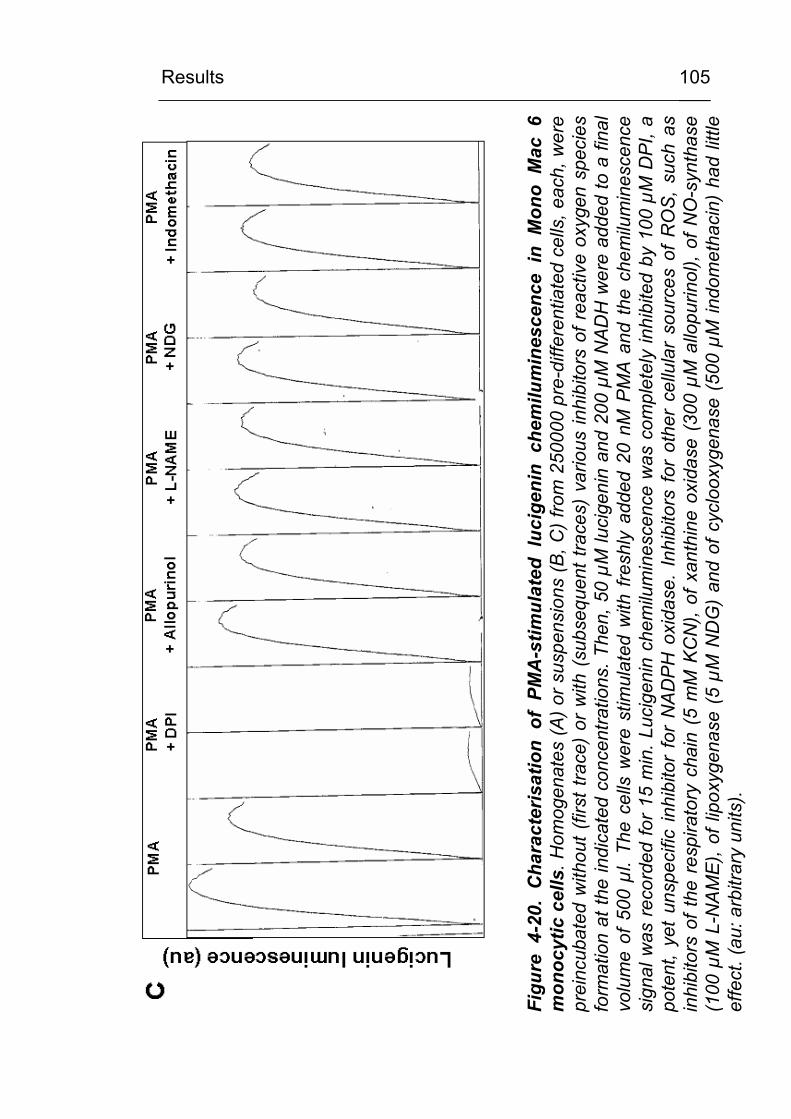
Results
105
Figu
re 4
-20.
Cha
ract
eris
atio
n of
PM
A-s
timul
ated
luc
igen
in c
hem
ilum
ines
cenc
e in
Mon
o M
ac 6
mon
ocyt
ic c
ells
. Hom
ogen
ates
(A) o
r sus
pens
ions
(B, C
) fro
m 2
5000
0 pr
e-di
ffere
ntia
ted
cells
, eac
h, w
ere
prei
ncub
ated
with
out (
first
trac
e) o
r w
ith (
subs
eque
nt tr
aces
) va
rious
inhi
bito
rs o
f rea
ctiv
e ox
ygen
spe
cies
form
atio
n at
the
indi
cate
d co
ncen
tratio
ns. T
hen,
50
µM lu
cige
nin
and
200
µM N
ADH
wer
e ad
ded
to a
fina
lvo
lum
e of
500
µl.
The
cells
wer
e st
imul
ated
with
fres
hly
adde
d 20
nM
PM
A an
d th
e ch
emilu
min
esce
nce
sign
al w
as re
cord
ed fo
r 15
min
. Luc
igen
in c
hem
ilum
ines
cenc
e w
as c
ompl
etel
y in
hibi
ted
by 1
00 µ
M D
PI, a
pote
nt,
yet
unsp
ecifi
c in
hibi
tor
for
NAD
PH o
xida
se.
Inhi
bito
rs f
or o
ther
cel
lula
r so
urce
s of
RO
S, s
uch
asin
hibi
tors
of t
he r
espi
rato
ry c
hain
(5
mM
KC
N),
of x
anth
ine
oxid
ase
(300
µM
allo
purin
ol),
of N
O-s
ynth
ase
(100
µM
L-N
AME)
, of l
ipox
ygen
ase
(5 µ
M N
DG
) an
d of
cyc
loox
ygen
ase
(500
µM
indo
met
haci
n) h
ad li
ttle
effe
ct. (
au: a
rbitr
ary
units
).
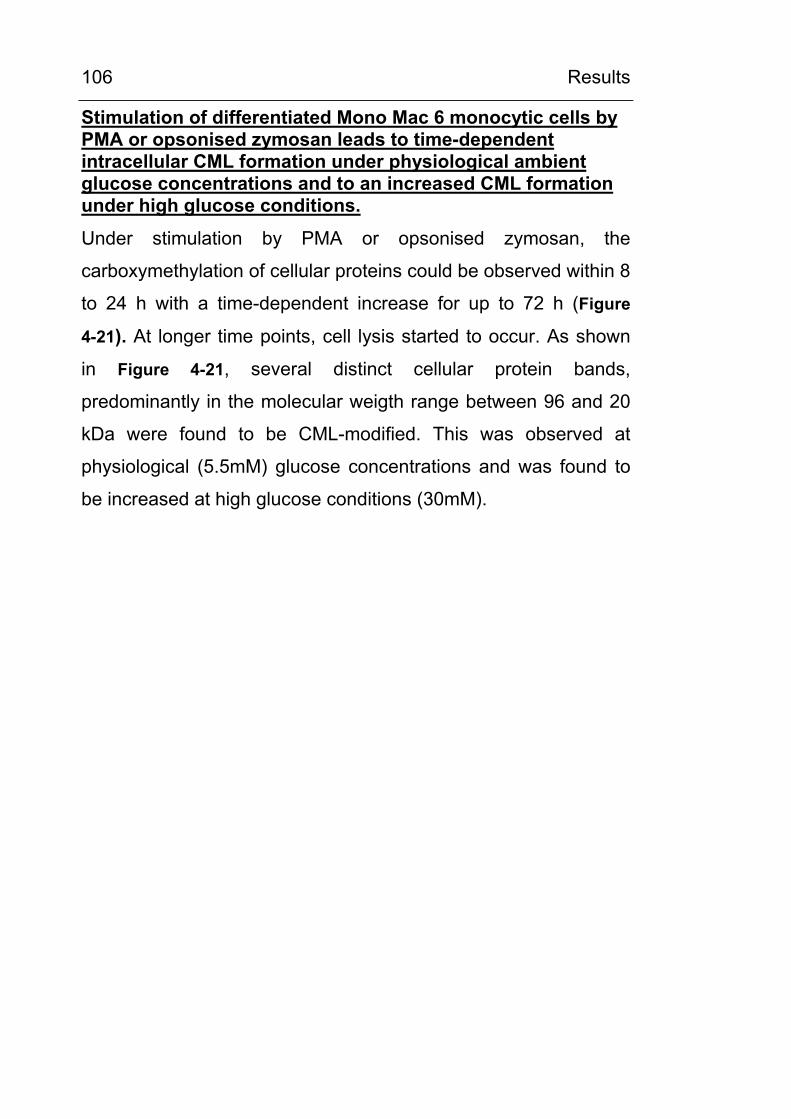
Results
106
Stimulation of differentiated Mono Mac 6 monocytic cells by PMA or opsonised zymosan leads to time-dependent intracellular CML formation under physiological ambient glucose concentrations and to an increased CML formation under high glucose conditions.
Under stimulation by PMA or opsonised zymosan, the
carboxymethylation of cellular proteins could be observed within 8
to 24 h with a time-dependent increase for up to 72 h (Figure
4-21). At longer time points, cell lysis started to occur. As shown
in Figure 4-21, several distinct cellular protein bands,
predominantly in the molecular weigth range between 96 and 20
kDa were found to be CML-modified. This was observed at
physiological (5.5mM) glucose concentrations and was found to
be increased at high glucose conditions (30mM).
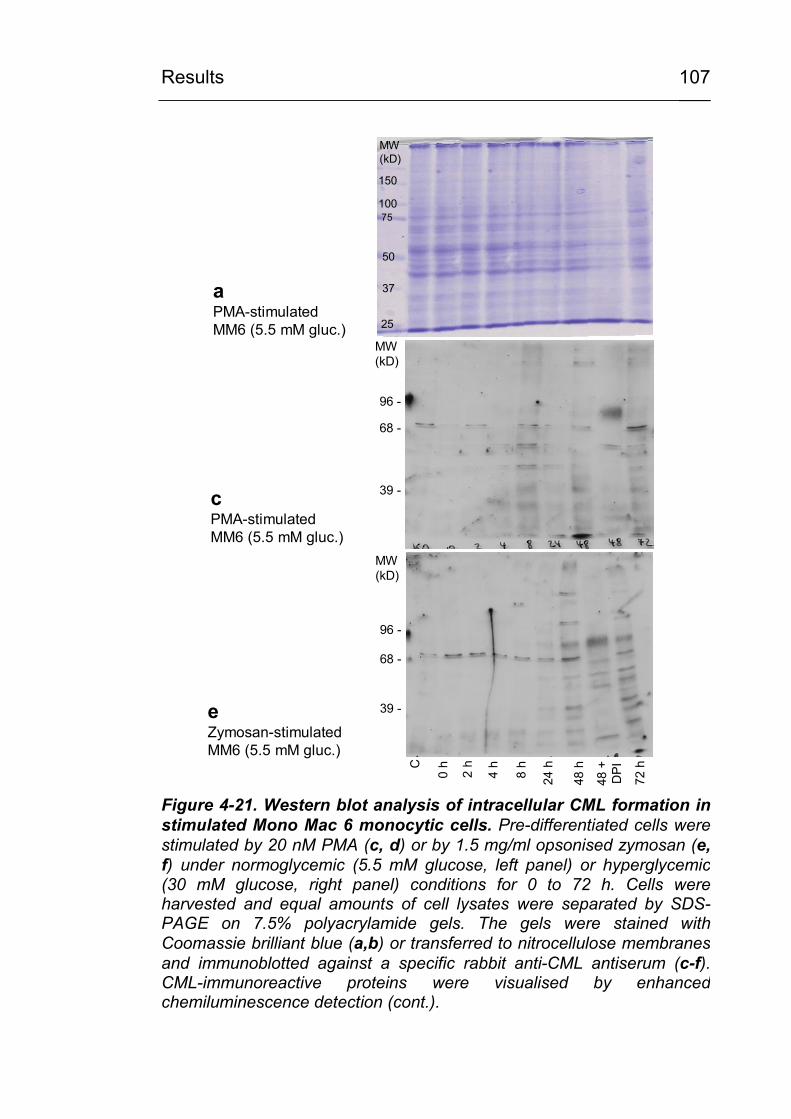
Results
107
75
150
MW(kD)
150
100
50
37
25
75
a PMA-stimulatedMM6 (5.5 mM gluc.)
C
0 h
2 h
4 h
8 h
24 h
48 h
72 h
48 +
D
PI96 -
68 -
39 -
MW(kD)
e Zymosan-stimulatedMM6 (5.5 mM gluc.)
96 -
68 -
39 -
MW(kD)
c PMA-stimulatedMM6 (5.5 mM gluc.)
Figure 4-21. Western blot analysis of intracellular CML formation instimulated Mono Mac 6 monocytic cells. Pre-differentiated cells were stimulated by 20 nM PMA (c, d) or by 1.5 mg/ml opsonised zymosan (e, f) under normoglycemic (5.5 mM glucose, left panel) or hyperglycemic(30 mM glucose, right panel) conditions for 0 to 72 h. Cells wereharvested and equal amounts of cell lysates were separated by SDS-PAGE on 7.5% polyacrylamide gels. The gels were stained with Coomassie brilliant blue (a,b) or transferred to nitrocellulose membranesand immunoblotted against a specific rabbit anti-CML antiserum (c-f). CML-immunoreactive proteins were visualised by enhancedchemiluminescence detection (cont.).
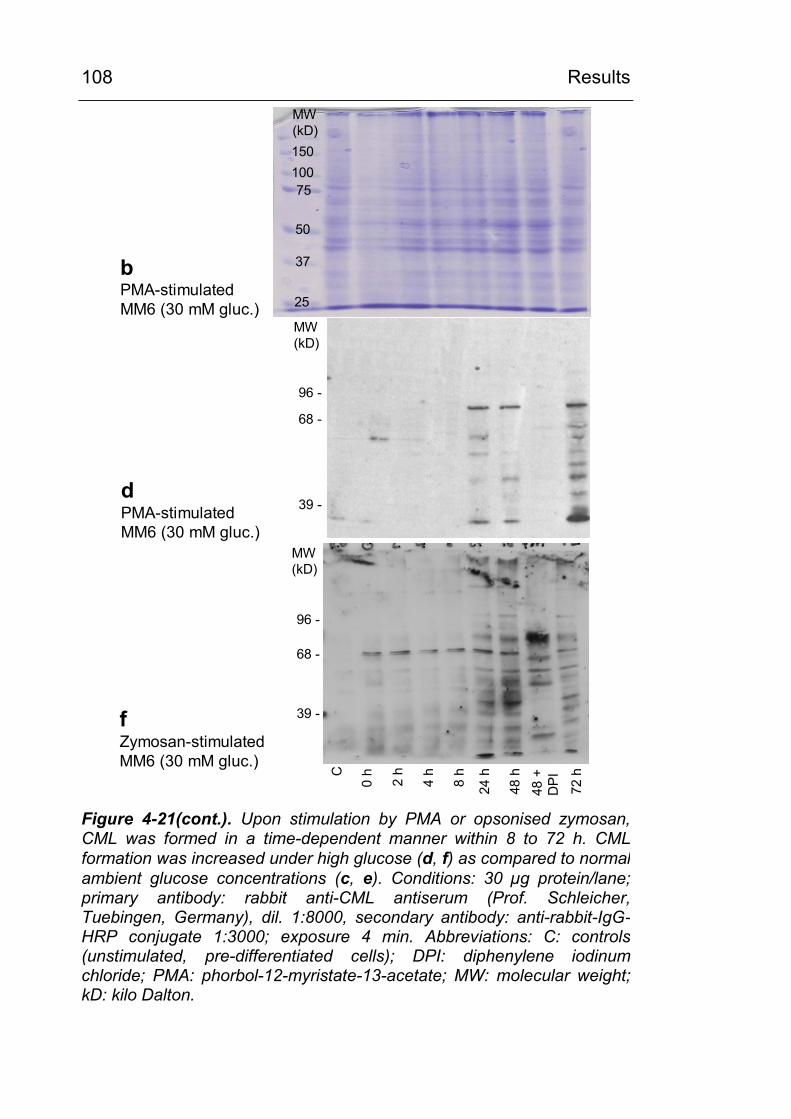
Results
108
96 -
68 -
39 -
MW(kD)
C
0 h
2 h
4 h
8 h
24 h
48 h
72 h
48 +
D
PI
96 -
68 -
39 -
MW(kD)
f Zymosan-stimulatedMM6 (30 mM gluc.)
d PMA-stimulatedMM6 (30 mM gluc.)
150100
50
37
25
MW(kD)
75
bPMA-stimulatedMM6 (30 mM gluc.)
Figure 4-21(cont.). Upon stimulation by PMA or opsonised zymosan,CML was formed in a time-dependent manner within 8 to 72 h. CMLformation was increased under high glucose (d, f) as compared to normal ambient glucose concentrations (c, e). Conditions: 30 µg protein/lane; primary antibody: rabbit anti-CML antiserum (Prof. Schleicher, Tuebingen, Germany), dil. 1:8000, secondary antibody: anti-rabbit-IgG-HRP conjugate 1:3000; exposure 4 min. Abbreviations: C: controls (unstimulated, pre-differentiated cells); DPI: diphenylene iodinumchloride; PMA: phorbol-12-myristate-13-acetate; MW: molecular weight; kD: kilo Dalton.
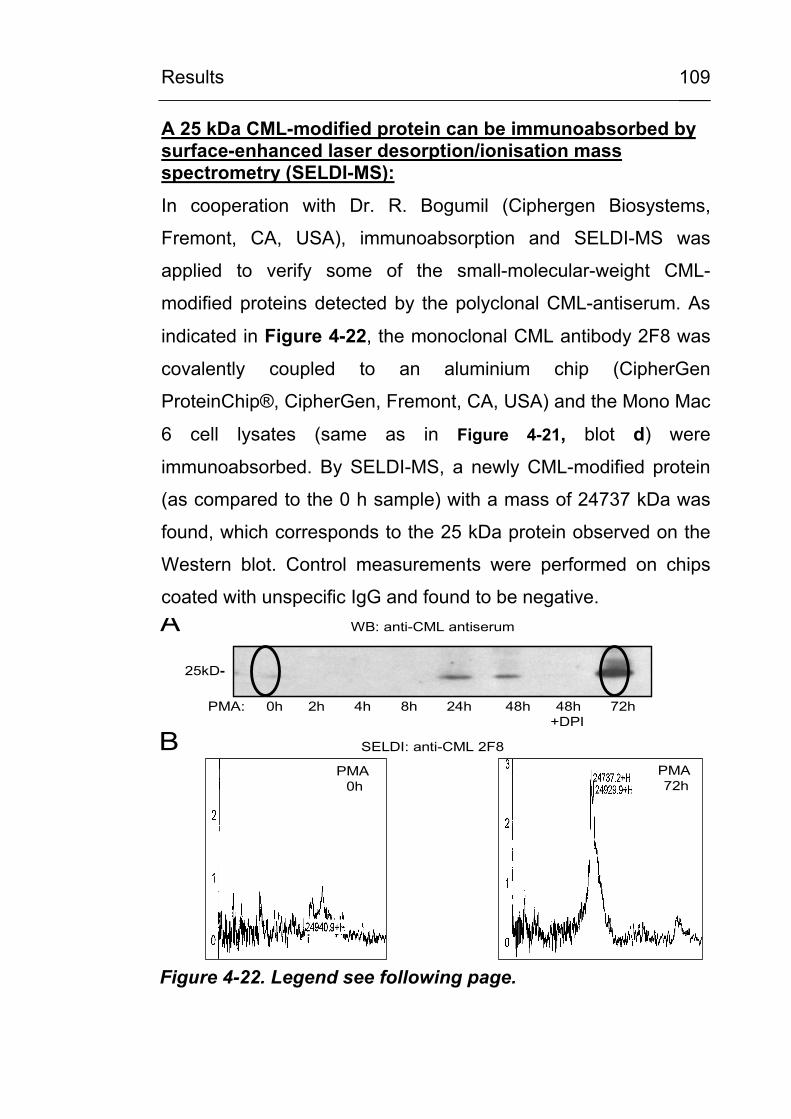
Results
109
A 25 kDa CML-modified protein can be immunoabsorbed by surface-enhanced laser desorption/ionisation mass spectrometry (SELDI-MS):
In cooperation with Dr. R. Bogumil (Ciphergen Biosystems,
Fremont, CA, USA), immunoabsorption and SELDI-MS was
applied to verify some of the small-molecular-weight CML-
modified proteins detected by the polyclonal CML-antiserum. As
indicated in Figure 4-22, the monoclonal CML antibody 2F8 was
covalently coupled to an aluminium chip (CipherGen
ProteinChip®, CipherGen, Fremont, CA, USA) and the Mono Mac
6 cell lysates (same as in Figure 4-21, blot d) were
immunoabsorbed. By SELDI-MS, a newly CML-modified protein
(as compared to the 0 h sample) with a mass of 24737 kDa was
found, which corresponds to the 25 kDa protein observed on the
Western blot. Control measurements were performed on chips
coated with unspecific IgG and found to be negative.
PMA: 0h 2h 4h 8h 24h 48h 48h 72h +DPI
25kD-
A WB: anti-CML antiserum
BPMA
0hPMA 72h
SELDI: anti-CML 2F8
Figure 4-22. Legend see following page.
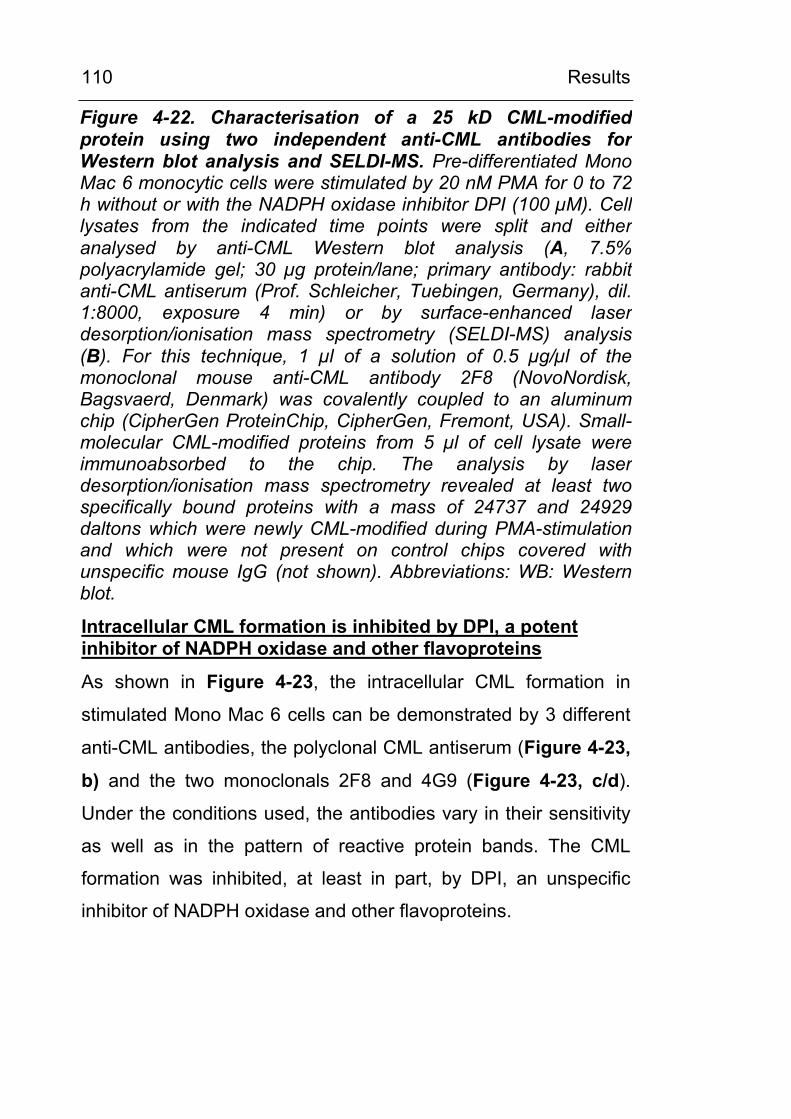
Results
110
Figure 4-22. Characterisation of a 25 kD CML-modified protein using two independent anti-CML antibodies for Western blot analysis and SELDI-MS. Pre-differentiated Mono Mac 6 monocytic cells were stimulated by 20 nM PMA for 0 to 72h without or with the NADPH oxidase inhibitor DPI (100 µM). Celllysates from the indicated time points were split and eitheranalysed by anti-CML Western blot analysis (A, 7.5% polyacrylamide gel; 30 µg protein/lane; primary antibody: rabbitanti-CML antiserum (Prof. Schleicher, Tuebingen, Germany), dil.1:8000, exposure 4 min) or by surface-enhanced laser desorption/ionisation mass spectrometry (SELDI-MS) analysis (B). For this technique, 1 µl of a solution of 0.5 µg/µl of themonoclonal mouse anti-CML antibody 2F8 (NovoNordisk, Bagsvaerd, Denmark) was covalently coupled to an aluminumchip (CipherGen ProteinChip, CipherGen, Fremont, USA). Small-molecular CML-modified proteins from 5 µl of cell lysate wereimmunoabsorbed to the chip. The analysis by laserdesorption/ionisation mass spectrometry revealed at least twospecifically bound proteins with a mass of 24737 and 24929daltons which were newly CML-modified during PMA-stimulation and which were not present on control chips covered withunspecific mouse IgG (not shown). Abbreviations: WB: Western blot.
Intracellular CML formation is inhibited by DPI, a potent inhibitor of NADPH oxidase and other flavoproteins
As shown in Figure 4-23, the intracellular CML formation in
stimulated Mono Mac 6 cells can be demonstrated by 3 different
anti-CML antibodies, the polyclonal CML antiserum (Figure 4-23,
b) and the two monoclonals 2F8 and 4G9 (Figure 4-23, c/d).
Under the conditions used, the antibodies vary in their sensitivity
as well as in the pattern of reactive protein bands. The CML
formation was inhibited, at least in part, by DPI, an unspecific
inhibitor of NADPH oxidase and other flavoproteins.
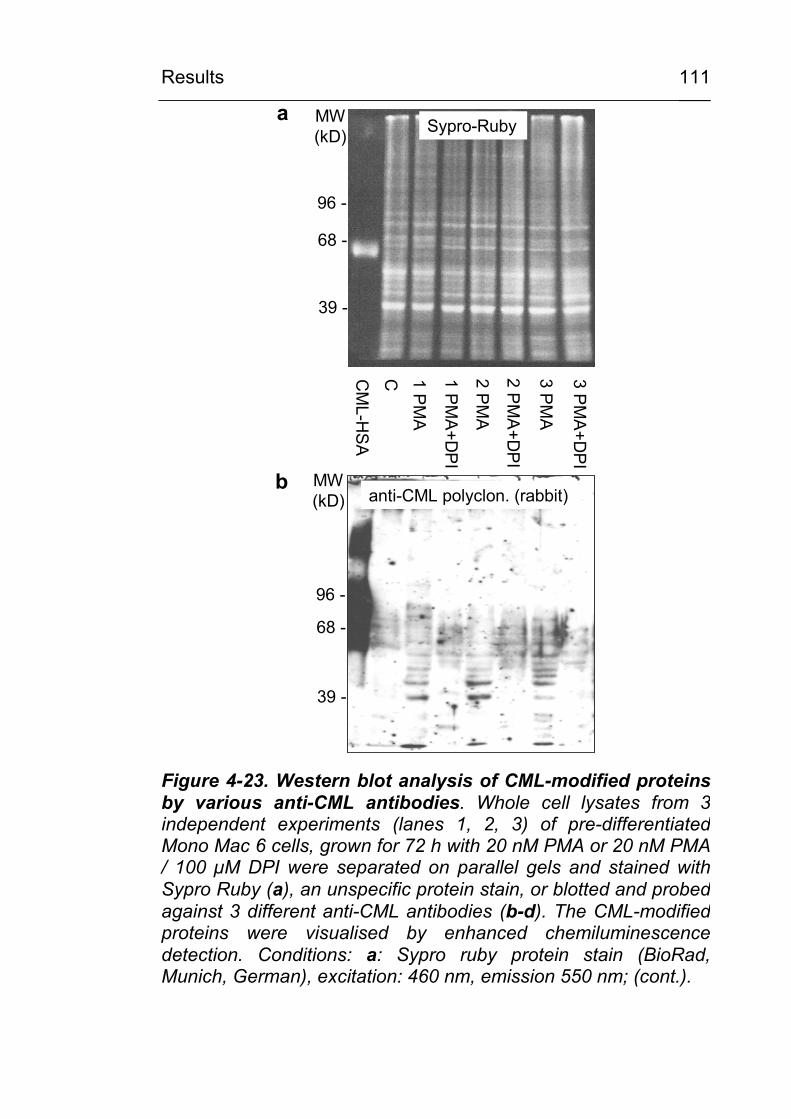
Results
111
CM
L-HS
A
C 1 PM
A
1 PM
A+D
PI
2 PM
A
3 PM
A
2 PM
A+D
PI
3 PM
A+D
PI
Sypro-Ruby
96 -
68 -
39 -
a MW(kD)
anti-CML polyclon. (rabbit)
96 -
68 -
39 -
b MW(kD)
Figure 4-23. Western blot analysis of CML-modified proteins by various anti-CML antibodies. Whole cell lysates from 3 independent experiments (lanes 1, 2, 3) of pre-differentiated Mono Mac 6 cells, grown for 72 h with 20 nM PMA or 20 nM PMA / 100 µM DPI were separated on parallel gels and stained withSypro Ruby (a), an unspecific protein stain, or blotted and probedagainst 3 different anti-CML antibodies (b-d). The CML-modified proteins were visualised by enhanced chemiluminescence detection. Conditions: a: Sypro ruby protein stain (BioRad,Munich, German), excitation: 460 nm, emission 550 nm; (cont.).
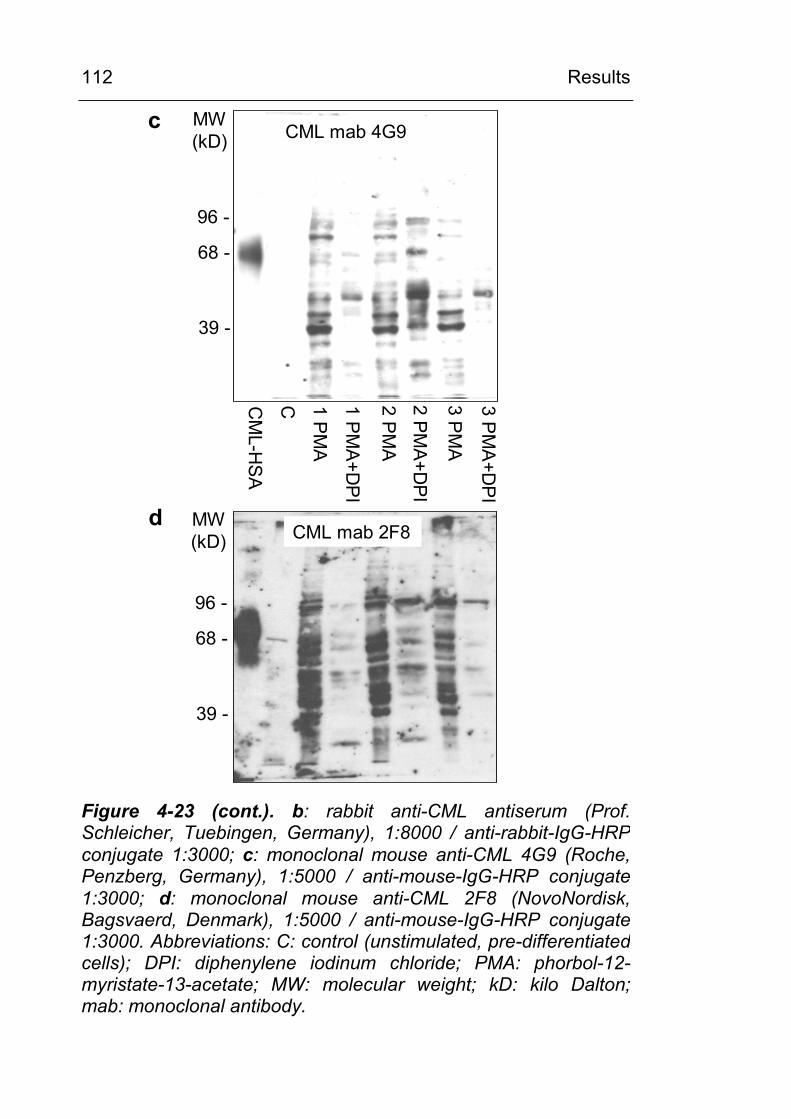
Results
112
CM
L-HS
A
C 1 PM
A
1 PM
A+D
PI
2 PM
A
3 PM
A
2 PM
A+D
PI
3 PM
A+D
PI
CML mab 4G9c
96 -
68 -
39 -
MW(kD)
CML mab 2F8
96 -
68 -
39 -
d MW(kD)
Figure 4-23 (cont.). b: rabbit anti-CML antiserum (Prof. Schleicher, Tuebingen, Germany), 1:8000 / anti-rabbit-IgG-HRP conjugate 1:3000; c: monoclonal mouse anti-CML 4G9 (Roche, Penzberg, Germany), 1:5000 / anti-mouse-IgG-HRP conjugate 1:3000; d: monoclonal mouse anti-CML 2F8 (NovoNordisk, Bagsvaerd, Denmark), 1:5000 / anti-mouse-IgG-HRP conjugate 1:3000. Abbreviations: C: control (unstimulated, pre-differentiated cells); DPI: diphenylene iodinum chloride; PMA: phorbol-12-myristate-13-acetate; MW: molecular weight; kD: kilo Dalton; mab: monoclonal antibody.
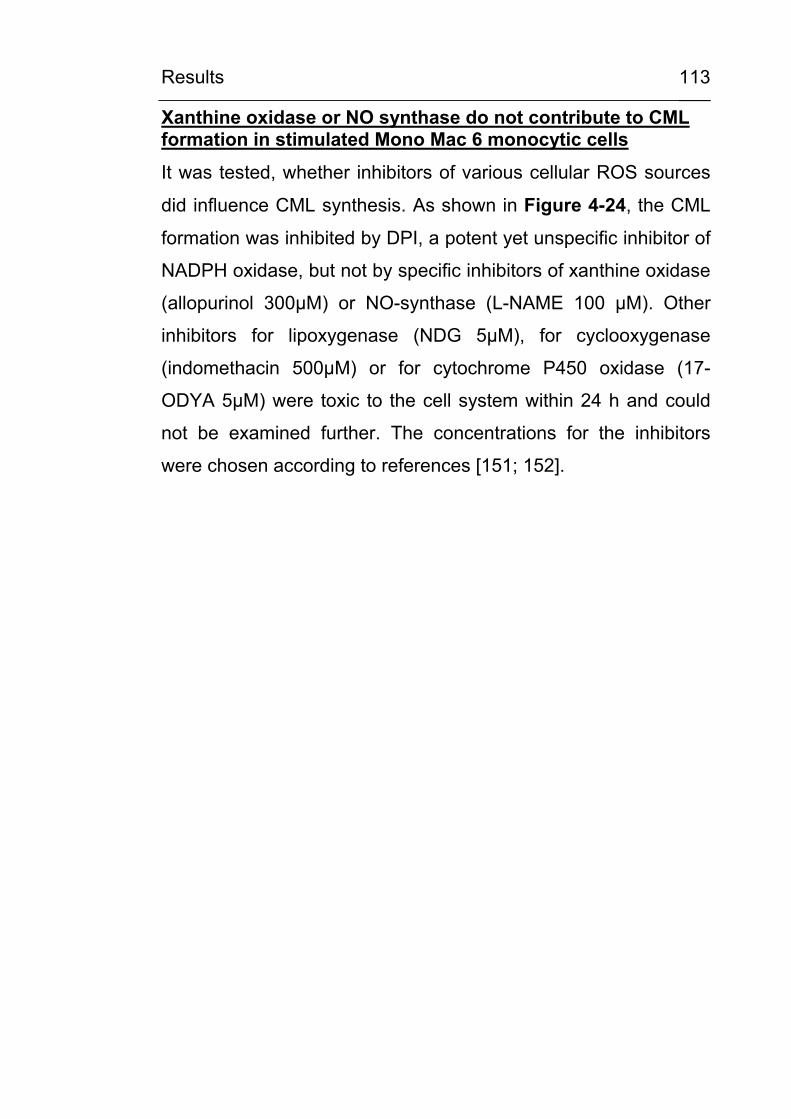
Results
113
Xanthine oxidase or NO synthase do not contribute to CML formation in stimulated Mono Mac 6 monocytic cells
It was tested, whether inhibitors of various cellular ROS sources
did influence CML synthesis. As shown in Figure 4-24, the CML
formation was inhibited by DPI, a potent yet unspecific inhibitor of
NADPH oxidase, but not by specific inhibitors of xanthine oxidase
(allopurinol 300µM) or NO-synthase (L-NAME 100 µM). Other
inhibitors for lipoxygenase (NDG 5µM), for cyclooxygenase
(indomethacin 500µM) or for cytochrome P450 oxidase (17-
ODYA 5µM) were toxic to the cell system within 24 h and could
not be examined further. The concentrations for the inhibitors
were chosen according to references [151; 152].
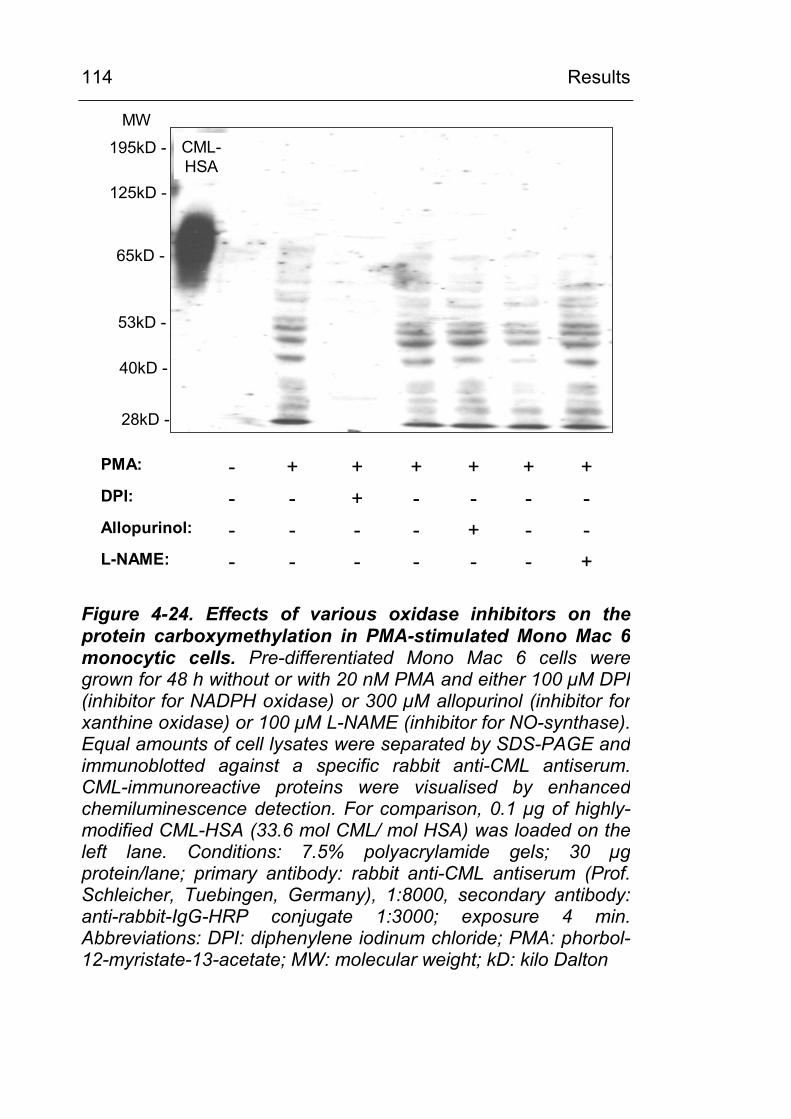
Results
114
+------L-NAME:--+----Allopurinol:----+--DPI:++++++-PMA:
CML-HSA
125kD -
65kD -
28kD -
40kD -
195kD -
53kD -
MW
Figure 4-24. Effects of various oxidase inhibitors on theprotein carboxymethylation in PMA-stimulated Mono Mac 6 monocytic cells. Pre-differentiated Mono Mac 6 cells weregrown for 48 h without or with 20 nM PMA and either 100 µM DPI(inhibitor for NADPH oxidase) or 300 µM allopurinol (inhibitor forxanthine oxidase) or 100 µM L-NAME (inhibitor for NO-synthase). Equal amounts of cell lysates were separated by SDS-PAGE and immunoblotted against a specific rabbit anti-CML antiserum. CML-immunoreactive proteins were visualised by enhancedchemiluminescence detection. For comparison, 0.1 µg of highly-modified CML-HSA (33.6 mol CML/ mol HSA) was loaded on theleft lane. Conditions: 7.5% polyacrylamide gels; 30 µgprotein/lane; primary antibody: rabbit anti-CML antiserum (Prof. Schleicher, Tuebingen, Germany), 1:8000, secondary antibody: anti-rabbit-IgG-HRP conjugate 1:3000; exposure 4 min.Abbreviations: DPI: diphenylene iodinum chloride; PMA: phorbol-12-myristate-13-acetate; MW: molecular weight; kD: kilo Dalton
Results
115
4.3.3.2 Experiments with pre-differentiated PLB 985 and PLB 985 gp91∆488-497 (NADPH oxidase knock out) monocytic cells
In NADPH oxidase knockout cells, CML formation is not abolished as compared to wild type monocytic cells:
The putative connection between NADPH oxidase activity and
protein carboxymethylation was investigated further using the
leukemia cell line PLB 985 for which a NADPH oxidase knock out
mutant gp91∆488-497 exists [134]. After pre-differentiation with
50 nM 1,25-(OH)2-vitamin D3 according to the protocol of Perkins
et al. [137], the characteristics of monocytic differentiation, such
as adherence and change in morphology, became visible. As
shown in Figure 4-25, a similar time-dependent degree of CML
modification of cellular proteins in both, the wild type control and
the NADPH oxidase knock out mutant was found under
stimulation for 72 h.
Result: The time-dependent carboxymethylation of cellular
proteins in stimulated monocytic cells is NADPH oxidase-
independent.
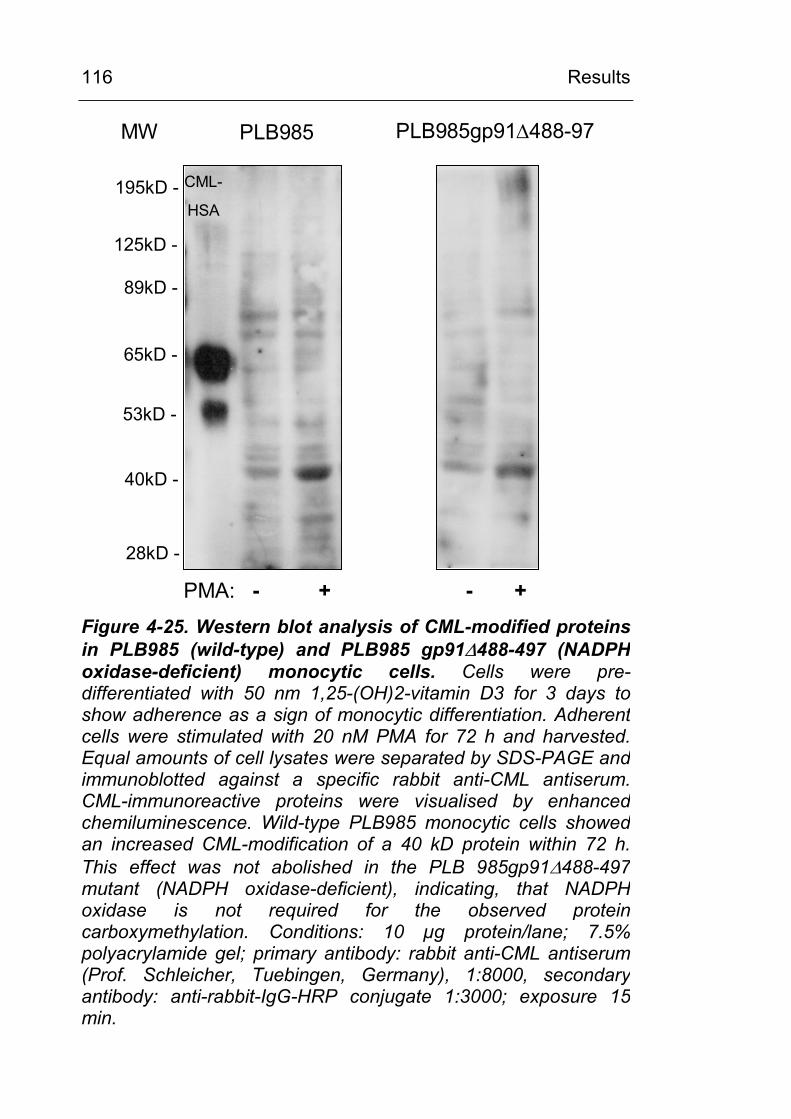
Results
116
125kD -
65kD -
28kD -
40kD -
195kD -
53kD -
89kD -
PLB985 PLB985gp91∆488-97
CML-
HSA
PMA: - + - +
MW
Figure 4-25. Western blot analysis of CML-modified proteins in PLB985 (wild-type) and PLB985 gp91∆488-497 (NADPH oxidase-deficient) monocytic cells. Cells were pre-differentiated with 50 nm 1,25-(OH)2-vitamin D3 for 3 days to show adherence as a sign of monocytic differentiation. Adherent cells were stimulated with 20 nM PMA for 72 h and harvested. Equal amounts of cell lysates were separated by SDS-PAGE and immunoblotted against a specific rabbit anti-CML antiserum. CML-immunoreactive proteins were visualised by enhanced chemiluminescence. Wild-type PLB985 monocytic cells showedan increased CML-modification of a 40 kD protein within 72 h.This effect was not abolished in the PLB 985gp91∆488-497mutant (NADPH oxidase-deficient), indicating, that NADPHoxidase is not required for the observed protein carboxymethylation. Conditions: 10 µg protein/lane; 7.5% polyacrylamide gel; primary antibody: rabbit anti-CML antiserum (Prof. Schleicher, Tuebingen, Germany), 1:8000, secondaryantibody: anti-rabbit-IgG-HRP conjugate 1:3000; exposure 15 min.
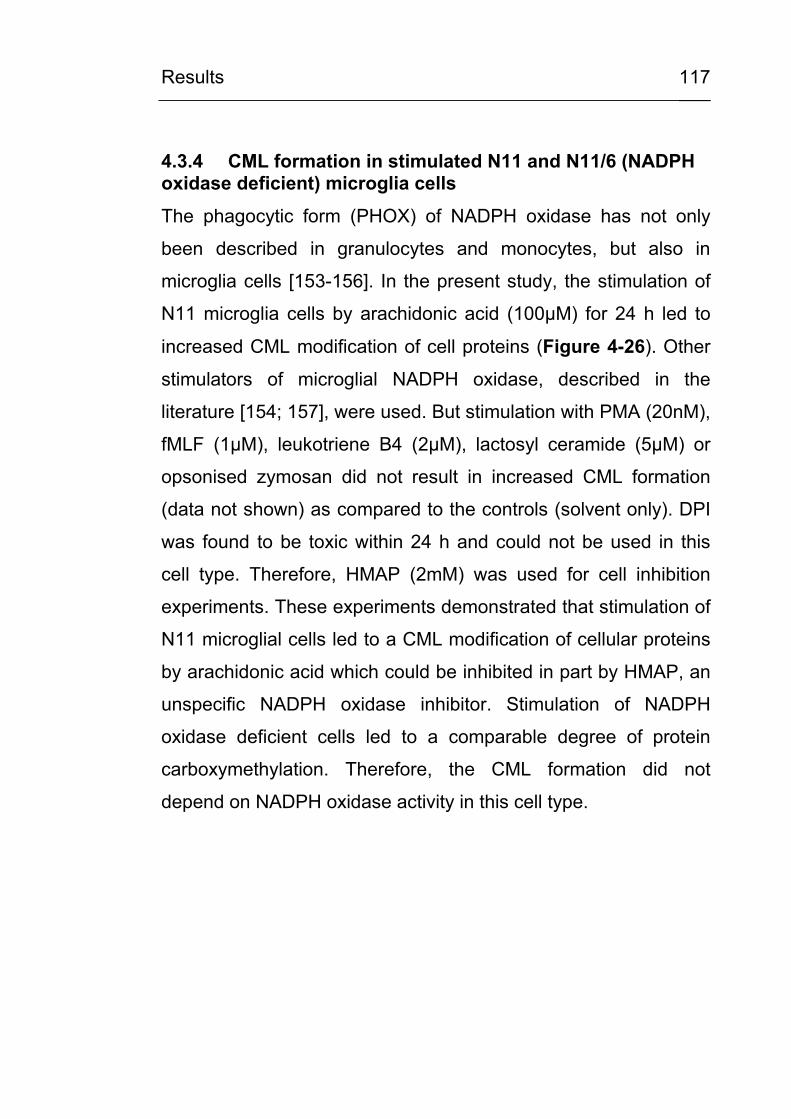
Results
117
4.3.4 CML formation in stimulated N11 and N11/6 (NADPH oxidase deficient) microglia cells
The phagocytic form (PHOX) of NADPH oxidase has not only
been described in granulocytes and monocytes, but also in
microglia cells [153-156]. In the present study, the stimulation of
N11 microglia cells by arachidonic acid (100µM) for 24 h led to
increased CML modification of cell proteins (Figure 4-26). Other
stimulators of microglial NADPH oxidase, described in the
literature [154; 157], were used. But stimulation with PMA (20nM),
fMLF (1µM), leukotriene B4 (2µM), lactosyl ceramide (5µM) or
opsonised zymosan did not result in increased CML formation
(data not shown) as compared to the controls (solvent only). DPI
was found to be toxic within 24 h and could not be used in this
cell type. Therefore, HMAP (2mM) was used for cell inhibition
experiments. These experiments demonstrated that stimulation of
N11 microglial cells led to a CML modification of cellular proteins
by arachidonic acid which could be inhibited in part by HMAP, an
unspecific NADPH oxidase inhibitor. Stimulation of NADPH
oxidase deficient cells led to a comparable degree of protein
carboxymethylation. Therefore, the CML formation did not
depend on NADPH oxidase activity in this cell type.
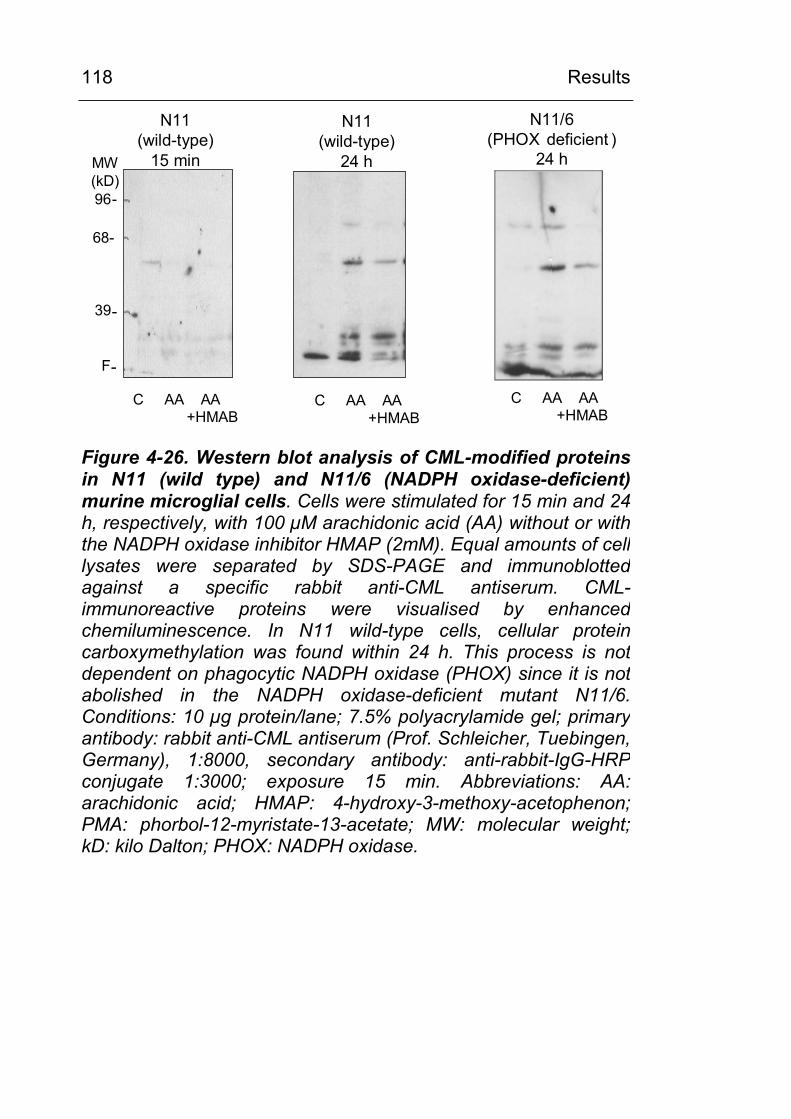
Results
118
C AA AA+HMAB
C AA AA+HMAB
C AA AA+HMAB
N11/6(PHOX deficient )
24 h
96-
39-
F-
68-
N11(wild-type)
15 min
N11(wild-type)
24 hMW(kD)
Figure 4-26. Western blot analysis of CML-modified proteins in N11 (wild type) and N11/6 (NADPH oxidase-deficient) murine microglial cells. Cells were stimulated for 15 min and 24h, respectively, with 100 µM arachidonic acid (AA) without or withthe NADPH oxidase inhibitor HMAP (2mM). Equal amounts of cell lysates were separated by SDS-PAGE and immunoblotted against a specific rabbit anti-CML antiserum. CML-immunoreactive proteins were visualised by enhanced chemiluminescence. In N11 wild-type cells, cellular protein carboxymethylation was found within 24 h. This process is not dependent on phagocytic NADPH oxidase (PHOX) since it is not abolished in the NADPH oxidase-deficient mutant N11/6.Conditions: 10 µg protein/lane; 7.5% polyacrylamide gel; primaryantibody: rabbit anti-CML antiserum (Prof. Schleicher, Tuebingen,Germany), 1:8000, secondary antibody: anti-rabbit-IgG-HRP conjugate 1:3000; exposure 15 min. Abbreviations: AA:arachidonic acid; HMAP: 4-hydroxy-3-methoxy-acetophenon; PMA: phorbol-12-myristate-13-acetate; MW: molecular weight; kD: kilo Dalton; PHOX: NADPH oxidase.
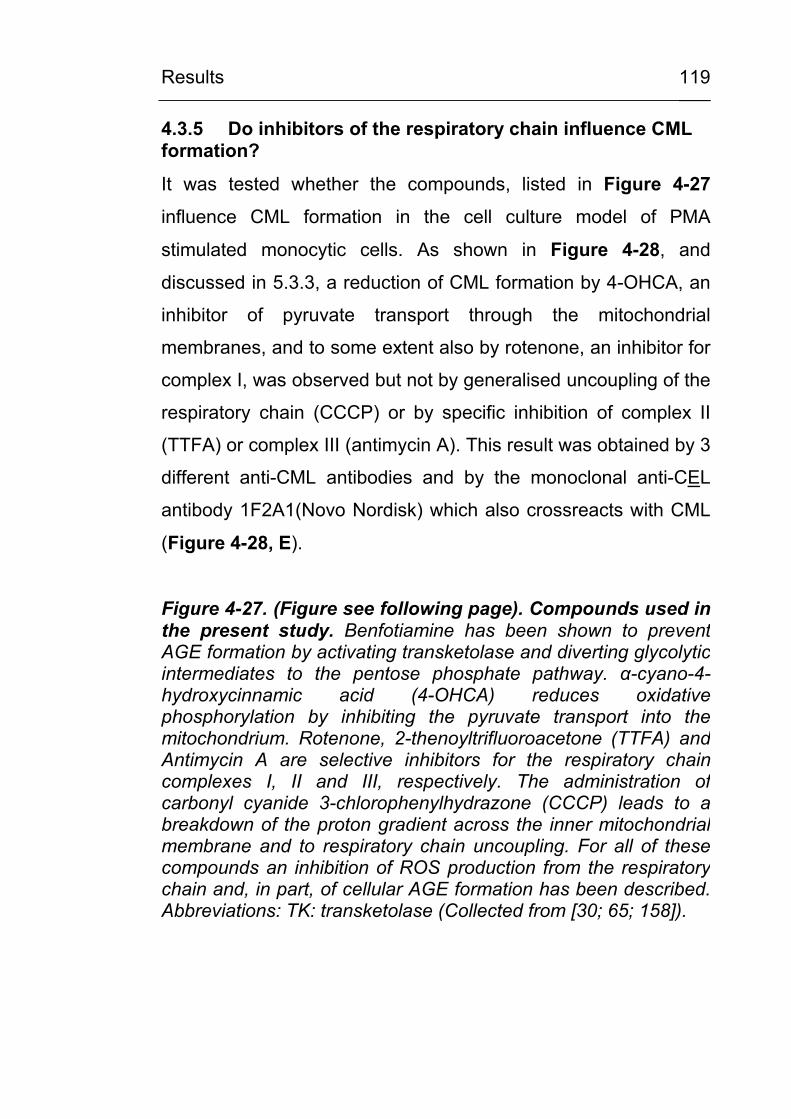
Results
119
4.3.5 Do inhibitors of the respiratory chain influence CML formation?
It was tested whether the compounds, listed in Figure 4-27
influence CML formation in the cell culture model of PMA
stimulated monocytic cells. As shown in Figure 4-28, and
discussed in 5.3.3, a reduction of CML formation by 4-OHCA, an
inhibitor of pyruvate transport through the mitochondrial
membranes, and to some extent also by rotenone, an inhibitor for
complex I, was observed but not by generalised uncoupling of the
respiratory chain (CCCP) or by specific inhibition of complex II
(TTFA) or complex III (antimycin A). This result was obtained by 3
different anti-CML antibodies and by the monoclonal anti-CEL
antibody 1F2A1(Novo Nordisk) which also crossreacts with CML
(Figure 4-28, E).
Figure 4-27. (Figure see following page). Compounds used in the present study. Benfotiamine has been shown to preventAGE formation by activating transketolase and diverting glycolyticintermediates to the pentose phosphate pathway. α-cyano-4-hydroxycinnamic acid (4-OHCA) reduces oxidative phosphorylation by inhibiting the pyruvate transport into themitochondrium. Rotenone, 2-thenoyltrifluoroacetone (TTFA) and Antimycin A are selective inhibitors for the respiratory chaincomplexes I, II and III, respectively. The administration ofcarbonyl cyanide 3-chlorophenylhydrazone (CCCP) leads to a breakdown of the proton gradient across the inner mitochondrialmembrane and to respiratory chain uncoupling. For all of thesecompounds an inhibition of ROS production from the respiratorychain and, in part, of cellular AGE formation has been described.Abbreviations: TK: transketolase (Collected from [30; 65; 158]).

Results
120
CCCP
RotenoneTTFA
Antimycin A
4-OHCA
Benfotiamine
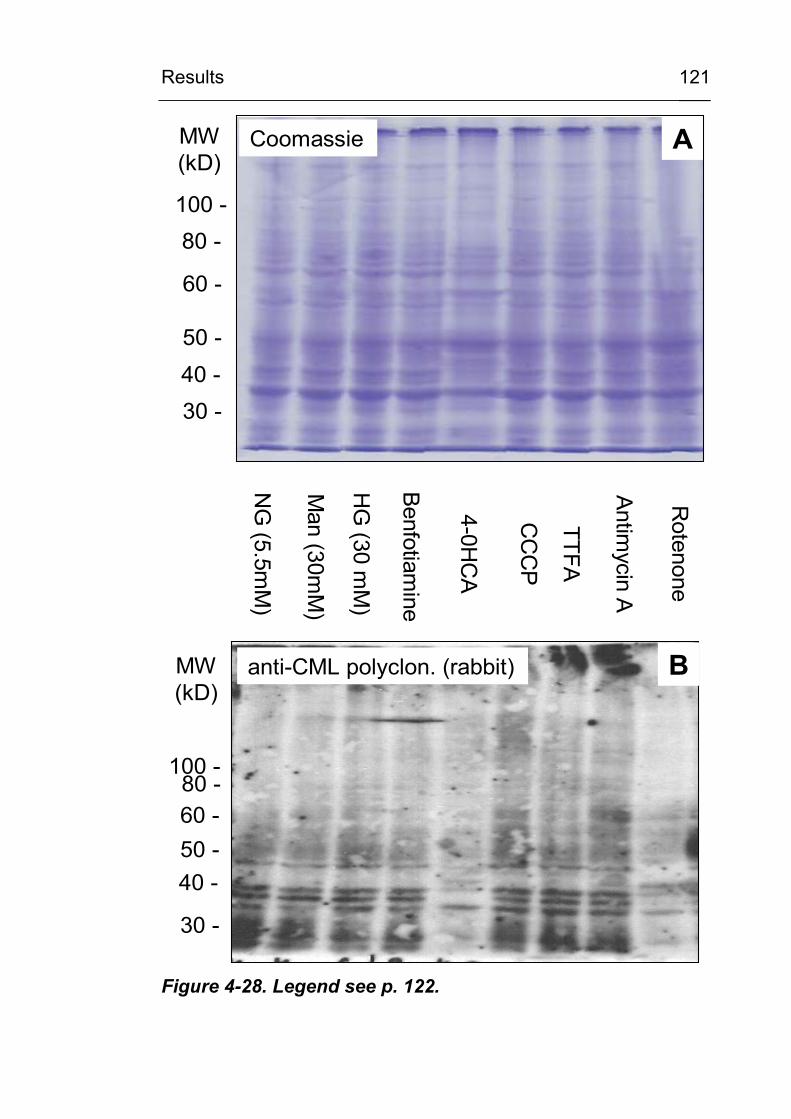
Results
121
Coomassie
80 -
60 -
40 -
100 -
50 -
30 -
anti-CML polyclon. (rabbit)
80 -60 -
40 -
100 -
50 -
30 -
NG
(5.5mM
)
Man (30m
M)
HG
(30 mM
)
Benfotiam
ine
4-0HC
A
TTFA
CC
CP
Antim
ycinA
Rotenone
AMW(kD)
MW(kD)
B
Figure 4-28. Legend see p. 122.
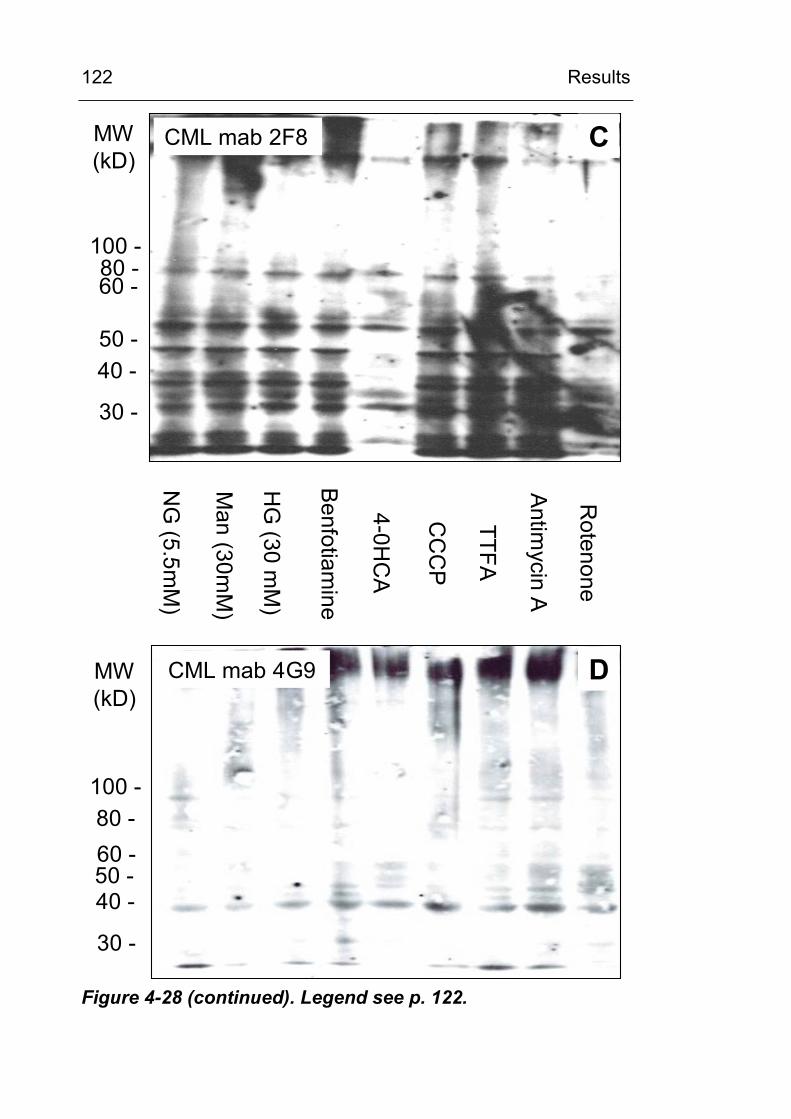
Results
122
80 -60 -
40 -
100 -
50 -
30 -
CML mab 2F8
NG
(5.5mM
)
Man (30m
M)
HG
(30 mM
)
Benfotiam
ine
4-0HC
A
TTFA
CC
CP
Antim
ycinA
Rotenone
80 -60 -
40 -
100 -
50 -
30 -
CML mab 4G9
MW(kD)
MW(kD)
C
D
Figure 4-28 (continued). Legend see p. 122.
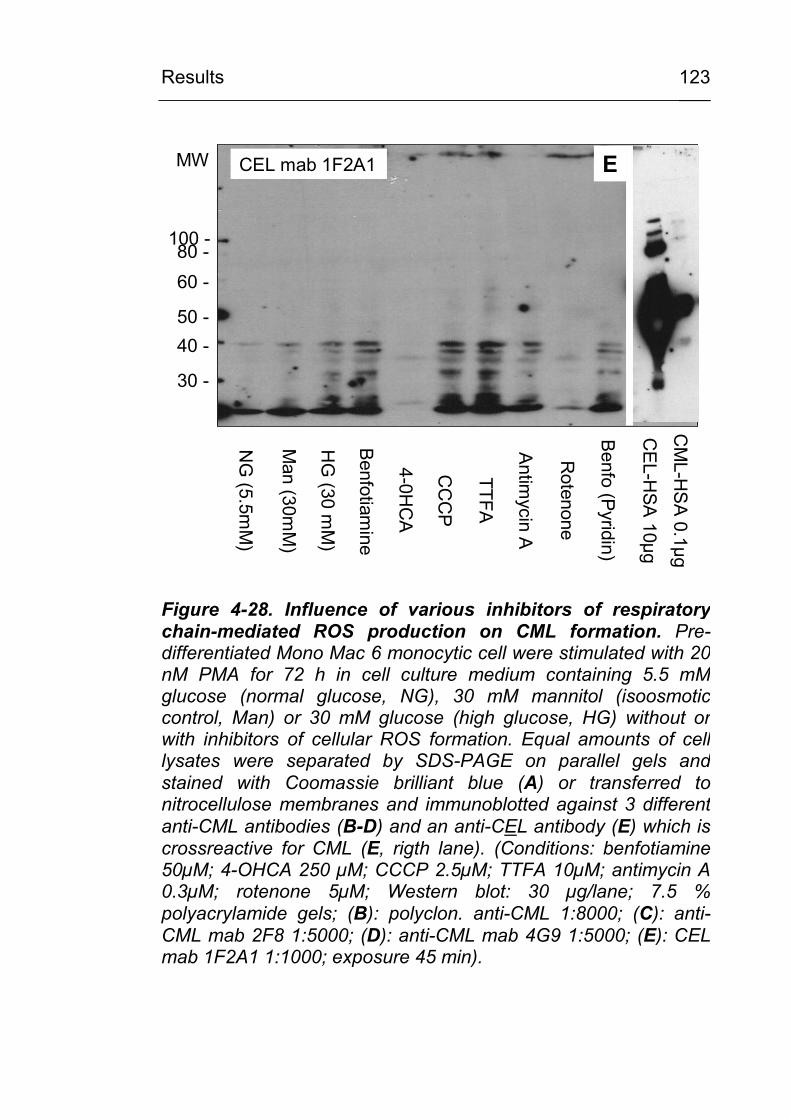
Results
123
80 -60 -
40 -
100 -
50 -
30 -
CEL mab 1F2A1
NG
(5.5mM
)
Man (30m
M)
HG
(30 mM
)
Benfotiamine
4-0HC
A
TTFA
CC
CP
Antim
ycinA
Rotenone
Benfo
(Pyridin)
CE
L-HSA
10µg
CM
L-HS
A 0.1µg
MW E
Figure 4-28. Influence of various inhibitors of respiratorychain-mediated ROS production on CML formation. Pre-differentiated Mono Mac 6 monocytic cell were stimulated with 20nM PMA for 72 h in cell culture medium containing 5.5 mMglucose (normal glucose, NG), 30 mM mannitol (isoosmoticcontrol, Man) or 30 mM glucose (high glucose, HG) without orwith inhibitors of cellular ROS formation. Equal amounts of celllysates were separated by SDS-PAGE on parallel gels and stained with Coomassie brilliant blue (A) or transferred to nitrocellulose membranes and immunoblotted against 3 differentanti-CML antibodies (B-D) and an anti-CEL antibody (E) which is crossreactive for CML (E, rigth lane). (Conditions: benfotiamine50µM; 4-OHCA 250 µM; CCCP 2.5µM; TTFA 10µM; antimycin A 0.3µM; rotenone 5µM; Western blot: 30 µg/lane; 7.5 %polyacrylamide gels; (B): polyclon. anti-CML 1:8000; (C): anti-CML mab 2F8 1:5000; (D): anti-CML mab 4G9 1:5000; (E): CEL mab 1F2A1 1:1000; exposure 45 min).
Results
124
4.3.6 Identification of CML-modified proteins
Two different approaches were employed in order to identify
some of the CML-modified proteins: (a) Immunoabsorption/
immunoprecipitation and (b) 2-D-gel eletrophoresis (IPG-
DALT/SDS-PAGE) of cell lysates with anti-CML Western blot
analysis.
Three different monoclonal CML-antibodies were used:
(1) monoclonal mouse anti-CML-AK 4G9 (obtained from Roche)
(2) monoclonal mouse anti-CML-AK 2F8A (obtained from
NovoNordisk)
(3) the monoclonal mouse anti-CML-AK NF1G (obtained from
Transgenics)
CML antibodies were absorbed or coupled to (1) NHS-sepharose
columns (Amersham Pharmacia Biotech, Freiburg), (2) Protein A-
and G-coated magnetic beads (Dynal, Hamburg), (3) anti-IgG-
coated magnetic beads (Dynal, Hamburg), (4) Spin-column kits
with activated sepharose or with (5) protein A/G-sepharose
without or (6) with covalent crosslinking of the CML-antibodies (all
from Pierce, Bonn), and (7) classic immuno-precipitation with
protein A/G-sepharose. So far, no CML-immunoreactive proteins
could be precipitated. Further work will be required to isolate and
identify these CML-reactive protein bands.
Discussion
125
5 DISCUSSION
5.1 CML excretion in urine
In the present study a specific, reproducible and sensitive HPLC
method for the determination of CML excretion in urine has been
developed [159]. It has been proposed that the measurement of
CML in urine may serve as an integrative biomarker for systemic
oxidative stress [160], since its formation requires oxidative
chemistry and since CML is the chemically best-defined and most
abundant glycoxidation product. Previously, CML in urine has
been measured using immunoassays [161]. Several monoclonal
and polyclonal antibodies have been raised against CML-
modified proteins and peptides and used to measure CML.
However, until now, there has been no universally established
standard or unit of measurement to compare results from different
immunological assays [20; 161]. CML in urine originates from
structurally heterogenous compounds which do not share a well
defined common epitope, ranging from the free monomer CML to
carboxymethylated oligopeptides/polypeptides and proteins [162;
163].
Therefore, the determination of the free modified amino acid CML
using chromatographic separation techniques and synthetic CML
as a defined standard will provide an advantage. Previously,
Knecht et al. have used SIM-GC-MS and (2H8)CML as a
deuterated internal standard to determine CML in urine [164].
Although this method is specific and very precise, it is not widely
available. Drusch et al. [165] had described previously a RP-
HPLC method to determine the total CML content of fresh and
heat-treated food samples. By adapting this method to urine, a
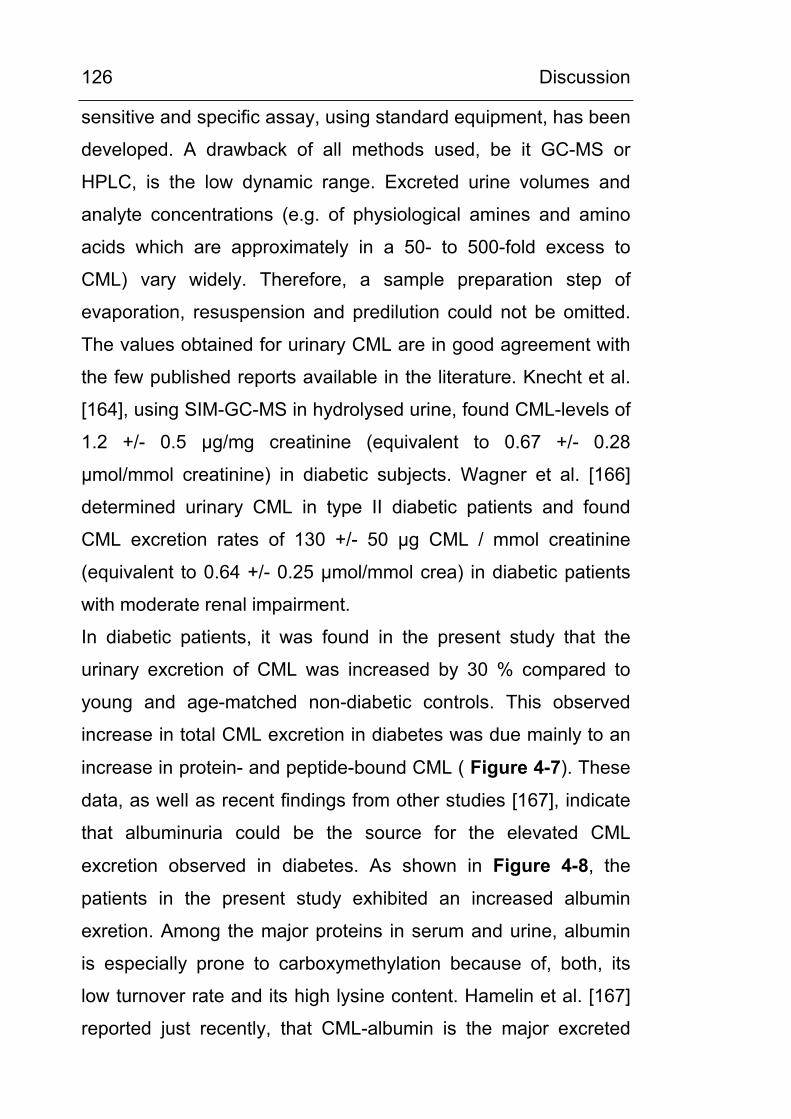
Discussion
126
sensitive and specific assay, using standard equipment, has been
developed. A drawback of all methods used, be it GC-MS or
HPLC, is the low dynamic range. Excreted urine volumes and
analyte concentrations (e.g. of physiological amines and amino
acids which are approximately in a 50- to 500-fold excess to
CML) vary widely. Therefore, a sample preparation step of
evaporation, resuspension and predilution could not be omitted.
The values obtained for urinary CML are in good agreement with
the few published reports available in the literature. Knecht et al.
[164], using SIM-GC-MS in hydrolysed urine, found CML-levels of
1.2 +/- 0.5 µg/mg creatinine (equivalent to 0.67 +/- 0.28
µmol/mmol creatinine) in diabetic subjects. Wagner et al. [166]
determined urinary CML in type II diabetic patients and found
CML excretion rates of 130 +/- 50 µg CML / mmol creatinine
(equivalent to 0.64 +/- 0.25 µmol/mmol crea) in diabetic patients
with moderate renal impairment.
In diabetic patients, it was found in the present study that the
urinary excretion of CML was increased by 30 % compared to
young and age-matched non-diabetic controls. This observed
increase in total CML excretion in diabetes was due mainly to an
increase in protein- and peptide-bound CML ( Figure 4-7). These
data, as well as recent findings from other studies [167], indicate
that albuminuria could be the source for the elevated CML
excretion observed in diabetes. As shown in Figure 4-8, the
patients in the present study exhibited an increased albumin
exretion. Among the major proteins in serum and urine, albumin
is especially prone to carboxymethylation because of, both, its
low turnover rate and its high lysine content. Hamelin et al. [167]
reported just recently, that CML-albumin is the major excreted
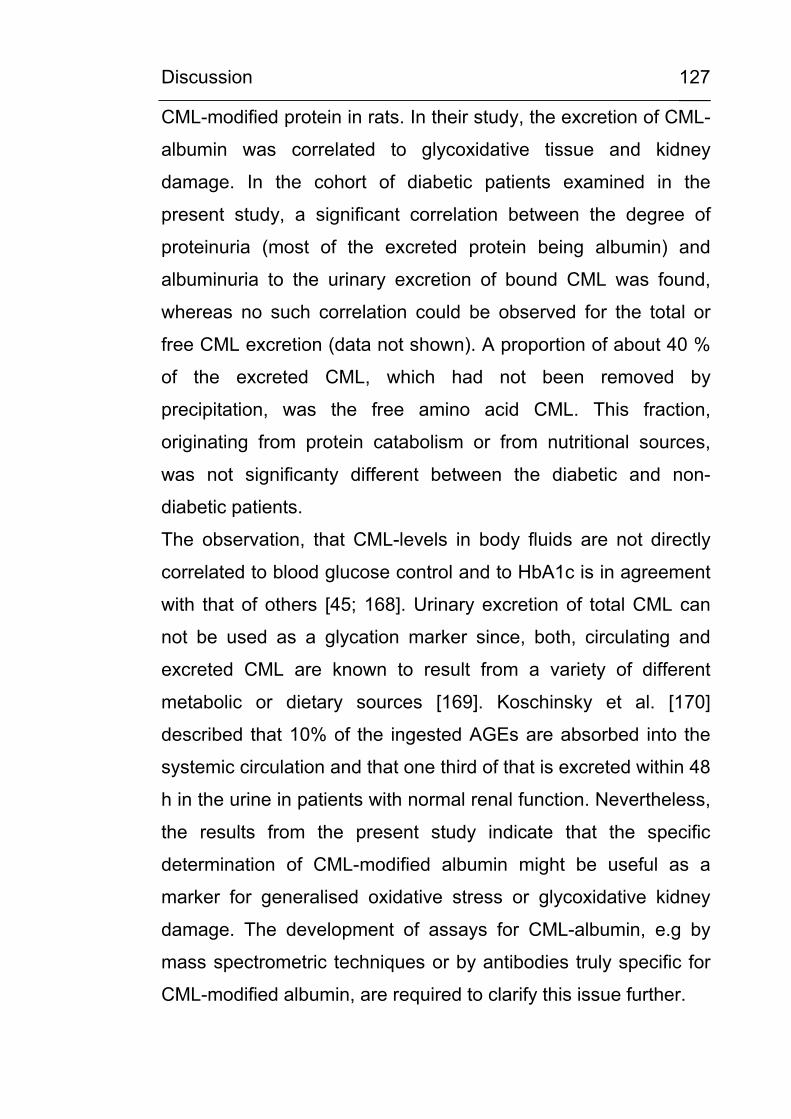
Discussion
127
CML-modified protein in rats. In their study, the excretion of CML-
albumin was correlated to glycoxidative tissue and kidney
damage. In the cohort of diabetic patients examined in the
present study, a significant correlation between the degree of
proteinuria (most of the excreted protein being albumin) and
albuminuria to the urinary excretion of bound CML was found,
whereas no such correlation could be observed for the total or
free CML excretion (data not shown). A proportion of about 40 %
of the excreted CML, which had not been removed by
precipitation, was the free amino acid CML. This fraction,
originating from protein catabolism or from nutritional sources,
was not significanty different between the diabetic and non-
diabetic patients.
The observation, that CML-levels in body fluids are not directly
correlated to blood glucose control and to HbA1c is in agreement
with that of others [45; 168]. Urinary excretion of total CML can
not be used as a glycation marker since, both, circulating and
excreted CML are known to result from a variety of different
metabolic or dietary sources [169]. Koschinsky et al. [170]
described that 10% of the ingested AGEs are absorbed into the
systemic circulation and that one third of that is excreted within 48
h in the urine in patients with normal renal function. Nevertheless,
the results from the present study indicate that the specific
determination of CML-modified albumin might be useful as a
marker for generalised oxidative stress or glycoxidative kidney
damage. The development of assays for CML-albumin, e.g by
mass spectrometric techniques or by antibodies truly specific for
CML-modified albumin, are required to clarify this issue further.
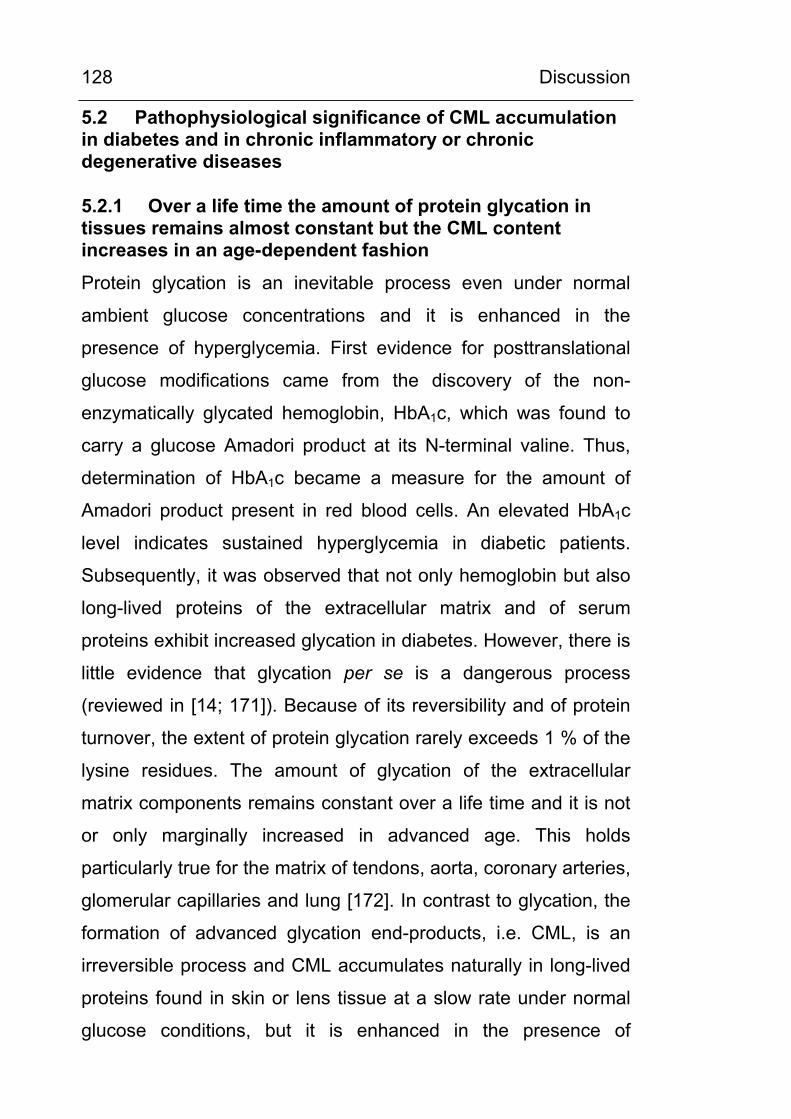
Discussion
128
5.2 Pathophysiological significance of CML accumulation in diabetes and in chronic inflammatory or chronic degenerative diseases
5.2.1 Over a life time the amount of protein glycation in tissues remains almost constant but the CML content increases in an age-dependent fashion
Protein glycation is an inevitable process even under normal
ambient glucose concentrations and it is enhanced in the
presence of hyperglycemia. First evidence for posttranslational
glucose modifications came from the discovery of the non-
enzymatically glycated hemoglobin, HbA1c, which was found to
carry a glucose Amadori product at its N-terminal valine. Thus,
determination of HbA1c became a measure for the amount of
Amadori product present in red blood cells. An elevated HbA1c
level indicates sustained hyperglycemia in diabetic patients.
Subsequently, it was observed that not only hemoglobin but also
long-lived proteins of the extracellular matrix and of serum
proteins exhibit increased glycation in diabetes. However, there is
little evidence that glycation per se is a dangerous process
(reviewed in [14; 171]). Because of its reversibility and of protein
turnover, the extent of protein glycation rarely exceeds 1 % of the
lysine residues. The amount of glycation of the extracellular
matrix components remains constant over a life time and it is not
or only marginally increased in advanced age. This holds
particularly true for the matrix of tendons, aorta, coronary arteries,
glomerular capillaries and lung [172]. In contrast to glycation, the
formation of advanced glycation end-products, i.e. CML, is an
irreversible process and CML accumulates naturally in long-lived
proteins found in skin or lens tissue at a slow rate under normal
glucose conditions, but it is enhanced in the presence of
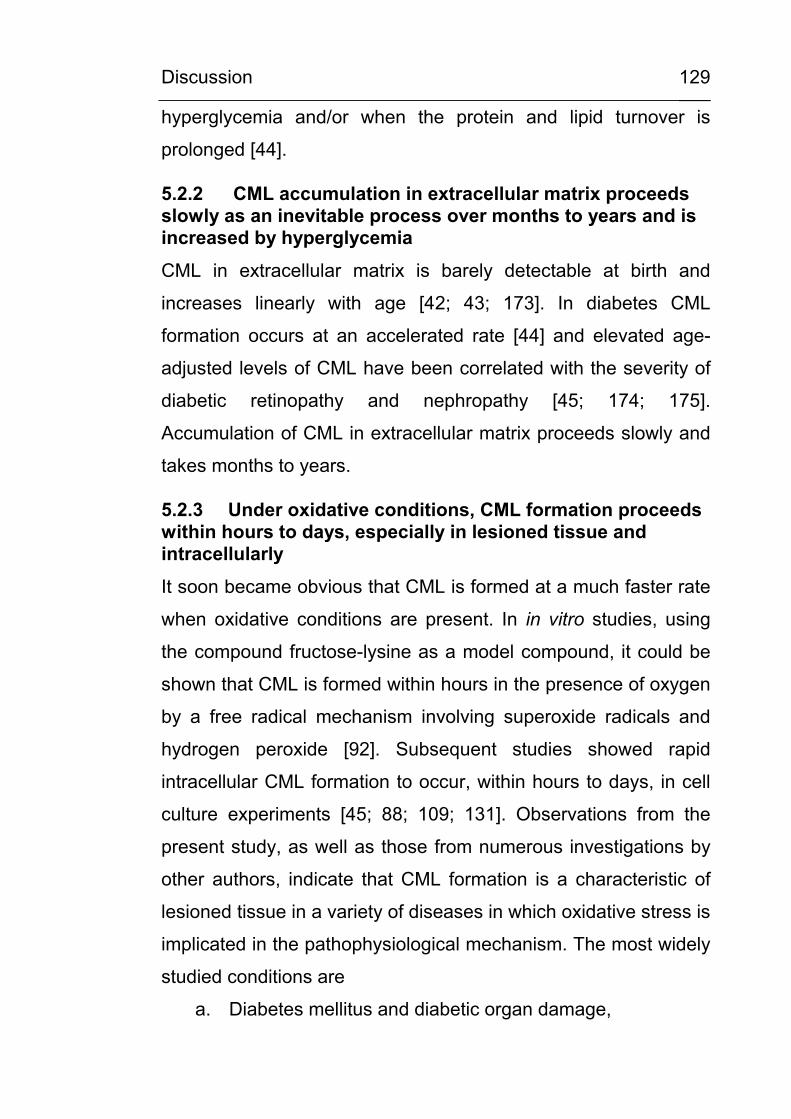
Discussion
129
hyperglycemia and/or when the protein and lipid turnover is
prolonged [44].
5.2.2 CML accumulation in extracellular matrix proceeds slowly as an inevitable process over months to years and is increased by hyperglycemia
CML in extracellular matrix is barely detectable at birth and
increases linearly with age [42; 43; 173]. In diabetes CML
formation occurs at an accelerated rate [44] and elevated age-
adjusted levels of CML have been correlated with the severity of
diabetic retinopathy and nephropathy [45; 174; 175].
Accumulation of CML in extracellular matrix proceeds slowly and
takes months to years.
5.2.3 Under oxidative conditions, CML formation proceeds within hours to days, especially in lesioned tissue and intracellularly
It soon became obvious that CML is formed at a much faster rate
when oxidative conditions are present. In in vitro studies, using
the compound fructose-lysine as a model compound, it could be
shown that CML is formed within hours in the presence of oxygen
by a free radical mechanism involving superoxide radicals and
hydrogen peroxide [92]. Subsequent studies showed rapid
intracellular CML formation to occur, within hours to days, in cell
culture experiments [45; 88; 109; 131]. Observations from the
present study, as well as those from numerous investigations by
other authors, indicate that CML formation is a characteristic of
lesioned tissue in a variety of diseases in which oxidative stress is
implicated in the pathophysiological mechanism. The most widely
studied conditions are
a. Diabetes mellitus and diabetic organ damage,
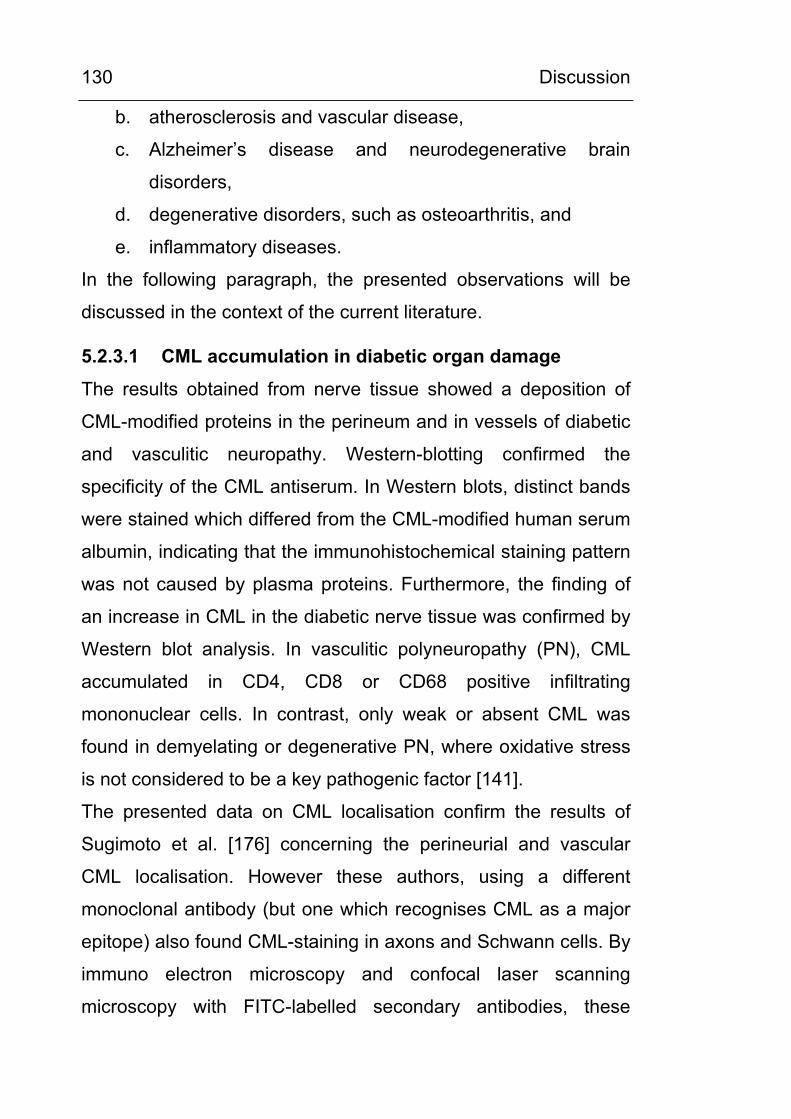
Discussion
130
b. atherosclerosis and vascular disease,
c. Alzheimer’s disease and neurodegenerative brain
disorders,
d. degenerative disorders, such as osteoarthritis, and
e. inflammatory diseases.
In the following paragraph, the presented observations will be
discussed in the context of the current literature.
5.2.3.1 CML accumulation in diabetic organ damage
The results obtained from nerve tissue showed a deposition of
CML-modified proteins in the perineum and in vessels of diabetic
and vasculitic neuropathy. Western-blotting confirmed the
specificity of the CML antiserum. In Western blots, distinct bands
were stained which differed from the CML-modified human serum
albumin, indicating that the immunohistochemical staining pattern
was not caused by plasma proteins. Furthermore, the finding of
an increase in CML in the diabetic nerve tissue was confirmed by
Western blot analysis. In vasculitic polyneuropathy (PN), CML
accumulated in CD4, CD8 or CD68 positive infiltrating
mononuclear cells. In contrast, only weak or absent CML was
found in demyelating or degenerative PN, where oxidative stress
is not considered to be a key pathogenic factor [141].
The presented data on CML localisation confirm the results of
Sugimoto et al. [176] concerning the perineurial and vascular
CML localisation. However these authors, using a different
monoclonal antibody (but one which recognises CML as a major
epitope) also found CML-staining in axons and Schwann cells. By
immuno electron microscopy and confocal laser scanning
microscopy with FITC-labelled secondary antibodies, these
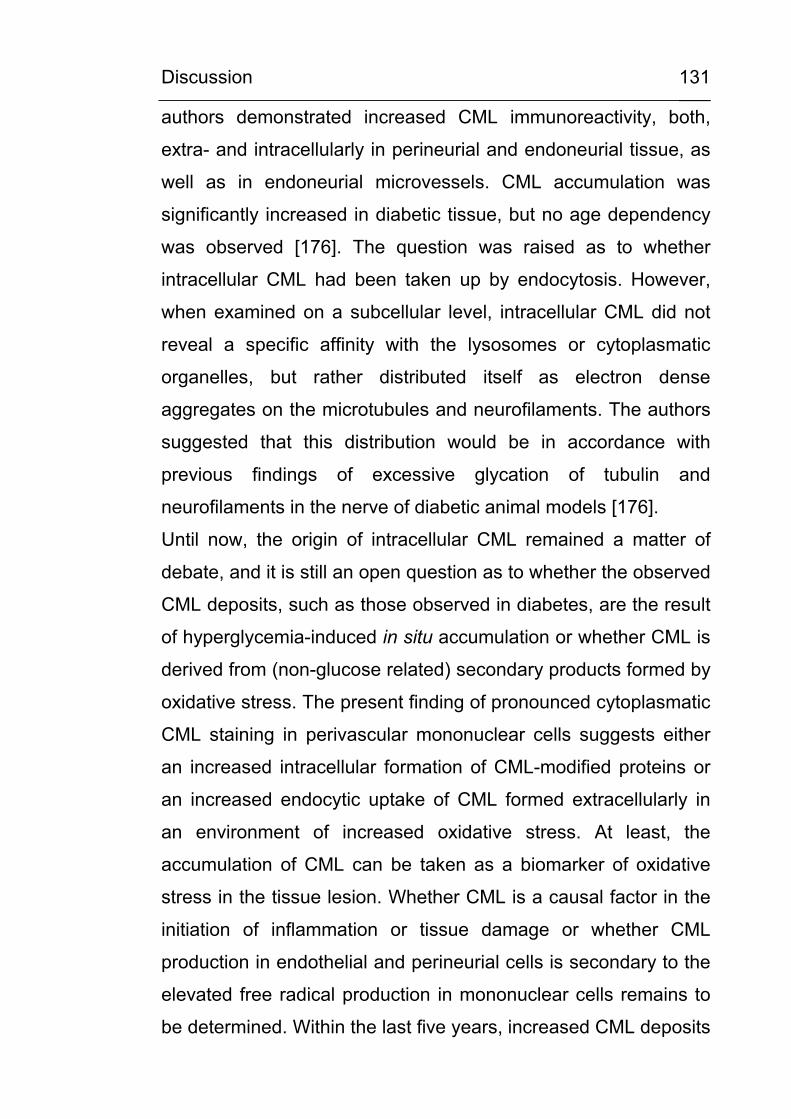
Discussion
131
authors demonstrated increased CML immunoreactivity, both,
extra- and intracellularly in perineurial and endoneurial tissue, as
well as in endoneurial microvessels. CML accumulation was
significantly increased in diabetic tissue, but no age dependency
was observed [176]. The question was raised as to whether
intracellular CML had been taken up by endocytosis. However,
when examined on a subcellular level, intracellular CML did not
reveal a specific affinity with the lysosomes or cytoplasmatic
organelles, but rather distributed itself as electron dense
aggregates on the microtubules and neurofilaments. The authors
suggested that this distribution would be in accordance with
previous findings of excessive glycation of tubulin and
neurofilaments in the nerve of diabetic animal models [176].
Until now, the origin of intracellular CML remained a matter of
debate, and it is still an open question as to whether the observed
CML deposits, such as those observed in diabetes, are the result
of hyperglycemia-induced in situ accumulation or whether CML is
derived from (non-glucose related) secondary products formed by
oxidative stress. The present finding of pronounced cytoplasmatic
CML staining in perivascular mononuclear cells suggests either
an increased intracellular formation of CML-modified proteins or
an increased endocytic uptake of CML formed extracellularly in
an environment of increased oxidative stress. At least, the
accumulation of CML can be taken as a biomarker of oxidative
stress in the tissue lesion. Whether CML is a causal factor in the
initiation of inflammation or tissue damage or whether CML
production in endothelial and perineurial cells is secondary to the
elevated free radical production in mononuclear cells remains to
be determined. Within the last five years, increased CML deposits
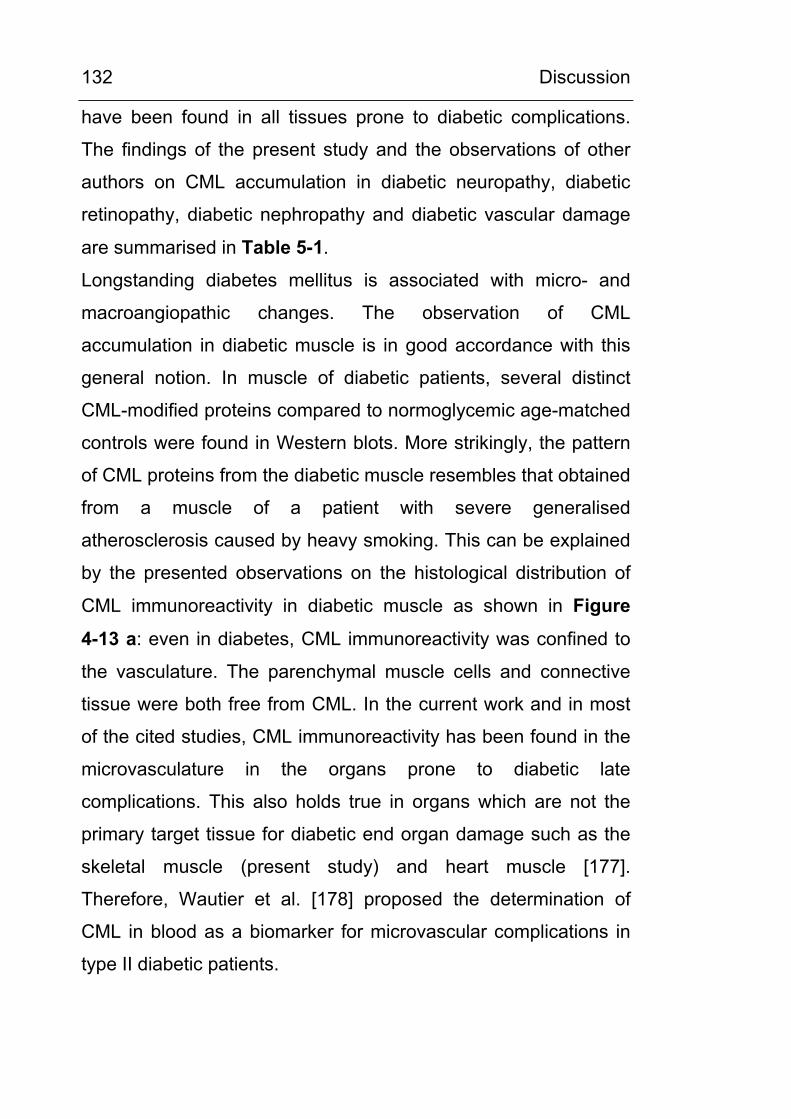
Discussion
132
have been found in all tissues prone to diabetic complications.
The findings of the present study and the observations of other
authors on CML accumulation in diabetic neuropathy, diabetic
retinopathy, diabetic nephropathy and diabetic vascular damage
are summarised in Table 5-1.
Longstanding diabetes mellitus is associated with micro- and
macroangiopathic changes. The observation of CML
accumulation in diabetic muscle is in good accordance with this
general notion. In muscle of diabetic patients, several distinct
CML-modified proteins compared to normoglycemic age-matched
controls were found in Western blots. More strikingly, the pattern
of CML proteins from the diabetic muscle resembles that obtained
from a muscle of a patient with severe generalised
atherosclerosis caused by heavy smoking. This can be explained
by the presented observations on the histological distribution of
CML immunoreactivity in diabetic muscle as shown in Figure
4-13 a: even in diabetes, CML immunoreactivity was confined to
the vasculature. The parenchymal muscle cells and connective
tissue were both free from CML. In the current work and in most
of the cited studies, CML immunoreactivity has been found in the
microvasculature in the organs prone to diabetic late
complications. This also holds true in organs which are not the
primary target tissue for diabetic end organ damage such as the
skeletal muscle (present study) and heart muscle [177].
Therefore, Wautier et al. [178] proposed the determination of
CML in blood as a biomarker for microvascular complications in
type II diabetic patients.
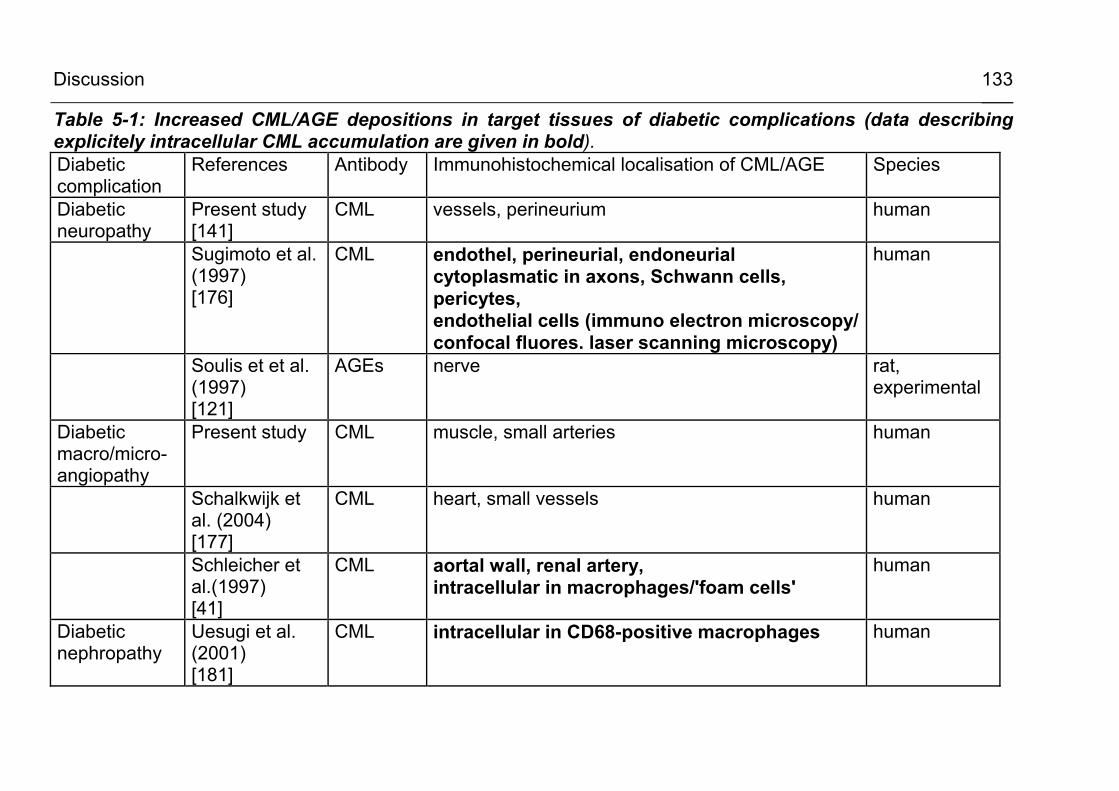
Discussion
133
Table 5-1: Increased CML/AGE depositions in target tissues of diabetic complications (data describing explicitely intracellular CML accumulation are given in bold). Diabetic complication
References Antibody Immunohistochemical localisation of CML/AGE Species
Diabetic neuropathy
Present study [141]
CML vessels, perineurium human
Sugimoto et al. (1997) [176]
CML endothel, perineurial, endoneurial cytoplasmatic in axons, Schwann cells, pericytes, endothelial cells (immuno electron microscopy/ confocal fluores. laser scanning microscopy)
human
Soulis et et al. (1997) [121]
AGEs nerve rat, experimental
Diabetic macro/micro-angiopathy
Present study CML muscle, small arteries human
Schalkwijk et al. (2004) [177]
CML heart, small vessels human
Schleicher et al.(1997) [41]
CML aortal wall, renal artery, intracellular in macrophages/'foam cells'
human
Diabetic nephropathy
Uesugi et al. (2001) [181]
CML intracellular in CD68-positive macrophages human
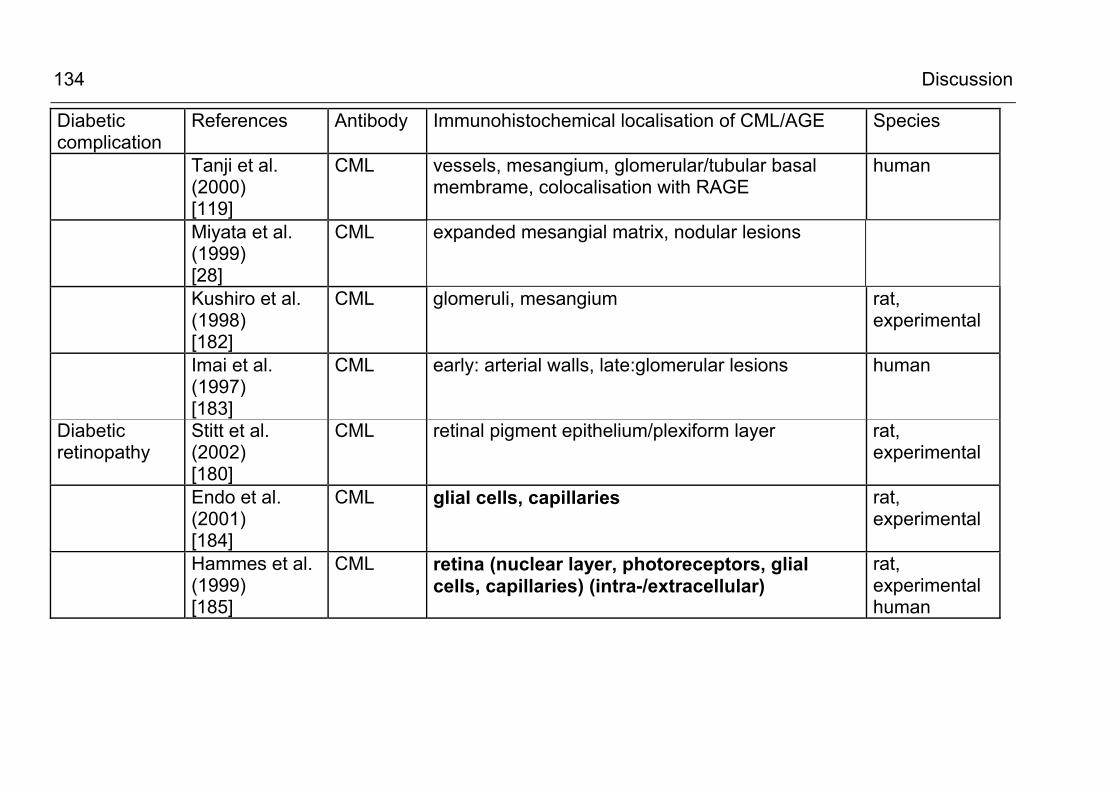
Discussion
134
Diabetic complication
References Antibody Immunohistochemical localisation of CML/AGE Species
Tanji et al. (2000) [119]
CML vessels, mesangium, glomerular/tubular basal membrame, colocalisation with RAGE
human
Miyata et al. (1999) [28]
CML expanded mesangial matrix, nodular lesions
Kushiro et al. (1998) [182]
CML glomeruli, mesangium rat, experimental
Imai et al. (1997) [183]
CML early: arterial walls, late:glomerular lesions human
Diabetic retinopathy
Stitt et al. (2002) [180]
CML retinal pigment epithelium/plexiform layer rat, experimental
Endo et al. (2001) [184]
CML glial cells, capillaries rat, experimental
Hammes et al. (1999) [185]
CML retina (nuclear layer, photoreceptors, glial cells, capillaries) (intra-/extracellular)
rat, experimental human
Discussion
135
Further evidence for the potential involvement of CML in the
pathogenesis of diabetic microvascular disease and of diabetic
organ damage comes from observations in animal models where
functionally unrelated inhibitors of the formation of CML and other
AGEs partially prevented various functional and structural
manifestations of diabetic microvascular disease in blood vessels,
retina, kidney and nerve. Soulis et al. [179] observed in an
experimental diabetic rat model that the compounds
aminoguanidine and 2,3-diaminophenazine inhibited the
increased formation of AGEs in the vessels of diabetic animals
and prevented the formation of mesenteric vascular hypertrophy.
Stitt et al. [180] reported that the AGE inhibitor pyridoxamine
reduced the retinal accumulation of CML and protected against
the development of diabetic retinopathy in streptozotocin-induced
diabetic rats. Most recently, Nakamura et al. reported a reduced
CML formation and the retardation of diabetic nephropathy in
diabetic OLETF rats in the presence of the AGE inhibitor OPB-
9195 [114].
5.2.3.2 CML accumulation in atherosclerosis and vascular disease
As discussed above, the vasculature is the preferred localisation
of CML accumulation in diabetic macro- and microangiopathy and
also in atherosclerosis associated with other conditions such as
in uremia. Since specific CML antibodies have become available,
several studies have demonstrated the accumulation and
distribution of CML in atheromatous lesions [34; 46; 107; 186;
187] [188]. The current literature is reviewed in Table 5-2. In most
studies, CML modification of the extracellular matrix was
observed in areas of intimal fibrosis and atheromatous plaque
Discussion
136
formation, but several authors [34; 46; 186] have made the
intriguing observation of a strong cytoplasmatic CML staining
within ‘foamy macrophages’. Horiuchi et al. [46] described dense
intracellular CML deposits in macrophage-derived foam cells
(PM-2-K positive cells) in early stages of atherosclerosis (intimal
thickening and fatty streak lesions) and strong CML accumulation
in macrophage- and SMC-derived foam cells (HHF35-positive
cells).
There is ongoing debate about the origin of intracellular CML. On
the surface of macrophages and other cells, AGE binding
proteins/receptors such as the macrophage scavenger receptor
(MSR) and the receptor for AGEs (RAGE) have been
characterised [123]. One explanation for CML accumulation may
be that macrophages and smooth muscle cells bearing AGE-
binding receptors readily take up and degrade CML-modified
matrix proteins from the plaques. Horiuchi et al. [46] described
that more than 60% of CML-loaded foam cells in atherosclerotic
lesions also showed positive reaction to anti-MSR antibodies.
However, the unexpectedly high intracellular CML-staining in
macrophages may also be explained by intracellular de novo
formation. At present, there is evidence that both mechanisms
can take part in the accumulation of CML: the endocytic uptake of
AGE-modified extracellular matrix components [189-191] and the
intracellular formation from lipid peroxidation and other oxidative
metabolic processes [31; 88; 125; 131]. To clarifiy this issue of
intracellular CML formation, further studies in cell culture systems
and the systematic analysis of the CML-modified proteins are
required.
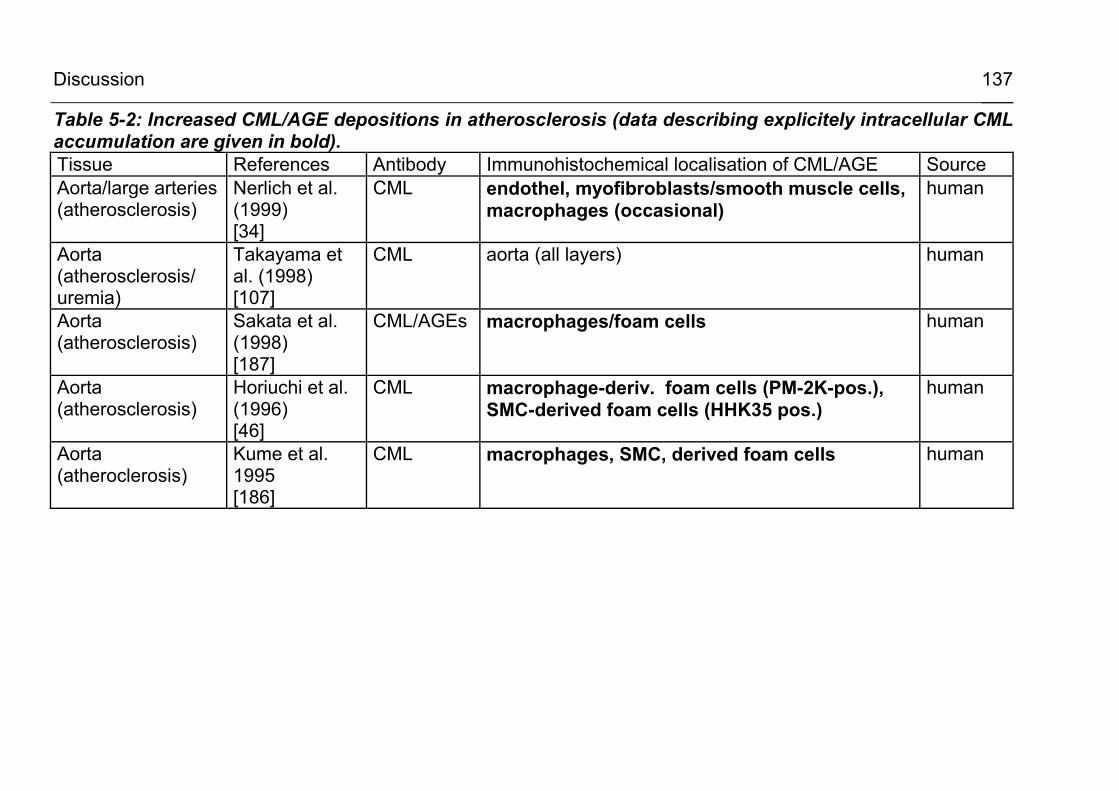
Discussion
137
Table 5-2: Increased CML/AGE depositions in atherosclerosis (data describing explicitely intracellular CML accumulation are given in bold). Tissue References Antibody Immunohistochemical localisation of CML/AGE Source Aorta/large arteries (atherosclerosis)
Nerlich et al. (1999) [34]
CML endothel, myofibroblasts/smooth muscle cells, macrophages (occasional)
human
Aorta (atherosclerosis/ uremia)
Takayama et al. (1998) [107]
CML aorta (all layers) human
Aorta (atherosclerosis)
Sakata et al. (1998) [187]
CML/AGEs macrophages/foam cells human
Aorta (atherosclerosis)
Horiuchi et al. (1996) [46]
CML macrophage-deriv. foam cells (PM-2K-pos.), SMC-derived foam cells (HHK35 pos.)
human
Aorta (atheroclerosis)
Kume et al. 1995 [186]
CML macrophages, SMC, derived foam cells human
Discussion
138
5.2.3.3 CML formation in Alzheimer’s disease and other neurodegenerative conditions
In the current study it has been shown for the first time that intracellular CML formation can be demonstrated in N11 microglial cells under stimulation with arachidonic acid, an agent known to evoke NADPH-dependent intracellular ROS production [192; 193]. CML has been shown to accumulate in aging and at an increased rate in Alzheimer’s disease (AD) by various authors [102; 103; 194] and, thus, it has been suggested to play a role in the aging process as well as in the pathogenesis of AD. Recently, Takeda et al. [102] examined brain tissue from patients with AD and described that the increased intracellular CML accumulation seen in glial cells is disease-specific for AD: In this study, electron microscopy was used to examine the subcellular distribution and CML was found intracellularly in the microglial cytoplasm as well as in the cytoplasm of astrocytes and neuronal cells. The glial CML found was generally more prominent in AD brains than in aged brains [102]. As in the case of foam cells in atherosclerosis, the question was raised as to whether the glial CML was derived from the degenerating neurons and had been taken up subsequently by endocytosis. However, the electron microscopic features of glial CML were not those of endocytosomes and the glial CML was also prominent in regions without neuronal loss. Thus, the authors favored the hypothesis that glial CML was primarily synthesised in the glial cytoplasma, especially since recently various oxygen radicals and carbonyl compounds known to promote the formation of CML have been demonstrated in AD brains [195; 196]. This hypothesis is supported by the new finding
Discussion
139
from the present study of intracellular CML formation in stimulated N11 microglial cells. Besides AD, disease-specific CML accumulation has been
described in other neurogenerative disorders such as Pick’s
disease [197] or amyotrophic lateral sclerosis [198]. The pertinent
findings from the literature are summarised in Table 5-3.
5.2.3.4 CML formation in degenerative conditions as osteoarthritis
In the present study, it was observed and published for the first
time [201] that in osteoarthritis (OA) CML is accumulating
intracellularly, namely in chondrocytes of the lesioned cartilage
and in subchondral osteocytes (Figure 4-14). Drinda et al. [101]
have confirmed these findings for OA shortly thereafter and
reported an even higher CML accumulation in rheumatoid arthritis
(RA), an inflammatory condition of the synovial lining and
adjacent structures of the joint. Table 5-4 summarises the current
finding together with pertinent reports from the literature on
degenerative conditions, where increased CML formation has
been demonstrated intracellularly.
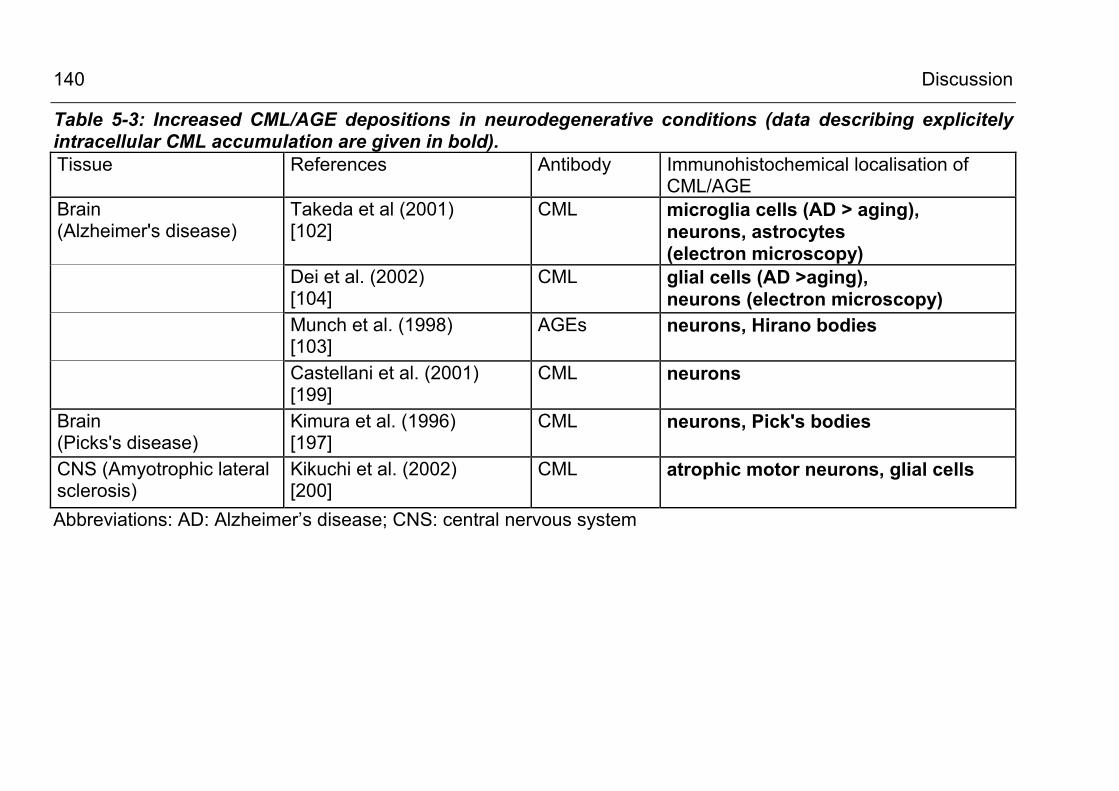
Discussion
140
Table 5-3: Increased CML/AGE depositions in neurodegenerative conditions (data describing explicitely intracellular CML accumulation are given in bold). Tissue References Antibody Immunohistochemical localisation of
CML/AGE Brain (Alzheimer's disease)
Takeda et al (2001) [102]
CML microglia cells (AD > aging), neurons, astrocytes (electron microscopy)
Dei et al. (2002) [104]
CML glial cells (AD >aging), neurons (electron microscopy)
Munch et al. (1998) [103]
AGEs neurons, Hirano bodies
Castellani et al. (2001) [199]
CML neurons
Brain (Picks's disease)
Kimura et al. (1996) [197]
CML neurons, Pick's bodies
CNS (Amyotrophic lateral sclerosis)
Kikuchi et al. (2002) [200]
CML atrophic motor neurons, glial cells
Abbreviations: AD: Alzheimer’s disease; CNS: central nervous system
Discussion
141
Up to now it has not been clarified whether chondrocytes in
osteoarthritis produce CML or whether there is a receptor-
mediated uptake of the CML-modified proteins [108]. In Western
blot analysis of total tissue protein extracts three distinct CML-
modified protein bands were found (see Figure 4-15) in the
molecular weight range of 39 - 68 kDa which did not react with
antibodies specific for major extra-cellular matrix (ECM)
components such as osteopontin, collagen II, aggrecan or
cartilage oligomeric matrix protein (COMP) [201]. This could
indicate that the observed CML-modified proteins have been
formed intracellularly. Recently, it has been described that
cytokines, in particular tumor necrosis factor alpha (TNFα),
induce the formation of AGEs in vitro [202] and that TNFα is
enhanced in OA chondrocytes. Hiran et al. [203; 204] described a
cellular NADPH oxidase and the NADPH oxidase-dependent
production of superoxide anions and other ROS in stimulated
porcine articular chondrocytes. To further clarify the origin of
intracellular CML in chondrocytes and the role of NADPH
oxidase-dependent oxidative stress, the characterisation of some
of the CML-modified proteins will be required.
5.2.3.5 CML formation in inflammatory conditions
A prominent finding of the present study is the pronounced
intracellular CML accumulation in inflammatory mononuclear cells
and the rapid CML modification of cellular proteins in stimulated
monocytic (Mono Mac 6) and macrophage-related cells (N11
microglia cells). Using immunohistochemistry, CML depositions
have been demonstrated in inflammatory conditions of nerve
(vasculitic neuropathy) and muscle (dermatomyositis,
Discussion
142
polymyositis). This is in clear contrast to the non-inflammatory
polyneuropathies examined: in CDIP, a form of demyelating PN,
and in Charcot-Marie-Tooth disease type I (CMT I), a
degenerative PN, little to no CML has been found in the tissue.
The observation of CML accumulation in infiltrating macrophages
and lymphocytes in the tissue lesions is in line with other reports
which have been summarised in Table 5-5. Drinda et al. [101]
described the presence of CML-loaded macrophages and long-
lived T-lymphocytes in the synovial tissue in rheumatoid arthritis
(RA) and confirmed the cell’s identity by double staining against
CD68 and CD45Ro, respectively. In RA, increased CML-staining
was also described in the synovial lining and sublining and in the
endothelium as compared to healthy control tissue. In a previous
report from this laboratory [205], investigating the distribution of
CML in normal intestinal mucosa and in chronic inflammatory
bowel disease, CML-loaded infiltrating or resident macrophages
have been found as a characteristic of inflammatory tissue
changes in chronic active and inactive colitis ulcerosa and in M.
Crohn. In this report, additional CML staining was observed in
apical enterocytes and in interstitial cells, which was significantly
increased in inflammatory bowel disease as compared to healthy
intestinal tissue.
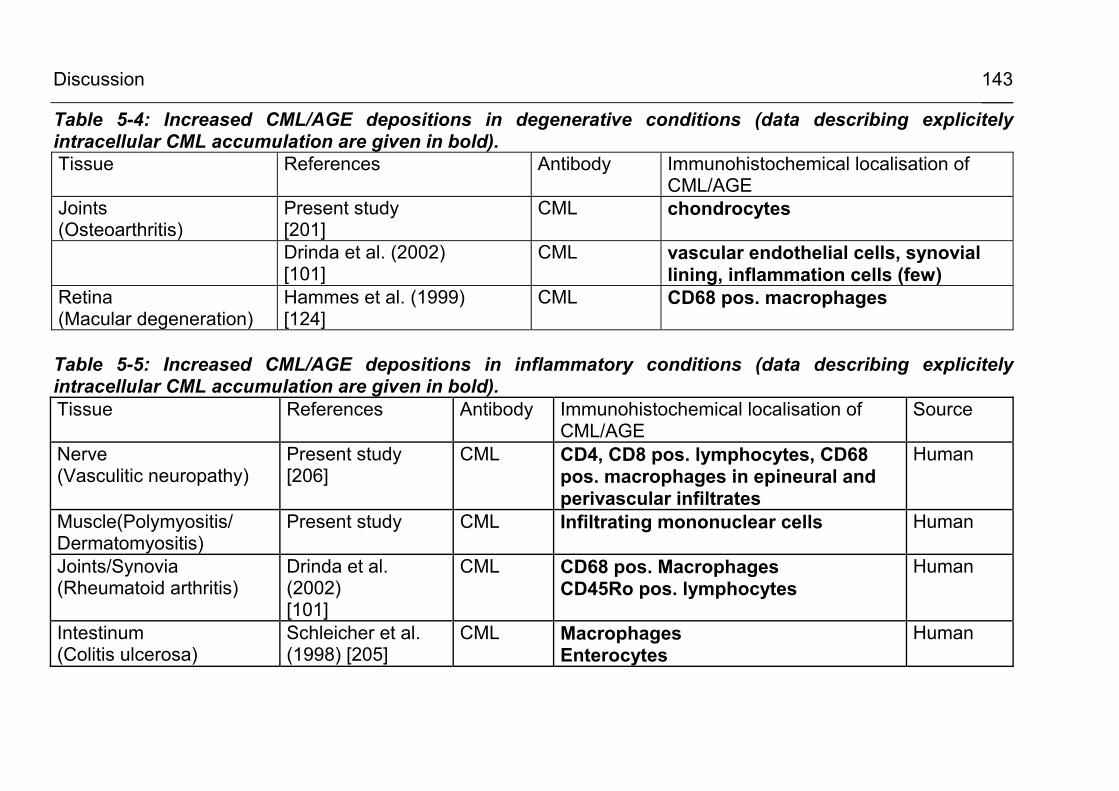
Discussion
143
Table 5-4: Increased CML/AGE depositions in degenerative conditions (data describing explicitely intracellular CML accumulation are given in bold). Tissue References Antibody Immunohistochemical localisation of
CML/AGE Joints (Osteoarthritis)
Present study [201]
CML chondrocytes
Drinda et al. (2002) [101]
CML vascular endothelial cells, synovial lining, inflammation cells (few)
Retina (Macular degeneration)
Hammes et al. (1999) [124]
CML CD68 pos. macrophages
Table 5-5: Increased CML/AGE depositions in inflammatory conditions (data describing explicitely intracellular CML accumulation are given in bold). Tissue References Antibody Immunohistochemical localisation of
CML/AGE Source
Nerve (Vasculitic neuropathy)
Present study [206]
CML CD4, CD8 pos. lymphocytes, CD68 pos. macrophages in epineural and perivascular infiltrates
Human
Muscle(Polymyositis/ Dermatomyositis)
Present study CML Infiltrating mononuclear cells Human
Joints/Synovia (Rheumatoid arthritis)
Drinda et al. (2002) [101]
CML CD68 pos. Macrophages CD45Ro pos. lymphocytes
Human
Intestinum (Colitis ulcerosa)
Schleicher et al. (1998) [205]
CML Macrophages Enterocytes
Human
Discussion
144
5.2.4 Is intracellular CML actually formed within the cell?
As shown in the preceding paragraphs, under numerous
pathological conditions CML accumulation has been localised
intracellularly, especially in infiltrating macrophages and other
inflammatory cells. There is ongoing debate, whether the
observed depositions represent CML-modified proteins or other
macromolecules actually formed within the cell, or rather reveal
material which has been taken up by endocytosis. To date, there
is evidence that both processes occur.
Strong evidence for intracellular de novo carboxymethylation of
cellular proteins comes from the present data in differentiated
monocytic Mono Mac 6 cells. In this cell culture model it was
demonstrated for the first time that normal and high glucose
conditions, in combination with stimulation by PMA, leads to time-
dependent CML modification of distinct cellular proteins. During
the experimental conditions great care was taken to ensure that
cell pellets were washed thouroughly (resuspended and washed
three times in PBS) to remove traces of fetal serum proteins
originating from the culture medium. The fetal calf serum itself
clearly contains CML-modified proteins, mainly CML albumin, as
shown in the experiment using granulocyte suspensions (see
paragraph 4.3.2): at the start of the experiment there was already
a carboxymethylated protein band at approx. 65 kDa visible in the
anti-CML Western blots of culture medium. (see Figure 4-18). In contrast to this observation, in whole cell lysates
from washed cell pellets, no or very little CML immunoreactivity
was observed in the early stages (0 – 8 h) of the cell culture
experiments using Mono Mac 6 cells. CML formation developed
Discussion
145
in a time-dependent fashion at later time points (24 – 72h)
indicating that de novo CML formation has occured (see Figure
4-21 c-f). The present findings are in line with observations in various cell
types and cell culture models made by other authors. Table 5-6
reviews recent studies where intracellular de novo synthesis has
been described in cultured cell lines of epithelial [126], endothelial
[31; 125] and neuronal [88; 127] origin. The findings concerning
CML-formation in ex vivo-isolated circulating blood cells are listed
in Table 5-7. In the cited reports, oxidative stress was generated
either by ROS-generating enzymes, most obviously in
granulocytes, where stimulation resulted in an ‘oxidative burst’
from myeloperoxidase and NADPH oxidase [130], or by high
glucose-driven superoxide anion production from the respiratory
chain [125]. Another mechanism for intracellular CML formation
was to diminish antioxidative defense, e.g. by GSH depletion
through menadione [45].
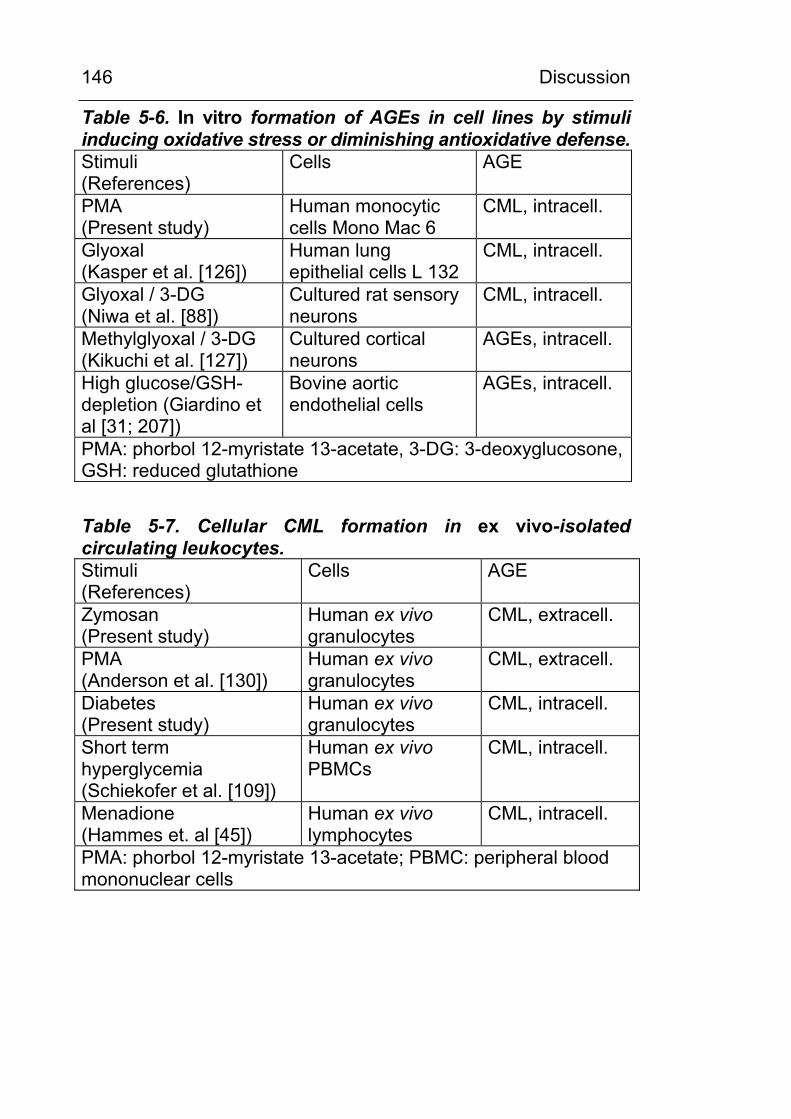
Discussion
146
Table 5-6. In vitro formation of AGEs in cell lines by stimuli inducing oxidative stress or diminishing antioxidative defense. Stimuli (References)
Cells AGE
PMA (Present study)
Human monocytic cells Mono Mac 6
CML, intracell.
Glyoxal (Kasper et al. [126])
Human lung epithelial cells L 132
CML, intracell.
Glyoxal / 3-DG (Niwa et al. [88])
Cultured rat sensory neurons
CML, intracell.
Methylglyoxal / 3-DG (Kikuchi et al. [127])
Cultured cortical neurons
AGEs, intracell.
High glucose/GSH-depletion (Giardino et al [31; 207])
Bovine aortic endothelial cells
AGEs, intracell.
PMA: phorbol 12-myristate 13-acetate, 3-DG: 3-deoxyglucosone, GSH: reduced glutathione
Table 5-7. Cellular CML formation in ex vivo-isolated circulating leukocytes. Stimuli (References)
Cells AGE
Zymosan (Present study)
Human ex vivo granulocytes
CML, extracell.
PMA (Anderson et al. [130])
Human ex vivo granulocytes
CML, extracell.
Diabetes (Present study)
Human ex vivo granulocytes
CML, intracell.
Short term hyperglycemia (Schiekofer et al. [109])
Human ex vivo PBMCs
CML, intracell.
Menadione (Hammes et. al [45])
Human ex vivo lymphocytes
CML, intracell.
PMA: phorbol 12-myristate 13-acetate; PBMC: peripheral blood mononuclear cells
Discussion
147
5.3 Which cellular source of ROS production is involved in CML formation?
In the present study, for the first time, the carboxymethylation of
intracellular proteins had been observed in a cell culture model of
differentiated monocytic cells. Therefore, the mechanism of
cellular CML formation was investigated further. In vitro data
suggest that protein carboxymethylation is mediated by reactive
oxygen species (ROS). If this holds true also in cells, then what
would be the oxygen species involved and what would be the
cellular source?
5.3.1 Is NADPH oxidase implicated in CML formation?
Among the various cellular ROS-generating systems, NADPH
oxidase would be a good candidate for two reasons:
First, NADPH oxidase has been implicated, at least indirectly, in CML/AGE formation:
Up to now there is no good study which proves unequivocally the
direct involvement of cellular NADPH oxidase in CML formation.
Nevertheless, there was indirect evidence for the contribution of
this ROS-generating enzyme to protein carboxymethylation by
the report of Anderson et al. [130] who demonstrated that the
‘oxidative burst’ of stimulated granulocytes led to superoxide
anion production and CML formation on proteins. However, in this
study the contributions of NADPH oxidase and myeloperoxidase
activity have not been separated clearly.
Second, most of the cell types or tissues known to form intracellular CML, have also proven to possess NADPH oxidase or to exert NADPH oxidase activity
In most of the cell types in which CML formation has been
described so far, also the presence of NADPH oxidase has been
Discussion
148
demonstrated, be it on DNA or RNA level or by demonstrating the
presence of NADPH oxidase subunits in Western blots or by
functional assays: Table 5-8 lists the pertinent literature up to the
present date. In atherosclerosis, the nonphagocytic/cellular form
of NADPH oxidase has been described to be the major source of
superoxide anions produced in the vessel wall [208] and in cell
lines of cultured vascular smooth muscle cells [144] and
endothelial cells [112; 145; 209]. In all of the mentioned vascular
components, also CML formation has been observed by other
authors (as reviewed in Table 5-8). The same holds true for
relevant cell types in Alzheimer’s disease and rheumatoid arthritis
(Table 5-8).
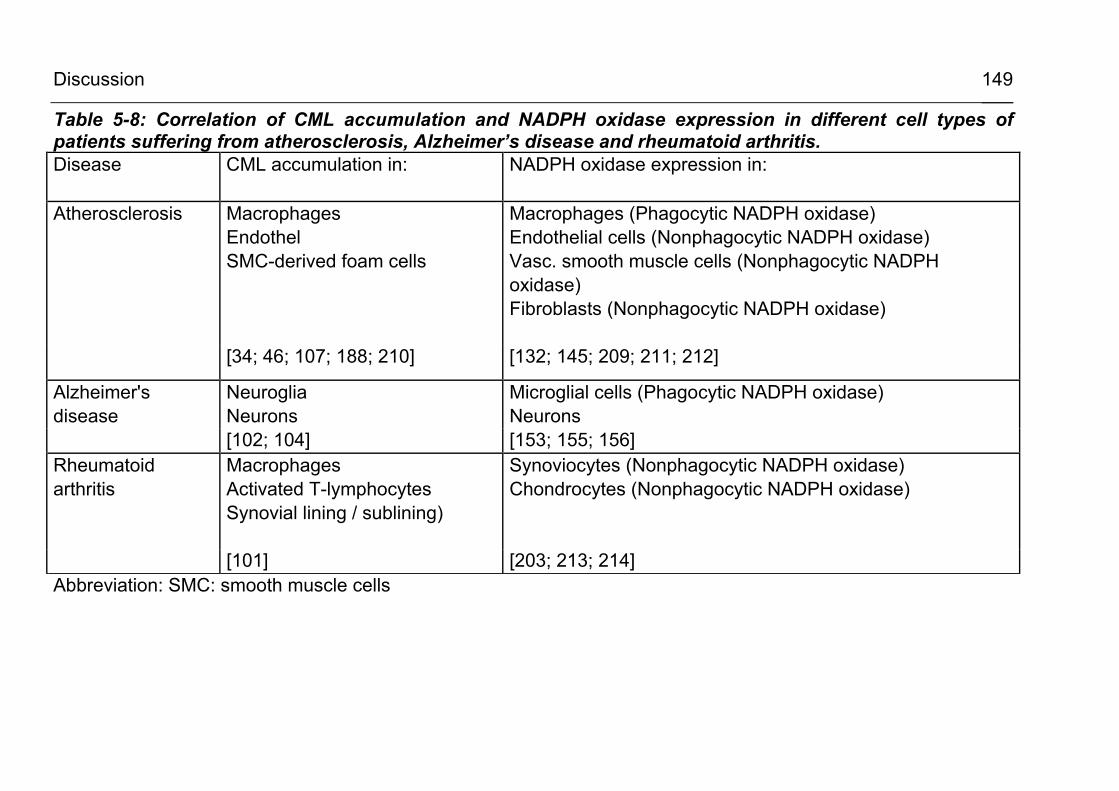
Discussion
149
Table 5-8: Correlation of CML accumulation and NADPH oxidase expression in different cell types of patients suffering from atherosclerosis, Alzheimer’s disease and rheumatoid arthritis. Disease CML accumulation in:
NADPH oxidase expression in:
Atherosclerosis
Macrophages Endothel SMC-derived foam cells
Macrophages (Phagocytic NADPH oxidase) Endothelial cells (Nonphagocytic NADPH oxidase) Vasc. smooth muscle cells (Nonphagocytic NADPH oxidase) Fibroblasts (Nonphagocytic NADPH oxidase)
[34; 46; 107; 188; 210] [132; 145; 209; 211; 212]
Alzheimer's disease
Neuroglia Neurons
Microglial cells (Phagocytic NADPH oxidase) Neurons
[102; 104] [153; 155; 156] Rheumatoid arthritis
Macrophages Activated T-lymphocytes Synovial lining / sublining)
Synoviocytes (Nonphagocytic NADPH oxidase) Chondrocytes (Nonphagocytic NADPH oxidase)
[101] [203; 213; 214] Abbreviation: SMC: smooth muscle cells
Discussion
150
A widely used assay for NADPH oxidase activity is the lucigenin
chemiluminescence assay. Although in numerous studies the
validity of this assay has been stated [144-146; 215-218], the
specifity of this assay is still a matter of debate [148; 149; 219;
220]. In the present study, the protocol of Griendling et al. [144]
with modifications was applied. A lower concentration of lucigenin
was used to eliminate redox cycling of this compound as
proposed by Munzel et al. [146]. It is a drawback for the research
on NADPH oxidase that there is still no specific cell permeable
inhibitor for this enzyme. The most widely used NADPH oxidase
inhibitor at present is DPI. Inhibition of superoxide anion
production by this compound is accepted in the literature as
evidence for NADPH oxidase activity [221-223], but there are
emerging data that DPI is not specific for NADPH oxidase, but
rather inhibits other NADPH-dependent flavoproteins as well
[224-227]. It has been proposed [228; 229] that the inhibitory
action occurs by the reaction of DPI with the reduced anionic
state ot the flavin residue resulting in a phenyl adduct of the flavin
group. Besides NADPH oxidase, a DPI-dependent inhibition has
been shown for mitochondrial dehydrogenase, for NADPH
cytochrome P450 reductase (CPR), for xanthine oxidase, for NO
synthase and for sulfite synthase [229].
5.3.2 Is the cellular NADPH oxidase activity crucial for CML formation?
To prove or disprove the results from DPI inhibition experiments,
NADPH oxidase knock out mutants of monocytic cells (PLB985
gp91∆488-497) and of microglia cells (N11/6 NADPH oxidase
knock outs) were used. In those cell lines, the PHOX subunit had
been rendered inactive as characterised previously ([134] and
Discussion
151
personal communication from A. Neumann, Würzburg). It was
found that the CML formation observed in PLB985 gp91∆488-497
knock out mutants was quantitatively comparable to wild type
cells. This result had been corroborated by the findings in
microglia cells. In NADPH oxidase deficient N11/6 microglial
cells, the CML formation in response to stimulation by arachidonic
acid had been observed to the same extent as in N11 wild type
cells. From these experiments, clear evidence was obtained that
protein carboxymethylation is not dependent on cellular NADPH
oxidase.
5.3.3 Is ROS production from the mitochondrial respiratory chain involved in CML formation?
An actual hypothesis links hyperglycemia-dependent increased
superoxide anion formation from the respiratory chain to the
increased intracellular formation of AGEs [30; 65]. Various
compounds, as depicted in Figure 4-27, have been shown to
reduce respiratory chain-mediated formation of ROS and some of
them have been shown to reduce methylglyoxal-derived AGEs
[65; 158]. 4-OHCA is known to reduce mitochodrial superoxide
anion production by inhibiting the pyruvate transport into the
mitochondria and the other compounds are known to interfere
with the respiratory chain directly. Either by uncoupling of the
oxidative phosphorylation (CCCP) or by interfering with specific
mitochondrial redox complexes (rotenone, TTFA, antimycin A) at
the working concentrations given in Table 3-2 and Figure 4-24.
Benfotiamine has been shown to activate transketolase thereby
diverting excess glycolytic intermediates to the pentose
phosphate pathway (see Figure 4-27). This has been shown to
prevent the high glucose-driven formation of methylglyoxal-
Discussion
152
derived AGEs without affecting mitochondrial ROS production
[158].
It was tested, whether these compounds also influence CML
formation in the cell culture model of PMA-stimulated monocytic
cells. The results were not entirely conclusive. It was observed
that the formation of CML was reduced by 4-OHCA and to some
extent by rotenone, a specific inhibitor of complex I, but not by
unspecific uncoupling of the respiratory chain (CCCP) or by
inhibiting complex II (TTFA) or III (antimycin A). These results are
in contrast to Nishikawa et al. [65] who investigated the formation
of methylglyoxal-derived AGEs, which are other important AGEs
implicated in the pathogenesis of oxidative stress-induced tissue
damage. These authors reported a reducing effect of CCCP and
TTFA on high glucose-driven ROS generation and on the
formation of methylglyoxal-derived AGE formation, but not of
rotenone. In summary, the presented results do not indicate that
an inhibition of the respiratory chain at various stages does lead
to a generalised reduction of CML- or AGE-formation. Further
experiments including subcellular fractionation and more specific
techniques for the measurement of superoxide anions should be
employed to get a clearer picture on the involvement of
mitochondrial ROS in CML formation.
Zusammenfassung (Deutsch)
153
6 ZUSAMMENFASSUNG (DEUTSCH) Zielstellung: In der vorliegenden Arbeit sollte die Hypothese überprüft werden,
daß das ‚advanced glycation end-product (AGE)‘ Nε-
(carboxymethyl)-Lysin (CML)
(a) intrazellulär in Makrophagen und Granulozyten gebildet wird,
(b) ein Lipidperoxidationsprodukt darstellt,
(c) maßgeblich durch den Einfluß reaktiver Sauerstoffspezies
(ROS) entsteht, insbesondere durch das Superoxidanion
O2._, dem Produkt der zellulären NADPH-Oxidase,
und ob somit
(d) der Nachweis von CML in Geweben und in
Körperflüssigkeiten und der Nachweis spezifischer
carboxymethylierter Proteine zum Verständnis entzündlicher
und degenerativer Prozese beiträgt.
Vorarbeiten: In Vorabeiten wurden Modellproteine chemisch carboxymethyliert
und charakterisiert (CML-Albumin, CML-Haemoglobin, CML-
Ferritin) und ein CML-Standard synthetisiert und charakterisiert.
Nachweis der in vivo-Formation von CML im Urin, in
Geweben und in zirkulierenden Entzündungszellen
• Es wurde eine spezifische, reproduzierbare und sensitive
HPLC-Methode zur Bestimmung der CML Ausscheidung im
Urin entwickelt und veröffentlicht [159]. Diabetiker zeigten
eine um 30 % erhöhte Ausscheidung von Gesamt-CML,
bedingt durch eine erhöhte Ausscheidung von CML-Albumin.
Rund 40% des ausgeschiedenen CML liegen als freie
Zusammenfassung (Deutsch)
154
Aminosäure und 60% als peptid- und proteingebundenes
CML vor.
• Mit einem hier erzeugten spezifischen CML-Antiserum und
mit monoklonalen CML-Antikörpern wurde
immunhistochemisch (IHC) und mittels Western Blot die
vermehrte Bildung carboxymethylierter Proteine in Nerven-
und Muskelgewebe bei Diabetes mellitus und in Knorpel-,
Nerven- und Muskelgewebe bei verschiedenen chronisch-
entzündlichen und degenerativen Zuständen gefunden. Diese
Arbeiten wurden in Kooperation mit Dr. M. Haslbeck,
Erlangen, und Dr. Schwab, Dresden, durchgeführt. Auffällig
war die teilweise intrazelluläre Lokalisation (IHC) der CML-
Akkumulation in geweberesidenten Zellen und infiltrierenden
Entzündungszellen.
• Des Weiteren wurde untersucht, ob eine verstärkte
intrazelluläre CML-Bildung auch in zirkulierenden Leukozyten
von Diabetikern nachweisbar ist. Dazu wurden Granulozyten,
Monozyten und Lymphozyten von Normalpatienten und
Diabetikern durch Immunabsorption mit Magnetbeads
entsprechend ihrer Oberflächenmarker isoliert. Bei einem Teil
der diabetischen Patienten (2 von 8 Patienten) wurden in
Granulozyten durch Carboxymethylierung modifizierte
zelluläre Proteine gefunden.
Mechanismus der CML Bildung:
• Lipidperoxidation führt zur Proteincarboxymethylierung in
vitro:
Es wurde untersucht, ob der oxidative Abbau mehrfach
ungesättigter Fettsäuren (Lipidperoxidation) in vitro zu einer
Carboxymethylierung des Modellproteins RNAse führt. Des
Zusammenfassung (Deutsch)
155
Weiteren wurde der Einfluß reaktiver Sauerstoffspezies
(H2O2, Superoxidanionen) auf die CML-Modifikation von
RNAse untersucht. Eingesetzt wurden Ölsäure, Linolensäure
und Arachidonsäure.
Ergebnis: Es hat sich gezeigt, daß die Carboxymethylierung
(a) ein sauerstoffabhängiger Prozess ist, (b) die
Reaktionsgeschwindigkeit mit der Anzahl der
Doppelbindungen in der Fettsäure steigt und bei
Arachidonsäure am höchsten liegt und sich (c) durch H2O2
oder ein O2. _ generierendes System nicht steigern läßt.
• Der ‚oxidative burst‘ stimulierter Granulozyten führt zur
Carboxymethylierung von Serumproteinen:
Granulozyten zeigen nach Stimulation mit LPS oder
opsonisiertem Zymosan eine massive Freisetzung von
granulär gespeicherten Effektorenzymen, insbesondere von
NADPH-Oxidase und Myeloperoxidase. Dadurch kommt es
lokal zu sehr hohen Konzentrationen reaktiver
Sauerstoffspezies.
In frisch isolierten Granulozyten führt die Stimulation des
‚oxidativen burst‘ zu einer Zelllyse innerhalb von 1-2 Stunden.
Dieses System demonstriert den Beitrag der
Myeloperoxidase und anderer Effektorenzyme zur CML-
Bildung, eignet sich jedoch nicht zur Untersuchung der
intrazellulären Protein-Carboxymethylierung.
• Die in vitro Stimulation vordifferenzierter Monozyten- und
Mikroglia-Zelllinien führt zur zeitabhängigen CML-
Modifikation intrazellulärer Proteine. Die CML-Bildung ist
unabhängig von der zellulären NADPH-Oxidase und Xanthin-
Zusammenfassung (Deutsch)
156
Oxidase und läßt sich durch Hemmstoffe der mitochondrialen
ROS-Produktion nicht durchgängig hemmen:
Die Kinetik der CML-Bildung und der Beitrag der
phagozytären (PHOX) Form der NADPH-Oxidase wurde in
den monozytären Zelllinien Mono Mac 6, PLB 985 (Wildtyp)
und PLB 985gp91∆488-497 (PHOX-defizient) und in der
Neuroglia-Zelllinie N11 (Wildtyp) und N11/6 (PHOX-defizient)
mittels spezifischer polyklonaler und monoklonaler CML-
Antikörper untersucht. Zur Bestimmung der ROS-Produktion
und der NADPH-Oxidase Aktivität wurde ein Lucigenin-
Chemilumineszenztest entsprechend der Vorschrift von
Griendling et al. [144] mit Modifikationen verwendet.
In vordifferenzierten und stimulierten (PMA 20nM) Mono Mac
6 Zellen wurde eine zeitabhängige CML-Modifikation
intrazellulärer Protein innerhalb von 1 – 3 Tagen beobachtet.
Diese konnte durch DPI (100µM), einen unspezifischen
Inhibitor der NADPH-Oxidase und anderer Flavoproteine,
gehemmt werden. Hemmstoffe der Xanthin-Oxidase
(Allopurinol 300µM) oder der NO-Synthase (L-NAME)
reduzieren die CML-Bildung nicht. Hemmstoffe der
mitochondrialen ROS-Bildung zeigten keinen einheitlichen
Effekt auf die CML-Modifikation zellulärer Proteine. N11
Zellen zeigten CML-Bildung innerhalb von 24 h. In den
NADPH-defizienten Mutanten war die CML-Bildung nicht
unterdrückt.
Ergebnis: Die beobachtete CML-Modifikation zellulärer
Protein ist unabhängig von NADPH-Oxidase oder Xanthin-
Oxidase und läßt sich durch Inhibitoren der mitochondrialen
ROS-Produktion nicht generell reduzieren. Andere, bislang
Zusammenfassung (Deutsch)
157
ungeklärte Quellen für reaktive Sauerstoffverbindungen oder
bislang unbekannte Mechanismen scheinen für die CML-
Bildung verantwortlich zu sein.
Zusammenfassung: Zusammenfassend erscheint es aus den vorgelegten
Ergebnissen unwahrscheinlich, daß CML durch einen einzelnen,
spezifischen Mechanismus und aus einer einzelnen, definierten
Vorläufersubstanz gebildet wird. Durch Untersuchungen mit
NADPH-Oxidase defizienten Zelllinien wurde nachgewiesen, daß
CML kein spezifischer Marker für die zelluläre NADPH-
Oxidaseaktivität ist.
Summary (English)
158
7 SUMMARY (ENGLISH) Aims of this study: In the present study, the hypothesis was tested, whether the
advanced glycation end product (AGE) Nε-(carboxymethyl)-lysine
(CML) is
(a) produced intracellularly in macrophages and granulocytes,
(b) a product of lipid peroxidation,
(c) formed under the influence of reactive oxygen species (ROS),
especially the superoxide anion, produced by cellular NADPH
oxidase.
Furthermore, it was studied, whether
(d) the detection and measurement of CML in tissues and body
fluids and the identification of specific CML-modified proteins may
add to the understanding of the pathophysiological processes in
chronic inflammatory and degenerative diseases.
Preparatory work: In preparation for this study, test proteins were chemically
carboxymethylated and analysed (CML-albumin, CML-
hemoglobin, CML-ferritin), and a CML-standard was synthesised
and characterised.
Detection of the in vivo formation of CML in urine, tissues,
and circulating leukocytes: A specific, sensitive and reproducible HPLC method for the
analysis of CML excretion in urine was developed [159]. Diabetic
patients exhibited a 30 % increase in the excretion of total CML
due to an increase in CML albumin excretion. About 40% CML is
excreted as free amino acid, while the remaining 60% is peptide-
and protein-bound CML.
Summary (English)
159
By immunohistochemistry (IHC) and Western blot techniques,
using a specific CML antiserum and monoclonal CML-antibodies,
an increase in the formation of CML-modified proteins in nerve
tissue, muscle tissue and cartilage tissue has been found in
diabetics and in various chronic inflammatory and degenerative
conditions. A common feature concerning these findings was the
intracellular localisation (IHC) of CML accumulation in resident
and infiltrating inflammatory cells.
Because of this result, it was investigated further as to whether an
increased intracellular CML accumulation could be seen in the
circulating leukocytes of diabetics. For this purpose, granulocytes,
monocytes and lymphocytes from control patients and diabetics
were isolated by immunoabsorption with magnetic beads. CML-
modified cellular proteins were found in granulocytes from a
minor portion of the diabetic patients (2/8).
Potential mechanisms of CML formation Lipid peroxidation leads to carboxymethylation of proteins in vitro
:
It was investigated, whether the oxidative degradation of the poly-
unsaturated fatty acids (oleic acid, linolenic acid, and arachidonic
acid) leads to a carboxymethylation of the model protein RNAse.
The influence of reactive oxygen species (superoxide anions and
H2O2) on the CML modification of RNAse was also investigated.
It was found that
(a) carboxymethylation is an oxygen-dependent process,
(b) the degree of CML modification increases with the number of
double bonds in the fatty acids (highest in arachidonic acid),
(c) the degree of carboxymethylation could not be increased by
H2O2 or by superoxide anion-generating systems.
Summary (English)
160
The “oxidative burst” of stimulated granulocytes leads to CML
modification of serum proteins:
Freshly isolated granulocytes were stimulated by LPS or
opsonised zymosan to study the contribution of NADPH oxidase
and myeloperoxidase, released during the “oxidative burst”, to the
carboxymethylation of serum proteins.
The ‘oxidative burst’ of granulocytes leads to a rapid
carboxymethylation of ambient serum proteins and of cellular
proteins, set free during cell lysis. This result demonstrates the
contribution of myeloperoxidase and other effector enzymes to
the formation of CML. However, the technique is not suitable for
investigating intracellular carboxymethylation since rapid cell lysis
occurs within 60 – 120 min.
The stimulation of differentiated monocytic and microglia cell lines
leads to time-dependent CML modification of intracellular proteins
in vitro:
The kinetics of CML formation and the contribution of the
phagocytic (PHOX) form of NADPH oxidase were analysed in the
monocytic cell lines Mono Mac 6, PLB 985 (wild type) and PLB
985gp91∆488-497 (PHOX-deficient), and in the neuroglia-cell
lines N11 (wild type) and N11/6 (PHOX-deficient), using specific
polyclonal and monoclonal antibodies directed against CML. For
the analysis of ROS production and the measurement of NADPH
oxidase activity, a lucigenin chemiluminescence test was used
according to Griendling et al. [144]. In pre-differentiated and
stimulated (PMA 20nM) Mono Mac 6 cells, a time-dependent
CML modification of intracellular proteins was observed within 1-3
days. This effect could be blocked by DPI (100µM), an unspecific
inhibitor of NADPH oxidase and other flavoproteins. Inhibitors of
Summary (English)
161
xanthine oxidase (allopurinol 300µM) or of NO-Synthase (L-
NAME) had no effect. The effects of various inhibitors of
mitochondrial ROS production were not conclusive.
N11 cells showed CML-formation within 24 h. CML formation was
not reduced in NADPH oxidase deficient mutants, neither in
monocytic PLB 985gp91∆488-497 nor in microglial N11/6 cells.
The observed CML modification of cellular proteins is
independent of NADPH oxidase or xanthine oxidase. The direct
or indirect inhibition of mitochondrial ROS production does not
lead to a general reduction of CML formation. Other unidentified
sources of reactive oxygen species or different mechanisms
appear to be responsible for the formation of CML.
In summary, this study has proven that CML is not a specific
marker for cellular NADPH oxidase activity. From the presented
results it seems not likely that CML is formed by a single
mechanism or from a single precursor.
References
162
8 REFERENCES
[1.] Maillard LC. Action des acids amines sur les sucres; formation des melanoidins par voie methodique. C R Acad Sci Ser 1912;154:66-68.
[2.] Ledl F, Beck J, Sengl M, Osiander H, Estendorfer S, Severin T, Huber B. Chemical pathways of the Maillard reaction. Prog Clin Biol Res 1989;304:23-42.
[3.] Njoroge FG, Monnier VM. The chemistry of the Maillard reaction under physiological conditions: a review. Prog Clin Biol Res 1989;304:85-107.
[4.] Brownlee M. Negative consequences of glycation. Metabolism 2000;49:9-13.
[5.] John WG, Lamb EJ. The Maillard or browning reaction in diabetes. Eye 1993;7:230-237.
[6.] Thorpe SR, Baynes JW. Role of the Maillard reaction in diabetes mellitus and diseases of aging. Drugs Aging 1996;9:69-77.
[7.] Vlassara H, Bucala R, Striker L. Pathogenic effects of advanced glycosylation: biochemical, biologic, and clinical implications for diabetes and aging. Lab Invest 1994;70:138-151.
[8.] Koenig RJ, Blobstein SH, Cerami A. Structure of carbohydrate of hemoglobin AIc. J Biol Chem 1977;252:2992-2997.
[9.] Makita Z, Vlassara H, Rayfield E, Cartwright K, Friedman E, Rodby R, Cerami A, Bucala R. Hemoglobin-AGE: a circulating marker of advanced glycosylation. Science 1992;258:651-653.
[10.] Vlassara H, Palace MR. Diabetes and advanced glycation endproducts. J Intern Med 2001;251:87-101.
References
163
[11.] Schleicher E. Glykierung von Proteinen: Pathobiochemische und diagnostische Aspekte. Lab med 1993;17:381-387.
[12.] Furth AJ. Glycated proteins in diabetes. Br J Biomed Sci 1997;54:192-200.
[13.] Monnier VM, Sell DR, Nagaraj RH, Miyata S, Grandhee S, Odetti P, Ibrahim SA. Maillard reaction-mediated molecular damage to extracellular matrix and other tissue proteins in diabetes, aging, and uremia. Diabetes 1992;41:36-41.
[14.] Wells-Knecht KJ, Brinkmann E, Wells-Knecht MC, Litchfield JE, Ahmed MU, Reddy S, Zyzak DV, Thorpe SR, Baynes JW. New biomarkers of Maillard reaction damage to proteins. Nephrol Dial Transplant 1996;11 Suppl 5:41-47.
[15.] Brownlee M. The pathological implications of protein glycation. Clin Invest Med 1995;18:275-281.
[16.] Wu JT. Advanced glycosylation end products: a new disease marker for diabetes and aging. J Clin Lab Anal 1993;7:252-255.
[17.] Monnier VM, Nagaraj RH, Portero-Otin M, Glomb M, Elgawish AH, Sell DR, Friedlander MA. Structure of advanced Maillard reaction products and their pathological role. Nephrol Dial Transplant 1996;11 Suppl 5:20-26.
[18.] Thornalley PJ. Cell activation by glycated proteins. AGE receptors, receptor recognition factors and functional classification of AGEs. Cell Mol Biol (Noisy -le-grand) 1998;44:1013-1023.
[19.] Kislinger T, Fu C, Huber B, Qu W, Taguchi A, Du YS, Hofmann M, Yan SF, Pischetsrieder M, Stern D, Schmidt AM. N(epsilon)-(carboxymethyl)lysine adducts of proteins are ligands for receptor for advanced glycation end products that activate cell signaling pathways and
References
164
modulate gene expression. J Biol Chem 1999;274:31740-31749.
[20.] Singh R, Barden A, Mori T, Beilin L. Advanced glycation end-products: a review. Diabetologia 2001;44:129-146.
[21.] Baynes JW, Thorpe SR, Murtiashaw MH. Nonenzymatic glucosylation of lysine residues in albumin. Methods Enzymol 1984;106:88-98.
[22.] Fu MX, Wells-Knecht KJ, Blackledge JA, Lyons TJ, Thorpe SR, Baynes JW. Glycation, glycoxidation, and cross-linking of collagen by glucose. Kinetics, mechanisms, and inhibition of late stages of the Maillard reaction. Diabetes 1994;43:676-683.
[23.] Thornalley PJ, Langborg A, Minhas HS. Formation of glyoxal, methylglyoxal and 3-deoxyglucosone in the glycation of proteins by glucose. Biochem J 1999;344:109-116.
[24.] Degenhardt TP, Thorpe SR, Baynes JW. Chemical modification of proteins by methylglyoxal. Cell Mol Biol (Noisy -le-grand) 1998;44:1139-1145.
[25.] Miyata T, Inagi R, Asahi K, Yamada Y, Horie K, Sakai H, Uchida K, Kurokawa K. Generation of protein carbonyls by glycoxidation and lipoxidation reactions with autoxidation products of ascorbic acid and polyunsaturated fatty acids. FEBS Lett 1998;437:24-28.
[26.] Miyata T, van Ypersele d, Kurokawa K, Baynes JW. Alterations in nonenzymatic biochemistry in uremia: origin and significance of "carbonyl stress" in long-term uremic complications. Kidney Int 1999;55:389-399.
[27.] Miyata T, Fu MX, Kurokawa K, van Ypersele d, Thorpe SR, Baynes JW. Autoxidation products of both carbohydrates and lipids are increased in uremic plasma: is there oxidative stress in uremia? Kidney Int 1998;54:1290-1295.
References
165
[28.] Miyata T, Sugiyama S, Suzuki D, Inagi R, Kurokawa K. Increased carbonyl modification by lipids and carbohydrates in diabetic nephropathy. Kidney Int 1999;71:S54-S56.
[29.] Suzuki D, Miyata T, Saotome N, Horie K, Inagi R, Yasuda Y, Uchida K, Izuhara Y, Yagame M, Sakai H, Kurokawa K. Immunohistochemical evidence for an increased oxidative stress and carbonyl modification of proteins in diabetic glomerular lesions. J Am Soc Nephrol 1999;10:822-832.
[30.] Brownlee M. Biochemistry and molecular cell biology of diabetic complications. Nature 2001;414:813-820.
[31.] Giardino I, Edelstein D, Brownlee M. Nonenzymatic glycosylation in vitro and in bovine endothelial cells alters basic fibroblast growth factor activity. A model for intracellular glycosylation in diabetes. J Clin Invest 1994;94:110-117.
[32.] Shinohara M, Thornalley PJ, Giardino I, Beisswenger P, Thorpe SR, Onorato J, Brownlee M. Overexpression of glyoxalase-I in bovine endothelial cells inhibits intracellular advanced glycation endproduct formation and prevents hyperglycemia-induced increases in macromolecular endocytosis. J Clin Invest 1998;101:1142-1147.
[33.] Thornalley PJ. The glyoxalase system: new developments towards functional characterization of a metabolic pathway fundamental to biological life. Biochem J 1990;269:1-11.
[34.] Nerlich AG, Schleicher ED. N(epsilon)-(carboxymethyl)lysine in atherosclerotic vascular lesions as a marker for local oxidative stress. Atherosclerosis 1999;144:41-47.
[35.] Thorpe SR, Baynes JW. CML: a brief history. In: Horiuchi S et al., eds. The Maillard Reaction in Food Chemistry and Medical Science: Update for the Postgenomic Era.
References
166
Elsevier International Congress Series. Volume 1245. Amsterdam: Elsevier, 2002.
[36.] Shaw JN, Baynes JW, Thorpe SR. N epsilon-(carboxymethyl)lysine (CML) as a biomarker of oxidative stress in long-lived tissue proteins. Methods Mol Biol 2002;186:129-137.
[37.] Ikeda K, Higashi T, Sano H, Jinnouchi Y, Yoshida M, Araki T, Ueda S, Horiuchi S. N (epsilon)-(carboxymethyl)lysine protein adduct is a major immunological epitope in proteins modified with advanced glycation end products of the Maillard reaction. Biochemistry 1996;35:8075-8083.
[38.] Reddy S, Bichler J, Wells-Knecht KJ, Thorpe SR, Baynes JW. N epsilon-(carboxymethyl)lysine is a dominant advanced glycation end product (AGE) antigen in tissue proteins. Biochemistry 1995;34:10872-10878.
[39.] Ahmed MU, Thorpe SR, Baynes JW. Identification of N epsilon-carboxymethyllysine as a degradation product of fructoselysine in glycated protein. J Biol Chem 1986;261:4889-4894.
[40.] Fu MX, Requena JR, Jenkins AJ, Lyons TJ, Baynes JW, Thorpe SR. The advanced glycation end product, Nepsilon-(carboxymethyl)lysine, is a product of both lipid peroxidation and glycoxidation reactions. J Biol Chem 1996;271:9982-9986.
[41.] Schleicher ED, Wagner E, Nerlich AG. Increased accumulation of the glycoxidation product N(epsilon)-(carboxymethyl)lysine in human tissues in diabetes and aging. J Clin Invest 1997;99:457-468.
[42.] Dunn JA, Patrick JS, Thorpe SR, Baynes JW. Oxidation of Glycated Proteins: Age-Dependent Accumulation of N(epsilon)-(Carboxymethyl)lysine in Lens Proteins. Biochemistry 1989;28:9464-9468.
References
167
[43.] Dunn JA, McCance DR, Thorpe SR, Lyons TJ, Baynes JW. Age-dependent accumulation of N epsilon-(carboxymethyl)lysine and N epsilon-(carboxymethyl)hydroxylysine in human skin collagen. Biochemistry 1991;30:1205-1210.
[44.] Dyer DG, Dunn JA, Thorpe SR, Bailie KE, Lyons TJ, McCance DR, Baynes JW. Accumulation of Maillard reaction products in skin collagen in diabetes and aging. J Clin Invest 1993;91:2463-2469.
[45.] Hammes HP, Brownlee M, Lin J, Schleicher E, Bretzel RG. Diabetic retinopathy risk correlates with intracellular concentrations of the glycoxidation product Nepsilon-(carboxymethyl) lysine independently of glycohaemoglobin concentrations. Diabetologia 1999;42:603-607.
[46.] Horiuchi S, Sano H, Higashi T, Ikeda K, Jinnouchi Y, Nagai R, Takahashi K. Extra- and intracellular localization of advanced glycation end-products in human atherosclerotic lesions. Nephrol Dial Transplant 1996;11 Suppl 5:81-86.
[47.] Ceriello A. Hyperglycaemia: the bridge between non-enzymatic glycation and oxidative stress in the pathogenesis of diabetic complications. Diabetes Nutr Metab 1999;12:42-46.
[48.] Giugliano D, Ceriello A, Paolisso G. Oxidative stress and diabetic vascular complications. Diabetes Care 1996;19:257-267.
[49.] Friedman EA. Advanced glycosylated end products and hyperglycemia in the pathogenesis of diabetic complications. Diabetes Care 1999;22 Suppl 2:B65-B71.
[50.] McCance DR, Dyer DG, Dunn JA, Bailie KE, Thorpe SR, Baynes JW, Lyons TJ. Maillard reaction products and their relation to complications in insulin-dependent diabetes mellitus. J Clin Invest 1993;91:2470-2478.
References
168
[51.] Koya D, King GL. Protein kinase C activation and the development of diabetic complications. Diabetes 1998;47:859-866.
[52.] Lee AY, Chung SS. Contributions of polyol pathway to oxidative stress in diabetic cataract. FASEB J 1999;13:23-30.
[53.] Veerababu G, Tang J, Hoffman RT, Daniels MC, Hebert LF, Jr., Crook ED, Cooksey RC, McClain DA. Overexpression of glutamine: fructose-6-phosphate amidotransferase in the liver of transgenic mice results in enhanced glycogen storage, hyperlipidemia, obesity, and impaired glucose tolerance. Diabetes 2000;49:2070-2078.
[54.] Nishikawa T, Edelstein D, Du XL, Yamagishi S, Matsumura T, Kaneda Y, Yorek MA, Beebe D, Oates PJ, Hammes HP, Giardino I, Brownlee M. Normalizing mitochondrial superoxide production blocks three pathways of hyperglycaemic damage. Nature 2000;404:787-790.
[55.] Nishikawa T, Edelstein D, Brownlee M. The missing link: a single unifying mechanism for diabetic complications. Kidney Int 2000;77:S26-S30.
[56.] Baynes JW, Thorpe SR. Role of oxidative stress in diabetic complications: a new perspective on an old paradigm. Diabetes 1999;48:1-9.
[57.] Wolff SP, Jiang ZY, Hunt JV. Protein glycation and oxidative stress in diabetes mellitus and ageing. Free Radic Biol Med 1991;10:339-352.
[58.] Wolff SP. Diabetes mellitus and free radicals. Free radicals, transition metals and oxidative stress in the aetiology of diabetes mellitus and complications. Br Med Bull 1993;49:642-652.
[59.] Laaksonen DE, Atalay M, Niskanen L, Uusitupa M, Hanninen O, Sen CK. Increased resting and exercise-
References
169
induced oxidative stress in young IDDM men. Diabetes Care 1996;19:569-574.
[60.] Altomare E, Vendemiale G, Chicco D, Procacci V, Cirelli F. Increased lipid peroxidation in type 2 poorly controlled diabetic patients. Diabete Metab 1992;18:264-271.
[61.] Haffner SM, Agil A, Mykkanen L, Stern MP, Jialal I. Plasma oxidizability in subjects with normal glucose tolerance, impaired glucose tolerance, and NIDDM. Diabetes Care 1995;18:646-653.
[62.] MacRury SM, Gordon D, Wilson R, Bradley H, Gemmell CG, Paterson JR, Rumley AG, MacCuish AC. A comparison of different methods of assessing free radical activity in type 2 diabetes and peripheral vascular disease. Diabet Med 1993;10:331-335.
[63.] Nourooz-Zadeh J, Tajaddini-Sarmadi J, McCarthy S, Betteridge DJ, Wolff SP. Elevated levels of authentic plasma hydroperoxides in NIDDM. Diabetes 1995;44:1054-1058.
[64.] Rosen P, Nawroth PP, King G, Moller W, Tritschler HJ, Packer L. The role of oxidative stress in the onset and progression of diabetes and its complications: a summary of a Congress Series sponsored by UNESCO-MCBN, the American Diabetes Association and the German Diabetes Society. Diabetes Metab Res Rev 2001;17:189-212.
[65.] Nishikawa T, Edelstein D, Du XL, Yamagishi S, Matsumura T, Kaneda Y, Yorek MA, Beebe D, Oates PJ, Hammes HP, Giardino I, Brownlee M. Normalizing mitochondrial superoxide production blocks three pathways of hyperglycaemic damage. Nature 2000;404:787-790.
[66.] Mullarkey CJ, Edelstein D, Brownlee M. Free radical generation by early glycation products: a mechanism for accelerated atherogenesis in diabetes. Biochem Biophys Res Commun 1990;173:932-939.
References
170
[67.] Yan SD, Schmidt AM, Anderson GM, Zhang J, Brett J, Zou YS, Pinsky D, Stern D. Enhanced cellular oxidant stress by the interaction of advanced glycation end products with their receptors/binding proteins. J Biol Chem 1994;269:9889-9897.
[68.] Noberasco G, Odetti P, Boeri D, Maiello M, Adezati L. Malondialdehyde (MDA) level in diabetic subjects. Relationship with blood glucose and glycosylated hemoglobin. Biomed Pharmacother 1991;45:193-196.
[69.] Packer L, Witt EH, Tritschler HJ. alpha-Lipoic acid as a biological antioxidant. Free Radic Biol Med 1995;19:227-250.
[70.] Suzuki YJ, Tsuchiya M, Packer L. Lipoate prevents glucose-induced protein modifications. Free Radic Res Commun 1992;17:211-217.
[71.] Borcea V, Nourooz-Zadeh J, Wolff SP, Klevesath M, Hofmann M, Urich H, Wahl P, Ziegler R, Tritschler H, Halliwell B, Nawroth PP. alpha-Lipoic acid decreases oxidative stress even in diabetic patients with poor glycemic control and albuminuria. Free Radic Biol Med 1999;26:1495-1500.
[72.] Maxwell SR, Thomason H, Sandler D, LeGuen C, Baxter MA, Thorpe GH, Jones AF, Barnett AH. Poor glycaemic control is associated with reduced serum free radical scavenging (antioxidant) activity in non-insulin-dependent diabetes mellitus. Ann Clin Biochem 1997;34:638-644.
[73.] Sundaram RK, Bhaskar A, Vijayalingam S, Viswanathan M, Mohan R, Shanmugasundaram KR. Antioxidant status and lipid peroxidation in type II diabetes mellitus with and without complications. Clin Sci (Lond) 1996;90:255-260.
[74.] Atalay M, Laaksonen DE, Niskanen L, Uusitupa M, Hanninen O, Sen CK. Altered antioxidant enzyme defences in insulin-dependent diabetic men with increased resting and exercise-induced oxidative stress. Acta Physiol Scand 1997;161:195-201.
References
171
[75.] Nourooz-Zadeh J, Rahimi A, Tajaddini-Sarmadi J, Tritschler H, Rosen P, Halliwell B, Betteridge DJ. Relationships between plasma measures of oxidative stress and metabolic control in NIDDM. Diabetologia 1997;40:647-653.
[76.] Hofmann MA, Schiekofer S, Isermann B, Kanitz M, Henkels M, Joswig M, Treusch A, Morcos M, Weiss T, Borcea V, Abdel KA, Amiral J, Tritschler H, Ritz E, Wahl P, Ziegler R, Bierhaus A, Nawroth PP. Peripheral blood mononuclear cells isolated from patients with diabetic nephropathy show increased activation of the oxidative-stress sensitive transcription factor NF-kappaB. Diabetologia 1999;42:222-232.
[77.] Bierhaus A, Chevion S, Chevion M, Hofmann M, Quehenberger P, Illmer T, Luther T, Berentshtein E, Tritschler H, Muller M, Wahl P, Ziegler R, Nawroth PP. Advanced glycation end product-induced activation of NF-kappaB is suppressed by alpha-lipoic acid in cultured endothelial cells. Diabetes 1997;46:1481-1490.
[78.] Halliwell B. The role of oxygen radicals in human disease, with particular reference to the vascular system. Haemostasis 1993;23 Suppl 1:118-126.
[79.] Finkel T, Holbrook NJ. Oxidants, oxidative stress and the biology of ageing. Nature 2000;408:239-247.
[80.] Halliwell B, Gutteridge JMC. Free radicals in biology and medicine. 3rd ed. Oxford, UK: Oxford Science Publications, 1998.
[81.] Halliwell B. Antioxidants in human health and disease. Annu Rev Nutr 1996;16:33-50.
[82.] Sies H. Strategies of antioxidant defense. Eur J Biochem 1993;215:213-219.
[83.] Stahl W, Sies H. Antioxidant defense: vitamins E and C and carotenoids. Diabetes 1997;46 Suppl 2:S14-S18.
References
172
[84.] Wolff SP, Dean RT. Glucose autoxidation and protein modification. The potential role of 'autoxidative glycosylation' in diabetes. Biochem J 1987;245:243-250.
[85.] Wells-Knecht KJ, Zyzak DV, Litchfield JE, Thorpe SR, Baynes JW. Mechanism of autoxidative glycosylation: identification of glyoxal and arabinose as intermediates in the autoxidative modification of proteins by glucose. Biochemistry 1995;34:3702-3709.
[86.] Dunn JA, Ahmed MU, Murtiashaw MH, Richardson JM, Walla MD, Thorpe SR, Baynes JW. Reaction of ascorbate with lysine and protein under autoxidizing conditions: formation of N epsilon-(carboxymethyl)lysine by reaction between lysine and products of autoxidation of ascorbate. Biochemistry 1990;29:10964-10970.
[87.] Litchfield JE, Thorpe SR, Baynes JW. Oxygen is not required for the browning and crosslinking of protein by pentoses: relevance to Maillard reactions in vivo. Int J Biochem Cell Biol 1999;31:1297-1305.
[88.] Niwa H, Takeda A, Wakai M, Miyata T, Yasuda Y, Mitsuma T, Kurokawa K, Sobue G. Accelerated formation of N epsilon-(carboxymethyl) lysine, an advanced glycation end product, by glyoxal and 3-deoxyglucosone in cultured rat sensory neurons. Biochem Biophys Res Commun 1998;248:93-97.
[89.] Glomb MA, Monnier VM. Mechanism of protein modification by glyoxal and glycolaldehyde, reactive intermediates of the Maillard reaction. J Biol Chem 1995;270:10017-10026.
[90.] Fu S, Fu MX, Baynes JW, Thorpe SR, Dean RT. Presence of dopa and amino acid hydroperoxides in proteins modified with advanced glycation end products (AGEs): amino acid oxidation products as a possible source of oxidative stress induced by AGE proteins. Biochem J 1998;330:233-239.
References
173
[91.] Hamada Y, Nakamura J, Naruse K, Komori T, Kato K, Kasuya Y, Nagai R, Horiuchi S, Hotta N. Epalrestat, an aldose reductase ihibitor, reduces the levels of Nepsilon-(carboxymethyl)lysine protein adducts and their precursors in erythrocytes from diabetic patients. Diabetes Care 2000;23:1539-1544.
[92.] Smith PR, Thornalley PJ. Mechanism of the degradation of non-enzymatically glycated proteins under physiological conditions. Studies with the model fructosamine, N epsilon-(1-deoxy-D-fructos-1-yl)hippuryl-lysine. Eur J Biochem 1992;210:729-739.
[93.] Hunt JV, Dean RT, Wolff SP. Hydroxyl radical production and autoxidative glycosylation. Glucose autoxidation as the cause of protein damage in the experimental glycation model of diabetes mellitus and ageing. Biochem J 1988;256:205-212.
[94.] Hunt JV, Smith CC, Wolff SP. Autoxidative glycosylation and possible involvement of peroxides and free radicals in LDL modification by glucose. Diabetes 1990;39:1420-1424.
[95.] Jiang ZY, Woollard AC, Wolff SP. Hydrogen peroxide production during experimental protein glycation. FEBS Lett 1990;268:69-71.
[96.] Saxena AK, Saxena P, Wu X, Obrenovich M, Weiss MF, Monnier VM. Protein aging by carboxymethylation of lysines generates sites for divalent metal and redox active copper binding: relevance to diseases of glycoxidative stress. Biochem Biophys Res Commun 1999;260:332-338.
[97.] Requena JR, Stadtman ER. Conversion of lysine to N(epsilon)-(carboxymethyl)lysine increases susceptibility of proteins to metal-catalyzed oxidation. Biochem Biophys Res Commun 1999;264:207-211.
[98.] Nagai R, Unno Y, Hayashi MC, Masuda S, Hayase F, Kinae N, Horiuchi S. Peroxynitrite induces formation of N(
References
174
epsilon )-(carboxymethyl) lysine by the cleavage of Amadori product and generation of glucosone and glyoxal from glucose: novel pathways for protein modification by peroxynitrite. Diabetes 2002;51:2833-2839.
[99.] Wells-Knecht MC, Thorpe SR, Baynes JW. Pathways of formation of glycoxidation products during glycation of collagen. Biochemistry 1995;34:15134-15141.
[100.] Kennedy AL, Lyons TJ. Glycation, oxidation, and lipoxidation in the development of diabetic complications. Metabolism 1997;46:14-21.
[101.] Drinda S, Franke S, Canet CC, Petrow P, Brauer R, Huttich C, Stein G, Hein G. Identification of the advanced glycation end products N(epsilon)-carboxymethyllysine in the synovial tissue of patients with rheumatoid arthritis. Ann Rheum Dis 2002;61:488-492.
[102.] Takeda A, Wakai M, Niwa H, Dei R, Yamamoto M, Li M, Goto Y, Yasuda T, Nakagomi Y, Watanabe M, Inagaki T, Yasuda Y, Miyata T, Sobue G. Neuronal and glial advanced glycation end product [Nepsilon-(carboxymethyl)lysine]] in Alzheimer's disease brains. Acta Neuropathol (Berl) 2001;101:27-35.
[103.] Munch G, Cunningham AM, Riederer P, Braak E. Advanced glycation endproducts are associated with Hirano bodies in Alzheimer's disease. Brain Res 1998;796:307-310.
[104.] Dei R, Takeda A, Niwa H, Li M, Nakagomi Y, Watanabe M, Inagaki T, Washimi Y, Yasuda Y, Horie K, Miyata T, Sobue G. Lipid peroxidation and advanced glycation end products in the brain in normal aging and in Alzheimer's disease. Acta Neuropathol (Berl) 2002;104:113-122.
[105.] Weiss MF, Erhard P, Kader-Attia FA, Wu YC, Deoreo PB, Araki A, Glomb MA, Monnier VM. Mechanisms for the formation of glycoxidation products in end-stage renal disease. Kidney Int 2000;57:2571-2585.
References
175
[106.] Horie K, Miyata T, Maeda K, Miyata S, Sugiyama S, Sakai H, van Ypersole dS, Monnier VM, Witztum JL, Kurokawa K. Immunohistochemical colocalization of glycoxidation products and lipid peroxidation products in diabetic renal glomerular lesions. Implication for glycoxidative stress in the pathogenesis of diabetic nephropathy. J Clin Invest 1997;100:2995-3004.
[107.] Takayama F, Aoyama I, Tsukushi S, Miyazaki T, Miyazaki S, Morita T, Hirasawa Y, Shimokata K, Niwa T. Immunohistochemical detection of imidazolone and N(epsilon)-(carboxymethyl)lysine in aortas of hemodialysis patients. Cell Mol Biol (Noisy -le-grand) 1998;44:1101-1109.
[108.] Kislinger T, Fu C, Huber B, Qu W, Taguchi A, Du YS, Hofmann M, Yan SF, Pischetsrieder M, Stern D, Schmidt AM. N(epsilon)-(carboxymethyl)lysine adducts of proteins are ligands for receptor for advanced glycation end products that activate cell signaling pathways and modulate gene expression. J Biol Chem 1999;274:31740-31749.
[109.] Schiekofer S, Andrassy M, Chen J, Rudofsky G, Schneider J, Wendt T, Stefan N, Humpert P, Fritsche A, Stumvoll M, Schleicher E, Haring HU, Nawroth PP, Bierhaus A. Acute Hyperglycemia Causes Intracellular Formation of CML and Activation of ras, p42/44 MAPK, and Nuclear Factor kappaB in PBMCs. Diabetes 2003;52:621-633.
[110.] Zill H, Gunther R, Erbersdobler HF, Folsch UR, Faist V. RAGE expression and AGE-induced MAP kinase activation in Caco-2 cells. Biochem Biophys Res Commun 2001;288:1108-1111.
[111.] Borrebaek J, Prydz K, Fjeldstad K, Vuong TT, Berg TJ, Holkov C, Kolset SO. The AGE product N epsilon-(carboxymethyl)lysine serum albumin is a modulator of proteoglycan expression in polarized cultured kidney epithelial cells. Diabetologia 2001;44:488-494.
References
176
[112.] Wautier MP, Chappey O, Corda S, Stern DM, Schmidt AM, Wautier JL. Activation of NADPH oxidase by AGE links oxidant stress to altered gene expression via RAGE. Am J Physiol Endocrinol Metab 2001;280:E685-E694.
[113.] Nakamura S, Makita Z, Ishikawa S, Yasumura K, Fujii W, Yanagisawa K, Kawata T, Koike T. Progression of nephropathy in spontaneous diabetic rats is prevented by OPB-9195, a novel inhibitor of advanced glycation. Diabetes 1997;46:895-899.
[114.] Nakamura S, Tachikawa T, Tobita K, Aoyama I, Takayama F, Enomoto A, Niwa T. An inhibitor of advanced glycation end product formation reduces N epsilon-(carboxymethyl)lysine accumulation in glomeruli of diabetic rats. Am J Kidney Dis 2003;41:S68-S71.
[115.] Schmidt AM, Hori O, Cao R, Yan SD, Brett J, Wautier JL, Ogawa S, Kuwabara K, Matsumoto M, Stern D. RAGE: a novel cellular receptor for advanced glycation end products. Diabetes 1996;45 Suppl 3:S77-S80.
[116.] Schmidt AM, Yan SD, Yan SF, Stern DM. The biology of the receptor for advanced glycation end products and its ligands. Biochim Biophys Acta 2000;1498:99-111.
[117.] Bierhaus A, Schiekofer S, Schwaninger M, Andrassy M, Humpert PM, Chen J, Hong M, Luther T, Henle T, Kloting I, Morcos M, Hofmann M, Tritschler H, Weigle B, Kasper M, Smith M, Perry G, Schmidt AM, Stern DM, Haring HU, Schleicher E, Nawroth PP. Diabetes-associated sustained activation of the transcription factor nuclear factor-kappaB. Diabetes 2001;50:2792-2808.
[118.] Bierhaus A, Hofmann MA, Ziegler R, Nawroth PP. AGEs and their interaction with AGE-receptors in vascular disease and diabetes mellitus. I. The AGE concept. Cardiovasc Res 1998;37:586-600.
[119.] Tanji N, Markowitz GS, Fu C, Kislinger T, Taguchi A, Pischetsrieder M, Stern D, Schmidt AM, D'Agati VD. Expression of advanced glycation end products and their
References
177
cellular receptor RAGE in diabetic nephropathy and nondiabetic renal disease. J Am Soc Nephrol 2000;11:1656-1666.
[120.] Stitt AW, Li YM, Gardiner TA, Bucala R, Archer DB, Vlassara H. Advanced glycation end products (AGEs) co-localize with AGE receptors in the retinal vasculature of diabetic and of AGE-infused rats. Am J Pathol 1997;150:523-531.
[121.] Soulis T, Thallas V, Youssef S, Gilbert RE, McWilliam BG, Murray-McIntosh RP, Cooper ME. Advanced glycation end products and their receptors co-localise in rat organs susceptible to diabetic microvascular injury. Diabetologia 1997;40:619-628.
[122.] Hori O, Yan SD, Ogawa S, Kuwabara K, Matsumoto M, Stern D, Schmidt AM. The receptor for advanced glycation end-products has a central role in mediating the effects of advanced glycation end-products on the development of vascular disease in diabetes mellitus. Nephrol Dial Transplant 1996;11 Suppl 5:13-16.
[123.] Schmidt AM, Hori O, Brett J, Yan SD, Wautier JL, Stern D. Cellular receptors for advanced glycation end products. Implications for induction of oxidant stress and cellular dysfunction in the pathogenesis of vascular lesions. Arterioscler Thromb 1994;14:1521-1528.
[124.] Hammes HP, Hoerauf H, Alt A, Schleicher E, Clausen JT, Bretzel RG, Laqua H. N(epsilon)(carboxymethyl)lysin and the AGE receptor RAGE colocalize in age-related macular degeneration. Invest Ophthalmol Vis Sci 1999;40:1855-1859.
[125.] Giardino I, Edelstein D, Brownlee M. BCL-2 expression or antioxidants prevent hyperglycemia-induced formation of intracellular advanced glycation endproducts in bovine endothelial cells. J Clin Invest 1996;97:1422-1428.
[126.] Kasper M, Roehlecke C, Witt M, Fehrenbach H, Hofer A, Miyata T, Weigert C, Funk RH, Schleicher ED. Induction
References
178
of apoptosis by glyoxal in human embryonic lung epithelial cell line L132. Am J Respir Cell Mol Biol 2000;23:485-491.
[127.] Kikuchi S, Shinpo K, Moriwaka F, Makita Z, Miyata T, Tashiro K. Neurotoxicity of methylglyoxal and 3-deoxyglucosone on cultured cortical neurons: synergism between glycation and oxidative stress, possibly involved in neurodegenerative diseases. J Neurosci Res 1999;57:280-289.
[128.] Pamplona R, Portero-Otin M, Bellmun MJ, Gredilla R, Barja G. Aging increases Nepsilon-(carboxymethyl)lysine and caloric restriction decreases Nepsilon-(carboxyethyl)lysine and Nepsilon-(malondialdehyde)lysine in rat heart mitochondrial proteins. Free Radic Res 2002;36:47-54.
[129.] Pamplona R, Portero-Otin M, Requena J, Gredilla R, Barja G. Oxidative, glycoxidative and lipoxidative damage to rat heart mitochondrial proteins is lower after 4 months of caloric restriction than in age-matched controls. Mech Aging Dev 2002;123:1437-1446.
[130.] Anderson MM, Requena JR, Crowley JR, Thorpe SR, Heinecke JW. The myeloperoxidase system of human phagocytes generates Nepsilon-(carboxymethyl)lysine on proteins: a mechanism for producing advanced glycation end products at sites of inflammation. J Clin Invest 1999;104:103-113.
[131.] Schleicher E, Nerlich A, Haslbeck M, Heuss D, Kasper M, Bierhaus A, Nawroth PP, Haering HU, Friess U. Formation of N(epsilon)-(carboxymethyl)lysine in inflammatory and noninflammatory conditions of nerve and muscle and in inflammatory cells in vitro. In: Horiuchi S and et.al., eds. The Maillard Reaction in Food Chemistry and Medical Science: Update for the Postgenomic Era. Elsevier International Congress Series. Elsevier, Amsterdam, 2002:53-59.
References
179
[132.] Griendling KK, Sorescu D, Ushio-Fukai M. NAD(P)H oxidase: role in cardiovascular biology and disease. Circ Res 2000;86:494-501.
[133.] Ziegler-Heitbrock HW, Thiel E, Futterer A, Herzog V, Wirtz A, Riethmuller G. Establishment of a human cell line (Mono Mac 6) with characteristics of mature monocytes. Int J Cancer 1988;41:456-461.
[134.] Yu L, Cross AR, Zhen L, Dinauer MC. Functional analysis of NADPH oxidase in granulocytic cells expressing a delta488-497 gp91(phox) deletion mutant. Blood 1999;94:2497-2504.
[135.] Weber C, Aepfelbacher M, Haag H, Ziegler-Heitbrock HW, Weber PC. Tumor necrosis factor induces enhanced responses to platelet-activating factor and differentiation in human monocytic Mono Mac 6 cells. Eur J Immunol 1993;23:852-859.
[136.] Ziegler-Heitbrock HW, Schraut W, Wendelgaß.P., Ströbel MST, Weber C, Aepfelbacher M, Ehlers M, Schütt C, Haas JG. Distinct patterns of differentiation induced in the monocytic cell line Mono Mac 6. Journal of Leukocyte Biology 1994;55:73-80.
[137.] Perkins SL, Link DC, Kling S, Ley TJ, Teitelbaum SL. 1,25-Dihydroxyvitamin D3 induces monocytic differentiation of the PLB-985 leukemic line and promotes c-fgr mRNA expression. J Leukoc Biol 1991;50:427-433.
[138.] Onorato JM, Jenkins AJ, Thorpe SR, Baynes JW. Pyridoxamine, an inhibitor of advanced glycation reactions, also inhibits advanced lipoxidation reactions. Mechanism of action of pyridoxamine. J Biol Chem 2000;275:21177-21184.
[139.] Liardon R, Weck-Gaudard D, Philipossian G, Finot P. Identification of N(epsilon)-Carboxymethyllysine: A new Maillard Raection Product, in Rat Urine. J Agric Food Chem 1987;35:427-431.
References
180
[140.] Gempel KE, Wagner EM, Schleicher ED. Production and Characterization of Antibodies against Carboxymethyllysine-modified Proteins. Maillard Reactions in Chemistry, Food and Health 1994;392-396.
[141.] Haslbeck KM, Schleicher ED, Friess U, Kirchner A, Neundorfer B, Heuss D. N(epsilon)-Carboxymethyllysine in diabetic and non-diabetic polyneuropathies. Acta Neuropathol (Berl) 2001;104:45-52.
[142.] Schwab W, Friess U, Hempel U, Schulze E, Makita Z, Kasper M, Simank HG. Immunohistochemical demonstration of N(epsilon)-carboxymethyllysine protein adduct in normal and osteoarthritic cartilage. Histochem Cell Biol 2002;117:541-546.
[143.] Gerber CE, Kuci S, Zipfel M, Niethammer D, Bruchelt G. Phagocytic activity and oxidative burst of granulocytes in persons with myeloperoxidase deficiency. Eur J Clin Chem Clin Biochem 1996;34:901-908.
[144.] Griendling KK, Minieri CA, Ollerenshaw JD, Alexander RW. Angiotensin II stimulates NADH and NADPH oxidase activity in cultured vascular smooth muscle cells. Circ Res 1994;74:1141-1148.
[145.] Christ M, Bauersachs J, Liebetrau C, Heck M, Gunther A, Wehling M. Glucose increases endothelial-dependent superoxide formation in coronary arteries by NAD(P)H oxidase activation: attenuation by the 3-hydroxy-3-methylglutaryl coenzyme A reductase inhibitor atorvastatin. Diabetes 2002;51:2648-2652.
[146.] Munzel T, Afanas'ev IB, Kleschyov AL, Harrison DG. Detection of superoxide in vascular tissue. Arterioscler Thromb Vasc Biol 2002;22:1761-1768.
[147.] Li Y, Zhu H, Kuppusamy P, Roubaud V, Zweier JL, Trush MA. Validation of lucigenin (bis-N-methylacridinium) as a chemilumigenic probe for detecting superoxide anion radical production by enzymatic and cellular systems. J Biol Chem 1998;273:2015-2023.
References
181
[148.] Janiszewski M, Souza HP, Liu X, Pedro MA, Zweier JL, Laurindo FR. Overestimation of NADH-driven vascular oxidase activity due to lucigenin artifacts. Free Radic Biol Med 2002;32:446-453.
[149.] Spasojevic I, Liochev SI, Fridovich I. Lucigenin: redox potential in aqueous media and redox cycling with O-(2) production. Arch Biochem Biophys 2000;373:447-450.
[150.] Nerlich AG, Schleicher ED, Boos N. 1997 Volvo Award winner in basic science studies. Immunohistologic markers for age-related changes of human lumbar intervertebral discs. Spine 1997;22:2781-2795.
[151.] Behl C, Davis JB, Lesley R, Schubert D. Hydrogen peroxide mediates amyloid beta protein toxicity. Cell 1994;77:817-827.
[152.] Souza HP, Laurindo FR, Ziegelstein RC, Berlowitz CO, Zweier JL. Vascular NAD(P)H oxidase is distinct from the phagocytic enzyme and modulates vascular reactivity control. Am J Physiol Heart Circ Physiol 2001;280:H658-H667.
[153.] Shimohama S, Tanino H, Kawakami N, Okamura N, Kodama H, Yamaguchi T, Hayakawa T, Nunomura A, Chiba S, Perry G, Smith MA, Fujimoto S. Activation of NADPH oxidase in Alzheimer's disease brains. Biochem Biophys Res Commun 2000;273:5-9.
[154.] Sankarapandi S, Zweier JL, Mukherjee G, Quinn MT, Huso DL. Measurement and characterization of superoxide generation in microglial cells: evidence for an NADPH oxidase-dependent pathway. Arch Biochem Biophys 1998;353:312-321.
[155.] Tammariello SP, Quinn MT, Estus S. NADPH oxidase contributes directly to oxidative stress and apoptosis in nerve growth factor-deprived sympathetic neurons. J Neurosci 2000;20:RC53.
References
182
[156.] Bianca VD, Dusi S, Bianchini E, Dal P, I, Rossi F. beta-amyloid activates the O-2 forming NADPH oxidase in microglia, monocytes, and neutrophils. A possible inflammatory mechanism of neuronal damage in Alzheimer's disease. J Biol Chem 1999;274:15493-15499.
[157.] Meier B, Radeke HH, Selle S, Habermehl GG, Resch K, Sies H. Human fibroblasts release low amounts of reactive oxygen species in response to the potent phagocyte stimulants, serum-treated zymosan, N-formyl-methionyl-leucyl-phenylalanine, leukotriene B4 or 12-O-tetradecanoylphorbol 13-acetate. Biol Chem Hoppe Seyler 1990;371:1021-1025.
[158.] Hammes HP, Du X, Edelstein D, Taguchi T, Matsumura T, Ju Q, Lin J, Bierhaus A, Nawroth P, Hannak D, Neumaier M, Bergfeld R, Giardino I, Brownlee M. Benfotiamine blocks three major pathways of hyperglycemic damage and prevents experimental diabetic retinopathy. Nat Med 2003;9:294-299.
[159.] Friess U, Waldner M, Wahl HG, Lehmann R, Haering HU, Voelter W, Schleicher E. HPLC-based determination of urinary free and total N(epsilon)-(carboxymethyl)lysine excretion in normal and diabetic subjects. J Chromatogr B Analyt Technol Biomed Life Sci 2003;794:273-280.
[160.] Miyata T, Wada Y, Cai Z, Iida Y, Horie K, Yasuda Y, Maeda K, Kurokawa K, van Ypersele dS. Implication of an increased oxidative stress in the formation of advanced glycation end products in patients with end-stage renal failure. Kidney Int 1997;51:1170-1181.
[161.] Mitsuhashi T, Vlassara H, Founds HW, Li YM. Standardizing the immunological measurement of advanced glycation endproducts using normal human serum. J Immunol Methods 1997;207:79-88.
[162.] Buongiorno AM, Sagratella E, Morelli S, Di Virgilio A, Sensi M. Advanced glycosylation end product quantification: differently produced polyclonal antisera do
References
183
not share the recognition of epitopes of different nature. Ann Ist Super Sanita 2002;38:393-399.
[163.] Henle T, Deppisch R, Beck W, Hergesell O, Hansch GM, Ritz E. Advanced glycated end-products (AGE) during haemodialysis treatment: discrepant results with different methodologies reflecting the heterogeneity of AGE compounds. Nephrol Dial Transplant 1999;14:1968-1975.
[164.] Knecht KJ, Dunn JA, McFarland KF, McCance DR, Lyons TJ, Thorpe SR, Baynes JW. Effect of diabetes and aging on carboxymethyllysine levels in human urine. Diabetes 1991;40:190-196.
[165.] Drusch S, Faist V, Erbersdobler HF. Determination of N-€-carboxymethyllysine in milk products by a modified reversed-phase HPLC method. Food Chemistry 1999;65:547-553.
[166.] Wagner Z, Wittmann I, Mazak I, Schinzel R, Heidland A, Kientsch-Engel R, Nagy J. N(epsilon)-(carboxymethyl)lysine levels in patients with type 2 diabetes: role of renal function. Am J Kidney Dis 2001;38:785-791.
[167.] Hamelin M, Borot-Laloi C, Friguet B, Bakala H. Increased level of glycoxidation product N(varepsilon)-(carboxymethyl)lysine in rat serum and urine proteins with aging: link with glycoxidative damage accumulation in kidney. Arch Biochem Biophys 2003;411:215-222.
[168.] Takeuchi M, Makita Z, Yanagisawa K, Kameda Y, Koike T. Detection of noncarboxymethyllysine and carboxymethyllysine advanced glycation end products (AGE) in serum of diabetic patients. Mol Med 1999;5:393-405.
[169.] Henle T. AGEs in foods: Do they play a role in uremia? Kidney Int Suppl 2003;84:S145-S147.
[170.] Koschinsky T, He CJ, Mitsuhashi T, Bucala R, Liu C, Buenting C, Heitmann K, Vlassara H. Orally absorbed
References
184
reactive glycation products (glycotoxins): an environmental risk factor in diabetic nephropathy. Proc Natl Acad Sci U S A 1997;94:6474-6479.
[171.] Kennedy L, Baynes JW. Non-enzymatic glycosylation and the chronic complications of diabetes: an overview. Diabetologia 1984;26:93-98.
[172.] Schleicher E, Wieland OH. Kinetic analysis of glycation as a tool for assessing the half-life of proteins. Biochim Biophys Acta 1986;884:199-205.
[173.] Ling X, Nagai R, Sakashita N, Takeya M, Horiuchi S, Takahashi K. Immunohistochemical distribution and quantitative biochemical detection of advanced glycation end products in fetal to adult rats and in rats with streptozotocin-induced diabetes. Lab Invest 2001;81:845-861.
[174.] Meng J, Sakata N, Imanaga Y, Takebayashi S, Nagai R, Horiuchi S. Carboxymethyllysine in dermal tissues of diabetic and nondiabetic patients with chronic renal failure: relevance to glycoxidation damage. Nephron 2001;88:30-35.
[175.] Monnier VM, Bautista O, Kenny D, Sell DR, Fogarty J, Dahms W, Cleary PA, Lachin J, Genuth S. Skin collagen glycation, glycoxidation, and crosslinking are lower in subjects with long-term intensive versus conventional therapy of type 1 diabetes: relevance of glycated collagen products versus HbA1c as markers of diabetic complications. DCCT Skin Collagen Ancillary Study Group. Diabetes Control and Complications Trial. Diabetes 1999;48:870-880.
[176.] Sugimoto K, Nishizawa Y, Horiuchi S, Yagihashi S. Localization in human diabetic peripheral nerve of N(epsilon)-carboxymethyllysine-protein adducts, an advanced glycation endproduct. Diabetologia 1997;40:1380-1387.
References
185
[177.] Schalkwijk CG, . Increased accumulation of the glycoxidation product N(epsilon)-(carboxymethyl)lysine in hearts of diabetic patients. Diabetologia. 2004 (in press).
[178.] Wautier M, Massin P, Guillausseau P, Huijberts M, Levy B, Boulanger E, Laloi-Michelin M, Wautier J. N(carboxymethyl)lysine as a biomarker for microvascular complications in type 2 diabetic patients. Diabetes Metab 2003;29:44-52.
[179.] Soulis T, Sastra S, Thallas V, Mortensen SB, Wilken M, Clausen JT, Bjerrum OJ, Petersen H, Lau J, Jerums G, Boel E, Cooper ME. A novel inhibitor of advanced glycation end-product formation inhibits mesenteric vascular hypertrophy in experimental diabetes. Diabetologia 1999;42:472-479.
[180.] Stitt A, Gardiner TA, Alderson NL, Canning P, Frizzell N, Duffy N, Boyle C, Januszewski AS, Chachich M, Baynes JW, Thorpe SR, Anderson NL. The AGE inhibitor pyridoxamine inhibits development of retinopathy in experimental diabetes. Diabetes 2002 Sep ;51(9 ):2826 -32 2002;51:2826-2832.
[181.] Uesugi N, Sakata N, Horiuchi S, Nagai R, Takeya M, Meng J, Saito T, Takebayashi S. Glycoxidation-modified macrophages and lipid peroxidation products are associated with the progression of human diabetic nephropathy. Am J Kidney Dis 2001;38:1016-1025.
[182.] Kushiro M, Shikata K, Sugimoto H, Ikeda K, Horiuchi S, Makino H. Accumulation of Nsigma-(carboxy-methyl)lysine and changes in glomerular extracellular matrix components in Otsuka Long-Evans Tokushima fatty rat: a model of spontaneous NIDDM. Nephron 1998;79:458-468.
[183.] Imai N, Nishi S, Suzuki Y, Karasawa R, Ueno M, Shimada H, Kawashima S, Nakamaru T, Miyakawa Y, Araki N, Horiuchi S, Gejyo F, Arakawa M. Histological localization of advanced glycosylation end products in the
References
186
progression of diabetic nephropathy. Nephron 1997;76:153-160.
[184.] Endo M, Yanagisawa K, Tsuchida K, Okamoto T, Matsushita T, Higuchi M, Matsuda A, Takeuchi M, Makita Z, Koike T. Increased levels of vascular endothelial growth factor and advanced glycation end products in aqueous humor of patients with diabetic retinopathy. Horm Metab Res 2001;33:317-322.
[185.] Hammes HP, Alt A, Niwa T, Clausen JT, Bretzel RG, Brownlee M, Schleicher ED. Differential accumulation of advanced glycation end products in the course of diabetic retinopathy. Diabetologia 1999;42:728-736.
[186.] Kume S, Takeya M, Mori T, Araki N, Suzuki H, Horiuchi S, Kodama T, Miyauchi Y, Takahashi K. Immunohistochemical and ultrastructural detection of advanced glycation end products in atherosclerotic lesions of human aorta with a novel specific monoclonal antibody. Am J Pathol 1995;147:654-667.
[187.] Sakata N, Imanaga Y, Meng J, Tachikawa Y, Takebayashi S, Nagai R, Horiuchi S, Itabe H, Takano T. Immunohistochemical localization of different epitopes of advanced glycation end products in human atherosclerotic lesions. Atherosclerosis 1998;141:61-75.
[188.] Sakata N, Imanaga Y, Meng J, Tachikawa Y, Takebayashi S, Nagai R, Horiuchi S. Increased advanced glycation end products in atherosclerotic lesions of patients with end-stage renal disease. Atherosclerosis 1999;142:67-77.
[189.] Dobrian A, Lazar V, Tirziu D, Simionescu M. Increased macrophage uptake of irreversibly glycated albumin modified-low density lipoproteins of normal and diabetic subjects is mediated by non-saturable mechanisms. Biochim Biophys Acta 1996;1317:5-14.
[190.] Westwood ME, McLellan AC, Thornalley PJ. Receptor-mediated endocytic uptake of methylglyoxal-modified
References
187
serum albumin. Competition with advanced glycation end product-modified serum albumin at the advanced glycation end product receptor. J Biol Chem 1994;269:32293-32298.
[191.] Takata K, Horiuchi S, Araki N, Shiga M, Saitoh M, Morino Y. Scavenger receptor of human monocytic leukemia cell line (THP-1) and murine macrophages for nonenzymatically glycosylated proteins. Biochim Biophys Acta 1989;986:18-26.
[192.] Henderson LM, Thomas S, Banting G, Chappell JB. The arachidonate-activatable, NADPH oxidase-associated H+ channel is contained within the multi-membrane-spanning N-terminal region of gp91-phox. Biochem J 1997;325:701-705.
[193.] Doussiere J, Bouzidi F, Poinas A, Gaillard J, Vignais PV. Kinetic study of the activation of the neutrophil NADPH oxidase by arachidonic acid. Antagonistic effects of arachidonic acid and phenylarsine oxide. Biochemistry 1999;38:16394-16406.
[194.] Castellani RJ, Harris PL, Sayre LM, Fujii J, Taniguchi N, Vitek MP, Founds H, Atwood CS, Perry G, Smith MA. Active glycation in neurofibrillary pathology of Alzheimer disease: N(epsilon)-(carboxymethyl) lysine and hexitol-lysine. Free Radic Biol Med 2001;31:175-180.
[195.] Good PF, Werner P, Hsu A, Olanow CW, Perl DP. Evidence of neuronal oxidative damage in Alzheimer's disease. Am J Pathol 1996;149:21-28.
[196.] Smith MA, Perry G, Richey PL, Sayre LM, Anderson VE, Beal MF, Kowall N. Oxidative damage in Alzheimer's. Nature 1996;382:120-121.
[197.] Kimura T, Ikeda K, Takamatsu J, Miyata T, Sobue G, Miyakawa T, Horiuchi S. Identification of advanced glycation end products of the Maillard reaction in Pick's disease. Neurosci Lett 1996;219:95-98.
References
188
[198.] Kikuchi S, Shinpo K, Ogata A, Tsuji S, Takeuchi M, Makita Z, Tashiro K. Detection of N epsilon-(carboxymethyl)lysine (CML) and non-CML advanced glycation end-products in the anterior horn of amyotrophic lateral sclerosis spinal cord. Amyotroph Lateral Scler Other Motor Neuron Disord 2002;3:63-68.
[199.] Castellani RJ, Harris PL, Sayre LM, Fujii J, Taniguchi N, Vitek MP, Founds H, Atwood CS, Perry G, Smith MA. Active glycation in neurofibrillary pathology of Alzheimer disease: N(epsilon)-(carboxymethyl) lysine and hexitol-lysine. Free Radic Biol Med 2001;31:175-180.
[200.] Kikuchi S, Shinpo K, Ogata A, Tsuji S, Takeuchi M, Makita Z, Tashiro K. Detection of N epsilon-(carboxymethyl)lysine (CML) and non-CML advanced glycation end-products in the anterior horn of amyotrophic lateral sclerosis spinal cord. Amyotroph Lateral Scler Other Motor Neuron Disord 2002;3:63-68.
[201.] Schwab W, Friess U, Hempel U, Schulze E, Makita Z, Kasper M, Simank HG. Immunohistochemical demonstration of -(carboxymethyl)lysine protein adducts in normal and osteoarthritic cartilage. Histochem Cell Biol 2002;117:541-546.
[202.] Van Herreweghe F, Mao J, Chaplen FW, Grooten J, Gevaert K, Vandekerckhove J, Vancompernolle K. Tumor necrosis factor-induced modulation of glyoxalase I activities through phosphorylation by PKA results in cell death and is accompanied by the formation of a specific methylglyoxal-derived AGE. Proc Natl Acad Sci U S A 2002;99:949-954.
[203.] Hiran TS, Moulton PJ, Hancock JT. Detection of superoxide and NADPH oxidase in porcine articular chondrocytes. Free Radic Biol Med 1997;23:736-743.
[204.] Hiran TS, Moulton PJ, Hancock JT. In situ detection of superoxide anions within porcine articular cartilage. Br J Biomed Sci 1998;55:199-203.
References
189
[205.] Schleicher ED, Gempel KE, Wagner E, Nerlich AG. Immunolocalization of the Glycoxidation Product N(epsilon)-(carboxymethyl)Lysine in Normal and Inflamed Human Intestinal Tissues. In: O'Brian JO, Nursten H, Crabbe MJC, and Ames JM, eds. Cambridge, UK: The Royal Society of Chemistry, 1998:316-321.
[206.] Haslbeck KM, Schleicher ED, Friess U, Kirchner A, Neundorfer B, Heuss D. N(epsilon)-Carboxymethyllysine in diabetic and non-diabetic polyneuropathies. Acta Neuropathol (Berl) 2002;104:45-52.
[207.] Giardino I, Edelstein D, Brownlee M. BCL-2 expression or antioxidants prevent hyperglycemia-induced formation of intracellular advanced glycation endproducts in bovine endothelial cells. J Clin Invest 1996;97:1422-1428.
[208.] Griendling KK, Ushio-Fukai M. Redox control of vascular smooth muscle proliferation. J Lab Clin Med 1998;132:9-15.
[209.] Gorlach A, Brandes RP, Nguyen K, Amidi M, Dehghani F, Busse R. A gp91phox containing NADPH oxidase selectively expressed in endothelial cells is a major source of oxygen radical generation in the arterial wall. Circ Res 2000;87:26-32.
[210.] Schleicher E, Nerlich A. Atherosclerosis as a diabetic complication. In: Colaco C, ed. The Glycation Hypothesis of Atherosclerosis. 1997:151-168.
[211.] Gorlach A, Brandes RP, Bassus S, Kronemann N, Kirchmaier CM, Busse R, Schini-Kerth VB. Oxidative stress and expression of p22phox are involved in the up-regulation of tissue factor in vascular smooth muscle cells in response to activated platelets. FASEB J 2000;14:1518-1528.
[212.] Sorescu D, Weiss D, Lassegue B, Clempus RE, Szocs K, Sorescu GP, Valppu L, Quinn MT, Lambeth JD, Vega JD, Taylor WR, Griendling KK. Superoxide production and
References
190
expression of nox family proteins in human atherosclerosis. Circulation 2002;105:1429-1435.
[213.] Moulton PJ, Hiran TS, Goldring MB, Hancock JT. Detection of protein and mRNA of various components of the NADPH oxidase complex in an immortalized human chondrocyte line. Br J Rheumatol 1997;36:522-529.
[214.] Tanabe T, Otani H, Mishima K, Ogawa R, Inagaki C. Phorbol 12-myristate 13-acetate (PMA)-induced oxyradical production in rheumatoid synovial cells. Jpn J Pharmacol 1997;73:347-351.
[215.] Warnholtz A, Nickenig G, Schulz E, Macharzina R, Brasen JH, Skatchkov M, Heitzer T, Stasch JP, Griendling KK, Harrison DG, Bohm M, Meinertz T, Munzel T. Increased NADH-oxidase-mediated superoxide production in the early stages of atherosclerosis: evidence for involvement of the renin-angiotensin system. Circulation 1999;99:2027-2033.
[216.] Munzel T, Kurz S, Rajagopalan S, Thoenes M, Berrington WR, Thompson JA, Freeman BA, Harrison DG. Hydralazine prevents nitroglycerin tolerance by inhibiting activation of a membrane-bound NADH oxidase. A new action for an old drug. J Clin Invest 1996;98:1465-1470.
[217.] Munzel T, Mollnau H, Hartmann M, Geiger C, Oelze M, Warnholtz A, Yehia AH, Forstermann U, Meinertz T. Effects of a nitrate-free interval on tolerance, vasoconstrictor sensitivity and vascular superoxide production. J Am Coll Cardiol 2000;36:628-634.
[218.] Rajagopalan S, Kurz S, Munzel T, Tarpey M, Freeman BA, Griendling KK, Harrison DG. Angiotensin II-mediated hypertension in the rat increases vascular superoxide production via membrane NADH/NADPH oxidase activation. Contribution to alterations of vasomotor tone. J Clin Invest 1996;97:1916-1923.
References
191
[219.] Liochev SI, Fridovich I. Lucigenin as mediator of superoxide production: revisited. Free Radic Biol Med 1998;25:926-928.
[220.] Rost M, Karge E, Klinger W. What do we measure with luminol-, lucigenin- and penicillin-amplified chemiluminescence? 1. Investigations with hydrogen peroxide and sodium hypochlorite. J Biolumin Chemilumin 1998;13:355-363.
[221.] Morre DJ. Preferential inhibition of the plasma membrane NADH oxidase (NOX) activity by diphenyleneiodonium chloride with NADPH as donor. Antioxid Redox Signal 2002;4:207-212.
[222.] Kono H, Rusyn I, Uesugi T, Yamashina S, Connor HD, Dikalova A, Mason RP, Thurman RG. Diphenyleneiodonium sulfate, an NADPH oxidase inhibitor, prevents early alcohol-induced liver injury in the rat. Am J Physiol Gastrointest Liver Physiol 2001;280:G1005-G1012.
[223.] Jones RD, Thompson JS, Morice AH. The NADPH oxidase inhibitors iodonium diphenyl and cadmium sulphate inhibit hypoxic pulmonary vasoconstriction in isolated rat pulmonary arteries. Physiol Res 2000;49:587-596.
[224.] Li Y, Trush MA. Diphenyleneiodonium, an NAD(P)H oxidase inhibitor, also potently inhibits mitochondrial reactive oxygen species production. Biochem Biophys Res Commun 1998;253:295-299.
[225.] Li Y, Zhu H, Trush MA. Detection of mitochondria-derived reactive oxygen species production by the chemilumigenic probes lucigenin and luminol. Biochim Biophys Acta 1999;1428:1-12.
[226.] Rembish SJ, Trush MA. Further evidence that lucigenin-derived chemiluminescence monitors mitochondrial superoxide generation in rat alveolar macrophages. Free Radic Biol Med 1994;17:117-126.
References
192
[227.] Tsukamoto M, Tampo Y, Yonaha M. Lucigenin reduction by NADPH-cytochrome P450 reductase and the effect of phospholipids and albumin on chemiluminescence. Biochem Mol Biol Int 1998;45:115-123.
[228.] O'Donnell BV, Tew DG, Jones OT, England PJ. Studies on the inhibitory mechanism of iodonium compounds with special reference to neutrophil NADPH oxidase. Biochem J 1993;290:41-49.
[229.] Chakraborty S, Massey V. Reaction of reduced flavins and flavoproteins with diphenyliodonium chloride. J Biol Chem 2002;277:41507-41516.
Appendix
193
9 APPENDIX Meine akademischen Lehrer waren:
Herr Prof. Dr. I. B. Autenrieth Herr Prof. Dr. H. Bisswanger Herr Prof. Dr. K. W. Bock Herr Prof. Dr. P. Bohley Frau Prof. Dr. Dr. U. Breyer-Pfaff Herr PD Dr. R. Dringen Herr Prof. Dr. M. Duszenko Herr Prof. Dr. K. Eisele Herr Prof. Dr. K.-U. Fröhlich Herr Prof. Dr. G. Gauglitz Herr Prof. Dr. Dr. h.c. M. Hanack Herr Prof. Dr. G. Häfelinger Herr Prof. Dr. H. Hagenmaier, Ph. D. Herr Prof. Dr. B. Hamprecht Herr Prof. Dr. H.-U. Häring Herr Prof. Dr. G. Jung Herr Prof. Dr. H. Liebich Herr Prof. Dr. E. Lindner Herr Prof. Dr. D. Mecke Herr Prof. Dr. W. Nakel Herr Prof. Dr. H. Oberhammer Herr Prof. Dr. W. Pfeiffer Herr Prof. Dr. H. Probst Herr Prof. Dr. H.-G. Rammensee Herr Prof. Dr. E. Schleicher Herr Prof. Dr. R.-M. Schmülling Herr Prof. Dr. Dr. h.c. J. Strähle Herr Prof. Dr. Dr. h.c. W. Voelter Herr Prof. Dr. U. Weser
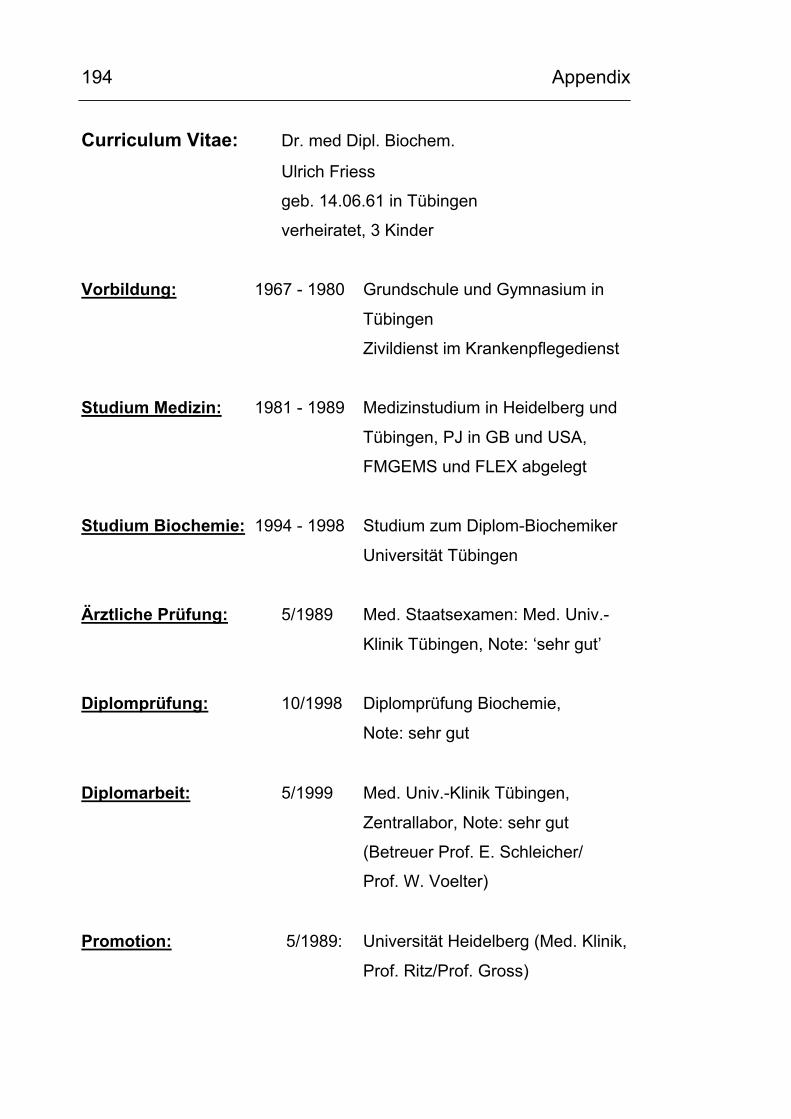
Appendix
194
Curriculum Vitae: Dr. med Dipl. Biochem. Ulrich Friess
geb. 14.06.61 in Tübingen
verheiratet, 3 Kinder
Vorbildung: 1967 - 1980 Grundschule und Gymnasium in
Tübingen
Zivildienst im Krankenpflegedienst
Studium Medizin: 1981 - 1989 Medizinstudium in Heidelberg und
Tübingen, PJ in GB und USA,
FMGEMS und FLEX abgelegt
Studium Biochemie: 1994 - 1998 Studium zum Diplom-Biochemiker
Universität Tübingen
Ärztliche Prüfung: 5/1989 Med. Staatsexamen: Med. Univ.-
Klinik Tübingen, Note: ‘sehr gut’
Diplomprüfung: 10/1998 Diplomprüfung Biochemie,
Note: sehr gut
Diplomarbeit: 5/1999 Med. Univ.-Klinik Tübingen,
Zentrallabor, Note: sehr gut
(Betreuer Prof. E. Schleicher/
Prof. W. Voelter)
Promotion: 5/1989: Universität Heidelberg (Med. Klinik,
Prof. Ritz/Prof. Gross)
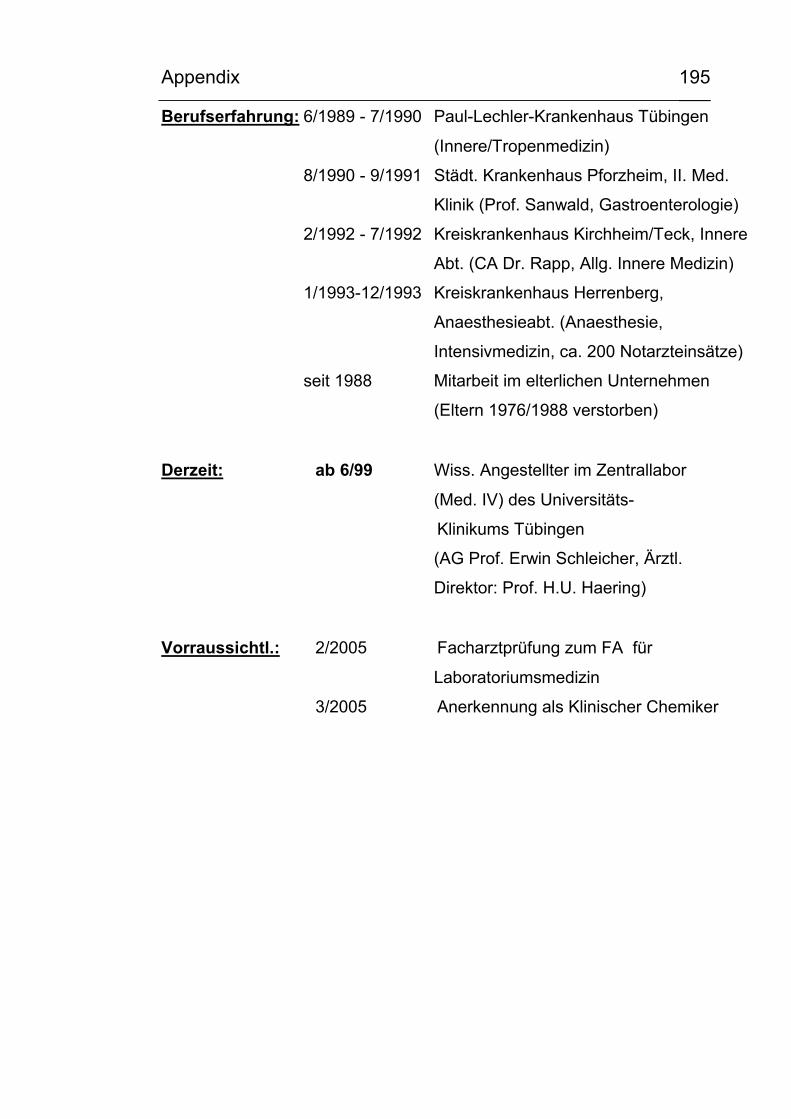
Appendix
195
Berufserfahrung: 6/1989 - 7/1990 Paul-Lechler-Krankenhaus Tübingen
(Innere/Tropenmedizin)
8/1990 - 9/1991 Städt. Krankenhaus Pforzheim, II. Med.
Klinik (Prof. Sanwald, Gastroenterologie)
2/1992 - 7/1992 Kreiskrankenhaus Kirchheim/Teck, Innere
Abt. (CA Dr. Rapp, Allg. Innere Medizin)
1/1993-12/1993 Kreiskrankenhaus Herrenberg,
Anaesthesieabt. (Anaesthesie,
Intensivmedizin, ca. 200 Notarzteinsätze)
seit 1988 Mitarbeit im elterlichen Unternehmen
(Eltern 1976/1988 verstorben)
Derzeit: ab 6/99 Wiss. Angestellter im Zentrallabor
(Med. IV) des Universitäts-
Klinikums Tübingen
(AG Prof. Erwin Schleicher, Ärztl.
Direktor: Prof. H.U. Haering)
Vorraussichtl.: 2/2005 Facharztprüfung zum FA für
Laboratoriumsmedizin
3/2005 Anerkennung als Klinischer Chemiker

Appendix
196