Embed Size (px)
Citation preview
econstor www.econstor.eu
Der Open-Access-Publikationsserver der ZBW – Leibniz-Informationszentrum WirtschaftThe Open Access Publication Server of the ZBW – Leibniz Information Centre for Economics
Standard-Nutzungsbedingungen:
Die Dokumente auf EconStor dürfen zu eigenen wissenschaftlichenZwecken und zum Privatgebrauch gespeichert und kopiert werden.
Sie dürfen die Dokumente nicht für öffentliche oder kommerzielleZwecke vervielfältigen, öffentlich ausstellen, öffentlich zugänglichmachen, vertreiben oder anderweitig nutzen.
Sofern die Verfasser die Dokumente unter Open-Content-Lizenzen(insbesondere CC-Lizenzen) zur Verfügung gestellt haben sollten,gelten abweichend von diesen Nutzungsbedingungen die in der dortgenannten Lizenz gewährten Nutzungsrechte.
Terms of use:
Documents in EconStor may be saved and copied for yourpersonal and scholarly purposes.
You are not to copy documents for public or commercialpurposes, to exhibit the documents publicly, to make thempublicly available on the internet, or to distribute or otherwiseuse the documents in public.
If the documents have been made available under an OpenContent Licence (especially Creative Commons Licences), youmay exercise further usage rights as specified in the indicatedlicence.
zbw Leibniz-Informationszentrum WirtschaftLeibniz Information Centre for Economics
Heblich, Stephan; Lameli, Alfred; Riener, Gerhard
Working PaperThe Effect of Perceived Regional Accents on Individual EconomicBehavior: A Lab Experiment on Linguistic Performance, CognitiveRatings and Economic Decisions
IZA Discussion Papers, No. 8640
Provided in Cooperation with:Institute for the Study of Labor (IZA)
Suggested Citation: Heblich, Stephan; Lameli, Alfred; Riener, Gerhard (2014) : The Effect ofPerceived Regional Accents on Individual Economic Behavior: A Lab Experiment on LinguisticPerformance, Cognitive Ratings and Economic Decisions, IZA Discussion Papers, No. 8640
This Version is available at:http://hdl.handle.net/10419/106581
DI
SC
US
SI
ON
P
AP
ER
S
ER
IE
S
Forschungsinstitut zur Zukunft der ArbeitInstitute for the Study of Labor
The Effect of Perceived Regional Accents onIndividual Economic Behavior:A Lab Experiment on Linguistic Performance,Cognitive Ratings and Economic Decisions
IZA DP No. 8640
November 2014
Stephan HeblichAlfred LameliGerhard Riener
The Effect of Perceived Regional Accents on Individual Economic Behavior:
A Lab Experiment on Linguistic Performance, Cognitive Ratings and Economic Decisions
Stephan Heblich University of Bristol, CESifo, IZA and SERC
Alfred Lameli
Research Centre Deutscher Sprachatlas and ADW Mainz
Gerhard Riener Düsseldorf Institute for Competition Economics and CRC PEG University of Göttingen
Discussion Paper No. 8640 November 2014
IZA
P.O. Box 7240 53072 Bonn
Germany
Phone: +49-228-3894-0 Fax: +49-228-3894-180
E-mail: [email protected]
Any opinions expressed here are those of the author(s) and not those of IZA. Research published in this series may include views on policy, but the institute itself takes no institutional policy positions. The IZA research network is committed to the IZA Guiding Principles of Research Integrity. The Institute for the Study of Labor (IZA) in Bonn is a local and virtual international research center and a place of communication between science, politics and business. IZA is an independent nonprofit organization supported by Deutsche Post Foundation. The center is associated with the University of Bonn and offers a stimulating research environment through its international network, workshops and conferences, data service, project support, research visits and doctoral program. IZA engages in (i) original and internationally competitive research in all fields of labor economics, (ii) development of policy concepts, and (iii) dissemination of research results and concepts to the interested public. IZA Discussion Papers often represent preliminary work and are circulated to encourage discussion. Citation of such a paper should account for its provisional character. A revised version may be available directly from the author.
IZA Discussion Paper No. 8640 November 2014
ABSTRACT
The Effect of Perceived Regional Accents on Individual Economic Behavior: A Lab Experiment on Linguistic
Performance, Cognitive Ratings and Economic Decisions Does it matter if you speak with a regional accent? Speaking immediately reveals something of one’s own social and cultural identity, be it consciously or unconsciously. Perceiving accents involves not only reconstructing such imprints but also augmenting them with particular attitudes and stereotypes. Even though we know much about attitudes and stereotypes that are transmitted by, e.g. skin color, names or physical attractiveness, we do not yet have satisfactory answers how accent perception affects human behavior. How do people act in economically relevant contexts when they are confronted with regional accents? This paper reports a laboratory experiment where we address this question. Participants in our experiment conduct cognitive tests where they can choose to either cooperate or compete with a randomly matched male opponent identified only via his rendering of a standardized text in either a regional accent or standard accent. We find a strong connection between the linguistic performance and the cognitive rating of the opponent. When matched with an opponent who speaks the accent of the participant’s home region – the in-group opponent –, individuals tend to cooperate significantly more often. By contrast, they are more likely to compete when matched with an accent speaker from outside their home region, the out-group opponent. Our findings demonstrate, firstly, that the perception of an out-group accent leads not only to social discrimination but also influences economic decisions. Secondly, they suggest that this economic behavior is not necessarily attributable to the perception of a regional accent per se, but rather to the social rating of linguistic distance and the in-group/out-group perception it evokes. JEL Classification: C90, J70, Z10 Keywords: discrimination, accent, in-group/out-group, lab experiment Corresponding author: Stephan Heblich University of Bristol Department of Economics 8 Woodland Road Bristol BS8 1TN United Kingdom E-mail: [email protected]
2
1. Introduction
Language as the primary means of human communication forms a large part of social practice.
It is shaped by speakers' idiosyncratic experiences [1] and by long-lasting cultural traits [2]. In
everyday communication, both of these components, the individual and the cultural, evoke
stereotypes and social ratings. Spoken language is thus a signal that elicits particular
conceptualizations about the speaker [3]. The extent to which these determine non-linguistic
behavior is still poorly understood.
The identifying potential of language has recently attracted researchers from different fields,
including linguists [4,5], psychologists [6,7] and economists [8,9]. Measuring the effect of
language on social behavior and individual interaction is however very difficult, given its
dependence on specific contexts and individual preconditions. The most common way of
addressing this challenge is to focus on individual attitudes and judgments. It turns out that
listening to non-native or regional accents can invoke judgments about the credibility of
speakers [7,10], their character traits and cognitive capacities [6,11], or even influence the
perception of facts in criminal cases [12,13]. There is also evidence that the use of an accent
can imply strategic advantages, e.g., in sales conversations [9] or job interviews [14], where
accents suggest a joint identity. What remains open is to what extent attitudes really suit the
action. While extensive research has already established a link between attitudes and action
for individual characteristics like beauty or ethnicity [15–17], there has been widespread
disregard for the gap between reported attitudes to accents and actual behavior. This is
unfortunate, because accents are qualitatively different from other distinguishing factors (e.g.,
physical attractiveness) and effectively constitute a unique parameter of human interactions
[18] that can be used strategically.
This paper addresses the gap between accent perception and individual action. Our first
hypothesis is that accent perception does affect individual behavior. Since accents distinguish
social groups, the effect should differ when perceiving in-group or out-group accents [19].
This is our second hypothesis. Finally, we take up the finding that out-group accents can
invoke discriminatory judgments and pose our third hypothesis that in-group favoritism is
manifested by a feeling of cognitive superiority.
To formally test these hypotheses, we combine techniques from experimental economics and
linguistics to develop a picture of differentiated behavioral discrimination. To omit potential
influences from cross-country differences we focus on regional accents within one country—
in our case Germany—that indicate a higher similarity between speakers and listeners than
foreign accents [14]. Regional accents typically originate in local dialects [20]. With the
3
introduction of national radio and television programs later, dialects began to converge to the
codified written language [21]. This process leaves us with regional accents as an
intermediate stage between dialects and standard language today (note that other studies—
especially in the German tradition—may use the terms ‘regiolect’, ‘regional dialect’, ‘regional
standard’ or ‘spoken standard’ to refer to this intermediate stage). In Germany, regional
accents typically consist of phonological and inflectional features that are still understandable
for individuals from other regions. They are commonly used in everyday communication and
subject to noticeable variation depending on contextual requirements [22,23]. Importantly,
regional accents still reflect historic variation in norms, habits, and conventions that emerged
over generations within dialect regions [24,25]. Already in childhood, regional accents turn
out to be a more relevant dimension of social preferences than foreign accents or race [26,27].
This is why regional accents today still distinguish social groups that differ in acceptance,
popularity and loyalty [28]. In the following, we explore this distinguishing feature of
regional accents to assess how differences in accents affect individual interactions.
The main challenge for our research design is to account for the possibility that using an
accent may either be strategic or correlated with context-specific and/or individual
characteristics. Both cases would induce spurious correlations [29]. To overcome potential
problems of confounding influences and identify an unbiased effect, our experiment meets the
following three criteria. First, the controlled laboratory environment rules out any biases from
unobserved context effects causing individuals to use regional accent strategically. This
involves fixed interactions as well as fixed language treatments. Second, our experimental
strategy separates accent effects from possibly confounding speaker characteristics like voice
or intonation. Third, we present a strategy to distinguish general social discrimination of
accent speakers from specific social discrimination of out-group accent speakers.
Our experimental setup confronts experimental participants (EP) with three types of randomly
assigned language samples, one in German standard language (in the following standard
accent) and two in regional accents. All language samples are provided by native language
informants (LI). The first regional accent is chosen to match the Eastern Middle German
accent spoken in the EPs home region, Thuringia. The second accent originates in a different
region, namely Bavaria. Both accents rank among the most prominent accents in German
census data [30]. Our setup implies that EPs perceive Eastern Middle German as in-group
accent and Bavarian as out-group accent. The experiment consists of cognitive tests where
EPs have to compare their own performance with the LI’s expected performance. If they
expect to outperform the LI they can choose to compete. If successful, they will receive a
4
higher remuneration but will lose money if their performance is equal or worse than the LI. If
EPs do not rate their own performance higher than the LI’s performance, they can choose to
cooperate instead, or choose a strategy that is independent of the LI’s performance. The only
thing EPs know about their opponents is their (randomly matched) accent. Any systematic
difference in the choice to cooperate or compete when being matched with an in-group or out-
group LI thus reveals how accent perception affects action.
Our results confirm our first hypothesis, that accent perception affects individual interactions.
Moreover, we find evidence for a systematically different treatment of the out-group accent.
EPs are less willing to cooperate with the out-group accent LI and choose to compete instead.
Since the spoken accent is not related to the LI’s performance by design, we follow [31] and
consider this differential treatment as expression of social discrimination. To the extent that
individuals can choose to use a standard accent or a regional accent, our results also allow for
the reverse argument that individuals can influence the economic behavior of interaction
partners through the choice to employ regional accents or standard accent.
In the remainder, we will explain our experimental setup in detail, present and discuss their
relevance and implications.
2. Material and Methods
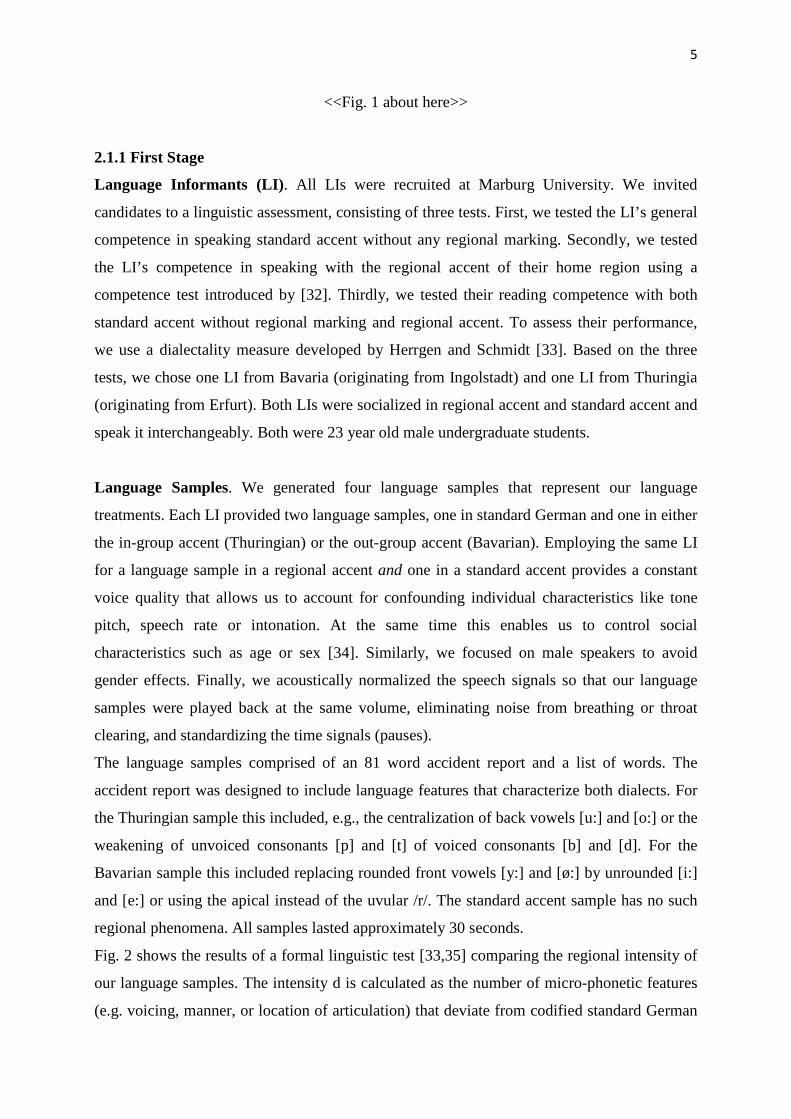
2.1 Experimental strategy As outlined in Fig. 1 (upper part), our strategy proceeds in two stages. In the first stage,
language informants (LI) with competence in standard accent and regional accent generate
two language samples, one in standard accent and one in regional accent. Additionally, they
perform a set of five cognitive tasks which are remunerated according to performance (piece
rate).
In the second stage, we invite experimental participants (EP) to the laboratory where they
perform the same set of cognitive tasks plus one extra task at the beginning. This first
cognitive task involves one of the randomly assigned language samples generated in the first
stage. EPs’ remuneration depends on their performance in these tasks as well. However, after
the first task, EPs can also choose remuneration schemes that incorporate their expectation of
the LI’s performance. If they believe that they are better than the LI they can compete,
otherwise cooperate or ignore the LI. By linking the EPs’ choice to compete or cooperate to
the randomly assigned language sample, we can assess how accent perception influences
individual behavior.
5
<<Fig. 1 about here>>
2.1.1 First Stage
Language Informants (LI). All LIs were recruited at Marburg University. We invited
candidates to a linguistic assessment, consisting of three tests. First, we tested the LI’s general
competence in speaking standard accent without any regional marking. Secondly, we tested
the LI’s competence in speaking with the regional accent of their home region using a
competence test introduced by [32]. Thirdly, we tested their reading competence with both
standard accent without regional marking and regional accent. To assess their performance,
we use a dialectality measure developed by Herrgen and Schmidt [33]. Based on the three
tests, we chose one LI from Bavaria (originating from Ingolstadt) and one LI from Thuringia
(originating from Erfurt). Both LIs were socialized in regional accent and standard accent and
speak it interchangeably. Both were 23 year old male undergraduate students.
Language Samples. We generated four language samples that represent our language
treatments. Each LI provided two language samples, one in standard German and one in either
the in-group accent (Thuringian) or the out-group accent (Bavarian). Employing the same LI
for a language sample in a regional accent and one in a standard accent provides a constant
voice quality that allows us to account for confounding individual characteristics like tone
pitch, speech rate or intonation. At the same time this enables us to control social
characteristics such as age or sex [34]. Similarly, we focused on male speakers to avoid
gender effects. Finally, we acoustically normalized the speech signals so that our language
samples were played back at the same volume, eliminating noise from breathing or throat
clearing, and standardizing the time signals (pauses).
The language samples comprised of an 81 word accident report and a list of words. The
accident report was designed to include language features that characterize both dialects. For
the Thuringian sample this included, e.g., the centralization of back vowels [u:] and [o:] or the
weakening of unvoiced consonants [p] and [t] of voiced consonants [b] and [d]. For the
Bavarian sample this included replacing rounded front vowels [y:] and [ø:] by unrounded [i:]
and [e:] or using the apical instead of the uvular /r/. The standard accent sample has no such
regional phenomena. All samples lasted approximately 30 seconds.
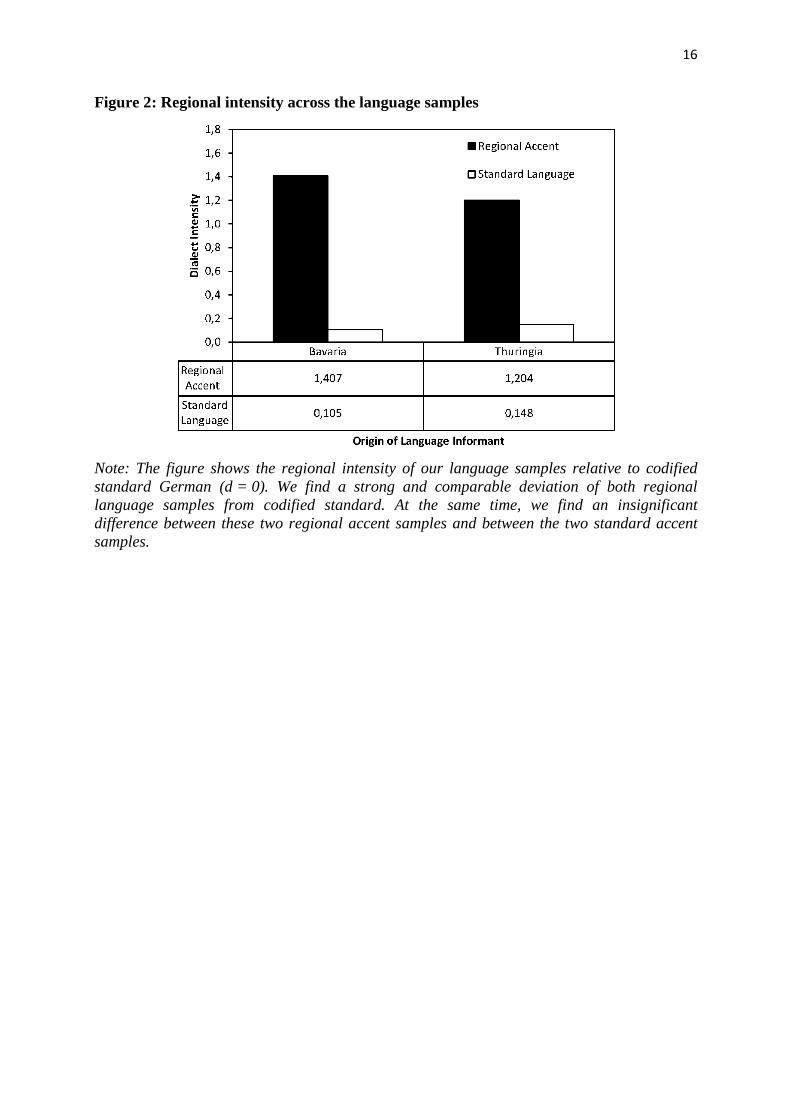
Fig. 2 shows the results of a formal linguistic test [33,35] comparing the regional intensity of
our language samples. The intensity d is calculated as the number of micro-phonetic features
(e.g. voicing, manner, or location of articulation) that deviate from codified standard German
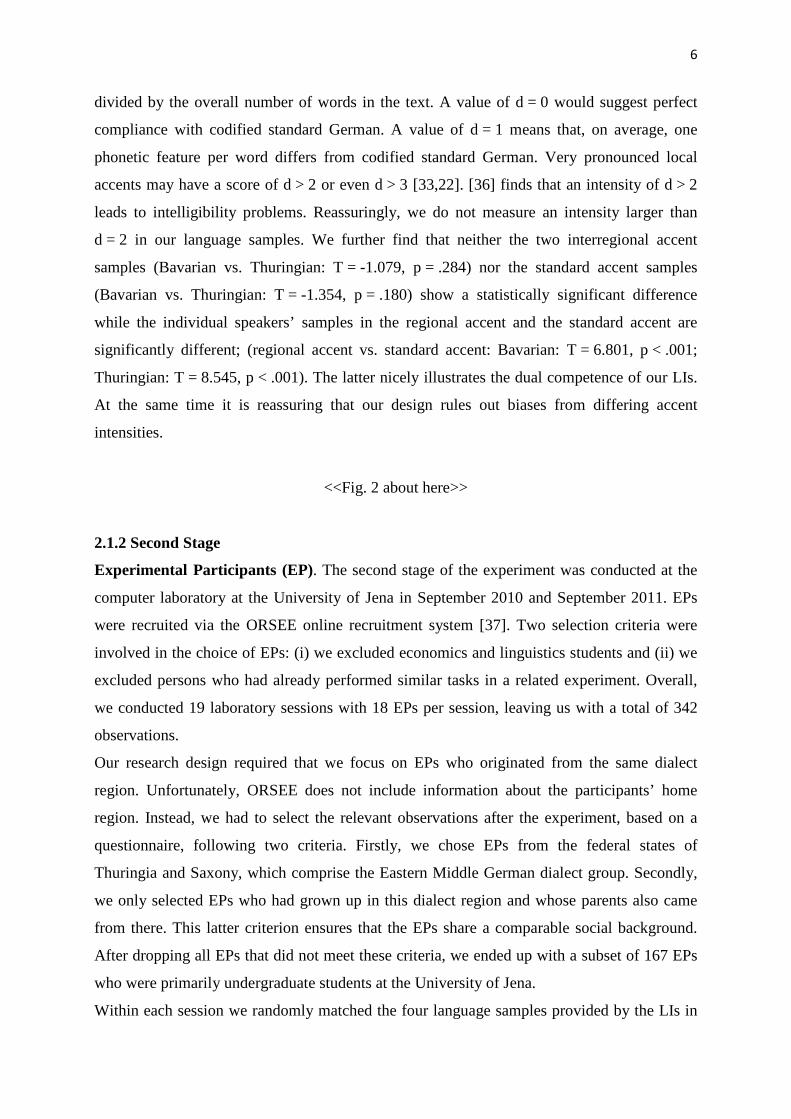
6
divided by the overall number of words in the text. A value of d = 0 would suggest perfect
compliance with codified standard German. A value of d = 1 means that, on average, one
phonetic feature per word differs from codified standard German. Very pronounced local
accents may have a score of d > 2 or even d > 3 [33,22]. [36] finds that an intensity of d > 2
leads to intelligibility problems. Reassuringly, we do not measure an intensity larger than
d = 2 in our language samples. We further find that neither the two interregional accent
samples (Bavarian vs. Thuringian: T = -1.079, p = .284) nor the standard accent samples
(Bavarian vs. Thuringian: T = -1.354, p = .180) show a statistically significant difference
while the individual speakers’ samples in the regional accent and the standard accent are
significantly different; (regional accent vs. standard accent: Bavarian: T = 6.801, p < .001;
Thuringian: T = 8.545, p < .001). The latter nicely illustrates the dual competence of our LIs.
At the same time it is reassuring that our design rules out biases from differing accent
intensities.
<<Fig. 2 about here>>
2.1.2 Second Stage
Experimental Participants (EP). The second stage of the experiment was conducted at the
computer laboratory at the University of Jena in September 2010 and September 2011. EPs
were recruited via the ORSEE online recruitment system [37]. Two selection criteria were
involved in the choice of EPs: (i) we excluded economics and linguistics students and (ii) we
excluded persons who had already performed similar tasks in a related experiment. Overall,
we conducted 19 laboratory sessions with 18 EPs per session, leaving us with a total of 342
observations.
Our research design required that we focus on EPs who originated from the same dialect
region. Unfortunately, ORSEE does not include information about the participants’ home
region. Instead, we had to select the relevant observations after the experiment, based on a
questionnaire, following two criteria. Firstly, we chose EPs from the federal states of
Thuringia and Saxony, which comprise the Eastern Middle German dialect group. Secondly,
we only selected EPs who had grown up in this dialect region and whose parents also came
from there. This latter criterion ensures that the EPs share a comparable social background.
After dropping all EPs that did not meet these criteria, we ended up with a subset of 167 EPs
who were primarily undergraduate students at the University of Jena.
Within each session we randomly matched the four language samples provided by the LIs in
7
the first stage with the EPs. This procedure avoids confounding treatment effects with session
effects. Moreover, EPs were not aware of the other treatments, so as to reduce experimenter
demand effects (cf. [38]). We obtained the following observation numbers for each pairing of
EP and LI: standard accent spoken by the Thuringian LI: N = 41; standard accent spoken by
the Bavarian LI: N = 40; Thuringian accent: N = 36; Bavarian accent: N = 50.
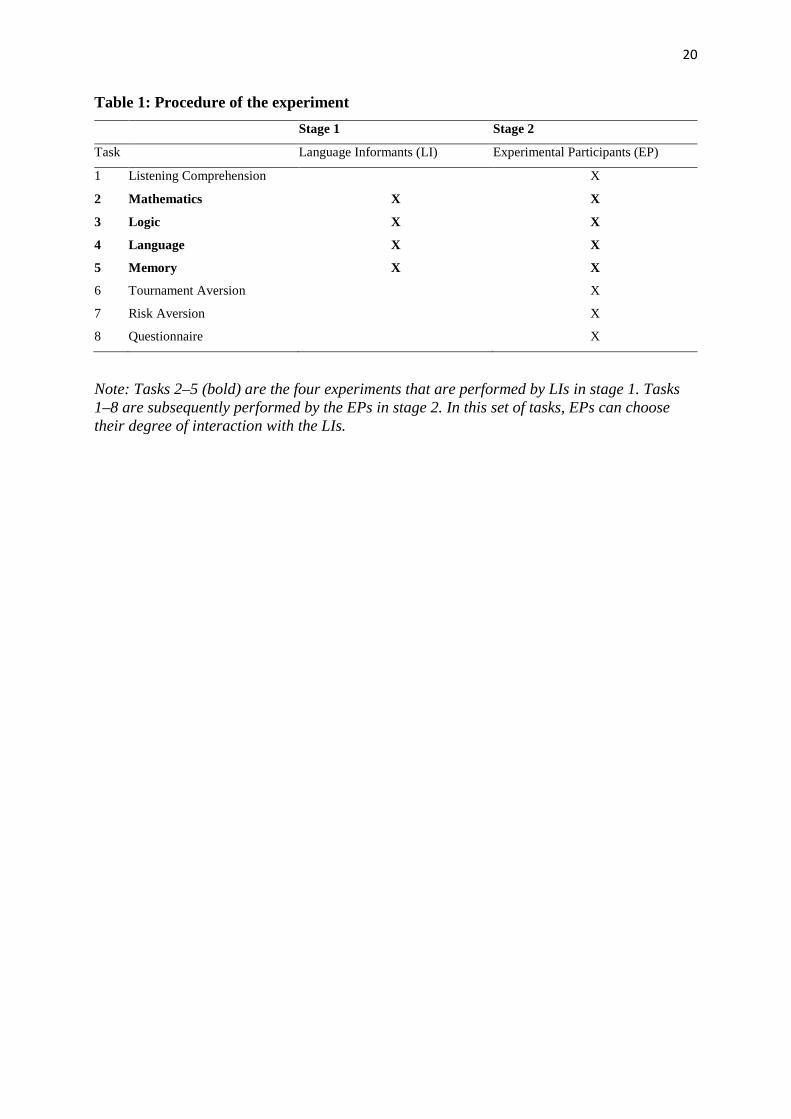
Tasks. The experiment consisted of eight sets of tasks (cf. Table 1), all of them programmed
in zTree [39]. Tasks 1–5 were designed as cognitive tests that have been shown to be good
predictors of general economic success (cf. SI 1 for examples of these tasks). They cover a
wide range of cognitive abilities including (a) language competence (tasks 1, 4), (b) the ability
to abstract (task 2), (c) logic (task 3), and (d) memory (task 5);skills that have been shown to
be important determinants for success in the labor market [40]. To control for individual
preferences that may affect the choice of a payment scheme we further included standard
games that test tournament and risk aversion (tasks 6‒7). A final task presented a
questionnaire that helps us collected personal and linguistic information about the EPs (task
8).
<<Table 1 about here>>
Task 1 – Listening Comprehension: The regional treatments were introduced in a listening
comprehension task at the beginning of the experiment. In this task, EPs listened individually
on headphones to a text read out by a randomly matched LI who spoke either standard
German, or with a Bavarian or Thuringian accent. This 81-word accident report took a format
familiar from radio news bulletins. After listening to the text, EPs were asked to answer
multiple choice questions about it. This setting was designed as a typical listening
comprehension task as encountered in school or university language courses. The text we
used is part of the German language examination (Deutsche Sprachprüfung für den
Hochschulzugang; DSH) required for university entrance in Germany. In all setups, EPs had
to remember a number of facts from the text. In this context, the use of regional accents
presented an additional test complication.
Task 2 – Mathematics: The mathematics task required EPs to add up five two-digit numbers.
Calculators were not allowed but paper and pencil were provided by the experimenter. All
numbers were randomly drawn and presented in the following way: An open-ended series of
calculations was to be performed within a set time of five minutes. As soon as EPs had
8
completed one task they received a new one. A count of correctly solved calculations was
always visible on the screen. After receiving the instructions, EPs could familiarize
themselves with the task in a two-minute non-paid trial round. This task was included on the
basis of [41] studies of male and female attitudes towards competition.
Task 3 – Logic: In this task, EPs were asked to answer questions from the 2002 GRE
(Graduate Record Examination) logic section. GRE is a standardized test used as a
recruitment tool for doctoral candidates in Europe and the US. Each question described a
particular situation on which the EPs had to answer several combinational logic-based
questions.
Task 4 – Language: In the language task, EPs were asked to place five words in order into a
grammatically correct sentence (declarative sentence). Each word was assigned a unique
number and EPs had to order these numbers to specify the correct sentence structure.
Whenever they completed one sentence correctly, a new one was presented until five minutes
had passed. This task had previously been used to analyze gender task stereotypes [42].
Task 5 – Memory: As in the listening comprehension task EPs listened to a list of 16 words
read out by the LI in a treatment-specific variety (i.e., either in standard accent or regional
accent). The EPs were asked to memorize as many words as possible. Subsequently, they
were presented with a list of words on the screen and the EPs had to identify the words that
had previously been read out.
Task 6 – Tournament Aversion: To test for tournament aversion, we used the results from the
word order task (which is according to [42] only mildly gender-biased) and asked EPs
whether they wanted to receive € 1 or to have their result compared with a randomly chosen
result from another individual in the room. If their result was better, they would receive € 3, if
not, they would forfeit payment.
Task 7 – Risk Aversion: To control for risk aversion, we applied a simplified procedure based
on [43] that had previously been used by [44]. EPs were presented with a list of five pairs of
different lotteries. In each case, EPs had the choice between a safe lottery X that guaranteed
payment of € 0.50 and a risky lottery Y in which they had an equal chance of winning
amounts ranging from € 0.90 to € 1.50 or zero. In general, we would expect more risk adverse
individuals to be slower to switch from lottery X to lottery Y. One pair of lotteries was
randomly selected and the decision was paid out.
Task 8 – Questionnaire: At the end, EPs were asked to fill out a questionnaire. This included
biographic information and four sets of linguistic questions that helped us determine the EPs’
attitudes toward dialects and their region of origin.
9
Payment Schemes. In stage one of our experiment, LIs had been asked to perform the same
four tasks that the EPs were asked to do in the laboratory. LIs earned a piece rate of one ECU
(Experimental Currency Unit) per correct answer. The exchange rate between ECU and Euro
is 1 EUR = 1.7 ECU. This exchange rate is calculated from a pilot study and provides that
students earn on average the hourly wage rate of a research assistant at the University of Jena.
In stage two, EPs received € 0.50 per correct answer in Task 1 as an incentive to listen
carefully. After that, EPs were informed that they would subsequently perform four other
tasks that their matched LI had completed earlier for a fixed remuneration per correctly solved
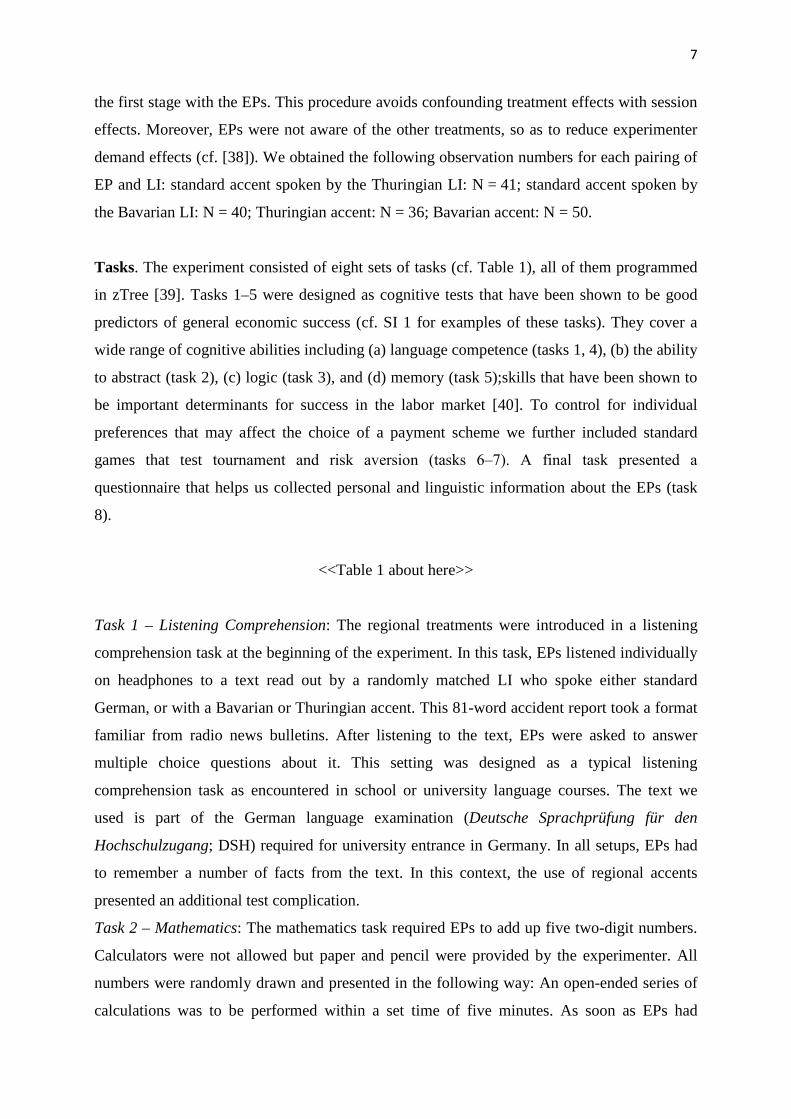
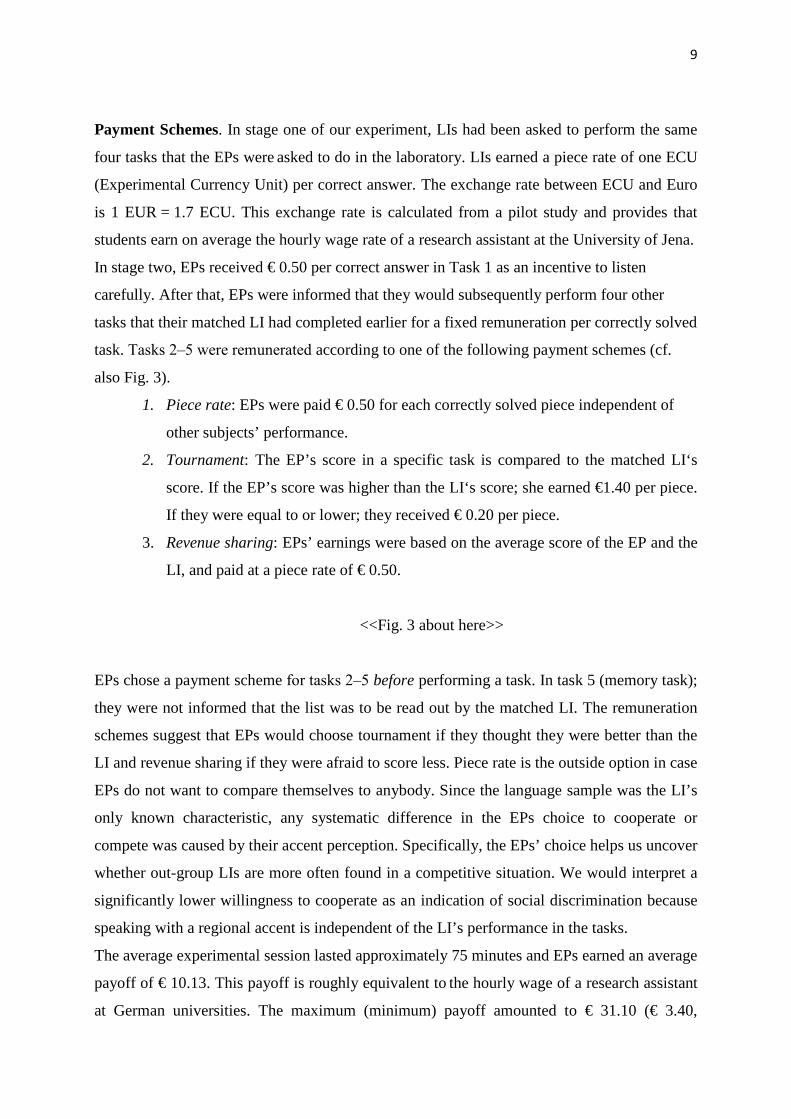
task. Tasks 2‒5 were remunerated according to one of the following payment schemes (cf.
also Fig. 3).
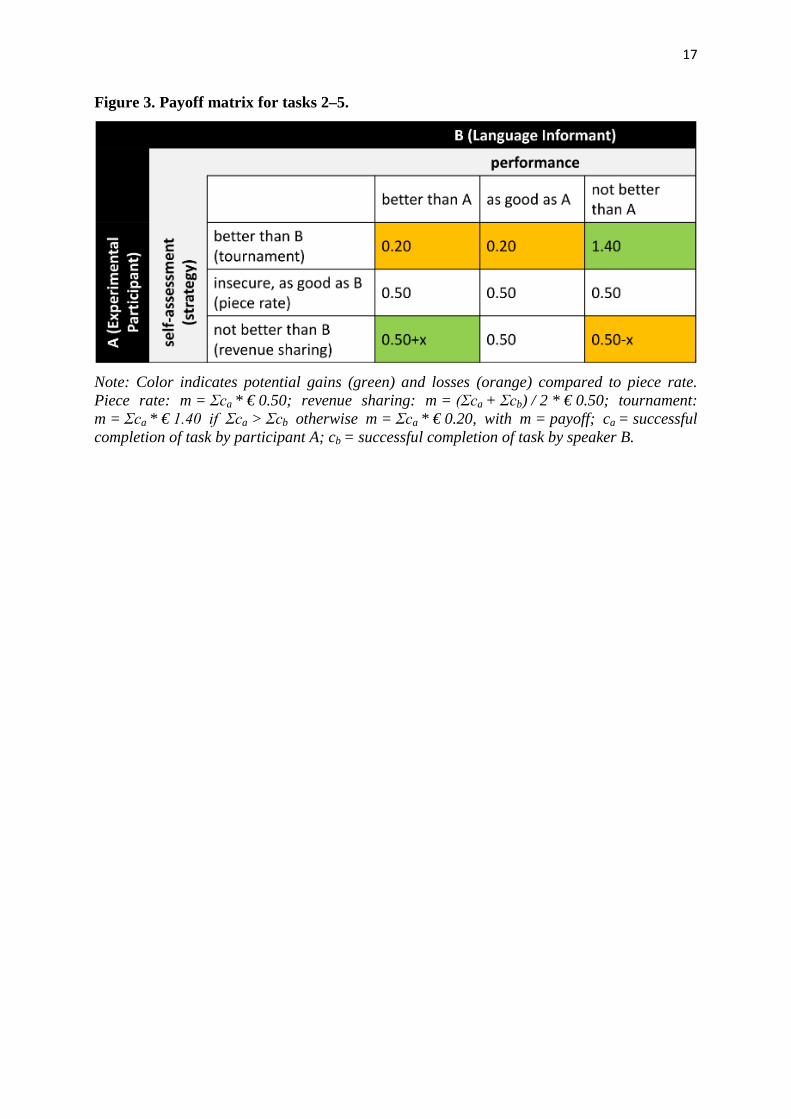
1. Piece rate: EPs were paid € 0.50 for each correctly solved piece independent of
other subjects’ performance.
2. Tournament: The EP’s score in a specific task is compared to the matched LI‘s
score. If the EP’s score was higher than the LI‘s score; she earned €1.40 per piece.
If they were equal to or lower; they received € 0.20 per piece.
3. Revenue sharing: EPs’ earnings were based on the average score of the EP and the
LI, and paid at a piece rate of € 0.50.
<<Fig. 3 about here>>
EPs chose a payment scheme for tasks 2‒5 before performing a task. In task 5 (memory task);
they were not informed that the list was to be read out by the matched LI. The remuneration
schemes suggest that EPs would choose tournament if they thought they were better than the
LI and revenue sharing if they were afraid to score less. Piece rate is the outside option in case
EPs do not want to compare themselves to anybody. Since the language sample was the LI’s
only known characteristic, any systematic difference in the EPs choice to cooperate or
compete was caused by their accent perception. Specifically, the EPs’ choice helps us uncover
whether out-group LIs are more often found in a competitive situation. We would interpret a
significantly lower willingness to cooperate as an indication of social discrimination because
speaking with a regional accent is independent of the LI’s performance in the tasks.
The average experimental session lasted approximately 75 minutes and EPs earned an average
payoff of € 10.13. This payoff is roughly equivalent to the hourly wage of a research assistant
at German universities. The maximum (minimum) payoff amounted to € 31.10 (€ 3.40,
10
respectively).
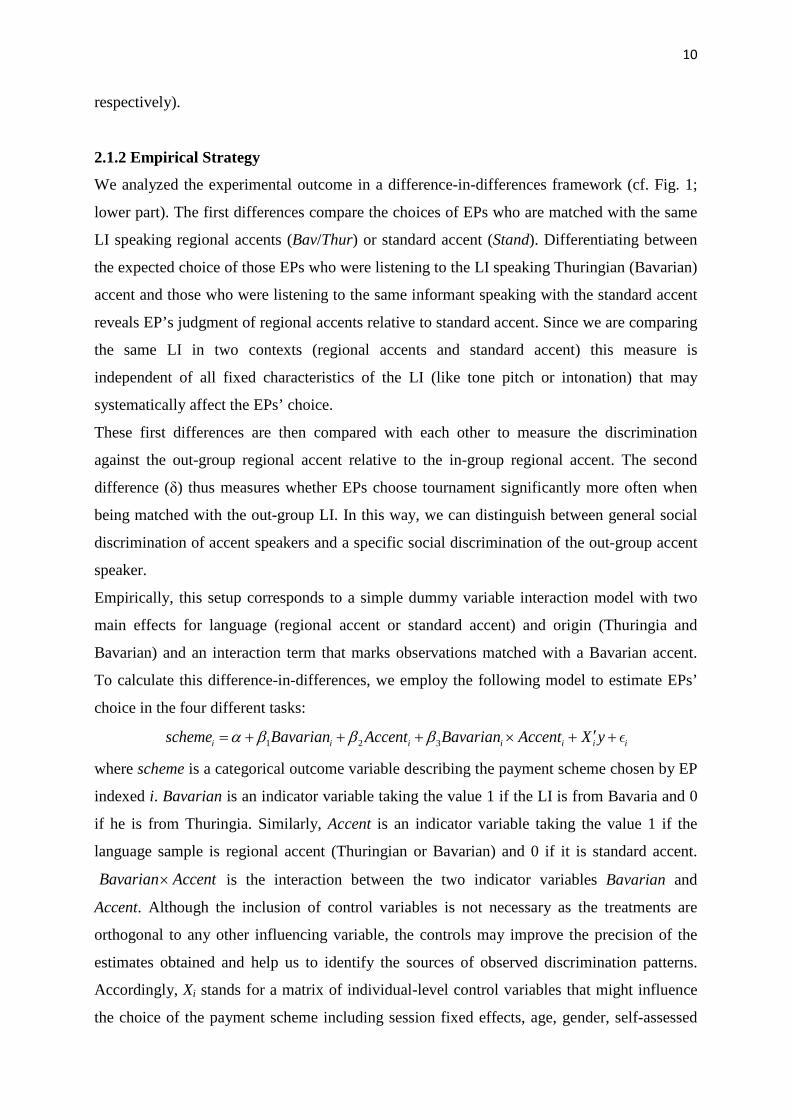
2.1.2 Empirical Strategy
We analyzed the experimental outcome in a difference-in-differences framework (cf. Fig. 1;
lower part). The first differences compare the choices of EPs who are matched with the same
LI speaking regional accents (Bav/Thur) or standard accent (Stand). Differentiating between
the expected choice of those EPs who were listening to the LI speaking Thuringian (Bavarian)
accent and those who were listening to the same informant speaking with the standard accent
reveals EP’s judgment of regional accents relative to standard accent. Since we are comparing
the same LI in two contexts (regional accents and standard accent) this measure is
independent of all fixed characteristics of the LI (like tone pitch or intonation) that may
systematically affect the EPs’ choice.
These first differences are then compared with each other to measure the discrimination
against the out-group regional accent relative to the in-group regional accent. The second
difference (δ) thus measures whether EPs choose tournament significantly more often when
being matched with the out-group LI. In this way, we can distinguish between general social
discrimination of accent speakers and a specific social discrimination of the out-group accent
speaker.
Empirically, this setup corresponds to a simple dummy variable interaction model with two
main effects for language (regional accent or standard accent) and origin (Thuringia and
Bavarian) and an interaction term that marks observations matched with a Bavarian accent.
To calculate this difference-in-differences, we employ the following model to estimate EPs’
choice in the four different tasks:
1 2 3i i i i i i iBavarian Accent Bavarian Accescheme nt X yα β β β ′= + + + × + +
where scheme is a categorical outcome variable describing the payment scheme chosen by EP
indexed i. Bavarian is an indicator variable taking the value 1 if the LI is from Bavaria and 0
if he is from Thuringia. Similarly, Accent is an indicator variable taking the value 1 if the
language sample is regional accent (Thuringian or Bavarian) and 0 if it is standard accent.
is the interaction between the two indicator variables Bavarian and
Accent. Although the inclusion of control variables is not necessary as the treatments are
orthogonal to any other influencing variable, the controls may improve the precision of the
estimates obtained and help us to identify the sources of observed discrimination patterns.
Accordingly, Xi stands for a matrix of individual-level control variables that might influence
the choice of the payment scheme including session fixed effects, age, gender, self-assessed
Bavarian Accent×
11
performance, and the results from task 6 and task 7 indicating tournament aversion and risk
aversion. Finally, ɛ is an i.i.d. error term.
The two parameters of interest are β2 and β3. The parameter β2 gives us the probability of
choosing competition when the Thuringian LI speaks with a regional accent and β3 gives us
the change in probability of choosing competition when the Bavarian LI speaks with a
regional accent.
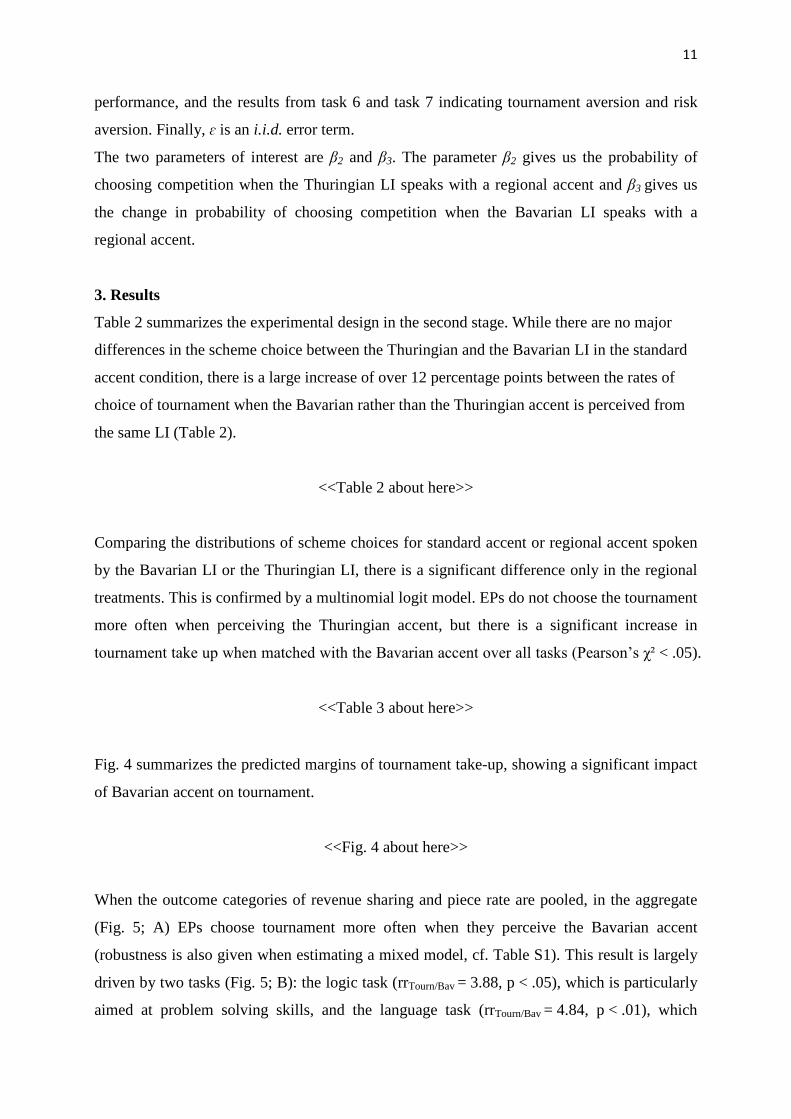
3. Results
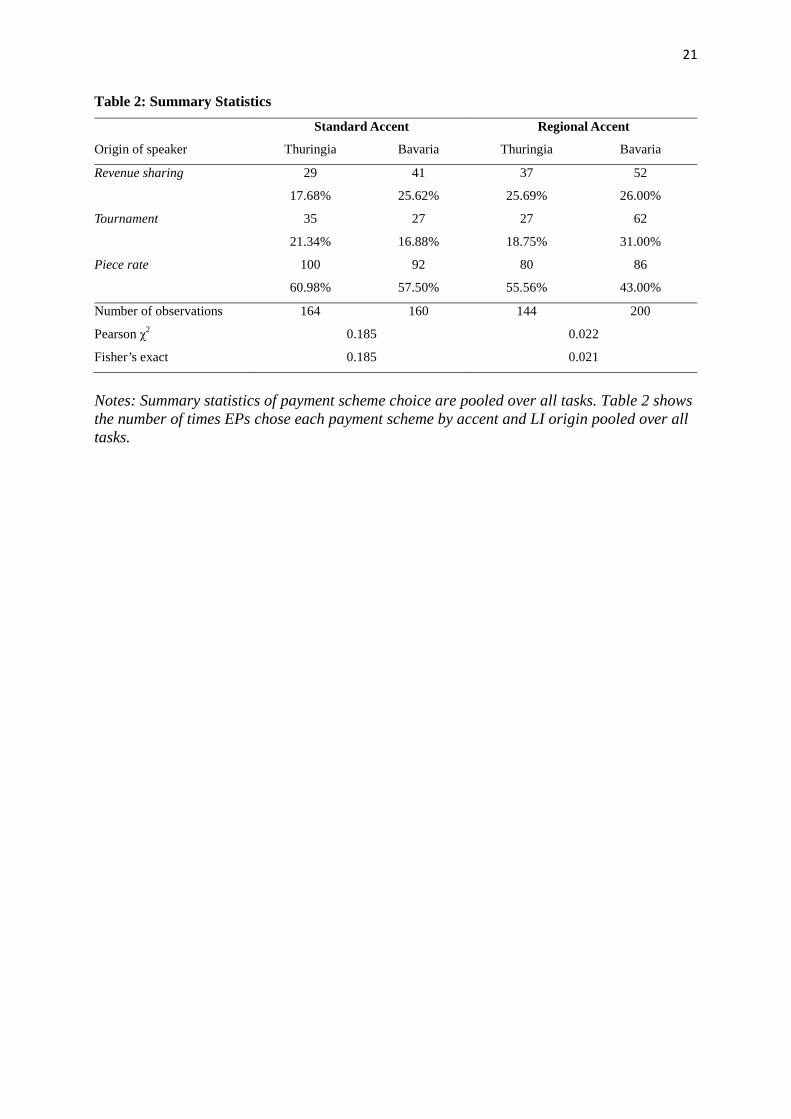
Table 2 summarizes the experimental design in the second stage. While there are no major
differences in the scheme choice between the Thuringian and the Bavarian LI in the standard
accent condition, there is a large increase of over 12 percentage points between the rates of
choice of tournament when the Bavarian rather than the Thuringian accent is perceived from
the same LI (Table 2).
<<Table 2 about here>>
Comparing the distributions of scheme choices for standard accent or regional accent spoken
by the Bavarian LI or the Thuringian LI, there is a significant difference only in the regional
treatments. This is confirmed by a multinomial logit model. EPs do not choose the tournament
more often when perceiving the Thuringian accent, but there is a significant increase in
tournament take up when matched with the Bavarian accent over all tasks (Pearson’s χ² < .05).
<<Table 3 about here>>
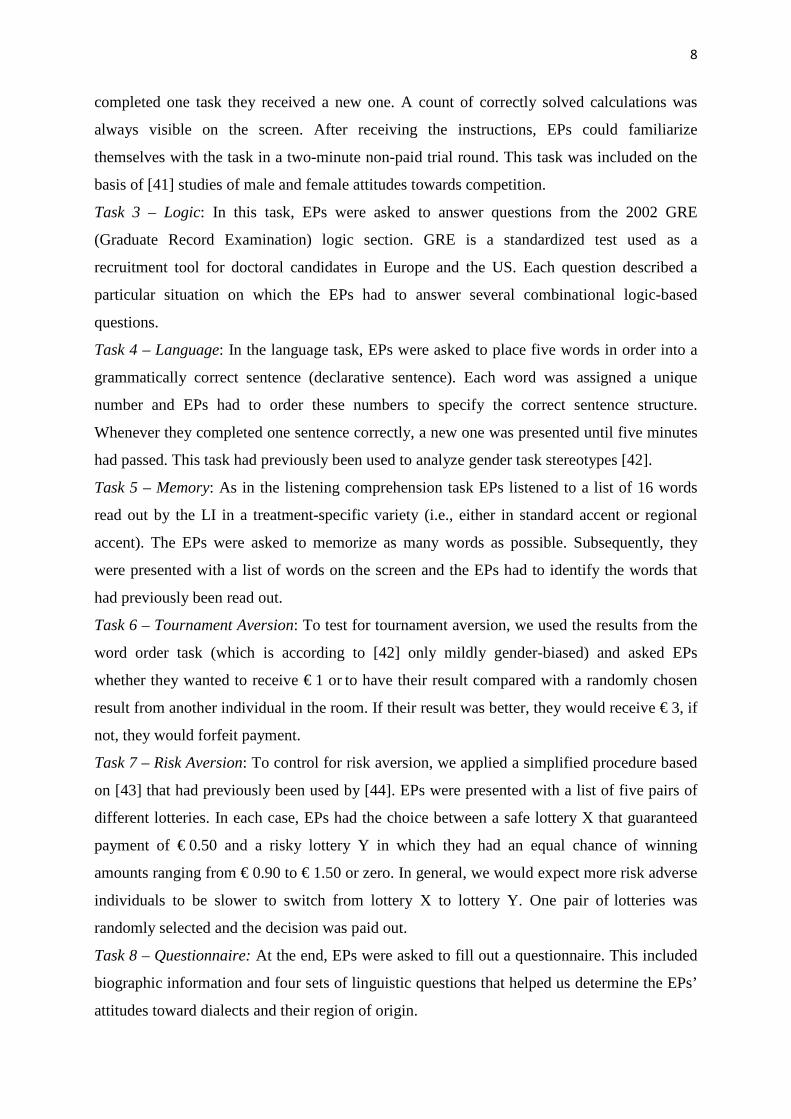
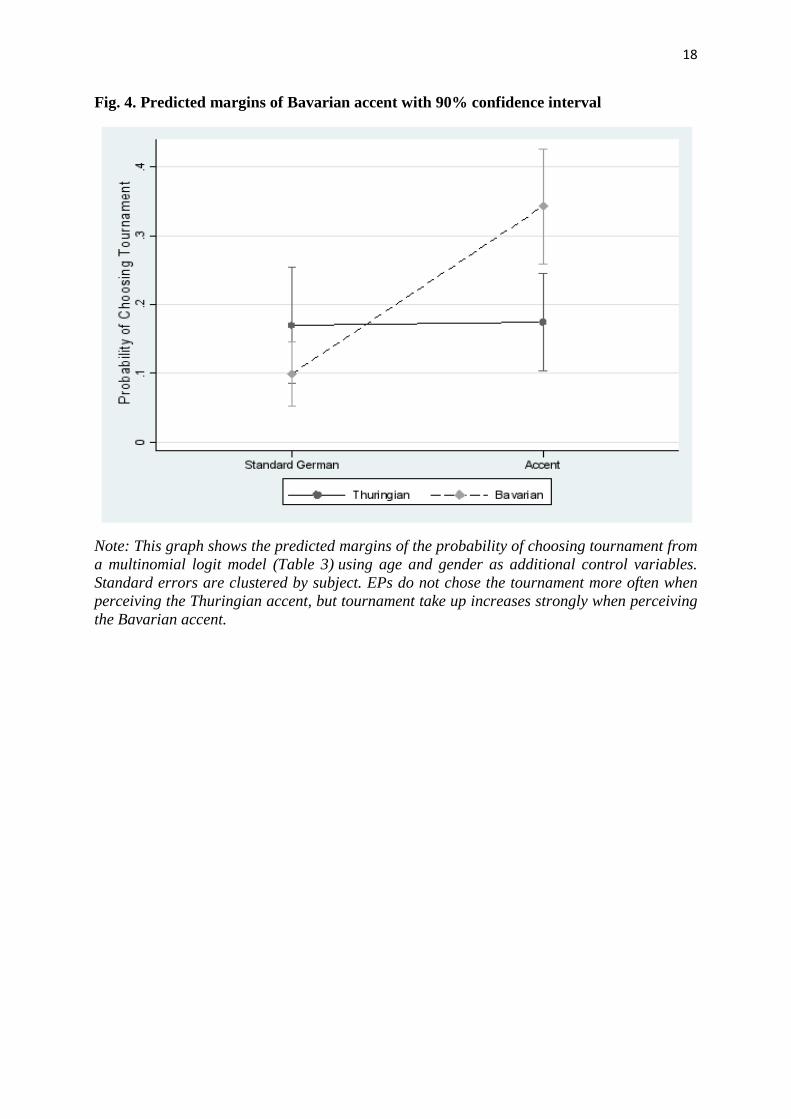
Fig. 4 summarizes the predicted margins of tournament take-up, showing a significant impact
of Bavarian accent on tournament.
<<Fig. 4 about here>>
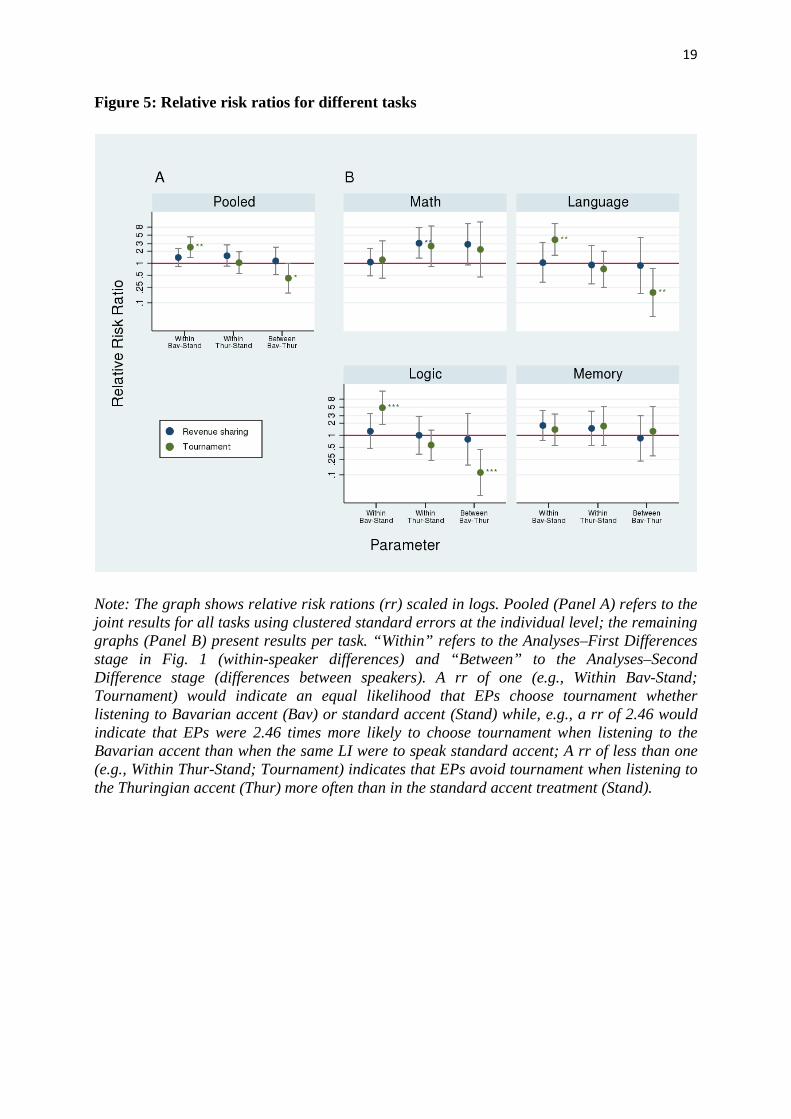
When the outcome categories of revenue sharing and piece rate are pooled, in the aggregate
(Fig. 5; A) EPs choose tournament more often when they perceive the Bavarian accent
(robustness is also given when estimating a mixed model, cf. Table S1). This result is largely
driven by two tasks (Fig. 5; B): the logic task (rrTourn/Bav = 3.88, p < .05), which is particularly
aimed at problem solving skills, and the language task (rrTourn/Bav = 4.84, p < .01), which
12
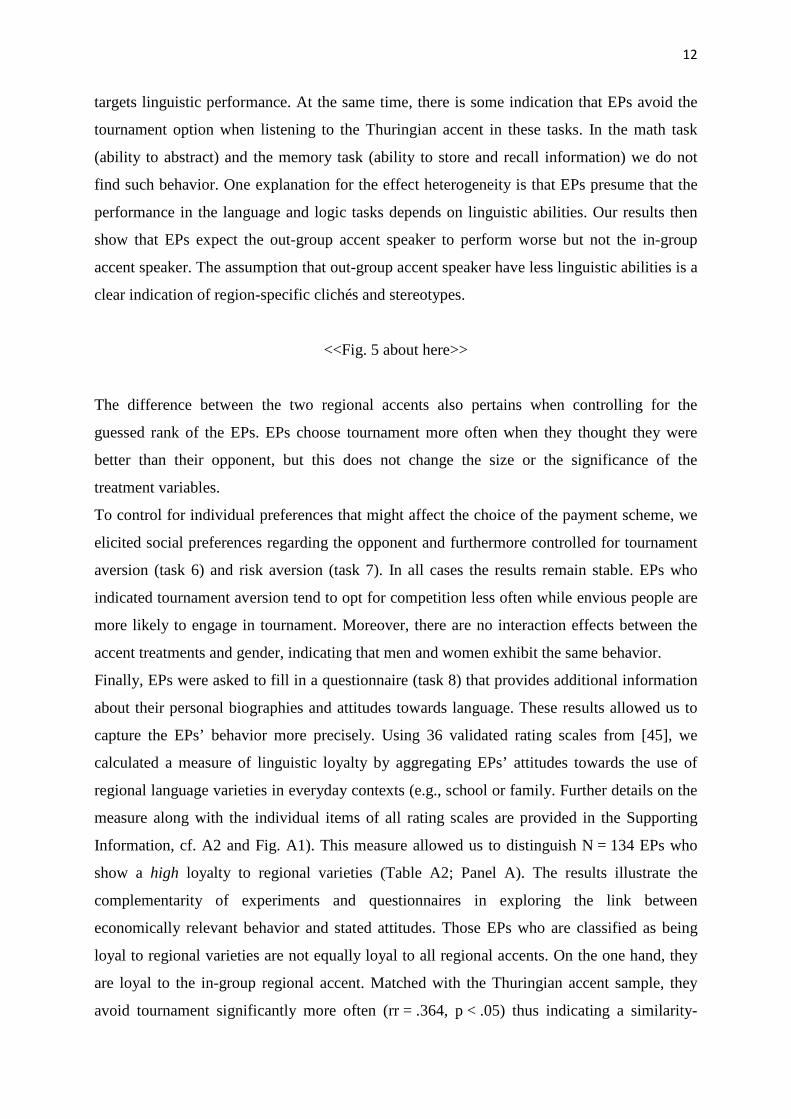
targets linguistic performance. At the same time, there is some indication that EPs avoid the
tournament option when listening to the Thuringian accent in these tasks. In the math task
(ability to abstract) and the memory task (ability to store and recall information) we do not
find such behavior. One explanation for the effect heterogeneity is that EPs presume that the
performance in the language and logic tasks depends on linguistic abilities. Our results then
show that EPs expect the out-group accent speaker to perform worse but not the in-group
accent speaker. The assumption that out-group accent speaker have less linguistic abilities is a
clear indication of region-specific clichés and stereotypes.
<<Fig. 5 about here>>
The difference between the two regional accents also pertains when controlling for the
guessed rank of the EPs. EPs choose tournament more often when they thought they were
better than their opponent, but this does not change the size or the significance of the
treatment variables.
To control for individual preferences that might affect the choice of the payment scheme, we
elicited social preferences regarding the opponent and furthermore controlled for tournament
aversion (task 6) and risk aversion (task 7). In all cases the results remain stable. EPs who
indicated tournament aversion tend to opt for competition less often while envious people are
more likely to engage in tournament. Moreover, there are no interaction effects between the
accent treatments and gender, indicating that men and women exhibit the same behavior.
Finally, EPs were asked to fill in a questionnaire (task 8) that provides additional information
about their personal biographies and attitudes towards language. These results allowed us to
capture the EPs’ behavior more precisely. Using 36 validated rating scales from [45], we
calculated a measure of linguistic loyalty by aggregating EPs’ attitudes towards the use of
regional language varieties in everyday contexts (e.g., school or family. Further details on the
measure along with the individual items of all rating scales are provided in the Supporting
Information, cf. A2 and Fig. A1). This measure allowed us to distinguish N = 134 EPs who
show a high loyalty to regional varieties (Table A2; Panel A). The results illustrate the
complementarity of experiments and questionnaires in exploring the link between
economically relevant behavior and stated attitudes. Those EPs who are classified as being
loyal to regional varieties are not equally loyal to all regional accents. On the one hand, they
are loyal to the in-group regional accent. Matched with the Thuringian accent sample, they
avoid tournament significantly more often (rr = .364, p < .05) thus indicating a similarity-
13
attraction effect. On the other hand, they choose tournament significantly more often
(rr = 3.453, p < .001) when confronted with the distant Bavarian accent.
4. Conclusion
Our experimental approach allows us to evaluate accent discrimination in economically
relevant situations. Each of the tasks performed in the experiment addresses different
cognitive capacities. Our experimental setup requires EPs to then compare their own
capacities with the LIs’ expected cognitive capacities. EPs reveal the result of this comparison
through their choice of a payment scheme. If they believe that they can outperform the LI they
choose competition over cooperation.
Varying the accent exogenously, we find that the economic behavior of the interaction
partners is undoubtedly influenced by the use of regional accent or standard accent (first
hypothesis). However, it turns out that only the out-group regional accent affects economic
behavior, indicating that regional accents also transport socio-symbolic information about the
speaker [46]. This is a clear pattern of in-group vs. out-group behavior (second hypothesis)).
Since EPs are more likely to try and outcompete the opponent (i.e. choose competition) when
being matched with the distance accent LI, we interpret this as feeling of cognitive superiority
against the out-group speaker (third hypothesis).
Looking at the four tasks separately, we observe effect heterogeneity related to the cognitive
dimensions tested in the experiment. In the language and logic tasks, EPs are more likely to
choose tournament against the out-group accent LI (Bavarian). They think they are better.
When being matched with the in-group accent LI (Thuringian) we do not find this behavior.
Beyond that, we find weak indication that EPs are more likely to cooperate (i.e. choose
revenue sharing) with the in-group accent LI in the math task and we do not find any effect in
the memory task.
One explanation for the effect heterogeneity is that EPs consciously or subconsciously relate
language and combination tasks, but not math and memorization tasks, to the language
treatment. In that case, regional clichés and stereotypes about the out-group accent would
drive the EPs’ expectation about the opponent’s performance in language related tasks.
Another potential explanation may relate to the EPs’ familiarity with the type of task. While
mental arithmetic and memorization are explicitly trained from early on in kindergarten and at
school, cognitive tests (so called brain teasers that are commonly used in assessment centers)
require combinational logic that appears only later in the school curriculum—if at all. To the
extent that (i) everyone received training in math and memorization at school and (ii) almost
14
everyone has had the experience that sometimes somebody else was better in solving these
tasks, it may be rational to avoid competition. By contrast, language and combinational logic
tasks are not explicitly trained at school thus leaving more room for assumptions about the
opponent’s performance. This is where regional clichés and stereotypes come into play. This
interpretation relates to [47] who find that while trained persons tend to underestimate their
performance, untrained persons tend to overrate their performance and ability. In our context,
this may also explain why experimental participants tend to cooperate with the speaker of
their own regional accent in the math task—thus looking for trustful support—while they
don’t when the same person speaks standard language.
Since our results do not allow us to further explore these potential explanations, we refer them
to future research. Based on our findings, we conclude that regional accents can encourage
clichés and stereotypes that affect individual behavior. More generally, this carries
implications for both, speakers and listeners. From the perspective of the listener, stereotypes
may be goal-oriented [48] as they help reach a decision. But they also may be misleading and
thus not economically effective. This opens up an interesting perspective for the speaker: the
use of regional accents can be strategically employed to persuade or manipulate a
communication partner.
Acknowledgments
This research is supported by the Max Planck Society, the Academy of Science and Literature
Mainz (grant REDE 0404), the German Research Foundation (DFG grant RTG1411) and the
Research Centre Deutscher Sprachatlas.
15
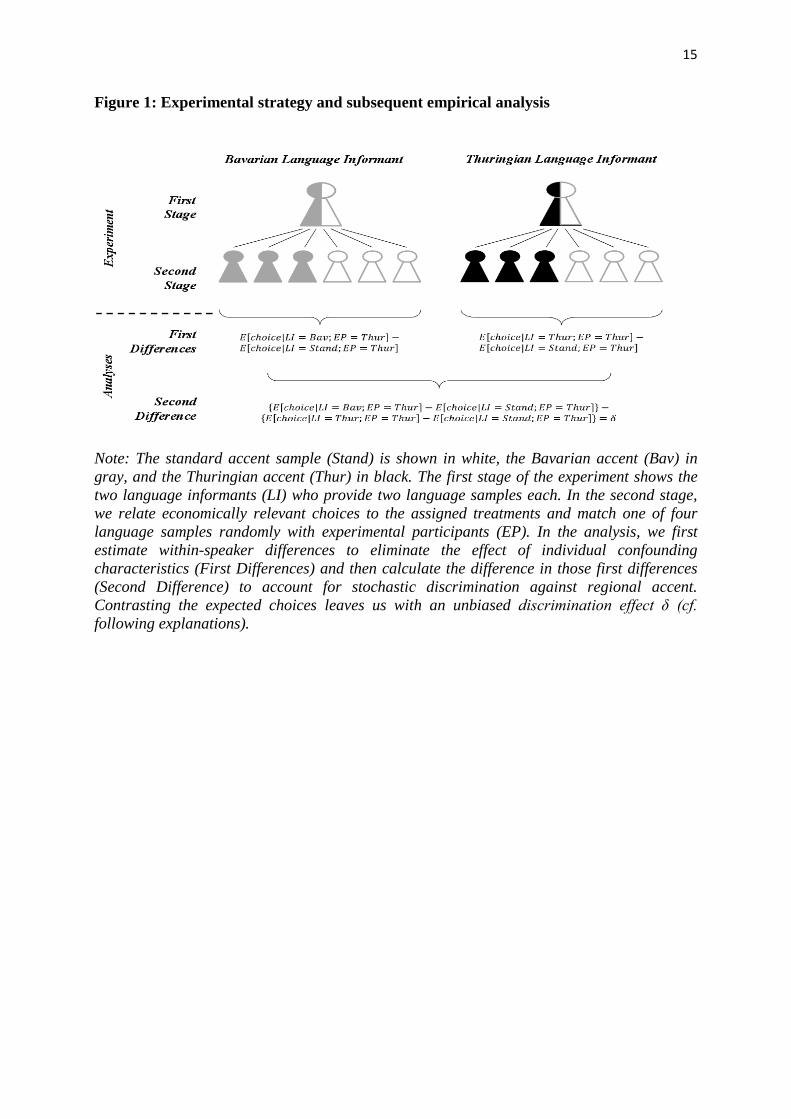
Figure 1: Experimental strategy and subsequent empirical analysis
Note: The standard accent sample (Stand) is shown in white, the Bavarian accent (Bav) in gray, and the Thuringian accent (Thur) in black. The first stage of the experiment shows the two language informants (LI) who provide two language samples each. In the second stage, we relate economically relevant choices to the assigned treatments and match one of four language samples randomly with experimental participants (EP). In the analysis, we first estimate within-speaker differences to eliminate the effect of individual confounding characteristics (First Differences) and then calculate the difference in those first differences (Second Difference) to account for stochastic discrimination against regional accent. Contrasting the expected choices leaves us with an unbiased discrimination effect δ (cf. following explanations).
16
Figure 2: Regional intensity across the language samples
Note: The figure shows the regional intensity of our language samples relative to codified standard German (d = 0). We find a strong and comparable deviation of both regional language samples from codified standard. At the same time, we find an insignificant difference between these two regional accent samples and between the two standard accent samples.
17
Figure 3. Payoff matrix for tasks 2–5.
Note: Color indicates potential gains (green) and losses (orange) compared to piece rate. Piece rate: m = Ʃca * € 0.50; revenue sharing: m = (Ʃca + Ʃcb) / 2 * € 0.50; tournament: m = Ʃca * € 1.40 if Ʃca > Ʃcb otherwise m = Ʃca * € 0.20, with m = payoff; ca = successful completion of task by participant A; cb = successful completion of task by speaker B.
18
Fig. 4. Predicted margins of Bavarian accent with 90% confidence interval
Note: This graph shows the predicted margins of the probability of choosing tournament from a multinomial logit model (Table 3) using age and gender as additional control variables. Standard errors are clustered by subject. EPs do not chose the tournament more often when perceiving the Thuringian accent, but tournament take up increases strongly when perceiving the Bavarian accent.
19
Figure 5: Relative risk ratios for different tasks
Note: The graph shows relative risk rations (rr) scaled in logs. Pooled (Panel A) refers to the joint results for all tasks using clustered standard errors at the individual level; the remaining graphs (Panel B) present results per task. “Within” refers to the Analyses–First Differences stage in Fig. 1 (within-speaker differences) and “Between” to the Analyses–Second Difference stage (differences between speakers). A rr of one (e.g., Within Bav-Stand; Tournament) would indicate an equal likelihood that EPs choose tournament whether listening to Bavarian accent (Bav) or standard accent (Stand) while, e.g., a rr of 2.46 would indicate that EPs were 2.46 times more likely to choose tournament when listening to the Bavarian accent than when the same LI were to speak standard accent; A rr of less than one (e.g., Within Thur-Stand; Tournament) indicates that EPs avoid tournament when listening to the Thuringian accent (Thur) more often than in the standard accent treatment (Stand).
20
Table 1: Procedure of the experiment Stage 1 Stage 2
Task Language Informants (LI) Experimental Participants (EP) 1 Listening Comprehension X 2 Mathematics X X 3 Logic X X 4 Language X X 5 Memory X X 6 Tournament Aversion X 7 Risk Aversion X 8 Questionnaire X
Note: Tasks 2–5 (bold) are the four experiments that are performed by LIs in stage 1. Tasks 1–8 are subsequently performed by the EPs in stage 2. In this set of tasks, EPs can choose their degree of interaction with the LIs.
21
Table 2: Summary Statistics Standard Accent Regional Accent Origin of speaker Thuringia Bavaria Thuringia Bavaria Revenue sharing 29 41 37 52 17.68% 25.62% 25.69% 26.00% Tournament 35 27 27 62 21.34% 16.88% 18.75% 31.00% Piece rate 100 92 80 86 60.98% 57.50% 55.56% 43.00% Number of observations 164 160 144 200 Pearson χ2 0.185 0.022 Fisher’s exact 0.185 0.021
Notes: Summary statistics of payment scheme choice are pooled over all tasks. Table 2 shows the number of times EPs chose each payment scheme by accent and LI origin pooled over all tasks.
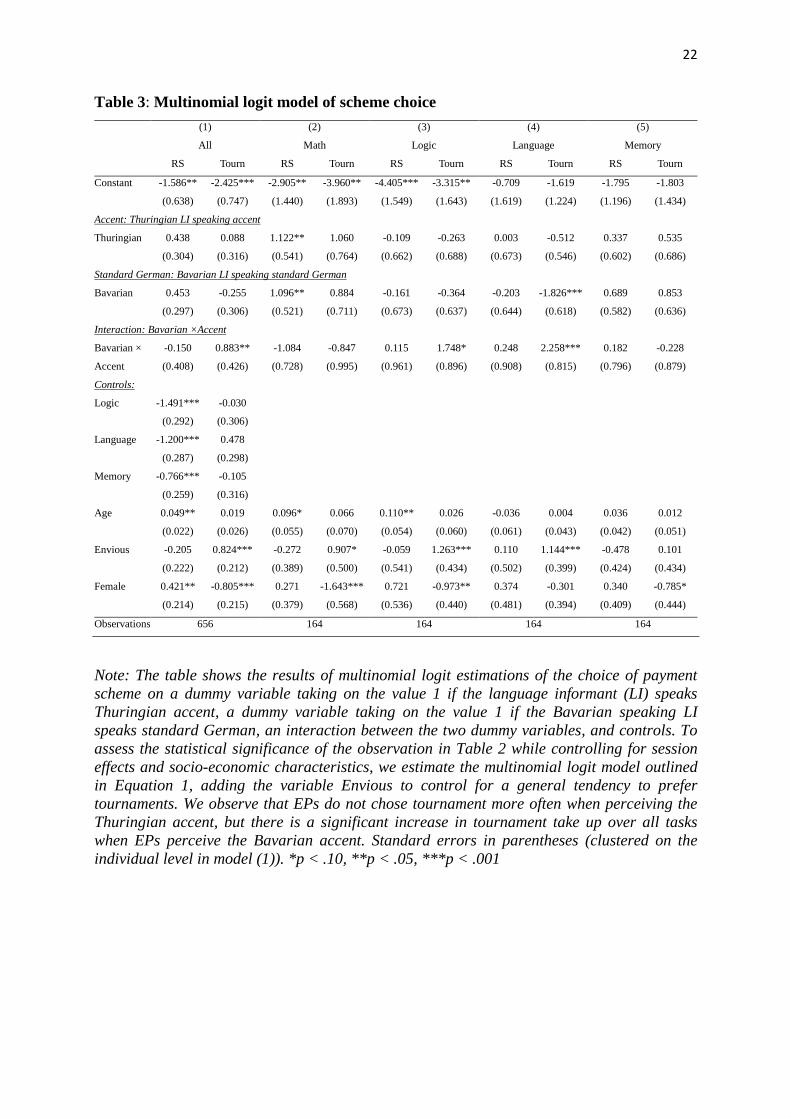
22
Table 3: Multinomial logit model of scheme choice (1) (2) (3) (4) (5) All Math Logic Language Memory RS Tourn RS Tourn RS Tourn RS Tourn RS Tourn Constant -1.586** -2.425*** -2.905** -3.960** -4.405*** -3.315** -0.709 -1.619 -1.795 -1.803 (0.638) (0.747) (1.440) (1.893) (1.549) (1.643) (1.619) (1.224) (1.196) (1.434) Accent: Thuringian LI speaking accent
Thuringian 0.438 0.088 1.122** 1.060 -0.109 -0.263 0.003 -0.512 0.337 0.535 (0.304) (0.316) (0.541) (0.764) (0.662) (0.688) (0.673) (0.546) (0.602) (0.686) Standard German: Bavarian LI speaking standard German
Bavarian 0.453 -0.255 1.096** 0.884 -0.161 -0.364 -0.203 -1.826*** 0.689 0.853 (0.297) (0.306) (0.521) (0.711) (0.673) (0.637) (0.644) (0.618) (0.582) (0.636) Interaction: Bavarian ×Accent
Bavarian × -0.150 0.883** -1.084 -0.847 0.115 1.748* 0.248 2.258*** 0.182 -0.228 Accent (0.408) (0.426) (0.728) (0.995) (0.961) (0.896) (0.908) (0.815) (0.796) (0.879) Controls:
Logic -1.491*** -0.030
(0.292) (0.306)
Language -1.200*** 0.478
(0.287) (0.298)
Memory -0.766*** -0.105
(0.259) (0.316)
Age 0.049** 0.019 0.096* 0.066 0.110** 0.026 -0.036 0.004 0.036 0.012 (0.022) (0.026) (0.055) (0.070) (0.054) (0.060) (0.061) (0.043) (0.042) (0.051) Envious -0.205 0.824*** -0.272 0.907* -0.059 1.263*** 0.110 1.144*** -0.478 0.101 (0.222) (0.212) (0.389) (0.500) (0.541) (0.434) (0.502) (0.399) (0.424) (0.434) Female 0.421** -0.805*** 0.271 -1.643*** 0.721 -0.973** 0.374 -0.301 0.340 -0.785* (0.214) (0.215) (0.379) (0.568) (0.536) (0.440) (0.481) (0.394) (0.409) (0.444) Observations 656 164 164 164 164
Note: The table shows the results of multinomial logit estimations of the choice of payment scheme on a dummy variable taking on the value 1 if the language informant (LI) speaks Thuringian accent, a dummy variable taking on the value 1 if the Bavarian speaking LI speaks standard German, an interaction between the two dummy variables, and controls. To assess the statistical significance of the observation in Table 2 while controlling for session effects and socio-economic characteristics, we estimate the multinomial logit model outlined in Equation 1, adding the variable Envious to control for a general tendency to prefer tournaments. We observe that EPs do not chose tournament more often when perceiving the Thuringian accent, but there is a significant increase in tournament take up over all tasks when EPs perceive the Bavarian accent. Standard errors in parentheses (clustered on the individual level in model (1)). *p < .10, **p < .05, ***p < .001
23
References
1. Krauss R M., Chiu C (1997) Language and social behavior. In: Gilbert D, Fiske ST, Lindsey G, editors. Handbook of Social Psychology. Boston: McGraw-Hill. pp. 41–88.
2. Cavalli-Sforza LL (2000) Genes, peoples and languages. London: Allen Lane. 227 p. 3. Ramus F, Hauser MD, Miller C, Morris D, Mehler J (2000) Language discrimination by
human newborns and by cotton-top tamarin monkeys. Science 288: 349–351. 4. Fina A de Code-Switching and the Construction of Ethnic Identity in a Community of
Practice. Language in Society (LSoc) 36 (3): 371–392. Available: 10.1017/S0047404507070182.
5. Preston D (2010) Mapping the geolinguistic spaces of the brain. In: Lameli A, Kehrein R, Rabanus S, editors. Language and Space. An International Handbook of Linguistic Variation. Berlin, New York: Mouton de Gruyter.
6. Rakić T, Steffens MC, Mummendey A (2011) When it matters how you pronounce it: The influence of regional accents on job interview outcome. British Journal of Psychology 102: 868–883.
7. Lev-Ari S, Keysar B (2010) Why don't we believe non-native speakers? The influence of accent on credibility. Journal of Experimental Social Psychology 46: 1093–1096.
8. Ginsburgh V, Weber S (2011) How many languages do we need? The economics of linguistic diversity. Princeton: Princeton University Press.
9. Mai R, Hoffmann S (2011) Four positive effects of a salesperson's regional dialect in services selling. Journal of Service Research 14: 460–474.
10. Tsalikis J, Ortiz-Buonafina M, LaTour MS (1992) The Role of Accent on the Credibility and Effectiveness of the International Business Person: The Case of Guatemala. International Marketing Review 9 (4): 57–72.
11. Holmes K, Murachver T, Bayard D (2001) Accent, appearance and ethnic stereotypes in New Zealand. New Zealand Journal of Psychology 30 (2): 79–86.
12. Frumkin L (2007) Influences of accent and ethnic background on perceptions of eyewitness. Psychology, Crime and Law 13: 317–331.
13. Dixon JA, Mahoney B, Cocks R (2002) Accents of guilt? Effects of regional accent, ‘race’ and crime type on attributions of guilt. Journal of Language and Social Psychology 21: 162–168.
14. Deprez-Sims AS, Morris SB (2010) Accents in the workplace: their effects during a job interview. International Journal of Psychology 45 (6): 417–426.
15. Hamermesh DS, Biddle JE (1994) Beauty and the labor market. The American Economic Review 84: 1174–1194.
16. Purnell T, Idsardi W, Baugh J (1999) Perceptual and phonetic experiments on American English dialect ientification. Journal of Language and Social Psychology 18: 10–30.
17. Mobius MM, Rosenblat TS (2006) Why beauty matters. The American Economic Review 96: 222–235.
18. Gluszek A, Dovidio JF (2010) The way they speak: A social psychological perspective on the stigma of nonnative accents in communication. Personality and Social Psychology Review 14: 214–237.
24
19. Romaine S (1980) Stylistic Variation and Evaluative Reactions To Speech: Problems in the Investigation of Linguistic Attitudes in Scotland. Language and Speech 23 (3): 213–232.
20. Chambers JK, Trudgill P (1999) Dialectology. Cambridge: Cambridge University Press. 21. Auer P (2005) Europe's Sociolinguistic Unity, or: A Typology of European Dialect /
Standard Constellations. In: Delbecque N, van der Auwera J, Geeraerts D, editors. Perspectives on Variation. Berlin: Mouton de Gruyter. pp. 7–42.
22. Kehrein R (2012) Regionalsprachliche Spektren im Raum. Zur linguistischen Struktur der Vertikale. Stuttgart: Steiner. 389 p.
23. Schmidt JE Formation of and change in regiolects and (regional) dialects in German. Taal & Tongval 63, 1.
24. Coupland N, Bishop H (2007) Ideologised values for British accents. Journal of Sociolinguistics 11: 74–93.
25. Falck O, Heblich S, Lameli A, Südekum J (2012) Dialects, cultural identity, and economic exchange. Journal of urban economics 72: 225–239.
26. Souza AL, Byers-Heinlein K, Poulin-Dubois D (2013) Bilingual and monolingual children prefer native-accented speakers. Frontiers in Psychology 4 (953).
27. Kinzler KD, Dupoux E, Spelke ES (2007) The native language of social cognition. Proceedings of the National Academy of Science 104 (30): 12577–12580.
28. Thorne S (2005) Accent pride and prejudice: Are speakers of stigmatized variants really less loyal. Journal of Quantitative Linguistics 12: 151–166.
29. Manski CF (1993) Identification of endogenous social effects: The reflection problem. The Review of Economic Studies 60: 531–542.
30. Institut für Demoskopie Allensbach (2008) IfD-survey 10016, Allensbach. 31. Fershtman C, Gneezy U (2001) Discrimination in a segmented society: An experimental
approach. Quarterly Journal of Economics: 351–377. 32. Purschke C (2011) Regionalsprache und Hörerurteil. Grundzüge einer perzeptiven
Variationslinguistik. Stuttgart: Steiner. 347, XVI S p. 33. Herrgen J, Schmidt JE (1989) Dialektalitätsareale und Dialektabbau. In: Putschke W,
Veith WH, Wiesinger P, editors. Dialektgeographie und Dialektologie. Günter Bellmann zum 60. Geburtstag von seinen Schülern und Freunden. Marburg: Elwert. pp. 304–346.
34. Lambert WE, Hodgson RC, Gardner RC, Fillenbaum S (1960) Evaluational Reactions to Spoken Language. Journal of Abnormal and Social Psychology 60: 44–51.
35. Lameli A (2004) Standard und Substandard. Regionalismen im diachronen Längsschnitt. Stuttgart: Steiner. 272 S p.
36. Schmitt EH (1992) Interdialektale Verstehbarkeit. Eine Untersuchung im Rhein- und Moselfränkischen. Stuttgart: Steiner.
37. Greiner B (2004) An online recruitment system for economic experiments. MPRA Paper No. 13513. Available: http://mpra.ub.uni-muenchen.de/13513/. Accessed 23 February 2014.
38. Zizzo DJ (2010) Experimenter demand effects in economic experiments. Experimental economics : a journal of the Economic Science Association 13 (1): 75–98.
39. Fischbacher U (2007) z-Tree. Zurich toolbox for ready-made economic experiments. Experimental Economics 10 (2): 171–178.
25
40. Hanushek EA, Schwerdt G, Wiederhold S, Woessmann L (2013) Returns to Skills around the World: Evidence from PIAAC.
41. Niederle M, Vesterlund L (2007) Do women shy away from competition? Do men compete too much. The Quarterly Journal of Economics 122: 1067–1101.
42. Grosse ND, Riener G (2010) Explaining gender differences in competitiveness. Gender-task stereotypes. Available: http://zs.thulb.uni-jena.de/receive/jportal_jparticle_00165582.
43. Holt CA, Laury SK (2002) Risk aversion and incentive effects. The American Economic Review 92: 1644–1655.
44. Durante R, Putterman L, Van der Weele J (2014) Preferences for redistribution and perception of fairness: An experimental study. Journal of the European Economic Associations.
45. Huesmann A (1998) Zwischen Dialekt und Standard. Empirische Untersuchung zur Soziolinguistik des Varietätenspektrums im Deutschen. Tübingen: Niemeyer. XV, 287 S p.
46. Eckert P (2012) Three Waves of Variation Study: The Emergence of Meaning in the Study of Sociolinguistic Variation. Annual Review of Anthropology 41: 87–100.
47. Kruger J, Dunning D (1999) Unskilled and unaware of it: How difficulties in recognizing one's own incompetence lead to inflated self-assessments. Journal of Personality and Social Psychology 77 (6): 1121–1134.
48. Wheeler ME, Fiske ST (2005) Controlling racial prejudice and stereotyping: Social cognitive goals affect amygdala and stereotype activation. Psychological Science 16: 56–63.
26
Appendix: Supporting Information
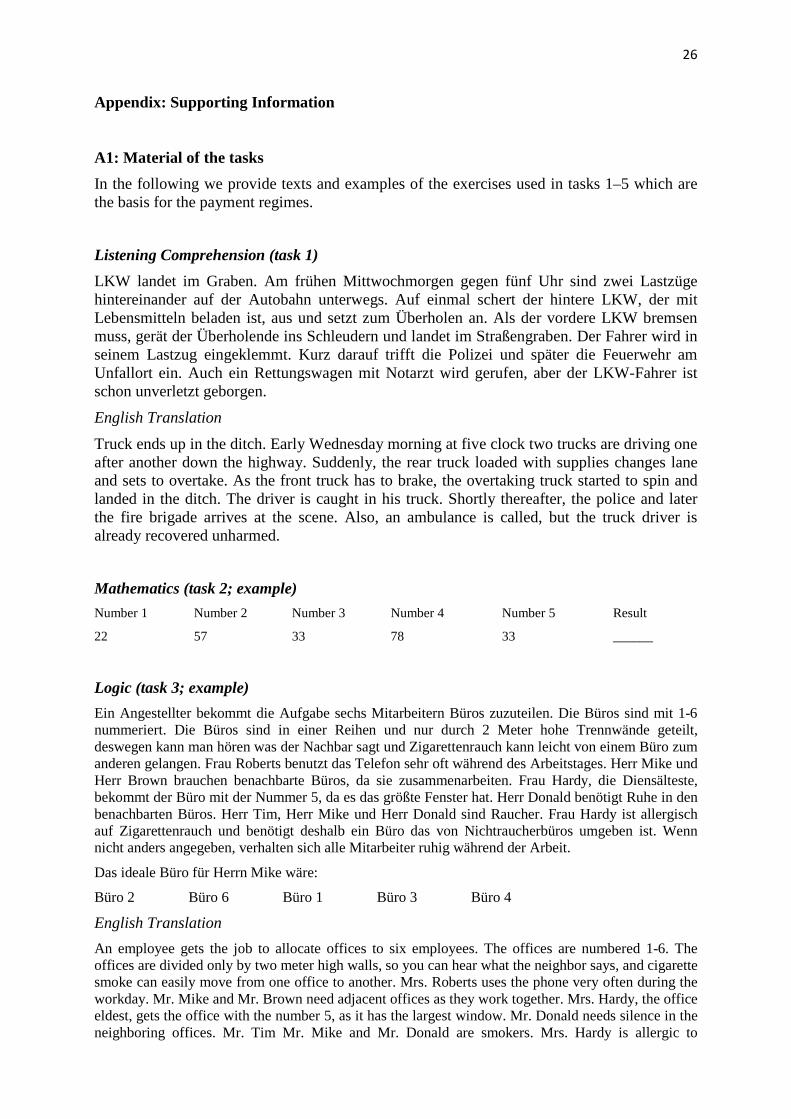
A1: Material of the tasks In the following we provide texts and examples of the exercises used in tasks 1–5 which are the basis for the payment regimes.
Listening Comprehension (task 1) LKW landet im Graben. Am frühen Mittwochmorgen gegen fünf Uhr sind zwei Lastzüge hintereinander auf der Autobahn unterwegs. Auf einmal schert der hintere LKW, der mit Lebensmitteln beladen ist, aus und setzt zum Überholen an. Als der vordere LKW bremsen muss, gerät der Überholende ins Schleudern und landet im Straßengraben. Der Fahrer wird in seinem Lastzug eingeklemmt. Kurz darauf trifft die Polizei und später die Feuerwehr am Unfallort ein. Auch ein Rettungswagen mit Notarzt wird gerufen, aber der LKW-Fahrer ist schon unverletzt geborgen.
English Translation Truck ends up in the ditch. Early Wednesday morning at five clock two trucks are driving one after another down the highway. Suddenly, the rear truck loaded with supplies changes lane and sets to overtake. As the front truck has to brake, the overtaking truck started to spin and landed in the ditch. The driver is caught in his truck. Shortly thereafter, the police and later the fire brigade arrives at the scene. Also, an ambulance is called, but the truck driver is already recovered unharmed.
Mathematics (task 2; example) Number 1 Number 2 Number 3 Number 4 Number 5 Result
22 57 33 78 33 ______
Logic (task 3; example) Ein Angestellter bekommt die Aufgabe sechs Mitarbeitern Büros zuzuteilen. Die Büros sind mit 1-6 nummeriert. Die Büros sind in einer Reihen und nur durch 2 Meter hohe Trennwände geteilt, deswegen kann man hören was der Nachbar sagt und Zigarettenrauch kann leicht von einem Büro zum anderen gelangen. Frau Roberts benutzt das Telefon sehr oft während des Arbeitstages. Herr Mike und Herr Brown brauchen benachbarte Büros, da sie zusammenarbeiten. Frau Hardy, die Diensälteste, bekommt der Büro mit der Nummer 5, da es das größte Fenster hat. Herr Donald benötigt Ruhe in den benachbarten Büros. Herr Tim, Herr Mike und Herr Donald sind Raucher. Frau Hardy ist allergisch auf Zigarettenrauch und benötigt deshalb ein Büro das von Nichtraucherbüros umgeben ist. Wenn nicht anders angegeben, verhalten sich alle Mitarbeiter ruhig während der Arbeit.
Das ideale Büro für Herrn Mike wäre:
Büro 2 Büro 6 Büro 1 Büro 3 Büro 4
English Translation An employee gets the job to allocate offices to six employees. The offices are numbered 1-6. The offices are divided only by two meter high walls, so you can hear what the neighbor says, and cigarette smoke can easily move from one office to another. Mrs. Roberts uses the phone very often during the workday. Mr. Mike and Mr. Brown need adjacent offices as they work together. Mrs. Hardy, the office eldest, gets the office with the number 5, as it has the largest window. Mr. Donald needs silence in the neighboring offices. Mr. Tim Mr. Mike and Mr. Donald are smokers. Mrs. Hardy is allergic to
27
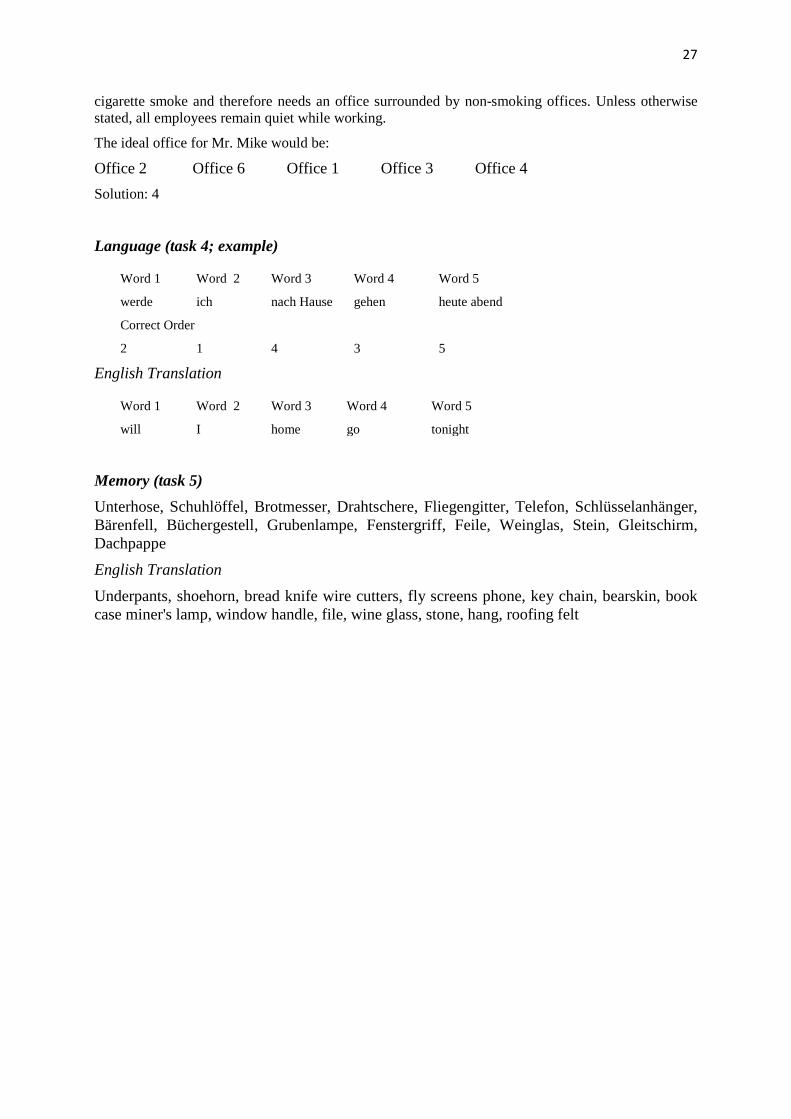
cigarette smoke and therefore needs an office surrounded by non-smoking offices. Unless otherwise stated, all employees remain quiet while working.
The ideal office for Mr. Mike would be:
Office 2 Office 6 Office 1 Office 3 Office 4 Solution: 4
Language (task 4; example)
Word 1 Word 2 Word 3 Word 4 Word 5
werde ich nach Hause gehen heute abend
Correct Order
2 1 4 3 5
English Translation
Word 1 Word 2 Word 3 Word 4 Word 5
will I home go tonight
Memory (task 5) Unterhose, Schuhlöffel, Brotmesser, Drahtschere, Fliegengitter, Telefon, Schlüsselanhänger, Bärenfell, Büchergestell, Grubenlampe, Fenstergriff, Feile, Weinglas, Stein, Gleitschirm, Dachpappe
English Translation Underpants, shoehorn, bread knife wire cutters, fly screens phone, key chain, bearskin, book case miner's lamp, window handle, file, wine glass, stone, hang, roofing felt
28
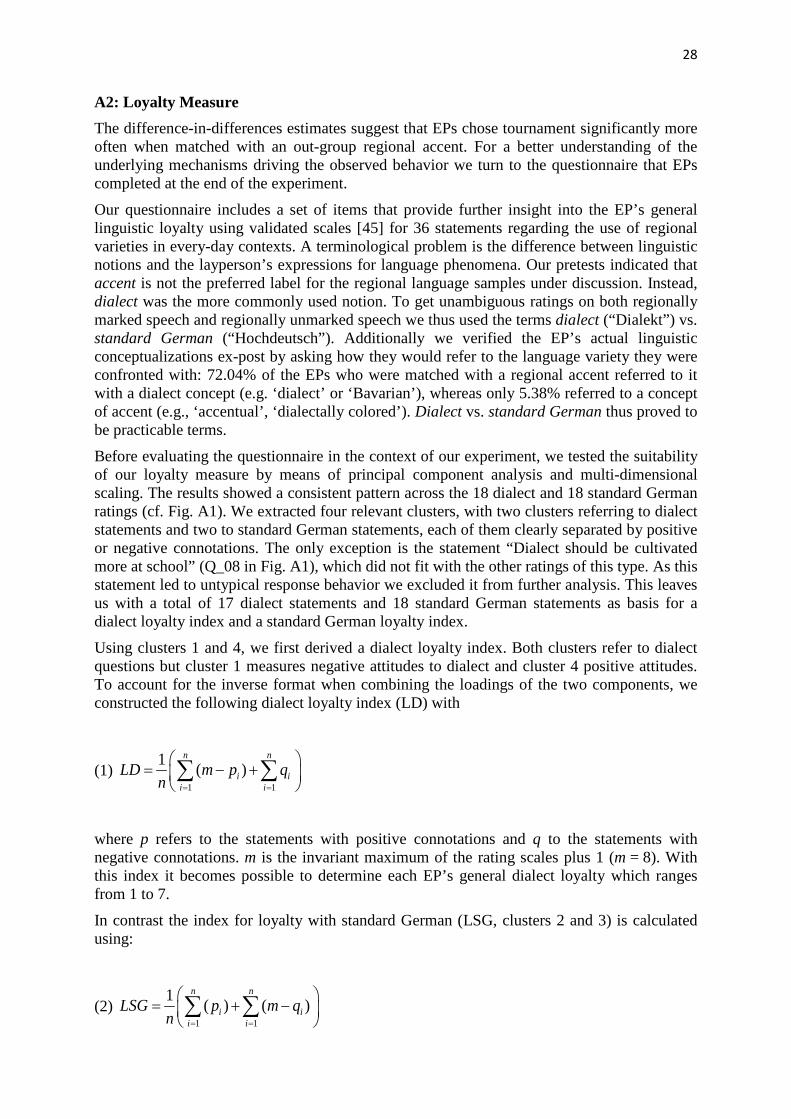
A2: Loyalty Measure The difference-in-differences estimates suggest that EPs chose tournament significantly more often when matched with an out-group regional accent. For a better understanding of the underlying mechanisms driving the observed behavior we turn to the questionnaire that EPs completed at the end of the experiment.
Our questionnaire includes a set of items that provide further insight into the EP’s general linguistic loyalty using validated scales [45] for 36 statements regarding the use of regional varieties in every-day contexts. A terminological problem is the difference between linguistic notions and the layperson’s expressions for language phenomena. Our pretests indicated that accent is not the preferred label for the regional language samples under discussion. Instead, dialect was the more commonly used notion. To get unambiguous ratings on both regionally marked speech and regionally unmarked speech we thus used the terms dialect (“Dialekt”) vs. standard German (“Hochdeutsch”). Additionally we verified the EP’s actual linguistic conceptualizations ex-post by asking how they would refer to the language variety they were confronted with: 72.04% of the EPs who were matched with a regional accent referred to it with a dialect concept (e.g. ‘dialect’ or ‘Bavarian’), whereas only 5.38% referred to a concept of accent (e.g., ‘accentual’, ‘dialectally colored’). Dialect vs. standard German thus proved to be practicable terms.
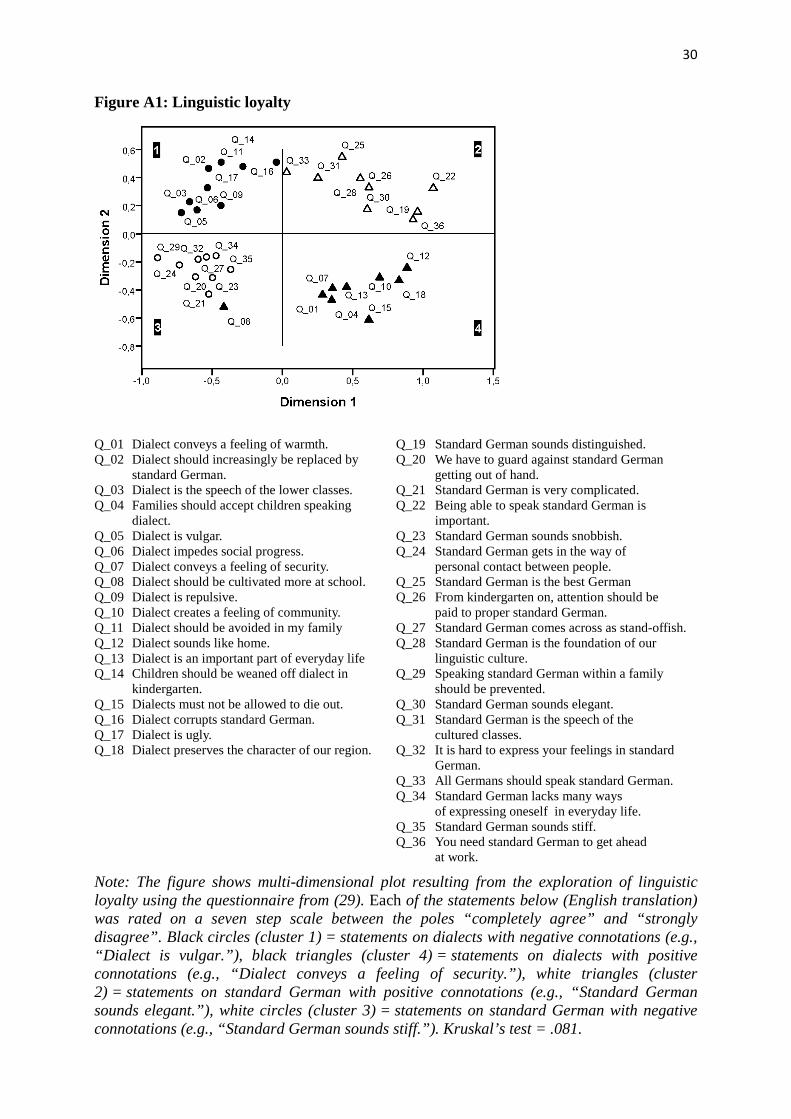
Before evaluating the questionnaire in the context of our experiment, we tested the suitability of our loyalty measure by means of principal component analysis and multi-dimensional scaling. The results showed a consistent pattern across the 18 dialect and 18 standard German ratings (cf. Fig. A1). We extracted four relevant clusters, with two clusters referring to dialect statements and two to standard German statements, each of them clearly separated by positive or negative connotations. The only exception is the statement “Dialect should be cultivated more at school” (Q_08 in Fig. A1), which did not fit with the other ratings of this type. As this statement led to untypical response behavior we excluded it from further analysis. This leaves us with a total of 17 dialect statements and 18 standard German statements as basis for a dialect loyalty index and a standard German loyalty index.
Using clusters 1 and 4, we first derived a dialect loyalty index. Both clusters refer to dialect questions but cluster 1 measures negative attitudes to dialect and cluster 4 positive attitudes. To account for the inverse format when combining the loadings of the two components, we constructed the following dialect loyalty index (LD) with
(1) 1 1
1 ( )n n
i ii i
LD m p qn = =
= − +
∑ ∑
where p refers to the statements with positive connotations and q to the statements with negative connotations. m is the invariant maximum of the rating scales plus 1 (m = 8). With this index it becomes possible to determine each EP’s general dialect loyalty which ranges from 1 to 7.
In contrast the index for loyalty with standard German (LSG, clusters 2 and 3) is calculated using:
(2) 1 1
1 ( ) ( )n n
i ii i
LSG p m qn = =
= + −
∑ ∑

29
These measures are expressions of an EP’s general loyalty for dialects (regional varieties respectively) and/or standard German as well as his/her cultural appreciation of these varieties. Loyalty to dialect indicates a language-related feeling of regional identity; loyalty to standard German reflects a supra-regional or even national identity. Note that these measures are not mutually exclusive, i.e. we allow for the possibility that both kinds of identity may apply to the same EP. In our experiment, they should be captured in our first differences as they refer to the discrimination against dialect (or standard) German speakers (Table S2).
30
Figure A1: Linguistic loyalty
Q_01 Q_02 Q_03 Q_04 Q_05 Q_06 Q_07 Q_08 Q_09 Q_10 Q_11 Q_12 Q_13 Q_14 Q_15 Q_16 Q_17 Q_18
Dialect conveys a feeling of warmth. Dialect should increasingly be replaced by standard German. Dialect is the speech of the lower classes. Families should accept children speaking dialect. Dialect is vulgar. Dialect impedes social progress. Dialect conveys a feeling of security. Dialect should be cultivated more at school. Dialect is repulsive. Dialect creates a feeling of community. Dialect should be avoided in my family Dialect sounds like home. Dialect is an important part of everyday life Children should be weaned off dialect in kindergarten. Dialects must not be allowed to die out. Dialect corrupts standard German. Dialect is ugly. Dialect preserves the character of our region.
Q_19 Q_20 Q_21 Q_22 Q_23 Q_24 Q_25 Q_26 Q_27 Q_28 Q_29 Q_30 Q_31 Q_32 Q_33 Q_34 Q_35 Q_36
Standard German sounds distinguished. We have to guard against standard German getting out of hand. Standard German is very complicated. Being able to speak standard German is important. Standard German sounds snobbish. Standard German gets in the way of personal contact between people. Standard German is the best German From kindergarten on, attention should be paid to proper standard German. Standard German comes across as stand-offish. Standard German is the foundation of our linguistic culture. Speaking standard German within a family should be prevented. Standard German sounds elegant. Standard German is the speech of the cultured classes. It is hard to express your feelings in standard German. All Germans should speak standard German. Standard German lacks many ways of expressing oneself in everyday life. Standard German sounds stiff. You need standard German to get ahead at work.
Note: The figure shows multi-dimensional plot resulting from the exploration of linguistic loyalty using the questionnaire from (29). Each of the statements below (English translation) was rated on a seven step scale between the poles “completely agree” and “strongly disagree”. Black circles (cluster 1) = statements on dialects with negative connotations (e.g., “Dialect is vulgar.”), black triangles (cluster 4) = statements on dialects with positive connotations (e.g., “Dialect conveys a feeling of security.”), white triangles (cluster 2) = statements on standard German with positive connotations (e.g., “Standard German sounds elegant.”), white circles (cluster 3) = statements on standard German with negative connotations (e.g., “Standard German sounds stiff.”). Kruskal’s test = .081.
31
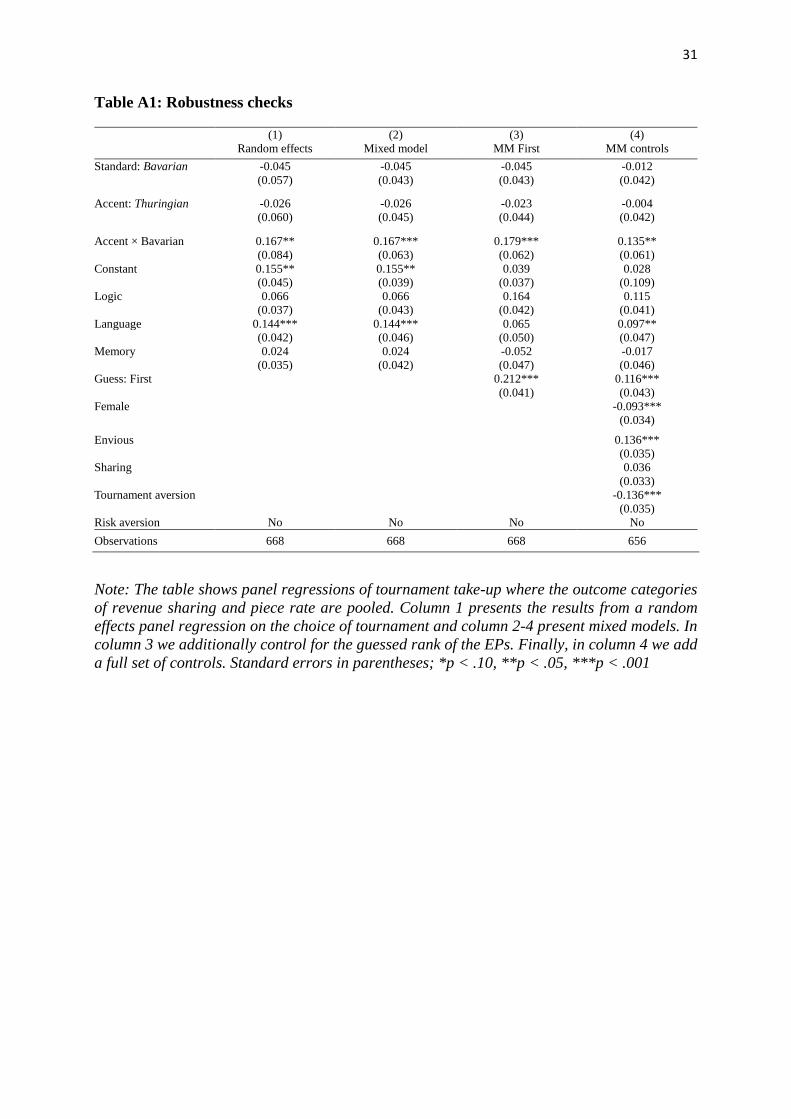
Table A1: Robustness checks
(1) (2) (3) (4) Random effects Mixed model MM First MM controls
Standard: Bavarian -0.045 -0.045 -0.045 -0.012 (0.057) (0.043) (0.043) (0.042) Accent: Thuringian -0.026 -0.026 -0.023 -0.004 (0.060) (0.045) (0.044) (0.042) Accent × Bavarian 0.167** 0.167*** 0.179*** 0.135** (0.084) (0.063) (0.062) (0.061) Constant 0.155** 0.155** 0.039 0.028 (0.045) (0.039) (0.037) (0.109) Logic 0.066 0.066 0.164 0.115 (0.037) (0.043) (0.042) (0.041) Language 0.144*** 0.144*** 0.065 0.097** (0.042) (0.046) (0.050) (0.047) Memory 0.024 0.024 -0.052 -0.017 (0.035) (0.042) (0.047) (0.046) Guess: First 0.212*** 0.116*** (0.041) (0.043) Female -0.093*** (0.034) Envious 0.136*** (0.035) Sharing 0.036 (0.033) Tournament aversion -0.136*** (0.035) Risk aversion No No No No Observations 668 668 668 656 Note: The table shows panel regressions of tournament take-up where the outcome categories of revenue sharing and piece rate are pooled. Column 1 presents the results from a random effects panel regression on the choice of tournament and column 2-4 present mixed models. In column 3 we additionally control for the guessed rank of the EPs. Finally, in column 4 we add a full set of controls. Standard errors in parentheses; *p < .10, **p < .05, ***p < .001
32
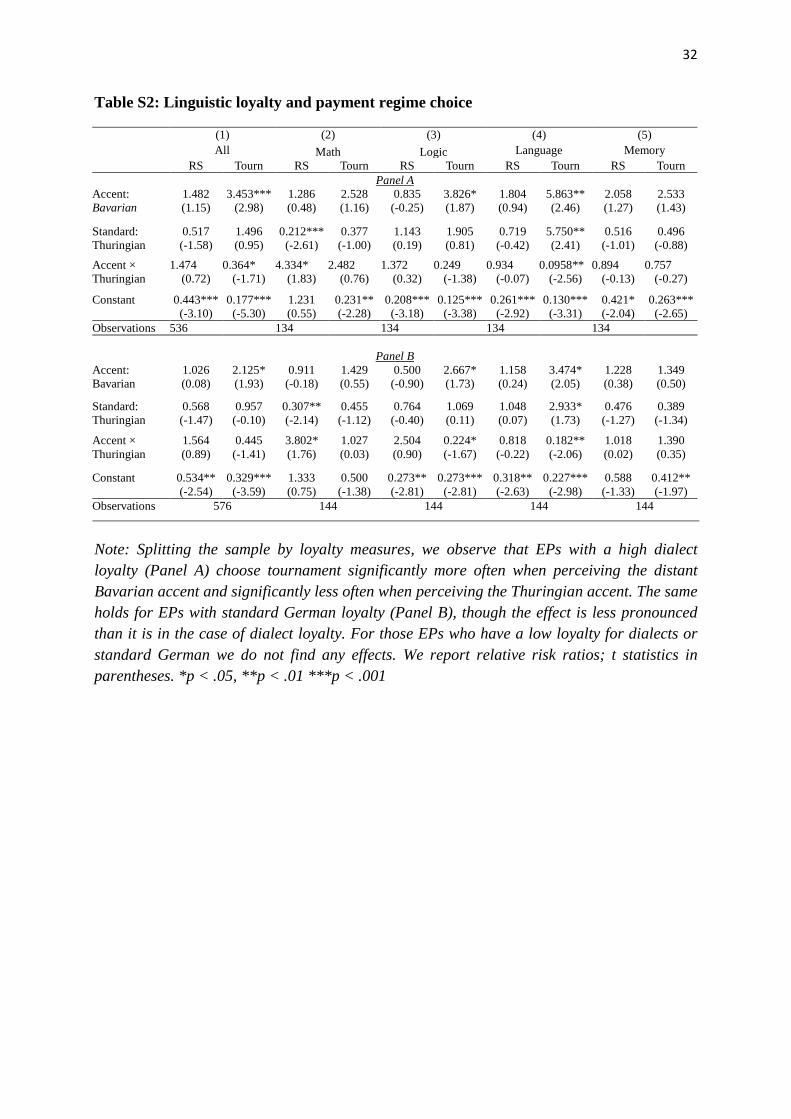
Table S2: Linguistic loyalty and payment regime choice
(1) (2) (3) (4) (5) All Math Logic Language Memory RS Tourn RS Tourn RS Tourn RS Tourn RS Tourn
Panel A Accent: 1.482 3.453*** 1.286 2.528 0.835 3.826* 1.804 5.863** 2.058 2.533 Bavarian (1.15) (2.98) (0.48) (1.16) (-0.25) (1.87) (0.94) (2.46) (1.27) (1.43)
Standard: 0.517 1.496 0.212*** 0.377 1.143 1.905 0.719 5.750** 0.516 0.496 Thuringian (-1.58) (0.95) (-2.61) (-1.00) (0.19) (0.81) (-0.42) (2.41) (-1.01) (-0.88)
Accent × 1.474 0.364* 4.334* 2.482 1.372 0.249 0.934 0.0958** 0.894 0.757 Thuringian (0.72) (-1.71) (1.83) (0.76) (0.32) (-1.38) (-0.07) (-2.56) (-0.13) (-0.27)
Constant 0.443*** 0.177*** 1.231 0.231** 0.208*** 0.125*** 0.261*** 0.130*** 0.421* 0.263*** (-3.10) (-5.30) (0.55) (-2.28) (-3.18) (-3.38) (-2.92) (-3.31) (-2.04) (-2.65) Observations 536 134 134 134 134
Panel B Accent: 1.026 2.125* 0.911 1.429 0.500 2.667* 1.158 3.474* 1.228 1.349 Bavarian (0.08) (1.93) (-0.18) (0.55) (-0.90) (1.73) (0.24) (2.05) (0.38) (0.50)
Standard: 0.568 0.957 0.307** 0.455 0.764 1.069 1.048 2.933* 0.476 0.389 Thuringian (-1.47) (-0.10) (-2.14) (-1.12) (-0.40) (0.11) (0.07) (1.73) (-1.27) (-1.34)
Accent × 1.564 0.445 3.802* 1.027 2.504 0.224* 0.818 0.182** 1.018 1.390 Thuringian (0.89) (-1.41) (1.76) (0.03) (0.90) (-1.67) (-0.22) (-2.06) (0.02) (0.35)
Constant 0.534** 0.329*** 1.333 0.500 0.273** 0.273*** 0.318** 0.227*** 0.588 0.412** (-2.54) (-3.59) (0.75) (-1.38) (-2.81) (-2.81) (-2.63) (-2.98) (-1.33) (-1.97) Observations 576 144 144 144 144
Note: Splitting the sample by loyalty measures, we observe that EPs with a high dialect loyalty (Panel A) choose tournament significantly more often when perceiving the distant Bavarian accent and significantly less often when perceiving the Thuringian accent. The same holds for EPs with standard German loyalty (Panel B), though the effect is less pronounced than it is in the case of dialect loyalty. For those EPs who have a low loyalty for dialects or standard German we do not find any effects. We report relative risk ratios; t statistics in parentheses. *p < .05, **p < .01 ***p < .001