Embed Size (px)
Citation preview
Identification and Characterization of
GAS2L3 as a Novel Mitotic Regulator in
Human Cells
Dissertation zur Erlangung des
naturwissenschaftlichen Doktorgrades
der Bayerischen Julius-Maximilians-Universität Würzburg
vorgelegt von
Kathrin Schmitt aus
Freiburg im Breisgau
Würzburg, 2010
Eingereicht am:
……………………………………………………………………
Mitglieder der Promotionskommission:
Vorsitzender:
1. Gutachter: Prof. Dr. Stefan Gaubatz
2. Gutachter: Prof. Dr. Georg Krohne
Tag des Promotionskolloquiums:
……………………………………………………………………
Doktorurkunde ausgehändigt am:
……………………………………………………………………
ABSTRACT
Precise control of mitotic progression is vital for the maintenance of genomic integrity. Since the loss of genomic integrity is known to promote tumorigenesis, the identification of knew G2/M regulatory genes attracts great attention.
LINC, a human multiprotein complex, is a transcriptional activator of a set of G2/M specific genes. By depleting LIN9 in MEFs, a core subunit of LINC, Gas2l3 was identified as a novel LINC target gene. The so far uncharacterized Gas2l3 gene encodes for a member of the family of growth arrest specific 2 (GAS2) proteins, which share a highly conserved putative actin binding CH and a putative microtubule binding GAS2 domain.
In the present study GAS2L3 was identified as a LINC target gene also in human cells.
Gene expression analysis revealed that GAS2L3 transcription, in contrast to all other GAS2 family members, is highly regulated during the cell cycle with highest expression in G2/M. The GAS2L3 protein showed a specific localization pattern during the M phase: In metaphase, GAS2L3 localized to the mitotic spindle, relocated to the spindle midzone microtubules in late anaphase and concentrated at the midbody in telophase where it persisted until the end of cytokinesis. Overexpression of a set of different GAS2L3 deletion mutants demonstrated that the localization to the mitotic microtubule network is dependent on the C-terminus, whereas the midbody localization is dependent on full length GAS2L3 protein. Additionally, exclusive overexpression of the CH domain induced the formation of actin stress fibers, suggesting that the CH domain is an actin binding domain. In contrast, the GAS2 domain was neither needed nor sufficient for microtubule binding, indicating that there must be an additional so far unknown microtubule binding domain in the C-terminus. Interestingly, immunoblot analysis also identified the C-terminus as the domain responsible for GAS2L3 protein instability, partially dependent on proteasomal degradation.
Consistent with its specific localization pattern, GAS2L3 depletion by RNAi demonstrated its responsibility for proper mitosis and cytokinesis. GAS2L3 depletion in HeLa cells resulted in the accumulation of multinucleated cells, an indicator for chromosome mis-segregation during mitosis. Also the amount of cells in cytokinesis was enriched, indicating failures in completing the last step of cytokinesis, the abscission. Strikingly, treatment with microtubule poisons that lead to the activation of the spindle assembly checkpoint (SAC) indicated that the SAC was weakened in GAS2L3 depleted cells. Although the exact molecular mechanism is still unknown, fist experiments support the hypothesis that GAS2L3 might be a regulator of the SAC master kinase BUBR1.
In conclusion, this study provides first evidence for GAS2L3 as a novel regulator of mitosis and cytokinesis and it might therefore be an important guardian against tumorigenesis.
Die Identifizierung und Charakterisierung von GAS2L3 als neuer Regulator der Mitose in humanen Zellen
KURZFASSUNG
Der korrekte Verlauf durch die Mitose des Zellzyklus trägt entscheidend zur Aufrechterhaltung der genomischen Integrität bei. Da ein Verlust der genomischen Integrität die Tumorentstehung begünstigt, ist die Identifizierung neuer G2/M regulatorischer Gene ein Forschungsbereich, der großes Interesse weckt.
Der humane Multiproteinkomplex LINC ist für die transkriptionelle Aktivierung einer Vielzahl G2/M spezifischer Gene verantwortlich. Durch die Depletion von LIN9 in MEFs, einer Kernkomponente von LINC, wurde Gas2l3 als ein neues Zielgen von LINC identifiziert. Das bisher uncharakterisierte Gas2l3 Gen codiert für ein der GAS2 (growth arrest specific 2) Familie zugehöriges Protein, deren Mitglieder sich durch eine hoch konservierte putative Aktin-bindende Domäne (CH) und eine putative Mikrotubuli-bindende Domäne (GAS2) auszeichnen.
In der vorliegenden Arbeit konnte gezeigt werden, dass GAS2L3 auch in humanen
Zellen ein Zielgen von LINC ist. Die Transkription von GAS2L3 wies, im Gegensatz zu allen anderen GAS2 Familienmitgliedern, eine starke Regulation während des Zellzyklus auf, wobei die höchste Genexpression in der G2/M Phase vorlag. Das GAS2L3 Protein zeigte eine spezifische Lokalisation während der M Phase: In der Metaphase findet sich GAS2L3 an der mitotischen Spindel, wandert von dort an die Mikrotubuli der zentralen Spindel der Anaphase und konzentriert sich in der Telophase am Midbody, wo es bis zum Ende der Zytokinese verweilt. Der Einsatz unterschiedlicher Deletionsmutanten demonstrierte, dass die Lokalisation an die mitotischen Mikrotubuli vom C-Terminus abhängig ist, wohingegen die Lokalisation am Midbody von der gesamten Proteinsequenz abhängt. Die Ausbildung von Aktin-Streß-Filamenten nach alleiniger Überexpression der CH Domäne deutete darauf hin, dass die CH Domäne eine Aktin-bindende Domäne ist. Die GAS2 Domäne hingegen wurde weder für die Interaktion mit Mikrotubuli gebraucht, noch war sie alleine für diese ausreichend. Alle Daten weisen darauf hin, dass GAS2L3 eine bisher unbekannte Mikrotubuli-bindende Domäne im C-Terminus trägt. Interessanterweise ist der C-Terminus auch für die hohe Instabilität des GAS2L3 Proteins, die teilweise durch den Abbau im Proteasom verursacht wird, verantwortlich.
Entsprechend der spezifischen Lokalisation zeigte die Depletion von GAS2L3 durch siRNA Transfektion dessen Wichtigkeit für den korrekten Verlauf der M Phase. GAS2L3 depletierte HeLa Zellen zeigten eine Anreicherung von multinukleären Zellen, welche ein Indikator für die fehlerhafte Verteilung der Chromosomen in der Mitose sind. Ein Hinweis auf Probleme im Beenden der Zytokinese stellte die erhöhte Anzahl von Zellen dar, die sich in der Zytokinese befanden. Eines der auffallendsten Merkmale war ein geschwächter mitotischer Spindelkontrollpunkt, den GAS2L3 depletierte Zellen nach der Behandlung mit den Kontrollpunkt aktivierenden Mikrotubuli-Giften aufwiesen. Auch wenn der exakte molekulare Mechanismus hierbei noch unbekannt ist, deuten erste Experimente darauf hin, dass GAS2L3 die Aktivität von BUBR1, einer essentiellen Kinase des mitotischen Spindelkontrollpunkts, beeinflusst.
Alle Daten dieser Arbeit verdeutlichen die Wichtigkeit von GAS2L3 als einen neuen Regulator der Mitose und Zytokinese. Somit ist anzunehmen, dass die korrekte Funktion von GAS2L3 entscheidend zum Schutz vor Tumorentstehung beiträgt.
I
TABLE OF CONTENTS 1 INTRODUCTION ................................................................................. 1
1.1 The human cell cycle ........................................................................................... 1 1.1.1 Cell cycle regulation by cyclin/CDK complexes ............................................ 1 1.1.2 Cell division: the M phase ............................................................................... 4
1.1.2.1 Mitosis ............................................................................................................... 4 1.1.2.2 Cytokinesis ........................................................................................................ 5
1.1.2.2.1 Cleavage furrow formation ................................................................... 6 1.1.2.2.2 Midbody formation and abscission ....................................................... 6
1.1.3 The Spindle assembly checkpoint ................................................................... 7 1.1.3.1 The spindle assembly checkpoint and cancer ................................................... 9
1.2 The LIN complex ............................................................................................... 10 1.2.1 LINC characterization in vitro ....................................................................... 10 1.2.2 LINC characterization in vivo ....................................................................... 10
1.2.2.1 LINC target genes in mice .............................................................................. 11
1.3 The family of growth arrest specific genes ...................................................... 12 1.3.1 The GAS2 family........................................................................................... 13
1.3.1.1 The highly conserved CH and GAS2 domains ............................................... 13 1.3.1.2 GAS2 ............................................................................................................... 14 1.3.1.3 GAS2L1 (GAR22) .......................................................................................... 14 1.3.1.4 GAS2L2 (GAR17) .......................................................................................... 14 1.3.1.5 GAS2L3 .......................................................................................................... 15
1.4 Aim of this study ................................................................................................ 15
2 MATERIAL & METHODS ............................................................... 16
2.1 Materials............................................................................................................. 16 2.1.1 Chemical Stocks & Reagents ........................................................................ 16 2.1.2 Enzymes......................................................................................................... 17 2.1.3 Antibiotics ..................................................................................................... 17 2.1.4 Buffers ........................................................................................................... 18
2.1.4.1 General buffers ................................................................................................ 18 2.1.4.2 Buffers for whole protein lysates .................................................................... 19 2.1.4.3 Buffers for immunoprecipitation and immunoblot ......................................... 19 2.1.4.4 Buffers for inclusion body purification ........................................................... 20 2.1.4.5 Buffers for flow cytometry (FACS) ................................................................ 20 2.1.4.6 Buffers for immunofluorescence .................................................................... 20
2.1.5 Antibodies ...................................................................................................... 21 2.1.5.1 Primary antibodies .......................................................................................... 21
II
2.1.5.2 Secondary antibodies ...................................................................................... 22
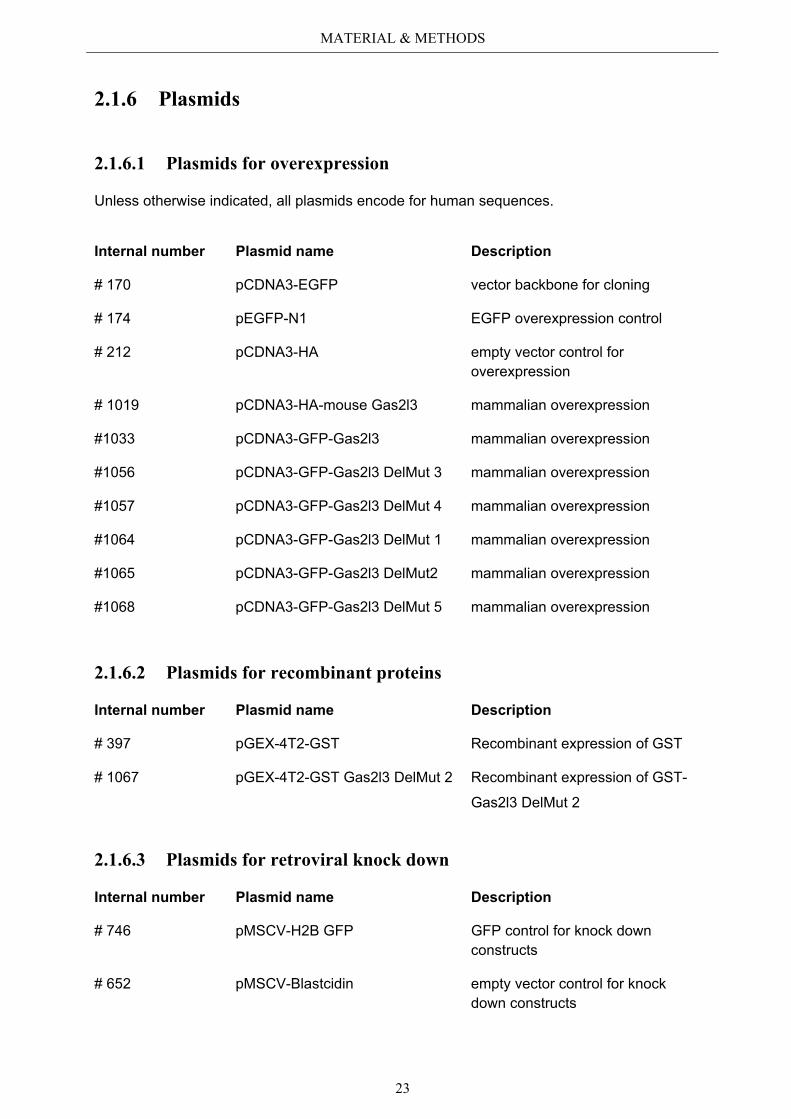
2.1.6 Plasmids ......................................................................................................... 23 2.1.6.1 Plasmids for overexpression ........................................................................... 23 2.1.6.2 Plasmids for recombinant proteins .................................................................. 23 2.1.6.3 Plasmids for retroviral knock down ................................................................ 23
2.1.7 Primers ........................................................................................................... 24 2.1.7.1 Primers for cloning.......................................................................................... 24 2.1.7.2 Primer for shRNA design ................................................................................ 25 2.1.7.3 Primers for quantitative RT-PCR .................................................................... 25
2.1.8 siRNA sequences ........................................................................................... 26 2.1.9 Cell lines / Cell culture media / Transfection reagents .................................. 26 2.1.10 Markers .......................................................................................................... 27 2.1.11 Kits................................................................................................................. 27 2.1.12 Beads ............................................................................................................. 27
2.2 Methods .............................................................................................................. 28 2.2.1 Cell culture .................................................................................................... 28
2.2.1.1 Passageing of cells .......................................................................................... 28 2.2.1.2 Freezing of cells .............................................................................................. 28 2.2.1.3 Thawing of cells .............................................................................................. 28 2.2.1.4 Counting of cells ............................................................................................. 28 2.2.1.5 Transient transfection ...................................................................................... 28
2.2.1.5.1 Calcium phosphate transfection ......................................................... 28 2.2.1.5.2 Lipofectamine / Metafectene transfection .......................................... 29
2.2.1.6 Infection of BJ-ET cells .................................................................................. 29 2.2.1.7 Growth curve of BJ-ET cells .......................................................................... 29 2.2.1.8 Synchronization of T98G cells by serum starvation ....................................... 29 2.2.1.9 Synchronization of HeLa cells by thymidine .................................................. 29 2.2.1.10 Cell treatment with different reagents ............................................................. 30 2.2.1.11 Determination of cell cycle phases by flow cytometry ................................... 30 2.2.1.12 Immunofluorescence ....................................................................................... 30
2.2.1.12.1 PSP fixation ...................................................................................... 30 2.2.1.12.2 PSP / 0.3 % triton fixation ................................................................ 31 2.2.1.12.3 MesMetOh fixation ............................................................................ 31 2.2.1.12.4 TCA fixation ...................................................................................... 31 2.2.1.12.5 Indirect immunofluorescence (standard procedure) ......................... 31 2.2.1.12.6 Direct immunofluorescence of actin filaments .................................. 31 2.2.1.12.7 Fixation method for specific immunofluorescence stainings ............ 32
2.2.2 Expression analysis........................................................................................ 32 2.2.2.1 RNA isolation ................................................................................................. 32 2.2.2.2 Reverse transcription....................................................................................... 32
III
2.2.2.3 Quantitative real-time PCR (qRT-PCR) ......................................................... 33
2.2.3 Biochemical methods .................................................................................... 33 2.2.3.1 Whole cell lysates ........................................................................................... 33 2.2.3.2 Determination of protein concentration (Bradford) ........................................ 34 2.2.3.3 Immunoprecipitation ....................................................................................... 34 2.2.3.4 SDS polyacrylamide gel electrophoresis (SDS-PAGE) .................................. 34 2.2.3.5 Immunoblotting ............................................................................................... 35 2.2.3.6 Purification of inclusion bodies from recombinant bacteria for antibody ..........
production ....................................................................................................... 35
2.2.4 Molecular biology.......................................................................................... 36 2.2.4.1 Isolation of plasmid DNA from bacteria ......................................................... 36
2.2.4.1.1 Mini preparation ................................................................................. 36 2.2.4.1.2 Midi and Maxi preparation ................................................................. 36
2.2.4.2 Isolation of plasmid DNA fragments from agarose gels ................................. 36 2.2.4.3 Isolation of PCR products after restriction ...................................................... 37 2.2.4.4 Standard cloning methods ............................................................................... 37
2.2.4.4.1 Primer design ..................................................................................... 37 2.2.4.4.2 PCR for cloning of DNA fragments ..................................................... 37 2.2.4.4.3 Agarose gelelectrophoresis ................................................................. 38 2.2.4.4.4 Restriction ........................................................................................... 38 2.2.4.4.5 Ligation .............................................................................................. 39 2.2.4.4.6 Transformation (heat shock) ............................................................... 39 2.2.4.4.7 Sequencing .......................................................................................... 39 2.2.4.4.8 Cloning of hGAS2L3 WT and Delmut 1-5 ........................................... 39
3 RESULTS ............................................................................................. 40
3.1 The uncharacterized LINC target gene GAS2L3 ........................................... 40 3.2 GAS2L3 is a LINC target gene in the human system ..................................... 40
3.2.1 Transcriptional regulation during the cell cycle ............................................ 41 3.2.2 G2/M specific expression pattern is LINC dependent ................................... 43
3.3 Localization pattern of overexpressed GAS2L3 ............................................. 44 3.3.1 Validation of the midbody localization ......................................................... 45 3.3.2 Mitotic distribution of GAS2L3 .................................................................... 47
3.4 Localization of endogenous GAS2L3 ............................................................... 50 3.5 Characterizing GAS2L3 protein domains ...................................................... 51
3.5.1 Protein domains essential for specific localization pattern ........................... 52 3.5.2 Domains essential for GAS2L3 protein stability ........................................... 55
3.6 Immunoblot analysis of endogenous GAS2L3 protein .................................. 57 3.7 Biological relevance ........................................................................................... 58 3.8 GAS2L3 depletion under physiological conditions ........................................ 58
IV
3.8.1 GAS2L3 depletion in transformed cells ........................................................ 59 3.8.2 GAS2L3 depletion in untransformed cells .................................................... 61
3.9 GAS2L3 depletion after induction of mitotic stress ....................................... 62 3.9.1 Spindle assembly checkpoint activation by nocodazole ................................ 63
3.9.1.1 SAC activation over time ................................................................................ 63 3.9.1.2 SAC recovery assay ........................................................................................ 65
3.9.2 Spindle assembly checkpoint activation by Taxol ........................................ 66 3.9.2.1 SAC activation over time ................................................................................ 66
3.9.3 Mechanism behind a compromised SAC ...................................................... 67 3.9.3.1 MAD2 protein characterization after GAS2L3 depletion ............................... 68
3.9.3.1.1 MAD2 kinetochore localization after taxol treatment ........................ 68 3.9.3.1.2 MAD2/CDC20 interaction after taxol treatment ................................. 69
3.9.3.2 BUBR1 protein characterization after GAS2L3 depletion ............................. 69 3.9.3.2.1 BUBR1 kinetochore localization ........................................................ 70 3.9.3.2.2 BUBR1 protein levels after taxol treatment ........................................ 71
4 DISCUSSION ....................................................................................... 72
4.1 Characterization of GAS2L3 ............................................................................ 72 4.2 GAS2L3 is a G2/M regulated LINC target gene ............................................. 72 4.3 GAS2L3 localization during the cell cycle ...................................................... 72
4.3.1 GAS2L3 colocalizes with and stabilizes the interphase microtubule................ network .......................................................................................................... 73
4.3.2 GAS2L3 colocalizes with the mitotic microtubule network ......................... 73 4.3.3 GAS2L3 localizes to the midbody during cytokinesis .................................. 73
4.4 Characterization of GAS2L3 protein domains ............................................... 74 4.4.1 The GAS2 domain is neither needed nor sufficient for microtubule binding 74 4.4.2 The CH domain is an actin binding domain .................................................. 75 4.4.3 Only full length GAS2L3 localizes to the midbody ...................................... 75 4.4.4 GAS2L3 is highly regulated on protein level ................................................ 75
4.5 Biological relevance: GAS2L3 is a regulator of mitosis and cytokinesis ...... 77 4.5.1 GAS2L3 depletion results in mitosis and cytokinesis failure........................ 77 4.5.2 GAS2L3 depletion weakens the spindle assembly checkpoint ..................... 79 4.5.3 Role of GAS2L3 in the SAC ......................................................................... 80
4.5.3.1 MAD2 can still localize to kinetochores but MAD2/CDC20 ............................ interaction is compromised ............................................................................. 81
4.5.3.2 BUBR1 phosphorylation is affected in GAS2L3 depleted cells ..................... 81
4.6 Hypothesis .......................................................................................................... 83

V
5 APPENDIX ........................................................................................... 85
5.1 List of Figures & Tables ................................................................................... 85 5.2 Abbreviations ..................................................................................................... 86 5.3 References .......................................................................................................... 87 5.4 Own publications ............................................................................................... 96 5.5 Curriculum Vitae .............................................................................................. 97 5.6 Eidesstattliche Erklärung ................................................................................. 98
Acknowledgements
INTRODUCTION
1
1 INTRODUCTION
1.1 The human cell cycle
The eukaryotic cell cycle is a fundamental evolutionarily conserved process that regulates cell
division from simple unicellular organisms, such as yeast, through to higher multicellular
organisms, such as humans. In multicellular organism, maintaining genomic integrity by precise
control of the cell cycle is vital for development, survival and proliferation.
The human cell cycle can be divided into four main phases, termed G1, S, G2 and M
phase. During G1 (gap1), the first gap phase, cells grow in size and synthesize RNA and
proteins. These molecular events eventually commit the cell to progress into the next cell cycle
phase, the S phase. In S (synthesis) phase, active replication of the parental chromosomes
takes place resulting in the doubled DNA amount though the cell ploidy remains the same.
During the following G2 (gap2) phase, correct duplication of the chromosomes is controlled
before cells enter M phase, where cell division takes place. The M phase is composed of two
tightly controlled important processes. First, in mitosis, the duplicated chromosomes get
separated followed by cytokinesis, the process of dividing the cytoplasm in two identical
daughter cells. The period of the cell cycle from the end of one M phase to the beginning of the
next, including G1, S and G2 phase is also termed interphase. In humans, most differentiated
cells stop dividing and leave the cell cycle in G1 to enter a quiescent cell cycle state called G0,
where they survive for month to years (Coller, 2007; Pardee, 1974; Shackelford et al., 1999).
1.1.1 Cell cycle regulation by cyclin/CDK complexes
The transition from one cell cycle phase into the next is mainly regulated by the activities of
various protein kinase complexes, the so called cyclin/CDK (cyclin dependent kinase)
complexes. Different cyclin/CDK complexes are expressed in different phases of the cell cycle,
with each cyclin, as regulatory subunit, having a specific time of appearance and a specific
kinase to activate (Doree and Galas, 1994). In humans, mainly the four kinases CDK1, 2, 4 and
6 regulate the activity of several proteins involved in DNA replication and mitosis by
phosphorylating them at specific regulatory sites, thereby promoting cell cycle progression
(Morgan, 1997; Murray, 2004).
Cell cycle progression starts with external mitogenic signaling in G1. Mitogens induce,
via conserved receptor tyrosine kinase pathways, the expression of CDK4 and CDK6, the G1
CDKs (Sherr, 1994a; Sherr et al., 1994). G1 cyclin/CDK complexes lead to the release of E2F
transcription factors (E2F1-3) by phosphorylating their inhibitory subunit, the pRB protein
(Nevins, 1992; Sherr, 1994b; Stevaux and Dyson, 2002). Once E2F1-3 are released, cells have
INTRODUCTION
2
bypassed the so called restriction point, a point of no return (Planas-Silva and Weinberg, 1997).
Further cell cycle progression is now independent from external mitogens. This highlights the
important role of pRB as a negative regulator of proliferation, supported by the fact that pRB,
product of the first identified tumorsuppressor gene RB1, is mutated in approximately one third
of all human tumors (Lee et al., 1987a; Lee et al., 1987b; Sherr, 1996). After their release,
E2F1-3 activate the expression of genes essential for S phase entry (Dyson, 1998; Humbert et
al., 2000; Trimarchi and Lees, 2002). Amongst others, these are genes essential for DNA
replication, nucleotide synthesis and the S phase cyclin/CDK genes, cyclin E and CDK2. Active
S phase cyclin/CDK complexes are then the start signal for DNA replication. During S phase,
the M phase cyclin, cyclin B, is synthesized and accumulates in the cytosol. As soon as cyclin B
migrates into the nucleus it activates the kinase activity of CDK1 (Porter and Donoghue, 2003).
Cyclin B/CDK1 complexes are also called the MPF (mitosis promoting factor), since directly
after complex formation entry into mitosis takes place (Gavet and Pines, 2010). After successful
chromosome segregation, mitotic exit is caused by the complete degradation of cyclin B in late
mitosis. Responsible for cyclin B degradation is the so called destruction box, a specific APC
(anaphase promoting complex)/CDH1 recognition site. The APC, an E3 ubiquitin ligase,
polyubiquitinates cyclin B. This event is followed by proteasomal degradation (Kramer et al.,
2000; Peters, 2006). After the complete loss of cyclin/CDK activity, constitutively active
phosphatases dephosphorylate pRB, which in turn inhibits E2F transcription factors and the cell
cycle restarts.
Under normal circumstances the cell cycle proceeds without interruptions. However,
when damage occurs cells have the capacity to arrest proliferation in all phases of the cell
cycle. Those control mechanisms that check cellular integrity before subsequent events in cell
cycle progression are initiated, are referred to as cell cycle checkpoints. Checkpoints can
generate a transient delay to allow the cell more time to repair damage before further
progression. Alternatively, if the damage is too severe to be adequately repaired, cells undergo
apoptosis or enter an irreversible senescence like state (Kastan and Bartek, 2004; Shackelford
et al., 1999).
INTRODUCTION
3
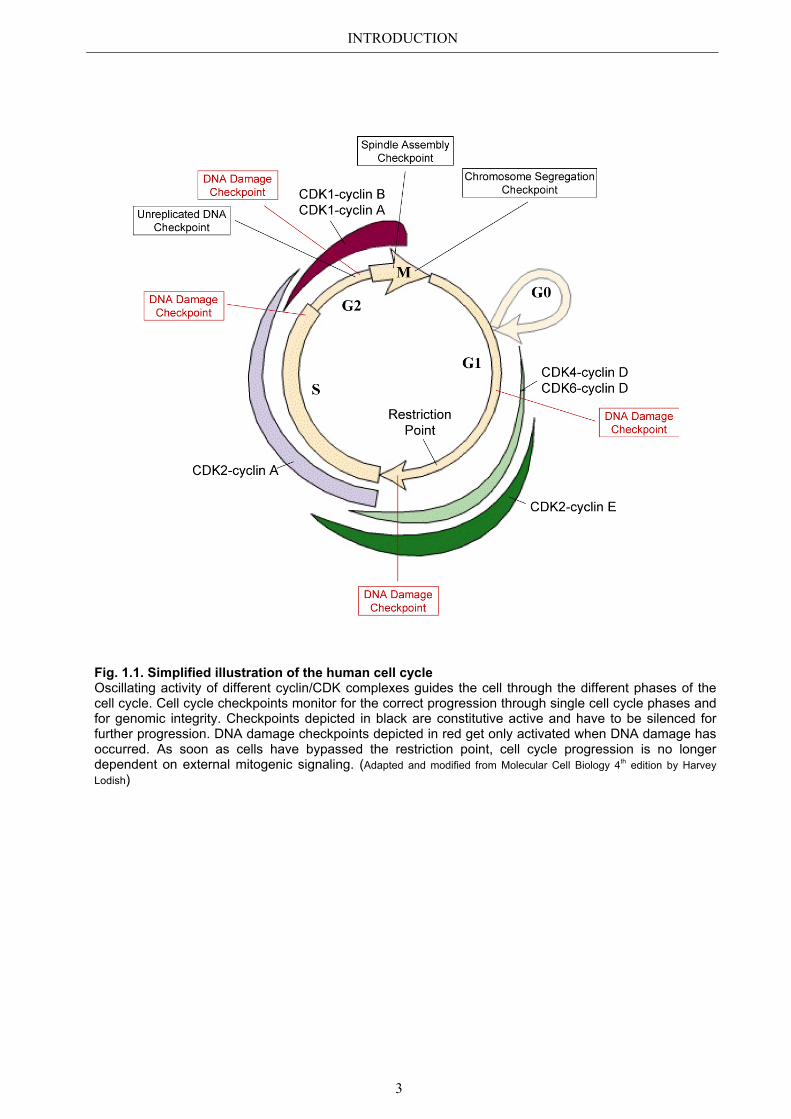
Fig. 1.1. Simplified illustration of the human cell cycle Oscillating activity of different cyclin/CDK complexes guides the cell through the different phases of the cell cycle. Cell cycle checkpoints monitor for the correct progression through single cell cycle phases and for genomic integrity. Checkpoints depicted in black are constitutive active and have to be silenced for further progression. DNA damage checkpoints depicted in red get only activated when DNA damage has occurred. As soon as cells have bypassed the restriction point, cell cycle progression is no longer dependent on external mitogenic signaling. (Adapted and modified from Molecular Cell Biology 4th edition by Harvey Lodish)
INTRODUCTION
4
1.1.2 Cell division: the M phase
Chromosome missegregation leads to genetic instability and alters the dosage of a large subset
of genes, which can result in severe disease phenotypes. Therefore, chromosome segregation
in M phase is one of the most important steps during the cell cycle and has to be tightly
controlled.
The M phase, the last step during one cell cycle, is composed of mitosis and
cytokinesis, including the separation of sister chromatids followed by the division of the mother
cell cytoplasm in two new identical daughter cells. In contrast to the other cell cycle phases,
M phase, with a duration of approximately 30 min, is extremely fast.
1.1.2.1 Mitosis
Mitosis can be divided into several stages, named prophase, prometaphase, metaphase,
anaphase and telophase. Start signal for mitotic entry is the activation of CDK1/cyclin B
complexes in late G2, also called mitotic promoting factor (MPF) (Gavet and Pines, 2010). In
prophase, the MPF phosphorylates a variety of substrates, including nuclear lamins,
microtubule binding proteins and condensins. Those early mitotic phosphorylation events lead
to the initiation of chromatin condensation and the reorganization of microtubules in preparation
of mitotic spindle formation. Chromosomes, containing two sister chromatids held together by
cohesins at the centromeric region, start to get visible. Duplicated centrosomes divide and
relocate to the opposite cell poles where they function as microtubule organizing centers
(MTOCs), also called mitotic spindle poles (Cleveland et al., 2003; Nasmyth, 2002). Initiation of
prometaphase starts with the nuclear envelope breakdown and chromosomes are captured by
spindle microtubules at the kinetochores, an accumulation of proteins at the centromeric region
(Hauf and Watanabe, 2004; Maiato et al., 2004a; Maiato et al., 2004b). Highly conserved
proteins of the kinetochores are for example the specialized histone H3 variant CENP-A and the
motor proteins dynein and kinesin. CENP-A helps the kinetochore to associate with DNA; the
motor proteins generate forces that move chromosomes during later mitosis (Joglekar et al.,
2010). As soon as chromosomes are aligned at the spindle equator, called metaphase plate,
cells have entered metaphase. Chromosomes arrest in metaphase until every single
kinetochore is correctly attached to spindle microtubules. This essential step is controlled by the
spindle assembly checkpoint (SAC). Once the SAC is satisfied, anaphase onset is induced by
APC/CCDC20 complex formation (Yu, 2002). The anaphase promoting complex/cyclosome
(APC/C) is a specific mitotic E3 ubiquitin ligase (Peters, 2002). Binding of the co-activator
CDC20 to APC/C targets the APC/C to securin and cyclin B (Kraft et al., 2006). This in turn
leads to their ubiquitination and degradation by the proteasome. Securin degradation leads to
the release of separase, a cystein protease specifically cleaving the Scc1 subunit of cohesin,
leading to sister chromatid separation (Nasmyth, 2002; Peters, 2002; Peters, 2006).
INTRODUCTION
5
Additionally, spindle poles move further apart supporting sister chromatid separation. Finally,
binding of the co-activator CDH1 to APC/C leads to complete cyclin B degradation and cells
enter telophase, the last stage of mitosis (Peters, 2002; Peters, 2006). During telophase, the
nuclear envelope reassembles, chromosomes decondense and first steps of cytokinesis are
initiated.
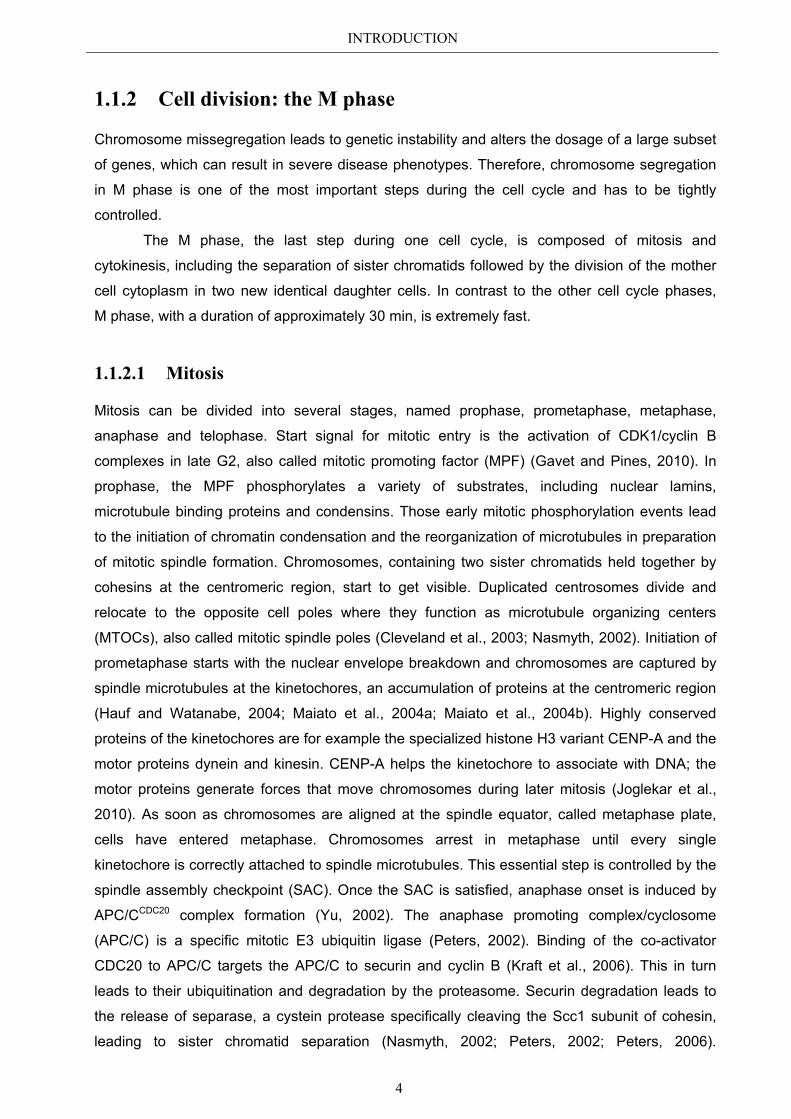
Fig. 1.2. Overview of different M phase stages HeLa cells were stained with an antibody against Aurora B in red as a marker for the single mitotic stages. The microtubules were counterstained in green with an A-tubulin antibody. Aurora B, the enzymatic heart of the chromosomal passenger complex, colocalizes with centromeres from prophase until metaphase. During anaphase Aurora B localizes to the spindle midzone and finally accumulates at the midbody during telophase.
1.1.2.2 Cytokinesis
The final act of cell division is cytokinesis, the partition of cellular contents into two daughter
cells. In the last years, research on cytokinesis has been attracting increasing attention, since it
is proposed that failure of this process is associated with tumorigenesis (Sagona and Stenmark,
2010). Although many proteins could be identified as cytokinesis regulators, this process is still
less well understood than earlier events during mitosis.
INTRODUCTION
6
1.1.2.2.1 Cleavage furrow formation
Preparation of cytokinesis already starts during anaphase with the formation of the central
spindle and the contractile ring (Glotzer, 2005; Glotzer, 2009a). The contractile ring is a network
of actin and myosin filaments organized on a scaffold of cytoskeletal proteins, such as septins
and the actin binding protein anillin (D'Avino, 2009). The contractile ring drives the constriction
of the plasma membrane, generating two daughter cells connected by a cytoplasmic bridge.
The right positioning of the contractile ring has to be tightly controlled since failure during
cytokinesis causes abortive cytoplasmic abscission resulting in binucleated or multinucleated
cells. The central spindle, also called spindle midzone, plays an important role in coordinating
the site of contractile ring assembly (Glotzer, 2009b). Central spindle formation also starts
during anaphase. Directly after chromatid separation, proteins essential for the assembly of the
central spindle relocalize from the cytoplasm and initiate a bundling of the plus ends of
microtubules. One important protein concentrating at the central spindle is the guanine
nucleotide exchange factor (GEF) ECT2. ECT2 leads to the central spindle localization and
activation of RhoA, the key activator in contractile ring formation (Kamijo et al., 2006; Nishimura
and Yonemura, 2006; Piekny et al., 2005). After contractile ring formation at the equatorial
cortex, activation of myosin motor activity and sliding of actin filaments leads to the ingression of
the cleavage furrow (Eggert et al., 2006). At the same time the central spindle becomes
compacted and forms a dense structure called the midbody (Paweletz, 2001).
1.1.2.2.2 Midbody formation and abscission
By the end of cytokinesis, the dividing cells are still connected by a narrow intercellular bridge
containing the midbody. The midbody (MB) is a dense structure formed in telophase and
derived from the central spindle and a massive number of recruited proteins. By purification of
MBs from mitotic HeLa cells following proteomic analysis, recent research identified more than
100 proteins to be involved in MB formation (Skop et al., 2004). However, due to its small size
and its temporary appearance, molecular and functional aspects of the MB still remain poorly
understood. Proteins of the MB are known to be responsible for many different processes in the
cell. These are for example ribosomal proteins, heat shock proteins and proteins from various
subcellular compartments such as mitochondria and the centrosomes. The concentration of
proteins which are associated with vesicular transport finally leads to the last step of
cytokinesis, the abscission (Schiel and Prekeris, 2010). During abscission three main processes
have to be fulfilled. Firstly, membrane vesicles derived from the biosynthetic and endocytic
recycling pathways are delivered to the plasma membrane of the constricting midbody in order
to facilitate further narrowing. Secondly, central spindle microtubules of the midbody have to be
severed. Thirdly, the final abscission of a membrane remnant that connects the two daughter
cells is required. Not surprisingly, disruption of components of the MB can result in defective
INTRODUCTION
7
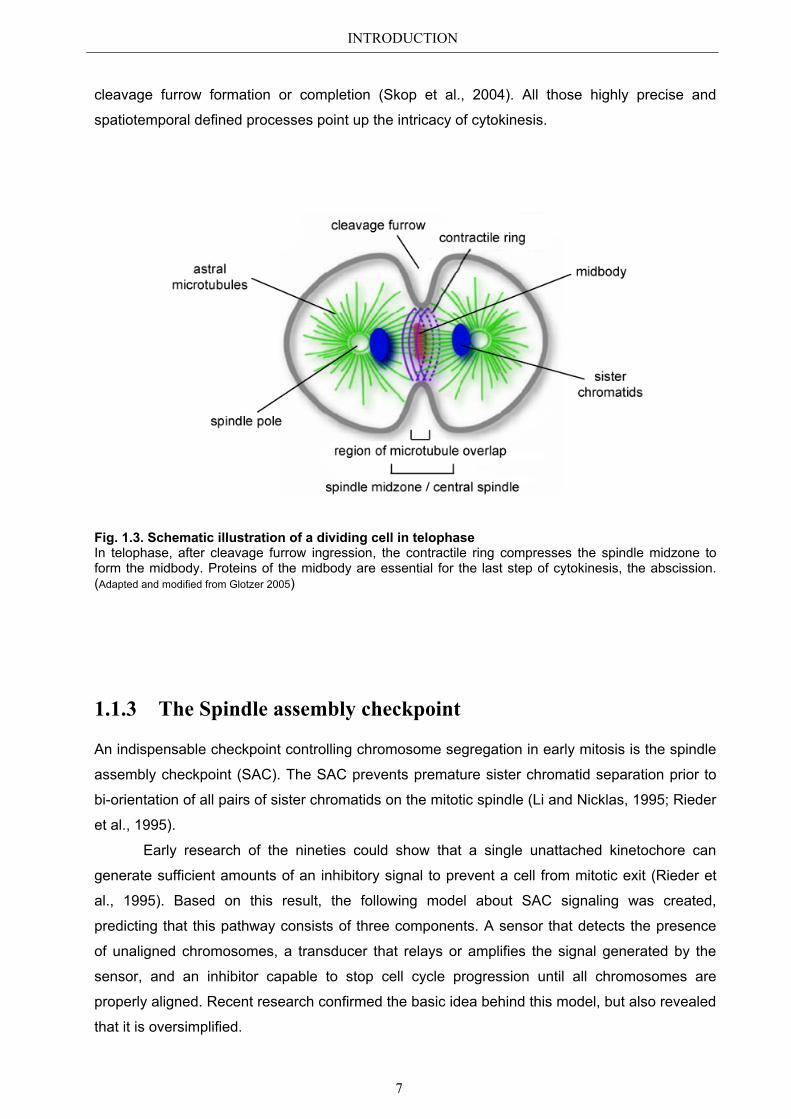
cleavage furrow formation or completion (Skop et al., 2004). All those highly precise and
spatiotemporal defined processes point up the intricacy of cytokinesis.
Fig. 1.3. Schematic illustration of a dividing cell in telophase In telophase, after cleavage furrow ingression, the contractile ring compresses the spindle midzone to form the midbody. Proteins of the midbody are essential for the last step of cytokinesis, the abscission. (Adapted and modified from Glotzer 2005)
1.1.3 The Spindle assembly checkpoint
An indispensable checkpoint controlling chromosome segregation in early mitosis is the spindle
assembly checkpoint (SAC). The SAC prevents premature sister chromatid separation prior to
bi-orientation of all pairs of sister chromatids on the mitotic spindle (Li and Nicklas, 1995; Rieder
et al., 1995).
Early research of the nineties could show that a single unattached kinetochore can
generate sufficient amounts of an inhibitory signal to prevent a cell from mitotic exit (Rieder et
al., 1995). Based on this result, the following model about SAC signaling was created,
predicting that this pathway consists of three components. A sensor that detects the presence
of unaligned chromosomes, a transducer that relays or amplifies the signal generated by the
sensor, and an inhibitor capable to stop cell cycle progression until all chromosomes are
properly aligned. Recent research confirmed the basic idea behind this model, but also revealed
that it is oversimplified.
INTRODUCTION
8
Today the SAC has been proposed to be bipartite, with one arm monitoring kinetochore
occupancy with microtubules and the other arm monitoring spindle tension exerted on
kinetochores (Shannon et al., 2002; Skoufias et al., 2001; Stern and Murray, 2001; Taylor et al.,
2001; Waters et al., 1998). First evidence that a “lack of tension” alone is sufficient to activate
the SAC came from experiments in yeast. By using a replication defective Cdc6-yeast strain,
Stern and Murray demonstrated that unreplicated chromosomes, containing only one
kinetochore, were still able to be captured by the mitotic spindle microtubules. Although all
kinetochores were occupied by microtubules, still prolonged SAC activation was triggered,
indicated by non decreasing levels of securin. This clearly demonstrated that monooriented
chromatids, whose kinetochores are not under tension, can trigger the SAC (Stern and Murray,
2001).
The critical molecular target of the SAC is the APC/C (Bharadwaj and Yu, 2004; Yu,
2002). Important proteins concerning a functional SAC are the core components MAD2 (mitotic
arrest deficiency 2), BUBR1 (mitotic arrest deficiency 3) and BUB3 (budding uninhibited by
benzimidazole). The BUB and MAD genes were originally identified in yeast genetic screens,
where their functional loss inhibited mitotic arrest upon exposure to microtubule destabilizing
drugs (Hoyt et al., 1991; Li and Murray, 1991). Those proteins get recruited to unattached
kinetochores where they bind CDC20, together representing the so called MCC (mitotic
checkpoint complex) (Cleveland et al., 2003; Taylor et al., 2004) . Even though single MAD2
and BUBR1 have the potential to bind and inhibit CDC20, MCC formation leads to a 3.000 fold
greater inhibition of APC/C CDC20 complex formation (Fang, 2002; Hardwick et al., 2000; Sudakin
et al., 2001; Tang et al., 2001). Interestingly, signal for MCC formation is not generated from
kinetochores, as MCC is also present and active in interphase cells. However, only APC/C
isolated from mitotic cells is sensitive to inhibition by MCC (Sudakin et al., 2001). It is proposed
that the interphase pool of MCC allows for rapid inhibition of APC/C when cells enter mitosis.
Unattached kinetochores then target the APC/C for sustained inhibition by the MCC (Sudakin et
al., 2001). In addition, MCC formation promotes CDC20 degradation, thus lowering CDC20
protein levels upon checkpoint activation. Upon correct attachment of all kinetochores to
microtubules, the SAC is satisfied and stops producing APC/C inhibitors. However, the rate of
spontaneous dissociation of these inhibitors is low, and it is widely accepted that an active
process, called SAC silencing, must be triggered for APC/C CDC20 to be activated (Akiyoshi et al.,
2009; Vanoosthuyse and Hardwick, 2009a; Vanoosthuyse and Hardwick, 2009b; Vanoosthuyse
et al., 2009). To date, the mechanism of SAC silencing still raises many questions.
Like all checkpoints, the SAC does not arrest cells permanently. Even if the SAC cannot
be satisfied, cyclin B is progressively destroyed by a proteasome dependent mechanism
followed by mitotic exit. Interestingly, MAD2 and BUBR1 remain associated with kinetochores
as cells bypass the SAC, indicating that the SAC is still active. Therefore, mitotic escape is not
due to active adaption pathways. A feasible model predicts a leaky APC/C CDC20 inhibition over
INTRODUCTION
9
time leading to a slow but continuous cyclin B degradation that ultimately drives the cell out of
mitosis (Brito and Rieder, 2006; Rieder and Maiato, 2004).
1.1.3.1 The spindle assembly checkpoint and cancer
A hallmark of most human cancers is aneuploidy, a state of having abnormal numbers of
chromosomes. Aneuploid cells can arise directly from diploid cells through errors in
chromosome segregation. However, whether aneuploidy is cause or consequence of
tumorigenesis is still a matter of debate (Weaver et al., 2007).
One possible candidate mechanism involved in chromosome segregation in relation to
tumorigenesis is the SAC. In certain types of human cancers, including breast, colorectal and
gastric cancers, mutations have been observed in SAC genes, although at very low frequency
(Weaver and Cleveland, 2006). To learn more about the contribution of deregulated SAC genes
and tumorigenesis, a multitude of mouse genetic models has been created in recent years.
Extensive studies of those mouse genetic approaches could indeed demonstrate a strong link
between deregulation of genes involved in controlling chromosome segregation and
development of aneuploidy and cancer (Li et al., 2009).
For example, classical knockout mouse models of the important SAC genes Bub1,
BubR1 and Mad2 results in early embryonic lethality (Baker et al., 2004; Dobles et al., 2000;
Jeganathan et al., 2007). In contrast, haploinsufficiency or hypomorphism of these genes
results in aneuploidy in both mouse embryonic fibroblasts (MEFs) and in tissues, albeit to
varying degrees (Michel et al., 2001; Perera et al., 2007; Wang et al., 2004). Even though Bub1
and BubR1 heterozygous mice develop aneuploidy, they show no increase in spontaneous
tumor formation (Baker et al., 2004; Jeganathan et al., 2007), while mice heterozygous for
Mad2 develop tumors after long latencies (Dobles et al., 2000; Michel et al., 2001). Additionally,
those mouse models revealed that the potential of aneupoidy to drive tumorigenesis is highly
dependent on the genetic context. As a specific example, BubR1 hypomorphism has been
analyzed in mice lacking either p16Ink4a or p19Arf (Baker et al., 2008). The incidence of lung
tumorigenesis in BubR1 hypomorphic mice increased nearly 20 fold in mice lacking the gene
that encodes p16Ink4a. In contrast, when p19Arf instead of p16Ink4a was absent,
tumorigenesis did not accelerate in any tissue.
This contrariness underlines the fact that there are still more open than answered
questions about tumorigenesis in general.
INTRODUCTION
10
1.2 The LIN complex
The coordinated expression of G2/M-specific genes is responsible for correct progression
through mitosis, an important step for the maintenance of genomic integrity. Recently, our group
identified LINC (LIN complex), a human multiprotein complex that is required for transcriptional
activation of G2/M genes (Schmit et al., 2007).
1.2.1 LINC characterization in vitro
LINC consists of a stable core module including the four LIN proteins LIN9, LIN54, LIN52, LIN37
and the chromatin associated protein RbAp48. This five-protein core module dynamically
associates with repressor proteins p130 and E2F4 and the transcription factor B-MYB in a cell
cycle dependent manner. In quiescent cells, association of LINC with p130/E2F4 targets LINC
to the promoters of G1/S genes. Notably, siRNA experiments demonstrated that this promoter
binding is not essential for G1/S gene repression. Binding to B-MYB in S phase targets LINC to
a large set of G2/M regulated genes. In vitro knock down experiments of different LINC core
module proteins inhibited G2/M gene expression, suggesting a direct role for LINC/B-MYB as a
transcriptional activator of those G2/M genes. Furthermore, chromatin immunoprecipitation
(ChIP) experiments confirmed a direct binding of LINC/B-MYB to gene promoters (Osterloh et
al., 2007; Schmit et al., 2007).
Important LINC/B-MYB regulated G2/M genes are amongst others the M phase
cyclin/CDK genes cyclin B1, CDK1 and cyclin A2. Corresponding to their fundamental role in
cell cycle progression, depletion of different LINC components strongly impaired cell
proliferation with an accumulation of cells in G2 followed by delayed entry into mitosis. Other
LINC activated genes are for example mitotic genes like survivin, BUB1, CENP-E and PLK1
(Schmit et al., 2007). Deregulation of mitotic genes is widely accepted to be implicated in
tumorigenesis by promoting genetic instability.
1.2.2 LINC characterization in vivo
To investigate the physiological role of LINC in vivo, our group generated constitutive as well as
conditional knockout mouse models by targeting LIN9, a protein of the stable core module
(Reichert et al., 2010). With those two mouse models it was possible to investigate the role of
LIN9 in development and, by generating inducible knockout MEFs, in gene regulation.
Heterozygous Lin9+/- mice developed normally and showed no obvious defects.
However, the complete loss of Lin9 resulted in early embryonic lethality. Genotyping of embryos
dissected from the deciduae at embryonic days 7.5 to 13.5 revealed that none of the embryos
INTRODUCTION
11
was homozygous Lin9-/-, suggesting that embryos die shortly after implantation (Reichert et al.,
2010). Dramatically, also the loss of Lin9 in adult mice resulted in death within seven days due
to a complete atrophy of the small intestine, an organ renewing in the mouse every 3 to 5 days.
Histological analysis of the remaining tissue revealed large and irregular nuclei as well as
binucleated cells, indicating that LIN9 regulates mitosis and cytokinesis in vivo (Reichert et al.,
2010).
Analysis of Lin9 knockout MEFs confirmed the role of LIN9 as a regulator of mitosis and
cytokinesis. Lin9 knockout MEFs showed an abnormal cell cycle profile with an accumulation of
tetraploid and polyploid cells. Single cell morphology, examined by fluorescence and time lapse
microscopy, revealed that Lin9 knockout resulted in a high amount of cells with aberrant nuclei
morphology, aberrant number and distribution of centrosomes and a strong increase in
binucleated cells. All in all, these phenotypes suggested a role for LIN9 in the transcriptional
regulation of mitotic genes in mice (Reichert et al., 2010).
1.2.2.1 LINC target genes in mice
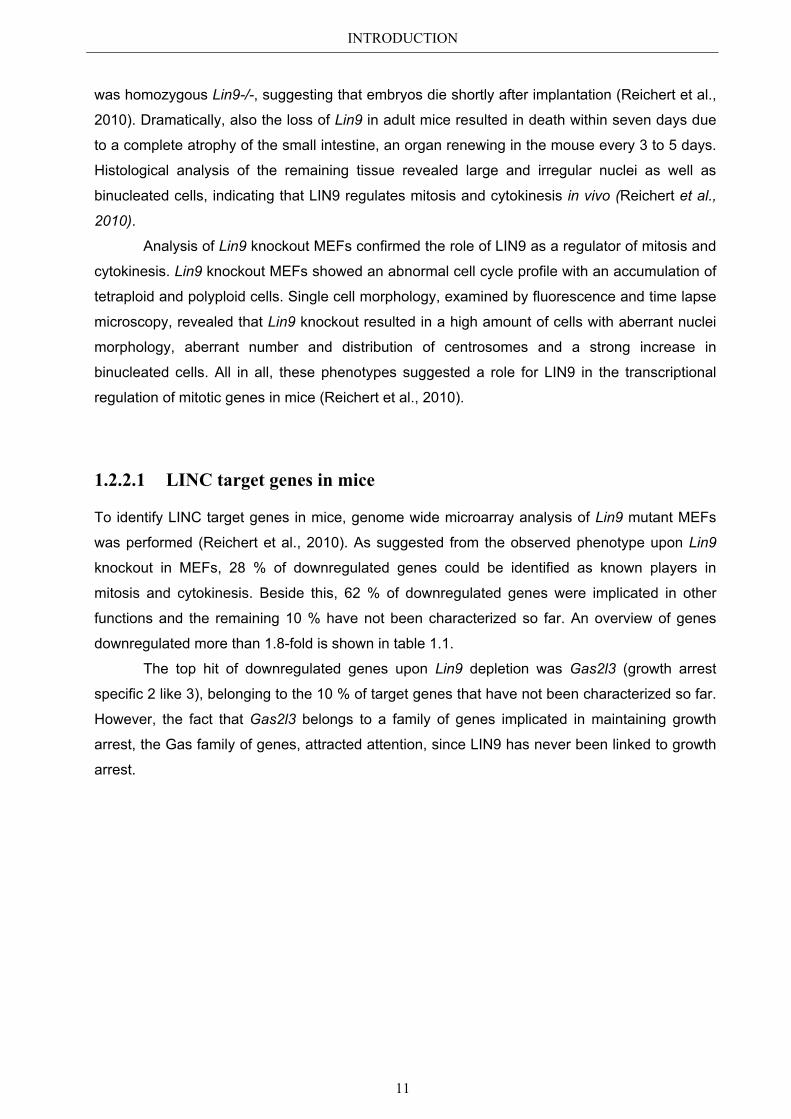
To identify LINC target genes in mice, genome wide microarray analysis of Lin9 mutant MEFs
was performed (Reichert et al., 2010). As suggested from the observed phenotype upon Lin9
knockout in MEFs, 28 % of downregulated genes could be identified as known players in
mitosis and cytokinesis. Beside this, 62 % of downregulated genes were implicated in other
functions and the remaining 10 % have not been characterized so far. An overview of genes
downregulated more than 1.8-fold is shown in table 1.1.
The top hit of downregulated genes upon Lin9 depletion was Gas2l3 (growth arrest
specific 2 like 3), belonging to the 10 % of target genes that have not been characterized so far.
However, the fact that Gas2l3 belongs to a family of genes implicated in maintaining growth
arrest, the Gas family of genes, attracted attention, since LIN9 has never been linked to growth
arrest.
INTRODUCTION
12
Fold Change Gene Symbol Function Reference 3.19 Gas2l3 uncharacterized 3.08 Nusap1 mitosis (Raemaekers et al., 2003)
(Ribbeck et al., 2007)
3.00 C230078M08 uncharacterized 2.78 1190002F15I uncharacterized 2.76 C9orf140 other function 2.68 Aspm mitosis / cytokinesis (Kouprina et al., 2005)
(Zhong et al., 2005)
2.64 CenpF mitosis / cytokinesis (Feng et al., 2006) (Varis et al., 2006)
2.33 E130306D19 uncharacterized 2.23 Mxd3 (Mad3) other function 2.22 Phf19 other function 2.10 Mki67 other function 1.94 D17H6S56E-5 uncharacterized 1.94 Plk1 mitosis / cytokinesis (Petronczki et al., 2008)
1.94 Tnfaip8l1 other function 1.91 Cdkn3 other function 1.89 CenpE mitosis (Rao et al., 2009)
1.85 Top2a mitosis (Cobb et al., 1999)
1.84 Cdkn2c other function 1.83 Kif20a (Mklp2) mitosis / cytokinesis (Fontijn et al., 2001)
(Neef et al., 2006)
1.81 AK047015 uncharacterized 1.81 Kif23 (Mklp1) mitosis / cytokinesis (Zhu et al., 2005a)
(Zhu et al., 2005b)
1.81 CenpA mitosis (Torras-Llort et al., 2009) (Kalitsis et al., 2003)
Table 1.1. Genes downregulated upon Lin9 depletion Genome wide microarray analysis of Lin9 knockout MEFs was performed. Listed are all genes downregulated more than 1.8-fold. (Data Reichert et al. 2010)
1.3 The family of growth arrest specific genes
The state of growth arrest, alternatively called G0 or quiescence, is a cell cycle phase
characterized by a stop of cell proliferation. Reentry into the cell cycle is positively regulated
through the transcriptional activation of growth promoting genes induced by exogenous growth
factor signaling. Already in the early 1980s, numerous growth promoting genes have been
identified, for example the today well characterized transcription factors c-fos and c-myc
(Coughlin et al., 1985; Greenberg and Ziff, 1984). To identify genes that define the G0 phase
and do not promote the G0/G1 transition, Schneider et al. performed a screen in murine
fibroblasts looking for genes negatively regulated by serum or growth factor addition. The
identified set of genes was termed the Gas genes (growth arrest specific genes). Transcriptional
expression of one gene, the so called Gas2 gene, was strictly arrest specific irrespective how
the quiescence state was induced (Schneider et al., 1988). In humans, following research
identified highly homologous genes and all together they represent the GAS2 family.
INTRODUCTION
13
1.3.1 The GAS2 family
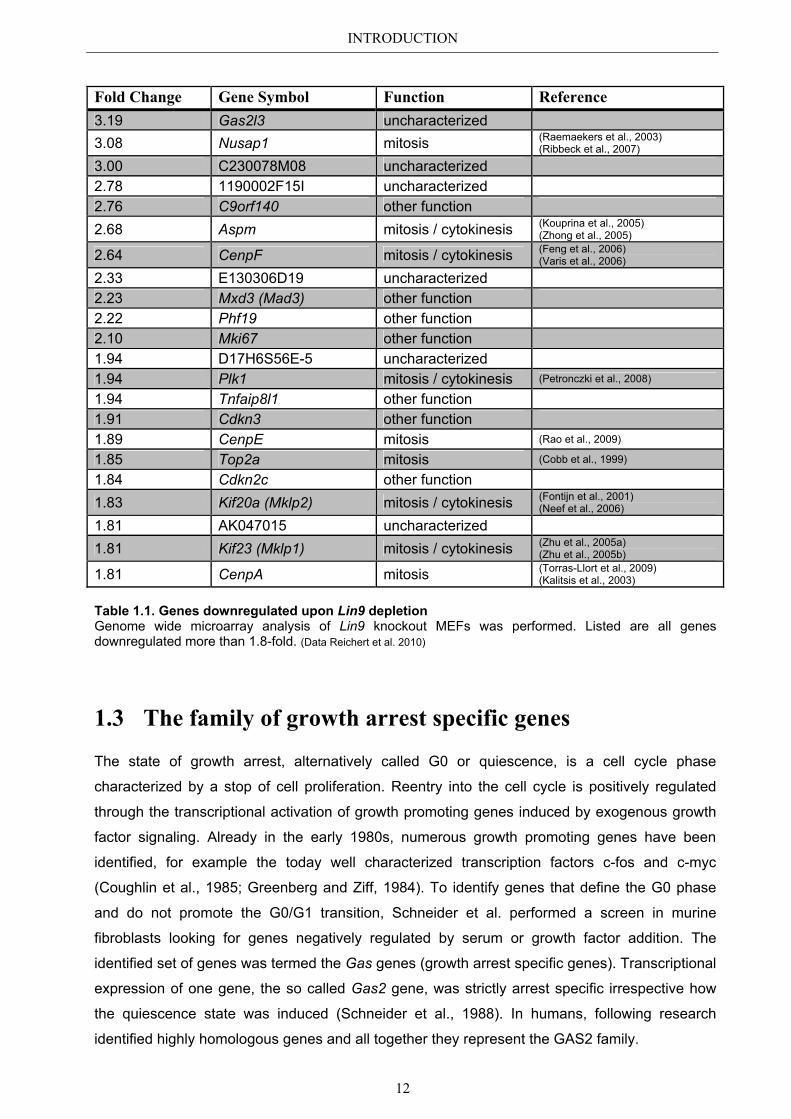
The GAS2 family is composed of the four family members GAS2, GAS2L1 (GAR22), GAS2L2
(GAR17) and GAS2L3. All family members share two highly conserved domains; a putative
actin binding calponin homology (CH) domain and a putative microtubule binding growth arrest
specific 2 (GAS2/GAR) domain. Proteins having both an actin binding and a microtubule binding
domain, are proposed to function as cytoskeletal linker proteins, connecting and coordinating
microfilaments and microtubules.
Fig. 1.4. Schematic illustration of the human GAS2 family members For all proteins the same highly conserved CH and GAS2 domains have been predicted. CH: calponin homology domain; GAS2: growth arrest specific 2 domain
1.3.1.1 The highly conserved CH and GAS2 domains
The calponin homology (CH) domain, a sequence motif of about 120 amino acids originally
identified in the protein calponin, has been suggested to confer actin binding to a variety of
cytoskeletal and signaling proteins. Detailed analysis of all known CH domain containing
proteins led to the classification into three different groups. Firstly proteins containing two
tandem repeats of the CH domain, a domain designated as ABD (actin binding domain),
secondly proteins containing two ABDs and thirdly, proteins containing only a single amino
terminal CH domain (Stradal et al., 1998). Deeper investigation also revealed that single CH
domains clearly function differently from ABDs containing two CH domains in tandem. CH
domains within an ABD exhibit significant higher affinities for actin, whereas a single CH domain
is neither sufficient nor necessary for actin binding (Gimona and Mital, 1998; Gimona and
Winder, 1998; Stradal et al., 1998).
The GAS2-related (GAR/GAS2) domain was named after the GAS2 (growth arrest
specific 2) protein. Only a few proteins have been found to possess this domain, including
INTRODUCTION
14
microtubule–actin crosslinking factor (MACF), some members of the plakin family and the GAS2
family members. The GAS2 domain comprises about 57 amino acids and has been shown to
bind to microtubules (Sun et al., 2001).
1.3.1.2 GAS2
Beside the fact that the GAS2 expression is highly restricted to growth arrested mouse and
human fibroblasts, GAS2 has been shown to colocalize with actin fibers, thus being a
component of the microfilament network (Brancolini et al., 1992; Schneider et al., 1988). The
GAS2 protein has a quite long half-life time, but hyperphosphorylation of GAS2 upon the
induction of the G0/G1 transition seems to be responsible for regulating its activity and
specifically correlates with the reorganization of the actin cytoskeleton (Brancolini and
Schneider, 1994). GAS2 has also been shown to be a caspase 3 substrate, thereby playing a
role in regulating cell shape changes during apoptosis (Brancolini et al., 1995). Additionally, by
interaction with m-calpain, GAS2 inhibits calpain-dependent processing of p53 thereby
increasing p53 stability and the susceptibility to p53-dependent apoptosis (Benetti et al., 2005;
Benetti et al., 2001). Consistent with its role in apoptosis, GAS2 expression and cleavage are
induced during mouse embryonic development in the developing mouse limb, a region
undergoing extensive apoptosis (Lee et al., 1999).
1.3.1.3 GAS2L1 (GAR22)
The human GAS2-related gene (GAR22) is located on chromosome 22q12 and exhibits loss of
heterozygosity in many human tumor types (Zucman-Rossi et al., 1996). Alternative splicing of
the primary transcript results in two GAS2L1 proteins, the short protein GAS2L1α (36 kDa) and
the longer protein GAS2L1β (73 kDa) (Zucman-Rossi et al., 1996). Although human and mouse
GAS2L1 mRNAs are expressed nearly ubiquitously, mouse GAS2L1 protein can only be
detected in testis and brain. Furthermore, only GAS2L1β isoform is present in these tissues and
the absolute amounts of expressed protein are extremely low. Whether posttranscriptional
inhibition of gene expression or enhanced protein degradation account for the apparent lack of
GAS2L1 proteins in Gas2l1 mRNA containing tissues is not known so far (Goriounov et al.,
2003). Overexpressed human GAS2L1β is able to crosslink microtubules and microfilaments,
suggesting that endogenous protein may involve integration of these two components of the
cytoskeleton (Goriounov et al., 2003).
1.3.1.4 GAS2L2 (GAR17)
The human GAS2-related gene on chromosome 17 (GAR17) also encodes for two protein
isoforms, GAS2L2α and GAS2L2β. Human GAS2L2 mRNA expression is limited to skeletal
INTRODUCTION
15
muscle, whereas the β transcript is the predominant mRNA. As well as GAS2L1β, also the
β isoform of GAS2L2 appears to be able to crosslink microtubules and microfilaments in
transfected cells (Goriounov et al., 2003).
1.3.1.5 GAS2L3
The LINC target gene GAS2L3 is located on chromosome 12 in human and chromosome 10 in
mouse cells. Human GAS2L3 mRNA encodes for 2085 bp and the estimated protein size is
75 kDa. An alignment of the human and mouse GAS2L3 amino acid sequence results in 76 %
identity. To date, nothing is known about the biological function or biochemical properties of the
GAS2L3 gene and the corresponding GAS2L3 protein product.
1.4 Aim of this study
Failure during mitosis and cytokinesis can result in aneuploid cells. To date, the hypothesis that
aneuploidy promotes tumorigenesis is widely accepted. Therefore, research on the identification
of new mitotic regulators still attracts great attention.
The human LIN complex is a transcriptional activator of a set of G2/M specific genes
and therefore essential for proper mitosis and cytokinesis. To identify so far unknown LINC
target genes and consequently putative new mitotic regulators, our lab performed genome wide
microarray analysis from Lin9 knockout MEFs. The top hit of downregulated genes upon LIN9
depletion was Gas2l3, a member of the family of growth arrest specific 2 genes (Gas2 family).
The fact that Gas2l3 was completely uncharacterized made this gene a useful subject of
investigation. Hence, the aim of this thesis was the biochemical as well as biological
characterization of GAS2L3 in the human system.
The biochemical characterization included the investigation of the transcriptional
regulation of GAS2L3 gene expression during the cell cycle. Also the identification of GAS2L3
localization during the cell cycle was analyzed by immunofluorescence microscopy. To analyze
in detail the domains responsible for the specific localization pattern, different GAS2L3 deletion
mutants were cloned. By using protein analytical methods, properties of GAS2L3 full length
protein and GAS2L3 deletion mutants were monitored.
To analyze if GAS2L3 has any biological function during the cell cycle, different siRNA
approaches were used. For example, cell cycle behavior upon GAS2L3 depletion was
monitored by classical PI FACS analysis. To specifically monitor the fraction of mitotic cells
upon GAS2L3 depletion, pH3 FACS analysis was performed either with or without the induction
of mitotic stress by treatment with microtubule poisons. Additionally, nuclei morphology of
GAS2L3 depleted cells was analyzed by microscopic single cell examination.
MATERIAL & METHODS
16
2 MATERIAL & METHODS
2.1 Materials
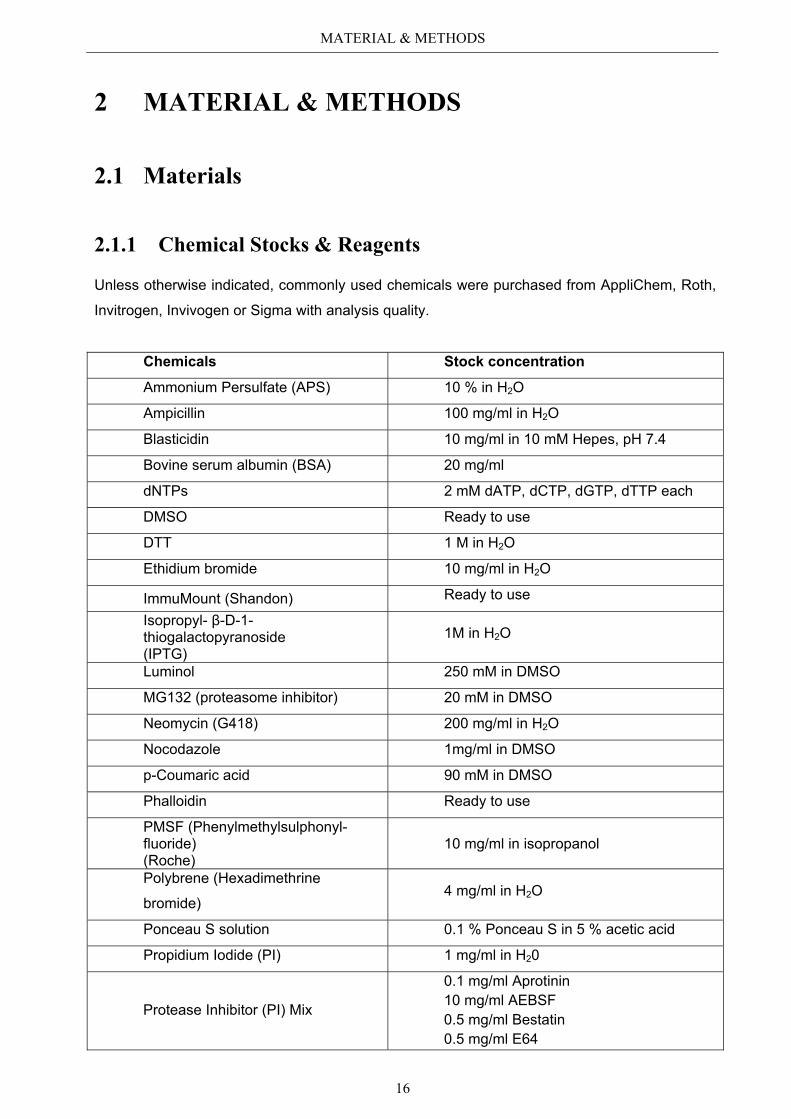
2.1.1 Chemical Stocks & Reagents
Unless otherwise indicated, commonly used chemicals were purchased from AppliChem, Roth,
Invitrogen, Invivogen or Sigma with analysis quality.
Chemicals Stock concentration
Ammonium Persulfate (APS) 10 % in H2O
Ampicillin 100 mg/ml in H2O
Blasticidin 10 mg/ml in 10 mM Hepes, pH 7.4
Bovine serum albumin (BSA) 20 mg/ml
dNTPs 2 mM dATP, dCTP, dGTP, dTTP each
DMSO Ready to use
DTT 1 M in H2O
Ethidium bromide 10 mg/ml in H2O
ImmuMount (Shandon) Ready to use
Isopropyl- β-D-1- thiogalactopyranoside (IPTG)
1M in H2O
Luminol 250 mM in DMSO
MG132 (proteasome inhibitor) 20 mM in DMSO
Neomycin (G418) 200 mg/ml in H2O
Nocodazole 1mg/ml in DMSO
p-Coumaric acid 90 mM in DMSO
Phalloidin Ready to use
PMSF (Phenylmethylsulphonyl- fluoride) (Roche)
10 mg/ml in isopropanol
Polybrene (Hexadimethrine
bromide) 4 mg/ml in H2O
Ponceau S solution 0.1 % Ponceau S in 5 % acetic acid
Propidium Iodide (PI) 1 mg/ml in H20
Protease Inhibitor (PI) Mix
0.1 mg/ml Aprotinin 10 mg/ml AEBSF 0.5 mg/ml Bestatin 0.5 mg/ml E64
MATERIAL & METHODS
17
1 mg/ml Leupeptin 0.1 mg/ml Pepstatin
Protease Inhibitor Cocktail Sigma Ready to use
Proteinase K 10 mg/ml in 50 mM Tris-HCl pH 8.0 / 1 mM CaCl2
ProtoGel 30 % (Biozym) Ready to use
Random primer (Roche) 0.5 mg/ml in H2O
RNase A 10 mg/ml in 10 mM Tris-HCl pH 7.4 / 150 mM NaCl
RO-3306 (CDK1 Inhibitor) 10 mM in DMSO
Sodium dodecyl sulfate (SDS) 10 % in H2O
Taxol 10mM in methanol 100 %
Temed 99 % Ready to use
Trizol /Trifast (total RNA isolation reagent) (Peqlab / Thermo) Ready to use
Thymidine 200 mM in DMSO
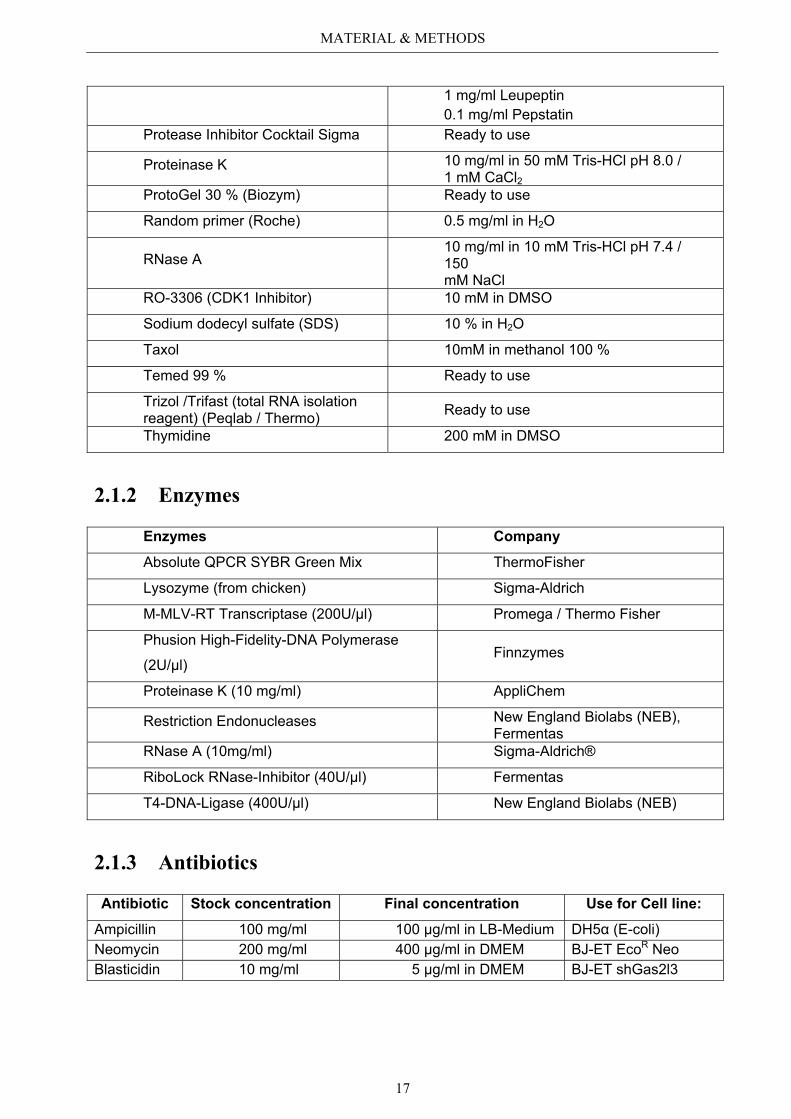
2.1.2 Enzymes
Enzymes Company
Absolute QPCR SYBR Green Mix ThermoFisher
Lysozyme (from chicken) Sigma-Aldrich
M-MLV-RT Transcriptase (200U/µl) Promega / Thermo Fisher
Phusion High-Fidelity-DNA Polymerase
(2U/µl) Finnzymes
Proteinase K (10 mg/ml) AppliChem
Restriction Endonucleases New England Biolabs (NEB), Fermentas
RNase A (10mg/ml) Sigma-Aldrich®
RiboLock RNase-Inhibitor (40U/µl) Fermentas
T4-DNA-Ligase (400U/µl) New England Biolabs (NEB)
2.1.3 Antibiotics
Antibiotic Stock concentration Final concentration Use for Cell line:
Ampicillin 100 mg/ml 100 µg/ml in LB-Medium DH5α (E-coli) Neomycin 200 mg/ml 400 µg/ml in DMEM BJ-ET EcoR Neo Blasticidin 10 mg/ml 5 µg/ml in DMEM BJ-ET shGas2l3
MATERIAL & METHODS
18
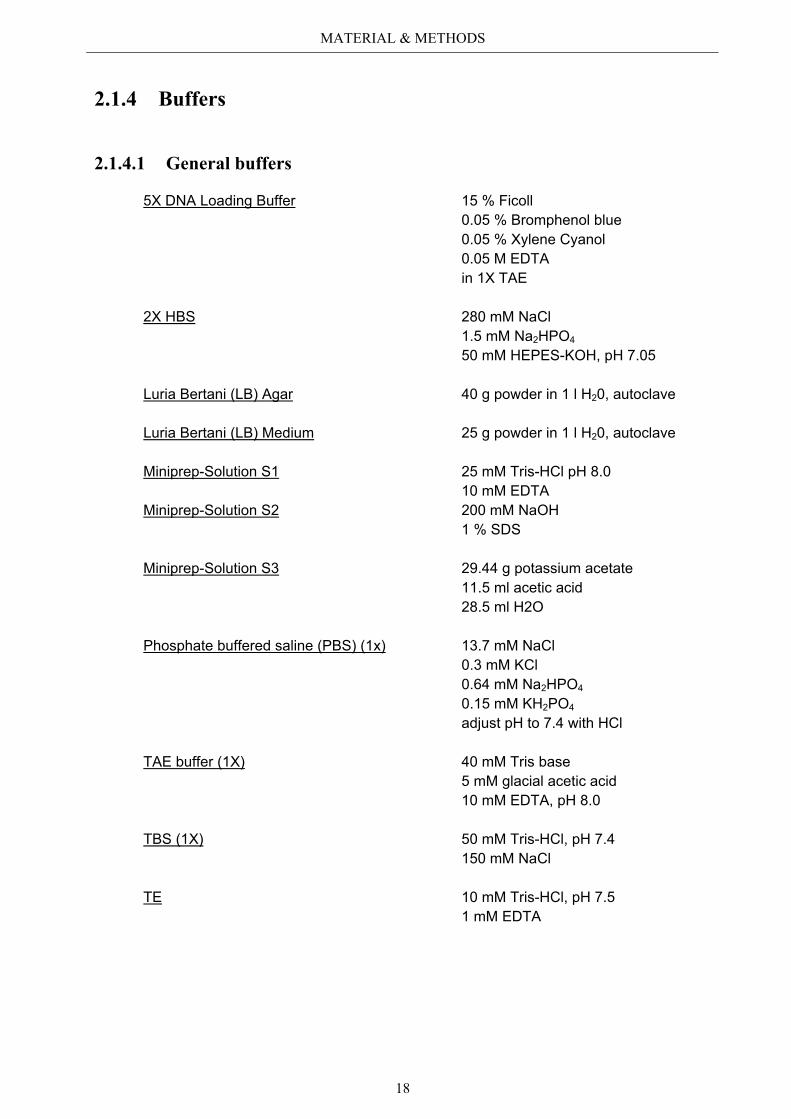
2.1.4 Buffers
2.1.4.1 General buffers
5X DNA Loading Buffer 15 % Ficoll 0.05 % Bromphenol blue 0.05 % Xylene Cyanol 0.05 M EDTA in 1X TAE
2X HBS 280 mM NaCl 1.5 mM Na2HPO4 50 mM HEPES-KOH, pH 7.05
Luria Bertani (LB) Agar 40 g powder in 1 l H20, autoclave
Luria Bertani (LB) Medium 25 g powder in 1 l H20, autoclave
Miniprep-Solution S1 25 mM Tris-HCl pH 8.0 10 mM EDTA
Miniprep-Solution S2 200 mM NaOH 1 % SDS
Miniprep-Solution S3 29.44 g potassium acetate 11.5 ml acetic acid 28.5 ml H2O
Phosphate buffered saline (PBS) (1x) 13.7 mM NaCl 0.3 mM KCl 0.64 mM Na2HPO4 0.15 mM KH2PO4 adjust pH to 7.4 with HCl
TAE buffer (1X) 40 mM Tris base 5 mM glacial acetic acid 10 mM EDTA, pH 8.0
TBS (1X) 50 mM Tris-HCl, pH 7.4 150 mM NaCl
TE 10 mM Tris-HCl, pH 7.5 1 mM EDTA
MATERIAL & METHODS
19
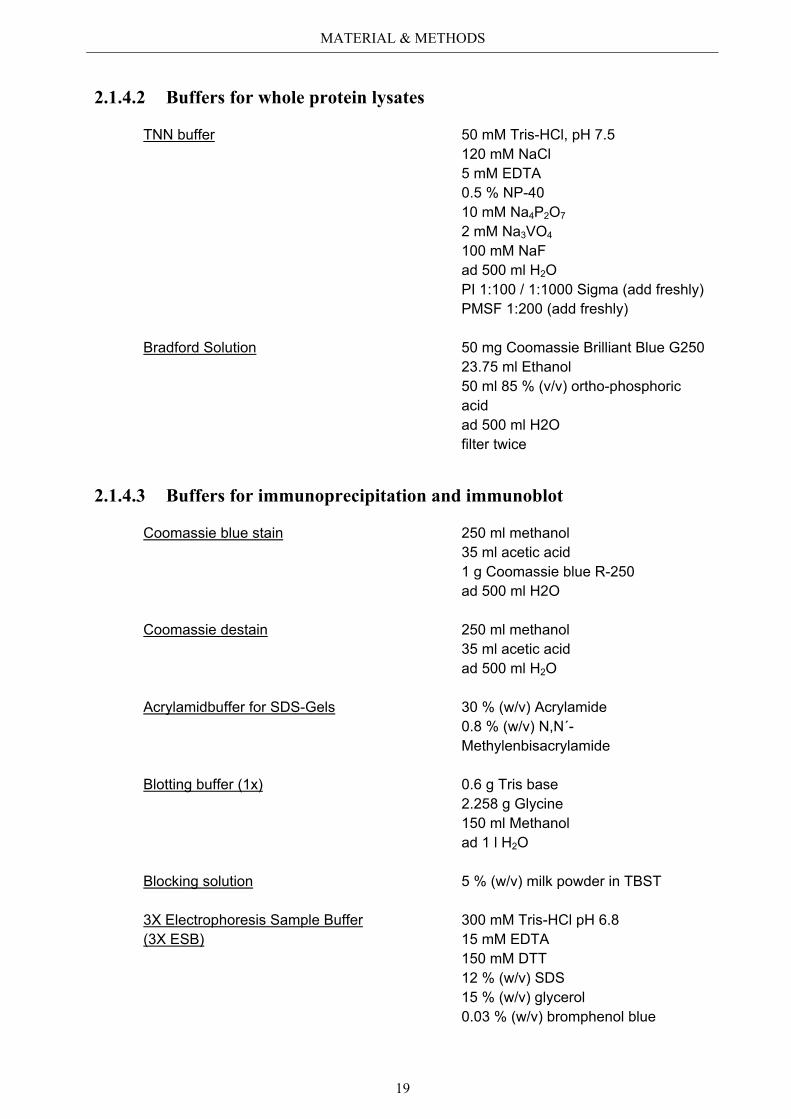
2.1.4.2 Buffers for whole protein lysates
TNN buffer 50 mM Tris-HCl, pH 7.5 120 mM NaCl 5 mM EDTA 0.5 % NP-40 10 mM Na4P2O7 2 mM Na3VO4 100 mM NaF ad 500 ml H2O PI 1:100 / 1:1000 Sigma (add freshly) PMSF 1:200 (add freshly)
Bradford Solution 50 mg Coomassie Brilliant Blue G250 23.75 ml Ethanol 50 ml 85 % (v/v) ortho-phosphoric acid ad 500 ml H2O filter twice
2.1.4.3 Buffers for immunoprecipitation and immunoblot
Coomassie blue stain 250 ml methanol 35 ml acetic acid 1 g Coomassie blue R-250 ad 500 ml H2O
Coomassie destain 250 ml methanol 35 ml acetic acid ad 500 ml H2O
Acrylamidbuffer for SDS-Gels 30 % (w/v) Acrylamide 0.8 % (w/v) N,N´- Methylenbisacrylamide
Blotting buffer (1x) 0.6 g Tris base 2.258 g Glycine 150 ml Methanol ad 1 l H2O
Blocking solution 5 % (w/v) milk powder in TBST
3X Electrophoresis Sample Buffer (3X ESB)
300 mM Tris-HCl pH 6.8 15 mM EDTA 150 mM DTT 12 % (w/v) SDS 15 % (w/v) glycerol 0.03 % (w/v) bromphenol blue
MATERIAL & METHODS
20
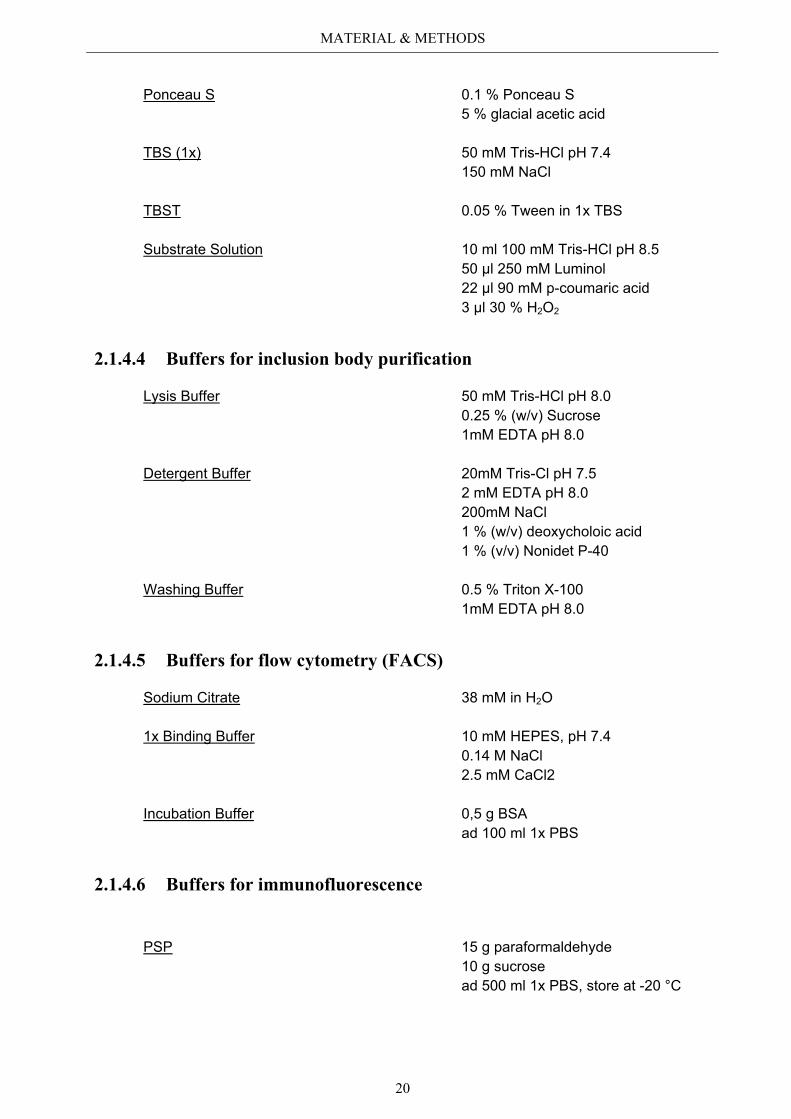
Ponceau S 0.1 % Ponceau S 5 % glacial acetic acid
TBS (1x) 50 mM Tris-HCl pH 7.4 150 mM NaCl
TBST 0.05 % Tween in 1x TBS
Substrate Solution 10 ml 100 mM Tris-HCl pH 8.5 50 µl 250 mM Luminol 22 µl 90 mM p-coumaric acid 3 µl 30 % H2O2
2.1.4.4 Buffers for inclusion body purification
Lysis Buffer 50 mM Tris-HCl pH 8.0 0.25 % (w/v) Sucrose 1mM EDTA pH 8.0
Detergent Buffer 20mM Tris-Cl pH 7.5 2 mM EDTA pH 8.0 200mM NaCl 1 % (w/v) deoxycholoic acid 1 % (v/v) Nonidet P-40
Washing Buffer 0.5 % Triton X-100 1mM EDTA pH 8.0
2.1.4.5 Buffers for flow cytometry (FACS)
Sodium Citrate 38 mM in H2O
1x Binding Buffer 10 mM HEPES, pH 7.4 0.14 M NaCl 2.5 mM CaCl2
Incubation Buffer 0,5 g BSA ad 100 ml 1x PBS
2.1.4.6 Buffers for immunofluorescence
PSP 15 g paraformaldehyde 10 g sucrose ad 500 ml 1x PBS, store at -20 °C
MATERIAL & METHODS
21
Mes Buffer 100 mM MeS pH 6.9 1mM EGTA 1 mM MgCl2
ad 100 ml H2O, store at 4 °C
Methanol Fixative 10 ml Mes Buffer 90 ml methanol, store at -20 °C
10 % TCA 10 g Trichloroacetic acid (TCA) in 100 ml PBS, store at 4 °C
PBST 0.5 ml triton 100 % 500 ml PBS, store at 4 °C
Blocking Solution 5 g BSA in 100 ml PBS, store at 4 °C or 10 ml FCS / 1 g Albumin ad 100 ml PBS, store at 4°C or 5 % goat serum in PBST, fresh made
2.1.5 Antibodies
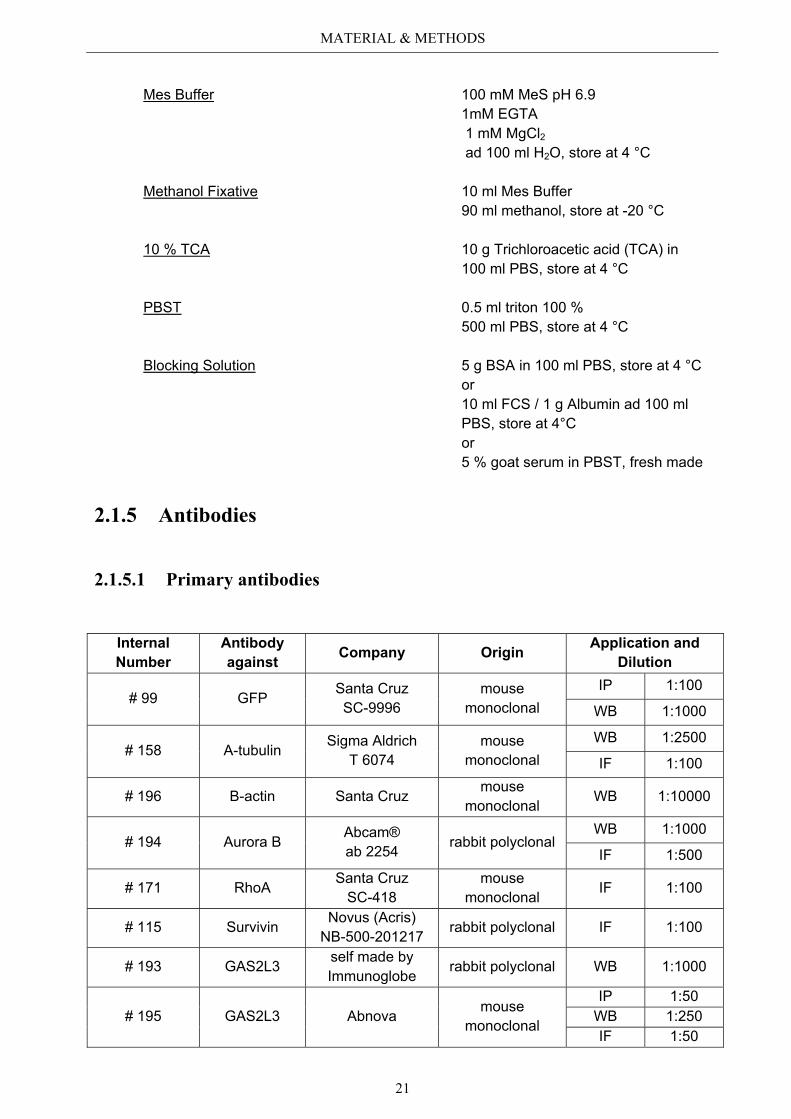
2.1.5.1 Primary antibodies
Internal Number
Antibody against Company Origin Application and
Dilution
# 99 GFP Santa Cruz SC-9996
mouse monoclonal
IP 1:100
WB 1:1000
# 158 A-tubulin Sigma Aldrich T 6074
mouse monoclonal
WB 1:2500
IF 1:100
# 196 B-actin Santa Cruz mouse
monoclonal WB 1:10000
# 194 Aurora B Abcam® ab 2254 rabbit polyclonal
WB 1:1000
IF 1:500
# 171 RhoA Santa Cruz SC-418
mouse monoclonal IF 1:100
# 115 Survivin Novus (Acris) NB-500-201217 rabbit polyclonal IF 1:100
# 193 GAS2L3 self made by Immunoglobe
rabbit polyclonal WB 1:1000
# 195 GAS2L3 Abnova mouse monoclonal
IP 1:50 WB 1:250 IF 1:50
MATERIAL & METHODS
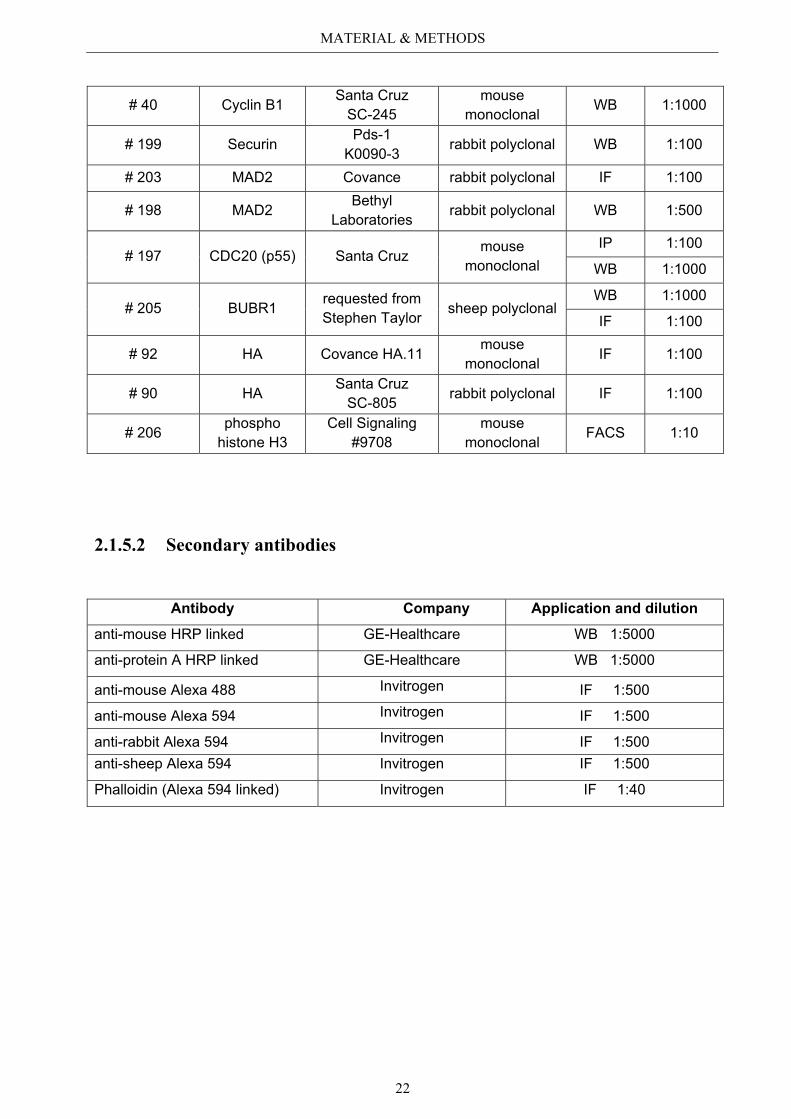
22
# 40 Cyclin B1 Santa Cruz SC-245
mouse monoclonal WB 1:1000
# 199 Securin Pds-1 K0090-3
rabbit polyclonal WB 1:100
# 203 MAD2 Covance rabbit polyclonal IF 1:100
# 198 MAD2 Bethyl Laboratories rabbit polyclonal WB 1:500
# 197 CDC20 (p55) Santa Cruz mouse
monoclonal IP 1:100
WB 1:1000
# 205 BUBR1 requested from Stephen Taylor sheep polyclonal
WB 1:1000
IF 1:100
# 92 HA Covance HA.11 mouse
monoclonal IF 1:100
# 90 HA Santa Cruz SC-805 rabbit polyclonal IF 1:100
# 206 phospho histone H3
Cell Signaling #9708
mouse monoclonal FACS 1:10
2.1.5.2 Secondary antibodies
Antibody Company Application and dilution
anti-mouse HRP linked GE-Healthcare WB 1:5000
anti-protein A HRP linked GE-Healthcare WB 1:5000
anti-mouse Alexa 488 Invitrogen IF 1:500
anti-mouse Alexa 594 Invitrogen IF 1:500
anti-rabbit Alexa 594 Invitrogen IF 1:500 anti-sheep Alexa 594 Invitrogen IF 1:500
Phalloidin (Alexa 594 linked) Invitrogen IF 1:40
MATERIAL & METHODS
23
2.1.6 Plasmids
2.1.6.1 Plasmids for overexpression
Unless otherwise indicated, all plasmids encode for human sequences.
Internal number Plasmid name Description
# 170 pCDNA3-EGFP vector backbone for cloning
# 174 pEGFP-N1 EGFP overexpression control
# 212 pCDNA3-HA empty vector control for overexpression
# 1019 pCDNA3-HA-mouse Gas2l3 mammalian overexpression
#1033 pCDNA3-GFP-Gas2l3 mammalian overexpression
#1056 pCDNA3-GFP-Gas2l3 DelMut 3 mammalian overexpression
#1057 pCDNA3-GFP-Gas2l3 DelMut 4 mammalian overexpression
#1064 pCDNA3-GFP-Gas2l3 DelMut 1 mammalian overexpression
#1065 pCDNA3-GFP-Gas2l3 DelMut2 mammalian overexpression
#1068 pCDNA3-GFP-Gas2l3 DelMut 5 mammalian overexpression
2.1.6.2 Plasmids for recombinant proteins
Internal number Plasmid name Description
# 397 pGEX-4T2-GST Recombinant expression of GST
# 1067 pGEX-4T2-GST Gas2l3 DelMut 2 Recombinant expression of GST-
Gas2l3 DelMut 2
2.1.6.3 Plasmids for retroviral knock down
Internal number Plasmid name Description
# 746 pMSCV-H2B GFP GFP control for knock down constructs
# 652 pMSCV-Blastcidin empty vector control for knock down constructs
MATERIAL & METHODS
24
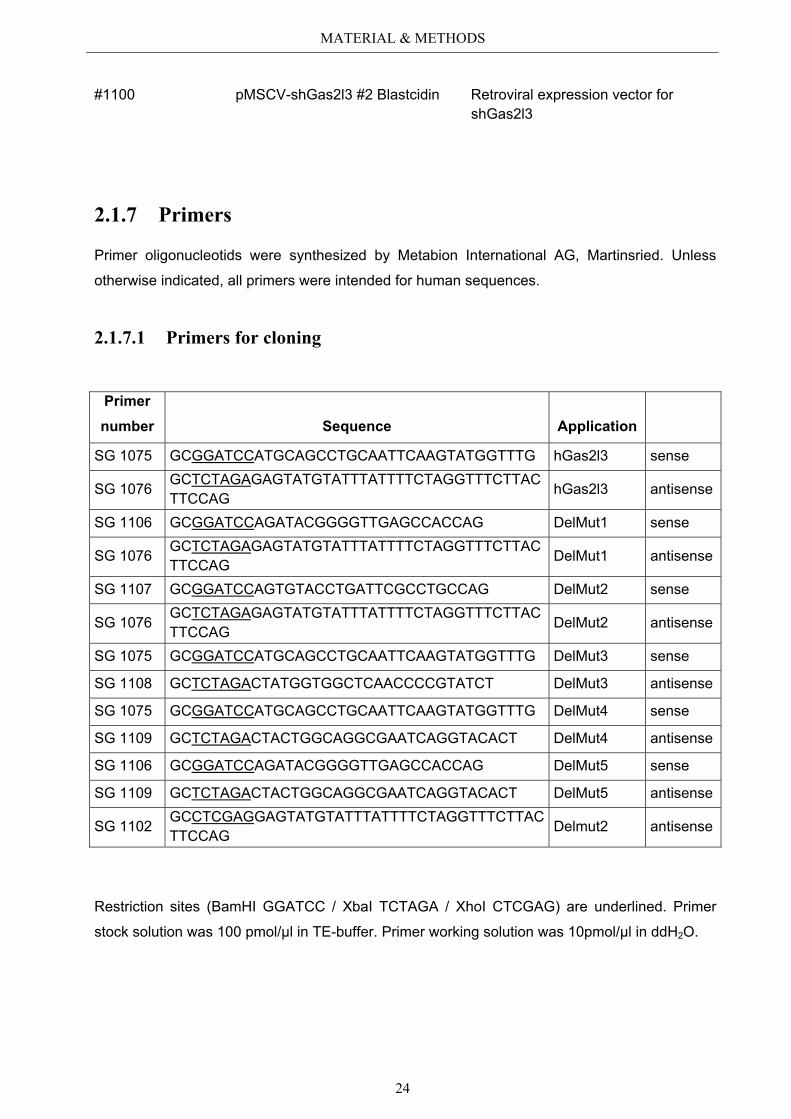
#1100 pMSCV-shGas2l3 #2 Blastcidin Retroviral expression vector for shGas2l3
2.1.7 Primers
Primer oligonucleotids were synthesized by Metabion International AG, Martinsried. Unless
otherwise indicated, all primers were intended for human sequences.
2.1.7.1 Primers for cloning
Primer number Sequence Application
SG 1075 GCGGATCCATGCAGCCTGCAATTCAAGTATGGTTTG hGas2l3 sense
SG 1076 GCTCTAGAGAGTATGTATTTATTTTCTAGGTTTCTTACTTCCAG
hGas2l3 antisense
SG 1106 GCGGATCCAGATACGGGGTTGAGCCACCAG DelMut1 sense
SG 1076 GCTCTAGAGAGTATGTATTTATTTTCTAGGTTTCTTACTTCCAG DelMut1 antisense
SG 1107 GCGGATCCAGTGTACCTGATTCGCCTGCCAG DelMut2 sense
SG 1076 GCTCTAGAGAGTATGTATTTATTTTCTAGGTTTCTTACTTCCAG DelMut2 antisense
SG 1075 GCGGATCCATGCAGCCTGCAATTCAAGTATGGTTTG DelMut3 sense
SG 1108 GCTCTAGACTATGGTGGCTCAACCCCGTATCT DelMut3 antisense
SG 1075 GCGGATCCATGCAGCCTGCAATTCAAGTATGGTTTG DelMut4 sense
SG 1109 GCTCTAGACTACTGGCAGGCGAATCAGGTACACT DelMut4 antisense
SG 1106 GCGGATCCAGATACGGGGTTGAGCCACCAG DelMut5 sense
SG 1109 GCTCTAGACTACTGGCAGGCGAATCAGGTACACT DelMut5 antisense
SG 1102 GCCTCGAGGAGTATGTATTTATTTTCTAGGTTTCTTACTTCCAG Delmut2 antisense
Restriction sites (BamHI GGATCC / XbaI TCTAGA / XhoI CTCGAG) are underlined. Primer
stock solution was 100 pmol/µl in TE-buffer. Primer working solution was 10pmol/µl in ddH2O.
MATERIAL & METHODS
25
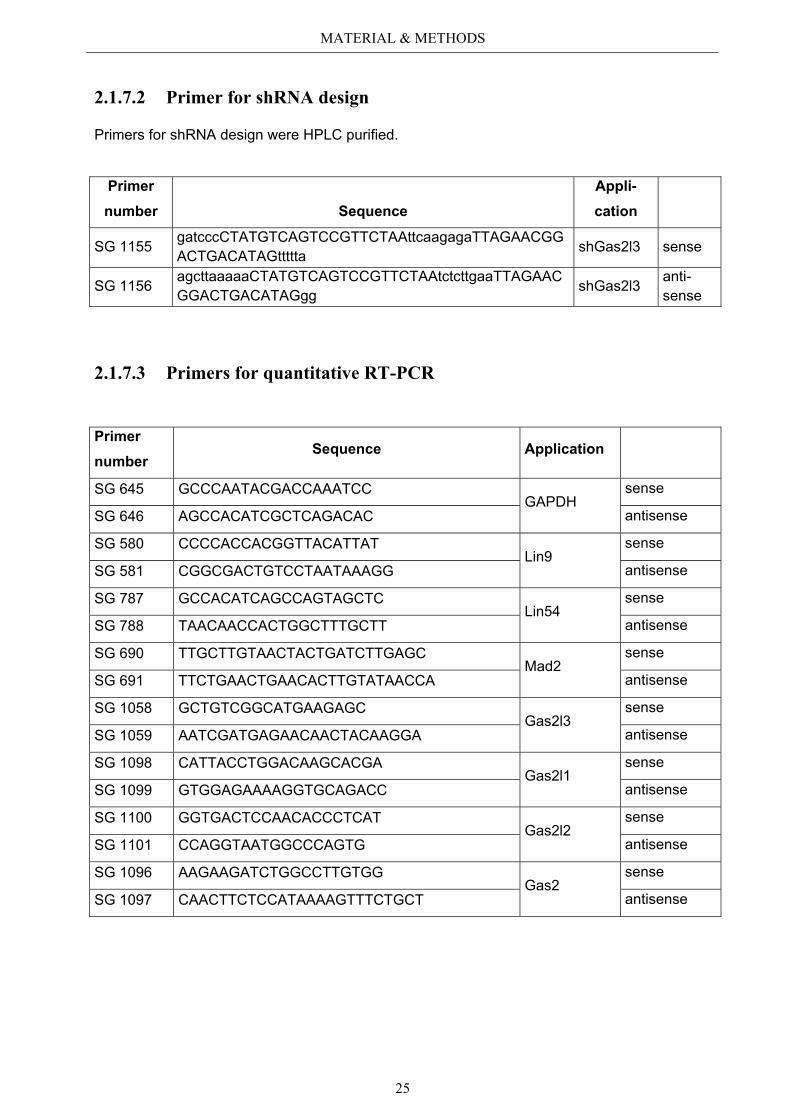
2.1.7.2 Primer for shRNA design
Primers for shRNA design were HPLC purified.
Primer number Sequence
Appli-cation
SG 1155 gatcccCTATGTCAGTCCGTTCTAAttcaagagaTTAGAACGGACTGACATAGttttta shGas2l3 sense
SG 1156 agcttaaaaaCTATGTCAGTCCGTTCTAAtctcttgaaTTAGAACGGACTGACATAGgg shGas2l3 anti-
sense
2.1.7.3 Primers for quantitative RT-PCR
Primer number
Sequence Application
SG 645 GCCCAATACGACCAAATCC GAPDH
sense
SG 646 AGCCACATCGCTCAGACAC antisense
SG 580 CCCCACCACGGTTACATTAT Lin9
sense
SG 581 CGGCGACTGTCCTAATAAAGG antisense
SG 787 GCCACATCAGCCAGTAGCTC Lin54
sense
SG 788 TAACAACCACTGGCTTTGCTT antisense
SG 690 TTGCTTGTAACTACTGATCTTGAGC Mad2
sense
SG 691 TTCTGAACTGAACACTTGTATAACCA antisense
SG 1058 GCTGTCGGCATGAAGAGC Gas2l3
sense
SG 1059 AATCGATGAGAACAACTACAAGGA antisense
SG 1098 CATTACCTGGACAAGCACGA Gas2l1
sense
SG 1099 GTGGAGAAAAGGTGCAGACC antisense
SG 1100 GGTGACTCCAACACCCTCAT Gas2l2
sense
SG 1101 CCAGGTAATGGCCCAGTG antisense
SG 1096 AAGAAGATCTGGCCTTGTGG Gas2
sense
SG 1097 CAACTTCTCCATAAAAGTTTCTGCT antisense
MATERIAL & METHODS
26
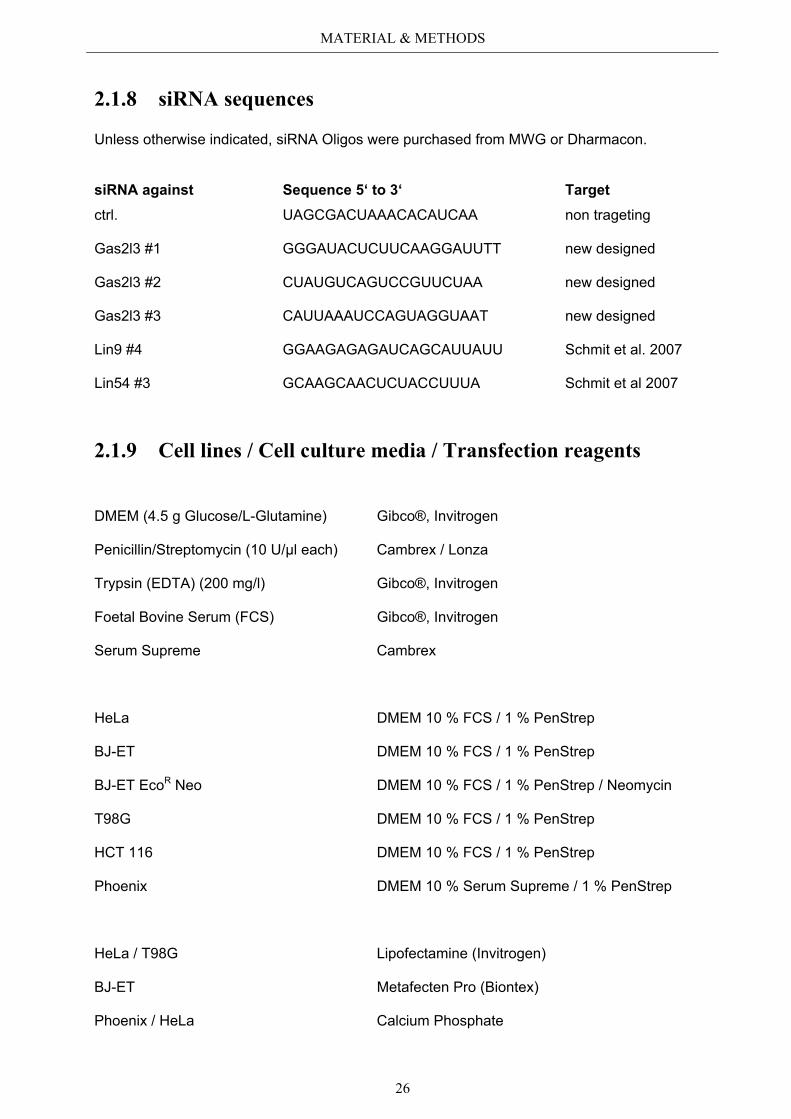
2.1.8 siRNA sequences
Unless otherwise indicated, siRNA Oligos were purchased from MWG or Dharmacon.
siRNA against Sequence 5‘ to 3‘ Target ctrl. UAGCGACUAAACACAUCAA non trageting
Gas2l3 #1 GGGAUACUCUUCAAGGAUUTT new designed
Gas2l3 #2 CUAUGUCAGUCCGUUCUAA new designed
Gas2l3 #3 CAUUAAAUCCAGUAGGUAAT new designed
Lin9 #4 GGAAGAGAGAUCAGCAUUAUU Schmit et al. 2007
Lin54 #3 GCAAGCAACUCUACCUUUA Schmit et al 2007
2.1.9 Cell lines / Cell culture media / Transfection reagents
DMEM (4.5 g Glucose/L-Glutamine) Gibco®, Invitrogen
Penicillin/Streptomycin (10 U/μl each) Cambrex / Lonza
Trypsin (EDTA) (200 mg/l) Gibco®, Invitrogen
Foetal Bovine Serum (FCS) Gibco®, Invitrogen
Serum Supreme Cambrex
HeLa DMEM 10 % FCS / 1 % PenStrep
BJ-ET DMEM 10 % FCS / 1 % PenStrep
BJ-ET EcoR Neo DMEM 10 % FCS / 1 % PenStrep / Neomycin
T98G DMEM 10 % FCS / 1 % PenStrep
HCT 116 DMEM 10 % FCS / 1 % PenStrep
Phoenix DMEM 10 % Serum Supreme / 1 % PenStrep
HeLa / T98G Lipofectamine (Invitrogen)
BJ-ET Metafecten Pro (Biontex)
Phoenix / HeLa Calcium Phosphate
MATERIAL & METHODS
27
2.1.10 Markers
1 Kb DNA Ladder Fermentas
SDS Page Ruler Mix Fermentas
2.1.11 Kits
Jetstar Gel Extraction Kit Genomed
Jetstar Plasmid Purification Midi/Maxi Kit Genomed
Plasmid Mini/Midi/Maxi Kit Promega / Invitrogen
QIAquick PCR Purification Kit Qiagen
Absolute QPCR SYBR Green Mix Thermo Fisher
2.1.12 Beads
Protein A Sepharose (Pierce)
Protein G Sepharose (Pierce)
Glutathione Sepharose (Amersham)
MATERIAL & METHODS
28
2.2 Methods
2.2.1 Cell culture
2.2.1.1 Passageing of cells
Eukaryotic cells were cultivated in a tissue culture incubator at 37 °C and with 5 % carbon
dioxide (CO2). For passageing, cells were washed once with PBS and incubated with
Trypsin/EDTA for a few minutes at 37 °C. The detached cells were plated on new culture
dishes.
2.2.1.2 Freezing of cells
To freeze cells, cells on 10 cm dishes were trypsinized and transferred into a 15 ml falcon with
10 ml fresh media. Next, they were centrifuged for 3 min at 1000 rpm, the supernatant was
discarded and 1 ml ice cold freeze medium (DMEM media containing 10 % DMSO) was added.
Pellets were resuspended and transferred into cooled cryotubes. Cells were stored at -80 °C for
short term or in liquid nitrogen for long term.
2.2.1.3 Thawing of cells
Cells were quickly thawed in a 37 °C water bath. The cell suspension was mixed with 10 ml
fresh medium and centrifuged for 3 min at 1000 rpm. The supernatant was discarded and
pellets were resuspended in 10 ml fresh medium and seeded into 10 cm dishes.
2.2.1.4 Counting of cells
Cell counting was performed using a Neubauer Chamber. The number of cells per ml in
suspension was calculated using the following formula:
Cells/ml = (Cells counted / number of counted large squares) x 104
2.2.1.5 Transient transfection
2.2.1.5.1 Calcium phosphate transfection
HeLa and Phoenix cells were transfected using calcium phosphate. 15-30 µg of plasmid DNA
was mixed with 50 µl of 2.5 M CaCl2 and with H2O to a final amount of 500 µl. 500 µl of 2x HBS
MATERIAL & METHODS
29
were continuously bubbled while DNA/CaCl2 mixture was added drop wise. This solutuion was
slowly added to the cells. After 14 – 18 h incubation, cells were washed with PBS and fed with
fresh medium. Cells were harvested after 48 h post transfection for the desired procedure.
2.2.1.5.2 Lipofectamine / Metafectene transfection
T98G and HeLa cells were transfected with Lipofectamine 2000 (Invitrogen), HCT 116 and BJ-
ET cells were transfected with Metafectene Pro (Biontex), according to the manufacturer’s
instructions.
2.2.1.6 Infection of BJ-ET cells
For the production of ecotrophic virus supernatants, Phoenix cells carrying the ecotrophic
receptor were transiently transfected with the plasmid of interest using calcium phosphate
(s. 2.2.1.5.1). 48 h after transfection, the virus supernatants were harvested and used
immediately or were frozen in liquid nitrogen and stored at -80 °C.
BJ-ET cells were splitted 1:4 the day before infection. For the infection, the viral
supernatant was mixed with 8 µg/ml polybrene, filtered (0.45 µm) and added to the cells. 14 –
18 h after infection, the cells were fed with fresh medium and selection was started 48h after
infection.
2.2.1.7 Growth curve of BJ-ET cells
1x10⁵ of the infected and selected BJ-ET cells were plated on a 6-well-plate in triplicates. Every
4 days, cells were counted and 1x10⁵ cells replated. Mean values of the cumulative cell
numbers were plotted against the time.
2.2.1.8 Synchronization of T98G cells by serum starvation
For synchronization in G0, 60 % confluent T98G cells were washed twice with PBS and fed with
DMEM without FCS for 72 h. Release into the cell cycle was achieved by adding 20 % FCS.
2.2.1.9 Synchronization of HeLa cells by thymidine
For synchronization at the G1/S border, 60 % confluent HeLa cells were treated with 2.5 mM
thymidine for 24 h. Afterwards cells were released into the cell cycle by washing twice with PBS
and adding 10 % FCS medium.
MATERIAL & METHODS
30
2.2.1.10 Cell treatment with different reagents
To block asynchronously HeLa cells in metaphase, 150 ng/ml nocodazole or 33 nM taxol were
directly added into fresh cell medium after siRNA transfection (s. 2.2.1.5.2). When cells were
additionally synchronized by thymidine at the G1/S border (s. 2.2.1.9), 33 nM taxol was added
into the medium directly after the cell cycle release.
For protein stabilization assays, calcium phosphate transfected HeLa cells (s. 2.2.1.5.1)
were incubated for 7 – 10 h with 20 µM MG132 40 h post transfection.
2.2.1.11 Determination of cell cycle phases by flow cytometry
For flow cytometry (FACS) measurement, cells were harvested by trypsinization, washed with
cold PBS and fixed with 1 ml ice cold 80 % ethanol. After fixation at -20 °C for at least one night,
cells were again washed with cold PBS and the cell pellet was resuspended in 500 µl 38 mM
NaCitrate and 25 µl RNase A [10 mg/ml]. Cells were incubated for 1-2 h at 37 °C and stained
with 30 µl propidium iodide (PI) [1 mg/ml] directly before FACS measurement.
In order to determine the fraction of cells in early M phase, cells were stained with
propidium iodide and an antibody specific for phosphorylated histone H3 at serine10 (phospho
H3). Cells were harvested by trypsinization, washed in PBS and fixed in 2 % paraformaldehyde
in PBS for 10 min at 37 °C. After 1 min on ice, cells were permeabilized for 30 min at 4 °C by
adding 90 % ice cold methanol and afterwards stored at -20 °C over night. 5 x 10⁵ cells were
washed with 3 ml incubation buffer, resuspended in 90 μl incubation buffer and blocked for
10 min at room temperature (RT). By addition of 10 μl phospho H3 antibody the cells were
stained for 1.5 – 2 h at RT in the dark. After a second washing step with incubation buffer, cells
were incubated with 50 μg/ml PI and 0.7 mg/ml RNaseA for 30 min at 37°C and analyzed by
FACS to determine the fraction of phosphorylated histone H3 positive cells.
2.2.1.12 Immunofluorescence
For immunofluorescence studies, cells were plated on coverslips in 6-well plates, fixed with an
adequate fixative and stained by direct or indirect immunofluorescence.
2.2.1.12.1 PSP fixation
For PSP fixation, cells plated on coverslips were washed once with PBS followed by fixation in
1.5 ml prewarmed PSP for 10 min at RT. After washing for 5 min with PBS, cells were
MATERIAL & METHODS
31
permeabilized in 2 ml PBS / 0,2 % triton for 5 min at RT. Cells were washed again twice in
PBS / 0,1 % triton (PBST) before used for further staining procedure.
2.2.1.12.2 PSP / 0.3 % triton fixation
For PSP fixation with 0.3 % triton, cells plated on coverslips were washed once with PBS
followed by fixation in 1.5 ml prewarmed PSP and additional 0.3 % triton for 10 min at RT. After
washing for 5 min with PBS, cells were permeabilized in 2 ml PBS / 0,2 % triton for 5 min at RT.
Cells were washed again twice in PBS / 0,1 % triton (PBST) before used for further staining
procedure.
2.2.1.12.3 MesMetOh fixation
For MesMetOH fixation, cells plated on coverslips were washed once with PBS followed by
fixation in 1.5 ml ice cold methanol fixative for 5 min at RT. Before further staining procedure,
cells were thoroughly washed for 3 times in PBS.
2.2.1.12.4 TCA fixation
For TCA fixation, cells plated on coverslips were directly fixed in 1.5 ml ice cold 10 % TCA for
15 min at RT. After washing for 5 min with PBS, cells were permeabilized in 2 ml PBS / 0,2 %
triton for 5 min at RT. Cells were washed again twice in PBS / 0,1 % triton (PBST) before used
for further staining procedure.
2.2.1.12.5 Indirect immunofluorescence (standard procedure)
For indirect immunofluorescence staining, fixed cells were first incubated in blocking solution for
minimal 20 min to avoid unspecific binding of the antibodies. After blocking, cells on cover slips
were directly transferred to a dark humid chamber and incubated with 80 µl diluted primary
antibody (standard dilution 1:100 in PBS) for 1 h at RT. Afterwards, the cover slips were washed
3 times with PBST and incubated with 75 µl of the appropriate fluorescence labelled secondary
antibody (standard dilution 1:500 in PBS) and bisbenzamide (1:5000 in PBS) for nuclei staining.
After 30 min incubation, cells were thoroughly washed with PBS and mounted with ImmuMount.
2.2.1.12.6 Direct immunofluorescence of actin filaments
For staining of actin filaments, direct immunofluorescence with fluorescence labelled phalloidin
was performed. Cells were first fixed with PSP (s. 2.2.1.12.1), washed twice with PBS for 5 min
and then incubated in blocking solution for 20 min at RT to minimize unspecific staining.
Afterwards, cells were incubated with 80 µl diluted fluorescence labelled phalloidin (1:40 in
PBS) for 30 min at RT in a dark humid chamber. Cells were washed 3 times for 5 min in PBST
MATERIAL & METHODS
32
following nuclei staining with bisbenzamide 1:2500 in PBS for 1 min at RT. Finally, cells were
thoroughly washed with PBS and mounted with ImmuMount.
2.2.1.12.7 Fixation method for specific immunofluorescence stainings
Staining Fixation Method
EGFP-GAS2L3 PSP + /- 0.3 % triton
endogenous GAS2L3 PSP + /- 0.3 % triton
A-tubulin PSP + /- 0.3 % triton / MesMetOH
Aurora B PSP + /- 0.3 % triton
Survivin PSP + /- 0.3 % triton
RhoA 10 % TCA
MAD2 PSP + 0.3 % triton
BUBR1 PSP + 0.3 % triton
Actin filaments with Phalloidin PSP - 0.3 % triton
2.2.2 Expression analysis
2.2.2.1 RNA isolation
Total RNA was isolated from cell culture cells by using the RNA isolation reagent Trifast from
Peqlab. After removing the medium, 1 ml Trifast was added onto the cell culture plate and cells
were scraped into a reaction tube. After 5 min incubation, 200 µl chloroform was added and
thoroughly vortexed for 15 sec. The tubes were centrifuged at 11400 rpm and 4 °C for 10
minutes and the upper aqueous phase was transferred to a new reaction tube. RNA was
precipitated with 500 µl isopropanol at RT for 10 minutes and centrifuged for 10 minutes at
11400 rpm and 4 °C. The pellet was washed with 80 % ethanol and resuspended with 25 -40 µl
RNase free water.
2.2.2.2 Reverse transcription
To transcribe RNA into cDNA, 2.5 μg RNA were mixed with 0.5 μl random primer [0.5 μg/μl] and
brought to 10 μl with water. After incubation at 70 °C for 5 min, the samples were left for 1 min
at 4 °C and then mixed with 5 μl M-MLV 5 x reaction buffer, 6.25 μl dNTPs [2mM], 0.5 μl
Ribolock RNase inhibitor [40 U/μl], 0.5 μl M-MLV-RT [200U] and 2.75 μl H2O. For cDNA
synthesis, the samples were incubated at 37 °C for 60 min and then inactivated for 15 min at
70 °C.
MATERIAL & METHODS
33
2.2.2.3 Quantitative real-time PCR (qRT-PCR)
To determine the amount of a specific mRNA compared to a housekeeping gene, the following
reaction was prepared:
Standard reaction mix: 12.5 μl absolute qRT-PCR Sybr Green Mix
10.5 μl H2O
1 μl fw / rev primer mix (10 pmol/μl each)
1 μl cDNA
Standard PCR program (40 cycles): 95 °C 15 min
95 °C 15 s
60 °C 1 min
The relative expression of a gene compared to a housekeeping gene was calculated with this
formula: 2-ΔΔCt
with ΔΔCt = ΔCt (sample) – ΔCt (reference)
and ΔCt = Ct (gene of interest) – Ct (housekeeping gene)
The standard deviation of ΔΔCt was calculated with:
s=√(s12+s2
2)
with s1 = standard deviation (gene of interest)
and s2 = standard deviation (housekeeping gene)
The margin of error for 2-ΔΔCt was determined by this formula: 2-ΔΔCt +/-s
and the error used for the error bars was calculated with: 2-ΔΔCt +s - 2-ΔΔCt
2.2.3 Biochemical methods
2.2.3.1 Whole cell lysates
HeLa cells were scraped with cold PBS and centrifuged for 5 min at 3000 rpm and 4 °C. The
pellet was resuspended with 10 times its amount of TNN buffer (with freshly added PI [1:100 /
1:1000 Sigma] and PMSF [1:200]) by vortexing and incubation on ice for at least 20 min. The
lysates were spinned at 14000 rpm for 10 min at 4 °C to remove the cell debris. The
MATERIAL & METHODS
34
supernatant was transferred in a new reaction tube and immediately used for
immunoprecipitation or boiled in 3x ESB for 5 minutes and frozen at -20 °C.
2.2.3.2 Determination of protein concentration (Bradford)
The protein concentration was determined with the method described by Bradford (Bradford,
1976). 1 µl of whole cell lysate was mixed with 100 µl 0.15 M NaCl and 1 ml of Bradford
solution. Extinction at 595 nm was measured and compared to a standard BSA dilution series.
2.2.3.3 Immunoprecipitation
For immunoprecipitation, between 0.5 and 1 mg of whole cell lysate was incubated for 4 hours
or overnight with the desired antibodies on a rotating wheel at 4 °C. 40 µl of protein A-
(polyclonal antibodies) or protein G-sepharose (monoclonal antibodies) were added and left
incubated for additional 1 h at 4 °C on the roating wheel. The beads were washed 5 times with
TNN and spinned in between for 1 minute at 3000 rpm and 4 °C. After the last wash, the
supernatant was removed completely with a Hamilton syringe and the beads were resuspended
in 40 µl 3x ESB and boiled for 5 minutes at 95 °C. Samples were stored at -20°C or directly
used for electrophoresis.
In parallel, 20 % of the protein amount used for immunoprecipitation was boiled with 3 x
ESB at 95 °C for 5 min and used as input samples.
2.2.3.4 SDS polyacrylamide gel electrophoresis (SDS-PAGE)
SDS-PAGE analysis was performed using the discontinous method (Laemmli, 1970). A 8 - 14 %
separating gel was prepared and after polymerization, the stacking gel was poured on the top.
The gels were prepared as follows:
Separating gel (10 %) 6.1 ml H2O
3.7 ml 1.5 M Tris pH 8.8
5 ml Acrylamid/Bisacrylamid
75 μl 20 % SDS
100 μl 10 % APS
20 μl TEMED
Stacking gel 6.9 ml H2O
1.4 ml 0.5 M Tris pH 6.8
1.6 ml Acrylamid/Bisacrylamid
50 μl 20 % SDS
50 μl 10 % APS
20 μl TEMED
MATERIAL & METHODS
35
Electrophoresis was carried out in 1X SDS running buffer for about 1 h at 35 mA/gel.
The gels were either used for immunoblotting or stained for 30 minutes with Coomassie blue to
visualize the proteins.
2.2.3.5 Immunoblotting
The transfer of proteins onto PVDF membranes was done via electroblotting using a BioRad
Wet Blot gadget. The PVDF membrane was preincubated for 1 min with 100 % methanol and
rinsed with blotting buffer. The membrane was laid onto a layer of Whatman filter paper and the
SDS-polyacrylamide gel was placed on the membrane, followed by a second layer of filter
paper. This “sandwich” was clasped on both sides by sponges and placed in a cooled wet
blotting tank (Biorad). The transfer occurred for 60 min at 300 mA in 1X Blotting Buffer.
Successful and equal transfer of proteins was visualized by staining of the membrane with a
Ponceau S solution and destaining with H2O.
To detect specific proteins with their respective antibodies, the membranes were
blocked with 3 % milk powder in TBST (Blocking solution) for 2 - 4 h, and then incubated
overnight at 4°C with the primary antibody diluted in blocking solution. Afterwards, the
membrane was washed 3 times for 10 min in TBST and incubated with the secondary HRP-
conjugated antibody for 1 h at RT. After 3 wash steps of 10 min in TBST, specific bands were
detected using a Luminol-substrate-solution. The membrane was wrapped in plastic foil and
exposed to an ECL-film.
2.2.3.6 Purification of inclusion bodies from recombinant bacteria for
antibody production
Chemocompetent bacteria were transformed with the desired GST construct with heat-shock
(s. 2.2.4.4.6).
50 ml over night culture of one single bacterial colony was diluted 1:10 in LB media and
grown for 1 h at 37 °C. Then the recombinant protein expression was induced for 4 h with 1 mM
IPTG. For fusion protein recovery, bacterial cultures were pelleted by centrifugation at 4000 rpm
for 10 minutes at 4 °C and pellets resuspended in 30 ml ice cold lysis buffer. To completely lyse
the bacteria, additional 7 ml lysis buffer together with 70 mg lysozyme was added to the
bacteria and incubated for 30 min on ice followed by sonification (10 times for 30 seconds, 50 %
intensity). After adding 70 ml detergent buffer, lysates were centrifuged 10 min for 7000 rpm at
4 °C. Afterwards the slightly orange supernatant was carefully removed and the remaining pellet
was resuspended in 85 ml washing buffer followed by centrifugation for 10 min at 7000 rpm at
4°C. Washing was repeated as long as a tight pellet was obtained. This pellet was finally
MATERIAL & METHODS
36
washed with 85 ml 70 % ethanol and resuspended in a small volume of sterile PBS followed by
sonification until a clear white suspension was obtained.
For estimation of protein concentration, an aliquot was boiled in 3x ESB and loaded onto
a SDS-polyacrylamide gel. Proteins were visualized by Coomassie blue stain.
For antibody production, aliquots with 0.25 – 1 mg protein / 250 µl were frozen at -20°C
and collected from immunoGlobe (Antikörpertechnik GmbH) for rabbit injection.
2.2.4 Molecular biology
2.2.4.1 Isolation of plasmid DNA from bacteria
2.2.4.1.1 Mini preparation
Single colonies were picked from an LB agar plate after transformation and incubated in 4 ml LB
medium containing ampicillin over night in a shaker at 37 °C. 1.5 ml bacterial solution was
pelleted and resuspended in 300 µl S1. The bacteria were lysed by adding 300 µl S2 for 5
minutes. This reaction was neutalized with 300 µl S3. The bacterial debris were pelleted for 10
minutes at full speed and plasmid DNA in the supernatant was precipitated with 700 µl
isopropanol. After centrifugation for 60 minutes at room temperature, the pellet was washed
with 1 ml 70 % ethanol. The pellet was air dried and resuspended in 30 µl H2O. Correct bacterial
clones were identified by restriction (s. 2.2.4.4.4).
2.2.4.1.2 Midi and Maxi preparation
A single colony was picked from a LB agar plate after transformation and cultured in 4 ml LB
medium containing ampicillin at 37 °C for 4 - 8 h. This culture was transferred into either 50 –
100 ml (Midi preparation) or 200 – 400 ml (Maxi preparation) LB medium containing ampicillin
and left growing over night in a shaker at 37 °C. Plasmids were purified with Midi- or Maxi-Kits
from Genomed, Qiagen, Promega or Invitrogen according to the manufacturer’s instructions.
2.2.4.2 Isolation of plasmid DNA fragments from agarose gels
Plasmid DNA was digested with the desired restriction enzymes and incubated at 37 °C for
more than 2 h. The restriction was loaded on a 0.8 – 1.4 % agarose gel and fragments were
seperated by electrophoresis at 100 – 130 V for 1 h. The desired bands were cut out and
isolated with the JetStar gel extraction kit (Genomed) according to the manufacturer´s
instructions.
MATERIAL & METHODS
37
2.2.4.3 Isolation of PCR products after restriction
To purify PCR products after restriction, the QIAquick PCR purification kit from Qiagen was
used according to the manufacturer`s protocol.
2.2.4.4 Standard cloning methods
2.2.4.4.1 Primer design
The use of perfect designed primers is essential for the specific amplification of the desired
DNA. Optimal primers have a CG content of 50-60 % and a melting temperature higher than
54°C to ensure highly specific amplification products. A “C” or “G” at the 3`-end can results in an
improved binding and elongation. Of course the primer sequences should be highly specific for
the amplificated product and the primer should not build up any secondary structures like
hairpins. Furthermore both primers should not be able to interact with each other, as well as a
primer should not be able to interact with itself.
Primers for cloning a DNA fragment additionally contained the desired restriction
enzyme site. To calculate the melting temperature of new designed primers, the “Oligo
Calculator” from the Dana-Farber Cancer Institute was used. Primer specificity was analyzed
with the help of “Basic Local Alignment Search Tool” (BLAST) on NCBI.
2.2.4.4.2 PCR for cloning of DNA fragments
To amplify DNA fragments for cloning, the PhusionTM High Fidelity polymerase (Finnzymes) was
used, which is a special proof reading polymerase and has a 3` - 5` proof reading / exonuclease
activity.
Standard reaction mix: template DNA 2-5 µl
Polymerase buffer 10 µl
Phusion polymerase 0,5 µl
dNTPs (2mM) 5 µl
primer fw (10µM) 3 µl
primer rev (10µM) 3 µl
ddH2O add to 50 µl
MATERIAL & METHODS
38
Standard PCR conditions: 1) initial denaturation 30 sec, 98 °C
2) denaturation 10 sec, 98 °C
3) annealing 30 sec, 45-59 °C primer dependent
4) elongation 30 sec / 1 kb, 72 °C → back to step 2, 30 cycles 5) final elongation 10min, 72 °C
6) store at 4 °C
For primer annealing, temperature should be 3 °C above the temperature of the lower primer
melting temperature.
For further cloning, PCR products were separated on a 0.8 - 1.4 % agarose gel by
electrophoresis (s. 2.2.4.4.3), excised and then eluted from the gel. Afterwards they were
digested with the appropriate restriction enzymes (s. 2.2.4.4.4).
2.2.4.4.3 Agarose gelelectrophoresis
DNA fragments from restrictions (s. 2.2.4.4.4) or cloning PCRs (s. 2.2.4.4.2) were separated for
analytical or preparative purpose via agarose gelelectrophoresis. The desired amount of
agarose (0.8 – 1.4 %) was added to 1xTAE buffer and then heated in a microwave until it was
completely dissolved. Ethidiumbromide was added in the concentration of 1 µg/100ml TAE to
enable the visibility of the DNA fragments under UV light. DNA samples were mixed with
6xDNA-Loading buffer and loaded into the pockets of the gel. As a marker, the 1kb DNA ladder
of Fermentas was used. Electrophoresis was performed at 90 - 120V for about 1 h. DNA bands
were visualized under UV light and then photographed and/or excised (s. 2.2.4.3).
2.2.4.4.4 Restriction
Restriction from plasmid DNA and PCR fragments was performed with an adequate restriction
endonuclease and the recommended buffer for approximately 3 h at 37°C.
Standard reaction mix: DNA 0,5-5 µg
10xbuffer 5 µl
Enzyme 0,5 µl
ddH2O add to 50µl
Digested DNA fragments from a vector were separated and analyzed by agarose
gelelectrophoresis (s. 2.2.4.4.3). Digested PCR products were purified with the QIAquick PCR
purification kit.
MATERIAL & METHODS
39
2.2.4.4.5 Ligation
Classical ligation was performed with T4-DNA-ligase (NEB) in a molar ratio of 1:3 (vector to
insert). The mixture was set up in a 10 μl volume, with 1 Unit T4-ligase and ~50 ng vector DNA.
The samples were incubated at RT over night.
2.2.4.4.6 Transformation (heat shock)
For transformation, chemical competent bacteria cells (DH5α) were used. These cells (stored at
-80 °C) were first thawed on ice for 10 min. Then 200ng of plasmid DNA or the 10 µl ligation
reaction were mixed with 100 µl of the bacteria in a reaction tube and the mixture was set on ice
for 30 min. Next, the tube was heat shocked for 2 min at 42 °C and cooled on ice. After addition
of 250 μl cold LB media (without ampicillin), the sample was incubated for 40 min at 37 °C. The
bacterial cells were centrifuged for 1 min at 7000 rpm and the supernatant was discarded. The
pellet was plated on LB agar plates and incubated at 37 °C o/n. The colonies were picked for
plasmid isolation (s. 2.2.4.1.1).
2.2.4.4.7 Sequencing
All sequencing work was done by SeqLab (Göttingen).
2.2.4.4.8 Cloning of hGAS2L3 WT and Delmut 1-5
For cloning human GAS2L3, the GAS2L3 mRNA sequence NM_174942 from NCBI was used
as template for primer design. As template for PCR reaction, cDNA from G2/M synchronized
T98G cells was used. GAS2L3 was cloned into the mammalian overexpression vector pCDNA3
carrying the EGFP sequence in front of the N-terminus. For cloning GAS2L3 Delmut 1-5,
pCDNA3-EGFP hGAS2L3 was used as template for PCR reaction. All forward primers carried a
BamHI restriction site, the reverse primers a XbaI restriction site (primer list s. 2.1.7.1).
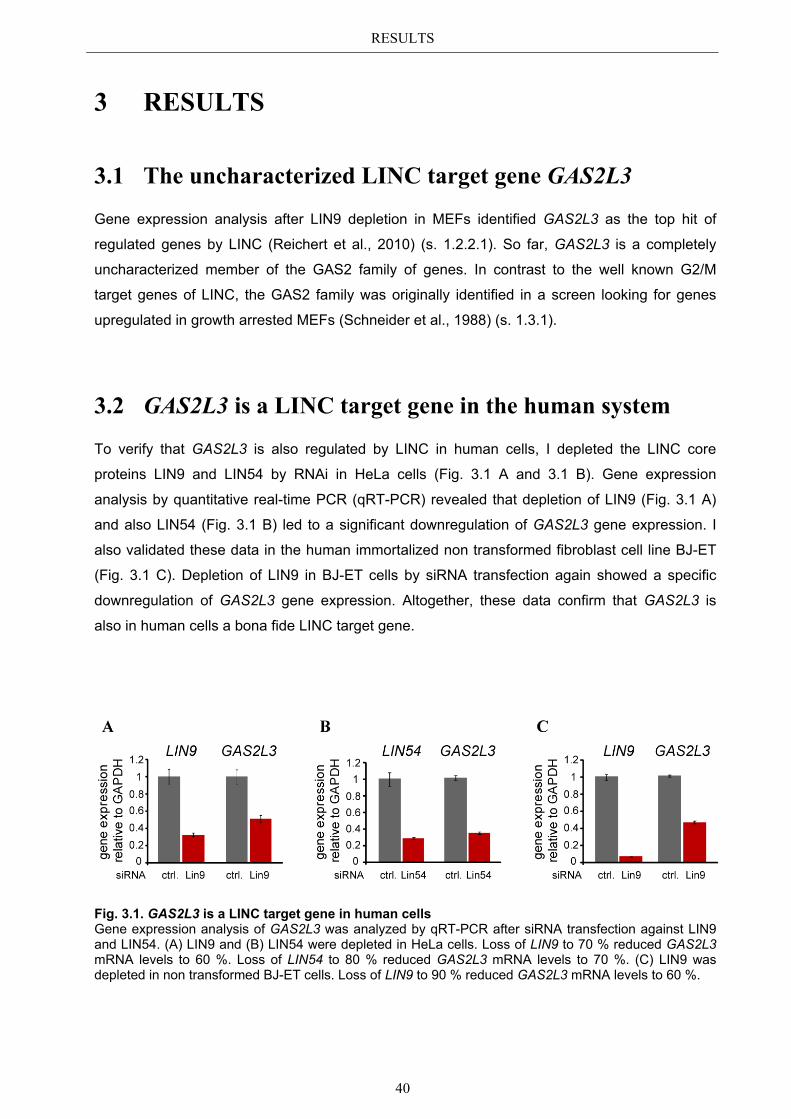
RESULTS
40
3 RESULTS
3.1 The uncharacterized LINC target gene GAS2L3
Gene expression analysis after LIN9 depletion in MEFs identified GAS2L3 as the top hit of
regulated genes by LINC (Reichert et al., 2010) (s. 1.2.2.1). So far, GAS2L3 is a completely
uncharacterized member of the GAS2 family of genes. In contrast to the well known G2/M
target genes of LINC, the GAS2 family was originally identified in a screen looking for genes
upregulated in growth arrested MEFs (Schneider et al., 1988) (s. 1.3.1).
3.2 GAS2L3 is a LINC target gene in the human system
To verify that GAS2L3 is also regulated by LINC in human cells, I depleted the LINC core
proteins LIN9 and LIN54 by RNAi in HeLa cells (Fig. 3.1 A and 3.1 B). Gene expression
analysis by quantitative real-time PCR (qRT-PCR) revealed that depletion of LIN9 (Fig. 3.1 A)
and also LIN54 (Fig. 3.1 B) led to a significant downregulation of GAS2L3 gene expression. I
also validated these data in the human immortalized non transformed fibroblast cell line BJ-ET
(Fig. 3.1 C). Depletion of LIN9 in BJ-ET cells by siRNA transfection again showed a specific
downregulation of GAS2L3 gene expression. Altogether, these data confirm that GAS2L3 is
also in human cells a bona fide LINC target gene.
Fig. 3.1. GAS2L3 is a LINC target gene in human cells Gene expression analysis of GAS2L3 was analyzed by qRT-PCR after siRNA transfection against LIN9 and LIN54. (A) LIN9 and (B) LIN54 were depleted in HeLa cells. Loss of LIN9 to 70 % reduced GAS2L3 mRNA levels to 60 %. Loss of LIN54 to 80 % reduced GAS2L3 mRNA levels to 70 %. (C) LIN9 was depleted in non transformed BJ-ET cells. Loss of LIN9 to 90 % reduced GAS2L3 mRNA levels to 60 %.
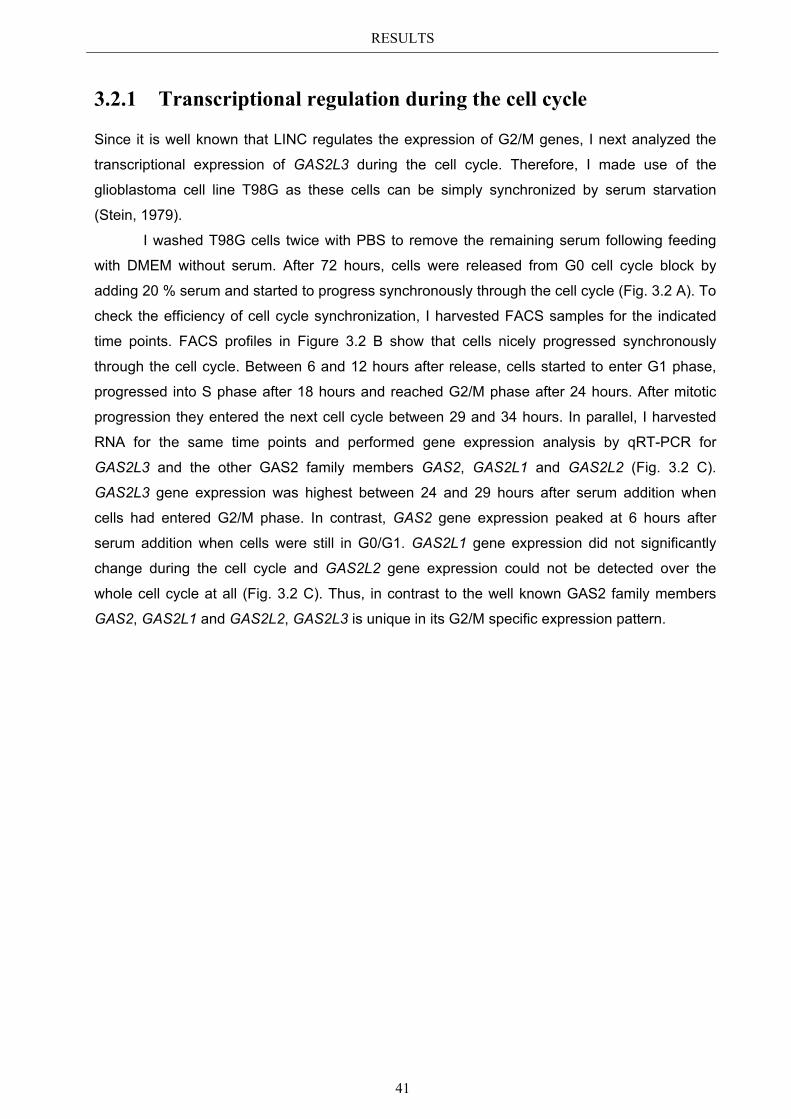
RESULTS
41
3.2.1 Transcriptional regulation during the cell cycle
Since it is well known that LINC regulates the expression of G2/M genes, I next analyzed the
transcriptional expression of GAS2L3 during the cell cycle. Therefore, I made use of the
glioblastoma cell line T98G as these cells can be simply synchronized by serum starvation
(Stein, 1979).
I washed T98G cells twice with PBS to remove the remaining serum following feeding
with DMEM without serum. After 72 hours, cells were released from G0 cell cycle block by
adding 20 % serum and started to progress synchronously through the cell cycle (Fig. 3.2 A). To
check the efficiency of cell cycle synchronization, I harvested FACS samples for the indicated
time points. FACS profiles in Figure 3.2 B show that cells nicely progressed synchronously
through the cell cycle. Between 6 and 12 hours after release, cells started to enter G1 phase,
progressed into S phase after 18 hours and reached G2/M phase after 24 hours. After mitotic
progression they entered the next cell cycle between 29 and 34 hours. In parallel, I harvested
RNA for the same time points and performed gene expression analysis by qRT-PCR for
GAS2L3 and the other GAS2 family members GAS2, GAS2L1 and GAS2L2 (Fig. 3.2 C).
GAS2L3 gene expression was highest between 24 and 29 hours after serum addition when
cells had entered G2/M phase. In contrast, GAS2 gene expression peaked at 6 hours after
serum addition when cells were still in G0/G1. GAS2L1 gene expression did not significantly
change during the cell cycle and GAS2L2 gene expression could not be detected over the
whole cell cycle at all (Fig. 3.2 C). Thus, in contrast to the well known GAS2 family members
GAS2, GAS2L1 and GAS2L2, GAS2L3 is unique in its G2/M specific expression pattern.
RESULTS
42
Fig. 3.2. GAS2L3 is a G2/M regulated gene Gene expression analysis of GAS2L3 and the other GAS2 family members was performed in synchronized T98G cells by qRT-PCR. (A) Scheme of the experimental set up. (B) T98G cell synchronization was confirmed by FACS analysis at the indicated time points. (C) GAS2L3 is transcriptionally activated during G2/M phase. GAS2 gene expression peaks in G0/G1 phase. GAS2L1 gene expression is not regulated at all during the cell cycle.
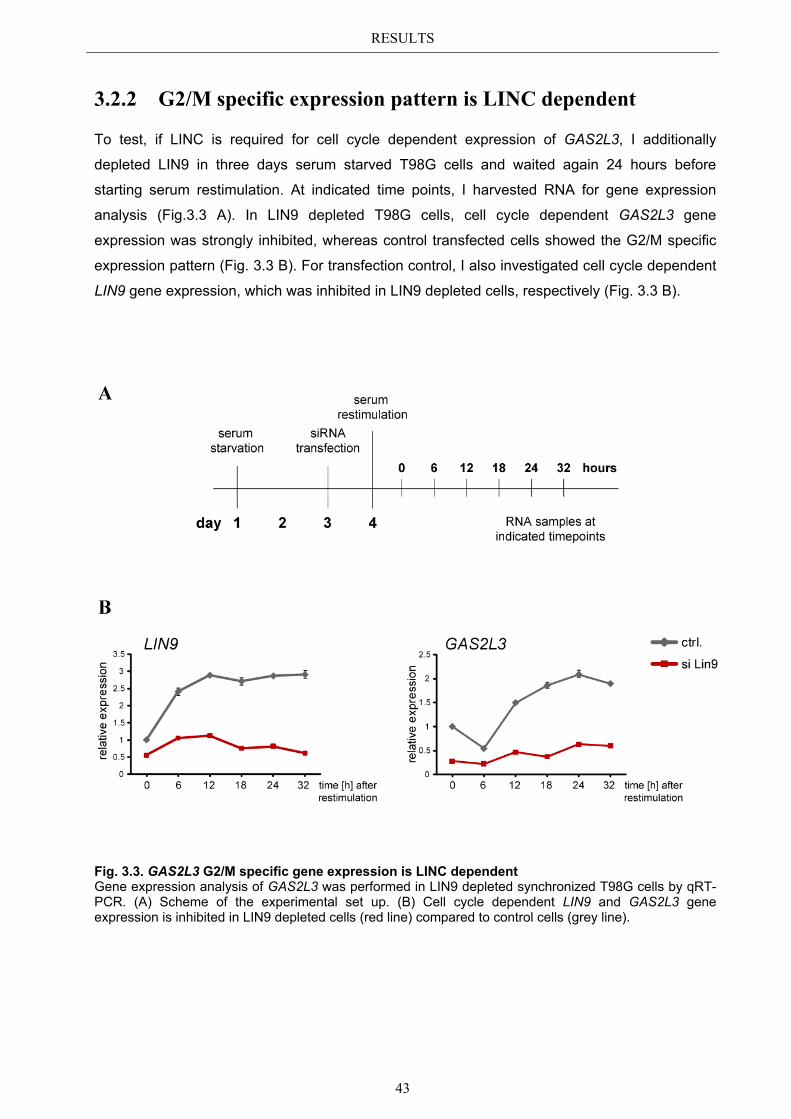
RESULTS
43
3.2.2 G2/M specific expression pattern is LINC dependent
To test, if LINC is required for cell cycle dependent expression of GAS2L3, I additionally
depleted LIN9 in three days serum starved T98G cells and waited again 24 hours before
starting serum restimulation. At indicated time points, I harvested RNA for gene expression
analysis (Fig.3.3 A). In LIN9 depleted T98G cells, cell cycle dependent GAS2L3 gene
expression was strongly inhibited, whereas control transfected cells showed the G2/M specific
expression pattern (Fig. 3.3 B). For transfection control, I also investigated cell cycle dependent
LIN9 gene expression, which was inhibited in LIN9 depleted cells, respectively (Fig. 3.3 B).
Fig. 3.3. GAS2L3 G2/M specific gene expression is LINC dependent Gene expression analysis of GAS2L3 was performed in LIN9 depleted synchronized T98G cells by qRT-PCR. (A) Scheme of the experimental set up. (B) Cell cycle dependent LIN9 and GAS2L3 gene expression is inhibited in LIN9 depleted cells (red line) compared to control cells (grey line).
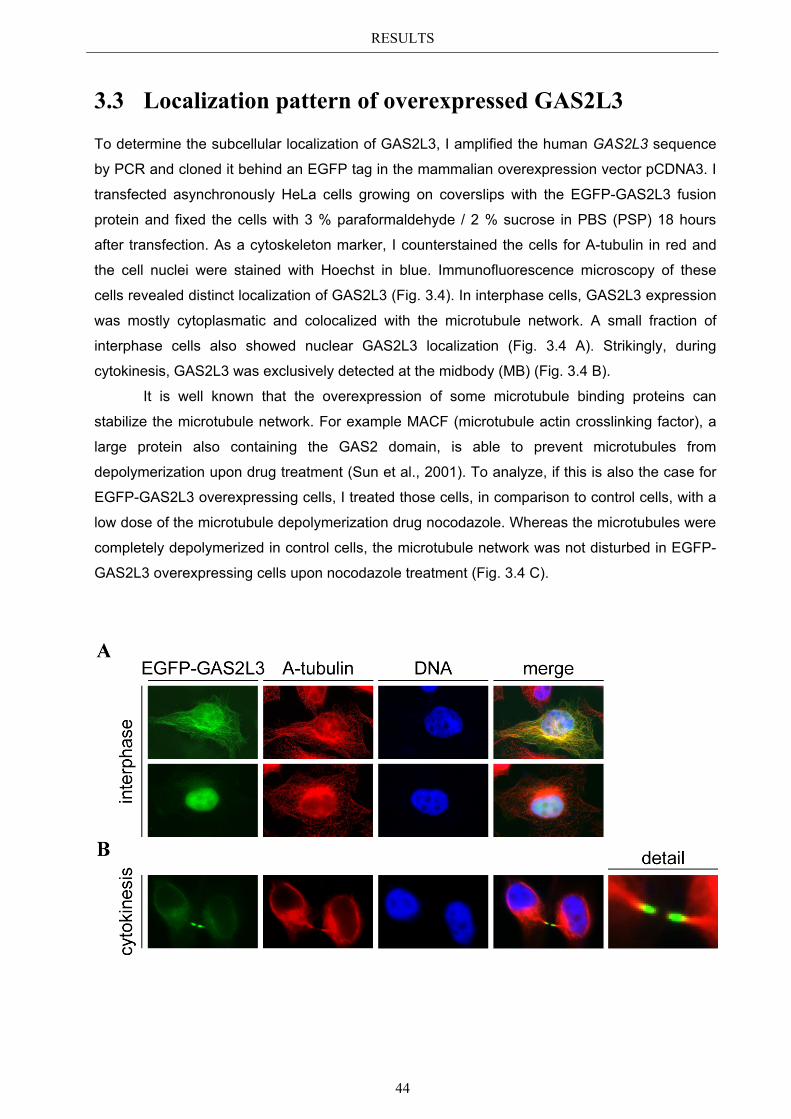
RESULTS
44
3.3 Localization pattern of overexpressed GAS2L3
To determine the subcellular localization of GAS2L3, I amplified the human GAS2L3 sequence
by PCR and cloned it behind an EGFP tag in the mammalian overexpression vector pCDNA3. I
transfected asynchronously HeLa cells growing on coverslips with the EGFP-GAS2L3 fusion
protein and fixed the cells with 3 % paraformaldehyde / 2 % sucrose in PBS (PSP) 18 hours
after transfection. As a cytoskeleton marker, I counterstained the cells for A-tubulin in red and
the cell nuclei were stained with Hoechst in blue. Immunofluorescence microscopy of these
cells revealed distinct localization of GAS2L3 (Fig. 3.4). In interphase cells, GAS2L3 expression
was mostly cytoplasmatic and colocalized with the microtubule network. A small fraction of
interphase cells also showed nuclear GAS2L3 localization (Fig. 3.4 A). Strikingly, during
cytokinesis, GAS2L3 was exclusively detected at the midbody (MB) (Fig. 3.4 B).
It is well known that the overexpression of some microtubule binding proteins can
stabilize the microtubule network. For example MACF (microtubule actin crosslinking factor), a
large protein also containing the GAS2 domain, is able to prevent microtubules from
depolymerization upon drug treatment (Sun et al., 2001). To analyze, if this is also the case for
EGFP-GAS2L3 overexpressing cells, I treated those cells, in comparison to control cells, with a
low dose of the microtubule depolymerization drug nocodazole. Whereas the microtubules were
completely depolymerized in control cells, the microtubule network was not disturbed in EGFP-
GAS2L3 overexpressing cells upon nocodazole treatment (Fig. 3.4 C).
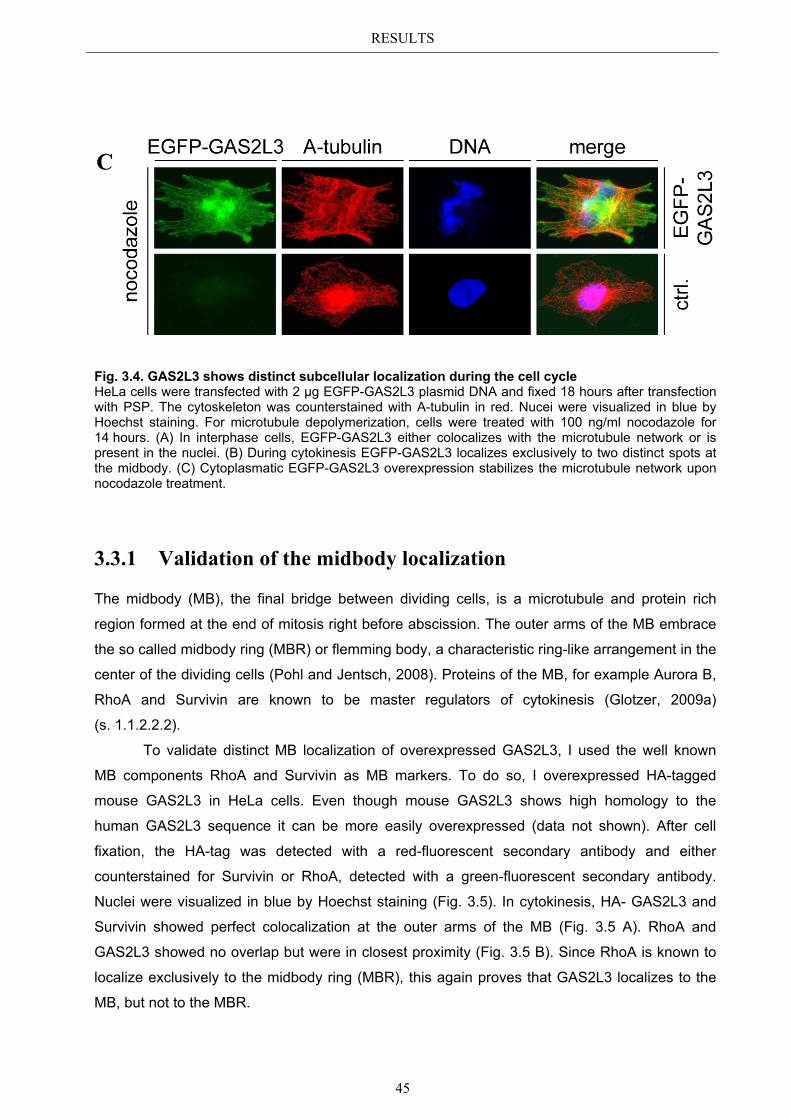
RESULTS
45
Fig. 3.4. GAS2L3 shows distinct subcellular localization during the cell cycle HeLa cells were transfected with 2 µg EGFP-GAS2L3 plasmid DNA and fixed 18 hours after transfection with PSP. The cytoskeleton was counterstained with A-tubulin in red. Nucei were visualized in blue by Hoechst staining. For microtubule depolymerization, cells were treated with 100 ng/ml nocodazole for 14 hours. (A) In interphase cells, EGFP-GAS2L3 either colocalizes with the microtubule network or is present in the nuclei. (B) During cytokinesis EGFP-GAS2L3 localizes exclusively to two distinct spots at the midbody. (C) Cytoplasmatic EGFP-GAS2L3 overexpression stabilizes the microtubule network upon nocodazole treatment.
3.3.1 Validation of the midbody localization
The midbody (MB), the final bridge between dividing cells, is a microtubule and protein rich
region formed at the end of mitosis right before abscission. The outer arms of the MB embrace
the so called midbody ring (MBR) or flemming body, a characteristic ring-like arrangement in the
center of the dividing cells (Pohl and Jentsch, 2008). Proteins of the MB, for example Aurora B,
RhoA and Survivin are known to be master regulators of cytokinesis (Glotzer, 2009a)
(s. 1.1.2.2.2).
To validate distinct MB localization of overexpressed GAS2L3, I used the well known
MB components RhoA and Survivin as MB markers. To do so, I overexpressed HA-tagged
mouse GAS2L3 in HeLa cells. Even though mouse GAS2L3 shows high homology to the
human GAS2L3 sequence it can be more easily overexpressed (data not shown). After cell
fixation, the HA-tag was detected with a red-fluorescent secondary antibody and either
counterstained for Survivin or RhoA, detected with a green-fluorescent secondary antibody.
Nuclei were visualized in blue by Hoechst staining (Fig. 3.5). In cytokinesis, HA- GAS2L3 and
Survivin showed perfect colocalization at the outer arms of the MB (Fig. 3.5 A). RhoA and
GAS2L3 showed no overlap but were in closest proximity (Fig. 3.5 B). Since RhoA is known to
localize exclusively to the midbody ring (MBR), this again proves that GAS2L3 localizes to the
MB, but not to the MBR.
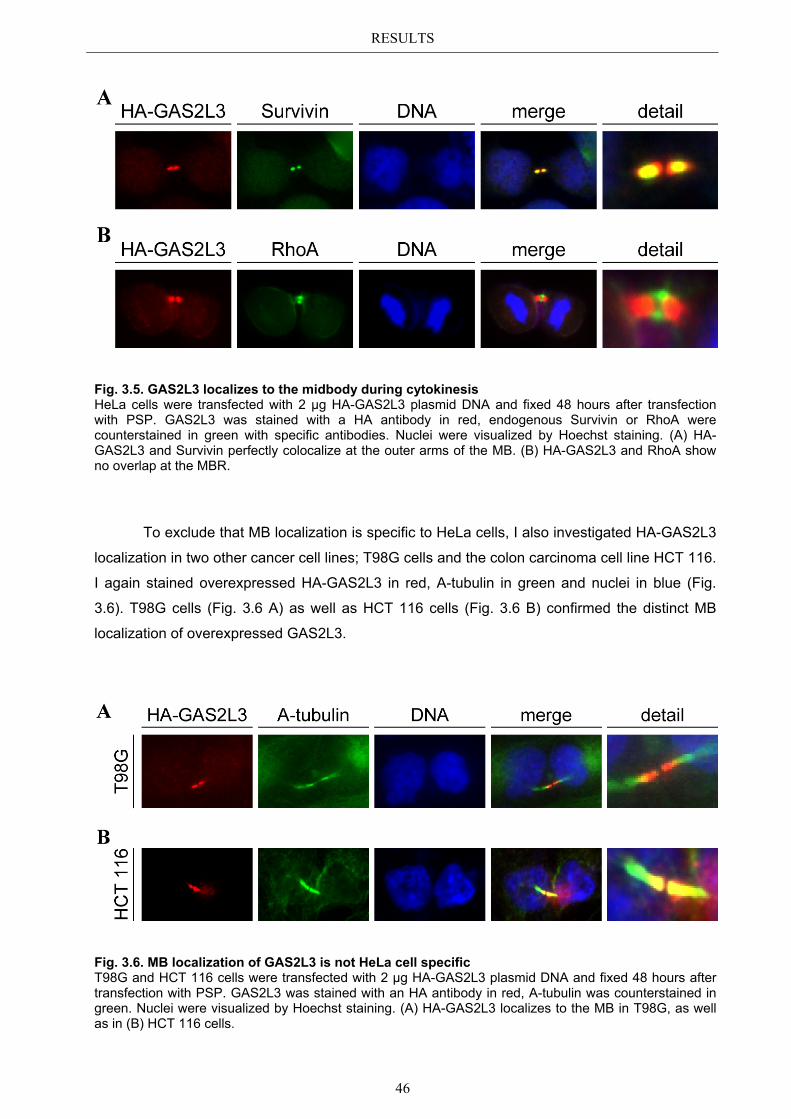
RESULTS
46
Fig. 3.5. GAS2L3 localizes to the midbody during cytokinesis HeLa cells were transfected with 2 µg HA-GAS2L3 plasmid DNA and fixed 48 hours after transfection with PSP. GAS2L3 was stained with a HA antibody in red, endogenous Survivin or RhoA were counterstained in green with specific antibodies. Nuclei were visualized by Hoechst staining. (A) HA-GAS2L3 and Survivin perfectly colocalize at the outer arms of the MB. (B) HA-GAS2L3 and RhoA show no overlap at the MBR.
To exclude that MB localization is specific to HeLa cells, I also investigated HA-GAS2L3
localization in two other cancer cell lines; T98G cells and the colon carcinoma cell line HCT 116.
I again stained overexpressed HA-GAS2L3 in red, A-tubulin in green and nuclei in blue (Fig.
3.6). T98G cells (Fig. 3.6 A) as well as HCT 116 cells (Fig. 3.6 B) confirmed the distinct MB
localization of overexpressed GAS2L3.
Fig. 3.6. MB localization of GAS2L3 is not HeLa cell specific T98G and HCT 116 cells were transfected with 2 µg HA-GAS2L3 plasmid DNA and fixed 48 hours after transfection with PSP. GAS2L3 was stained with an HA antibody in red, A-tubulin was counterstained in green. Nuclei were visualized by Hoechst staining. (A) HA-GAS2L3 localizes to the MB in T98G, as well as in (B) HCT 116 cells.
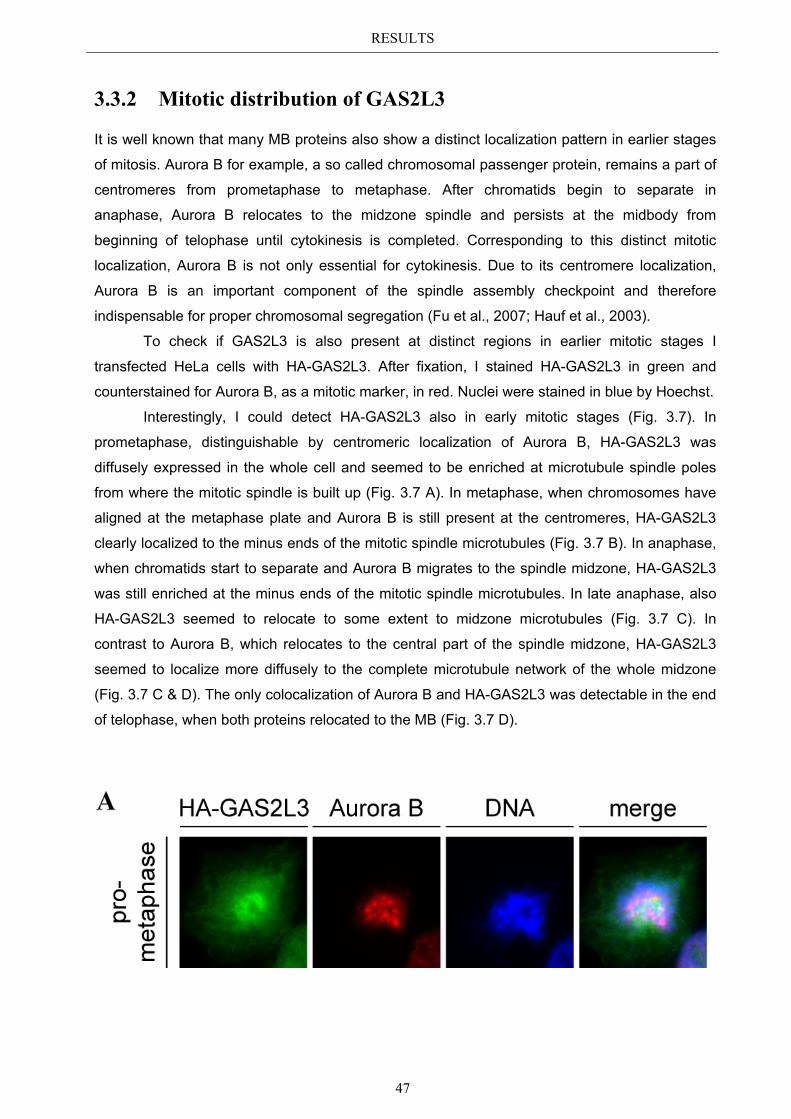
RESULTS
47
3.3.2 Mitotic distribution of GAS2L3
It is well known that many MB proteins also show a distinct localization pattern in earlier stages
of mitosis. Aurora B for example, a so called chromosomal passenger protein, remains a part of
centromeres from prometaphase to metaphase. After chromatids begin to separate in
anaphase, Aurora B relocates to the midzone spindle and persists at the midbody from
beginning of telophase until cytokinesis is completed. Corresponding to this distinct mitotic
localization, Aurora B is not only essential for cytokinesis. Due to its centromere localization,
Aurora B is an important component of the spindle assembly checkpoint and therefore
indispensable for proper chromosomal segregation (Fu et al., 2007; Hauf et al., 2003).
To check if GAS2L3 is also present at distinct regions in earlier mitotic stages I
transfected HeLa cells with HA-GAS2L3. After fixation, I stained HA-GAS2L3 in green and
counterstained for Aurora B, as a mitotic marker, in red. Nuclei were stained in blue by Hoechst.
Interestingly, I could detect HA-GAS2L3 also in early mitotic stages (Fig. 3.7). In
prometaphase, distinguishable by centromeric localization of Aurora B, HA-GAS2L3 was
diffusely expressed in the whole cell and seemed to be enriched at microtubule spindle poles
from where the mitotic spindle is built up (Fig. 3.7 A). In metaphase, when chromosomes have
aligned at the metaphase plate and Aurora B is still present at the centromeres, HA-GAS2L3
clearly localized to the minus ends of the mitotic spindle microtubules (Fig. 3.7 B). In anaphase,
when chromatids start to separate and Aurora B migrates to the spindle midzone, HA-GAS2L3
was still enriched at the minus ends of the mitotic spindle microtubules. In late anaphase, also
HA-GAS2L3 seemed to relocate to some extent to midzone microtubules (Fig. 3.7 C). In
contrast to Aurora B, which relocates to the central part of the spindle midzone, HA-GAS2L3
seemed to localize more diffusely to the complete microtubule network of the whole midzone
(Fig. 3.7 C & D). The only colocalization of Aurora B and HA-GAS2L3 was detectable in the end
of telophase, when both proteins relocated to the MB (Fig. 3.7 D).
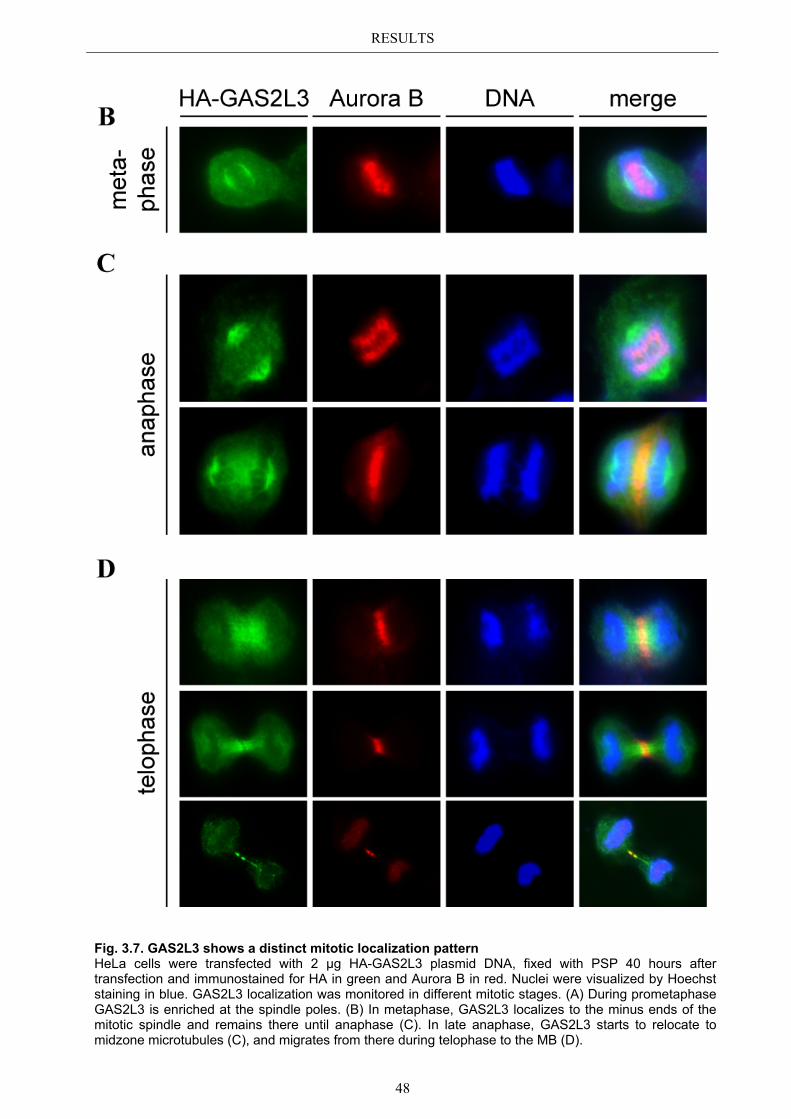
RESULTS
48
Fig. 3.7. GAS2L3 shows a distinct mitotic localization pattern HeLa cells were transfected with 2 µg HA-GAS2L3 plasmid DNA, fixed with PSP 40 hours after transfection and immunostained for HA in green and Aurora B in red. Nuclei were visualized by Hoechst staining in blue. GAS2L3 localization was monitored in different mitotic stages. (A) During prometaphase GAS2L3 is enriched at the spindle poles. (B) In metaphase, GAS2L3 localizes to the minus ends of the mitotic spindle and remains there until anaphase (C). In late anaphase, GAS2L3 starts to relocate to midzone microtubules (C), and migrates from there during telophase to the MB (D).
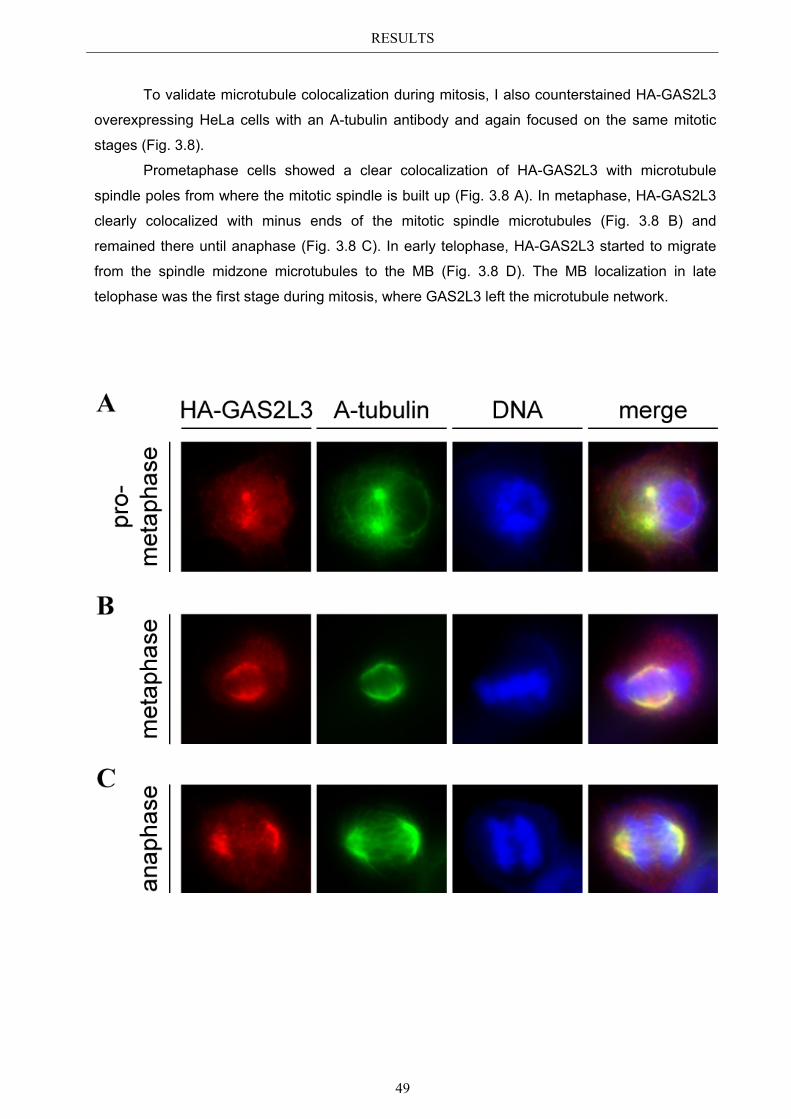
RESULTS
49
To validate microtubule colocalization during mitosis, I also counterstained HA-GAS2L3
overexpressing HeLa cells with an A-tubulin antibody and again focused on the same mitotic
stages (Fig. 3.8).
Prometaphase cells showed a clear colocalization of HA-GAS2L3 with microtubule
spindle poles from where the mitotic spindle is built up (Fig. 3.8 A). In metaphase, HA-GAS2L3
clearly colocalized with minus ends of the mitotic spindle microtubules (Fig. 3.8 B) and
remained there until anaphase (Fig. 3.8 C). In early telophase, HA-GAS2L3 started to migrate
from the spindle midzone microtubules to the MB (Fig. 3.8 D). The MB localization in late
telophase was the first stage during mitosis, where GAS2L3 left the microtubule network.
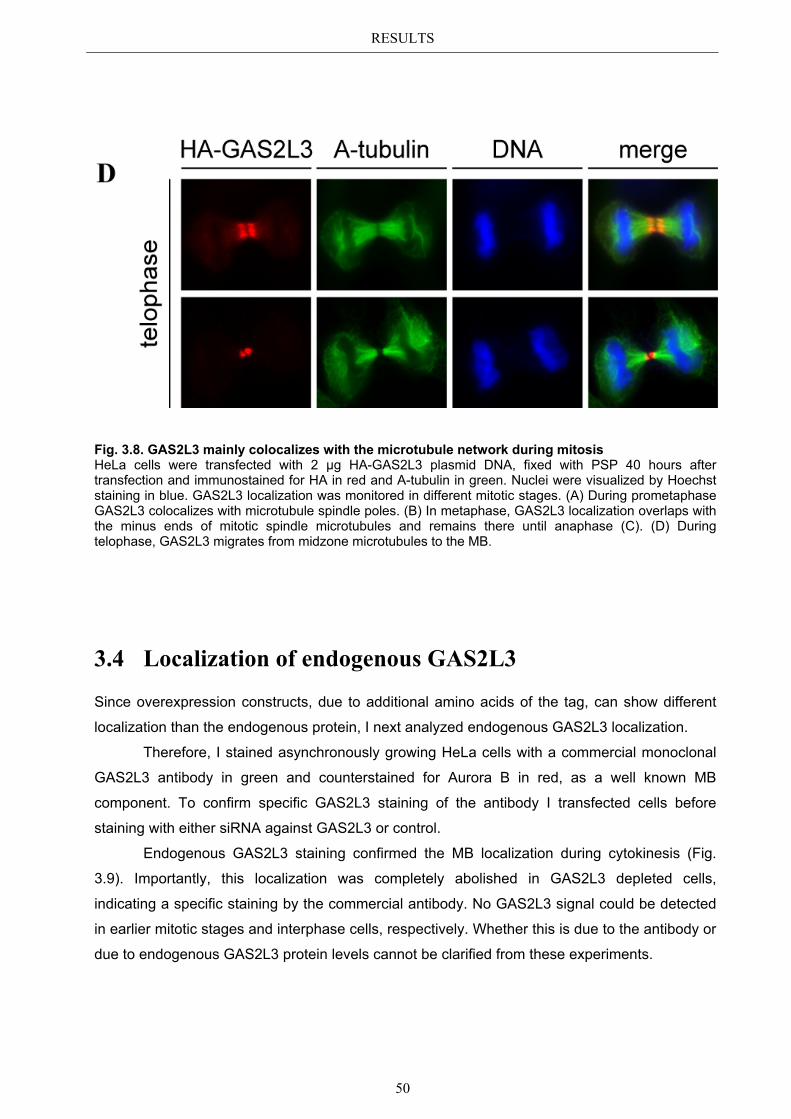
RESULTS
50
Fig. 3.8. GAS2L3 mainly colocalizes with the microtubule network during mitosis HeLa cells were transfected with 2 µg HA-GAS2L3 plasmid DNA, fixed with PSP 40 hours after transfection and immunostained for HA in red and A-tubulin in green. Nuclei were visualized by Hoechst staining in blue. GAS2L3 localization was monitored in different mitotic stages. (A) During prometaphase GAS2L3 colocalizes with microtubule spindle poles. (B) In metaphase, GAS2L3 localization overlaps with the minus ends of mitotic spindle microtubules and remains there until anaphase (C). (D) During telophase, GAS2L3 migrates from midzone microtubules to the MB.
3.4 Localization of endogenous GAS2L3
Since overexpression constructs, due to additional amino acids of the tag, can show different
localization than the endogenous protein, I next analyzed endogenous GAS2L3 localization.
Therefore, I stained asynchronously growing HeLa cells with a commercial monoclonal
GAS2L3 antibody in green and counterstained for Aurora B in red, as a well known MB
component. To confirm specific GAS2L3 staining of the antibody I transfected cells before
staining with either siRNA against GAS2L3 or control.
Endogenous GAS2L3 staining confirmed the MB localization during cytokinesis (Fig.
3.9). Importantly, this localization was completely abolished in GAS2L3 depleted cells,
indicating a specific staining by the commercial antibody. No GAS2L3 signal could be detected
in earlier mitotic stages and interphase cells, respectively. Whether this is due to the antibody or
due to endogenous GAS2L3 protein levels cannot be clarified from these experiments.
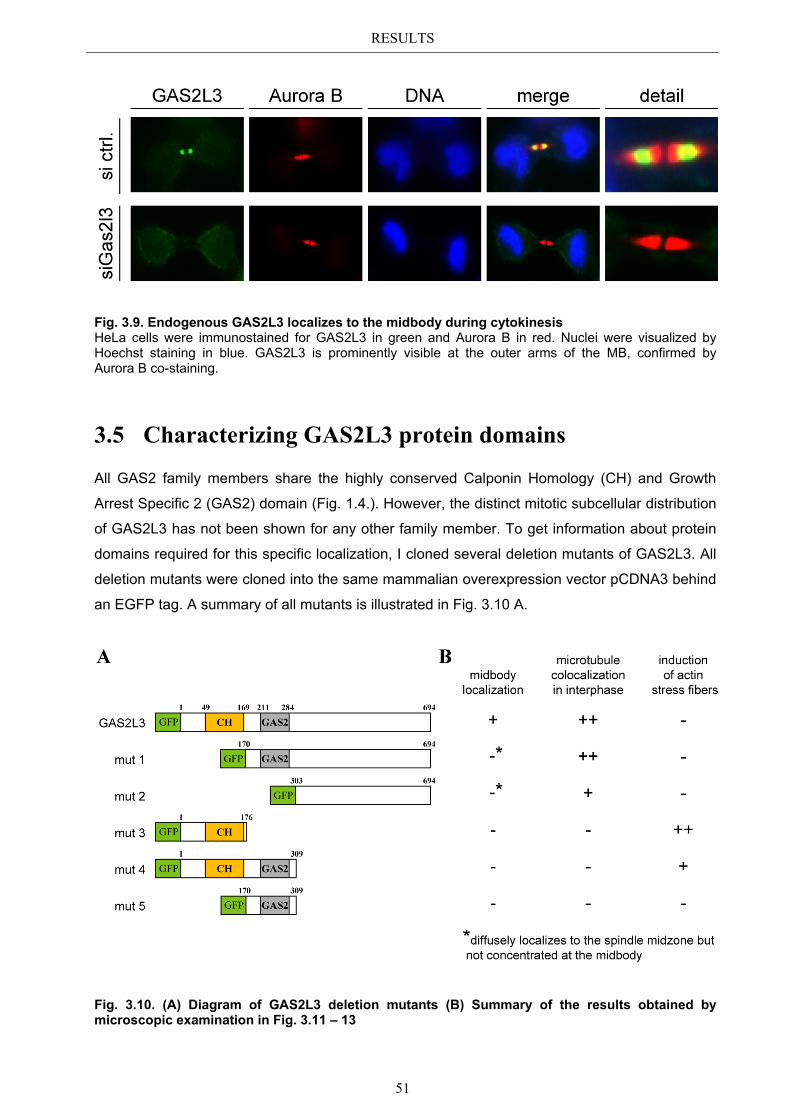
RESULTS
51
Fig. 3.9. Endogenous GAS2L3 localizes to the midbody during cytokinesis HeLa cells were immunostained for GAS2L3 in green and Aurora B in red. Nuclei were visualized by Hoechst staining in blue. GAS2L3 is prominently visible at the outer arms of the MB, confirmed by Aurora B co-staining.
3.5 Characterizing GAS2L3 protein domains
All GAS2 family members share the highly conserved Calponin Homology (CH) and Growth
Arrest Specific 2 (GAS2) domain (Fig. 1.4.). However, the distinct mitotic subcellular distribution
of GAS2L3 has not been shown for any other family member. To get information about protein
domains required for this specific localization, I cloned several deletion mutants of GAS2L3. All
deletion mutants were cloned into the same mammalian overexpression vector pCDNA3 behind
an EGFP tag. A summary of all mutants is illustrated in Fig. 3.10 A.
Fig. 3.10. (A) Diagram of GAS2L3 deletion mutants (B) Summary of the results obtained by microscopic examination in Fig. 3.11 – 13
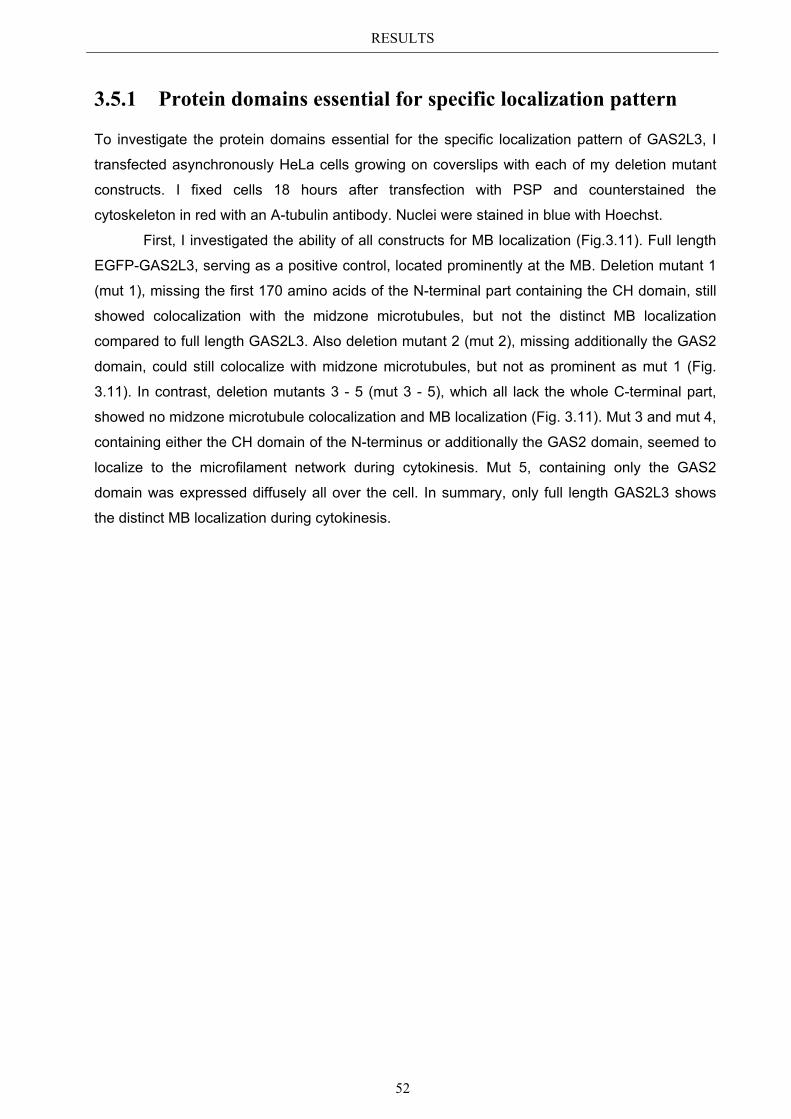
RESULTS
52
3.5.1 Protein domains essential for specific localization pattern
To investigate the protein domains essential for the specific localization pattern of GAS2L3, I
transfected asynchronously HeLa cells growing on coverslips with each of my deletion mutant
constructs. I fixed cells 18 hours after transfection with PSP and counterstained the
cytoskeleton in red with an A-tubulin antibody. Nuclei were stained in blue with Hoechst.
First, I investigated the ability of all constructs for MB localization (Fig.3.11). Full length
EGFP-GAS2L3, serving as a positive control, located prominently at the MB. Deletion mutant 1
(mut 1), missing the first 170 amino acids of the N-terminal part containing the CH domain, still
showed colocalization with the midzone microtubules, but not the distinct MB localization
compared to full length GAS2L3. Also deletion mutant 2 (mut 2), missing additionally the GAS2
domain, could still colocalize with midzone microtubules, but not as prominent as mut 1 (Fig.
3.11). In contrast, deletion mutants 3 - 5 (mut 3 - 5), which all lack the whole C-terminal part,
showed no midzone microtubule colocalization and MB localization (Fig. 3.11). Mut 3 and mut 4,
containing either the CH domain of the N-terminus or additionally the GAS2 domain, seemed to
localize to the microfilament network during cytokinesis. Mut 5, containing only the GAS2
domain was expressed diffusely all over the cell. In summary, only full length GAS2L3 shows
the distinct MB localization during cytokinesis.
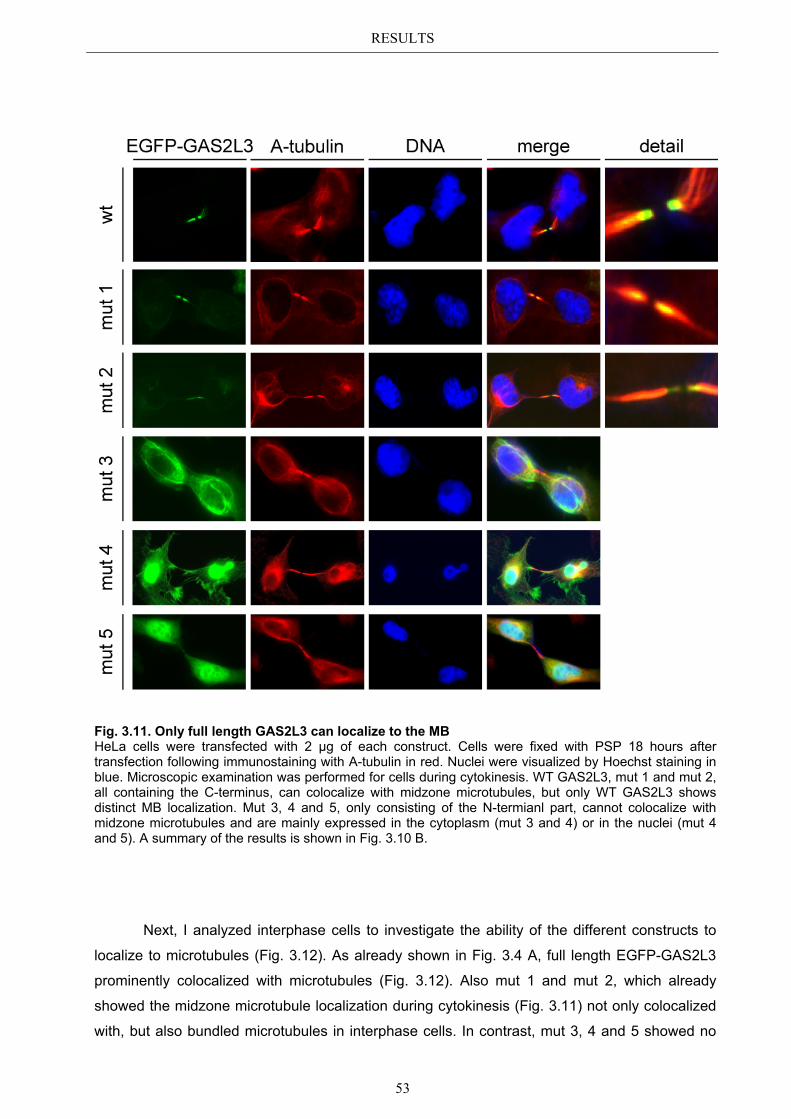
RESULTS
53
Fig. 3.11. Only full length GAS2L3 can localize to the MB HeLa cells were transfected with 2 µg of each construct. Cells were fixed with PSP 18 hours after transfection following immunostaining with A-tubulin in red. Nuclei were visualized by Hoechst staining in blue. Microscopic examination was performed for cells during cytokinesis. WT GAS2L3, mut 1 and mut 2, all containing the C-terminus, can colocalize with midzone microtubules, but only WT GAS2L3 shows distinct MB localization. Mut 3, 4 and 5, only consisting of the N-termianl part, cannot colocalize with midzone microtubules and are mainly expressed in the cytoplasm (mut 3 and 4) or in the nuclei (mut 4 and 5). A summary of the results is shown in Fig. 3.10 B.
Next, I analyzed interphase cells to investigate the ability of the different constructs to
localize to microtubules (Fig. 3.12). As already shown in Fig. 3.4 A, full length EGFP-GAS2L3
prominently colocalized with microtubules (Fig. 3.12). Also mut 1 and mut 2, which already
showed the midzone microtubule localization during cytokinesis (Fig. 3.11) not only colocalized
with, but also bundled microtubules in interphase cells. In contrast, mut 3, 4 and 5 showed no
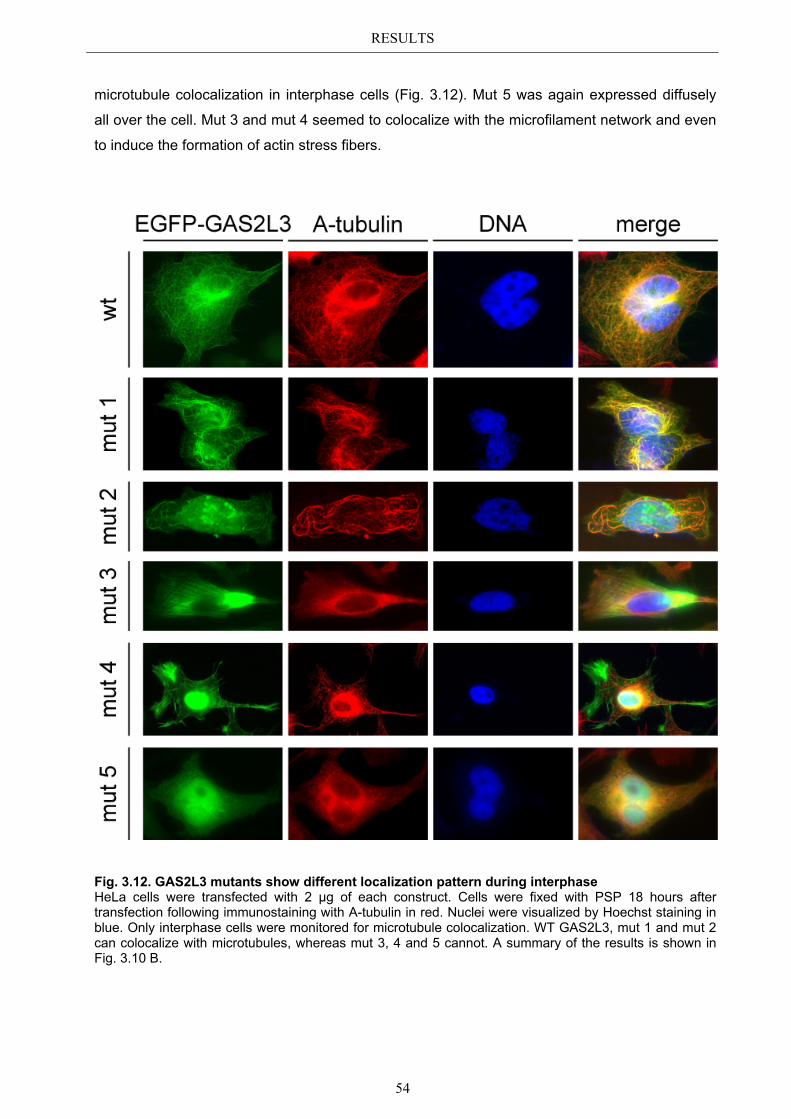
RESULTS
54
microtubule colocalization in interphase cells (Fig. 3.12). Mut 5 was again expressed diffusely
all over the cell. Mut 3 and mut 4 seemed to colocalize with the microfilament network and even
to induce the formation of actin stress fibers.
Fig. 3.12. GAS2L3 mutants show different localization pattern during interphase HeLa cells were transfected with 2 µg of each construct. Cells were fixed with PSP 18 hours after transfection following immunostaining with A-tubulin in red. Nuclei were visualized by Hoechst staining in blue. Only interphase cells were monitored for microtubule colocalization. WT GAS2L3, mut 1 and mut 2 can colocalize with microtubules, whereas mut 3, 4 and 5 cannot. A summary of the results is shown in Fig. 3.10 B.
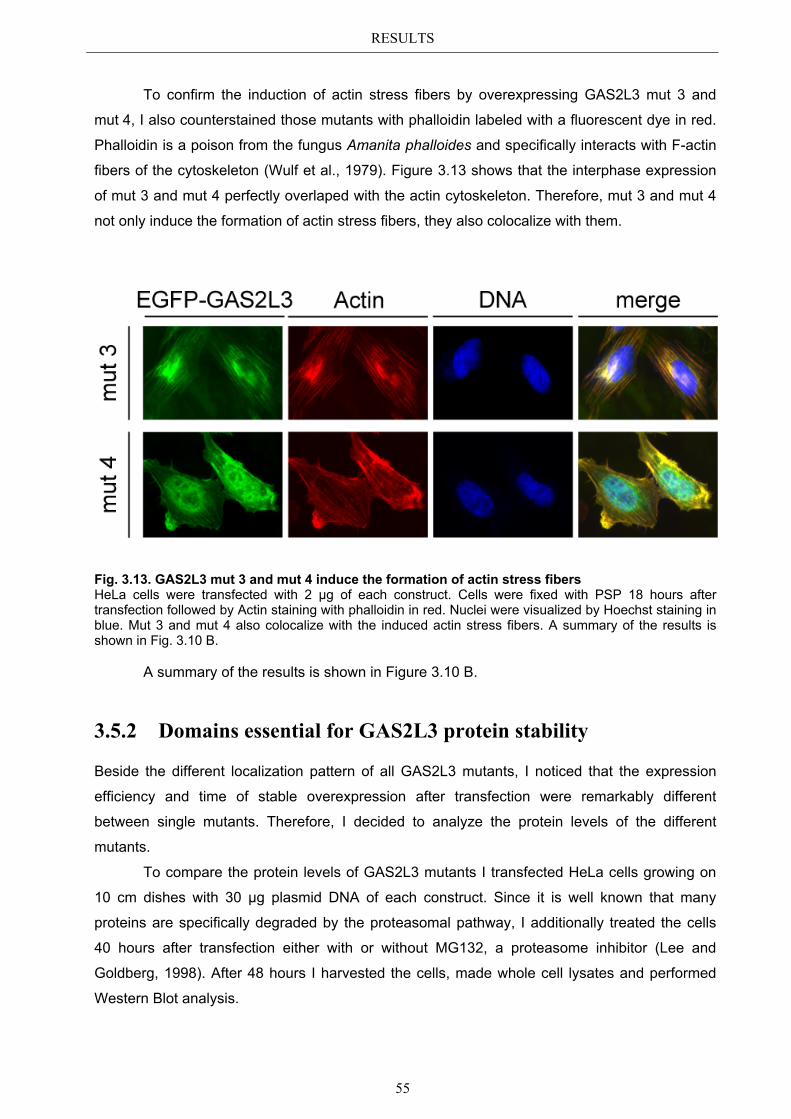
RESULTS
55
To confirm the induction of actin stress fibers by overexpressing GAS2L3 mut 3 and
mut 4, I also counterstained those mutants with phalloidin labeled with a fluorescent dye in red.
Phalloidin is a poison from the fungus Amanita phalloides and specifically interacts with F-actin
fibers of the cytoskeleton (Wulf et al., 1979). Figure 3.13 shows that the interphase expression
of mut 3 and mut 4 perfectly overlaped with the actin cytoskeleton. Therefore, mut 3 and mut 4
not only induce the formation of actin stress fibers, they also colocalize with them.
Fig. 3.13. GAS2L3 mut 3 and mut 4 induce the formation of actin stress fibers HeLa cells were transfected with 2 µg of each construct. Cells were fixed with PSP 18 hours after transfection followed by Actin staining with phalloidin in red. Nuclei were visualized by Hoechst staining in blue. Mut 3 and mut 4 also colocalize with the induced actin stress fibers. A summary of the results is shown in Fig. 3.10 B.
A summary of the results is shown in Figure 3.10 B.
3.5.2 Domains essential for GAS2L3 protein stability
Beside the different localization pattern of all GAS2L3 mutants, I noticed that the expression
efficiency and time of stable overexpression after transfection were remarkably different
between single mutants. Therefore, I decided to analyze the protein levels of the different
mutants.
To compare the protein levels of GAS2L3 mutants I transfected HeLa cells growing on
10 cm dishes with 30 µg plasmid DNA of each construct. Since it is well known that many
proteins are specifically degraded by the proteasomal pathway, I additionally treated the cells
40 hours after transfection either with or without MG132, a proteasome inhibitor (Lee and
Goldberg, 1998). After 48 hours I harvested the cells, made whole cell lysates and performed
Western Blot analysis.
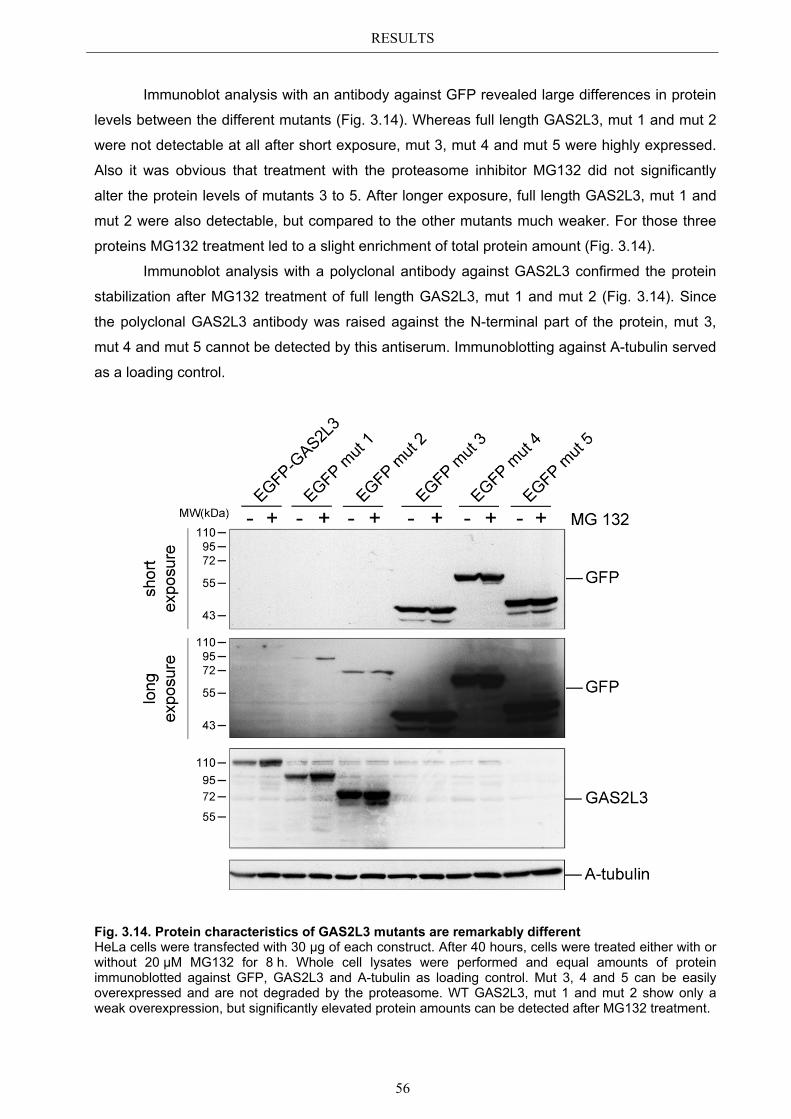
RESULTS
56
Immunoblot analysis with an antibody against GFP revealed large differences in protein
levels between the different mutants (Fig. 3.14). Whereas full length GAS2L3, mut 1 and mut 2
were not detectable at all after short exposure, mut 3, mut 4 and mut 5 were highly expressed.
Also it was obvious that treatment with the proteasome inhibitor MG132 did not significantly
alter the protein levels of mutants 3 to 5. After longer exposure, full length GAS2L3, mut 1 and
mut 2 were also detectable, but compared to the other mutants much weaker. For those three
proteins MG132 treatment led to a slight enrichment of total protein amount (Fig. 3.14).
Immunoblot analysis with a polyclonal antibody against GAS2L3 confirmed the protein
stabilization after MG132 treatment of full length GAS2L3, mut 1 and mut 2 (Fig. 3.14). Since
the polyclonal GAS2L3 antibody was raised against the N-terminal part of the protein, mut 3,
mut 4 and mut 5 cannot be detected by this antiserum. Immunoblotting against A-tubulin served
as a loading control.
Fig. 3.14. Protein characteristics of GAS2L3 mutants are remarkably different HeLa cells were transfected with 30 µg of each construct. After 40 hours, cells were treated either with or without 20 µM MG132 for 8 h. Whole cell lysates were performed and equal amounts of protein immunoblotted against GFP, GAS2L3 and A-tubulin as loading control. Mut 3, 4 and 5 can be easily overexpressed and are not degraded by the proteasome. WT GAS2L3, mut 1 and mut 2 show only a weak overexpression, but significantly elevated protein amounts can be detected after MG132 treatment.
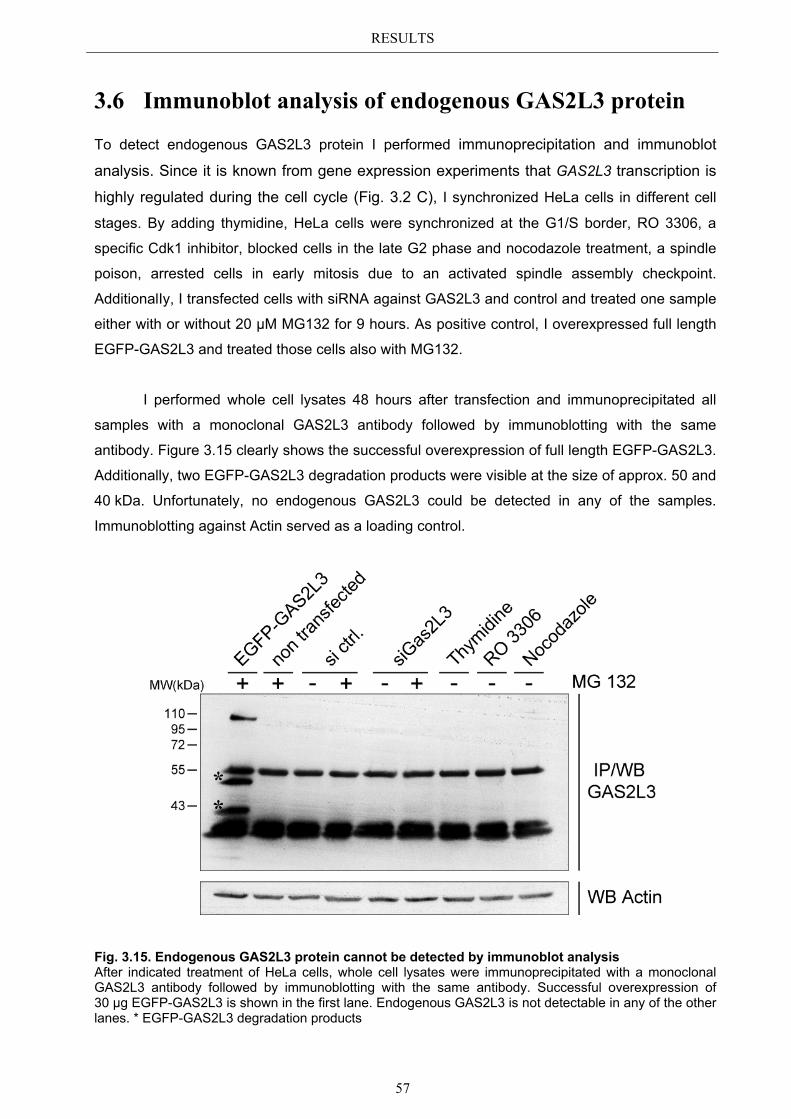
RESULTS
57
3.6 Immunoblot analysis of endogenous GAS2L3 protein
To detect endogenous GAS2L3 protein I performed immunoprecipitation and immunoblot
analysis. Since it is known from gene expression experiments that GAS2L3 transcription is
highly regulated during the cell cycle (Fig. 3.2 C), I synchronized HeLa cells in different cell
stages. By adding thymidine, HeLa cells were synchronized at the G1/S border, RO 3306, a
specific Cdk1 inhibitor, blocked cells in the late G2 phase and nocodazole treatment, a spindle
poison, arrested cells in early mitosis due to an activated spindle assembly checkpoint.
AdditionalIy, I transfected cells with siRNA against GAS2L3 and control and treated one sample
either with or without 20 µM MG132 for 9 hours. As positive control, I overexpressed full length
EGFP-GAS2L3 and treated those cells also with MG132.
I performed whole cell lysates 48 hours after transfection and immunoprecipitated all
samples with a monoclonal GAS2L3 antibody followed by immunoblotting with the same
antibody. Figure 3.15 clearly shows the successful overexpression of full length EGFP-GAS2L3.
Additionally, two EGFP-GAS2L3 degradation products were visible at the size of approx. 50 and
40 kDa. Unfortunately, no endogenous GAS2L3 could be detected in any of the samples.
Immunoblotting against Actin served as a loading control.
Fig. 3.15. Endogenous GAS2L3 protein cannot be detected by immunoblot analysis After indicated treatment of HeLa cells, whole cell lysates were immunoprecipitated with a monoclonal GAS2L3 antibody followed by immunoblotting with the same antibody. Successful overexpression of 30 µg EGFP-GAS2L3 is shown in the first lane. Endogenous GAS2L3 is not detectable in any of the other lanes. * EGFP-GAS2L3 degradation products
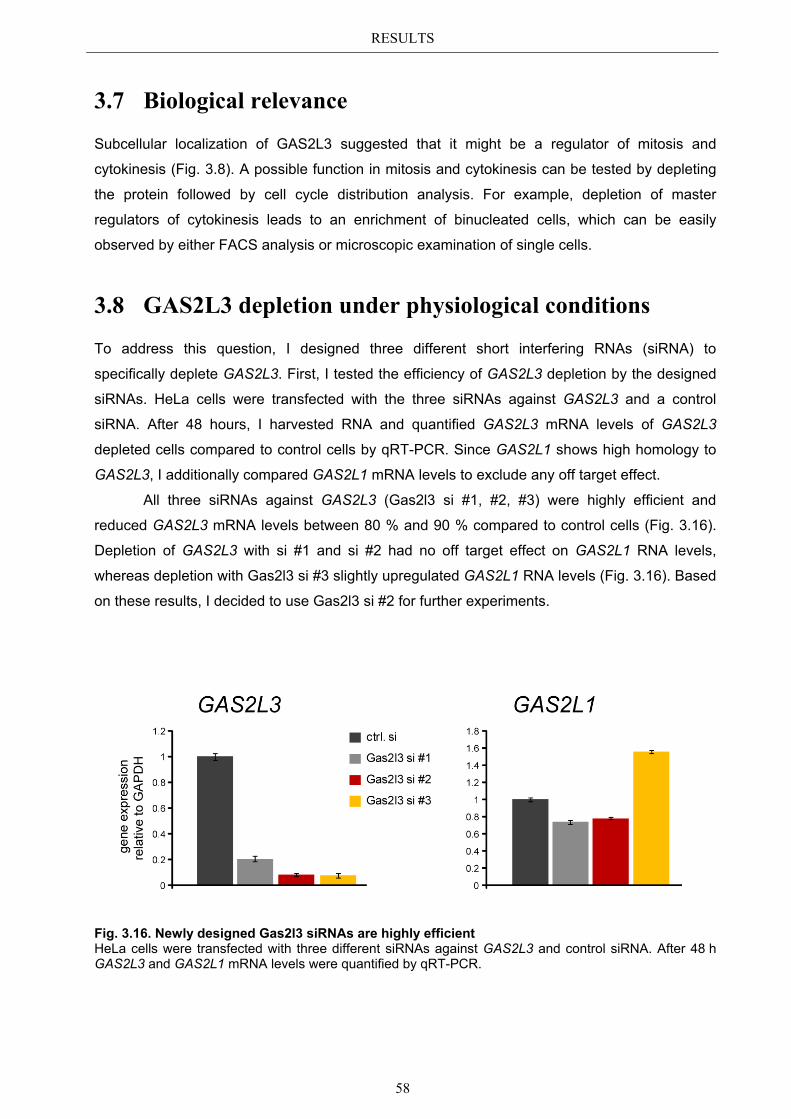
RESULTS
58
3.7 Biological relevance
Subcellular localization of GAS2L3 suggested that it might be a regulator of mitosis and
cytokinesis (Fig. 3.8). A possible function in mitosis and cytokinesis can be tested by depleting
the protein followed by cell cycle distribution analysis. For example, depletion of master
regulators of cytokinesis leads to an enrichment of binucleated cells, which can be easily
observed by either FACS analysis or microscopic examination of single cells.
3.8 GAS2L3 depletion under physiological conditions
To address this question, I designed three different short interfering RNAs (siRNA) to
specifically deplete GAS2L3. First, I tested the efficiency of GAS2L3 depletion by the designed
siRNAs. HeLa cells were transfected with the three siRNAs against GAS2L3 and a control
siRNA. After 48 hours, I harvested RNA and quantified GAS2L3 mRNA levels of GAS2L3
depleted cells compared to control cells by qRT-PCR. Since GAS2L1 shows high homology to
GAS2L3, I additionally compared GAS2L1 mRNA levels to exclude any off target effect.
All three siRNAs against GAS2L3 (Gas2l3 si #1, #2, #3) were highly efficient and
reduced GAS2L3 mRNA levels between 80 % and 90 % compared to control cells (Fig. 3.16).
Depletion of GAS2L3 with si #1 and si #2 had no off target effect on GAS2L1 RNA levels,
whereas depletion with Gas2l3 si #3 slightly upregulated GAS2L1 RNA levels (Fig. 3.16). Based
on these results, I decided to use Gas2l3 si #2 for further experiments.
Fig. 3.16. Newly designed Gas2l3 siRNAs are highly efficient HeLa cells were transfected with three different siRNAs against GAS2L3 and control siRNA. After 48 h GAS2L3 and GAS2L1 mRNA levels were quantified by qRT-PCR.
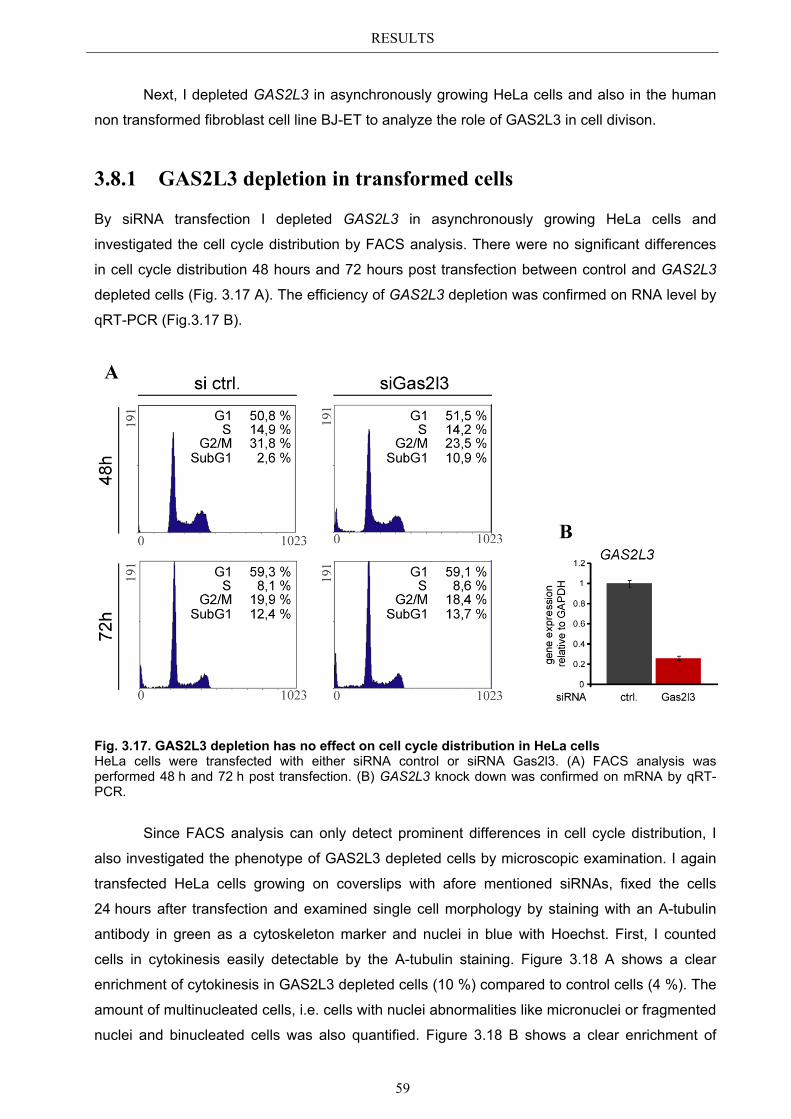
RESULTS
59
Next, I depleted GAS2L3 in asynchronously growing HeLa cells and also in the human
non transformed fibroblast cell line BJ-ET to analyze the role of GAS2L3 in cell divison.
3.8.1 GAS2L3 depletion in transformed cells
By siRNA transfection I depleted GAS2L3 in asynchronously growing HeLa cells and
investigated the cell cycle distribution by FACS analysis. There were no significant differences
in cell cycle distribution 48 hours and 72 hours post transfection between control and GAS2L3
depleted cells (Fig. 3.17 A). The efficiency of GAS2L3 depletion was confirmed on RNA level by
qRT-PCR (Fig.3.17 B).
Fig. 3.17. GAS2L3 depletion has no effect on cell cycle distribution in HeLa cells HeLa cells were transfected with either siRNA control or siRNA Gas2l3. (A) FACS analysis was performed 48 h and 72 h post transfection. (B) GAS2L3 knock down was confirmed on mRNA by qRT-PCR.
Since FACS analysis can only detect prominent differences in cell cycle distribution, I
also investigated the phenotype of GAS2L3 depleted cells by microscopic examination. I again
transfected HeLa cells growing on coverslips with afore mentioned siRNAs, fixed the cells
24 hours after transfection and examined single cell morphology by staining with an A-tubulin
antibody in green as a cytoskeleton marker and nuclei in blue with Hoechst. First, I counted
cells in cytokinesis easily detectable by the A-tubulin staining. Figure 3.18 A shows a clear
enrichment of cytokinesis in GAS2L3 depleted cells (10 %) compared to control cells (4 %). The
amount of multinucleated cells, i.e. cells with nuclei abnormalities like micronuclei or fragmented
nuclei and binucleated cells was also quantified. Figure 3.18 B shows a clear enrichment of
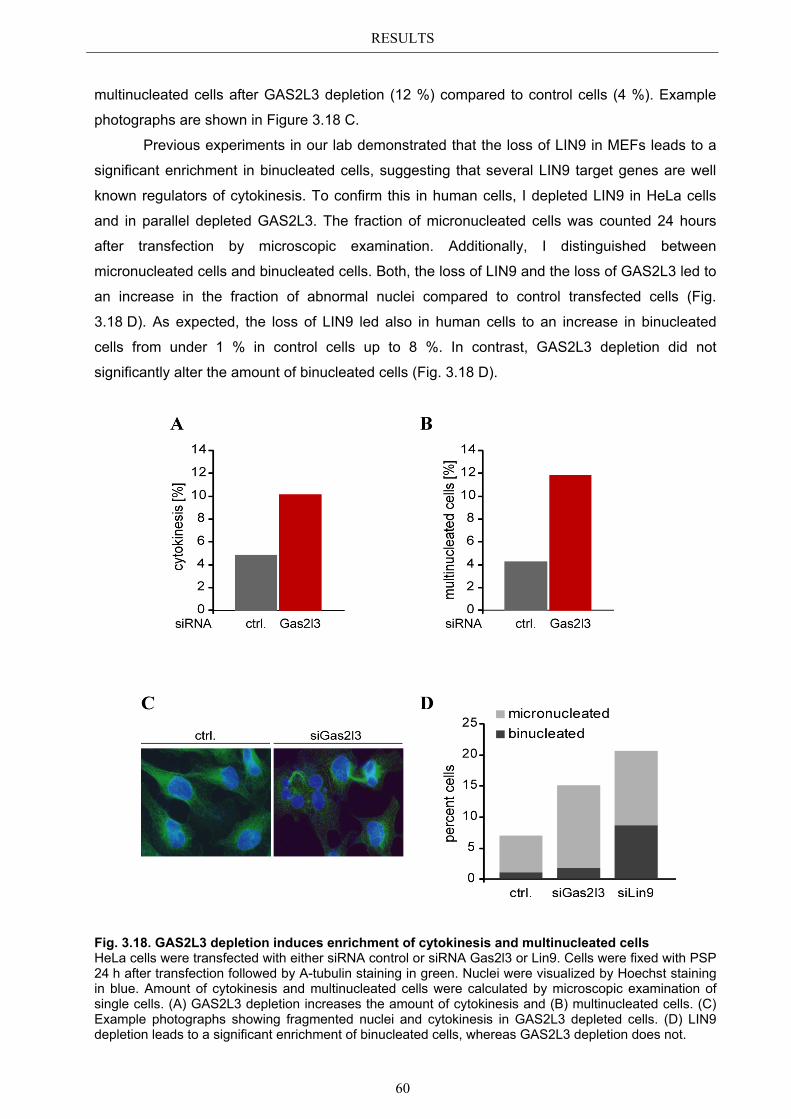
RESULTS
60
multinucleated cells after GAS2L3 depletion (12 %) compared to control cells (4 %). Example
photographs are shown in Figure 3.18 C.
Previous experiments in our lab demonstrated that the loss of LIN9 in MEFs leads to a
significant enrichment in binucleated cells, suggesting that several LIN9 target genes are well
known regulators of cytokinesis. To confirm this in human cells, I depleted LIN9 in HeLa cells
and in parallel depleted GAS2L3. The fraction of micronucleated cells was counted 24 hours
after transfection by microscopic examination. Additionally, I distinguished between
micronucleated cells and binucleated cells. Both, the loss of LIN9 and the loss of GAS2L3 led to
an increase in the fraction of abnormal nuclei compared to control transfected cells (Fig.
3.18 D). As expected, the loss of LIN9 led also in human cells to an increase in binucleated
cells from under 1 % in control cells up to 8 %. In contrast, GAS2L3 depletion did not
significantly alter the amount of binucleated cells (Fig. 3.18 D).
Fig. 3.18. GAS2L3 depletion induces enrichment of cytokinesis and multinucleated cells HeLa cells were transfected with either siRNA control or siRNA Gas2l3 or Lin9. Cells were fixed with PSP 24 h after transfection followed by A-tubulin staining in green. Nuclei were visualized by Hoechst staining in blue. Amount of cytokinesis and multinucleated cells were calculated by microscopic examination of single cells. (A) GAS2L3 depletion increases the amount of cytokinesis and (B) multinucleated cells. (C) Example photographs showing fragmented nuclei and cytokinesis in GAS2L3 depleted cells. (D) LIN9 depletion leads to a significant enrichment of binucleated cells, whereas GAS2L3 depletion does not.
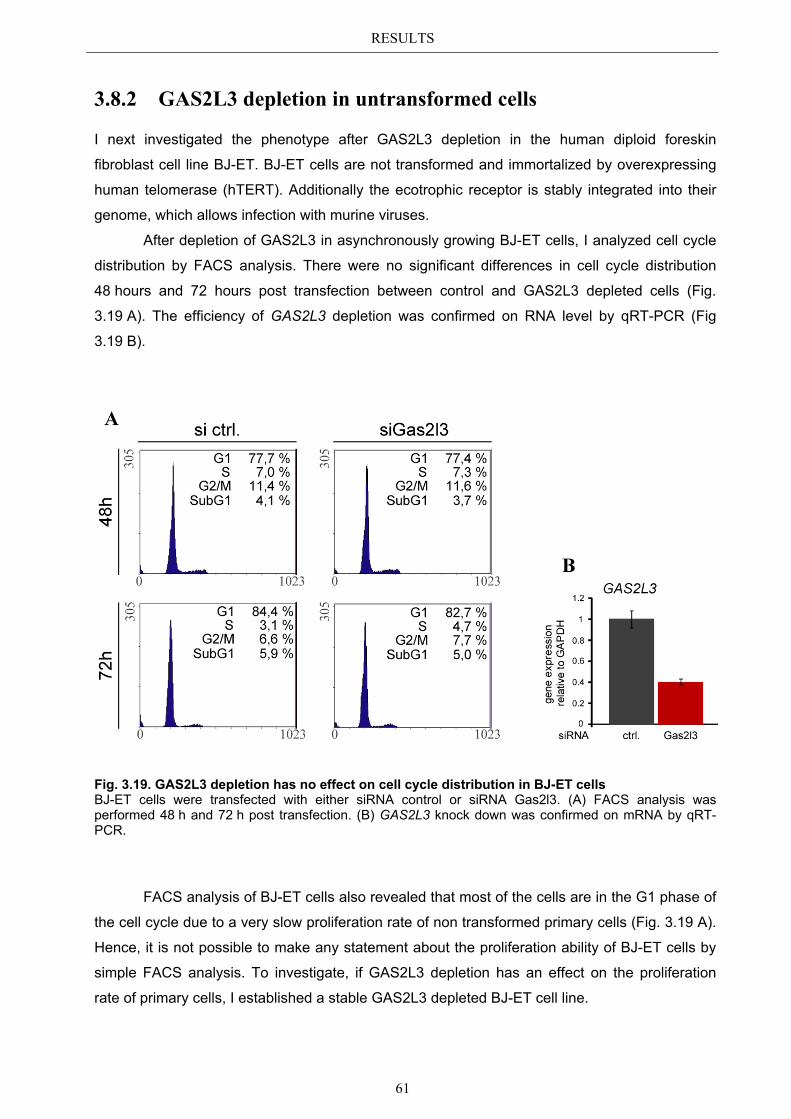
RESULTS
61
3.8.2 GAS2L3 depletion in untransformed cells
I next investigated the phenotype after GAS2L3 depletion in the human diploid foreskin
fibroblast cell line BJ-ET. BJ-ET cells are not transformed and immortalized by overexpressing
human telomerase (hTERT). Additionally the ecotrophic receptor is stably integrated into their
genome, which allows infection with murine viruses.
After depletion of GAS2L3 in asynchronously growing BJ-ET cells, I analyzed cell cycle
distribution by FACS analysis. There were no significant differences in cell cycle distribution
48 hours and 72 hours post transfection between control and GAS2L3 depleted cells (Fig.
3.19 A). The efficiency of GAS2L3 depletion was confirmed on RNA level by qRT-PCR (Fig
3.19 B).
Fig. 3.19. GAS2L3 depletion has no effect on cell cycle distribution in BJ-ET cells BJ-ET cells were transfected with either siRNA control or siRNA Gas2l3. (A) FACS analysis was performed 48 h and 72 h post transfection. (B) GAS2L3 knock down was confirmed on mRNA by qRT-PCR.
FACS analysis of BJ-ET cells also revealed that most of the cells are in the G1 phase of
the cell cycle due to a very slow proliferation rate of non transformed primary cells (Fig. 3.19 A).
Hence, it is not possible to make any statement about the proliferation ability of BJ-ET cells by
simple FACS analysis. To investigate, if GAS2L3 depletion has an effect on the proliferation
rate of primary cells, I established a stable GAS2L3 depleted BJ-ET cell line.
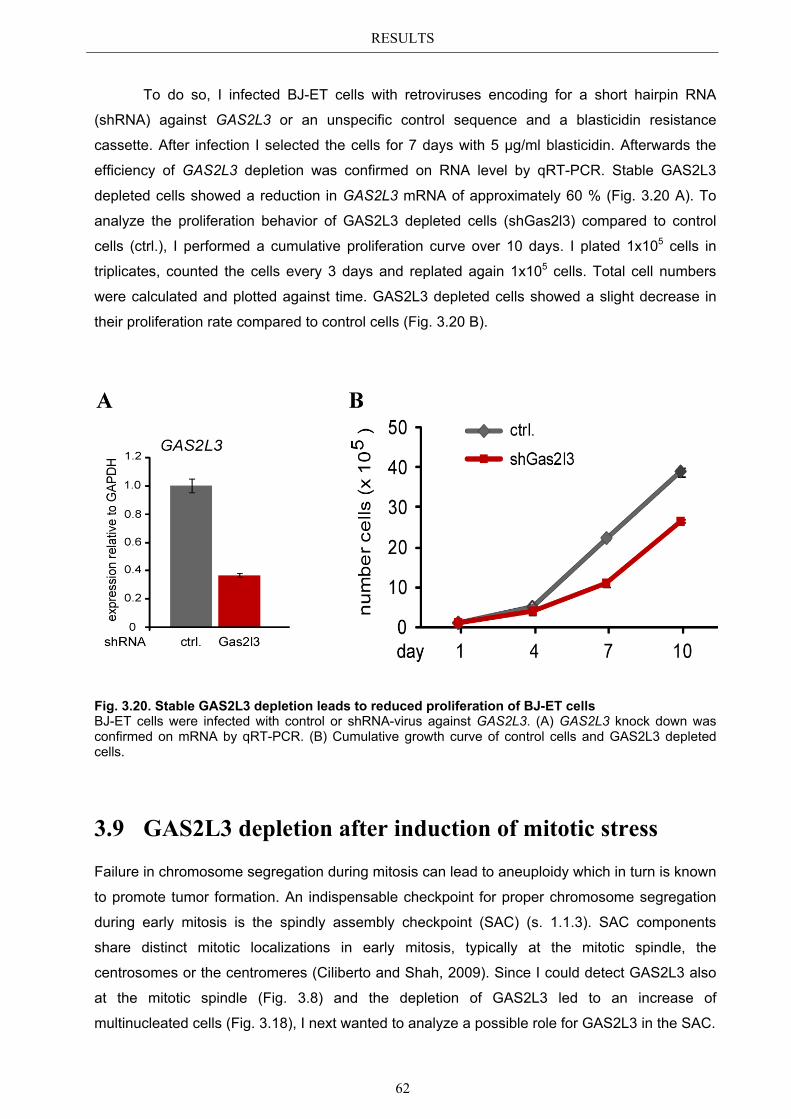
RESULTS
62
To do so, I infected BJ-ET cells with retroviruses encoding for a short hairpin RNA
(shRNA) against GAS2L3 or an unspecific control sequence and a blasticidin resistance
cassette. After infection I selected the cells for 7 days with 5 µg/ml blasticidin. Afterwards the
efficiency of GAS2L3 depletion was confirmed on RNA level by qRT-PCR. Stable GAS2L3
depleted cells showed a reduction in GAS2L3 mRNA of approximately 60 % (Fig. 3.20 A). To
analyze the proliferation behavior of GAS2L3 depleted cells (shGas2l3) compared to control
cells (ctrl.), I performed a cumulative proliferation curve over 10 days. I plated 1x10⁵ cells in
triplicates, counted the cells every 3 days and replated again 1x10⁵ cells. Total cell numbers
were calculated and plotted against time. GAS2L3 depleted cells showed a slight decrease in
their proliferation rate compared to control cells (Fig. 3.20 B).
Fig. 3.20. Stable GAS2L3 depletion leads to reduced proliferation of BJ-ET cells BJ-ET cells were infected with control or shRNA-virus against GAS2L3. (A) GAS2L3 knock down was confirmed on mRNA by qRT-PCR. (B) Cumulative growth curve of control cells and GAS2L3 depleted cells.
3.9 GAS2L3 depletion after induction of mitotic stress
Failure in chromosome segregation during mitosis can lead to aneuploidy which in turn is known
to promote tumor formation. An indispensable checkpoint for proper chromosome segregation
during early mitosis is the spindly assembly checkpoint (SAC) (s. 1.1.3). SAC components
share distinct mitotic localizations in early mitosis, typically at the mitotic spindle, the
centrosomes or the centromeres (Ciliberto and Shah, 2009). Since I could detect GAS2L3 also
at the mitotic spindle (Fig. 3.8) and the depletion of GAS2L3 led to an increase of
multinucleated cells (Fig. 3.18), I next wanted to analyze a possible role for GAS2L3 in the SAC.
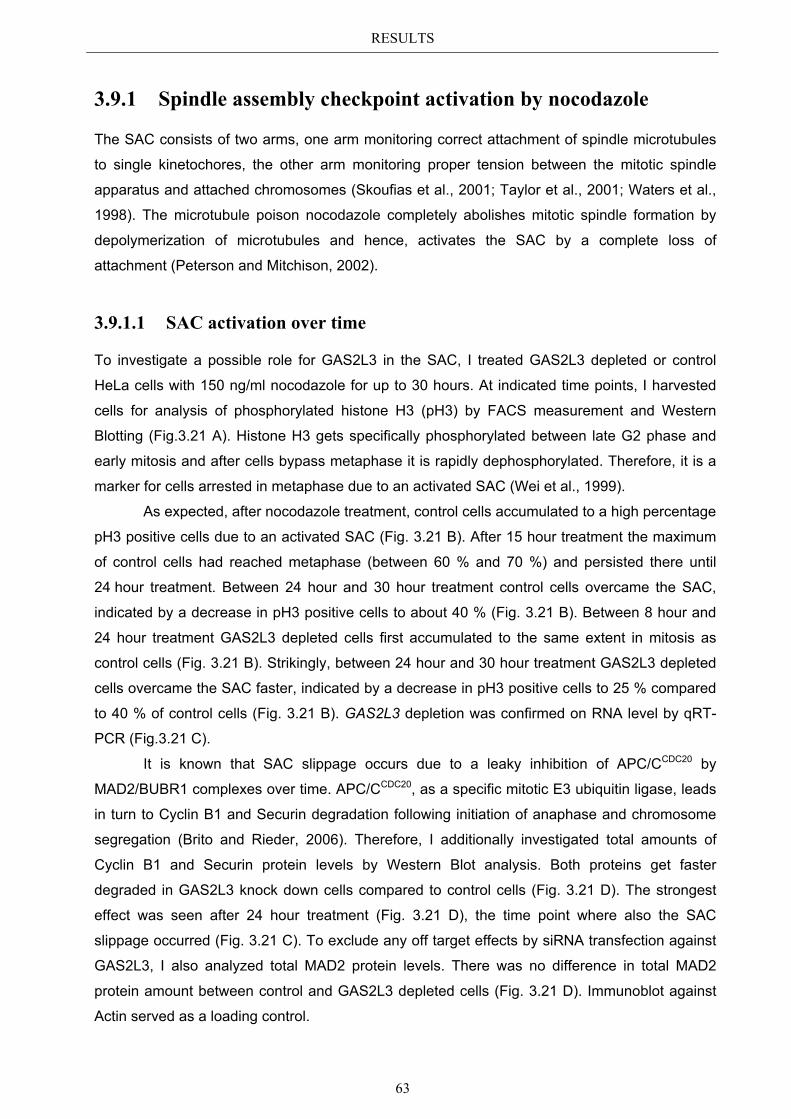
RESULTS
63
3.9.1 Spindle assembly checkpoint activation by nocodazole
The SAC consists of two arms, one arm monitoring correct attachment of spindle microtubules
to single kinetochores, the other arm monitoring proper tension between the mitotic spindle
apparatus and attached chromosomes (Skoufias et al., 2001; Taylor et al., 2001; Waters et al.,
1998). The microtubule poison nocodazole completely abolishes mitotic spindle formation by
depolymerization of microtubules and hence, activates the SAC by a complete loss of
attachment (Peterson and Mitchison, 2002).
3.9.1.1 SAC activation over time
To investigate a possible role for GAS2L3 in the SAC, I treated GAS2L3 depleted or control
HeLa cells with 150 ng/ml nocodazole for up to 30 hours. At indicated time points, I harvested
cells for analysis of phosphorylated histone H3 (pH3) by FACS measurement and Western
Blotting (Fig.3.21 A). Histone H3 gets specifically phosphorylated between late G2 phase and
early mitosis and after cells bypass metaphase it is rapidly dephosphorylated. Therefore, it is a
marker for cells arrested in metaphase due to an activated SAC (Wei et al., 1999).
As expected, after nocodazole treatment, control cells accumulated to a high percentage
pH3 positive cells due to an activated SAC (Fig. 3.21 B). After 15 hour treatment the maximum
of control cells had reached metaphase (between 60 % and 70 %) and persisted there until
24 hour treatment. Between 24 hour and 30 hour treatment control cells overcame the SAC,
indicated by a decrease in pH3 positive cells to about 40 % (Fig. 3.21 B). Between 8 hour and
24 hour treatment GAS2L3 depleted cells first accumulated to the same extent in mitosis as
control cells (Fig. 3.21 B). Strikingly, between 24 hour and 30 hour treatment GAS2L3 depleted
cells overcame the SAC faster, indicated by a decrease in pH3 positive cells to 25 % compared
to 40 % of control cells (Fig. 3.21 B). GAS2L3 depletion was confirmed on RNA level by qRT-
PCR (Fig.3.21 C).
It is known that SAC slippage occurs due to a leaky inhibition of APC/CCDC20 by
MAD2/BUBR1 complexes over time. APC/CCDC20, as a specific mitotic E3 ubiquitin ligase, leads
in turn to Cyclin B1 and Securin degradation following initiation of anaphase and chromosome
segregation (Brito and Rieder, 2006). Therefore, I additionally investigated total amounts of
Cyclin B1 and Securin protein levels by Western Blot analysis. Both proteins get faster
degraded in GAS2L3 knock down cells compared to control cells (Fig. 3.21 D). The strongest
effect was seen after 24 hour treatment (Fig. 3.21 D), the time point where also the SAC
slippage occurred (Fig. 3.21 C). To exclude any off target effects by siRNA transfection against
GAS2L3, I also analyzed total MAD2 protein levels. There was no difference in total MAD2
protein amount between control and GAS2L3 depleted cells (Fig. 3.21 D). Immunoblot against
Actin served as a loading control.
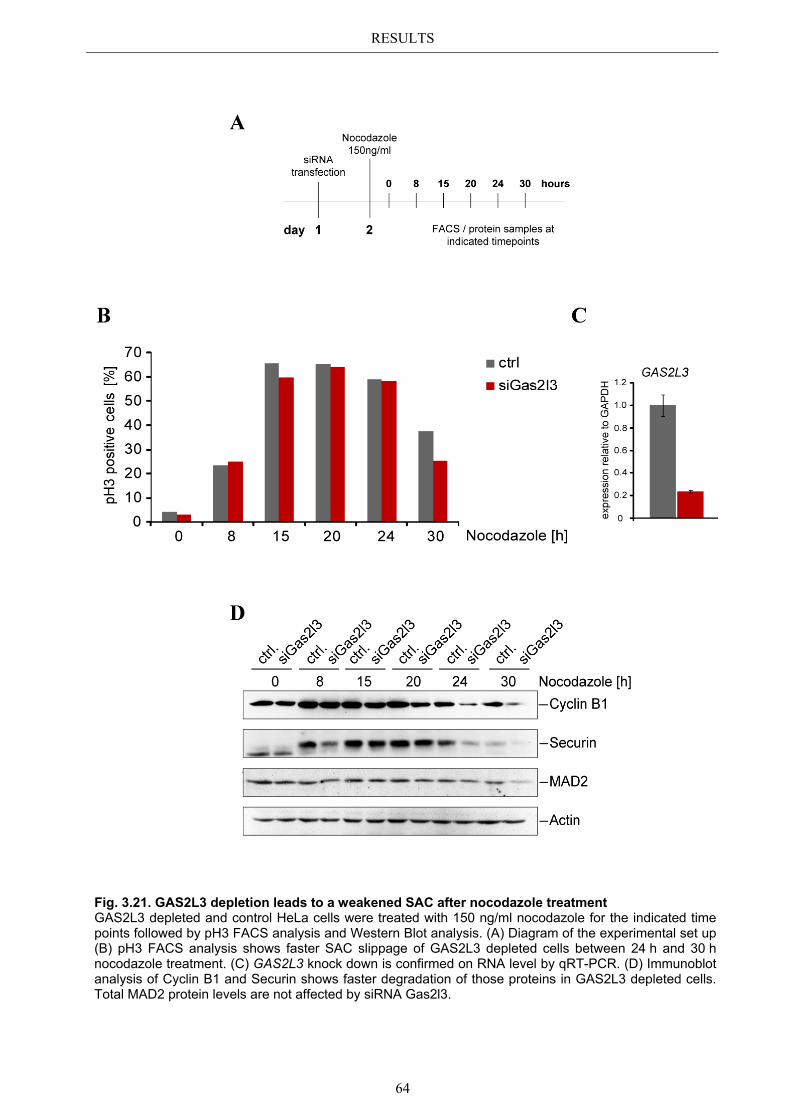
RESULTS
64
Fig. 3.21. GAS2L3 depletion leads to a weakened SAC after nocodazole treatment GAS2L3 depleted and control HeLa cells were treated with 150 ng/ml nocodazole for the indicated time points followed by pH3 FACS analysis and Western Blot analysis. (A) Diagram of the experimental set up (B) pH3 FACS analysis shows faster SAC slippage of GAS2L3 depleted cells between 24 h and 30 h nocodazole treatment. (C) GAS2L3 knock down is confirmed on RNA level by qRT-PCR. (D) Immunoblot analysis of Cyclin B1 and Securin shows faster degradation of those proteins in GAS2L3 depleted cells. Total MAD2 protein levels are not affected by siRNA Gas2l3.
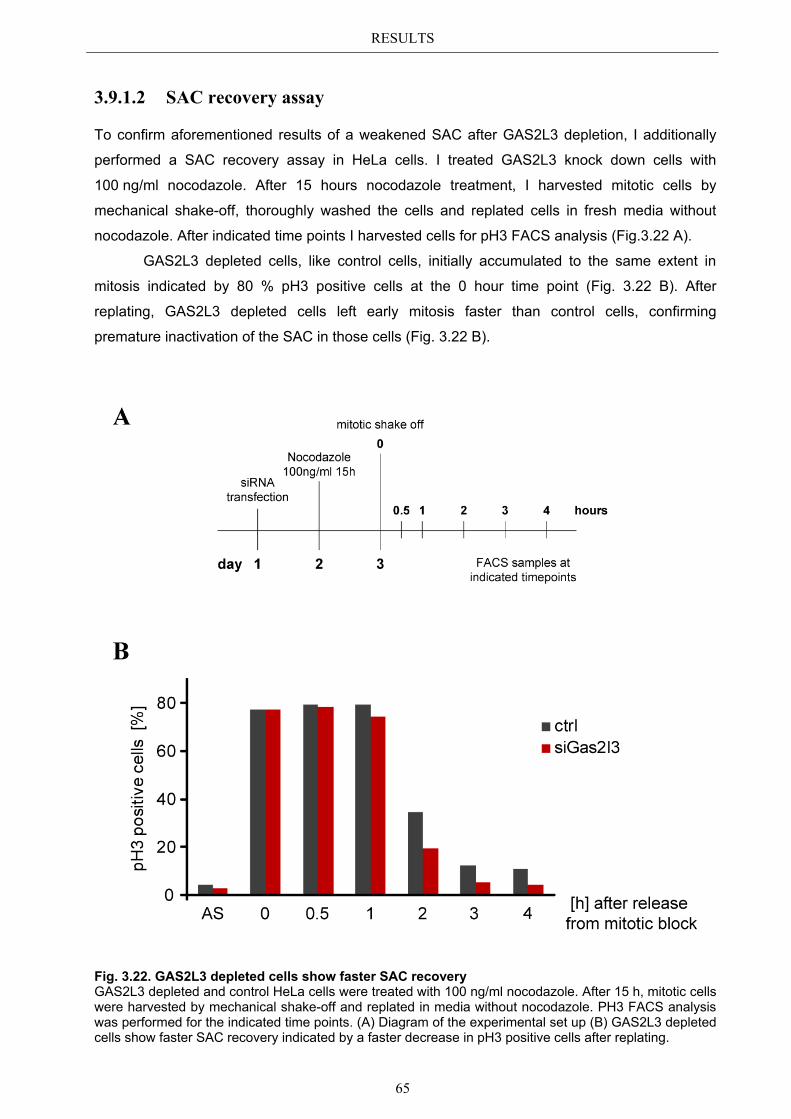
RESULTS
65
3.9.1.2 SAC recovery assay
To confirm aforementioned results of a weakened SAC after GAS2L3 depletion, I additionally
performed a SAC recovery assay in HeLa cells. I treated GAS2L3 knock down cells with
100 ng/ml nocodazole. After 15 hours nocodazole treatment, I harvested mitotic cells by
mechanical shake-off, thoroughly washed the cells and replated cells in fresh media without
nocodazole. After indicated time points I harvested cells for pH3 FACS analysis (Fig.3.22 A).
GAS2L3 depleted cells, like control cells, initially accumulated to the same extent in
mitosis indicated by 80 % pH3 positive cells at the 0 hour time point (Fig. 3.22 B). After
replating, GAS2L3 depleted cells left early mitosis faster than control cells, confirming
premature inactivation of the SAC in those cells (Fig. 3.22 B).
Fig. 3.22. GAS2L3 depleted cells show faster SAC recovery GAS2L3 depleted and control HeLa cells were treated with 100 ng/ml nocodazole. After 15 h, mitotic cells were harvested by mechanical shake-off and replated in media without nocodazole. PH3 FACS analysis was performed for the indicated time points. (A) Diagram of the experimental set up (B) GAS2L3 depleted cells show faster SAC recovery indicated by a faster decrease in pH3 positive cells after replating.
RESULTS
66
3.9.2 Spindle assembly checkpoint activation by Taxol
The microtubule poison taxol leads to hyperstabilization of microtubules (Peterson and
Mitchison, 2002). In that case, the mitotic spindle can properly develop, but the spindle dynamic
is completely disturbed. This in turn activates the SAC by a loss of tension.
3.9.2.1 SAC activation over time
To monitor SAC activation induced by loss of tension in GAS2L3 deficient HeLa cells, I treated
the cells with taxol. After GAS2L3 depletion, I first synchronized cells at the G1/S border by a
single thymidine block for 24 hours. Afterwards I started with 33 nM taxol treatment for indicated
time points and harvested cells for pH3 FACS analysis and Western Blot analysis (Fig. 3.23 A).
At no time point after taxol treatment, GAS2L3 deficient cells reached the amount of pH3
positive control cells (Fig. 3.23 B). Whereas control cells reached a maximum of 45 % pH3
positive cells after 17 hour treatment, only 25 % of cells were pH3 positive in GAS2L3 depleted
cells at this time, indicating a weakened SAC upon depletion of GAS2L3 (Fig. 3.23 B).
Additionally, I investigated total protein amounts of Cyclin B1 and Securin by
immunoblot analysis. As was observed after nocodazole treatment (Fig. 3.21 D), Securin and
Cyclin B1 were degraded faster in GAS2L3 depleted cells compared to control cells (Fig.
3.23 C). Immunoblot analysis of MAD2 revealed no difference in total protein amount between
control and GAS2L3 depleted cells, excluding an off target effect of siGas2l3 on MAD2 RNA
levels (Fig. 3.23 C). To validate this, I also investigated MAD2 mRNA level by qRT-PCR, which
was not affected upon GAS2L3 depletion (Fig. 3.23 D).
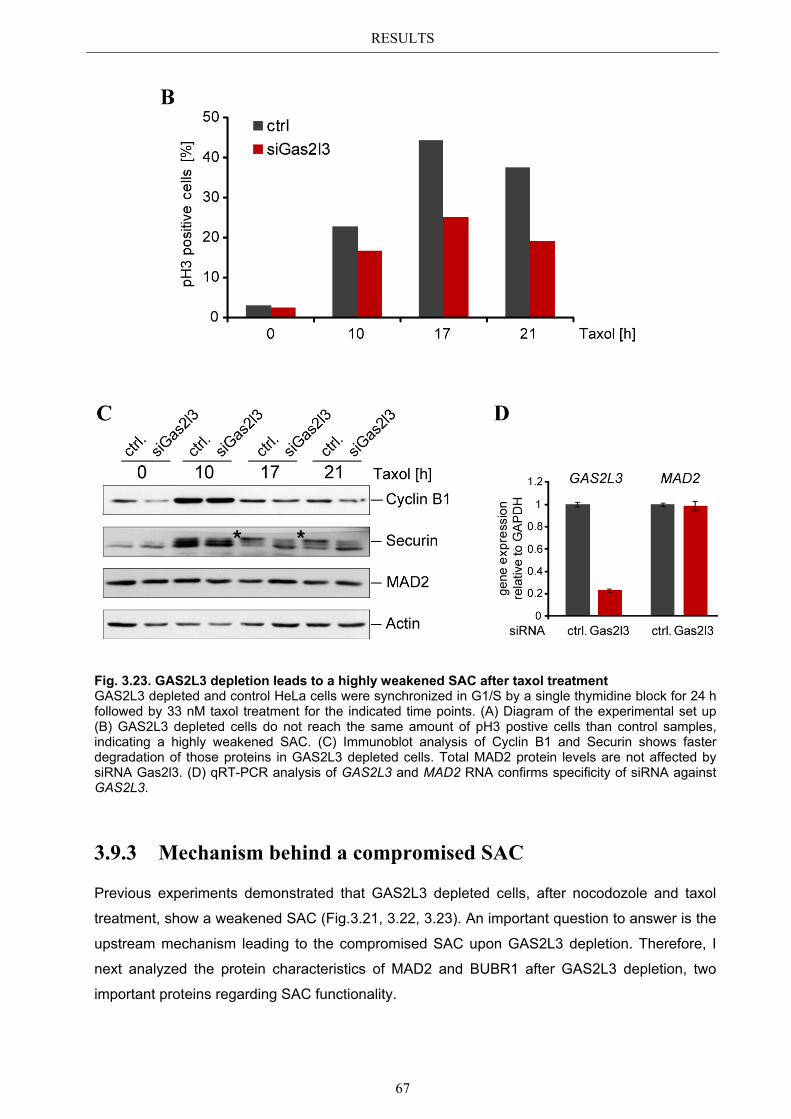
RESULTS
67
Fig. 3.23. GAS2L3 depletion leads to a highly weakened SAC after taxol treatment GAS2L3 depleted and control HeLa cells were synchronized in G1/S by a single thymidine block for 24 h followed by 33 nM taxol treatment for the indicated time points. (A) Diagram of the experimental set up (B) GAS2L3 depleted cells do not reach the same amount of pH3 postive cells than control samples, indicating a highly weakened SAC. (C) Immunoblot analysis of Cyclin B1 and Securin shows faster degradation of those proteins in GAS2L3 depleted cells. Total MAD2 protein levels are not affected by siRNA Gas2l3. (D) qRT-PCR analysis of GAS2L3 and MAD2 RNA confirms specificity of siRNA against GAS2L3.
3.9.3 Mechanism behind a compromised SAC
Previous experiments demonstrated that GAS2L3 depleted cells, after nocodozole and taxol
treatment, show a weakened SAC (Fig.3.21, 3.22, 3.23). An important question to answer is the
upstream mechanism leading to the compromised SAC upon GAS2L3 depletion. Therefore, I
next analyzed the protein characteristics of MAD2 and BUBR1 after GAS2L3 depletion, two
important proteins regarding SAC functionality.
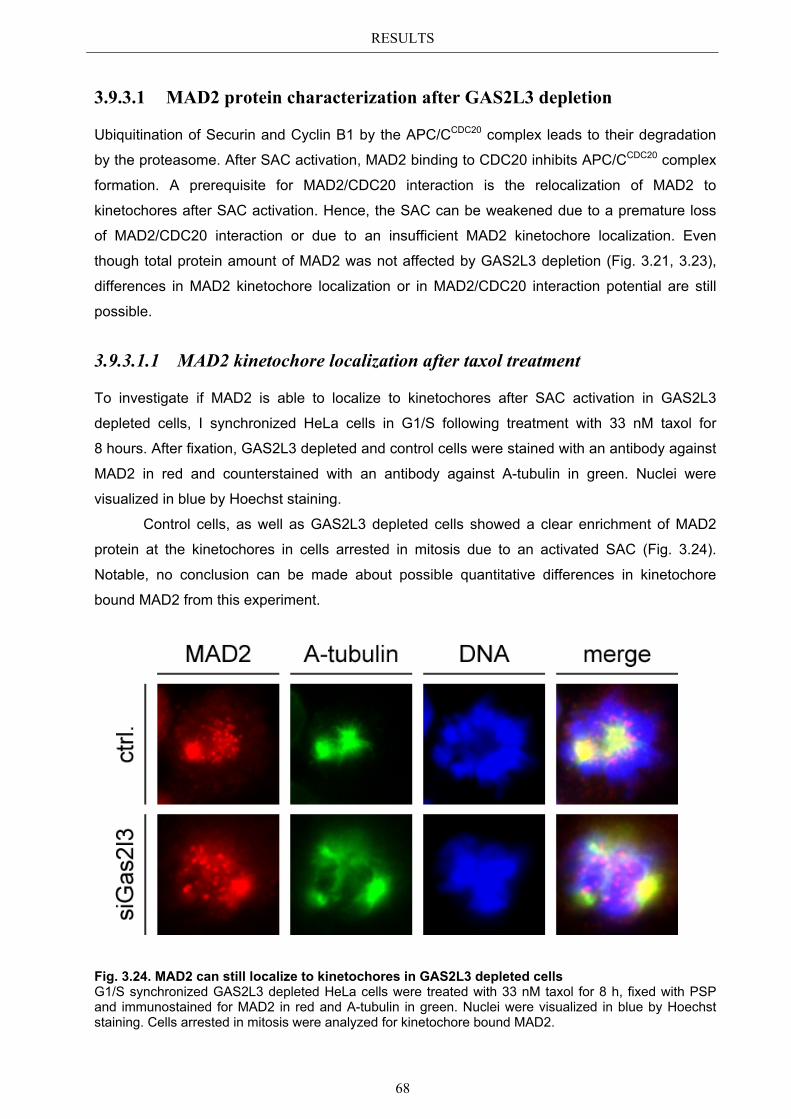
RESULTS
68
3.9.3.1 MAD2 protein characterization after GAS2L3 depletion
Ubiquitination of Securin and Cyclin B1 by the APC/CCDC20 complex leads to their degradation
by the proteasome. After SAC activation, MAD2 binding to CDC20 inhibits APC/CCDC20 complex
formation. A prerequisite for MAD2/CDC20 interaction is the relocalization of MAD2 to
kinetochores after SAC activation. Hence, the SAC can be weakened due to a premature loss
of MAD2/CDC20 interaction or due to an insufficient MAD2 kinetochore localization. Even
though total protein amount of MAD2 was not affected by GAS2L3 depletion (Fig. 3.21, 3.23),
differences in MAD2 kinetochore localization or in MAD2/CDC20 interaction potential are still
possible.
3.9.3.1.1 MAD2 kinetochore localization after taxol treatment
To investigate if MAD2 is able to localize to kinetochores after SAC activation in GAS2L3
depleted cells, I synchronized HeLa cells in G1/S following treatment with 33 nM taxol for
8 hours. After fixation, GAS2L3 depleted and control cells were stained with an antibody against
MAD2 in red and counterstained with an antibody against A-tubulin in green. Nuclei were
visualized in blue by Hoechst staining.
Control cells, as well as GAS2L3 depleted cells showed a clear enrichment of MAD2
protein at the kinetochores in cells arrested in mitosis due to an activated SAC (Fig. 3.24).
Notable, no conclusion can be made about possible quantitative differences in kinetochore
bound MAD2 from this experiment.
Fig. 3.24. MAD2 can still localize to kinetochores in GAS2L3 depleted cells G1/S synchronized GAS2L3 depleted HeLa cells were treated with 33 nM taxol for 8 h, fixed with PSP and immunostained for MAD2 in red and A-tubulin in green. Nuclei were visualized in blue by Hoechst staining. Cells arrested in mitosis were analyzed for kinetochore bound MAD2.
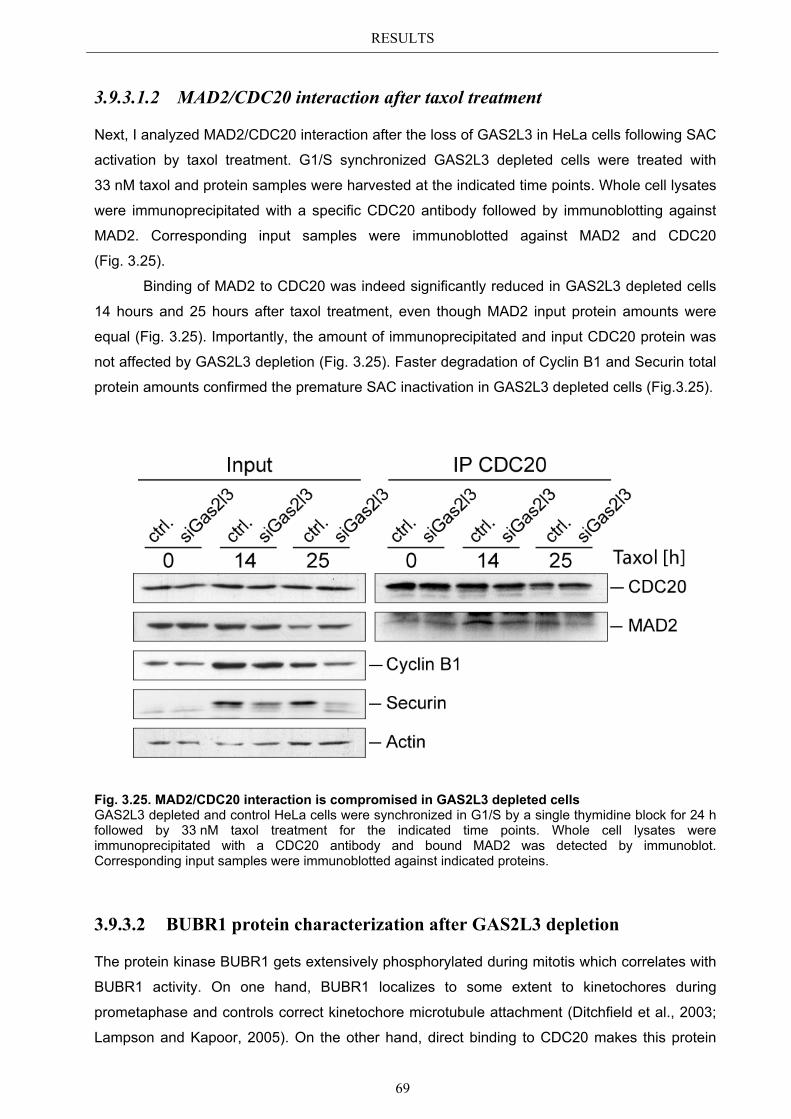
RESULTS
69
3.9.3.1.2 MAD2/CDC20 interaction after taxol treatment
Next, I analyzed MAD2/CDC20 interaction after the loss of GAS2L3 in HeLa cells following SAC
activation by taxol treatment. G1/S synchronized GAS2L3 depleted cells were treated with
33 nM taxol and protein samples were harvested at the indicated time points. Whole cell lysates
were immunoprecipitated with a specific CDC20 antibody followed by immunoblotting against
MAD2. Corresponding input samples were immunoblotted against MAD2 and CDC20
(Fig. 3.25).
Binding of MAD2 to CDC20 was indeed significantly reduced in GAS2L3 depleted cells
14 hours and 25 hours after taxol treatment, even though MAD2 input protein amounts were
equal (Fig. 3.25). Importantly, the amount of immunoprecipitated and input CDC20 protein was
not affected by GAS2L3 depletion (Fig. 3.25). Faster degradation of Cyclin B1 and Securin total
protein amounts confirmed the premature SAC inactivation in GAS2L3 depleted cells (Fig.3.25).
Fig. 3.25. MAD2/CDC20 interaction is compromised in GAS2L3 depleted cells GAS2L3 depleted and control HeLa cells were synchronized in G1/S by a single thymidine block for 24 h followed by 33 nM taxol treatment for the indicated time points. Whole cell lysates were immunoprecipitated with a CDC20 antibody and bound MAD2 was detected by immunoblot. Corresponding input samples were immunoblotted against indicated proteins.
3.9.3.2 BUBR1 protein characterization after GAS2L3 depletion
The protein kinase BUBR1 gets extensively phosphorylated during mitotis which correlates with
BUBR1 activity. On one hand, BUBR1 localizes to some extent to kinetochores during
prometaphase and controls correct kinetochore microtubule attachment (Ditchfield et al., 2003;
Lampson and Kapoor, 2005). On the other hand, direct binding to CDC20 makes this protein
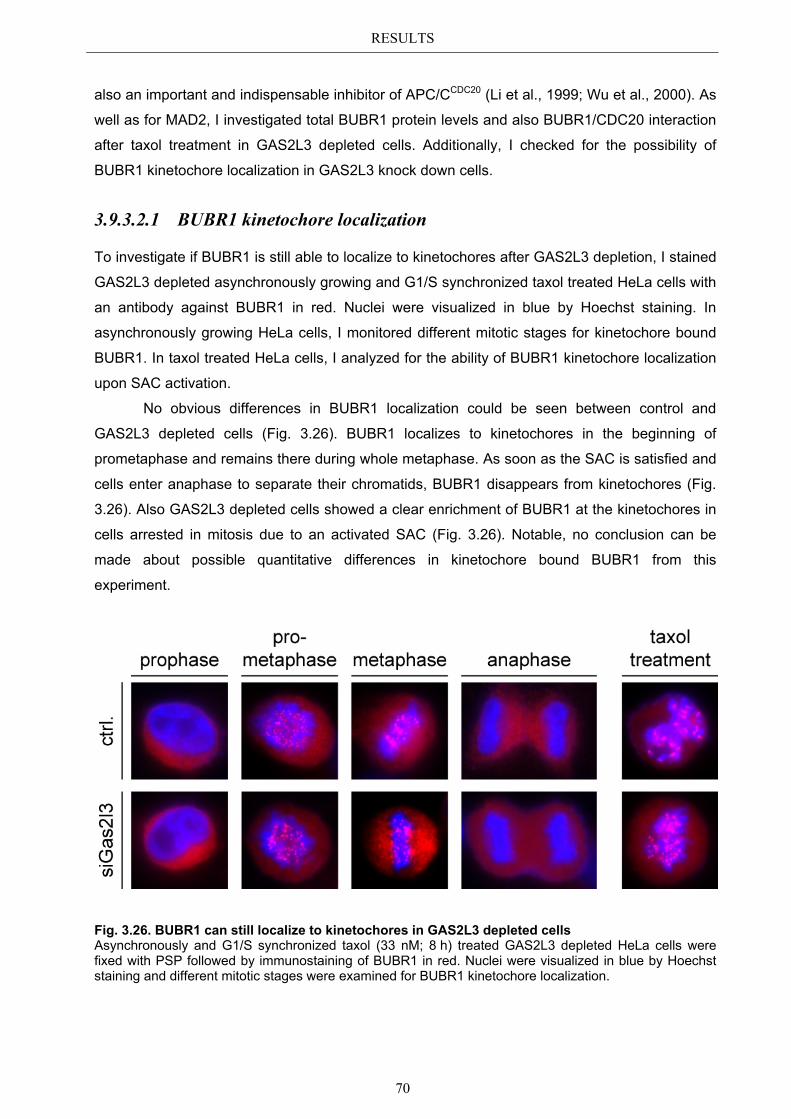
RESULTS
70
also an important and indispensable inhibitor of APC/CCDC20 (Li et al., 1999; Wu et al., 2000). As
well as for MAD2, I investigated total BUBR1 protein levels and also BUBR1/CDC20 interaction
after taxol treatment in GAS2L3 depleted cells. Additionally, I checked for the possibility of
BUBR1 kinetochore localization in GAS2L3 knock down cells.
3.9.3.2.1 BUBR1 kinetochore localization
To investigate if BUBR1 is still able to localize to kinetochores after GAS2L3 depletion, I stained
GAS2L3 depleted asynchronously growing and G1/S synchronized taxol treated HeLa cells with
an antibody against BUBR1 in red. Nuclei were visualized in blue by Hoechst staining. In
asynchronously growing HeLa cells, I monitored different mitotic stages for kinetochore bound
BUBR1. In taxol treated HeLa cells, I analyzed for the ability of BUBR1 kinetochore localization
upon SAC activation.
No obvious differences in BUBR1 localization could be seen between control and
GAS2L3 depleted cells (Fig. 3.26). BUBR1 localizes to kinetochores in the beginning of
prometaphase and remains there during whole metaphase. As soon as the SAC is satisfied and
cells enter anaphase to separate their chromatids, BUBR1 disappears from kinetochores (Fig.
3.26). Also GAS2L3 depleted cells showed a clear enrichment of BUBR1 at the kinetochores in
cells arrested in mitosis due to an activated SAC (Fig. 3.26). Notable, no conclusion can be
made about possible quantitative differences in kinetochore bound BUBR1 from this
experiment.
Fig. 3.26. BUBR1 can still localize to kinetochores in GAS2L3 depleted cells Asynchronously and G1/S synchronized taxol (33 nM; 8 h) treated GAS2L3 depleted HeLa cells were fixed with PSP followed by immunostaining of BUBR1 in red. Nuclei were visualized in blue by Hoechst staining and different mitotic stages were examined for BUBR1 kinetochore localization.
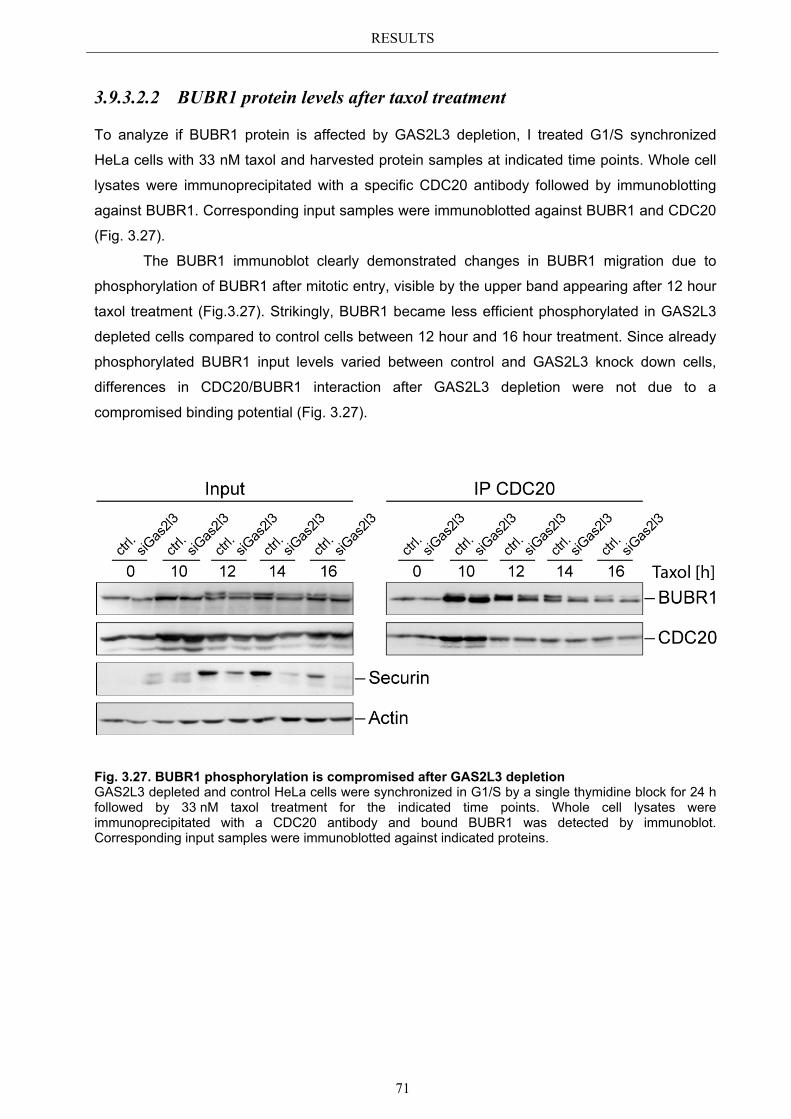
RESULTS
71
3.9.3.2.2 BUBR1 protein levels after taxol treatment
To analyze if BUBR1 protein is affected by GAS2L3 depletion, I treated G1/S synchronized
HeLa cells with 33 nM taxol and harvested protein samples at indicated time points. Whole cell
lysates were immunoprecipitated with a specific CDC20 antibody followed by immunoblotting
against BUBR1. Corresponding input samples were immunoblotted against BUBR1 and CDC20
(Fig. 3.27).
The BUBR1 immunoblot clearly demonstrated changes in BUBR1 migration due to
phosphorylation of BUBR1 after mitotic entry, visible by the upper band appearing after 12 hour
taxol treatment (Fig.3.27). Strikingly, BUBR1 became less efficient phosphorylated in GAS2L3
depleted cells compared to control cells between 12 hour and 16 hour treatment. Since already
phosphorylated BUBR1 input levels varied between control and GAS2L3 knock down cells,
differences in CDC20/BUBR1 interaction after GAS2L3 depletion were not due to a
compromised binding potential (Fig. 3.27).
Fig. 3.27. BUBR1 phosphorylation is compromised after GAS2L3 depletion GAS2L3 depleted and control HeLa cells were synchronized in G1/S by a single thymidine block for 24 h followed by 33 nM taxol treatment for the indicated time points. Whole cell lysates were immunoprecipitated with a CDC20 antibody and bound BUBR1 was detected by immunoblot. Corresponding input samples were immunoblotted against indicated proteins.
DISCUSSION
72
4 DISCUSSION
4.1 Characterization of GAS2L3
Failure during mitosis results in the loss of genomic integrity which is known to promote
tumorigenesis. Hence, the identification of new G2/M regulatory genes still attracts great
attention.
To identify putative new mitotic regulators our lab performed genome wide microarray
analysis from Lin9 depleted MEFs (Reichert et al., 2010). LIN9, a core protein of the LIN
complex, is a transcriptional activator of G2/M specific genes (Osterloh et al., 2007; Schmit et
al., 2007). The top hit of LIN9 activated genes in MEFs was Gas2l3, a so far completely
uncharacterized member of the family of growth arrest specific 2 genes. This work addressed
the biochemical as well as biological characterization of GAS2L3 in human cells.
4.2 GAS2L3 is a G2/M regulated LINC target gene
GAS2L3 gene expression was strongly inhibited in LIN9 and LIN54 depleted HeLa cells
(Fig. 3.1 A & B), indicating that GAS2L3 is also a LINC target gene in human cells. The same
result was obtained upon LIN9 depletion in the non transformed human fibroblast cell line BJ-ET
(Fig. 3.1 C).
GAS2L3 belongs to the GAS2 family of genes, which were originally identified to be
transcriptionally activated in growth arrested MEFs (Schneider et al., 1988). Therefore, the next
important question was the transcriptional regulation of GAS2L3 during the cell cycle in human
cells. Strikingly, transcriptional activation of GAS2L3 gene expression started in the S phase
and reached its maximum when most of the cells were in G2/M (Fig. 3.2). This G2/M specific
gene expression was completely inhibited in LIN9 depleted cells (Fig. 3.3). In contrast, none of
the other GAS2 family members showed a similar gene expression profile (Fig. 3.2). All
together, these data confirm that GAS2L3, unlike the other GAS2 family members, is a bona
fide G2/M activated LINC target gene in human cells.
4.3 GAS2L3 localization during the cell cycle
The G2/M specific expression pattern argued for a possible role of GAS2L3 in mitosis. To get
more information about a possible biological function of GAS2L3, I next investigated its
localization during the cell cycle. The fact that GAS2L3 contains the highly conserved CH and
GAS2 domain (Fig. 1.4) raised suspicion that GAS2L3 might function as a cytoskeletal linker
protein, connecting and coordinating microfilaments and microtubules (s. 1.3.1.1).
DISCUSSION
73
4.3.1 GAS2L3 colocalizes with and stabilizes the interphase
microtubule network
During interphase, in a small fraction of cells nuclear localization of EGFP-GAS2L3 was
observed (Fig. 3.4 A). However, in most of the interphase cells GAS2L3 was cytoplasmatic and
colocalized with the mictrotubule network (Fig. 3.4 A). Additionally, microtubules in EGFP-
GAS2L3 expressing cells were more resistant to depolymerization than those in control cells.
Therefore, overexpressed GAS2L3 is not only able to colocalize with, but also stabilizes
microtubules (Fig. 3.4 C). These observations were the first hint that the GAS2 domain of
GAS2L3 might indeed function as a microtubule binding domain.
4.3.2 GAS2L3 colocalizes with the mitotic microtubule network
During mitosis, overexpressed GAS2L3 also colocalized with the microtubule network. In
prometaphase, GAS2L3 was diffusely expressed in the whole cell but slightly enriched at
microtubule spindle poles from where the mitotic spindle is built up (Fig. 3.7 A & 3.8 A). In
metaphase, GAS2L3 clearly localized to the minus ends of the mitotic spindle microtubules (Fig.
3.7 B & 3.8 B). In the beginning of anaphase, when Aurora B migrated to the spindle midzone,
GAS2L3 was still enriched at the minus ends of the mitotic spindle microtubules. In late
anaphase, also GAS2L3 relocated to some extent to spindle midzone microtubules (Fig. 3.7 C
& 3.8 C). In contrast to Aurora B, which relocated to the central part of the spindle midzone,
GAS2L3 was present more diffusely at the complete microtubule network of the whole spindle
midzone. Interestingly, during telophase, GAS2L3 started to migrate from the spindle midzone
microtubules to the midbody. The midbody in late telophase was the first structure where
GAS2L3 and Aurora B showed a perfect colocalization (Fig. 3.7 D & 3.8 D). Also midbody
localization was the first stage during mitosis, where GAS2L3 left the microtubule network.
4.3.3 GAS2L3 localizes to the midbody during cytokinesis
The midbody (MB) is a dense structure formed in telophase and derived from the central spindle
and a massive number of recruited proteins (Fig. 1.3). Until the end of cytokinesis, the MB is the
final bridge between the dividing cells. Many proteins of the MB, for example RhoA, Aurora B
and Survivin, are well known master regulators of cytokinesis. Not surprisingly, disruption of
those proteins leads to cytokinesis failure resulting in binucleated cells.
Co-staining of GAS2L3 with the well known MB component Survivin and the MBR
(midbody ring) component RhoA validated GAS2L3 MB localization and defined GAS2L3
localization to the outer arms of the MB which embrace the MBR (Fig. 3.5). GAS2L3 MB
localization was also confirmed in the two other cancer cell lines HCT 116 and T98G (Fig. 3.6).
DISCUSSION
74
Strikingly, also endogenous GAS2L3 was clearly detectable at the MB in HeLa cells (Fig. 3.9),
confirming that GAS2L3 is indeed a member of the MB and a possible regulator of cytokinesis.
Even though overexpressed GAS2L3 localized to the mitotic microtubule network (Fig.
3.7 & 3.8), no endogenous GAS2L3 could be detected there. This might be due to a low
antibody titer and / or a low concentration of GAS2L3 protein at those structures. As well, these
results point out that high amounts of GAS2L3 protein seem to be present at the MB.
4.4 Characterization of GAS2L3 protein domains
To determine which protein domains are required for the specific localization pattern of
GAS2L3, I overexpressed a series of EGFP-GAS2L3 deletion mutant constructs in HeLa cells
and monitored their localization during the cell cycle (Fig. 3.10 A).
4.4.1 The GAS2 domain is neither needed nor sufficient for
microtubule binding
Association of GAS2L3 to the cytoplasmic microtubule network was highly dependent on
sequences in the C-terminus (Fig. 3.12). However, constructs containing additionally the GAS2
domain showed stronger overlap with the microtubule network, indicating that GAS2L3 has at
least two microtubule binding domains (MBD): the GAS2 domain, which is already known as
MBD, and a further domain in the C-terminus, so far not characterized. Both MBDs work
cooperatively and are needed for proper microtubule colocalization.
Other experiments in our lab suggest that a second MBD is located between amino
acids 455 and 535 (Kremling H, diploma thesis). However, predictive domain analysis with this
amino acid sequence revealed no known MBD.
It is important to mention that the colocalization of proteins observed by
immunofluorescence microscopy provides evidence but is not a proof for protein binding. To
confirm that GAS2L3 binds to the microtubule network, other in vitro assays should be
performed. For example, a simple assay is the microtubule (MT) spin down assay. This assay
relies on the fact that MTs will pellet when centrifuged. Therefore, any protein that is associated
with the MTs will pellet with them during centrifugation. A simple immunoblot analysis of the
supernatant versus pellet fraction will identify if a protein is able to associate with MTs.
DISCUSSION
75
4.4.2 The CH domain is an actin binding domain
Overexpressing the mutants that contain only the CH domain or the CH and the GAS2 domain
resulted in the prominent induction of and colocalization with actin stress fibers (Fig. 3.12 & 3.13
& 3.10 B). This indicates that the CH domain has the potential to function as an actin binding
domain.
Remarkably, full length GAS2L3 protein never showed colocalization with the actin
filament network. Therefore, it is possible that the CH domain of full length GAS2L3 is masked
by an intramolecular interaction with the C-terminus. Even though such conformational
regulation is poorly understood, it may have wide generality as it has been proposed for several
proteins, for example for the cytoskeletal proteins vinculin and the ERM proteins (Johnson and
Craig, 1994; Johnson and Craig, 1995; Pearson et al., 2000).
4.4.3 Only full length GAS2L3 localizes to the midbody
Interestingly, only full length GAS2L3 showed defined MB localization (Fig. 3.11 & 3.10 B).
Deletion mutants lacking the CH domain or the CH and GAS2 domain could still diffusely
localize to spindle midzone microtubules, whereas all mutants lacking the C-terminus even
failed to localize to spindle midzone microtubules (Fig. 3.11 & 3.10 B). These results confirm
that there must be at least one additional MBD in the C-terminus. The fact that only full length
GAS2L3 shows defined MB localization argues for the importance of the actin binding CH
domain. This is an interesting point, since I mentioned before that it is likely that the CH domain
of GAS2L3 is masked by the C-terminus in interphase cells (s. 4.4.2). However, it might be
possible that localization of GAS2L3 to the microtubule network during mitosis somehow leads
to conformational changes which eventually unmask the CH domain during cytokinesis.
4.4.4 GAS2L3 is highly regulated on protein level
Protein levels of constructs containing the C-terminus were almost undetectable by immunoblot
analysis (Fig. 3.14). However, treatment with the proteasome inhibitor MG132 significantly
elevated their protein levels (Fig. 3.14). In contrast, constructs containing only parts of the N-
terminus could be easily overexpressed and MG132 treatment had no effect on their protein
levels (Fig. 3.14). All together these data indicate that GAS2L3 is highly regulated on protein
level and this regulation is, at least partially, due to degradation by the proteasome. The signal
for the proteasomal degradation must lie within the C-terminus. Experiments of Heidi Kremling
(diploma thesis) suggest that the area responsible for proteasomal degradation is located
between amino acids 375 and 455. However, predictive domain analysis with this amino acid
sequence revealed no known degradation domains.
DISCUSSION
76
Full length GAS2L3 protein levels, even after MG132 treatment, never reached the
amount of the stable N-terminus constructs (Fig. 3.14). Hence, it is likely that, beside the
proteasomal degradation, other pathways affect GAS2L3 stability. Interestingly, in some
experiments GAS2L3 degradation products or GAS2L3 cleaved fragments were visible, but only
from constructs containing the C-terminus (Fig. 3.15 and data not shown). It might be possible
that GAS2L3 is per se highly unstable and only stabilized by specific posttranslational
modifications during particular cell cycle stages like mitosis. Well known posttranslational
modifications which control many aspects of mitosis by regulating protein activity are protein
phosphorylation and dephosphorylation. Recent work has highlighted the important role played
by protein phosphatases in the regulation of mitosis and show that protein phosphatases are
not merely silent partners to kinases (Trinkle-Mulcahy and Lamond, 2006). Master mitotic
kinases are CDK1, PLK1 and Aurora B and the master phosphatases are PP1 and CDC25.
Screening for predictive GAS2L3 mitotic phosphorylation sites identified four putative CDK1
sites in the C-terminus. However, site specific mutagenesis resulting in the disruption of those
phosphorylation sites did neither alter protein stability nor protein localization to the midbody
(data not shown).
Like phosphorylation, O-GlcNAc (O-linked-beta-N-acetylglucosamine) is a reversible
modification of nuclear and cytoplasmic proteins and consists of the attachment of a single β-N-
acetyl-glucosamine moiety to hydroxyl groups of serine or threonine residues. O-GlcNAc
transferase (OGT) catalyzes the addition of the sugar moiety from the donor substrate to
proteins (Hart et al., 2007). During M phase, OGT localizes to discrete structures, such as
centrosomes in metaphase and the mitotic spindle in anaphase. During cytokinesis OGT
localizes to the midbody along with O-GlcNAcase (OGA), the enzyme that removes the sugar.
Interestingly, OGT overexpression in HeLa cells reduces the abundance of protein components
of the chromosomal passenger complex at the midbody, resulting in an increase in polyploidy
due to defective cytokinesis (Slawson et al., 2005; Wang et al., 2010). However, the identity of
other OGT mitotic substrates is currently not known and it is tempting to speculate that GAS2L3
might be an OGT substrate.
To get information about the mechanism affecting GAS2L3 protein characteristics,
posttranslational modification sites could be identified by mass spectrometry. However, one
problem is that endogenous GAS2L3 could never be detected by IP/WB, even after cell
synchronization in different cell cycle stages (Fig. 3.15). Given that immunofluorescence
staining only detected endogenous GAS2L3 at the midbody (Fig. 3.9), it should be tested, if
GAS2L3 could be detected by immunoblot analysis from purified midbodies.
DISCUSSION
77
4.5 Biological relevance: GAS2L3 is a regulator of mitosis
and cytokinesis
Genes with mitotic functions such as Cyclin B, Aurora B and PLK1 have similar transcriptional
expression profiles during the cell cycle, as they are all induced in G2/M. In 2002 Whitfield et al.
reported that 566 genes in the human transcriptome are induced in G2 or G2/M, and
interestingly GAS2L3 was found to be one of 30 novel genes with the best induction in G2/M
(Whitfield et al., 2002).
Also in this work, GAS2L3 gene expression profiles (Fig. 3.2 & 3.3) and subcellular
localization of GAS2L3 (Fig. 3.7 & 3.8) suggested that it might be a regulator of mitosis and
cytokinesis.
4.5.1 GAS2L3 depletion results in mitosis and cytokinesis failure
Strikingly, GAS2L3 depleted HeLa cells showed a significant enrichment in multinucleated cells,
indicating failure during chromosome segregation in mitosis (Fig. 3.18 B). Additionally, I could
observe an enrichment of cells in cytokinesis (Fig. 3.18 A). This might be an indicator for
prolonged cytokinesis in GAS2L3 depleted cells, perhaps due to failure during the last step of
cytokinesis, the abscission.
Live cell imaging by time lapse microscopy (Kremling H, diploma thesis) showed that
metaphase-anaphase transition was significantly shortened in GAS2L3 depleted HeLa cells (16
min) compared to control cells (24 min). A shortened metaphase can result in chromosomal
mis-segregation since cells have not enough time for correct alignment at the metaphase plate
and bipolar kinetochore attachment. A high amount of GAS2L3 depleted cells (22 % compared
to 3.5 % of control cells) also showed defects in completing cytokinesis. Even though cells
started cytokinesis properly, they could not complete cytokinesis and the already divided sister
chromatids re-fused, often accompanied by nuclei de-fragmentation. Taken together, time lapse
microscopy confirmed my results obtained by single cell examination, representing that GAS2L3
is essential for proper M phase progression.
Depletion of master regulators of cytokinesis, for example Anillin or the chromosomal
passenger protein INCENP (inner centromere protein), result typically in an increase of
binucleated cells, which can be easily observed in elevated amounts of G2/M cells by FACS
analysis (Oegema et al., 2000; Zhao and Fang, 2005; Zhu et al., 2005a). Binucleated cells arise
from failure during the last step of cytokinesis, the abscission of the cytoplasmatic membrane in
two daughter cells.
Even though mitosis and cytokinesis failure induced by GAS2L3 depletion in HeLa cells
were detectable at the single cell stage (Fig. 3.18 A & B), they did not result in a severe
phenotype detectable by FACS analysis (Fig. 3.17). Also single cell examination showed no
DISCUSSION
78
enrichment of binucleated cells upon GAS2L3 depletion compared to control cells (Fig. 3.18 D).
In contrast, depletion of LIN9, a well known transcriptional regulator of many cytokinesis genes,
enriched the amount of binucleated cells from under 1 % in control up to 8 % in LIN9 depleted
cells (Fig. 3.18 D). Therefore, the mechanism how GAS2L3 depletion affects cytokinesis,
resulting in a low but reproducible number of cells showing nuclei re-fusion accompanied by
nuclei de-fragmentation, cannot be simply explained by GAS2L3 being a regulator of
abscission.
Also for other midbody components it has been already shown that depletion in cell
culture does not necessarily result in severe cytokinesis defects. A very good example is ASPM,
the abnormal spindle-like microcephaly associated protein. Homozygous mutations in the
ASPM gene are the leading cause of autosomal recessive primary microcephaly, a neurological
disorder in which patients exhibit reduced occipital frontal head circumference and mild to
severe mental retardation (Woods et al., 2005; Zhong et al., 2005). ASPM is the putative human
ortholog of the Drosophila melanogaster abnormal spindle gene (asp), which is essential for
mitotic spindle function. Larval neuroblasts in Drosophila asp mutants fail to complete
asymmetric cell division (do Carmo Avides and Glover, 1999; Gonzalez et al., 1990). In human
cells, ASPM has been shown to localize to the midbody ring in vitro (Paramasivam et al., 2007).
Despite its midbody localization, depletion of ASPM in mammalian cell culture has never been
described to result in cytokinesis failure (Fish et al., 2006; Horvath et al., 2006; Zhong et al.,
2005).
It could be possible that GAS2L3 depletion, like ASPM, has in vivo a severe phenotype
compared to the in vitro phenotype in cell culture. If GAS2L3 is for example essential during
embryonic development or for the maintenance of genomic integrity, there would be no chance
to identify such functions by using HeLa cells, an already highly transformed human breast
cancer cell line. First evidence for a possible role in maintaining genomic integrity comes from
experiments in the non transformed human foreskin fibroblast cell line BJ-ET. Even though
transient depletion of GAS2L3 by siRNA transfection had no impact on cell cycle distribution
(Fig. 3.19), stable GAS2L3 depleted BJ-ET cells by shRNA infection showed a slight decrease
in their proliferation rate (Fig. 3.20). Strikingly, after longer passaging of those stable GAS2L3
depleted BJ-ET cells, karyogram analysis and FISH examination revealed a slight increase in
aneuploidy (Wolter P, unpublished data).
The fact that more than 100 proteins have been identified to be midbody components
should also attract interest. It could be possible that other midbody components are able to
compensate for the decreased GAS2L3 expression. Therefore, the next important step should
be the identification of direct GAS2L3 interacting partners. Unfortunately, the instability of
GAS2L3 protein in human cells makes immunoprecipitation and immunoblot experiments very
difficult (Fig. 3.14 & 3.15).
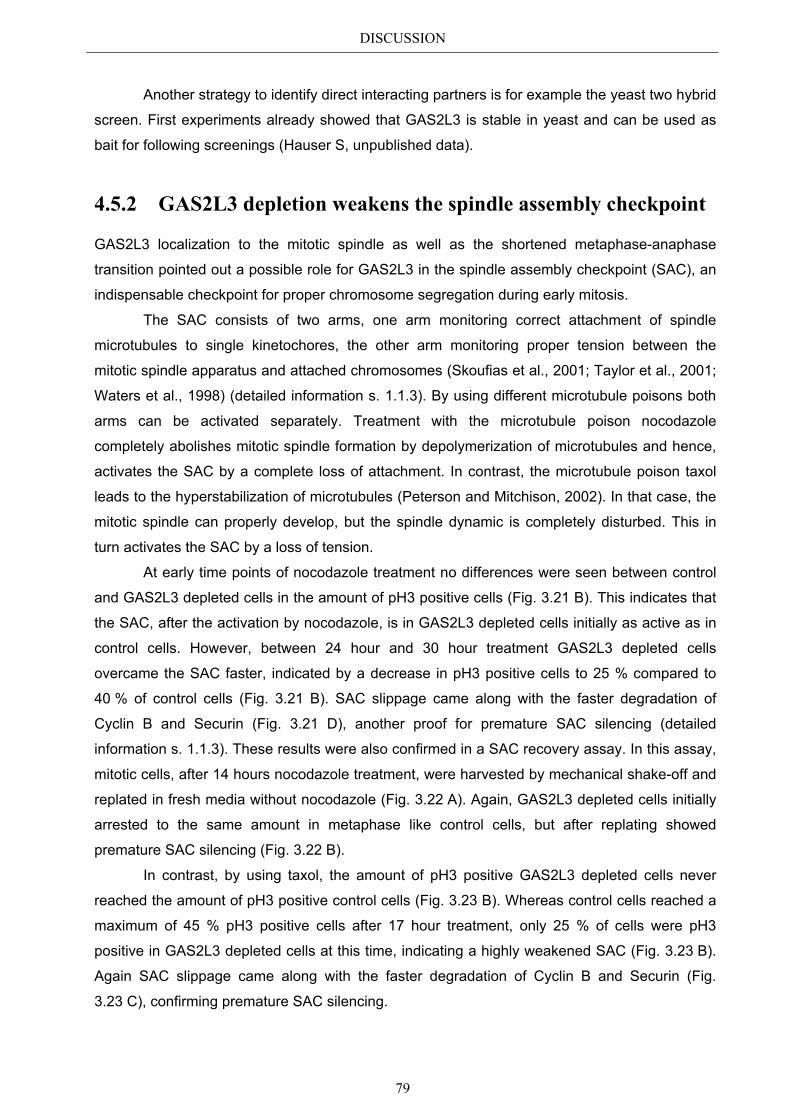
DISCUSSION
79
Another strategy to identify direct interacting partners is for example the yeast two hybrid
screen. First experiments already showed that GAS2L3 is stable in yeast and can be used as
bait for following screenings (Hauser S, unpublished data).
4.5.2 GAS2L3 depletion weakens the spindle assembly checkpoint
GAS2L3 localization to the mitotic spindle as well as the shortened metaphase-anaphase
transition pointed out a possible role for GAS2L3 in the spindle assembly checkpoint (SAC), an
indispensable checkpoint for proper chromosome segregation during early mitosis.
The SAC consists of two arms, one arm monitoring correct attachment of spindle
microtubules to single kinetochores, the other arm monitoring proper tension between the
mitotic spindle apparatus and attached chromosomes (Skoufias et al., 2001; Taylor et al., 2001;
Waters et al., 1998) (detailed information s. 1.1.3). By using different microtubule poisons both
arms can be activated separately. Treatment with the microtubule poison nocodazole
completely abolishes mitotic spindle formation by depolymerization of microtubules and hence,
activates the SAC by a complete loss of attachment. In contrast, the microtubule poison taxol
leads to the hyperstabilization of microtubules (Peterson and Mitchison, 2002). In that case, the
mitotic spindle can properly develop, but the spindle dynamic is completely disturbed. This in
turn activates the SAC by a loss of tension.
At early time points of nocodazole treatment no differences were seen between control
and GAS2L3 depleted cells in the amount of pH3 positive cells (Fig. 3.21 B). This indicates that
the SAC, after the activation by nocodazole, is in GAS2L3 depleted cells initially as active as in
control cells. However, between 24 hour and 30 hour treatment GAS2L3 depleted cells
overcame the SAC faster, indicated by a decrease in pH3 positive cells to 25 % compared to
40 % of control cells (Fig. 3.21 B). SAC slippage came along with the faster degradation of
Cyclin B and Securin (Fig. 3.21 D), another proof for premature SAC silencing (detailed
information s. 1.1.3). These results were also confirmed in a SAC recovery assay. In this assay,
mitotic cells, after 14 hours nocodazole treatment, were harvested by mechanical shake-off and
replated in fresh media without nocodazole (Fig. 3.22 A). Again, GAS2L3 depleted cells initially
arrested to the same amount in metaphase like control cells, but after replating showed
premature SAC silencing (Fig. 3.22 B).
In contrast, by using taxol, the amount of pH3 positive GAS2L3 depleted cells never
reached the amount of pH3 positive control cells (Fig. 3.23 B). Whereas control cells reached a
maximum of 45 % pH3 positive cells after 17 hour treatment, only 25 % of cells were pH3
positive in GAS2L3 depleted cells at this time, indicating a highly weakened SAC (Fig. 3.23 B).
Again SAC slippage came along with the faster degradation of Cyclin B and Securin (Fig.
3.23 C), confirming premature SAC silencing.
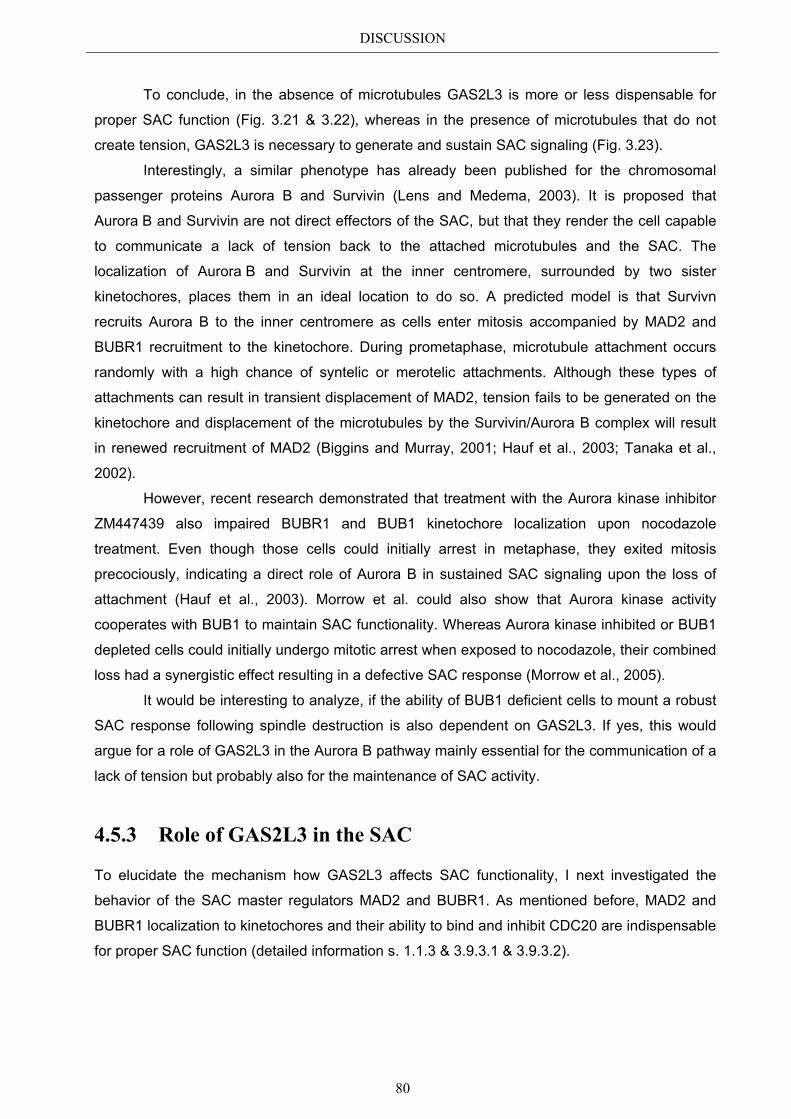
DISCUSSION
80
To conclude, in the absence of microtubules GAS2L3 is more or less dispensable for
proper SAC function (Fig. 3.21 & 3.22), whereas in the presence of microtubules that do not
create tension, GAS2L3 is necessary to generate and sustain SAC signaling (Fig. 3.23).
Interestingly, a similar phenotype has already been published for the chromosomal
passenger proteins Aurora B and Survivin (Lens and Medema, 2003). It is proposed that
Aurora B and Survivin are not direct effectors of the SAC, but that they render the cell capable
to communicate a lack of tension back to the attached microtubules and the SAC. The
localization of Aurora B and Survivin at the inner centromere, surrounded by two sister
kinetochores, places them in an ideal location to do so. A predicted model is that Survivn
recruits Aurora B to the inner centromere as cells enter mitosis accompanied by MAD2 and
BUBR1 recruitment to the kinetochore. During prometaphase, microtubule attachment occurs
randomly with a high chance of syntelic or merotelic attachments. Although these types of
attachments can result in transient displacement of MAD2, tension fails to be generated on the
kinetochore and displacement of the microtubules by the Survivin/Aurora B complex will result
in renewed recruitment of MAD2 (Biggins and Murray, 2001; Hauf et al., 2003; Tanaka et al.,
2002).
However, recent research demonstrated that treatment with the Aurora kinase inhibitor
ZM447439 also impaired BUBR1 and BUB1 kinetochore localization upon nocodazole
treatment. Even though those cells could initially arrest in metaphase, they exited mitosis
precociously, indicating a direct role of Aurora B in sustained SAC signaling upon the loss of
attachment (Hauf et al., 2003). Morrow et al. could also show that Aurora kinase activity
cooperates with BUB1 to maintain SAC functionality. Whereas Aurora kinase inhibited or BUB1
depleted cells could initially undergo mitotic arrest when exposed to nocodazole, their combined
loss had a synergistic effect resulting in a defective SAC response (Morrow et al., 2005).
It would be interesting to analyze, if the ability of BUB1 deficient cells to mount a robust
SAC response following spindle destruction is also dependent on GAS2L3. If yes, this would
argue for a role of GAS2L3 in the Aurora B pathway mainly essential for the communication of a
lack of tension but probably also for the maintenance of SAC activity.
4.5.3 Role of GAS2L3 in the SAC
To elucidate the mechanism how GAS2L3 affects SAC functionality, I next investigated the
behavior of the SAC master regulators MAD2 and BUBR1. As mentioned before, MAD2 and
BUBR1 localization to kinetochores and their ability to bind and inhibit CDC20 are indispensable
for proper SAC function (detailed information s. 1.1.3 & 3.9.3.1 & 3.9.3.2).
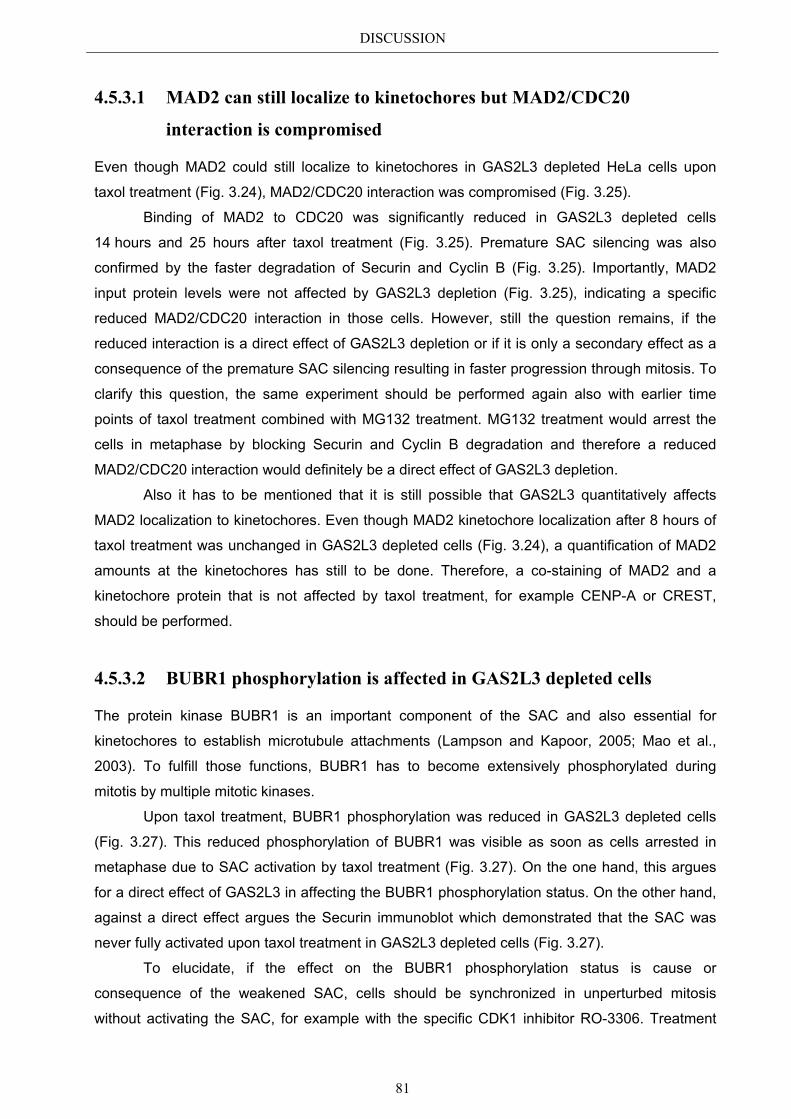
DISCUSSION
81
4.5.3.1 MAD2 can still localize to kinetochores but MAD2/CDC20
interaction is compromised
Even though MAD2 could still localize to kinetochores in GAS2L3 depleted HeLa cells upon
taxol treatment (Fig. 3.24), MAD2/CDC20 interaction was compromised (Fig. 3.25).
Binding of MAD2 to CDC20 was significantly reduced in GAS2L3 depleted cells
14 hours and 25 hours after taxol treatment (Fig. 3.25). Premature SAC silencing was also
confirmed by the faster degradation of Securin and Cyclin B (Fig. 3.25). Importantly, MAD2
input protein levels were not affected by GAS2L3 depletion (Fig. 3.25), indicating a specific
reduced MAD2/CDC20 interaction in those cells. However, still the question remains, if the
reduced interaction is a direct effect of GAS2L3 depletion or if it is only a secondary effect as a
consequence of the premature SAC silencing resulting in faster progression through mitosis. To
clarify this question, the same experiment should be performed again also with earlier time
points of taxol treatment combined with MG132 treatment. MG132 treatment would arrest the
cells in metaphase by blocking Securin and Cyclin B degradation and therefore a reduced
MAD2/CDC20 interaction would definitely be a direct effect of GAS2L3 depletion.
Also it has to be mentioned that it is still possible that GAS2L3 quantitatively affects
MAD2 localization to kinetochores. Even though MAD2 kinetochore localization after 8 hours of
taxol treatment was unchanged in GAS2L3 depleted cells (Fig. 3.24), a quantification of MAD2
amounts at the kinetochores has still to be done. Therefore, a co-staining of MAD2 and a
kinetochore protein that is not affected by taxol treatment, for example CENP-A or CREST,
should be performed.
4.5.3.2 BUBR1 phosphorylation is affected in GAS2L3 depleted cells
The protein kinase BUBR1 is an important component of the SAC and also essential for
kinetochores to establish microtubule attachments (Lampson and Kapoor, 2005; Mao et al.,
2003). To fulfill those functions, BUBR1 has to become extensively phosphorylated during
mitotis by multiple mitotic kinases.
Upon taxol treatment, BUBR1 phosphorylation was reduced in GAS2L3 depleted cells
(Fig. 3.27). This reduced phosphorylation of BUBR1 was visible as soon as cells arrested in
metaphase due to SAC activation by taxol treatment (Fig. 3.27). On the one hand, this argues
for a direct effect of GAS2L3 in affecting the BUBR1 phosphorylation status. On the other hand,
against a direct effect argues the Securin immunoblot which demonstrated that the SAC was
never fully activated upon taxol treatment in GAS2L3 depleted cells (Fig. 3.27).
To elucidate, if the effect on the BUBR1 phosphorylation status is cause or
consequence of the weakened SAC, cells should be synchronized in unperturbed mitosis
without activating the SAC, for example with the specific CDK1 inhibitor RO-3306. Treatment
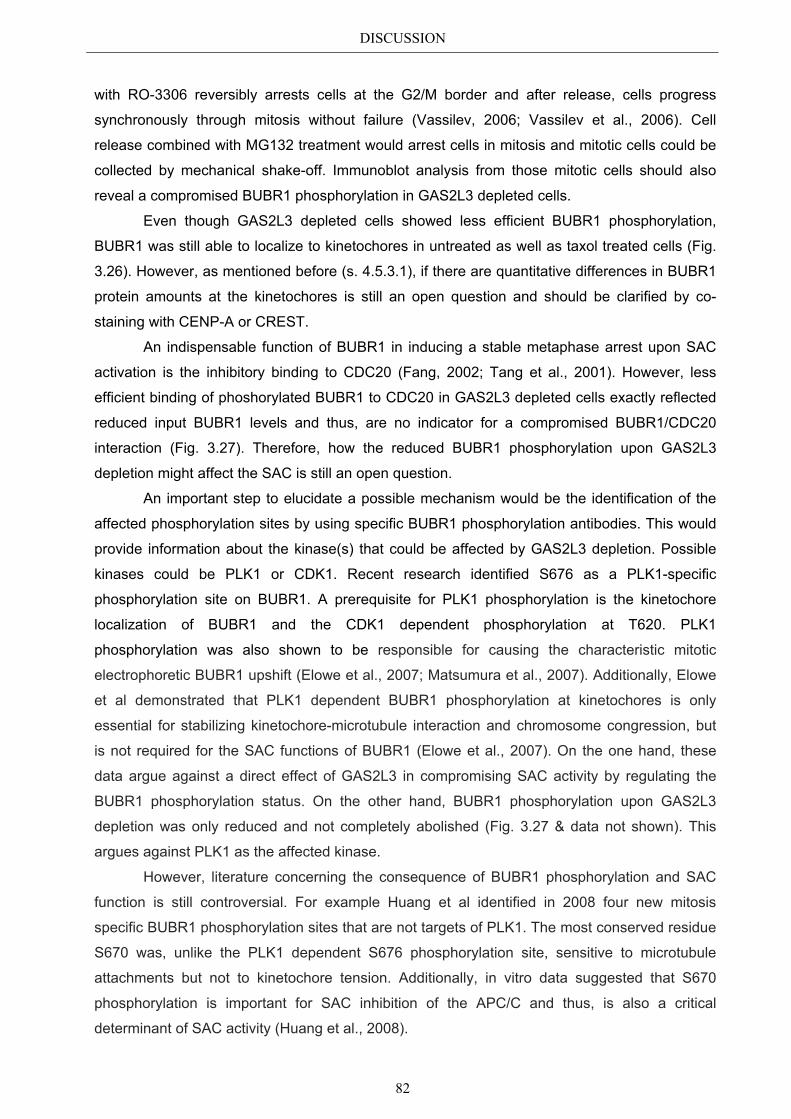
DISCUSSION
82
with RO-3306 reversibly arrests cells at the G2/M border and after release, cells progress
synchronously through mitosis without failure (Vassilev, 2006; Vassilev et al., 2006). Cell
release combined with MG132 treatment would arrest cells in mitosis and mitotic cells could be
collected by mechanical shake-off. Immunoblot analysis from those mitotic cells should also
reveal a compromised BUBR1 phosphorylation in GAS2L3 depleted cells.
Even though GAS2L3 depleted cells showed less efficient BUBR1 phosphorylation,
BUBR1 was still able to localize to kinetochores in untreated as well as taxol treated cells (Fig.
3.26). However, as mentioned before (s. 4.5.3.1), if there are quantitative differences in BUBR1
protein amounts at the kinetochores is still an open question and should be clarified by co-
staining with CENP-A or CREST.
An indispensable function of BUBR1 in inducing a stable metaphase arrest upon SAC
activation is the inhibitory binding to CDC20 (Fang, 2002; Tang et al., 2001). However, less
efficient binding of phoshorylated BUBR1 to CDC20 in GAS2L3 depleted cells exactly reflected
reduced input BUBR1 levels and thus, are no indicator for a compromised BUBR1/CDC20
interaction (Fig. 3.27). Therefore, how the reduced BUBR1 phosphorylation upon GAS2L3
depletion might affect the SAC is still an open question.
An important step to elucidate a possible mechanism would be the identification of the
affected phosphorylation sites by using specific BUBR1 phosphorylation antibodies. This would
provide information about the kinase(s) that could be affected by GAS2L3 depletion. Possible
kinases could be PLK1 or CDK1. Recent research identified S676 as a PLK1-specific
phosphorylation site on BUBR1. A prerequisite for PLK1 phosphorylation is the kinetochore
localization of BUBR1 and the CDK1 dependent phosphorylation at T620. PLK1
phosphorylation was also shown to be responsible for causing the characteristic mitotic
electrophoretic BUBR1 upshift (Elowe et al., 2007; Matsumura et al., 2007). Additionally, Elowe
et al demonstrated that PLK1 dependent BUBR1 phosphorylation at kinetochores is only
essential for stabilizing kinetochore-microtubule interaction and chromosome congression, but
is not required for the SAC functions of BUBR1 (Elowe et al., 2007). On the one hand, these
data argue against a direct effect of GAS2L3 in compromising SAC activity by regulating the
BUBR1 phosphorylation status. On the other hand, BUBR1 phosphorylation upon GAS2L3
depletion was only reduced and not completely abolished (Fig. 3.27 & data not shown). This
argues against PLK1 as the affected kinase.
However, literature concerning the consequence of BUBR1 phosphorylation and SAC
function is still controversial. For example Huang et al identified in 2008 four new mitosis
specific BUBR1 phosphorylation sites that are not targets of PLK1. The most conserved residue
S670 was, unlike the PLK1 dependent S676 phosphorylation site, sensitive to microtubule
attachments but not to kinetochore tension. Additionally, in vitro data suggested that S670
phosphorylation is important for SAC inhibition of the APC/C and thus, is also a critical
determinant of SAC activity (Huang et al., 2008).
DISCUSSION
83
The discrepancy of those studies might be dependent on whether compromised BUBR1
phosphorylation has impact on BUBR1 kinase activity, encoded by the C-terminus. Even though
the role of this kinase domain in SAC function, and in mitosis generally, is also still
controversial, evidence is coming from data in Xenopus extracts, in MEFs and in human cells
that BUBR1 kinase activity is essential for sustaining SAC signaling (Kops et al., 2004;
Malureanu et al., 2009; Mao et al., 2003).
At kinetochores, BUBR1 kinase activity is turned on through phosphorylation by the
microtubule motor protein CENP-E and vice versa, BUBR1 kinetochore localization is also
essential for CENP-E kinetochore association (Mao et al., 2003; Mao et al., 2005). Whereas
kinase-dead BUBR1 has been shown to still localize to kinetochores in the absence of
endogenous BUBR1, SAC activity could only be partially restored (Malureanu et al., 2009). This
suggests that prolonged SAC signaling requires BUBR1 kinase activity at kinetochores. The
identification of the substrates through which kinetochore bound BUBR1 acts to sustain SAC
signaling will be important future experiments.
It could be possible that the affected kinase upon GAS2L3 depletion might be CENP-E.
Therefore, the next important experiment would be an in vitro BUBR1 kinase assay to
investigate, if the compromised phosphorylation upon GAS2L3 depletion weakens BUBR1
kinase activity. Interestingly, the BUBR1 kinase activity is not required for CDC20 binding and
for BUBR1 kinetochore localization (Malureanu et al., 2009; Tang et al., 2001). So it is still
possible that albeit BUBR1/CDC20 interaction and BUBR1 kinetochore localization were not
compromised upon GAS2L3 depletion (Fig. 3.26 & 3.27), BUBR1 kinase activity might be
affected.
4.6 Hypothesis
Aneuploidy is the most common characteristic of human solid tumors and has therefore been
proposed to contribute to, or even to drive, tumor development. The SAC guards against
chromosome mis-segregation by delaying cell cycle progression through mitosis until all
chromosomes have successfully made spindle microtubule attachments. Defects in the SAC
generate aneuploidy and hence might facilitate tumorigenesis. In this study, I could demonstrate
that GAS2L3 is essential for proper SAC function and furthermore for proper cytokinesis, but the
underlying mechanism is so far unknown.
The molecular mechanism of cytokinesis is still not completely understood. One
important open question is the mechanism linking the contractile ring to the plasma membrane
or the mechanism stabilizing the interaction of the contractile ring and the spindle midzone. A
possibility is that proteins, containing actin as well as microtubule binding domains, function as
specific linker proteins. One of the proteins known to have a pivotal role as linker protein is the
actin binding protein Anillin. Recent studies indicated that Anillin is not only necessary for the
DISCUSSION
84
organization of the contractile ring, but also for linking structural components of the ring to
signaling proteins that control cytokinesis and mitotic exit (D'Avino et al., 2008; Piekny and
Glotzer, 2008). Moreover, Anillin establishes a direct connection between the contractile ring
and spindle microtubules at the cell division site (D'Avino et al., 2008; Gregory et al., 2008).
Except for Anillin, to date, remarkably few actin binding proteins have been identified among the
genes implicated in cytokinesis (Glotzer, 2005). Since I could demonstrate that midbody
localization of GAS2L3 during cytokinesis is not only dependent on the microtubule binding
domains but also on the CH domain, it is tempting to speculate that GAS2L3 might be such a
linker protein.
Concerning GAS2L3 function at the SAC, it is difficult to propose a hypothesis due to the
complexity of this checkpoint. What I can conclude from my experiments is that in the absence
of microtubules (nocodazole treatment) GAS2L3 is more or less dispensable for proper SAC
function, whereas in the presence of microtubules that do not create tension (taxol treatment),
GAS2L3 is necessary to generate and sustain SAC signaling. This argues for GAS2L3 playing a
role similar to Aurora B and not for being a direct participant in SAC signaling. It is thinkable that
by localizing to mitotic spindle microtubules, GAS2L3 acts as a transducer protein in the Aurora
B pathway, known to be responsible for sensing the tension between attached kinetochores. In
this scenario, GAS2L3 would transduce the mechanical property sensed by Aurora B into a
biochemical signal, therefore rendering the cell capable to communicate a lack of tension back
to the SAC.
An obvious phenotype upon GAS2L3 depletion and SAC activation was also the
reduced phosphorylation of BUBR1. However, the impact of the BUBR1 phosphorylation status
in relation to SAC function is highly dependent on the affected phosphorylation sites. PLK1
phosphorylation at S676 has been shown to be not essential for SAC function and only for
stable kinetochore microtubule attachments. In contrast, phosphorylation by CENP-E affects
BUBR1 kinase activity and BUBR1 kinase activity has been shown to be essential for sustained
SAC signaling. Therefore, it is possible that GAS2L3 might be a direct effector of the SAC and
essential for sustained SAC signaling. This would be an explanation for the premature SAC
silencing in nocodazole treated cells upon GAS2L3 depletion. However, before proposing any
hypothesis, it is crucial to find out whether reduced BUBR1 phosphorylation is cause or
consequence of the weakened SAC.
Since a complete understanding of mitotic regulation is central to dissecting the basic
mechanisms of tumorigenesis, further research on GAS2L3 is indispensable.
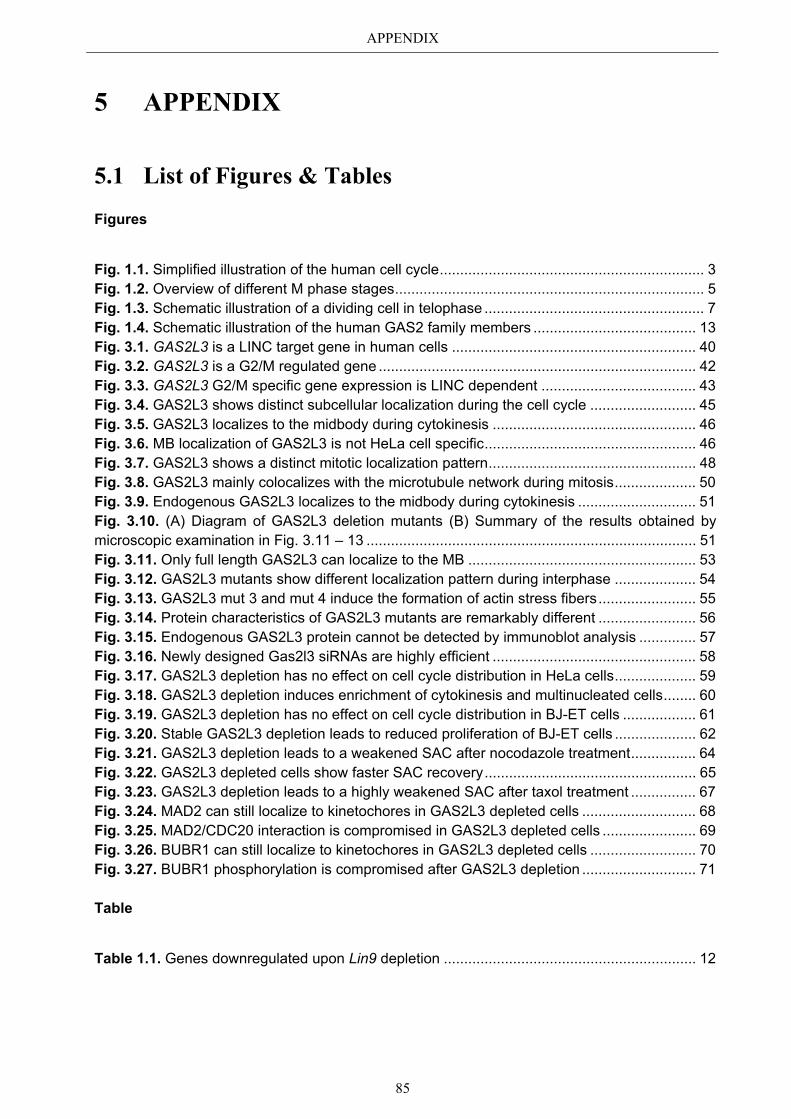
APPENDIX
85
5 APPENDIX
5.1 List of Figures & Tables
Figures
Fig. 1.1. Simplified illustration of the human cell cycle ................................................................. 3 Fig. 1.2. Overview of different M phase stages ............................................................................ 5 Fig. 1.3. Schematic illustration of a dividing cell in telophase ...................................................... 7 Fig. 1.4. Schematic illustration of the human GAS2 family members ........................................ 13 Fig. 3.1. GAS2L3 is a LINC target gene in human cells ............................................................ 40 Fig. 3.2. GAS2L3 is a G2/M regulated gene .............................................................................. 42 Fig. 3.3. GAS2L3 G2/M specific gene expression is LINC dependent ...................................... 43 Fig. 3.4. GAS2L3 shows distinct subcellular localization during the cell cycle .......................... 45 Fig. 3.5. GAS2L3 localizes to the midbody during cytokinesis .................................................. 46 Fig. 3.6. MB localization of GAS2L3 is not HeLa cell specific .................................................... 46 Fig. 3.7. GAS2L3 shows a distinct mitotic localization pattern ................................................... 48 Fig. 3.8. GAS2L3 mainly colocalizes with the microtubule network during mitosis .................... 50 Fig. 3.9. Endogenous GAS2L3 localizes to the midbody during cytokinesis ............................. 51 Fig. 3.10. (A) Diagram of GAS2L3 deletion mutants (B) Summary of the results obtained by microscopic examination in Fig. 3.11 – 13 ................................................................................. 51 Fig. 3.11. Only full length GAS2L3 can localize to the MB ........................................................ 53 Fig. 3.12. GAS2L3 mutants show different localization pattern during interphase .................... 54 Fig. 3.13. GAS2L3 mut 3 and mut 4 induce the formation of actin stress fibers ........................ 55 Fig. 3.14. Protein characteristics of GAS2L3 mutants are remarkably different ........................ 56 Fig. 3.15. Endogenous GAS2L3 protein cannot be detected by immunoblot analysis .............. 57 Fig. 3.16. Newly designed Gas2l3 siRNAs are highly efficient .................................................. 58 Fig. 3.17. GAS2L3 depletion has no effect on cell cycle distribution in HeLa cells .................... 59 Fig. 3.18. GAS2L3 depletion induces enrichment of cytokinesis and multinucleated cells ........ 60 Fig. 3.19. GAS2L3 depletion has no effect on cell cycle distribution in BJ-ET cells .................. 61 Fig. 3.20. Stable GAS2L3 depletion leads to reduced proliferation of BJ-ET cells .................... 62 Fig. 3.21. GAS2L3 depletion leads to a weakened SAC after nocodazole treatment ................ 64 Fig. 3.22. GAS2L3 depleted cells show faster SAC recovery .................................................... 65 Fig. 3.23. GAS2L3 depletion leads to a highly weakened SAC after taxol treatment ................ 67 Fig. 3.24. MAD2 can still localize to kinetochores in GAS2L3 depleted cells ............................ 68 Fig. 3.25. MAD2/CDC20 interaction is compromised in GAS2L3 depleted cells ....................... 69 Fig. 3.26. BUBR1 can still localize to kinetochores in GAS2L3 depleted cells .......................... 70 Fig. 3.27. BUBR1 phosphorylation is compromised after GAS2L3 depletion ............................ 71
Table
Table 1.1. Genes downregulated upon Lin9 depletion .............................................................. 12
APPENDIX
86
5.2 Abbreviations
ABD Actin binding domain APC/C Anaphase promoting complex/Cyclosome APS Ammonium persulfate AS Anti sense bp base pairs BSA Bovine serum albumine CDK Cyclin dependent kinase CH Calponin homology ChIP Chromatin immunoprecipitation DMEM Dulbecco`s modified eagle medium DMSO Dimethylsulfoxyde DNA Deoxyribonucleic acid DTT Dithiothreitol dNTP Deoxyribonucleotide triphosphate EDTA Ethylenediaminetetraacetic acid ESB Electrophoresis sample buffer FACS Fluorescence-associated cell sorting FCS Fetal calf serum Fig. Figure G0, G1, G2 Gap phases GAS Growth arrest specific GAPDH Glyceraldehyde-3-phosphate dehydrogenase GST Glutathione S-transferase h Hours HRP Horseradish peroxydase IF Immunofluorescence IP Immunoprecipitation kDa kiloDalton LB Luria Bertani LINC LIN complex MB Midbody MBD Microtubule binding domain MBR Midbody ring M phase Mitosis and cytokinesis MT Microtubules PBS Phosphate buffered saline PH3 Phosphorylated histone H3 (Ser10) PI Protease Inhibitor PMSF Phenylmethylsulphonyl fluoride pRB Retinoblastoma protein qRT-PCR Quantitative real-time polymerase chain reaction RNA Ribonucleic acid RNAi RNA interference shRNA short hairpin RNA siRNA small interfering RNA rpm Revolutions per minute RT Reverse transcriptase / Room temperature SDS Sodium dodecyl sulfate S phase Synthesis phase TAE Tris-acetate-EDTA TBS Tris-buffered saline WB Western blot
APPENDIX
87
5.3 References Akiyoshi, B., Nelson, C. R., Ranish, J. A., and Biggins, S. (2009). Quantitative proteomic analysis
of purified yeast kinetochores identifies a PP1 regulatory subunit. Genes Dev 23, 2887- 2899.
Baker, D. J., Jeganathan, K. B., Cameron, J. D., Thompson, M., Juneja, S., Kopecka, A., Kumar,
R., Jenkins, R. B., de Groen, P. C., Roche, P., and van Deursen, J. M. (2004). BubR1 insufficiency causes early onset of aging-associated phenotypes and infertility in mice. Nat Genet 36, 744-749.
Baker, D. J., Perez-Terzic, C., Jin, F., Pitel, K., Niederlander, N. J., Jeganathan, K., Yamada, S.,
Reyes, S., Rowe, L., Hiddinga, H. J., et al. (2008). Opposing roles for p16Ink4a and p19Arf in senescence and ageing caused by BubR1 insufficiency. Nat Cell Biol 10, 825- 836.
Benetti, R., Copetti, T., Dell'Orso, S., Melloni, E., Brancolini, C., Monte, M., and Schneider, C.
(2005). The calpain system is involved in the constitutive regulation of beta-catenin signaling functions. J Biol Chem 280, 22070-22080.
Benetti, R., Del Sal, G., Monte, M., Paroni, G., Brancolini, C., and Schneider, C. (2001). The
death substrate Gas2 binds m-calpain and increases susceptibility to p53-dependent apoptosis. EMBO J 20, 2702-2714.
Bharadwaj, R., and Yu, H. (2004). The spindle checkpoint, aneuploidy, and cancer. Oncogene
23, 2016-2027. Biggins, S., and Murray, A. W. (2001). The budding yeast protein kinase Ipl1/Aurora allows the
absence of tension to activate the spindle checkpoint. Genes Dev 15, 3118-3129. Bradford, M. M. (1976). A rapid and sensitive method for the quantitation of microgram quantities
of protein utilizing the principle of protein-dye binding. Anal Biochem 72, 248-254. Brancolini, C., Benedetti, M., and Schneider, C. (1995). Microfilament reorganization during
apoptosis: the role of Gas2, a possible substrate for ICE-like proteases. EMBO J 14, 5179-5190.
Brancolini, C., Bottega, S., and Schneider, C. (1992). Gas2, a growth arrest-specific protein, is a
component of the microfilament network system. J Cell Biol 117, 1251-1261. Brancolini, C., and Schneider, C. (1994). Phosphorylation of the growth arrest-specific protein
Gas2 is coupled to actin rearrangements during Go-->G1 transition in NIH 3T3 cells. J Cell Biol 124, 743-756.
Brito, D. A., and Rieder, C. L. (2006). Mitotic checkpoint slippage in humans occurs via cyclin B
destruction in the presence of an active checkpoint. Curr Biol 16, 1194-1200. Ciliberto, A., and Shah, J. V. (2009). A quantitative systems view of the spindle assembly
checkpoint. EMBO J 28, 2162-2173. Cleveland, D. W., Mao, Y., and Sullivan, K. F. (2003). Centromeres and kinetochores: from
epigenetics to mitotic checkpoint signaling. Cell 112, 407-421. Cobb, J., Miyaike, M., Kikuchi, A., and Handel, M. A. (1999). Meiotic events at the centromeric
heterochromatin: histone H3 phosphorylation, topoisomerase II alpha localization and chromosome condensation. Chromosoma 108, 412-425.
Coller, H. A. (2007). What's taking so long? S-phase entry from quiescence versus proliferation.
Nat Rev Mol Cell Biol 8, 667-670.
APPENDIX
88
Coughlin, S. R., Lee, W. M., Williams, P. W., Giels, G. M., and Williams, L. T. (1985). c-myc gene expression is stimulated by agents that activate protein kinase C and does not account for the mitogenic effect of PDGF. Cell 43, 243-251.
D'Avino, P. P. (2009). How to scaffold the contractile ring for a safe cytokinesis - lessons from
Anillin-related proteins. J Cell Sci 122, 1071-1079. D'Avino, P. P., Takeda, T., Capalbo, L., Zhang, W., Lilley, K. S., Laue, E. D., and Glover, D. M.
(2008). Interaction between Anillin and RacGAP50C connects the actomyosin contractile ring with spindle microtubules at the cell division site. J Cell Sci 121, 1151-1158.
Ditchfield, C., Johnson, V. L., Tighe, A., Ellston, R., Haworth, C., Johnson, T., Mortlock, A., Keen,
N., and Taylor, S. S. (2003). Aurora B couples chromosome alignment with anaphase by targeting BubR1, Mad2, and Cenp-E to kinetochores. J Cell Biol 161, 267-280.
do Carmo Avides, M., and Glover, D. M. (1999). Abnormal spindle protein, Asp, and the integrity
of mitotic centrosomal microtubule organizing centers. Science 283, 1733-1735. Dobles, M., Liberal, V., Scott, M. L., Benezra, R., and Sorger, P. K. (2000). Chromosome
missegregation and apoptosis in mice lacking the mitotic checkpoint protein Mad2. Cell 101, 635-645.
Doree, M., and Galas, S. (1994). The cyclin-dependent protein kinases and the control of cell
division. FASEB J 8, 1114-1121. Dyson, N. (1998). The regulation of E2F by pRB-family proteins. Genes Dev 12, 2245-2262. Eggert, U. S., Mitchison, T. J., and Field, C. M. (2006). Animal cytokinesis: from parts list
to mechanisms. Annu Rev Biochem 75, 543-566. Elowe, S., Hummer, S., Uldschmid, A., Li, X., and Nigg, E. A. (2007). Tension-sensitive Plk1
phosphorylation on BubR1 regulates the stability of kinetochore microtubule interactions. Genes Dev 21, 2205-2219.
Fang, G. (2002). Checkpoint protein BubR1 acts synergistically with Mad2 to inhibit anaphase-
promoting complex. Mol Biol Cell 13, 755-766. Feng, J., Huang, H., and Yen, T. J. (2006). CENP-F is a novel microtubule-binding protein that is
essential for kinetochore attachments and affects the duration of the mitotic checkpoint delay. Chromosoma 115, 320-329.
Fish, J. L., Kosodo, Y., Enard, W., Paabo, S., and Huttner, W. B. (2006). Aspm specifically
maintains symmetric proliferative divisions of neuroepithelial cells. Proc Natl Acad Sci U S A 103, 10438-10443.
Fontijn, R. D., Goud, B., Echard, A., Jollivet, F., van Marle, J., Pannekoek, H., and Horrevoets, A.
J. (2001). The human kinesin-like protein RB6K is under tight cell cycle control and is essential for cytokinesis. Mol Cell Biol 21, 2944-2955.
Fu, J., Bian, M., Jiang, Q., and Zhang, C. (2007). Roles of Aurora kinases in mitosis and
tumorigenesis. Mol Cancer Res 5, 1-10. Gavet, O., and Pines, J. (2010). Progressive activation of CyclinB1-Cdk1 coordinates entry to
mitosis. Dev Cell 18, 533-543. Gimona, M., and Mital, R. (1998). The single CH domain of calponin is neither sufficient nor
necessary for F-actin binding. J Cell Sci 111 ( Pt 13), 1813-1821. Gimona, M., and Winder, S. J. (1998). Single calponin homology domains are not actin-binding
domains. Curr Biol 8, R674-675. Glotzer, M. (2005). The molecular requirements for cytokinesis. Science 307, 1735-1739.
APPENDIX
89
Glotzer, M. (2009a). The 3Ms of central spindle assembly: microtubules, motors and MAPs. Nat Rev Mol Cell Biol 10, 9-20.
Glotzer, M. (2009b). Cytokinesis: GAP gap. Curr Biol 19, R162-165. Gonzalez, C., Saunders, R. D., Casal, J., Molina, I., Carmena, M., Ripoll, P., and Glover, D. M.
(1990). Mutations at the asp locus of Drosophila lead to multiple free centrosomes in syncytial embryos, but restrict centrosome duplication in larval neuroblasts. J Cell Sci 96 (Pt 4), 605-616.
Goriounov, D., Leung, C. L., and Liem, R. K. (2003). Protein products of human Gas2-related
genes on chromosomes 17 and 22 (hGAR17 and hGAR22) associate with both microfilaments and microtubules. J Cell Sci 116, 1045-1058.
Greenberg, M. E., and Ziff, E. B. (1984). Stimulation of 3T3 cells induces transcription of the c-fos
proto-oncogene. Nature 311, 433-438. Gregory, S. L., Ebrahimi, S., Milverton, J., Jones, W. M., Bejsovec, A., and Saint, R. (2008). Cell
division requires a direct link between microtubule-bound RacGAP and Anillin in the contractile ring. Curr Biol 18, 25-29.
Hardwick, K. G., Johnston, R. C., Smith, D. L., and Murray, A. W. (2000). MAD3 encodes a novel
component of the spindle checkpoint which interacts with Bub3p, Cdc20p, and Mad2p. J Cell Biol 148, 871-882.
Hart, G. W., Housley, M. P., and Slawson, C. (2007). Cycling of O-linked beta-N-
acetylglucosamine on nucleocytoplasmic proteins. Nature 446, 1017-1022. Hauf, S., Cole, R. W., LaTerra, S., Zimmer, C., Schnapp, G., Walter, R., Heckel, A., van Meel, J.,
Rieder, C. L., and Peters, J. M. (2003). The small molecule Hesperadin reveals a role for Aurora B in correcting kinetochore-microtubule attachment and in maintaining the spindle assembly checkpoint. J Cell Biol 161, 281-294.
Hauf, S., and Watanabe, Y. (2004). Kinetochore orientation in mitosis and meiosis. Cell 119, 317-
327. Horvath, S., Zhang, B., Carlson, M., Lu, K. V., Zhu, S., Felciano, R. M., Laurance, M. F., Zhao,
W., Qi, S., Chen, Z., et al. (2006). Analysis of oncogenic signaling networks in glioblastoma identifies ASPM as a molecular target. Proc Natl Acad Sci U S A 103, 17402-17407.
Hoyt, M. A., Totis, L., and Roberts, B. T. (1991). S. cerevisiae genes required for cell cycle arrest
in response to loss of microtubule function. Cell 66, 507-517. Huang, H., Hittle, J., Zappacosta, F., Annan, R. S., Hershko, A., and Yen, T. J. (2008).
Phosphorylation sites in BubR1 that regulate kinetochore attachment, tension, and mitotic exit. J Cell Biol 183, 667-680.
Humbert, P. O., Verona, R., Trimarchi, J. M., Rogers, C., Dandapani, S., and Lees, J. A. (2000).
E2f3 is critical for normal cellular proliferation. Genes Dev 14, 690-703. Jeganathan, K., Malureanu, L., Baker, D. J., Abraham, S. C., and van Deursen, J. M. (2007).
Bub1 mediates cell death in response to chromosome missegregation and acts to suppress spontaneous tumorigenesis. J Cell Biol 179, 255-267.
Joglekar, A. P., Bloom, K. S., and Salmon, E. D. (2010). Mechanisms of force generation by end-
on kinetochore-microtubule attachments. Curr Opin Cell Biol 22, 57-67. Johnson, R. P., and Craig, S. W. (1994). An intramolecular association between the head and tail
domains of vinculin modulates talin binding. J Biol Chem 269, 12611-12619. Johnson, R. P., and Craig, S. W. (1995). F-actin binding site masked by the intramolecular
association of vinculin head and tail domains. Nature 373, 261-264.
APPENDIX
90
Kalitsis, P., Fowler, K. J., Earle, E., Griffiths, B., Howman, E., Newson, A. J., and Choo, K. H.
(2003). Partially functional Cenpa-GFP fusion protein causes increased chromosome missegregation and apoptosis during mouse embryogenesis. Chromosome Res 11, 345-357.
Kamijo, K., Ohara, N., Abe, M., Uchimura, T., Hosoya, H., Lee, J. S., and Miki, T. (2006).
Dissecting the role of Rho-mediated signaling in contractile ring formation. Mol Biol Cell 17, 43-55.
Kastan, M. B., and Bartek, J. (2004). Cell-cycle checkpoints and cancer. Nature 432, 316-323. Kops, G. J., Foltz, D. R., and Cleveland, D. W. (2004). Lethality to human cancer cells through
massive chromosome loss by inhibition of the mitotic checkpoint. Proc Natl Acad Sci U.S.A 101, 8699-8704.
Kouprina, N., Pavlicek, A., Collins, N. K., Nakano, M., Noskov, V. N., Ohzeki, J., Mochida, G. H.,
Risinger, J. I., Goldsmith, P., Gunsior, M., et al. (2005). The microcephaly ASPM gene is expressed in proliferating tissues and encodes for a mitotic spindle protein. Hum Mol Genet 14, 2155-2165.
Kraft, C., Gmachl, M., and Peters, J. M. (2006). Methods to measure ubiquitin-dependent
proteolysis mediated by the anaphase-promoting complex. Methods 38, 39-51. Kramer, E. R., Scheuringer, N., Podtelejnikov, A. V., Mann, M., and Peters, J. M. (2000). Mitotic
regulation of the APC activator proteins CDC20 and CDH1. Mol Biol Cell 11, 1555-1569. Lampson, M. A., and Kapoor, T. M. (2005). The human mitotic checkpoint protein BubR1
regulates chromosome-spindle attachments. Nat Cell Biol 7, 93-98. Lee, D. H., and Goldberg, A. L. (1998). Proteasome inhibitors: valuable new tools for cell
biologists. Trends Cell Biol 8, 397-403. Lee, K. K., Tang, M. K., Yew, D. T., Chow, P. H., Yee, S. P., Schneider, C., and Brancolini, C.
(1999). gas2 is a multifunctional gene involved in the regulation of apoptosis and chondrogenesis in the developing mouse limb. Dev Biol 207, 14-25.
Lee, W. H., Bookstein, R., Hong, F., Young, L. J., Shew, J. Y., and Lee, E. Y. (1987a). Human
retinoblastoma susceptibility gene: cloning, identification, and sequence. Science 235, 1394-1399.
Lee, W. H., Shew, J. Y., Hong, F. D., Sery, T. W., Donoso, L. A., Young, L. J., Bookstein, R., and
Lee, E. Y. (1987b). The retinoblastoma susceptibility gene encodes a nuclear phosphoprotein associated with DNA binding activity. Nature 329, 642-645.
Lens, S. M., and Medema, R. H. (2003). The survivin/Aurora B complex: its role in coordinating
tension and attachment. Cell Cycle 2, 507-510. Li, M., Fang, X., Wei, Z., York, J. P., and Zhang, P. (2009). Loss of spindle assembly checkpoint-
mediated inhibition of Cdc20 promotes tumorigenesis in mice. J Cell Biol 185, 983-994. Li, R., and Murray, A. W. (1991). Feedback control of mitosis in budding yeast. Cell 66, 519-531. Li, W., Lan, Z., Wu, H., Wu, S., Meadows, J., Chen, J., Zhu, V., and Dai, W. (1999). BUBR1
phosphorylation is regulated during mitotic checkpoint activation. Cell Growth Differ 10, 769-775.
Li, X., and Nicklas, R. B. (1995). Mitotic forces control a cell-cycle checkpoint. Nature 373, 630-
632. Maiato, H., DeLuca, J., Salmon, E. D., and Earnshaw, W. C. (2004a). The dynamic kinetochore-
microtubule interface. J Cell Sci 117, 5461-5477.
APPENDIX
91
Maiato, H., Sampaio, P., and Sunkel, C. E. (2004b). Microtubule-associated proteins and their essential roles during mitosis. Int Rev Cytol 241, 53-153.
Malureanu, L. A., Jeganathan, K. B., Hamada, M., Wasilewski, L., Davenport, J., and van
Deursen, J. M. (2009). BubR1 N terminus acts as a soluble inhibitor of cyclin B degradation by APC/C(Cdc20) in interphase. Dev Cell 16, 118-131.
Mao, Y., Abrieu, A., and Cleveland, D. W. (2003). Activating and silencing the mitotic checkpoint
through CENP-E-dependent activation/inactivation of BubR1. Cell 114, 87-98. Mao, Y., Desai, A., and Cleveland, D. W. (2005). Microtubule capture by CENP-E silences
BubR1-dependent mitotic checkpoint signaling. J Cell Biol 170, 873-880. Matsumura, S., Toyoshima, F., and Nishida, E. (2007). Polo-like kinase 1 facilitates chromosome
alignment during prometaphase through BubR1. J Biol Chem 282, 15217-15227. Michel, L. S., Liberal, V., Chatterjee, A., Kirchwegger, R., Pasche, B., Gerald, W., Dobles, M.,
Sorger, P. K., Murty, V. V., and Benezra, R. (2001). MAD2 haplo-insufficiency causes premature anaphase and chromosome instability in mammalian cells. Nature 409, 355- 359.
Morgan, D. O. (1997). Cyclin-dependent kinases: engines, clocks, and microprocessors.
Annu Rev Cell Dev Biol 13, 261-291. Morrow, C. J., Tighe, A., Johnson, V. L., Scott, M. I., Ditchfield, C., and Taylor, S. S. (2005). Bub1
and aurora B cooperate to maintain BubR1-mediated inhibition of APC/CCdc20. J Cell Sci 118, 3639-3652.
Murray, A. W. (2004). Recycling the cell cycle: cyclins revisited. Cell 116, 221-234. Nasmyth, K. (2002). Segregating sister genomes: the molecular biology of chromosome
separation. Science 297, 559-565. Neef, R., Klein, U. R., Kopajtich, R., and Barr, F. A. (2006). Cooperation between mitotic kinesins
controls the late stages of cytokinesis. Curr Biol 16, 301-307. Nevins, J. R. (1992). E2F: a link between the Rb tumor suppressor protein and viral
oncoproteins. Science 258, 424-429. Nishimura, Y., and Yonemura, S. (2006). Centralspindlin regulates ECT2 and RhoA accumulation
at the equatorial cortex during cytokinesis. J Cell Sci 119, 104-114. Oegema, K., Savoian, M. S., Mitchison, T. J., and Field, C. M. (2000). Functional analysis of a
human homologue of the Drosophila actin binding protein anillin suggests a role in cytokinesis. J Cell Biol 150, 539-552.
Osterloh, L., von Eyss, B., Schmit, F., Rein, L., Hubner, D., Samans, B., Hauser, S., and
Gaubatz, S. (2007). The human synMuv-like protein LIN-9 is required for transcription of G2/M genes and for entry into mitosis. EMBO J 26, 144-157.
Paramasivam, M., Chang, Y. J., and LoTurco, J. J. (2007). ASPM and citron kinase co-localize to
the midbody ring during cytokinesis. Cell Cycle 6, 1605-1612. Pardee, A. B. (1974). A restriction point for control of normal animal cell proliferation. Proc Natl
Acad Sci U S A 71, 1286-1290. Paweletz, N. (2001). Walther Flemming: pioneer of mitosis research. Nat Rev Mol Cell Biol 2, 72-
75. Pearson, M. A., Reczek, D., Bretscher, A., and Karplus, P. A. (2000). Structure of the ERM
protein moesin reveals the FERM domain fold masked by an extended actin binding tail domain. Cell 101, 259-270.
APPENDIX
92
Perera, D., Tilston, V., Hopwood, J. A., Barchi, M., Boot-Handford, R. P., and Taylor, S. S. (2007). Bub1 maintains centromeric cohesion by activation of the spindle checkpoint. Dev Cell 13, 566-579.
Peters, J. M. (2002). The anaphase-promoting complex: proteolysis in mitosis and beyond. Mol
Cell 9, 931-943. Peters, J. M. (2006). The anaphase promoting complex/cyclosome: a machine designed to
destroy. Nat Rev Mol Cell Biol 7, 644-656. Peterson, J. R., and Mitchison, T. J. (2002). Small molecules, big impact: a history of chemical
inhibitors and the cytoskeleton. Chem Biol 9, 1275-1285. Petronczki, M., Lenart, P., and Peters, J. M. (2008). Polo on the Rise-from Mitotic Entry to
Cytokinesis with Plk1. Dev Cell 14, 646-659. Piekny, A., Werner, M., and Glotzer, M. (2005). Cytokinesis: welcome to the Rho zone. Trends
Cell Biol 15, 651-658. Piekny, A. J., and Glotzer, M. (2008). Anillin is a scaffold protein that links RhoA, actin, and
myosin during cytokinesis. Curr Biol 18, 30-36. Planas-Silva, M. D., and Weinberg, R. A. (1997). The restriction point and control of cell
proliferation. Curr Opin Cell Biol 9, 768-772. Pohl, C., and Jentsch, S. (2008). Final stages of cytokinesis and midbody ring formation are
controlled by BRUCE. Cell 132, 832-845. Porter, L. A., and Donoghue, D. J. (2003). Cyclin B1 and CDK1: nuclear localization and
upstream regulators. Prog Cell Cycle Res 5, 335-347. Raemaekers, T., Ribbeck, K., Beaudouin, J., Annaert, W., Van Camp, M., Stockmans, I., Smets,
N., Bouillon, R., Ellenberg, J., and Carmeliet, G. (2003). NuSAP, a novel microtubule- associated protein involved in mitotic spindle organization. J Cell Biol 162, 1017-1029.
Rao, C. V., Yamada, H. Y., Yao, Y., and Dai, W. (2009). Enhanced genomic instabilities caused
by deregulated microtubule dynamics and chromosome segregation: a perspective from genetic studies in mice. Carcinogenesis 30, 1469-1474.
Reichert, N., Wurster, S., Ulrich, T., Schmitt, K., Hauser, S., Probst, L., Gotz, R., Ceteci, F., Moll,
R., Rapp, U., and Gaubatz, S. (2010). Lin9, a subunit of the mammalian DREAM complex, is essential for embryonic development, for survival of adult mice, and for tumor suppression. Mol Cell Biol 30, 2896-2908.
Ribbeck, K., Raemaekers, T., Carmeliet, G., and Mattaj, I. W. (2007). A role for NuSAP in linking
microtubules to mitotic chromosomes. Curr Biol 17, 230-236. Rieder, C. L., Cole, R. W., Khodjakov, A., and Sluder, G. (1995). The checkpoint delaying
anaphase in response to chromosome monoorientation is mediated by an inhibitory signal produced by unattached kinetochores. J Cell Biol 130, 941-948.
Rieder, C. L., and Maiato, H. (2004). Stuck in division or passing through: what happens when
cells cannot satisfy the spindle assembly checkpoint. Dev Cell 7, 637-651. Sagona, A. P., and Stenmark, H. (2010). Cytokinesis and cancer. FEBS Lett 584, 2652-2661. Schiel, J. A., and Prekeris, R. (2010). Making the final cut - mechanisms mediating the
abscission step of cytokinesis. ScientificWorldJournal 10, 1424-1434. Schmit, F., Korenjak, M., Mannefeld, M., Schmitt, K., Franke, C., von Eyss, B., Gagrica, S.,
Hanel, F., Brehm, A., and Gaubatz, S. (2007). LINC, a human complex that is related to pRB-containing complexes in invertebrates regulates the expression of G2/M genes. Cell Cycle 6, 1903-1913.
APPENDIX
93
Schneider, C., King, R. M., and Philipson, L. (1988). Genes specifically expressed at growth
arrest of mammalian cells. Cell 54, 787-793. Shackelford, R. E., Kaufmann, W. K., and Paules, R. S. (1999). Cell cycle control, checkpoint
mechanisms, and genotoxic stress. Environ Health Perspect 107 Suppl 1, 5-24. Shannon, K. B., Canman, J. C., and Salmon, E. D. (2002). Mad2 and BubR1 function in a single
checkpoint pathway that responds to a loss of tension. Mol Biol Cell 13, 3706-3719. Sherr, C. J. (1994a). G1 phase progression: cycling on cue. Cell 79, 551-555. Sherr, C. J. (1994b). The ins and outs of RB: coupling gene expression to the cell cycle clock.
Trends Cell Biol 4, 15-18. Sherr, C. J. (1996). Cancer cell cycles. Science 274, 1672-1677. Sherr, C. J., Kato, J., Quelle, D. E., Matsuoka, M., and Roussel, M. F. (1994). D-type cyclins and
their cyclin-dependent kinases: G1 phase integrators of the mitogenic response. Cold Spring Harb Symp Quant Biol 59, 11-19.
Skop, A. R., Liu, H., Yates, J., 3rd, Meyer, B. J., and Heald, R. (2004). Dissection of the
mammalian midbody proteome reveals conserved cytokinesis mechanisms. Science 305, 61-66.
Skoufias, D. A., Andreassen, P. R., Lacroix, F. B., Wilson, L., and Margolis, R. L. (2001).
Mammalian mad2 and bub1/bubR1 recognize distinct spindle-attachment and kinetochore-tension checkpoints. Proc Natl Acad Sci U S A 98, 4492-4497.
Slawson, C., Zachara, N. E., Vosseller, K., Cheung, W. D., Lane, M. D., and Hart, G. W. (2005).
Perturbations in O-linked beta-N-acetylglucosamine protein modification cause severe defects in mitotic progression and cytokinesis. J Biol Chem 280, 32944-32956.
Stein, G. H. (1979). T98G: an anchorage-independent human tumor cell line that exhibits
stationary phase G1 arrest in vitro. J Cell Physiol 99, 43-54. Stern, B. M., and Murray, A. W. (2001). Lack of tension at kinetochores activates the spindle
checkpoint in budding yeast. Curr Biol 11, 1462-1467. Stevaux, O., and Dyson, N. J. (2002). A revised picture of the E2F transcriptional network and
RB function. Curr Opin Cell Biol 14, 684-691. Stradal, T., Kranewitter, W., Winder, S. J., and Gimona, M. (1998). CH domains revisited. FEBS
Lett 431, 134-137. Sudakin, V., Chan, G. K., and Yen, T. J. (2001). Checkpoint inhibition of the APC/C in HeLa cells
is mediated by a complex of BUBR1, BUB3, CDC20, and MAD2. J Cell Biol 154, 925-936.
Sun, D., Leung, C. L., and Liem, R. K. (2001). Characterization of the microtubule binding domain
of microtubule actin crosslinking factor (MACF): identification of a novel group of microtubule associated proteins. J Cell Sci 114, 161-172.
Tanaka, T. U., Rachidi, N., Janke, C., Pereira, G., Galova, M., Schiebel, E., Stark, M. J., and
Nasmyth, K. (2002). Evidence that the Ipl1-Sli15 (Aurora kinase-INCENP) complex promotes chromosome bi-orientation by altering kinetochore-spindle pole connections. Cell 108, 317-329.
Tang, Z., Bharadwaj, R., Li, B., and Yu, H. (2001). Mad2-Independent inhibition of APCCdc20 by
the mitotic checkpoint protein BubR1. Dev Cell 1, 227-237.
APPENDIX
94
Taylor, S. S., Hussein, D., Wang, Y., Elderkin, S., and Morrow, C. J. (2001). Kinetochore localisation and phosphorylation of the mitotic checkpoint components Bub1 and BubR1 are differentially regulated by spindle events in human cells. J Cell Sci 114, 4385-4395.
Taylor, S. S., Scott, M. I., and Holland, A. J. (2004). The spindle checkpoint: a quality control
mechanism which ensures accurate chromosome segregation. Chromosome Res 12, 599-616.
Torras-Llort, M., Moreno-Moreno, O., and Azorin, F. (2009). Focus on the centre: the role of
chromatin on the regulation of centromere identity and function. EMBO J 28, 2337-2348. Trimarchi, J. M., and Lees, J. A. (2002). Sibling rivalry in the E2F family. Nat Rev Mol Cell Biol 3,
11-20. Trinkle-Mulcahy, L., and Lamond, A. I. (2006). Mitotic phosphatases: no longer silent partners.
Curr Opin Cell Biol 18, 623-631. Vanoosthuyse, V., and Hardwick, K. G. (2009a). A novel protein phosphatase 1-dependent
spindle checkpoint silencing mechanism. Curr Biol 19, 1176-1181. Vanoosthuyse, V., and Hardwick, K. G. (2009b). Overcoming inhibition in the spindle checkpoint.
Genes Dev 23, 2799-2805. Vanoosthuyse, V., Meadows, J. C., van der Sar, S. J., Millar, J. B., and Hardwick, K. G. (2009).
Bub3p facilitates spindle checkpoint silencing in fission yeast. Mol Biol Cell 20, 5096- 5105.
Varis, A., Salmela, A. L., and Kallio, M. J. (2006). Cenp-F (mitosin) is more than a mitotic marker.
Chromosoma 115, 288-295. Vassilev, L. T. (2006). Cell cycle synchronization at the G2/M phase border by reversible
inhibition of CDK1. Cell Cycle 5, 2555-2556. Vassilev, L. T., Tovar, C., Chen, S., Knezevic, D., Zhao, X., Sun, H., Heimbrook, D. C., and
Chen, L. (2006). Selective small-molecule inhibitor reveals critical mitotic functions of human CDK1. Proc Natl Acad Sci U S A 103, 10660-10665.
Wang, Q., Liu, T., Fang, Y., Xie, S., Huang, X., Mahmood, R., Ramaswamy, G., Sakamoto, K.
M., Darzynkiewicz, Z., Xu, M., and Dai, W. (2004). BUBR1 deficiency results in abnormal megakaryopoiesis. Blood 103, 1278-1285.
Wang, Z., Udeshi, N. D., Slawson, C., Compton, P. D., Sakabe, K., Cheung, W. D., Shabanowitz,
J., Hunt, D. F., and Hart, G. W. (2010). Extensive crosstalk between O-GlcNAcylation and phosphorylation regulates cytokinesis. Sci Signal 3, ra2.
Waters, J. C., Chen, R. H., Murray, A. W., and Salmon, E. D. (1998). Localization of Mad2 to
kinetochores depends on microtubule attachment, not tension. J Cell Biol 141, 1181- 1191.
Weaver, B. A., and Cleveland, D. W. (2006). Does aneuploidy cause cancer? Curr Opin Cell Biol
18, 658-667. Weaver, B. A., Silk, A. D., Montagna, C., Verdier-Pinard, P., and Cleveland, D. W. (2007).
Aneuploidy acts both oncogenically and as a tumor suppressor. Cancer Cell 11, 25-36. Wei, Y., Yu, L., Bowen, J., Gorovsky, M. A., and Allis, C. D. (1999). Phosphorylation of histone
H3 is required for proper chromosome condensation and segregation. Cell 97, 99-109. Whitfield, M. L., Sherlock, G., Saldanha, A. J., Murray, J. I., Ball, C. A., Alexander, K. E., Matese,
J. C., Perou, C. M., Hurt, M. M., Brown, P. O., and Botstein, D. (2002). Identification of genes periodically expressed in the human cell cycle and their expression in tumors. Mol Biol Cell 13, 1977-2000.
APPENDIX
95
Woods, C. G., Bond, J., and Enard, W. (2005). Autosomal recessive primary microcephaly (MCPH): a review of clinical, molecular, and evolutionary findings. Am J Hum Genet 76, 717-728.
Wu, H., Lan, Z., Li, W., Wu, S., Weinstein, J., Sakamoto, K. M., and Dai, W. (2000).
p55CDC/hCDC20 is associated with BUBR1 and may be a downstream target of the spindle checkpoint kinase. Oncogene 19, 4557-4562.
Wulf, E., Deboben, A., Bautz, F. A., Faulstich, H., and Wieland, T. (1979). Fluorescent
phallotoxin, a tool for the visualization of cellular actin. Proc Natl Acad Sci U S A 76, 4498-4502.
Yu, H. (2002). Regulation of APC-Cdc20 by the spindle checkpoint. Curr Opin Cell Biol 14, 706-
714. Zhao, W. M., and Fang, G. (2005). Anillin is a substrate of anaphase-promoting
complex/cyclosome (APC/C) that controls spatial contractility of myosin during late cytokinesis. J Biol Chem 280, 33516-33524.
Zhong, X., Liu, L., Zhao, A., Pfeifer, G. P., and Xu, X. (2005). The abnormal spindle-like,
microcephaly-associated (ASPM) gene encodes a centrosomal protein. Cell Cycle 4, 1227-1229.
Zhu, C., Bossy-Wetzel, E., and Jiang, W. (2005a). Recruitment of MKLP1 to the spindle
midzone/midbody by INCENP is essential for midbody formation and completion of cytokinesis in human cells. Biochem J 389, 373-381.
Zhu, C., Zhao, J., Bibikova, M., Leverson, J. D., Bossy-Wetzel, E., Fan, J. B., Abraham, R. T.,
and Jiang, W. (2005b). Functional analysis of human microtubule-based motor proteins, the kinesins and dyneins, in mitosis/cytokinesis using RNA interference. Mol Biol Cell 16, 3187-3199.
Zucman-Rossi, J., Legoix, P., and Thomas, G. (1996). Identification of new members of the Gas2
and Ras families in the 22q12 chromosome region. Genomics 38, 247-254.
APPENDIX
96
5.4 Own publications
in preparation Schmitt K, Kremling H, Wolpert P, Probst L and Gaubatz S. The LINC target gene GAS2L3 is a novel regulator of mitosis and cytokinesis.
2010 Reichert N, Wurster S, Ulrich T, Schmitt K, Hauser S, Probst L, Götz R, Ceteci F, Moll R, Rapp U and Gaubatz S. LIN9, a subunit of the mammalian DREAM complex is essential for embryonic development, for survival of adult mice and for tumor suppression. Molecular and Cellular Biology 2010 June;30(12):2896-908.
2007 Schmit F, Korenjak M, Mannefeld M, Schmitt K, Franke C, von Eyss B, Gagrica S, Hänel F, Brehm A and Gaubatz S. LINC, a human complex that is related to pRb-containing complexes in invertebrates regulates the expression of G2/M genes. Cell Cycle 2007 August 1;6(15):1903-13.
Conference contributions (Talks & Posters)
06.-08.10.2010 Meeting “The Puzzling World of Cancer”, Integrated Graduate College of the SFB Transregio 17, Universität Würzburg
Talk: Schmitt K, Kremling H, Wolter P, Probst L and Gaubatz S. The LINC Target Gene GAS2L3 is a Novel Regulator of Mitosis and Cytokinesis.
21.-23.08.2008 Meeting “Cancer and the Cell Cycle”, ISREC, Lausanne (Schweiz)
Poster: Mannefeld M, Schmitt K, Gaubatz S. Regulation of G2/M gene expression by the human DREAM/ LIN complex in response to DNA damage.
06.-07.02.2008 Sonderforschungsbereich Transregio 17 Meeting, Universität Würzburg
Poster: Reichert N, Schmitt K, Spahr S, Götz R, Rapp UR, Gaubatz S. The role of LIN9 in Ras-dependent tumorigenesis.
APPENDIX
98
5.6 Eidesstattliche Erklärung
Hiermit erkläre ich, Kathrin Schmitt, geboren am 9. November 1977 in Freiburg im Breisgau, an
Eides statt, dass ich die vorliegende Dissertation selbständig verfasst habe und dabei keine
anderen als die von mir angegebenen Hilfsmittel und Quellen benutzt habe. Zitate sind als
solche gekennzeichnet.
Ich erkläre außerdem, dass die vorliegende Dissertation weder in gleicher noch in ähnlicher
Form bereits in einem anderen Prüfungsverfahren vorgelegen hat.
Ich habe früher, außer den mit dem Zulassungsantrag urkundlich vorgelegten Graden, keine
weiteren akademischen Grade erworben oder zu erwerben versucht.
Würzburg, 30. September 2010
______________________________
Kathrin Schmitt

ACKNOWLEDGEMENTS
I am grateful to Prof. Dr. Stefan Gaubatz for the opportunity to work in his lab and for
supervising my PhD thesis. Thank you for your continued scientific support and helpful
suggestions.
Thank you to Prof. Dr. Georg Krohne for the supervision of my PhD thesis as a representative
of the Faculty of Biology.
Many thanks to all my colleagues in the PCI, PCII & EBC for your help and advice. In particular,
I would like to thank my present lab mates for the pleasant working atmosphere, help, advice
and support: Tanja Ulrich, Jasmina Esterlechner, Piero Ocone, Stefanie Hauser, Susi Spahr
and Adelgunde Wolpert. Special thanks go to Leona Probst, Heidi Kremling and Patrick Wolter
for your assistance to my project.
Above all, I want to express my gratitude to my former lab mates: Mirijam Mannefeld, Nina
Reichert, Fabienne Schmit, Lisa Osterloh and Markus Kleinschmidt. Without your enthusiasm
for science, your unfailing optimism and your friendship I would have never started my PhD.
Special thanks go to my parents, sisters and Benjamin for your love, continued encouragement
and because I could always rely on you.