Embed Size (px)
Citation preview
Determination of discontinuity friction by rock mass classificationDetermination du frottement discontinu et des proprietes des roches intactes par classification des
massifs rocheuxBestimmung der Unstetigkeitsreibung und den Eigenschaften von ungest6rtem Felsgestein nach
Felsmassen-Klassifizierung
H. R.G. K. HACK, lTC, International Institute for Aerospace Survey and Earth Sciences, Delft, NetherlandsD.G. PRICE, Delft University of Technology, Department of Engineering Geology, Netherlands
ABSTRACf: An empirical relation ('sliding criterium') was found between simple field descriptions of discontinuity characteristics andfriction angle for discontinuities under low normal stress. The relation was established by analysing the stability of a large amount ofslopes. The large amount of slope stability assessments and descriptions of discontinuity characteristics on which the relation is based,made a probability analysis of the relation possible.
REsUME: Une relation empirique ('sliding criterium') est deterrninee entre des descriptions simples du terrain des caracteristiques dediscontinuite et l'angle de friction sons des conditions du stress bas normal. Cette relation est obtenne par I'analyse la stabilite d'un grandnombre de pentes. Ca, en combination avec les descriptions des caracteristiques de discontinuite en ce qui se base la relation a faciliteune analyse de probabilite de ladite relation.
ZUSAMMENFASSUNG: In diesem Aufsatz wird eine empirische Beziehung (sliding criterium) zwischen der einfachen Beschreibungvon Diskontinuitaten im Feld und dem Reibungswinkel fiir Diskontinuitaten unter niedrige Normalspannung vorgestellt. Grundlage fiirdie Formulierung dieser Beziehung bildet die Untersuchung von Diskontinuitaten und der Standfestigkeit einer grossen Anzahl vonBoschungshangen. Auf dieser Basis wurden Wahrscheinlichkeitsrechnungen durchgefiihrt.
1 INTRODUCTION
A relation between discontinuity friction parameters and fielddescriptions was found during the development of a rock massclassification scheme for slope stability (Hack et aI. 1993a,1993b, 1995). The rock slope classification system was developedduring four years of research in the Falset area in the north-eastof Spain. Here new roads have recently been built through amountainous terrain, necessitating a large number of new roadcuts.
Rocks in the Falset area vary from Tertiary conglomerates toCarboniferous slates and include rocks containing gypsum,shales, granite (fresh to completely weathered), limestone andsandstone. Existing old and new slopes with heights between 3and 20 m have been classified and assessed on stability by thestaff and students of ITC and the Thchnical University, Delft.Nearly all slopes have been classified and their stability assessedby more than one person to avoid observer bias. About 60different persons did the descriptions and bias in the overallresults is therefore not very likely. AlSQ the quantity of differentslopes (253) increases the reliability of the final results.
The slope orientation and orientations of all discontinuity setswere measured and the stability of the slope was assessedvisually. The discontinuity sets were described on roughness,infill and alteration of discontinuity walls, to provide data toestablish the discontinuity friction parameters.
2 DISCONTINUITY CHARACTERIZATION
\Vious authors have given sets of standards for the descriptionof discontinuities with the option to establish the friction parame-ters of a discontinuity (lSRM, 1978, 1981, Barton et aI., 1977,1980, Bieniawski, 1989, Laubscher, 1990). This research usedthat developed by Laubscher as this is one of the most detaileddescription systems.
The Laubscher system includes descriptions for roughness
Table 1. Discontinuity description (for examples of roughness profilesrefer to Laubscher, 1990).
WIN'J multi-directional :1.00WIN'J uni-directional :0.95curved :0.85slight undulating :0.80straight :0.75rough stepped/irregular :0.95smooth stepped :0.90slickensided stepped :0.85rough undulating :0.80smooth undulating :0.75slickensided undulating :0.70TOUghplanar :0.65smooth planar :0.60polished :0.55cemented infill :1.07no inftll - surface staining :1.00iioiisofteiirng-&s}ieare~rTcoirse-----:0.95-material, e.g. free of :medium :0.90clay, talc, etc. : fine :0.85---------------------+ ------ ---------soft sheared material, : coarse :0.75e.g. clay, talc, etc. : medium :0.65
: fine :0.55------------ .L _gouge < irregularities :0.42gouge > irregularities :0.17flowing material :0.05none :1.00karst :0.92
Roughness
large scale (RI)
Roughness
small scale (Rs)
(on an area of20 x 20 cmZ)
Infill
material (Im)
Karst (Ka)
(small and large scale), material friction, alteration of discon-tinuity walls, infill of discontinuities and the inti uence of water.As a result of the research this description system was modified(table 1) Major changes are that the presence of karst featuresalong discontinuities had to be added as a factor and thatalteration of discontinuity walls could be omitted. The factor for
23
'cemented' infill is related to calcitic cement. Discontinuitieswith a very strong type of cement, e.g. quartz, which is alsostrongly cemented to the adjacent rock, should not be consideredas a discontinuity. Easily dissolvable and deformable types ofcement, e.g. gypsum, should be characterized as non-cementedinfill. The factor for infill 'gouge> irregularities' should alwaysbe combined with the small scale roughness factor for 'polished' .Non-persistent discontinuities are classified as roughstepped/irregular. The roughness should be considered in thedirection of the slope dip if the roughness is anisotropic.
3 VISUAL ESTIMATED SLOPE STABILITY
The research was directed towards designing a slope stabilitysystem that includes all possible mechanisms and modes causinginstability. None of the analytical or numerical methods tocalculate a slope can incorporate all possible causes and thereforea visual estimation of the stability of the slopes is the onlypossible approach. Three classes have been used for the visualestimation of slope stability (table 2) It is obvious that a visualestimation of stability can in some situations be subjective. Theestimation of stability is distinct for slopes that have failed or forslopes where major problems causing instability are clearlyvisible. Also for definitely stable slopes the estimation can beassumed to be reliable. For slopes that have minor instabilityproblems estimation is more subjective.
Table 2. Classes fur visually estimated stability.
class description
1 stable No signs visible of failure or possible failure.
Small parts of the slope have failed or are
2small failing. For example small blocks roll down
problems the slope during rain; run-off water causesmaterial to be transported down the slope.
3large prob- Parts of the slope have failed or are failing.
lems
The description small or large is independent from the size (height orlength) of the slope.
4 ROCK SLOPE FAILURE
Slope failure mechanisms and their different modes, such as planesliding, wedge failure, toppling and, to some extent, buckling arediscontinuity related. Also non-discontinuity related agencies suchas deterioration of rock material, progressive weathering, intactrock creep, erosion due to (surface-) water and internal water(flow and pressure) can cause slope failures.
In general, the method to analyze slope stability in theliterature is to identify the mechanism and mode causing instabil-ity (plane sliding, toppling, etc.) and then calculate the relatedrock mass parameters that have allowed failure under thepresumed mechanism and mode. In this way a relation isestablished between one or more rock mass parameters and onefailure mechanism and mode. However the identification of thefailure mechanism and mode is often not straightforward and/ormore than one mechanism or mode is causing failure. If thefailure mechanism or mode is not recognized properly thenconsequently the relation found is erroneous or inaccurate. Theamount of mechanisms and modes causing slope instability andthe amount of parameters that governs the mechanisms andmodes are, in general, very large. Therefore a misconception ofthe failure mechanism or mode and related failure function iseasily made.
10 avoid this type of error, the analysis of the rock massparameters related to failure mechanisms and modes is mirroredin this research. Rather than investigating instability an analysisis done of the stable slopes, for certainly failure has not (at themoment of investigation) occurred in a stable slope. Thereforerecognition of the mechanisms and modes is not necessary.
5 'SLIDING' CRITERIUM
It is likely that any form of sliding along discontinuities in aslope, whether wedge or plane sliding, depends (partly or com-pletely) on the condition of the discontinuities and on the drivingforces in the direction of the slope working on the rock (mass)above the discontinuity. Release surfaces which allow sliding are
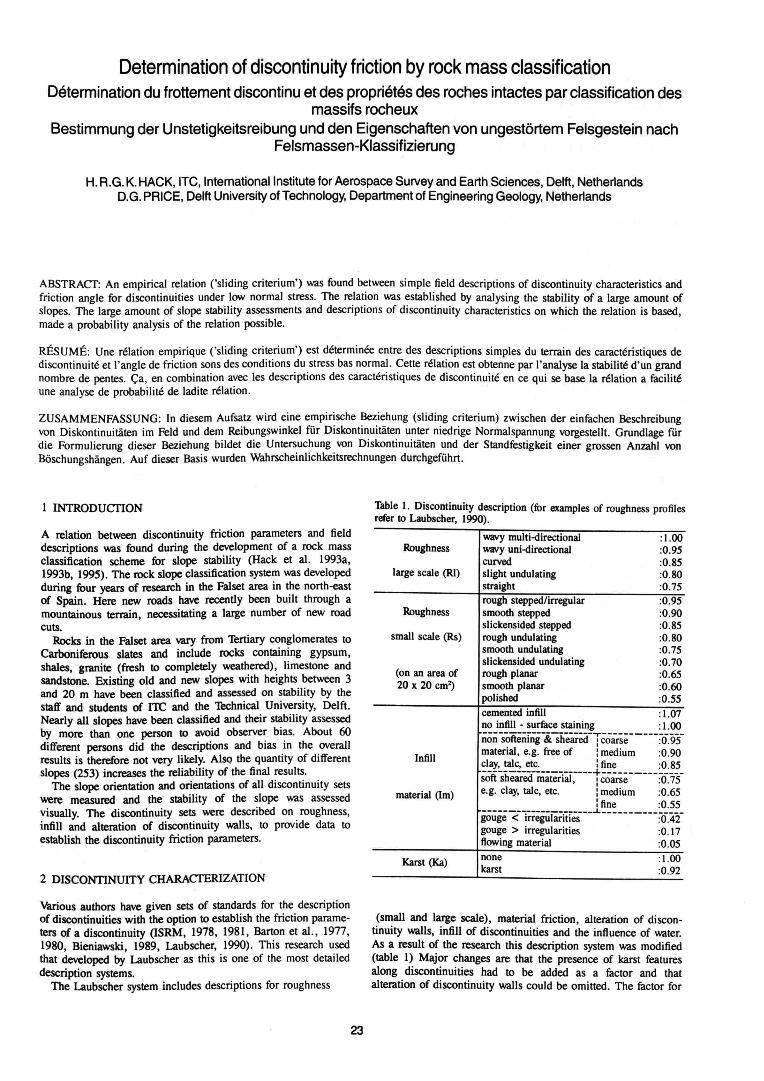
. present in (nearly) all slopes considered. Figure I shows thediscontinuity condition factor TC (which is a multiplication ofthe factors from table I; TC = Rl x Rs x 1m x Ka) versus 13 (=the apparent discontinuity dip in the direction of the slope dip)for discontinuities that dip in the direction of the slope and 13 <slope dip. 13, the apparent discontinuity dip in the direction of theslope dip is:
p ~ arctan [J cos ( dip direction.t/opc - dip direction __ IUd".)I• tan (dip dUtOltlWdry~
(1)
The accuracy of measuring dip and dip directions is certainlynot less than 5° (see below), therefore only discontinuities areincluded for which: dip,lope > 13 + 5°. If the difference is lessthan 5° the dipalopoand 13 are assumed to be equal and thediscontinuity plane forms the slope. The later are obviously nota cause for slope instability due to sliding. The dashed line in
*
+ lC
lC
+
.••••••• Mtirlla*l ttabHI\y* _<•••••1))( Ina_ (••••• 2)+ _(cI_3)
o o w ~ ~ ~ ~ ~ ro ~II (- apperent discontinuity dip In direction .Iope dip) (deg)
Figure 1. Discontinuity condition factor TC vs fJ for 'day-lighting'discontinuities in stable and unstable slopes.
Figure I indicates the boundary below which no discontinuitycondition factors of discontinuities in stable slopes plot except fortwo discontinuities (which have a difference just over 5 ° betweenslope dip and (3).
That only a relative limited amount of slopes fail through planesliding and that most of the values belonging-to instable slopesare relatively near to the dashed line (thus near to equilibrium) isnot unreasonable. The slopes analyzed are only those that haveexisted for some time. Slopes containing discontinuities with avery low discontinuity condition factor combined with a highapparent discontinuity dip in the direction of the slope dip (thusthose plotting further below the dashed line in figure 1) are likelyto have failed before the assessment took place. Generally failurewill have resulted in a stable slope but with a lower slope dip.
The relation found is independent of the intact rock materialand of the alteration of the discontinuity wall. In most discontinu-ities there is no tensile strength between the discontinuity planes
24
and also the normal stress on the discontinuity plane is (very) low(limited or no shearing through asperities) which explains that thecohesion is - 0 MPa.
For toppling a similar relation has been found. However dueto limited space this can not be discussed in detail in this paper.
6 CORRELATION WITH TEST VALUES
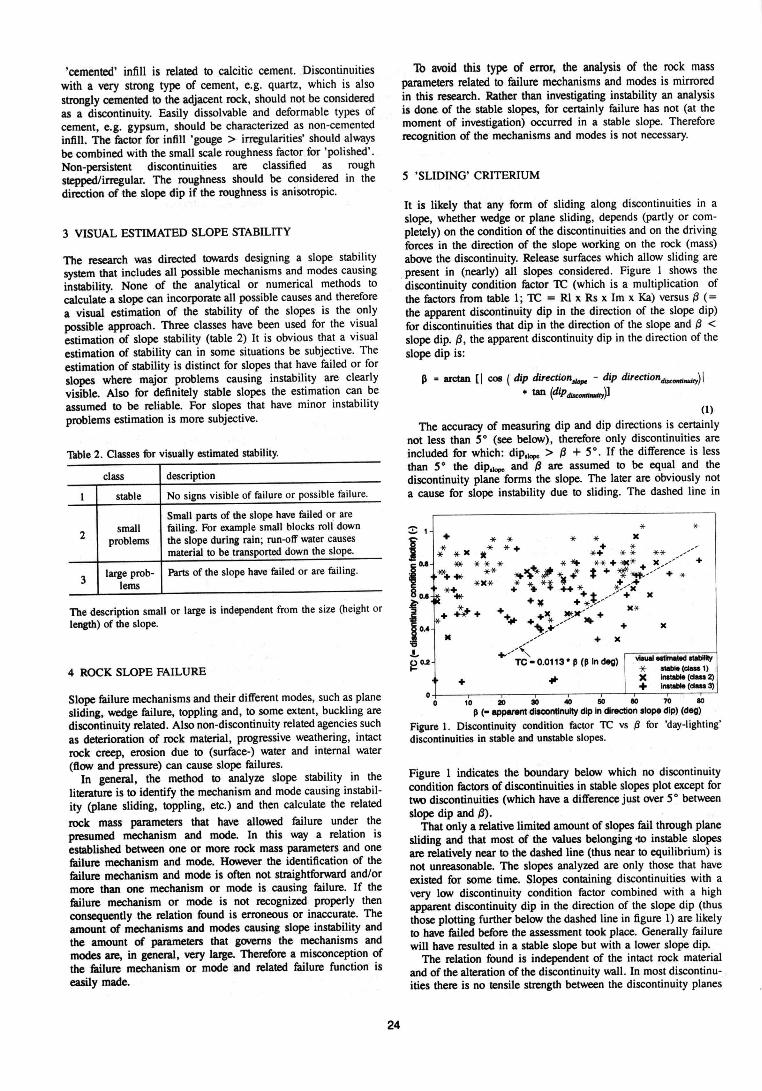
{3 is plotted versus the small scale roughness factor in figure 2together with the results of field tilt tests (tilt angle) and labora-tory shearbox tests. The shearbox values are not corrected fordilatation. Also are plotted the averages of shearbox testsperformed on artificial plaster samples (Grima, 1994). The corre-lation for the different data sets is quite reasonable, certainly forthe lower values. The scatter of the test results is such that thelinear regression lines in the graphs are rather an indication of atrend than a correlation. No dependency on rock material couldbe established for the tests.
The difference between {3and tilt angle and shearbox frictionfor the higher values might be explained by the difference inobtaining the data. The values resulting from the 'sliding
70
20O.A 0.80 0.81 0.70 0.75 0.80 0.85 0.80 0.85
amd acaJe roughneaa faclor
Figure 2. p, shearbox test friction and tilt angle vs small scale rough-ness factor.
criterium' represent the friction values for in-situ and fittingplanes. Also the discontinuity in-situ might have some (small)amount of cohesion between asperities on the discontinuity walls.The tilt and shearbox tests were done on sample blocks extractedfrom the slope. The extraction process can easily break thecohesion and damage the discontinuity planes. In particular sharpasperities, that cause the highest t-angle, are easily broken.Furthermore, during extraction and preparation of the sample, thesample halves are nearly always taken apart and re-fitted for thetilt or shearbox tests. The cohesion that might have been presentis broken and the re-fitting will often not be as good as theoriginal in-situ fit of the sample halves. A not so good fit willresult in a lower t-angle (Rengers, 1970) and thus also in a lowertilt angle or shearbox friction value and as it is likely that thehigher values result from a high t-angle rather than a highmaterial friction value; the influence of the sample preparation isobvious.
This is confirmed by the tests on the artificial plaster samples(Grima, 1994). The samples where made exactly according to thegraphs for roughness description of Laubscher (1990) and theISRM standard graphs (ISRM, 1978, 1981). Testing started withperfect fitting sample halves. Each value is the average of II to12 tests. The average values are considerably higher than theshearbox results on real rock samples but confirm the 'slidingcriterium' .
7 CORRELATION WITH LITERATURE VALUES
7.1 Basic friction
values reported in the literature for basic friction range from 230to 400 (Giani, 1992, Barton, 1973a - values for a clean, smoothdiamond saw cut). The friction for a straight polished surfacewithout infill equals 36.50 according to the 'sliding criterium',which is fairly well comparable. The differences between basicfriction for different rock materials reported in the literature aresmall and for many less than the range measured for one rockmaterial. This is also found for the 'sliding criterium' which doesnot show any significant difference in friction values for differentrock materials.
7.2 Small scale TOughness
•
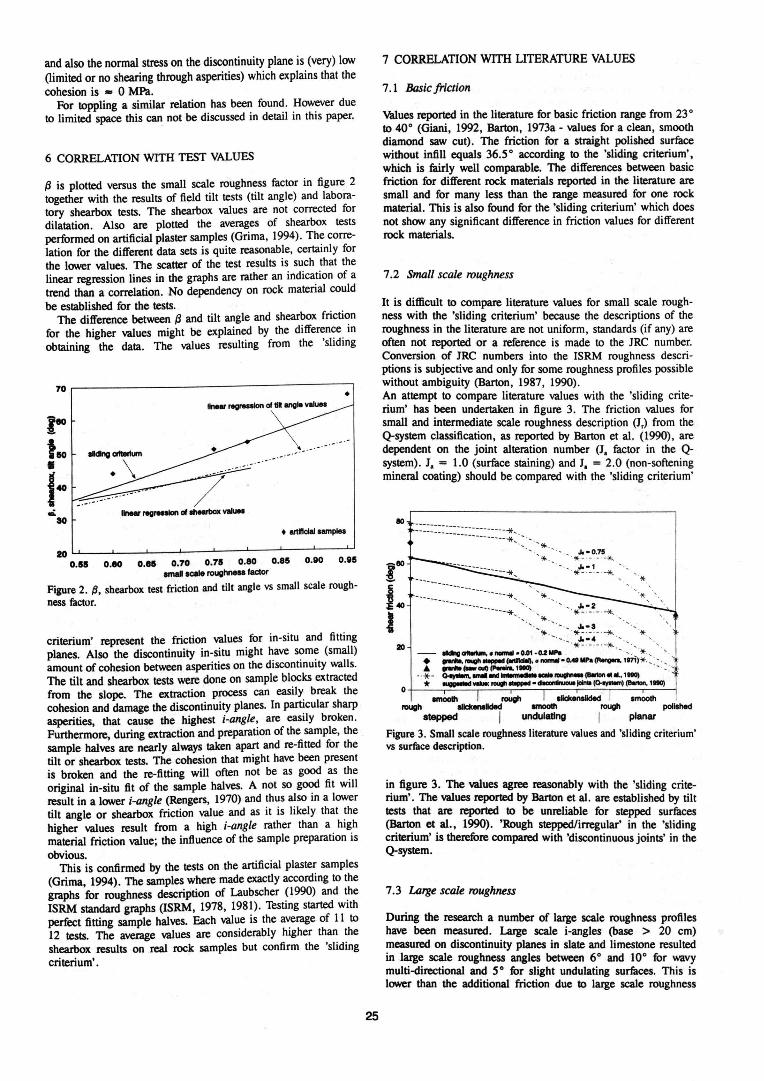
It is difficult to compare literature values for small scale rough-ness with the 'sliding criterium' because the descriptions of theroughness in the literature are not uniform, standards (if any) areoften not reported or a reference is made to the JRC number.Conversion of IRC numbers into the ISRM roughness descri-ptions is subjective and only for some roughness profiles possiblewithout ambiguity (Barton, 1987, 1990).An attempt to compare literature values with the 'sliding crite-rium' has been undertaken in figure 3. The friction values forsmall and intermediate scale roughness description (J,) from theQ-system classification, as reported by Barton et al. (1990), aredependent on the joint alteration number (1. factor in the Q-system). J. = 1.0 (surface staining) and J. = 2.0 (non-softeningmineral coating) should be compared with the 'sliding criterium'
10---------11-,
----------11- " ," ',*,
'*'•••·0.75* ...._._*."'. "'-1.*.._._...••.
------ ------------II-,
-------11-, ',.'" *" "" ....,
'*'. ''It-.- .•. _l(" '*20 -c . •.•. *~:__4_._l(,,·· •.•.- -,-,._-O,oI.G.2_ "'" '*" ".
• __ •••••••1IIppode--l.•_. OM"'" (IlongIro.lmy*.• '.A •••• _aulle-181l1l ":-'--*- o.r-m._ ••. .....-e- ••••..181l1l .
o * ....-_ .•••••.1IIppod._ ••••• ~)e-.181l1l
amooIh rough IlIcIk8nslkIed smoothrough allclcenalded amooIh rough polished
stepped I undulating I planar
Figure 3. Small scale roughness literature values and 'sliding criterium'vs surface description.
-------- -------
in figure 3. The values agree reasonably with the 'sliding crite-rium'. The values reported by Barton et al. are established by tilttests that are reported to be unreliable for stepped surfaces(Barton et al., 1990). 'Rough stepped/irregular' in the 'slidingcriterium' is therefore compared with 'discontinuous joints' in theQ-system.
7.3 lArge scale TOughness
During the research a number of large scale roughness profileshave been measured. Large scale i-angles (base > 20 cm)measured on discontinuity planes in slate and limestone resultedin large scale roughness angles between 60 and 100 for wavymulti-directional and 50 for slight undulating surfaces. This islower than the additional friction due to large scale roughness
25
based on the 'sliding criterium'. The measurements were done onexposed planes, probably resulting from sliding of overlyingrock. This sliding has most likely reduced the roughness i-angles.
The number of large scale roughness friction values reportedin the literature is very limited. TIlt tests on large scale artificialsamples (Chryssanthakis et al., 1990) gave higher friction valuesthan the 'sliding criterium' and also higher than the t-anglesmeasured. However the roughness description of these profileswas not reported and the description has been estimated fromscale drawings in the publication. This might well underestimatethe large and small scale roughness.
7.4 lnfill material
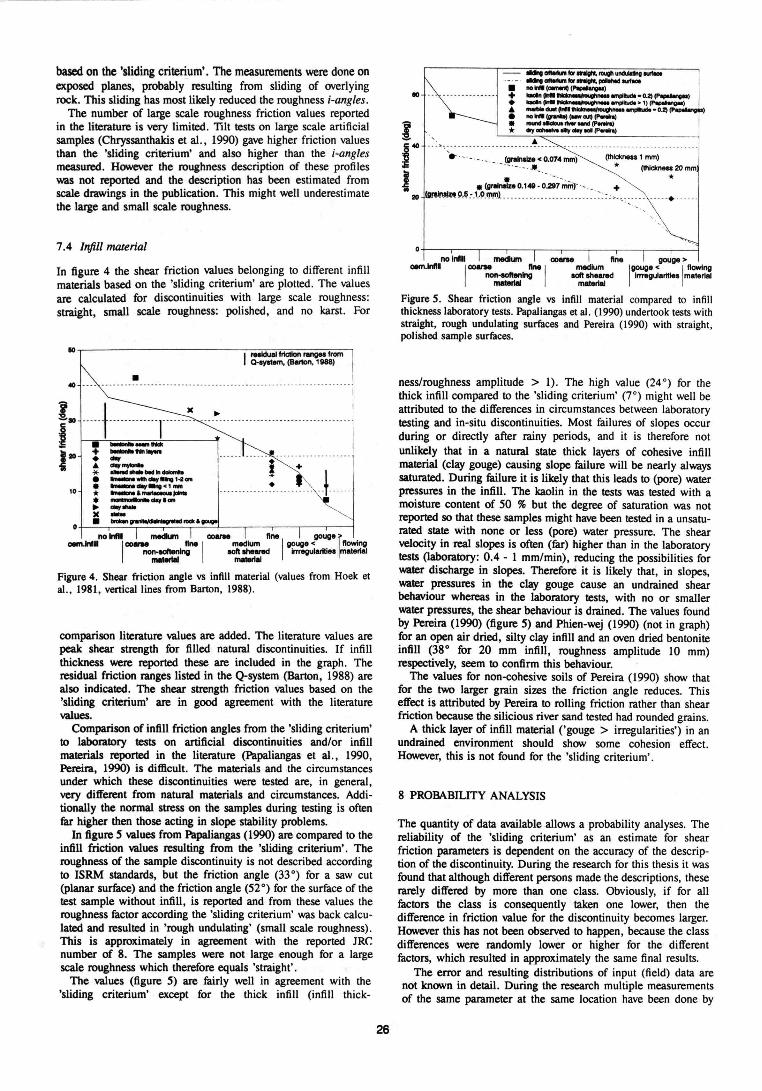
In figure 4 the shear friction values belonging to different infillmaterials based on the 'sliding criterium' are plotted. The valuesare calculated for discontinuities with large scale roughness:straight, small scale roughness: polished, and no karst. For
10
I lMklual IricIIonrengN fromQ-ayIIem. (Betton. 1MIl)
•--------_._---_._--._------_ .. __ .__ ----- -_ _-----
110------~-------------r----~- •
i .---I + -"*'tovorI10 • _·--* __ •.•.•In_·--_..,.•.•.• __ •• c,_'0 * _,_""'"
• -day ••••·--)( -o • -~""''''-- •••••-- •• -,-
110InlII medium cc.rM line gouge ~oem.1nIII ICl*N line I medium I gouge < tIowIng
non-eoIlenlng 1011 ahlI8nId lrmJguIatftIQ alerlal..-111 maIIII'IaI
i +. "" ~... _------_ .. _ .. _ .... _._.'~ ...
Figure 4. Shear friction angle vs infill material (values from Hoek etaI., 1981, vertical lines from Barton, 1988).
comparison literature values are added. The literature values arepeak shear strength for filled natural discontinuities. If infillthickness were reported these are included in the graph. Theresidual friction ranges listed in the Q-system (Barton, 1988) arealso indicated. The shear strength friction values based on the'sliding criterium' are in good agreement with the literaturevalues.
Comparison of infill friction angles from the 'sliding criterium'to laboratory tests on artificial discontinuities and/or infillmaterials reported in the literature (Papaliangas et al., 1990,Pereira, 1990) is difficult. The materials and the circumstancesunder which these discontinuities were tested are, in general,very different from natural materials and circumstances. Addi-tionally the normal stress on the samples during testing is oftenfur higher then those acting in slope stability problems.
In figure 5 values from Papaliangas (1990) are compared to theinfill friction values resulting from the 'sliding criterium'. Theroughness of the sample discontinuity is not described accordingto ISRM standards, but the friction angle (33°) for a saw cut(planar surface) and the friction angle (5r) for the surface of thetest sample without infill, is reported and from these values theroughness factor according the 'sliding criterium' was back calcu-lated and resulted in 'rough undulating' (small scale roughness).This is approximately in agreement with the reported IRenumber of 8. The samples were not large enough for a largescale roughness which therefore equals 'straight'.
The values (figure 5) are fairly well in agreement with the'sliding criterium' except for the thick infill (infill thick-
- -._lor ..•.....•.UIOlIdnG-._._.-. _lor •••••poIIIlod_• •••••• (-.onI)~)eo + - .0.21~1·-----"'-")-)• -- •••_-0.2)
• ••••••w.-)(-"""~I • ----~* d1y-oIIy-"'~- "
j 40 --:··~:~-:~:·~-~-~-~-.;:~-~.;;.;4~) (1Nd<neaI1mm)~ .-.-.-... * (lh1cknNa 20 mm
I .(granTz. 0.1. :o~~ -"""'" _ + *211~!l,~,_1_·!l-'!""L .: :,_" __._ __• .
no InIII mediumoem.lnlll Icc.rM line I
non-aoltenlng...-..Figure 5. Shear friction angle vs infill material compared to infillthickness laboratory tests. Papaliangas et al. (1990) undertook tests withstraight, rough undulating surfaces and Pereira (1990) with straight,polished sample surfaces.
ness/roughness amplitude > I). The high value (24°) for thethick infill compared to the 'sliding criterium' (70) might well beattributed to the differences in circumstances between laboratorytesting and in-situ discontinuities. Most failures of slopes occurduring or directly after rainy periods, and it is therefore notunlikely that in a natural state thick layers of cohesive infillmaterial (clay gouge) causing slope failure will be nearly alwayssaturated. During failure it is likely that this leads to (pore) waterpressures in the infill. The kaolin in the tests was tested with amoisture content of 50 % but the degree of saturation was notreported so that these samples might have been tested in a unsatu-rated state with none or less (pore) water pressure. The shearvelocity in real slopes is often (far) higher than in the laboratorytests (laboratory: 0.4 - I mm/min), reducing the possibilities forwater discharge in slopes. Therefore it is likely that, in slopes,water pressures in the clay gouge cause an undrained shearbehaviour whereas in the laboratory tests, with no or smallerwater pressures, the shear behaviour is drained. The values foundby Pereira (1990) (figure 5) and Phien-wej (1990) (not in graph)for an open air dried, silty clay infill and an oven dried bentoniteinfill (38° for 20 mm infill, roughness amplitude 10 mm)respectively, seem to confirm this behaviour.
The values for non-cohesive soils of Pereira (1990) show thatfor the two larger grain sizes the friction angle reduces. Thiseffect is attributed by Pereira to rolling friction rather than shearfriction because the silicious river sand tested had rounded grains.
A thick layer of infill material ('gouge> irregularities') in anundrained environment should show some cohesion effect.However, this is not found for the 'sliding criterium'.
8 PROBABIUTY ANALYSIS
The quantity of data available allows a probability analyses. Thereliability of the 'sliding criterium' as an estimate for shearfriction parameters is dependent on the accuracy of the descrip-tion of the discontinuity. During the research for this thesis it wasfound that although different persons made the descriptions, theserarely differed by more than one class. Obviously, if for allfactors the class is consequently taken one lower, then thedifference in friction value for the discontinuity becomes larger.However this has not been observed to happen, because the classdifferences were randomly lower or higher for the differentfactors, which resulted in approximately the same final results.
The error and resulting distributions of input (field) data arenot known in detail. During the research multiple measurementsof the same parameter at the same location have been done by
26
1.00 .. ....•... . , , .
0.80 ..... discontinuity slabl.with r.spect to sliding
0.10 j ••••.•.••..
0.40
0.20
discontinuity Instabl.with respect to sliding
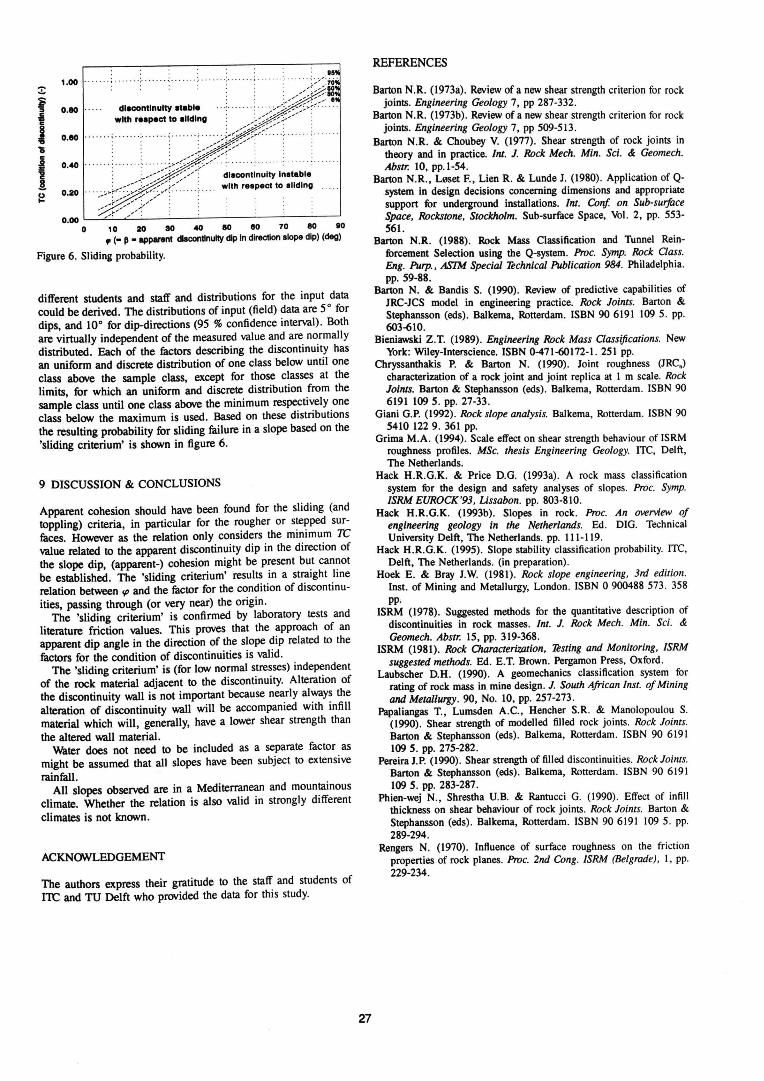
0.00 o 10 20 SO 40 80 80 70 80 110~ (_ p _ apparent cIscontlnul1y dlp in direction slope dip) (<leg)
Figure 6. Sliding probability.
different students and staff and distributions for the input datacould be derived. The distributions of input (field) data are 5° fordips, and 10° for dip-directions (95 % confidence interval). Bothare virtually independent of the measured value and are normallydistributed. Each of the factors describing the discontinuity hasan uniform and discrete distribution of one class below until oneclass above the sample class, except for those classes at thelimits, for which an uniform and discrete distribution from thesample class until one class above the minimum respectively oneclass below the maximum is used. Based on these distributionsthe resulting probability for sliding failure in a slope based on the'sliding criterium' is shown in figure 6.
9 DISCUSSION & CONCLUSIONS
Apparent cohesion should have been found for the sliding (andtoppling) criteria, in particular for the rougher or stepped sur-faces. However as the relation only considers the minimum TCvalue related to the apparent discontinuity dip in the direction ofthe slope dip, (apparent-) cohesion might be present but cannotbe established. The 'sliding criterium' results in a straight linerelation between tp and the factor for the condition of discontinu-ities, passing through (or very near) the origin.
The 'sliding criterium' is confirmed by laboratory tests andliterature friction values. This proves that the approach of anapparent dip angle in the direction of the slope dip related to thefactors for the condition of discontinuities is valid.
The 'sliding criterium' is (for low normal stresses) independentof the rock material adjacent to the discontinuity. Alteration ofthe discontinuity wall is not important because nearly always thealteration of discontinuity wall will be accompanied with infillmaterial which will, generally, have a lower shear strength thanthe altered wall material.
Water does not need to be included as a separate factor asmight be assumed that all slopes have been subject to extensiverainfall.
All slopes observed are in a Mediterranean and mountainousclimate. Whether the relation is also valid in strongly differentclimates is not known.
ACKNOWLEDGEMENT
The authors express their gratitude to the staff and students ofITC and TU Delft who provided the data for this study.
REFERENCES
Barton N.R. (1973a). Review of a new shear strength criterion for rockjoints. Engineering Geology 7, pp 287-332.
Barton N.R. (1973b). Review of a new shear strength criterion for rockjoints. Engineering Geology 7, pp 509-513.
Barton N.R. & Choubey V. (1977). Shear strength of rock joints intheory and in practice. Int. J. Rock Mech. Min. Sci. & Geomech.Abstr: 10, pp.I-54.
Barton N.R., Leset E, Lien R. & Lunde J. (1980). Application of Q-system in design decisions concerning dimensions and appropriatesupport for underground installations. Int. Conf. on Sub-surfaceSpace, Bockstone, Stockholm. Sub-surface Space, Vol. 2, pp. 553-561.
Barton N.R. (1988). Rock Mass Classification and Thnnel Rein-forcemeat Selection using the Q-system. Proc. Symp. Rock Class.Eng. Purp., ASTM Special Technical Publication 984. Philadelphia.pp.59-88.
Barton N. & Bandis S. (1990). Review of predictive capabilities ofJRC-JCS model in engineering practice. Rock Joints. Barton &Stephansson (eds). Balkema, Rotterdam. ISBN 90 6191 109 5. pp.603.{jl0.
Bieniawski Z.T. (1989). Engineering Rock Mass Classifications. NewYork: Wiley-Interscience. ISBN 0-471.{jOI72-1. 251 pp.
Chryssanthakis P. & Barton N. (1990). Joint roughness (JRC.)characterization of a rock joint and joint replica at 1 m scale. RockJoints. Barton & Stephansson (eds). Balkema, Rotterdam. ISBN 906191 109 5. pp. 27-33.
Giani G.P. (1992). Rock slope analysis. Balkema, Rotterdam. ISBN 905410 1229. 361 pp.
Grima M.A. (1994). Scale effect on shear strength behaviour of ISRMroughness profiles. MSc. thesis Engineering Geology. lTC, Delft,The Netherlands.
Hack H.R.G.K. & Price D.G. (1993a). A rock mass classificationsystem fur the design and safety analyses of slopes. Proc. Symp.ISRM EUROCK'93, Lissabon. pp. 803-810.
Hack H.R.G.K. (1993b). Slopes in rock. Proc. An ovemew ofengineering geology in the Netherlands. Ed. DIG. TechnicalUniversity Delft, The Netherlands. pp. 111-119.
Hack H.R.G.K. (1995). Slope stability classification probability. lTC,Delft, The Netherlands. (in preparation).
Hoek E. & Bray J.w. (1981). Rock slope engineering, 3rd edition.Inst. of Mining and Metallurgy, London. ISBN 0 900488 573. 358pp.
ISRM (1978). Suggested methods for the quantitative description ofdiscontinuities in rock masses. Int. J. Rock Mech. Min. Sci. &Geomech. Abstr: 15, pp. 319-368.
ISRM (1981). Rock Otaraaertzation, Testing and Monitoring. ISRMsuggested methods. Ed. E.T. Brown. Pergamon Press, Oxford.
Laubscher D.H. (1990). A geomechanics classification system furrating of rock mass in mine design. J. South African lnst. of Miningand Metallurgy. 90, No. 10, pp. 257-273.
Papaliangas T., Lumsden A.C., Hencher S.R. & Manolopoulou S.(1990). Shear strength of modelled filled rock joints. Rock Joints.Barton & Stephansson (eds). Balkema, Rotterdam. ISBN 90 6191109 5. pp. 275-282.
Pereira J.P. (1990). Shear strength of filled discontinuities. Rock Joints.Barton & Stephansson (eds). Balkema, Rotterdam. ISBN 90 6191109 5. pp. 283-287.
Phien-wej N., Shrestha Ll.B. & Rantucci G. (1990). Effect of infillthickness on shear behaviour of rock joints. Rock Joints. Barton &Stephansson (eds). Balkema, Rotterdam. ISBN 90 6191 109 5. pp.289-294.
Rengers N. (1970). Influence of surface roughness on the frictionproperties of rock planes. Proc. 2nd Cong. ISRM (Belgrade), I, pp.229-234.
27


![Stahlbeton III Discontinuity Region Design Workshop - ethz.ch · Beton * [-] C35/45 * Tipp: Über den grünen Knopf rechts kann ein neues Material aus der Bibliothek geladen werden,](https://img.pdfslide.org/doc/110x75/5d46b19a88c99391138cadd3/stahlbeton-iii-discontinuity-region-design-workshop-ethzch-beton-c3545.jpg)


![Guião da entrevista - IPLeiria...Classification of Functioning, Disability and Health (ICF) [31], we can now rely on a globally agreed framework and classification to define the typical](https://img.pdfslide.org/doc/110x75/613c0015f8f21c0c8269526c/guio-da-entrevista-ipleiria-classification-of-functioning-disability-and.jpg)