Embed Size (px)
Citation preview
MSchweizer Kompetenzzentrum für Medien und Druckereitechnologie Centre de compétence suisse pour la technologie des médias et de l’imprimerieSwiss Center of Competence for Media and Printing Technology
Ug
ra P
late
Co
ntr
ol
Wed
ge 1
982
©
UgraIm EMPA-HausLerchenfeldstr. 5CH-9014 St. GallenTel. +41 71 274 74 43Fax +41 71 274 76 [email protected]
ManualEdition January 2008
2 Ugra Plate Control Wedge 1982©
General Description
Aim
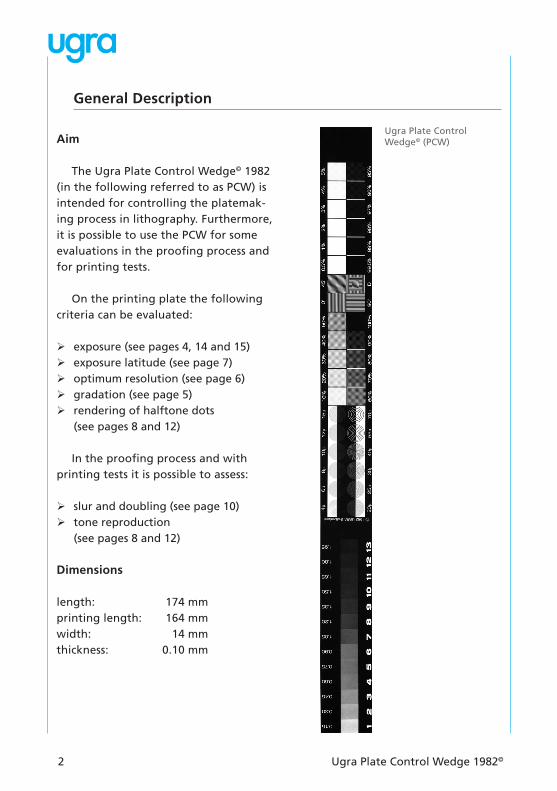
The Ugra Plate Control Wedge© 1982 (in the following referred to as PCW) is intended for controlling the platemak-ing process in lithography. Furthermore, it is possible to use the PCW for some evaluations in the proofing process and for printing tests.
On the printing plate the following criteria can be evaluated:
exposure (see pages 4, 14 and 15) ¾exposure latitude (see page 7) ¾optimum resolution (see page 6) ¾gradation (see page 5) ¾rendering of halftone dots ¾(see pages 8 and 12)
In the proofing process and with printing tests it is possible to assess:
slur and doubling (see page 10) ¾tone reproduction ¾(see pages 8 and 12)
Dimensions
length: 174 mmprinting length: 164 mmwidth: 14 mmthickness: 0.10 mm
Ugra Plate Control Wedge© (PCW)
Ugra Plate Control Wedge 1982© 3
Structure
The Ugra PCW consists of five elements:
Continuous-tone wedge: ¾13 steps 4 x 5 mmMicro-lines: 12 circular patches, ¾diameter 4.5 mm, positive and negative halvesHalftone wedge 60 lines/cm ¾(150 lines/in): 10 steps – 5 x 5 mmSlur target: 4 steps – 5 x 5 mm ¾Small dot patches, negative and posi- ¾tive: 12 steps – 5 x 5 mm
The PCW is made of two differ-ent films, a high resolution line film and continuous-tone film. The latter, consisting of 13 continuous-tone steps, is assembled into a window of the line film with an adhesive tape.
4 Ugra Plate Control Wedge 1982©
Continuous-tone wedge
Density values
The density values are labelled on top of the continuous-tone patches. These values are correct for a densitom-eter that is zeroed without film base.
Tolerances
deviation from the specified density ¾values: ± 0.02difference between two steps: ¾0.15 ± 0.02
Relation between exposure time and rendering of the continuous-tone wedge
For a given type of light sensitive material, the continuous-tone wedge indicates differences in exposure ac-cording to the following rule:
If a higher step of the continuous-tone wedge should print on the plate, the initial exposure time has to be multiplied with the above indicated fac-tor. If a lower step is desired, the initial exposure time must be divided by the factor. Example:
To proceed from step 5 to step 7, the exposure time should be doubled. To go back from step 4 to step 3, the exposure time must be divided by 1.4.
Control of exposure
The correct exposure can not be determined from the continuous-tone wedge alone. It is necessary to make a series of exposures and evaluate the reproduction of the micro-lines. Once the correct exposure for a certain plate has been determined, it then can be maintained by keeping the reproduced continuous-tone step constant.
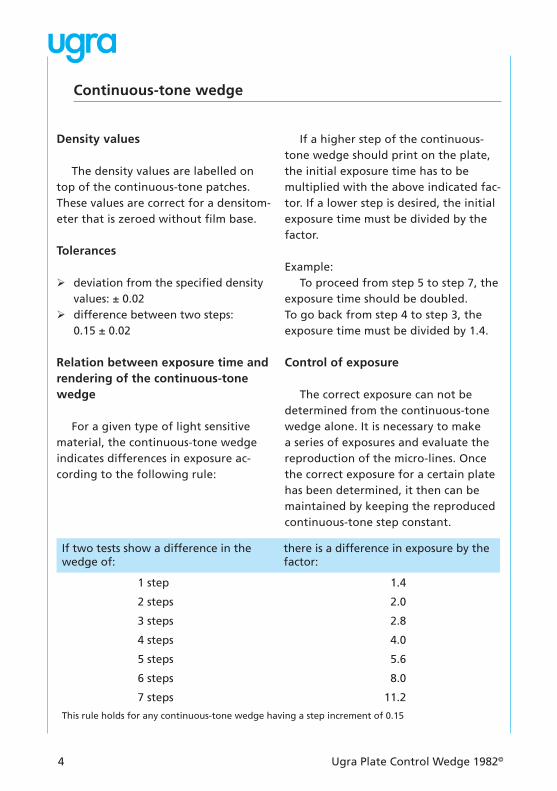
If two tests show a difference in the wedge of:
there is a difference in exposure by the factor:
1 step 1.4
2 steps 2.0
3 steps 2.8
4 steps 4.0
5 steps 5.6
6 steps 8.0
7 steps 11.2
This rule holds for any continuous-tone wedge having a step increment of 0.15

Ugra Plate Control Wedge 1982© 5
In general, optimum exposure is ap-plied, when the first printing step in the continuous-tone wedge for the differ-ent light-sensitive coatings is as follows:
diazo coatings (positive working): ¾step 4 to 5diazo coatings (negative working): ¾step 3 to 5
These specifications refer to the reproduction of the continuous-tone wedge after developing. If the light sensitive coating is removed (e.g. in multi-metal platemaking), then the evaluation of the continuous-tone wedge on the finished plate becomes meaningless.
Evaluation of gradiation
The gradation of a light-sensitive coating can be judged by counting the number of continuous-tone steps that are neither fully solid nor fully non-printing. The following values are typical for the different light-sensitive coatings:
diazo coatings (positive working): ¾step 4 to 7diazo coatings (negative working): ¾step 5 to 8
Again, theses specifications refer to the light-sensitive coating after devel-oping.
Continuous-tone wedge (the continuous-tone is simulated by a fine halftone).

6 Ugra Plate Control Wedge 1982©
Micro-lines
Specifications
The 12 patches of micro-lines have the following values:
The micro-line patches of the PCW have the same values as the micro-line patches in the Fogra-PMS-K-patch.
(Compared with the K-patch in the Fogra-PMS Color Control Bar, the Ugra PCW has additional line widths of 4, 25, 40, 55 and 70 µm.)Therefore, the micro-lines of the Ugra PCW can be evaluated according to the same guidelines as the ones established for the Fogra-K-patch.
Determination of optimum resolution
In order to determine the optimum resolution of a plate (or film), a series of exposures is made such that each fol-lowing exposure time is the double of the preceding one. Example for a series of five exposures:
20 – 40 – 80 – 160 – 320 s
width µm
distance µm
area covered %*
lines/cm
4 36 10 250
6 54 10 167
8 72 10 125
10 90 10 100
12 108 10 83
15 135 10 67
20 120 14.3 71
25 135 15.6 62
30 150 16.6 56
40 200 16.6 42
55 275 16.6 30
70 350 16.6 24
*negative lines have the complementary values to 100 %.
Micro-lines
Ugra Plate Control Wedge 1982© 7
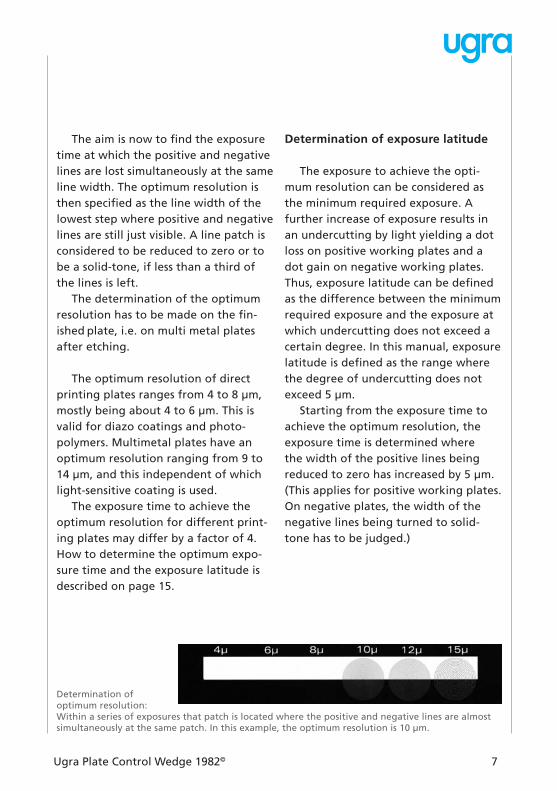
The aim is now to find the exposure time at which the positive and negative lines are lost simultaneously at the same line width. The optimum resolution is then specified as the line width of the lowest step where positive and negative lines are still just visible. A line patch is considered to be reduced to zero or to be a solid-tone, if less than a third of the lines is left.
The determination of the optimum resolution has to be made on the fin-ished plate, i.e. on multi metal plates after etching.
The optimum resolution of direct printing plates ranges from 4 to 8 µm, mostly being about 4 to 6 µm. This is valid for diazo coatings and photo-polymers. Multimetal plates have an optimum resolution ranging from 9 to 14 µm, and this independent of which light-sensitive coating is used.
The exposure time to achieve the opti mum resolution for different print-ing plates may differ by a factor of 4. How to determine the optimum expo-sure time and the exposure latitude is described on page 15.
Determination of optimum resolution: Within a series of exposures that patch is located where the positive and negative lines are almost simultaneously at the same patch. In this example, the optimum resolution is 10 µm.
Determination of exposure latitude
The exposure to achieve the opti-mum resolution can be considered as the minimum required exposure. A further increase of exposure results in an undercutting by light yielding a dot loss on positive working plates and a dot gain on negative working plates. Thus, exposure latitude can be defined as the difference between the minimum required exposure and the exposure at which undercutting does not exceed a certain degree. In this manual, exposure latitude is defined as the range where the degree of undercutting does not exceed 5 µm.
Starting from the exposure time to achieve the optimum resolution, the exposure time is determined where the width of the positive lines being reduced to zero has increased by 5 µm. (This applies for positive working plates. On negative plates, the width of the negative lines being turned to solid-tone has to be judged.)
8 Ugra Plate Control Wedge 1982©
Halftone wedge 60 lines/cm
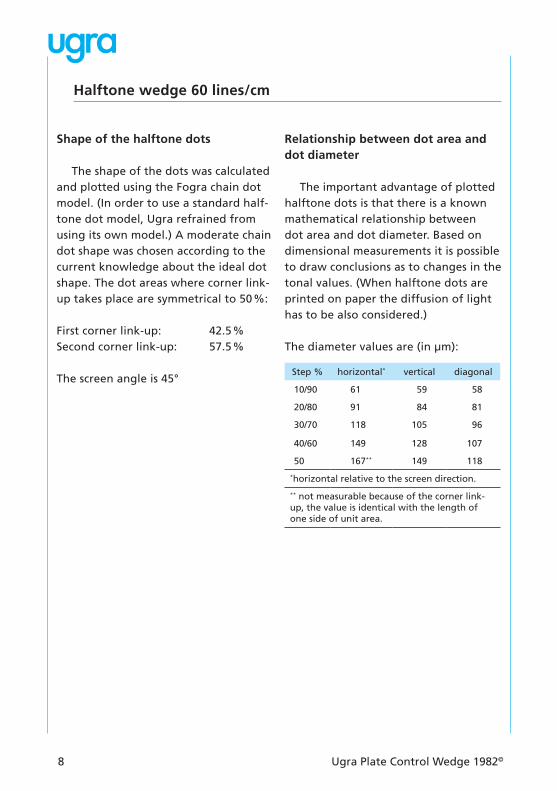
Shape of the halftone dots
The shape of the dots was calculated and plotted using the Fogra chain dot model. (In order to use a standard half-tone dot model, Ugra refrained from using its own model.) A moderate chain dot shape was chosen according to the current knowledge about the ideal dot shape. The dot areas where corner link-up takes place are symmetrical to 50%:
First corner link-up: 42.5%Second corner link-up: 57.5%
The screen angle is 45°
Relationship between dot area and dot diameter
The important advantage of plotted halftone dots is that there is a known mathematical relationship between dot area and dot diameter. Based on dimensional measurements it is possible to draw conclusions as to changes in the tonal values. (When halftone dots are printed on paper the diffusion of light has to be also considered.)
The diameter values are (in µm):
Step % horizontal* vertical diagonal
10/90 61 59 58
20/80 91 84 81
30/70 118 105 96
40/60 149 128 107
50 167** 149 118
*horizontal relative to the screen direction.
** not measurable because of the corner link-up, the value is identical with the length of one side of unit area.
Ugra Plate Control Wedge 1982© 9
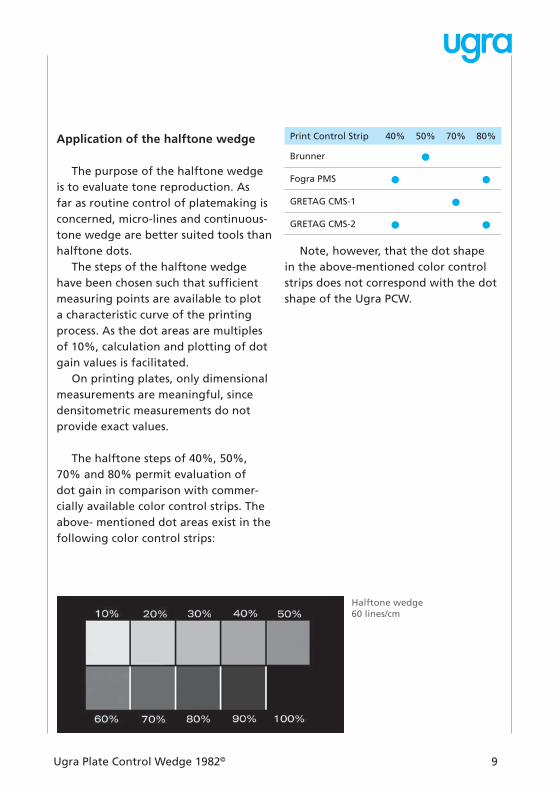
Application of the halftone wedge
The purpose of the halftone wedge is to evaluate tone reproduction. As far as routine control of platemaking is concerned, micro-lines and continuous-tone wedge are better suited tools than halftone dots.
The steps of the halftone wedge have been chosen such that suffi cient measuring points are available to plot a characteristic curve of the printing process. As the dot areas are multiples of 10%, calculation and plotting of dot gain values is facilitated.
On printing plates, only dimensional measurements are meaningful, since densitometric measurements do not provide exact values.
The halftone steps of 40%, 50%, 70% and 80% permit evaluation of dot gain in comparison with commer-cially available color control strips. The above- mentioned dot areas exist in the following color control strips:
Print Control Strip 40% 50% 70% 80%
Brunner
Fogra PMS
GRETAG CMS-1
GRETAG CMS-2
Note, however, that the dot shape in the above-mentioned color control strips does not correspond with the dot shape of the Ugra PCW.
Halftone wedge60 lines/cm
10 Ugra Plate Control Wedge 1982©
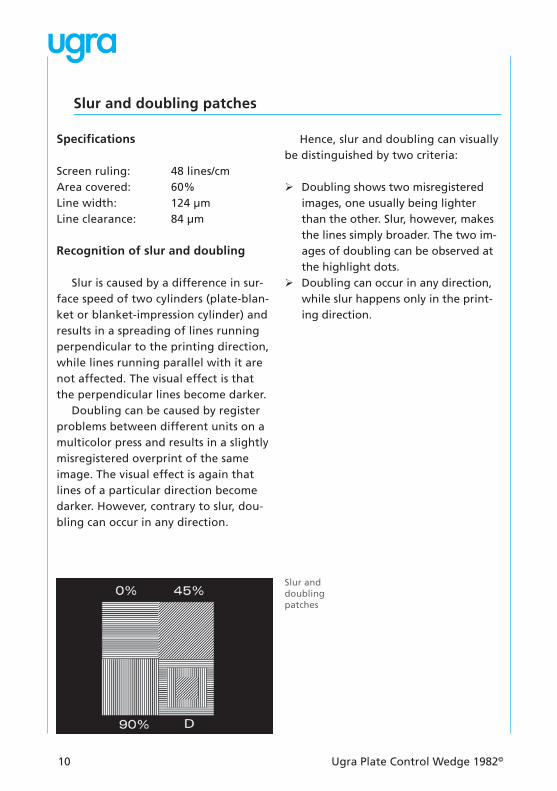
Slur and doubling patches
Specifications
Screen ruling: 48 lines/cmArea covered: 60%Line width: 124 µmLine clearance: 84 µm
Recognition of slur and doubling
Slur is caused by a difference in sur-face speed of two cylinders (plate-blan-ket or blanket-impression cylinder) and results in a spreading of lines running perpendicular to the printing direction, while lines running parallel with it are not affected. The visual effect is that the perpendicular lines become darker.
Doubling can be caused by register problems between different units on a multicolor press and results in a slightly misregistered overprint of the same image. The visual effect is again that lines of a particular direction become darker. However, contrary to slur, dou-bling can occur in any direction.
Hence, slur and doubling can visually be distinguished by two criteria:
Doubling shows two misregistered ¾images, one usually being lighter than the other. Slur, however, makes the lines simply broader. The two im-ages of doubling can be observed at the highlight dots.Doubling can occur in any direction, ¾while slur happens only in the print-ing direction.
Slur and doubling patches
Ugra Plate Control Wedge 1982© 11
Application of the target D
The purpose of target D is solely for the visual assessment of slur and dou-bling. For the sake of standardization target D is the same as the one in the Fogra Color Bar (PMS).
It has been shown that lines of rectangular and diagonal direction are most sensitive for the recognition of slur and doubling.
Application of the line patches 0°/90°/45°
The patches 0°/90°/45° are designed to help evaluate slur and doubling by density measurements. This can be of interest when running printing tests, while the visual control of slur and dou-bling is sufficient in normal production printing and proofing.
The density measurements provide a numerical measure of contrast in ad-dition to a visual judgement. This can be very useful when, for instance, the performance of different blankets is studied.
In addition, it can be seen from com-parison with target D, which numerical difference leads to a visually perceptible slur of doubling.

12 Ugra Plate Control Wedge 1982©
Small dot patches
Specifications
Screen ruling: 60 lines/cmDot shape: circularScreen angle 45°
The distance from dot center to center is 167 µm measured in the screen direction. The dots have the following diameters:
Application of the small dot patches
On principle, small dots can be judged in the same way as micro-lines, i.e. it is checked to what extent positive dots are reduced to zero or negative dots have turned to a solid tone.
Step % Diameter µm
0.5 99.5 13
1 99 19
2 98 27
3 97 33
4 96 38
5 95 42
In addition small dots indicate the beginning and the end of the repro-ducible tone scale. Note, however, that small dots of the Ugra PCW do not be-have the same way as micro-lines hav-ing the same diameter when undercut by light. This is due to two reasons:
The distance between the small dots ¾is considerably larger than between micro-lines of the same diameter. (Also, the small dots in the Ugra PCW should not be compared with small dots of the same diameter in other control strips, since the distance be-tween the dots may be different.)
Halftone dots are undercut by light ¾from all directions, while lines are only undercut from two directions.
This is the reason why the small dots in the Ugra PCW are more sensitive than the micro-lines having the same diameter.
0.5% 1% 2% 3% 4% 5%
99.5% 99% 98% 97% 96% 95%
Small dot patches60 lines/cm
Ugra Plate Control Wedge 1982© 13
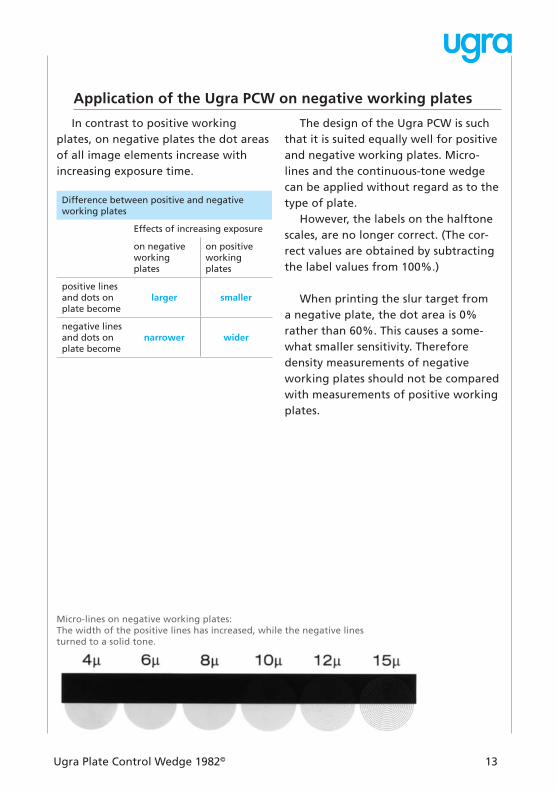
Application of the Ugra PCW on negative working plates
In contrast to positive working plates, on negative plates the dot areas of all image elements increase with increasing exposure time.
Difference between positive and negative working plates
Effects of increasing exposure
on negative working plates
on positive working plates
positive lines and dots on plate become
larger smaller
negative lines and dots on plate become
narrower wider
The design of the Ugra PCW is such that it is suited equally well for positive and negative working plates. Micro-lines and the continuous-tone wedge can be applied without regard as to the type of plate.
However, the labels on the halftone scales, are no longer correct. (The cor-rect values are obtained by subtracting the label values from 100%.)
When printing the slur target from a negative plate, the dot area is 0% rather than 60%. This causes a some-what smaller sensitivity. Therefore density measurements of negative working plates should not be compared with measurements of positive working plates.
Micro-lines on negative working plates:The width of the positive lines has increased, while the negative lines turned to a solid tone.
14 Ugra Plate Control Wedge 1982©
Standardization of the platemaking process
Although the exposure time required to achieve the optimum resolution and the exposure latitude are objective criteria, the «correct» exposure time can not be directly derived from it.
The exposure time to achieve the optimum resolution can be considered as the minimum required exposure. If this exposure time is exceeded, the positive halftone dots become smaller, which may not be desirable. Simulta-neously the negative halftone dots become more open, which is usually desired. Also, film edges are reduced with increasing exposure time.
Hence, the «correct» exposure time is a compromise. Depending on the im-age, it may be desirable that
the shadows are sufficiently open ¾the highlights are not too much un- ¾dercutthe film edges are eliminated to an ¾extent that only few corrections on the plate are necessary.
Since there are no objective crite-ria for the «correct» exposure time, it is reasonable to define an arbitrary criterion in order to standardize the platemaking process.
Ugra established the following guidelines, which are in line with the Fogra recommendations:
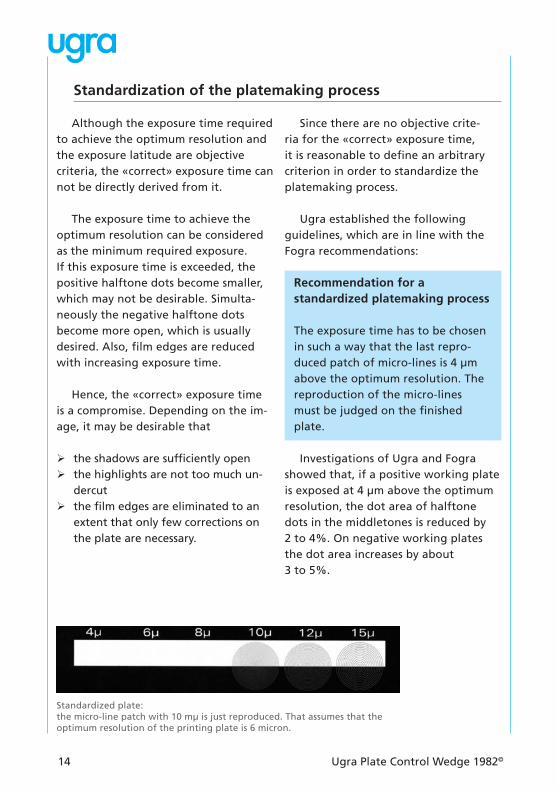
Investigations of Ugra and Fogra showed that, if a positive working plate is exposed at 4 µm above the optimum resolution, the dot area of halftone dots in the middletones is reduced by 2 to 4%. On negative working plates the dot area increases by about 3 to 5%.
Recommendation for a standardized platemaking process
The exposure time has to be chosen in such a way that the last repro-duced patch of micro-lines is 4 µm above the optimum resolution. The reproduction of the micro-lines must be judged on the finished plate.
Standardized plate:the micro-line patch with 10 mµ is just reproduced. That assumes that the optimum resolution of the printing plate is 6 micron.
Ugra Plate Control Wedge 1982© 15
How to determine the exposure parameters
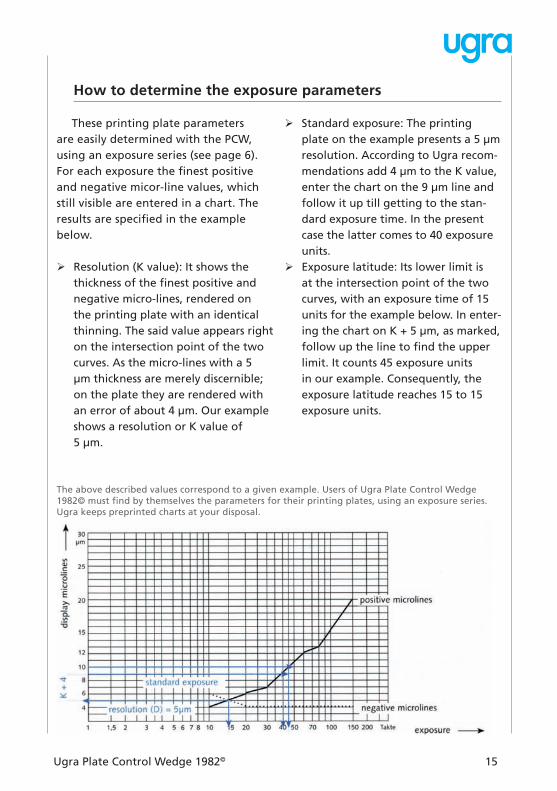
These printing plate parameters are easily determined with the PCW, using an exposure series (see page 6). For each exposure the finest positive and negative micor-line values, which still visible are entered in a chart. The results are specified in the example below.
Resolution (K value): It shows the ¾thickness of the finest positive and negative micro-lines, rendered on the printing plate with an identical thinning. The said value appears right on the intersection point of the two curves. As the micro-lines with a 5 µm thickness are merely discernible; on the plate they are rendered with an error of about 4 µm. Our example shows a resolution or K value of 5 µm.
Standard exposure: The printing ¾plate on the example presents a 5 µm resolution. According to Ugra recom-mendations add 4 µm to the K value, enter the chart on the 9 µm line and follow it up till getting to the stan-dard exposure time. In the present case the latter comes to 40 exposure units.Exposure latitude: Its lower limit is ¾at the intersection point of the two curves, with an exposure time of 15 units for the example below. In enter-ing the chart on K + 5 µm, as marked, follow up the line to find the upper limit. It counts 45 exposure units in our example. Consequently, the exposure latitude reaches 15 to 15 exposure units.
The above described values correspond to a given example. Users of Ugra Plate Control Wedge 1982© must find by themselves the parameters for their printing plates, using an exposure series. Ugra keeps preprinted charts at your disposal.

16 Ugra Plate Control Wedge 1982©
Other Ugra quality control products
Ask your supplier for other Ugra quality control products.
Ugra/Fogra PostScript Control Wedge: ¾PostScript software tool for quality control and process control of elec-tronic printing systems.
Ugra/Fogra Digital Printing ¾Control Strip: PostScript software tool for quality control in printing process.
Ugra/Fogra Digital Plate Control ¾Wedge: PostScript software tool for quality and process control for computer-to-plate-systems.
Ugra/Fogra Digital Print Scale: ¾ PostScript software tool for quality control in four color digital print-ing systems and computer-to-press-systems.
Ugra/Fogra Media Wedge CMYK: ¾Control wedge for the quality control of digital proofs and control of Color Management systems.
Ugra/Fogra Media Wedge CIELAB: ¾Control wedge to measure the color volume of any digital color output system.
Ugra Display Certification and Analy- ¾sis Tool (UDACT): Software to evaluate the monitors calibration and assessing the color gamut with integrated Ugra/Fogra Media Wedge CMYK.
Ugra Light Indicators: ¾ The control strip to control the cor-rect illumination for proofs and prints.
Alwan CMYKOptimizer: ¾Software to control and correct auto-matically and dynamically the colors and ink weight characteristics of in-coming files, before sending them for film and plate output. One benefit is a substantial ink saving of up to 30 per cent!
User designed Ugra Digital Control ¾Strips: Development of control strips to the user’s specific requirements.