Embed Size (px)
Citation preview
Journal of Food Distribution Research
Volume 43, Issue 3
November 2012 Volume 43, Issue 3
15
A Pilot Study of the Market for Energy Drinks
Oral Capps, Jra and Robin D. Hanselman
b
aExecutive Professor, Regents Professor, and Co-Director of the Agribusiness, Food, and Consumer Economics
Research Center (AFCERC) and Research Associate, Department of Agricultural Economics,
371 C AGLS Building, Texas A&M University, College Station, Texas, 77843-2124, USA
Phone: (979) 845-8492 Email: [email protected]
bResearch Assistant, Department of Agricultural Economics, 371C AGLS Building Texas A&M University,
College Station, Texas, 77843-2124, USA Email: [email protected]
Abstract
The energy drink market is one of the fastest growing markets in the non-alcoholic beverage
industry. Yet, relatively little is known about this set of “new age” beverages. To fill this
research void, we provide a historical perspective on this market and gather information from a
local retailer located close to the campus of Texas A&M University to estimate the demand
interrelationships for major energy drink brands (Full Throttle, Monster, Red Bull, and Rock-
star). We employ the Barten synthetic demand system in this regard and obtain estimates of own-
price, cross-price, and expenditure elasticities for the respective brands.
Keywords: energy drinks, Barten synthetic demand system, pilot study
Corresponding author
Capps and Hanselman Journal of Food Distribution Research
November 2012 Volume 43, Issue 3
.
16
Background
The energy drink market is one of the fastest growing markets in the non-alcoholic beverage in-
dustry. Sales of energy drinks in the United States were expected to grow to $10 billion by the
close of 2011 (The Beverage Network 2011). Designed to combat physical and mental fatigue,
energy drinks contain a variety of vitamins, herbal supplements, and stimulants. Main ingredi-
ents include caffeine, taurine, sucrose, glucose, and B-group vitamins. Japan is viewed as the
pioneer of the energy drink phenomenon, starting in 1962 where Taisho Pharmaceuticals manu-
factured a beverage called Lipovitan-D (Penalty 2006). In 1987, an Austrian, Dietrich
Mateschitz, formulated Red Bull which surged in popularity in Europe. In 1997, Red Bull was
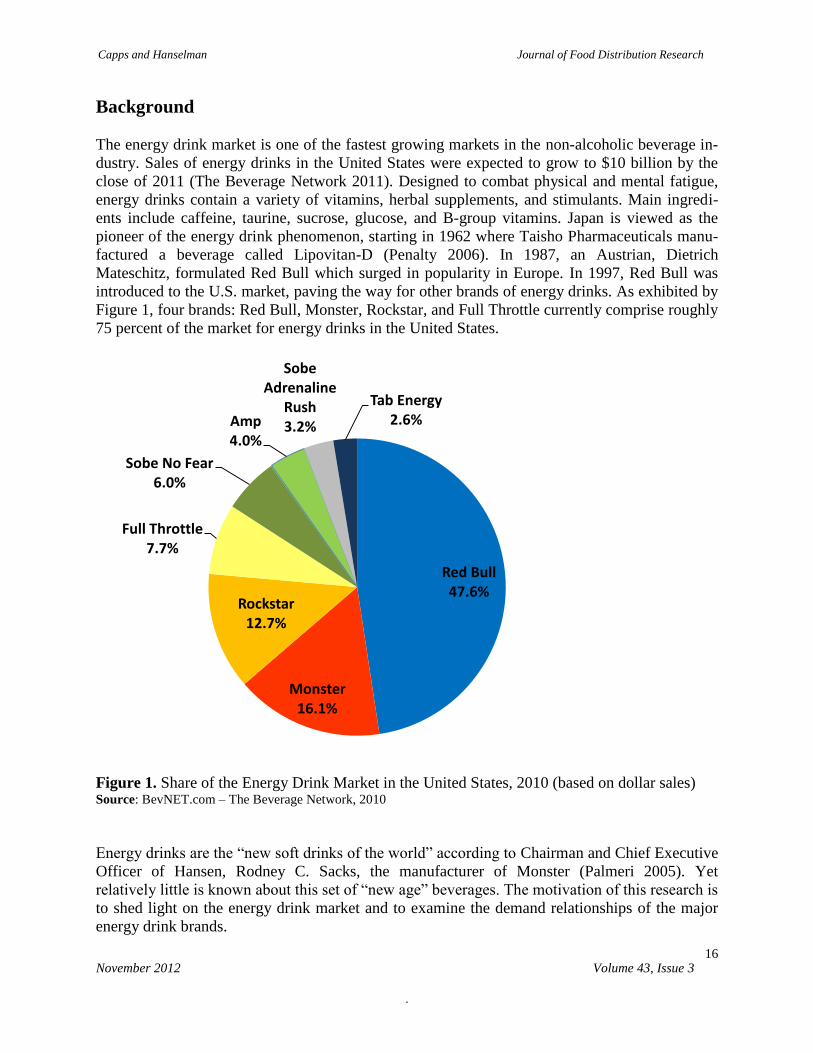
introduced to the U.S. market, paving the way for other brands of energy drinks. As exhibited by
Figure 1, four brands: Red Bull, Monster, Rockstar, and Full Throttle currently comprise roughly
75 percent of the market for energy drinks in the United States.
Figure 1. Share of the Energy Drink Market in the United States, 2010 (based on dollar sales) Source: BevNET.com – The Beverage Network, 2010
Energy drinks are the “new soft drinks of the world” according to Chairman and Chief Executive
Officer of Hansen, Rodney C. Sacks, the manufacturer of Monster (Palmeri 2005). Yet
relatively little is known about this set of “new age” beverages. The motivation of this research is
to shed light on the energy drink market and to examine the demand relationships of the major
energy drink brands.
Red Bull 47.6%
Monster 16.1%
Rockstar 12.7%
Full Throttle 7.7%
Sobe No Fear 6.0%
Amp 4.0%
Sobe Adrenaline
Rush 3.2%
Tab Energy 2.6%
Capps and Hanselman Journal of Food Distribution Research
November 2012 Volume 43, Issue 3
.
17
The objectives are threefold: (1) to provide a historical perspective on the nature of the market
for energy drinks; (2) to gather information from a local retailer (H-E-B) in the Bryan-College
Station area in order to investigate factors associated with the demands for the Red Bull, Mon-
ster, Rockstar, and Full Throttle brands; and (3) to provide strategic information to the local
retailer principally via own-price elasticities and cross-price elasticities of the major energy drink
brands. In essence, this work is a pilot study concerning the nature of demand interrelationships
in the domestic energy drink market.
According to the Beverage Network (2011), the primary consumers of energy drinks are those
under 35 years of age. In particular, college students are major consumers of energy drinks.
Malinauskas et al. (2007) found that slightly more than 50 percent of college students consumed
more than one energy drink per month. Given that the Bryan-College Station community
encompasses Texas A&M University, this pilot study allows us to focus on purchases of energy
drinks largely, although not exclusively, by college students.
Historical Perspective on the Energy Drink Market
To fulfill the first objective, we provide a historical perspective on the market for energy drinks.
To that end, we describe the current manufacturers of energy drinks in the U.S. market, and we
provide background information on each of the respective major brands (e.g. the date in which
the product was introduced, characteristics of the product, distribution of the product, and market
share). Also, we discuss various aspects of advertising/promotion for energy drinks.
Energy drinks provide attractive margins to distributors and to retailers. Additionally, these bev-
erages do not require much shelf space. Energy drinks are distributed in convenience and gas
stores, supermarkets, and other outlets. A near-majority of sales takes place in convenience and
gas stores; immediate gratification destinations. Over the period 2004 to 2009, roughly 46 per-
cent to 53 percent of the volume sold of energy drinks took place in convenience and gas stores,
about 10 percent of the volume sold took place in supermarkets, and approximately 13 percent of
the volume sold took place in food service outlets (The Beverage Network, 2011). The marketing
of energy drinks typically rests on the use of nontraditional outlets, for example, extreme sports,
NASCAR, and celebrity endorsements. Not much is done through the use of
television, radio, and print advertising (The Beverage Network 2011).
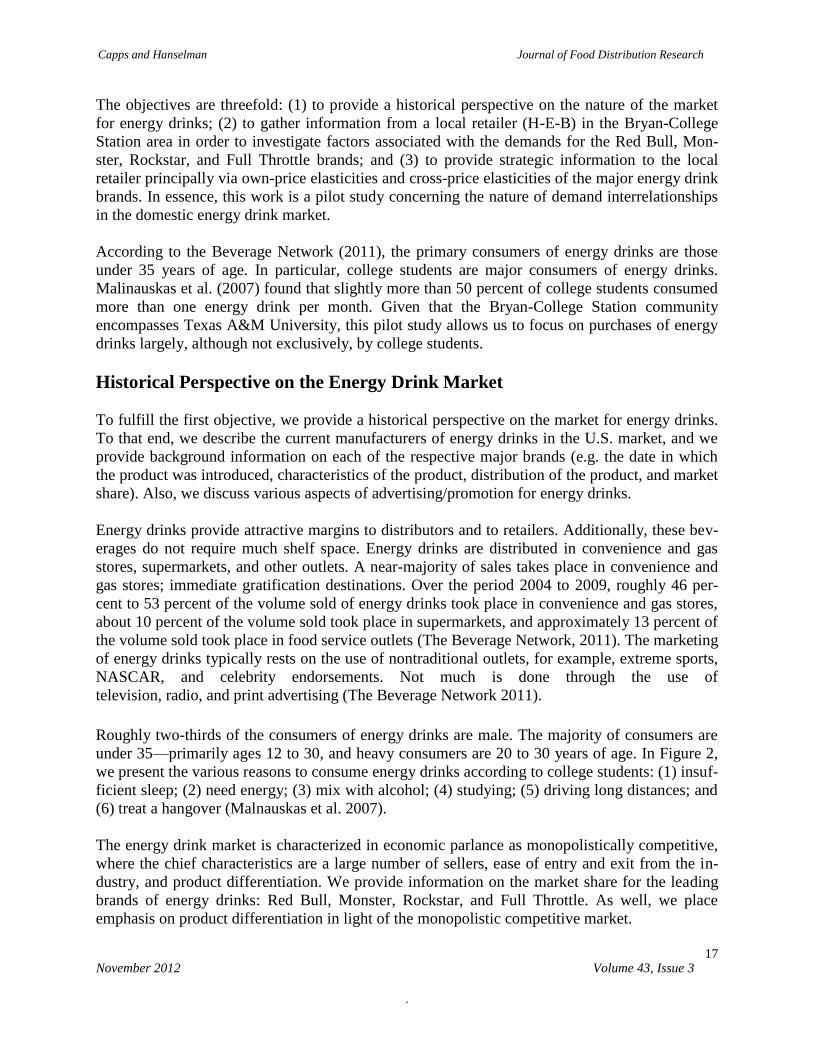
Roughly two-thirds of the consumers of energy drinks are male. The majority of consumers are
under 35—primarily ages 12 to 30, and heavy consumers are 20 to 30 years of age. In Figure 2,
we present the various reasons to consume energy drinks according to college students: (1) insuf-
ficient sleep; (2) need energy; (3) mix with alcohol; (4) studying; (5) driving long distances; and
(6) treat a hangover (Malnauskas et al. 2007).
The energy drink market is characterized in economic parlance as monopolistically competitive,
where the chief characteristics are a large number of sellers, ease of entry and exit from the in-
dustry, and product differentiation. We provide information on the market share for the leading
brands of energy drinks: Red Bull, Monster, Rockstar, and Full Throttle. As well, we place
emphasis on product differentiation in light of the monopolistic competitive market.
Capps and Hanselman Journal of Food Distribution Research
November 2012 Volume 43, Issue 3
.
18
Figure 2. Percentage of College Students Reporting the Frequency of Energy Drink
Consumption by Situation within a Month. Source: Malinauskas et al. (2007)
Red Bull is the best known and most widely consumed energy drink in the world. Red Bull was
adapted from a Thai beverage called “Krating Daeng,” a popular drink with rickshaw drivers in
Thailand. Established in 1984, the co-founders of this brand were Dietrich Mateschitz, an
Austrian entrepreneur, and Chaleo Yoovidhya, owner of Krating Daeng. Red Bull is currently
manufactured by Red Bull GmbH, an Austrian company. Its main ingredients include taurine (an
amino acid) and glucuronolactone (a carbohydrate). Proclamations made by the manufacturers of
Red Bull include increased performance, increased concentration, increased reaction speed, im-
proved vigilance, improved emotional status, and stimulated metabolism (Penalty 2006). Its
slogan is “Red Bull gives you wings.” As with the majority of energy drinks, Red Bull is mainly
advertised through sporting event sponsorships and celebrity endorsements. Currently, Red Bull
occupies a market share of between 40 percent and 45 percent among energy drinks (The Bever-
age Market 2011).
Capps and Hanselman Journal of Food Distribution Research
November 2012 Volume 43, Issue 3
.
19
Monster is manufactured by the Hansen Natural Corporation in Corona, California. Introduced
initially in 2002, this brand was one of the first energy drinks marketed in a 16-ounce can, nearly
twice the size of the typical “bullet” size. The slogan for Monster energy drinks is “unleash the
beast.” The drink typically comes in a black can with a green “M” logo. Monster pull tabs are
unique from standard pull tabs in that they are punched with an “M” instead of a large hole (Pen-
alty 2006). Monster contains ingredients of l-carnitine, taurine, ginseng, and B vitamins. The
manufacturer’s advertising methods include the sponsorship of extreme sporting events such as
Supercross, Nascar, snowboarding, and drag racing. At present, the market share for Monster is
around 15 percent (The Beverage Market 2011).
Rockstar was created in 2001 by Russell Weiner, son of the renowned herbalist, Michael Weiner.
The slogan for this brand is “party like a rockstar.” The official website is black and red and
bursting with photographs of celebrities drinking or holding the beverage. Manufactured by
Rockstar, Inc. based in Las Vegas, Nevada, Rockstar was the first energy drink to be available in
16 and 24 ounce cans. Weiner sought to differentiate Rockstar from the industry leader Red Bull,
claiming that the drink was “twice the size of Red Bull for the same price.” Rockstar also differ-
entiates its product by featuring ingredients that are “scientifically” formulated to speed the re-
covery time of those who lead active and exhausting lifestyles (Penalty 2006). Rockstar is also
available in many different flavors. At present, the market share for Rockstar is between 10 per-
cent and 12 percent among energy drinks (The Beverage Network 2011).
Full Throttle is made with 100 percent premium Arabic coffee. Its slogan is “no choke mix-
ture…full flavor you don’t have to force down…No mystery ingredients. No bull.” (Penalty
2006). Full Throttle is available in several different flavors. Currently, the market share for Full
Throttle is between 5 percent and 10 percent (The Beverage Network 2011).
Data from a Local Retailer Concerning Major Energy Drink Brands
To satisfy the second objective, we solicited data related to weekly sales, volume, and price
information as well as weekly customer counts for Red Bull, Monster, Rockstar, and Full
Throttle energy drinks from a local H-E-B supermarket in close proximity to the campus of
Capps and Hanselman Journal of Food Distribution Research
November 2012 Volume 43, Issue 3
.
20
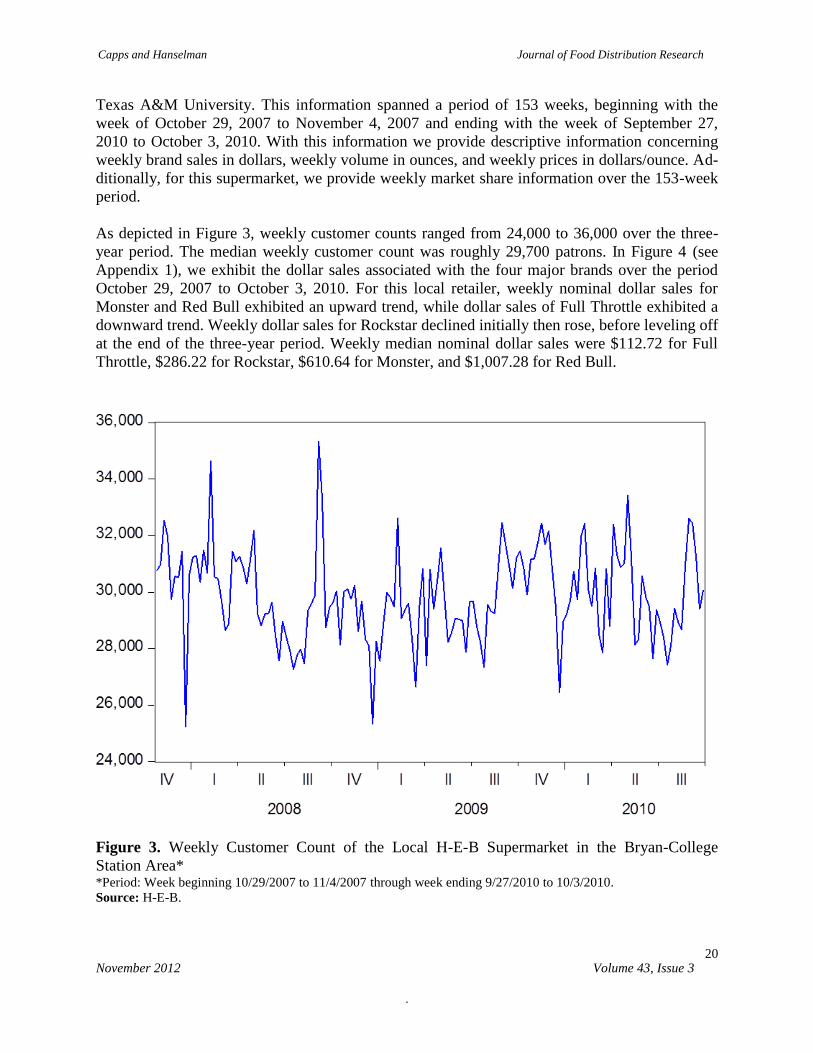
Texas A&M University. This information spanned a period of 153 weeks, beginning with the
week of October 29, 2007 to November 4, 2007 and ending with the week of September 27,
2010 to October 3, 2010. With this information we provide descriptive information concerning
weekly brand sales in dollars, weekly volume in ounces, and weekly prices in dollars/ounce. Ad-
ditionally, for this supermarket, we provide weekly market share information over the 153-week
period.
As depicted in Figure 3, weekly customer counts ranged from 24,000 to 36,000 over the three-
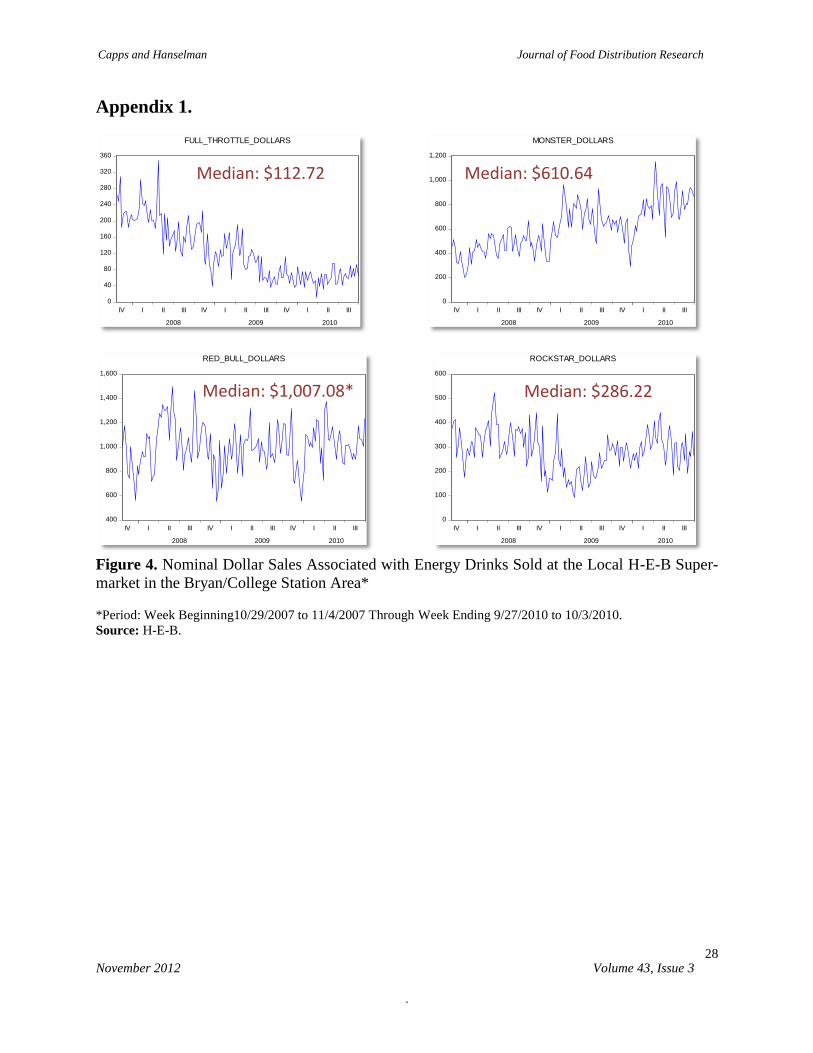
year period. The median weekly customer count was roughly 29,700 patrons. In Figure 4 (see
Appendix 1), we exhibit the dollar sales associated with the four major brands over the period
October 29, 2007 to October 3, 2010. For this local retailer, weekly nominal dollar sales for
Monster and Red Bull exhibited an upward trend, while dollar sales of Full Throttle exhibited a
downward trend. Weekly dollar sales for Rockstar declined initially then rose, before leveling off
at the end of the three-year period. Weekly median nominal dollar sales were $112.72 for Full
Throttle, $286.22 for Rockstar, $610.64 for Monster, and $1,007.28 for Red Bull.
Figure 3. Weekly Customer Count of the Local H-E-B Supermarket in the Bryan-College
Station Area* *Period: Week beginning 10/29/2007 to 11/4/2007 through week ending 9/27/2010 to 10/3/2010.
Source: H-E-B.
Capps and Hanselman Journal of Food Distribution Research
November 2012 Volume 43, Issue 3
.
21
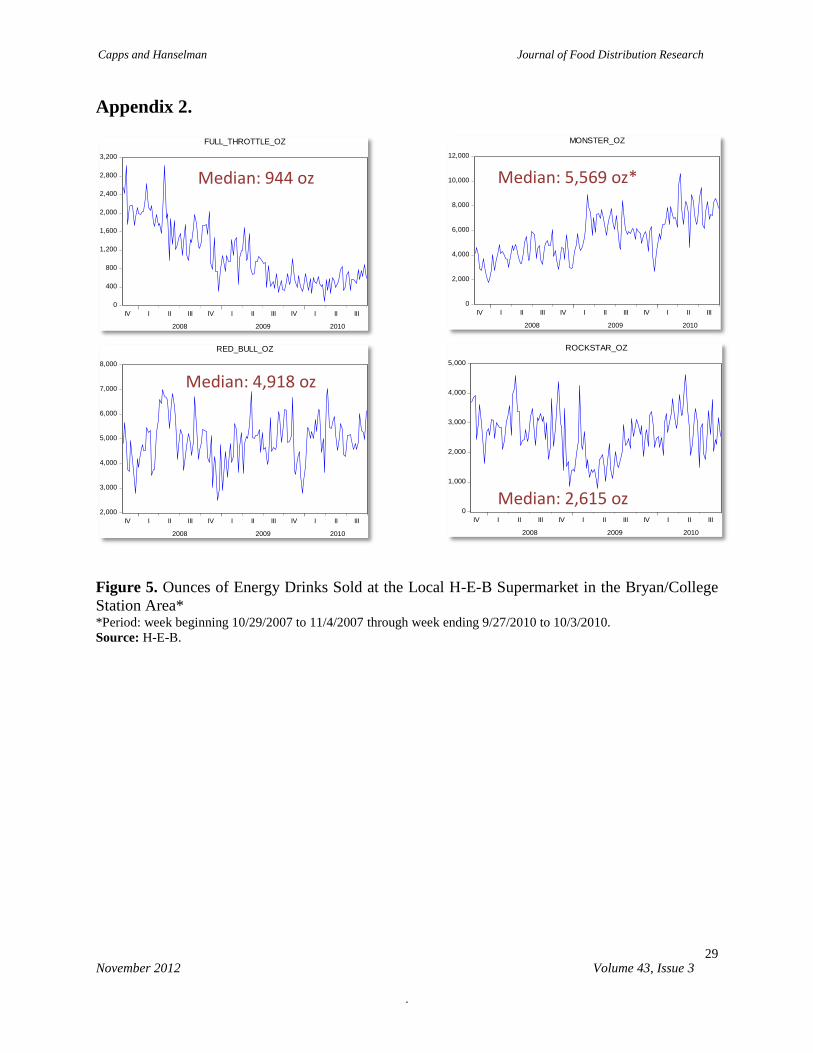
As presented in Figure 5 (see Appendix 2), ounces sold for energy drinks from October 29, 2007
to October 3, 2010 exemplified the same types of patterns as for dollar sales. Median ounces sold
were 944 for Full Throttle, 2,615 for Rockstar, 4,918 for Red Bull, and 5,569 for Monster.
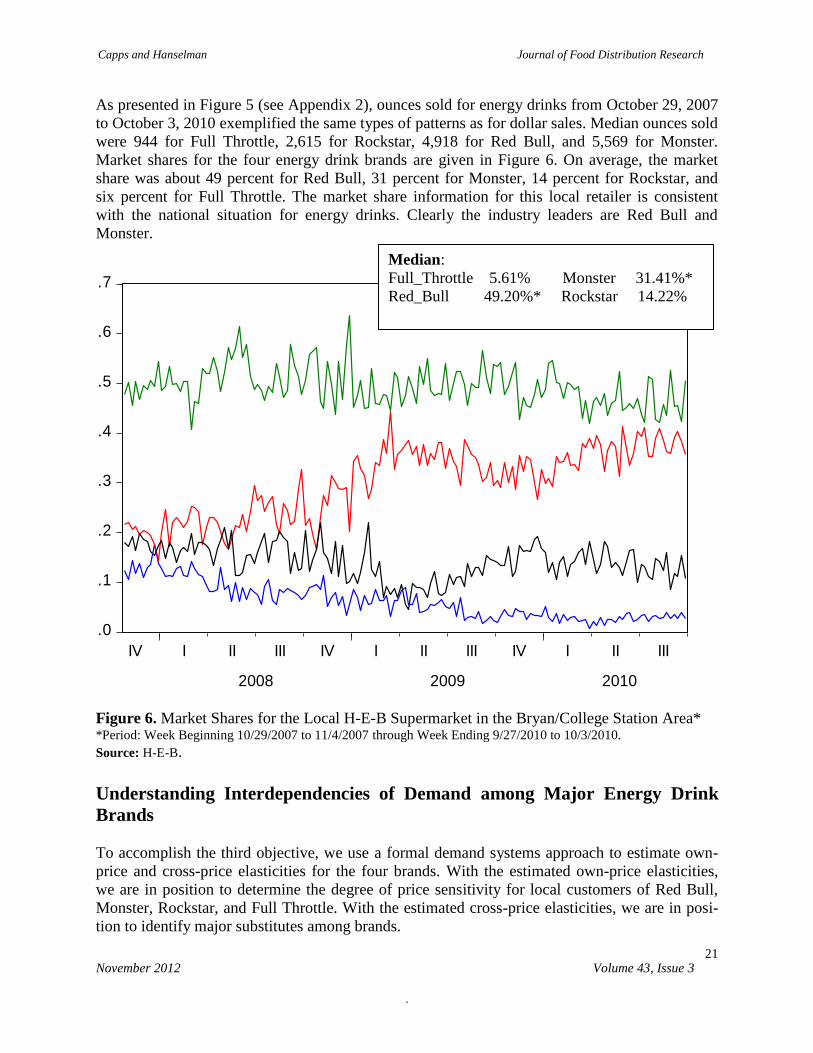
Market shares for the four energy drink brands are given in Figure 6. On average, the market
share was about 49 percent for Red Bull, 31 percent for Monster, 14 percent for Rockstar, and
six percent for Full Throttle. The market share information for this local retailer is consistent
with the national situation for energy drinks. Clearly the industry leaders are Red Bull and
Monster.
Figure 6. Market Shares for the Local H-E-B Supermarket in the Bryan/College Station Area* *Period: Week Beginning 10/29/2007 to 11/4/2007 through Week Ending 9/27/2010 to 10/3/2010.
Source: H-E-B.
Understanding Interdependencies of Demand among Major Energy Drink
Brands
To accomplish the third objective, we use a formal demand systems approach to estimate own-
price and cross-price elasticities for the four brands. With the estimated own-price elasticities,
we are in position to determine the degree of price sensitivity for local customers of Red Bull,
Monster, Rockstar, and Full Throttle. With the estimated cross-price elasticities, we are in posi-
tion to identify major substitutes among brands.
.0
.1
.2
.3
.4
.5
.6
.7
IV I II III IV I II III IV I II III
2008 2009 2010
W_FULL_THROTTLE W_MONSTER
W_RED_BULL W_ROCKSTAR
Median:
Full_Throttle 5.61% Monster 31.41%*
Red_Bull 49.20%* Rockstar 14.22%
Capps and Hanselman Journal of Food Distribution Research
November 2012 Volume 43, Issue 3
.
22
One of the compelling features of demand system models is that they maintain flexibility while
simultaneously satisfying the adding-up, homogeneity, and symmetry restrictions in accordance
with demand theory. However, there is little to guide researchers when attempting to choose a
particular functional form among various alternatives. In this light, Barten (1993) developed a
synthetic system which nests four popular differential demand systems including the Rotterdam,
LA/AIDS, CBS (Central Bureau of Statistics), and NBR (National Bureau Research). Maynard
and Veeramani (2003) also demonstrate that synthetic models help avoid specification bias
through the use of generalized functional forms.
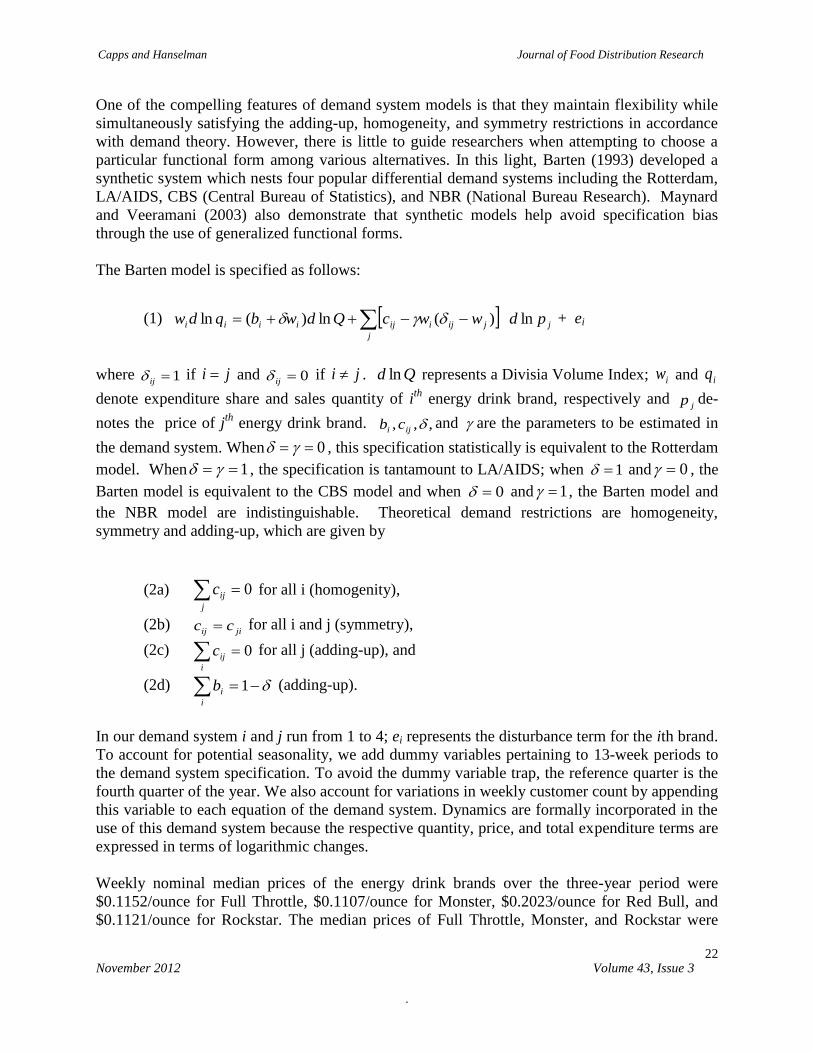
The Barten model is specified as follows:
(1) j
j
jijiijiiii pdwwcQdwbqdw ln)(ln)(ln + ei
where 1ij if ji and 0ij if ji . Qd ln represents a Divisia Volume Index; iw and iq
denote expenditure share and sales quantity of ith
energy drink brand, respectively and jp de-
notes the price of jth
energy drink brand. ,,, iji cb and are the parameters to be estimated in
the demand system. When 0 , this specification statistically is equivalent to the Rotterdam
model. When 1 , the specification is tantamount to LA/AIDS; when 1 and 0 , the
Barten model is equivalent to the CBS model and when 0 and 1 , the Barten model and
the NBR model are indistinguishable. Theoretical demand restrictions are homogeneity,
symmetry and adding-up, which are given by
(2a) 0j
ijc for all i (homogenity),
(2b) jiij cc for all i and j (symmetry),
(2c)
0i
ijc for all j (adding-up), and
(2d) i
ib 1 (adding-up).
In our demand system i and j run from 1 to 4; ei represents the disturbance term for the ith brand.
To account for potential seasonality, we add dummy variables pertaining to 13-week periods to
the demand system specification. To avoid the dummy variable trap, the reference quarter is the
fourth quarter of the year. We also account for variations in weekly customer count by appending
this variable to each equation of the demand system. Dynamics are formally incorporated in the
use of this demand system because the respective quantity, price, and total expenditure terms are
expressed in terms of logarithmic changes.
Weekly nominal median prices of the energy drink brands over the three-year period were
$0.1152/ounce for Full Throttle, $0.1107/ounce for Monster, $0.2023/ounce for Red Bull, and
$0.1121/ounce for Rockstar. The median prices of Full Throttle, Monster, and Rockstar were
Capps and Hanselman Journal of Food Distribution Research
November 2012 Volume 43, Issue 3
.
23
very similar. The median price of Red Bull was nearly double the median prices of the remaining
major brands for this local retailer. The range of the nominal prices was $0.0999/ounce to
$0.1431/ounce for Full Throttle, $0.1013/ounce to $0.1231/ounce for Monster, $0.1900/ounce to
$0.2283/ounce for Red Bull, and $0.0928 to $0.1328/ounce for Rockstar. Pairwise correlations
among the respective prices were not high by any means, ranging from -0.1937 to 0.3324.
In estimating the Barten synthetic demand system, one equation was dropped to avoid estimation
problems due to the singularity of the variance-covariance matrix of disturbance terms. The
equation pertaining to the Rockstar brand was chosen arbitrarily to be omitted from the system.
The parameter estimates associated with this omitted equation are recovered through the use of
the aforementioned theoretical restrictions given by equations (2a) to (2d).
An Iterated Seemingly Unrelated Regression (ITSUR) technique is applied, taking into account
the contemporaneous correlation of the disturbance terms among the equations. As well, we al-
low for the presence of first-order serial correlation [AR(1)] in the disturbance terms in each of
the equations. The “mechanical” correction accounts for other systematic factors (e.g. advertising
and promotion, the prices of other non-alcoholic beverages, etc.) that do not explicitly appear in
the demand system due primarily to the lack of available data. These other systematic factors
may affect the dependent variables in the system. Because of adding-up, a common AR(1)
coefficient was estimated for the system of equations.
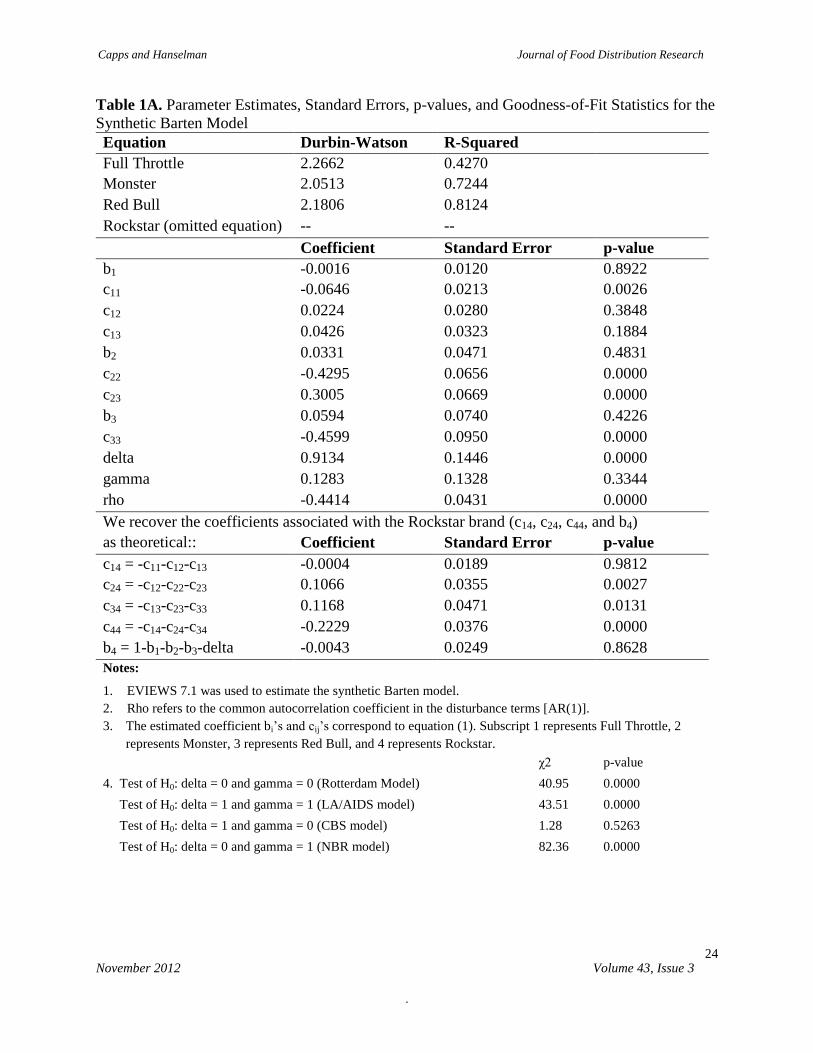
The estimated coefficients, standard errors, p-values, and goodness-of-fit statistics associated
with the Barten synthetic demand system are presented in Tables 1a and 1b. The estimated coef-
ficients with the cij’s are all statistically different from zero except for c14. The estimated coeffi-
cients associated with the bi’s are not statistically different from zero. Neither the coefficients
pertaining to seasonality nor customer counts were statistically different from zero. The good-
ness-of-fit statistics indicate that the individual equations of the demand system explain a notable
amount of variability in each of the dependent variables. The range of the goodness-of-fit statis-
tics was from 0.427 to 0.812. Importantly, based on the estimates of δ and γ, the Barten model
was statistically superior to the Rotterdam model, the LA/AIDS model, and the NBR model. The
empirical analysis, however, was consistent with the CBS model.
Capps and Hanselman Journal of Food Distribution Research
November 2012 Volume 43, Issue 3
.
24
Table 1A. Parameter Estimates, Standard Errors, p-values, and Goodness-of-Fit Statistics for the
Synthetic Barten Model
Equation Durbin-Watson R-Squared
Full Throttle 2.2662 0.4270
Monster 2.0513 0.7244
Red Bull 2.1806 0.8124
Rockstar (omitted equation) -- --
Coefficient Standard Error p-value
b1 -0.0016 0.0120 0.8922
c11 -0.0646 0.0213 0.0026
c12 0.0224 0.0280 0.3848
c13 0.0426 0.0323 0.1884
b2 0.0331 0.0471 0.4831
c22 -0.4295 0.0656 0.0000
c23 0.3005 0.0669 0.0000
b3 0.0594 0.0740 0.4226
c33 -0.4599 0.0950 0.0000
delta 0.9134 0.1446 0.0000
gamma 0.1283 0.1328 0.3344
rho -0.4414 0.0431 0.0000
We recover the coefficients associated with the Rockstar brand (c14, c24, c44, and b4)
strictions. as theoretical:: Coefficient Standard Error p-value
c14 = -c11-c12-c13 -0.0004 0.0189 0.9812
c24 = -c12-c22-c23 0.1066 0.0355 0.0027
c34 = -c13-c23-c33 0.1168 0.0471 0.0131
c44 = -c14-c24-c34 -0.2229 0.0376 0.0000
b4 = 1-b1-b2-b3-delta -0.0043 0.0249 0.8628
Notes:
1. EVIEWS 7.1 was used to estimate the synthetic Barten model.
2. Rho refers to the common autocorrelation coefficient in the disturbance terms [AR(1)].
3. The estimated coefficient bi’s and cij’s correspond to equation (1). Subscript 1 represents Full Throttle, 2
represents Monster, 3 represents Red Bull, and 4 represents Rockstar.
χ2 p-value
4. Test of H0: delta = 0 and gamma = 0 (Rotterdam Model) 40.95 0.0000
Test of H0: delta = 1 and gamma = 1 (LA/AIDS model) 43.51 0.0000
Test of H0: delta = 1 and gamma = 0 (CBS model) 1.28 0.5263
Test of H0: delta = 0 and gamma = 1 (NBR model) 82.36 0.0000
Capps and Hanselman Journal of Food Distribution Research
November 2012 Volume 43, Issue 3
.
25
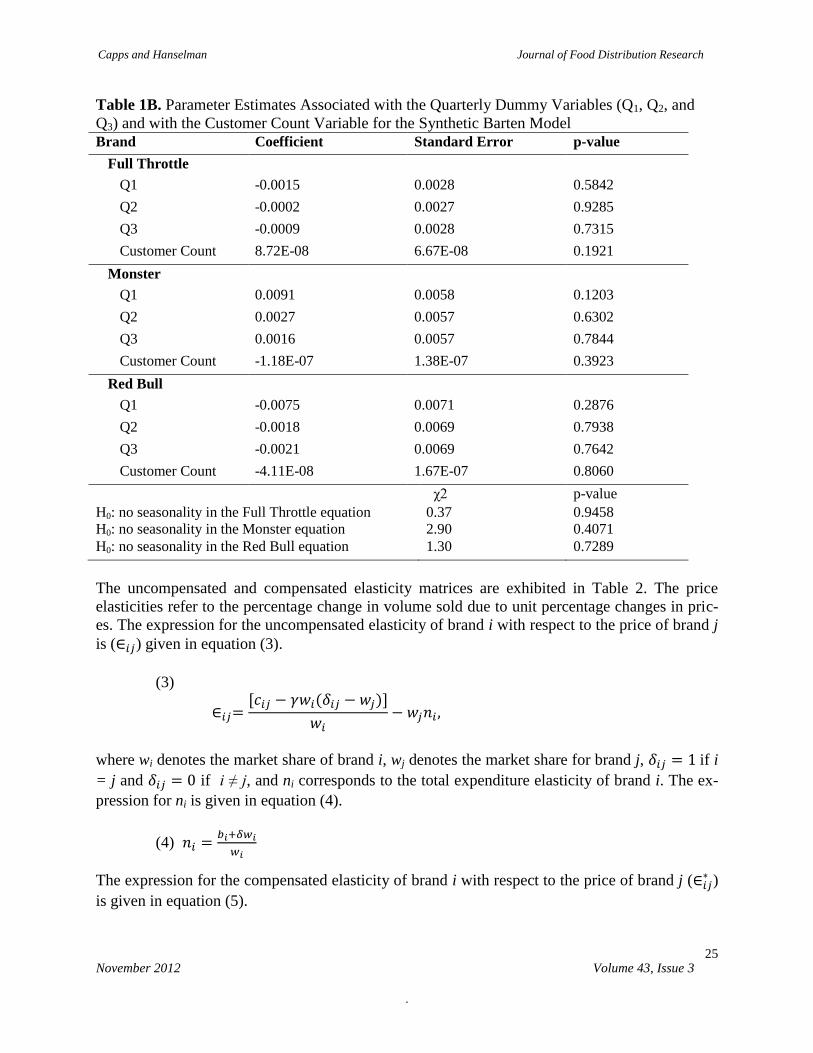
Table 1B. Parameter Estimates Associated with the Quarterly Dummy Variables (Q1, Q2, and
Q3) and with the Customer Count Variable for the Synthetic Barten Model
Brand Coefficient Standard Error p-value
Full Throttle
Q1 -0.0015 0.0028 0.5842
Q2 -0.0002 0.0027 0.9285
Q3 -0.0009 0.0028 0.7315
Customer Count 8.72E-08 6.67E-08 0.1921
Monster
Q1 0.0091 0.0058 0.1203
Q2 0.0027 0.0057 0.6302
Q3 0.0016 0.0057 0.7844
Customer Count -1.18E-07 1.38E-07 0.3923
Red Bull
Q1 -0.0075 0.0071 0.2876
Q2 -0.0018 0.0069 0.7938
Q3 -0.0021 0.0069 0.7642
Customer Count -4.11E-08 1.67E-07 0.8060
χ2 p-value
H0: no seasonality in the Full Throttle equation 0.37 0.9458
H0: no seasonality in the Monster equation 2.90 0.4071
H0: no seasonality in the Red Bull equation 1.30 0.7289
The uncompensated and compensated elasticity matrices are exhibited in Table 2. The price
elasticities refer to the percentage change in volume sold due to unit percentage changes in pric-
es. The expression for the uncompensated elasticity of brand i with respect to the price of brand j
is ( ) given in equation (3).
(3)
where wi denotes the market share of brand i, wj denotes the market share for brand j, if i
= j and if i ≠ j, and ni corresponds to the total expenditure elasticity of brand i. The ex-
pression for ni is given in equation (4).
(4)
The expression for the compensated elasticity of brand i with respect to the price of brand j ( )
is given in equation (5).
Capps and Hanselman Journal of Food Distribution Research
November 2012 Volume 43, Issue 3
.
26
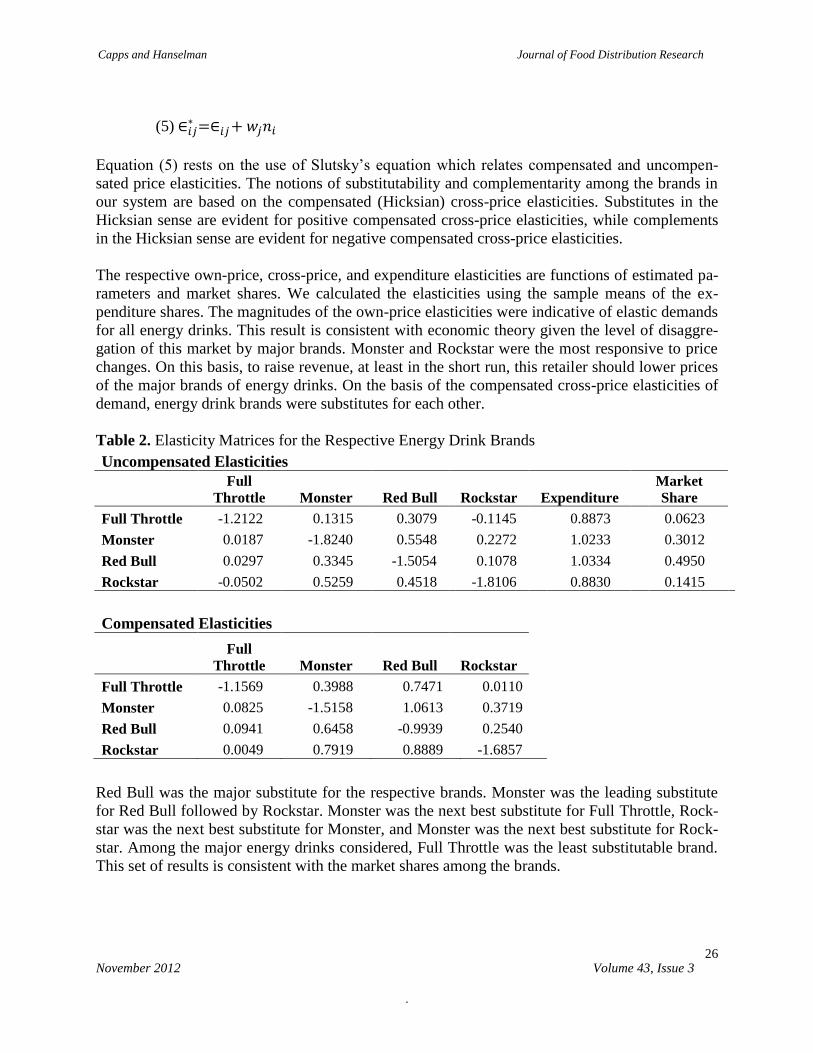
(5)
Equation (5) rests on the use of Slutsky’s equation which relates compensated and uncompen-
sated price elasticities. The notions of substitutability and complementarity among the brands in
our system are based on the compensated (Hicksian) cross-price elasticities. Substitutes in the
Hicksian sense are evident for positive compensated cross-price elasticities, while complements
in the Hicksian sense are evident for negative compensated cross-price elasticities.
The respective own-price, cross-price, and expenditure elasticities are functions of estimated pa-
rameters and market shares. We calculated the elasticities using the sample means of the ex-
penditure shares. The magnitudes of the own-price elasticities were indicative of elastic demands
for all energy drinks. This result is consistent with economic theory given the level of disaggre-
gation of this market by major brands. Monster and Rockstar were the most responsive to price
changes. On this basis, to raise revenue, at least in the short run, this retailer should lower prices
of the major brands of energy drinks. On the basis of the compensated cross-price elasticities of
demand, energy drink brands were substitutes for each other.
Table 2. Elasticity Matrices for the Respective Energy Drink Brands
Uncompensated Elasticities
Full
Throttle Monster Red Bull Rockstar Expenditure
Market
Share
Full Throttle -1.2122 0.1315 0.3079 -0.1145 0.8873 0.0623
Monster 0.0187 -1.8240 0.5548 0.2272 1.0233 0.3012
Red Bull 0.0297 0.3345 -1.5054 0.1078 1.0334 0.4950
Rockstar -0.0502 0.5259 0.4518 -1.8106 0.8830 0.1415
Compensated Elasticities
Full
Throttle Monster Red Bull Rockstar
Full Throttle -1.1569 0.3988 0.7471 0.0110
Monster 0.0825 -1.5158 1.0613 0.3719
Red Bull 0.0941 0.6458 -0.9939 0.2540
Rockstar 0.0049 0.7919 0.8889 -1.6857
Red Bull was the major substitute for the respective brands. Monster was the leading substitute
for Red Bull followed by Rockstar. Monster was the next best substitute for Full Throttle, Rock-
star was the next best substitute for Monster, and Monster was the next best substitute for Rock-
star. Among the major energy drinks considered, Full Throttle was the least substitutable brand.
This set of results is consistent with the market shares among the brands.
Capps and Hanselman Journal of Food Distribution Research
November 2012 Volume 43, Issue 3
.
27
Conclusions
This analysis allows a better understanding in regard to purchase behavior of major energy drink
brands. This analysis may be replicated for other H-E-B stores, for other retailers, or for various
convenience store and gas station outlets. This analysis will allow manufacturers of the major
energy drink brands as well as retailers to improve strategic decision-making. Specifically, with
our quantitative analysis, forecasts of item movement can be made to assist in inventory man-
agement, and pricing strategies can be developed to maximize sales revenue.
A number of limitations exist in the present analysis. The data pertain to only one store, H-E-B,
and do not reflect competitor actions. Additionally, due to the lack of available data, the model
does not take into account in-store promotion or local advertising effects. Moreover, other poten-
tial substitutes from the set of non-alcoholic beverages, particularly those rich in caffeine, are not
considered (e.g., coffee, tea, and carbonated soft drinks). This work certainly may be replicated
in other areas throughout the United States. To be sure, future work should accommodate a long-
er list of potential substitutes/complements from the non-alcoholic beverage category as well as
the impacts of advertising and promotion. Nevertheless, our pilot study approach fills a research
void on the examination of the energy drink market. Future research should provide dividends to
analyses of this growing “new age” beverage category.
References
Barten, A. P. 1993. “Consumer Allocation Models: Choice of Functional Form.” Empirical
Economics 18(1):129-158.
Malinauskas, B. M., V. G. Aeby, R. F. Overton, T. Carpenter-Aeby, and K. Barber-Heidal. 2007.
“A Survey of Energy Drink Consumption Patterns among College Students.” Nutrition
Journal. http://www.nutritionj.com/[content accessed February 26, 2011].
Maynard, L.J. and V.N. Veeramani. 2003. “Price Sensitivities for US Frozen Dairy Products.”
Journal of Agricultural and Applied Economics 35:599-609.
Palmeri, C. "Hansen Natural." Businessweek. 6 June 2005.
<http://www.businessweek.com/magazine/content/05_23/b3936409.htm>.
Penalty, J. 2006. “A Brief History of Energy Drinks.” SWINDLE Magazine.
<http://swindlemagazine.com/issue06/a-brief-history-of-energy-drinks/>.
[Accessed February 26, 2011].
The Beverage Network. http://www.bevnet.com, “Energy Drinks Market.”
[Accessed February 26, 2011].
Capps and Hanselman Journal of Food Distribution Research
November 2012 Volume 43, Issue 3
.
28
Appendix 1.
Figure 4. Nominal Dollar Sales Associated with Energy Drinks Sold at the Local H-E-B Super-
market in the Bryan/College Station Area*
*Period: Week Beginning10/29/2007 to 11/4/2007 Through Week Ending 9/27/2010 to 10/3/2010.
Source: H-E-B.
0
40
80
120
160
200
240
280
320
360
IV I II III IV I II III IV I II III
2008 2009 2010
FULL_THROTTLE_DOLLARS
0
200
400
600
800
1,000
1,200
IV I II III IV I II III IV I II III
2008 2009 2010
MONSTER_DOLLARS
400
600
800
1,000
1,200
1,400
1,600
IV I II III IV I II III IV I II III
2008 2009 2010
RED_BULL_DOLLARS
0
100
200
300
400
500
600
IV I II III IV I II III IV I II III
2008 2009 2010
ROCKSTAR_DOLLARS
Median: $112.72 Median: $610.64
Median: $1,007.08* Median: $286.22
Capps and Hanselman Journal of Food Distribution Research
November 2012 Volume 43, Issue 3
.
29
Appendix 2.
Figure 5. Ounces of Energy Drinks Sold at the Local H-E-B Supermarket in the Bryan/College
Station Area* *Period: week beginning 10/29/2007 to 11/4/2007 through week ending 9/27/2010 to 10/3/2010.
Source: H-E-B.
2,000
3,000
4,000
5,000
6,000
7,000
8,000
IV I II III IV I II III IV I II III
2008 2009 2010
RED_BULL_OZ
0
2,000
4,000
6,000
8,000
10,000
12,000
IV I II III IV I II III IV I II III
2008 2009 2010
MONSTER_OZ
0
400
800
1,200
1,600
2,000
2,400
2,800
3,200
IV I II III IV I II III IV I II III
2008 2009 2010
FULL_THROTTLE_OZ
0
1,000
2,000
3,000
4,000
5,000
IV I II III IV I II III IV I II III
2008 2009 2010
ROCKSTAR_OZ
Median: 944 oz Median: 5,569 oz*
Median: 4,918 oz
Median: 2,615 oz