Embed Size (px)
Citation preview
Microslot NMR Probe for Metabolomics StudiesHans Georg Krojanski,† Jorg Lambert,†,‡ Yilmaz Gerikalan,† Dieter Suter,‡,§ andRoland Hergenroder*,†
ISASsInstitute for Analytical Sciences, Bunsen-Kirchhoff-Str. 11, 44139 Dortmund, Germany; IZMRsInterdisziplinaresZentrum fur Magnetische Resonanz, 44221 Dortmund, Germany; and Fachbereich Physik, Technische UniversitatDortmund, Otto-Hahn Str. 4, 44221 Dortmund, Germany
A NMR microprobe based on microstrip technology suit-able for investigations of volume-limited samples in thelow nanoliter range was designed. NMR spectra of samplequantities in the 100 pmol range can be obtained withthis probe in a few seconds. The planar geometry of theprobe is easily adaptable to the size and geometry require-ments of the samples.
Due to its high speciation performance, NMR is one of themajor technologies for metabolic profiling.1 NMR spectroscopyis a very information-rich analytical technique which givescomprehensive chemical information about the composition ofunknown materials. The use of NMR spectroscopy as a tool formetabolomics, however, is limited by the sensitivity of NMR.Generally, one way to enhance the sensitivity is to increase thenuclear polarization, e.g., by dynamic nuclear polarization oroptical pumping, and another approach is to improve the detectionof the NMR signal.2
The optimum experimental setup for NMR on mass-limitedbiological samples is to dissolve the sample in the minimumvolume of solvent to get the highest possible concentration, andto construct the smallest radio frequency (rf) coil that will enclosethe sample.3 The first microcoils that have been used for high-resolution 1H NMR of nanoliter-volume samples were solenoidalcoils.4,5 The construction of solenoidal microcoils is feasible downto sizes of the order of 100 µm. Further downscaling is currentlyhindered by practical problems. Therefore, planar microcoils,which are easier to scale down, were tested. Additionally, planarcoil geometries allow for integration with microfluidic chips torealize a versatile “lab-on-a-chip”. Among the biggest challengesfor planar helical coils is the relatively poor B1 rf field homogeneityand the static B0 field distortions induced by the windings of themicrocoil.6
Recently, two new types of rf microcoils were used for high-resolution 1H NMR, which are based on planar, electromagnetic
waveguides. Microstrip transmission line resonators were firstused for surface coils in MRI by Zhang and co-workers, whichgave also a brief theoretical description of the microstrip rf coilto guide coil design.7 Van Bentum and co-workers introduced astripline waveguide as the NMR detector.8 It has been used forsolid-state NMR9 as well as high-resolution liquid-state NMR.10 Aslightly different approach was taken by Maguire and co-workerswho used a small microslot in a microstrip waveguide that createsa pure series inductance as the rf coil.11 As in conventional probes,lumped elements were used to build a resonance circuit and tomatch the system to the impedance of the spectrometer (50 Ω).This approach is easily scalable to different sizes, and thereforewe used this design to manufacture a microslot NMR probe formetabolomics NMR measurements on mass-limited samples. Weused a femtosecond laser, which allows for very precise laserablation for structures down to sizes of 1 µm, and even below,with high aspect ratios. Femtosecond-laser ablation has the hugeadvantage that thermal damages and stresses degrading themicroslot performance are avoided. The relatively thick copperfilm (>10 µm) is easily and precisely structured this way.
EXPERIMENTAL SECTIONMaterials. Deionized water (W. Schmidt GmbH), 99.9%
labeled D2O, and 2H-labeled chloroform (99.9%) (both from AldrichChemical) were used as solvents. Fused silica capillaries forcapillary electrophoresis (CE) from CS-Chromatographie Servicewere used for the samples with inner diameters (i.d.) of 25, 50,75, and 100 µm; the outer diameters (o.d.) were 360 and 363 µmfor the smallest and the three larger ones, respectively. Capillarieswith i.d. 300 µm (o.d. 400 µm) were employed for measurementsof highly diluted samples (Hirschmann Laborgerate). The variablecapacitors (Voltronics Corp.) for probe building were nonmagnetictrimmer capacitors (NMAJ15HVE) with a range of 1-16 pF. Thefixed capacitor was an 1 pF ATC chip capacitor (700 C series).The substrate used for microcoil fabrication was Rogers RT/duroid 5880 high-frequency laminate. The dielectric of thislaminate is glass microfiber reinforced PTFE (thickness 3.175mm) with electrodeposited copper on both sides (thickness 35µm). For electrical connection, a semirigid coaxial cable (EZ 141-TP/M17) was used inside the probe (Huber + Suhner). The
* To whom correspondence should be addressed. E-mail: [email protected].
† ISASsInstitute for Analytical Sciences.‡ IZMRsInterdisziplinares Zentrum fur Magnetische Resonanz.§ Technische Universitat Dortmund.
(1) Griffin, J. L. Philos. Trans. R. Soc. B 2006, 361, 147–161.(2) Fujiwara, T.; Ramamoorthy, A. Annu. Rep. NMR Spectrosc. 2006, 58, 155–
175.(3) Webb, A. G. Prog. Nucl. Magn. Reson. Spectrosc. 1997, 31, 1–42.(4) Wu, N.; Peck, T. L.; Webb, A. G.; Magin, R. L.; Sweedler, J. V. Anal. Chem.
1994, 66, 3849–3857.(5) Olson, D. L.; Peck, T. L.; Webb, A. G.; Magin, R. L.; Sweedler, J. V. Science
1995, 270, 1967–1970.(6) Stocker, J. E.; Peck, T. L.; Webb, A. G.; Feng, M.; Magin, R. L. IEEE Trans.
Biomed. Eng. 1997, 44, 1122–1127.
(7) Zhang, X.; Ugurbil, K.; Chen, W. Magn. Reson. Med. 2001, 46, 443–450.(8) van Bentum, P. J. M.; Janssen, J. W. G.; Kentgens, A. P. M. Analyst 2004,
129, 793–803.(9) van Bentum, P. J. M.; Janssen, J. W. G.; Kentgens, A. P. M.; Bart, J.;
Gardeniers, J. G. E. J. Magn. Reson. 2007, 189, 104–113.(10) Kentgens, A. P. M.; Bart, J.; van Bentum, P. J. M.; Brinkmann, A.; van Eck,
E. R. H.; Gardeniers, J. G. E.; Janssen, J. W. G.; Knijn, P.; Vasa, S.;Verkuijlen, M. H. W. J. Chem. Phys. 2008, 128, 052202.
Anal. Chem. 2008, 80, 8668–8672
10.1021/ac801636a CCC: $40.75 2008 American Chemical Society8668 Analytical Chemistry, Vol. 80, No. 22, November 15, 2008Published on Web 10/22/2008
photoresist used for chemical etching was AR-U 4040 Alresist(Alresist). The development of the exposed substrate was donewith sodium hydroxide solution (7 g/L). The etching bath (Hema)consisted of sodium persulfate. For cleaning and polishing,deionized water, isopropanol, and abrasive paper with differentgrain sizes (Awuko) were used.
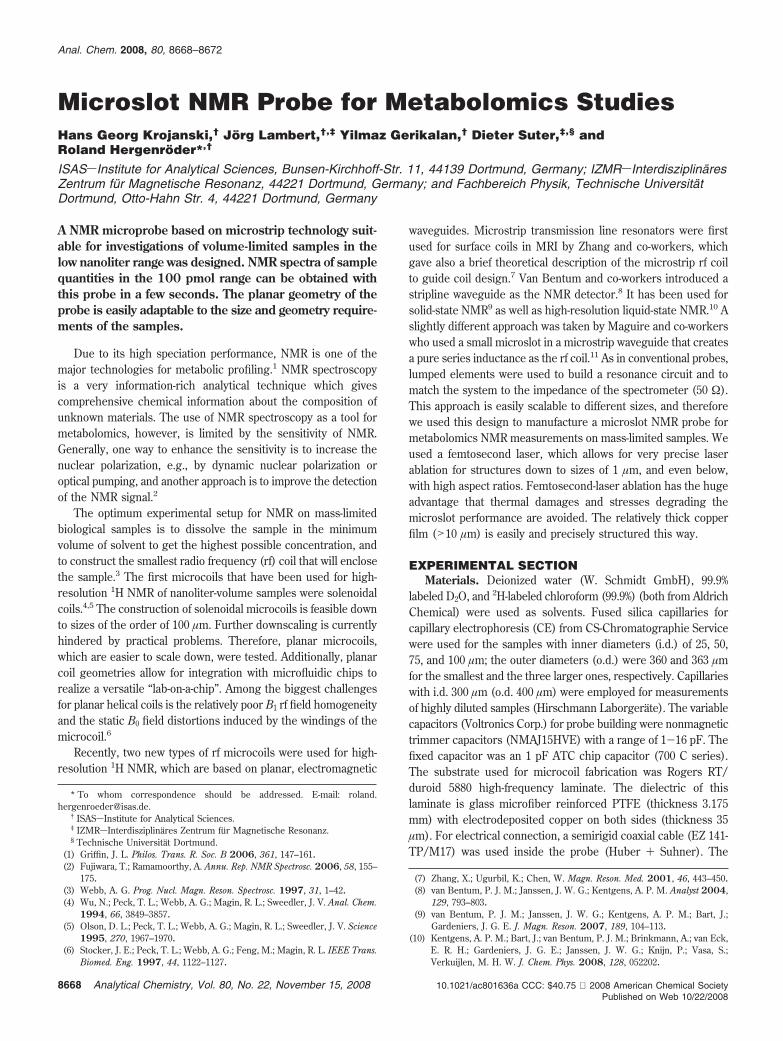
NMR Probe Fabrication. Microslot Fabrication. The micros-trip and the support structure for soldering of the capacitors andthe semirigid cable were chemically etched on one side of theRogers substrate. First, the copper surface was cleaned withisopropanol and bidistilled water. Successively, the surface waspolished to micron root-mean-square (rms) roughness. Theremaining thickness of the film was approximately 30 µm. Afterthat, a thin film of photoresist was rolled up on the substrate.The mask for the structure and microstrip was pressed on thecopper surface and was exposed for 25 s in a vacuum chamber toultraviolet light. The development of the substrate was done in asodium hydroxide bath for several seconds. After that, it wasimmersed in an etching bath that contained sodium persulfatefor about 20 min. The micromachining of the microslot into themicrostrip waveguide was made by femtosecond laser microma-chining. A scanning electron microscope (SEM) picture of themicroslot after the laser ablation is shown in the upper right-handside of Figure 1. The left-hand side of this figure is a photographof the upper part of the probe with the microstrip (black arrow),support structure (Cu), semirigid cable, and capacitors. Themicrostrip has a length of 6 mm, and the greatest length of theconductor from the impedance matching capacitors to the mi-croslot is approximately 4 cm.
Electrical Characterization. The electrical measurements of theresonance circuit were first done with a vector network analyzer(Agilent AN 1287-1). The resonance circuit of the probe has aQ-factor of about 100, and standing wave ratios (SWR) of 1.001are easily achievable. The dc (direct current) resistance of thestructure (including the microstrip) is 0.03 Ω (Keithley 199
multimeter). After the probe was inserted into the magnet, theobservation of the resonance of the probe circuit was performedwith the built-in function of the Bruker spectrometer software(Topspin 2.0/2.1).To estimate the extension of the B1 fieldproduced by the microslot, we used three-dimensional finiteelement (FEM) simulations (COMSOL Multiphysics with Elec-tromagnetics module; Comsol). The lower right-hand side ofFigure 1 shows the component of the magnetic field producedby the microslot which is perpendicular to the B0 field and to theaxis along the microstrip. This component is the B1 field used inNMR to excite the nuclear spins, and it is also the component ofthe detected induced field produced by the spins. The figureshows a color map of the B1 field 181.5 µm above the microslot(the center of most of the capillaries used). From FEM simula-tions, it can be seen that the B1 field does not exceed the lengthof the slot (130 µm) and drops rapidly to zero along the microstrip(Figure 1). According to the simulations, the effective samplelength of the NMR measurements is only 150 µm, even if thefilling height of the sample tube is several millimeters.
Sample Preparation. Individual sample tubes were cut as 1 cmpieces from fused silica capillaries. The sample tubes were cleanedin an ultrasonic bath with acetone, and then in deionized waterfor about an hour each. Before sample insertion, the capillarieswere rinsed with deionized water and dried with compressed air.To fill the tubes they were dipped into the sample which wasimmediately sucked in by capillary forces. Kerr wax was used toseal the tubes after the insertion of the sample. The almostdumbbell-shaped sealed sample tube was then filed so that oneflat surface including the outer surface of the capillary arose. Thisflat surface was used to position the sample tube on the microstrip.It was then taped down with adhesive tape. The positioning andthe cleaning procedures were monitored with an optical micro-scope. Lysozyme was taken from Sigma, lyophilized powder,protein content 95%. The NCM460 (Incell Corp., San Antonio, TX)cell line was derived from normal human colon mucosal epithe-lium. Sucrose was taken from Aldrich, reagent grade 98%. DL-lacticacid lithium salt was taken from Aldrich, 95%.
NMR Experiments. NMR Experiments were carried out byusing a 500 MHz (11.7 T) magnet, a four-channel Bruker AvanceSpectrometer and a home-built probe including the circuit boardwith the microslot waveguide. In some cases comparison mea-surements with a conventional NMR probe (Bruker PAQXI 5 mminverse probe) were performed.
RESULTS AND DISCUSSIONB0 and B1 Homogeneity. To characterize the probe, first a
sample of a mixture of 5% deionized water and 95% deuteratedwater was measured. A typical spectrum is shown as the inset ofFigure 2. In this example, 10.6 nL of water was filled into acapillary with an i.d. of 300 µm, and an o.d. of 400 µm. The rfpulse length was 6.5 µs with 0.58 W output power at the probe,measured with an oscilloscope (LeCroy WavePro 950, 1 GHz, 16GS/s). This corresponds to a rf conversion efficiency (B1 fieldper square root of power) of 1.18 mT/W. For comparison, theBruker PAQXI probe yields 0.24 mT/W. The conversionefficiency is better for our microslot probe because of the smallercoil size. This has recently been shown for planar microresonatorsfor electron spin resonance.12
Figure 1. Left: Photograph of the upper part of the microslot probe.The black arrow points to the microstrip with the microslot at thecenter. Upper right: SEM picture of the microslot after the laserablation. Lower right: By-field component in the vicinity of the microslotobtained by FEM simulation (linear scale from B ) 0 to Bmax). B0
denotes the static magnetic field of the magnet, while B1 is the radio-frequency field generated by the microstrip.
8669Analytical Chemistry, Vol. 80, No. 22, November 15, 2008
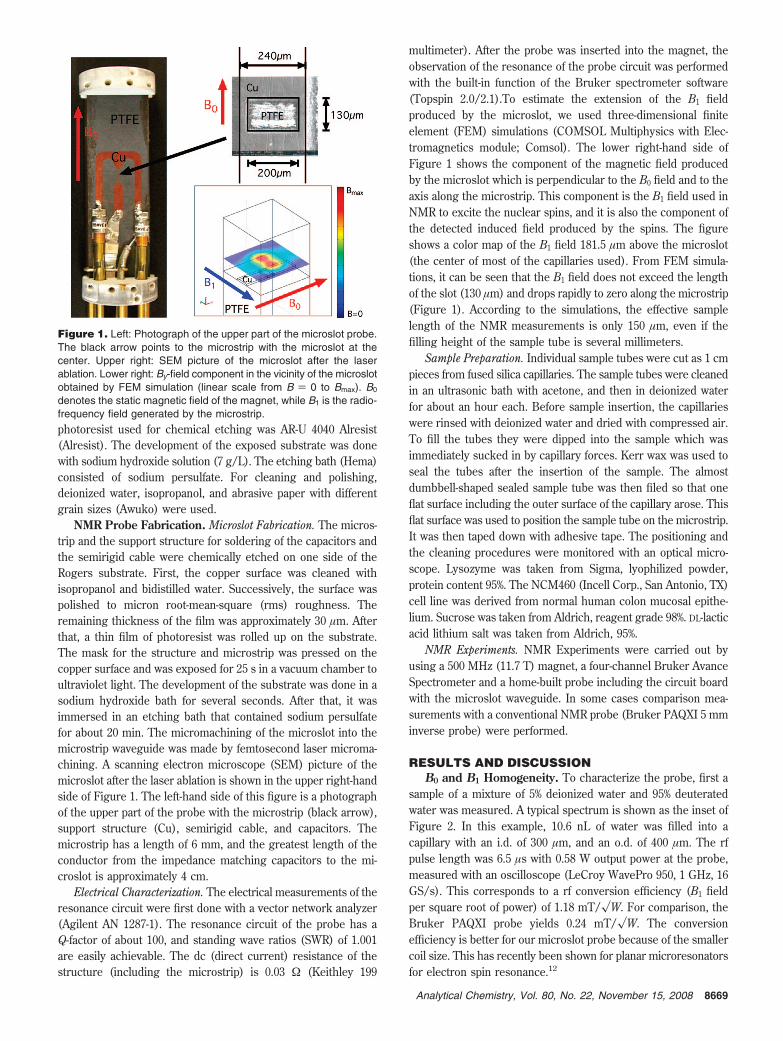
A fit of a Lorentzian to the data results in a line width (fullwidth at half-height (fwhh)) of 3.6 Hz (inset of Figure 2). No filteror apodization of the data was applied to the one-dimensionalspectra. It was possible to get a line width of less than 1 Hz (fwhh),but only at the expense of a broad (∼50 Hz) and distorted baselineof the resonance. In our experiments, we used the shim settingsfor obtaining Lorentzian-shaped resonance in water as a startingpoint for the shimming of other samples.
Nutation experiments were performed on water samples withdifferent inner diameters of the sample tube to characterize thehomogeneity of the B1 rf field of the probe coil. The resultingratios of the signal amplitude at 450° and 90° flip angles are 97%,94%, 83%, and 78% for inner diameters of the sample tubes of 25,50, 75, and 100 µm, respectively. This shows that the B1 fieldhomogeneity gets worse with larger diameter of the samples, butit is in all tested capillaries still within reasonable limits for NMRspectroscopy. For comparison, a measurement of the 450° and90° signal amplitude ratio yields 84% for the commercial BrukerPAQXI probe.
Sensitivity. For a given static magnetic field strength and sampleconcentration, the sensitivity of a NMR experiment is governed bythe properties of the NMR probe. In NMR, the signal-to-noise ratio(SNR) is typically defined as the ratio of the height of a resonanceof interest, divided by 2 times the root-mean-square of the noise floor.Usually, the SNR of the anomeric proton of sucrose is measured toquantify the sensitivity of a microcoil probe.13 The spectrum of asample with volume Vs ) 10.6 nL at 0.215 M concentration in D2Ois shown in Figure 2. To compare the sensitivity to the publishedliterature data on NMR microcoils, the measured SNR is used tocalculate the limit of detection (LOD)13
nLODm )3n√tExp
SNR
where the mole amount n refers to the portion of the samplewithin the detection volume and tExp is the total experiment time.To compare measurements done at different magnetic field
strengths B0, a scaling to 600 MHz is used and therefore the SNRmust be multiplied by 1.376 because of the ωL
7/4 sensitivity scalingfor inductive readout.14 With an experiment time of 16 × 1.82 s(16 accumulations), and a SNR of 69, the limit of detection isnLODm ) 0.39 nmol s1/2. Maguire and co-workers measured aLOD of 3.05 nmol s1/2 for their probe (scaled to 600 MHz).11 Themain difference to our result is that they used the length of thesample for the calculation, whereas we used the estimated lengthl ) 150 µm from FEM simulations to calculate the detectionvolume. Massin and co-workers manufactured a planar (spiral)microcoil on a glass substrate with etched microfluidic channels.15
They used a slightly different figure of merit, the mass sensitivityper acquisition, and report a value of 88 µmol-1 (scaled to 600MHz) for the anomeric proton of sucrose with a Lorentz-Gaussresolution enhancement, which corresponds to a LOD of 34 nmol.For stripline probes, an experimental detection sensitivity of 1.5× 10¹³ spins per Hz (0.025 nmol/Hz) was calculated from thetime domain sensitivity for a single scan proton spectrum of a 12nL ethanol sample (measured at 600 MHz).9
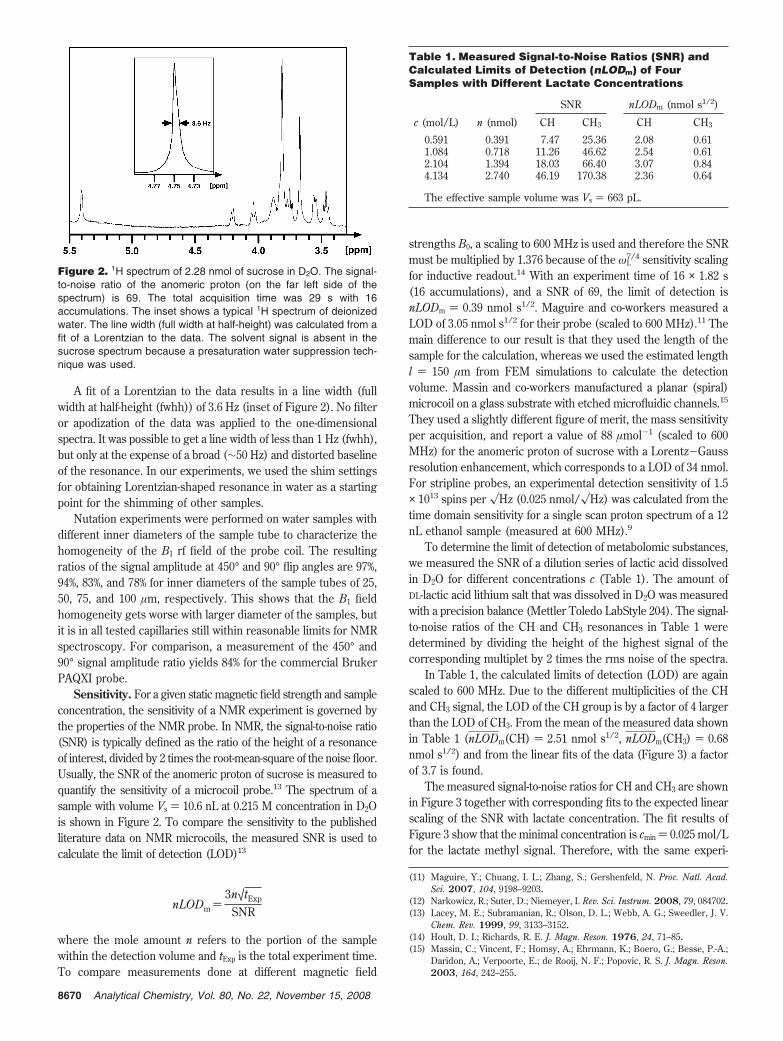
To determine the limit of detection of metabolomic substances,we measured the SNR of a dilution series of lactic acid dissolvedin D2O for different concentrations c (Table 1). The amount ofDL-lactic acid lithium salt that was dissolved in D2O was measuredwith a precision balance (Mettler Toledo LabStyle 204). The signal-to-noise ratios of the CH and CH3 resonances in Table 1 weredetermined by dividing the height of the highest signal of thecorresponding multiplet by 2 times the rms noise of the spectra.
In Table 1, the calculated limits of detection (LOD) are againscaled to 600 MHz. Due to the different multiplicities of the CHand CH3 signal, the LOD of the CH group is by a factor of 4 largerthan the LOD of CH3. From the mean of the measured data shownin Table 1 (nLODm(CH) ) 2.51 nmol s1/2, nLODm(CH3) ) 0.68nmol s1/2) and from the linear fits of the data (Figure 3) a factorof 3.7 is found.
The measured signal-to-noise ratios for CH and CH3 are shownin Figure 3 together with corresponding fits to the expected linearscaling of the SNR with lactate concentration. The fit results ofFigure 3 show that the minimal concentration is cmin ) 0.025 mol/Lfor the lactate methyl signal. Therefore, with the same experi-
(11) Maguire, Y.; Chuang, I. L.; Zhang, S.; Gershenfeld, N. Proc. Natl. Acad.Sci. 2007, 104, 9198–9203.
(12) Narkowicz, R.; Suter, D.; Niemeyer, I. Rev. Sci. Instrum. 2008, 79, 084702.(13) Lacey, M. E.; Subramanian, R.; Olson, D. L.; Webb, A. G.; Sweedler, J. V.
Chem. Rev. 1999, 99, 3133–3152.(14) Hoult, D. I.; Richards, R. E. J. Magn. Reson. 1976, 24, 71–85.(15) Massin, C.; Vincent, F.; Homsy, A.; Ehrmann, K.; Boero, G.; Besse, P.-A.;
Daridon, A.; Verpoorte, E.; de Rooij, N. F.; Popovic, R. S. J. Magn. Reson.2003, 164, 242–255.
Figure 2. 1H spectrum of 2.28 nmol of sucrose in D2O. The signal-to-noise ratio of the anomeric proton (on the far left side of thespectrum) is 69. The total acquisition time was 29 s with 16accumulations. The inset shows a typical 1H spectrum of deionizedwater. The line width (full width at half-height) was calculated from afit of a Lorentzian to the data. The solvent signal is absent in thesucrose spectrum because a presaturation water suppression tech-nique was used.
Table 1. Measured Signal-to-Noise Ratios (SNR) andCalculated Limits of Detection (nLODm) of FourSamples with Different Lactate Concentrations
SNR nLODm (nmol s1/2)
c (mol/L) n (nmol) CH CH3 CH CH3
0.591 0.391 7.47 25.36 2.08 0.611.084 0.718 11.26 46.62 2.54 0.612.104 1.394 18.03 66.40 3.07 0.844.134 2.740 46.19 170.38 2.36 0.64
The effective sample volume was Vs ) 663 pL.
8670 Analytical Chemistry, Vol. 80, No. 22, November 15, 2008
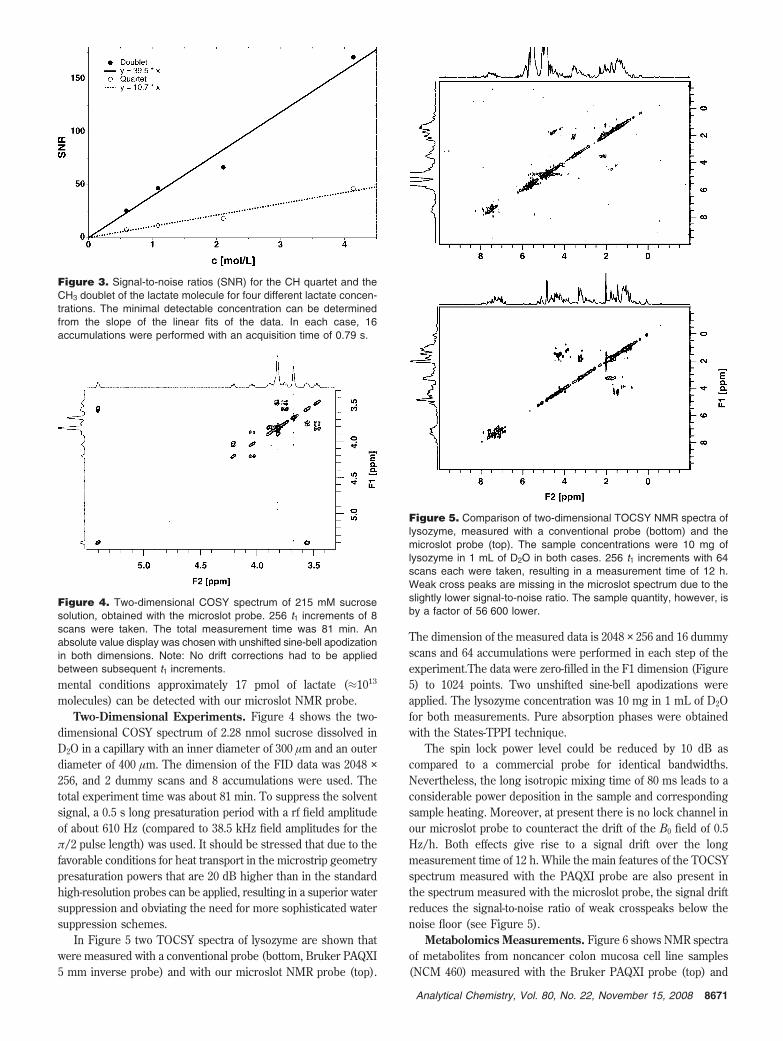
mental conditions approximately 17 pmol of lactate (≈1013
molecules) can be detected with our microslot NMR probe.Two-Dimensional Experiments. Figure 4 shows the two-
dimensional COSY spectrum of 2.28 nmol sucrose dissolved inD2O in a capillary with an inner diameter of 300 µm and an outerdiameter of 400 µm. The dimension of the FID data was 2048 ×256, and 2 dummy scans and 8 accumulations were used. Thetotal experiment time was about 81 min. To suppress the solventsignal, a 0.5 s long presaturation period with a rf field amplitudeof about 610 Hz (compared to 38.5 kHz field amplitudes for theπ/2 pulse length) was used. It should be stressed that due to thefavorable conditions for heat transport in the microstrip geometrypresaturation powers that are 20 dB higher than in the standardhigh-resolution probes can be applied, resulting in a superior watersuppression and obviating the need for more sophisticated watersuppression schemes.
In Figure 5 two TOCSY spectra of lysozyme are shown thatwere measured with a conventional probe (bottom, Bruker PAQXI5 mm inverse probe) and with our microslot NMR probe (top).
The dimension of the measured data is 2048 × 256 and 16 dummyscans and 64 accumulations were performed in each step of theexperiment.The data were zero-filled in the F1 dimension (Figure5) to 1024 points. Two unshifted sine-bell apodizations wereapplied. The lysozyme concentration was 10 mg in 1 mL of D2Ofor both measurements. Pure absorption phases were obtainedwith the States-TPPI technique.
The spin lock power level could be reduced by 10 dB ascompared to a commercial probe for identical bandwidths.Nevertheless, the long isotropic mixing time of 80 ms leads to aconsiderable power deposition in the sample and correspondingsample heating. Moreover, at present there is no lock channel inour microslot probe to counteract the drift of the B0 field of 0.5Hz/h. Both effects give rise to a signal drift over the longmeasurement time of 12 h. While the main features of the TOCSYspectrum measured with the PAQXI probe are also present inthe spectrum measured with the microslot probe, the signal driftreduces the signal-to-noise ratio of weak crosspeaks below thenoise floor (see Figure 5).
Metabolomics Measurements. Figure 6 shows NMR spectraof metabolites from noncancer colon mucosa cell line samples(NCM 460) measured with the Bruker PAQXI probe (top) and
Figure 3. Signal-to-noise ratios (SNR) for the CH quartet and theCH3 doublet of the lactate molecule for four different lactate concen-trations. The minimal detectable concentration can be determinedfrom the slope of the linear fits of the data. In each case, 16accumulations were performed with an acquisition time of 0.79 s.
Figure 4. Two-dimensional COSY spectrum of 215 mM sucrosesolution, obtained with the microslot probe. 256 t1 increments of 8scans were taken. The total measurement time was 81 min. Anabsolute value display was chosen with unshifted sine-bell apodizationin both dimensions. Note: No drift corrections had to be appliedbetween subsequent t1 increments.
Figure 5. Comparison of two-dimensional TOCSY NMR spectra oflysozyme, measured with a conventional probe (bottom) and themicroslot probe (top). The sample concentrations were 10 mg oflysozyme in 1 mL of D2O in both cases. 256 t1 increments with 64scans each were taken, resulting in a measurement time of 12 h.Weak cross peaks are missing in the microslot spectrum due to theslightly lower signal-to-noise ratio. The sample quantity, however, isby a factor of 56 600 lower.
8671Analytical Chemistry, Vol. 80, No. 22, November 15, 2008
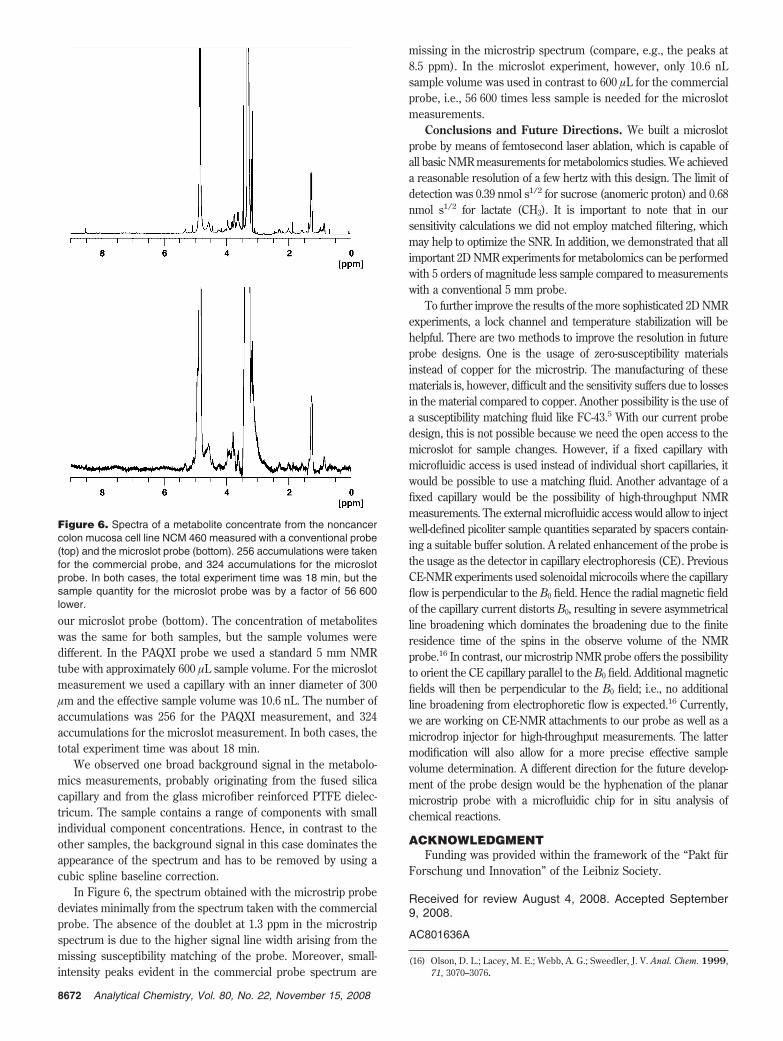
our microslot probe (bottom). The concentration of metaboliteswas the same for both samples, but the sample volumes weredifferent. In the PAQXI probe we used a standard 5 mm NMRtube with approximately 600 µL sample volume. For the microslotmeasurement we used a capillary with an inner diameter of 300µm and the effective sample volume was 10.6 nL. The number ofaccumulations was 256 for the PAQXI measurement, and 324accumulations for the microslot measurement. In both cases, thetotal experiment time was about 18 min.
We observed one broad background signal in the metabolo-mics measurements, probably originating from the fused silicacapillary and from the glass microfiber reinforced PTFE dielec-tricum. The sample contains a range of components with smallindividual component concentrations. Hence, in contrast to theother samples, the background signal in this case dominates theappearance of the spectrum and has to be removed by using acubic spline baseline correction.
In Figure 6, the spectrum obtained with the microstrip probedeviates minimally from the spectrum taken with the commercialprobe. The absence of the doublet at 1.3 ppm in the microstripspectrum is due to the higher signal line width arising from themissing susceptibility matching of the probe. Moreover, small-intensity peaks evident in the commercial probe spectrum are
missing in the microstrip spectrum (compare, e.g., the peaks at8.5 ppm). In the microslot experiment, however, only 10.6 nLsample volume was used in contrast to 600 µL for the commercialprobe, i.e., 56 600 times less sample is needed for the microslotmeasurements.
Conclusions and Future Directions. We built a microslotprobe by means of femtosecond laser ablation, which is capable ofall basic NMR measurements for metabolomics studies. We achieveda reasonable resolution of a few hertz with this design. The limit ofdetection was 0.39 nmol s1/2 for sucrose (anomeric proton) and 0.68nmol s1/2 for lactate (CH3). It is important to note that in oursensitivity calculations we did not employ matched filtering, whichmay help to optimize the SNR. In addition, we demonstrated that allimportant 2D NMR experiments for metabolomics can be performedwith 5 orders of magnitude less sample compared to measurementswith a conventional 5 mm probe.
To further improve the results of the more sophisticated 2D NMRexperiments, a lock channel and temperature stabilization will behelpful. There are two methods to improve the resolution in futureprobe designs. One is the usage of zero-susceptibility materialsinstead of copper for the microstrip. The manufacturing of thesematerials is, however, difficult and the sensitivity suffers due to lossesin the material compared to copper. Another possibility is the use ofa susceptibility matching fluid like FC-43.5 With our current probedesign, this is not possible because we need the open access to themicroslot for sample changes. However, if a fixed capillary withmicrofluidic access is used instead of individual short capillaries, itwould be possible to use a matching fluid. Another advantage of afixed capillary would be the possibility of high-throughput NMRmeasurements. The external microfluidic access would allow to injectwell-defined picoliter sample quantities separated by spacers contain-ing a suitable buffer solution. A related enhancement of the probe isthe usage as the detector in capillary electrophoresis (CE). PreviousCE-NMR experiments used solenoidal microcoils where the capillaryflow is perpendicular to the B0 field. Hence the radial magnetic fieldof the capillary current distorts B0, resulting in severe asymmetricalline broadening which dominates the broadening due to the finiteresidence time of the spins in the observe volume of the NMRprobe.16 In contrast, our microstrip NMR probe offers the possibilityto orient the CE capillary parallel to the B0 field. Additional magneticfields will then be perpendicular to the B0 field; i.e., no additionalline broadening from electrophoretic flow is expected.16 Currently,we are working on CE-NMR attachments to our probe as well as amicrodrop injector for high-throughput measurements. The lattermodification will also allow for a more precise effective samplevolume determination. A different direction for the future develop-ment of the probe design would be the hyphenation of the planarmicrostrip probe with a microfluidic chip for in situ analysis ofchemical reactions.
ACKNOWLEDGMENTFunding was provided within the framework of the “Pakt fur
Forschung und Innovation” of the Leibniz Society.
Received for review August 4, 2008. Accepted September9, 2008.
AC801636A
(16) Olson, D. L.; Lacey, M. E.; Webb, A. G.; Sweedler, J. V. Anal. Chem. 1999,71, 3070–3076.
Figure 6. Spectra of a metabolite concentrate from the noncancercolon mucosa cell line NCM 460 measured with a conventional probe(top) and the microslot probe (bottom). 256 accumulations were takenfor the commercial probe, and 324 accumulations for the microslotprobe. In both cases, the total experiment time was 18 min, but thesample quantity for the microslot probe was by a factor of 56 600lower.
8672 Analytical Chemistry, Vol. 80, No. 22, November 15, 2008