Embed Size (px)
Citation preview
141 Health Promotion and Chronic Disease Prevention in Canada Research, Policy and PracticeVol 41, No 5, May 2021
Author references:
1. Centre de recherche du Centre hospitalier de l’Université de Montréal (CRCHUM), Montréal, Quebec, Canada2. Department of Anesthesiology and Pain Medicine, Faculty of Medicine, Université de Montréal, Montréal, Quebec, Canada3. Department of Health Sciences, Université du Québec en Abitibi-Témiscamingue (UQAT), Rouyn-Noranda, Quebec, Canada4. Pain BC Society, Vancouver, British Columbia, Canada5. Department of Public Health Sciences, Queen’s University, Kingston, Ontario, Canada6. Department of Family Medicine, Dalhousie University, Halifax, Nova Scotia, Canada7. StatsSciences Inc., Notre-Dame-de-l’Île-Perrot, Quebec, Canada8. Department of Family and Emergency Medicine, Faculty of Medicine, Université de Montréal, Montréal, Quebec, Canada
Correspondence: Gabrielle Pagé, Centre de recherche du Centre hospitalier de l’Université de Montréal, Saint Antoine Building, Room S01-122, 850 Saint Denis St., Montréal, QC H2X 0A9; Tel: 514-890-8000 ext. 31601; Email: [email protected]
Tweet this article
Highlights
• Two-thirds of individuals who com-pleted an online survey reported worsened pain since the beginning of the COVID-19 pandemic.
• Almost half of respondents experi-enced moderate to severe psycho-logical distress.
• Changes to pain treatments during the pandemic were significantly associated with worsened pain.
• Geographical aspects, such as rural vs. urban living or living in a prov-ince with higher infection rates were not associated with pain status or psychological distress.
• In future waves of the pandemic, consideration must be given to con-tinue offering adequate pharmaco-logical and physical/psychological pain treatments.
Abstract
Background: The COVID-19 pandemic has had a disproportionate impact on vulnerable populations, including individuals with chronic pain. We examined associations between geographical variations in COVID-19 infection rates, stress and pain severity, and inves-tigated factors associated with changes in pain status and psychological distress among individuals living with chronic pain during the pandemic.
Methods: This investigation is part of a larger initiative, the Chronic Pain & COVID-19 Pan-Canadian Study, which adopted a cross-sectional observational design. A total of 3159 individuals living with chronic pain completed a quantitative survey between 16 April and 31 May 2020.
Results: Two-thirds (68.1%) of participants were between 40 and 69 years old, and 83.5% were women. Two-thirds (68.9%) of individuals reported worsened pain since pandemic onset. Higher levels of perceived pandemic-related risks (adjusted odds ratio: 1.27; 95% confidence interval: 1.03–1.56) and stress (1.21; 1.05–1.41), changes in phar-macological (3.17; 2.49–4.05) and physical/psychological (2.04; 1.62–2.58) pain treat-ments and being employed at the beginning of the pandemic (1.42; 1.09–1.86) were associated with increased likelihood of reporting worsened pain. Job loss (34.9% of individuals were employed pre-pandemic) was associated with lower likelihood (0.67; 0.48–0.94) of reporting worsened pain. Almost half (43.2%) of individuals reported moderate/severe levels of psychological distress. Negative emotions toward the pandemic (2.14; 1.78–2.57) and overall stress (1.43; 1.36–1.50) were associated with moderate/severe psychological distress.
Conclusion: Study results identified psychosocial factors to consider in addition to bio-medical factors in monitoring patients’ status and facilitating treatment access for chronic pain patients during a pandemic.
Keywords: COVID-19, pain, psychological distress, pandemic
Introduction
Chronic pain is defined as a pain that has been present for more than 3 months, that has persisted for longer than the normal tissue-healing time or that is associated with a chronic condition.1,2 Worldwide, approximately 20% of the adult population
Original quantitative research
A cross-sectional study of pain status and psychological distress among individuals living with chronic pain: the Chronic Pain & COVID-19 Pan-Canadian StudyM. Gabrielle Pagé, PhD (1,2); Anaïs Lacasse, PhD (3); Lise Dassieu, PhD (1); Maria Hudspith, MA (4); Gregg Moor, BA (4); Kathryn Sutton (4); James M. Thompson, MD (5,6); Marc Dorais, MSc (7); Audrée Janelle Montcalm, MSc (1); Nadia Sourial, PhD (1,8); Manon Choinière, PhD (1,2)
Published online February 10, 2021
This article has been peer reviewed.
https://doi.org/10.24095/hpcdp.41.5.01
142Health Promotion and Chronic Disease Prevention in Canada Research, Policy and Practice Vol 41, No 5, May 2021
lives with chronic pain.3,4 Inadequate chronic pain management costs between $38.3 billion and $40.4 billion in annual direct and indirect health care costs in Canada.5
Chronic pain can have a wide range of repercussions on a person’s life and their health-related quality of life and mental health comorbidities.6 These impacts on physical and mental health and well-being may be heightened during times of high stress. One-quarter of individuals in the general population report experiencing anxiety or depressive symptoms since the beginning of the COVID-19 pandemic.7 However, there is a paucity of empirical data on the physical and mental health effects of the COVID-19 pandemic on vul-nerable populations such as individuals living with chronic pain. Describing and identifying factors associated with poor physical and mental health statuses can inform public health decisions in future waves of the pandemic.
Based on expert opinion, individuals with chronic pain are likely to experience an exacerbation of their health condition dur-ing and after the COVID-19 pandemic.8 This crisis and the associated psychologi-cal stressors may also precipitate a new onset of chronic pain.8 One out of two individuals receiving tertiary chronic pain treatment in Canada live below the pov-erty line,9 and the pandemic has dispro-portionally affected populations with low socioeconomic status. Furthermore, access to proper pain assessment, treatment and management has been challenging in Canada for a long time—particularly in rural and remote regions10—and the large-scale shut down of pain clinics, allied health profes-sionals’ offices and exercise facilities during the pandemic has worsened pain manage-ment access.
The goal of this cross-sectional study was to document the physical and mental health status and socioeconomic status of Canadians living with chronic pain dur-ing the COVID-19 pandemic. The specific objec tives were to (1) examine the associ-ation between geographical variations in COVID-19 infection rate, stress appraisal and pain severity; and (2) investigate the biopsychosocial factors associated with (a) changes in pain status during the COVID-19 pandemic, and (b) psychologi-cal distress among individuals living with chronic pain.
We hypothesized that (1) high provincial infection rates of COVID-19 would be associated with higher levels of stress appraisal and pain severity; and (2) the degree of geographical infection rates of COVID-19 and levels of perceived global and pandemic-specific stress would be associated with pain deterioration and psychological distress.
Methods
Design
The present study is part of a larger ini-tiative, the Chronic Pain & COVID-19 Pan-Canadian Study, which used a cross-sectional mixed-method design to answer various pandemic-related research questions.11 Quan-titative survey data are summarized in the present article.
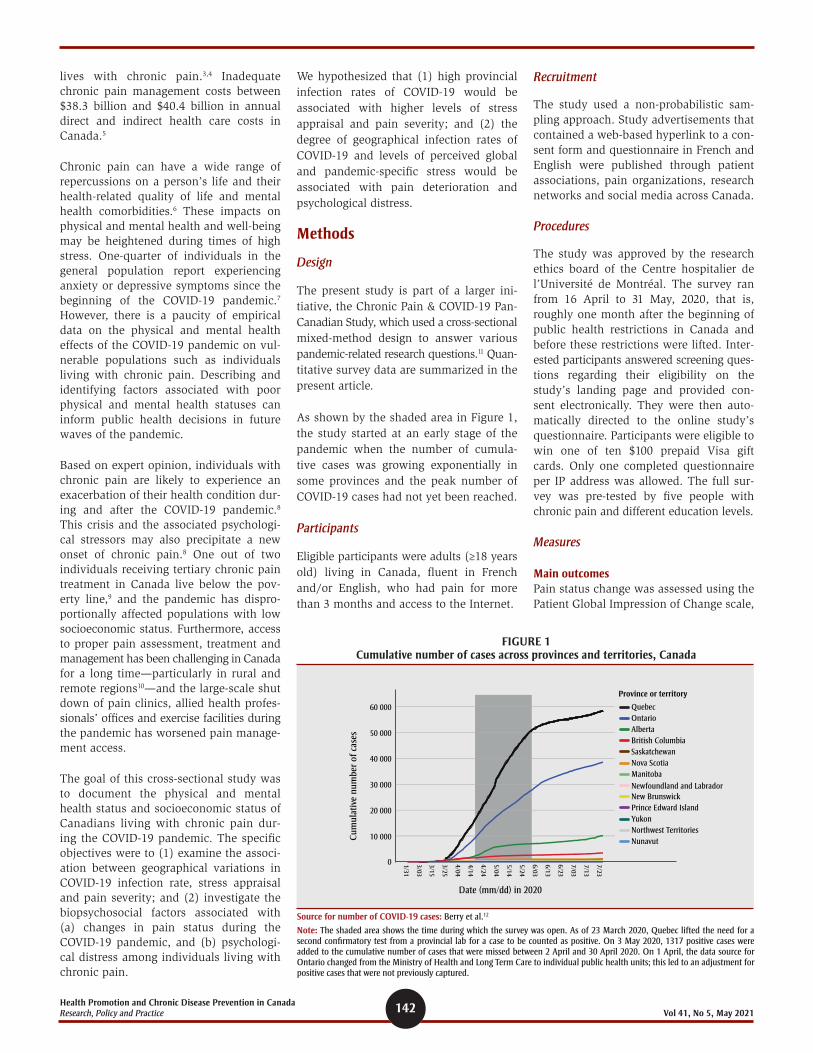
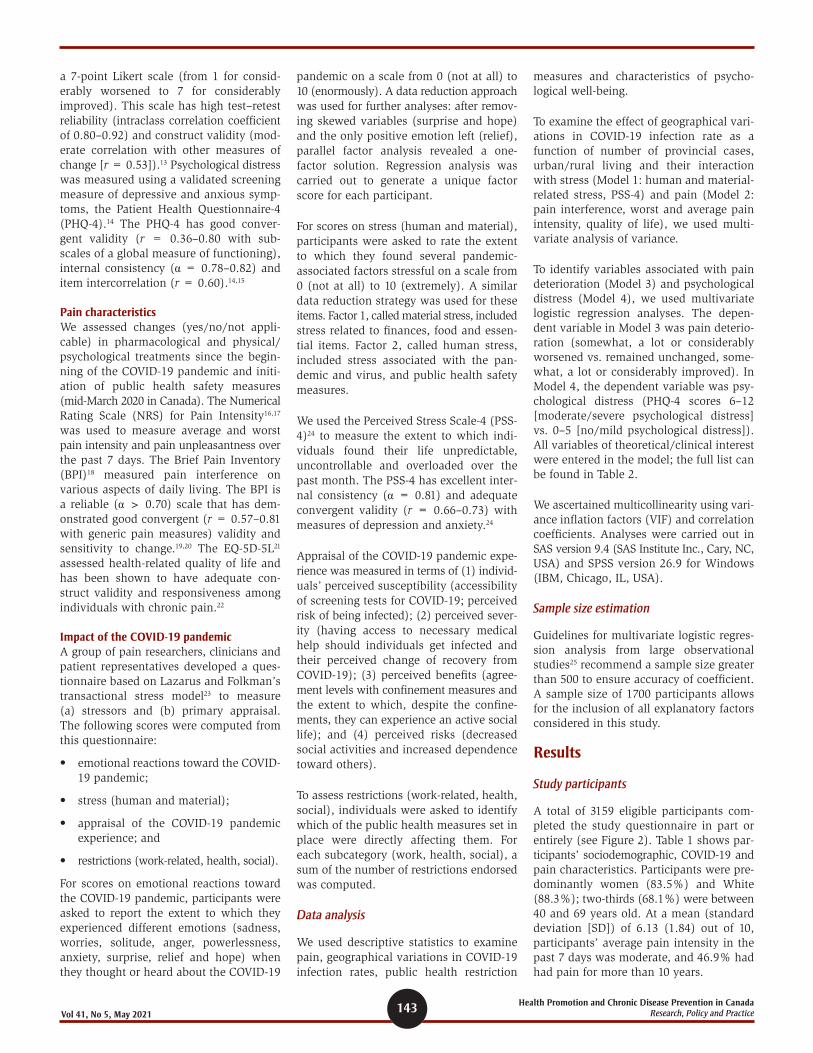
As shown by the shaded area in Figure 1, the study started at an early stage of the pandemic when the number of cumula-tive cases was growing exponentially in some provinces and the peak number of COVID-19 cases had not yet been reached.
Participants
Eligible participants were adults (≥18 years old) living in Canada, fluent in French and/or English, who had pain for more than 3 months and access to the Internet.
Recruitment
The study used a non-probabilistic sam-pling approach. Study advertisements that contained a web-based hyperlink to a con-sent form and questionnaire in French and English were published through patient associations, pain organizations, research networks and social media across Canada.
Procedures
The study was approved by the research ethics board of the Centre hospitalier de l’Université de Montréal. The survey ran from 16 April to 31 May, 2020, that is, roughly one month after the beginning of public health restrictions in Canada and before these restrictions were lifted. Inter-ested participants answered screening ques-tions regarding their eligibility on the study’s landing page and provided con-sent electronically. They were then auto-matically directed to the online study’s questionnaire. Participants were eligible to win one of ten $100 prepaid Visa gift cards. Only one completed questionnaire per IP address was allowed. The full sur-vey was pre-tested by five people with chronic pain and different education levels.
Measures
Main outcomesPain status change was assessed using the Patient Global Impression of Change scale,
Date (mm/dd) in 2020
Cum
ulat
ive
num
ber
of c
ases
60 000 Quebec
Province or territory
OntarioAlbertaBritish ColumbiaSaskatchewanNova ScotiaManitobaNewfoundland and LabradorNew BrunswickPrince Edward IslandYukonNorthwest TerritoriesNunavut
50 000
40 000
30 000
20 000
10 000
0 7/23
7/13
7/03
6/23
5/24
5/14
5/04
4/24
4/14
4/04
3/25
3/15
3/03
1/31
6/13
6/03
FIGURE 1 Cumulative number of cases across provinces and territories, Canada
Source for number of COVID-19 cases: Berry et al.12
Note: The shaded area shows the time during which the survey was open. As of 23 March 2020, Quebec lifted the need for a second confirmatory test from a provincial lab for a case to be counted as positive. On 3 May 2020, 1317 positive cases were added to the cumulative number of cases that were missed between 2 April and 30 April 2020. On 1 April, the data source for Ontario changed from the Ministry of Health and Long Term Care to individual public health units; this led to an adjustment for positive cases that were not previously captured.
143 Health Promotion and Chronic Disease Prevention in Canada Research, Policy and PracticeVol 41, No 5, May 2021
a 7-point Likert scale (from 1 for consid-erably worsened to 7 for considerably improved). This scale has high test–retest reliability (intraclass correlation coefficient of 0.80–0.92) and construct validity (mod-erate correlation with other measures of change [r = 0.53]).13 Psychological distress was measured using a validated screening measure of depressive and anxious symp-toms, the Patient Health Questionnaire-4 (PHQ-4).14 The PHQ-4 has good conver-gent validity (r = 0.36–0.80 with sub-scales of a global measure of functioning), internal consistency (α = 0.78–0.82) and item intercorrelation (r = 0.60).14,15
Pain characteristicsWe assessed changes (yes/no/not appli-cable) in pharmacological and physical/psychological treatments since the begin-ning of the COVID-19 pandemic and initi-ation of public health safety measures (mid-March 2020 in Canada). The Numerical Rating Scale (NRS) for Pain Intensity16,17 was used to measure average and worst pain intensity and pain unpleasantness over the past 7 days. The Brief Pain Inventory (BPI)18 measured pain interference on various aspects of daily living. The BPI is a reliable (α > 0.70) scale that has dem-onstrated good convergent (r = 0.57–0.81 with generic pain measures) validity and sensitivity to change.19,20 The EQ-5D-5L21 assessed health-related quality of life and has been shown to have adequate con-struct validity and responsiveness among individuals with chronic pain.22
Impact of the COVID-19 pandemicA group of pain researchers, clinicians and patient representatives developed a ques-tionnaire based on Lazarus and Folkman’s transactional stress model23 to measure (a) stressors and (b) primary appraisal. The following scores were computed from this questionnaire:
• emotional reactions toward the COVID-19 pandemic;
• stress (human and material);
• appraisal of the COVID-19 pandemic experience; and
• restrictions (work-related, health, social).
For scores on emotional reactions toward the COVID-19 pandemic, participants were asked to report the extent to which they experienced different emotions (sadness, worries, solitude, anger, powerlessness, anxiety, surprise, relief and hope) when they thought or heard about the COVID-19
pandemic on a scale from 0 (not at all) to 10 (enormously). A data reduction approach was used for further analyses: after remov-ing skewed variables (surprise and hope) and the only positive emotion left (relief), parallel factor analysis revealed a one- factor solution. Regression analysis was carried out to generate a unique factor score for each participant.
For scores on stress (human and material), participants were asked to rate the extent to which they found several pandemic-associated factors stressful on a scale from 0 (not at all) to 10 (extremely). A similar data reduction strategy was used for these items. Factor 1, called material stress, included stress related to finances, food and essen-tial items. Factor 2, called human stress, included stress associated with the pan-demic and virus, and public health safety measures.
We used the Perceived Stress Scale-4 (PSS-4)24 to measure the extent to which indi-viduals found their life unpredictable, uncontrollable and overloaded over the past month. The PSS-4 has excellent inter-nal consistency (α = 0.81) and adequate convergent validity (r = 0.66–0.73) with measures of depression and anxiety.24
Appraisal of the COVID-19 pandemic expe-rience was measured in terms of (1) individ-uals’ perceived susceptibility (accessibility of screening tests for COVID-19; perceived risk of being infected); (2) perceived sever-ity (having access to necessary medical help should individuals get infected and their perceived change of recovery from COVID-19); (3) perceived benefits (agree-ment levels with confinement measures and the extent to which, despite the confine-ments, they can experience an active social life); and (4) perceived risks (decreased social activities and increased dependence toward others).
To assess restrictions (work-related, health, social), individuals were asked to identify which of the public health measures set in place were directly affecting them. For each subcategory (work, health, social), a sum of the number of restrictions endorsed was computed.
Data analysis
We used descriptive statistics to examine pain, geographical variations in COVID-19 infection rates, public health restriction
measures and characteristics of psycho-logical well-being.
To examine the effect of geographical vari-ations in COVID-19 infection rate as a function of number of provincial cases, urban/rural living and their interaction with stress (Model 1: human and material- related stress, PSS-4) and pain (Model 2: pain interference, worst and average pain intensity, quality of life), we used multi-variate analysis of variance.
To identify variables associated with pain deterioration (Model 3) and psychological distress (Model 4), we used multivariate logistic regression analyses. The depen-dent variable in Model 3 was pain deterio-ration (somewhat, a lot or considerably worsened vs. remained unchanged, some-what, a lot or considerably improved). In Model 4, the dependent variable was psy-chological distress (PHQ-4 scores 6–12 [moderate/severe psychological distress] vs. 0–5 [no/mild psychological distress]). All variables of theoretical/clinical interest were entered in the model; the full list can be found in Table 2.
We ascertained multicollinearity using vari-ance inflation factors (VIF) and correlation coefficients. Analyses were carried out in SAS version 9.4 (SAS Institute Inc., Cary, NC, USA) and SPSS version 26.9 for Windows (IBM, Chicago, IL, USA).
Sample size estimation
Guidelines for multivariate logistic regres-sion analysis from large observational studies25 recommend a sample size greater than 500 to ensure accuracy of coefficient. A sample size of 1700 participants allows for the inclusion of all explanatory factors considered in this study.
Results
Study participants
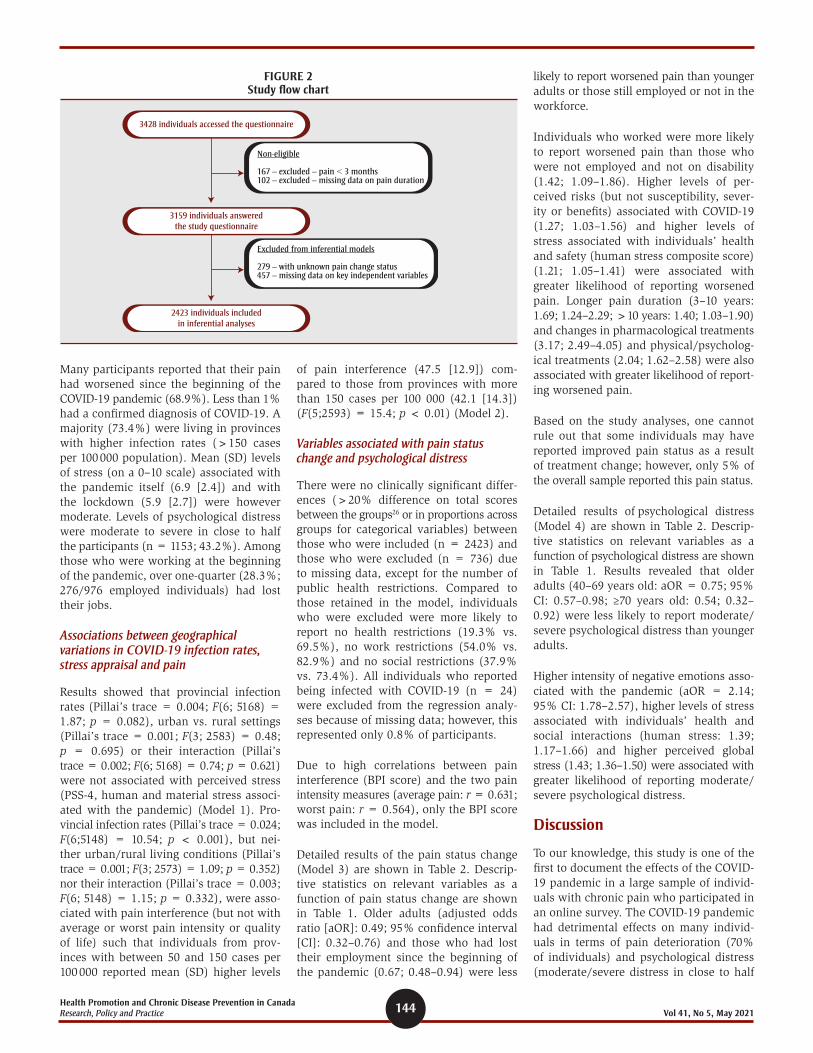
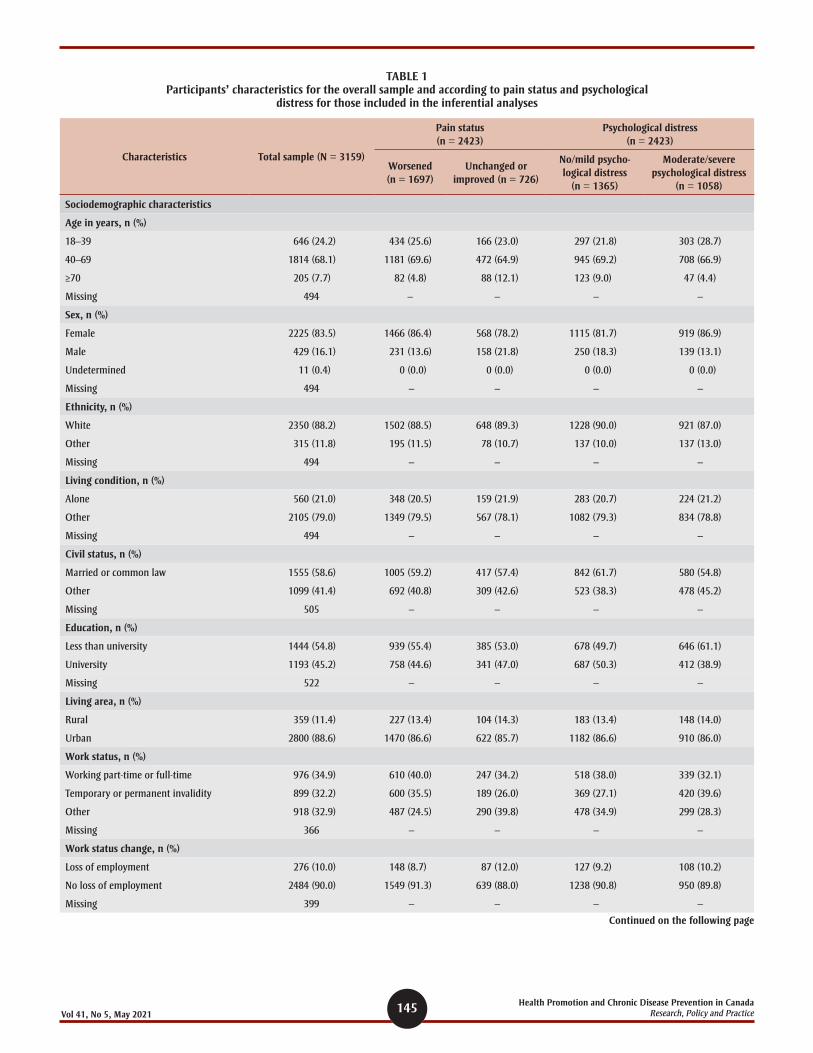
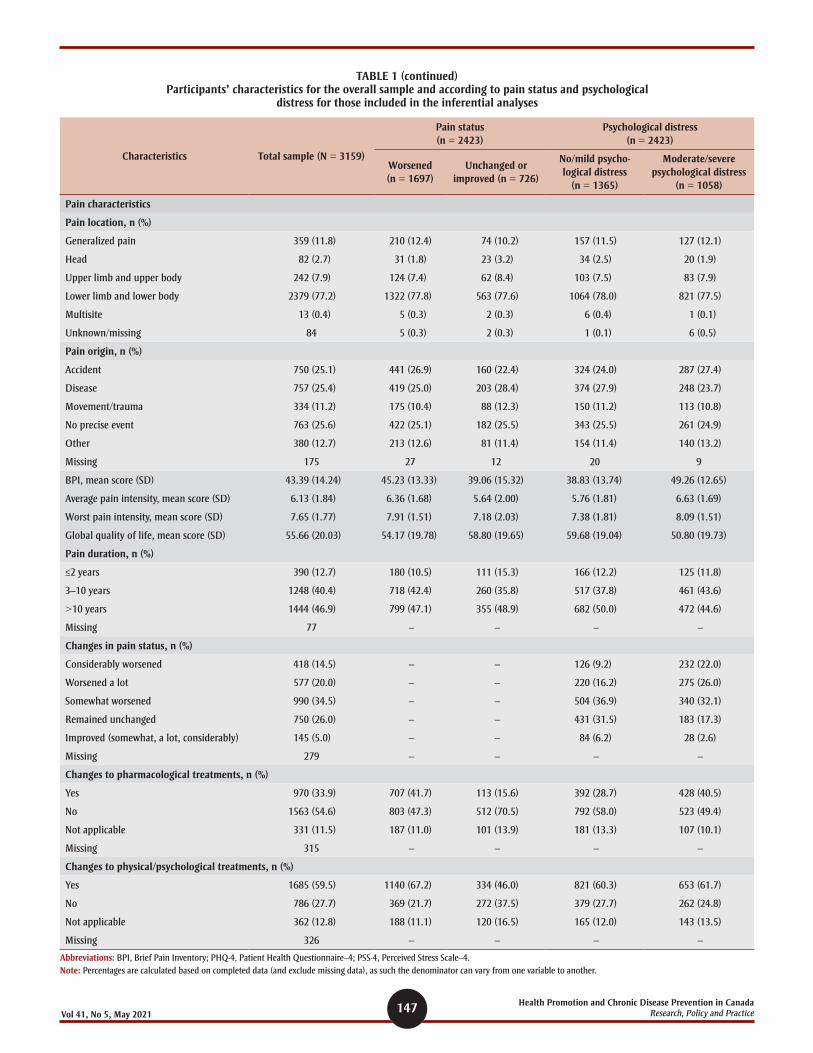
A total of 3159 eligible participants com-pleted the study questionnaire in part or entirely (see Figure 2). Table 1 shows par-ticipants’ sociodemographic, COVID-19 and pain characteristics. Participants were pre-dominantly women (83.5%) and White (88.3%); two-thirds (68.1%) were between 40 and 69 years old. At a mean (standard deviation [SD]) of 6.13 (1.84) out of 10, participants’ average pain intensity in the past 7 days was moderate, and 46.9% had had pain for more than 10 years.
144Health Promotion and Chronic Disease Prevention in Canada Research, Policy and Practice Vol 41, No 5, May 2021
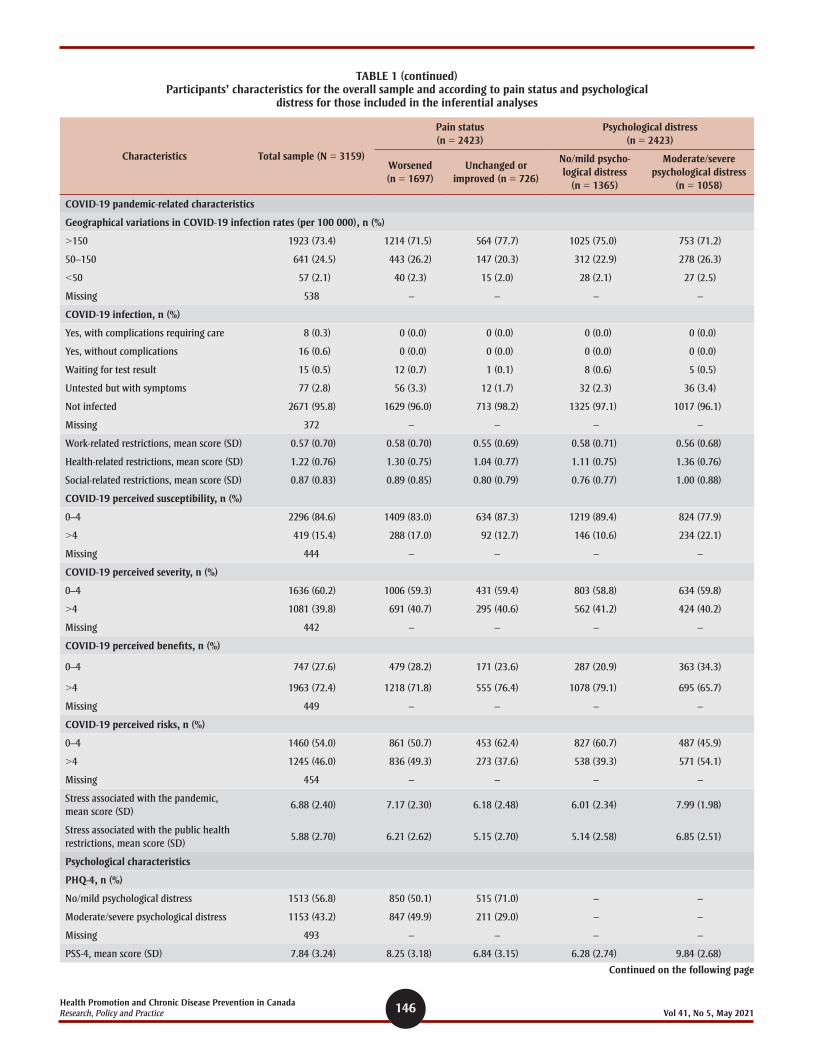
Many participants reported that their pain had worsened since the beginning of the COVID-19 pandemic (68.9%). Less than 1% had a confirmed diagnosis of COVID-19. A majority (73.4%) were living in provinces with higher infection rates (>150 cases per 100 000 population). Mean (SD) levels of stress (on a 0–10 scale) associated with the pandemic itself (6.9 [2.4]) and with the lockdown (5.9 [2.7]) were however moderate. Levels of psychological distress were moderate to severe in close to half the participants (n = 1153; 43.2%). Among those who were working at the beginning of the pandemic, over one-quarter (28.3%; 276/976 employed individuals) had lost their jobs.
Associations between geographical variations in COVID-19 infection rates, stress appraisal and pain
Results showed that provincial infection rates (Pillai’s trace = 0.004; F(6; 5168) = 1.87; p = 0.082), urban vs. rural settings (Pillai’s trace = 0.001; F(3; 2583) = 0.48; p = 0.695) or their interaction (Pillai’s trace = 0.002; F(6; 5168) = 0.74; p = 0.621) were not associated with perceived stress (PSS-4, human and material stress associ-ated with the pandemic) (Model 1). Pro-vincial infection rates (Pillai’s trace = 0.024; F(6;5148) = 10.54; p < 0.001), but nei-ther urban/rural living conditions (Pillai’s trace = 0.001; F(3; 2573) = 1.09; p = 0.352) nor their interaction (Pillai’s trace = 0.003; F(6; 5148) = 1.15; p = 0.332), were asso-ciated with pain interference (but not with average or worst pain intensity or quality of life) such that individuals from prov-inces with between 50 and 150 cases per 100 000 reported mean (SD) higher levels
of pain interference (47.5 [12.9]) com-pared to those from provinces with more than 150 cases per 100 000 (42.1 [14.3]) (F(5;2593) = 15.4; p < 0.01) (Model 2).
Variables associated with pain status change and psychological distress
There were no clinically significant differ-ences (>20% difference on total scores between the groups26 or in proportions across groups for categorical variables) between those who were included (n = 2423) and those who were excluded (n = 736) due to missing data, except for the number of public health restrictions. Compared to those retained in the model, individuals who were excluded were more likely to report no health restrictions (19.3% vs. 69.5%), no work restrictions (54.0% vs. 82.9%) and no social restrictions (37.9% vs. 73.4%). All individuals who reported being infected with COVID-19 (n = 24) were excluded from the regression analy-ses because of missing data; however, this represented only 0.8% of participants.
Due to high correlations between pain interference (BPI score) and the two pain intensity measures (average pain: r = 0.631; worst pain: r = 0.564), only the BPI score was included in the model.
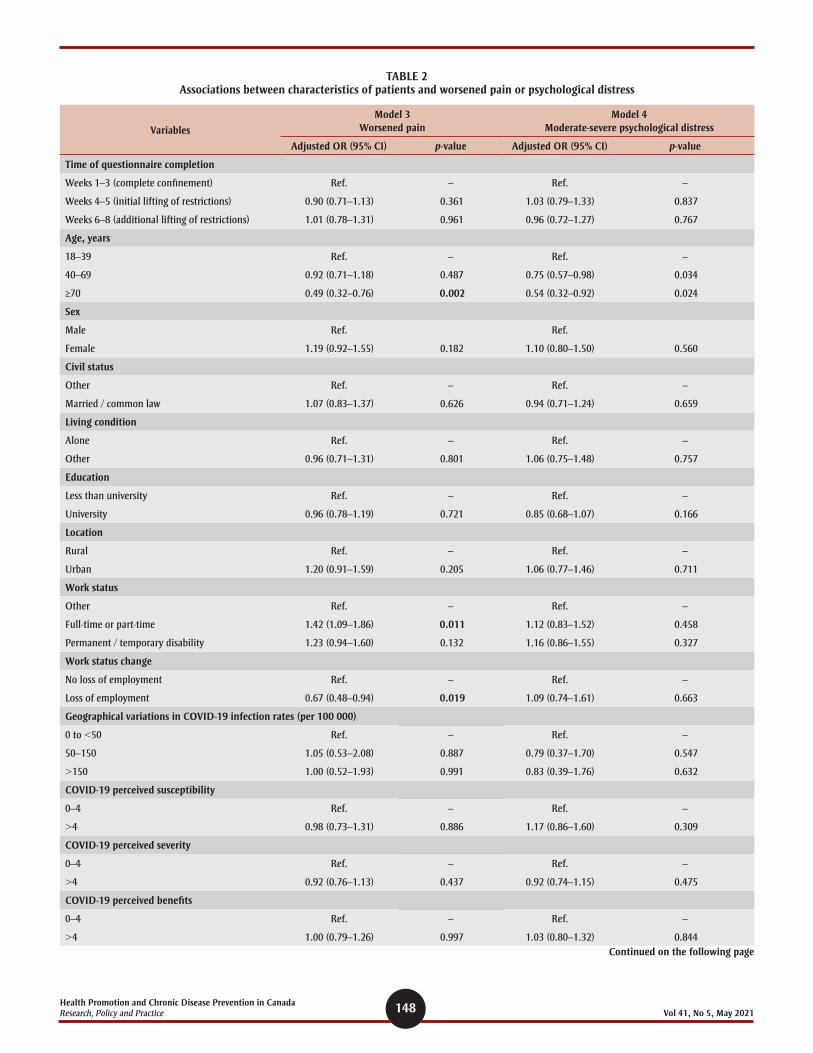
Detailed results of the pain status change (Model 3) are shown in Table 2. Descrip-tive statistics on relevant variables as a function of pain status change are shown in Table 1. Older adults (adjusted odds ratio [aOR]: 0.49; 95% confidence interval [CI]: 0.32–0.76) and those who had lost their employment since the beginning of the pandemic (0.67; 0.48–0.94) were less
likely to report worsened pain than younger adults or those still employed or not in the workforce.
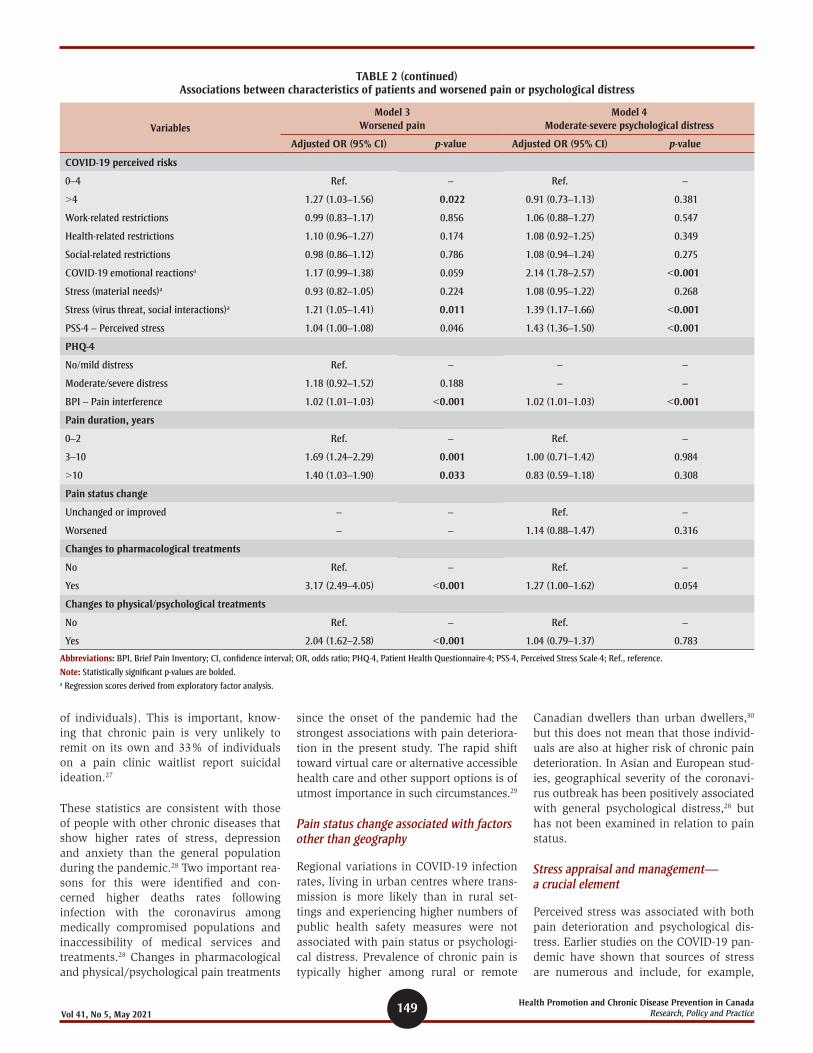
Individuals who worked were more likely to report worsened pain than those who were not employed and not on disability (1.42; 1.09–1.86). Higher levels of per-ceived risks (but not susceptibility, sever-ity or benefits) associated with COVID-19 (1.27; 1.03–1.56) and higher levels of stress associated with individuals’ health and safety (human stress composite score) (1.21; 1.05–1.41) were associated with greater likelihood of reporting worsened pain. Longer pain duration (3–10 years: 1.69; 1.24–2.29; >10 years: 1.40; 1.03–1.90) and changes in pharmacological treatments (3.17; 2.49–4.05) and physical/psycholog-ical treatments (2.04; 1.62–2.58) were also associated with greater likelihood of report-ing worsened pain.
Based on the study analyses, one cannot rule out that some individuals may have reported improved pain status as a result of treatment change; however, only 5% of the overall sample reported this pain status.
Detailed results of psychological distress (Model 4) are shown in Table 2. Descrip-tive statistics on relevant variables as a function of psychological distress are shown in Table 1. Results revealed that older adults (40–69 years old: aOR = 0.75; 95% CI: 0.57–0.98; ≥70 years old: 0.54; 0.32–0.92) were less likely to report moderate/severe psychological distress than younger adults.
Higher intensity of negative emotions asso-ciated with the pandemic (aOR = 2.14; 95% CI: 1.78–2.57), higher levels of stress associated with individuals’ health and social interactions (human stress: 1.39; 1.17–1.66) and higher perceived global stress (1.43; 1.36–1.50) were associated with greater likelihood of reporting moderate/severe psychological distress.
Discussion
To our knowledge, this study is one of the first to document the effects of the COVID-19 pandemic in a large sample of individ-uals with chronic pain who participated in an online survey. The COVID-19 pandemic had detrimental effects on many individ-uals in terms of pain deterioration (70% of individuals) and psychological distress (moderate/severe distress in close to half
3428 individuals accessed the questionnaire
3159 individuals answeredthe study questionnaire
2423 individuals includedin inferential analyses
Non-eligible
167 – excluded – pain < 3 months102 – excluded – missing data on pain duration
Excluded from inferential models
279 – with unknown pain change status457 – missing data on key independent variables
FIGURE 2 Study flow chart
145 Health Promotion and Chronic Disease Prevention in Canada Research, Policy and PracticeVol 41, No 5, May 2021
TABLE 1 Participants’ characteristics for the overall sample and according to pain status and psychological
distress for those included in the inferential analyses
Characteristics Total sample (N = 3159)
Pain status (n = 2423)
Psychological distress (n = 2423)
Worsened (n = 1697)
Unchanged or improved (n = 726)
No/mild psycho-logical distress
(n = 1365)
Moderate/severe psychological distress
(n = 1058)
Sociodemographic characteristics
Age in years, n (%)
18–39 646 (24.2) 434 (25.6) 166 (23.0) 297 (21.8) 303 (28.7)
40–69 1814 (68.1) 1181 (69.6) 472 (64.9) 945 (69.2) 708 (66.9)
≥70 205 (7.7) 82 (4.8) 88 (12.1) 123 (9.0) 47 (4.4)
Missing 494 – – – –
Sex, n (%)
Female 2225 (83.5) 1466 (86.4) 568 (78.2) 1115 (81.7) 919 (86.9)
Male 429 (16.1) 231 (13.6) 158 (21.8) 250 (18.3) 139 (13.1)
Undetermined 11 (0.4) 0 (0.0) 0 (0.0) 0 (0.0) 0 (0.0)
Missing 494 – – – –
Ethnicity, n (%)
White 2350 (88.2) 1502 (88.5) 648 (89.3) 1228 (90.0) 921 (87.0)
Other 315 (11.8) 195 (11.5) 78 (10.7) 137 (10.0) 137 (13.0)
Missing 494 – – – –
Living condition, n (%)
Alone 560 (21.0) 348 (20.5) 159 (21.9) 283 (20.7) 224 (21.2)
Other 2105 (79.0) 1349 (79.5) 567 (78.1) 1082 (79.3) 834 (78.8)
Missing 494 – – – –
Civil status, n (%)
Married or common law 1555 (58.6) 1005 (59.2) 417 (57.4) 842 (61.7) 580 (54.8)
Other 1099 (41.4) 692 (40.8) 309 (42.6) 523 (38.3) 478 (45.2)
Missing 505 – – – –
Education, n (%)
Less than university 1444 (54.8) 939 (55.4) 385 (53.0) 678 (49.7) 646 (61.1)
University 1193 (45.2) 758 (44.6) 341 (47.0) 687 (50.3) 412 (38.9)
Missing 522 – – – –
Living area, n (%)
Rural 359 (11.4) 227 (13.4) 104 (14.3) 183 (13.4) 148 (14.0)
Urban 2800 (88.6) 1470 (86.6) 622 (85.7) 1182 (86.6) 910 (86.0)
Work status, n (%)
Working part-time or full-time 976 (34.9) 610 (40.0) 247 (34.2) 518 (38.0) 339 (32.1)
Temporary or permanent invalidity 899 (32.2) 600 (35.5) 189 (26.0) 369 (27.1) 420 (39.6)
Other 918 (32.9) 487 (24.5) 290 (39.8) 478 (34.9) 299 (28.3)
Missing 366 – – – –
Work status change, n (%)
Loss of employment 276 (10.0) 148 (8.7) 87 (12.0) 127 (9.2) 108 (10.2)
No loss of employment 2484 (90.0) 1549 (91.3) 639 (88.0) 1238 (90.8) 950 (89.8)
Missing 399 – – – –
Continued on the following page
146Health Promotion and Chronic Disease Prevention in Canada Research, Policy and Practice Vol 41, No 5, May 2021
Characteristics Total sample (N = 3159)
Pain status (n = 2423)
Psychological distress (n = 2423)
Worsened (n = 1697)
Unchanged or improved (n = 726)
No/mild psycho-logical distress
(n = 1365)
Moderate/severe psychological distress
(n = 1058)
COVID-19 pandemic-related characteristics
Geographical variations in COVID-19 infection rates (per 100 000), n (%)
>150 1923 (73.4) 1214 (71.5) 564 (77.7) 1025 (75.0) 753 (71.2)
50–150 641 (24.5) 443 (26.2) 147 (20.3) 312 (22.9) 278 (26.3)
<50 57 (2.1) 40 (2.3) 15 (2.0) 28 (2.1) 27 (2.5)
Missing 538 – – – –
COVID-19 infection, n (%)
Yes, with complications requiring care 8 (0.3) 0 (0.0) 0 (0.0) 0 (0.0) 0 (0.0)
Yes, without complications 16 (0.6) 0 (0.0) 0 (0.0) 0 (0.0) 0 (0.0)
Waiting for test result 15 (0.5) 12 (0.7) 1 (0.1) 8 (0.6) 5 (0.5)
Untested but with symptoms 77 (2.8) 56 (3.3) 12 (1.7) 32 (2.3) 36 (3.4)
Not infected 2671 (95.8) 1629 (96.0) 713 (98.2) 1325 (97.1) 1017 (96.1)
Missing 372 – – – –
Work-related restrictions, mean score (SD) 0.57 (0.70) 0.58 (0.70) 0.55 (0.69) 0.58 (0.71) 0.56 (0.68)
Health-related restrictions, mean score (SD) 1.22 (0.76) 1.30 (0.75) 1.04 (0.77) 1.11 (0.75) 1.36 (0.76)
Social-related restrictions, mean score (SD) 0.87 (0.83) 0.89 (0.85) 0.80 (0.79) 0.76 (0.77) 1.00 (0.88)
COVID-19 perceived susceptibility, n (%)
0–4 2296 (84.6) 1409 (83.0) 634 (87.3) 1219 (89.4) 824 (77.9)
>4 419 (15.4) 288 (17.0) 92 (12.7) 146 (10.6) 234 (22.1)
Missing 444 – – – –
COVID-19 perceived severity, n (%)
0–4 1636 (60.2) 1006 (59.3) 431 (59.4) 803 (58.8) 634 (59.8)
>4 1081 (39.8) 691 (40.7) 295 (40.6) 562 (41.2) 424 (40.2)
Missing 442 – – – –
COVID-19 perceived benefits, n (%)
0–4 747 (27.6) 479 (28.2) 171 (23.6) 287 (20.9) 363 (34.3)
>4 1963 (72.4) 1218 (71.8) 555 (76.4) 1078 (79.1) 695 (65.7)
Missing 449 – – – –
COVID-19 perceived risks, n (%)
0–4 1460 (54.0) 861 (50.7) 453 (62.4) 827 (60.7) 487 (45.9)
>4 1245 (46.0) 836 (49.3) 273 (37.6) 538 (39.3) 571 (54.1)
Missing 454 – – – –
Stress associated with the pandemic, mean score (SD)
6.88 (2.40) 7.17 (2.30) 6.18 (2.48) 6.01 (2.34) 7.99 (1.98)
Stress associated with the public health restrictions, mean score (SD)
5.88 (2.70) 6.21 (2.62) 5.15 (2.70) 5.14 (2.58) 6.85 (2.51)
Psychological characteristics
PHQ-4, n (%)
No/mild psychological distress 1513 (56.8) 850 (50.1) 515 (71.0) – –
Moderate/severe psychological distress 1153 (43.2) 847 (49.9) 211 (29.0) – –
Missing 493 – – – –
PSS-4, mean score (SD) 7.84 (3.24) 8.25 (3.18) 6.84 (3.15) 6.28 (2.74) 9.84 (2.68)
TABLE 1 (continued) Participants’ characteristics for the overall sample and according to pain status and psychological
distress for those included in the inferential analyses
Continued on the following page
147 Health Promotion and Chronic Disease Prevention in Canada Research, Policy and PracticeVol 41, No 5, May 2021
Characteristics Total sample (N = 3159)
Pain status (n = 2423)
Psychological distress (n = 2423)
Worsened (n = 1697)
Unchanged or improved (n = 726)
No/mild psycho-logical distress
(n = 1365)
Moderate/severe psychological distress
(n = 1058)
Pain characteristics
Pain location, n (%)
Generalized pain 359 (11.8) 210 (12.4) 74 (10.2) 157 (11.5) 127 (12.1)
Head 82 (2.7) 31 (1.8) 23 (3.2) 34 (2.5) 20 (1.9)
Upper limb and upper body 242 (7.9) 124 (7.4) 62 (8.4) 103 (7.5) 83 (7.9)
Lower limb and lower body 2379 (77.2) 1322 (77.8) 563 (77.6) 1064 (78.0) 821 (77.5)
Multisite 13 (0.4) 5 (0.3) 2 (0.3) 6 (0.4) 1 (0.1)
Unknown/missing 84 5 (0.3) 2 (0.3) 1 (0.1) 6 (0.5)
Pain origin, n (%)
Accident 750 (25.1) 441 (26.9) 160 (22.4) 324 (24.0) 287 (27.4)
Disease 757 (25.4) 419 (25.0) 203 (28.4) 374 (27.9) 248 (23.7)
Movement/trauma 334 (11.2) 175 (10.4) 88 (12.3) 150 (11.2) 113 (10.8)
No precise event 763 (25.6) 422 (25.1) 182 (25.5) 343 (25.5) 261 (24.9)
Other 380 (12.7) 213 (12.6) 81 (11.4) 154 (11.4) 140 (13.2)
Missing 175 27 12 20 9
BPI, mean score (SD) 43.39 (14.24) 45.23 (13.33) 39.06 (15.32) 38.83 (13.74) 49.26 (12.65)
Average pain intensity, mean score (SD) 6.13 (1.84) 6.36 (1.68) 5.64 (2.00) 5.76 (1.81) 6.63 (1.69)
Worst pain intensity, mean score (SD) 7.65 (1.77) 7.91 (1.51) 7.18 (2.03) 7.38 (1.81) 8.09 (1.51)
Global quality of life, mean score (SD) 55.66 (20.03) 54.17 (19.78) 58.80 (19.65) 59.68 (19.04) 50.80 (19.73)
Pain duration, n (%)
≤2 years 390 (12.7) 180 (10.5) 111 (15.3) 166 (12.2) 125 (11.8)
3–10 years 1248 (40.4) 718 (42.4) 260 (35.8) 517 (37.8) 461 (43.6)
>10 years 1444 (46.9) 799 (47.1) 355 (48.9) 682 (50.0) 472 (44.6)
Missing 77 – – – –
Changes in pain status, n (%)
Considerably worsened 418 (14.5) – – 126 (9.2) 232 (22.0)
Worsened a lot 577 (20.0) – – 220 (16.2) 275 (26.0)
Somewhat worsened 990 (34.5) – – 504 (36.9) 340 (32.1)
Remained unchanged 750 (26.0) – – 431 (31.5) 183 (17.3)
Improved (somewhat, a lot, considerably) 145 (5.0) – – 84 (6.2) 28 (2.6)
Missing 279 – – – –
Changes to pharmacological treatments, n (%)
Yes 970 (33.9) 707 (41.7) 113 (15.6) 392 (28.7) 428 (40.5)
No 1563 (54.6) 803 (47.3) 512 (70.5) 792 (58.0) 523 (49.4)
Not applicable 331 (11.5) 187 (11.0) 101 (13.9) 181 (13.3) 107 (10.1)
Missing 315 – – – –
Changes to physical/psychological treatments, n (%)
Yes 1685 (59.5) 1140 (67.2) 334 (46.0) 821 (60.3) 653 (61.7)
No 786 (27.7) 369 (21.7) 272 (37.5) 379 (27.7) 262 (24.8)
Not applicable 362 (12.8) 188 (11.1) 120 (16.5) 165 (12.0) 143 (13.5)
Missing 326 – – – –
Abbreviations: BPI, Brief Pain Inventory; PHQ-4, Patient Health Questionnaire–4; PSS-4, Perceived Stress Scale–4.Note: Percentages are calculated based on completed data (and exclude missing data), as such the denominator can vary from one variable to another.
TABLE 1 (continued) Participants’ characteristics for the overall sample and according to pain status and psychological
distress for those included in the inferential analyses
148Health Promotion and Chronic Disease Prevention in Canada Research, Policy and Practice Vol 41, No 5, May 2021
TABLE 2 Associations between characteristics of patients and worsened pain or psychological distress
Variables
Model 3 Worsened pain
Model 4 Moderate-severe psychological distress
Adjusted OR (95% CI) p-value Adjusted OR (95% CI) p-value
Time of questionnaire completion
Weeks 1–3 (complete confinement) Ref. – Ref. –
Weeks 4–5 (initial lifting of restrictions) 0.90 (0.71–1.13) 0.361 1.03 (0.79–1.33) 0.837
Weeks 6–8 (additional lifting of restrictions) 1.01 (0.78–1.31) 0.961 0.96 (0.72–1.27) 0.767
Age, years
18–39 Ref. – Ref. –
40–69 0.92 (0.71–1.18) 0.487 0.75 (0.57–0.98) 0.034
≥70 0.49 (0.32–0.76) 0.002 0.54 (0.32–0.92) 0.024
Sex
Male Ref. Ref.
Female 1.19 (0.92–1.55) 0.182 1.10 (0.80–1.50) 0.560
Civil status
Other Ref. – Ref. –
Married / common law 1.07 (0.83–1.37) 0.626 0.94 (0.71–1.24) 0.659
Living condition
Alone Ref. – Ref. –
Other 0.96 (0.71–1.31) 0.801 1.06 (0.75–1.48) 0.757
Education
Less than university Ref. – Ref. –
University 0.96 (0.78–1.19) 0.721 0.85 (0.68–1.07) 0.166
Location
Rural Ref. – Ref. –
Urban 1.20 (0.91–1.59) 0.205 1.06 (0.77–1.46) 0.711
Work status
Other Ref. – Ref. –
Full-time or part-time 1.42 (1.09–1.86) 0.011 1.12 (0.83–1.52) 0.458
Permanent / temporary disability 1.23 (0.94–1.60) 0.132 1.16 (0.86–1.55) 0.327
Work status change
No loss of employment Ref. – Ref. –
Loss of employment 0.67 (0.48–0.94) 0.019 1.09 (0.74–1.61) 0.663
Geographical variations in COVID-19 infection rates (per 100 000)
0 to <50 Ref. – Ref. –
50–150 1.05 (0.53–2.08) 0.887 0.79 (0.37–1.70) 0.547
>150 1.00 (0.52–1.93) 0.991 0.83 (0.39–1.76) 0.632
COVID-19 perceived susceptibility
0–4 Ref. – Ref. –
>4 0.98 (0.73–1.31) 0.886 1.17 (0.86–1.60) 0.309
COVID-19 perceived severity
0–4 Ref. – Ref. –
>4 0.92 (0.76–1.13) 0.437 0.92 (0.74–1.15) 0.475
COVID-19 perceived benefits
0–4 Ref. – Ref. –
>4 1.00 (0.79–1.26) 0.997 1.03 (0.80–1.32) 0.844Continued on the following page
149 Health Promotion and Chronic Disease Prevention in Canada Research, Policy and PracticeVol 41, No 5, May 2021
of individuals). This is important, know-ing that chronic pain is very unlikely to remit on its own and 33% of individuals on a pain clinic waitlist report suicidal ideation.27
These statistics are consistent with those of people with other chronic diseases that show higher rates of stress, depression and anxiety than the general population during the pandemic.28 Two important rea-sons for this were identified and con-cerned higher deaths rates following infection with the coronavirus among medically compromised populations and inaccessibility of medical services and treatments.28 Changes in pharmacological and physical/psychological pain treatments
since the onset of the pandemic had the strongest associations with pain deteriora-tion in the present study. The rapid shift toward virtual care or alternative accessible health care and other support options is of utmost importance in such circumstances.29
Pain status change associated with factors other than geography
Regional variations in COVID-19 infection rates, living in urban centres where trans-mission is more likely than in rural set-tings and experiencing higher numbers of public health safety measures were not associated with pain status or psychologi-cal distress. Prevalence of chronic pain is typically higher among rural or remote
Canadian dwellers than urban dwellers,30 but this does not mean that those individ-uals are also at higher risk of chronic pain deterioration. In Asian and European stud-ies, geographical severity of the coronavi-rus outbreak has been positively associated with general psychological distress,28 but has not been examined in relation to pain status.
Stress appraisal and management— a crucial element
Perceived stress was associated with both pain deterioration and psychological dis-tress. Earlier studies on the COVID-19 pan-demic have shown that sources of stress are numerous and include, for example,
Variables
Model 3 Worsened pain
Model 4 Moderate-severe psychological distress
Adjusted OR (95% CI) p-value Adjusted OR (95% CI) p-value
COVID-19 perceived risks
0–4 Ref. – Ref. –
>4 1.27 (1.03–1.56) 0.022 0.91 (0.73–1.13) 0.381
Work-related restrictions 0.99 (0.83–1.17) 0.856 1.06 (0.88–1.27) 0.547
Health-related restrictions 1.10 (0.96–1.27) 0.174 1.08 (0.92–1.25) 0.349
Social-related restrictions 0.98 (0.86–1.12) 0.786 1.08 (0.94–1.24) 0.275
COVID-19 emotional reactionsa 1.17 (0.99–1.38) 0.059 2.14 (1.78–2.57) <0.001
Stress (material needs)a 0.93 (0.82–1.05) 0.224 1.08 (0.95–1.22) 0.268
Stress (virus threat, social interactions)a 1.21 (1.05–1.41) 0.011 1.39 (1.17–1.66) <0.001
PSS-4 – Perceived stress 1.04 (1.00–1.08) 0.046 1.43 (1.36–1.50) <0.001
PHQ-4
No/mild distress Ref. – – –
Moderate/severe distress 1.18 (0.92–1.52) 0.188 – –
BPI – Pain interference 1.02 (1.01–1.03) <0.001 1.02 (1.01–1.03) <0.001
Pain duration, years
0–2 Ref. – Ref. –
3–10 1.69 (1.24–2.29) 0.001 1.00 (0.71–1.42) 0.984
>10 1.40 (1.03–1.90) 0.033 0.83 (0.59–1.18) 0.308
Pain status change
Unchanged or improved – – Ref. –
Worsened – – 1.14 (0.88–1.47) 0.316
Changes to pharmacological treatments
No Ref. – Ref. –
Yes 3.17 (2.49–4.05) <0.001 1.27 (1.00–1.62) 0.054
Changes to physical/psychological treatments
No Ref. – Ref. –
Yes 2.04 (1.62–2.58) <0.001 1.04 (0.79–1.37) 0.783
Abbreviations: BPI, Brief Pain Inventory; CI, confidence interval; OR, odds ratio; PHQ-4, Patient Health Questionnaire-4; PSS-4, Perceived Stress Scale-4; Ref., reference.
Note: Statistically significant p-values are bolded.a Regression scores derived from exploratory factor analysis.
TABLE 2 (continued) Associations between characteristics of patients and worsened pain or psychological distress
150Health Promotion and Chronic Disease Prevention in Canada Research, Policy and Practice Vol 41, No 5, May 2021
fear of COVID-19 infection, socioeconomic worries and traumatic stress responses.31,32
In this study, stress appraisal had stronger associations with pain status and psycho-logical distress than degree of geographi-cal variations in COVID-19 infection. This is a clinically important finding, since minimizing the absolute number of stress-ors may be difficult during a pandemic; alternatively, helping individuals manage and appraise stress more optimally is achievable.33
Counterintuitively, having lost one’s job during the pandemic was associated with lower likelihood of reporting worsened pain; however, being in the workforce at the beginning of the pandemic was asso-ciated with an increased likelihood of reporting worsened pain. While the type of employment was not measured in this study, working during the pandemic may push the boundaries of a person’s physi-cal capacity if environmental demands (e.g. caring for children at home, adjust-ing to remote working) increase. Losing one’s job, if widely available national emergency financial programs can be made use of, may decrease an individual’s level of physical activity or allow for greater engagement in pain self-management.
Deteriorated pain and psychological dis-tress were less prevalent with older age. This is consistent with a systematic review that showed younger adults were at increased risk of psychological distress during the pandemic, likely because of the financial and professional stress associated with lockdowns in addition to increased responsibilities such as childcare.28
Magnitude of psychological distress
Psychological distress in this sample (43%) was double that of the general population during the COVID-19 pandemic.8 Our find-ings showed that those who felt particu-larly vulnerable to the COVID-19 pandemic or expressed concerns about the health of others were more likely to report psycho-logical distress. The COVID-19 pandemic puts individuals in an unpredictable situa-tion over which they have little control, a perfect recipe for increased stress.33 In contrast to pain status change, changes in pharmacological or physical/psychologi-cal treatments for pain did not increase the odds of reporting moderate to severe psychological distress. Some of those treat-ment changes may have been initiated by
individuals with chronic pain to limit their risk of COVID-19 infection (e.g. by avoid-ing hospitals), which in turn may have led to a reduced perceived threat. For others, unwanted changes to their treatments may have led to a worsening of their psy-chological distress.
Strengths and limitations
The cross-sectional design of this study precluded the ability to make causal infer-ences. The self-selection of participants in the study through a convenience sampling strategy that included patient organiza-tions limited generalizability of our find-ings to all individuals with chronic pain. However, compared to other large random surveys, our study sample was of a similar age (mean age: 49.7 compared to 46.6–48.4)2,34,35 and had a similar percentage of workers (34.9% compared to 38–44%)2,34; pain duration (46.9% with pain duration >10 years compared to 46–46.7%)2,36; and pain intensity (mean 0–10 pain score: 6.1 vs. 6.3–6.9)34,37 compared to other large random surveys.
Female participants were overrepresented in this study compared to other stud-ies.2,34,35,37 It is possible that such represen-tation was in part due to the recruitment strategies that relied primarily on social media.38,39 Nonetheless, we were able to recruit a nonnegligible number of male participants (n = 429), allowing us to consider this variable in the multivariate models.
The exclusion of individuals with missing data likely resulted in a sample that was less affected by the pandemic than those included. Moreover, patient self-report data may have been subject to recall bias and/or misclassification. These characteristics, however, allow to focus on the individu-als’ perspectives and to document their lived experience, something very difficult to achieve in large epidemiological studies using medico-administrative databases.
Implications and recommendations
Given the cross-sectional nature and con-venience sampling procedure used in this study, it will be important to validate study findings in other samples of indi-viduals living with chronic pain. Study results showed deteriorated pain and psy-chological status during the COVID-19 pan-demic in a population that already faced multiple types of physical, socioeconomic
and mental health challenges. The pan-demic has exacerbated all of these chal-lenges.40,41 Given the trajectory of chronic pain, it is likely that many individuals will not return to their pre-pandemic pain state once it is over, and rates of chronic pain may increase over time.5 As suggested in the latest report of the Canadian Pain Task Force, tangible system responses to the COVID-19 pandemic should be imple-mented to improve the conditions of indi-viduals living with chronic pain.5 These include the identification of pain as a health care priority, supporting epidemio-logical research on pain (including post viral pain), facilitating the implementation of virtual stepped care for pain and men-tal health, facilitating access to self-man-agement tools and creating centralized and interdisciplinary assessment, intake and care.5
Acknowledgements
The authors would like to thank the Pain BC and the Canadian Arthritis Patient Alliance for their feedback on the study design and questionnaires, and for their recruitment efforts. MGP is a Junior 1 research scholar and AL is a Junior 2 research scholar from the Fonds de recher-che du Québec – Santé (FRQS).
We also want to thank our patient part-ners—Camille Fauteux, Jacques Laliberté and Linda Wilhelm—for their insights and collaborations throughout the project. They were involved in the pre-test of the study questionnaires and provided their feedback on the interpretation of study results.
Dissemination
Study results have been presented at two con-ferences—Canadian Psychological Association and Centre de recherche du Centre hospi-talier de l’Université de Montréal (CHUM). Two public webinars also took place to disseminate study results to the general public. In addition, we plan to further dis-seminate study results to participants and the general public through infographics, and press releases through partnering organizations.
Funding
Financial support for this study was pro-vided by the Chronic Pain Network of the Canadian Institutes of Health Research (CIHR)’s Strategy for Patient-Oriented
151 Health Promotion and Chronic Disease Prevention in Canada Research, Policy and PracticeVol 41, No 5, May 2021
Research (SPOR grant SCA-145102)), the Quebec Pain Research Network of the FRQS and Pain BC.
MH, GM and KS are employees of Pain BC, a charitable non-profit organization working to enhance the well-being of peo-ple living with pain. They were involved in the study design, participants’ recruit-ment and review of the manuscript. All other funding sources had no role in the study design, collection, analysis and interpretation of data, writing of the man-uscript or decision to submit the paper for publication.
Conflict of interest
All authors declare no support from com-mercial entities for the submitted work. MH, GM and KS are employees of Pain BC, a charitable non-profit organization working to enhance the well-being of peo-ple living with pain; this organization receives funding from the British Columbia Ministry of Health. GM received funding from the Michael Smith Foundation for Health Research through InSearch Research Group for work unrelated to this submission.
Authors’ contributions and statement
MGP – conceptualization, data curation, formal analysis, investigation, methodol-ogy, writing – original draft and review and editing; AL – conceptualization, data curation, funding acquisition, methodol-ogy, writing – review and editing; LD – conceptualization, data curation, funding acquisition, methodology, writing – review and editing; MH – conceptualization, data curation, funding acquisition, methodol-ogy, writing – review and editing; GM – conceptualization, data curation, funding acquisition, methodology, writing – review and editing; KS – conceptualization, data curation, funding acquisition, methodol-ogy, writing – review and editing; JMT – conceptualization, data curation, funding acquisition, methodology, writing – review and editing; MD – formal analysis, writing-review and editing; AJM – conceptualiza-tion, data curation, methodology, project administration, writing – review and edit-ing; NS – methodology, analysis, writing-review and editing; MC – conceptualization, data curation, funding acquisition, meth-odology, writing – review and editing.
The content and views expressed in this article are those of the authors and do not
necessarily reflect those of the Government of Canada.
References
1. Treede RD, Rief W, Barke A, et al. Chronic pain as a symptom or a disease: the IASP Classification of Chronic Pain for the International Classification of Diseases (ICD-11). Pain. 2019;160(1):19-27. https://doi .org/10.1097/j.pain.0000000000001384
2. Treede RD, Rief W, Barke A, et al. A classification of chronic pain for ICD-11. Pain. 2015;156(6):1003-7. https://doi .org/10.1097/j.pain.0000000000000160
3. Dahlhamer J, Lucas J, Zelaya C, et al. Prevalence of chronic pain and high- impact chronic pain among adults–United States, 2016. MMWR Morb Mortal Wkly Rep. 2018;67(36):1001-6. https://doi.org/10.15585/mmwr .mm6736a2
4. Breivik H, Collett B, Ventafridda V, Cohen R, Gallacher D. Survey of chronic pain in Europe: prevalence, impact on daily life, and treatment. Eur J Pain. 2006;10(4):287-333. https:// doi.org/10.1016/j.ejpain.2005.06.009
5. Campbell F, Hudspith M, Choinière M, et al. Working together to better understand, prevent, and manage chronic pain: what we heard. A report by the Canadian Pain Task Force, October 2020. Ottawa (ON): Health Canada, 2020.
6. Campbell F, Hudspith M, Choinière M, et al. Chronic pain in Canada: laying a foundation for action. A report by the Canadian Pain Task Force, June 2019. Ottawa (ON): Health Canada; 2019.
7. Rajkumar RP. COVID-19 and mental health: a review of the existing litera-ture. Asian J Psychiatr. 2020;52: 102066. https://doi.org/10.1016/j.ajp .2020.102066
8. Clauw DJ, Häuser W, Cohen SP, Fitzcharles MA. Considering the poten-tial for an increase in chronic pain after the COVID-19 pandemic. Pain. 2020;161(8):1694-7. https://doi.org/10 .1097/j.pain.0000000000001950
9. May CR, Brcic V, Lau B. Character-istics and complexity of chronic pain patients referred to a community- based multidisciplinary chronic pain clinic. Can J Pain. 2018;2(1):125-34. https://doi.org/10.1080/24740527.2018 .1453751
10. Peng P, Choiniere M, Dion D, et al. Challenges in accessing multidiscipli-nary pain treatment facilities in Canada. Can J Anaesth. 2007;54(12):977-84. https://doi.org/10.1007/BF03016631
11. Lacasse A, Pagé MG, Dassieu L, et al. Impact of the COVID-19 pandemic on the pharmacological, physical and psy-chological treatments of pain: findings from the Chronic Pain & COVID-19 Pan-Canadian Study. Pain Reports. Forthcoming 2021.
12. Berry I, Soucy JP, Tuite A, Fisman D; COVID-19 Canada Open Data Working Group. Open access epidemiologic data and an interactive dashboard to monitor the COVID-19 outbreak in Canada. CMAJ. 2020;192(15):E420. https://doi.org/10.1503/cmaj.75262
13. Bobos P, MacDermid J, Nazari G, Furtado R; CATWAD. Psychometric properties of the global rating of change scales in patients with neck disorders: a systematic review with meta-analysis and meta-regression. BMJ Open. 2019;9(11):e033909. https://doi.org/10.1136/bmjopen-2019-033909
14. Kroenke K, Spitzer RL, Williams JB, Löwe B. An ultra-brief screening scale for anxiety and depression: the PHQ-4. Psychosomatics. 2009;50(6):613-21. https://doi.org/10.1176/appi.psy.50.6 .613
15. Löwe B, Wahl I, Rose M, et al. A 4-item measure of depression and anxiety: validation and standardization of the Patient Health Questionnaire-4 (PHQ-4) in the general population. J Affect Disord. 2010;122(1-2):86-95. https://doi.org/10.1016/j.jad.2009.06.019
16. Dworkin RH, Turk DC, Farrar JT, et al. Core outcome measures for chro-nic pain clinical trials: IMMPACT recommendations. Pain. 2005;113(1-2): 9-19. https://doi.org/10.1016/j.pain .2004.09.012
152Health Promotion and Chronic Disease Prevention in Canada Research, Policy and Practice Vol 41, No 5, May 2021
17. Jensen MP, Karoly P. Self-report scales and procedures for assessing pain in adults. In: Turk DC, Melzack R., editors. Handbook of pain assessment. 3rd ed. New York (NY): The Guilford Press; 2011.
18. Cleeland CS. The Brief Pain Inventory User Guide. Houston (TX): The University of Texas MD Anderson Cancer Center; 2009.
19. Keller S, Bann CM, Dodd SL, Schein J, Mendoza TR, Cleeland CS. Validity of the brief pain inventory for use in documenting the outcomes of patients with noncancer pain. Clin J Pain. 2004;20(5):309-18. https://doi.org/10 .1097/00002508-200409000-00005
20. Tan G, Jensen MP, Thornby JI, Shanti BF. Validation of the Brief Pain Inventory for chronic nonmalignant pain. J Pain. 2004;5(2):133-7. https://doi.org/10.1016/j.jpain.2003.12.005
21. EuroQol Research Foundation. EQ-5D- 5L user guide: basic information on how to use the EQ-5D-5L instrument. Version 3.0 [Internet]. Rotterdam (NL): EuroQol Research Foundation; 2019 [cited 2020 Mar 30]. Available from: https://euroqol.org/publications/user -guides
22. Obradovic M, Lal A, Liedgens H. Validity and responsiveness of EuroQol-5 dimension (EQ-5D) versus Short Form-6 dimension (SF-6D) ques-tionnaire in chronic pain. Health Qual Life Outcomes. 2013;11:110. https://doi.org/10.1186/1477-7525-11-110
23. Lazarus RS, Folkman S. Stress, appraisal and coping. New York (NY): Springer Press; 1984.
24. Dupret E, Bocéréan C. La mesure du stress en milieu professionnel avec l’échelle de stress perçu (Perceived Stress Scale): pertinence des versions en dix et quatre items. Psychol Trav Organ. 2013;19(4):362-84. https://doi .org/10.1016/S1420-2530(16)30049-8
25. Bujang MA, Sa’at N, Sidik T, Joo LC. Sample size guidelines for logistic regression from observational studies with large population: emphasis on the accuracy between statistics and param-eters based on real life clinical data. Malays J Med Sci. 2018;25(4):122-30. https://doi.org/10.21315/mjms2018 .25.4.12
26. Dworkin RH, Turk D, Wyrwich KW, et al. Interpreting the clinical impor-tance of treatment outcomes in chro-nic pain clinical trials: IMMPACT recommendations. J Pain. 2008;9(2): 105-21. https://doi.org/10.1016/j.jpain .2007.09.005
27. Choinière M, Dion D, Peng P, et al. The Canadian STOP-PAIN project – Part 1: Who are the patients on the waitlists of multidisciplinary pain treatment facilities? Can J Anaesth. 2010;57(6):539-48. https://doi.org/10 .1007/s12630-010-9305-5
28. Xiong J, Lipsitz O, Nasri F, et al. Impact of COVID-19 pandemic on mental health in the general popula-tion: a systematic review. J Affect Disord. 2020;277:55-64. https://doi .org/10.1016/j.jad.2020.08.001
29. Eccleston C, Blyth FM, Dear BF, et al. Managing patients with chronic pain during the COVID-19 outbreak: consi-derations for the rapid introduction of remotely supported (eHealth) pain man-agement services. Pain. 2020;161(5): 889-93. https://doi.org/10.1097/j.pain .0000000000001885
30. Bath B, Trask C, McCrosky J, Lawson J. Demographic and health characte-ristics of rural- and urban-dwelling Canadians with chronic back disor-ders: a population-based comparison. Spine. 2014;39(23):1960-8. https://doi .org/10.1097/BRS.0000000000000561
31. Taylor S, Landry CA, Paluszek MM, Fergus TA, McKay D, Asmundson GJ. COVID stress syndrome: concept, struc-ture, and correlates. Depress Anxiety. 2020;37(8):706-14. https://doi.org/10 .1002/da.23071
32. Taylor S, Landry CA, Paluszek MM, Fergus TA, McKay D, Asmundson GJ. Development and initial validation of the COVID Stress Scales. J Anxiety Disord. 2020;72:102232. https://doi.org /10.1016/j.janxdis.2020.102232
33. Lupien SJ, Ouellet-Morin I, Trepanier L, et al. The DeStress for Success Program: effects of a stress education program on cortisol levels and depres-sive symptomatology in adolescents making the transition to high school. Neuroscience. 2013;249:74-87. https:// doi.org/10.1016/j.neuroscience.2013 .01.057
34. Moulin DE, Clark AJ, Speechley M, Morley-Forster PK. Chronic pain in Canada – prevalence, treatment, impact and the role of opioid analgesia. Pain Res Manag. 2002;7(4):179-84. https:// doi.org/10.1155/2002/323085
35. Toth C, Lander J, Wiebe S. The preva-lence and impact of chronic pain with neuropathic pain symptoms in the general population. Pain Med. 2009; 10(5):918-29. Epub 2009/07/15. https:// doi.org/10.1111/j.1526-4637.2009 .00655.x
36. Schopflocher D, Taenzer P, Jovey R. The prevalence of chronic pain in Canada. Pain Res Manag. 2011;16(6): 445-50. https://doi.org/10.1155/2011 /876306
37. Boulanger A, Clark AJ, Squire P, Cui E, Horbay GL. Chronic pain in Canada: have we improved our management of chronic noncancer pain? Pain Res Manag. 2007;12(1):39-47. https://doi .org/10.1155/2007/762180
38. Marshall K. Utilisation de l’ordinateur au travail. l’emploi et le revenu en per-spective-l’édition en ligne. Perspective. 2001;2(5).
39. CEFRIO. L’usage des médias sociaux au Québec. Enquête NETendances. 2018;9(5). https://transformation -numerique.ulaval.ca/wp-content /uploads/2020/09/netendances-2018 -usage-medias-sociaux.pdf
40. Lynch M, Williamson OD, Banfield J. COVID-19 impact and response by Canadian Pain Clinics: A National Survey of Adult Pain Clinics. Can J Pain. 2020;4(1):204-9. https://doi.org/10.1080/24740527.2020.1783218
41. Hovey R, Linkiewich D, Brachaniec M. Chronic pain, vulnerability and human spirit while living under the umbrella of COVID-19. Patient Exp J. 2020;7(2):8. https://doi.org/10.35680 /2372-0247.1504