Embed Size (px)
Citation preview

CO – Supply Chain
Wie Nestlé Statistische Prognosemodelle benützt um Kunden und Konsumenten sichere und frische Produkte zu liefern
Marcel Baumgartner [email protected]
Baden, May 7th, 2013
SAS Forum Switzerland
Your speaker
• Married, two children
• Applied Mathematics, EPFL (1992)
• Masters in Statistics, Purdue University (1995)
• Nestlé Research Center, Vers-chez-les-Blanc (1994 – 2001)
• Nestlé Headquarters, Corporate Unit for Supply Chain (2001 - …)
• Current Role:
Global Lead for Demand Planning Performance and Statistical
Forecasting
• Co-president of the Swiss Statistical Society (www.stat.ch)
• President of the section Business & Industries of the Swiss Statistical
Society
2
Agenda
• Nestlé and Nestlé in Switzerland
• Supply Chain Management
• S&OP and Forecasting
• Applying Statistical Forecasting
• Experiences with SAS
3
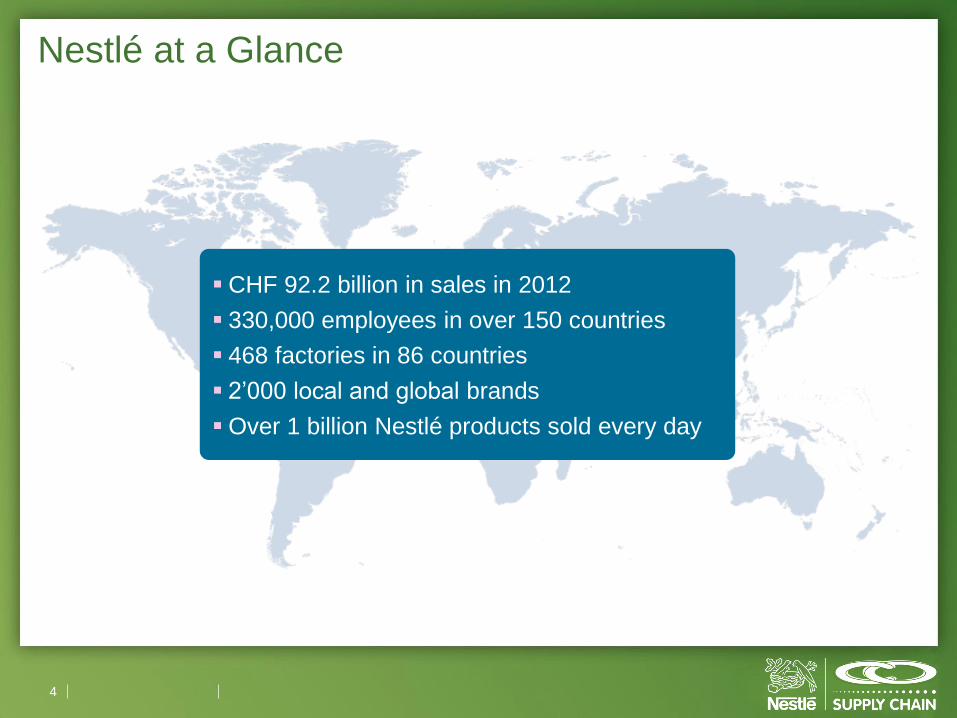
Nestlé at a Glance
4
CHF 92.2 billion in sales in 2012
330,000 employees in over 150 countries
468 factories in 86 countries
2’000 local and global brands
Over 1 billion Nestlé products sold every day
5
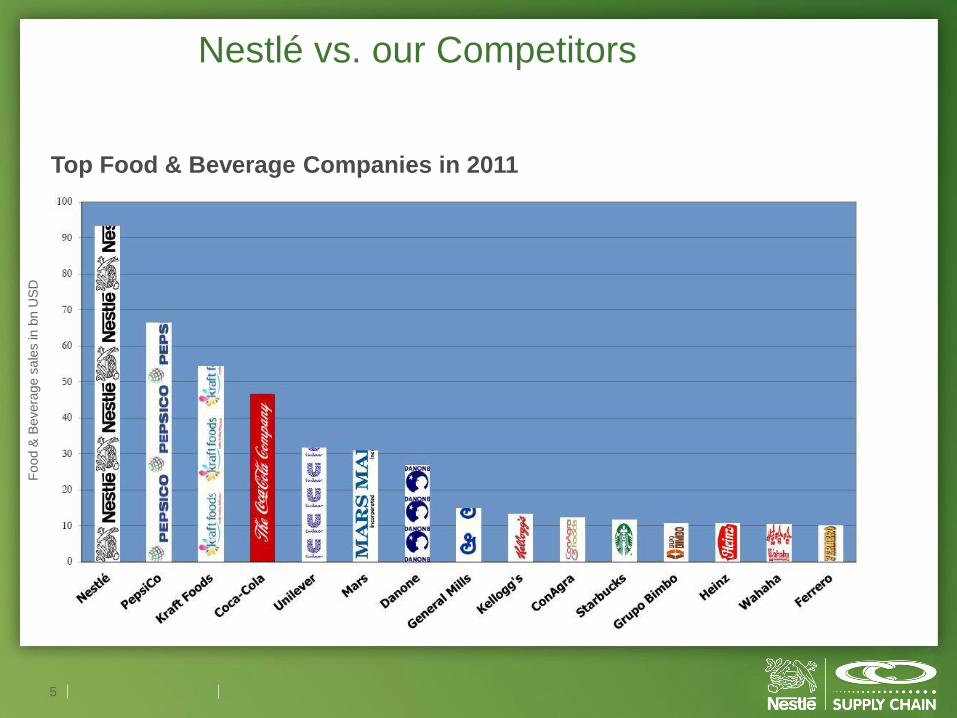
Nestlé vs. our Competitors
Top Food & Beverage Companies in 2011
Food &
Bevera
ge s
ale
s in b
n U
SD
6
7
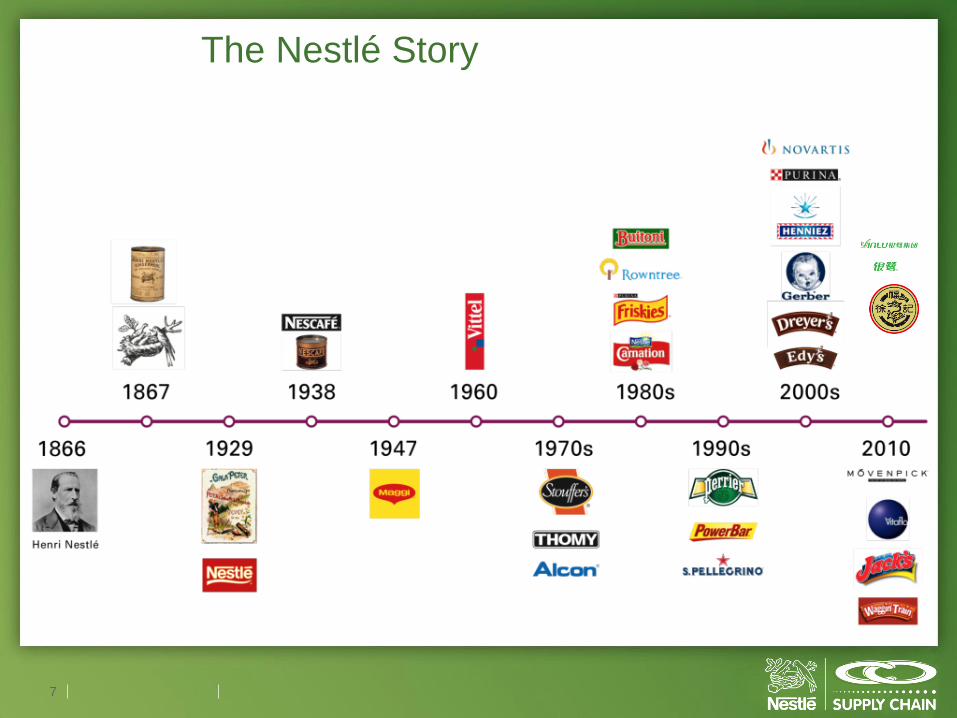
The Nestlé Story
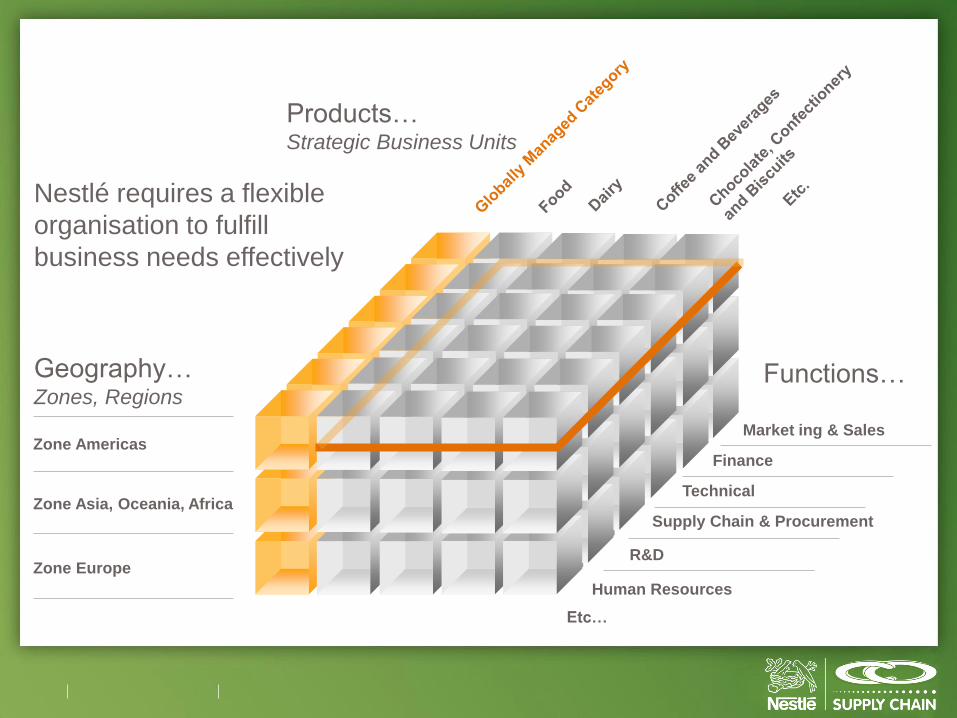
Nestlé requires a flexible
organisation to fulfill
business needs effectively
Zone Asia, Oceania, Africa
Zone Americas
Zone Europe
Geography… Zones, Regions
Products… Strategic Business Units
Supply Chain & Procurement
Finance
Market ing & Sales
Technical
R&D
Human Resources
Functions…
Etc…
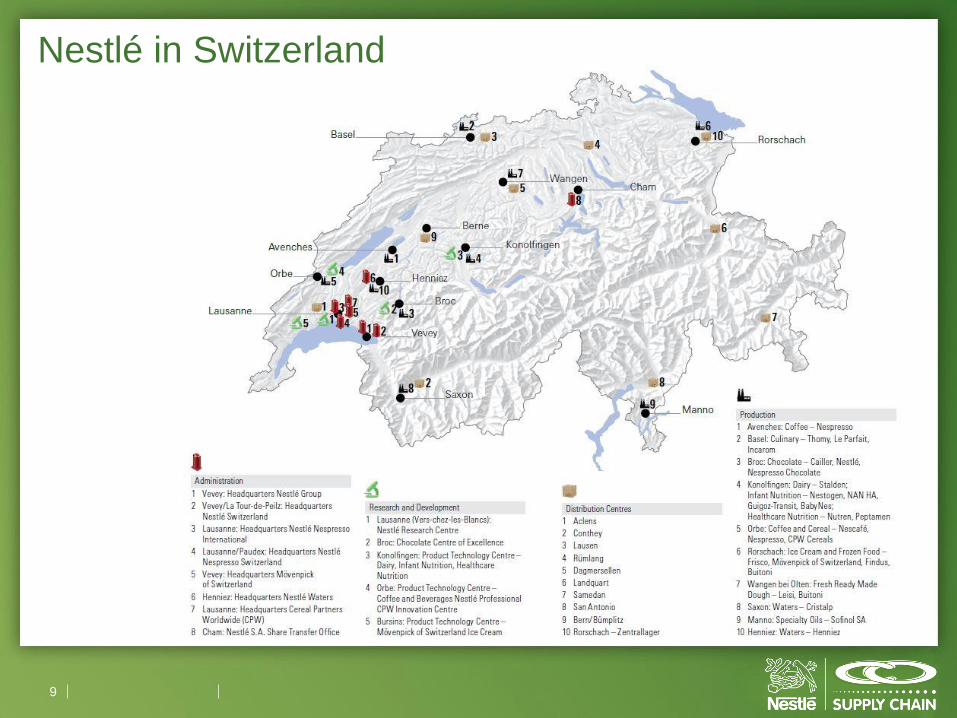
Nestlé in Switzerland
9
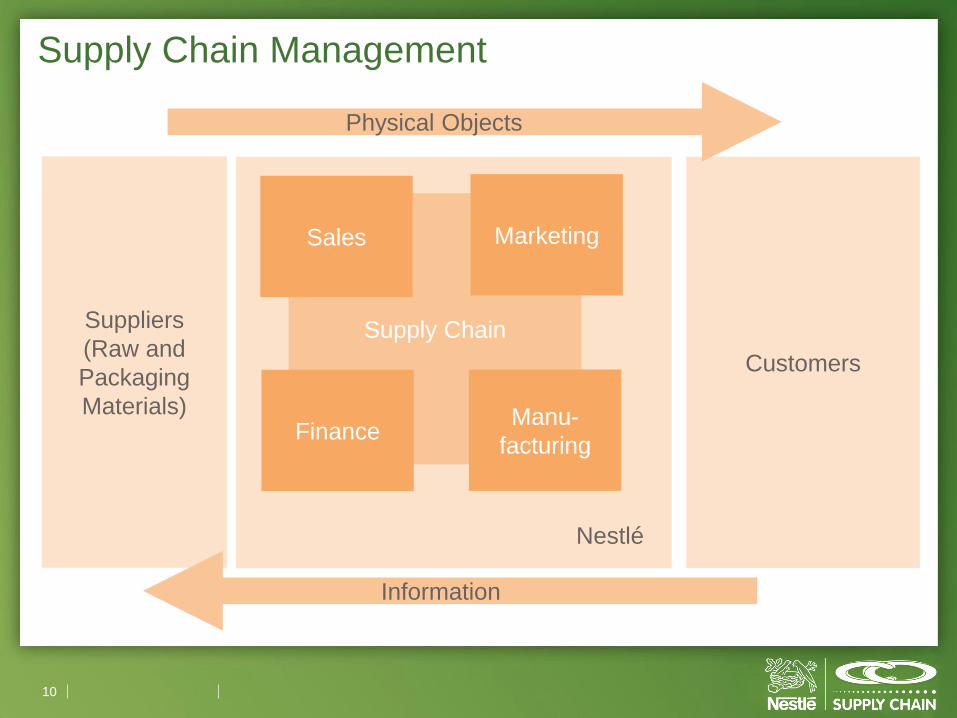
Supply Chain Management
10
Customers
Suppliers
(Raw and
Packaging
Materials)
Nestlé
Supply Chain
Marketing
Finance
Sales
Manu-
facturing
Physical Objects
Information
The Supply Chain Solves Trade-Offs
Two main Key Performance Indicators:
• Customer Service Level (% of orders completely delivered)
• Holding Inventory
To improve Customer Service, you can hold more inventory.
But inventory costs money: cash is blocked, physical storage,
risk of ageing products.
The overall goal of Supply Chain Management is to improve
Customer Service whilst optimizing the costs, by solving this
trade-off.
11
The Need for Forecasting
At Nestlé, most of our production is driven by "Make to Stock", and
not "Make to Order".
We often have to produce large batches, both for cost (larger
batches = smaller costs per unit) and sometimes quality reasons.
Therefore, we need to forecast the future orders of our clients to have
the right volumes of the right product, at the right location, at the
right moment in time.
12
Balance Demand and Supply
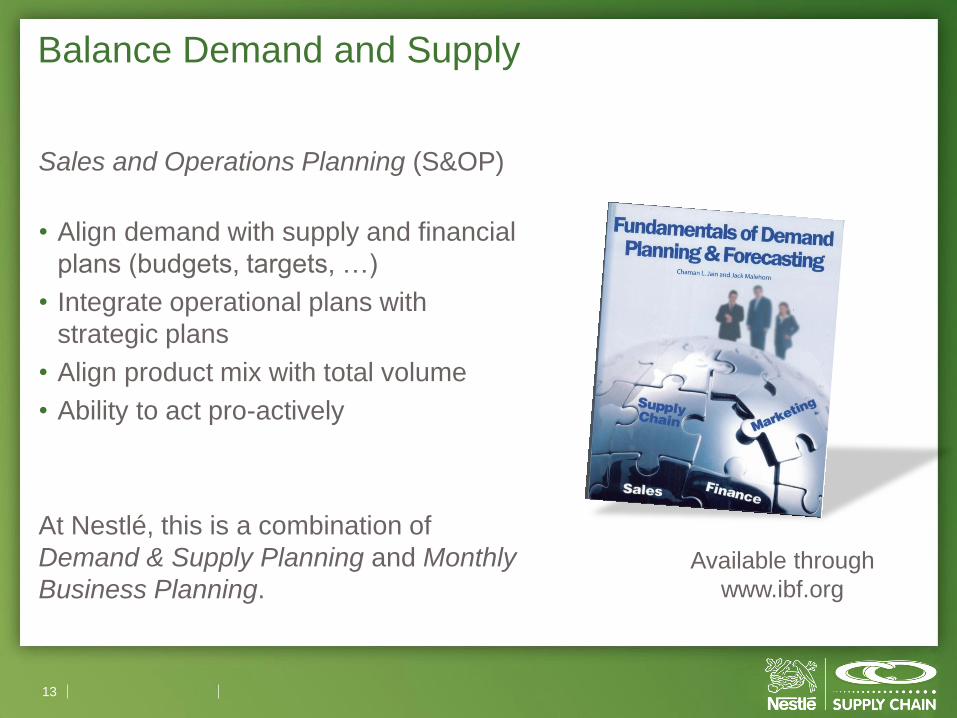
Sales and Operations Planning (S&OP)
• Align demand with supply and financial
plans (budgets, targets, …)
• Integrate operational plans with
strategic plans
• Align product mix with total volume
• Ability to act pro-actively
At Nestlé, this is a combination of
Demand & Supply Planning and Monthly
Business Planning.
13
Available through
www.ibf.org
Forecasting: Judgmental vs. Statistical
There are basically two ways to make forecasts about future volumes
of our products:
• Judgmentally (manually, subjectively, …)
• Statistically
Research shows that statistical forecasts, based on adequate
historical data, can perform better. Particularly for low volatile
products.
Judgment will always be necessary, but it needs to be used wisely.
See this research from Robert Fildes et al.
14
Six Truths about Forecasting
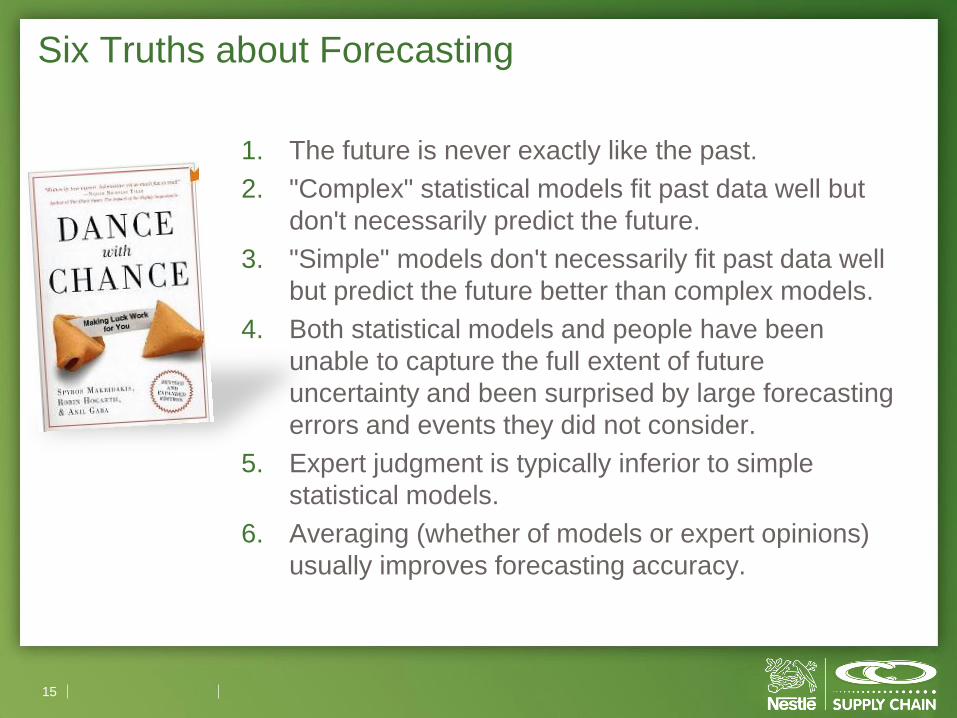
1. The future is never exactly like the past.
2. "Complex" statistical models fit past data well but
don't necessarily predict the future.
3. "Simple" models don't necessarily fit past data well
but predict the future better than complex models.
4. Both statistical models and people have been
unable to capture the full extent of future
uncertainty and been surprised by large forecasting
errors and events they did not consider.
5. Expert judgment is typically inferior to simple
statistical models.
6. Averaging (whether of models or expert opinions)
usually improves forecasting accuracy.
15
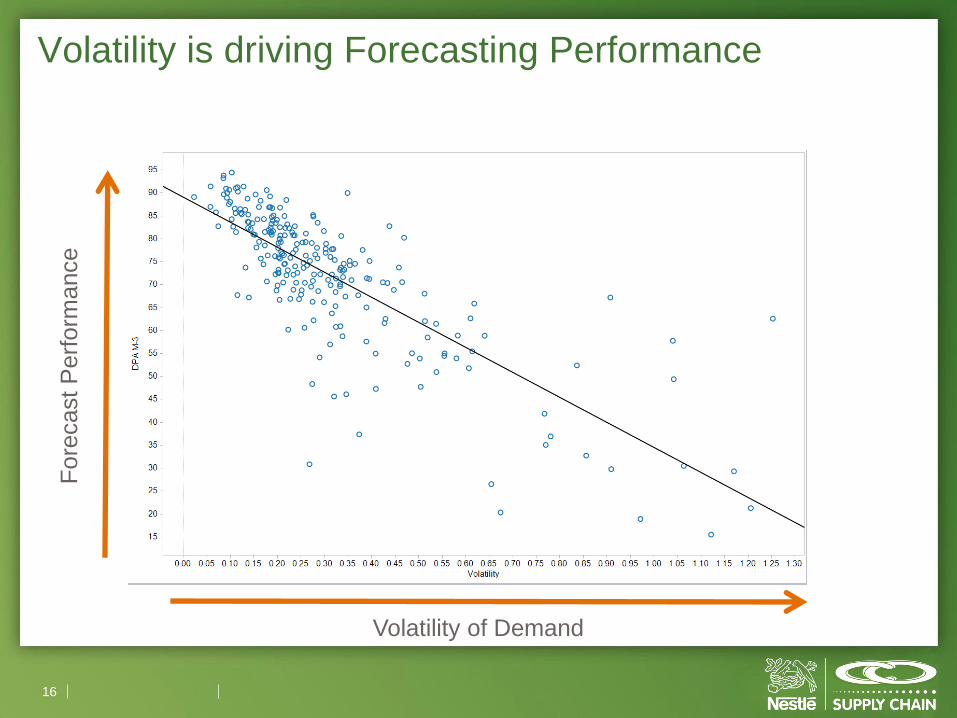
Volatility is driving Forecasting Performance
16
Fore
cast
Perf
orm
ance
Volatility of Demand
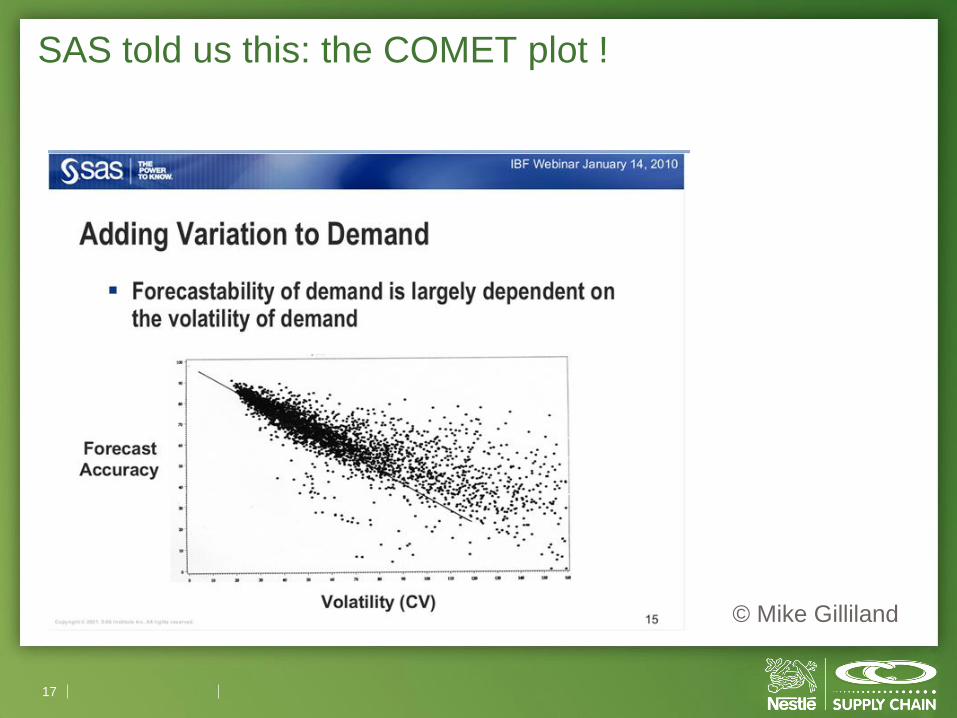
SAS told us this: the COMET plot !
17
© Mike Gilliland
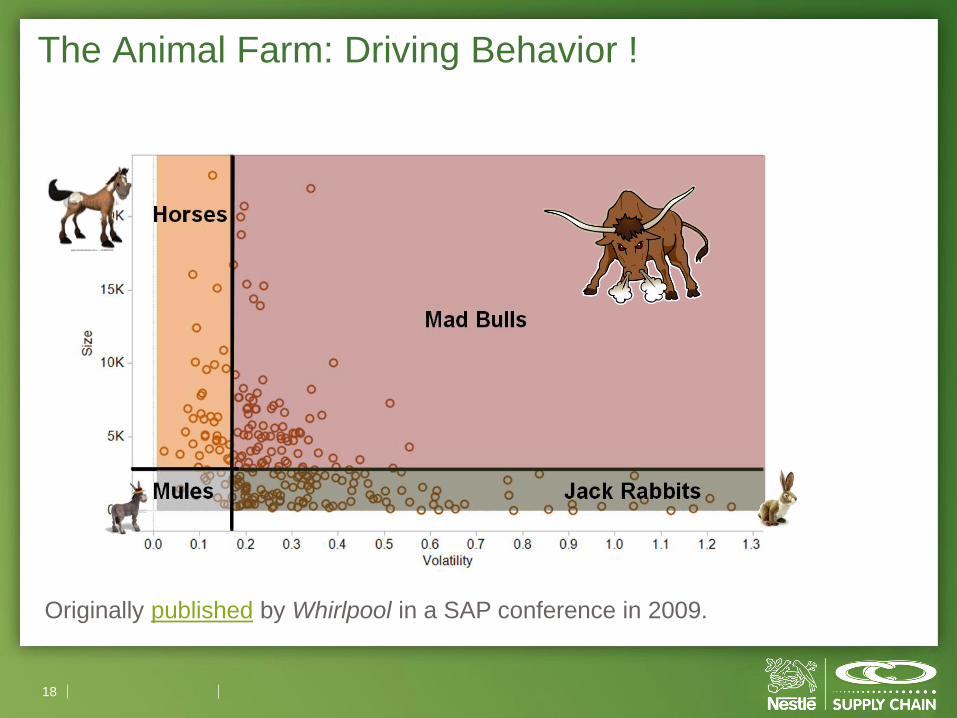
The Animal Farm: Driving Behavior !
18
Originally published by Whirlpool in a SAP conference in 2009.
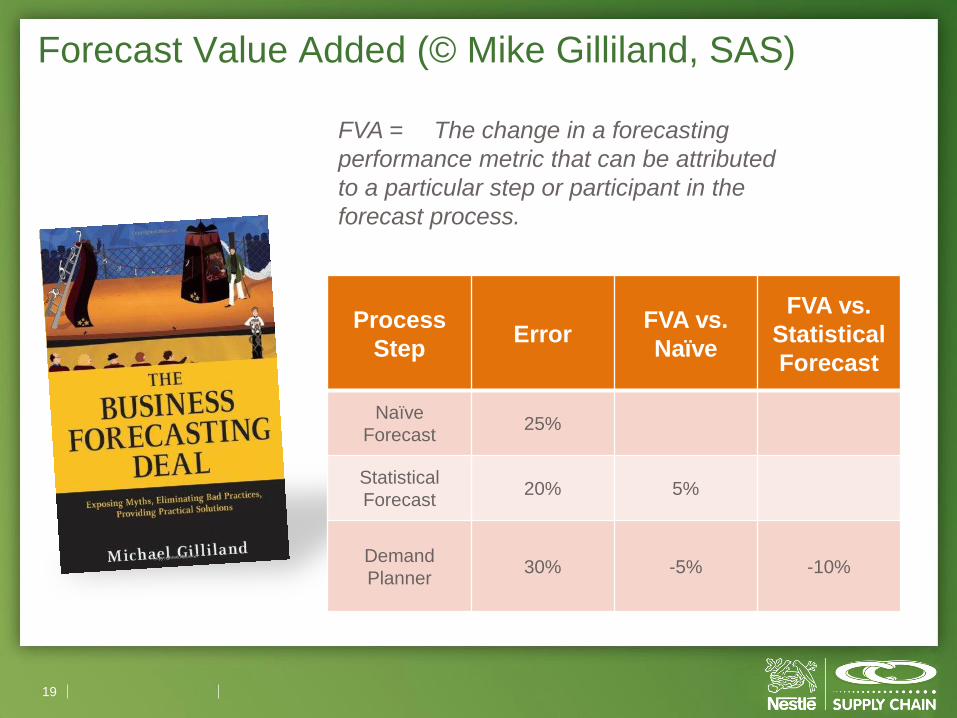
Forecast Value Added (© Mike Gilliland, SAS)
19
Process
Step Error
FVA vs.
Naïve
FVA vs.
Statistical
Forecast
Naïve
Forecast 25%
Statistical
Forecast 20% 5%
Demand
Planner 30% -5% -10%
FVA = The change in a forecasting
performance metric that can be attributed
to a particular step or participant in the
forecast process.
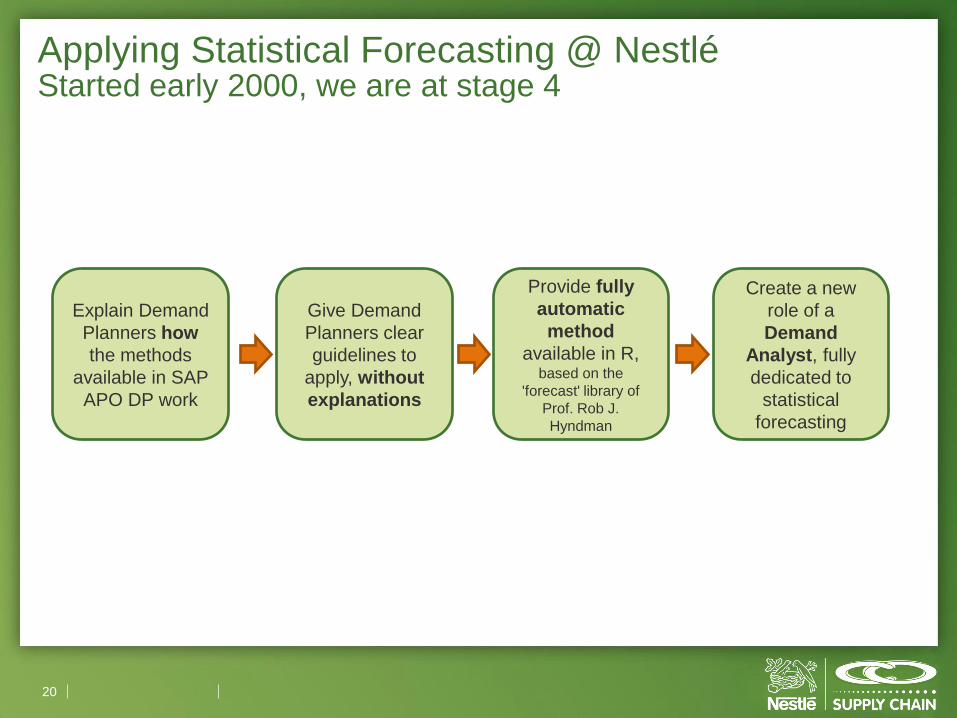
Applying Statistical Forecasting @ Nestlé Started early 2000, we are at stage 4
20
Explain Demand
Planners how
the methods
available in SAP
APO DP work
Give Demand
Planners clear
guidelines to
apply, without
explanations
Provide fully
automatic
method
available in R, based on the
'forecast' library of
Prof. Rob J.
Hyndman
Create a new
role of a
Demand
Analyst, fully
dedicated to
statistical
forecasting
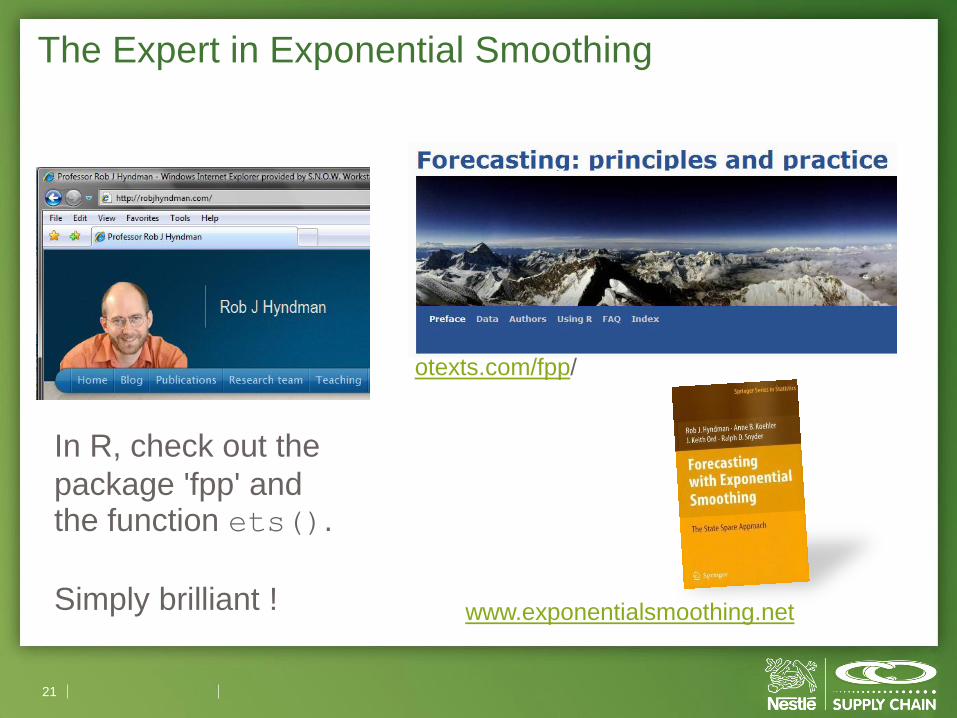
The Expert in Exponential Smoothing
21
In R, check out the
package 'fpp' and the function ets().
Simply brilliant !
otexts.com/fpp/
www.exponentialsmoothing.net
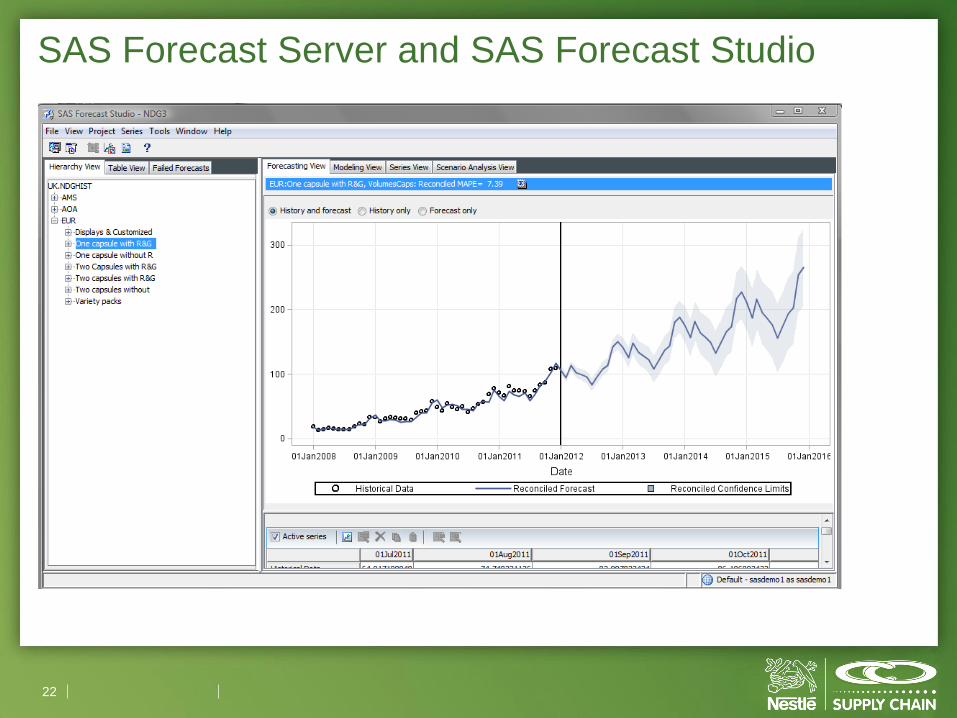
SAS Forecast Server and SAS Forecast Studio
22
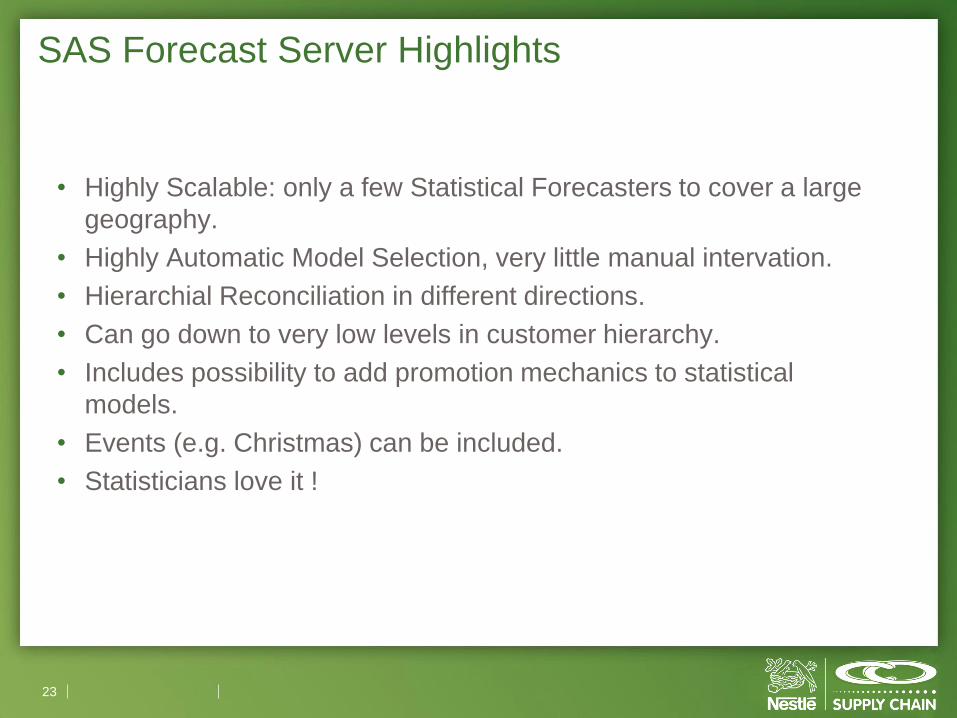
SAS Forecast Server Highlights
• Highly Scalable: only a few Statistical Forecasters to cover a large
geography.
• Highly Automatic Model Selection, very little manual intervation.
• Hierarchial Reconciliation in different directions.
• Can go down to very low levels in customer hierarchy.
• Includes possibility to add promotion mechanics to statistical
models.
• Events (e.g. Christmas) can be included.
• Statisticians love it !
23
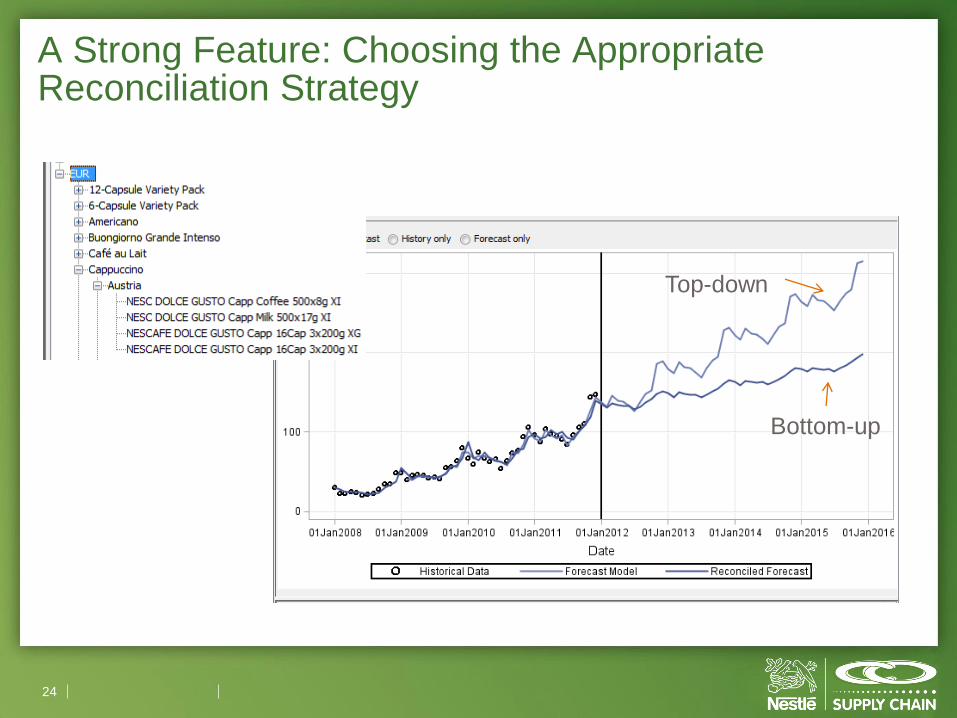
A Strong Feature: Choosing the Appropriate Reconciliation Strategy
24
Bottom-up
Top-down
Fresh Results from one of our MArkets
• We use SAS Forecast Studio to produce forecasts, using default
paratemers (e.g. ARIMA and ESM, minimizing MAPE, no hold-out
sample, …), and 3 years of uncleaned order history.
• Hierarchy:
Market -> Category -> BaseItem -> Customer
• Focus is on accuracy on the Baseitem level. We test middle-out
Baseitem versus bottom-up from Customer.
• Metric:
our Nestlé Demand Plan performance indicators simulated for
August 2012 to January 2013, error measured on level Baseitem,
time-aggregated for 6 months, weighted, lag one and three month.
Compared with the performance of the planners in the market.
25
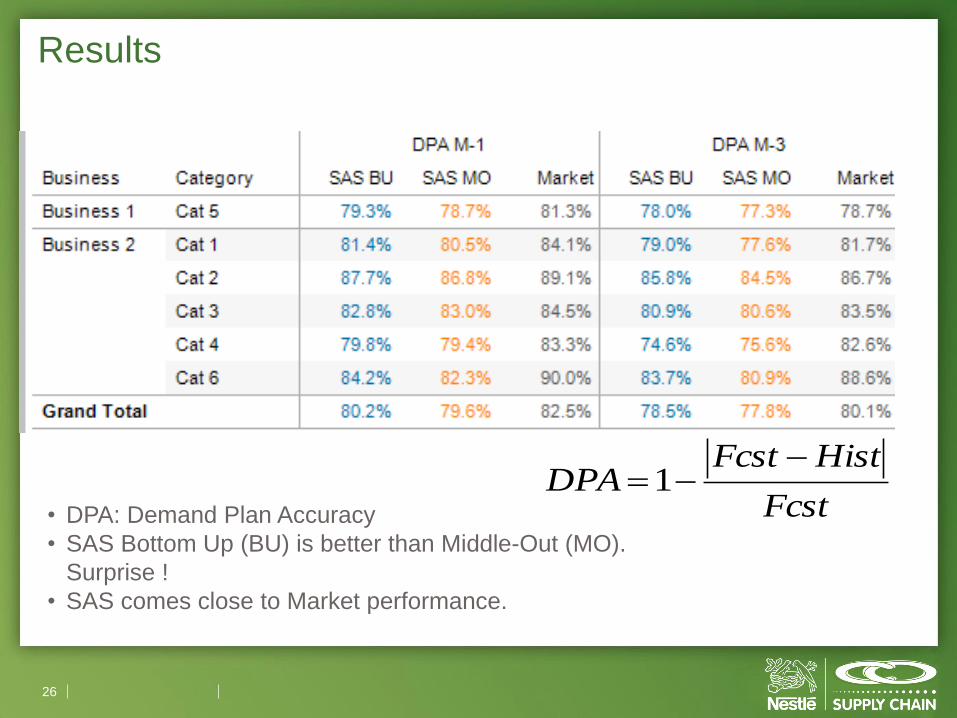
Results
26
• DPA: Demand Plan Accuracy
• SAS Bottom Up (BU) is better than Middle-Out (MO).
Surprise !
• SAS comes close to Market performance.
Fcst
HistFcstDPA
1
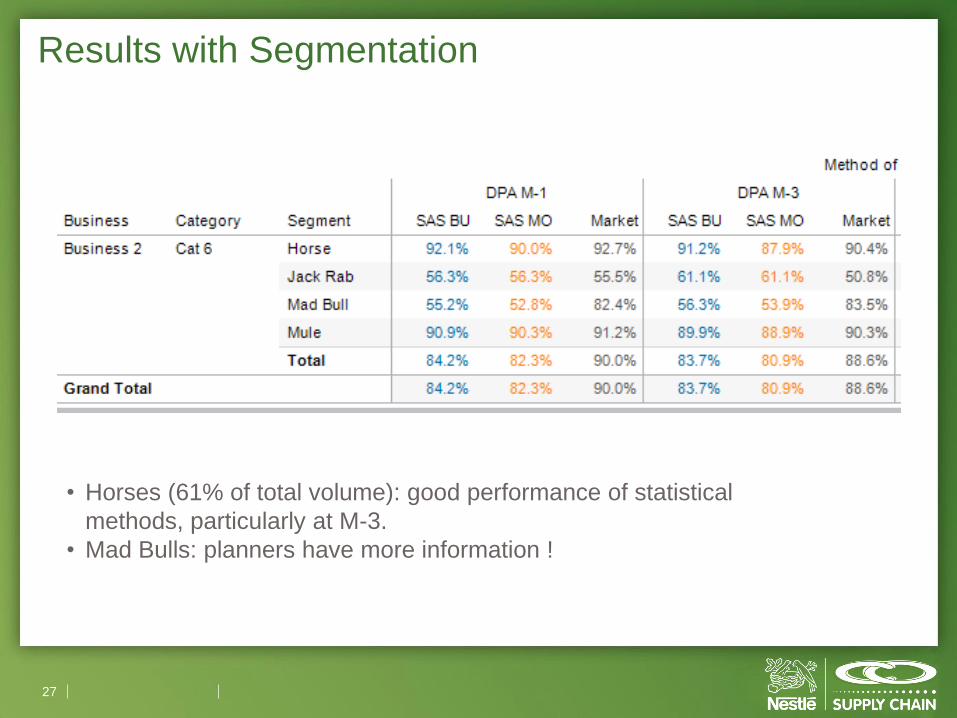
Results with Segmentation
27
• Horses (61% of total volume): good performance of statistical
methods, particularly at M-3.
• Mad Bulls: planners have more information !
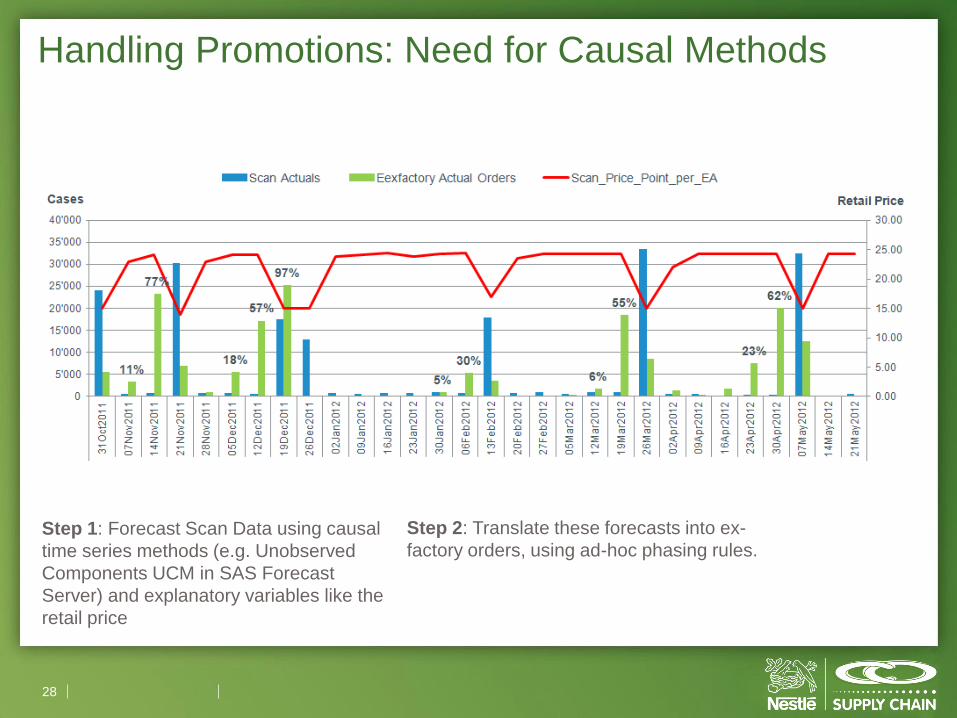
Handling Promotions: Need for Causal Methods
28
Step 1: Forecast Scan Data using causal
time series methods (e.g. Unobserved
Components UCM in SAS Forecast
Server) and explanatory variables like the
retail price
Step 2: Translate these forecasts into ex-
factory orders, using ad-hoc phasing rules.
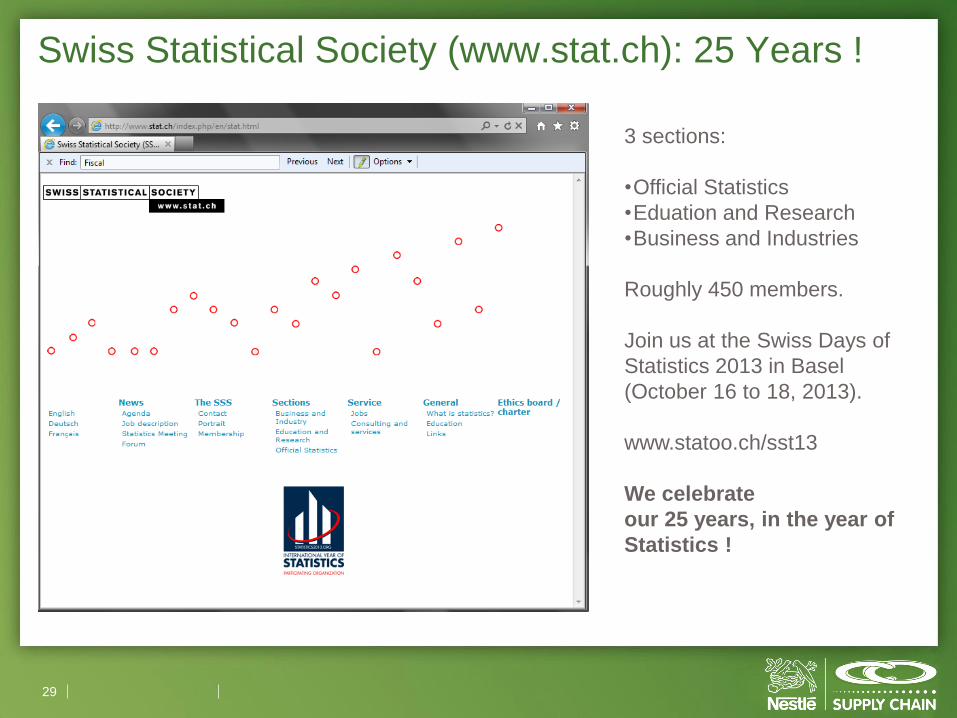
Swiss Statistical Society (www.stat.ch): 25 Years !
29
3 sections:
•Official Statistics
•Eduation and Research
•Business and Industries
Roughly 450 members.
Join us at the Swiss Days of
Statistics 2013 in Basel
(October 16 to 18, 2013).
www.statoo.ch/sst13
We celebrate
our 25 years, in the year of
Statistics !

Thank You !
30