Embed Size (px)
Citation preview
Chair of Mining Engineering and Mineral Economics
Master's Thesis
Raw Material's Production Data:
An Analysis of International Data
Collections and Their Applications
Marie-Theres Kügerl, BSc BSc
February 2020
Raw Material’s Production Data Page I
Declaration of Authorship
Raw Material’s Production Data Page II
Preface, Dedication, Acknowledgement
This thesis was completed as the final part of my Master’s degree “Mining
Engineering” at the Chair of Mining Engineering and Mineral Economics, at the
Montanuniversitaet Leoben.
First of all, I thank Vice Rector Univ.-Prof. Peter Moser, from Montanuniversitaet
Leoben, for his support and guidance during the preparation of this thesis.
The contributions of Dipl.-Ing. Christian Reichl, from the Austrian Federal Ministry
of Sustainability and Tourism, Univ.-Prof. Fridolin Krausmann, Mrs Teresa J.
Brown, Mineral Commodity Geologist, BGS, and Mr Michael Magyar, USGS, were
of great help and I would like to thank them for their inputs.
Last but not least, I want to thank Mr Andreas Okorn, and my parents Marina and
Johannes Kügerl, for their revisions and continuous support.
Raw Material’s Production Data Page III
Abstract
This Master’s Thesis is divided into three parts. First, three international data
collections (World Mining Data, British Geological Survey, United States
Geological Survey) of raw material’s production data, and one collection on
European level (Eurostat) are evaluated. The assessment includes commodities
reported, countries covered, additional information on the commodity, as well as
strengths and weaknesses of each report.
Secondly, applications using these reports are discussed, showing numerous
studies and policy measurements relying on the figures by the data collections.
This includes the criticality study of the European Union, Material Flow Analysis,
and Sustainable Development Goals.
Thirdly, two power plants are compared in terms of material requirements for their
construction – a combined heat and power plant and a wind farm. The amount of
materials used per kilowatt hour of electricity production is assessed, as well as
their recyclability and criticality for the EU.
Raw Material’s Production Data Page IV
Zusammenfassung
Diese Diplomarbeit ist in drei Teile gegliedert.
Zunächst werden drei internationale Datensammlungen (World Mining Data,
British Geological Survey, United States Geological Survey) von Produktionsdaten
von Rohstoffen und eine Sammlung auf europäischer Ebene (Eurostat)
ausgewertet. Die Bewertung umfasst die erfassten Rohstoffe, die berücksichtigten
Länder, zusätzliche Informationen über den jeweiligen Rohstoff, sowie die Stärken
und Schwächen der einzelnen Berichte.
Zweitens werden Anwendungen, die diese Berichte nutzen, diskutiert, wobei
zahlreiche Studien und politische Maßnahmen gezeigt werden, die sich auf die
Zahlen der Datensammlungen stützen. Dazu gehören die Kritizitätsstudie der
Europäischen Union, Materialflussanalysen und die nachhaltigen
Entwicklungsziele.
Drittens werden zwei Kraftwerke in Bezug auf den Materialbedarf für ihre
Konstruktion miteinander verglichen - ein Heizkraftwerk und ein Windpark. Die
Menge der verwendeten Materialien pro Kilowattstunde Stromerzeugung wird
ebenso bewertet, wie ihre Recyclingfähigkeit und ihre Kritizität für die EU.
Raw Material’s Production Data Page V
Table of Contents
Declaration of Authorship ........................................................................................ I
Preface, Dedication, Acknowledgement .................................................................. I
Abstract ................................................................................................................. III
Zusammenfassung ................................................................................................ IV
Table of Contents ................................................................................................... V
1 Introduction ................................................................................................. 1
2 Collections of Raw Material’s Production Data ........................................... 3
2.1 World Mining Data ....................................................................................... 3
2.2 World Mineral Production ............................................................................ 7
2.3 Minerals Yearbook ...................................................................................... 9
2.4 Eurostat ..................................................................................................... 12
2.5 Comparison ............................................................................................... 17
3 Applications ............................................................................................... 38
3.1 European Commission List of Critical Raw Materials ................................ 38
3.1.1 Evaluation of criticality ............................................................................... 40
3.2 Circular Economy ...................................................................................... 44
3.3 Global Material Flow .................................................................................. 49
3.3.1 Demand Drivers ........................................................................................ 55
3.4 Sustainable Development Goals ............................................................... 60
4 Raw Material’s Consumption in Light of New Technologies ...................... 71
4.1 Thermal Power Plant ................................................................................. 71
4.2 Wind Turbine ............................................................................................. 76
4.3 Comparison ............................................................................................... 84
5 Conclusion ................................................................................................ 90
6 Bibliography .............................................................................................. 95
7 List of Figures.......................................................................................... 100
8 List of Tables ........................................................................................... 102
9 List of Equations ...................................................................................... 103
10 List of Abbreviations ................................................................................ 104
Annex ……………………………………………………………………………………VI
Raw Material’s Production Data Page 1
1 Introduction
Raw materials are an integral part of our everyday lives. They influence our living
standards – starting at the “simple roof over our heads” to cars we drive and the
smartphones we own. They influence the industry providing jobs and driving our
economy, they affect our health and well-being by ensuring clean drinking water, and
they are vital to our future and the future of our planet helping us to expand renewable
energy systems, build electric cars, etc.
“Raw materials are not an exclusive concern of the mining industry, they are the
concern of all of us.” (Pesonen, 2019)
In order to evaluate the amount of raw materials we need, recordings of the amounts
of raw materials mined are of vital importance. Production of raw materials influences
company planning, not only by companies involved in the mining sector, but also by
downstream companies depending on those materials. Policy making also depends
on availability and demand of raw materials, such as the Circular Economy Initiative
by the European Union.
There are currently three major providers of data on raw materials production on an
international level that are publicly available – the British Geological Survey, the United
States Geological Survey, and the Austrian Federal Ministry on Tourism and
Sustainability. The first step of this thesis is a comparison of these three providers
evaluating what data they offer (raw materials and countries reported, metal content
vs ore, additional information), how the data is collected, and if there are any
differences. Moreover, an evaluation of strengths and weaknesses is conducted, and
if possible, a guideline on how and when to use which provider shall be proposed. To
focus more on the European level also Eurostat data is included which is not as
expansive, in terms of raw materials and countries evaluated, but does also include
different data sets such as import and export, or domestic consumption figures. Is this
a valuable addition covering “blind spots” of the other providers, does it have different
applications, where are the similarities?
Raw Material’s Production Data Page 2
The second part of this thesis is a literature review on applications of the data provided
by the institutions evaluated in the first part. This includes studies on (global) material
flows, and demand drivers, but also policies, such as the circular economy package by
the EU, the critical raw materials list, or the Sustainable Development Goals are
considered. The aim of this part is to show different applications of raw material’s
production data as well as its importance for policy makers, and to see whether there
are any differences in data reported vs data required.
Thirdly, the data is used to conduct a comparison of two different electric energy
production methods, wind power farms and thermal power plants. This comparison
shall evaluate “new vs old technology” in terms of material input required to build such
a power plant also looking into the type of materials used, e.g. materials considered
critical by the European Union, or materials connected to issues such as conflicts,
environmental problems, etc. This part has the purpose of showing that renewable
energy sources still rely heavily on the input of primary raw materials, maybe even
more than conventional energy production methods. It shall also show possible issues
connected to the materials used for renewable energy production, such as availability
of materials, dependency on certain countries, and recyclability.
Note: In this thesis figures are stated using “.” as decimal points and “,” as thousands
separators.
Raw Material’s Production Data Page 3
2 Collections of Raw Material’s Production Data
In this thesis the three main publications of mineral raw material’s world production
data are evaluated in detail regarding data provided, method of data collection and
their advantages and disadvantages compared to each other. Only publications that
are available for free were chosen and that cover the broadest selection of countries
and mineral raw materials.
These publications are the World Mining Data (WMD) published by the Federal Ministry
Republic of Austria Sustainability and Tourism, the World Mineral Production by the
British Geological Survey (BGS) and the Minerals Yearbook by the United States
Geological Survey (USGS).
Data provided by Eurostat in their material flow accounts for European production of
raw materials is evaluated and compared to the other statistics as well in order to have
a comparison to a slightly different type of data collection and evaluate its advantages
and disadvantages.
2.1 World Mining Data
World Mining Data (WMD) is an annual publication by the Federal Ministry Republic of
Austria Sustainability and Tourism which includes production figures of 63 mineral
commodities from 168 countries. It is usually delayed two years, meaning the most
current data in the publication of the year 2019 is from 2017. It is the “youngest”
publication of the three global data providers, with 34 reports by 2019.
Raw Material’s Production Data Page 4
The commodity figures are grouped by:
• Continents
• World regions (according to IIASA)
• Development status (according to OECD definitions) of producer countries
• Per capita income of producer countries
• Country groups and economic blocks (e.g. EU or BRICS countries)
• Political stability using the Worldwide Governance Indicators of producer
countries
• Groups of commodities
• Concentration of producer countries using the Herfindahl-Hirschman Index
(HHI)
(Reichl et al., 2019)
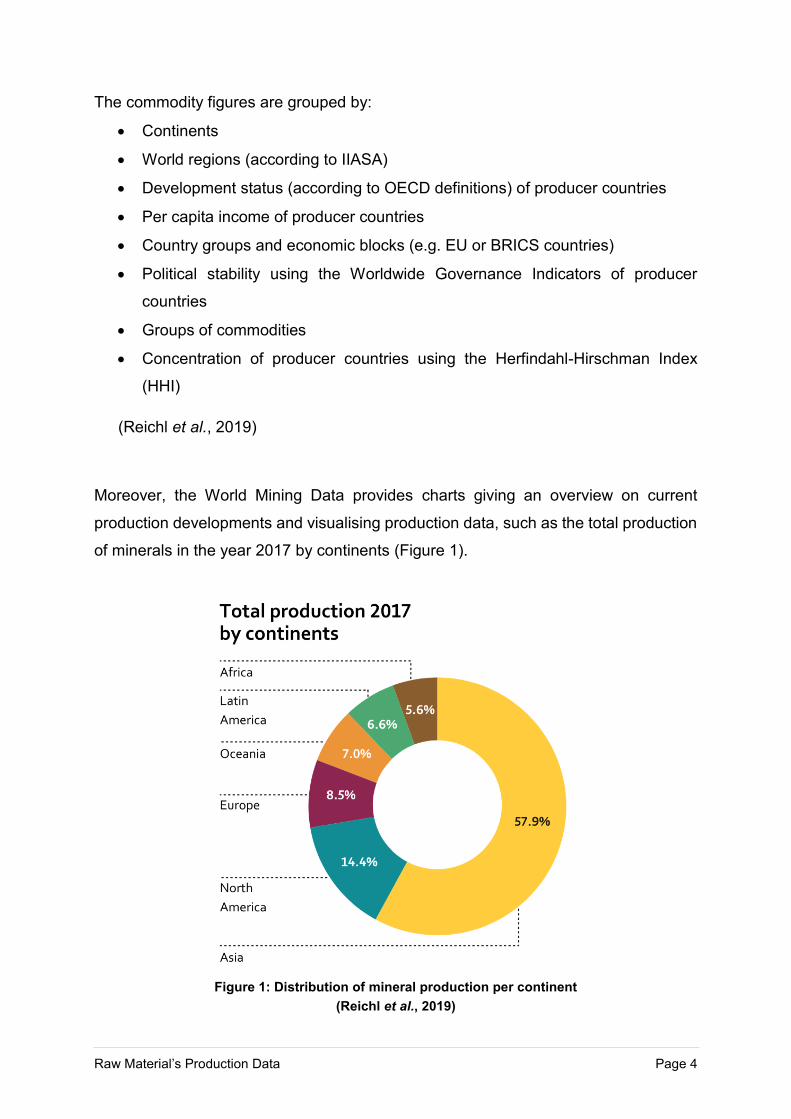
Moreover, the World Mining Data provides charts giving an overview on current
production developments and visualising production data, such as the total production
of minerals in the year 2017 by continents (Figure 1).
Figure 1: Distribution of mineral production per continent
(Reichl et al., 2019)
Raw Material’s Production Data Page 5
The 68 commodities are organised in five groups according to geological principles by
Univ.Prof. Dr. Leopold Weber, former publisher of the World Mining data. The only
exception to this is coal; here also the utilisation is considered (e.g. coking coal).
The groups and contained minerals are:
• Iron and Ferro-Alloy Metals
o Iron, Chromium, Cobalt, Manganese, Molybdenum, Nickel, Niobium,
Tantalum, Titianium, Tungsten, Vanadium
• Non-Ferrous Metals
o Aluminium, Antimony, Arsenic, Bauxite, Bismuth, Cadmium, Copper,
Gallium, Germanium, Lead, Lithium, Mercury, Rare Earth Minerals,
Rhenium, Selenium, Tellurium, Tin, Zinc
• Precious Metals
o Gold, Platinum-Group Metals (Palladium, Platinum, Rhodium), Silver
• Industrial Minerals
o Asbestos, Baryte, Bentonite, Boron Minerals, Diamond (Gem/Industrial),
Diatomite, Feldspar, Fluorspar, Graphite, Gypsum and Anhydrite, Kaolin
(China-Clay), Magnesite, Perlite, Phosphates (incl. Guano), Potash, Salt,
Sulfur, Talc (incl. Steatite and Pyrophyllite), Vermiculite, Zircon
• Mineral Fuels
o Steam Coal (incl. Anthracite and Sub-Bituminous Coal), Coking Coal,
Lignite, Natural Gas, Crude Petroleum, Oil Sands, Oil Shales, Uranium
(Reichl et al., 2019)
The metal figures usually indicate the contained metal content not the ore in order to
ensure a global comparability of the amounts. Due to the widely varying metal contents
a comparison of the mined ore would be pointless, e.g. iron ore in Carajás, Brazil (Vale)
has an iron content of 67%, in Kiruna, Sweden (LKAB) approx. 48%. (Vale, 2017;
LKAB, 2017)
As the output changes regularly due to changes in efficiency of the processing it is
favourable to use the content of traded concentrate, or for example the content is
calculated using the amount of mined ore multiplied by the metal content provided by
mining companies.
Raw Material’s Production Data Page 6
The authors collect data using different methods. On the one hand questionnaires are
sent out globally to Austrian embassies that distribute it among responsible authorities.
The response rate is between 20 to 25%. Moreover, companies are consulted,
especially in areas with a low number of producers (e.g. Latin America).
Other sources are the central bank, study groups and other data providers, such as
BGS and USGS. The ministry also cooperates with World Mining Congress which is
providing essential data of their members.
Unfortunately, there are some countries and commodities where little or no data is
available. Lithium production, for example, is calculated from the products sold on the
world market. Also, Cadmium is a problematic mineral where mainly export numbers
are used to estimate the production.
A major strength of World Mining Data is the section on political stability, development
status, etc. of producer countries, as well as the concentration of producer countries
showing economic interdependencies.
World Mining Data is publicly available as PDF- and Excel-files that can be downloaded
from the designated website. The Excel-files include all data available between 1984
and 2017.
(Information on data collection and reporting kindly provided by Dipl.-Ing. Christian
Reichl, Federal Ministry of Sustainability and Tourism)
Raw Material’s Production Data Page 7
2.2 World Mineral Production
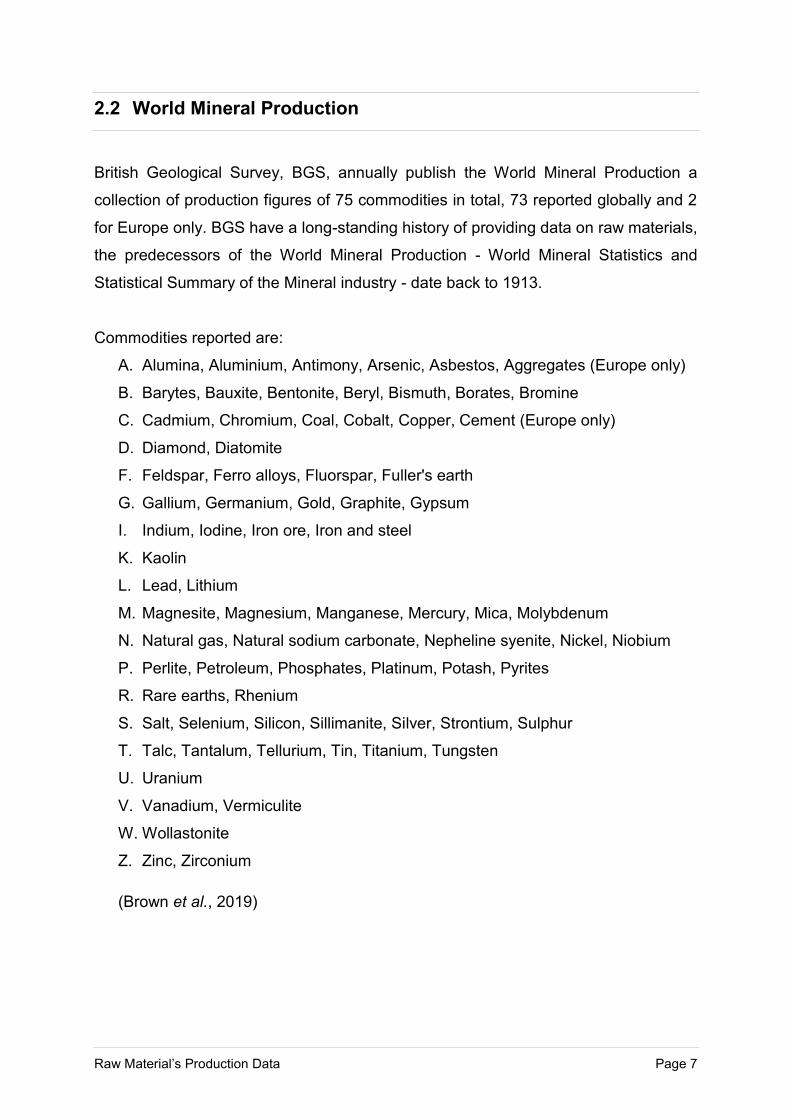
British Geological Survey, BGS, annually publish the World Mineral Production a
collection of production figures of 75 commodities in total, 73 reported globally and 2
for Europe only. BGS have a long-standing history of providing data on raw materials,
the predecessors of the World Mineral Production - World Mineral Statistics and
Statistical Summary of the Mineral industry - date back to 1913.
Commodities reported are:
A. Alumina, Aluminium, Antimony, Arsenic, Asbestos, Aggregates (Europe only)
B. Barytes, Bauxite, Bentonite, Beryl, Bismuth, Borates, Bromine
C. Cadmium, Chromium, Coal, Cobalt, Copper, Cement (Europe only)
D. Diamond, Diatomite
F. Feldspar, Ferro alloys, Fluorspar, Fuller's earth
G. Gallium, Germanium, Gold, Graphite, Gypsum
I. Indium, Iodine, Iron ore, Iron and steel
K. Kaolin
L. Lead, Lithium
M. Magnesite, Magnesium, Manganese, Mercury, Mica, Molybdenum
N. Natural gas, Natural sodium carbonate, Nepheline syenite, Nickel, Niobium
P. Perlite, Petroleum, Phosphates, Platinum, Potash, Pyrites
R. Rare earths, Rhenium
S. Salt, Selenium, Silicon, Sillimanite, Silver, Strontium, Sulphur
T. Talc, Tantalum, Tellurium, Tin, Titanium, Tungsten
U. Uranium
V. Vanadium, Vermiculite
W. Wollastonite
Z. Zinc, Zirconium
(Brown et al., 2019)
Raw Material’s Production Data Page 8
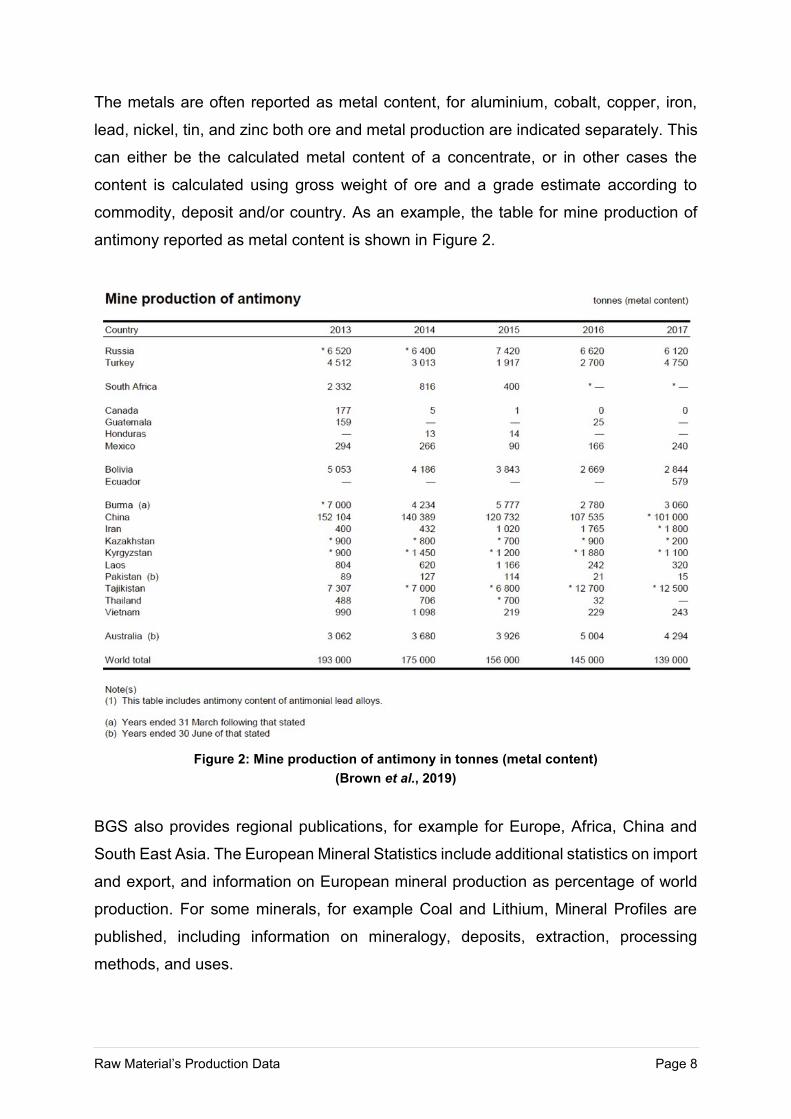
The metals are often reported as metal content, for aluminium, cobalt, copper, iron,
lead, nickel, tin, and zinc both ore and metal production are indicated separately. This
can either be the calculated metal content of a concentrate, or in other cases the
content is calculated using gross weight of ore and a grade estimate according to
commodity, deposit and/or country. As an example, the table for mine production of
antimony reported as metal content is shown in Figure 2.
Figure 2: Mine production of antimony in tonnes (metal content)
(Brown et al., 2019)
BGS also provides regional publications, for example for Europe, Africa, China and
South East Asia. The European Mineral Statistics include additional statistics on import
and export, and information on European mineral production as percentage of world
production. For some minerals, for example Coal and Lithium, Mineral Profiles are
published, including information on mineralogy, deposits, extraction, processing
methods, and uses.
Raw Material’s Production Data Page 9
All publications can be downloaded from BGS homepage as PDF-files and additionally
production, export and import data from 1970-2017 can be downloaded as Excel-files
in steps of 10 years maximum.
Considering data collection, BGS uses various methods. As a first step questionnaires
are sent out individualised for each country contacted. Moreover, internet research is
conducted, consulting websites of government organisations and companies and also
other publications are consulted. Previously, BGS was supported by UK Embassies
providing data of their country, but this is not very common anymore.
(Information on data collection and reporting kindly provided by Mrs Teresa J. Brown,
Mineral Commodity Geologist, BGS)
2.3 Minerals Yearbook
The Minerals Yearbook is a publication by United States Geological Survey (USGS).
It consists of three volumes:
• Volume I: Metals and Minerals
• Volume II: Area Reports, Domestic
• Volume III: Area Reports, International
Volume I on metals and minerals includes individual reports for 90 commodities that
are published annually. These reports include an extensive review of consumption,
prices and trade with focus on the United States. They also include a world review
analysing industry and world market structure, as well as an outlook considering future
demand and applications.
Statistics given in Volume I again focus on the USA, providing imported and exported
amounts, apparent consumption, and price development. Production figures document
global production. (U.S. Geological Survey, 2019e)
Raw Material’s Production Data Page 10
Commodities reported in Volume I are:
A. Manufactured Abrasives (incl. Fused Aluminium Oxide, Corundum, Silicon),
Aggregates (Construction Sand and Gravel, Crushed Stone), Bauxite and
Alumina, Aluminium, Antimony, Arsenic, Asbestos
B. Barite, Bentonite (Clay Minerals) Beryllium, Bismuth, Boron, Bromine
C. Cadmium, Cement, Chromium, Clay Minerals (incl. Bentonite, Fuller’s Earth,
Kaolin), Cobalt, Niobium (Columbium), Copper, Crushed Stone (incl. Calcium
Carbonate, Granite, Limestone, Marble, Sandstone, Slate, Traprock)
D. Diamond (industrial), Diatomite, Dimension Stone (incl. Granite, Limestone,
Marble, Sandstone, Slate)
F. Feldspar (incl. Nepheline Syenite), Ferro-alloys, Fluorspar
G. Gallium, Garnet (industrial), Gemstones (incl. Shell), Germanium, Gold,
Graphite, Gypsum
H. Hafnium Helium
I. Iodine, Iron Ore, Iron and Steel, Iron and Steel Scrap, Iron and Steel Slag, Iron
Oxide Pigments
K. Kyanite and Related Minerals (incl. Synthetic Mullite)
L. Lead, Lime, Lithium
M. Magnesium, Magnesium Compounds, Manganese, Mercury, Mica,
Molybdenum
N. Nickel, Niobium, Nitrogen
P. Peat, Perlite, Phosphate Rock, Platinum-Group-Metals (Iridium, Osmium,
Palladium, Rhodium, Ruthenium), Potash, Pumice and Pummicite
R. Rare Earths (incl. Yttrium), Rhenium
S. Salt, Construction Sand and Gravel, Selenium, Silica (incl. Quartz Crystal,
Industrial Sand and Gravel, Tripoli), Silicon, Silver, Soda Ash, Strontium, Sulfur
T. Talc (incl. Pyrophyllite), Tantalum, Tellurium, Thorium, Tin, Titanium (incl.
Ilmenite, Rutil), Tungsten
V. Vanadium, Vermiculite
W. Wollastonite
Z. Zeolites, Zinc, Zirconium
(U.S. Geological Survey, 2019a)
Raw Material’s Production Data Page 11
However, there are exceptions; some of the 90 commodities are only reported for the
USA:
Manufactured Abrasives, Construction Sand and Gravel, Crushed Stone, Dimension
Stone, Industrial Garnet, Helium, Iron and Steel Scrap, Iron and Steel Slag,
Wollastonite (no production or trade figures at all), Zeolites
USGS usually reports metal content to enable a comparison between mines, plants,
and facilities at various stages of the supply chain. The value reported is adapted to
industry standards.
The main method of data collection is via survey forms, a Mineral Questionnaire,
developed for each country according to its current mineral industry.
Volume II focuses on statistical data and information for the United States on a State-
by-State basis and is therefore not relevant for this analysis.
Volume III indicates mineral production, trade, policy and industry developments for
175 countries. It is possible that Volume I and Volume III provide different production
figures for one commodity. This depends on the different methods of data collection
and different sources used by the respective specialist. However, lately USGS is trying
to reconcile the numbers internally and agree on one value in order to avoid
discrepancies (this is not valid for historical data).
The Minerals Yearbook is published with a delay of three to four years. At the time of
this assessment the most current data available was from 2015 or 2016 depending on
the commodity. It has a longstanding history with the first volume published in 1932.
There is also historic data available for some commodities dating back until 1900.
More recent data is published in the so-called Mineral Commodity Summaries that are
already available for 2018. This publication focuses on the US industry and market and
is not as extensive as the Minerals Yearbook. It covers 90 minerals and materials
providing domestic production and use, imports and exports, prices, stocks, recycling
and substitutes, notable events, trends, and issues, as well as some details on world
production, resources, and reserves.
(U.S. Geological Survey, 2019a, 2019b, 2019c, 2019d, 2019e)
Raw Material’s Production Data Page 12
All publications are available online, on the USGS website.
(Information on data collection and reporting kindly provided by Mr Michael Magyar,
USGS)
2.4 Eurostat
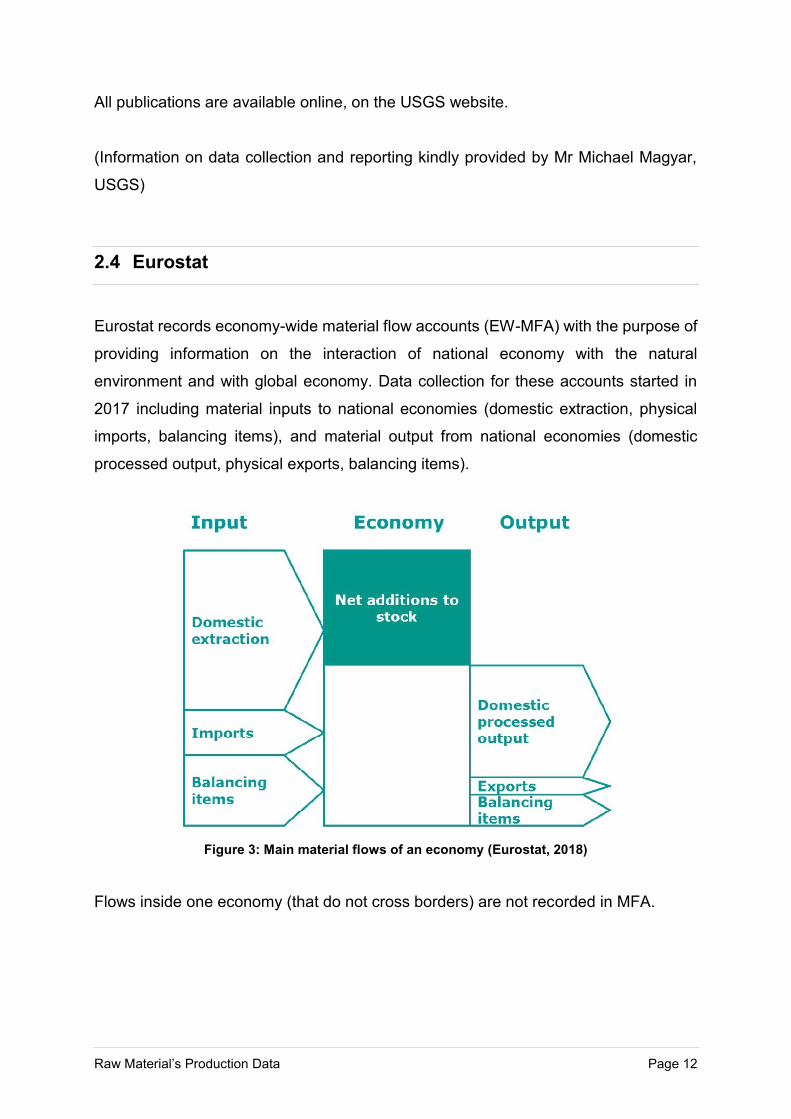
Eurostat records economy-wide material flow accounts (EW-MFA) with the purpose of
providing information on the interaction of national economy with the natural
environment and with global economy. Data collection for these accounts started in
2017 including material inputs to national economies (domestic extraction, physical
imports, balancing items), and material output from national economies (domestic
processed output, physical exports, balancing items).
Figure 3: Main material flows of an economy (Eurostat, 2018)
Flows inside one economy (that do not cross borders) are not recorded in MFA.
Raw Material’s Production Data Page 13
The EW-MFA reports a number of different material groups:
• Biomass
o Crops
▪ Cereals; Roots, tubers; Sugar crops; Pulses; Nuts; Oil-bearing
crops; Vegetables; Fruits; Fibres; Other crops (excluding fodder
crops n.e.c.)
▪ Crop residues (used), fodder crops and grazed biomass
o Wood
o Wild fish catch, aquatic plants and animals, hunting and gathering
o Live animals and animal products (excluding wild fish, aquatic plants and
animals, hunted and gathered animals)
o Products mainly from biomass
• Metal ores (gross ores)
o Iron
o Non-ferrous metal: Copper; Nickel; Lead; Zinc; Tin; Gold, silver, platinum
and other precious metals; Bauxite and other aluminium; Uranium and
thorium; Other non-ferrous metals
o Products mainly from metals
• Non-metallic minerals
o Marble, granite, sandstone, porphyry, basalt, other ornamental or
building stone (excluding slate)
o Chalk and dolomite
o Slate
o Chemical and fertiliser minerals
o Salt
o Limestone and gypsum
o Clays and kaolin
o Sand and gravel
o Other non-metallic minerals n.e.c.
o Excavated earthen materials (including soil), only if used (optional
reporting)
o Products mainly from non-metallic minerals
Raw Material’s Production Data Page 14
• Fossil energy materials/carriers
o Coal and other solid energy materials/carriers
o Liquid and gaseous energy materials/carriers
o Products mainly from fossil energy products
• Other products
• Waste for final treatment and disposal
• Domestic processed output
o Emissions to air
o Waste disposal to the environment
o Emissions to water
o Dissipative use of products
o Dissipative losses
• Balancing items: net output (= Balancing item: output side – Balancing item:
input side)
(Eurostat, 2019a)
Relevant for this assessment is the domestic extraction of metals and minerals. Here
the “run-of-mine” concept is applied, reporting extraction of ores rather than metal
content. It is measured before any separation or concentration excluding any materials
not containing wanted metals or minerals. If available, gross ores reported by the mine
operator are used. Otherwise run-of-mine amounts have to be calculated using
conversion factors. National and international statistics tend to report metal content or
concentrates, and these values are converted to gross ores by multiplying them with a
factor determined according to commodity and mine, country, and year. In case
specific data is not available a general conversion factor has to be used. These general
factors are based on annual business reports of mines calculated for each metal
individually. An issue requiring special attention is ore containing more than one metal
in order to avoid double counting. (Eurostat, 2018)
Eurostat collects data from three different sources: 1) National statistical institutes
using digital questionnaires which are mandatory since 2013. 2) EU-wide harmonised
sources of statistical data, and 3) data provided by international sources such as UN
Food and Agricultural Organisation (FAO), BGS, and USGS. (Eurostat, 2018)
Raw Material’s Production Data Page 15
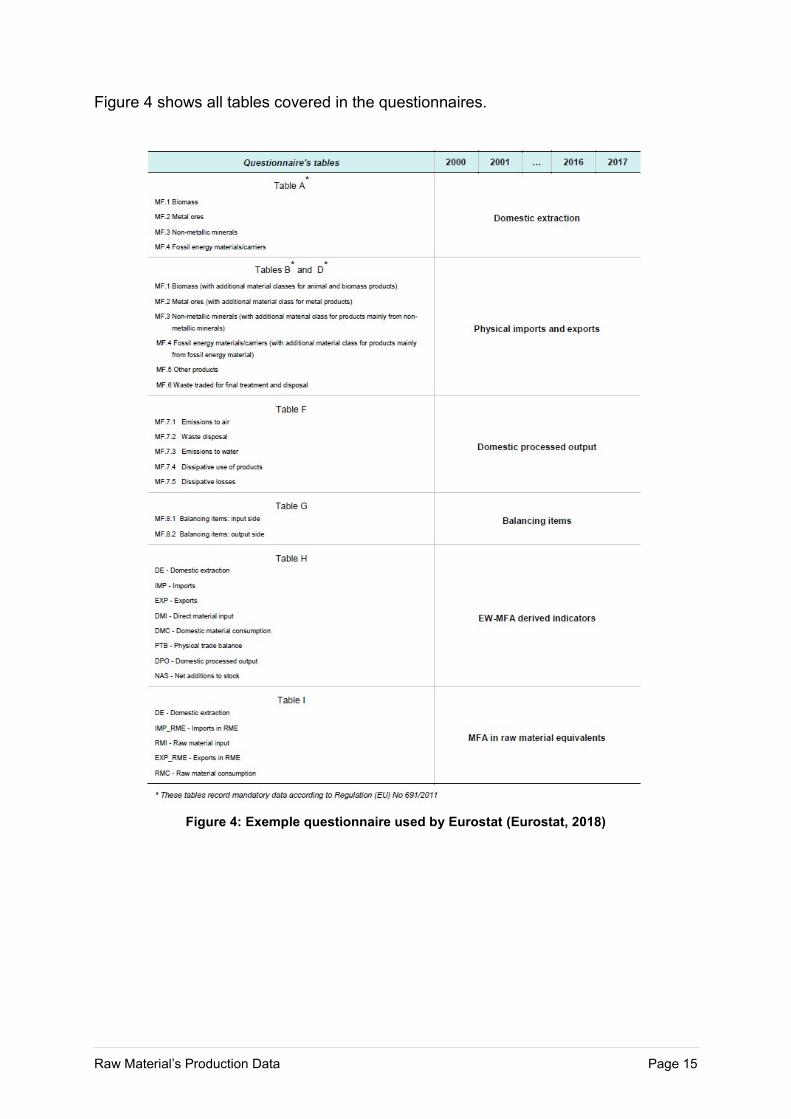
Figure 4 shows all tables covered in the questionnaires.
Figure 4: Exemple questionnaire used by Eurostat (Eurostat, 2018)
Raw Material’s Production Data Page 16
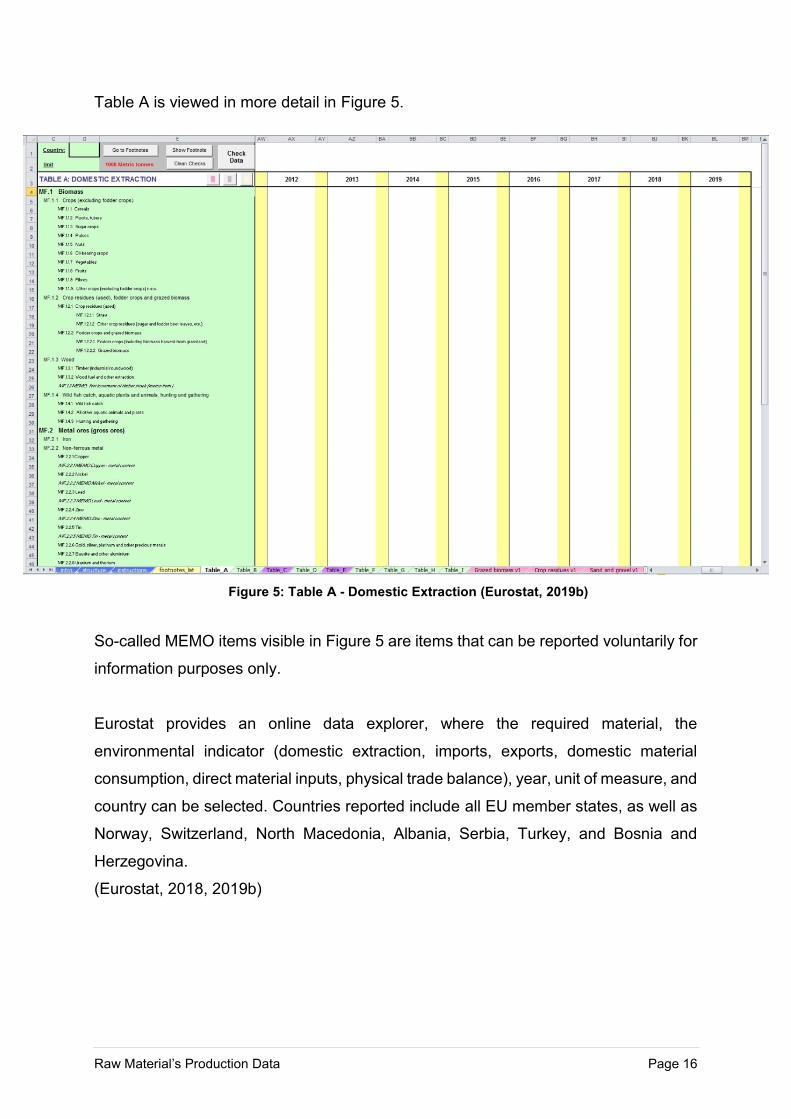
Table A is viewed in more detail in Figure 5.
So-called MEMO items visible in Figure 5 are items that can be reported voluntarily for
information purposes only.
Eurostat provides an online data explorer, where the required material, the
environmental indicator (domestic extraction, imports, exports, domestic material
consumption, direct material inputs, physical trade balance), year, unit of measure, and
country can be selected. Countries reported include all EU member states, as well as
Norway, Switzerland, North Macedonia, Albania, Serbia, Turkey, and Bosnia and
Herzegovina.
(Eurostat, 2018, 2019b)
Figure 5: Table A - Domestic Extraction (Eurostat, 2019b)
Raw Material’s Production Data Page 17
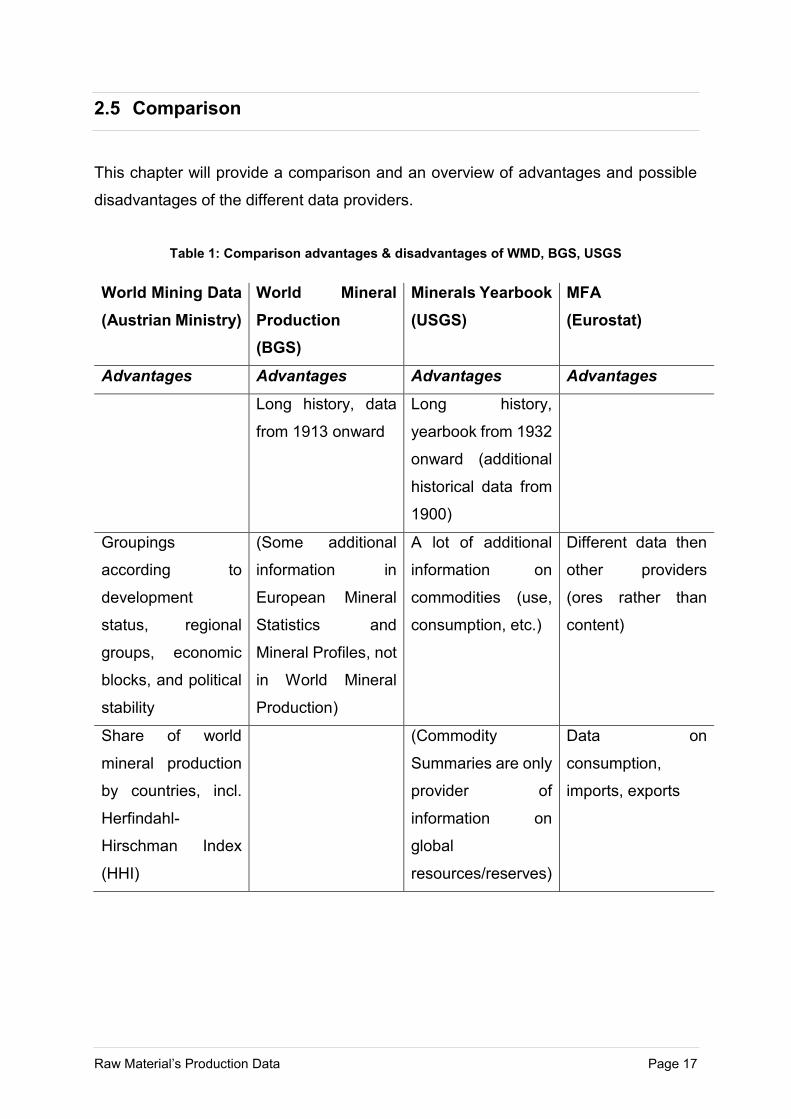
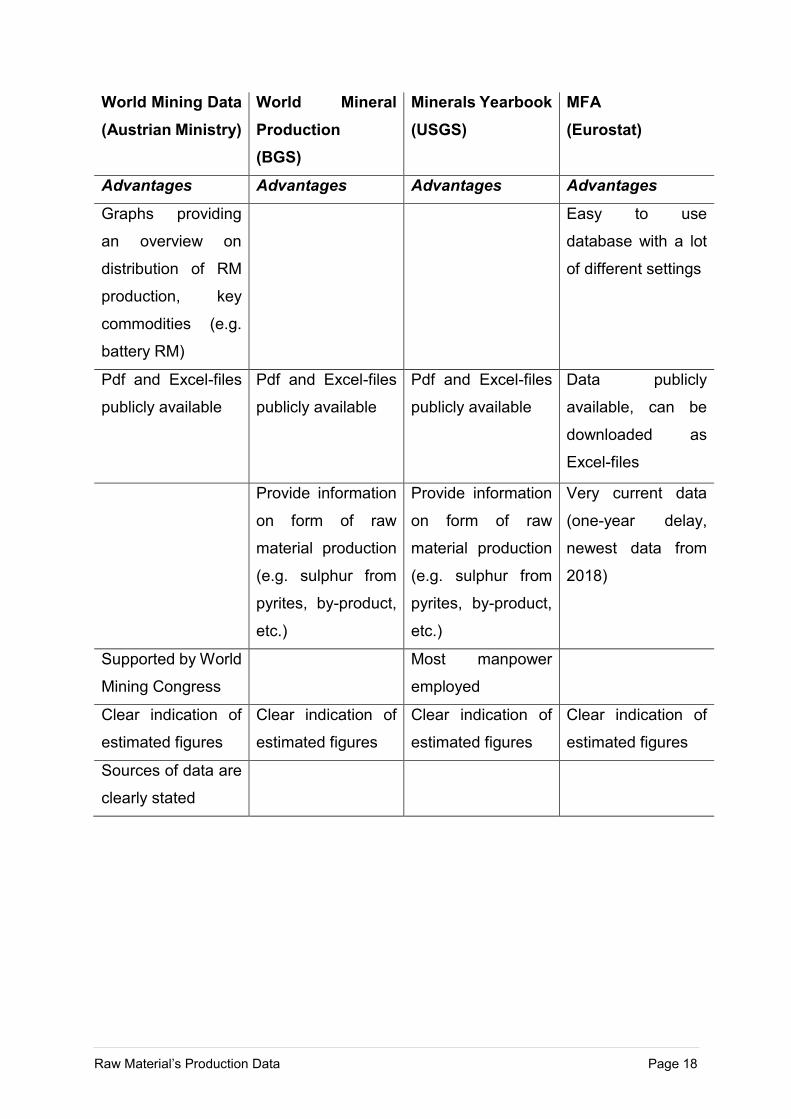
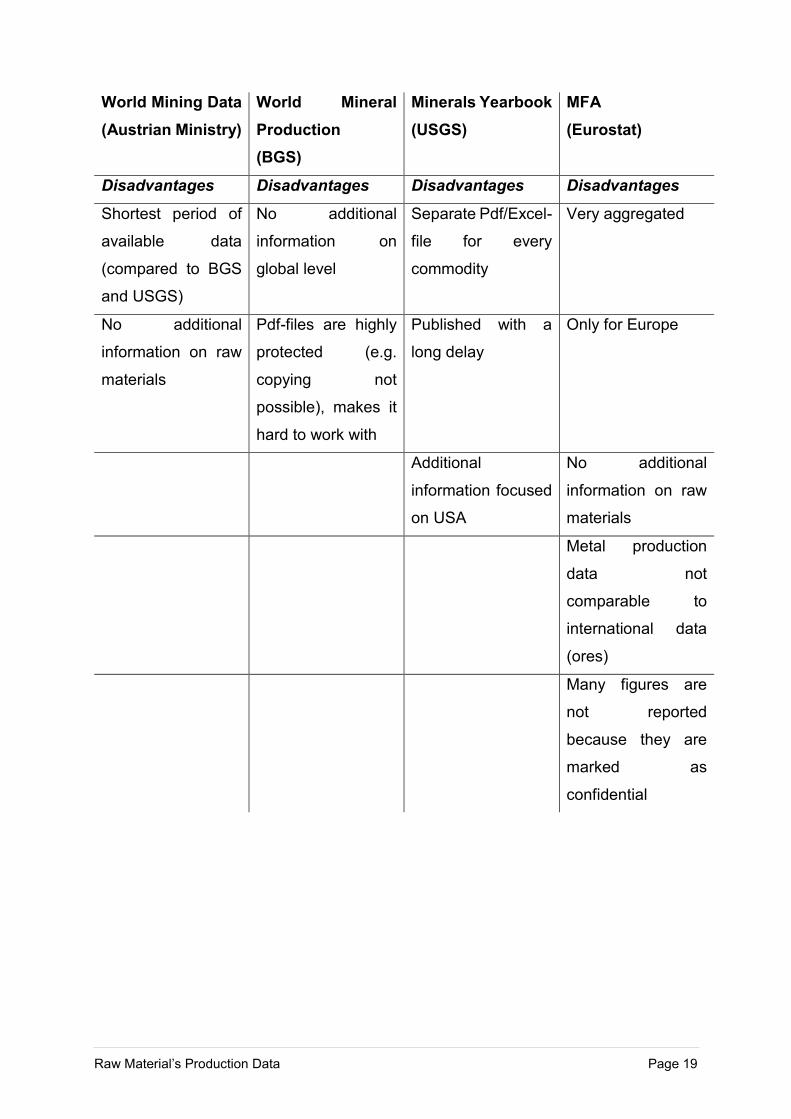
2.5 Comparison
This chapter will provide a comparison and an overview of advantages and possible
disadvantages of the different data providers.
Table 1: Comparison advantages & disadvantages of WMD, BGS, USGS
World Mining Data
(Austrian Ministry)
World Mineral
Production
(BGS)
Minerals Yearbook
(USGS)
MFA
(Eurostat)
Advantages Advantages Advantages Advantages
Long history, data
from 1913 onward
Long history,
yearbook from 1932
onward (additional
historical data from
1900)
Groupings
according to
development
status, regional
groups, economic
blocks, and political
stability
(Some additional
information in
European Mineral
Statistics and
Mineral Profiles, not
in World Mineral
Production)
A lot of additional
information on
commodities (use,
consumption, etc.)
Different data then
other providers
(ores rather than
content)
Share of world
mineral production
by countries, incl.
Herfindahl-
Hirschman Index
(HHI)
(Commodity
Summaries are only
provider of
information on
global
resources/reserves)
Data on
consumption,
imports, exports
Raw Material’s Production Data Page 18
World Mining Data
(Austrian Ministry)
World Mineral
Production
(BGS)
Minerals Yearbook
(USGS)
MFA
(Eurostat)
Advantages Advantages Advantages Advantages
Graphs providing
an overview on
distribution of RM
production, key
commodities (e.g.
battery RM)
Easy to use
database with a lot
of different settings
Pdf and Excel-files
publicly available
Pdf and Excel-files
publicly available
Pdf and Excel-files
publicly available
Data publicly
available, can be
downloaded as
Excel-files
Provide information
on form of raw
material production
(e.g. sulphur from
pyrites, by-product,
etc.)
Provide information
on form of raw
material production
(e.g. sulphur from
pyrites, by-product,
etc.)
Very current data
(one-year delay,
newest data from
2018)
Supported by World
Mining Congress
Most manpower
employed
Clear indication of
estimated figures
Clear indication of
estimated figures
Clear indication of
estimated figures
Clear indication of
estimated figures
Sources of data are
clearly stated
Raw Material’s Production Data Page 19
World Mining Data
(Austrian Ministry)
World Mineral
Production
(BGS)
Minerals Yearbook
(USGS)
MFA
(Eurostat)
Disadvantages Disadvantages Disadvantages Disadvantages
Shortest period of
available data
(compared to BGS
and USGS)
No additional
information on
global level
Separate Pdf/Excel-
file for every
commodity
Very aggregated
No additional
information on raw
materials
Pdf-files are highly
protected (e.g.
copying not
possible), makes it
hard to work with
Published with a
long delay
Only for Europe
Additional
information focused
on USA
No additional
information on raw
materials
Metal production
data not
comparable to
international data
(ores)
Many figures are
not reported
because they are
marked as
confidential
Raw Material’s Production Data Page 20
The global data providers, World Mining Data (Federal Ministry Republic of Austria
Sustainability and Tourism), World Mineral Production (British Geological Survey), and
Minerals Yearbook (United States Geological Survey) are very similar considering the
actual figures they report. For many metals they have established an annual meeting
to discuss sources and numbers together with different study groups. Usually, all three
report metal content and only in some cases ores. For instance, WMD, BGS, and
USGS report both Aluminium and Bauxite. BGS and USGS additionally provide
information on alumina (Al2O3).
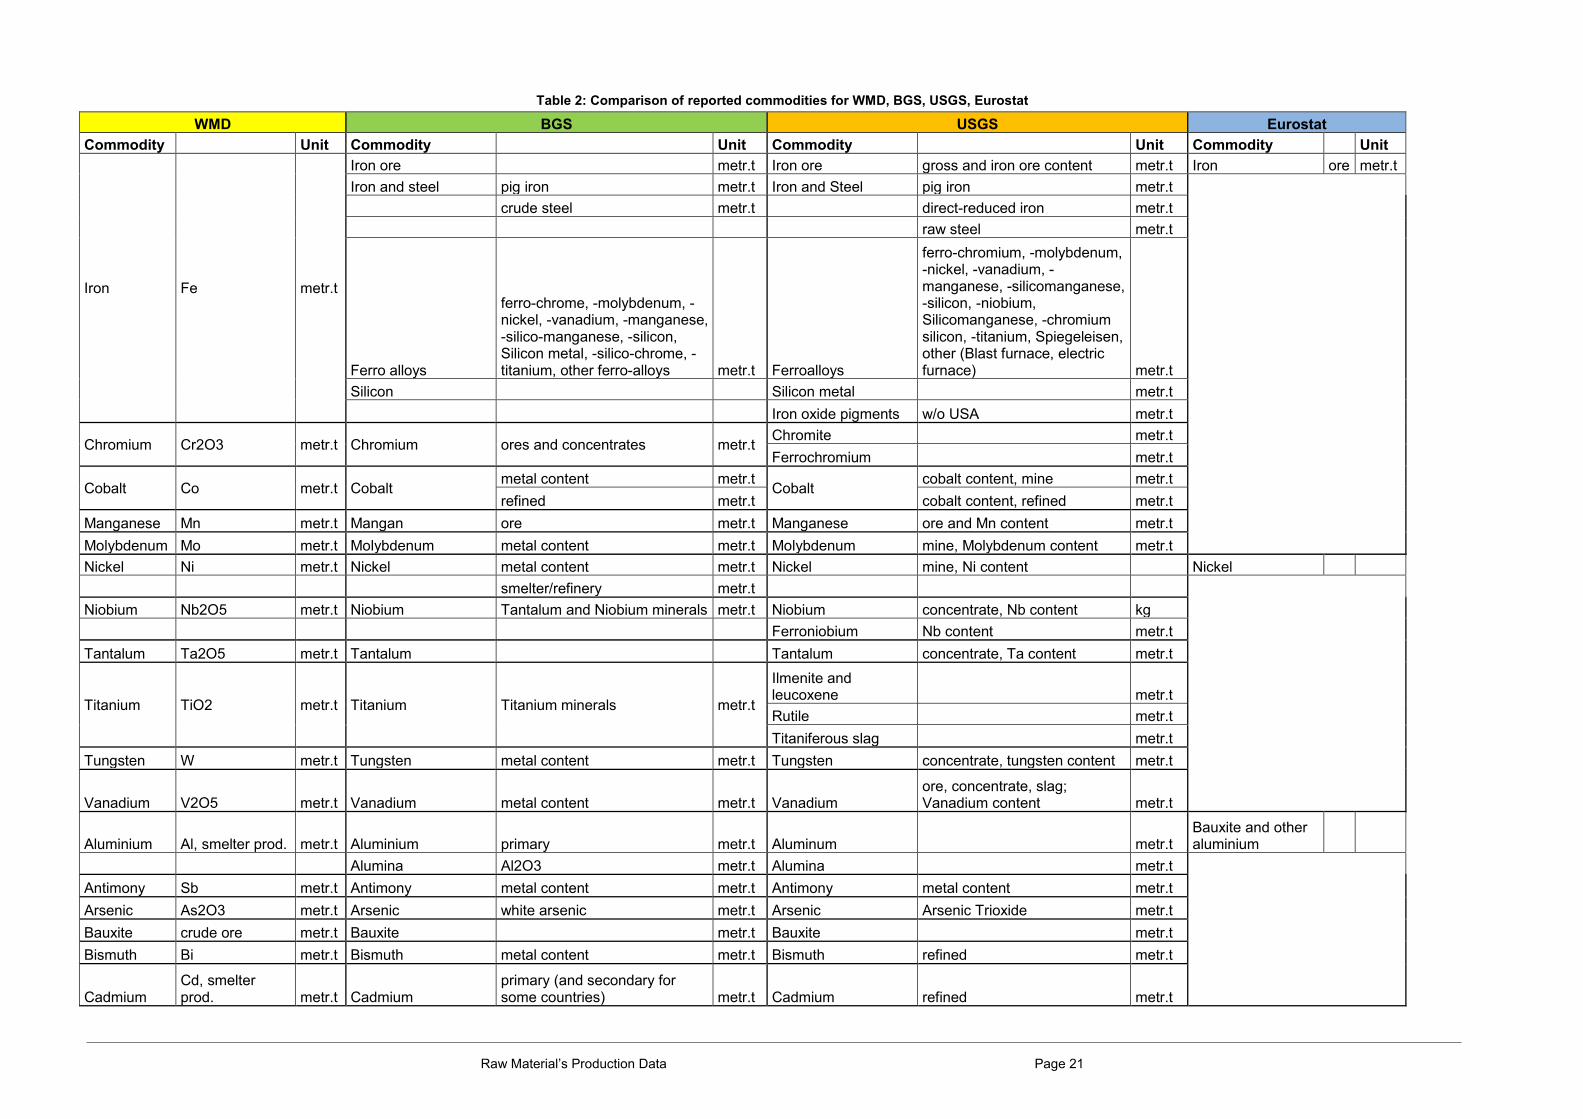
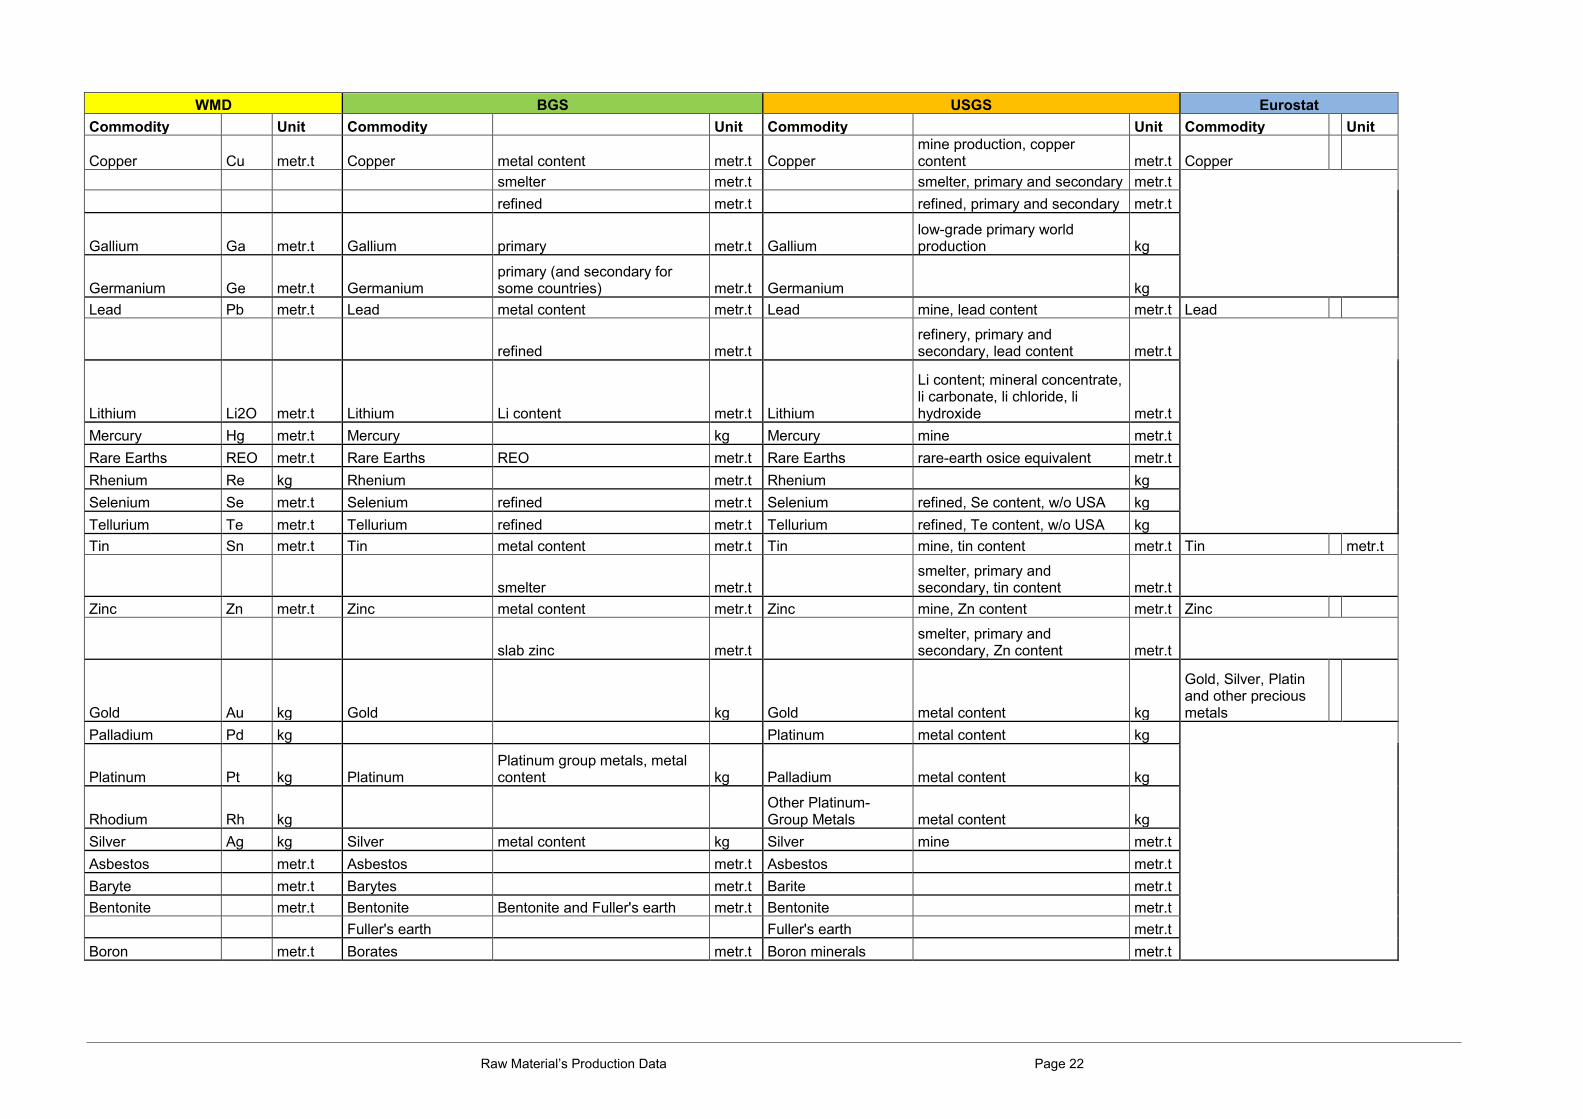
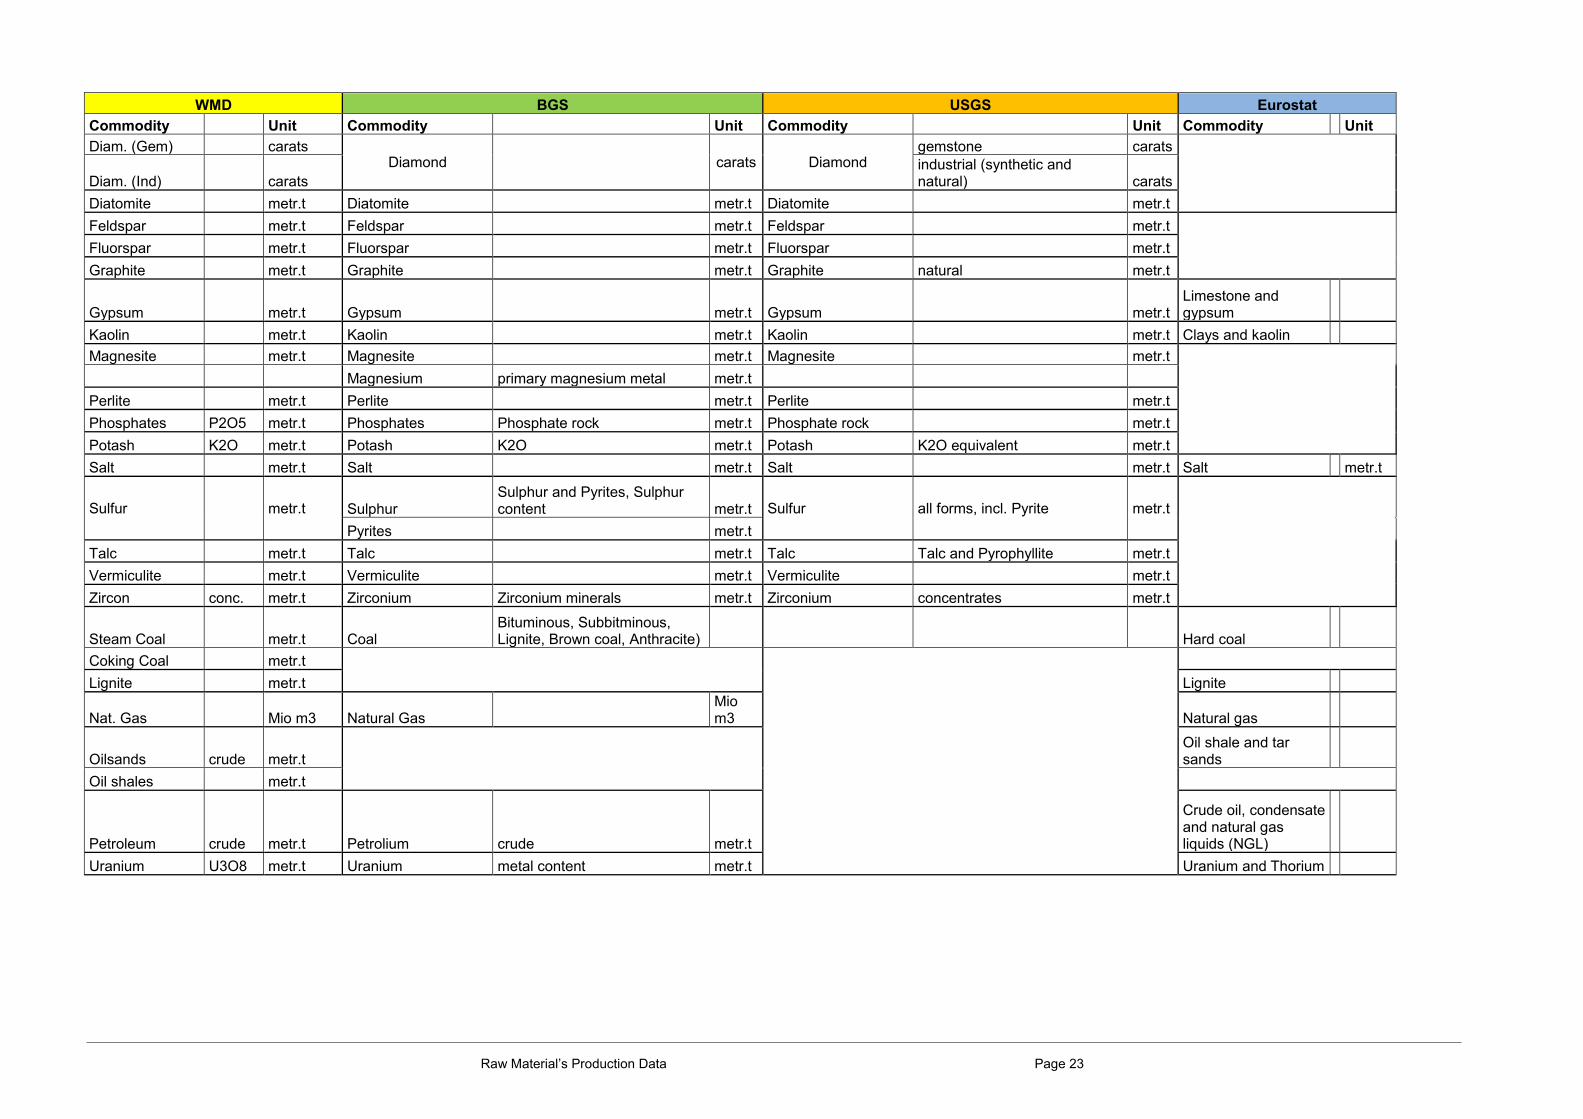
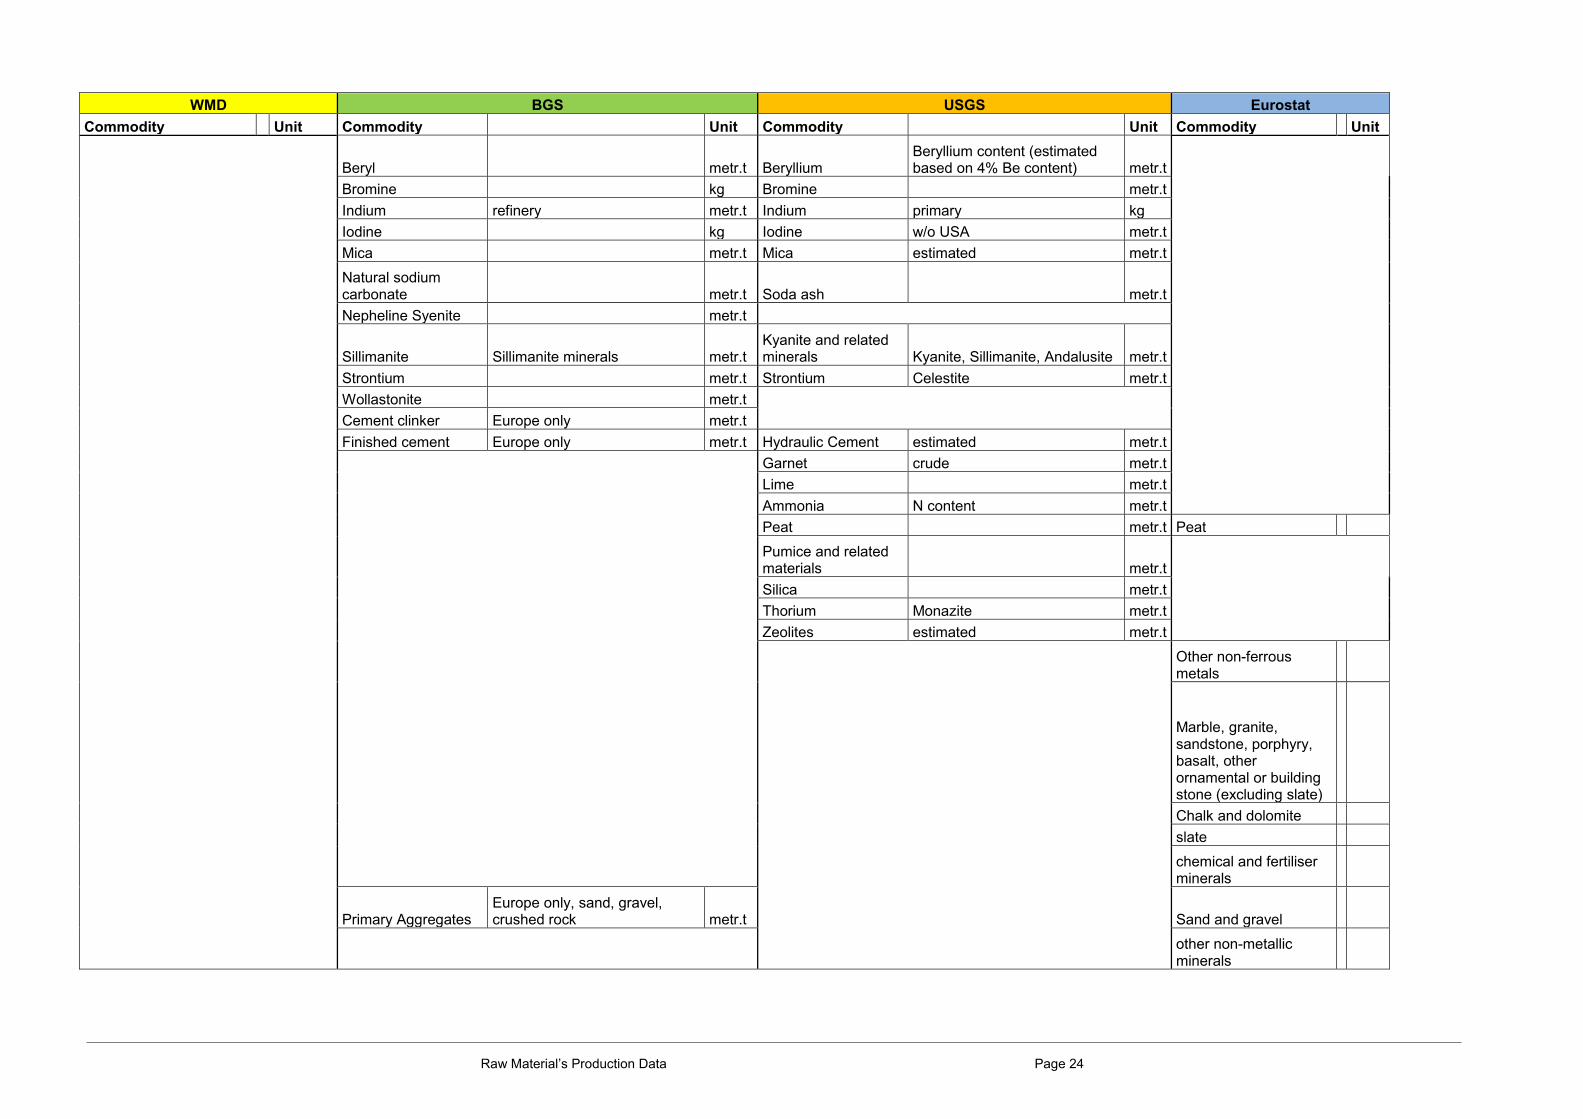
In the following two tables the commodities reported are compared in more detail.
Table 2 lists all commodities reported by the four data providers (WMD, BGS, USGS,
and Eurostat) allowing a comparison of commodities reported and the unit (metal
content, ore) this is done in. Table 3 shows a detailed comparison of actual production
figures reported by all four data providers for the European Union (EU-28) only, in order
to allow a comparison with Eurostat data. However, it must not be forgotten that
Eurostat reports ores rather than metal content.
Raw Material’s Production Data Page 21
Table 2: Comparison of reported commodities for WMD, BGS, USGS, Eurostat
WMD BGS USGS Eurostat
Commodity Unit Commodity Unit Commodity Unit Commodity Unit
Iron Fe metr.t
Iron ore metr.t Iron ore gross and iron ore content metr.t Iron ore metr.t
Iron and steel pig iron metr.t Iron and Steel pig iron metr.t
crude steel metr.t direct-reduced iron metr.t
raw steel metr.t
Ferro alloys
ferro-chrome, -molybdenum, -nickel, -vanadium, -manganese, -silico-manganese, -silicon, Silicon metal, -silico-chrome, -titanium, other ferro-alloys metr.t Ferroalloys
ferro-chromium, -molybdenum, -nickel, -vanadium, -manganese, -silicomanganese, -silicon, -niobium, Silicomanganese, -chromium silicon, -titanium, Spiegeleisen, other (Blast furnace, electric furnace) metr.t
Silicon Silicon metal metr.t
Iron oxide pigments w/o USA metr.t
Chromium Cr2O3 metr.t Chromium ores and concentrates metr.t Chromite metr.t
Ferrochromium metr.t
Cobalt Co metr.t Cobalt metal content metr.t
Cobalt cobalt content, mine metr.t
refined metr.t cobalt content, refined metr.t
Manganese Mn metr.t Mangan ore metr.t Manganese ore and Mn content metr.t
Molybdenum Mo metr.t Molybdenum metal content metr.t Molybdenum mine, Molybdenum content metr.t
Nickel Ni metr.t Nickel metal content metr.t Nickel mine, Ni content Nickel
smelter/refinery metr.t
Niobium Nb2O5 metr.t Niobium Tantalum and Niobium minerals metr.t Niobium concentrate, Nb content kg
Ferroniobium Nb content metr.t
Tantalum Ta2O5 metr.t Tantalum Tantalum concentrate, Ta content metr.t
Titanium TiO2 metr.t Titanium Titanium minerals metr.t
Ilmenite and leucoxene metr.t
Rutile metr.t
Titaniferous slag metr.t
Tungsten W metr.t Tungsten metal content metr.t Tungsten concentrate, tungsten content metr.t
Vanadium V2O5 metr.t Vanadium metal content metr.t Vanadium ore, concentrate, slag; Vanadium content metr.t
Aluminium Al, smelter prod. metr.t Aluminium primary metr.t Aluminum metr.t Bauxite and other aluminium
Alumina Al2O3 metr.t Alumina metr.t
Antimony Sb metr.t Antimony metal content metr.t Antimony metal content metr.t
Arsenic As2O3 metr.t Arsenic white arsenic metr.t Arsenic Arsenic Trioxide metr.t
Bauxite crude ore metr.t Bauxite metr.t Bauxite metr.t
Bismuth Bi metr.t Bismuth metal content metr.t Bismuth refined metr.t
Cadmium Cd, smelter prod. metr.t Cadmium
primary (and secondary for some countries) metr.t Cadmium refined metr.t
Raw Material’s Production Data Page 22
WMD BGS USGS Eurostat
Commodity Unit Commodity Unit Commodity Unit Commodity Unit
Copper Cu metr.t Copper metal content metr.t Copper mine production, copper content metr.t Copper
smelter metr.t smelter, primary and secondary metr.t
refined metr.t refined, primary and secondary metr.t
Gallium Ga metr.t Gallium primary metr.t Gallium low-grade primary world production kg
Germanium Ge metr.t Germanium primary (and secondary for some countries) metr.t Germanium kg
Lead Pb metr.t Lead metal content metr.t Lead mine, lead content metr.t Lead
refined metr.t refinery, primary and secondary, lead content metr.t
Lithium Li2O metr.t Lithium Li content metr.t Lithium
Li content; mineral concentrate, li carbonate, li chloride, li hydroxide metr.t
Mercury Hg metr.t Mercury kg Mercury mine metr.t
Rare Earths REO metr.t Rare Earths REO metr.t Rare Earths rare-earth osice equivalent metr.t
Rhenium Re kg Rhenium metr.t Rhenium kg
Selenium Se metr.t Selenium refined metr.t Selenium refined, Se content, w/o USA kg
Tellurium Te metr.t Tellurium refined metr.t Tellurium refined, Te content, w/o USA kg
Tin Sn metr.t Tin metal content metr.t Tin mine, tin content metr.t Tin metr.t
smelter metr.t
smelter, primary and secondary, tin content metr.t
Zinc Zn metr.t Zinc metal content metr.t Zinc mine, Zn content metr.t Zinc
slab zinc metr.t
smelter, primary and secondary, Zn content metr.t
Gold Au kg Gold kg Gold metal content kg
Gold, Silver, Platin and other precious metals
Palladium Pd kg Platinum metal content kg
Platinum Pt kg Platinum Platinum group metals, metal content kg Palladium metal content kg
Rhodium Rh kg Other Platinum-Group Metals metal content kg
Silver Ag kg Silver metal content kg Silver mine metr.t
Asbestos metr.t Asbestos metr.t Asbestos metr.t
Baryte metr.t Barytes metr.t Barite metr.t
Bentonite metr.t Bentonite Bentonite and Fuller's earth metr.t Bentonite metr.t
Fuller's earth Fuller's earth metr.t
Boron metr.t Borates metr.t Boron minerals metr.t
Raw Material’s Production Data Page 23
WMD BGS USGS Eurostat
Commodity Unit Commodity Unit Commodity Unit Commodity Unit
Diam. (Gem) carats Diamond carats Diamond
gemstone carats
Diam. (Ind) carats
industrial (synthetic and natural) carats
Diatomite metr.t Diatomite metr.t Diatomite metr.t
Feldspar metr.t Feldspar metr.t Feldspar metr.t
Fluorspar metr.t Fluorspar metr.t Fluorspar metr.t
Graphite metr.t Graphite metr.t Graphite natural metr.t
Gypsum metr.t Gypsum metr.t Gypsum metr.t Limestone and gypsum
Kaolin metr.t Kaolin metr.t Kaolin metr.t Clays and kaolin
Magnesite metr.t Magnesite metr.t Magnesite metr.t
Magnesium primary magnesium metal metr.t
Perlite metr.t Perlite metr.t Perlite metr.t
Phosphates P2O5 metr.t Phosphates Phosphate rock metr.t Phosphate rock metr.t
Potash K2O metr.t Potash K2O metr.t Potash K2O equivalent metr.t
Salt metr.t Salt metr.t Salt metr.t Salt metr.t
Sulfur
metr.t Sulphur Sulphur and Pyrites, Sulphur content metr.t Sulfur all forms, incl. Pyrite metr.t
Pyrites metr.t
Talc metr.t Talc metr.t Talc Talc and Pyrophyllite metr.t
Vermiculite metr.t Vermiculite metr.t Vermiculite metr.t
Zircon conc. metr.t Zirconium Zirconium minerals metr.t Zirconium concentrates metr.t
Steam Coal metr.t Coal Bituminous, Subbitminous, Lignite, Brown coal, Anthracite) Hard coal
Coking Coal metr.t
Lignite metr.t Lignite
Nat. Gas Mio m3 Natural Gas
Mio m3 Natural gas
Oilsands crude metr.t
Oil shale and tar sands
Oil shales metr.t
Petroleum crude metr.t Petrolium crude metr.t
Crude oil, condensate and natural gas liquids (NGL)
Uranium U3O8 metr.t Uranium metal content metr.t Uranium and Thorium
Raw Material’s Production Data Page 24
WMD BGS USGS Eurostat
Commodity Unit Commodity Unit Commodity Unit Commodity Unit
Beryl metr.t Beryllium Beryllium content (estimated based on 4% Be content) metr.t
Bromine kg Bromine metr.t
Indium refinery metr.t Indium primary kg
Iodine kg Iodine w/o USA metr.t
Mica metr.t Mica estimated metr.t
Natural sodium carbonate metr.t Soda ash metr.t
Nepheline Syenite metr.t
Sillimanite Sillimanite minerals metr.t Kyanite and related minerals Kyanite, Sillimanite, Andalusite metr.t
Strontium metr.t Strontium Celestite metr.t
Wollastonite metr.t
Cement clinker Europe only metr.t
Finished cement Europe only metr.t Hydraulic Cement estimated metr.t
Garnet crude metr.t
Lime metr.t
Ammonia N content metr.t
Peat metr.t Peat
Pumice and related materials metr.t
Silica metr.t
Thorium Monazite metr.t
Zeolites estimated metr.t
Other non-ferrous metals
Marble, granite, sandstone, porphyry, basalt, other ornamental or building stone (excluding slate)
Chalk and dolomite
slate
chemical and fertiliser minerals
Primary Aggregates Europe only, sand, gravel, crushed rock metr.t Sand and gravel
other non-metallic minerals
Raw Material’s Production Data Page 25
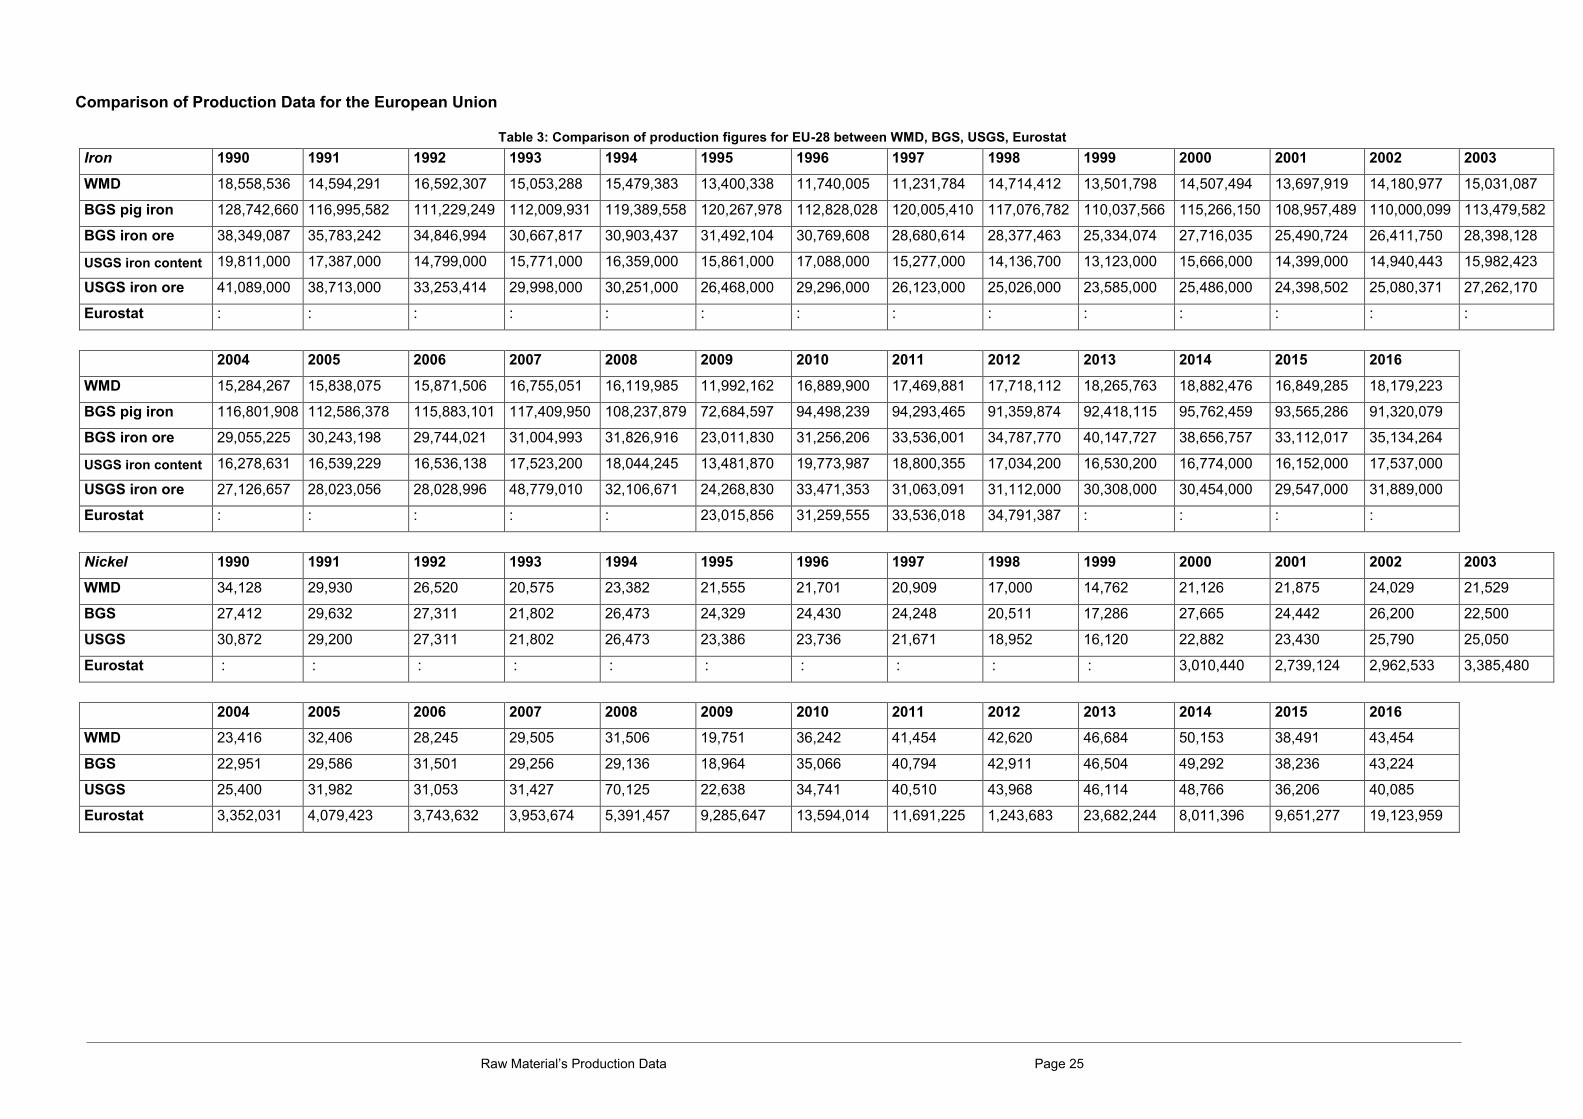
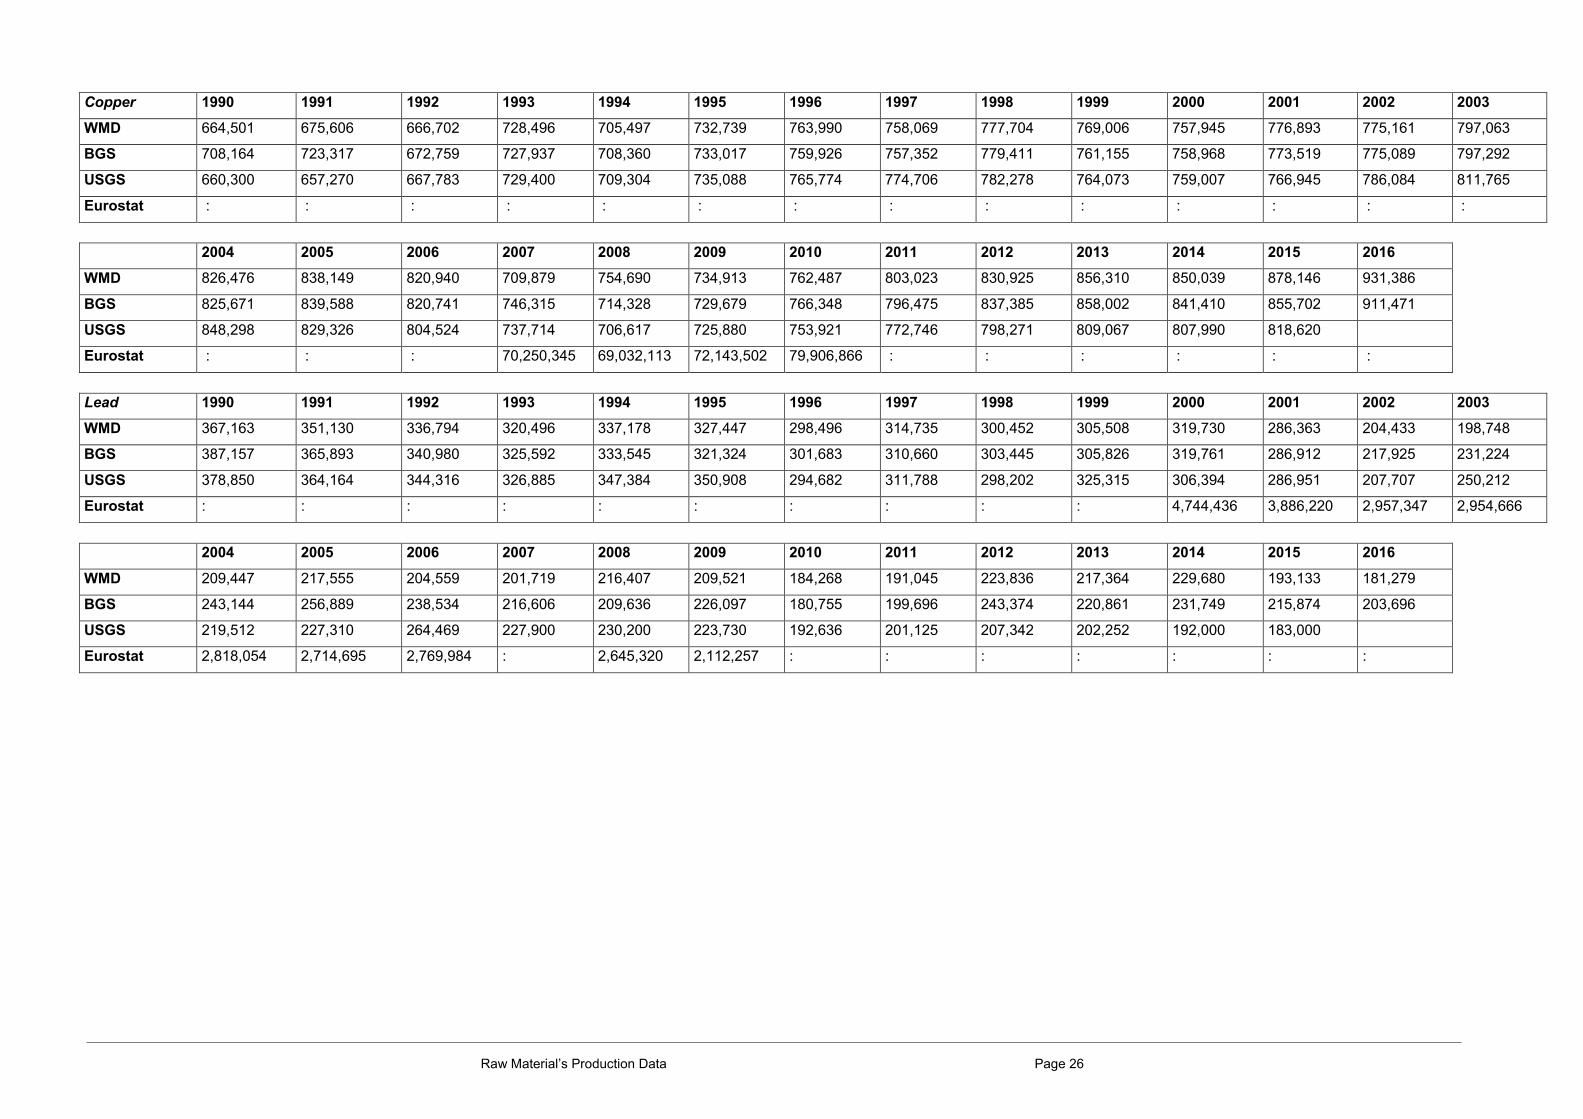
Comparison of Production Data for the European Union
Table 3: Comparison of production figures for EU-28 between WMD, BGS, USGS, Eurostat
Iron 1990 1991 1992 1993 1994 1995 1996 1997 1998 1999 2000 2001 2002 2003
WMD 18,558,536 14,594,291 16,592,307 15,053,288 15,479,383 13,400,338 11,740,005 11,231,784 14,714,412 13,501,798 14,507,494 13,697,919 14,180,977 15,031,087
BGS pig iron 128,742,660 116,995,582 111,229,249 112,009,931 119,389,558 120,267,978 112,828,028 120,005,410 117,076,782 110,037,566 115,266,150 108,957,489 110,000,099 113,479,582
BGS iron ore 38,349,087 35,783,242 34,846,994 30,667,817 30,903,437 31,492,104 30,769,608 28,680,614 28,377,463 25,334,074 27,716,035 25,490,724 26,411,750 28,398,128
USGS iron content 19,811,000 17,387,000 14,799,000 15,771,000 16,359,000 15,861,000 17,088,000 15,277,000 14,136,700 13,123,000 15,666,000 14,399,000 14,940,443 15,982,423
USGS iron ore 41,089,000 38,713,000 33,253,414 29,998,000 30,251,000 26,468,000 29,296,000 26,123,000 25,026,000 23,585,000 25,486,000 24,398,502 25,080,371 27,262,170
Eurostat : : : : : : : : : : : : : :
2004 2005 2006 2007 2008 2009 2010 2011 2012 2013 2014 2015 2016
WMD 15,284,267 15,838,075 15,871,506 16,755,051 16,119,985 11,992,162 16,889,900 17,469,881 17,718,112 18,265,763 18,882,476 16,849,285 18,179,223
BGS pig iron 116,801,908 112,586,378 115,883,101 117,409,950 108,237,879 72,684,597 94,498,239 94,293,465 91,359,874 92,418,115 95,762,459 93,565,286 91,320,079
BGS iron ore 29,055,225 30,243,198 29,744,021 31,004,993 31,826,916 23,011,830 31,256,206 33,536,001 34,787,770 40,147,727 38,656,757 33,112,017 35,134,264
USGS iron content 16,278,631 16,539,229 16,536,138 17,523,200 18,044,245 13,481,870 19,773,987 18,800,355 17,034,200 16,530,200 16,774,000 16,152,000 17,537,000
USGS iron ore 27,126,657 28,023,056 28,028,996 48,779,010 32,106,671 24,268,830 33,471,353 31,063,091 31,112,000 30,308,000 30,454,000 29,547,000 31,889,000
Eurostat : : : : : 23,015,856 31,259,555 33,536,018 34,791,387 : : : :
Nickel 1990 1991 1992 1993 1994 1995 1996 1997 1998 1999 2000 2001 2002 2003
WMD 34,128 29,930 26,520 20,575 23,382 21,555 21,701 20,909 17,000 14,762 21,126 21,875 24,029 21,529
BGS 27,412 29,632 27,311 21,802 26,473 24,329 24,430 24,248 20,511 17,286 27,665 24,442 26,200 22,500
USGS 30,872 29,200 27,311 21,802 26,473 23,386 23,736 21,671 18,952 16,120 22,882 23,430 25,790 25,050
Eurostat : : : : : : : : : : 3,010,440 2,739,124 2,962,533 3,385,480
2004 2005 2006 2007 2008 2009 2010 2011 2012 2013 2014 2015 2016
WMD 23,416 32,406 28,245 29,505 31,506 19,751 36,242 41,454 42,620 46,684 50,153 38,491 43,454
BGS 22,951 29,586 31,501 29,256 29,136 18,964 35,066 40,794 42,911 46,504 49,292 38,236 43,224
USGS 25,400 31,982 31,053 31,427 70,125 22,638 34,741 40,510 43,968 46,114 48,766 36,206 40,085
Eurostat 3,352,031 4,079,423 3,743,632 3,953,674 5,391,457 9,285,647 13,594,014 11,691,225 1,243,683 23,682,244 8,011,396 9,651,277 19,123,959
Raw Material’s Production Data Page 26
Copper 1990 1991 1992 1993 1994 1995 1996 1997 1998 1999 2000 2001 2002 2003
WMD 664,501 675,606 666,702 728,496 705,497 732,739 763,990 758,069 777,704 769,006 757,945 776,893 775,161 797,063
BGS 708,164 723,317 672,759 727,937 708,360 733,017 759,926 757,352 779,411 761,155 758,968 773,519 775,089 797,292
USGS 660,300 657,270 667,783 729,400 709,304 735,088 765,774 774,706 782,278 764,073 759,007 766,945 786,084 811,765
Eurostat : : : : : : : : : : : : : :
2004 2005 2006 2007 2008 2009 2010 2011 2012 2013 2014 2015 2016
WMD 826,476 838,149 820,940 709,879 754,690 734,913 762,487 803,023 830,925 856,310 850,039 878,146 931,386
BGS 825,671 839,588 820,741 746,315 714,328 729,679 766,348 796,475 837,385 858,002 841,410 855,702 911,471
USGS 848,298 829,326 804,524 737,714 706,617 725,880 753,921 772,746 798,271 809,067 807,990 818,620
Eurostat : : : 70,250,345 69,032,113 72,143,502 79,906,866 : : : : : :
Lead 1990 1991 1992 1993 1994 1995 1996 1997 1998 1999 2000 2001 2002 2003
WMD 367,163 351,130 336,794 320,496 337,178 327,447 298,496 314,735 300,452 305,508 319,730 286,363 204,433 198,748
BGS 387,157 365,893 340,980 325,592 333,545 321,324 301,683 310,660 303,445 305,826 319,761 286,912 217,925 231,224
USGS 378,850 364,164 344,316 326,885 347,384 350,908 294,682 311,788 298,202 325,315 306,394 286,951 207,707 250,212
Eurostat : : : : : : : : : : 4,744,436 3,886,220 2,957,347 2,954,666
2004 2005 2006 2007 2008 2009 2010 2011 2012 2013 2014 2015 2016
WMD 209,447 217,555 204,559 201,719 216,407 209,521 184,268 191,045 223,836 217,364 229,680 193,133 181,279
BGS 243,144 256,889 238,534 216,606 209,636 226,097 180,755 199,696 243,374 220,861 231,749 215,874 203,696
USGS 219,512 227,310 264,469 227,900 230,200 223,730 192,636 201,125 207,342 202,252 192,000 183,000
Eurostat 2,818,054 2,714,695 2,769,984 : 2,645,320 2,112,257 : : : : : : :
Raw Material’s Production Data Page 27
Tin 1990 1991 1992 1993 1994 1995 1996 1997 1998 1999 2000 2001 2002 2003
WMD 7,158 5,467 5,062 7,568 6,237 6,629 6,739 5,970 3,363 2,270 1,228 2,163 361 222
BGS 6,961 5,488 5,055 7,566 6,252 6,599 6,740 5,962 3,406 2,163 1,246 1,201 345 203
USGS 10,607 10,804 8,611 7,568 6,258 6,602 6,742 5,065 3,478 2,202 1,230 1,176 574 465
Eurostat : : : : : : : : : : 730,245 672,529 210,059 135,005
2004 2005 2006 2007 2008 2009 2010 2011 2012 2013 2014 2015 2016
WMD 225 232 25 41 49 34 22 48 110 84 75 58 206
BGS 200 243 25 41 29 34 22 48 111 84 75 42 221
USGS 451 243 25 41 29 34 22 39 42 84 75 42 45
Eurostat 152,004 171,045 43,141 42,142 40,299 46,241 34,479 36,981 38,355 35,152 31,515 17,576 22,727
Zinc 1990 1991 1992 1993 1994 1995 1996 1997 1998 1999 2000 2001 2002 2003
WMD 1,050,762 1,020,821 930,384 837,312 782,179 795,240 727,757 766,970 738,628 763,715 871,083 857,616 754,046 853,810
BGS 1,074,106 1,076,734 921,630 835,369 780,096 793,248 725,107 763,618 737,200 758,189 869,534 864,925 750,858 851,182
USGS 1,049,370 1,042,052 927,816 834,161 772,558 787,732 729,226 789,532 745,811 741,555 881,813 808,908 727,526 856,765
Eurostat : : : : : : : : : : : : : :
2004 2005 2006 2007 2008 2009 2010 2011 2012 2013 2014 2015 2016
WMD 847,400 867,243 845,807 844,917 821,269 760,211 748,510 764,864 758,571 743,828 753,963 722,336 698,141
BGS 849,214 875,850 845,794 844,358 821,320 760,529 764,280 767,840 754,815 741,857 739,108 704,451 687,367
USGS 851,941 808,908 843,556 841,103 818,954 751,907 721,109 733,338 726,114 720,498 745,573 702,594 675,714
Eurostat : : : : : 8,916,807 11,683,071 10,771,425 10,582,934 12,123,351 9,224,075 12,178,355 12,838,771
Raw Material’s Production Data Page 28
Salt 1990 1991 1992 1993 1994 1995 1996 1997 1998 1999 2000 2001 2002 2003
WMD 52,674,263 48,166,690 44,130,376 44,238,668 45,494,922 50,367,921 50,816,812 52,573,788 47,486,195 49,717,275 49,580,879 48,738,824 48,053,797 48,385,378
BGS 48,351,092 43,557,398 41,672,208 41,237,675 46,010,755 49,674,854 51,739,105 49,336,747 48,050,155 48,867,016 47,560,485 49,132,746 48,948,685 50,453,727
USGS 50,835,000 50,965,000 45,716,000 46,152,000 50,092,000 52,860,000 53,756,000 51,965,000 52,505,000 47,294,000 34,185,572 48,636,585 49,847,497 52,563,265
Eurostat : : : : : : : : : : : : : :
2004 2005 2006 2007 2008 2009 2010 2011 2012 2013 2014 2015 2016
WMD 52,705,920 54,380,666 54,970,866 49,920,723 50,536,952 53,847,115 57,617,135 55,164,611 51,703,803 55,847,279 50,507,719 50,268,164 50,153,118
BGS 52,893,344 55,161,253 57,474,363 50,786,214 52,581,580 53,146,688 57,522,208 58,066,262 56,133,649 57,253,637 47,246,263 50,740,661 49,759,232
USGS 55,456,903 56,553,521 58,028,988 52,525,582 45,047,434 48,645,437 51,650,855 47,979,457 44,626,187 48,778,000 41,121,000 41,038,000 40,534,000
Eurostat : 61,621,762 : : 55,328,553 54,070,125 54,747,241 : 49,393,445 54,842,749 47,298,268 48,421,447 47,237,717
Hydraulic
Cement 1990 1991 1992 1993 1994 1995 1996 1997 1998 1999 2000 2001 2002 2003
BGS 2,374,200 2,393,900 13,294,300 13,137,900 14,470,500 14,350,300 14,672,000 14,910,000 201,267,858 227,571,887 233,222,547 228,176,121 227,365,606 233,830,813
USGS 233,356,000 215,215,000 215,309,000 204,284,000 211,039,000 209,677,000 207,319,000 218,170,000 226,684,000 231,202,000 235,191,000 230,228,000 229,573,000 236,529,763
2004 2005 2006 2007 2008 2009 2010 2011 2012 2013 2014 2015 2016
BGS 236,537,563 248,517,382 264,548,495 268,408,120 250,753,408 199,171,192 193,104,287 196,439,231 176,176,339 166,786,192 168,650,257 165,296,334 167,732,834
USGS 244,968,068 246,797,679 270,228,659 282,810,817 256,815,000 199,491,000 190,646,000 192,904,000 170,002,000 165,119,000 166,126,000 169,953,000 168,403,000
Sand and Gravel 1990 1991 1992 1993 1994 1995 1996 1997 1998 1999 2000 2001
BGS 0 0 98,912,000 100,017,000 109,419,000 101,732,000 93,947,000 98,383,000 1,128,257,905 1,345,525,918 1,283,223,513 1,307,543,059
Eurostat : : : : : : : : : : 2,475,155,646 2,486,034,488
2002 2003 2004 2005 2006 2007 2008 2009 2010 2011 2012 2013
BGS 1,273,294,310 1,278,857,979 1,424,319,638 1,456,689,616 1,514,818,664 1,518,128,347 1,482,074,554 1,277,865,282 1,177,969,757 1,210,285,288 1,066,611,584 1,034,575,262
Eurostat 2,376,108,177 2,352,946,685 2,391,109,155 2,502,707,725 2,626,227,552 2,770,542,982 2,680,518,968 2,320,185,983 2,158,056,464 2,326,514,105 2,078,394,573 1,975,698,616
2014 2015 2016
BGS 1,024,434,671 1,058,641,303 1,078,969,912
Eurostat 1,988,369,022 2,068,326,480 2,084,080,567
Raw Material’s Production Data Page 29
As the comparison of the four data providers in Table 2 demonstrates the difference
between the three international collections (WMD, BGS, USGS) is minor. BGS and
USGS provide additional data in some cases, for example iron, where they also
report iron ore, pig iron, steel, etc. However, BGS does not report iron content. WMD
focuses on the content or the form traded on the world market (e.g. Arsenic as
diarsenic trioxide As2O3) for maximum comparability. USGS does not provide any
data on energy raw materials in the Minerals Yearbook, for that they have a separate
collection. Eurostat on the other hand does not report as many commodities, and in
some cases, they are very aggregated, for example Gold, silver, platinum and other
precious metals.
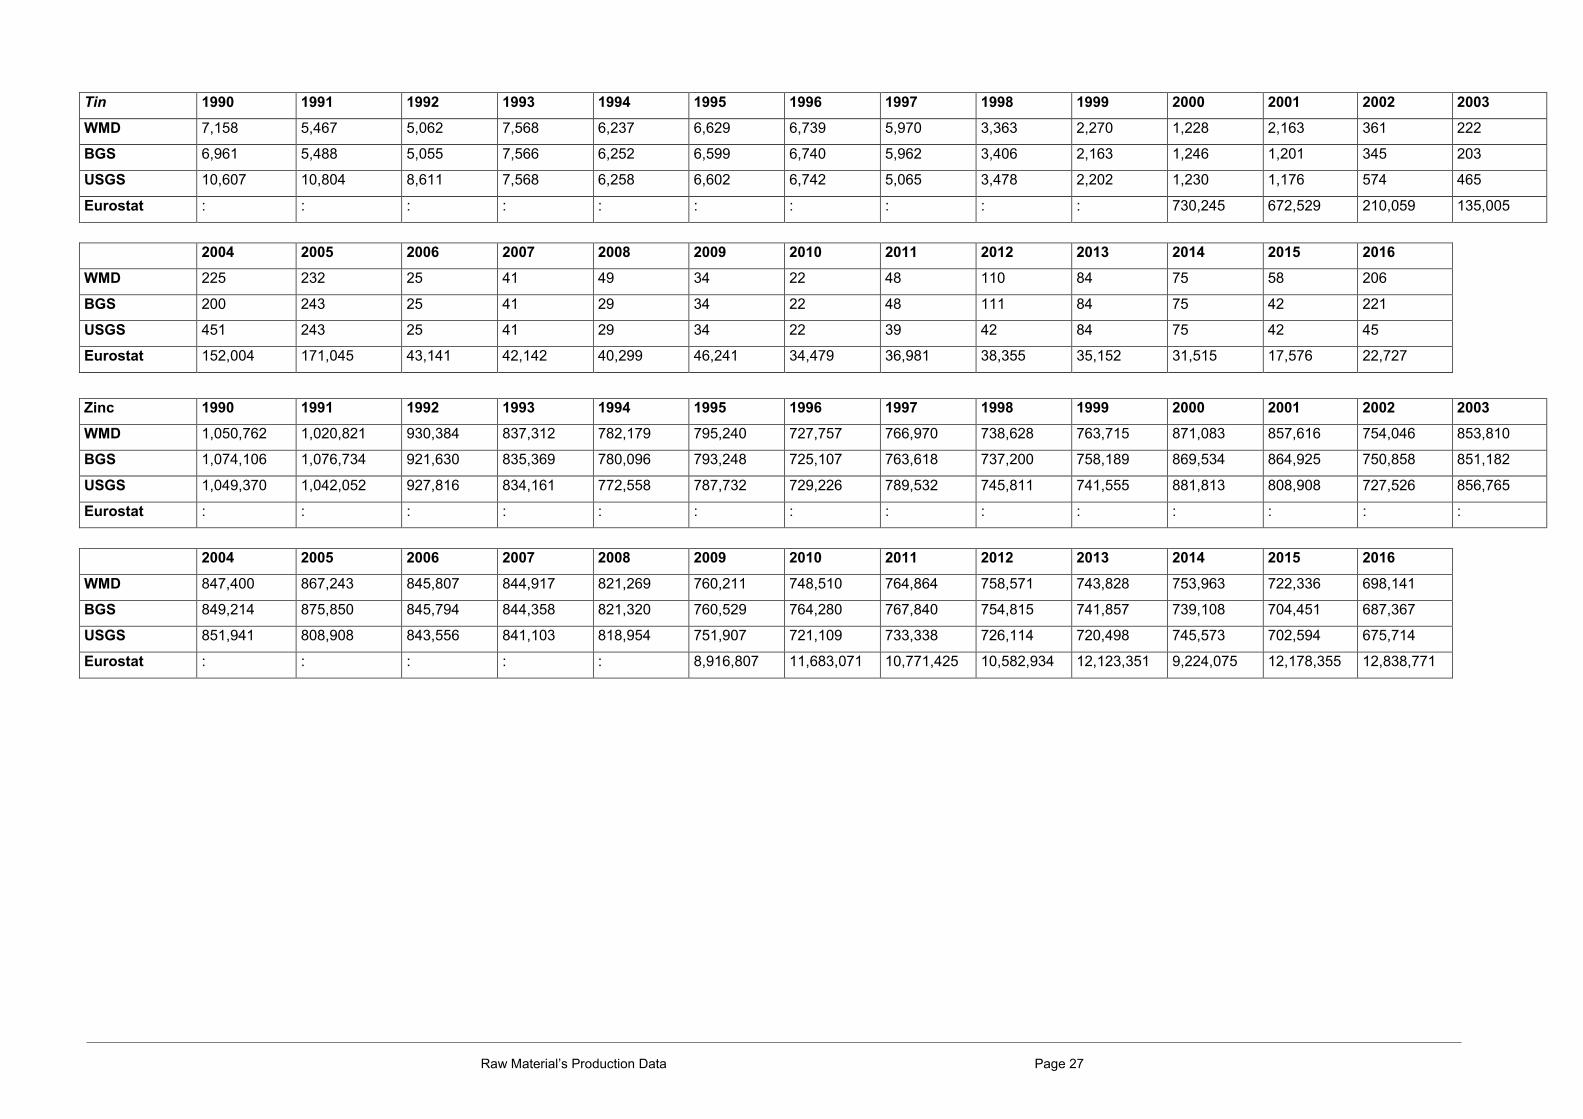
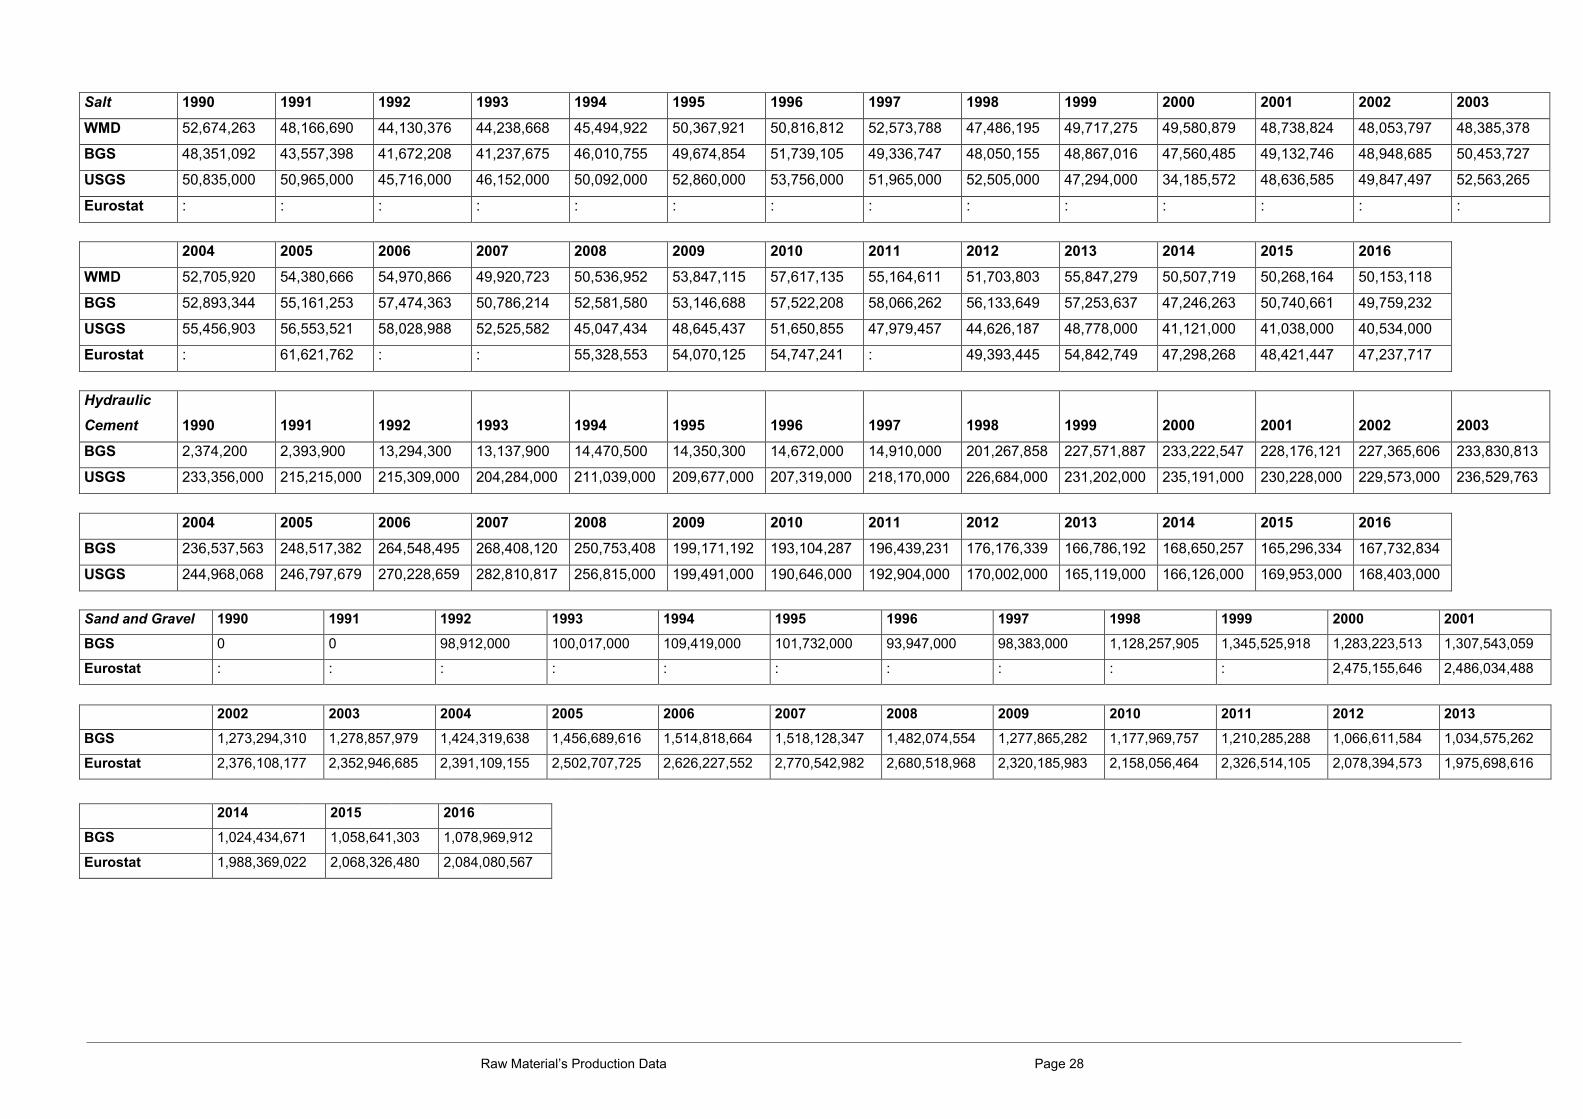
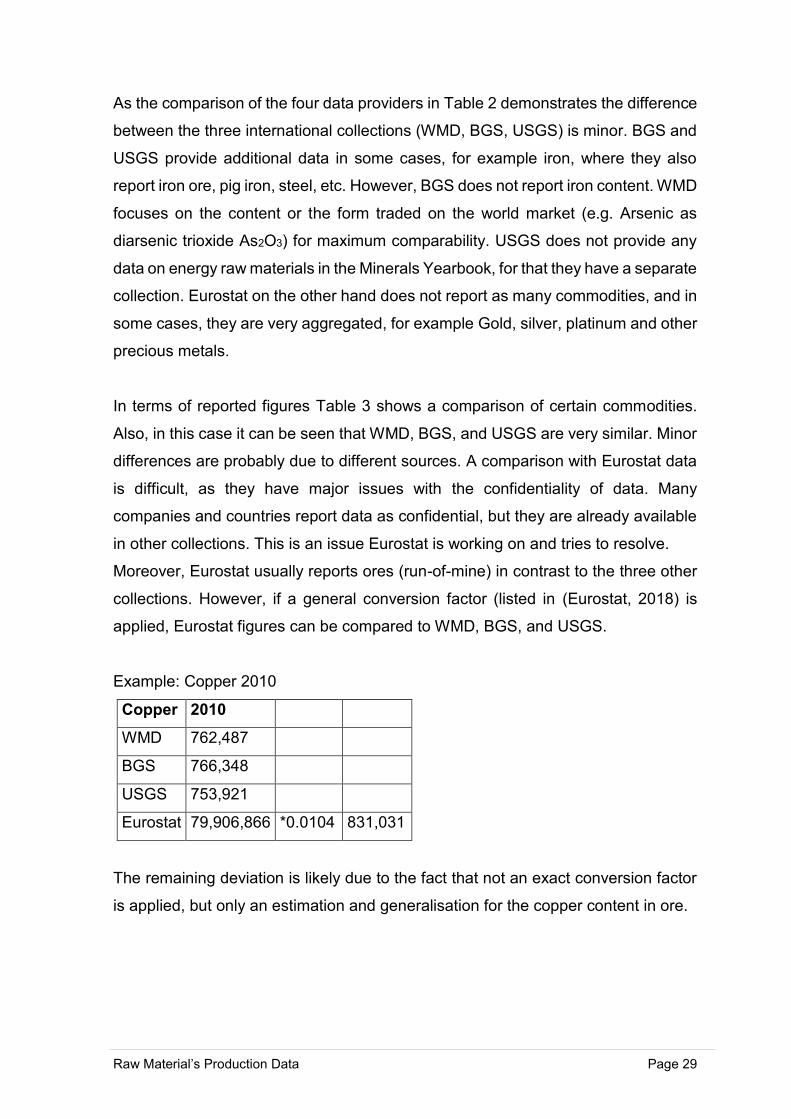
In terms of reported figures Table 3 shows a comparison of certain commodities.
Also, in this case it can be seen that WMD, BGS, and USGS are very similar. Minor
differences are probably due to different sources. A comparison with Eurostat data
is difficult, as they have major issues with the confidentiality of data. Many
companies and countries report data as confidential, but they are already available
in other collections. This is an issue Eurostat is working on and tries to resolve.
Moreover, Eurostat usually reports ores (run-of-mine) in contrast to the three other
collections. However, if a general conversion factor (listed in (Eurostat, 2018) is
applied, Eurostat figures can be compared to WMD, BGS, and USGS.
Example: Copper 2010
Copper 2010
WMD 762,487
BGS 766,348
USGS 753,921
Eurostat 79,906,866 *0.0104 831,031
The remaining deviation is likely due to the fact that not an exact conversion factor
is applied, but only an estimation and generalisation for the copper content in ore.
Raw Material’s Production Data Page 30
An objective recommendation on which data source to use cannot be given following
this evaluation, it truly depends on the intended purpose.
Considering the three global providers, BGS is preferable if long-term observations
are conducted. USGS is very useful if additional information about the raw material
is required, i.e. information on uses, deposits, prices, etc. WMD is very easy to use
and provides ready-made comparisons of country groups and economic blocks, as
well as concentration of production with the Herfindahl-Hirschman Index.
Eurostat MFA data on European level might not be useful for comparisons of metal
production data, as it reports ores rather than metal content.
However, it offers an overview of material flows (incl. imports and exports) of
European countries and can be a useful tool for sustainability considerations, if the
confidentiality issues are resolved.
Moreover, Eurostat gives figures of aggregates, such as sand and gravel.
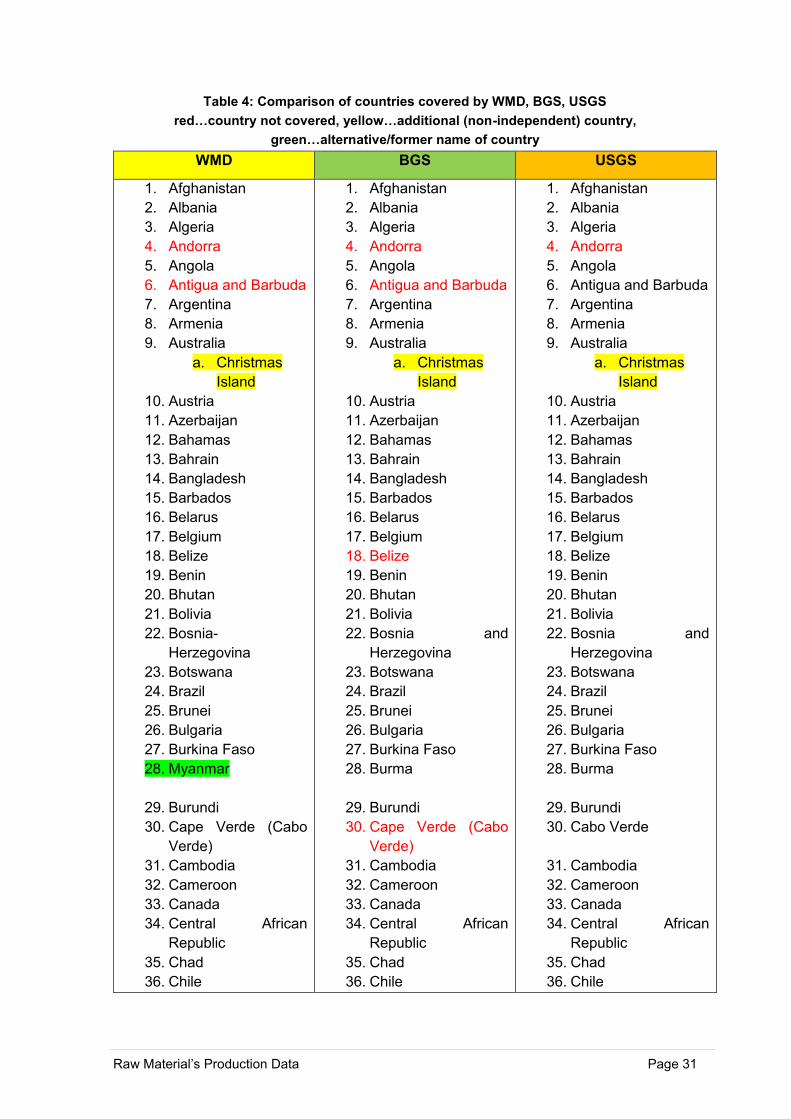
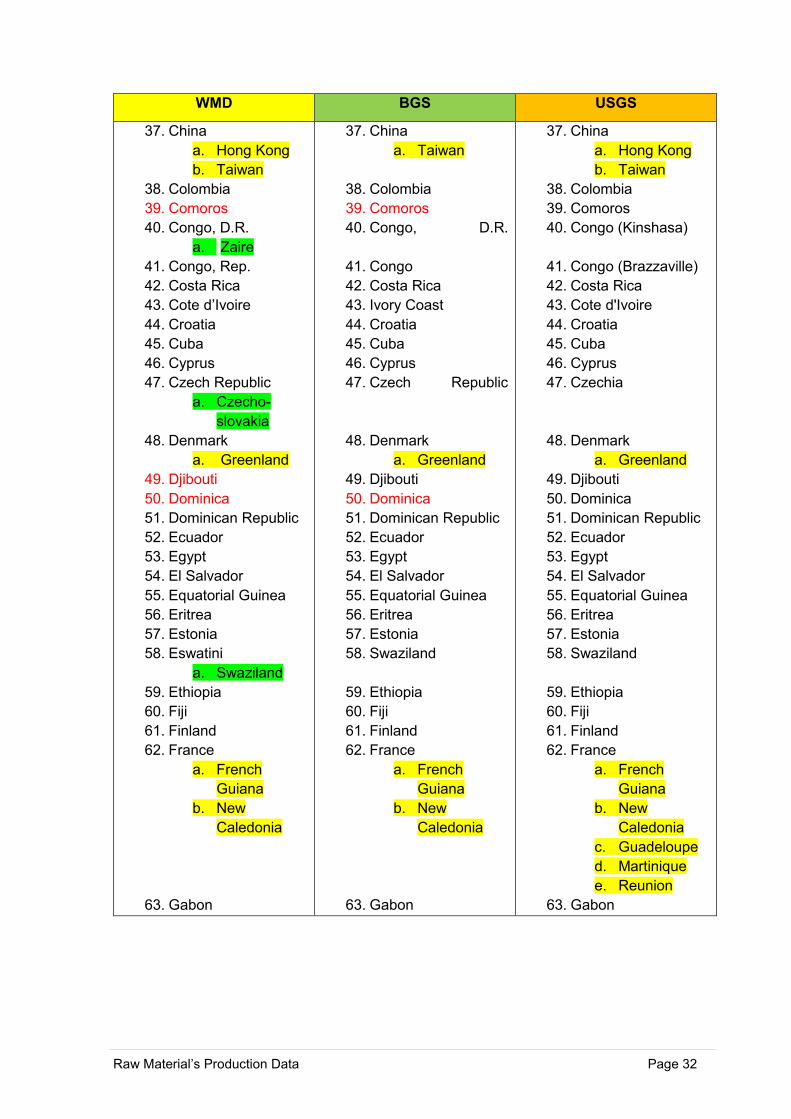
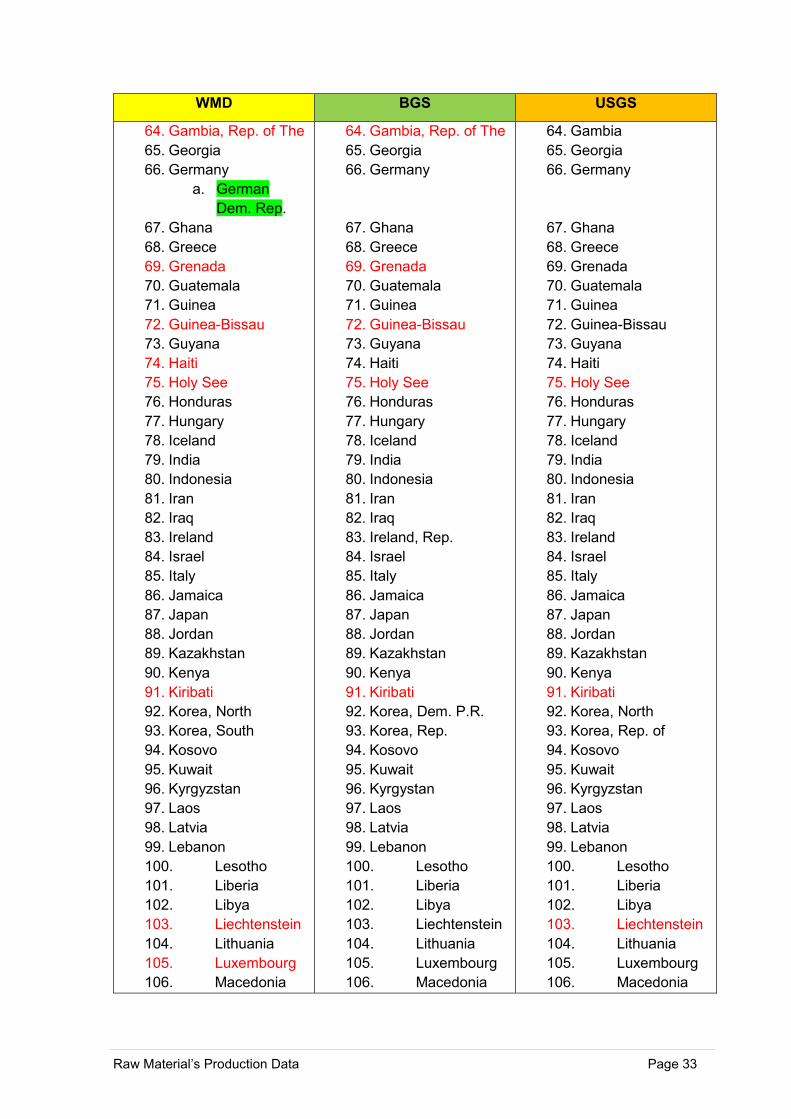
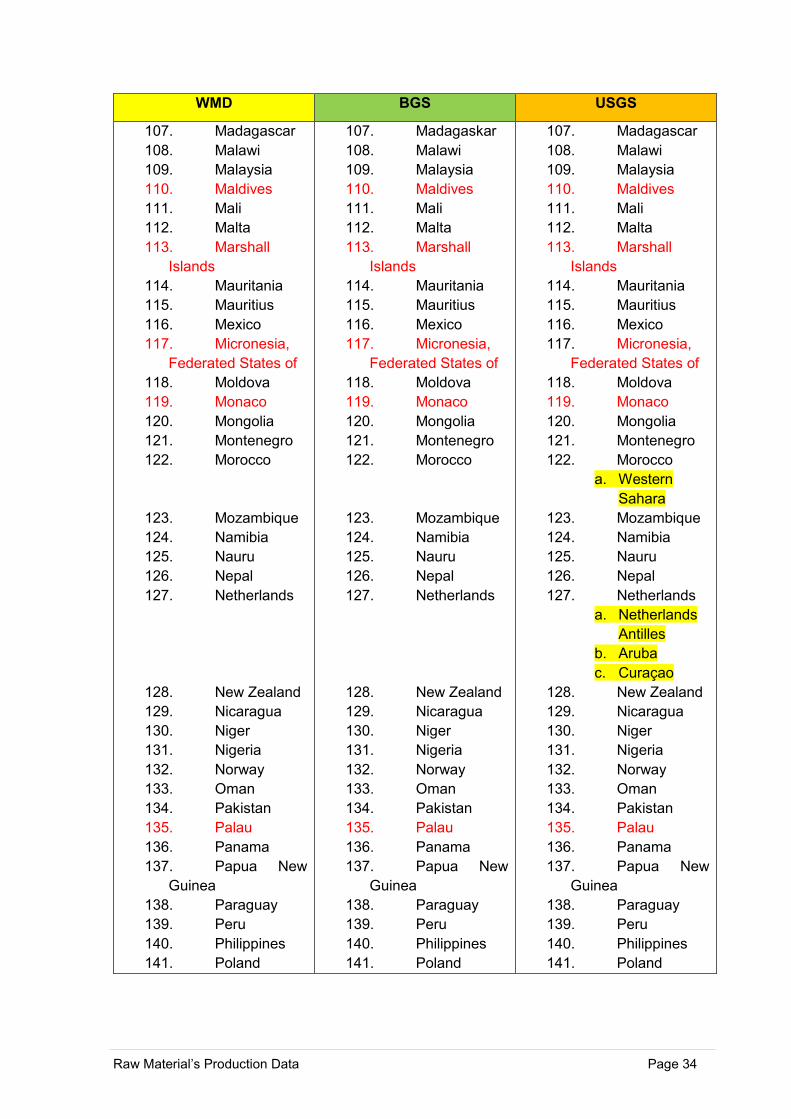
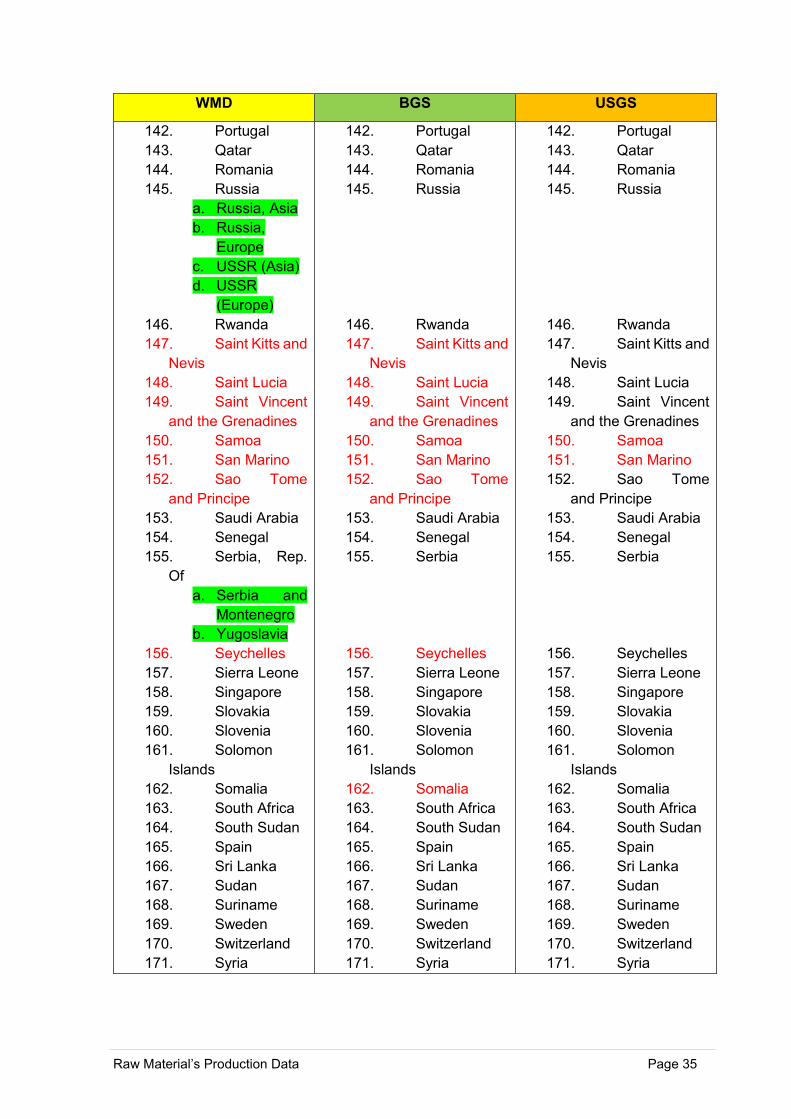
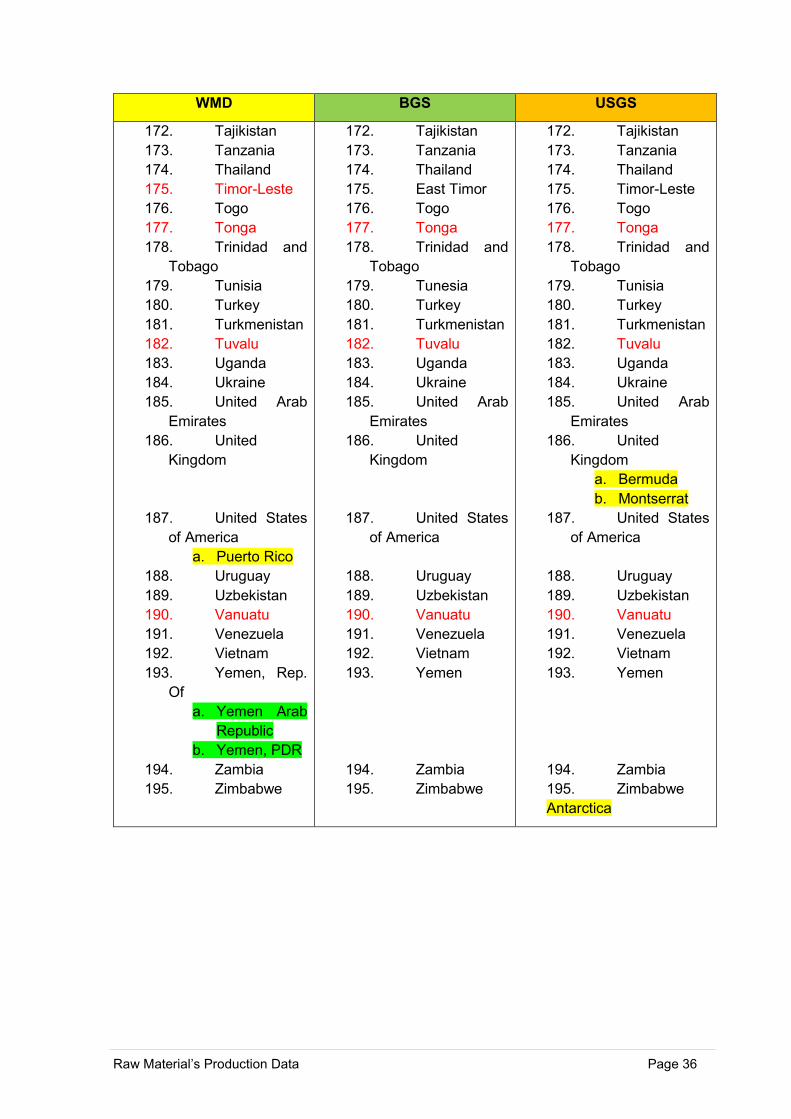
As a next step the countries covered by the three international data providers are
compared. This comparison can be seen in Table 4. As a reference the list of
independent states by the Bureau of Intelligence and Research of the U.S.
Department of State is used. (Bureau of Intelligence and Research, 2019)
Written in red are countries not covered by a data collection, highlighted in yellow
are additional (non-independent) countries separately covered by a collection, and
highlighted in green are alternative or former names and country conglomerates.
Raw Material’s Production Data Page 31
Table 4: Comparison of countries covered by WMD, BGS, USGS
red…country not covered, yellow…additional (non-independent) country,
green…alternative/former name of country
WMD BGS USGS
1. Afghanistan
2. Albania
3. Algeria
4. Andorra
5. Angola
6. Antigua and Barbuda
7. Argentina
8. Armenia
9. Australia
a. Christmas
Island
10. Austria
11. Azerbaijan
12. Bahamas
13. Bahrain
14. Bangladesh
15. Barbados
16. Belarus
17. Belgium
18. Belize
19. Benin
20. Bhutan
21. Bolivia
22. Bosnia-
Herzegovina
23. Botswana
24. Brazil
25. Brunei
26. Bulgaria
27. Burkina Faso
28. Myanmar
29. Burundi
30. Cape Verde (Cabo
Verde)
31. Cambodia
32. Cameroon
33. Canada
34. Central African
Republic
35. Chad
36. Chile
1. Afghanistan
2. Albania
3. Algeria
4. Andorra
5. Angola
6. Antigua and Barbuda
7. Argentina
8. Armenia
9. Australia
a. Christmas
Island
10. Austria
11. Azerbaijan
12. Bahamas
13. Bahrain
14. Bangladesh
15. Barbados
16. Belarus
17. Belgium
18. Belize
19. Benin
20. Bhutan
21. Bolivia
22. Bosnia and
Herzegovina
23. Botswana
24. Brazil
25. Brunei
26. Bulgaria
27. Burkina Faso
28. Burma
29. Burundi
30. Cabo Verde
31. Cambodia
32. Cameroon
33. Canada
34. Central African
Republic
35. Chad
36. Chile
Raw Material’s Production Data Page 32
WMD BGS USGS
37. China
a. Hong Kong
b. Taiwan
38. Colombia
39. Comoros
40. Congo, D.R.
a. Zaire
41. Congo, Rep.
42. Costa Rica
43. Cote d’Ivoire
44. Croatia
45. Cuba
46. Cyprus
47. Czech Republic
a. Czecho-
slovakia
48. Denmark
a. Greenland
49. Djibouti
50. Dominica
51. Dominican Republic
52. Ecuador
53. Egypt
54. El Salvador
55. Equatorial Guinea
56. Eritrea
57. Estonia
58. Eswatini
a. Swaziland
59. Ethiopia
60. Fiji
61. Finland
62. France
a. French
Guiana
b. New
Caledonia
63. Gabon
37. China
a. Taiwan
38. Colombia
39. Comoros
40. Congo, D.R.
41. Congo
42. Costa Rica
43. Ivory Coast
44. Croatia
45. Cuba
46. Cyprus
47. Czech Republic
48. Denmark
a. Greenland
49. Djibouti
50. Dominica
51. Dominican Republic
52. Ecuador
53. Egypt
54. El Salvador
55. Equatorial Guinea
56. Eritrea
57. Estonia
58. Swaziland
59. Ethiopia
60. Fiji
61. Finland
62. France
a. French
Guiana
b. New
Caledonia
63. Gabon
37. China
a. Hong Kong
b. Taiwan
38. Colombia
39. Comoros
40. Congo (Kinshasa)
41. Congo (Brazzaville)
42. Costa Rica
43. Cote d'Ivoire
44. Croatia
45. Cuba
46. Cyprus
47. Czechia
48. Denmark
a. Greenland
49. Djibouti
50. Dominica
51. Dominican Republic
52. Ecuador
53. Egypt
54. El Salvador
55. Equatorial Guinea
56. Eritrea
57. Estonia
58. Swaziland
59. Ethiopia
60. Fiji
61. Finland
62. France
a. French
Guiana
b. New
Caledonia
c. Guadeloupe
d. Martinique
e. Reunion
63. Gabon
Raw Material’s Production Data Page 33
WMD BGS USGS
64. Gambia, Rep. of The
65. Georgia
66. Germany
a. German
Dem. Rep.
67. Ghana
68. Greece
69. Grenada
70. Guatemala
71. Guinea
72. Guinea-Bissau
73. Guyana
74. Haiti
75. Holy See
76. Honduras
77. Hungary
78. Iceland
79. India
80. Indonesia
81. Iran
82. Iraq
83. Ireland
84. Israel
85. Italy
86. Jamaica
87. Japan
88. Jordan
89. Kazakhstan
90. Kenya
91. Kiribati
92. Korea, North
93. Korea, South
94. Kosovo
95. Kuwait
96. Kyrgyzstan
97. Laos
98. Latvia
99. Lebanon
100. Lesotho
101. Liberia
102. Libya
103. Liechtenstein
104. Lithuania
105. Luxembourg
106. Macedonia
64. Gambia, Rep. of The
65. Georgia
66. Germany
67. Ghana
68. Greece
69. Grenada
70. Guatemala
71. Guinea
72. Guinea-Bissau
73. Guyana
74. Haiti
75. Holy See
76. Honduras
77. Hungary
78. Iceland
79. India
80. Indonesia
81. Iran
82. Iraq
83. Ireland, Rep.
84. Israel
85. Italy
86. Jamaica
87. Japan
88. Jordan
89. Kazakhstan
90. Kenya
91. Kiribati
92. Korea, Dem. P.R.
93. Korea, Rep.
94. Kosovo
95. Kuwait
96. Kyrgystan
97. Laos
98. Latvia
99. Lebanon
100. Lesotho
101. Liberia
102. Libya
103. Liechtenstein
104. Lithuania
105. Luxembourg
106. Macedonia
64. Gambia
65. Georgia
66. Germany
67. Ghana
68. Greece
69. Grenada
70. Guatemala
71. Guinea
72. Guinea-Bissau
73. Guyana
74. Haiti
75. Holy See
76. Honduras
77. Hungary
78. Iceland
79. India
80. Indonesia
81. Iran
82. Iraq
83. Ireland
84. Israel
85. Italy
86. Jamaica
87. Japan
88. Jordan
89. Kazakhstan
90. Kenya
91. Kiribati
92. Korea, North
93. Korea, Rep. of
94. Kosovo
95. Kuwait
96. Kyrgyzstan
97. Laos
98. Latvia
99. Lebanon
100. Lesotho
101. Liberia
102. Libya
103. Liechtenstein
104. Lithuania
105. Luxembourg
106. Macedonia
Raw Material’s Production Data Page 34
WMD BGS USGS
107. Madagascar
108. Malawi
109. Malaysia
110. Maldives
111. Mali
112. Malta
113. Marshall
Islands
114. Mauritania
115. Mauritius
116. Mexico
117. Micronesia,
Federated States of
118. Moldova
119. Monaco
120. Mongolia
121. Montenegro
122. Morocco
123. Mozambique
124. Namibia
125. Nauru
126. Nepal
127. Netherlands
128. New Zealand
129. Nicaragua
130. Niger
131. Nigeria
132. Norway
133. Oman
134. Pakistan
135. Palau
136. Panama
137. Papua New
Guinea
138. Paraguay
139. Peru
140. Philippines
141. Poland
107. Madagaskar
108. Malawi
109. Malaysia
110. Maldives
111. Mali
112. Malta
113. Marshall
Islands
114. Mauritania
115. Mauritius
116. Mexico
117. Micronesia,
Federated States of
118. Moldova
119. Monaco
120. Mongolia
121. Montenegro
122. Morocco
123. Mozambique
124. Namibia
125. Nauru
126. Nepal
127. Netherlands
128. New Zealand
129. Nicaragua
130. Niger
131. Nigeria
132. Norway
133. Oman
134. Pakistan
135. Palau
136. Panama
137. Papua New
Guinea
138. Paraguay
139. Peru
140. Philippines
141. Poland
107. Madagascar
108. Malawi
109. Malaysia
110. Maldives
111. Mali
112. Malta
113. Marshall
Islands
114. Mauritania
115. Mauritius
116. Mexico
117. Micronesia,
Federated States of
118. Moldova
119. Monaco
120. Mongolia
121. Montenegro
122. Morocco
a. Western
Sahara
123. Mozambique
124. Namibia
125. Nauru
126. Nepal
127. Netherlands
a. Netherlands
Antilles
b. Aruba
c. Curaçao
128. New Zealand
129. Nicaragua
130. Niger
131. Nigeria
132. Norway
133. Oman
134. Pakistan
135. Palau
136. Panama
137. Papua New
Guinea
138. Paraguay
139. Peru
140. Philippines
141. Poland
Raw Material’s Production Data Page 35
WMD BGS USGS
142. Portugal
143. Qatar
144. Romania
145. Russia
a. Russia, Asia
b. Russia,
Europe
c. USSR (Asia)
d. USSR
(Europe)
146. Rwanda
147. Saint Kitts and
Nevis
148. Saint Lucia
149. Saint Vincent
and the Grenadines
150. Samoa
151. San Marino
152. Sao Tome
and Principe
153. Saudi Arabia
154. Senegal
155. Serbia, Rep.
Of
a. Serbia and
Montenegro
b. Yugoslavia
156. Seychelles
157. Sierra Leone
158. Singapore
159. Slovakia
160. Slovenia
161. Solomon
Islands
162. Somalia
163. South Africa
164. South Sudan
165. Spain
166. Sri Lanka
167. Sudan
168. Suriname
169. Sweden
170. Switzerland
171. Syria
142. Portugal
143. Qatar
144. Romania
145. Russia
146. Rwanda
147. Saint Kitts and
Nevis
148. Saint Lucia
149. Saint Vincent
and the Grenadines
150. Samoa
151. San Marino
152. Sao Tome
and Principe
153. Saudi Arabia
154. Senegal
155. Serbia
156. Seychelles
157. Sierra Leone
158. Singapore
159. Slovakia
160. Slovenia
161. Solomon
Islands
162. Somalia
163. South Africa
164. South Sudan
165. Spain
166. Sri Lanka
167. Sudan
168. Suriname
169. Sweden
170. Switzerland
171. Syria
Raw Material’s Production Data Page 36
WMD BGS USGS
172. Tajikistan
173. Tanzania
174. Thailand
175. Timor-Leste
176. Togo
177. Tonga
178. Trinidad and
Tobago
179. Tunisia
180. Turkey
181. Turkmenistan
182. Tuvalu
183. Uganda
184. Ukraine
185. United Arab
Emirates
186. United
Kingdom
187. United States
of America
a. Puerto Rico
188. Uruguay
189. Uzbekistan
190. Vanuatu
191. Venezuela
192. Vietnam
193. Yemen, Rep.
Of
a. Yemen Arab
Republic
b. Yemen, PDR
194. Zambia
195. Zimbabwe
172. Tajikistan
173. Tanzania
174. Thailand
175. East Timor
176. Togo
177. Tonga
178. Trinidad and
Tobago
179. Tunesia
180. Turkey
181. Turkmenistan
182. Tuvalu
183. Uganda
184. Ukraine
185. United Arab
Emirates
186. United
Kingdom
187. United States
of America
188. Uruguay
189. Uzbekistan
190. Vanuatu
191. Venezuela
192. Vietnam
193. Yemen
194. Zambia
195. Zimbabwe
172. Tajikistan
173. Tanzania
174. Thailand
175. Timor-Leste
176. Togo
177. Tonga
178. Trinidad and
Tobago
179. Tunisia
180. Turkey
181. Turkmenistan
182. Tuvalu
183. Uganda
184. Ukraine
185. United Arab
Emirates
186. United
Kingdom
a. Bermuda
b. Montserrat
187. United States
of America
188. Uruguay
189. Uzbekistan
190. Vanuatu
191. Venezuela
192. Vietnam
193. Yemen
194. Zambia
195. Zimbabwe
Antarctica
Raw Material’s Production Data Page 37
According to the website for the WMD the report covers 168 countries. In the report
of 2019, figures for 165 countries could be found. This number includes seven non-
independent countries, e.g. Greenland or Puerto Rico. However, WMD includes all
of the red-marked countries (apart from the Holy See and San Marino) in the
regional and development status groups section.
BGS covers 167 countries, these include five additional (non-independent)
countries.
USGS covers the most countries of all reports especially considering the additional
countries covered separately from their sovereignty state. It covers 174 countries
including nine non-independent countries plus Antarctica.
There are thirteen countries not covered by any of the three data providers. These
are Andorra, Holy See, Kiribati, Maldives, Marshall Islands, Micronesia, Monaco,
Palau, Samoa, San Marino, Tonga, Tuvalu, and Vanuatu. However, it is likely that
these states don’t have any mineral production whatsoever and are fully dependent
on imports.
Raw Material’s Production Data Page 38
3 Applications
This chapter aims at explaining the importance of production data reported by the
organisations analysed in chapter 2 Collections of Raw Material’s Production Data
by showing some applications where they are invaluable. Production data is not only
an important tool for strategic planning by companies but also for policy makers
enabling them to make forecasts and adapt commodity planning. For instance, the
data is used by the European Union to develop their list of critical raw materials
where economic importance and the supply risk of different commodities are
evaluated.
3.1 European Commission List of Critical Raw Materials
In 2008 the European Commission launched the raw materials initiative with the
goal of ensuring access and affordability of mineral raw materials; thereby securing
a functioning economy. Sectors such as construction, chemicals, and automotive,
etc. are all highly dependent on raw materials, and provide 30 million jobs in Europe.
This means supporting these industries by changing towards a more efficient use of
materials, especially those where the EU depends on import, and a sustainable
development is necessary.
The raw materials initiative acts on three different pillars:
1. Ensure access to raw materials on the world market
2. Foster supply of raw materials from European sources
3. Boost resource efficiency and recycling
One priority action is the development of a list of materials critical for the EU. This
is an important decision as the number and amount of raw materials required for
industry and end-use purposes increases steadily. Between 2010 and 2030 an
increase of global resource use of 100% can be expected and technological
progress and quality of life rely on an undisturbed access to raw materials. (Gislev
et al., 2018; European Commission, 2008)
Raw Material’s Production Data Page 39
Since 2011 the European Commission publishes a list of critical raw materials in a
three-year interval. The last list was published in 2017 evaluating 61 materials on
economic importance and supply risk for the EU. For this assessment the collections
investigated in chapter 2 are the main source of data.
The purpose of the criticality assessment is to enhance the European minerals
sector and support policy making on EU level.
The main targets are:
• Implementation of the industrial strategy by strengthening the
competitiveness of European industry.
• Enhancing the European mining and recycling industry and stimulating
production of critical raw materials.
• Enforce the EU circular economy action plan by promoting efficient use and
recycling of critical raw materials.
• Identify and inform about potential supply risks and related opportunities of
critical raw materials.
• Negotiate trade agreements, dispute existing trade distortion measures,
enhance research and innovation, as well as implementation of Sustainable
Development Goals.
(DG Grow, Unit C2 Resource Efficiency and Raw Materials, 2019)
Many of the critical raw materials are used for high tech products and emerging
innovations, for example solar panels, wind turbines, and electric vehicles. Due to
their importance for fighting climate change the demand for certain materials might
rise by a factor of 20 until 2030. However, the EU faces an imbalance between
upstream industries (extraction of raw materials) and downstream industries
(manufacturing and use) with European industry dominated by manufacturing rather
than mining. Also recycling of critical raw materials must be improved – the supply
from secondary sources is very limited. This is why enhancing those two industries
has to be a main target and requires careful attention. (Gislev et al., 2018)
Raw Material’s Production Data Page 40
3.1.1 Evaluation of criticality
The indicators used to assess the criticality of a raw material for the EU economy
are “Economic Importance” and “Supply Risk” based on historical data rather than
forecasts. Economic Importance defines the severity of the consequences for the
economy if the supply of a raw material is not sufficient. The methodology for the
assessment of critical raw materials was changed between 2014 and 2017 in order
to improve allocation of the raw material to the associated industry sectors.
Moreover, substitution has been included in both economic importance and supply
risk as a mitigating factor. (Blengini et al., 2017; Gislev et al., 2018)
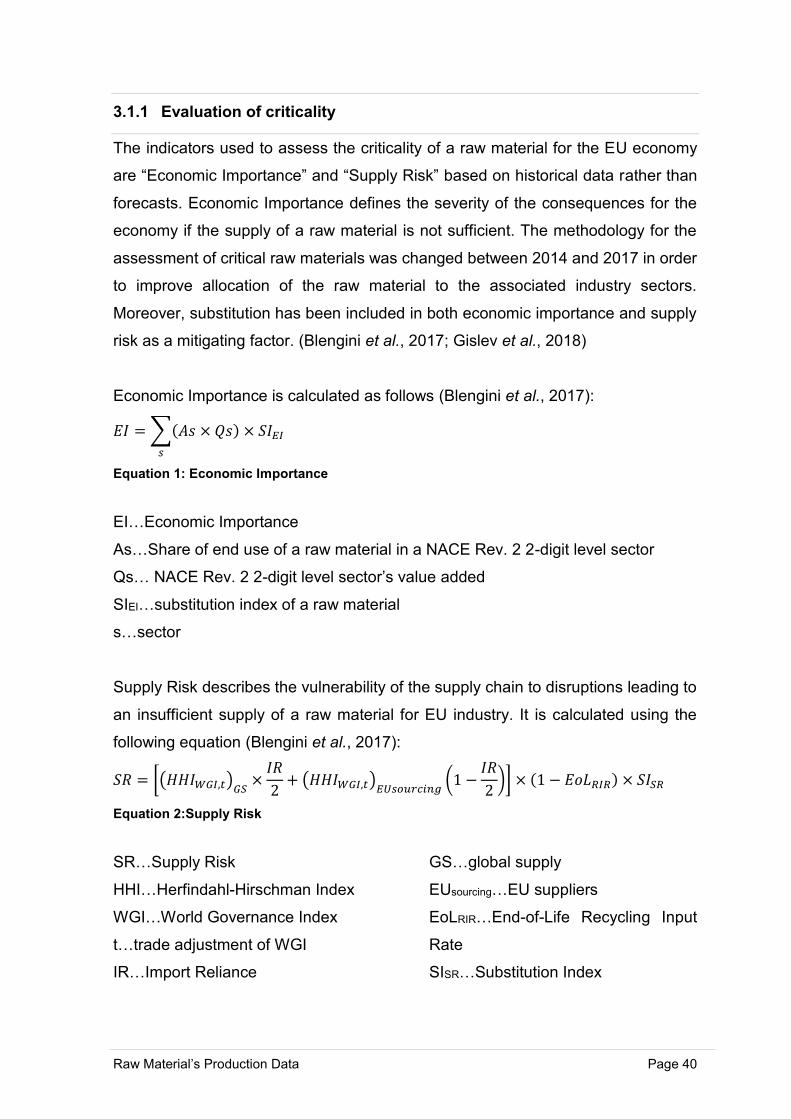
Economic Importance is calculated as follows (Blengini et al., 2017):
𝐸𝐼 =∑(𝐴𝑠 × 𝑄𝑠) × 𝑆𝐼𝐸𝐼𝑠
Equation 1: Economic Importance
EI…Economic Importance
As…Share of end use of a raw material in a NACE Rev. 2 2-digit level sector
Qs… NACE Rev. 2 2-digit level sector’s value added
SIEI…substitution index of a raw material
s…sector
Supply Risk describes the vulnerability of the supply chain to disruptions leading to
an insufficient supply of a raw material for EU industry. It is calculated using the
following equation (Blengini et al., 2017):
𝑆𝑅 = [(𝐻𝐻𝐼𝑊𝐺𝐼,𝑡)𝐺𝑆 ×𝐼𝑅
2+ (𝐻𝐻𝐼𝑊𝐺𝐼,𝑡)𝐸𝑈𝑠𝑜𝑢𝑟𝑐𝑖𝑛𝑔 (1 −
𝐼𝑅
2)] × (1 − 𝐸𝑜𝐿𝑅𝐼𝑅) × 𝑆𝐼𝑆𝑅
Equation 2:Supply Risk
SR…Supply Risk
HHI…Herfindahl-Hirschman Index
WGI…World Governance Index
t…trade adjustment of WGI
IR…Import Reliance
GS…global supply
EUsourcing…EU suppliers
EoLRIR…End-of-Life Recycling Input
Rate
SISR…Substitution Index
Raw Material’s Production Data Page 41
If possible WMD is used for production data because they are most coherent in
terms of what is reported (metal content or concentrate), and in terms of sources
and accuracy of data which are all clearly stated. However, in some cases BGS data
is used, for example, in the case of Strontium (evaluated for the first time in the
study to be published in 2020) because it is not reported in WMD. For helium and
silicon metal BGS is the source of data. Hafnium, which is on the criticality list of
2017, is not reported in WMD. However, neither BGS nor USGS, who both include
it in their data, report any production of Hafnium in recent years. For import and
export figures Eurostat COMEXT database is used (also basis for MFA trade data
evaluated in chapter 2) and USGS is an important source for information on the raw
material itself, incl. uses, deposits, international market structure, etc.
Figure 6 shows the main producer in the year 2017 of each critical raw material of
the 2017 list including production figures and share of global production. The data
is taken from WMD, apart from helium and silicon metal where BGS data is used.
(Hafnium is not included.)
The CRM list differentiates between light and heavy rare earth metals. The rare
earth element scandium is also evaluated separately. However, WMD, BGS, and
USGS report them aggregated as rare earths minerals. The same issue arises for
phosphate rock and phosphorus, both are analysed individually, but the three global
data providers cover phosphate rock (BGS, USGS) or phosphates (P2O5 content,
WMD). Differences can also be seen for borate (BGS) or boron (WMD), USGS
reports boron minerals, and magnesium (BGS) or magnesite (WMD), USGS
documents magnesium compounds as MgO equivalent. On the other hand, the
criticality study includes platinum group metals in an aggregated form, whereas,
WMD, BGS, and USGS all report platinum, palladium, and rhodium separately.
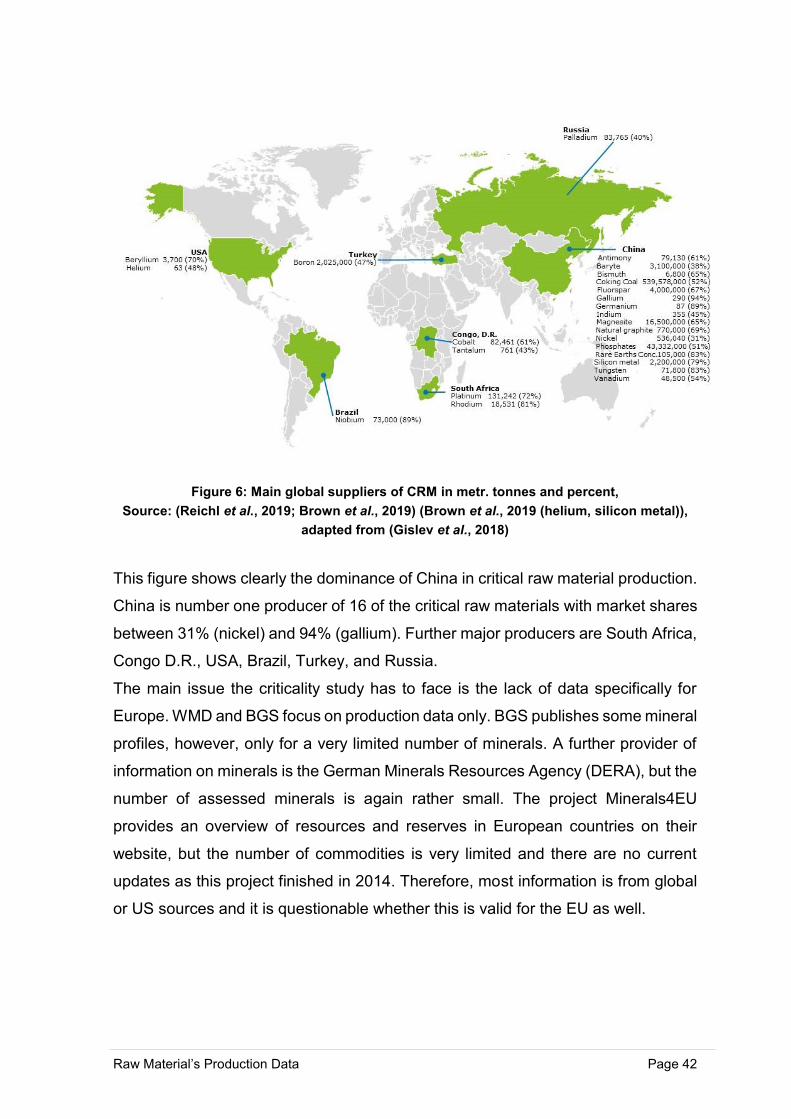
Raw Material’s Production Data Page 42
Figure 6: Main global suppliers of CRM in metr. tonnes and percent,
Source: (Reichl et al., 2019; Brown et al., 2019) (Brown et al., 2019 (helium, silicon metal)),
adapted from (Gislev et al., 2018)
This figure shows clearly the dominance of China in critical raw material production.
China is number one producer of 16 of the critical raw materials with market shares
between 31% (nickel) and 94% (gallium). Further major producers are South Africa,
Congo D.R., USA, Brazil, Turkey, and Russia.
The main issue the criticality study has to face is the lack of data specifically for
Europe. WMD and BGS focus on production data only. BGS publishes some mineral
profiles, however, only for a very limited number of minerals. A further provider of
information on minerals is the German Minerals Resources Agency (DERA), but the
number of assessed minerals is again rather small. The project Minerals4EU
provides an overview of resources and reserves in European countries on their
website, but the number of commodities is very limited and there are no current
updates as this project finished in 2014. Therefore, most information is from global
or US sources and it is questionable whether this is valid for the EU as well.
Raw Material’s Production Data Page 43
Arsenic, for example, is a popular chemical for wood treatment in form of the
compound chromated copper arsenate (CCA). In the US this is the main use of
Arsenic making up for almost 90% of total consumption. (George, 2019)
However, this application is highly restricted and subject to prior authorisation in the
EU due to its toxicity, meaning US consumption patterns cannot be used for the EU
and a source providing a distribution of European arsenic consumption is not
available.
This is an issue addressed by the Strategic Implementation Plan for European
Innovation Partnership on Raw Materials which emphasises the need for a
Geological Knowledge Base and Minerals Intelligence Information. For this purpose
DG JRC in cooperation with DG GROWTH has established RMIS – Raw Materials
Information System, a platform providing information on non-fuel, non-agricultural
raw materials from primary and secondary sources. However, especially the raw
materials’ profiles are incomplete for the time being. (EuroGeoSurveys, 2016; Joint
Research Centre, 2019)
Furthermore, as noted by the European Commission (2014) in a communication on
the list of critical raw materials and the implementation of the Raw Materials
Initiative, this initiative has not yet had a quantifiable effect on European production.
It is also not known how EU member states implement the suggestions of the raw
materials initiative. However, the Horizon 2020 programme supports a number of
projects aiming at creating guidelines for EU policies in order to develop a
harmonised framework for EU members to implement, supporting the raw materials
industry in Europe. One example of such a project is MinLand where
Montanuniversitaet Leoben is a consortium partner.
The main objective of MinLand is to enable extraction of mineral raw materials by
securing access to land for exploration and extraction. This is not an easy task due
to different interests regarding land-use. However, in order to decrease EU’s
dependencies from imports (especially of the critical raw materials) it is necessary
to strengthen domestic production. (MinLand, 2019)
Raw Material’s Production Data Page 44
Another project within the Horizon 2020 framework supporting the extractive
industry is MIREU (Mining and Metallurgy Regions of EU) also supported by
Montanuniversitaet Leoben. On the one hand MIREU aims at improving conditions
for the development and supply of raw materials in the EU. On the other hand, it
also works at the creation of a social guidance to operate on EU level to develop
standards for responsible and sustainable mining including the incorporation of
affected stakeholders. MIREU also wants to raise awareness about mining and the
need for mineral raw materials. (MIREU, 2017)
3.2 Circular Economy
One of the reasons for launching the Raw Materials Initiative is to enforce the
Circular Economy Action Plan. Circular economy is a concept of reducing the input
of primary raw materials, keeping their value in the economy for as long as possible,
and minimising the output of waste by recycling, repairing, and reusing products and
materials. At the moment this seems to be the best way forward in order to maintain
and promote high standards of living without completely depleting Earth’s
resources.
When talking about circular economy, two forms of “loop closing” have to be
differentiated:
• Socioeconomic loop closing (recycling materials as secondary material
inputs)
• Ecological loop closing (use of renewable biomass)
(Mayer et al., 2018; Gislev et al., 2018; European Commission, 2015; Haas et al.,
2015)
Raw Material’s Production Data Page 45
Considering the critical raw materials, the recycling input rate is fairly low to non-
existent. In 2011 Braedel et al. (UNEP) published a status report on the recycling
rates of metals showing that many metals included in the EU list of critical raw
materials are virtually not recycled at all, for example boron and scandium, all
evaluated indicators – old scrap ratio (OSR), collection rate (CR), and end-of-life
recycling rate (EOL-RR) – are not ascertainable or below 1%. This is an issue the
EU wants to address not only to secure the supply for the European industry, but
also because energy and water use is usually significantly lower for secondary
materials than for primary raw materials.
Circular economy is believed to help industries in the EU by boosting
competitiveness, protecting it against volatile raw material prices and insufficient
supply, and by creating new business opportunities. An example is “eco-design” of
products. The goal is to improve the reparability and disassembly of products which
helps the recycling process. Both design, allowing dismantling and recycling of the
contained raw materials, and a better communication between manufacturers and
recyclers need to be addressed. A model case for these improvement requirements
is the electronics sector, especially considering smart phones, often containing
critical raw materials. (Gislev et al., 2018; European Commission, 2015; Haas et al.,
2015; Mayer et al., 2018; Braedel et al., 2011)
Apart from the Action Plan for the Circular Economy also the Extractive Waste
Directive takes important steps towards a sustainable use of resources. Mining
companies are required to provide a waste management plan for the minimisation,
treatment, recovery, and disposal of extractive waste. This is to make sure that
adverse effects on the environment and human health are minimised, and raw
materials from extractive waste are recovered as completely as possible. (Gislev et
al., 2018)
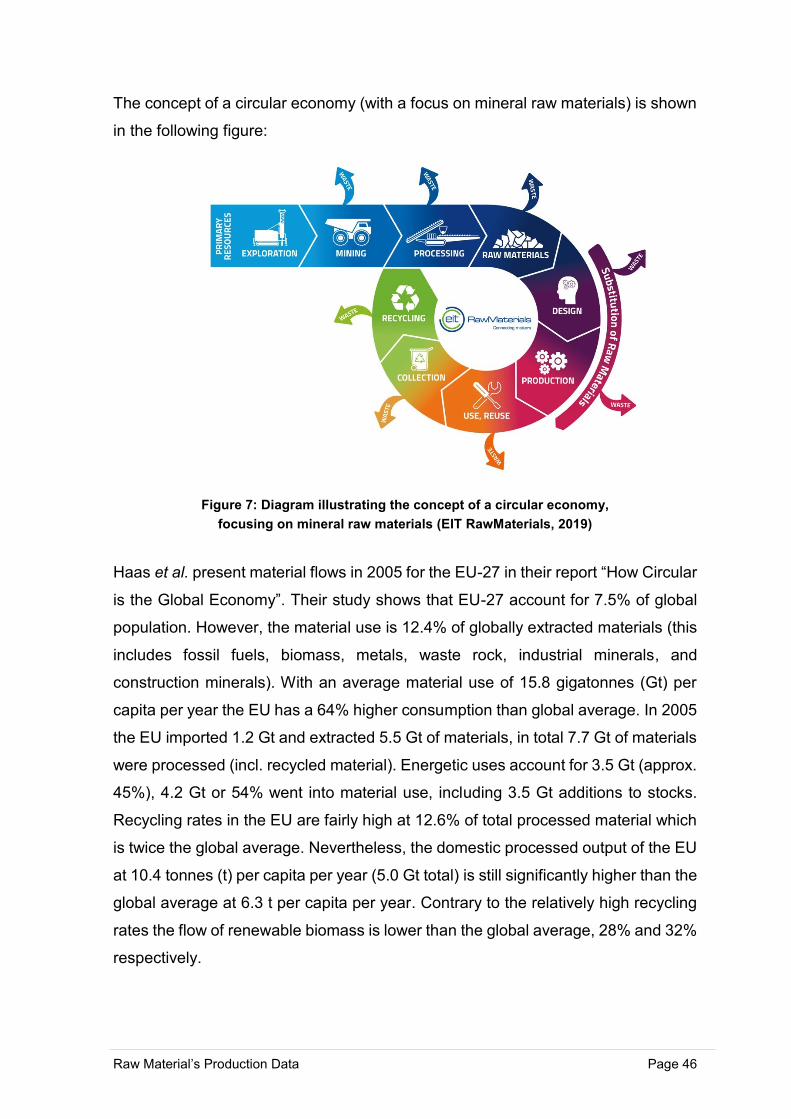
Raw Material’s Production Data Page 46
The concept of a circular economy (with a focus on mineral raw materials) is shown
in the following figure:
Figure 7: Diagram illustrating the concept of a circular economy,
focusing on mineral raw materials (EIT RawMaterials, 2019)
Haas et al. present material flows in 2005 for the EU-27 in their report “How Circular
is the Global Economy”. Their study shows that EU-27 account for 7.5% of global
population. However, the material use is 12.4% of globally extracted materials (this
includes fossil fuels, biomass, metals, waste rock, industrial minerals, and
construction minerals). With an average material use of 15.8 gigatonnes (Gt) per
capita per year the EU has a 64% higher consumption than global average. In 2005
the EU imported 1.2 Gt and extracted 5.5 Gt of materials, in total 7.7 Gt of materials
were processed (incl. recycled material). Energetic uses account for 3.5 Gt (approx.
45%), 4.2 Gt or 54% went into material use, including 3.5 Gt additions to stocks.
Recycling rates in the EU are fairly high at 12.6% of total processed material which
is twice the global average. Nevertheless, the domestic processed output of the EU
at 10.4 tonnes (t) per capita per year (5.0 Gt total) is still significantly higher than the
global average at 6.3 t per capita per year. Contrary to the relatively high recycling
rates the flow of renewable biomass is lower than the global average, 28% and 32%
respectively.
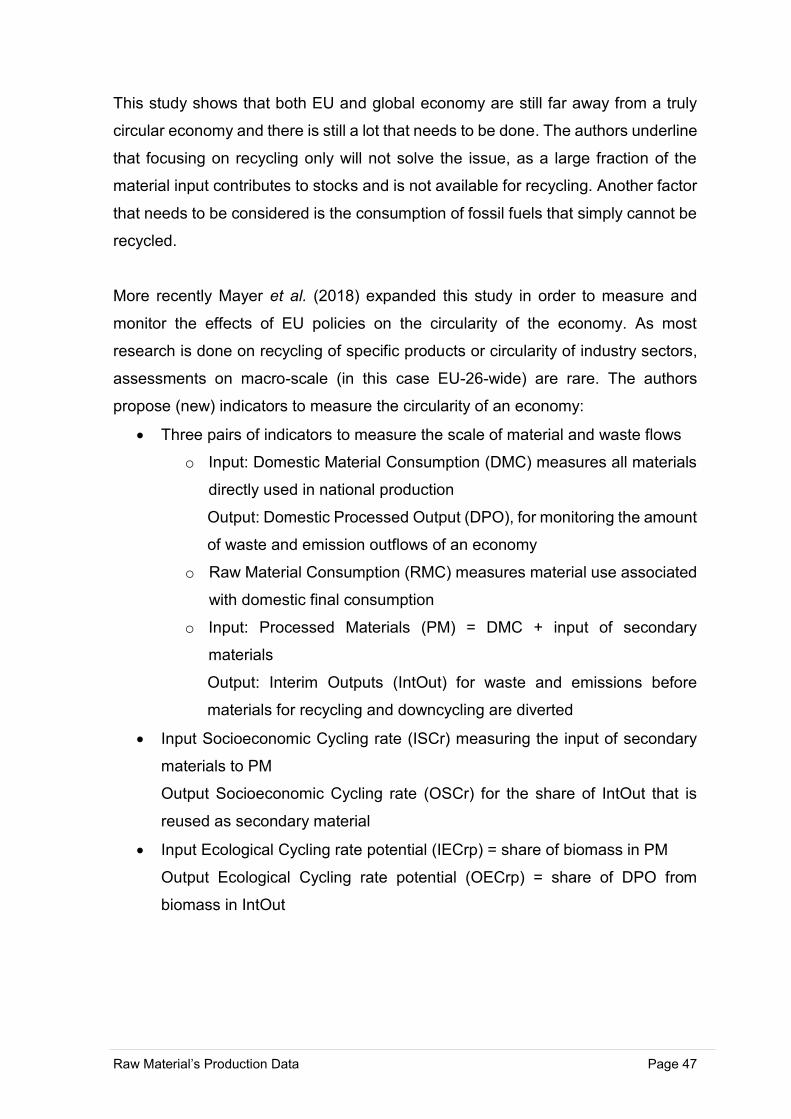
Raw Material’s Production Data Page 47
This study shows that both EU and global economy are still far away from a truly
circular economy and there is still a lot that needs to be done. The authors underline
that focusing on recycling only will not solve the issue, as a large fraction of the
material input contributes to stocks and is not available for recycling. Another factor
that needs to be considered is the consumption of fossil fuels that simply cannot be
recycled.
More recently Mayer et al. (2018) expanded this study in order to measure and
monitor the effects of EU policies on the circularity of the economy. As most
research is done on recycling of specific products or circularity of industry sectors,
assessments on macro-scale (in this case EU-26-wide) are rare. The authors
propose (new) indicators to measure the circularity of an economy:
• Three pairs of indicators to measure the scale of material and waste flows
o Input: Domestic Material Consumption (DMC) measures all materials
directly used in national production
Output: Domestic Processed Output (DPO), for monitoring the amount
of waste and emission outflows of an economy
o Raw Material Consumption (RMC) measures material use associated
with domestic final consumption
o Input: Processed Materials (PM) = DMC + input of secondary
materials
Output: Interim Outputs (IntOut) for waste and emissions before
materials for recycling and downcycling are diverted
• Input Socioeconomic Cycling rate (ISCr) measuring the input of secondary
materials to PM
Output Socioeconomic Cycling rate (OSCr) for the share of IntOut that is
reused as secondary material
• Input Ecological Cycling rate potential (IECrp) = share of biomass in PM
Output Ecological Cycling rate potential (OECrp) = share of DPO from
biomass in IntOut
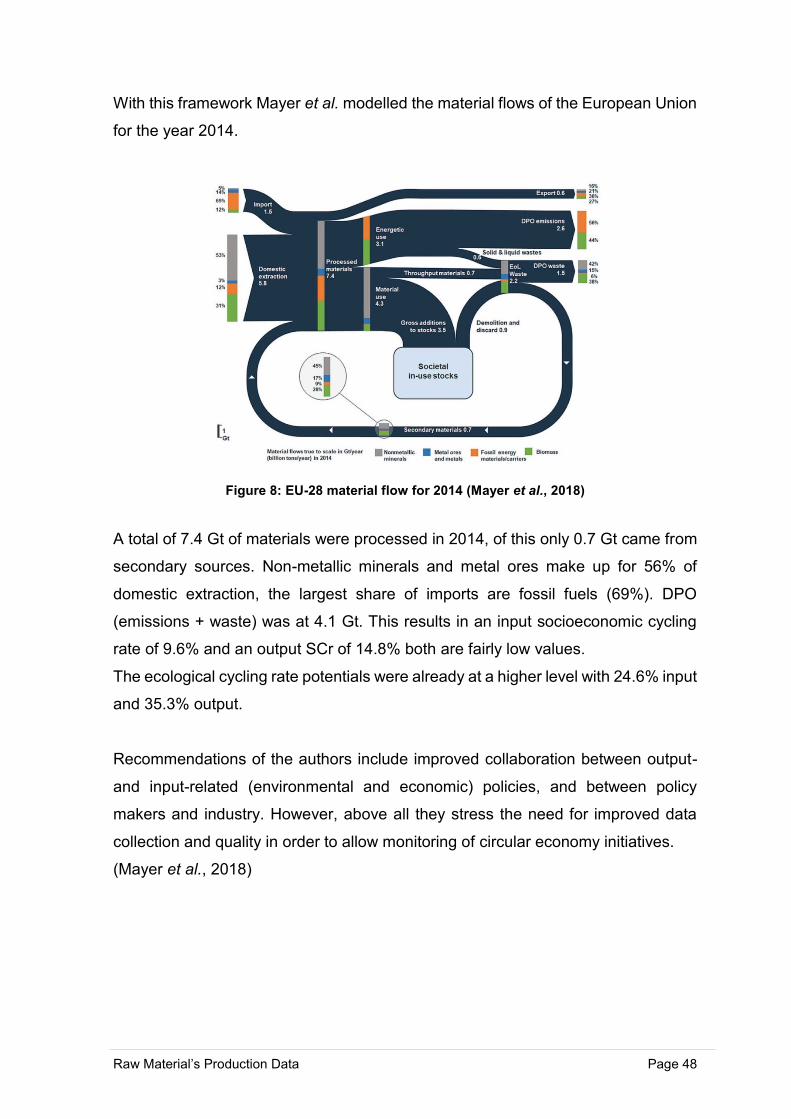
Raw Material’s Production Data Page 48
With this framework Mayer et al. modelled the material flows of the European Union
for the year 2014.
Figure 8: EU-28 material flow for 2014 (Mayer et al., 2018)
A total of 7.4 Gt of materials were processed in 2014, of this only 0.7 Gt came from
secondary sources. Non-metallic minerals and metal ores make up for 56% of
domestic extraction, the largest share of imports are fossil fuels (69%). DPO
(emissions + waste) was at 4.1 Gt. This results in an input socioeconomic cycling
rate of 9.6% and an output SCr of 14.8% both are fairly low values.
The ecological cycling rate potentials were already at a higher level with 24.6% input
and 35.3% output.
Recommendations of the authors include improved collaboration between output-
and input-related (environmental and economic) policies, and between policy
makers and industry. However, above all they stress the need for improved data
collection and quality in order to allow monitoring of circular economy initiatives.
(Mayer et al., 2018)
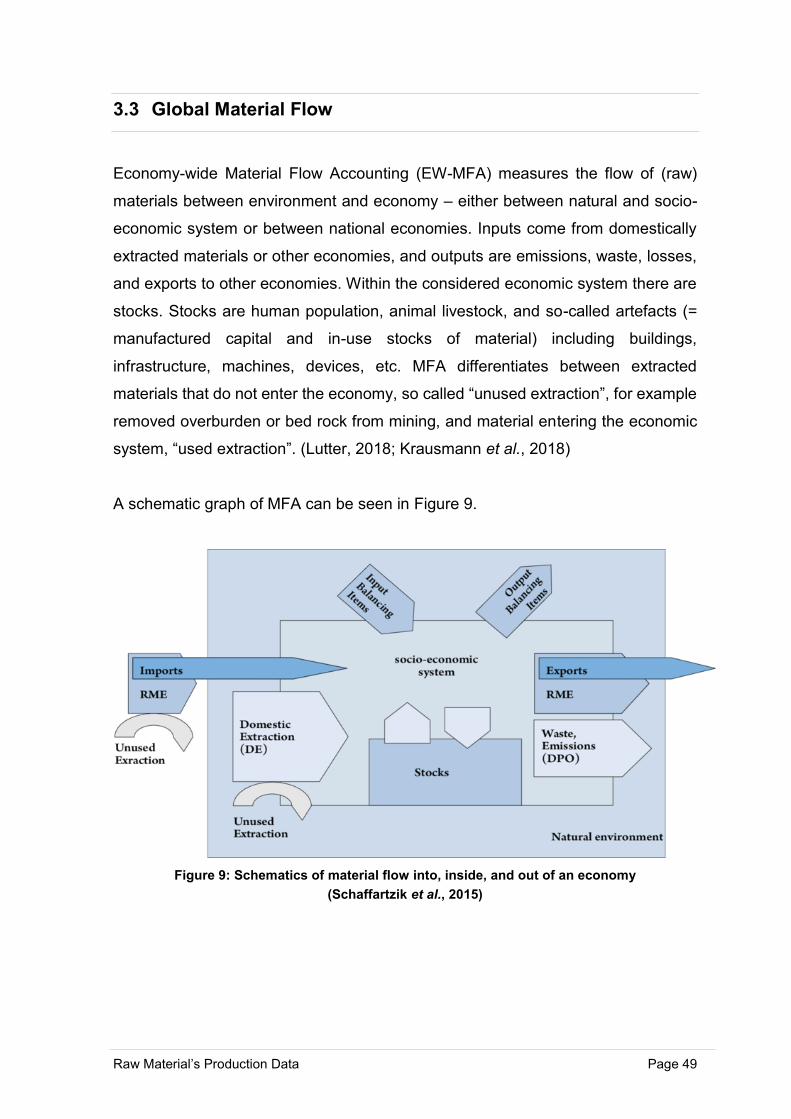
Raw Material’s Production Data Page 49
3.3 Global Material Flow
Economy-wide Material Flow Accounting (EW-MFA) measures the flow of (raw)
materials between environment and economy – either between natural and socio-
economic system or between national economies. Inputs come from domestically
extracted materials or other economies, and outputs are emissions, waste, losses,
and exports to other economies. Within the considered economic system there are
stocks. Stocks are human population, animal livestock, and so-called artefacts (=
manufactured capital and in-use stocks of material) including buildings,
infrastructure, machines, devices, etc. MFA differentiates between extracted
materials that do not enter the economy, so called “unused extraction”, for example
removed overburden or bed rock from mining, and material entering the economic
system, “used extraction”. (Lutter, 2018; Krausmann et al., 2018)
A schematic graph of MFA can be seen in Figure 9.
Figure 9: Schematics of material flow into, inside, and out of an economy
(Schaffartzik et al., 2015)
Raw Material’s Production Data Page 50
In chapter one material flow accounts by Eurostat were introduced. Apart from the
assessed raw materials production data this database also provides import and
export data, direct material inputs, physical trade balance, and domestic material
consumption. This is an ideal basis for evaluating material flows for the European
economy. Unfortunately, this database is incomplete, as Table 3 has already shown
production data is only available for some years making a long-term analysis
impossible. Therefore, import and export data provided by Eurostat material flow
accounts has to be combined with production data of one of the other data providers
discussed in chapter 2 (WMD, BGS, or USGS) to examine material flows of EU’s
economy. However, in order to do so production data has to be converted from
metal content to ores (see chapter 2.4 for conversion factors).
Moreover, Eurostat data is rather aggregated, and it is not always clear what
materials are included, e.g. “Other non-ferrous metals”. Comext database for trade
figures by Eurostat is a lot more comprehensive, including data for all materials
classified via the combined nomenclature (CN) and it is easier to find a suitable
match for production data, but again sometimes conversions are necessary. For
example, Potash production figures are usually reported as potassium oxide, K2O,
equivalent, whereas trade data reports sylvite (KCl).
A better suited source for material flows is found in the Global Material Flows
Database by the International Resource Panel (IRP). From this database it is
possible to extract figures for the same indicators as Eurostat MFA database for 13
different material flow categories (International Resource Panel, 2019):
coal, crop residues, crops, ferrous ores, grazed biomass and fodder crops, natural
gas, no ferrous ores, non-metallic minerals – construction dominant, non-metallic
minerals – industrial or agricultural dominant, oil shale and tar sands, petroleum,
wild catch and harvest, wood
These categories might be sufficient for material flow accounts of economic
systems, but considering a more detailed analysis of a specific raw material, this
data cannot be used due to the aggregation of materials.
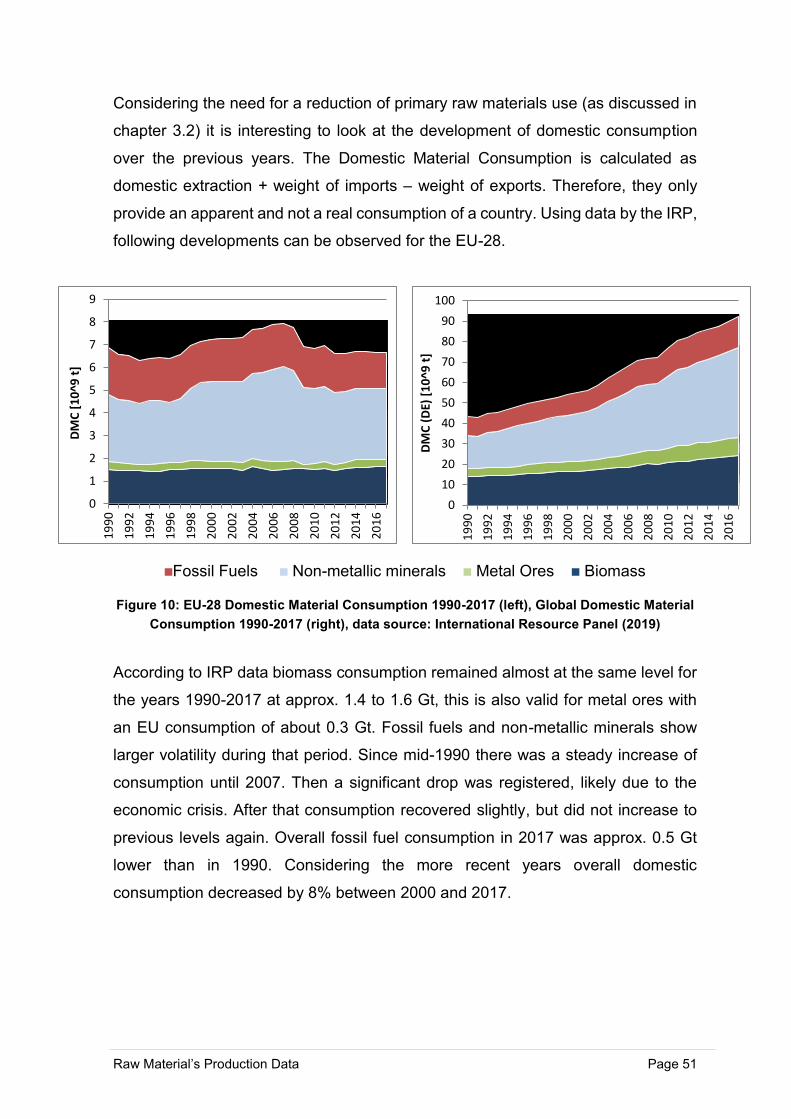
Raw Material’s Production Data Page 51
Considering the need for a reduction of primary raw materials use (as discussed in
chapter 3.2) it is interesting to look at the development of domestic consumption
over the previous years. The Domestic Material Consumption is calculated as
domestic extraction + weight of imports – weight of exports. Therefore, they only
provide an apparent and not a real consumption of a country. Using data by the IRP,
following developments can be observed for the EU-28.
Fossil Fuels Non-metallic minerals Metal Ores Biomass
Figure 10: EU-28 Domestic Material Consumption 1990-2017 (left), Global Domestic Material
Consumption 1990-2017 (right), data source: International Resource Panel (2019)
According to IRP data biomass consumption remained almost at the same level for
the years 1990-2017 at approx. 1.4 to 1.6 Gt, this is also valid for metal ores with
an EU consumption of about 0.3 Gt. Fossil fuels and non-metallic minerals show
larger volatility during that period. Since mid-1990 there was a steady increase of
consumption until 2007. Then a significant drop was registered, likely due to the
economic crisis. After that consumption recovered slightly, but did not increase to
previous levels again. Overall fossil fuel consumption in 2017 was approx. 0.5 Gt
lower than in 1990. Considering the more recent years overall domestic
consumption decreased by 8% between 2000 and 2017.
0
1
2
3
4
5
6
7
8
9
19
90
19
92
19
94
19
96
19
98
20
00
20
02
20
04
20
06
20
08
20
10
20
12
20
14
20
16
DM
C [
10
^9 t
]
0
10
20
30
40
50
60
70
80
90
100
19
90
19
92
19
94
19
96
19
98
20
00
20
02
20
04
20
06
20
08
20
10
20
12
20
14
20
16
DM
C (
DE)
[1
0^9
t]
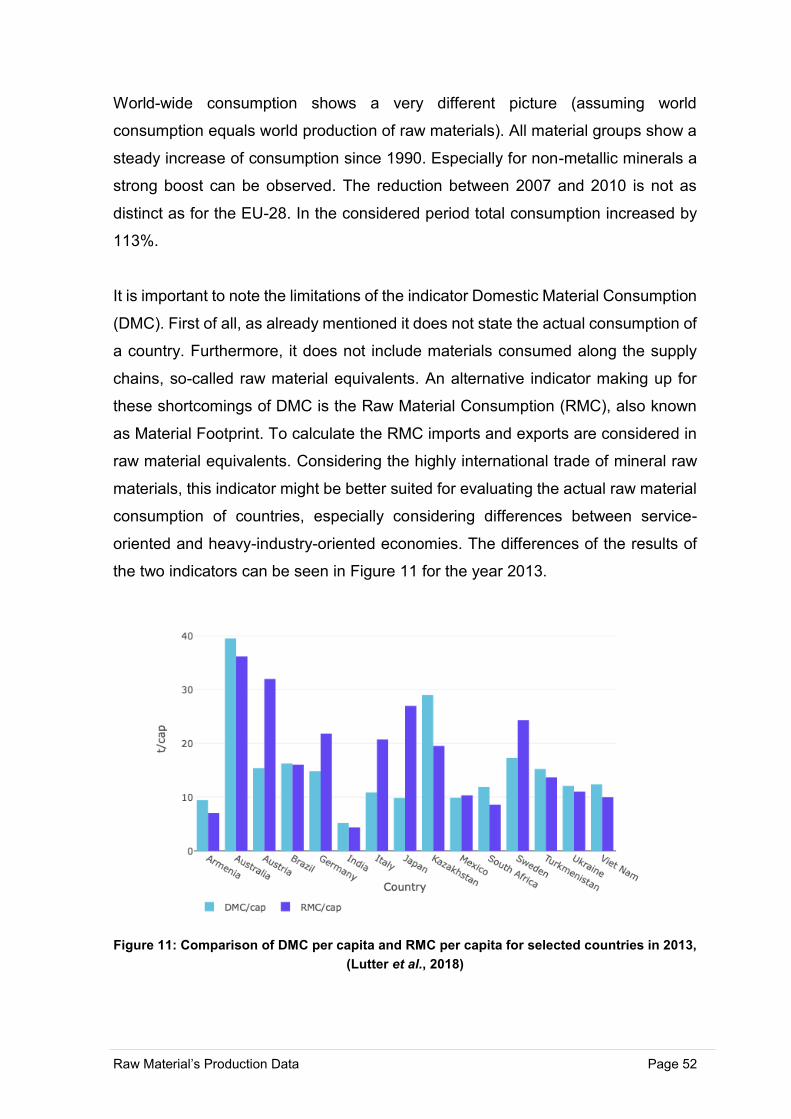
Raw Material’s Production Data Page 52
World-wide consumption shows a very different picture (assuming world
consumption equals world production of raw materials). All material groups show a
steady increase of consumption since 1990. Especially for non-metallic minerals a
strong boost can be observed. The reduction between 2007 and 2010 is not as
distinct as for the EU-28. In the considered period total consumption increased by
113%.
It is important to note the limitations of the indicator Domestic Material Consumption
(DMC). First of all, as already mentioned it does not state the actual consumption of
a country. Furthermore, it does not include materials consumed along the supply
chains, so-called raw material equivalents. An alternative indicator making up for
these shortcomings of DMC is the Raw Material Consumption (RMC), also known
as Material Footprint. To calculate the RMC imports and exports are considered in
raw material equivalents. Considering the highly international trade of mineral raw
materials, this indicator might be better suited for evaluating the actual raw material
consumption of countries, especially considering differences between service-
oriented and heavy-industry-oriented economies. The differences of the results of
the two indicators can be seen in Figure 11 for the year 2013.
Figure 11: Comparison of DMC per capita and RMC per capita for selected countries in 2013,
(Lutter et al., 2018)
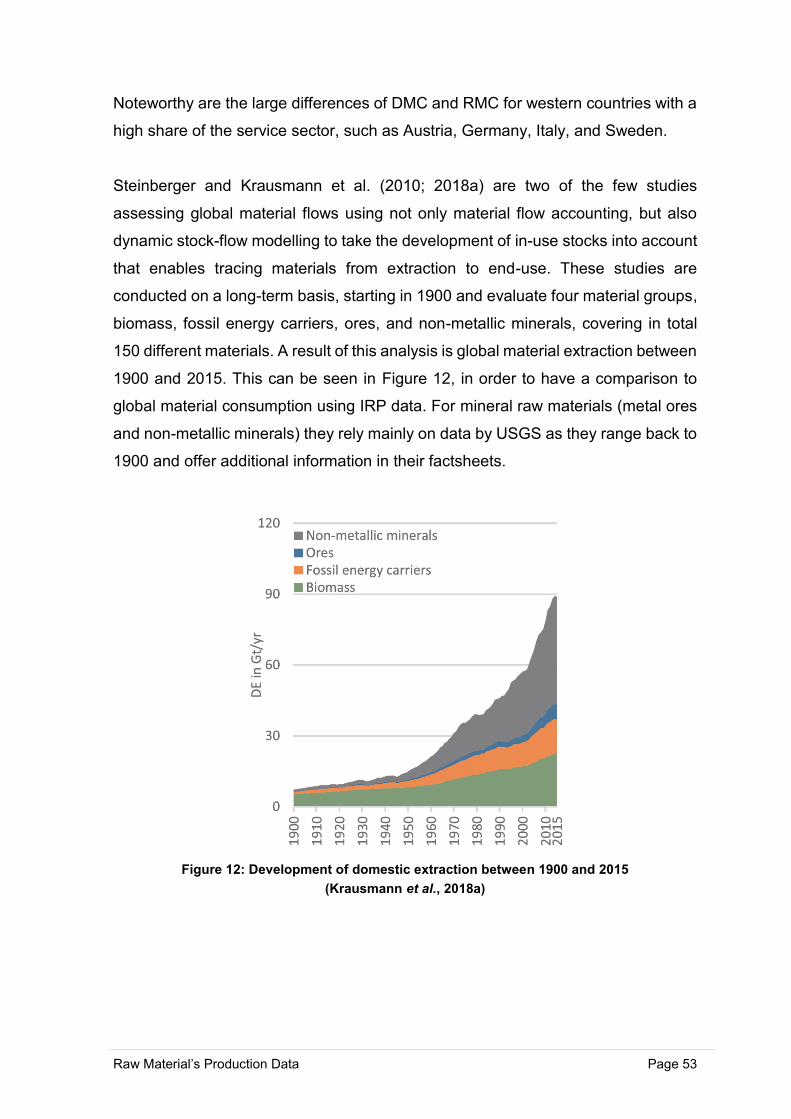
Raw Material’s Production Data Page 53
Noteworthy are the large differences of DMC and RMC for western countries with a
high share of the service sector, such as Austria, Germany, Italy, and Sweden.
Steinberger and Krausmann et al. (2010; 2018a) are two of the few studies
assessing global material flows using not only material flow accounting, but also
dynamic stock-flow modelling to take the development of in-use stocks into account
that enables tracing materials from extraction to end-use. These studies are
conducted on a long-term basis, starting in 1900 and evaluate four material groups,
biomass, fossil energy carriers, ores, and non-metallic minerals, covering in total
150 different materials. A result of this analysis is global material extraction between
1900 and 2015. This can be seen in Figure 12, in order to have a comparison to
global material consumption using IRP data. For mineral raw materials (metal ores
and non-metallic minerals) they rely mainly on data by USGS as they range back to
1900 and offer additional information in their factsheets.
Figure 12: Development of domestic extraction between 1900 and 2015
(Krausmann et al., 2018a)
Raw Material’s Production Data Page 54
This graph shows a similar development as Figure 10 (right, IRP data), the
different timelines must not be disregarded! IRP also has the four main material
categories, which they divide into 62 subcategories. A comparison of materials
included in both the study of Krausmann et al. and IRP data is therefore not
possible.
Differences can occur for the ore’s category and some minerals of the non-metallic
mineral’s category due to different factors for converting metal (mineral) contents
from data providers mentioned in chapter 2 to gross ores which are usually used
for material flow analysis. How this is conducted is explained in the technical
annexes of both studies. Krausmann et al. extrapolate the amount of gross ore
using metal content (mainly provided by USGS) and average global ore grades.
This might cause deviations as grades vary significantly between countries and
deposits. IRP on the other hand states it uses at least country-specific average ore
grades that may lead to more accurate estimations. The most difficult part is the
estimation of construction raw materials such as sand, gravel, clay, limestone,
gypsum, etc. The extraction of these minerals is (almost) not reported by the
international data providers (exceptions mentioned in chapter 2).
Krausmann et al. describe a “bottom-up” approach – they use kilometres of roads,
buildings, railways, etc. built to deduct the extracted amount of raw materials used
for these kinds of construction. A similar approach is described in the technical
annex of IRP database. (Krausmann et al., 2018a, 2018b; International Resource
Panel, 2018)
For material flow analysis a collection of extraction of raw materials for
construction purposes would be a great help. BGS is already attempting it on a
European level and USGS on US level, however, there is no international data
provider due to fragmentary or not existing data collections on national level.
Another point for improvement for MFA-studies would be the cooperation with the
data providers in order to obtain the exact metal contents used by BGS, USGS,
and WMD to avoid deviations due to different conversion factors.
Raw Material’s Production Data Page 55
Furthermore, according to Prof. Krausmann they do not consider by-products in
their MFA studies. That means the difference between metal content and gross
ore is considered tailings (waste).
This suggests tailings are overestimated, considering that many metals are won as
by-products only during the production of other metals.
(Additional information kindly provided by Prof. Fridolin Krausmann, Institute of
Social Ecology, University of Natural Resources and Life Sciences.)
3.3.1 Demand Drivers
This section aims at evaluating drivers of raw material consumption. Resource
consumption can be calculated using the IPAT theory, stating that environmental
impact or resource consumption (I) depend on population (P) times affluence (A,
e.g. GDP per capita) times technology (e.g. energy per GDP). This takes resource
decoupling from economic growth, increasing resource- and eco-efficiency due to
new technologies or changing lifestyles into account. In general, we can differentiate
five different factors influencing the amount of resource consumption of an
economy. (Boumphrey, 2016; Kalmykova et al., 2016)
Those drivers are:
1. Economic growth
2. Income growth
3. Demographic growth
4. Prices
5. Environmental Concerns
6. Technology
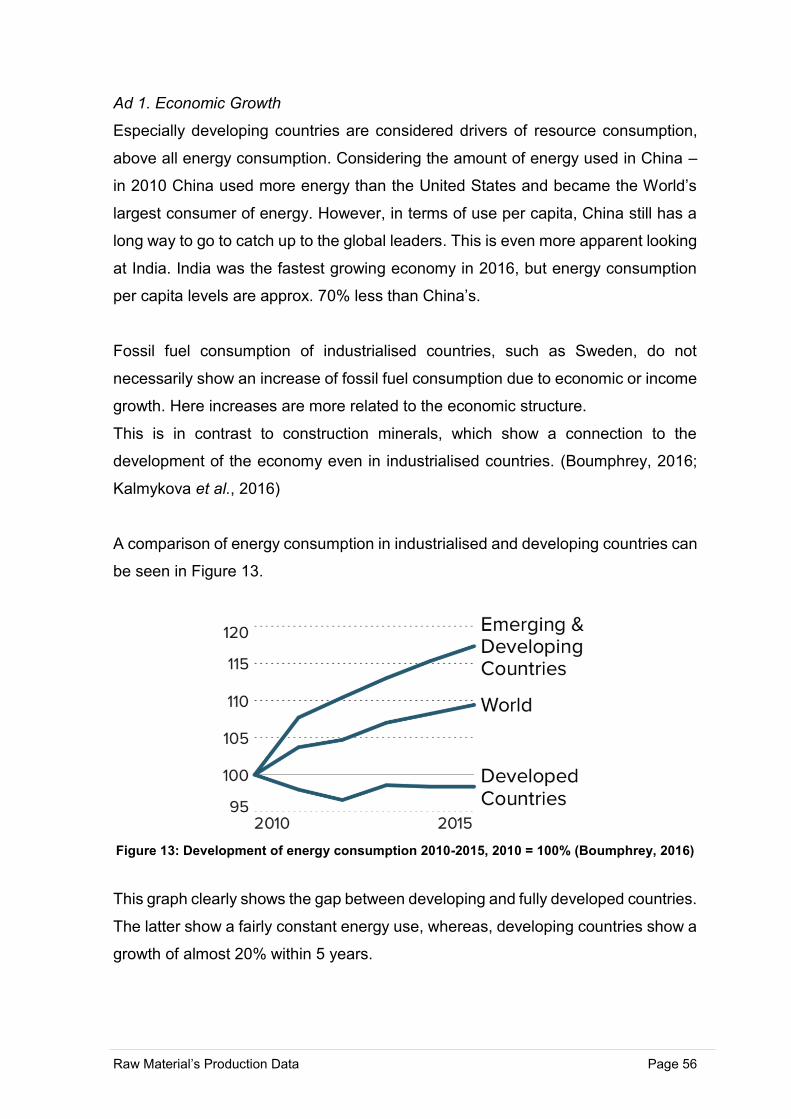
Raw Material’s Production Data Page 56
Ad 1. Economic Growth
Especially developing countries are considered drivers of resource consumption,
above all energy consumption. Considering the amount of energy used in China –
in 2010 China used more energy than the United States and became the World’s
largest consumer of energy. However, in terms of use per capita, China still has a
long way to go to catch up to the global leaders. This is even more apparent looking
at India. India was the fastest growing economy in 2016, but energy consumption
per capita levels are approx. 70% less than China’s.
Fossil fuel consumption of industrialised countries, such as Sweden, do not
necessarily show an increase of fossil fuel consumption due to economic or income
growth. Here increases are more related to the economic structure.
This is in contrast to construction minerals, which show a connection to the
development of the economy even in industrialised countries. (Boumphrey, 2016;
Kalmykova et al., 2016)
A comparison of energy consumption in industrialised and developing countries can
be seen in Figure 13.
Figure 13: Development of energy consumption 2010-2015, 2010 = 100% (Boumphrey, 2016)
This graph clearly shows the gap between developing and fully developed countries.
The latter show a fairly constant energy use, whereas, developing countries show a
growth of almost 20% within 5 years.
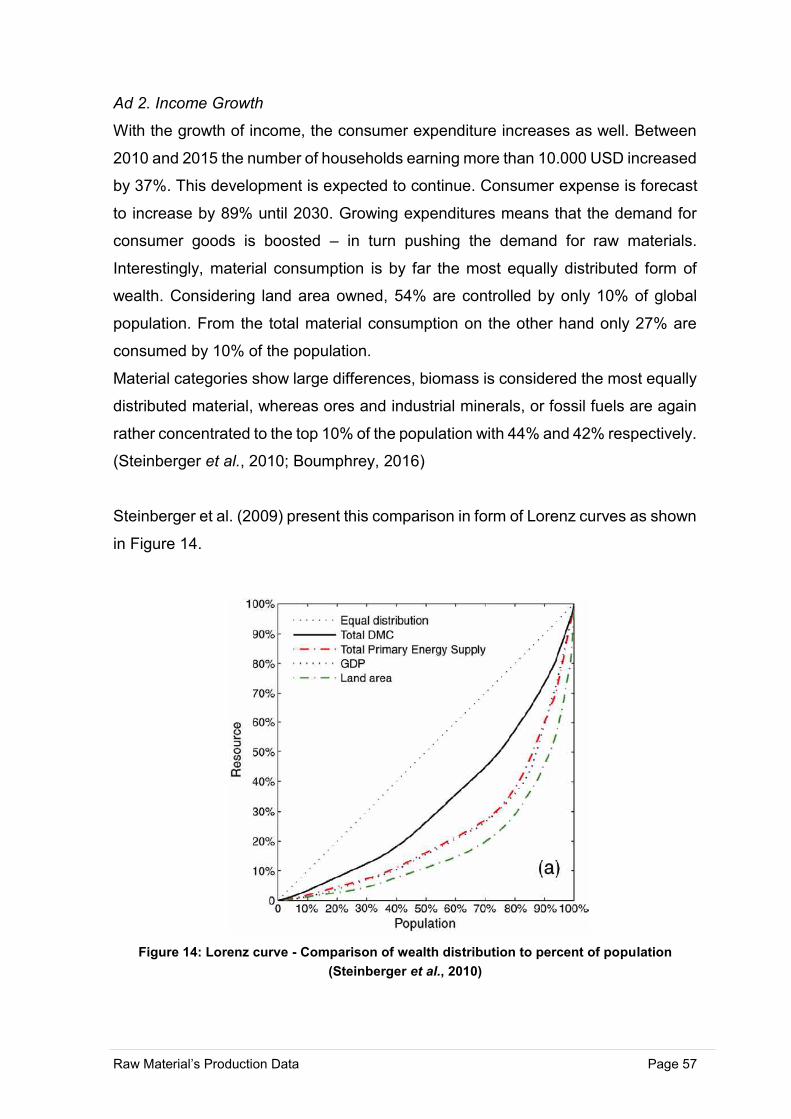
Raw Material’s Production Data Page 57
Ad 2. Income Growth
With the growth of income, the consumer expenditure increases as well. Between
2010 and 2015 the number of households earning more than 10.000 USD increased
by 37%. This development is expected to continue. Consumer expense is forecast
to increase by 89% until 2030. Growing expenditures means that the demand for
consumer goods is boosted – in turn pushing the demand for raw materials.
Interestingly, material consumption is by far the most equally distributed form of
wealth. Considering land area owned, 54% are controlled by only 10% of global
population. From the total material consumption on the other hand only 27% are
consumed by 10% of the population.
Material categories show large differences, biomass is considered the most equally
distributed material, whereas ores and industrial minerals, or fossil fuels are again
rather concentrated to the top 10% of the population with 44% and 42% respectively.
(Steinberger et al., 2010; Boumphrey, 2016)
Steinberger et al. (2009) present this comparison in form of Lorenz curves as shown
in Figure 14.
Figure 14: Lorenz curve - Comparison of wealth distribution to percent of population
(Steinberger et al., 2010)
Raw Material’s Production Data Page 58
The Lorenz curve plots wealth distribution by ranking population according to per
capita wealth. The y-coordinate gives the cumulated fraction of wealth and the x-
coordinate the cumulative lower income fraction of population. The curves for
different categories of wealth (DMC, energy supply, GDP, land area) are compared
to equal distribution.
Ad 3. Demographic Growth
World population is expected to reach 8.5 billion by 2030 (compared to 7.7 billion in
2019). This increases the need for infrastructure, including housing, transport, etc.
therefore boosting raw material demand as well. Especially since the urban
population is growing steadily at twice the rate than total global population.
Globally urban population is larger than rural population making up for more than
50% since 2007. This also means that the largest share of resource consumption
can be attributed to cities with approx. 75% of total consumption, and even more so
they are responsible for economic growth with about 80%.
However, this could also be a possible starting point for reducing resource
consumption and decoupling it from demographic growth in the future. Living in
cities usually means living in apartments rather than detached houses increasing
resource efficiency due to smaller living space and more people living in the same
structure.
Another aspect of demographic growth is the growth of car registrations. A study for
Sweden shows that even with a more efficient fuel consumption of new cars it has
not been possible to reduce overall fuel consumption due to a higher population
requiring more cars. (Boumphrey, 2016; Kalmykova et al., 2016)
Ad 4. Environmental Concerns
Due to growing environmental concerns the demand for renewable energy
increases. This demand-shift also influences the type of raw materials required.
Coal use, for example, is declining while solar, wind, and other renewable energy
sources are on an upturn. The production facilities for these energy sources require
different materials than thermal power plants, including some critical raw materials,
leading to a demand shift. Moreover, sustainability considerations push the demand
towards responsibly produced and recycled materials.
Raw Material’s Production Data Page 59
An example for such a change is the use of plastic bags in supermarkets.
Since the introduction of a small charge for bags, supermarkets in the UK report a
decrease of 80% of used plastic bags. (Boumphrey, 2016)
Ad 5. Price
An obvious factor influencing material consumption is the price. With the renewable
energy sources getting increasingly cheaper, their demand experiences a major
boost at the same time leading to a decreased demand of other materials for non-
renewable energy production. (Boumphrey, 2016)
Ad 6. Technology
Technology goes hand in hand with prices to a certain extent. New technologies for
renewable energy, for example, that are easier and therefore cheaper to produce
influence their turnover in a positive manner.
This effect is enhanced, if these technologies support the sustainability aspect, such
as electric vehicles. (Boumphrey, 2016)
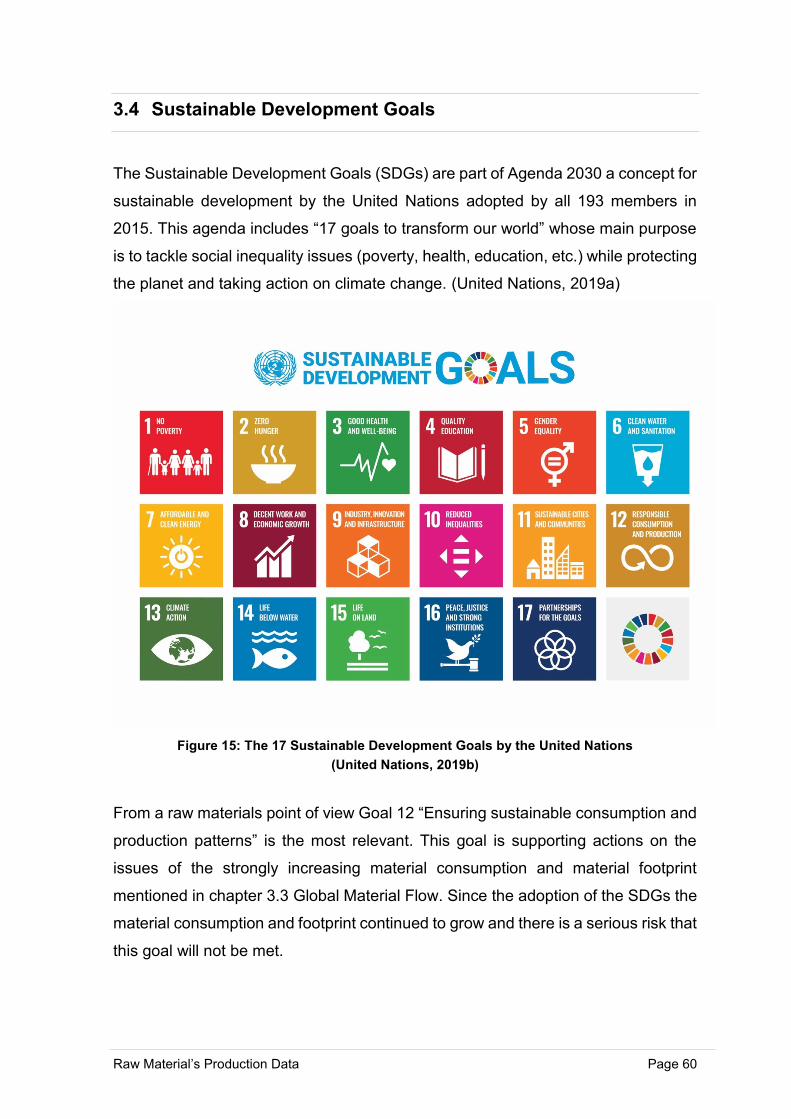
Raw Material’s Production Data Page 60
3.4 Sustainable Development Goals
The Sustainable Development Goals (SDGs) are part of Agenda 2030 a concept for
sustainable development by the United Nations adopted by all 193 members in
2015. This agenda includes “17 goals to transform our world” whose main purpose
is to tackle social inequality issues (poverty, health, education, etc.) while protecting
the planet and taking action on climate change. (United Nations, 2019a)
Figure 15: The 17 Sustainable Development Goals by the United Nations
(United Nations, 2019b)
From a raw materials point of view Goal 12 “Ensuring sustainable consumption and
production patterns” is the most relevant. This goal is supporting actions on the
issues of the strongly increasing material consumption and material footprint
mentioned in chapter 3.3 Global Material Flow. Since the adoption of the SDGs the
material consumption and footprint continued to grow and there is a serious risk that
this goal will not be met.
Raw Material’s Production Data Page 61
Without determined actions by all involved stakeholders global resource extraction
(assumption: global resource extraction is equal to global material consumption) is
projected to increase to 190 billion tons by 2060 compared to 92.1 billion tons in
2017. (United Nations, 2019c)
What is sustainable production and consumption? This term was defined by the
Oslo Symposium on Sustainable Consumption in 1994 as
“[…] the use of services and related products, which respond to basic needs
and bring a better quality of life while minimizing the use of natural resources
and toxic materials as well as the emissions of waste and pollutants over the
life cycle of the service or product so as not to jeopardize the needs of further
generations.” (United Nations, 2019d)
One of the actions taken by the European Union is the Circular Economy Package
discussed in chapter 3.2 Circular Economy covering raw materials in environment
and economy from extraction to recycling or waste. Another key initiative is the 7th
Environment Action Programme. However, the EU is not only focussing on
developments within its borders, but it also invests in responsible supply chains
promoting fair trade, human rights and good governance in producer countries
outside the EU. (European Commission, 2019)
The International Institute for Applied Sciences established an initiative called
“TWI2050 - The World in 2050 initiative” in order to provide scientific foundations for
the Agenda 2030. This initiative involves dozens of researchers and experts from
different institutions and organisations including academia, business, government,
etc. attempting to develop roadmaps towards the SDGs. In 2018 this initiative
published a report on the necessary transformations of society and economy to
achieve the SDGs.
A main focus of this report is SDG 12 making suggestions for more efficient use of
resources and reduction of raw materials consumption. The authors of this study
highlight the need for a mind-set shift of our society, away from thinking wellbeing
and status are linked to the consumption of resources, but rather to the services that
are provided by these resources.
Raw Material’s Production Data Page 62
They mention the example of a smartphone providing services such as phone,
camera, email, radio, and many more with one single device. In earlier days we
would have needed one device for each service.
Therefore, the smartphone is actually using resources much more efficiently.
However, to keep this efficiency over the whole lifecycle of a product and to move
towards a circular economy (another necessary change according to the report)
these products need to be designed for recycling or reusing. (TWI2050 - The World
in 2050 initiative, 2018)
Another interesting aspect mentioned in the report by TWI2050 is the need for
inclusion of material stocks in material flow analysis. During the 20th century raw
materials used for building up and maintaining global material stocks increased by
the factor 23. This means, while in 1900 20% of material input where put in stocks,
by 2010 this input rose to 50%. When trying to transform the economy to a more
sustainable and resource efficient system this needs to be taken into consideration
as these stocks have a very long lifetime and determine long-term pathways. For
example, transport or heating infrastructure – once in place they are difficult to
change. This also means that materials tied up in stocks are not available for
recycling. Due to rising economies of developing countries that still need to expand
infrastructure and buildings global material stocks are likely to continue growing and
until 2010 only 12% of material inflow were generated from secondary materials.
TWI2050 stresses the importance of stocks for our society and economy, because
“stocks transform resources into services”. This means that for example the raw
material crude oil would not be useful without the necessary infrastructure, such as
refineries, roads or cars. However, in order to move towards sustainable production
and consumption patterns a decoupling of resource use and economic development
have to be achieved. Moreover, stocks have to be used more intensely and for a
longer time. Future additions to stocks should be designed in a more efficient way
and provide high-quality services relying on a smaller inflow of materials.
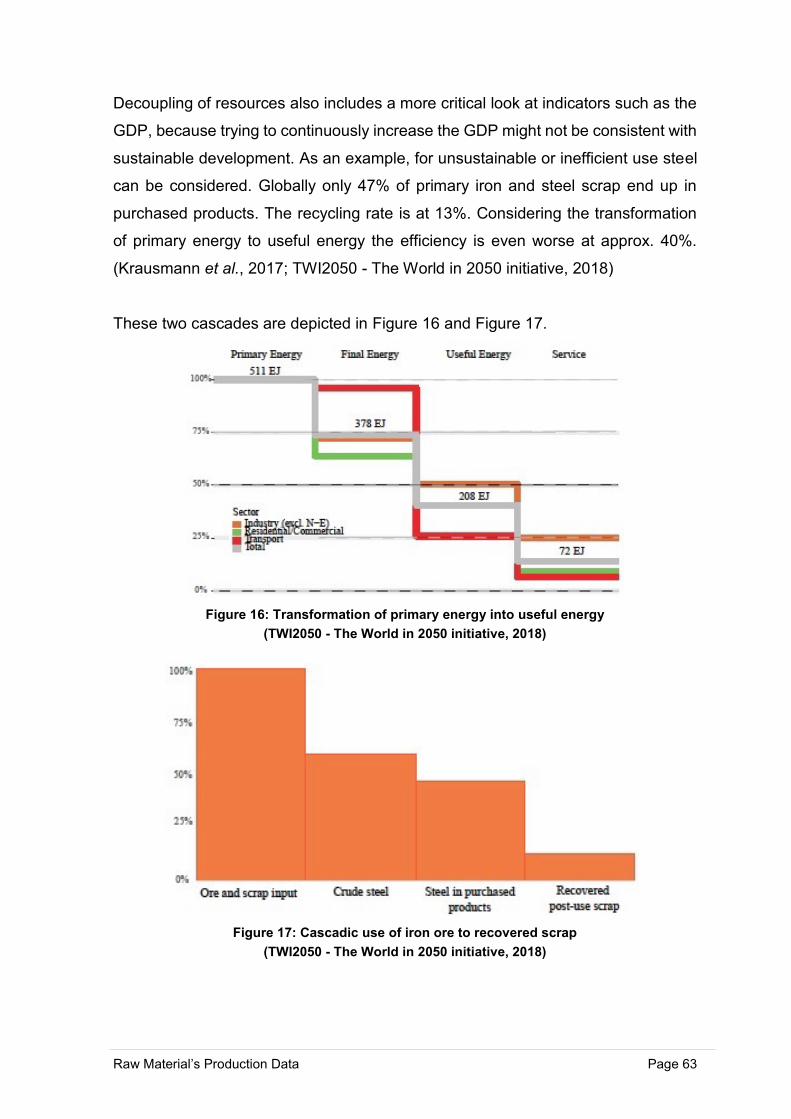
Raw Material’s Production Data Page 63
Decoupling of resources also includes a more critical look at indicators such as the
GDP, because trying to continuously increase the GDP might not be consistent with
sustainable development. As an example, for unsustainable or inefficient use steel
can be considered. Globally only 47% of primary iron and steel scrap end up in
purchased products. The recycling rate is at 13%. Considering the transformation
of primary energy to useful energy the efficiency is even worse at approx. 40%.
(Krausmann et al., 2017; TWI2050 - The World in 2050 initiative, 2018)
These two cascades are depicted in Figure 16 and Figure 17.
Figure 16: Transformation of primary energy into useful energy
(TWI2050 - The World in 2050 initiative, 2018)
Figure 17: Cascadic use of iron ore to recovered scrap
(TWI2050 - The World in 2050 initiative, 2018)
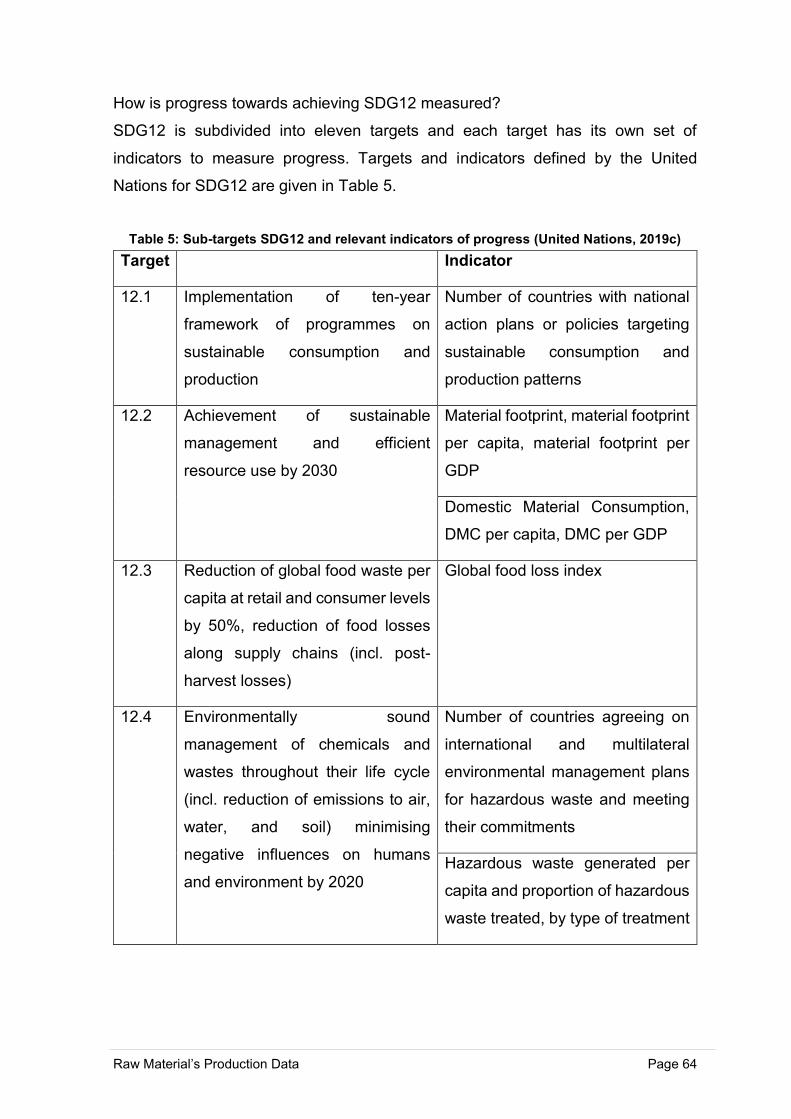
Raw Material’s Production Data Page 64
How is progress towards achieving SDG12 measured?
SDG12 is subdivided into eleven targets and each target has its own set of
indicators to measure progress. Targets and indicators defined by the United
Nations for SDG12 are given in Table 5.
Table 5: Sub-targets SDG12 and relevant indicators of progress (United Nations, 2019c)
Target Indicator
12.1 Implementation of ten-year
framework of programmes on
sustainable consumption and
production
Number of countries with national
action plans or policies targeting
sustainable consumption and
production patterns
12.2 Achievement of sustainable
management and efficient
resource use by 2030
Material footprint, material footprint
per capita, material footprint per
GDP
Domestic Material Consumption,
DMC per capita, DMC per GDP
12.3 Reduction of global food waste per
capita at retail and consumer levels
by 50%, reduction of food losses
along supply chains (incl. post-
harvest losses)
Global food loss index
12.4 Environmentally sound
management of chemicals and
wastes throughout their life cycle
(incl. reduction of emissions to air,
water, and soil) minimising
negative influences on humans
and environment by 2020
Number of countries agreeing on
international and multilateral
environmental management plans
for hazardous waste and meeting
their commitments
Hazardous waste generated per
capita and proportion of hazardous
waste treated, by type of treatment
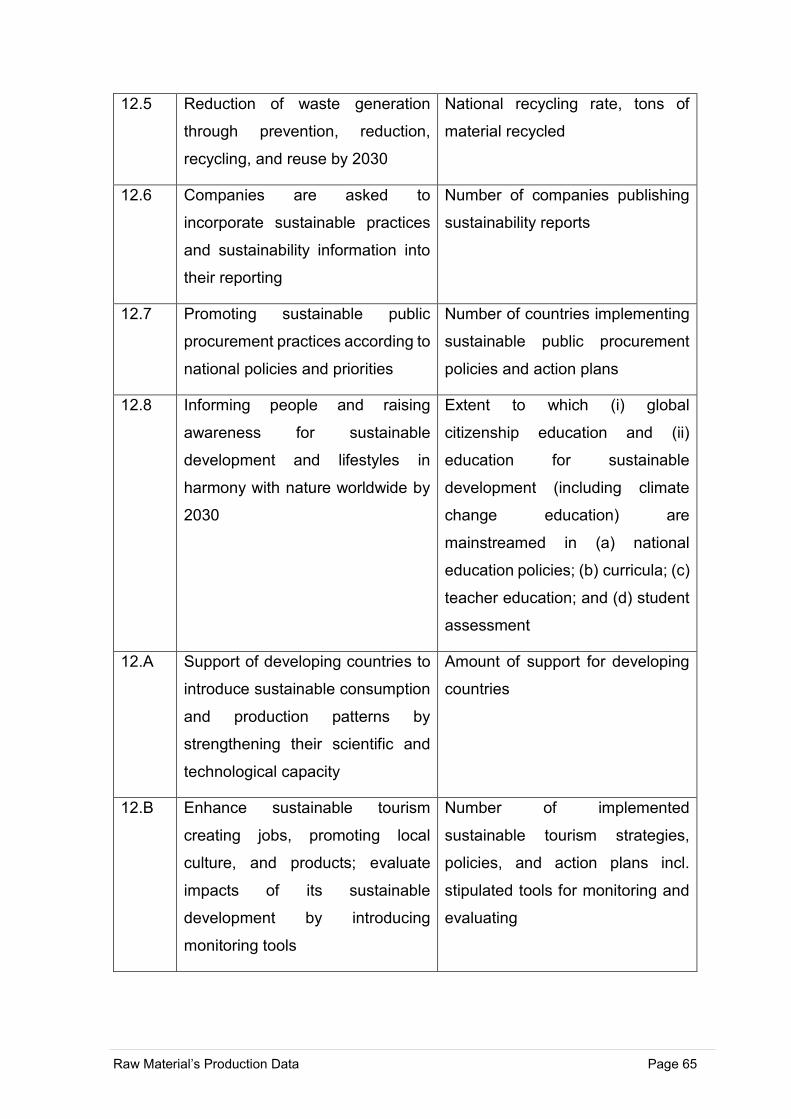
Raw Material’s Production Data Page 65
12.5 Reduction of waste generation
through prevention, reduction,
recycling, and reuse by 2030
National recycling rate, tons of
material recycled
12.6 Companies are asked to
incorporate sustainable practices
and sustainability information into
their reporting
Number of companies publishing
sustainability reports
12.7 Promoting sustainable public
procurement practices according to
national policies and priorities
Number of countries implementing
sustainable public procurement
policies and action plans
12.8 Informing people and raising
awareness for sustainable
development and lifestyles in
harmony with nature worldwide by
2030
Extent to which (i) global
citizenship education and (ii)
education for sustainable
development (including climate
change education) are
mainstreamed in (a) national
education policies; (b) curricula; (c)
teacher education; and (d) student
assessment
12.A Support of developing countries to
introduce sustainable consumption
and production patterns by
strengthening their scientific and
technological capacity
Amount of support for developing
countries
12.B Enhance sustainable tourism
creating jobs, promoting local
culture, and products; evaluate
impacts of its sustainable
development by introducing
monitoring tools
Number of implemented
sustainable tourism strategies,
policies, and action plans incl.
stipulated tools for monitoring and
evaluating
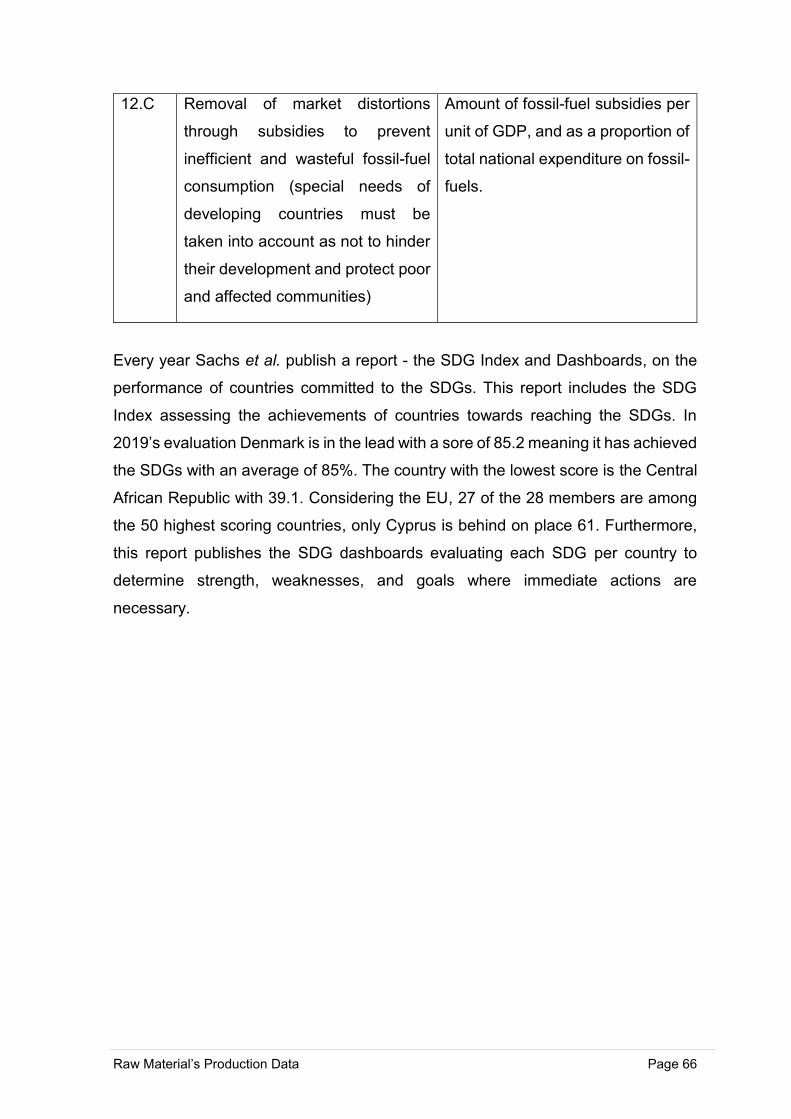
Raw Material’s Production Data Page 66
12.C Removal of market distortions
through subsidies to prevent
inefficient and wasteful fossil-fuel
consumption (special needs of
developing countries must be
taken into account as not to hinder
their development and protect poor
and affected communities)
Amount of fossil-fuel subsidies per
unit of GDP, and as a proportion of
total national expenditure on fossil-
fuels.
Every year Sachs et al. publish a report - the SDG Index and Dashboards, on the
performance of countries committed to the SDGs. This report includes the SDG
Index assessing the achievements of countries towards reaching the SDGs. In
2019’s evaluation Denmark is in the lead with a sore of 85.2 meaning it has achieved
the SDGs with an average of 85%. The country with the lowest score is the Central
African Republic with 39.1. Considering the EU, 27 of the 28 members are among
the 50 highest scoring countries, only Cyprus is behind on place 61. Furthermore,
this report publishes the SDG dashboards evaluating each SDG per country to
determine strength, weaknesses, and goals where immediate actions are
necessary.
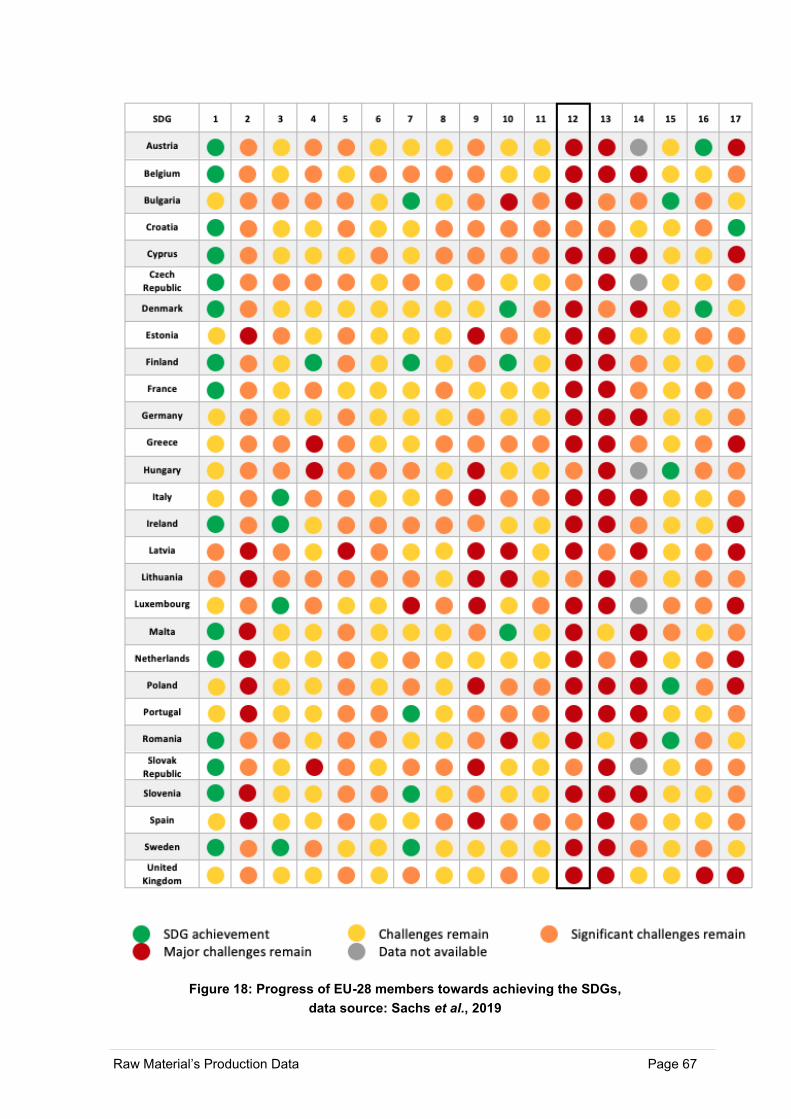
Raw Material’s Production Data Page 67
Figure 18: Progress of EU-28 members towards achieving the SDGs,
data source: Sachs et al., 2019
Raw Material’s Production Data Page 68
This table shows that all EU members are struggling with SDG12. Even the
Scandinavian countries Denmark, Sweden, and Finland, who are leading in the
SDG index representing overall achievement of all SDGs, have major issues in
reaching this goal and rank among the bottom 40 countries. For this reason, the
Nordic Council of Ministers representing Denmark, Finland, Iceland, Norway,
Sweden, Greenland, Faroe Islands, and Åland analysed the progress of these
countries towards SDG12, making recommendations for necessary actions to
achieve the sub-goals. (Sachs et al., 2019; Bauer et al., 2018)
The most critical topics are sustainable management of natural resources and
rationalising fossil-fuel subsidies:
• Sustainable Management of Natural Resources
Bauer et al. use the indicators proposed by the UN for target 12.2 (see
Table 5), additionally they included the percentage of anthropogenic
wastewater treated, and environmental taxes as a share of total taxes and
social contributions.
The Nordic region’s material footprint is at the top of the European
countries, mainly due to high levels of wealth and comparatively low
resource productivity. However, a main issue the authors address is the
lack of material footprint indicators based on Raw Material Consumption on
a global level, rather than Domestic Material Consumption. This falsifies the
actual material consumption of a country as it does not take “outsourcing” of
heavy industries into account. A good performance in DMC might simply
entail a higher level of outsourcing and stronger focus on service industries.
Nordic countries still have a large extractive industry. Considering Sweden
metal ore and biomass extraction alone make up 50% of its material
footprint.
Many European countries showed a decline of DMC due to the economic
crisis until 2013 caused by a reduction of construction projects. This decline
is likely to be overturned as the construction industry recovers. Construction
materials are responsible for 50% of DMC, however, of all material
resources they have only a 1% impact on the climate.
Raw Material’s Production Data Page 69
Nordic countries make an effort to develop and adopt green national
accounts (Green GDP or Beyond GDP indicators) to adjust for quality
losses of raw materials currently not being considered in the evaluation.
(Bauer et al., 2018, p. 18)
• Rationalise Fossil-Fuel Subsidies
For this evaluation the UN indicator for target 12.C was used (see Table 5).
According to research subsidies on fossil-fuels amounted to 425 billion USD
in 2015 and their phasing out could decrease carbon emissions by 6.4-
8.2%. By supporting the use of fossil fuels a change to other energy
sources is prevented. This impacts not only the achievement of SDG12, but
also other SDGs covering education, skills, and physical infrastructure.
It increases the use of fossil-fuels increasing pollution and therefore
impacting human health. Denmark is closest to the abolishment of
subsidies having already phased out support for bituminous coal and
petroleum, and significantly decreasing subsidies for diesel fuels.
Finland allocates the largest subsidies to fossil-fuels per GDP of all OECD
countries. Especially peat harvesting is strongly supported. Also, Norway
supports the petroleum industry by aiding research and development of
new resources. Moreover, coal mining company Store Norske is supported.
Norway is far away from reaching an abolishment of subsidies. On the
contrary, between 2011 and 2016 subsidies were increased by 400%.
(Bauer et al., 2018, p. 37)
Endl et al. investigate the opportunities of the mining sector to contribute to the
achievement of the SDGs focusing on contributions through innovations.
Innovations are divided into two groups – innovations driven by economic
considerations, and innovations driven by societal considerations. Each SDG is
considered in respect of aspects that can be influenced by the mining sector.
For example, SDG1 “End poverty in all its forms everywhere” includes the aspects
‘inclusive employment’, and ‘local procurement’. New technologies require a more
skilled workforce which is usually not available in highly remote areas where mining
is usually conducted.
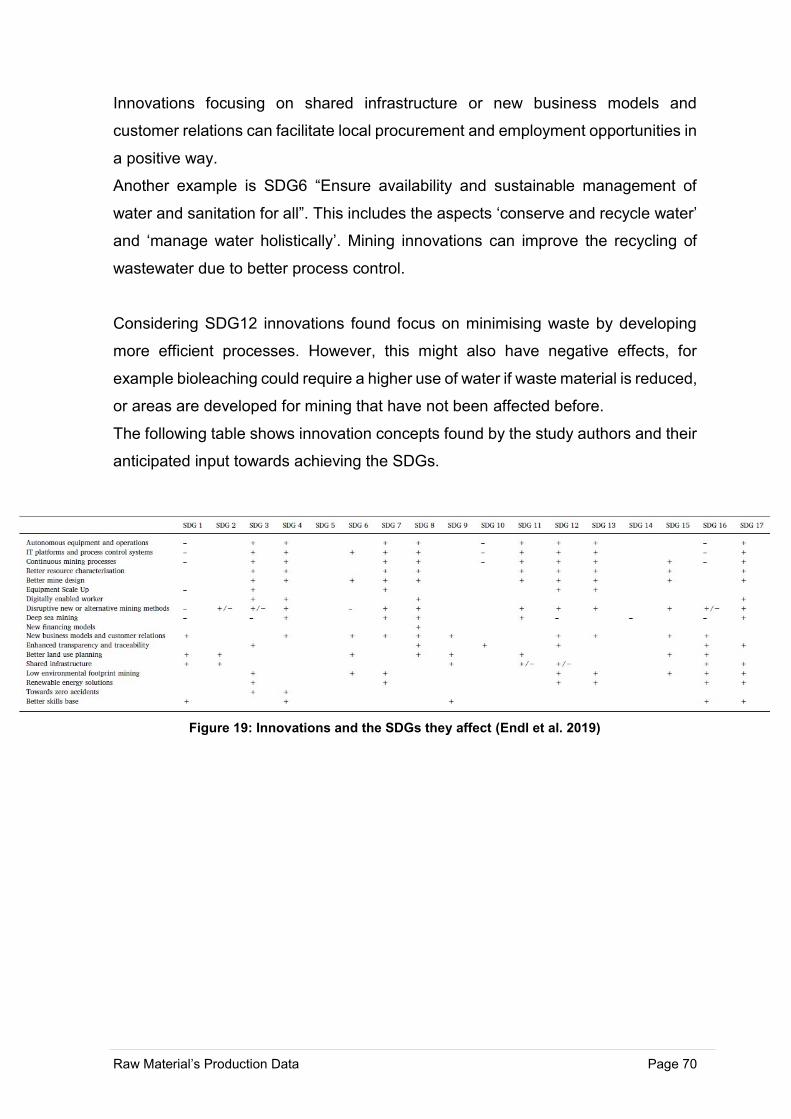
Raw Material’s Production Data Page 70
Innovations focusing on shared infrastructure or new business models and
customer relations can facilitate local procurement and employment opportunities in
a positive way.
Another example is SDG6 “Ensure availability and sustainable management of
water and sanitation for all”. This includes the aspects ‘conserve and recycle water’
and ‘manage water holistically’. Mining innovations can improve the recycling of
wastewater due to better process control.
Considering SDG12 innovations found focus on minimising waste by developing
more efficient processes. However, this might also have negative effects, for
example bioleaching could require a higher use of water if waste material is reduced,
or areas are developed for mining that have not been affected before.
The following table shows innovation concepts found by the study authors and their
anticipated input towards achieving the SDGs.
Figure 19: Innovations and the SDGs they affect (Endl et al. 2019)
Raw Material’s Production Data Page 71
4 Raw Material’s Consumption in Light of New
Technologies
In this chapter, two technologies for electricity production are compared on the basis
of materials used for the construction of the production units. On the one hand, a
thermal power plant is considered as “old-technology”, and on the other hand, wind
turbines represent the “new technologies. The goal is to gain an overview, what
changes in materials used are caused by this technology-shift and whether this can
be seen in the production numbers of these materials. This shall be done using data
collections evaluated in chapter 2. Moreover, the use of critical raw materials,
lifetime, and recycling shall be considered in terms of sustainability and efficiency of
electricity production.
4.1 Thermal Power Plant
A thermal power plant generates electricity by converting heat (thermal energy) from
burning some sort of fuel, typically coal, oil or gas, newer models also use e.g.
biomass, into electric energy which can then supply the grid with current.
Different types of thermal power plants have to be differentiated according to the
units used for electricity production (Verbund AG, 2019; TEPCO Fuel & Power Inc.,
2019):
1. Steam power generation
2. Combined-cycle power generation
3. ACC power generation
4. MACC power generation
5. Combined heat and power generation
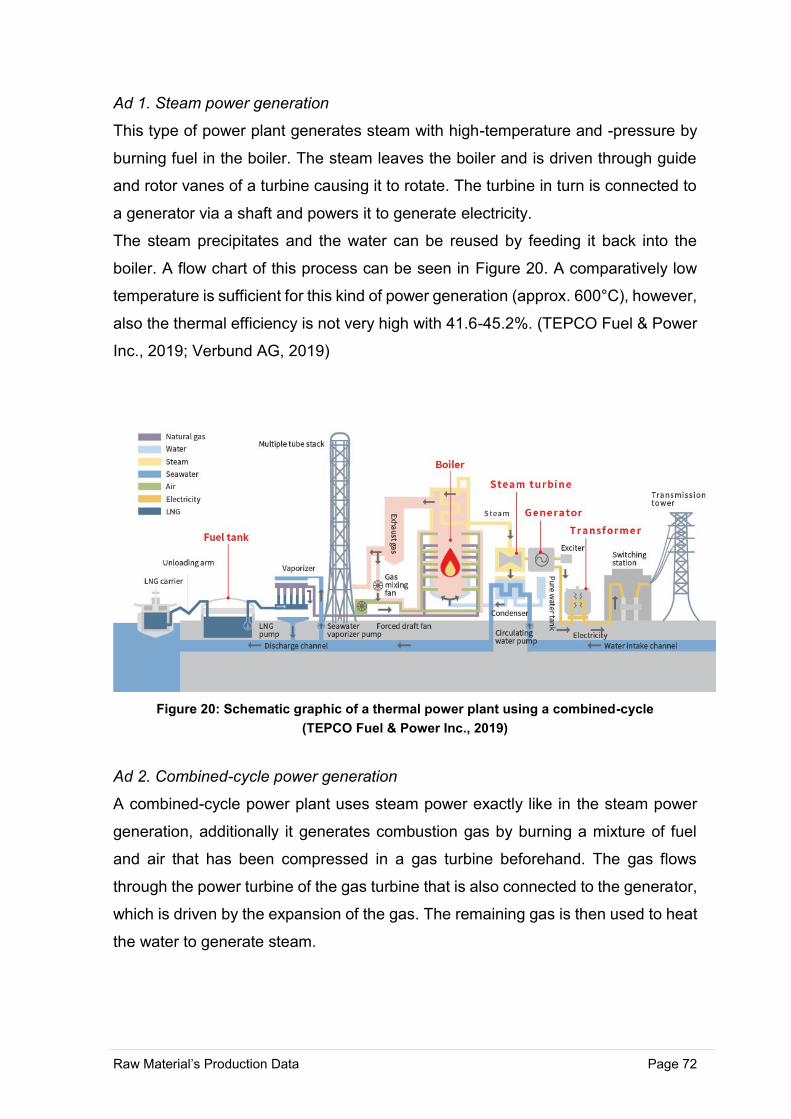
Raw Material’s Production Data Page 72
Ad 1. Steam power generation
This type of power plant generates steam with high-temperature and -pressure by
burning fuel in the boiler. The steam leaves the boiler and is driven through guide
and rotor vanes of a turbine causing it to rotate. The turbine in turn is connected to
a generator via a shaft and powers it to generate electricity.
The steam precipitates and the water can be reused by feeding it back into the
boiler. A flow chart of this process can be seen in Figure 20. A comparatively low
temperature is sufficient for this kind of power generation (approx. 600°C), however,
also the thermal efficiency is not very high with 41.6-45.2%. (TEPCO Fuel & Power
Inc., 2019; Verbund AG, 2019)
Figure 20: Schematic graphic of a thermal power plant using a combined-cycle
(TEPCO Fuel & Power Inc., 2019)
Ad 2. Combined-cycle power generation
A combined-cycle power plant uses steam power exactly like in the steam power
generation, additionally it generates combustion gas by burning a mixture of fuel
and air that has been compressed in a gas turbine beforehand. The gas flows
through the power turbine of the gas turbine that is also connected to the generator,
which is driven by the expansion of the gas. The remaining gas is then used to heat
the water to generate steam.
Raw Material’s Production Data Page 73
This power plant operates at a higher temperature (1100 °C gas temperature after
burning process, 560°C steam temperature) and has a higher thermal efficiency of
47.2% than a steam power plant. (TEPCO Fuel & Power Inc., 2019)
Ad 3., Ad 4. (More) Advanced Combined Cycle ((M)ACC) generation
Power plants of this type work based on the same principles as the combined-cycle
power generation, the only difference is the higher temperature of the combustion
gas (ACC: approx. 1300°C, MACC: approx. 1500°C) and therefore the higher
thermal efficiency of 54.1-57.2% and 58.6% respectively. (TEPCO Fuel & Power
Inc., 2019)
Ad 5. Combined heat and power generation
Combined heat and power generation can use any of the above-mentioned types of
electricity generation. The difference is that not all of the produced steam is used
for driving the turbine, but some is redirected to heat exchangers transferring heat
to the hot water network for district heating. (Verbund AG, 2019) The efficiency of
this type of power plant is a combination of the efficiency of the power production
and the heat production. The total efficiency ranges up to 85%.
For further evaluations a combined heat and power plant using biomass is chosen
due to the lack of data on materials and their amounts used for the construction of
the other power plant types. So, in fact, two types of renewable energy production
are compared. This power plant usually consists of a main building and a storage
building. The main building houses the facilities for the actual heat and power
production, including a block-type power station, gas buffer, scrubber, cooler,
biochar mixer, biomass feeding, pyrolysis, reduction reactor, hot gas filter, balance
tank district heating, and control units. (Käppler, 2015)
Käppler conducts a life cycle assessment of a combined heat and power plant. The
power plant evaluated has a nominal power of 250 kWel and 260 kWtherm. In 2016
1,517 MWh of electricity and 2,189 MWh of thermal energy were produced in 7,986
operating hours resulting in an average power output of 190 kWel. However, this
plant also has a power demand of 161 MWh per year.
Raw Material’s Production Data Page 74
Unfortunately, this was the first year of production of this power plant, meaning there
were numerous unplanned downtimes and the production was not as efficient as
planned. More current numbers could not be obtained.
The material flow diagram for energy in and output, as well as a layout for the main
building can be found in the Annex.
According to this study the materials and their amounts required for building such a
plant are as follows. (Käppler, 2015)
Main building
• Foundation:
o 700 kg sand and gravel
o 312 m3 reinforced
concrete
o 480 m2 moulding, i.e. 18
m3 wood
• 17 m2 glass windows, i.e. 850
kg glass
• 150 m2 tar paper, i.e. 1,500 kg
bitumen seal
• 1,050 kg roof insulation, i.e.
polystyrene foam stab
Storage building
• Foundation:
o 798 t gravel
o 108 m3 concreate (sole
plate and foundation)
• Walls:
o 56 m3 reinforced
concrete
o 76 m3 moulding from
wood
• 24 steel pillars, i.e. 16,800 kg
steel
• Roof: 1,100 m2 troughed
sheet, i.e. 14.68 kg steel
• 300 kg steel fan
Carburettor
• 7.2 t chromium alloy steel
• 9.6 t galvanised steel (stairs
and other plant components)
• 350 kg aluminium
• 350 kg copper (electric
components)
• 3 t rock wool (insulation)
• 24 ceramic filter cartridges
3,50 kg each
Block-type power station
• 240 kW gas engine
• Control unit: 275 kg steel, 0.15
kg aluminium, 10.8 kg copper,
78.5 kg polyethylene
• Noise protection: 1,919 kg
steel, 480 kg rock wool
• Converter: 488 kg steel
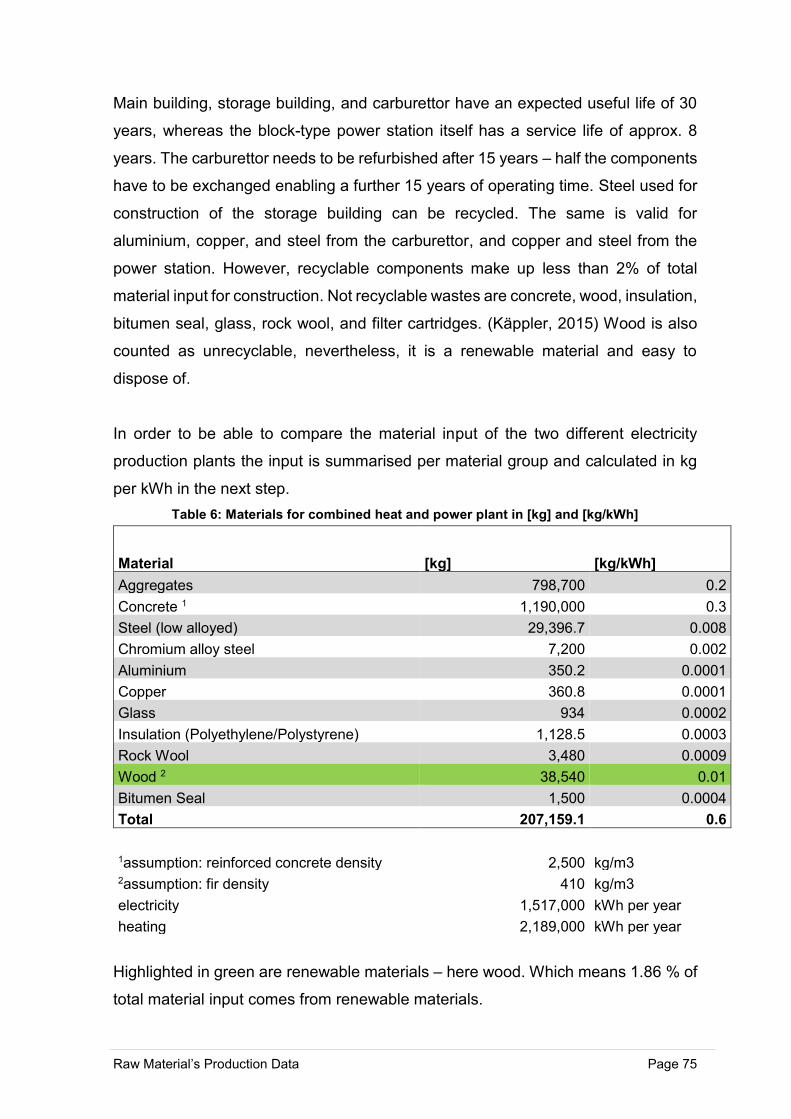
Raw Material’s Production Data Page 75
Main building, storage building, and carburettor have an expected useful life of 30
years, whereas the block-type power station itself has a service life of approx. 8
years. The carburettor needs to be refurbished after 15 years – half the components
have to be exchanged enabling a further 15 years of operating time. Steel used for
construction of the storage building can be recycled. The same is valid for
aluminium, copper, and steel from the carburettor, and copper and steel from the
power station. However, recyclable components make up less than 2% of total
material input for construction. Not recyclable wastes are concrete, wood, insulation,
bitumen seal, glass, rock wool, and filter cartridges. (Käppler, 2015) Wood is also
counted as unrecyclable, nevertheless, it is a renewable material and easy to
dispose of.
In order to be able to compare the material input of the two different electricity
production plants the input is summarised per material group and calculated in kg
per kWh in the next step.
Table 6: Materials for combined heat and power plant in [kg] and [kg/kWh]
Material [kg] [kg/kWh]
Aggregates 798,700 0.2
Concrete 1 1,190,000 0.3
Steel (low alloyed) 29,396.7 0.008
Chromium alloy steel 7,200 0.002
Aluminium 350.2 0.0001
Copper 360.8 0.0001
Glass 934 0.0002
Insulation (Polyethylene/Polystyrene) 1,128.5 0.0003
Rock Wool 3,480 0.0009
Wood 2 38,540 0.01
Bitumen Seal 1,500 0.0004
Total 207,159.1 0.6
1assumption: reinforced concrete density 2,500 kg/m3 2assumption: fir density 410 kg/m3
electricity 1,517,000 kWh per year
heating 2,189,000 kWh per year
Highlighted in green are renewable materials – here wood. Which means 1.86 % of
total material input comes from renewable materials.
Raw Material’s Production Data Page 76
4.2 Wind Turbine
According to Komusanac et al. (WindEurope) 362 TWh of electricity were generated
by wind turbines in 2018 covering 14% of the electricity demand of the EU. Wind
energy is also the renewable energy technology accounting for most investments
(63%) in 2018. Germany is the EU country accounting for the highest number of
new installations as well as the highest installed wind power capacity. However, in
terms of wind energy covering the electricity demand of a country, Denmark is in
the lead with a share of 41%. Considering global electricity production, the total
share of renewable energy in 2016 was 13.7%. Wind energy only takes up a share
of 0.6%. This is significantly lower than EU average. The highest share of
renewables is accounted for by biofuels and waste with 9.5% followed by
hydropower with a share of 2.5% of global electricity production. Overall, oil is still
the most important electricity source (31.9%), followed by coal (27.1%), and natural
gas (22.1). However, renewable energy sources are catching up and have
overtaken nuclear and other forms of power production (5.2%). (Komusanac et al.,
2019; International Energy Agency, 2018)
Wind turbines utilise the same principle for energy production as the turbines in
thermal power plants. Wind (or air movement) is a form of kinetic energy, driving the
turbine’s blades creating rotational energy. Rotational energy is then converted into
electricity via electromagnetic induction. The amount of wind power generated
depends on the size of the rotor and the speed of the wind.
wind power rotor dimensions (wind speed)3
A typical wind turbine consists of three main components independent of its size:
nacelle, rotor, and tower.
The materials used, the size, and the configuration of the wind turbine can vary. The
largest wind turbines currently on the market have a power rating of 8.8 MW with a
rotor diameter of 164 m. Offshore turbines are usually larger with a higher capacity
than onshore turbines.
Raw Material’s Production Data Page 77
A turbine has an expected service life of 20 to 30 years, which is comparable to the
combined heat and power plant discussed in the previous chapter (chapter 4.1).
Additionally, a plus of 15 years can be achieved by refurbishing the turbine. (IRENA
and IEA-ETSAP, 2016; Wilburn, 2011)
The nacelle houses the main components for electricity production, gearbox, rotor
shaft and brake, generator, and yaw system. It is directly connected to the blades
that capture the kinetic energy of the wind. The yaw system is responsible for
aligning the nacelle with the wind direction. (IRENA and IEA-ETSAP, 2016)
Commonly, there are three blades due to better balance of gyroscopic forces. The
profile of the blades is similar to that of airplane wings. Materials used are balsa
wood or polymer foam for the core, and a fiberglass-reinforced plastic and epoxy
adhesive mixture. Another possible material is carbon fibre-reinforced plastic that
offers higher strengths for sites where the blades have to endure high stresses,
however, costs are significantly higher. For smaller blades laminated wood is also
an option. The blades are supported by the blade extender made of steel, mounted
on the hub (the base) which is made of cast iron. Responsible for the blade angle
in order to achieve the best possible energy recovery, or other adjustments
according to wind and weather conditions, is the pitch drive, which consists of
stainless and alloy steels.
The nacelle usually is responsible for 25-40% of the total weight the turbine, the
rotor (incl. blades, blade extender, hub, and pitch drive system) for 10-14%.
The tower itself consists of a concrete foundation and steel sections accounting for
approx. 30-65% of the weight. The tower is designed for each site individually in
order to optimise the capture of wind energy. A graphical illustration of the main
components is shown in Figure 21.
(IRENA and IEA-ETSAP, 2016; Wilburn, 2011)
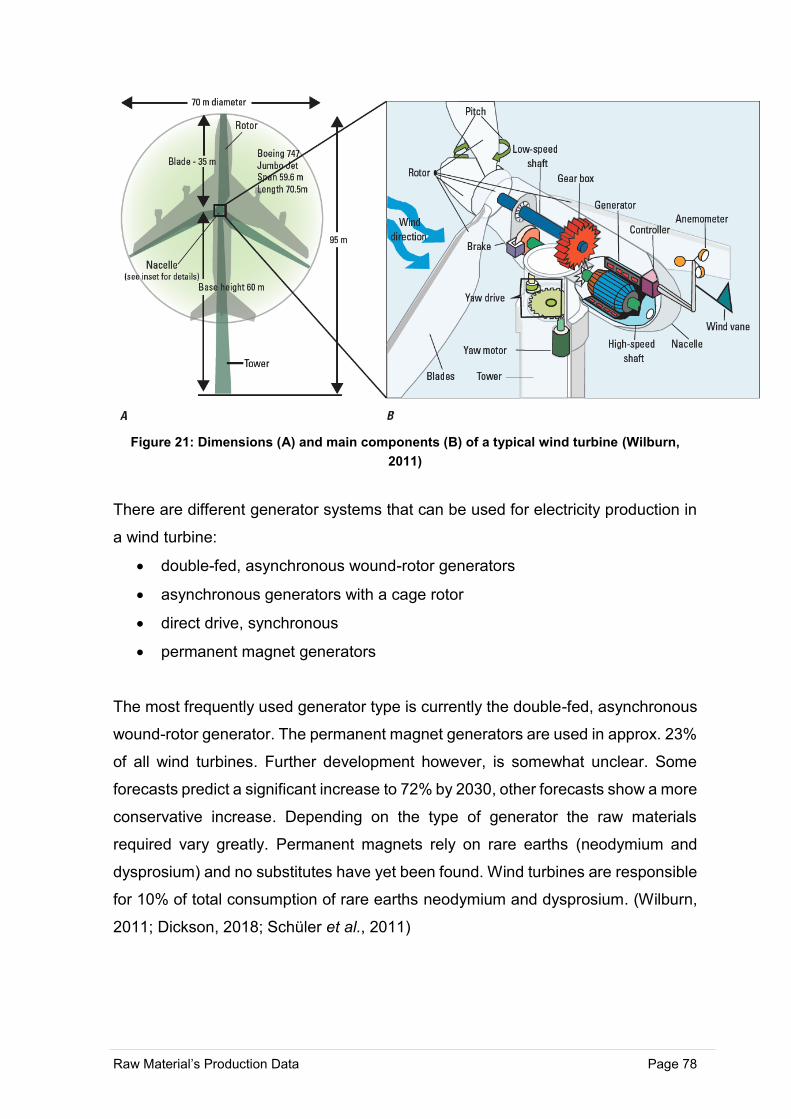
Raw Material’s Production Data Page 78
Figure 21: Dimensions (A) and main components (B) of a typical wind turbine (Wilburn,
2011)
There are different generator systems that can be used for electricity production in
a wind turbine:
• double-fed, asynchronous wound-rotor generators
• asynchronous generators with a cage rotor
• direct drive, synchronous
• permanent magnet generators
The most frequently used generator type is currently the double-fed, asynchronous
wound-rotor generator. The permanent magnet generators are used in approx. 23%
of all wind turbines. Further development however, is somewhat unclear. Some
forecasts predict a significant increase to 72% by 2030, other forecasts show a more
conservative increase. Depending on the type of generator the raw materials
required vary greatly. Permanent magnets rely on rare earths (neodymium and
dysprosium) and no substitutes have yet been found. Wind turbines are responsible
for 10% of total consumption of rare earths neodymium and dysprosium. (Wilburn,
2011; Dickson, 2018; Schüler et al., 2011)
Raw Material’s Production Data Page 79
There are numerous authors conducting life cycle assessment (LCA) for wind
turbines, e.g. (Haapala and Prempreeda, 2014) (InTech, 2012) (Asdrubali et al.,
2015) to mention just a few. Among other things, they provide a good overview of
materials required for the production.
The LCA conducted by Venås (2015) compares two turbines for offshore electricity
production - a conventional turbine with double-fed induction generator and a direct
drive permanent magnet generator.
The materials used for the nacelle and respective amounts are stated in the
following:
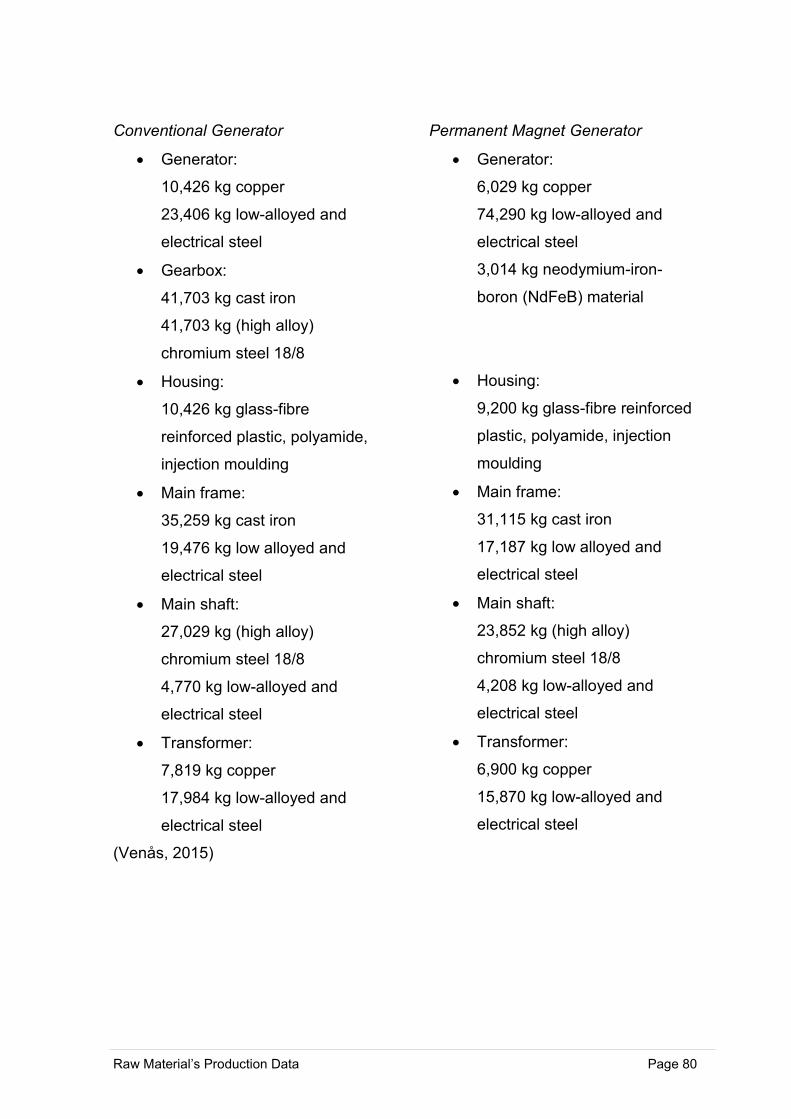
Raw Material’s Production Data Page 80
Conventional Generator
• Generator:
10,426 kg copper
23,406 kg low-alloyed and
electrical steel
• Gearbox:
41,703 kg cast iron
41,703 kg (high alloy)
chromium steel 18/8
• Housing:
10,426 kg glass-fibre
reinforced plastic, polyamide,
injection moulding
• Main frame:
35,259 kg cast iron
19,476 kg low alloyed and
electrical steel
• Main shaft:
27,029 kg (high alloy)
chromium steel 18/8
4,770 kg low-alloyed and
electrical steel
• Transformer:
7,819 kg copper
17,984 kg low-alloyed and
electrical steel
Permanent Magnet Generator
• Generator:
6,029 kg copper
74,290 kg low-alloyed and
electrical steel
3,014 kg neodymium-iron-
boron (NdFeB) material
• Housing:
9,200 kg glass-fibre reinforced
plastic, polyamide, injection
moulding
• Main frame:
31,115 kg cast iron
17,187 kg low alloyed and
electrical steel
• Main shaft:
23,852 kg (high alloy)
chromium steel 18/8
4,208 kg low-alloyed and
electrical steel
• Transformer:
6,900 kg copper
15,870 kg low-alloyed and
electrical steel
(Venås, 2015)
Raw Material’s Production Data Page 81
Permanent magnets using NdFeB-materials consist of 70% iron, 29% neodymium,
and 1% boron. Usually, it is not pure neodymium but rather an alloy of neodymium
with another rare earth element. Preferably, praseodymium as it has very similar
properties to neodymium and does not change the magnetic field. The ratio of the
mixture depends on the ore used, as separation is very difficult and expensive
(commonly 4 parts neodymium to 1 part praseodymium). Adding dysprosium can
have positive effects on the strength of the magnetic field especially at higher
temperatures. It also improves the corrosion resistance of the magnet. Alternatively,
terbium can be used with similar effects. Dysprosium is added with 3-5% of the total
weight of the magnet, terbium with < 1%. (Venås, 2015)
Breaking down the amount of NdFeB-material used for the turbine (3,014 kg),
2,109.8 kg iron, 874.1 kg rare earths, and 30.1 kg boron are required.
The comparison of material input for a conventional generator to a permanent
magnet generator shows that the permanent magnet generator does not require a
gearbox. Therefore, it is saving more than 80 t of cast iron and high alloy chromium
steel (approx. 41 t each). Also, for the other parts the permanent magnet turbine
has a lower material input than the conventional turbine. However, it requires 50 t
more low alloyed steel for the generator and additionally 3 t of NdFeB-material. In
total the material input for the permanent magnet turbine is 41 t lower than for the
conventional turbine. (Venås, 2015)
While permanent magnets seemed to be the way forward for some time, it is
currently not clear how their application will develop in the future. One of the largest
wind turbine producers, Vestas, pursues the production of conventional drive
turbines which require approx. 1/10 of rare earth elements, as opposed to direct-
drive (without gearbox) turbines. In conventional drive turbines rare earth elements
are still used in generator magnets and magnets used in the tower, however, they
do not contain permanent magnets and contribute < 0.1% to life cycle impacts.
(Vestas, 2019)
On the other hand, the company ENERCON, the wind turbine producer with the
largest market share in Germany, switched its production completely to gearless
systems. Also, Siemens and GE Renewable Energy offer direct drive turbines.
Permanent magnets are very useful for offshore wind farms. (Schüler et al., 2011;
GE Renewable Energy, 2019; Siemens, 2017)
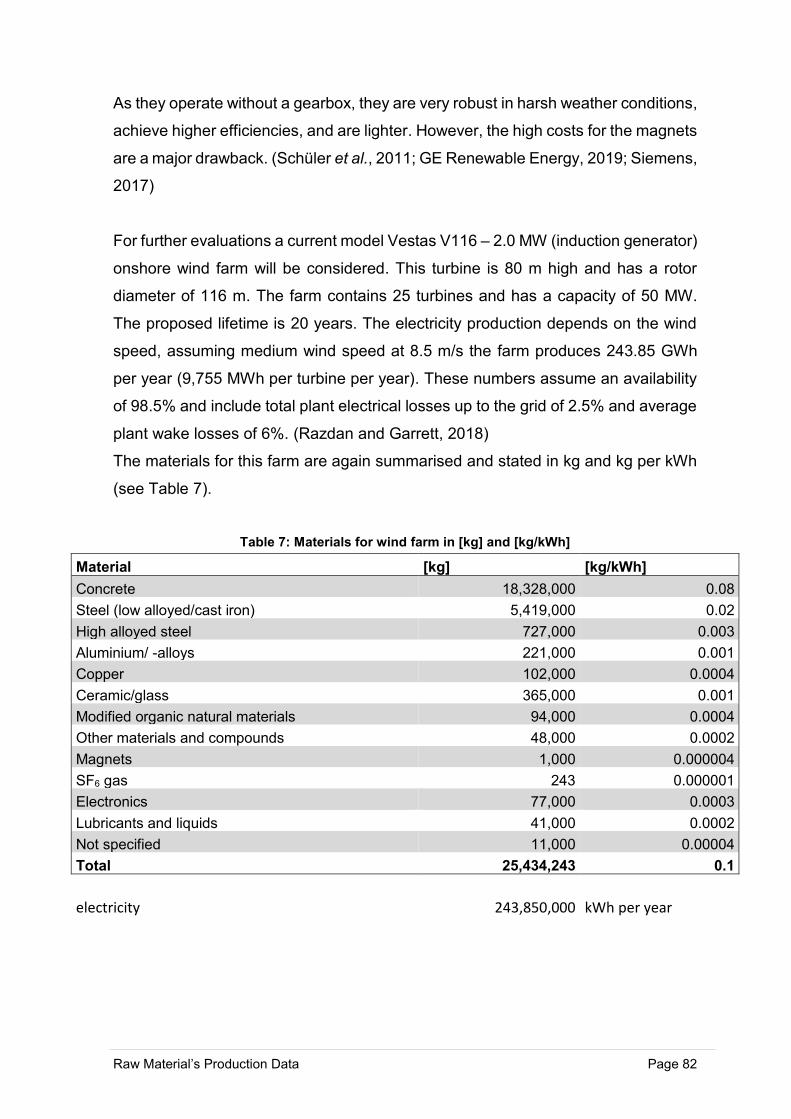
Raw Material’s Production Data Page 82
As they operate without a gearbox, they are very robust in harsh weather conditions,
achieve higher efficiencies, and are lighter. However, the high costs for the magnets
are a major drawback. (Schüler et al., 2011; GE Renewable Energy, 2019; Siemens,
2017)
For further evaluations a current model Vestas V116 – 2.0 MW (induction generator)
onshore wind farm will be considered. This turbine is 80 m high and has a rotor
diameter of 116 m. The farm contains 25 turbines and has a capacity of 50 MW.
The proposed lifetime is 20 years. The electricity production depends on the wind
speed, assuming medium wind speed at 8.5 m/s the farm produces 243.85 GWh
per year (9,755 MWh per turbine per year). These numbers assume an availability
of 98.5% and include total plant electrical losses up to the grid of 2.5% and average
plant wake losses of 6%. (Razdan and Garrett, 2018)
The materials for this farm are again summarised and stated in kg and kg per kWh
(see Table 7).
Table 7: Materials for wind farm in [kg] and [kg/kWh]
Material [kg] [kg/kWh]
Concrete 18,328,000 0.08
Steel (low alloyed/cast iron) 5,419,000 0.02
High alloyed steel 727,000 0.003
Aluminium/ -alloys 221,000 0.001
Copper 102,000 0.0004
Ceramic/glass 365,000 0.001
Modified organic natural materials 94,000 0.0004
Other materials and compounds 48,000 0.0002
Magnets 1,000 0.000004
SF6 gas 243 0.000001
Electronics 77,000 0.0003
Lubricants and liquids 41,000 0.0002
Not specified 11,000 0.00004
Total 25,434,243 0.1
electricity 243,850,000 kWh per year
Raw Material’s Production Data Page 83
Considering the materials used for the construction of the wind farm it cannot be
identified whether any renewable materials are used, as “modified organic natural
materials” is not specified in more detail. Many first-generation wind farms are about
to reach their end-of-life, so considering recyclability is of utmost importance.
According to Vestas many parts of the turbine can be recycled almost entirely. For
example, tower sections consisting mainly of mono-material (steel, cast iron, etc.)
can be recycled up to 98%. Gearbox, generator, cables, and yaw system reach 95%
recyclability. In general, steel, aluminium, and copper used are 92% recyclable, 8%
go to landfills. Not recyclable materials are polymers, fluids, and other materials.
These make up 74% of total material input of the wind farms considered in Table 7
(incl. concrete, ceramic/glass, modified organic natural materials, other materials
and compounds, lubricants and liquids, and not specified).
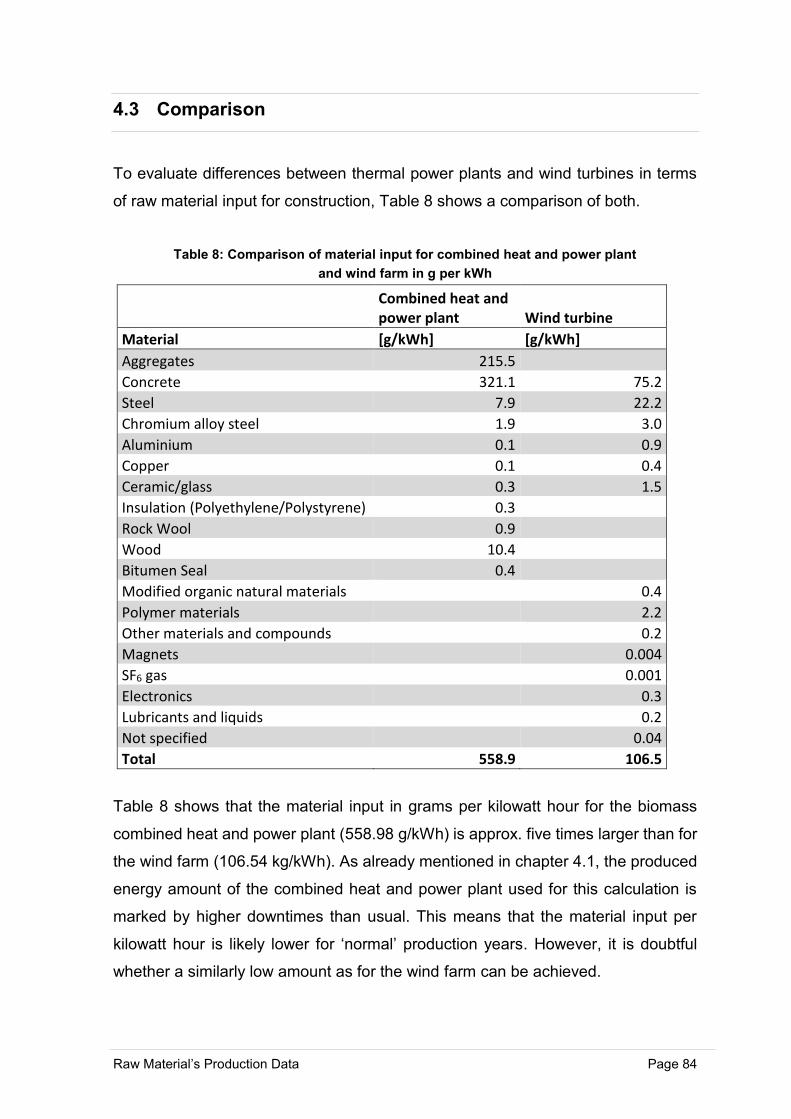
Raw Material’s Production Data Page 84
4.3 Comparison
To evaluate differences between thermal power plants and wind turbines in terms
of raw material input for construction, Table 8 shows a comparison of both.
Table 8: Comparison of material input for combined heat and power plant
and wind farm in g per kWh
Combined heat and power plant Wind turbine
Material [g/kWh] [g/kWh]
Aggregates 215.5
Concrete 321.1 75.2
Steel 7.9 22.2
Chromium alloy steel 1.9 3.0
Aluminium 0.1 0.9
Copper 0.1 0.4
Ceramic/glass 0.3 1.5
Insulation (Polyethylene/Polystyrene) 0.3
Rock Wool 0.9
Wood 10.4
Bitumen Seal 0.4
Modified organic natural materials 0.4
Polymer materials 2.2
Other materials and compounds 0.2
Magnets 0.004
SF6 gas 0.001
Electronics 0.3
Lubricants and liquids 0.2
Not specified 0.04
Total 558.9 106.5
Table 8 shows that the material input in grams per kilowatt hour for the biomass
combined heat and power plant (558.98 g/kWh) is approx. five times larger than for
the wind farm (106.54 kg/kWh). As already mentioned in chapter 4.1, the produced
energy amount of the combined heat and power plant used for this calculation is
marked by higher downtimes than usual. This means that the material input per
kilowatt hour is likely lower for ‘normal’ production years. However, it is doubtful
whether a similarly low amount as for the wind farm can be achieved.
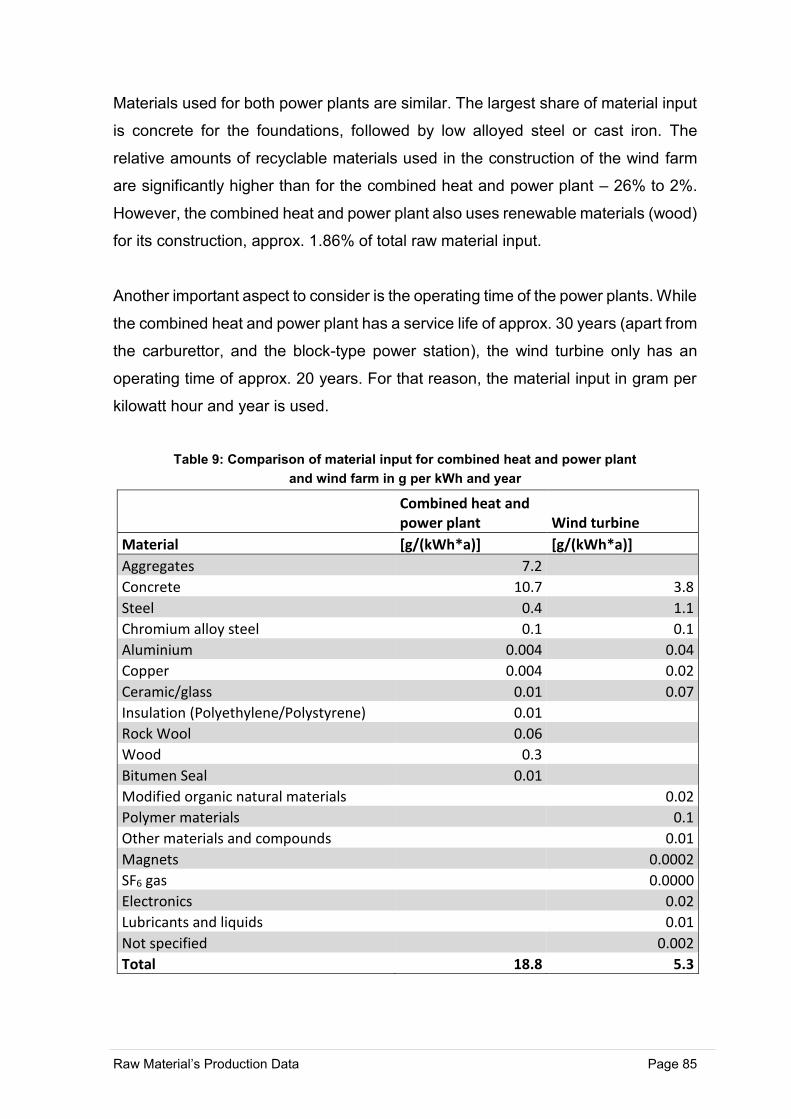
Raw Material’s Production Data Page 85
Materials used for both power plants are similar. The largest share of material input
is concrete for the foundations, followed by low alloyed steel or cast iron. The
relative amounts of recyclable materials used in the construction of the wind farm
are significantly higher than for the combined heat and power plant – 26% to 2%.
However, the combined heat and power plant also uses renewable materials (wood)
for its construction, approx. 1.86% of total raw material input.
Another important aspect to consider is the operating time of the power plants. While
the combined heat and power plant has a service life of approx. 30 years (apart from
the carburettor, and the block-type power station), the wind turbine only has an
operating time of approx. 20 years. For that reason, the material input in gram per
kilowatt hour and year is used.
Table 9: Comparison of material input for combined heat and power plant
and wind farm in g per kWh and year
Combined heat and power plant Wind turbine
Material [g/(kWh*a)] [g/(kWh*a)]
Aggregates 7.2 Concrete 10.7 3.8
Steel 0.4 1.1
Chromium alloy steel 0.1 0.1
Aluminium 0.004 0.04
Copper 0.004 0.02
Ceramic/glass 0.01 0.07
Insulation (Polyethylene/Polystyrene) 0.01 Rock Wool 0.06 Wood 0.3 Bitumen Seal 0.01 Modified organic natural materials 0.02
Polymer materials 0.1
Other materials and compounds 0.01
Magnets 0.0002
SF6 gas 0.0000
Electronics 0.02
Lubricants and liquids 0.01
Not specified 0.002
Total 18.8 5.3
Raw Material’s Production Data Page 86
For this comparison the materials required for the carburettor are multiplied with 1.5,
and for the block-type power station times 3.75. Table 9 shows that including the
service life of the two power plants into the considerations the difference of the
material input decreases. Now the material input for the combined heat and power
plant is only 3.5 times higher than for the wind farm.
The metals used in both power plants show a high recyclability. According to
Braedel et al. (2011) the End-of-life Recycling Rate for chromium is 90% (average
value), for iron 72% (average), for aluminium 58% (average), and for copper 68%.
Moreover, none of these metals are considered as critical for the EU. The largest
producers of iron in 2017 were Australia, China, and Brazil. There is also iron
production in the EU – for example, in Sweden and Austria. EU producers of
aluminium are among others Germany and France. The largest producers
worldwide are China and Russia. Chromium is produced in Finland and Greece,
Copper in Spain and Bulgaria. More detailed information on countries producing the
metals discussed can be found in the Annex. The tables are organised by the largest
producer in 2017.
Wind turbines also contain sulphur hexafluoride gas (SF6). It is used in switchgears
that are used in every turbine and to connect turbines and transformer stations. SF6
is a very powerful greenhouse gas and its disposal has to be done very carefully as
to not release it into the atmosphere. Therefore, the switchgears have to be
collected and SF6 gas is reclaimed for reuse. (Vestas, 2019)
For the sake of completeness, materials used for permanent magnets in wind
turbines shall be considered as well. Schüler et al. find that the recycling of
permanent magnet materials is far from ideal. Especially during the production
process a lot of material is lost, which is not yet recovered. Studies show that approx.
20-30% of rare earth magnets are lost during production. There are various
approaches on lab-scale on the reclamation of rare earth scrap from these
processes; however, none are in use on large scale yet. Also, in terms of substitution
(apart from the conventional drive for wind turbines) there are no commercially
available alternatives offering the same performance, incl. coercivity, corrosion
resistance, etc.
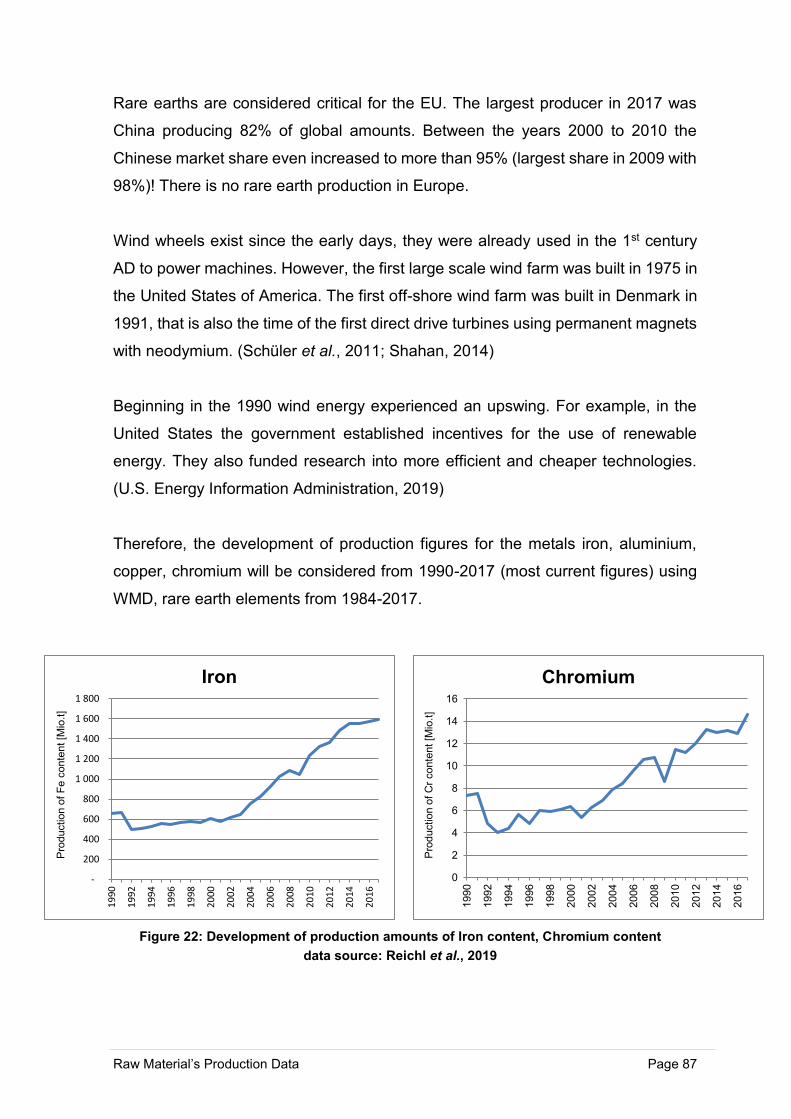
Raw Material’s Production Data Page 87
Rare earths are considered critical for the EU. The largest producer in 2017 was
China producing 82% of global amounts. Between the years 2000 to 2010 the
Chinese market share even increased to more than 95% (largest share in 2009 with
98%)! There is no rare earth production in Europe.
Wind wheels exist since the early days, they were already used in the 1st century
AD to power machines. However, the first large scale wind farm was built in 1975 in
the United States of America. The first off-shore wind farm was built in Denmark in
1991, that is also the time of the first direct drive turbines using permanent magnets
with neodymium. (Schüler et al., 2011; Shahan, 2014)
Beginning in the 1990 wind energy experienced an upswing. For example, in the
United States the government established incentives for the use of renewable
energy. They also funded research into more efficient and cheaper technologies.
(U.S. Energy Information Administration, 2019)
Therefore, the development of production figures for the metals iron, aluminium,
copper, chromium will be considered from 1990-2017 (most current figures) using
WMD, rare earth elements from 1984-2017.
-
200
400
600
800
1 000
1 200
1 400
1 600
1 800
19
90
19
92
19
94
19
96
19
98
20
00
20
02
20
04
20
06
20
08
20
10
20
12
20
14
20
16
Pro
ductio
n o
f F
e c
onte
nt [M
io.t
]
Iron
0
2
4
6
8
10
12
14
16
1990
1992
1994
1996
1998
2000
2002
2004
2006
2008
2010
2012
2014
2016
Pro
ductio
n o
f C
r conte
nt [M
io.t
]
Chromium
Figure 22: Development of production amounts of Iron content, Chromium content
data source: Reichl et al., 2019
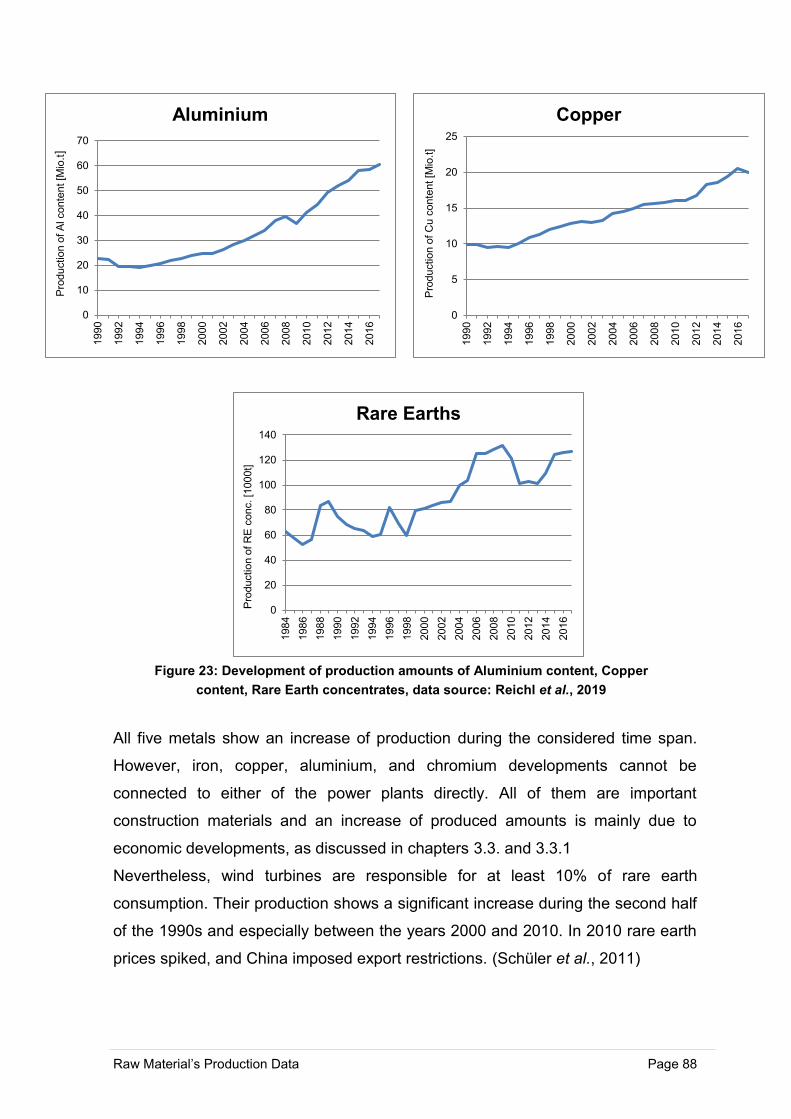
Raw Material’s Production Data Page 88
All five metals show an increase of production during the considered time span.
However, iron, copper, aluminium, and chromium developments cannot be
connected to either of the power plants directly. All of them are important
construction materials and an increase of produced amounts is mainly due to
economic developments, as discussed in chapters 3.3. and 3.3.1
Nevertheless, wind turbines are responsible for at least 10% of rare earth
consumption. Their production shows a significant increase during the second half
of the 1990s and especially between the years 2000 and 2010. In 2010 rare earth
prices spiked, and China imposed export restrictions. (Schüler et al., 2011)
0
10
20
30
40
50
60
70
1990
1992
1994
1996
1998
2000
2002
2004
2006
2008
2010
2012
2014
2016
Pro
duction o
f A
l conte
nt [M
io.t
]
Aluminium
0
20
40
60
80
100
120
140
1984
1986
1988
1990
1992
1994
1996
1998
2000
2002
2004
2006
2008
2010
2012
2014
2016
Pro
ductio
n o
f R
E c
onc. [1
000t]
Rare Earths
0
5
10
15
20
25
1990
1992
1994
1996
1998
2000
2002
2004
2006
2008
2010
2012
2014
2016
Pro
ductio
n o
f C
u c
onte
nt [M
io.t
]
Copper
Figure 23: Development of production amounts of Aluminium content, Copper
content, Rare Earth concentrates, data source: Reichl et al., 2019
Raw Material’s Production Data Page 89
In combination with economic recession rare earth production decreased. The
recovery started in 2013. These developments correlate with the expansion of wind
energy.
Another important difference is the energy and material input for electricity
production. Firstly, the combined heat and power plant requires energy (electricity
and heat) for the drying process of the wood chippings. For the assessed power
plant this amounts to approx. 560 MWh. Secondly, in order to produce electricity
and heat, it requires a constant input of biomass for the burning process. In 2016
that meant an input of 1,179 t wood chippings with a total energy content of 5,171.17
MWh. (Käppler, 2015)
The electricity required for operating wind turbines is neglectable. There are only
minor amounts used for system controls.
This thesis does not consider material input for maintenance. Moreover, the
transport, construction processes, grids, etc. are not evaluated. It can be assumed
that distances between combined heat and power plant and its consumers are
generally smaller than for wind farms. Wind farms, especially offshore farms, are
usually long distances from the consumer, or existing electricity grids. That means,
construction of new infrastructure is likely very resource intensive. Logistics and
transport probably involve greater effort than for combined heat and power plants
as well.
Another point not considered in this evaluation is the use of land which would be
significantly higher for the wind farm by a factor of at least 10. The combined heat
and power plant assessed here requires a space of 33,510 m². The wind farm
consists of 25 turbines each with a rotor diameter of 116 m. That equals an area of
336.400 m² without considering the distance that needs to be included in between
the turbines. (Käppler, 2015; Razdan and Garrett, 2018)
Raw Material’s Production Data Page 90
5 Conclusion
In chapter 2 Collections of Raw Material’s Production Data, four different data
collections for raw material production data are introduced. The data collections
were chosen according to their public availability and the amount of countries and
raw materials covered. These are three providers reporting global production, the
Austrian Federal Ministry for Sustainability and Tourism and their World Mining Data
(WMD), the British Geological Survey (BGS) and their World Mineral Production,
and the United States Geological Survey (USGS) with their Minerals Yearbook.
Moreover, one data provider for European production data is considered – Eurostat
Material Flow Database in order to include a different form of reporting and see its
advantages and disadvantages.
The goal is to assess the collections in terms of data reported (countries and raw
materials included, physical form of raw material reported), methods of data
collection, etc. These are then compared to find strengths and weaknesses.
It is also attempted to provide a guideline on which collection to use for what kind of
information.
The conclusion is that the three international data reports provide very similar data,
both in terms of commodities reported, and countries covered. Moreover, the
methods of data collection also show a lot of commonalities. Mainly desktop
research and information by contacts in governments and companies are employed,
but also questionnaires are sent out to embassies or responsible government
agencies.
The main differences can be seen in the setup of the reports and the additional data
provided. BGS only reports production numbers sorted by commodity and
subdivided by continent and country respectively. WMD has additional sections
sorting production by development status of the countries, political stability,
economic blocks, etc. It also provides graphics illustrating, for example, the
distribution of raw material production among continents or major developments in
global mining production. (Reichl et al., 2019)
Raw Material’s Production Data Page 91
USGS has a different approach for the Minerals Yearbook as the other two
international collections. Each commodity is published in a separate report, which
also includes background information on the industry, uses, reserves, and
resources. However, the main focus is on developments in the United States. This
shows the manpower employed by the USGS. Each commodity report is edited by
a commodity-specialist supported by data analysts. The same is the case for the
country reports in Volume III of the Minerals Yearbook.
No clear recommendation as to what report to use can be given. All three providers
have their strengths and the ideal collection depends on the application it is used
for. The quality of data appears to be very similar; no major differences could be
found. It seems the WMD are most coherent in terms of what form of raw material
is reported, always focusing on metal content or concentrate/product available on
the market. Moreover, it is very favourable that sources and reliability of data are
clearly stated. BGS is preferred if long-term evaluations are conducted. They offer
coherent data since 1913 and do not change the form a raw material is reported in
in order to allow maximum comparability. USGS is most useful if additional data is
required. One example for its application is the Critical Raw Materials list by the
European Commission where information on the application, industry, etc. are an
important input. However, a lot of the information provided is focused on the US.
Eurostat provides different data for European countries than the international
collections. First of all, they report ores rather than metal contents. Secondly, many
commodities are aggregated in groups and not reported separately, for example,
precious metals, instead of gold, silver, etc. One advantage of this collection is the
additional data provided, such as import and export figures, or physical trade
balance. Moreover, very recent data is published usually with only a one-year delay.
However, unfortunately the database is very incomplete, and a lot of data is not
published due to privacy issues. Which makes a comparison of the actual figures
with the international collections difficult and its use for long-term evaluations is not
possible.
Raw Material’s Production Data Page 92
A comparison of actual production figures of the three international providers
showed that there are differences, but they are usually minor. However, a
comparison with Eurostat figures proved difficult, as many raw materials are
aggregated in groups. Moreover, there are large gaps where figures are not
published due to the mentioned privacy issues and in order to be able to compare
the figures ores had to be converted to metal content (see chapter 2.5).
Chapter 3 Applications assesses different uses of raw material production data.
There are many studies relying on the data providers discussed before.
The production figures are relevant for companies, both upstream and downstream
for their strategic planning. Furthermore, they are a very important tool for policy
makers, not only for ensuring raw material supply for the economies, but also for
reaching targets in line with sustainability and circular economy considerations.
Two applications discussed in this chapter are the criticality assessment of the
European Union, and the Sustainable Development Goals. The criticality
assessment is a study conducted by the European Commission in a three-year
interval. This study has the purpose of showing which minerals are of fundamental
importance for the European economy, but are connected to supply risks. Without
the production data and additional information by above mentioned reports, this
evaluation would not be possible. However, this assessment also shows the need
for improved data collection for Europe. For example, for many raw materials there
is no information on their uses in the EU, but the criticality study has to rely on
information by USGS for the US.
Production data is also highly relevant for assessing the progress towards achieving
the Sustainable Development Goals, especially Goal 12 Responsible Production
and Consumption. Production data, as well as import and export figures are used
for modelling material flows of economic systems which show the material intensity
of an economy. This is useful information for evaluating where policies have to act
in order to achieve a more sustainable and efficient use of raw materials. Goal 12
needs special consideration in the European Union.
Raw Material’s Production Data Page 93
Even though most EU members show great progress towards achieving the SDGs
in general, all of them struggle with Goal 12. The most critical issues are the
sustainable management of natural resources and the abolishment of fossil fuel
subsidies. (Sachs et al., 2019; Bauer et al., 2018)
Another interesting application of raw material production data is material flow
accounting (MFA). MFA analyses the material flows into, inside, and out of an
economic system.
With this analysis consumption patterns can be identified which makes it a very
useful tool in the efforts for achieving SDG 12 and circular economy. For this
purpose, long-term data is necessary. Therefore, Krausmann et al. mainly use
USGS as a source of production data as they range back to 1900. However, MFA
utilises the “run-of-mine”-concept which means metal contents reported by USGS
(or the other international collections) need to be converted to gross ores. The
conversion requires the knowledge of the percentage of metal inside the ore which
varies greatly between different deposits. Usually an average value is chosen. This
can lead to deviations between gross ore calculated and actual produced amount.
Another issue for MFA is the missing recording of aggregates, such as sand and
gravel, or limestone. In order to conduct a complete MFA for an economy these
materials are very important as they are a major input in infrastructure and building
stock. To evaluate these amounts a bottom-up approach is used for estimations –
number of kilometres of roads built requires so much material, etc.
The last part of this thesis, chapter 4 Raw Material’s Consumption in Light of New
Technologies, compares the raw material input of two electricity producers. It
evaluates a combined heat and power plant, producing electricity and heat for
district heating by burning biomass, and an onshore wind farm of 25 wind turbines.
The material input for building both types of power plants is put in relation to the
amount of energy produced per year and the lifetime of the power plant. This
comparison shows that the material input in gram per kilowatt hour and operating
year for a wind farm (5.33 g/(kWh*a)) is lower than for a combined heat and power
plant (18.80 g/(kWh*a)). The wind farm also uses a higher percentage of recyclable
materials. On the other hand, the combined heat and power plant utilises renewable
materials for the construction.
Raw Material’s Production Data Page 94
The combined heat and power plant also relies on constant energy and material
input (electricity and biomass) for electricity and heat production.
However, certain kinds of wind turbines use rare earths for permanent magnet
generators and are responsible for approx. 10% of total global consumption of
neodymium and dysprosium. Not only are rare earths considered critical for the
European Union as China is the main producer with a market share of over 82% in
2017. (Reichl et al., 2019) But also, the processing is a very inefficient process
causing a lot of material loss and the recycling rates of rare earth magnets are still
very low. (Schüler et al., 2011; Dickson, G., 2018)
Considering the materials used for the construction, it was not possible to show a
relation between the production figures of the metals and the type of power plant
being constructed, as both types of plants use the same common materials that are
used in all forms of construction worldwide. Only rare earth production likely shows
a connection to increasing wind turbine production.
Not assessed are the construction of new infrastructure, logistics, and transport.
Which are probably higher for the wind farm due to longer distances from the
existing grid and its consumers. Also, the area required for both types of power
plants was not evaluated. Again, this would mean a much higher consumption of
resources from the wind farm than the combined heat and power plant. The
considered combined heat and power plant utilises a space of 33,510 m², whereas
the wind farm requires more than 336,400 m² (25 turbines with 116 m rotor diameter
each, not considering the distance between the turbines). (Käppler, 2015; Razdan
and Garrett, 2018)
Raw Material’s Production Data Page 95
6 Bibliography
Asdrubali, F., Baldinelli, G., D'Alessandro, F. and Scrucca, F. (2015), “Life cycle assessment of
electricity production from renewable energies: Review and results harmonization”,
Renewable and Sustainabl Energy Reviews, No. 42, pp. 1113–1122.
Bauer, B., Watson, D. and Gylling, A.C. (2018), Sustainable Consumption and Production: An
Analysis of Nordic Progress towards SDG12, and the way ahead.
Blengini, G.A., Blagoeva, D., Dewulf, J., Torres de Matos, C. and Nita, V. (2017), Assessment of the
Methodology for Establishing the EU List of Critical Raw Materials: Background Report,
Luxembourg.
Boumphrey, S. (2016), Sustainability and the New Normal for Natural Resources.
Braedel, T.E., Allwood, J., Birat, J.-P., Reck, B.K. and Sibley, S.F. (2011), Recycling Rates of Metals:
A Status Report, A Report of the Working Group on the Global Metal Flows to the
International Resource Panel.
Brown, T.J., Idoine, N.E., Raycraft, E.R., Hobbs, S.F., Shaw, R.A., Everett, P., Kresse, C., Deady, E.A.
and Bide, T. (2019), World Mineral Production 2013-2017, Keyworth, Nottingham.
Bureau of Intelligence and Research (2019), “Independent States in the World”, available at:
https://www.state.gov/independent-states-in-the-world/ (accessed 25 December 2019).
DG Grow, Unit C2 Resource Efficiency and Raw Materials (2019), “Critical raw materials - Internal
Market, Industry, Entrepreneurship and SMEs - European Commission”, available at:
https://ec.europa.eu/growth/sectors/raw-materials/specific-interest/critical_en (accessed 10
October 2019).
Dickson, G. (2018), Raw Materials and the wind industry, Raw Materials Week.
EIT RawMaterials (2019), “Innovation Themes”, available at:
https://eitrawmaterials.eu/innovation-themes/ (accessed 18 October 2019).
Endl, A., Tost, M., Hitch, M., Moser, P. and Feiel, S. (2019), “Europe's mining innovation trends
and their contribution to the sustainable development goals: Blind spots and strong points”,
Resources Policy.
EuroGeoSurveys (2016), “Mineral Resources”, available at:
https://www.eurogeosurveys.org/expertgroups/mineral-resources/ (accessed 21 October
2019).
Raw Material’s Production Data Page 96
European Commission (2008), Communication from the Commission to the European Parliament
and the Council: The raw materials initiative - meeting our critical needs for growth and jobs in
Europe, {SEC(2008) 2741}, Brussels, available at: https://eur-lex.europa.eu/legal-
content/EN/TXT/?uri=CELEX:52008DC0699 (accessed 10 June 2019).
European Commission (2014), Communication from the Commission to the European Parliament,
the Council, the European Economic and Social Committee and the Committee of the Regions:
On the review of the list of critical raw materials for the EU and the implementation of the
Raw Materials Initiative, {SWD'(2014) 171 final}, Brussels (accessed 10 June 2019).
European Commission (2015), Communication from the Commission to the European Parliament,
the Council, the European Economic and Social Committee and the Committee of the Regions:
Closing the loop - An EU action plan for the Circular Economy, COM(2015) 614 final, Brussels
(accessed 10 June 2019).
European Commission (2019), “Goal 12. Ensure sustainable consumption and production
patterns”, available at: https://ec.europa.eu/sustainable-development/goal12_en (accessed
24 November 2019).
Eurostat (2019b), Economy-wide material flow accounts (EW-MFA): 2019 EW-MFA questionnaire.
Eurostat (2019a), “Material flow accounts”, available at:
https://appsso.eurostat.ec.europa.eu/nui/show.do?dataset=env_ac_mfa&lang=en.
Eurostat (2018), Economy-wide material flow accounts: Handbook, 2018 edition, available at:
https://ec.europa.eu/eurostat/web/products-manuals-and-guidelines/-/KS-GQ-18-006.
GE Renewable Energy (2019), “Increasing Wind Energy with the Power of Massive Magnets”,
available at: https://www.ge.com/renewableenergy/stories/block-island-ge-store (accessed
30 December 2019).
George, M.W. (2019), Mineral Commodity Summaries: Arsenic (accessed 10 September 2019).
Gislev, M., Grohol, M., Mathieux, F. and Ardente, F. (2018), Report on Critical Raw Materials and
the Circular Economy, Luxembourg (accessed 4 June 2019).
Haapala, K.R. and Prempreeda, P. (2014), “Comparative life cycle assessment of 2.0 MW wind
turbines”, Int. J. Sustainable Manufacturing, No. Vol. 3, No. 2, pp. 170–185.
Haas, W., Krausmann, F., Wiedenhofer, D. and Heinz, M. (2015), “How Circular is the Global
Economy? An Assessment of Material Flows, Waste Production, and Recycling in the European
Union and the World in 2005”, Journal of Industrial Ecology, Vol. 19 No. 5, pp. 765–777.
InTech (Ed.) (2012), Sustainable Development - Energy, Engineering and Technologies -
Manufacturing and Environment: Life Cycle Analysis of Wind Turbine.
International Energy Agency (iea) (2018), Renewables information: Overview.
International Resource Panel (IRP) (2018), Technical Annex for Global Material Flows Database.
Raw Material’s Production Data Page 97
International Resource Panel (IRP) (2019), “Global Material Flows Database”, available at:
https://www.resourcepanel.org/global-material-flows-database (accessed 23 October 2019).
IRENA and IEA-ETSAP (2016), Wind Power: Technology Brief (accessed 24 November 2019).
Joint Research Centre (2019), “Raw Materials Information System”, available at:
https://rmis.jrc.ec.europa.eu/ (accessed 10 October 2019).
Kalmykova, Y., Rosado, L. and Patrício, J. (2016), “Resource consumption drivers and pathways to
reduction: economy, policy and lifestyle impact on material flows at the national and urban
scale”, Journal of Cleaner Production, No. 132, pp. 70–80.
Käppler, E. (2015), “Lebenszyklusanalyse der Strom- und Wärmeerzeugung einer
Holzvergasungsanlage inklusive Nahwärmenetz. Am Beispiel des Schwebefestbettvergasers
des Energiewerk Ilg, Dornbirn”, Master Thesis, Fachhochschule Vorarlberg, Dornbirn, 2015.
Komusanac, I., Fraile, D. and Brindley, G. (2019), Wind energy in Europe in 2018: Trends and
statistics, Brussels (accessed 30 November 2019).
Krausmann, F., Lauk, C., Haas, W. and Wiedenhofer, D. (2018b), From material extraction to
outflows of wastes and emissions: The socioeconomic metabolism of the global economy,
1900-2015: Supporting Information (accessed 10 January 2019).
Krausmann, F., Lauk, C., Haas, W. and Wiedenhofer, D. (2018a), “From resource extraction to
outflows of wastes and emissions: The socioeconomic metabolism of the global economy,
1900–2015”, Global Environmental Change, Vol. 52, pp. 131–140.
Krausmann, F., Weisz, H., Eisenmenger, N., Schütz, H., Haas, W. and Schaffartzik, A. (2018),
Economy-wide Material Flow Accounting: Introduction and Guide, Version 1.2, Vienna.
Krausmann, F., Wiedenhofer, D., Lauk, C., Haas, W., Tanikawa, H., Fishman, T., Miatto, A., Schandl,
H. and Haberl, H. (2017), “Global socioeconomic material stocks rise 23-fold over the 20th
century and require half of annual resource use”, Proceedings of the National Academy of
Sciences of the United States of America, Vol. 114 No. 8, pp. 1880–1885.
LKAB (2017), “Mineral reserves and mineral resources”, available at:
https://www.lkab.com/en/about-lkab/from-mine-to-port/exploration/mineral-reserves-and-
mineral-resources/ (accessed 19 February 2019).
Lutter, S. (2018), Introduction to Material Flow Accounting (MFA).
Lutter, S., Giljum, S. and Gözet, B. (2018), “The concept of material consumption –
materialflows.net”, available at: http://www.materialflows.net/the-concept-of-material-
consumption/ (accessed 3 October 2019).
Mayer, A., Haas, W., Wiedenhofer, D., Krausmann, F., Nuss, P. and Blengini, G.A. (2018),
“Measuring Progress towards a Circular Economy. A Monitoring Framework for Economy-
wide Material Loop Closing in the EU28”, Journal of Industrial Ecology, Vol. 23 No. 1, pp. 62–
76.
Raw Material’s Production Data Page 98
MinLand (2019), “About the project – Minland”, available at: https://minland.eu/project/
(accessed 16 October 2019).
MIREU (2017), “About Us | MIREU”, available at: https://www.mireu.eu/about-us (accessed 16
October 2019).
Pesonen, T. (2019), Raw Materials Week, Brussels.
Razdan, P. and Garrett, P. (2018), Life Cycle Assessment of electricity production from an Onshore
V112-3.3 MW Wind Plant, Aarhus N, Denmark.
Reichl, C., Schatz, M., Masopust, A. and Resel, W. (2019), World Mining Data 2019, Vienna,
available at: https://www.bmnt.gv.at/english/Energy---Mining/Mining/World-Mining-
Data.html (accessed 14 February 2019).
Sachs, J., Schmidt-Traub, G., Kroll, C., Lafortune, G. and Fuller, G. (2019), Sustainable Development
Report 2019, New York.
Schaffartzik, A., Eisenmenger, N. and Krausmann, F. (2015), Resource Use in Austria: Report 2015,
Vienna.
Schüler, D., Buchert, M., Liu, R., Dittrich, S. and Merz, C. (2011), Study on Rare Earths and Their
Recycling: Final Report for the Greens/EFA Group in the European Parliament, Darmstadt.
Shahan, Z. (2014), “Renewable Energy World. History of Wind Turbines”, available at:
https://www.renewableenergyworld.com/2014/11/21/history-of-wind-turbines/#gref
(accessed 20 November 2019).
Siemens (2017), “Windgeneratoren von Siemens”, available at:
https://new.siemens.com/global/de/branchen/windenergie/equipment/energieerzeugung/wi
ndgeneratoren.html (accessed 30 December 2019).
Steinberger, J.K., Krausmann, F. and Eisenmenger, N. (2010), “Global patterns of materials use: A
socioeconomic and geophysical analysis”, Ecological Economics, Vol. 69 No. 5, pp. 1148–1158.
TEPCO Fuel & Power Inc. (2019), “Types of Thermal Power Generation”, available at:
https://www7.tepco.co.jp/fp/thermal-power/types-e.html (accessed 7 December 2019).
TWI2050 - The World in 2050 initiative (2018), Transformations to Achieve the Sustainable
Development Goals: Report prepared by The World in 2050 initiative, Laxenburg, Austria,
available at: http://pure.iiasa.ac.at/15347.
U.S. Energy Information Administration (EIA) (2019), “History of wind power”, available at:
https://www.eia.gov/energyexplained/wind/history-of-wind-power.php (accessed 26
December 2019).
U.S. Geological Survey (2019d), “Mineral Commodity Summaries 2019”, available at:
https://doi.org/10.3133/70202434.
Raw Material’s Production Data Page 99
U.S. Geological Survey (2019b), “Minerals Yearbook. Area Reports: Domestic”, available at:
https://www.usgs.gov/centers/nmic/state-minerals-statistics-and-information.
U.S. Geological Survey (2019c), “Minerals Yearbook. Area Reports: International”, available at:
https://www.usgs.gov/centers/nmic/international-minerals-statistics-and-information.
U.S. Geological Survey (2019a), “Minerals Yearbook. Metals and Minerals”, available at:
https://www.usgs.gov/centers/nmic/minerals-yearbook-metals-and-minerals.
U.S. Geological Survey (2019e), “National Minerals Information Center. Specialty Items”, available
at: https://www.usgs.gov/centers/nmic/specialty-items.
United Nations (UN) (2019a), “Sustainable Development Goals. 17 Goals to Transform Our
World”, available at: https://www.un.org/sustainabledevelopment/ (accessed 24 November
2019).
United Nations (UN) (2019b), “Sustainable Development Goals. Communications materials”,
available at: https://www.un.org/sustainabledevelopment/news/communications-material/
(accessed 25 November 2019).
United Nations (UN) (2019c), “Sustainable Development Goals Knowledge Platform. Sustainable
Development Goal 12”, available at: https://sustainabledevelopment.un.org/sdg12 (accessed
24 November 2019).
United Nations (UN) (2019d), “Sustainable Development Goals Knowledge Platform. Sustainable
consumption and production”, available at:
https://sustainabledevelopment.un.org/topics/sustainableconsumptionandproduction
(accessed 28 November 2019).
Vale (2017), “Iron Ore and Pellets”, available at:
http://www.vale.com/brasil/EN/business/mining/iron-ore-pellets/Pages/default.aspx
(accessed 18 February 2019).
Venås, C. (2015), “Life cycle assessment of electric power generation by wind turbines containing
rare earth magnets”, Master Thesis, Norwegian University of Science and Technology,
Trondheim, 2015.
Verbund AG (2019), “Electricity Generation from Thermal Power Plant”, available at:
https://www.verbund.com/en-at/about-verbund/power-plants/power-plant-types/thermal
(accessed 7 December 2019).
Vestas (2019), “Sustainability. Material use”, available at:
https://www.vestas.com/en/about/sustainability#!material-use (accessed 30 December
2019).
Wilburn, D.R. (2011), Wind Energy in the United States and Materials Required for the Land-Based
Wind Turbine Industry From 2010 Through 2030, Reston, Virginia.
Raw Material’s Production Data Page 100
7 List of Figures
Figure 1: Distribution of mineral production per continent (Reichl et al., 2019) ..... 4
Figure 2: Mine production of antimony in tonnes (metal content) (Brown et al.,
2019) ...................................................................................................................... 8
Figure 3: Main material flows of an economy (Eurostat, 2018) ............................ 12
Figure 4: Exemple questionnaire used by Eurostat (Eurostat, 2018) ................... 15
Figure 5: Table A - Domestic Extraction (Eurostat, 2019b) .................................. 16
Figure 6: Main global suppliers of CRM in metr. tonnes and percent, Source:
(Reichl et al., 2019; Brown et al., 2019) (Brown et al., 2019 (helium, silicon metal)),
adapted from (Gislev et al., 2018) ........................................................................ 42
Figure 7: Diagram illustrating the concept of a circular economy, focusing on
mineral raw materials (EIT RawMaterials, 2019) .................................................. 46
Figure 8: EU-28 material flow for 2014 (Mayer et al., 2018) ................................. 48
Figure 9: Schematics of material flow into, inside, and out of an economy
(Schaffartzik et al., 2015) ..................................................................................... 49
Figure 10: EU-28 Domestic Material Consumption 1990-2017 (left), Global
Domestic Material Consumption 1990-2017 (right), data source: International
Resource Panel (2019) ........................................................................................ 51
Figure 11: Comparison of DMC per capita and RMC per capita for selected
countries in 2013, ................................................................................................. 52
Figure 12: Development of domestic extraction between 1900 and 2015
(Krausmann et al., 2018a) .................................................................................... 53
Figure 13: Development of energy consumption 2010-2015, 2010 = 100%
(Boumphrey, 2016) ............................................................................................... 56
Figure 14: Lorenz curve - Comparison of wealth distribution to percent of
population (Steinberger et al., 2010) .................................................................... 57
Figure 15: The 17 Sustainable Development Goals by the United Nations (United
Nations, 2019b) .................................................................................................... 60
Figure 16: Transformation of primary energy into useful energy (TWI2050 - The
World in 2050 initiative, 2018) .............................................................................. 63
Figure 17: Cascadic use of iron ore to recovered scrap (TWI2050 - The World in
2050 initiative, 2018) ............................................................................................ 63
Raw Material’s Production Data Page 101
Figure 18: Progress of EU-28 members towards achieving the SDGs, data source:
Sachs et al., 2019 ................................................................................................. 67
Figure 19: Innovations and the SDGs they affect (Endl et al. 2019) ..................... 70
Figure 20: Schematic graphic of a thermal power plant using a combined-cycle
(TEPCO Fuel & Power Inc., 2019) ....................................................................... 72
Figure 21: Dimensions (A) and main components (B) of a typical wind turbine
(Wilburn, 2011) ..................................................................................................... 78
Figure 22: Development of production amounts of Iron content, Chromium content
data source: Reichl et al., 2019 ............................................................................ 87
Figure 23: Development of production amounts of Aluminium content, Copper
content, Rare Earth concentrates, data source: Reichl et al., 2019...................... 88
Figure 24: Energy flows of biomass heat and power plant, adapted from Käppler
(2015) ................................................................................................................... VII
Figure 25: Layout main building biomass heat and power plant, adapted from
Käppler .............................................................................................................. VIII
Raw Material’s Production Data Page 102
8 List of Tables
Table 1: Comparison advantages & disadvantages of WMD, BGS, USGS .......... 17
Table 2: Comparison of reported commodities for WMD, BGS, USGS, Eurostat . 21
Table 3: Comparison of production figures for EU-28 between WMD, BGS, USGS,
Eurostat ................................................................................................................ 25
Table 4: Comparison of countries covered by WMD, BGS, USGS red…country not
covered, yellow…additional (non-independent) country, green…alternative/former
name of country .................................................................................................... 31
Table 5: Sub-targets SDG12 and relevant indicators of progress (United Nations,
2019c) .................................................................................................................. 64
Table 6: Materials for combined heat and power plant in [kg] and [kg/kWh] ........ 75
Table 7: Materials for wind farm in [kg] and [kg/kWh] ........................................... 82
Table 8: Comparison of material input for combined heat and power plant and
wind farm in g per kWh ......................................................................................... 84
Table 9: Comparison of material input for combined heat and power plant and
wind farm in g per kWh and year .......................................................................... 85
Table 10: Iron producers [metr. t iron content], organised by largest producer in
2017 (Reichl, et al. 2019) ...................................................................................... IX
Table 11: Chromium producers [metr. t chromium content], organised by largest
producer in 2017 (Reichl, et al. 2019) ................................................................. XXI
Table 12: : Aluminium producers [metr. t aluminium content], organised by largest
producer in 2017 (Reichl, et al. 2019) .............................................................. XXVI
Table 13: Copper producers [metr. t Copper content], organised by largest
producer in 2017 (Reichl, et al. 2019) ............................................................. XXXII
Table 14: Rare Earth producers [metr. t rare earth conc.], organised by largest
producer in 2017 (Reichl, et al. 2019) ............................................................... XLIV
Raw Material’s Production Data Page 103
9 List of Equations
Equation 1: Economic Importance ........................................................................ 40
Equation 2:Supply Risk ........................................................................................ 40
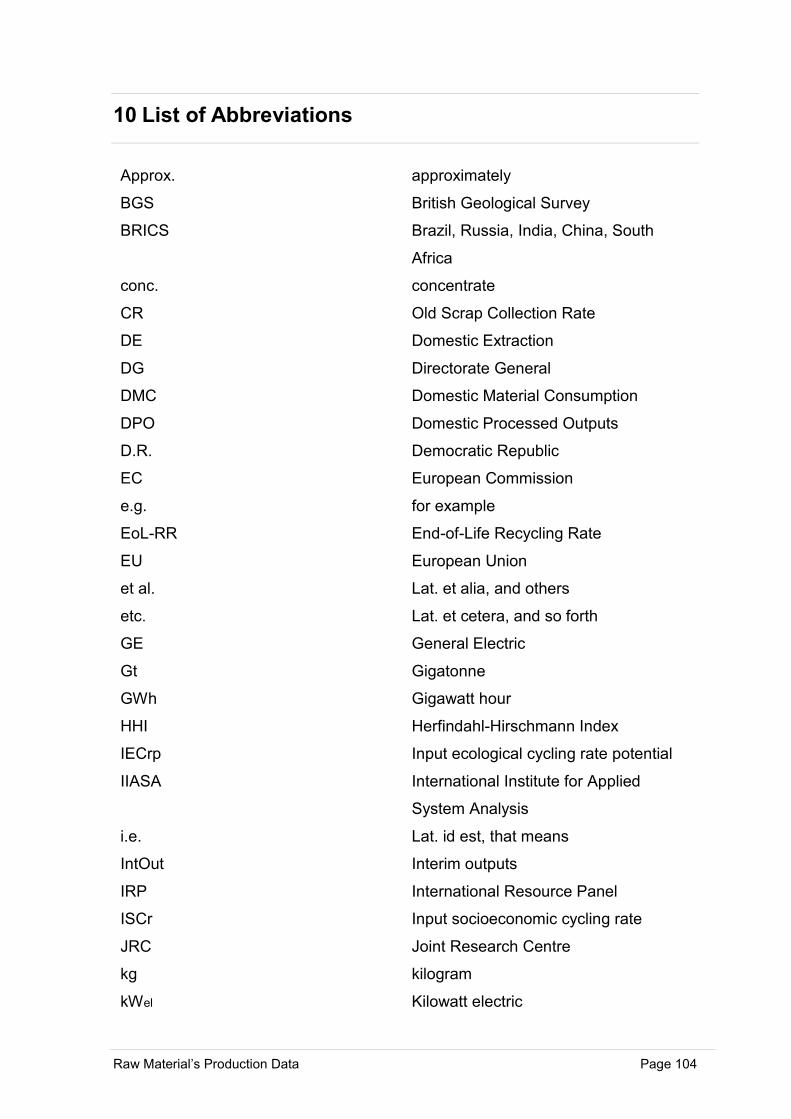
Raw Material’s Production Data Page 104
10 List of Abbreviations
Approx. approximately
BGS British Geological Survey
BRICS Brazil, Russia, India, China, South
Africa
conc. concentrate
CR Old Scrap Collection Rate
DE Domestic Extraction
DG Directorate General
DMC Domestic Material Consumption
DPO Domestic Processed Outputs
D.R. Democratic Republic
EC European Commission
e.g. for example
EoL-RR End-of-Life Recycling Rate
EU European Union
et al. Lat. et alia, and others
etc. Lat. et cetera, and so forth
GE General Electric
Gt Gigatonne
GWh Gigawatt hour
HHI Herfindahl-Hirschmann Index
IECrp Input ecological cycling rate potential
IIASA International Institute for Applied
System Analysis
i.e. Lat. id est, that means
IntOut Interim outputs
IRP International Resource Panel
ISCr Input socioeconomic cycling rate
JRC Joint Research Centre
kg kilogram
kWel Kilowatt electric
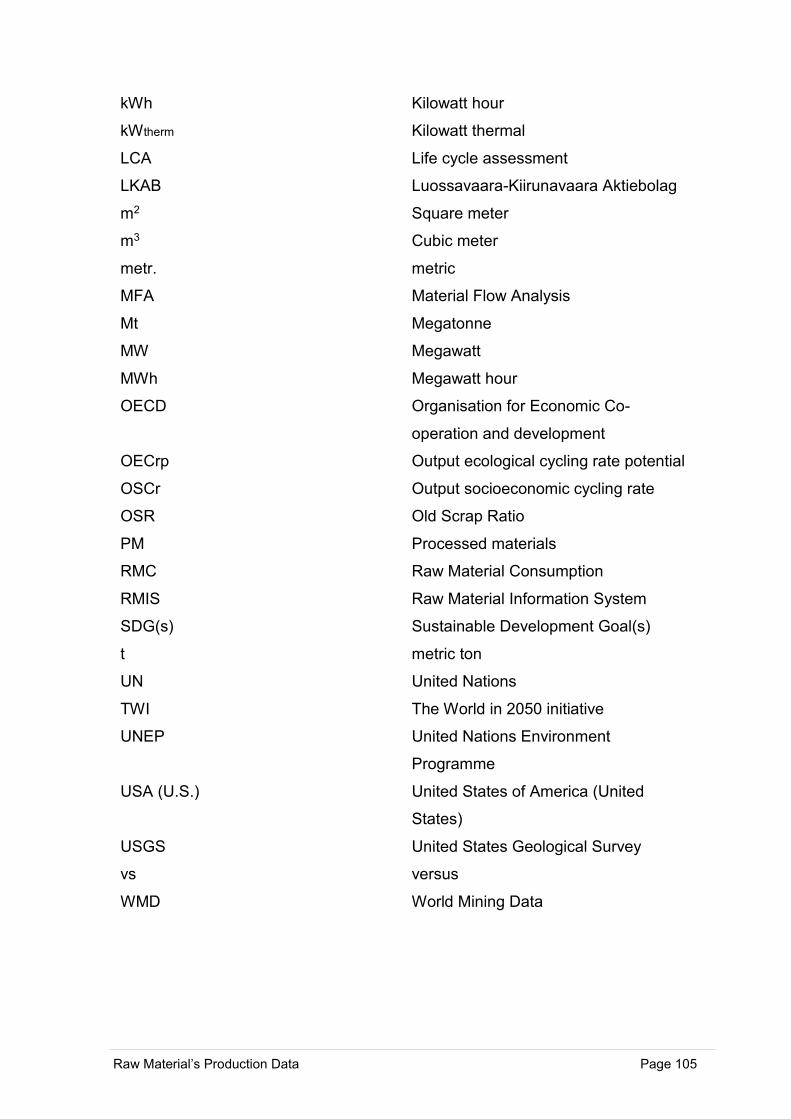
Raw Material’s Production Data Page 105
kWh Kilowatt hour
kWtherm Kilowatt thermal
LCA Life cycle assessment
LKAB Luossavaara-Kiirunavaara Aktiebolag
m2 Square meter
m3 Cubic meter
metr. metric
MFA Material Flow Analysis
Mt Megatonne
MW Megawatt
MWh Megawatt hour
OECD Organisation for Economic Co-
operation and development
OECrp Output ecological cycling rate potential
OSCr Output socioeconomic cycling rate
OSR Old Scrap Ratio
PM Processed materials
RMC Raw Material Consumption
RMIS Raw Material Information System
SDG(s) Sustainable Development Goal(s)
t metric ton
UN United Nations
TWI The World in 2050 initiative
UNEP United Nations Environment
Programme
USA (U.S.) United States of America (United
States)
USGS United States Geological Survey
vs versus
WMD World Mining Data
Raw Material’s Production Data Page VI
Annex
Annex Table of Contents
Annex Table of Contents ....................................................................................... VI
Annex ……………………………………………………………………………………...VI
1. Combined Heat and Power Plant .............................................................. VII
2. Raw Material Production Data for Chapter 4.3 ........................................... IX
Iron ……………………………………………………………………………………..IX
Chromium ........................................................................................................... XXI
Aluminium ......................................................................................................... XXVI
Copper ............................................................................................................. XXXII
Rare Earth Concentrates .................................................................................. XLIV
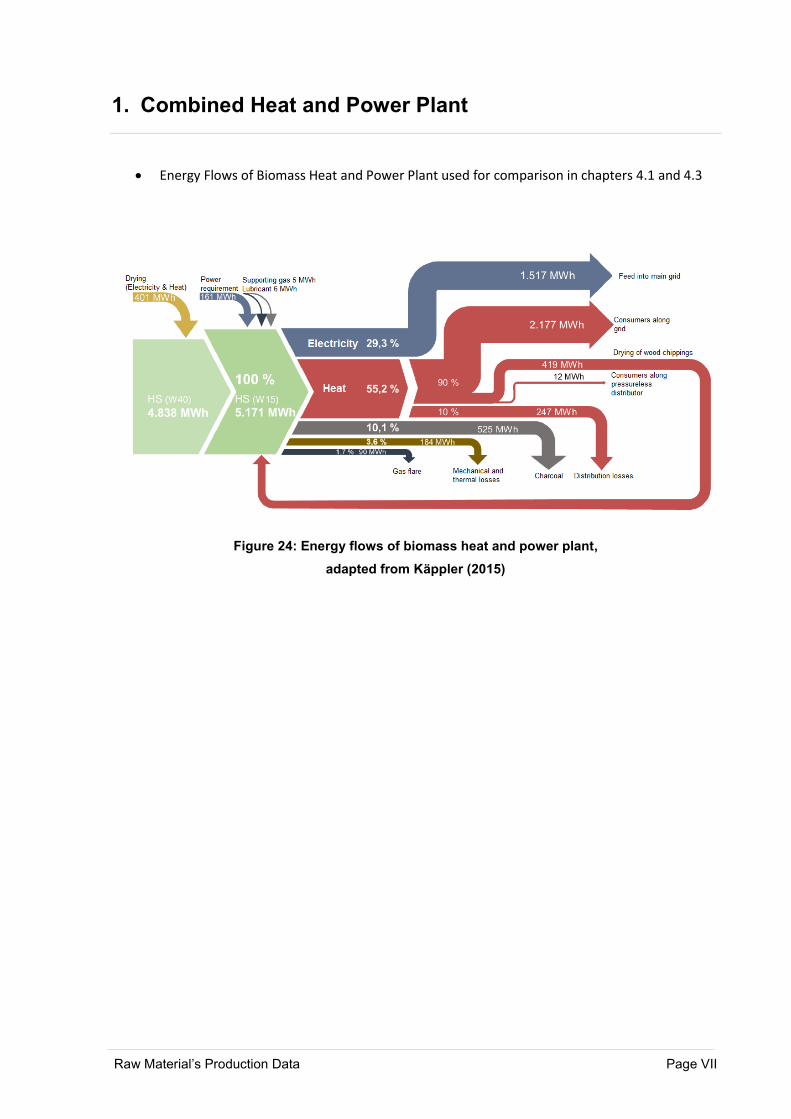
Raw Material’s Production Data Page VII
1. Combined Heat and Power Plant
• Energy Flows of Biomass Heat and Power Plant used for comparison in chapters 4.1 and 4.3
Figure 24: Energy flows of biomass heat and power plant,
adapted from Käppler (2015)
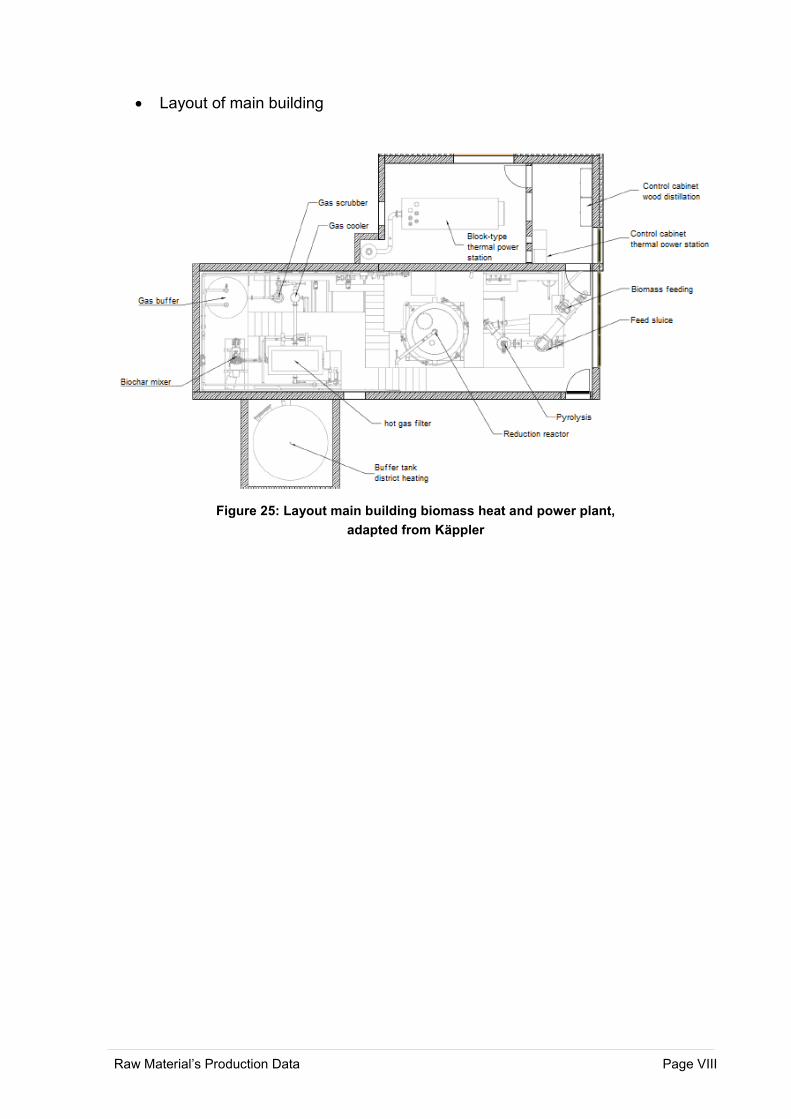
Raw Material’s Production Data Page VIII
• Layout of main building
Figure 25: Layout main building biomass heat and power plant,
adapted from Käppler
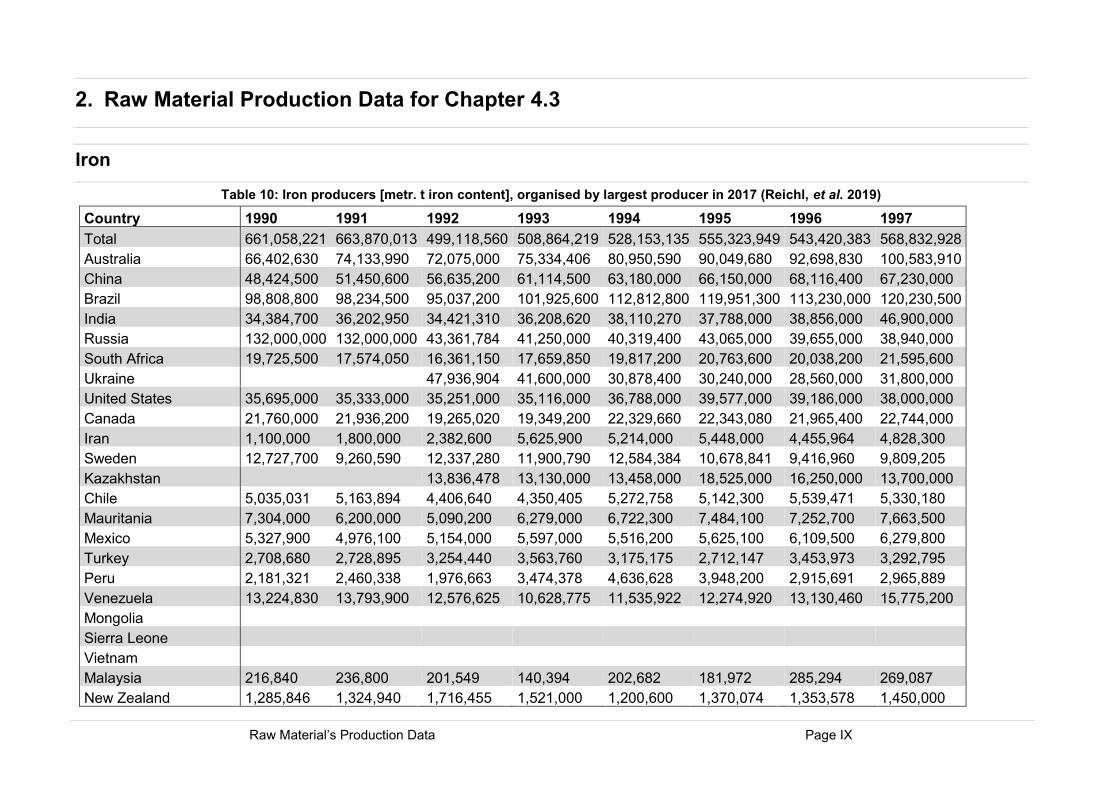
Raw Material’s Production Data Page IX
2. Raw Material Production Data for Chapter 4.3
Iron
Table 10: Iron producers [metr. t iron content], organised by largest producer in 2017 (Reichl, et al. 2019)
Country 1990 1991 1992 1993 1994 1995 1996 1997
Total 661,058,221 663,870,013 499,118,560 508,864,219 528,153,135 555,323,949 543,420,383 568,832,928
Australia 66,402,630 74,133,990 72,075,000 75,334,406 80,950,590 90,049,680 92,698,830 100,583,910
China 48,424,500 51,450,600 56,635,200 61,114,500 63,180,000 66,150,000 68,116,400 67,230,000
Brazil 98,808,800 98,234,500 95,037,200 101,925,600 112,812,800 119,951,300 113,230,000 120,230,500
India 34,384,700 36,202,950 34,421,310 36,208,620 38,110,270 37,788,000 38,856,000 46,900,000
Russia 132,000,000 132,000,000 43,361,784 41,250,000 40,319,400 43,065,000 39,655,000 38,940,000
South Africa 19,725,500 17,574,050 16,361,150 17,659,850 19,817,200 20,763,600 20,038,200 21,595,600
Ukraine 47,936,904 41,600,000 30,878,400 30,240,000 28,560,000 31,800,000
United States 35,695,000 35,333,000 35,251,000 35,116,000 36,788,000 39,577,000 39,186,000 38,000,000
Canada 21,760,000 21,936,200 19,265,020 19,349,200 22,329,660 22,343,080 21,965,400 22,744,000
Iran 1,100,000 1,800,000 2,382,600 5,625,900 5,214,000 5,448,000 4,455,964 4,828,300
Sweden 12,727,700 9,260,590 12,337,280 11,900,790 12,584,384 10,678,841 9,416,960 9,809,205
Kazakhstan 13,836,478 13,130,000 13,458,000 18,525,000 16,250,000 13,700,000
Chile 5,035,031 5,163,894 4,406,640 4,350,405 5,272,758 5,142,300 5,539,471 5,330,180
Mauritania 7,304,000 6,200,000 5,090,200 6,279,000 6,722,300 7,484,100 7,252,700 7,663,500
Mexico 5,327,900 4,976,100 5,154,000 5,597,000 5,516,200 5,625,100 6,109,500 6,279,800
Turkey 2,708,680 2,728,895 3,254,440 3,563,760 3,175,175 2,712,147 3,453,973 3,292,795
Peru 2,181,321 2,460,338 1,976,663 3,474,378 4,636,628 3,948,200 2,915,691 2,965,889
Venezuela 13,224,830 13,793,900 12,576,625 10,628,775 11,535,922 12,274,920 13,130,460 15,775,200
Mongolia Sierra Leone Vietnam Malaysia 216,840 236,800 201,549 140,394 202,682 181,972 285,294 269,087
New Zealand 1,285,846 1,324,940 1,716,455 1,521,000 1,200,600 1,370,074 1,353,578 1,450,000
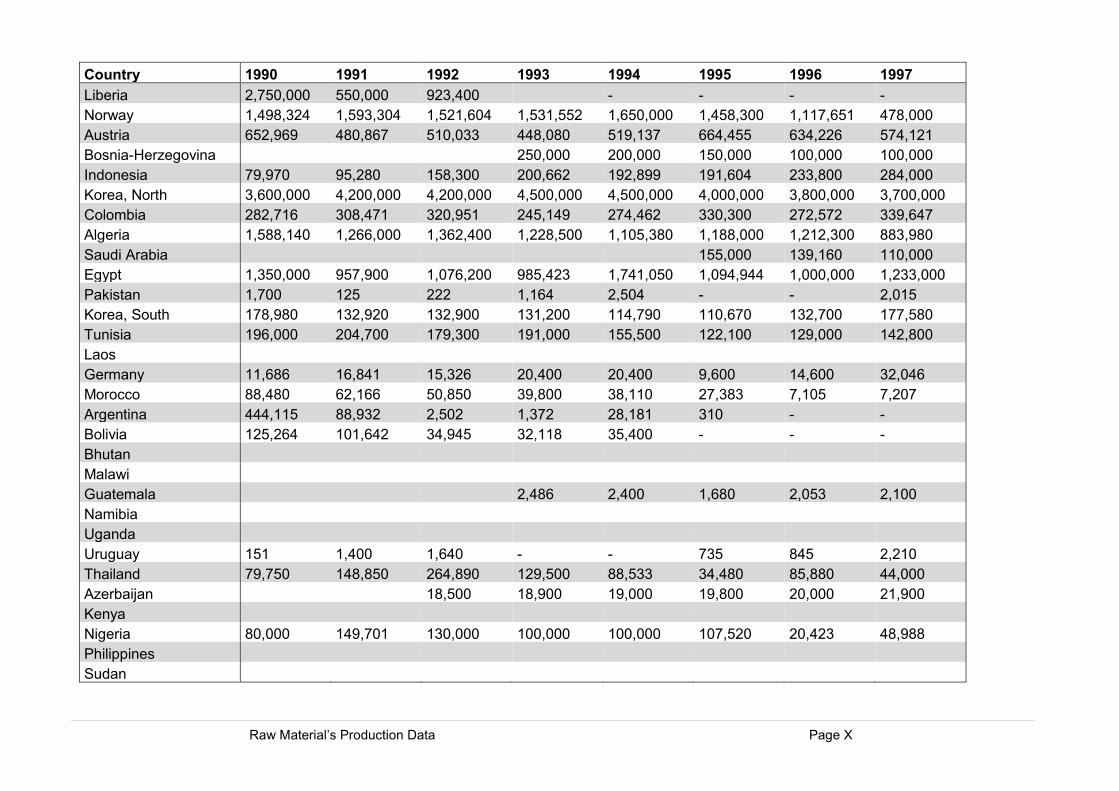
Raw Material’s Production Data Page X
Country 1990 1991 1992 1993 1994 1995 1996 1997
Liberia 2,750,000 550,000 923,400 - - - -
Norway 1,498,324 1,593,304 1,521,604 1,531,552 1,650,000 1,458,300 1,117,651 478,000
Austria 652,969 480,867 510,033 448,080 519,137 664,455 634,226 574,121
Bosnia-Herzegovina 250,000 200,000 150,000 100,000 100,000
Indonesia 79,970 95,280 158,300 200,662 192,899 191,604 233,800 284,000
Korea, North 3,600,000 4,200,000 4,200,000 4,500,000 4,500,000 4,000,000 3,800,000 3,700,000
Colombia 282,716 308,471 320,951 245,149 274,462 330,300 272,572 339,647
Algeria 1,588,140 1,266,000 1,362,400 1,228,500 1,105,380 1,188,000 1,212,300 883,980
Saudi Arabia 155,000 139,160 110,000
Egypt 1,350,000 957,900 1,076,200 985,423 1,741,050 1,094,944 1,000,000 1,233,000
Pakistan 1,700 125 222 1,164 2,504 - - 2,015
Korea, South 178,980 132,920 132,900 131,200 114,790 110,670 132,700 177,580
Tunisia 196,000 204,700 179,300 191,000 155,500 122,100 129,000 142,800
Laos Germany 11,686 16,841 15,326 20,400 20,400 9,600 14,600 32,046
Morocco 88,480 62,166 50,850 39,800 38,110 27,383 7,105 7,207
Argentina 444,115 88,932 2,502 1,372 28,181 310 - -
Bolivia 125,264 101,642 34,945 32,118 35,400 - - -
Bhutan Malawi Guatemala 2,486 2,400 1,680 2,053 2,100
Namibia Uganda Uruguay 151 1,400 1,640 - - 735 845 2,210
Thailand 79,750 148,850 264,890 129,500 88,533 34,480 85,880 44,000
Azerbaijan 18,500 18,900 19,000 19,800 20,000 21,900
Kenya Nigeria 80,000 149,701 130,000 100,000 100,000 107,520 20,423 48,988
Philippines Sudan
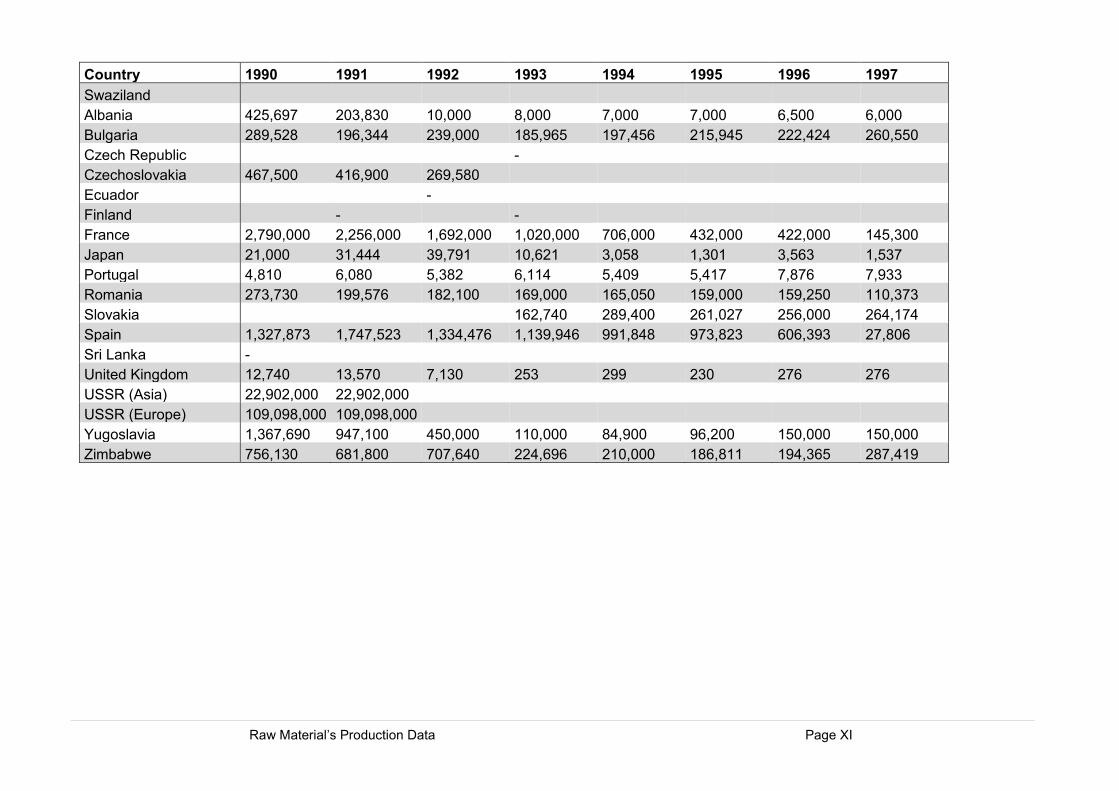
Raw Material’s Production Data Page XI
Country 1990 1991 1992 1993 1994 1995 1996 1997
Swaziland Albania 425,697 203,830 10,000 8,000 7,000 7,000 6,500 6,000
Bulgaria 289,528 196,344 239,000 185,965 197,456 215,945 222,424 260,550
Czech Republic - Czechoslovakia 467,500 416,900 269,580 Ecuador - Finland - - France 2,790,000 2,256,000 1,692,000 1,020,000 706,000 432,000 422,000 145,300
Japan 21,000 31,444 39,791 10,621 3,058 1,301 3,563 1,537
Portugal 4,810 6,080 5,382 6,114 5,409 5,417 7,876 7,933
Romania 273,730 199,576 182,100 169,000 165,050 159,000 159,250 110,373
Slovakia 162,740 289,400 261,027 256,000 264,174
Spain 1,327,873 1,747,523 1,334,476 1,139,946 991,848 973,823 606,393 27,806
Sri Lanka - United Kingdom 12,740 13,570 7,130 253 299 230 276 276
USSR (Asia) 22,902,000 22,902,000 USSR (Europe) 109,098,000 109,098,000 Yugoslavia 1,367,690 947,100 450,000 110,000 84,900 96,200 150,000 150,000
Zimbabwe 756,130 681,800 707,640 224,696 210,000 186,811 194,365 287,419
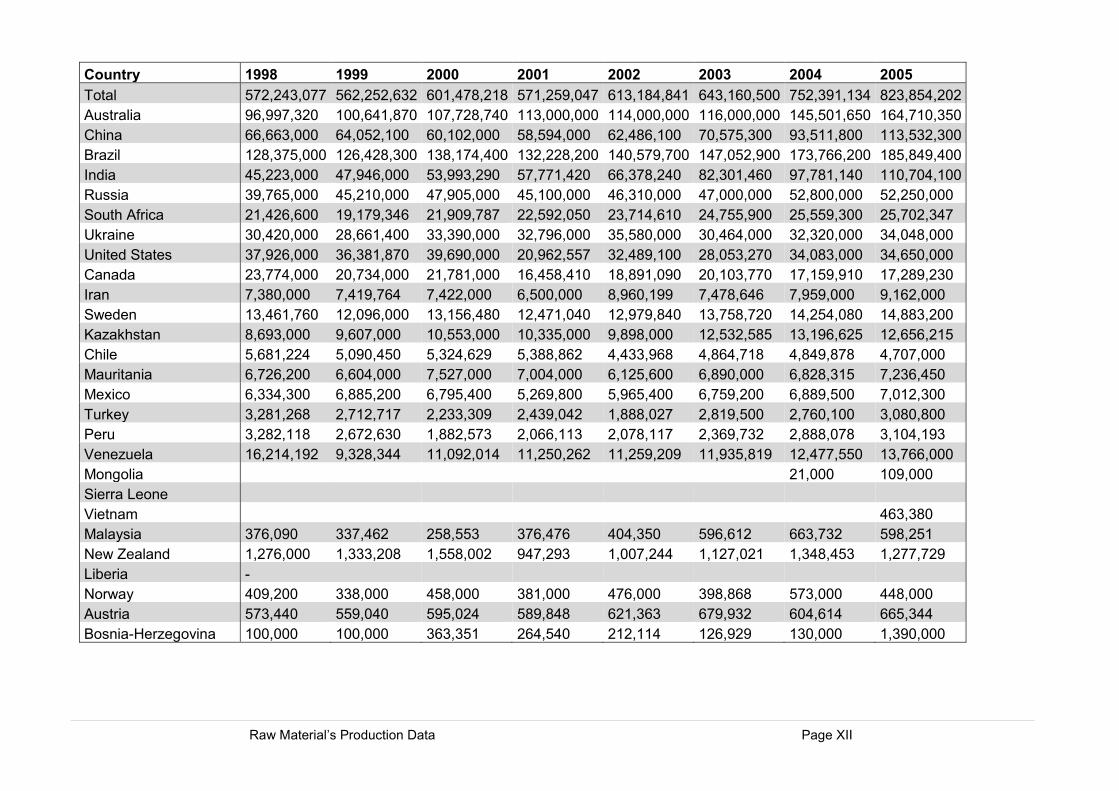
Raw Material’s Production Data Page XII
Country 1998 1999 2000 2001 2002 2003 2004 2005
Total 572,243,077 562,252,632 601,478,218 571,259,047 613,184,841 643,160,500 752,391,134 823,854,202
Australia 96,997,320 100,641,870 107,728,740 113,000,000 114,000,000 116,000,000 145,501,650 164,710,350
China 66,663,000 64,052,100 60,102,000 58,594,000 62,486,100 70,575,300 93,511,800 113,532,300
Brazil 128,375,000 126,428,300 138,174,400 132,228,200 140,579,700 147,052,900 173,766,200 185,849,400
India 45,223,000 47,946,000 53,993,290 57,771,420 66,378,240 82,301,460 97,781,140 110,704,100
Russia 39,765,000 45,210,000 47,905,000 45,100,000 46,310,000 47,000,000 52,800,000 52,250,000
South Africa 21,426,600 19,179,346 21,909,787 22,592,050 23,714,610 24,755,900 25,559,300 25,702,347
Ukraine 30,420,000 28,661,400 33,390,000 32,796,000 35,580,000 30,464,000 32,320,000 34,048,000
United States 37,926,000 36,381,870 39,690,000 20,962,557 32,489,100 28,053,270 34,083,000 34,650,000
Canada 23,774,000 20,734,000 21,781,000 16,458,410 18,891,090 20,103,770 17,159,910 17,289,230
Iran 7,380,000 7,419,764 7,422,000 6,500,000 8,960,199 7,478,646 7,959,000 9,162,000
Sweden 13,461,760 12,096,000 13,156,480 12,471,040 12,979,840 13,758,720 14,254,080 14,883,200
Kazakhstan 8,693,000 9,607,000 10,553,000 10,335,000 9,898,000 12,532,585 13,196,625 12,656,215
Chile 5,681,224 5,090,450 5,324,629 5,388,862 4,433,968 4,864,718 4,849,878 4,707,000
Mauritania 6,726,200 6,604,000 7,527,000 7,004,000 6,125,600 6,890,000 6,828,315 7,236,450
Mexico 6,334,300 6,885,200 6,795,400 5,269,800 5,965,400 6,759,200 6,889,500 7,012,300
Turkey 3,281,268 2,712,717 2,233,309 2,439,042 1,888,027 2,819,500 2,760,100 3,080,800
Peru 3,282,118 2,672,630 1,882,573 2,066,113 2,078,117 2,369,732 2,888,078 3,104,193
Venezuela 16,214,192 9,328,344 11,092,014 11,250,262 11,259,209 11,935,819 12,477,550 13,766,000
Mongolia 21,000 109,000
Sierra Leone Vietnam 463,380
Malaysia 376,090 337,462 258,553 376,476 404,350 596,612 663,732 598,251
New Zealand 1,276,000 1,333,208 1,558,002 947,293 1,007,244 1,127,021 1,348,453 1,277,729
Liberia - Norway 409,200 338,000 458,000 381,000 476,000 398,868 573,000 448,000
Austria 573,440 559,040 595,024 589,848 621,363 679,932 604,614 665,344
Bosnia-Herzegovina 100,000 100,000 363,351 264,540 212,114 126,929 130,000 1,390,000
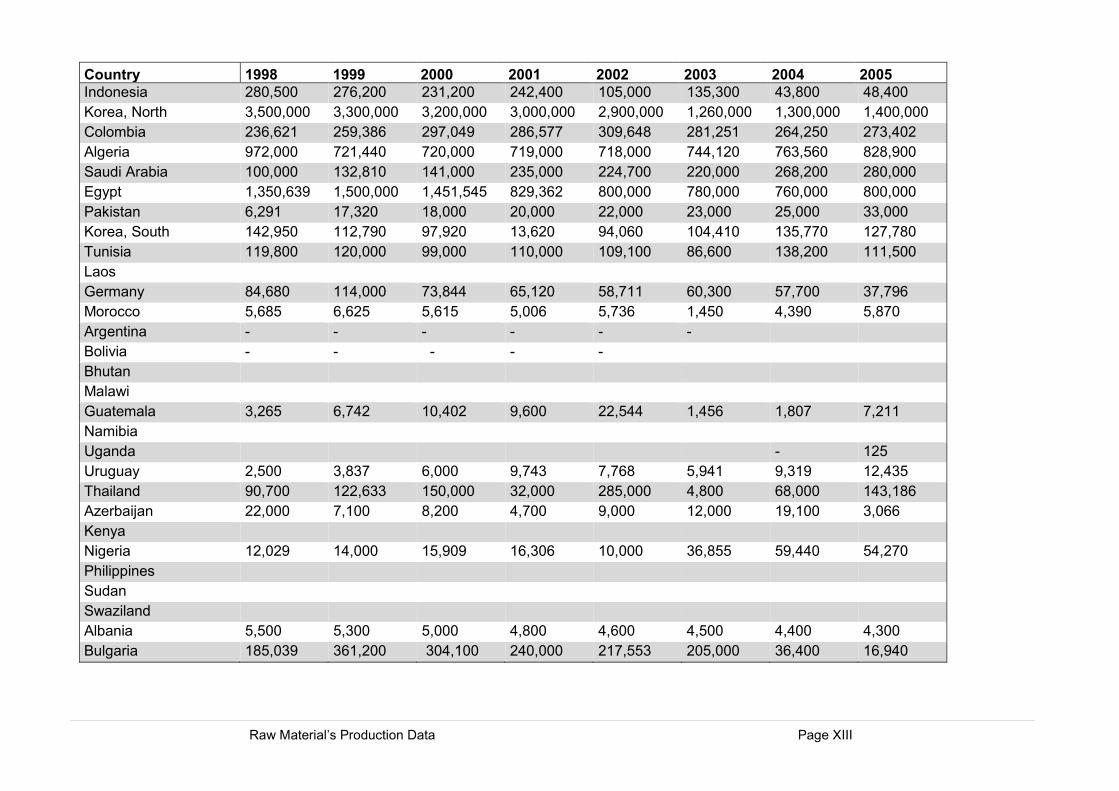
Raw Material’s Production Data Page XIII
Country 1998 1999 2000 2001 2002 2003 2004 2005
Indonesia 280,500 276,200 231,200 242,400 105,000 135,300 43,800 48,400
Korea, North 3,500,000 3,300,000 3,200,000 3,000,000 2,900,000 1,260,000 1,300,000 1,400,000
Colombia 236,621 259,386 297,049 286,577 309,648 281,251 264,250 273,402
Algeria 972,000 721,440 720,000 719,000 718,000 744,120 763,560 828,900
Saudi Arabia 100,000 132,810 141,000 235,000 224,700 220,000 268,200 280,000
Egypt 1,350,639 1,500,000 1,451,545 829,362 800,000 780,000 760,000 800,000
Pakistan 6,291 17,320 18,000 20,000 22,000 23,000 25,000 33,000
Korea, South 142,950 112,790 97,920 13,620 94,060 104,410 135,770 127,780
Tunisia 119,800 120,000 99,000 110,000 109,100 86,600 138,200 111,500
Laos
Germany 84,680 114,000 73,844 65,120 58,711 60,300 57,700 37,796
Morocco 5,685 6,625 5,615 5,006 5,736 1,450 4,390 5,870
Argentina - - - - - -
Bolivia - - - - -
Bhutan
Malawi
Guatemala 3,265 6,742 10,402 9,600 22,544 1,456 1,807 7,211
Namibia
Uganda
- 125
Uruguay 2,500 3,837 6,000 9,743 7,768 5,941 9,319 12,435
Thailand 90,700 122,633 150,000 32,000 285,000 4,800 68,000 143,186
Azerbaijan 22,000 7,100 8,200 4,700 9,000 12,000 19,100 3,066
Kenya
Nigeria 12,029 14,000 15,909 16,306 10,000 36,855 59,440 54,270
Philippines
Sudan
Swaziland
Albania 5,500 5,300 5,000 4,800 4,600 4,500 4,400 4,300
Bulgaria 185,039 361,200 304,100 240,000 217,553 205,000 36,400 16,940
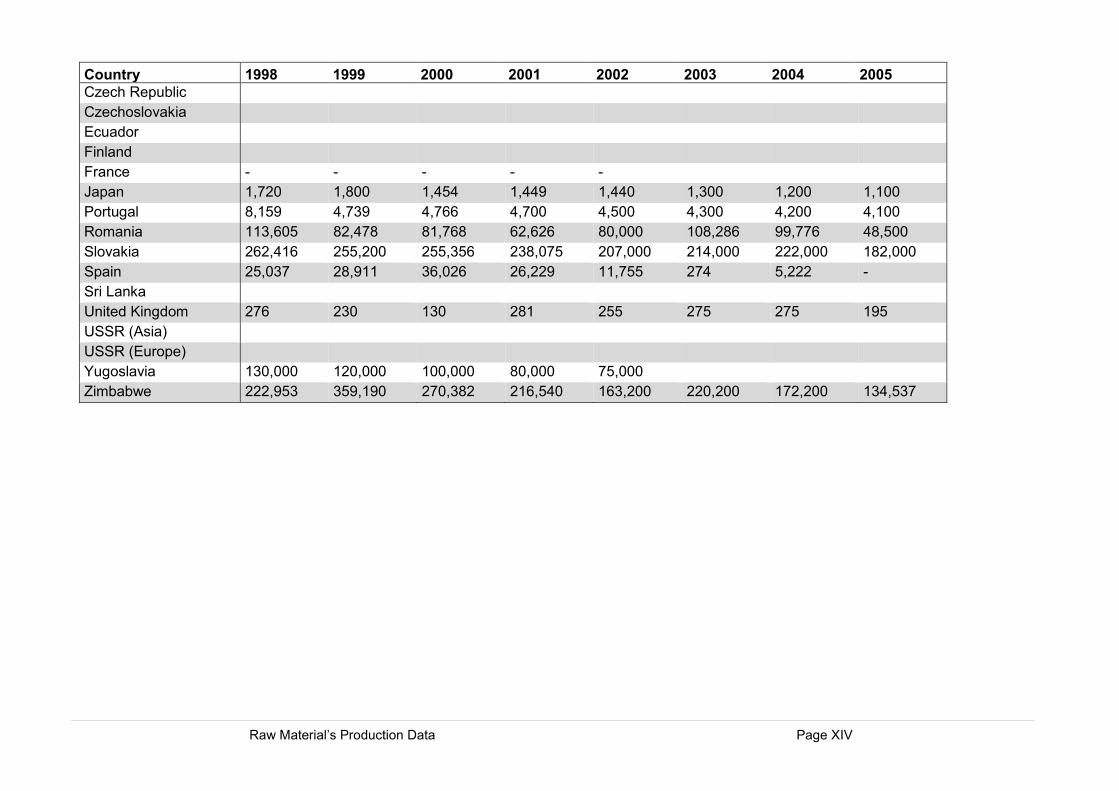
Raw Material’s Production Data Page XIV
Country 1998 1999 2000 2001 2002 2003 2004 2005
Czech Republic
Czechoslovakia
Ecuador
Finland
France - - - - -
Japan 1,720 1,800 1,454 1,449 1,440 1,300 1,200 1,100
Portugal 8,159 4,739 4,766 4,700 4,500 4,300 4,200 4,100
Romania 113,605 82,478 81,768 62,626 80,000 108,286 99,776 48,500
Slovakia 262,416 255,200 255,356 238,075 207,000 214,000 222,000 182,000
Spain 25,037 28,911 36,026 26,229 11,755 274 5,222 -
Sri Lanka
United Kingdom 276 230 130 281 255 275 275 195
USSR (Asia)
USSR (Europe)
Yugoslavia 130,000 120,000 100,000 80,000 75,000
Zimbabwe 222,953 359,190 270,382 216,540 163,200 220,200 172,200 134,537
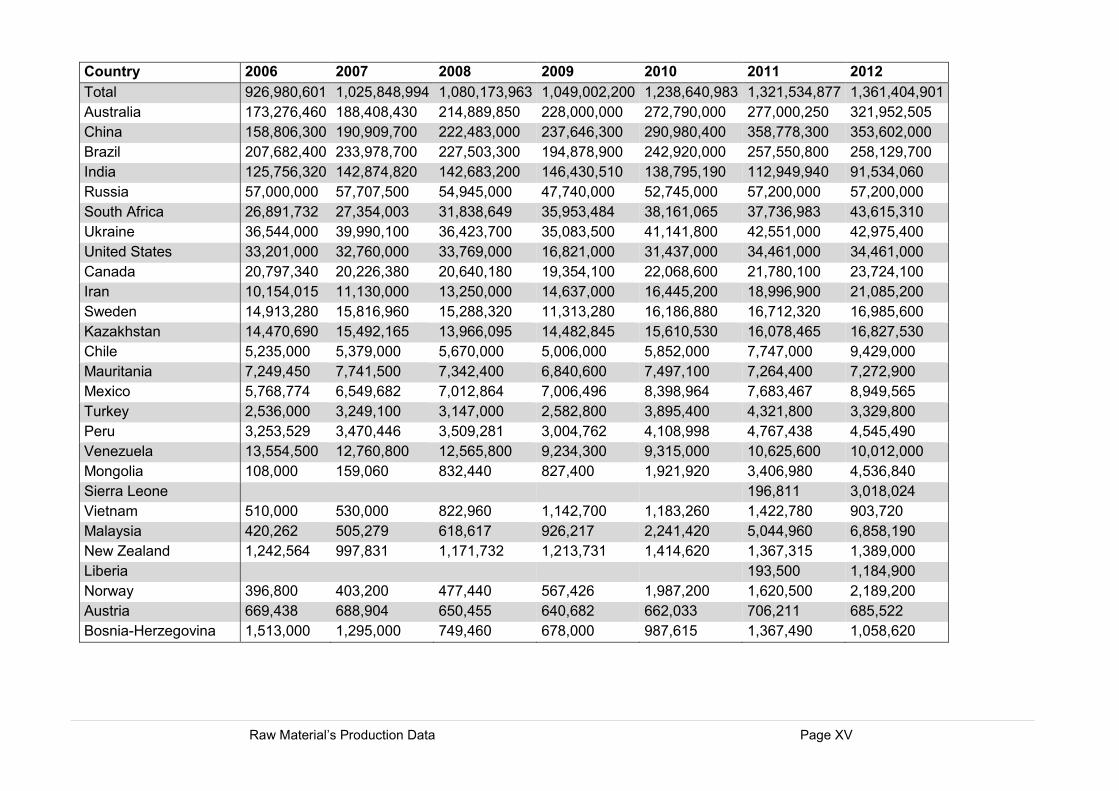
Raw Material’s Production Data Page XV
Country 2006 2007 2008 2009 2010 2011 2012
Total 926,980,601 1,025,848,994 1,080,173,963 1,049,002,200 1,238,640,983 1,321,534,877 1,361,404,901
Australia 173,276,460 188,408,430 214,889,850 228,000,000 272,790,000 277,000,250 321,952,505
China 158,806,300 190,909,700 222,483,000 237,646,300 290,980,400 358,778,300 353,602,000
Brazil 207,682,400 233,978,700 227,503,300 194,878,900 242,920,000 257,550,800 258,129,700
India 125,756,320 142,874,820 142,683,200 146,430,510 138,795,190 112,949,940 91,534,060
Russia 57,000,000 57,707,500 54,945,000 47,740,000 52,745,000 57,200,000 57,200,000
South Africa 26,891,732 27,354,003 31,838,649 35,953,484 38,161,065 37,736,983 43,615,310
Ukraine 36,544,000 39,990,100 36,423,700 35,083,500 41,141,800 42,551,000 42,975,400
United States 33,201,000 32,760,000 33,769,000 16,821,000 31,437,000 34,461,000 34,461,000
Canada 20,797,340 20,226,380 20,640,180 19,354,100 22,068,600 21,780,100 23,724,100
Iran 10,154,015 11,130,000 13,250,000 14,637,000 16,445,200 18,996,900 21,085,200
Sweden 14,913,280 15,816,960 15,288,320 11,313,280 16,186,880 16,712,320 16,985,600
Kazakhstan 14,470,690 15,492,165 13,966,095 14,482,845 15,610,530 16,078,465 16,827,530
Chile 5,235,000 5,379,000 5,670,000 5,006,000 5,852,000 7,747,000 9,429,000
Mauritania 7,249,450 7,741,500 7,342,400 6,840,600 7,497,100 7,264,400 7,272,900
Mexico 5,768,774 6,549,682 7,012,864 7,006,496 8,398,964 7,683,467 8,949,565
Turkey 2,536,000 3,249,100 3,147,000 2,582,800 3,895,400 4,321,800 3,329,800
Peru 3,253,529 3,470,446 3,509,281 3,004,762 4,108,998 4,767,438 4,545,490
Venezuela 13,554,500 12,760,800 12,565,800 9,234,300 9,315,000 10,625,600 10,012,000
Mongolia 108,000 159,060 832,440 827,400 1,921,920 3,406,980 4,536,840
Sierra Leone
196,811 3,018,024
Vietnam 510,000 530,000 822,960 1,142,700 1,183,260 1,422,780 903,720
Malaysia 420,262 505,279 618,617 926,217 2,241,420 5,044,960 6,858,190
New Zealand 1,242,564 997,831 1,171,732 1,213,731 1,414,620 1,367,315 1,389,000
Liberia
193,500 1,184,900
Norway 396,800 403,200 477,440 567,426 1,987,200 1,620,500 2,189,200
Austria 669,438 688,904 650,455 640,682 662,033 706,211 685,522
Bosnia-Herzegovina 1,513,000 1,295,000 749,460 678,000 987,615 1,367,490 1,058,620
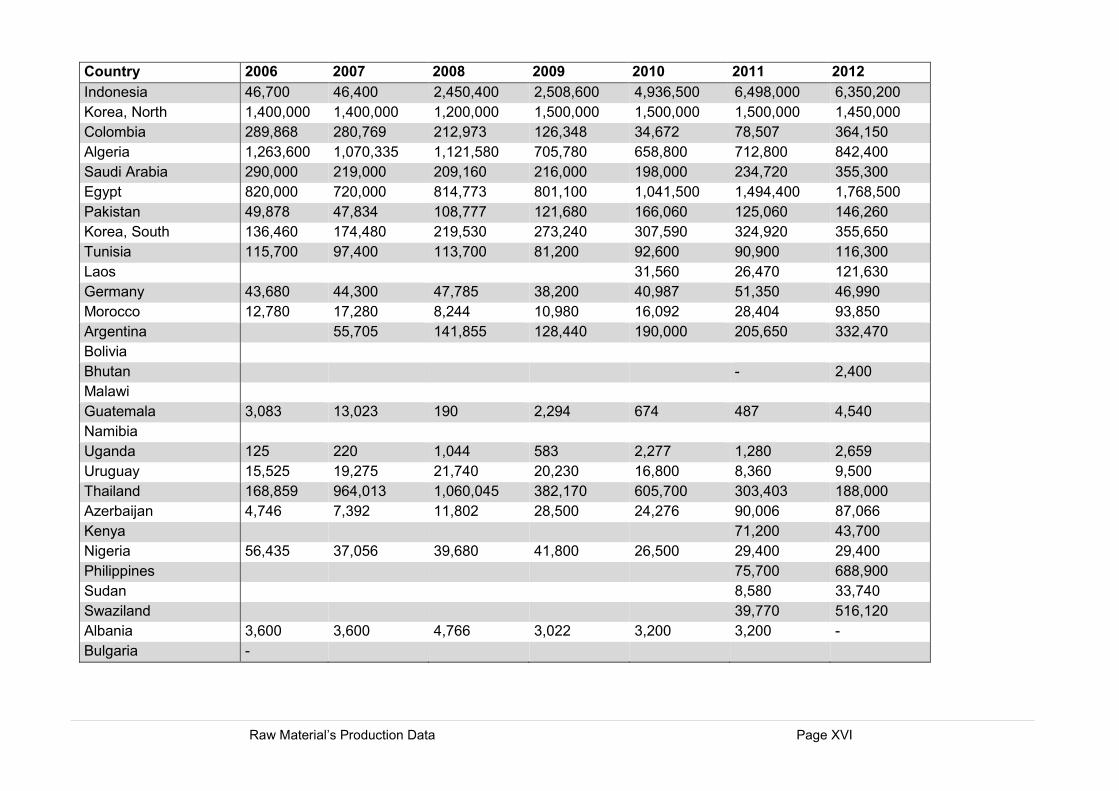
Raw Material’s Production Data Page XVI
Country 2006 2007 2008 2009 2010 2011 2012
Indonesia 46,700 46,400 2,450,400 2,508,600 4,936,500 6,498,000 6,350,200
Korea, North 1,400,000 1,400,000 1,200,000 1,500,000 1,500,000 1,500,000 1,450,000
Colombia 289,868 280,769 212,973 126,348 34,672 78,507 364,150
Algeria 1,263,600 1,070,335 1,121,580 705,780 658,800 712,800 842,400
Saudi Arabia 290,000 219,000 209,160 216,000 198,000 234,720 355,300
Egypt 820,000 720,000 814,773 801,100 1,041,500 1,494,400 1,768,500
Pakistan 49,878 47,834 108,777 121,680 166,060 125,060 146,260
Korea, South 136,460 174,480 219,530 273,240 307,590 324,920 355,650
Tunisia 115,700 97,400 113,700 81,200 92,600 90,900 116,300
Laos
31,560 26,470 121,630
Germany 43,680 44,300 47,785 38,200 40,987 51,350 46,990
Morocco 12,780 17,280 8,244 10,980 16,092 28,404 93,850
Argentina
55,705 141,855 128,440 190,000 205,650 332,470
Bolivia
Bhutan
- 2,400
Malawi
Guatemala 3,083 13,023 190 2,294 674 487 4,540
Namibia
Uganda 125 220 1,044 583 2,277 1,280 2,659
Uruguay 15,525 19,275 21,740 20,230 16,800 8,360 9,500
Thailand 168,859 964,013 1,060,045 382,170 605,700 303,403 188,000
Azerbaijan 4,746 7,392 11,802 28,500 24,276 90,006 87,066
Kenya
71,200 43,700
Nigeria 56,435 37,056 39,680 41,800 26,500 29,400 29,400
Philippines
75,700 688,900
Sudan
8,580 33,740
Swaziland
39,770 516,120
Albania 3,600 3,600 4,766 3,022 3,200 3,200 -
Bulgaria -
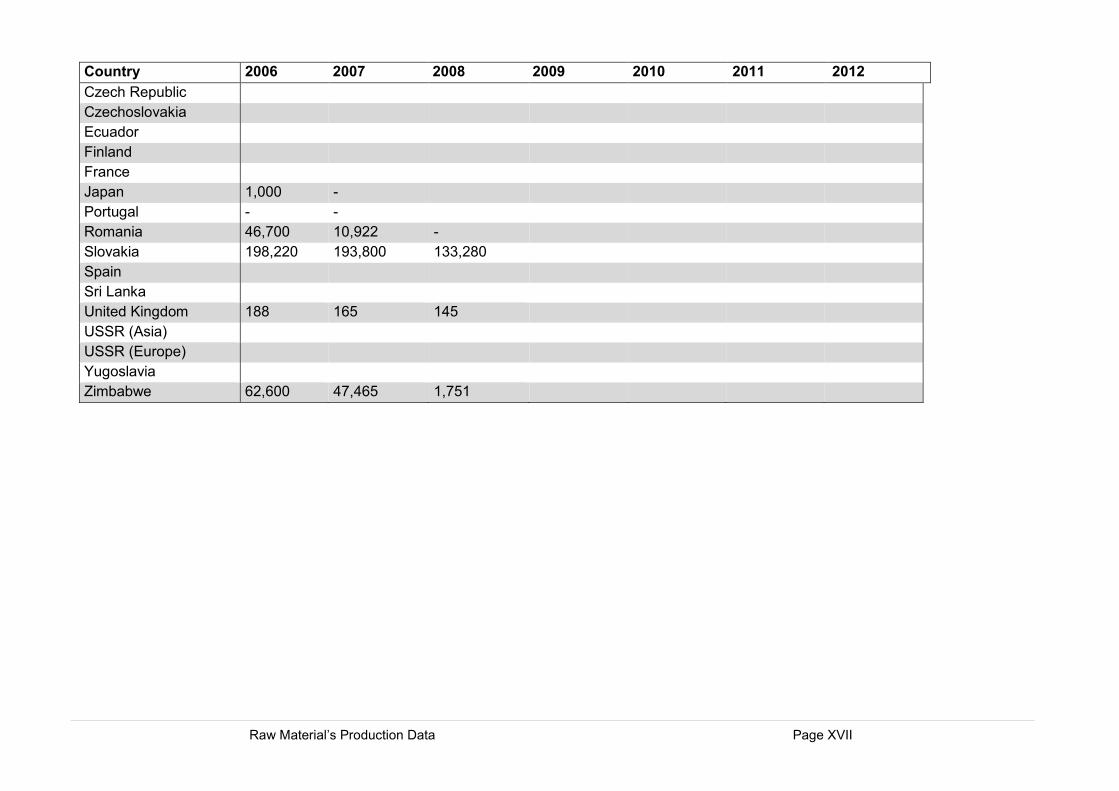
Raw Material’s Production Data Page XVII
Country 2006 2007 2008 2009 2010 2011 2012
Czech Republic
Czechoslovakia
Ecuador
Finland
France
Japan 1,000 -
Portugal - -
Romania 46,700 10,922 -
Slovakia 198,220 193,800 133,280
Spain
Sri Lanka
United Kingdom 188 165 145
USSR (Asia)
USSR (Europe)
Yugoslavia
Zimbabwe 62,600 47,465 1,751
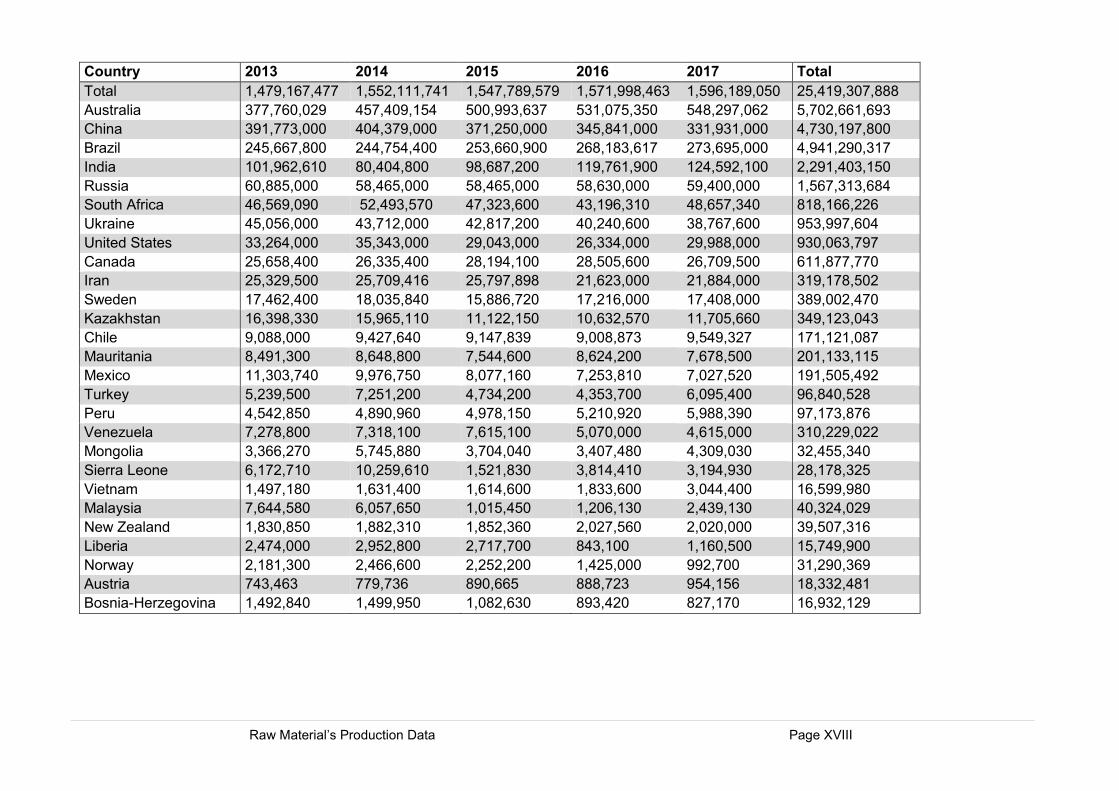
Raw Material’s Production Data Page XVIII
Country 2013 2014 2015 2016 2017 Total
Total 1,479,167,477 1,552,111,741 1,547,789,579 1,571,998,463 1,596,189,050 25,419,307,888
Australia 377,760,029 457,409,154 500,993,637 531,075,350 548,297,062 5,702,661,693
China 391,773,000 404,379,000 371,250,000 345,841,000 331,931,000 4,730,197,800
Brazil 245,667,800 244,754,400 253,660,900 268,183,617 273,695,000 4,941,290,317
India 101,962,610 80,404,800 98,687,200 119,761,900 124,592,100 2,291,403,150
Russia 60,885,000 58,465,000 58,465,000 58,630,000 59,400,000 1,567,313,684
South Africa 46,569,090 52,493,570 47,323,600 43,196,310 48,657,340 818,166,226
Ukraine 45,056,000 43,712,000 42,817,200 40,240,600 38,767,600 953,997,604
United States 33,264,000 35,343,000 29,043,000 26,334,000 29,988,000 930,063,797
Canada 25,658,400 26,335,400 28,194,100 28,505,600 26,709,500 611,877,770
Iran 25,329,500 25,709,416 25,797,898 21,623,000 21,884,000 319,178,502
Sweden 17,462,400 18,035,840 15,886,720 17,216,000 17,408,000 389,002,470
Kazakhstan 16,398,330 15,965,110 11,122,150 10,632,570 11,705,660 349,123,043
Chile 9,088,000 9,427,640 9,147,839 9,008,873 9,549,327 171,121,087
Mauritania 8,491,300 8,648,800 7,544,600 8,624,200 7,678,500 201,133,115
Mexico 11,303,740 9,976,750 8,077,160 7,253,810 7,027,520 191,505,492
Turkey 5,239,500 7,251,200 4,734,200 4,353,700 6,095,400 96,840,528
Peru 4,542,850 4,890,960 4,978,150 5,210,920 5,988,390 97,173,876
Venezuela 7,278,800 7,318,100 7,615,100 5,070,000 4,615,000 310,229,022
Mongolia 3,366,270 5,745,880 3,704,040 3,407,480 4,309,030 32,455,340
Sierra Leone 6,172,710 10,259,610 1,521,830 3,814,410 3,194,930 28,178,325
Vietnam 1,497,180 1,631,400 1,614,600 1,833,600 3,044,400 16,599,980
Malaysia 7,644,580 6,057,650 1,015,450 1,206,130 2,439,130 40,324,029
New Zealand 1,830,850 1,882,310 1,852,360 2,027,560 2,020,000 39,507,316
Liberia 2,474,000 2,952,800 2,717,700 843,100 1,160,500 15,749,900
Norway 2,181,300 2,466,600 2,252,200 1,425,000 992,700 31,290,369
Austria 743,463 779,736 890,665 888,723 954,156 18,332,481
Bosnia-Herzegovina 1,492,840 1,499,950 1,082,630 893,420 827,170 16,932,129
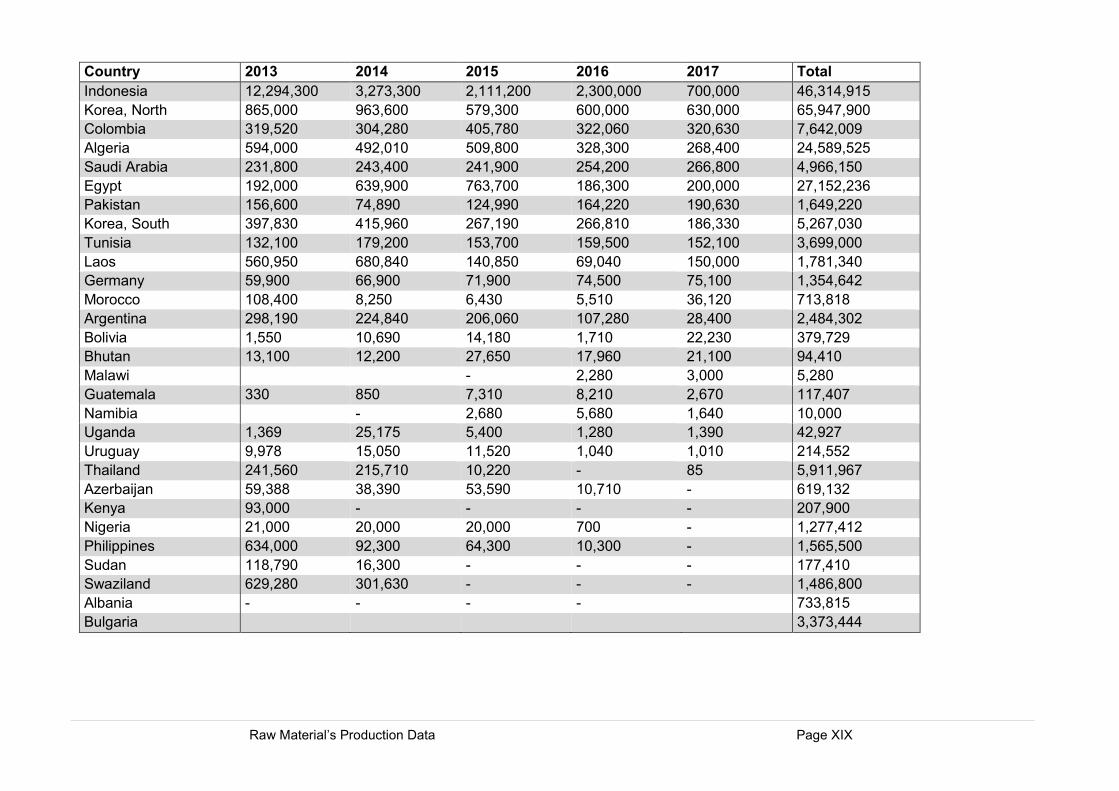
Raw Material’s Production Data Page XIX
Country 2013 2014 2015 2016 2017 Total
Indonesia 12,294,300 3,273,300 2,111,200 2,300,000 700,000 46,314,915
Korea, North 865,000 963,600 579,300 600,000 630,000 65,947,900
Colombia 319,520 304,280 405,780 322,060 320,630 7,642,009
Algeria 594,000 492,010 509,800 328,300 268,400 24,589,525
Saudi Arabia 231,800 243,400 241,900 254,200 266,800 4,966,150
Egypt 192,000 639,900 763,700 186,300 200,000 27,152,236
Pakistan 156,600 74,890 124,990 164,220 190,630 1,649,220
Korea, South 397,830 415,960 267,190 266,810 186,330 5,267,030
Tunisia 132,100 179,200 153,700 159,500 152,100 3,699,000
Laos 560,950 680,840 140,850 69,040 150,000 1,781,340
Germany 59,900 66,900 71,900 74,500 75,100 1,354,642
Morocco 108,400 8,250 6,430 5,510 36,120 713,818
Argentina 298,190 224,840 206,060 107,280 28,400 2,484,302
Bolivia 1,550 10,690 14,180 1,710 22,230 379,729
Bhutan 13,100 12,200 27,650 17,960 21,100 94,410
Malawi
- 2,280 3,000 5,280
Guatemala 330 850 7,310 8,210 2,670 117,407
Namibia
- 2,680 5,680 1,640 10,000
Uganda 1,369 25,175 5,400 1,280 1,390 42,927
Uruguay 9,978 15,050 11,520 1,040 1,010 214,552
Thailand 241,560 215,710 10,220 - 85 5,911,967
Azerbaijan 59,388 38,390 53,590 10,710 - 619,132
Kenya 93,000 - - - - 207,900
Nigeria 21,000 20,000 20,000 700 - 1,277,412
Philippines 634,000 92,300 64,300 10,300 - 1,565,500
Sudan 118,790 16,300 - - - 177,410
Swaziland 629,280 301,630 - - - 1,486,800
Albania - - - -
733,815
Bulgaria
3,373,444
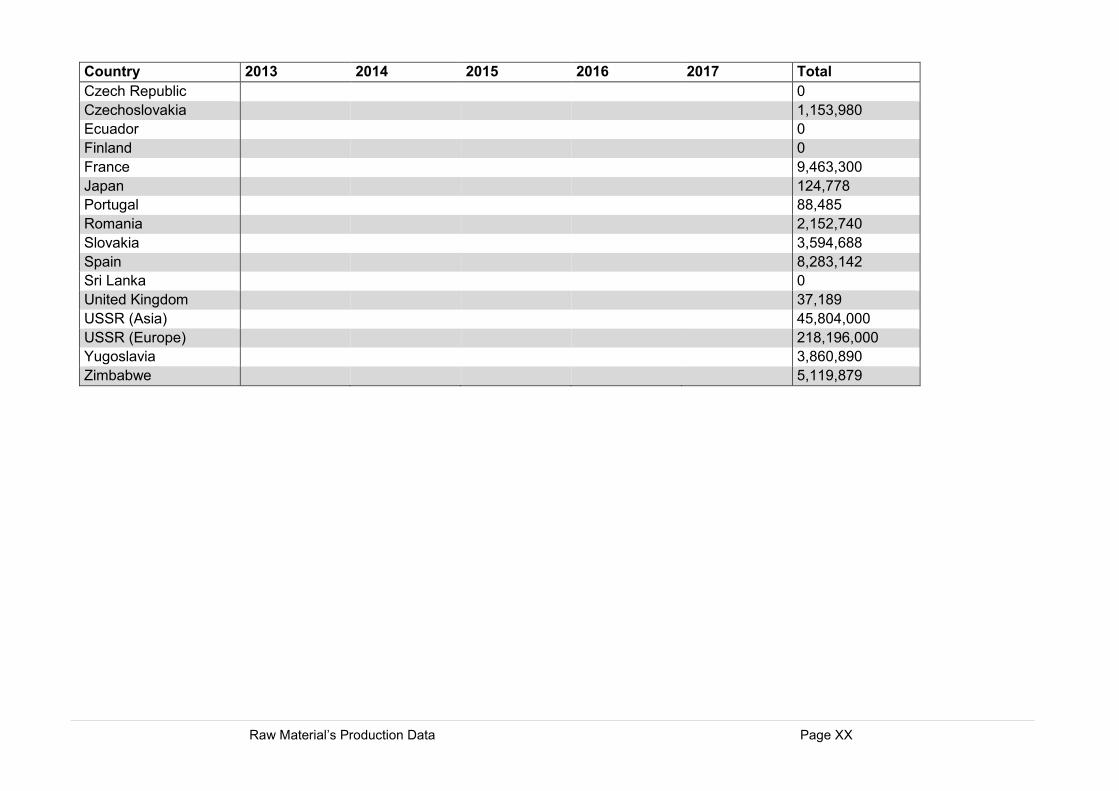
Raw Material’s Production Data Page XX
Country 2013 2014 2015 2016 2017 Total
Czech Republic
0
Czechoslovakia
1,153,980
Ecuador
0
Finland
0
France
9,463,300
Japan
124,778
Portugal
88,485
Romania
2,152,740
Slovakia
3,594,688
Spain
8,283,142
Sri Lanka
0
United Kingdom
37,189
USSR (Asia)
45,804,000
USSR (Europe)
218,196,000
Yugoslavia
3,860,890
Zimbabwe
5,119,879
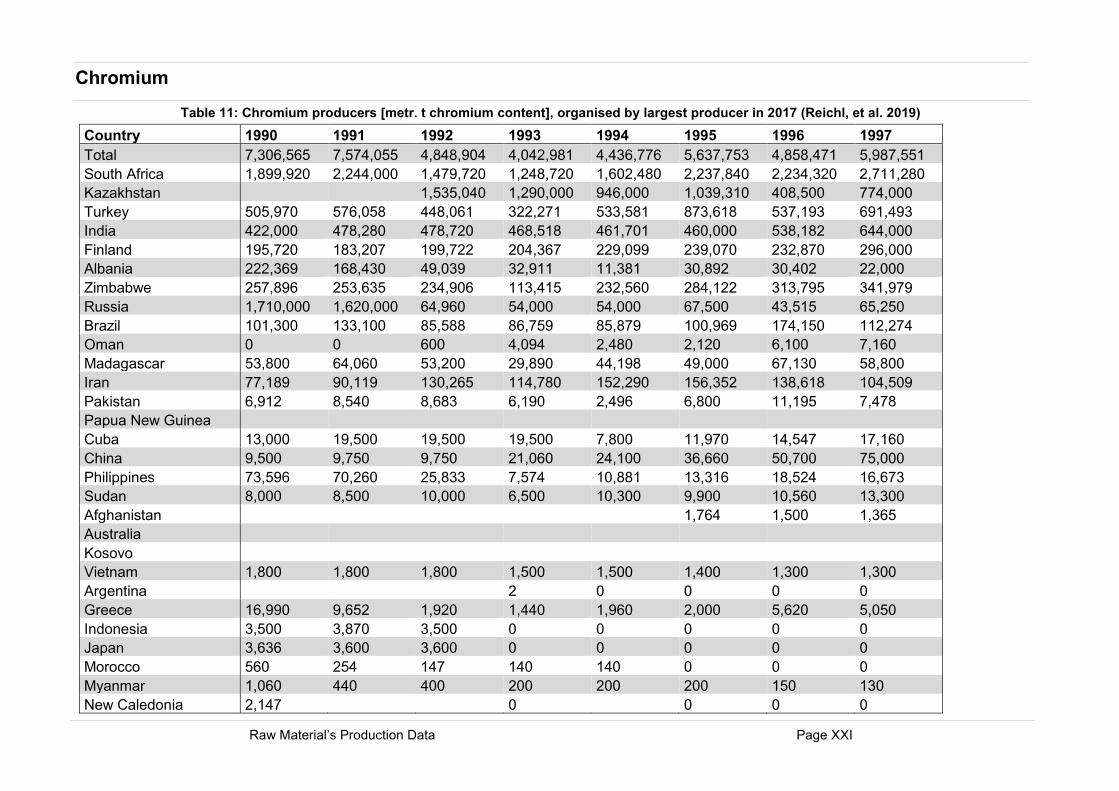
Raw Material’s Production Data Page XXI
Chromium
Table 11: Chromium producers [metr. t chromium content], organised by largest producer in 2017 (Reichl, et al. 2019)
Country 1990 1991 1992 1993 1994 1995 1996 1997
Total 7,306,565 7,574,055 4,848,904 4,042,981 4,436,776 5,637,753 4,858,471 5,987,551
South Africa 1,899,920 2,244,000 1,479,720 1,248,720 1,602,480 2,237,840 2,234,320 2,711,280
Kazakhstan 1,535,040 1,290,000 946,000 1,039,310 408,500 774,000
Turkey 505,970 576,058 448,061 322,271 533,581 873,618 537,193 691,493
India 422,000 478,280 478,720 468,518 461,701 460,000 538,182 644,000
Finland 195,720 183,207 199,722 204,367 229,099 239,070 232,870 296,000
Albania 222,369 168,430 49,039 32,911 11,381 30,892 30,402 22,000
Zimbabwe 257,896 253,635 234,906 113,415 232,560 284,122 313,795 341,979
Russia 1,710,000 1,620,000 64,960 54,000 54,000 67,500 43,515 65,250
Brazil 101,300 133,100 85,588 86,759 85,879 100,969 174,150 112,274
Oman 0 0 600 4,094 2,480 2,120 6,100 7,160
Madagascar 53,800 64,060 53,200 29,890 44,198 49,000 67,130 58,800
Iran 77,189 90,119 130,265 114,780 152,290 156,352 138,618 104,509
Pakistan 6,912 8,540 8,683 6,190 2,496 6,800 11,195 7,478
Papua New Guinea Cuba 13,000 19,500 19,500 19,500 7,800 11,970 14,547 17,160
China 9,500 9,750 9,750 21,060 24,100 36,660 50,700 75,000
Philippines 73,596 70,260 25,833 7,574 10,881 13,316 18,524 16,673
Sudan 8,000 8,500 10,000 6,500 10,300 9,900 10,560 13,300
Afghanistan 1,764 1,500 1,365
Australia Kosovo Vietnam 1,800 1,800 1,800 1,500 1,500 1,400 1,300 1,300
Argentina 2 0 0 0 0
Greece 16,990 9,652 1,920 1,440 1,960 2,000 5,620 5,050
Indonesia 3,500 3,870 3,500 0 0 0 0 0
Japan 3,636 3,600 3,600 0 0 0 0 0
Morocco 560 254 147 140 140 0 0 0
Myanmar 1,060 440 400 200 200 200 150 130
New Caledonia 2,147 0 0 0 0
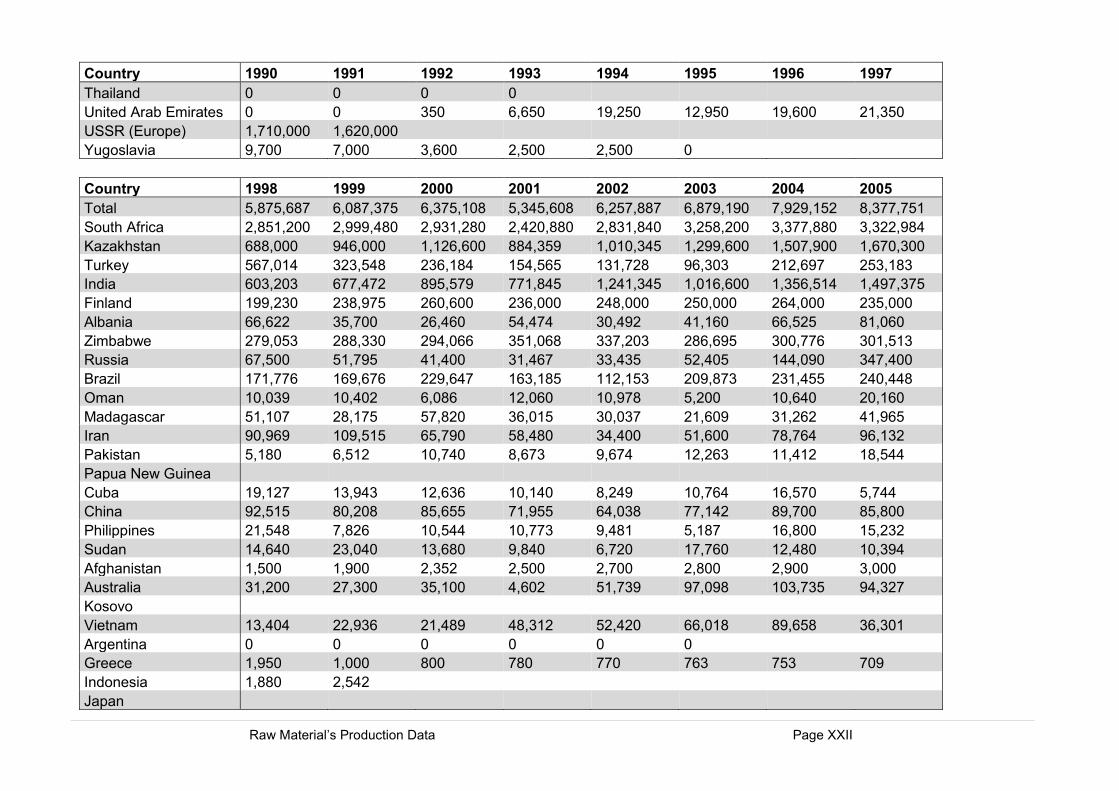
Raw Material’s Production Data Page XXII
Country 1990 1991 1992 1993 1994 1995 1996 1997
Thailand 0 0 0 0 United Arab Emirates 0 0 350 6,650 19,250 12,950 19,600 21,350
USSR (Europe) 1,710,000 1,620,000 Yugoslavia 9,700 7,000 3,600 2,500 2,500 0
Country 1998 1999 2000 2001 2002 2003 2004 2005
Total 5,875,687 6,087,375 6,375,108 5,345,608 6,257,887 6,879,190 7,929,152 8,377,751
South Africa 2,851,200 2,999,480 2,931,280 2,420,880 2,831,840 3,258,200 3,377,880 3,322,984
Kazakhstan 688,000 946,000 1,126,600 884,359 1,010,345 1,299,600 1,507,900 1,670,300
Turkey 567,014 323,548 236,184 154,565 131,728 96,303 212,697 253,183
India 603,203 677,472 895,579 771,845 1,241,345 1,016,600 1,356,514 1,497,375
Finland 199,230 238,975 260,600 236,000 248,000 250,000 264,000 235,000
Albania 66,622 35,700 26,460 54,474 30,492 41,160 66,525 81,060
Zimbabwe 279,053 288,330 294,066 351,068 337,203 286,695 300,776 301,513
Russia 67,500 51,795 41,400 31,467 33,435 52,405 144,090 347,400
Brazil 171,776 169,676 229,647 163,185 112,153 209,873 231,455 240,448
Oman 10,039 10,402 6,086 12,060 10,978 5,200 10,640 20,160
Madagascar 51,107 28,175 57,820 36,015 30,037 21,609 31,262 41,965
Iran 90,969 109,515 65,790 58,480 34,400 51,600 78,764 96,132
Pakistan 5,180 6,512 10,740 8,673 9,674 12,263 11,412 18,544
Papua New Guinea Cuba 19,127 13,943 12,636 10,140 8,249 10,764 16,570 5,744
China 92,515 80,208 85,655 71,955 64,038 77,142 89,700 85,800
Philippines 21,548 7,826 10,544 10,773 9,481 5,187 16,800 15,232
Sudan 14,640 23,040 13,680 9,840 6,720 17,760 12,480 10,394
Afghanistan 1,500 1,900 2,352 2,500 2,700 2,800 2,900 3,000
Australia 31,200 27,300 35,100 4,602 51,739 97,098 103,735 94,327
Kosovo Vietnam 13,404 22,936 21,489 48,312 52,420 66,018 89,658 36,301
Argentina 0 0 0 0 0 0 Greece 1,950 1,000 800 780 770 763 753 709
Indonesia 1,880 2,542 Japan
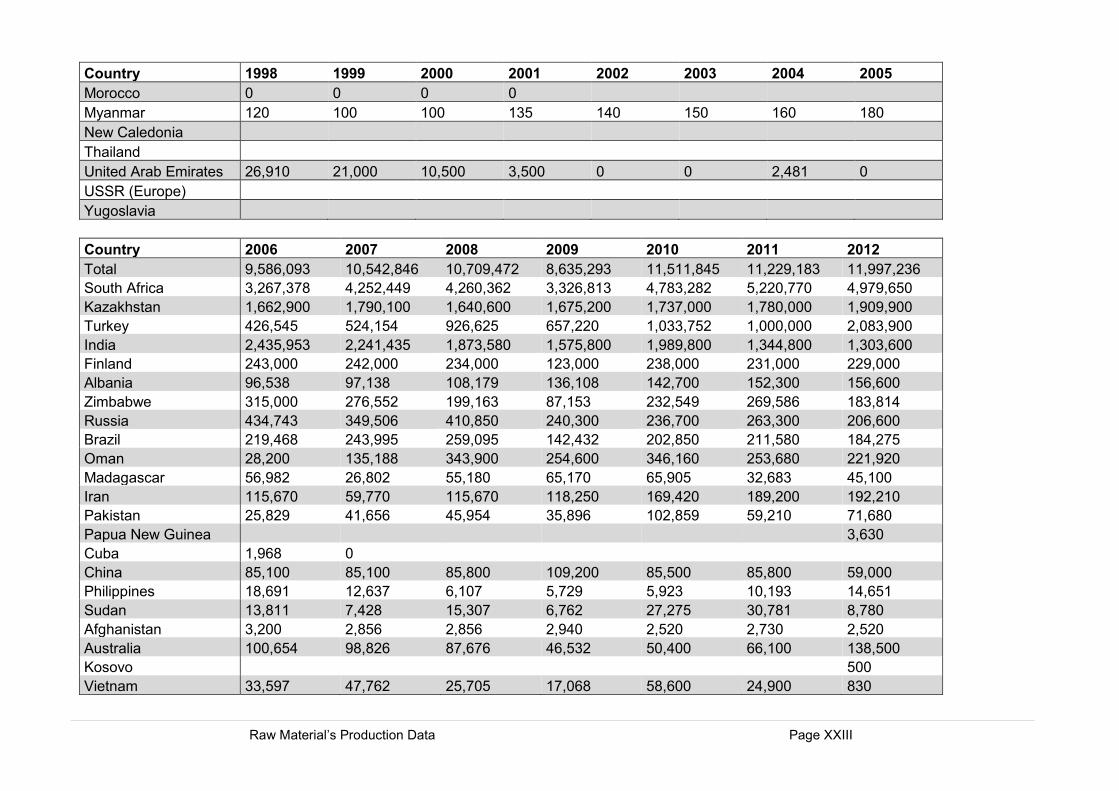
Raw Material’s Production Data Page XXIII
Country 1998 1999 2000 2001 2002 2003 2004 2005
Morocco 0 0 0 0 Myanmar 120 100 100 135 140 150 160 180
New Caledonia Thailand United Arab Emirates 26,910 21,000 10,500 3,500 0 0 2,481 0
USSR (Europe) Yugoslavia
Country 2006 2007 2008 2009 2010 2011 2012
Total 9,586,093 10,542,846 10,709,472 8,635,293 11,511,845 11,229,183 11,997,236
South Africa 3,267,378 4,252,449 4,260,362 3,326,813 4,783,282 5,220,770 4,979,650
Kazakhstan 1,662,900 1,790,100 1,640,600 1,675,200 1,737,000 1,780,000 1,909,900
Turkey 426,545 524,154 926,625 657,220 1,033,752 1,000,000 2,083,900
India 2,435,953 2,241,435 1,873,580 1,575,800 1,989,800 1,344,800 1,303,600
Finland 243,000 242,000 234,000 123,000 238,000 231,000 229,000
Albania 96,538 97,138 108,179 136,108 142,700 152,300 156,600
Zimbabwe 315,000 276,552 199,163 87,153 232,549 269,586 183,814
Russia 434,743 349,506 410,850 240,300 236,700 263,300 206,600
Brazil 219,468 243,995 259,095 142,432 202,850 211,580 184,275
Oman 28,200 135,188 343,900 254,600 346,160 253,680 221,920
Madagascar 56,982 26,802 55,180 65,170 65,905 32,683 45,100
Iran 115,670 59,770 115,670 118,250 169,420 189,200 192,210
Pakistan 25,829 41,656 45,954 35,896 102,859 59,210 71,680
Papua New Guinea 3,630
Cuba 1,968 0 China 85,100 85,100 85,800 109,200 85,500 85,800 59,000
Philippines 18,691 12,637 6,107 5,729 5,923 10,193 14,651
Sudan 13,811 7,428 15,307 6,762 27,275 30,781 8,780
Afghanistan 3,200 2,856 2,856 2,940 2,520 2,730 2,520
Australia 100,654 98,826 87,676 46,532 50,400 66,100 138,500
Kosovo 500
Vietnam 33,597 47,762 25,705 17,068 58,600 24,900 830
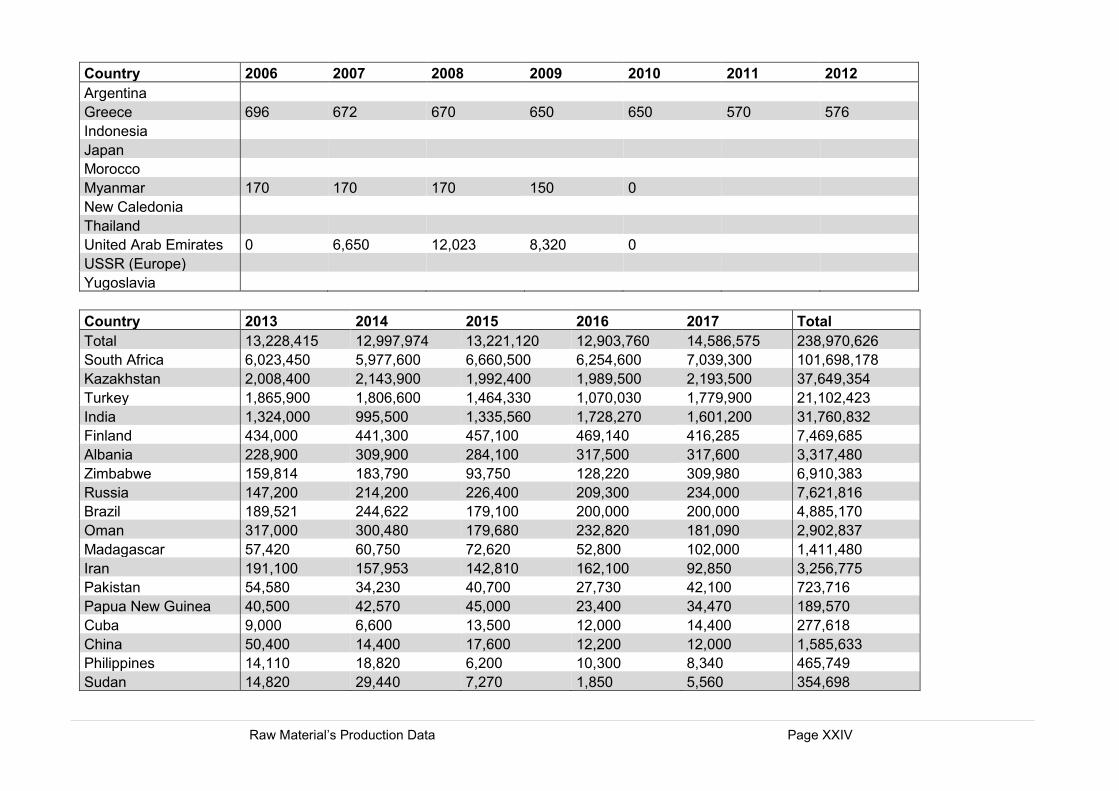
Raw Material’s Production Data Page XXIV
Country 2006 2007 2008 2009 2010 2011 2012
Argentina Greece 696 672 670 650 650 570 576
Indonesia Japan Morocco Myanmar 170 170 170 150 0 New Caledonia Thailand United Arab Emirates 0 6,650 12,023 8,320 0 USSR (Europe) Yugoslavia
Country 2013 2014 2015 2016 2017 Total
Total 13,228,415 12,997,974 13,221,120 12,903,760 14,586,575 238,970,626
South Africa 6,023,450 5,977,600 6,660,500 6,254,600 7,039,300 101,698,178
Kazakhstan 2,008,400 2,143,900 1,992,400 1,989,500 2,193,500 37,649,354
Turkey 1,865,900 1,806,600 1,464,330 1,070,030 1,779,900 21,102,423
India 1,324,000 995,500 1,335,560 1,728,270 1,601,200 31,760,832
Finland 434,000 441,300 457,100 469,140 416,285 7,469,685
Albania 228,900 309,900 284,100 317,500 317,600 3,317,480
Zimbabwe 159,814 183,790 93,750 128,220 309,980 6,910,383
Russia 147,200 214,200 226,400 209,300 234,000 7,621,816
Brazil 189,521 244,622 179,100 200,000 200,000 4,885,170
Oman 317,000 300,480 179,680 232,820 181,090 2,902,837
Madagascar 57,420 60,750 72,620 52,800 102,000 1,411,480
Iran 191,100 157,953 142,810 162,100 92,850 3,256,775
Pakistan 54,580 34,230 40,700 27,730 42,100 723,716
Papua New Guinea 40,500 42,570 45,000 23,400 34,470 189,570
Cuba 9,000 6,600 13,500 12,000 14,400 277,618
China 50,400 14,400 17,600 12,200 12,000 1,585,633
Philippines 14,110 18,820 6,200 10,300 8,340 465,749
Sudan 14,820 29,440 7,270 1,850 5,560 354,698
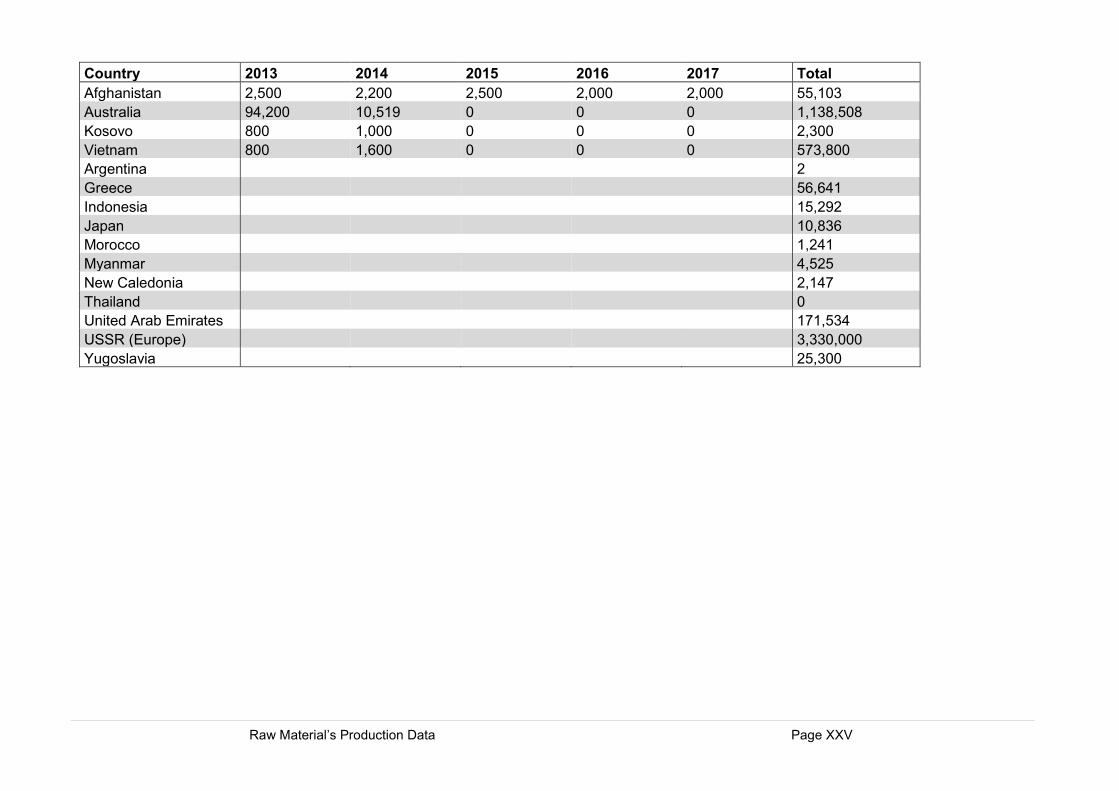
Raw Material’s Production Data Page XXV
Country 2013 2014 2015 2016 2017 Total
Afghanistan 2,500 2,200 2,500 2,000 2,000 55,103
Australia 94,200 10,519 0 0 0 1,138,508
Kosovo 800 1,000 0 0 0 2,300
Vietnam 800 1,600 0 0 0 573,800
Argentina 2
Greece 56,641
Indonesia 15,292
Japan 10,836
Morocco 1,241
Myanmar 4,525
New Caledonia 2,147
Thailand 0
United Arab Emirates 171,534
USSR (Europe) 3,330,000
Yugoslavia 25,300
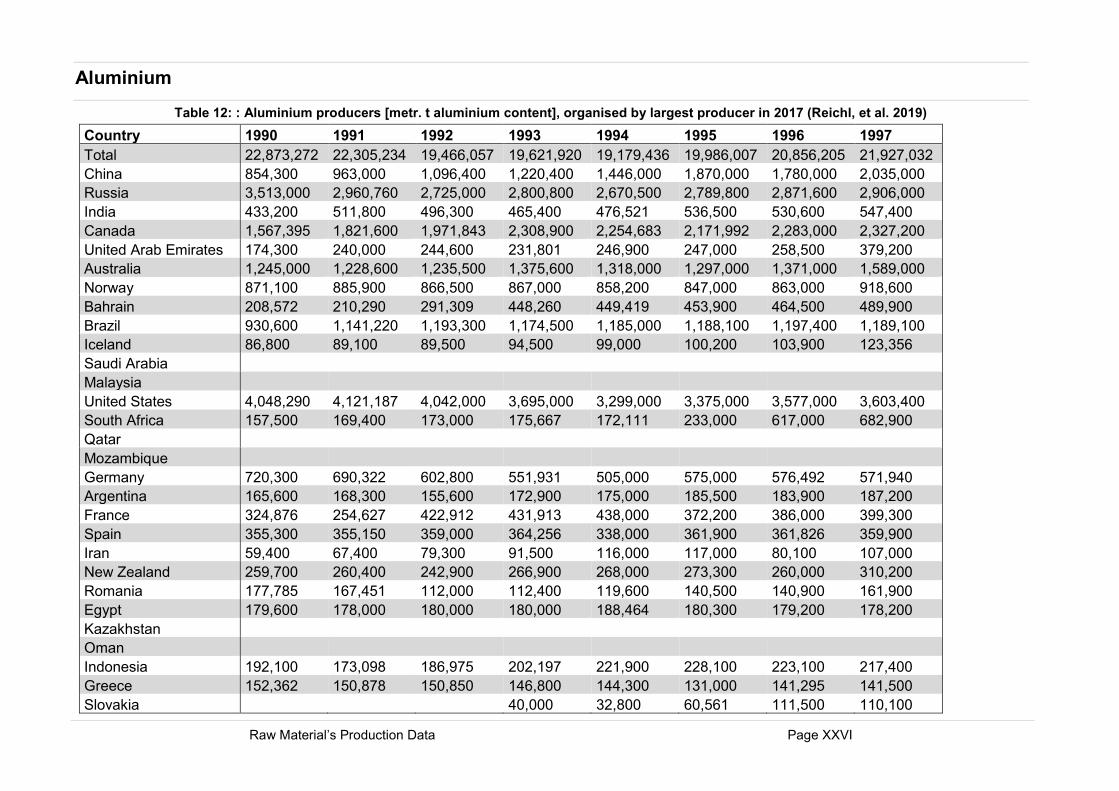
Raw Material’s Production Data Page XXVI
Aluminium
Table 12: : Aluminium producers [metr. t aluminium content], organised by largest producer in 2017 (Reichl, et al. 2019)
Country 1990 1991 1992 1993 1994 1995 1996 1997
Total 22,873,272 22,305,234 19,466,057 19,621,920 19,179,436 19,986,007 20,856,205 21,927,032
China 854,300 963,000 1,096,400 1,220,400 1,446,000 1,870,000 1,780,000 2,035,000
Russia 3,513,000 2,960,760 2,725,000 2,800,800 2,670,500 2,789,800 2,871,600 2,906,000
India 433,200 511,800 496,300 465,400 476,521 536,500 530,600 547,400
Canada 1,567,395 1,821,600 1,971,843 2,308,900 2,254,683 2,171,992 2,283,000 2,327,200
United Arab Emirates 174,300 240,000 244,600 231,801 246,900 247,000 258,500 379,200
Australia 1,245,000 1,228,600 1,235,500 1,375,600 1,318,000 1,297,000 1,371,000 1,589,000
Norway 871,100 885,900 866,500 867,000 858,200 847,000 863,000 918,600
Bahrain 208,572 210,290 291,309 448,260 449,419 453,900 464,500 489,900
Brazil 930,600 1,141,220 1,193,300 1,174,500 1,185,000 1,188,100 1,197,400 1,189,100
Iceland 86,800 89,100 89,500 94,500 99,000 100,200 103,900 123,356
Saudi Arabia Malaysia United States 4,048,290 4,121,187 4,042,000 3,695,000 3,299,000 3,375,000 3,577,000 3,603,400
South Africa 157,500 169,400 173,000 175,667 172,111 233,000 617,000 682,900
Qatar Mozambique Germany 720,300 690,322 602,800 551,931 505,000 575,000 576,492 571,940
Argentina 165,600 168,300 155,600 172,900 175,000 185,500 183,900 187,200
France 324,876 254,627 422,912 431,913 438,000 372,200 386,000 399,300
Spain 355,300 355,150 359,000 364,256 338,000 361,900 361,826 359,900
Iran 59,400 67,400 79,300 91,500 116,000 117,000 80,100 107,000
New Zealand 259,700 260,400 242,900 266,900 268,000 273,300 260,000 310,200
Romania 177,785 167,451 112,000 112,400 119,600 140,500 140,900 161,900
Egypt 179,600 178,000 180,000 180,000 188,464 180,300 179,200 178,200
Kazakhstan Oman Indonesia 192,100 173,098 186,975 202,197 221,900 228,100 223,100 217,400
Greece 152,362 150,878 150,850 146,800 144,300 131,000 141,295 141,500
Slovakia 40,000 32,800 60,561 111,500 110,100
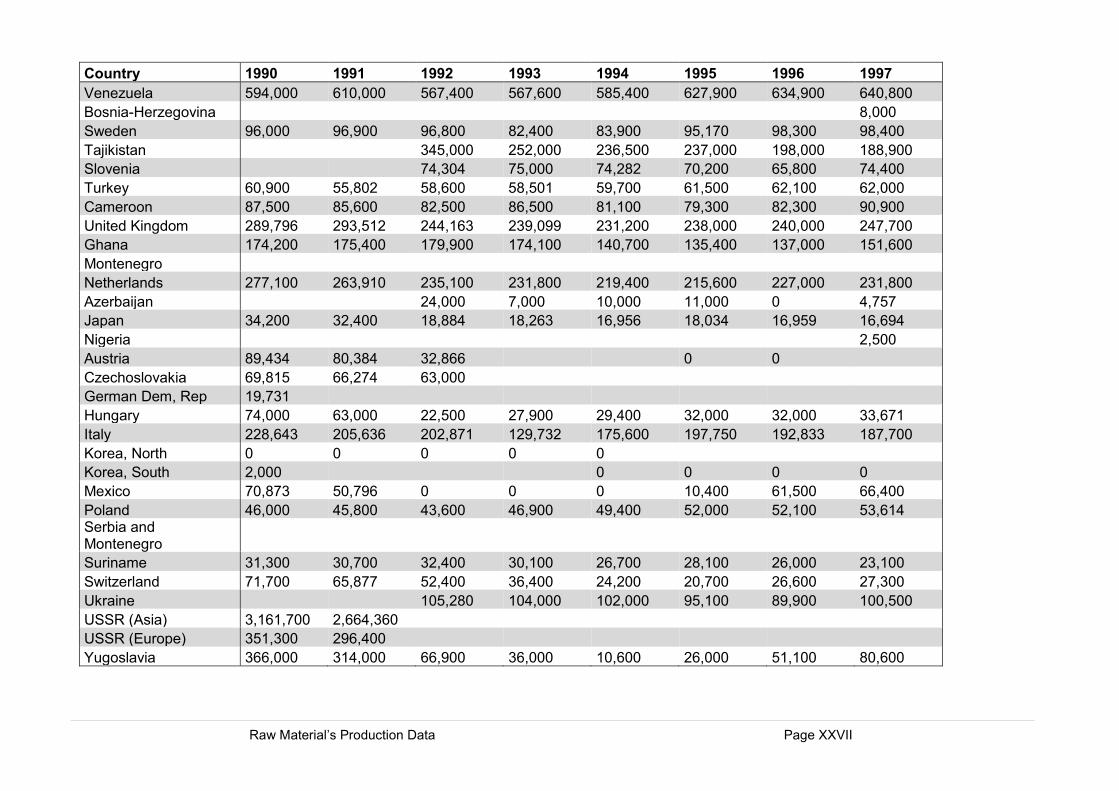
Raw Material’s Production Data Page XXVII
Country 1990 1991 1992 1993 1994 1995 1996 1997
Venezuela 594,000 610,000 567,400 567,600 585,400 627,900 634,900 640,800
Bosnia-Herzegovina 8,000
Sweden 96,000 96,900 96,800 82,400 83,900 95,170 98,300 98,400
Tajikistan 345,000 252,000 236,500 237,000 198,000 188,900
Slovenia 74,304 75,000 74,282 70,200 65,800 74,400
Turkey 60,900 55,802 58,600 58,501 59,700 61,500 62,100 62,000
Cameroon 87,500 85,600 82,500 86,500 81,100 79,300 82,300 90,900
United Kingdom 289,796 293,512 244,163 239,099 231,200 238,000 240,000 247,700
Ghana 174,200 175,400 179,900 174,100 140,700 135,400 137,000 151,600
Montenegro Netherlands 277,100 263,910 235,100 231,800 219,400 215,600 227,000 231,800
Azerbaijan 24,000 7,000 10,000 11,000 0 4,757
Japan 34,200 32,400 18,884 18,263 16,956 18,034 16,959 16,694
Nigeria 2,500
Austria 89,434 80,384 32,866 0 0 Czechoslovakia 69,815 66,274 63,000 German Dem, Rep 19,731 Hungary 74,000 63,000 22,500 27,900 29,400 32,000 32,000 33,671
Italy 228,643 205,636 202,871 129,732 175,600 197,750 192,833 187,700
Korea, North 0 0 0 0 0 Korea, South 2,000 0 0 0 0
Mexico 70,873 50,796 0 0 0 10,400 61,500 66,400
Poland 46,000 45,800 43,600 46,900 49,400 52,000 52,100 53,614 Serbia and Montenegro Suriname 31,300 30,700 32,400 30,100 26,700 28,100 26,000 23,100
Switzerland 71,700 65,877 52,400 36,400 24,200 20,700 26,600 27,300
Ukraine 105,280 104,000 102,000 95,100 89,900 100,500
USSR (Asia) 3,161,700 2,664,360 USSR (Europe) 351,300 296,400 Yugoslavia 366,000 314,000 66,900 36,000 10,600 26,000 51,100 80,600
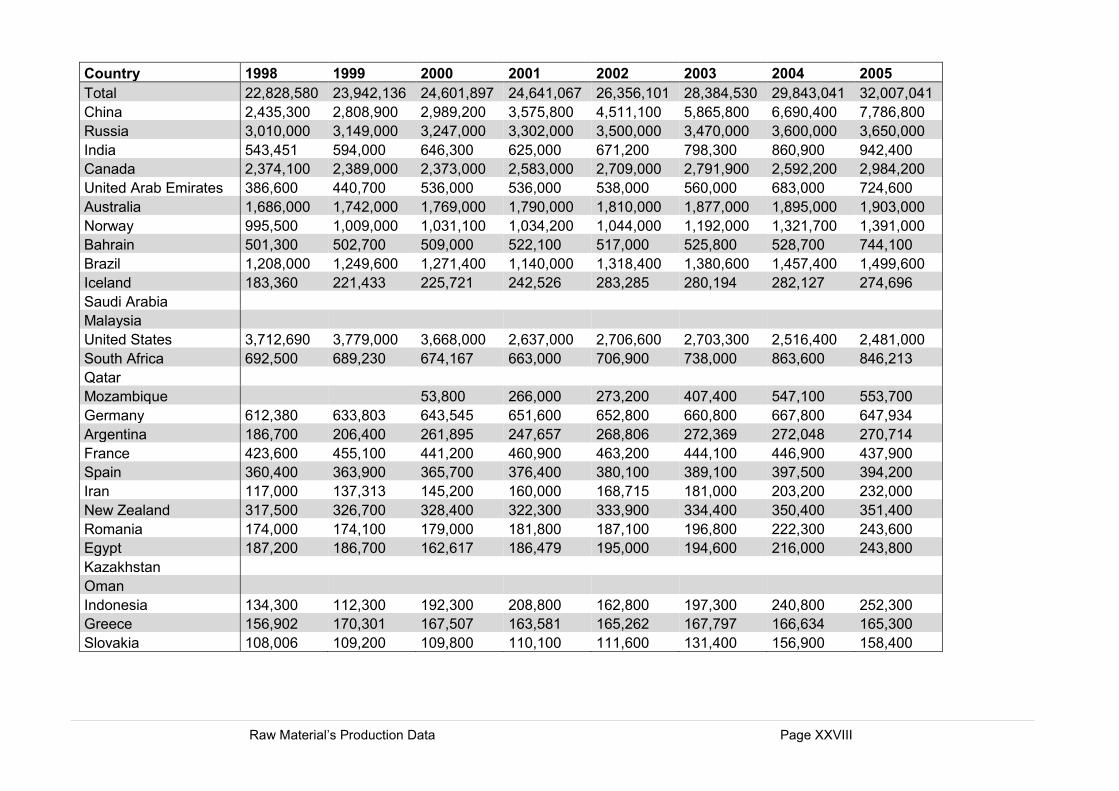
Raw Material’s Production Data Page XXVIII
Country 1998 1999 2000 2001 2002 2003 2004 2005
Total 22,828,580 23,942,136 24,601,897 24,641,067 26,356,101 28,384,530 29,843,041 32,007,041
China 2,435,300 2,808,900 2,989,200 3,575,800 4,511,100 5,865,800 6,690,400 7,786,800
Russia 3,010,000 3,149,000 3,247,000 3,302,000 3,500,000 3,470,000 3,600,000 3,650,000
India 543,451 594,000 646,300 625,000 671,200 798,300 860,900 942,400
Canada 2,374,100 2,389,000 2,373,000 2,583,000 2,709,000 2,791,900 2,592,200 2,984,200
United Arab Emirates 386,600 440,700 536,000 536,000 538,000 560,000 683,000 724,600
Australia 1,686,000 1,742,000 1,769,000 1,790,000 1,810,000 1,877,000 1,895,000 1,903,000
Norway 995,500 1,009,000 1,031,100 1,034,200 1,044,000 1,192,000 1,321,700 1,391,000
Bahrain 501,300 502,700 509,000 522,100 517,000 525,800 528,700 744,100
Brazil 1,208,000 1,249,600 1,271,400 1,140,000 1,318,400 1,380,600 1,457,400 1,499,600
Iceland 183,360 221,433 225,721 242,526 283,285 280,194 282,127 274,696
Saudi Arabia Malaysia United States 3,712,690 3,779,000 3,668,000 2,637,000 2,706,600 2,703,300 2,516,400 2,481,000
South Africa 692,500 689,230 674,167 663,000 706,900 738,000 863,600 846,213
Qatar Mozambique 53,800 266,000 273,200 407,400 547,100 553,700
Germany 612,380 633,803 643,545 651,600 652,800 660,800 667,800 647,934
Argentina 186,700 206,400 261,895 247,657 268,806 272,369 272,048 270,714
France 423,600 455,100 441,200 460,900 463,200 444,100 446,900 437,900
Spain 360,400 363,900 365,700 376,400 380,100 389,100 397,500 394,200
Iran 117,000 137,313 145,200 160,000 168,715 181,000 203,200 232,000
New Zealand 317,500 326,700 328,400 322,300 333,900 334,400 350,400 351,400
Romania 174,000 174,100 179,000 181,800 187,100 196,800 222,300 243,600
Egypt 187,200 186,700 162,617 186,479 195,000 194,600 216,000 243,800
Kazakhstan Oman Indonesia 134,300 112,300 192,300 208,800 162,800 197,300 240,800 252,300
Greece 156,902 170,301 167,507 163,581 165,262 167,797 166,634 165,300
Slovakia 108,006 109,200 109,800 110,100 111,600 131,400 156,900 158,400
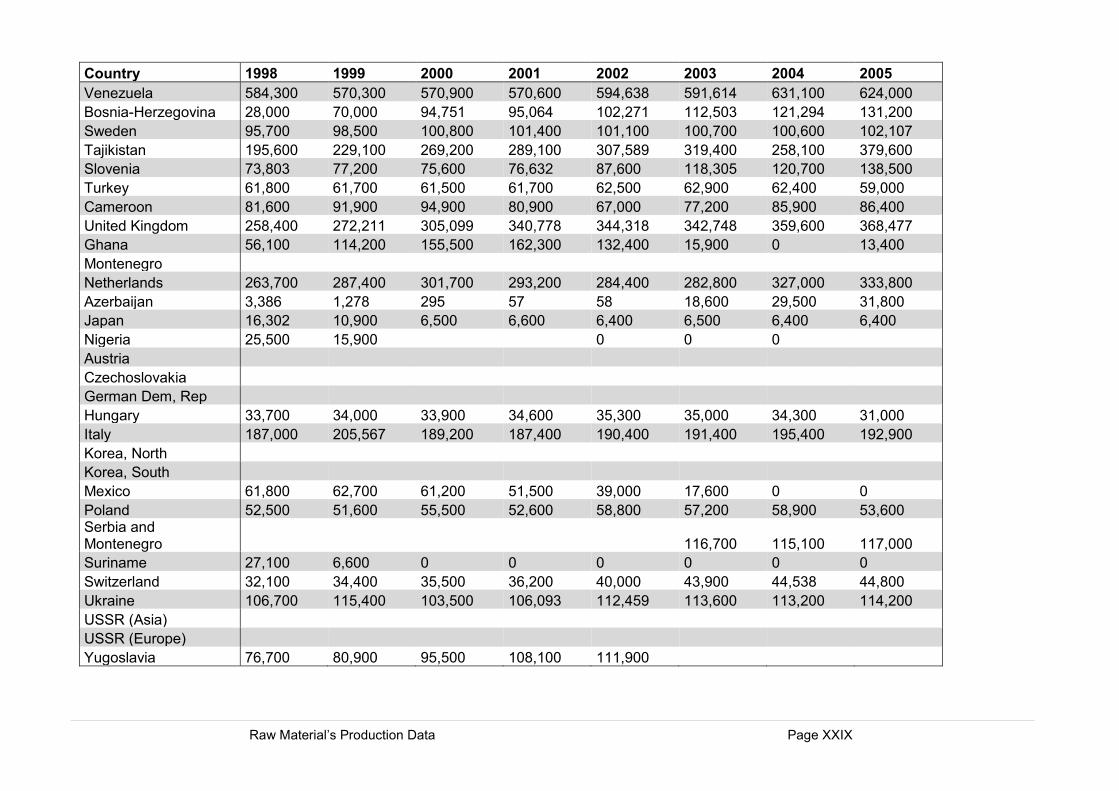
Raw Material’s Production Data Page XXIX
Country 1998 1999 2000 2001 2002 2003 2004 2005
Venezuela 584,300 570,300 570,900 570,600 594,638 591,614 631,100 624,000
Bosnia-Herzegovina 28,000 70,000 94,751 95,064 102,271 112,503 121,294 131,200
Sweden 95,700 98,500 100,800 101,400 101,100 100,700 100,600 102,107
Tajikistan 195,600 229,100 269,200 289,100 307,589 319,400 258,100 379,600
Slovenia 73,803 77,200 75,600 76,632 87,600 118,305 120,700 138,500
Turkey 61,800 61,700 61,500 61,700 62,500 62,900 62,400 59,000
Cameroon 81,600 91,900 94,900 80,900 67,000 77,200 85,900 86,400
United Kingdom 258,400 272,211 305,099 340,778 344,318 342,748 359,600 368,477
Ghana 56,100 114,200 155,500 162,300 132,400 15,900 0 13,400
Montenegro Netherlands 263,700 287,400 301,700 293,200 284,400 282,800 327,000 333,800
Azerbaijan 3,386 1,278 295 57 58 18,600 29,500 31,800
Japan 16,302 10,900 6,500 6,600 6,400 6,500 6,400 6,400
Nigeria 25,500 15,900 0 0 0 Austria Czechoslovakia German Dem, Rep Hungary 33,700 34,000 33,900 34,600 35,300 35,000 34,300 31,000
Italy 187,000 205,567 189,200 187,400 190,400 191,400 195,400 192,900
Korea, North Korea, South Mexico 61,800 62,700 61,200 51,500 39,000 17,600 0 0
Poland 52,500 51,600 55,500 52,600 58,800 57,200 58,900 53,600 Serbia and Montenegro 116,700 115,100 117,000
Suriname 27,100 6,600 0 0 0 0 0 0
Switzerland 32,100 34,400 35,500 36,200 40,000 43,900 44,538 44,800
Ukraine 106,700 115,400 103,500 106,093 112,459 113,600 113,200 114,200
USSR (Asia) USSR (Europe) Yugoslavia 76,700 80,900 95,500 108,100 111,900
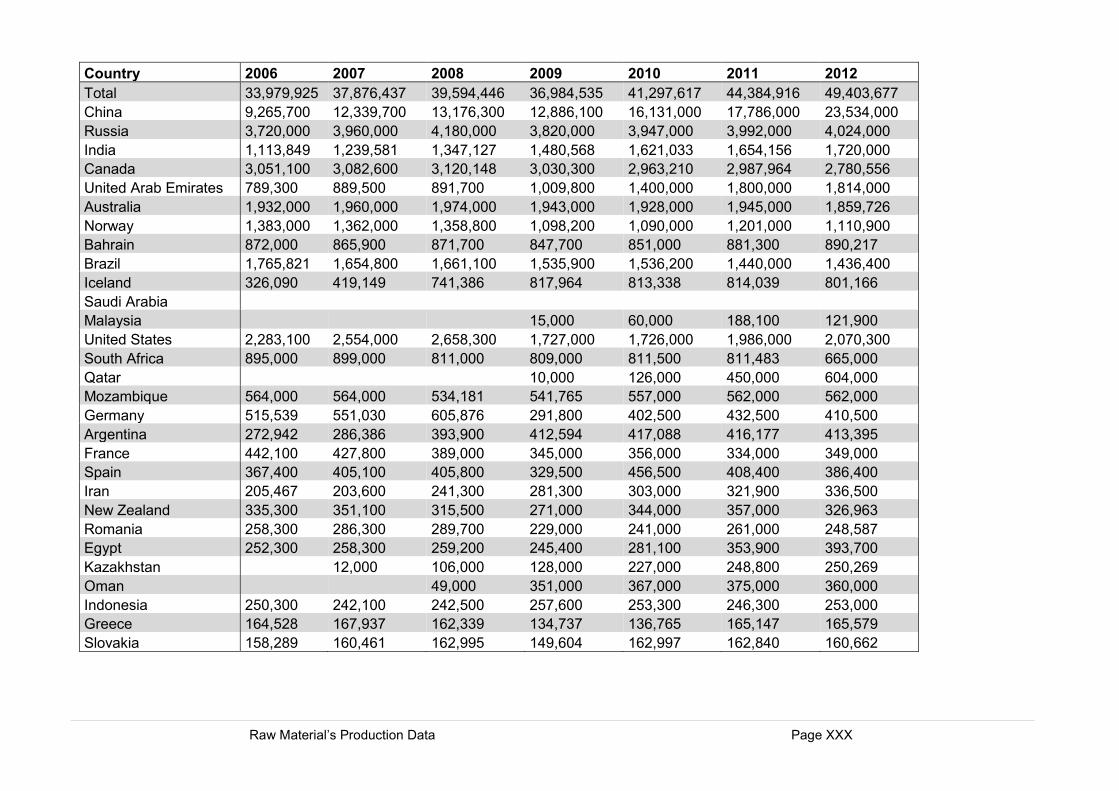
Raw Material’s Production Data Page XXX
Country 2006 2007 2008 2009 2010 2011 2012
Total 33,979,925 37,876,437 39,594,446 36,984,535 41,297,617 44,384,916 49,403,677
China 9,265,700 12,339,700 13,176,300 12,886,100 16,131,000 17,786,000 23,534,000
Russia 3,720,000 3,960,000 4,180,000 3,820,000 3,947,000 3,992,000 4,024,000
India 1,113,849 1,239,581 1,347,127 1,480,568 1,621,033 1,654,156 1,720,000
Canada 3,051,100 3,082,600 3,120,148 3,030,300 2,963,210 2,987,964 2,780,556
United Arab Emirates 789,300 889,500 891,700 1,009,800 1,400,000 1,800,000 1,814,000
Australia 1,932,000 1,960,000 1,974,000 1,943,000 1,928,000 1,945,000 1,859,726
Norway 1,383,000 1,362,000 1,358,800 1,098,200 1,090,000 1,201,000 1,110,900
Bahrain 872,000 865,900 871,700 847,700 851,000 881,300 890,217
Brazil 1,765,821 1,654,800 1,661,100 1,535,900 1,536,200 1,440,000 1,436,400
Iceland 326,090 419,149 741,386 817,964 813,338 814,039 801,166
Saudi Arabia Malaysia 15,000 60,000 188,100 121,900
United States 2,283,100 2,554,000 2,658,300 1,727,000 1,726,000 1,986,000 2,070,300
South Africa 895,000 899,000 811,000 809,000 811,500 811,483 665,000
Qatar 10,000 126,000 450,000 604,000
Mozambique 564,000 564,000 534,181 541,765 557,000 562,000 562,000
Germany 515,539 551,030 605,876 291,800 402,500 432,500 410,500
Argentina 272,942 286,386 393,900 412,594 417,088 416,177 413,395
France 442,100 427,800 389,000 345,000 356,000 334,000 349,000
Spain 367,400 405,100 405,800 329,500 456,500 408,400 386,400
Iran 205,467 203,600 241,300 281,300 303,000 321,900 336,500
New Zealand 335,300 351,100 315,500 271,000 344,000 357,000 326,963
Romania 258,300 286,300 289,700 229,000 241,000 261,000 248,587
Egypt 252,300 258,300 259,200 245,400 281,100 353,900 393,700
Kazakhstan 12,000 106,000 128,000 227,000 248,800 250,269
Oman 49,000 351,000 367,000 375,000 360,000
Indonesia 250,300 242,100 242,500 257,600 253,300 246,300 253,000
Greece 164,528 167,937 162,339 134,737 136,765 165,147 165,579
Slovakia 158,289 160,461 162,995 149,604 162,997 162,840 160,662
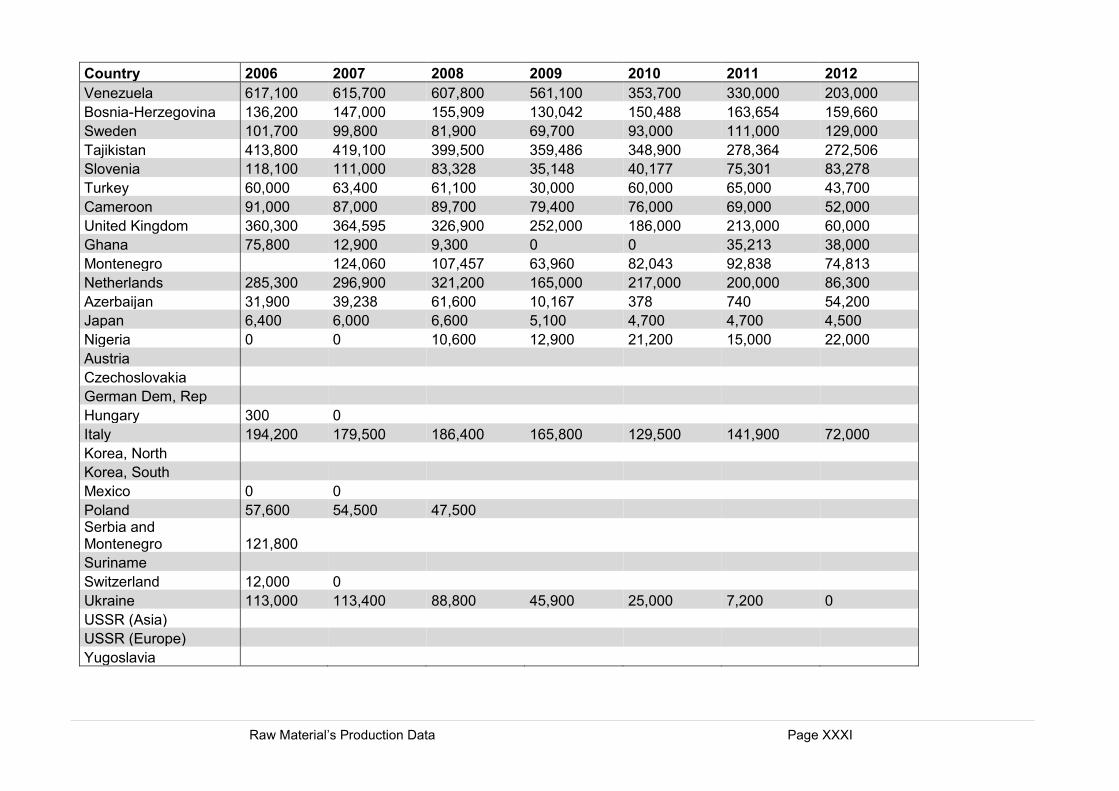
Raw Material’s Production Data Page XXXI
Country 2006 2007 2008 2009 2010 2011 2012
Venezuela 617,100 615,700 607,800 561,100 353,700 330,000 203,000
Bosnia-Herzegovina 136,200 147,000 155,909 130,042 150,488 163,654 159,660
Sweden 101,700 99,800 81,900 69,700 93,000 111,000 129,000
Tajikistan 413,800 419,100 399,500 359,486 348,900 278,364 272,506
Slovenia 118,100 111,000 83,328 35,148 40,177 75,301 83,278
Turkey 60,000 63,400 61,100 30,000 60,000 65,000 43,700
Cameroon 91,000 87,000 89,700 79,400 76,000 69,000 52,000
United Kingdom 360,300 364,595 326,900 252,000 186,000 213,000 60,000
Ghana 75,800 12,900 9,300 0 0 35,213 38,000
Montenegro 124,060 107,457 63,960 82,043 92,838 74,813
Netherlands 285,300 296,900 321,200 165,000 217,000 200,000 86,300
Azerbaijan 31,900 39,238 61,600 10,167 378 740 54,200
Japan 6,400 6,000 6,600 5,100 4,700 4,700 4,500
Nigeria 0 0 10,600 12,900 21,200 15,000 22,000
Austria Czechoslovakia German Dem, Rep Hungary 300 0 Italy 194,200 179,500 186,400 165,800 129,500 141,900 72,000
Korea, North Korea, South Mexico 0 0 Poland 57,600 54,500 47,500 Serbia and Montenegro 121,800 Suriname Switzerland 12,000 0 Ukraine 113,000 113,400 88,800 45,900 25,000 7,200 0
USSR (Asia) USSR (Europe) Yugoslavia
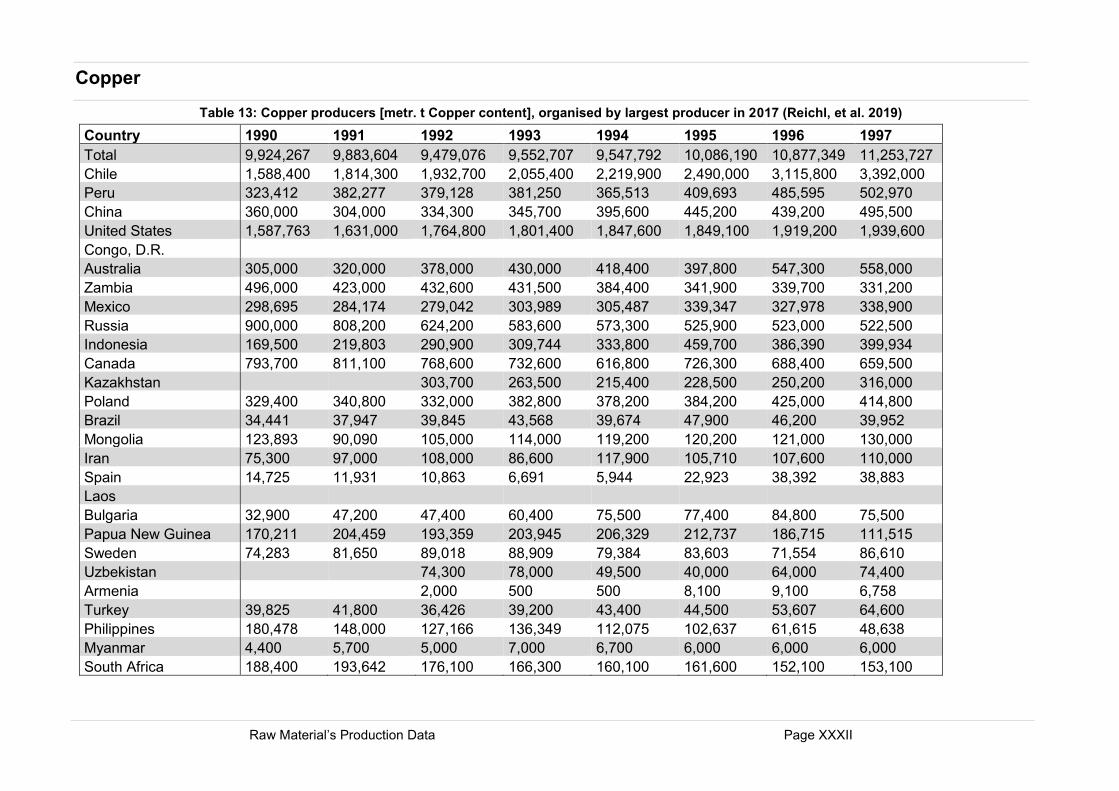
Raw Material’s Production Data Page XXXII
Copper
Table 13: Copper producers [metr. t Copper content], organised by largest producer in 2017 (Reichl, et al. 2019)
Country 1990 1991 1992 1993 1994 1995 1996 1997
Total 9,924,267 9,883,604 9,479,076 9,552,707 9,547,792 10,086,190 10,877,349 11,253,727
Chile 1,588,400 1,814,300 1,932,700 2,055,400 2,219,900 2,490,000 3,115,800 3,392,000
Peru 323,412 382,277 379,128 381,250 365,513 409,693 485,595 502,970
China 360,000 304,000 334,300 345,700 395,600 445,200 439,200 495,500
United States 1,587,763 1,631,000 1,764,800 1,801,400 1,847,600 1,849,100 1,919,200 1,939,600
Congo, D.R. Australia 305,000 320,000 378,000 430,000 418,400 397,800 547,300 558,000
Zambia 496,000 423,000 432,600 431,500 384,400 341,900 339,700 331,200
Mexico 298,695 284,174 279,042 303,989 305,487 339,347 327,978 338,900
Russia 900,000 808,200 624,200 583,600 573,300 525,900 523,000 522,500
Indonesia 169,500 219,803 290,900 309,744 333,800 459,700 386,390 399,934
Canada 793,700 811,100 768,600 732,600 616,800 726,300 688,400 659,500
Kazakhstan 303,700 263,500 215,400 228,500 250,200 316,000
Poland 329,400 340,800 332,000 382,800 378,200 384,200 425,000 414,800
Brazil 34,441 37,947 39,845 43,568 39,674 47,900 46,200 39,952
Mongolia 123,893 90,090 105,000 114,000 119,200 120,200 121,000 130,000
Iran 75,300 97,000 108,000 86,600 117,900 105,710 107,600 110,000
Spain 14,725 11,931 10,863 6,691 5,944 22,923 38,392 38,883
Laos Bulgaria 32,900 47,200 47,400 60,400 75,500 77,400 84,800 75,500
Papua New Guinea 170,211 204,459 193,359 203,945 206,329 212,737 186,715 111,515
Sweden 74,283 81,650 89,018 88,909 79,384 83,603 71,554 86,610
Uzbekistan 74,300 78,000 49,500 40,000 64,000 74,400
Armenia 2,000 500 500 8,100 9,100 6,758
Turkey 39,825 41,800 36,426 39,200 43,400 44,500 53,607 64,600
Philippines 180,478 148,000 127,166 136,349 112,075 102,637 61,615 48,638
Myanmar 4,400 5,700 5,000 7,000 6,700 6,000 6,000 6,000
South Africa 188,400 193,642 176,100 166,300 160,100 161,600 152,100 153,100
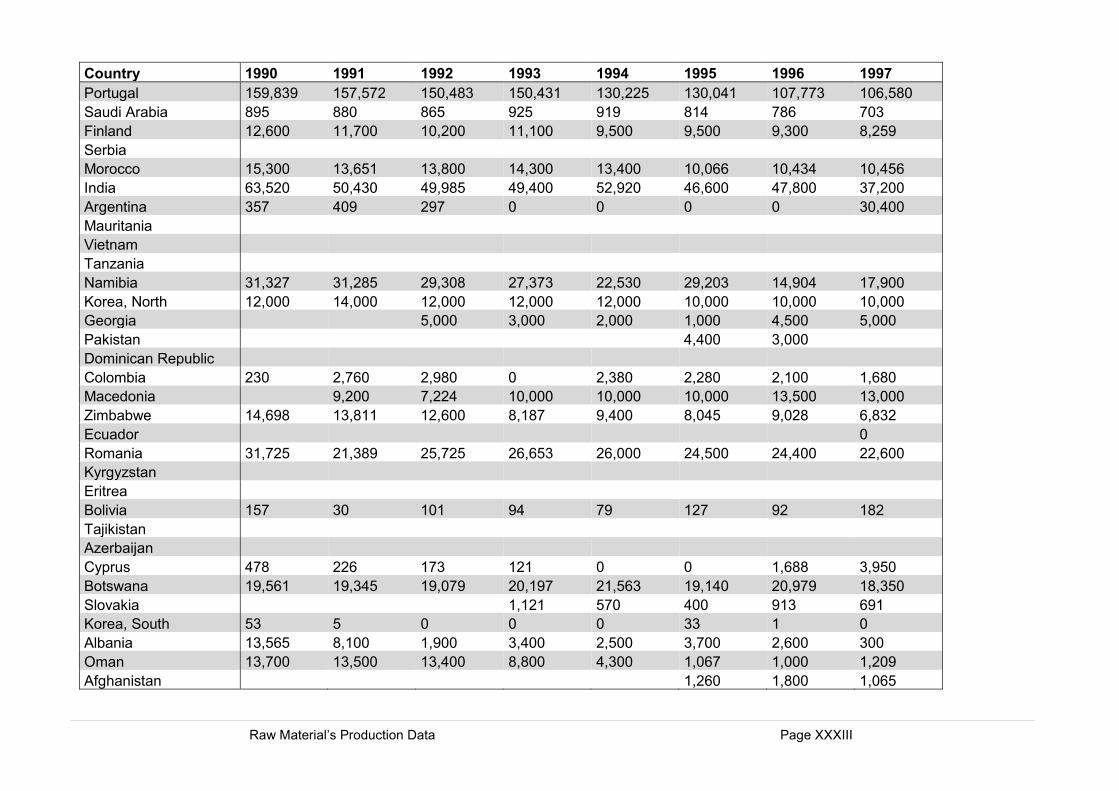
Raw Material’s Production Data Page XXXIII
Country 1990 1991 1992 1993 1994 1995 1996 1997
Portugal 159,839 157,572 150,483 150,431 130,225 130,041 107,773 106,580
Saudi Arabia 895 880 865 925 919 814 786 703
Finland 12,600 11,700 10,200 11,100 9,500 9,500 9,300 8,259
Serbia Morocco 15,300 13,651 13,800 14,300 13,400 10,066 10,434 10,456
India 63,520 50,430 49,985 49,400 52,920 46,600 47,800 37,200
Argentina 357 409 297 0 0 0 0 30,400
Mauritania Vietnam Tanzania Namibia 31,327 31,285 29,308 27,373 22,530 29,203 14,904 17,900
Korea, North 12,000 14,000 12,000 12,000 12,000 10,000 10,000 10,000
Georgia 5,000 3,000 2,000 1,000 4,500 5,000
Pakistan 4,400 3,000 Dominican Republic Colombia 230 2,760 2,980 0 2,380 2,280 2,100 1,680
Macedonia 9,200 7,224 10,000 10,000 10,000 13,500 13,000
Zimbabwe 14,698 13,811 12,600 8,187 9,400 8,045 9,028 6,832
Ecuador 0
Romania 31,725 21,389 25,725 26,653 26,000 24,500 24,400 22,600
Kyrgyzstan Eritrea Bolivia 157 30 101 94 79 127 92 182
Tajikistan Azerbaijan Cyprus 478 226 173 121 0 0 1,688 3,950
Botswana 19,561 19,345 19,079 20,197 21,563 19,140 20,979 18,350
Slovakia 1,121 570 400 913 691
Korea, South 53 5 0 0 0 33 1 0
Albania 13,565 8,100 1,900 3,400 2,500 3,700 2,600 300
Oman 13,700 13,500 13,400 8,800 4,300 1,067 1,000 1,209
Afghanistan 1,260 1,800 1,065
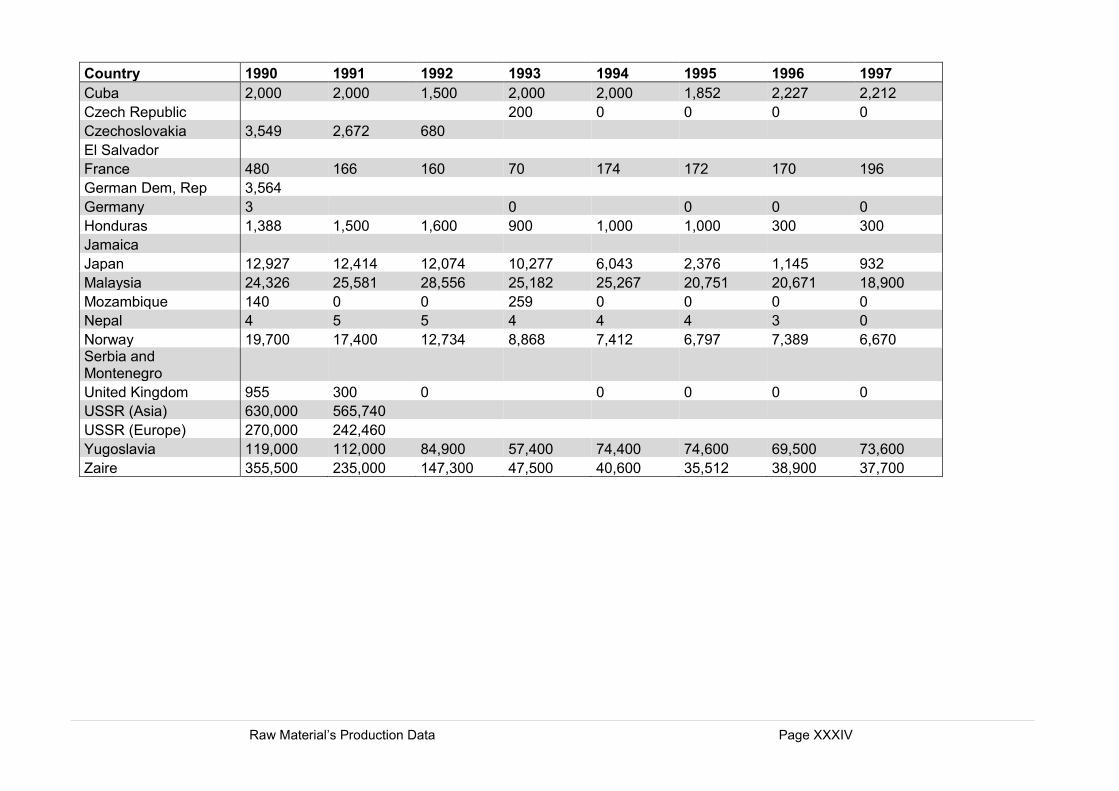
Raw Material’s Production Data Page XXXIV
Country 1990 1991 1992 1993 1994 1995 1996 1997
Cuba 2,000 2,000 1,500 2,000 2,000 1,852 2,227 2,212
Czech Republic 200 0 0 0 0
Czechoslovakia 3,549 2,672 680 El Salvador France 480 166 160 70 174 172 170 196
German Dem, Rep 3,564 Germany 3 0 0 0 0
Honduras 1,388 1,500 1,600 900 1,000 1,000 300 300
Jamaica Japan 12,927 12,414 12,074 10,277 6,043 2,376 1,145 932
Malaysia 24,326 25,581 28,556 25,182 25,267 20,751 20,671 18,900
Mozambique 140 0 0 259 0 0 0 0
Nepal 4 5 5 4 4 4 3 0
Norway 19,700 17,400 12,734 8,868 7,412 6,797 7,389 6,670 Serbia and Montenegro United Kingdom 955 300 0 0 0 0 0
USSR (Asia) 630,000 565,740 USSR (Europe) 270,000 242,460 Yugoslavia 119,000 112,000 84,900 57,400 74,400 74,600 69,500 73,600
Zaire 355,500 235,000 147,300 47,500 40,600 35,512 38,900 37,700
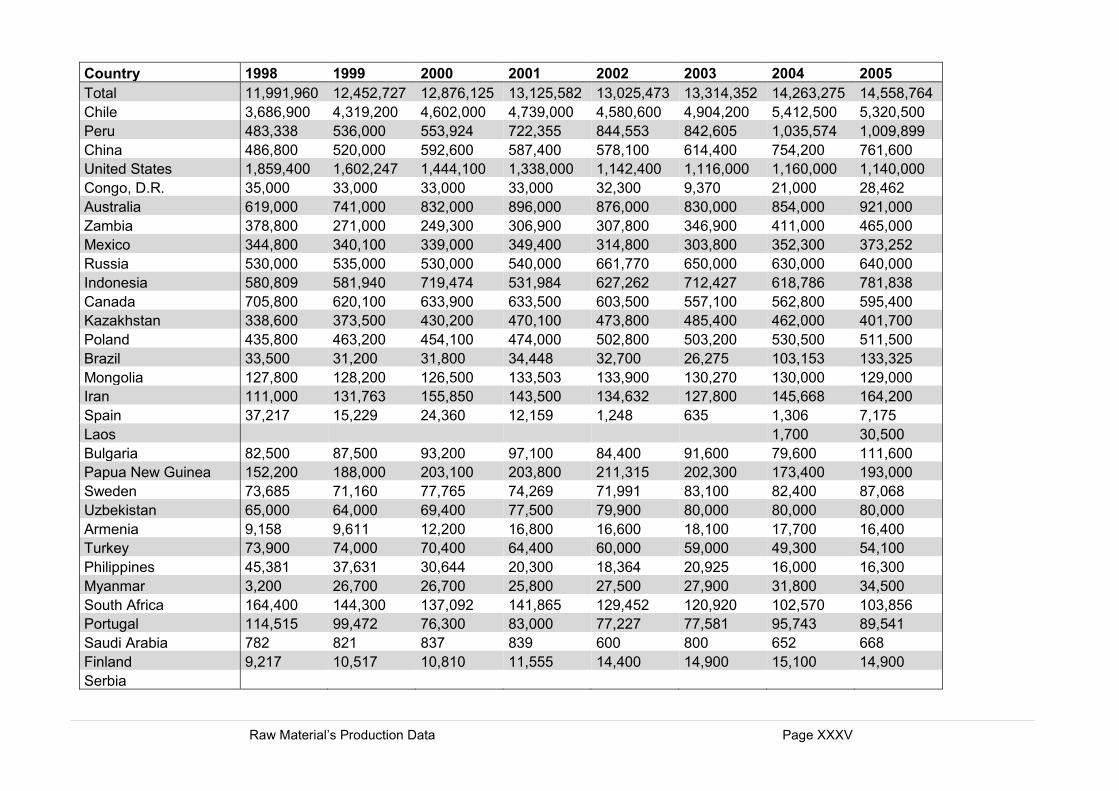
Raw Material’s Production Data Page XXXV
Country 1998 1999 2000 2001 2002 2003 2004 2005
Total 11,991,960 12,452,727 12,876,125 13,125,582 13,025,473 13,314,352 14,263,275 14,558,764
Chile 3,686,900 4,319,200 4,602,000 4,739,000 4,580,600 4,904,200 5,412,500 5,320,500
Peru 483,338 536,000 553,924 722,355 844,553 842,605 1,035,574 1,009,899
China 486,800 520,000 592,600 587,400 578,100 614,400 754,200 761,600
United States 1,859,400 1,602,247 1,444,100 1,338,000 1,142,400 1,116,000 1,160,000 1,140,000
Congo, D.R. 35,000 33,000 33,000 33,000 32,300 9,370 21,000 28,462
Australia 619,000 741,000 832,000 896,000 876,000 830,000 854,000 921,000
Zambia 378,800 271,000 249,300 306,900 307,800 346,900 411,000 465,000
Mexico 344,800 340,100 339,000 349,400 314,800 303,800 352,300 373,252
Russia 530,000 535,000 530,000 540,000 661,770 650,000 630,000 640,000
Indonesia 580,809 581,940 719,474 531,984 627,262 712,427 618,786 781,838
Canada 705,800 620,100 633,900 633,500 603,500 557,100 562,800 595,400
Kazakhstan 338,600 373,500 430,200 470,100 473,800 485,400 462,000 401,700
Poland 435,800 463,200 454,100 474,000 502,800 503,200 530,500 511,500
Brazil 33,500 31,200 31,800 34,448 32,700 26,275 103,153 133,325
Mongolia 127,800 128,200 126,500 133,503 133,900 130,270 130,000 129,000
Iran 111,000 131,763 155,850 143,500 134,632 127,800 145,668 164,200
Spain 37,217 15,229 24,360 12,159 1,248 635 1,306 7,175
Laos 1,700 30,500
Bulgaria 82,500 87,500 93,200 97,100 84,400 91,600 79,600 111,600
Papua New Guinea 152,200 188,000 203,100 203,800 211,315 202,300 173,400 193,000
Sweden 73,685 71,160 77,765 74,269 71,991 83,100 82,400 87,068
Uzbekistan 65,000 64,000 69,400 77,500 79,900 80,000 80,000 80,000
Armenia 9,158 9,611 12,200 16,800 16,600 18,100 17,700 16,400
Turkey 73,900 74,000 70,400 64,400 60,000 59,000 49,300 54,100
Philippines 45,381 37,631 30,644 20,300 18,364 20,925 16,000 16,300
Myanmar 3,200 26,700 26,700 25,800 27,500 27,900 31,800 34,500
South Africa 164,400 144,300 137,092 141,865 129,452 120,920 102,570 103,856
Portugal 114,515 99,472 76,300 83,000 77,227 77,581 95,743 89,541
Saudi Arabia 782 821 837 839 600 800 652 668
Finland 9,217 10,517 10,810 11,555 14,400 14,900 15,100 14,900
Serbia
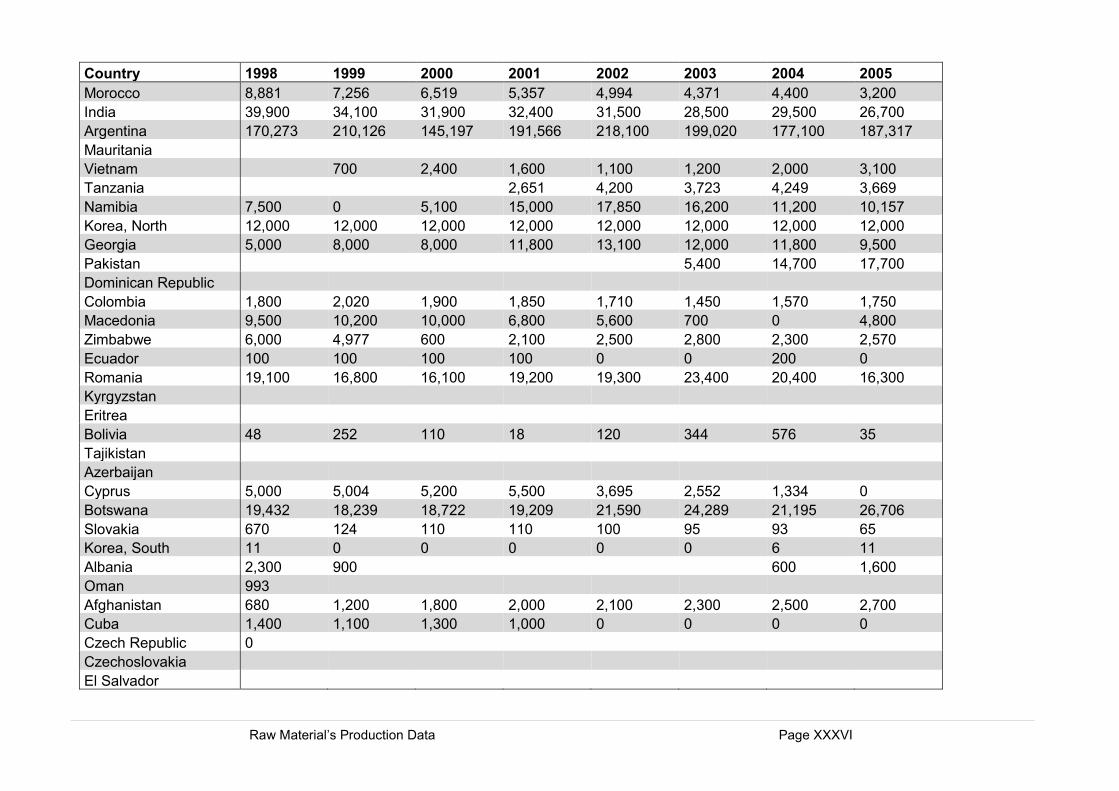
Raw Material’s Production Data Page XXXVI
Country 1998 1999 2000 2001 2002 2003 2004 2005
Morocco 8,881 7,256 6,519 5,357 4,994 4,371 4,400 3,200
India 39,900 34,100 31,900 32,400 31,500 28,500 29,500 26,700
Argentina 170,273 210,126 145,197 191,566 218,100 199,020 177,100 187,317
Mauritania Vietnam 700 2,400 1,600 1,100 1,200 2,000 3,100
Tanzania 2,651 4,200 3,723 4,249 3,669
Namibia 7,500 0 5,100 15,000 17,850 16,200 11,200 10,157
Korea, North 12,000 12,000 12,000 12,000 12,000 12,000 12,000 12,000
Georgia 5,000 8,000 8,000 11,800 13,100 12,000 11,800 9,500
Pakistan 5,400 14,700 17,700
Dominican Republic Colombia 1,800 2,020 1,900 1,850 1,710 1,450 1,570 1,750
Macedonia 9,500 10,200 10,000 6,800 5,600 700 0 4,800
Zimbabwe 6,000 4,977 600 2,100 2,500 2,800 2,300 2,570
Ecuador 100 100 100 100 0 0 200 0
Romania 19,100 16,800 16,100 19,200 19,300 23,400 20,400 16,300
Kyrgyzstan Eritrea Bolivia 48 252 110 18 120 344 576 35
Tajikistan Azerbaijan Cyprus 5,000 5,004 5,200 5,500 3,695 2,552 1,334 0
Botswana 19,432 18,239 18,722 19,209 21,590 24,289 21,195 26,706
Slovakia 670 124 110 110 100 95 93 65
Korea, South 11 0 0 0 0 0 6 11
Albania 2,300 900 600 1,600
Oman 993 Afghanistan 680 1,200 1,800 2,000 2,100 2,300 2,500 2,700
Cuba 1,400 1,100 1,300 1,000 0 0 0 0
Czech Republic 0 Czechoslovakia El Salvador
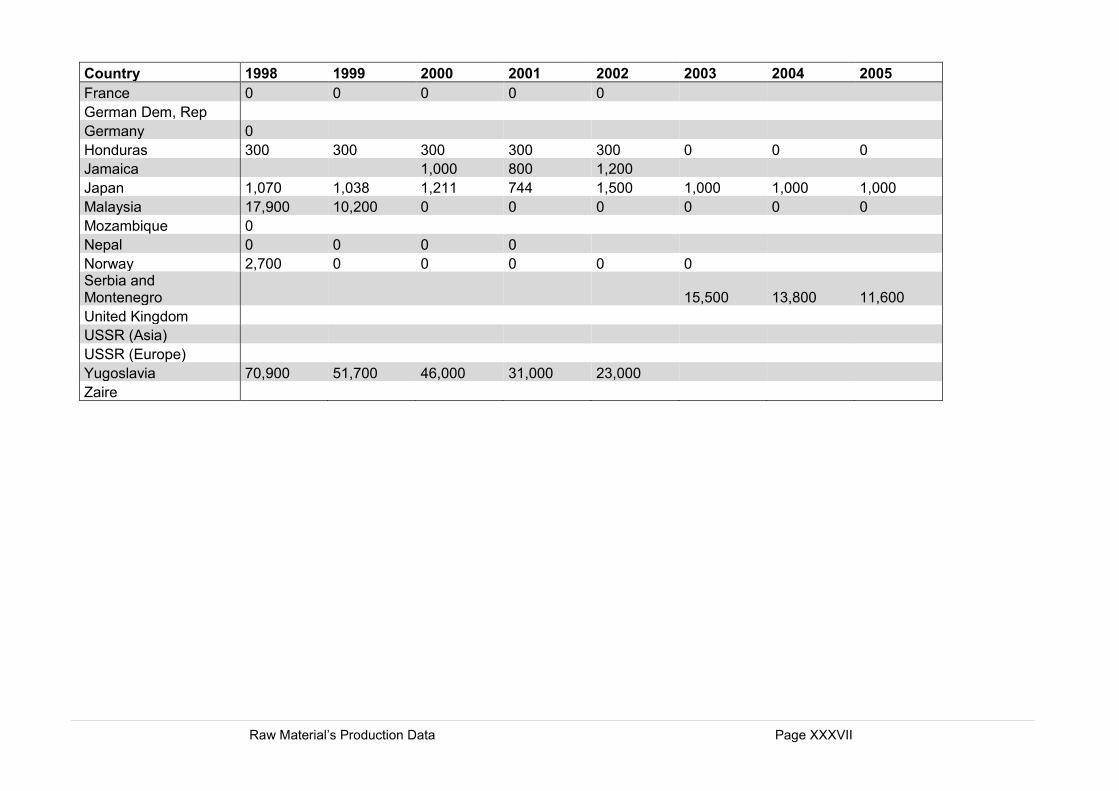
Raw Material’s Production Data Page XXXVII
Country 1998 1999 2000 2001 2002 2003 2004 2005
France 0 0 0 0 0 German Dem, Rep Germany 0 Honduras 300 300 300 300 300 0 0 0
Jamaica 1,000 800 1,200 Japan 1,070 1,038 1,211 744 1,500 1,000 1,000 1,000
Malaysia 17,900 10,200 0 0 0 0 0 0
Mozambique 0 Nepal 0 0 0 0 Norway 2,700 0 0 0 0 0 Serbia and Montenegro 15,500 13,800 11,600
United Kingdom USSR (Asia) USSR (Europe) Yugoslavia 70,900 51,700 46,000 31,000 23,000 Zaire
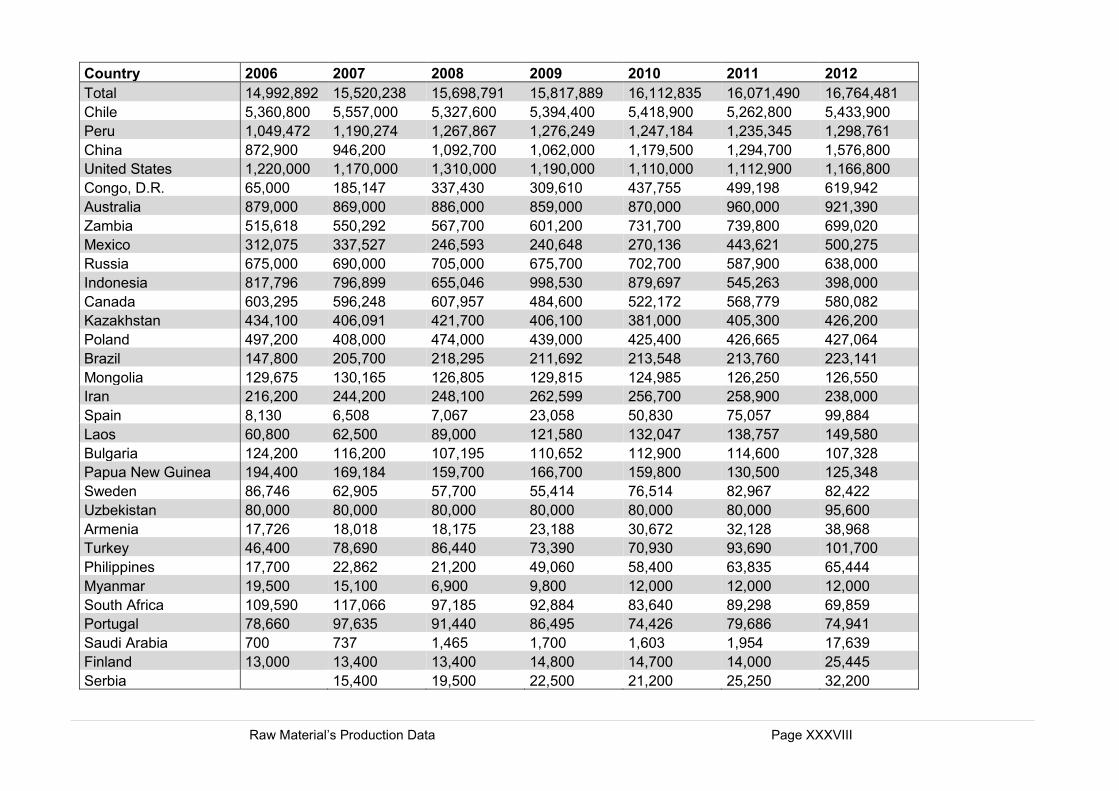
Raw Material’s Production Data Page XXXVIII
Country 2006 2007 2008 2009 2010 2011 2012
Total 14,992,892 15,520,238 15,698,791 15,817,889 16,112,835 16,071,490 16,764,481
Chile 5,360,800 5,557,000 5,327,600 5,394,400 5,418,900 5,262,800 5,433,900
Peru 1,049,472 1,190,274 1,267,867 1,276,249 1,247,184 1,235,345 1,298,761
China 872,900 946,200 1,092,700 1,062,000 1,179,500 1,294,700 1,576,800
United States 1,220,000 1,170,000 1,310,000 1,190,000 1,110,000 1,112,900 1,166,800
Congo, D.R. 65,000 185,147 337,430 309,610 437,755 499,198 619,942
Australia 879,000 869,000 886,000 859,000 870,000 960,000 921,390
Zambia 515,618 550,292 567,700 601,200 731,700 739,800 699,020
Mexico 312,075 337,527 246,593 240,648 270,136 443,621 500,275
Russia 675,000 690,000 705,000 675,700 702,700 587,900 638,000
Indonesia 817,796 796,899 655,046 998,530 879,697 545,263 398,000
Canada 603,295 596,248 607,957 484,600 522,172 568,779 580,082
Kazakhstan 434,100 406,091 421,700 406,100 381,000 405,300 426,200
Poland 497,200 408,000 474,000 439,000 425,400 426,665 427,064
Brazil 147,800 205,700 218,295 211,692 213,548 213,760 223,141
Mongolia 129,675 130,165 126,805 129,815 124,985 126,250 126,550
Iran 216,200 244,200 248,100 262,599 256,700 258,900 238,000
Spain 8,130 6,508 7,067 23,058 50,830 75,057 99,884
Laos 60,800 62,500 89,000 121,580 132,047 138,757 149,580
Bulgaria 124,200 116,200 107,195 110,652 112,900 114,600 107,328
Papua New Guinea 194,400 169,184 159,700 166,700 159,800 130,500 125,348
Sweden 86,746 62,905 57,700 55,414 76,514 82,967 82,422
Uzbekistan 80,000 80,000 80,000 80,000 80,000 80,000 95,600
Armenia 17,726 18,018 18,175 23,188 30,672 32,128 38,968
Turkey 46,400 78,690 86,440 73,390 70,930 93,690 101,700
Philippines 17,700 22,862 21,200 49,060 58,400 63,835 65,444
Myanmar 19,500 15,100 6,900 9,800 12,000 12,000 12,000
South Africa 109,590 117,066 97,185 92,884 83,640 89,298 69,859
Portugal 78,660 97,635 91,440 86,495 74,426 79,686 74,941
Saudi Arabia 700 737 1,465 1,700 1,603 1,954 17,639
Finland 13,000 13,400 13,400 14,800 14,700 14,000 25,445
Serbia 15,400 19,500 22,500 21,200 25,250 32,200
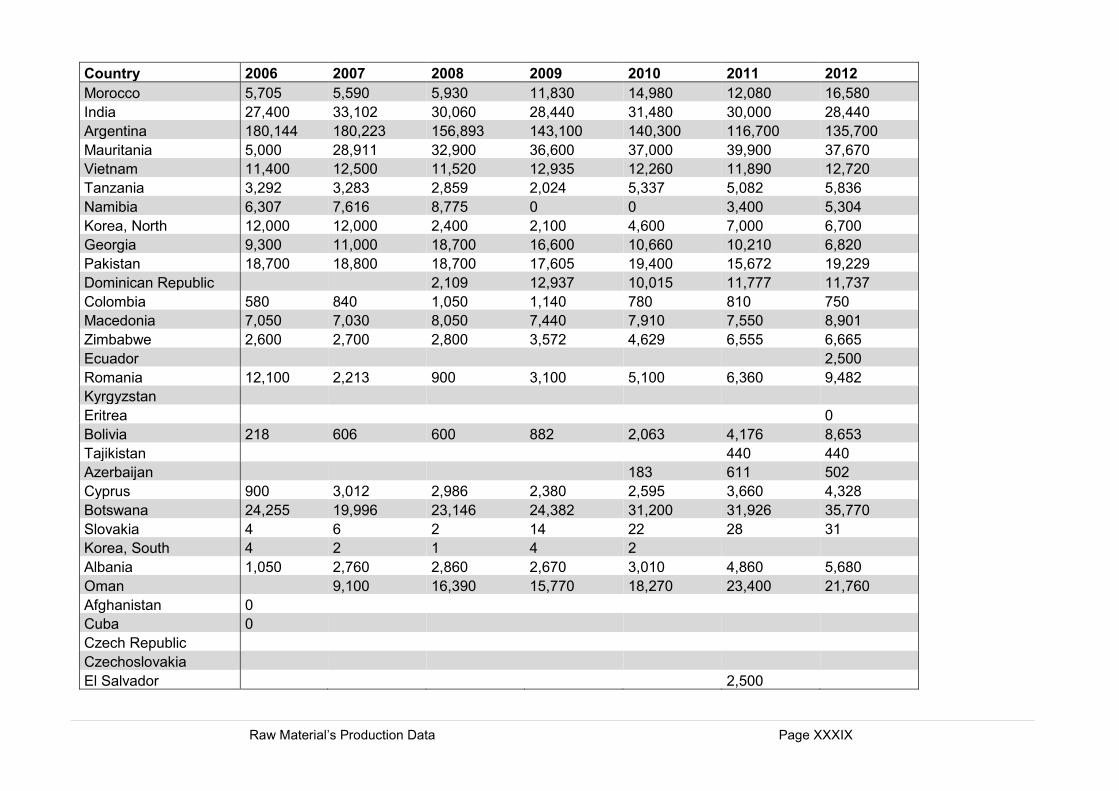
Raw Material’s Production Data Page XXXIX
Country 2006 2007 2008 2009 2010 2011 2012
Morocco 5,705 5,590 5,930 11,830 14,980 12,080 16,580
India 27,400 33,102 30,060 28,440 31,480 30,000 28,440
Argentina 180,144 180,223 156,893 143,100 140,300 116,700 135,700
Mauritania 5,000 28,911 32,900 36,600 37,000 39,900 37,670
Vietnam 11,400 12,500 11,520 12,935 12,260 11,890 12,720
Tanzania 3,292 3,283 2,859 2,024 5,337 5,082 5,836
Namibia 6,307 7,616 8,775 0 0 3,400 5,304
Korea, North 12,000 12,000 2,400 2,100 4,600 7,000 6,700
Georgia 9,300 11,000 18,700 16,600 10,660 10,210 6,820
Pakistan 18,700 18,800 18,700 17,605 19,400 15,672 19,229
Dominican Republic 2,109 12,937 10,015 11,777 11,737
Colombia 580 840 1,050 1,140 780 810 750
Macedonia 7,050 7,030 8,050 7,440 7,910 7,550 8,901
Zimbabwe 2,600 2,700 2,800 3,572 4,629 6,555 6,665
Ecuador 2,500
Romania 12,100 2,213 900 3,100 5,100 6,360 9,482
Kyrgyzstan Eritrea 0
Bolivia 218 606 600 882 2,063 4,176 8,653
Tajikistan 440 440
Azerbaijan 183 611 502
Cyprus 900 3,012 2,986 2,380 2,595 3,660 4,328
Botswana 24,255 19,996 23,146 24,382 31,200 31,926 35,770
Slovakia 4 6 2 14 22 28 31
Korea, South 4 2 1 4 2 Albania 1,050 2,760 2,860 2,670 3,010 4,860 5,680
Oman 9,100 16,390 15,770 18,270 23,400 21,760
Afghanistan 0 Cuba 0 Czech Republic Czechoslovakia El Salvador 2,500
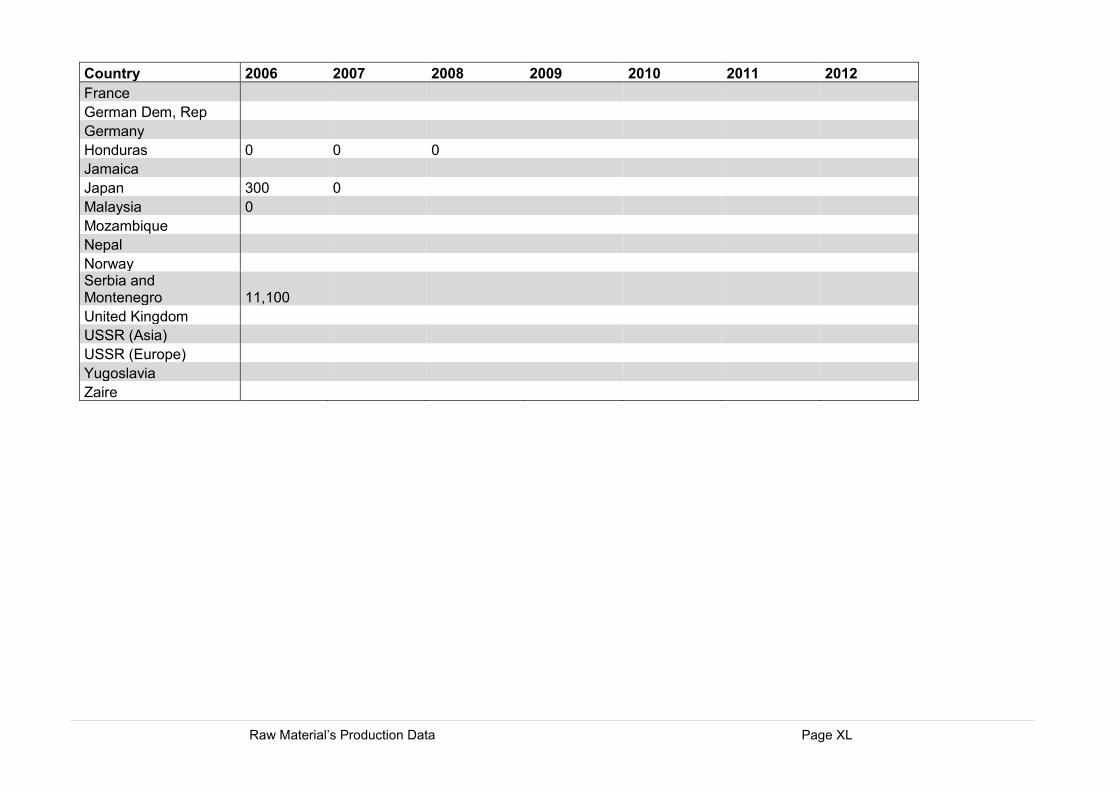
Raw Material’s Production Data Page XL
Country 2006 2007 2008 2009 2010 2011 2012
France German Dem, Rep Germany Honduras 0 0 0 Jamaica Japan 300 0 Malaysia 0 Mozambique Nepal Norway Serbia and Montenegro 11,100 United Kingdom USSR (Asia) USSR (Europe) Yugoslavia Zaire
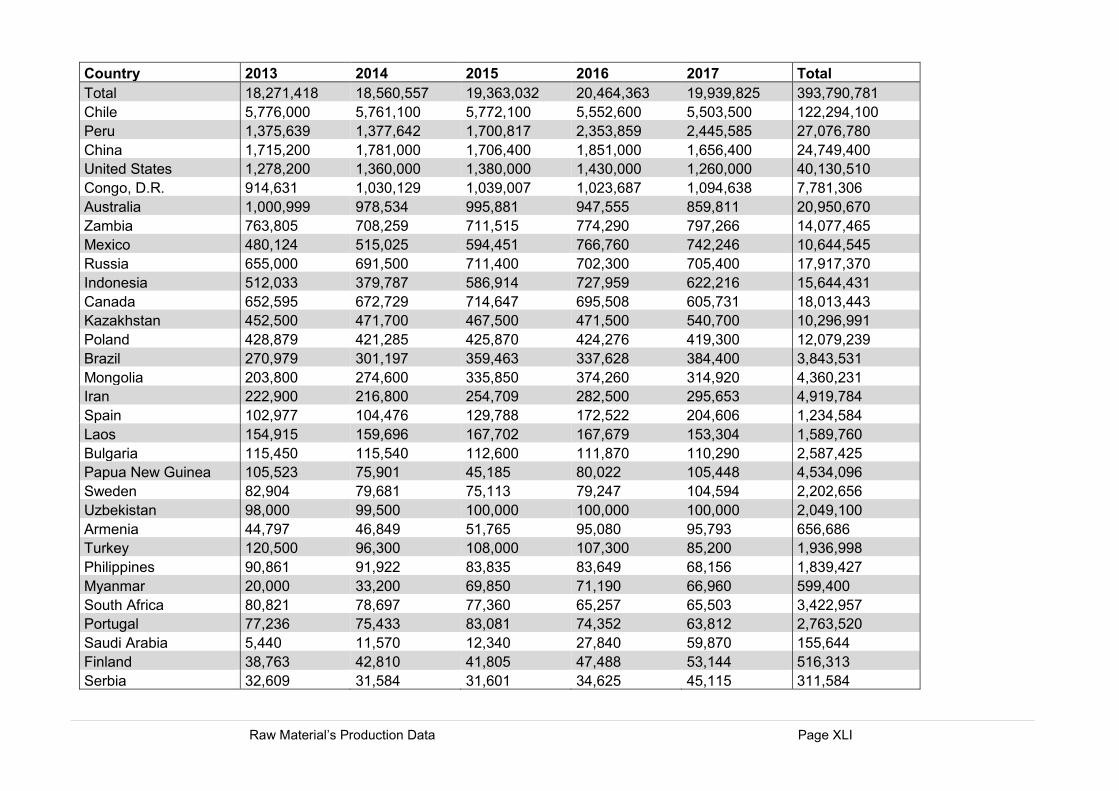
Raw Material’s Production Data Page XLI
Country 2013 2014 2015 2016 2017 Total
Total 18,271,418 18,560,557 19,363,032 20,464,363 19,939,825 393,790,781
Chile 5,776,000 5,761,100 5,772,100 5,552,600 5,503,500 122,294,100
Peru 1,375,639 1,377,642 1,700,817 2,353,859 2,445,585 27,076,780
China 1,715,200 1,781,000 1,706,400 1,851,000 1,656,400 24,749,400
United States 1,278,200 1,360,000 1,380,000 1,430,000 1,260,000 40,130,510
Congo, D.R. 914,631 1,030,129 1,039,007 1,023,687 1,094,638 7,781,306
Australia 1,000,999 978,534 995,881 947,555 859,811 20,950,670
Zambia 763,805 708,259 711,515 774,290 797,266 14,077,465
Mexico 480,124 515,025 594,451 766,760 742,246 10,644,545
Russia 655,000 691,500 711,400 702,300 705,400 17,917,370
Indonesia 512,033 379,787 586,914 727,959 622,216 15,644,431
Canada 652,595 672,729 714,647 695,508 605,731 18,013,443
Kazakhstan 452,500 471,700 467,500 471,500 540,700 10,296,991
Poland 428,879 421,285 425,870 424,276 419,300 12,079,239
Brazil 270,979 301,197 359,463 337,628 384,400 3,843,531
Mongolia 203,800 274,600 335,850 374,260 314,920 4,360,231
Iran 222,900 216,800 254,709 282,500 295,653 4,919,784
Spain 102,977 104,476 129,788 172,522 204,606 1,234,584
Laos 154,915 159,696 167,702 167,679 153,304 1,589,760
Bulgaria 115,450 115,540 112,600 111,870 110,290 2,587,425
Papua New Guinea 105,523 75,901 45,185 80,022 105,448 4,534,096
Sweden 82,904 79,681 75,113 79,247 104,594 2,202,656
Uzbekistan 98,000 99,500 100,000 100,000 100,000 2,049,100
Armenia 44,797 46,849 51,765 95,080 95,793 656,686
Turkey 120,500 96,300 108,000 107,300 85,200 1,936,998
Philippines 90,861 91,922 83,835 83,649 68,156 1,839,427
Myanmar 20,000 33,200 69,850 71,190 66,960 599,400
South Africa 80,821 78,697 77,360 65,257 65,503 3,422,957
Portugal 77,236 75,433 83,081 74,352 63,812 2,763,520
Saudi Arabia 5,440 11,570 12,340 27,840 59,870 155,644
Finland 38,763 42,810 41,805 47,488 53,144 516,313
Serbia 32,609 31,584 31,601 34,625 45,115 311,584
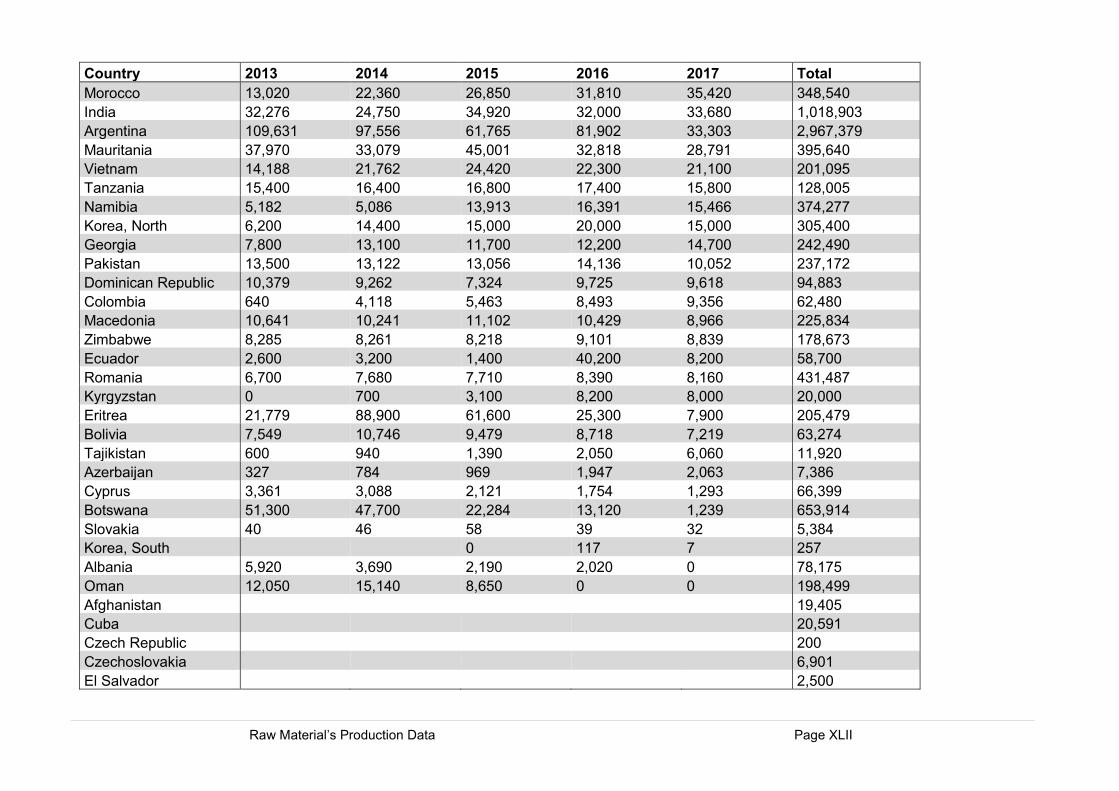
Raw Material’s Production Data Page XLII
Country 2013 2014 2015 2016 2017 Total
Morocco 13,020 22,360 26,850 31,810 35,420 348,540
India 32,276 24,750 34,920 32,000 33,680 1,018,903
Argentina 109,631 97,556 61,765 81,902 33,303 2,967,379
Mauritania 37,970 33,079 45,001 32,818 28,791 395,640
Vietnam 14,188 21,762 24,420 22,300 21,100 201,095
Tanzania 15,400 16,400 16,800 17,400 15,800 128,005
Namibia 5,182 5,086 13,913 16,391 15,466 374,277
Korea, North 6,200 14,400 15,000 20,000 15,000 305,400
Georgia 7,800 13,100 11,700 12,200 14,700 242,490
Pakistan 13,500 13,122 13,056 14,136 10,052 237,172
Dominican Republic 10,379 9,262 7,324 9,725 9,618 94,883
Colombia 640 4,118 5,463 8,493 9,356 62,480
Macedonia 10,641 10,241 11,102 10,429 8,966 225,834
Zimbabwe 8,285 8,261 8,218 9,101 8,839 178,673
Ecuador 2,600 3,200 1,400 40,200 8,200 58,700
Romania 6,700 7,680 7,710 8,390 8,160 431,487
Kyrgyzstan 0 700 3,100 8,200 8,000 20,000
Eritrea 21,779 88,900 61,600 25,300 7,900 205,479
Bolivia 7,549 10,746 9,479 8,718 7,219 63,274
Tajikistan 600 940 1,390 2,050 6,060 11,920
Azerbaijan 327 784 969 1,947 2,063 7,386
Cyprus 3,361 3,088 2,121 1,754 1,293 66,399
Botswana 51,300 47,700 22,284 13,120 1,239 653,914
Slovakia 40 46 58 39 32 5,384
Korea, South 0 117 7 257
Albania 5,920 3,690 2,190 2,020 0 78,175
Oman 12,050 15,140 8,650 0 0 198,499
Afghanistan 19,405
Cuba 20,591
Czech Republic 200
Czechoslovakia 6,901
El Salvador 2,500
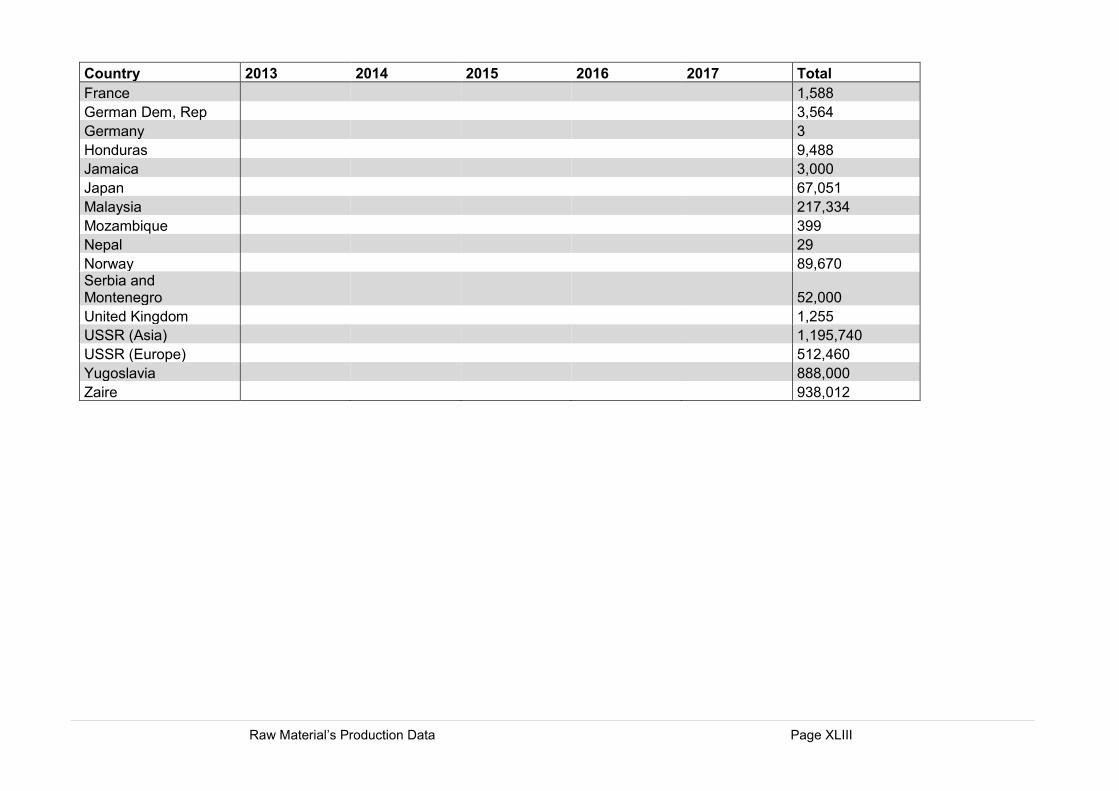
Raw Material’s Production Data Page XLIII
Country 2013 2014 2015 2016 2017 Total
France 1,588
German Dem, Rep 3,564
Germany 3
Honduras 9,488
Jamaica 3,000
Japan 67,051
Malaysia 217,334
Mozambique 399
Nepal 29
Norway 89,670 Serbia and Montenegro 52,000
United Kingdom 1,255
USSR (Asia) 1,195,740
USSR (Europe) 512,460
Yugoslavia 888,000
Zaire 938,012
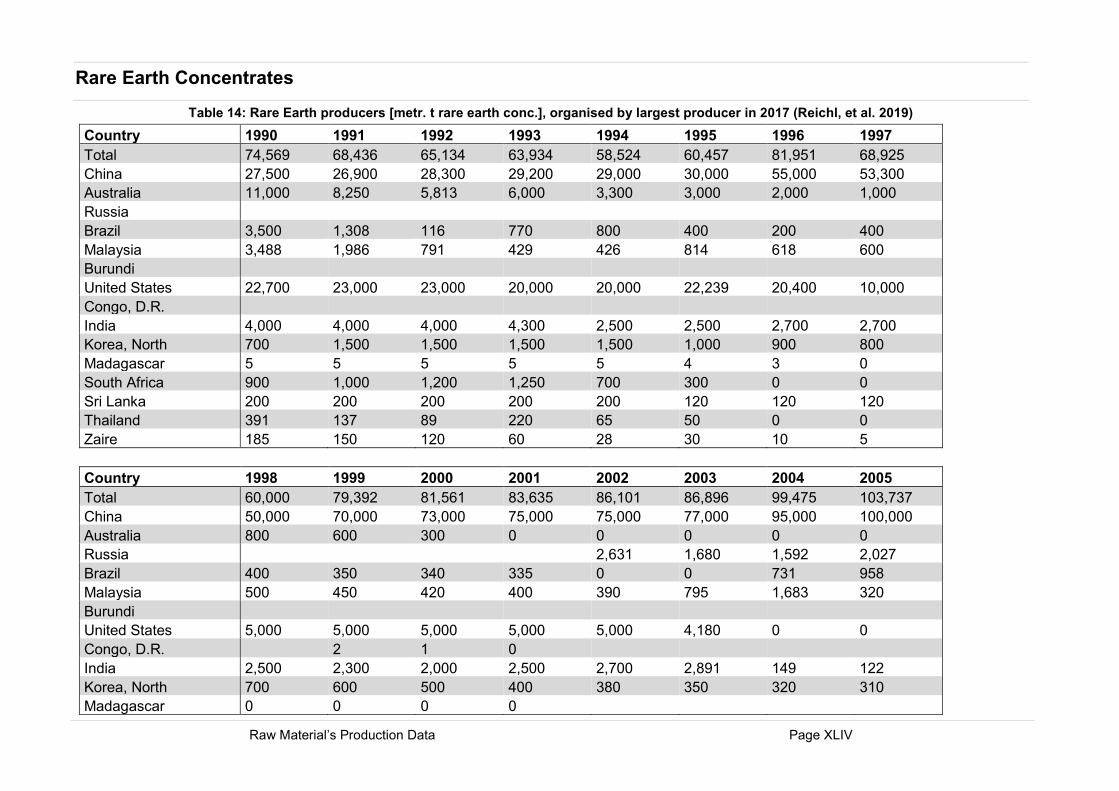
Raw Material’s Production Data Page XLIV
Rare Earth Concentrates
Table 14: Rare Earth producers [metr. t rare earth conc.], organised by largest producer in 2017 (Reichl, et al. 2019)
Country 1990 1991 1992 1993 1994 1995 1996 1997
Total 74,569 68,436 65,134 63,934 58,524 60,457 81,951 68,925
China 27,500 26,900 28,300 29,200 29,000 30,000 55,000 53,300
Australia 11,000 8,250 5,813 6,000 3,300 3,000 2,000 1,000
Russia Brazil 3,500 1,308 116 770 800 400 200 400
Malaysia 3,488 1,986 791 429 426 814 618 600
Burundi United States 22,700 23,000 23,000 20,000 20,000 22,239 20,400 10,000
Congo, D.R. India 4,000 4,000 4,000 4,300 2,500 2,500 2,700 2,700
Korea, North 700 1,500 1,500 1,500 1,500 1,000 900 800
Madagascar 5 5 5 5 5 4 3 0
South Africa 900 1,000 1,200 1,250 700 300 0 0
Sri Lanka 200 200 200 200 200 120 120 120
Thailand 391 137 89 220 65 50 0 0
Zaire 185 150 120 60 28 30 10 5
Country 1998 1999 2000 2001 2002 2003 2004 2005
Total 60,000 79,392 81,561 83,635 86,101 86,896 99,475 103,737
China 50,000 70,000 73,000 75,000 75,000 77,000 95,000 100,000
Australia 800 600 300 0 0 0 0 0
Russia 2,631 1,680 1,592 2,027
Brazil 400 350 340 335 0 0 731 958
Malaysia 500 450 420 400 390 795 1,683 320
Burundi United States 5,000 5,000 5,000 5,000 5,000 4,180 0 0
Congo, D.R. 2 1 0 India 2,500 2,300 2,000 2,500 2,700 2,891 149 122
Korea, North 700 600 500 400 380 350 320 310
Madagascar 0 0 0 0
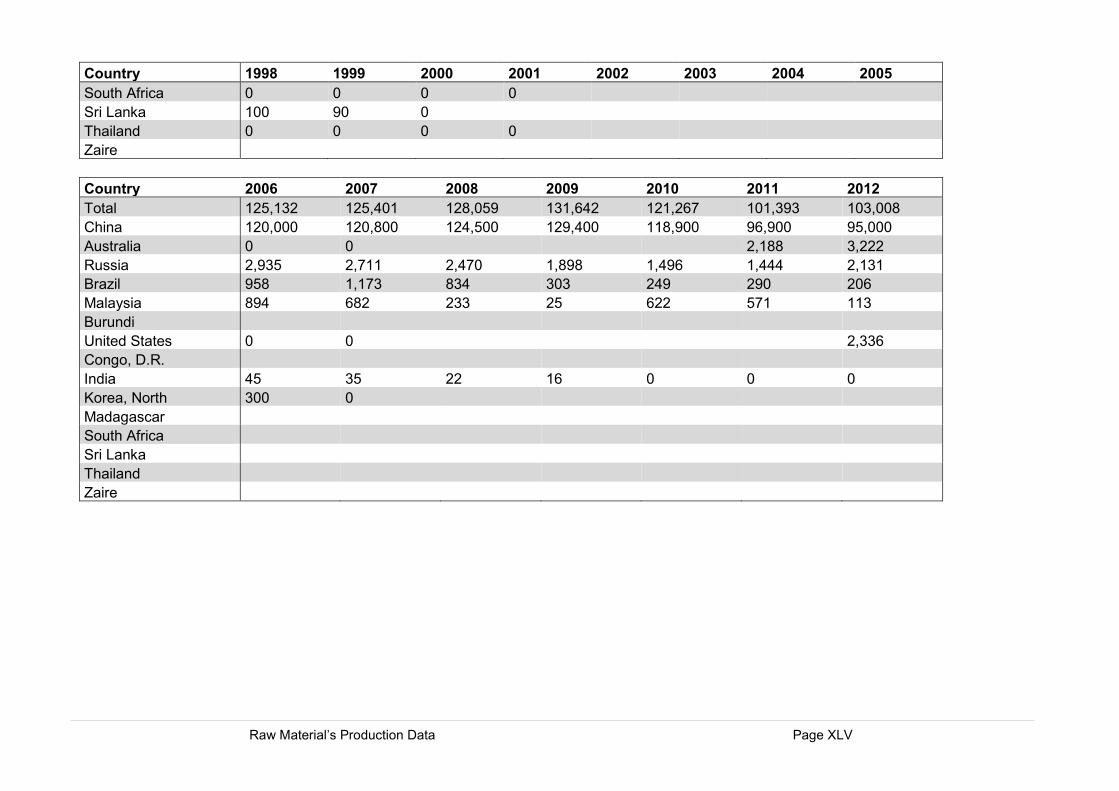
Raw Material’s Production Data Page XLV
Country 1998 1999 2000 2001 2002 2003 2004 2005
South Africa 0 0 0 0 Sri Lanka 100 90 0 Thailand 0 0 0 0 Zaire
Country 2006 2007 2008 2009 2010 2011 2012
Total 125,132 125,401 128,059 131,642 121,267 101,393 103,008
China 120,000 120,800 124,500 129,400 118,900 96,900 95,000
Australia 0 0 2,188 3,222
Russia 2,935 2,711 2,470 1,898 1,496 1,444 2,131
Brazil 958 1,173 834 303 249 290 206
Malaysia 894 682 233 25 622 571 113
Burundi United States 0 0 2,336
Congo, D.R. India 45 35 22 16 0 0 0
Korea, North 300 0 Madagascar South Africa Sri Lanka Thailand Zaire
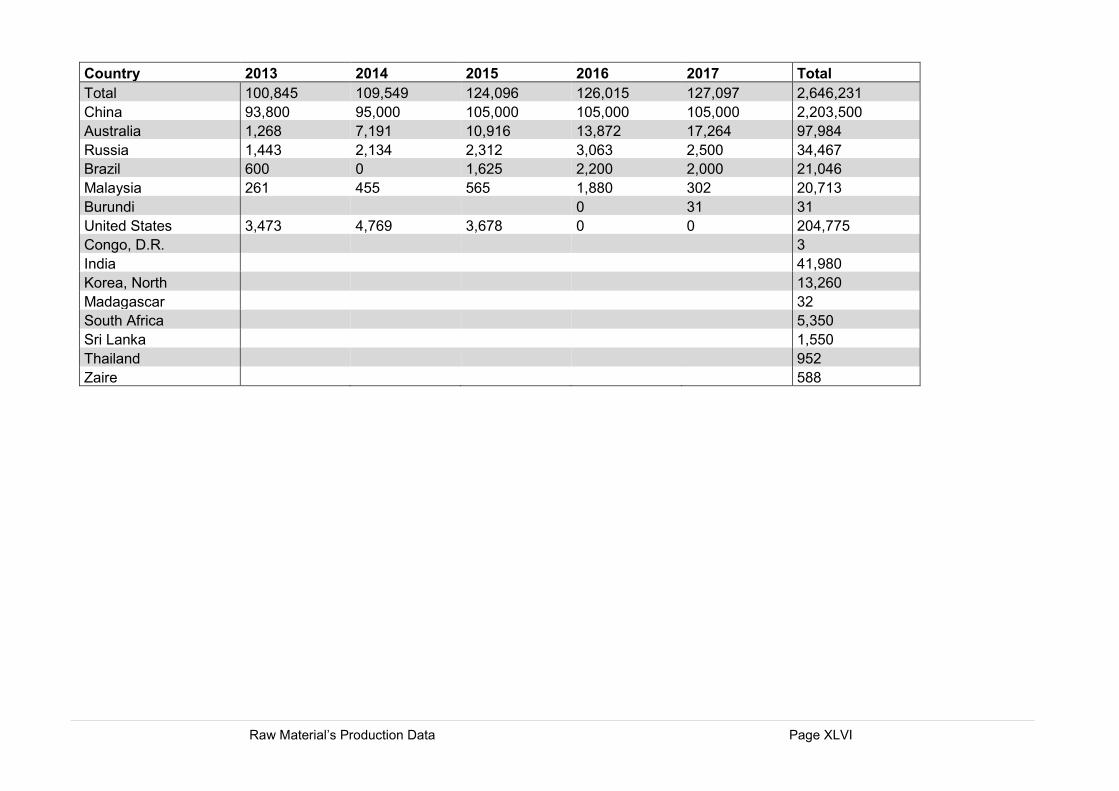
Raw Material’s Production Data Page XLVI
Country 2013 2014 2015 2016 2017 Total
Total 100,845 109,549 124,096 126,015 127,097 2,646,231
China 93,800 95,000 105,000 105,000 105,000 2,203,500
Australia 1,268 7,191 10,916 13,872 17,264 97,984
Russia 1,443 2,134 2,312 3,063 2,500 34,467
Brazil 600 0 1,625 2,200 2,000 21,046
Malaysia 261 455 565 1,880 302 20,713
Burundi 0 31 31
United States 3,473 4,769 3,678 0 0 204,775
Congo, D.R. 3
India 41,980
Korea, North 13,260
Madagascar 32
South Africa 5,350
Sri Lanka 1,550
Thailand 952
Zaire 588